UNITED STATES
SECURITIES AND EXCHANGE COMMISSION
Washington, D.C. 20549
FORM N-CSR
CERTIFIED SHAREHOLDER REPORT OF REGISTERED
MANAGEMENT INVESTMENT COMPANIES
Investment Company Act file number 811-6452
Fidelity Union Street Trust II
(Exact name of registrant as specified in charter)
82 Devonshire St., Boston, Massachusetts 02109
(Address of principal executive offices) (Zip code)
Eric D. Roiter, Secretary
82 Devonshire St.
Boston, Massachusetts 02109
(Name and address of agent for service)
Registrant's telephone number, including area code: 617-563-7000
Date of fiscal year end: | August 31 |
| |
Date of reporting period: | August 31, 2005 |
Item 1. Reports to Stockholders
Fidelity®
Arizona Municipal
Income Fund
(formerly Spartan® Arizona Municipal
Income Fund)
and
Fidelity
Arizona Municipal
Money Market Fund
|
Annual Report
August 31, 2005
|


| Contents | | | | |
| |
| Chairman’s Message | | 4 | | Ned Johnson’s message to shareholders. |
| Shareholder Expense | | 5 | | An example of shareholder expenses. |
| Example | | | | |
| Fidelity Arizona Municipal Income Fund |
| Performance | | 7 | | How the fund has done over time. |
| Management’s Discussion | | 8 | | The manager’s review of fund |
| | | | | performance, strategy and outlook. |
| Investment Changes | | 9 | | A summary of major shifts in the fund’s |
| | | | | investments over the past six months. |
| Investments | | 10 | | A complete list of the fund’s |
| | | | | investments with their market values. |
| Financial Statements | | 15 | | Statements of assets and liabilities, |
| | | | | operations, and changes in net assets, |
| | | | | as well as financial highlights. |
| Fidelity Arizona Municipal Money Market Fund |
| Investment Changes/ | | 19 | | A summary of major shifts in the fund’s |
| Performance | | | | investments over the past six months |
| | | | | and one year. |
| Investments | | 20 | | A complete list of the fund’s |
| | | | | investments. |
| Financial Statements | | 26 | | Statements of assets and liabilities, |
| | | | | operations, and changes in net assets, |
| | | | | as well as financial highlights. |
| Notes | | 30 | | Notes to the financial statements. |
| Report of Independent | | 35 | | |
| Registered Public | | | | |
| Accounting Firm | | | | |
| Trustees and Officers | | 36 | | |
| Distributions | | 48 | | |
| Proxy Voting Results | | 49 | | |
| Board Approval of Investment | | 50 | | |
| Advisory Contracts and | | | | |
| Management Fees | | | | |
To view a fund’s proxy voting guidelines and proxy voting record for the 12 month period ended June 30, visit www.fidelity.com/proxyvotingresults or visit the Securities and Exchange Commission’s (SEC) web site at www.sec.gov. You may also call 1-800-544-8544 to request a free copy of the proxy voting guidelines.
Standard & Poor’s, S&P and S&P 500 are registered service marks of The McGraw Hill Companies, Inc. and have been licensed for use by Fidelity Distributors Corporation.
Other third party marks appearing herein are the property of their respective owners. All other marks appearing herein are registered or unregistered trademarks or service marks of FMR Corp. or an affiliated company.
Annual Report
This report and the financial statements contained herein are submitted for the general information of the shareholders of the funds. This report is not authorized for distribution to prospective investors in the funds unless preceded or accompanied by an effective prospectus. A fund files its complete schedule of portfolio holdings with the SEC for the first and third quarters of each fiscal year on Form N Q. Forms N Q are available on the SEC’s web site at http://www.sec.gov. A fund’s Forms N Q may be reviewed and copied at the SEC’s Public Refer ence Room in Washington, DC. Information regarding the operation of the SEC’s Public Reference Room may be obtained by calling 1 800 SEC 0330. For a complete list of a fund’s portfolio holdings, view the most recent quarterly holdings report, semiannual report, or annual report on Fidelity’s web site at http://www.fidelity.com/holdings.
NOT FDIC INSURED · MAY LOSE VALUE · NO BANK GUARANTEE
Neither the funds nor Fidelity Distributors Corporation is a bank.
3 Annual Report
Chairman’s Message
(photograph of Edward C Johnson 3d)
Dear Shareholder:
During the past year or so, much has been reported about the mutual fund industry, and much of it has been more critical than I believe is warranted. Allegations that some companies have been less than forthright with their shareholders have cast a shadow on the entire industry. I continue to find these reports disturbing, and assert that they do not create an ac curate picture of the industry overall. Therefore, I would like to remind every one where Fidelity stands on these issues. I will say two things specifically regarding allegations that some mutual fund compa nies were in violation of the Securities and Exchange Commission’s forward pric ing rules or were involved in so called “market timing” activities.
First, Fidelity has no agreements that per mit customers who buy fund shares after 4 p.m. to obtain the 4 p.m. price. This is not a new policy. This is not to say that some one could not deceive the company through fraudulent acts. However, we are extremely diligent in preventing fraud from occurring in this manner and in every other. But I underscore again that Fidelity has no so called “agreements” that sanction illegal practices.
Second, Fidelity continues to stand on record, as we have for years, in opposition to predatory short term trading that adversely affects shareholders in a mutual fund. Back in the 1980s, we initiated a fee which is returned to the fund and, therefore, to investors to discourage this activity. Further, we took the lead sev eral years ago in developing a Fair Value Pricing Policy to prevent market timing on foreign securities in our funds. I am confi dent we will find other ways to make it more difficult for predatory traders to op erate. However, this will only be achieved through close cooperation among regula tors, legislators and the industry.
Yes, there have been unfortunate instances of unethical and illegal activity within the mutual fund industry from time to time. That is true of any industry. When this occurs, confessed or convicted offend ers should be dealt with appropriately. But we are still concerned about the risk of over regulation and the quick applica tion of simplistic solutions to intricate problems. Every system can be improved, and we support and applaud well thought out improvements by regulators, legisla tors and industry representatives that achieve the common goal of building and protecting the value of investors’ holdings. For nearly 60 years, Fidelity has worked very hard to improve its products and ser vice to justify your trust. When our family founded this company in 1946, we had only a few hundred customers. Today, we serve more than 18 million customers in cluding individual investors and partici pants in retirement plans across America. Let me close by saying that we do not take your trust in us for granted, and we real ize that we must always work to improve all aspects of our service to you. In turn, we urge you to continue your active par ticipation with your financial matters, so that your interests can be well served.
Best regards,
/s/ Edward C. Johnson 3rd
Edward C. Johnson 3d
Shareholder Expense Example
As a shareholder of a Fund, you incur two types of costs: (1) transaction costs, including redemption fees, and (2) ongoing costs, including management fees and other Fund expenses. This Example is intended to help you understand your ongoing costs (in dollars) of investing in the Funds and to compare these costs with the ongoing costs of investing in other mutual funds.
The Example is based on an investment of $1,000 invested at the beginning of the period and held for the entire period (March 1, 2005 to August 31, 2005).
The first line of the table below for each fund provides information about actual account values and actual expenses. You may use the information in this line, together with the amount you invested, to estimate the expenses that you paid over the period. Simply divide your account value by $1,000.00 (for example, an $8,600 account value divided by $1,000.00 = 8.6), then multiply the result by the number in the first line for a fund under the heading entitled “Expenses Paid During Period” to estimate the expenses you paid on your account during this period. A small balance maintenance fee of $12.00 that is charged once a year may apply for certain accounts with a value of less than $2,000. This fee is not included in the table below. If it was, the estimate of expenses you paid during the period would be higher, and your ending account value lower, by this amount.
Hypothetical Example for Comparison Purposes
The second line of the table below for each fund provides information about hypothetical account values and hypothetical expenses based on a fund’s actual expense ratio and an assumed rate of return of 5% per year before expenses, which is not the Fund’s actual return. The hypothetical account values and expenses may not be used to estimate the actual ending account balance or expenses you paid for the period. You may use this information to compare the ongoing costs of investing in the Fund and other funds. To do so, compare this 5% hypothetical example with the 5% hypothetical examples that appear in the shareholder reports of the other funds. A small balance maintenance fee of $12.00 that is charged once a year may apply for certain accounts with a value of less than $2,000. This fee is not included in the table below. If it was, the estimate of expenses you paid during the period would be higher, and your ending account value lower, by this amount. Please note that the expenses shown in the table are meant to highlight your ongoing costs only and do not reflect any transaction costs. Therefore, the second line of the table is useful in comparing ongoing costs only, and will not help you determine the relative total costs of owning different funds. In addition, if these transactional costs were included, your costs would have been higher.
5 Annual Report
| Shareholder Expense Example continued | | | | |
| |
| |
| | | | | | | | | | | | | Expenses Paid |
| | | | | Beginning | | | | Ending | | | | During Period* |
| | | | | Account Value | | | | Account Value | | | | March 1, 2005 |
| | | | | March 1, 2005 | | | | August 31, 2005 | | to August 31, 2005 |
| Fidelity Arizona Municipal | | | | | | | | | | | | |
| Income Fund | | | | | | | | | | | | |
| Actual | | $ | | 1,000.00 | | $ | | 1,024.60 | | $ | | 2.81 |
| HypotheticalA | | $ | | 1,000.00 | | $ | | 1,022.43 | | $ | | 2.80 |
| Fidelity Arizona Municipal | | | | | | | | | | | | |
| Money Market Fund | | | | | | | | | | | | |
| Actual | | $ | | 1,000.00 | | $ | | 1,010.00 | | $ | | 2.53 |
| HypotheticalA | | $ | | 1,000.00 | | $ | | 1,022.68 | | $ | | 2.55 |
| |
| A 5% return per year before expenses | | | | | | | | |
* Expenses are equal to each Fund’s annualized expense ratio (shown in the table below); multiplied by the average account value over the period, multiplied by 184/365 (to reflect the one half year period
| | | Annualized |
| | | Expense Ratio |
| Fidelity Arizona Municipal Income Fund | | 55% |
| Fidelity Arizona Municipal Money Market Fund | | 50% |
Fidelity Arizona Municipal Income Fund
Performance: The Bottom Line
Average annual total return reflects the change in the value of an investment, assuming reinvestment of the fund’s dividend income and capital gains (the profits earned upon the sale of securities that have grown in value) and assuming a constant rate of perfor mance each year. The $10,000 table and the fund’s returns do not reflect the deduction of taxes that a shareholder would pay on fund distributions or the redemption of fund shares. During periods of reimbursement by Fidelity, a fund’s total return will be greater than it would be had the reimbursement not occurred. How a fund did yesterday is no guarantee of how it will do tomorrow.
| Average Annual Total Returns | | | | | | |
| Periods ended August 31, 2005 | | Past 1 | | Past 5 | | Past 10 |
| | | year | | years | | years |
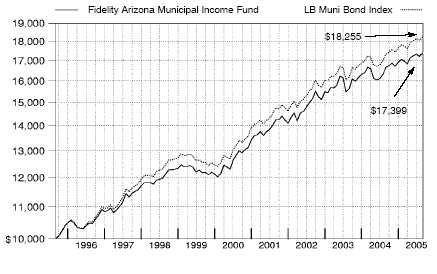
| Fidelity Arizona Municipal Income Fund | | 4.46% | | 6.00% | | 5.69% |
| |
| $10,000 Over 10 Years | | | | | | |
Let’s say hypothetically that $10,000 was invested in Fidelity® Arizona Municipal Income Fund on August 31, 1995. The chart shows how the value of your investment would have changed, and also shows how the Lehman Brothers Municipal Bond Index performed over the same period.
Annual Report
Fidelity Arizona Municipal Income Fund
Management’s Discussion of Fund Performance
Comments from Christine Thompson, Portfolio Manager of Fidelity® Arizona Municipal Income Fund
The municipal bond market had a solid advance during the past 12 months, and soundly outdistanced the taxable bond market. The Lehman Brothers® Municipal Bond Index a performance measure of approximately 34,000 investment grade, fixed rate, tax exempt bonds posted a total gain of 5.31% for the one year period ending August 31, 2005. In comparison, the Lehman Brothers Aggregate Bond Index, a proxy for the overall investment grade taxable bond market, rose a more modest 4.15% . The Federal Reserve Board raised interest rates eight times during the past 12 months, lifting the fed funds target rate from 1.50% to 3.50% . While rate action of this nature is often detrimental to muni returns, they weren’t affected as significantly this time around. Amid rising short term yields, the yields on longer term bonds declined and their prices rallied. Overall, heavy issuance was met with reasonably strong demand, particularly from institutional buyers. A narrowing yield gap relative to taxable bonds helped further highlight the attractive valuations of munis.
For the 12 months ending August 31, 2005, the fund returned 4.46% . During the same period, the LipperSM Arizona Municipal Debt Funds Average gained 4.07% and the Lehman Brothers Arizona 4 Plus Year Enhanced Municipal Bond Index returned 4.94% . Arizona’s municipal bond market performed in line with the national municipal market, helped in some ways by stronger economic conditions, though hurt in other ways. Likely aiding the fund’s outperformance of its Lipper peer group average was the fact that some of its holdings were prerefunded during the period, a process that enhanced the credit quality of the securities and pushed their prices higher. Weighing on the fund’s returns was my focus on high quality bonds, which generally lagged lower quality securities in response to strong demand for higher yielding bonds and investors’ growing comfort with risk. Although the fund did benefit from holding some lower quality investment grade securities, I believe its stake in them was relatively light compared to the Lipper peer group average. Additionally, my decision to avoid below investment grade munis altogether detracted from the fund’s relative returns, as these bonds were some of the market’s best performers. Among the fund’s high quality holdings were bonds issued in Puerto Rico, which are free from state taxes in all 50 states and at times offered what I believed were better values than bonds available in Arizona. In terms of sector positioning, fund performance was helped by an overweighting in local general obligation bonds, which performed well.
The views expressed in this statement reflect those of the portfolio manager only through the end of the period of the report as stated on the cover and do not necessarily represent the views of Fidelity or any other person in the Fidelity organization. Any such views are subject to change at any time based upon market or other conditions and Fidelity disclaims any responsibility to update such views. These views may not be relied on as investment advice and, because investment decisions for a Fidelity fund are based on numerous factors, may not be relied on as an indication of trading intent on behalf of any Fidelity fund.
Fidelity Arizona Municipal Income Fund
Investment Changes
| Top Five Sectors as of August 31, 2005 | | | | |
| | | % of fund’s | | % of fund’s net assets |
| | | net assets | | 6 months ago |
| General Obligations | | 21.3 | | 23.8 |
| Special Tax | | 20.0 | | 24.3 |
| Water & Sewer | | 17.8 | | 10.0 |
| Escrowed/Pre Refunded | | 15.5 | | 9.1 |
| Electric Utilities | | 10.5 | | 10.6 |
| Average Years to Maturity as of August 31, 2005 | | |
| | | | | 6 months ago |
| Years | | 13.4 | | 13.3 |
| Average years to maturity is based on the average time remaining to the stated maturity date of each |
| bond, weighted by the market value of each bond. | | | | |
| Duration as of August 31, 2005 | | | | |
| | | | | 6 months ago |
| Years | | 6.8 | | 6.8 |
Duration shows how much a bond fund’s price fluctuates with changes in comparable interest rates. If rates rise 1%, for example, a fund with a five year duration is likely to lose about 5% of its value. Other factors also can influence a bond fund’s performance and share price. Accordingly, a bond fund’s actual performance may differ from this example.
We have used ratings from Moody’s® Investors Services, Inc. Where Moody’s ratings are not available, we have used S&P® ratings.
Annual Report
Fidelity Arizona Municipal Income Fund
Investments August 31, 2005
Showing Percentage of Net Assets
Municipal Bonds 98.8%
| | | | | Principal | | | | Value |
| | | | | Amount | | | | (Note 1) |
| Arizona – 87.9% | | | | | | | | |
| Arizona Health Facilities Auth. Rev. (Catholic Health Care West | | | | | | | | |
| Proj.) Series A, 6.125% 7/1/09 | | $ | | 455,000 | | $ | | 478,555 |
| Arizona Pwr. Auth. Pwr. Resource Rev. (Hoover Uprating Proj.) | | | | | | | | |
| 5% 10/1/09 | | | | 1,160,000 | | | | 1,239,970 |
| Arizona School Facilities Board Ctfs. of Prtn.: | | | | | | | | |
| Series A2, 5% 9/1/18 (FGIC Insured) | | | | 1,000,000 | | | | 1,093,720 |
| Series B, 5.25% 9/1/19 (Pre-Refunded to 9/1/14 @ | | | | | | | | |
| 100) (d) | | | | 1,000,000 | | | | 1,131,460 |
| Series C, 5% 9/1/11 (FSA Insured) | | | | 1,060,000 | | | | 1,151,160 |
| Arizona School Facilities Board State School Impt. Rev.: | | | | | | | | |
| 5.25% 7/1/18 (Pre-Refunded to 7/1/12 @ 100) (d) | | | | 1,000,000 | | | | 1,114,930 |
| 5.25% 7/1/20 (Pre-Refunded to 7/1/12 @ 100) (d) | | | | 1,500,000 | | | | 1,672,395 |
| Arizona State Univ. Revs.: | | | | | | | | |
| 5% 7/1/26 (AMBAC Insured) | | | | 1,000,000 | | | | 1,074,600 |
| 5.5% 7/1/21 (Pre-Refunded to 7/1/12 @ 100) (d) | | | | 1,150,000 | | | | 1,299,569 |
| 5.75% 7/1/27 (Pre-Refunded to 7/1/12 @ 100) (d) | | | | 1,500,000 | | | | 1,717,770 |
| Arizona Student Ln. Acquisition Auth. Student Ln. Rev. | | | | | | | | |
| Subseries B1, 6.15% 5/1/29 (c) | | | | 500,000 | | | | 536,450 |
| Arizona Trans. Board Hwy. Rev.: | | | | | | | | |
| Series B, 5.25% 7/1/19 | | | | 2,500,000 | | | | 2,748,925 |
| 5.25% 7/1/13 | | | | 1,500,000 | | | | 1,646,985 |
| Arizona Wtr. Infrastructure Fin. Auth. Rev. (Wtr. Quality Proj.) | | | | | | | | |
| Series A, 5.375% 10/1/11 | | | | 2,000,000 | | | | 2,228,860 |
| Central Arizona Wtr. Conservation District Contract Rev. | | | | | | | | |
| (Central Arizona Proj.) Series A, 5.5% 11/1/09 | | | | 1,000,000 | | | | 1,089,540 |
| Chandler Gen. Oblig.: | | | | | | | | |
| 5.7% 7/1/15 | | | | 75,000 | | | | 83,668 |
| 6.25% 7/1/10 | | | | 500,000 | | | | 566,865 |
| 6.5% 7/1/10 (MBIA Insured) | | | | 200,000 | | | | 229,152 |
| 6.5% 7/1/11 (MBIA Insured) | | | | 225,000 | | | | 262,827 |
| Gilbert Wtr. Resources Muni. Property Corp. Wastewtr. Sys. & | | | | | | | | |
| Util. Rev. 4.9% 4/1/19 | | | | 1,000,000 | | | | 1,007,660 |
| Glendale Indl. Dev. Auth. Hosp. Rev. (John C. Lincoln Health | | | | | | | | |
| Network Proj.) 5% 12/1/35 | | | | 1,000,000 | | | | 1,021,640 |
| Maricopa County Hosp. Rev. (Sun Health Corp. Proj.): | | | | | | | | |
| 5% 4/1/14 | | | | 1,000,000 | | | | 1,061,480 |
| 6.125% 4/1/18 | | | | 85,000 | | | | 90,067 |
| 6.125% 4/1/18 (Pre-Refunded to 4/1/07 @ 102) (d) | | | | 215,000 | | | | 229,530 |
| Maricopa County Indl. Dev. Auth. Health Facilities Rev. (Catholic | | | | | | | | |
| Health Care West Proj.) Series 1998 A, 5% 7/1/16 | | | | 730,000 | | | | 756,565 |
| Maricopa County Indl. Dev. Auth. Hosp. Facilities Rev. (Mayo | | | | | | | | |
| Clinic Hosp. Proj.) 5.25% 11/15/37 | | | | 1,000,000 | | | | 1,053,370 |
See accompanying notes which are an integral part of the financial statements.
| Municipal Bonds continued | | | | | | | | |
| | | | | Principal | | | | Value |
| | | | | Amount | | | | (Note 1) |
| Arizona – continued | | | | | | | | |
| Maricopa County School District #28 Kyrene Elementary | | | | | | | | |
| Series C, 0% 1/1/10 (FGIC Insured) | | $ | | 1,425,000 | | $ | | 1,223,021 |
| Maricopa County Unified School District #48 Scottsdale: | | | | | | | | |
| Series A, 5% 7/1/18 (FGIC Insured) | | | | 1,000,000 | | | | 1,096,670 |
| 7.4% 7/1/10 | | | | 1,000,000 | | | | 1,181,240 |
| Maricopa County Unified School District #80 Chandler: | | | | | | | | |
| (2002 Proj.) Series A, 5% 7/1/17 (FSA Insured) | | | | 500,000 | | | | 541,640 |
| 6.25% 7/1/11 (Escrowed to Maturity) (d) | | | | 405,000 | | | | 468,694 |
| Mesa Indl. Dev. Auth. Rev. (Discovery Health Sys. Proj.) Series A: | | | | | | | | |
| 5.375% 1/1/14 (Pre-Refunded to 1/1/10 @ 101) (d) | | | | 500,000 | | | | 549,160 |
| 5.625% 1/1/29 (Pre-Refunded to 1/1/10 @ 101) (d) | | | | 795,000 | | | | 881,130 |
| Mesa Street & Hwy. Rev. 6.5% 7/1/11 (FSA Insured) | | | | 1,500,000 | | | | 1,752,180 |
| Mesa Util. Sys. Rev. 5.75% 7/1/14 (FGIC Insured) | | | | 1,000,000 | | | | 1,165,290 |
| Northern Arizona Univ. Sys. Rev.: | | | | | | | | |
| 5.5% 6/1/23 (FGIC Insured) | | | | 530,000 | | | | 597,257 |
| 5.5% 6/1/26 (FGIC Insured) | | | | 1,305,000 | | | | 1,466,468 |
| Phoenix Arpt. Rev. Series D, 6.4% 7/1/12 (MBIA Insured) (c) . | | | | 810,000 | | | | 821,899 |
| Phoenix Civic Impt. Board Arpt. Rev. Series B, 5.25% 7/1/27 | | | | | | | | |
| (FGIC Insured) (c) | | | | 1,000,000 | | | | 1,058,000 |
| Phoenix Civic Impt. Corp. Arpt. Excise Tax Rev. 5.25% | | | | | | | | |
| 7/1/09 (c) | | | | 400,000 | | | | 422,688 |
| Phoenix Civic Impt. Corp. Excise Tax Rev.: | | | | | | | | |
| (Civic Plaza Expansion Proj.) Series A, 5% 7/1/30 | | | | | | | | |
| (FGIC Insured) (a) | | | | 1,000,000 | | | | 1,068,760 |
| (Muni. Courthouse Proj.) Series A: | | | | | | | | |
| 5.375% 7/1/29 | | | | 560,000 | | | | 603,568 |
| 5.5% 7/1/11 | | | | 200,000 | | | | 218,404 |
| 5.75% 7/1/15 | | | | 675,000 | | | | 743,391 |
| Phoenix Civic Impt. Corp. Muni. Facilities Excise Tax Rev.: | | | | | | | | |
| 5.75% 7/1/10 (FGIC Insured) | | | | 340,000 | | | | 378,260 |
| 5.75% 7/1/12 (FGIC Insured) | | | | 1,250,000 | | | | 1,395,663 |
| 5.75% 7/1/14 (FGIC Insured) | | | | 1,000,000 | | | | 1,117,780 |
| Phoenix Civic Impt. Corp. Wastewtr. Sys. Rev.: | | | | | | | | |
| 5% 7/1/29 (MBIA Insured) | | | | 770,000 | | | | 819,642 |
| 5.7% 7/1/09 (FGIC Insured) | | | | 1,275,000 | | | | 1,392,517 |
| Phoenix Civic Impt. Corp. Wtr. Sys. Rev.: | | | | | | | | |
| Series 2001, 5.5% 7/1/24 (FGIC Insured) | | | | 1,000,000 | | | | 1,194,020 |
| 4.75% 7/1/27 (MBIA Insured) | | | | 1,020,000 | | | | 1,063,034 |
| 5% 7/1/20 (MBIA Insured) | | | | 5,000,000 | | | | 5,440,597 |
| 5% 7/1/29 (MBIA Insured) | | | | 1,000,000 | | | | 1,074,600 |
See accompanying notes which are an integral part of the financial statements.
11 Annual Report
| Fidelity Arizona Municipal Income Fund | | | | | | | | |
| Investments continued | | | | | | | | |
| |
| Municipal Bonds continued | | | | | | | | |
| | | | | Principal | | | | Value |
| | | | | Amount | | | | (Note 1) |
| Arizona – continued | | | | | | | | |
| Phoenix Gen. Oblig.: | | | | | | | | |
| Series 1995 A, 6% 7/1/11 | | $ | | 1,485,000 | | $ | | 1,693,108 |
| Series A, 6.25% 7/1/17 | | | | 1,000,000 | | | | 1,240,120 |
| Series B, 5.375% 7/1/20 | | | | 1,000,000 | | | | 1,112,820 |
| Phoenix Indl. Dev. Auth. Single Family Mtg. Rev. 0% 12/1/14 | | | | | | | | |
| (Escrowed to Maturity) (d) | | | | 1,250,000 | | | | 874,150 |
| Phoenix Street & Hwy. User Rev. 6.25% 7/1/11 (MBIA | | | | | | | | |
| Insured) | | | | 35,000 | | | | 35,162 |
| Pima County Indl. Dev. Auth. Rev. (HealthPartners Proj.) | | | | | | | | |
| Series A, 5.625% 4/1/14 (MBIA Insured) | | | | 200,000 | | | | 210,882 |
| Pima County Unified School District #1 Tucson: | | | | | | | | |
| 7.5% 7/1/08 (FGIC Insured) | | | | 1,000,000 | | | | 1,114,700 |
| 7.5% 7/1/10 (FGIC Insured) | | | | 250,000 | | | | 296,905 |
| Salt River Proj. Agric. Impt. & Pwr. District Elec. Sys. Rev.: | | | | | | | | |
| Series 2005 A: | | | | | | | | |
| 4.75% 1/1/35 | | | | 1,000,000 | | | | 1,033,760 |
| 5% 1/1/35 | | | | 1,500,000 | | | | 1,608,660 |
| Series A: | | | | | | | | |
| 5.25% 1/1/18 | | | | 1,000,000 | | | | 1,097,470 |
| 5.25% 1/1/19 | | | | 1,615,000 | | | | 1,773,383 |
| Series B: | | | | | | | | |
| 5% 1/1/20 | | | | 1,500,000 | | | | 1,611,015 |
| 5% 1/1/21 | | | | 255,000 | | | | 274,041 |
| Scottsdale Indl. Dev. Auth. Hosp. Rev. (Scottsdale Health Care | | | | | | | | |
| Proj.) 5.8% 12/1/31 | | | | 250,000 | | | | 271,363 |
| Scottsdale Wtr. & Swr. Rev. (1989 Proj.) Series E, 7% 7/1/07 . | | | | 150,000 | | | | 160,731 |
| Sedona Excise Tax Rev. 5% 7/1/19 (MBIA Insured) | | | | 1,000,000 | | | | 1,092,380 |
| Tempe Gen. Oblig.: | | | | | | | | |
| Series 2001 A, 6% 7/1/10 | | | | 600,000 | | | | 673,596 |
| 5% 7/1/19 | | | | 1,680,000 | | | | 1,818,734 |
| 5.5% 7/1/17 | | | | 1,035,000 | | | | 1,183,253 |
| Tempe Union High School District #213 7% 7/1/08 (FGIC | | | | | | | | |
| Insured) | | | | 310,000 | | | | 342,736 |
| Tucson Gen. Oblig.: | | | | | | | | |
| Series A, 6% 7/1/13 | | | | 800,000 | | | | 934,544 |
| 5% 7/1/18 (FGIC Insured) | | | | 3,295,000 | | | | 3,613,528 |
| Tucson Street & Hwy. User Rev.: | | | | | | | | |
| Series 1994 B, 7.5% 7/1/11 (MBIA Insured) | | | | 1,015,000 | | | | 1,235,966 |
| Series 1994 C, 7% 7/1/11 (FGIC Insured) | | | | 500,000 | | | | 597,195 |
| Series A, 7% 7/1/11 (MBIA Insured) | | | | 300,000 | | | | 358,317 |
| 6% 7/1/10 (MBIA Insured) | | | | 400,000 | | | | 449,444 |
See accompanying notes which are an integral part of the financial statements.
| Municipal Bonds continued | | | | | | |
| | | | | Principal | | Value |
| | | | | Amount | | (Note 1) |
| Arizona – continued | | | | | | |
| Tucson Wtr. Rev.: | | | | | | |
| Series 1994 C, 6.75% 7/1/07 (FGIC Insured) | | $ | | 200,000 | | $ 213,430 |
| Series A, 5% 7/1/11 (FGIC Insured) | | | | 1,410,000 | | 1,528,144 |
| 5.5% 7/1/14 | | | | 425,000 | | 475,643 |
| Univ. Med. Ctr. Corp. Hosp. Rev. 5.25% 7/1/15 | | | | 1,000,000 | | 1,078,960 |
| Univ. of Arizona Ctfs. of Prtn. Series C, 5% 6/1/14 | | | | | | |
| (AMBAC Insured) | | | | 600,000 | | 655,398 |
| Univ. of Arizona Univ. Revs. 5.25% 6/1/13 (FSA Insured) | | | | 245,000 | | 257,520 |
| Yavapai County Indl. Dev. Auth. Solid Waste Disp. Rev. | | | | | | |
| (Waste Mgmt., Inc. Proj.) 4%, tender 6/1/10 (b)(c) | | | | 1,000,000 | | 1,006,480 |
| Yuma County Hosp. District #1 6.35% 11/15/07 | | | | | | |
| (Escrowed to Maturity) (d) | | | | 265,000 | | 272,110 |
| | | | | | | 88,518,934 |
| |
| Puerto Rico 10.9% | | | | | | |
| Puerto Rico Commonwealth Hwy. & Trans. Auth. Hwy. Rev.: | | | | | | |
| Series 1996 Y, 5% 7/1/36 (FSA Insured) | | | | 1,000,000 | | 1,080,680 |
| Series Y, 5.5% 7/1/36 (FSA Insured) | | | | 500,000 | | 574,800 |
| Puerto Rico Commonwealth Hwy. & Trans. Auth. Trans. Rev.: | | | | | | |
| Series 1998, 5.75% 7/1/22 (CIFG North America Insured) | | | | 700,000 | | 797,132 |
| Series 2000 C, 6% 7/1/29 | | | | 500,000 | | 564,420 |
| Series D, 5.25% 7/1/38 | | | | 1,000,000 | | 1,059,820 |
| 5.75% 7/1/19 (FGIC Insured) | | | | 700,000 | | 801,738 |
| Puerto Rico Commonwealth Infrastructure Fing. Auth. | | | | | | |
| Series 2000 A: | | | | | | |
| 5.5% 10/1/32 (Escrowed to Maturity) (d) | | | | 2,525,000 | | 2,790,554 |
| 5.5% 10/1/40 (Escrowed to Maturity) (d) | | | | 2,295,000 | | 2,519,474 |
| Puerto Rico Elec. Pwr. Auth. Pwr. Rev.: | | | | | | |
| Series HH, 5.25% 7/1/29 (FSA Insured) | | | | 200,000 | | 217,174 |
| Series QQ, 5.25% 7/1/14 (XL Cap. Assurance, Inc. Insured) | | | | 500,000 | | 565,070 |
| | | | | | | 10,970,862 |
| |
| |
| TOTAL INVESTMENT PORTFOLIO 98.8% | | | | | | |
| (Cost $95,651,840) | | | | | | 99,489,796 |
| |
| NET OTHER ASSETS – 1.2% | | | | | | 1,205,685 |
| NET ASSETS 100% | | | | | | $ 100,695,481 |
See accompanying notes which are an integral part of the financial statements.
13 Annual Report
Fidelity Arizona Municipal Income Fund
Investments continued
Legend
(a) Security or a portion of the security purchased on a delayed delivery or when-issued basis.
(b) The coupon rate shown on floating or adjustable rate securities represents the rate at period end.
(c) Private activity obligations whose interest is subject to the federal alternative minimum tax for individuals. (d) Security collateralized by an amount sufficient to pay interest and principal.
The distribution of municipal securities by revenue source, as a percentage of total net assets, is as follows:
| General Obligations | | 21.3% |
| Special Tax | | 20.0% |
| Water & Sewer | | 17.8% |
| Escrowed/Pre Refunded | | 15.5% |
| Electric Utilities | | 10.5% |
| Health Care | | 5.9% |
| Others* (individually less than 5%) | | 9.0% |
| | | 100.0% |
| * Includes net other assets | | |
See accompanying notes which are an integral part of the financial statements.
| Fidelity Arizona Municipal Income Fund | | | | | | |
| |
| Financial Statements | | | | | | | | |
| |
| Statement of Assets and Liabilities | | | | | | | | |
| | | | | | | | | August 31, 2005 |
| |
| Assets | | | | | | | | |
| Investment in securities, at value (cost $95,651,840) | | | | | | | | |
| See accompanying schedule | | | | | | $ | | 99,489,796 |
| Cash | | | | | | | | 4,031,161 |
| Receivable for fund shares sold | | | | | | | | 21,243 |
| Interest receivable | | | | | | | | 1,059,231 |
| Other receivables | | | | | | | | 7,876 |
| Total assets | | | | | | | | 104,609,307 |
| |
| Liabilities | | | | | | | | |
| Payable for investments purchased on a delayed delivery | | | | | | |
| basis | | $ | | 3,678,860 | | | | |
| Payable for fund shares redeemed | | | | 62,415 | | | | |
| Distributions payable | | | | 127,293 | | | | |
| Accrued management fee | | | | 45,222 | | | | |
| Other affiliated payables | | | | 36 | | | | |
| Total liabilities | | | | | | | | 3,913,826 |
| |
| Net Assets | | | | | | $ | | 100,695,481 |
| Net Assets consist of: | | | | | | | | |
| Paid in capital | | | | | | $ | | 96,580,513 |
| Undistributed net investment income | | | | | | | | 16,823 |
| Accumulated undistributed net realized gain (loss) on | | | | | | | | |
| investments | | | | | | | | 260,189 |
| Net unrealized appreciation (depreciation) on | | | | | | | | |
| investments | | | | | | | | 3,837,956 |
| Net Assets, for 8,686,934 shares outstanding | | | | | | $ | | 100,695,481 |
| Net Asset Value, offering price and redemption price per | | | | | | |
| share ($100,695,481 ÷8,686,934 shares) | | | | | | $ | | 11.59 |
See accompanying notes which are an integral part of the financial statements.
15 Annual Report
| Fidelity Arizona Municipal Income Fund | | | | |
| Financial Statements continued | | | | |
| |
| Statement of Operations | | | | | | |
| | | | | Year ended August 31, 2005 |
| |
| Investment Income | | | | | | |
| Interest | | | | $ | | 3,677,329 |
| |
| Expenses | | | | | | |
| Management fee | | $ | | 490,000 | | |
| Independent trustees’ compensation | | | | 437 | | |
| Miscellaneous | | | | 170 | | |
| Total expenses before reductions | | | | 490,607 | | |
| Expense reductions | | | | (40,395) | | 450,212 |
| |
| Net investment income | | | | | | 3,227,117 |
| Realized and Unrealized Gain (Loss) | | | | |
| Net realized gain (loss) on: | | | | | | |
| Investment securities | | | | 285,147 | | |
| Futures contracts | | | | (5,166) | | |
| Total net realized gain (loss) | | | | | | 279,981 |
| Change in net unrealized appreciation (depreciation) on | | | | |
| investment securities | | | | | | 444,357 |
| Net gain (loss) | | | | | | 724,338 |
| Net increase (decrease) in net assets resulting from | | | | |
| operations | | | | $ | | 3,951,455 |
See accompanying notes which are an integral part of the financial statements.
| Statement of Changes in Net Assets | | | | | | | | |
| | | | | Year ended | | | | Year ended |
| | | | | August 31, | | | | August 31, |
| | | | | 2005 | | | | 2004 |
| Increase (Decrease) in Net Assets | | | | | | | | |
| Operations | | | | | | | | |
| Net investment income | | $ | | 3,227,117 | | $ | | 2,802,486 |
| Net realized gain (loss) | | | | 279,981 | | | | 463,856 |
| Change in net unrealized appreciation (depreciation) . | | | | 444,357 | | | | 1,209,249 |
| Net increase (decrease) in net assets resulting | | | | | | | | |
| from operations | | | | 3,951,455 | | | | 4,475,591 |
| Distributions to shareholders from net investment income . | | | | (3,235,508) | | | | (2,795,363) |
| Distributions to shareholders from net realized gain | | | | (377,090) | | | | (406,255) |
| Total distributions | | | | (3,612,598) | | | | (3,201,618) |
| Share transactions | | | | | | | | |
| Proceeds from sales of shares | | | | 34,309,224 | | | | 29,031,760 |
| Reinvestment of distributions | | | | 2,144,524 | | | | 2,011,588 |
| Cost of shares redeemed | | | | (14,386,971) | | | | (22,721,013) |
| Net increase (decrease) in net assets resulting from | | | | | | | | |
| share transactions | | | | 22,066,777 | | | | 8,322,335 |
| Redemption fees | | | | 977 | | | | 3,125 |
| Total increase (decrease) in net assets | | | | 22,406,611 | | | | 9,599,433 |
| |
| Net Assets | | | | | | | | |
| Beginning of period | | | | 78,288,870 | | | | 68,689,437 |
| End of period (including undistributed net investment | | | | | | | | |
| income of $16,823 and undistributed net investment | | | | | | | | |
| income of $18,878, respectively) | | $ | | 100,695,481 | | $ | | 78,288,870 |
| |
| Other Information | | | | | | | | |
| Shares | | | | | | | | |
| Sold | | | | 2,973,441 | | | | 2,514,738 |
| Issued in reinvestment of distributions | | | | 185,788 | | | | 174,888 |
| Redeemed | | | | (1,246,428) | | | | (1,985,119) |
| Net increase (decrease) | | | | 1,912,801 | | | | 704,507 |
See accompanying notes which are an integral part of the financial statements.
17 Annual Report
| Financial Highlights | | | | | | | | | | | | |
| |
| Years ended August 31, | | 2005 | | 2004 | | 2003 | | 2002 | | | | 2001 |
| Selected Per Share Data | | | | | | | | | | | | |
| Net asset value, | | | | | | | | | | | | |
| beginning of period | | $ 11.56 | | $ 11.32 | | $ 11.50 | | $ 11.26 | | $ | | 10.72 |
| Income from Investment | | | | | | | | | | | | |
| Operations | | | | | | | | | | | | |
| Net investment incomeB | | 417 | | .427 | | .435 | | .444D | | | | .472 |
| Net realized and unrealized | | | | | | | | | | | | |
| gain (loss) | | 087 | | .306 | | (.090) | | .254D | | | | .542 |
| Total from investment | | | | | | | | | | | | |
| operations | | 504 | | .733 | | .345 | | .698 | | | | 1.014 |
| Distributions from net investment | | | | | | | | | | | | |
| income | | (.419) | | (.427) | | (.435) | | (.443) | | | | (.475) |
| Distributions from net realized | | | | | | | | | | | | |
| gain | | (.055) | | (.066) | | (.090) | | (.015) | | | | (.001) |
| Total distributions | | (.474) | | (.493) | | (.525) | | (.458) | | | | (.476) |
| Redemption fees added to paid | | | | | | | | | | | | |
| in capitalB | | —E | | —E | | —E | | —E | | | | .002 |
| Net asset value, end of period . | | $ 11.59 | | $ 11.56 | | $ 11.32 | | $ 11.50 | | $ | | 11.26 |
| Total ReturnA | | 4.46% | | 6.58% | | 3.01% | | 6.38% | | | | 9.70% |
| Ratios to Average Net AssetsC | | | | | | | | | | | | |
| Expenses before expense | | | | | | | | | | | | |
| reductions | | 55% | | .55% | | .55% | | .55% | | | | .55% |
| Expenses net of voluntary | | | | | | | | | | | | |
| waivers, if any | | 55% | | .55% | | .55% | | .55% | | | | .55% |
| Expenses net of all reductions | | .50% | | .53% | | .52% | | .48% | | | | .41% |
| Net investment income | | 3.62% | | 3.72% | | 3.77% | | 3.96%D | | | | 4.32% |
| Supplemental Data | | | | | | | | | | | | |
| Net assets, end of period | | | | | | | | | | | | |
| (000 omitted) | | $100,695 | | $78,289 | | $68,689 | | $66,105 | | $50,716 |
| Portfolio turnover rate | | 13% | | 14% | | 19% | | 30% | | | | 24% |
A Total returns would have been lower had certain expenses not been reduced during the periods shown.
B Calculated based on average shares outstanding during the period.
C Expense ratios reflect operating expenses of the fund. Expenses before reductions do not reflect amounts reimbursed by the investment adviser or reductions from brokerage service arrangements or other expense offset arrangements and do not represent the amount paid by the fund during periods when reimbursements or reductions occur. Expenses net of any voluntary waivers reflect expenses after reimbursement by the investment adviser but prior to reductions from brokerage service arrangements or other expense offset arrangements. Expenses net of all reductions represent the net expenses paid by the fund.
D Effective September 1, 2001, the fund adopted the provisions of the AICPA Audit and Accounting Guide for Investment Companies and began amortizing premium and discount on all debt securities. Per share data and ratios for periods prior to adoption have not been restated to reflect this change.
E Amount represents less than $.001 per share.
See accompanying notes which are an integral part of the financial statements.
Fidelity Arizona Municipal Money Market Fund
Investment Changes/Performance
| Maturity Diversification | | | | | | |
| Days | | % of fund’s | | % of fund’s | | % of fund’s |
| | | investments | | investments | | investments |
| | | 8/31/05 | | 2/28/05 | | 8/31/04 |
| 0 – 30 | | 97.6 | | 88.5 | | 92.7 |
| 31 – 90 | | 1.7 | | 3.6 | | 0.0 |
| 91 – 180 | | 0.7 | | 2.8 | | 4.1 |
| 181 – 397 | | 0.0 | | 5.1 | | 3.2 |
| Weighted Average Maturity | | | | | | |
| | | 8/31/05 | | 2/28/05 | | 8/31/04 |
| Fidelity Arizona Municipal | | | | | | |
| Money Market Fund | | 9 Days | | 20 Days | | 18 Days |
| All Tax Free Money Market | | | | | | |
| Funds Average* | | 28 Days | | 28 Days | | 36 Days |
| Current and Historical Seven Day Yields | | | | | | |
| | | 8/29/05 | | 5/30/05 | | 2/28/05 | | 11/29/04 | | 8/30/04 |
| Fidelity Arizona Municipal | | | | | | | | | | |
| Money Market Fund | | 2.07% | | 2.44% | | 1.38% | | 1.19% | | 0.85% |
Yield refers to the income paid by the fund over a given period. Yields for money market funds are usually for seven day periods, as they are here, though they are expressed as annual percentage rates. Past performance is no guarantee of future results. Yield will vary and it is possible to lose money by investing in the fund.
*Source: iMoneyNet, Inc.
Annual Report
| Fidelity Arizona Municipal Money Market Fund | | | | |
| Investments August 31, | | 2005 | | | | |
| Showing Percentage of Net Assets | | | | | | |
| |
| Municipal Securities 95.1% | | | | | | |
| | | Principal | | | | Value |
| | | Amount | | | | (Note 1) |
| Arizona – 92.9% | | | | | | |
| Arizona Health Facilities Auth. Rev.: | | | | | | |
| (Banner Health Proj.): | | | | | | |
| Series 2005 B, 2.35% (FGIC Insured), VRDN (c) | | $ 4,500,000 | | $ | | 4,500,000 |
| Series 2005 C, 2.31% (FGIC Insured), VRDN (c) | | 3,000,000 | | | | 3,000,000 |
| (Royal Oaks Life Care Cmnty. Proj.) 2.49%, LOC Lasalle | | | | | | |
| Bank NA, VRDN (c) | | 5,000,000 | | | | 5,000,000 |
| (Southwest Behavioral Health Services, Inc. Proj.) 2.42%, | | | | | | |
| LOC JPMorgan Chase Bank, VRDN (c) | | 1,930,000 | | | | 1,930,000 |
| Series 2005 A, 2.35% (MBIA Insured), VRDN (c) | | 6,500,000 | | | | 6,500,000 |
| Arizona School Facilities Board Ctfs. of Prtn. Participating | | | | | | |
| VRDN: | | | | | | |
| Series IXIS 05 5, 2.53% (Liquidity Facility CDC Fin.-CDC | | | | | | |
| IXIS) (c)(f) | | 1,800,000 | | | | 1,800,000 |
| Series PT 2800, 2.53% (Liquidity Facility Merrill Lynch & Co., | | | | |
| Inc.) (c)(f) | | 3,000,000 | | | | 3,000,000 |
| Series Putters 735, 2.53% (Liquidity Facility Dresdner Bank | | | | |
| AG) (c)(f) | | 3,670,000 | | | | 3,670,000 |
| Series Putters 940, 2.53% (Liquidity Facility JPMorgan Chase | | | | |
| Bank) (c)(f) | | 2,000,000 | | | | 2,000,000 |
| Series RF 04 2, 2.57% (Liquidity Facility Bank of New York, | | | | |
| New York) (c)(f) | | 1,375,000 | | | | 1,375,000 |
| Series ROC II R 4069, 2.53% (Liquidity Facility Citigroup | | | | | | |
| Global Markets Hldgs., Inc.) (c)(f) | | 1,700,000 | | | | 1,700,000 |
| Arizona School Facilities Board State School Impt. Rev. | | | | | | |
| Participating VRDN: | | | | | | |
| Series MS 00 497, 2.52% (Liquidity Facility Morgan | | | | | | |
| Stanley) (c)(f) | | 1,047,000 | | | | 1,047,000 |
| Series Putters 483, 2.53% (Liquidity Facility PNC Bank NA, | | | | |
| Pittsburgh) (c)(f) | | 1,480,000 | | | | 1,480,000 |
| Series Putters 484, 2.53% (Liquidity Facility JPMorgan Chase | | | | |
| Bank) (c)(f) | | 1,480,000 | | | | 1,480,000 |
| Arizona State Univ. Ctfs. of Prtn. Participating VRDN Series | | | | | | |
| Putters 694, 2.53% (Liquidity Facility JPMorgan Chase & | | | | | | |
| Co.) (c)(f) | | 2,630,000 | | | | 2,630,000 |
| Arizona State Univ. Revs. Participating VRDN: | | | | | | |
| Series PT 2264, 2.53% (Liquidity Facility Merrill Lynch & Co., | | | | |
| Inc.) (c)(f) | | 4,000,000 | | | | 4,000,000 |
| Series ROC II R174, 2.53% (Liquidity Facility Citibank | | | | | | |
| NA) (c)(f) | | 3,700,000 | | | | 3,700,000 |
| Arizona Tourism & Sports Auth. Tax Rev. Participating VRDN: | | | | |
| Series PT 2312, 2.53% (Liquidity Facility Merrill Lynch & Co., | | | | |
| Inc.) (c)(f) | | 1,600,000 | | | | 1,600,000 |
See accompanying notes which are an integral part of the financial statements.
Annual Report
| Municipal Securities continued | | | | | | |
| | | Principal | | | | Value |
| | | Amount | | | | (Note 1) |
| Arizona – continued | | | | | | |
| Arizona Tourism & Sports Auth. Tax Rev. Participating VRDN: | | | | | | |
| – continued | | | | | | |
| Series Putters 690, 2.53% (Liquidity Facility JPMorgan Chase | | | | | | |
| & Co.) (c)(f) | | $ 1,700,000 | | $ | | 1,700,000 |
| Arizona Trans. Board Hwy. Rev. Participating VRDN Series | | | | | | |
| ROC II R1038, 2.53% (Liquidity Facility Citigroup Global | | | | | | |
| Markets Hldgs., Inc.) (c)(f) | | 2,030,000 | | | | 2,030,000 |
| Arizona Wtr. Infrastructure Fin. Auth. Rev. Participating VRDN | | | | | | |
| Series PT 2237, 2.53% (Liquidity Facility Merrill Lynch & Co., | | | | | | |
| Inc.) (c)(f) | | 1,500,000 | | | | 1,500,000 |
| Casa Grande Indl. Dev. Auth. Indl. Dev. Rev. (Price | | | | | | |
| Companies, Inc. Proj.) Series A, 2.55%, LOC Bank of | | | | | | |
| America NA, VRDN (c)(e) | | 2,060,000 | | | | 2,060,000 |
| Central Arizona Wtr. Conservation District Contract Rev. Bonds | | | | | | |
| (Central Arizona Proj.) Series A, 5.4% 11/1/05 | | 3,450,000 | | | | 3,465,342 |
| Chandler Indl. Dev. Auth. Indl. Dev. Rev. (Red Rock Stamping | | | | | | |
| Co. Proj.) Series 2000, 2.64%, LOC Key Bank NA, | | | | | | |
| VRDN (c)(e) | | 2,255,000 | | | | 2,255,000 |
| Cochise County Poll. Cont. Rev. Solid Waste Disp. Rev. Bonds | | | | | | |
| (Arizona Elec. Pwr. Coop. Proj.) 2.3%, tender 9/1/05 | | | | | | |
| (Nat’l. Rural Utils. Coop. Fin. Corp. Guaranteed) (c)(e) | | 4,000,000 | | | | 4,000,000 |
| Coconino County Poll. Cont. Corp. Rev. (Arizona Pub. Svc. Co. | | | | | | |
| Navajo Proj.) Series 1994 A, 2.41%, LOC KBC Bank NV, | | | | | | |
| VRDN (c)(e) | | 5,400,000 | | | | 5,400,000 |
| Flagstaff Indl. Dev. Auth. Solid Waste Disp. Rev. (Norton Envir., | | | | | | |
| Inc. Proj.) Series 1997, 2.64%, LOC Key Bank NA, | | | | | | |
| VRDN (c)(e) | | 2,200,000 | | | | 2,200,000 |
| Glendale Indl. Dev. Auth. Indl. Dev. Rev. (Superior Bedding Co. | | | | | | |
| Proj.) Series 1994, 2.66%, LOC Harris NA, VRDN (c)(e) | | 700,000 | | | | 700,000 |
| Maricopa County Indl. Dev. Auth. Indl. Dev. Rev.: | | | | | | |
| Bonds (American Wtr. Corp. Proj.) Series 1988, 2.8% tender | | | | | | |
| 9/7/05, CP mode (e) | | 1,600,000 | | | | 1,600,000 |
| (Clayton Homes, Inc. Proj.) Series 1998, 2.59%, LOC U.S. | | | | | | |
| Bank NA, Minnesota, VRDN (c)(e) | | 1,000,000 | | | | 1,000,000 |
| Maricopa County Indl. Dev. Auth. Multi-family Hsg. Rev.: | | | | | | |
| (Glenn Oaks Apts. Proj.) Series 2001, 2.6%, LOC Fannie | | | | | | |
| Mae, VRDN (c)(e) | | 3,299,675 | | | | 3,299,675 |
| (Ranchwood Apt. Proj.) Series 2001 A, 2.55%, LOC Fannie | | | | | | |
| Mae, VRDN (c)(e) | | 5,000,000 | | | | 5,000,000 |
| (San Angelin Apts. Proj.) 2.57%, LOC Fannie Mae, | | | | | | |
| VRDN (c)(e) | | 3,100,000 | | | | 3,100,000 |
| (San Lucas Apts. Proj.) 2.57%, LOC Fannie Mae, | | | | | | |
| VRDN (c)(e) | | 1,700,000 | | | | 1,700,000 |
See accompanying notes which are an integral part of the financial statements.
Annual Report
| Fidelity Arizona Municipal Money Market Fund | | | | | | |
| Investments continued | | | | | | | | |
| |
| Municipal Securities continued | | | | | | | | |
| | | | | Principal | | | | Value |
| | | | | Amount | | | | (Note 1) |
| Arizona – continued | | | | | | | | |
| Maricopa County Indl. Dev. Auth. Multi-family Hsg. Rev.: - | | | | | | | | |
| continued | | | | | | | | |
| (San Martin Apts. Proj.): | | | | | | | | |
| Series A1, 2.55%, LOC Fannie Mae, VRDN (c)(e) | | $ | | 2,700,000 | | $ | | 2,700,000 |
| Series A2, 2.55%, LOC Fannie Mae, VRDN (c)(e) | | | | 720,000 | | | | 720,000 |
| (San Miguel Apts. Proj.) 2.57%, LOC Fannie Mae, | | | | | | | | |
| VRDN (c)(e) | | | | 1,300,000 | | | | 1,300,000 |
| (San Remo Apts. Proj.) 2.55%, LOC Fannie Mae, | | | | | | | | |
| VRDN (c)(e) | | | | 3,400,000 | | | | 3,400,000 |
| (Village Square Apts. Proj.) 2.57%, LOC Fannie Mae, | | | | | | | | |
| VRDN (c)(e) | | | | 1,600,000 | | | | 1,600,000 |
| Maricopa County Indl. Dev. Auth. Single Family Mtg. Rev. | | | | | | | | |
| Participating VRDN: | | | | | | | | |
| Series Floaters 707, 2.57% (Liquidity Facility Morgan | | | | | | | | |
| Stanley) (c)(e)(f) | | | | 2,000,000 | | | | 2,000,000 |
| Series Merlots 01 A126, 2.45% (Liquidity Facility Wachovia | | | | | | |
| Bank NA) (c)(e)(f) | | | | 105,000 | | | | 105,000 |
| Series MS 1165, 2.57% (Liquidity Facility Morgan | | | | | | | | |
| Stanley) (c)(e)(f) | | | | 2,000,000 | | | | 2,000,000 |
| Maricopa County Indl. Dev. Auth. Solid Waste Disp. Rev. | | | | | | | | |
| Participating VRDN Series MT 48, 2.6% (Liquidity Facility | | | | | | |
| Lloyds TSB Bank PLC) (c)(e)(f) | | | | 1,770,000 | | | | 1,770,000 |
| McAllister Academic Village LLC Rev. (Arizona State Univ. | | | | | | | | |
| McAllister Academic Village Proj.) Series A, 2.35% (AMBAC | | | | | | |
| Insured), VRDN (c) | | | | 5,500,000 | | | | 5,500,000 |
| Phoenix Civic Impt. Board Arpt. Rev. Participating VRDN | | | | | | | | |
| Series Merlots 02 A28, 2.45% (Liquidity Facility Wachovia | | | | | | |
| Bank NA) (c)(e)(f) | | | | 1,280,000 | | | | 1,280,000 |
| Phoenix Civic Impt. Corp. Excise Tax Rev.: | | | | | | | | |
| Participating VRDN Series EGL 03 28, 2.53% (Liquidity | | | | | | | | |
| Facility Citibank NA, New York) (c)(f) | | | | 1,300,000 | | | | 1,300,000 |
| Series 1995, 2.39%, LOC Landesbank Hessen-Thuringen, | | | | | | |
| VRDN (c)(e) | | | | 17,200,000 | | | | 17,200,000 |
| Phoenix Civic Impt. Corp. Transit Excise Tax Rev. Participating | | | | | | |
| VRDN: | | | | | | | | |
| Series EGL 7050040, 2.53% (Liquidity Facility Citibank | | | | | | | | |
| NA) (c)(f) | | | | 1,800,000 | | | | 1,800,000 |
| Series EGL 720050020, 2.53% (Liquidity Facility Citibank | | | | | | |
| NA) (c)(f) | | | | 1,800,000 | | | | 1,800,000 |
| Series PT 2454, 2.53% (Liquidity Facility Merrill Lynch & Co., | | | | | | |
| Inc.) (c)(f) | | | | 5,420,000 | | | | 5,420,000 |
See accompanying notes which are an integral part of the financial statements.
Annual Report
| Municipal Securities continued | | | | | | |
| | | Principal | | | | Value |
| | | Amount | | | | (Note 1) |
| Arizona – continued | | | | | | |
| Phoenix Civic Impt. Corp. Wastewtr. Sys. Rev. Participating | | | | | | |
| VRDN: | | | | | | |
| Series MS 991, 2.52% (Liquidity Facility Morgan | | | | | | |
| Stanley) (c)(f) | | $ 1,500,000 | | $ | | 1,500,000 |
| Series ROC II R6039, 2.53% (Liquidity Facility Citibank | | | | | | |
| NA) (c)(f) | | 3,070,000 | | | | 3,070,000 |
| Phoenix Civic Impt. Corp. Wtr. Sys. Rev. Participating VRDN: | | | | | | |
| Series BS 9063, 2.41% (Liquidity Facility Bear Stearns | | | | | | |
| Companies, Inc.) (c)(f) | | 2,000,000 | | | | 2,000,000 |
| Series EGL 7050056, 2.53% (Liquidity Facility Citibank | | | | | | |
| NA) (c)(f) | | 2,000,000 | | | | 2,000,000 |
| Phoenix Indl. Dev. Auth. Multi-family Hsg. Rev.: | | | | | | |
| (Bell Square Apt. Proj.) Series 1995, 2.45%, LOC Gen. Elec. | | | | | | |
| Cap. Corp., VRDN (c) | | 1,000,000 | | | | 1,000,000 |
| (Westward Ho Apts. Proj.) Series 2003 A, 2.59%, LOC Fleet | | | | | | |
| Nat’l. Bank, VRDN (c)(e) | | 1,700,000 | | | | 1,700,000 |
| Phoenix Indl. Dev. Auth. Rev.: | | | | | | |
| (Independent Newspaper, Inc. Proj.) Series 2000, 2.64%, | | | | | | |
| LOC Wachovia Bank NA, VRDN (c)(e) | | 900,000 | | | | 900,000 |
| (Laura Dozer Ctr. Proj.) 2.65%, LOC JPMorgan Chase Bank, | | | | | | |
| VRDN (c) | | 1,000,000 | | | | 1,000,000 |
| (Phoenix Expansion Proj.) 2.7%, LOC JPMorgan Chase | | | | | | |
| Bank, VRDN (c)(e) | | 2,340,000 | | | | 2,340,000 |
| (Plastican Proj.) Series 1997, 2.4%, LOC Fleet Bank NA, | | | | | | |
| VRDN (c)(e) | | 2,740,000 | | | | 2,740,000 |
| (Swift Aviation Svcs., Inc. Proj.) 2.42%, LOC U.S. Bank NA, | | | | | | |
| Minnesota, VRDN (c)(e) | | 5,395,000 | | | | 5,395,000 |
| Phoenix Indl. Dev. Auth. Single Family Mtg. Rev. Participating | | | | | | |
| VRDN: | | | | | | |
| Series Merlots 01 A23, 2.45% (Liquidity Facility Wachovia | | | | | | |
| Bank NA) (c)(e)(f) | | 220,000 | | | | 220,000 |
| Series PT 1082, 2.57% (Liquidity Facility Merrill Lynch & Co., | | | | | | |
| Inc.) (c)(e)(f) | | 840,000 | | | | 840,000 |
| Pima County Indl. Dev. Auth. Indl. Rev. Participating VRDN | | | | | | |
| Series LB 00 L21, 2.48% (Liquidity Facility Lehman Brothers | | | | | | |
| Hldgs., Inc.) (c)(f) | | 2,575,000 | | | | 2,575,000 |
| Pima County Indl. Dev. Auth. Multi-family Hsg. Rev. (River | | | | | | |
| Point Proj.) Series 2001, 2.55%, LOC Fannie Mae, | | | | | | |
| VRDN (c)(e) | | 6,000,000 | | | | 6,000,000 |
| Pima County Indl. Dev. Auth. Rev. (El Dorado Hosp. Proj.) | | | | | | |
| 2.52%, LOC Branch Banking & Trust Co., VRDN (c) | | 1,600,000 | | | | 1,600,000 |
See accompanying notes which are an integral part of the financial statements.
Annual Report
| Fidelity Arizona Municipal Money Market Fund | | | | | | |
| Investments continued | | | | | | | | |
| |
| Municipal Securities continued | | | | | | | | |
| | | | | Principal | | | | Value |
| | | | | Amount | | | | (Note 1) |
| Arizona – continued | | | | | | | | |
| Salt River Proj. Agric. Impt. & Pwr. District Elec. Sys. Rev.: | | | | | | | | |
| Participating VRDN: | | | | | | | | |
| Series MS 1172, 2.39% (Liquidity Facility Morgan | | | | | | | | |
| Stanley) (c)(f) | | $ | | 2,200,000 | | $ | | 2,200,000 |
| Series PT 1512, 2.53% (Liquidity Facility Merrill Lynch & | | | | | | | | |
| Co., Inc.) (c)(f) | | | | 1,200,000 | | | | 1,200,000 |
| Series ROC II R1002, 2.53% (Liquidity Facility Citigroup | | | | | | | | |
| Global Markets Hldgs., Inc.) (c)(f) | | | | 1,285,000 | | | | 1,285,000 |
| Series ROC II R1003, 2.53% (Liquidity Facility Citigroup | | | | | | | | |
| Global Markets Hldgs., Inc.) (c)(f) | | | | 1,280,000 | | | | 1,280,000 |
| Series SG 03 160, 2.53% (Liquidity Facility Societe | | | | | | | | |
| Generale) (c)(f) | | | | 1,390,000 | | | | 1,390,000 |
| Series 1997 B: | | | | | | | | |
| 2.5% 9/6/05, CP | | | | 3,300,000 | | | | 3,300,000 |
| 2.7% 9/7/05, CP | | | | 2,100,000 | | | | 2,100,000 |
| Series 2004 C: | | | | | | | | |
| 2.75% 9/15/05, CP | | | | 1,500,000 | | | | 1,500,000 |
| 2.8% 9/15/05, CP | | | | 1,900,000 | | | | 1,900,000 |
| Scottsdale Indl. Dev. Auth. Rev. (Notre Dame Preparatory | | | | | | | | |
| School and Foundation for Sr. Living Proj.) Series 2001 B, | | | | | | | | |
| 2.5%, LOC JPMorgan Chase Bank, VRDN (c) | | | | 1,400,000 | | | | 1,400,000 |
| Sun Devil Energy Ctr. LLC Rev. (Arizona State Univ. Proj.) | | | | | | | | |
| 2.37% (FGIC Insured), VRDN (c) | | | | 1,600,000 | | | | 1,600,000 |
| Tempe Indl. Dev. Auth. Rev. (ASUF Brickyard Proj.) Series 2004 | | | | | | |
| A, 2.5%, LOC Bank of America NA, VRDN (c) | | | | 3,640,000 | | | | 3,640,000 |
| Univ. of Arizona Ctfs. of Prtn. (Univ. of Arizona Projs.) | | | | | | | | |
| Series 2004 B, 2.36% (AMBAC Insured), VRDN (c) | | | | 2,300,000 | | | | 2,300,000 |
| Yavapai County Indl. Dev. Auth. Indl. Dev. Rev. (Oxycal Lab. | | | | | | | | |
| Proj.) Series 1999 A, 2.65%, LOC Wells Fargo Bank NA, | | | | | | | | |
| San Francisco, VRDN (c)(e) | | | | 1,000,000 | | | | 1,000,000 |
| | | | | | | | | 202,292,017 |
| |
| Puerto Rico 0.6% | | | | | | | | |
| Puerto Rico Govt. Dev. Bank 2.85% 1/30/06, LOC Societe | | | | | | | | |
| Generale, CP (b) | | | | 1,400,000 | | | | 1,400,000 |
See accompanying notes which are an integral part of the financial statements.
| Municipal Securities continued | | | | |
| | | Shares | | Value |
| | | | | (Note 1) |
| Other – 1.6% | | | | |
| Fidelity Municipal Cash Central Fund, 2.49% (a)(d) | | 3,410,333 | | $ 3,410,333 |
| |
| TOTAL INVESTMENT PORTFOLIO 95.1% | | | | |
| (Cost $207,102,350) | | | | 207,102,350 |
| |
| NET OTHER ASSETS – 4.9% | | | | 10,717,107 |
| NET ASSETS 100% | | $ | | 217,819,457 |
Security Type Abbreviations
CP COMMERCIAL PAPER
VRDN — VARIABLE RATE DEMAND NOTE
(a) Affiliated fund that is available only to investment companies and other accounts managed by Fidelity Investments. The rate quoted is the annualized seven-day yield of the fund at period end. A complete listing of the fund’s holdings as of its most recent quarter end is available upon request.
(b) Security exempt from registration under Rule 144A of the Securities Act of 1933. These securities may be resold in transactions exempt from registration, normally to qualified institutional buyers. At the period end, the value of these securities amounted to $1,400,000 or 0.6% of net assets.
(c) The coupon rate shown on floating or adjustable rate securities represents the rate at period end.
(d) Information in this report regarding holdings by state and security types does not reflect the holdings of the Fidelity Municipal Cash Central Fund.
(e) Private activity obligations whose interest is subject to the federal alternative minimum tax for individuals. (f) Provides evidence of ownership in one or more underlying municipal bonds.
See accompanying notes which are an integral part of the financial statements.
25 Annual Report
| Fidelity Arizona Municipal Money Market Fund | | | | |
| |
| Financial Statements | | | | | | | | |
| |
| Statement of Assets and Liabilities | | | | | | | | |
| | | | | | | | | August 31, 2005 |
| |
| Assets | | | | | | | | |
| Investment in securities, at value (cost $207,102,350) | | | | | | | | |
| See accompanying schedule | | | | | | $ | | 207,102,350 |
| Cash | | | | | | | | 10,349,961 |
| Receivable for fund shares sold | | | | | | | | 2,862,515 |
| Interest receivable | | | | | | | | 756,512 |
| Other receivables | | | | | | | | 23,556 |
| Total assets | | | | | | | | 221,094,894 |
| |
| Liabilities | | | | | | | | |
| Payable for investments purchased | | $ | | 2,200,000 | | | | |
| Payable for fund shares redeemed | | | | 979,976 | | | | |
| Distributions payable | | | | 6,680 | | | | |
| Accrued management fee | | | | 88,712 | | | | |
| Other affiliated payables | | | | 69 | | | | |
| Total liabilities | | | | | | | | 3,275,437 |
| |
| Net Assets | | | | | | $ | | 217,819,457 |
| Net Assets consist of: | | | | | | | | |
| Paid in capital | | | | | | $ | | 217,793,383 |
| Undistributed net investment income | | | | | | | | 19,254 |
| Accumulated undistributed net realized gain (loss) on | | | | | | | | |
| investments | | | | | | | | 6,820 |
| Net Assets, for 217,693,823 shares outstanding | | | | | | $ | | 217,819,457 |
| Net Asset Value, offering price and redemption price per | | | | | | |
| share ($217,819,457 ÷ 217,693,823 shares) | | | | | | $ | | 1.00 |
See accompanying notes which are an integral part of the financial statements.
| Statement of Operations | | | | | | |
| | | | | Year ended August 31, 2005 |
| |
| Investment Income | | | | | | |
| Interest | | | | $ | | 3,700,633 |
| |
| Expenses | | | | | | |
| Management fee | | $ | | 899,281 | | |
| Independent trustees’ compensation | | | | 877 | | |
| Total expenses before reductions | | | | 900,158 | | |
| Expense reductions | | | | (133,335) | | 766,823 |
| |
| Net investment income | | | | | | 2,933,810 |
| |
| Net realized gain (loss) on investment securities | | | | | | 6,668 |
| Net increase in net assets resulting from operations | | | | $ | | 2,940,478 |
See accompanying notes which are an integral part of the financial statements.
27 Annual Report
| Fidelity Arizona Municipal Money Market Fund | | | | |
| Financial Statements continued | | | | | | | | |
| |
| Statement of Changes in Net Assets | | | | | | | | |
| | | | | Year ended | | | | Year ended |
| | | | | August 31, | | | | August 31, |
| | | | | 2005 | | | | 2004 |
| Increase (Decrease) in Net Assets | | | | | | | | |
| Operations | | | | | | | | |
| Net investment income | | $ | | 2,933,810 | | $ | | 856,308 |
| Net realized gain (loss) | | | | 6,668 | | | | 43,224 |
| Net increase in net assets resulting | | | | | | | | |
| from operations | | | | 2,940,478 | | | | 899,532 |
| Distributions to shareholders from net investment income . | | | | (2,931,883) | | | | (856,308) |
| Share transactions at net asset value of $1.00 per share | | | | | | | | |
| Proceeds from sales of shares | | | | 502,664,387 | | | | 284,737,103 |
| Reinvestment of distributions | | | | 2,899,293 | | | | 847,210 |
| Cost of shares redeemed | | | | (444,707,485) | | | | (262,790,710) |
| Net increase (decrease) in net assets and shares | | | | | | | | |
| resulting from share transactions | | | | 60,856,195 | | | | 22,793,603 |
| Total increase (decrease) in net assets | | | | 60,864,790 | | | | 22,836,827 |
| |
| Net Assets | | | | | | | | |
| Beginning of period | | | | 156,954,667 | | | | 134,117,840 |
| End of period (including undistributed net investment | | | | | | | | |
| income of $19,254 and undistributed net investment | | | | | | | | |
| income of $0, respectively) | | $ | | 217,819,457 | | $ | | 156,954,667 |
See accompanying notes which are an integral part of the financial statements.
| Financial Highlights | | | | | | | | | | | | | | | | | | | | |
| |
| Years ended August 31, | | | | 2005 | | | | 2004 | | | | 2003 | | | | 2002 | | | | 2001 |
| Selected Per Share Data | | | | | | | | | | | | | | | | | | | | |
| Net asset value, | | | | | | | | | | | | | | | | | | | | |
| beginning of period | | $ | | 1.00 | | $ | | 1.00 | | $ | | 1.00 | | $ | | 1.00 | | $ | | 1.00 |
| Income from Investment | | | | | | | | | | | | | | | | | | | | |
| Operations | | | | | | | | | | | | | | | | | | | | |
| Net investment income | | | | 016 | | | | .006 | | | | .008 | | | | .013 | | | | .032 |
| Net realized and unrealized | | | | | | | | | | | | | | | | | | | | |
| gain (loss)D | | | | — | | | | — | | | | — | | | | — | | | | — |
| Total from investment | | | | | | | | | | | | | | | | | | | | |
| operations | | | | 016 | | | | .006 | | | | .008 | | | | .013 | | | | .032 |
| Distributions from net investment | | | | | | | | | | | | | | | | | | | | |
| income | | | | (.016) | | | | (.006) | | | | (.008) | | | | (.013) | | | | (.032) |
| Distributions from net realized | | | | | | | | | | | | | | | | | | | | |
| gain | | | | — | | | | — | | | | —D | | | | — | | | | — |
| Total distributions | | | | (.016) | | | | (.006) | | | | (.008) | | | | (.013) | | | | (.032) |
| Net asset value, end of period . $ | | 1.00 | | $ | | 1.00 | | $ | | 1.00 | | $ | | 1.00 | | $ | | 1.00 |
| Total ReturnA,B | | | | 1.60% | | | | .60% | | | | .86% | | | | 1.30% | | | | 3.23% |
| Ratios to Average Net AssetsC | | | | | | | | | | | | | | | | | | | | |
| Expenses before expense | | | | | | | | | | | | | | | | | | | | |
| reductions | | | | 50% | | | | .50% | | | | .50% | | | | .50% | | | | .50% |
| Expenses net of voluntary | | | | | | | | | | | | | | | | | | | | |
| waivers, if any | | | | 50% | | | | .50% | | | | .50% | | | | .50% | | | | .50% |
| Expenses net of all reductions | | | | .43% | | | | .49% | | | | .48% | | | | .45% | | | | .47% |
| Net investment income | | | | 1.63% | | | | .60% | | | | .82% | | | | 1.27% | | | | 3.19% |
| Supplemental Data | | | | | | | | | | | | | | | | | | | | |
| Net assets, end of period | | | | | | | | | | | | | | | | | | | | |
| (000 omitted) | | $217,819 | | $156,955 | | $134,118 | | $132,208 | | $101,853 |
A Total returns would have been lower had certain expenses not been reduced during the periods shown.
B Total returns do not include the effect of the former account closeout fee.
C Expense ratios reflect operating expenses of the fund. Expenses before reductions do not reflect amounts reimbursed by the investment adviser or reductions from brokerage service arrangements or other expense offset arrangements and do not represent the amount paid by the fund during periods when reimbursements or reductions occur. Expenses net of any voluntary waivers reflect expenses after reimbursement by the investment adviser but prior to reductions from brokerage service arrangements or other expense offset arrangements. Expenses net of all reductions represent the net expenses paid by the fund.
D Amount represents less than $.001 per share.
See accompanying notes which are an integral part of the financial statements.
29 Annual Report
Notes to Financial Statements
For the period ended August 31, 2005
|
1. Significant Accounting Policies.
Fidelity Arizona Municipal Income Fund (the income fund) is a fund of Fidelity Union Street Trust. On July 21, 2005, the Board of Trustees approved a change in the name of Spartan Arizona Municipal Income Fund to Fidelity Arizona Municipal Income Fund effective August 15, 2005. Fidelity Arizona Municipal Money Market Fund (the money market fund) is a fund of Fidelity Union Street Trust II. Each trust is registered under the Investment Company Act of 1940, as amended (the 1940 Act), as an open end management investment company. Fidelity Union Street Trust and Fidelity Union Street Trust II (the trusts) are organized as a Massachusetts business trust and a Delaware statutory trust, respectively. The income fund is a non diversified fund. Each fund is authorized to issue an unlimited number of shares. Each fund may be affected by eco nomic and political developments in the state of Arizona. The financial statements have been prepared in conformity with accounting principles generally accepted in the United States of America, which require management to make certain estimates and assump tions at the date of the financial statements. The following summarizes the significant accounting policies of the income fund and the money market fund:
Security Valuation. Net asset value per share (NAV calculation) is calculated as of the close of business of the New York Stock Exchange, normally 4:00 p.m. Eastern time. For the income fund, debt securities, including restricted securities, are valued on the basis of information provided by a pricing service. Pricing services use valuation matrices that incorporate both dealer supplied valuations and valuation models. If prices are not readily available or do not accurately reflect fair value for a security, or if a security’s value has been materially affected by events occurring after the close of the exchange or market on which the security is principally traded, that security may be valued by another method that the Board of Trustees believes accurately reflects fair value. A security’s valuation may differ depending on the method used for determining value. Price movements in futures contracts and ADRs, market and trading trends, the bid/ask quotes of brokers and off exchange institutional trading may be reviewed in the course of making a good faith determination of a security’s fair value. Short term securities with remaining maturities of sixty days or less for which quotations are not readily available are valued on the basis of amortized cost. Investments in open end investment compa nies are valued at their net asset value each business day.
As permitted under Rule 2a 7 of the 1940 Act, and certain conditions therein, securities owned by the money market fund are valued initially at cost and thereafter assume a constant amortization to maturity of any discount or premium.
Investment Transactions and Income. Security transactions are accounted for as of trade date. Gains and losses on securities sold are determined on the basis of identified cost. Interest income is accrued as earned. Interest income includes coupon interest and amortization of premium and accretion of discount on debt securities.
1. Significant Accounting Policies continued
Expenses. Most expenses of each trust can be directly attributed to a fund. Expenses which cannot be directly attributed are apportioned among each fund in the trust.
Income Tax Information and Distributions to Shareholders. Each year, each fund intends to qualify as a regulated investment company by distributing all of its taxable income and realized gains under Subchapter M of the Internal Revenue Code. As a result, no provision for income taxes is required in the accompanying financial statements.
Dividends are declared daily and paid monthly from net investment income. Distribu tions from realized gains, if any, are recorded on the ex dividend date. Income and capital gain distributions are determined in accordance with income tax regulations, which may differ from generally accepted accounting principles. In addition, certain funds will claim a portion of the payment made to redeeming shareholders as a distribu tion for income tax purposes.
Capital accounts within the financial statements are adjusted for permanent book tax differences. These adjustments have no impact on net assets or the results of operations. Temporary book tax differences will reverse in a subsequent period.
Book tax differences are primarily due to futures transactions, market discount, deferred trustees compensation and losses deferred due to wash sales.
The funds purchase municipal securities whose interest, in the opinion of the issuer, is free from federal income tax. There is no assurance that the Internal Revenue Service (IRS) will agree with this opinion. In the event the IRS determines that the issuer does not comply with relevant tax requirements, interest payments from a security could become federally taxable, possibly retroactively to the date the security was issued.
The tax basis components of distributable earnings and the federal tax cost as of period end were as follows for each fund:
| | | Cost for Federal | | | | | | | | | | Net Unrealized |
| | | Income Tax | | Unrealized | | | | Unrealized | | | | Appreciation/ |
| | | Purposes | | Appreciation | | | | Depreciation | | | | (Depreciation) |
| Fidelity Arizona Municipal | | | | | | | | | | | | |
| Income Fund | $ | 95,633,620 | $ | 3,920,799 | | $ | | (64,623) | | $ | | 3,856,176 |
| Fidelity Arizona Municipal | | | | | | | | | | | | |
| Money Market Fund | | 207,102,350 | | — | | | | — | | | | — |
| |
| |
| | | | | | | | | | | | | Undistributed |
| | | | | | | | | Undistributed | | | | Long-term |
| | | | | | | | | Ordinary Income | | | | Capital Gain |
| Fidelity Arizona Municipal Income Fund | | | | $ | | — | | $ | | 244,988 |
| Fidelity Arizona Municipal Money Market Fund | | | | | | 19,322 | | | | — |
Annual Report
Notes to Financial Statements continued
1. Significant Accounting Policies continued
Income Tax Information and Distributions to Shareholders continued
The tax character of distributions paid was as follows:
| August 31, 2005 | | | | Tax-exempt | | | | Long-term | | | | Total |
| | | | | Income | | | | Capital Gains | | | | |
| Fidelity Arizona Municipal Income Fund | | $ | | 3,235,508 | | $ | | 377,090 | | $ | | 3,612,598 |
| Fidelity Arizona Municipal Money | | | | | | | | | | | | |
| Market Fund | | | | 2,931,883 | | | | | | | | 2,931,883 |
| |
| August 31, 2004 | | | | Tax-exempt | | | | Long-term | | | | Total |
| | | | | Income | | | | Capital Gains | | | | |
| Fidelity Arizona Municipal Income Fund | | $ | | 2,795,363 | | $ | | 406,255 | | $ | | 3,201,618 |
| Fidelity Arizona Municipal Money | | | | | | | | | | | | |
| Market Fund | | | | 846,776 | | | | 9,532 | | | | 856,308 |
Short Term Trading (Redemption) Fees. Shares held in the income fund less than 30 days are subject to a redemption fee equal to .50% of the proceeds of the redeemed shares. All redemption fees, including any estimated redemption fees paid by Fidelity Management & Research Company (FMR), are retained by the fund and accounted for as an addition to paid in capital.
Delayed Delivery Transactions and When Issued Securities. Certain funds may purchase or sell securities on a delayed delivery or when issued basis. Payment and delivery may take place after the customary settlement period for that security. The price of the underlying securities and the date when the securities will be delivered and paid for are fixed at the time the transaction is negotiated. During the time a delayed delivery sell is outstanding, the contract is marked to market daily and equivalent deliverable securities are held for the transaction. The value of the securities purchased on a delayed delivery or when issued basis are identified as such in each applicable fund’s Schedule of Investments. Certain funds may receive compensation for interest forgone in the purchase of a delayed delivery or when issued security. With respect to purchase commitments, each applicable fund identifies securities as segregated in its records with a value at least equal to the amount of the commitment. Losses may arise due to changes in the value of the underlying securities or if the counterparty does not perform under the contract’s terms, or if the issuer does not issue the securities due to political, economic, or other factors.
2. Operating Policies continued
Futures Contracts. The income fund may use futures contracts to manage its exposure to the bond market and to fluctuations in interest rates. Buying futures tends to increase a fund’s exposure to the underlying instrument, while selling futures tends to decrease a fund’s exposure to the underlying instrument or hedge other fund investments. Losses may arise from changes in the value of the underlying instruments or if the counterparties do not perform under the contracts’ terms. Gains (losses) are realized upon the expiration or closing of the futures contracts. Futures contracts are valued at the settlement price established each day by the board of trade or exchange on which they are traded.
3. Purchases and Sales of Investments.
Purchases and sales of securities, other than short term securities and U.S. government securities, for the income fund aggregated $35,129,244 and $11,542,560, respectively.
4. Fees and Other Transactions with Affiliates.
Management Fee. FMR and its affiliates provides the funds with investment manage ment related services for which the funds pay a monthly management fee. FMR pays all other expenses, except the compensation of the independent Trustees and certain exceptions such as interest expense. The management fee paid to FMR by the funds is reduced by an amount equal to the fees and expenses paid by the funds to the indepen dent Trustees. Each fund’s management fee is equal to the following annual rate of average net assets:
| Fidelity Arizona Municipal Income Fund | | 55% |
| Fidelity Arizona Municipal Money Market Fund | | 50% |
Affiliated Central Funds. Certain funds may invest in Money Market Central Funds which seek preservation of capital and current income and are managed by Fidelity Investments Money Management, Inc. (FIMM) an affiliate of FMR.
The Money Market Central Funds do not pay a management fee. Income distributions earned by the funds are recorded as income in the accompanying financial statements. Distributions from the Central Funds are noted in the table below:
| | | | | Income |
| | | | | Distributions |
| Fidelity Arizona Municipal Money Market Fund | | $ | | 136,797 |
Annual Report
Notes to Financial Statements continued
5. Committed Line of Credit.
|
The income fund participates with other funds managed by FMR in a $4.2 billion credit facility (the “line of credit”) to be utilized for temporary or emergency purposes to fund shareholder redemptions or for other short term liquidity purposes. The participating funds have agreed to pay commitment fees on their pro rata portion of the line of credit, which is included in Miscellaneous Expense on the Statement of Operations. During the period, there were no borrowings on this line of credit.
Through arrangements with each applicable fund’s custodian and transfer agent, credits realized as a result of uninvested cash balances were used to reduce each applicable fund’s management fee. During the period, these credits reduced the management fee by the following amounts:
| Fidelity Arizona Municipal Income Fund | | $ | | 40,395 |
| Fidelity Arizona Municipal Money Market Fund | | | | 133,335 |
| |
| 7. Other. | | | | |
The funds’ organizational documents provide former and current trustees and officers with a limited indemnification against liabilities arising in connection with the perfor mance of their duties to the funds. In the normal course of business, the funds may also enter into contracts that provide general indemnifications. The funds’ maximum exposure under these arrangements is unknown as this would be dependent on future claims that may be made against the funds. The risk of material loss from such claims is considered remote.
Report of Independent Registered Public Accounting Firm
To the Trustees of Fidelity Union Street Trust and Fidelity Union Street Trust II and the Shareholders of Fidelity Arizona Municipal Income Fund (formerly Spartan Arizona Municipal Income Fund) and Fidelity Arizona Municipal Money Market Fund:
In our opinion, the accompanying statements of assets and liabilities, including the schedules of investments, and the related statements of operations and of changes in net assets and the financial highlights present fairly, in all material respects, the financial position of Fidelity Arizona Municipal Income Fund (formerly Spartan Arizona Municipal Income Fund) (a fund of Fidelity Union Street Trust) and Fidelity Arizona Municipal Money Market Fund (a fund of Fidelity Union Street Trust II) at August 31, 2005 and the results of their operations, the changes in their net assets and the financial highlights for the periods indicated, in conformity with accounting principles generally accepted in the United States of America. These financial statements and financial highlights (hereafter referred to as “financial statements”) are the responsibility of the Fidelity Union Street Trust’s and Fidelity Union Street Trust II’s management; our responsibility is to express an opinion on these financial statements based on our audits. We conducted our audits of these financial statements in accordance with the standards of the Public Company Accounting Oversight Board (United States). Those standards require that we plan and perform the audit to obtain reasonable assurance about whether the financial statements are free of material misstatement. An audit includes examining, on a test basis, evidence supporting the amounts and disclosures in the financial statements, assessing the ac counting principles used and significant estimates made by management, and evaluating the overall financial statement presentation. We believe that our audits, which included confirmation of securities at August 31, 2005 by correspondence with the custodian and brokers, provide a reasonable basis for our opinion.
/s/ PricewaterhouseCoopers LLP PricewaterhouseCoopers LLP
Boston, Massachusetts
October 10, 2005
|
35 Annual Report
Trustees and Officers
The Trustees, Members of the Advisory Board, and executive officers of the trusts and funds, as applicable, are listed below. The Board of Trustees governs each fund and is responsible for protecting the interests of shareholders. The Trustees are experienced executives who meet periodically throughout the year to oversee each fund’s activities, review contractual arrangements with companies that provide services to each fund, and review each fund’s performance. Except for William O. McCoy, Stephen P. Jonas, and Kenneth L. Wolfe, each of the Trustees oversees 321 funds advised by FMR or an affiliate. Mr. McCoy oversees 323 funds advised by FMR or an affiliate. Mr. Jonas and Mr. Wolfe oversee 312 funds advised by FMR or an affiliate.
The Trustees hold office without limit in time except that (a) any Trustee may resign; (b) any Trustee may be removed by written instrument, signed by at least two thirds of the number of Trustees prior to such removal; (c) any Trustee who requests to be retired or who has become incapacitated by illness or injury may be retired by written instru ment signed by a majority of the other Trustees; and (d) any Trustee may be removed at any special meeting of shareholders by a two thirds vote of the outstanding voting securities of the trust. Each Trustee who is not an interested person (as defined in the 1940 Act) (Independent Trustee), shall retire not later than the last day of the calendar year in which his or her 72nd birthday occurs. The Independent Trustees may waive this mandatory retirement age policy with respect to individual Trustees. The executive officers and Advisory Board Members hold office without limit in time, except that any officer and Advisory Board Member may resign or may be removed by a vote of a majority of the Trustees at any regular meeting or any special meeting of the Trustees. Except as indicated, each individual has held the office shown or other offices in the same company for the past five years.
The funds’ Statement of Additional Information (SAI) includes more information about the Trustees. To request a free copy, call Fidelity at 1-800-544-8544.
Interested Trustees*:
Correspondence intended for each Trustee who is an interested person may be sent to Fidelity Investments, 82 Devonshire Street, Boston, Massachusetts 02109.
| | Name, Age; Principal Occupation
Edward C. Johnson 3d (75)**
|
Year of Election or Appointment: 1974 or 1991
Trustee of Fidelity Union Street Trust (1974) and Fidelity Union Street Trust II (1991). Mr. Johnson is Chairman of the Board of Trustees. Mr. Johnson serves as Chief Executive Officer, Chairman, and a Director of FMR Corp.; a Director and Chairman of the Board and of the Executive Committee of FMR; Chairman and a Director of Fidelity Management & Research (Far East) Inc.; Chairman and a Director of Fidelity Investments Money Management, Inc.; and Chairman (2001 present) and a Director (2000 present) of FMR Co., Inc.
| | Name, Age; Principal Occupation
Abigail P. Johnson (43)**
|
Year of Election or Appointment: 2001
Ms. Johnson serves as President of Fidelity Employer Services Company (FESCO) (2005 present). She is President and a Director of Fidelity Investments Money Management, Inc. (2001 present), FMR Co., Inc. (2001 present), and a Director of FMR Corp. Previously, Ms. Johnson served as a President and a Director of FMR (2001 2005), Senior Vice President of the Fidelity funds (2001 2005), and managed a number of Fidelity funds.
Year of Election or Appointment: 2005
Mr. Jonas is Senior Vice President of Arizona Municipal Money Market and Fidelity Arizona Municipal Income (2005 present). He also serves as Senior Vice President of other Fidelity funds (2005 present). Mr. Jonas is Executive Director of FMR (2005 present). Previously, Mr. Jonas served as President of Fidelity Enterprise Operations and Risk Services (2004 2005), Chief Administrative Officer (2002 2004), and Chief Financial Officer of FMR Co. (1998 2000). Mr. Jonas has been with Fidelity Investments since 1987 and has held various financial and management positions including Chief Financial Officer of FMR. In addition, he serves on the Boards of Boston Ballet (2003 present) and Simmons College (2003 present).
Year of Election or Appointment: 2003
Mr. Reynolds is a Director (2003 present) and Chief Operating Officer (2002 present) of FMR Corp. He also serves on the Board at Fidelity Investments Canada, Ltd. (2000 present). Previously, Mr. Reynolds served as President of Fidelity Investments Institutional Retirement Group (1996 2000).
* Trustees have been determined to be “Interested Trustees” by virtue of, among other things, their affiliation with the trusts or various entities under common control with FMR.
** Edward C. Johnson 3d, Trustee, is Abigail P. Johnson’s father.
37 Annual Report
Trustees and Officers - continued
Independent Trustees:
Correspondence intended for each Independent Trustee (that is, the Trustees other than the Interested Trustees) may be sent to Fidelity Investments, P.O. Box 55235, Boston, Massachusetts 02205 5235.
| | Name, Age; Principal Occupation
Dennis J. Dirks (57)
|
Year of Election or Appointment: 2005
Prior to his retirement in May 2003, Mr. Dirks was Chief Operating Officer and a member of the Board of The Depository Trust & Clearing Corporation (DTCC) (1999 2003). He also served as President, Chief Operating Officer, and Board member of The Depository Trust Company (DTC) (1999 2003) and President and Board member of the National Securities Clearing Corporation (NSCC) (1999 2003). In addition, Mr. Dirks served as Chief Executive Officer and Board member of the Government Securities Clearing Corporation (2001 2003) and Chief Executive Officer and Board member of the Mortgage Backed Securities Clearing Corporation (2001 2003). Mr. Dirks also serves as a Trustee of Manhattan College (2005 present).
Year of Election or Appointment: 1997
Dr. Gates is Vice Chairman of the Independent Trustees (2005 present). Dr. Gates is President of Texas A&M University (2002 present). He was Director of the Central Intelligence Agency (CIA) from 1991 to 1993. From 1989 to 1991, Dr. Gates served as Assistant to the President of the United States and Deputy National Security Advisor. Dr. Gates is a Director of NACCO Industries, Inc. (mining and manufacturing), Parker Drilling Co., Inc. (drilling and rental tools for the energy industry, 2001 present), and Brinker International (restaurant management, 2003 present). Previously, Dr. Gates served as a Director of LucasVarity PLC (automotive components and diesel engines), a Director of TRW Inc. (automotive, space, defense, and information technology), and Dean of the George Bush School of Government and Public Service at Texas A&M University (1999 2001). Dr. Gates also is a Trustee of the Forum for International Policy.
Name, Age; Principal Occupation
George H. Heilmeier (69)
|
Year of Election or Appointment: 2004
Dr. Heilmeier is Chairman Emeritus of Telcordia Technologies (commu nication software and systems), where prior to his retirement, he served as company Chairman and Chief Executive Officer. He currently serves on the Boards of Directors of The Mitre Corporation (systems engineer ing and information technology support for the government), Teletech Holdings (customer management services), and HRL Laboratories (private research and development, 2004 present). He is Chairman of the General Motors Technology Advisory Committee and a Life Fellow of the Institute of Electrical and Electronics Engineers (IEEE) (2000 present). Dr. Heilmeier is a member of the Defense Science Board and the National Security Agency Advisory Board. He is also a member of the National Academy of Engineering, the American Academy of Arts and Sciences, and the Board of Overseers of the School of Engineering and Applied Science of the University of Pennsylvania. Previously, Dr. Heilmeier served as a Director of TRW Inc. (automotive, space, defense, and information technology, 1992 2002), Compaq (1994 2002), Automatic Data Processing, Inc. (ADP) (technology based business outsourcing, 1995 2002), and INET Technologies Inc. (telecom munications network surveillance, 2001 2004), and Teletech Holdings (customer management services). He is the recipient of the 2005 Kyoto Prize in Advanced Technology for his invention of the liquid display.
Year of Election or Appointment: 2001
Prior to Ms. Knowles’ retirement in June 2000, she served as Executive Vice President and Chief Financial Officer of Atlantic Richfield Company (ARCO) (diversified energy, 1996 2000). From 1993 to 1996, she was a Senior Vice President of ARCO and President of ARCO Transportation Company. She served as a Director of ARCO from 1996 to 1998. She currently serves as a Director of Phelps Dodge Corporation (copper mining and manufacturing) and McKesson Corporation (healthcare ser vice, 2002 present). Ms. Knowles is a Trustee of the Brookings Institution and the Catalina Island Conservancy and also serves as a member of the Advisory Board for the School of Engineering of the University of Southern California.
39 Annual Report
Trustees and Officers - continued
| | Name, Age; Principal Occupation
Ned C. Lautenbach (61)
|
Year of Election or Appointment: 2000
Mr. Lautenbach has been a partner of Clayton, Dubilier & Rice, Inc. (private equity investment firm) since September 1998. Previously, Mr. Lautenbach was with the International Business Machines Corpora tion (IBM) from 1968 until his retirement in 1998. Mr. Lautenbach serves as a Director of Italtel Holding S.p.A. (telecommunications (Milan, Italy), 2004 present) and Eaton Corporation (diversified industrial) as well as the Philharmonic Center for the Arts in Naples, Florida. He also is a member of the Board of Trustees of Fairfield University (2005 present), as well as a member of the Council on Foreign Relations.
Year of Election or Appointment: 1993
Mr. Mann is Chairman of the Independent Trustees (2001 present). He is Chairman Emeritus of Lexmark International, Inc. (computer peripherals), where he served as CEO until April 1998, retired as Chairman May 1999, and remains a member of the Board. Prior to 1991, he held the positions of Vice President of International Business Machines Corpora tion (IBM) and President and General Manager of various IBM divisions and subsidiaries. He is a member of the Executive Committee of the Independent Director’s Council of the Investment Company Institute. In addition, Mr. Mann is a member of the President’s Cabinet at the Uni versity of Alabama and the Board of Visitors of the Culverhouse College of Commerce and Business Administration at the University of Alabama.
Year of Election or Appointment: 1997
Prior to his retirement in December 1994, Mr. McCoy was Vice Chair man of the Board of BellSouth Corporation (telecommunications) and President of BellSouth Enterprises. He is currently a Director of Liberty Corporation (holding company), Duke Realty Corporation (real estate), and Progress Energy, Inc. (electric utility). He is also a partner of Frank lin Street Partners (private investment management firm) and a member of the Research Triangle Foundation Board. In addition, Mr. McCoy served as the Interim Chancellor (1999 2000) and a member of the Board of Visitors for the University of North Carolina at Chapel Hill and currently serves on the Board of Directors of the University of North Carolina Health Care System and the Board of Visitors of the Kenan Flagler Business School (University of North Carolina at Chapel Hill). He also served as Vice President of Finance for the University of North Carolina (16 school system).
Name, Age; Principal Occupation
Cornelia M. Small (61)
|
Year of Election or Appointment: 2005
Ms. Small is a member (2000 present) and Chairperson (2002 present) of the Investment Committee, and a member (2002 present) of the Board of Trustees of Smith College. Previously, she served as Chief Investment Officer (1999 2000), Director of Global Equity Investments (1996 1999), and a member of the Board of Directors of Scudder, Stevens & Clark (1990 1997) and Scudder Kemper Investments (1997 1998). In addition, Ms. Small served as Co Chair (2000 2003) of the Annual Fund for the Fletcher School of Law and Diplomacy.
William S. Stavropoulos (66)
|
Year of Election or Appointment: 2002
Mr. Stavropoulos is Chairman of the Board (2000 present) and a Member of the Board of Directors of The Dow Chemical Company. Since joining The Dow Chemical Company in 1967, Mr. Stavropoulos served in numerous senior management positions, including President (1993 2000; 2002 2003), CEO (1995 2000; 2002 2004), and Chair man of the Executive Committee (2000 2004). Currently, he is a Direc tor of NCR Corporation (data warehousing and technology solutions), BellSouth Corporation (telecommunications), Chemical Financial Corpo ration, Maersk Inc. (industrial conglomerate, 2002 present), and Metal mark Capital (private equity investment firm, 2005 present). He also serves as a member of the Board of Trustees of the American Enterprise Institute for Public Policy Research. In addition, Mr. Stavropoulos is a member of The Business Council, J.P. Morgan International Council and the University of Notre Dame Advisory Council for the College of Science.
Year of Election or Appointment: 2005
Mr. Wolfe also serves as a Trustee (2005 present) or Member of the Advisory Board (2004 present) of other investment companies advised by FMR. Prior to his retirement in 2001, Mr. Wolfe was Chairman and Chief Executive Officer of Hershey Foods Corporation (1993 2001). He currently serves as a member of the boards of Adelphia Communica tions Corporation (2003 present), Bausch & Lomb, Inc., and Revlon Inc. (2004 present).
41 Annual Report
Trustees and Officers - continued
Advisory Board Members and Executive Officers:
Correspondence intended for Mr. Gamper may be sent to Fidelity Investments, P.O. Box 55235, Boston, Massachusetts 02205-5235. Correspondence intended for each executive officer and Mr. Lynch may be sent to Fidelity Investments, 82 Devonshire Street, Boston, Massachusetts 02109.
| | Name, Age; Principal Occupation
Albert R. Gamper, Jr. (63)
|
Year of Election or Appointment: 2005
Member of the Advisory Board of Fidelity Union Street Trust and Fidelity Union Street Trust II. Prior to his retirement in December 2004, Mr. Gamper served as Chairman of the Board of CIT Group Inc. (commercial finance). During his tenure with CIT Group Inc. Mr. Gamper served in numerous senior management positions, including Chairman (1987 1989; 1999 2001; 2002 2004), Chief Executive Officer (1987 2004), and President (1989 2002). He currently serves as a member of the Board of Directors of Public Service Enterprise Group (utilities, 2001 present), Chairman of the Board of Governors, Rutgers University (2004 present), and Chairman of the Board of Saint Barnabas Health Care System.
Year of Election or Appointment: 2003
Member of the Advisory Board of Fidelity Union Street Trust and Fidelity Union Street Trust II. Vice Chairman and a Director of FMR, and Vice Chairman (2001 present) and a Director (2000 present) of FMR Co., Inc. Previously, Mr. Lynch served as a Trustee of the Fidelity funds (1990 2003). In addition, he serves as a Trustee of Boston College, Massachusetts Eye & Ear Infirmary, Historic Deerfield, John F. Kennedy Library, and the Museum of Fine Arts of Boston.
Year of Election or Appointment: 2005
Vice President of Arizona Municipal Money Market and Fidelity Arizona Municipal Income. Mr. Donovan also serves as Vice President of Fidelity’s High Income Funds (2005 present), Fidelity’s Fixed Income Funds (2005 present), certain Asset Allocation Funds (2005 present), and certain Balanced Funds (2005 present). Mr. Donovan also serves as Executive Vice President of FMR (2005 present) and FMRC (2005 present). Previously, Mr. Donovan served as Vice President and Director of Fidelity’s International Equity Trading group (1998 2005).
Name, Age; Principal Occupation
Charles S. Morrison (44)
|
Year of Election or Appointment: 2002
Vice President of Arizona Municipal Money Market. Mr. Morrison also serves as Vice President of Fidelity’s Money Market Funds (2005 present) and certain Asset Allocation Funds (2002 present). Previously, he served as Vice President of Fidelity’s Bond Funds (2002 2005) and certain Balanced Funds (2002 2005). He served as Vice President (2002 2005) and Bond Group Leader (2002 2005) of Fidelity Investments Fixed Income Division. Mr. Morrison is also Vice President of FIMM
(2002 present) and FMR (2002 present). Mr. Morrison joined Fidelity Investments in 1987 as a Corporate Bond Analyst in the Fixed Income Research Division.
Year of Election or Appointment: 2002
Vice President of Arizona Municipal Money Market and Fidelity Arizona Municipal Income. Mr. Murphy also serves as Vice President of Fidelity’s Money Market Funds (2002 present), certain Asset Allocation Funds (2003 present), Fidelity’s Investment Grade Bond Funds (2005 present), and Fidelity’s Balanced Funds (2005 present). He serves as Senior Vice President (2000 present) and Head (2004 present) of the Fidelity Investments Fixed Income Division. Mr. Murphy is also a Senior Vice President of FIMM (2003 present) and a Vice President of FMR
(2000 present). Previously, Mr. Murphy served as Money Market Group Leader (2002 2004), Bond Group Leader (2000 2002), and Vice President of Fidelity’s Taxable Bond Funds (2000 2002) and Fidelity’s Municipal Bond Funds (2001 2002). Mr. Murphy joined Fidelity Investments in 1989 as a portfolio manager in the Bond Group.
Year of Election or Appointment: 2005
Vice President of Fidelity Arizona Municipal Income. Mr. Silvia also serves as Vice President of Fidelity’s Bond Funds (2005 present) and Senior Vice President and Bond Group Leader of the Fidelity Investments Fixed Income Division (2005 present). Previously, Mr. Silvia served as Director of Fidelity’s Taxable Bond portfolio managers (2002 2004) and a portfolio manager in the Bond Group (1997 2004).
Christine J. Thompson (47)
|
Year of Election or Appointment: 1998
Vice President of Fidelity Arizona Municipal Income. Ms. Thompson also serves as Vice President of other funds advised by FMR.
43 Annual Report
Trustees and Officers - continued
| | Name, Age; Principal Occupation
Michael Widrig (42)
|
Year of Election or Appointment: 2003
Vice President of Arizona Municipal Money Market. Mr. Widrig also serves as Vice President of other funds advised by FMR. Prior to assuming his current responsibilities, Mr. Widrig managed a variety of Fidelity funds and worked as an analyst in the Fixed Income Group.
Year of Election or Appointment: 1998
Secretary of Arizona Municipal Money Market and Fidelity Arizona Municipal Income. He also serves as Secretary of other Fidelity funds; Vice President, General Counsel, and Secretary of FMR Co., Inc. (2001 present) and FMR; Assistant Secretary of Fidelity Management & Research (U.K.) Inc. (2001 present), Fidelity Management & Research (Far East) Inc. (2001 present), and Fidelity Investments Money Manage ment, Inc. (2001 present). Mr. Roiter is an Adjunct Member, Faculty of Law, at Boston College Law School (2003 present). Previously, Mr. Roiter served as Vice President and Secretary of FDC (1998 2005).
Year of Election or Appointment: 2003
Assistant Secretary of Arizona Municipal Money Market and Fidelity Arizona Municipal Income. Mr. Fross also serves as Assistant Secretary of other Fidelity funds (2003 present), Vice President and Secretary of FDC (2005 present), and is an employee of FMR.
Year of Election or Appointment: 2004
President, Treasurer, and Anti Money Laundering (AML) officer of Arizona Municipal Money Market and Fidelity Arizona Municipal Income. Ms. Reynolds also serves as President, Treasurer, and AML officer of other Fidelity funds (2004) and is a Vice President (2003) and an employee (2002) of FMR. Before joining Fidelity Investments, Ms. Reynolds worked at PricewaterhouseCoopers LLP (PwC) (1980 2002), where she was most recently an audit partner with PwC’s investment management practice.
Name, Age; Principal Occupation
Timothy F. Hayes (54)
|
Year of Election or Appointment: 2002
Chief Financial Officer of Arizona Municipal Money Market and Fidelity Arizona Municipal Income. Mr. Hayes also serves as Chief Financial Officer of other Fidelity funds (2002 present) and President of Fidelity Investment Operations (2005 present) which includes Fidelity Pricing and Cash Management Services Group (FPCMS), where he served as President (1998 2005). Mr. Hayes serves as President of Fidelity Service Company (2003 present) where he also serves as a Director. Mr. Hayes also served as President of Fidelity Investments Operations Group (FIOG, 2002 2005).
Kenneth A. Rathgeber (58)
|
Year of Election or Appointment: 2004
Chief Compliance Officer of Arizona Municipal Money Market and Fidelity Arizona Municipal Income.. Mr. Rathgeber also serves as Chief Compliance Officer of other Fidelity funds (2004) and Executive Vice President of Risk Oversight for Fidelity Investments (2002). Previously, he served as Executive Vice President and Chief Operating Officer for Fidelity Investments Institutional Services Company, Inc. (1998 2002).
Year of Election or Appointment: 2003
Deputy Treasurer of Arizona Municipal Money Market and Fidelity Arizona Municipal Income. Mr. Hebble also serves as Deputy Treasurer of other Fidelity funds (2003), and is an employee of FMR. Before joining Fidelity Investments, Mr. Hebble worked at Deutsche Asset Man agement where he served as Director of Fund Accounting (2002 2003) and Assistant Treasurer of the Scudder Funds (1998 2003).
Year of Election or Appointment: 2005
Deputy Treasurer of Arizona Municipal Money Market and Fidelity Arizona Municipal Income. Mr. Mehrmann also serves as Deputy Trea surer of other Fidelity funds (2005 present) and is an employee of FMR. Previously, Mr. Mehrmann served as Vice President of Fidelity Invest ments Institutional Services Group (FIIS)/Fidelity Investments Institutional Operations Corporation, Inc. (FIIOC) Client Services (1998 2004).
45 Annual Report
Trustees and Officers - continued
| | Name, Age; Principal Occupation
Kimberley H. Monasterio (41)
|
Year of Election or Appointment: 2004
Deputy Treasurer of Arizona Municipal Money Market and Fidelity Arizona Municipal Income. Ms. Monasterio also serves as Deputy Trea surer of other Fidelity funds (2004) and is an employee of FMR (2004). Before joining Fidelity Investments, Ms. Monasterio served as Treasurer (2000 2004) and Chief Financial Officer (2002 2004) of the Franklin Templeton Funds and Senior Vice President of Franklin Templeton Services, LLC (2000 2004).
Year of Election or Appointment: 2005
Deputy Treasurer of Arizona Municipal Money Market and Fidelity Arizona Municipal Income. Mr. Robins also serves as Deputy Treasurer of other Fidelity funds (2005 present) and is an employee of FMR (2004 present). Before joining Fidelity Investments, Mr. Robins worked at KPMG LLP, where he was a partner in KPMG’s department of profes sional practice (2002 2004) and a Senior Manager (1999 2000). In addition, Mr. Robins served as Assistant Chief Accountant, United States Securities and Exchange Commission (2000 2002).
Year of Election or Appointment: 2005
Assistant Treasurer of Arizona Municipal Money Market and Fidelity Arizona Municipal Income. Mr. Byrnes also serves as Assistant Treasurer of Fidelity funds (2005 present) and is an employee of FMR (2005 present). Previously, Mr. Byrnes served as Vice President of FPCMS (2003 2005). Before joining Fidelity Investments, Mr. Byrnes worked at Deutsche Asset Management where he served as Vice President of the Investment Operations Group (2000 2003).
Year of Election or Appointment: 1994
Assistant Treasurer of Arizona Municipal Money Market and Fidelity Arizona Municipal Income. Mr. Costello also serves as Assistant Treasurer of other Fidelity funds and is an employee of FMR.
Year of Election or Appointment: 2004
Assistant Treasurer of Arizona Municipal Money Market and Fidelity Arizona Municipal Income. Mr. Lydecker also serves as Assistant Treasurer of other Fidelity funds (2004) and is an employee of FMR.
Name, Age; Principal Occupation
Mark Osterheld (50)
|
Year of Election or Appointment: 2002
Assistant Treasurer of Arizona Municipal Money Market and Fidelity Arizona Municipal Income. Mr. Osterheld also serves as Assistant Treasurer of other Fidelity funds (2002) and is an employee of FMR.
Year of Election or Appointment: 2005
Assistant Treasurer of Arizona Municipal Money Market and Fidelity Arizona Municipal Income. Mr. Ryan also serves as Assistant Treasurer of other Fidelity funds (2005 present) and is an employee of FMR (2005 present). Previously, Mr. Ryan served as Vice President of Fund Reporting in FPCMS (1999 2005).
Year of Election or Appointment: 2005
Assistant Treasurer of Arizona Municipal Money Market and Fidelity Arizona Municipal Income. Mr. Schiavone also serves as Assistant Treasurer of other Fidelity funds (2005 present) and is an employee of FMR (2005 present). Before joining Fidelity Investments, Mr. Schiavone worked at Deutsche Asset Management, where he most recently served as Assistant Treasurer (2003 2005) of the Scudder Funds and Vice President and Head of Fund Reporting (1996 2003).
47 Annual Report
The Board of Trustees of Arizona Municipal Income Fund voted to pay on October 10, 2005, to shareholders of record at the opening of business on October 7, 2005, a distribution of $.03 per share derived from capital gains realized from sales of portfolio securities.
The funds hereby designate as capital gain dividends the amounts noted below for the taxable year indicated or for dividends for the taxable year ended 2005, if subsequently determined to be different, the net capital gain of such year; and for dividends for the taxable year ended 2004, if subsequently determined to be different, the excess of: (a) the net capital gain of such year, over (b) amounts previously designated as capital gain dividends with respect to such year.
| Fund | | 2005 | | 2004 |
| Fidelity Arizona Municipal Income Fund | | $278,356 | | $352,841 |
| Fidelity Arizona Municipal Money Market Fund | | $6,669 | | $— |
During fiscal year ended 2005, 100% of each fund’s income dividends were free from federal income tax, and 4.72% and 51.70% of Arizona Municipal Income Fund and Arizona Municipal Money Market Fund’s income dividends were subject to the federal alternative minimum tax.
The fund will notify shareholders in January 2006 of amounts for use in preparing 2005 income tax returns.
Proxy Voting Results
A special meeting of the fund’s shareholders was held on April 13, 2005. The results of votes taken among shareholders on proposals before them are reported below. Each vote reported represents one dollar of net asset value held on the record date for the meeting.
| PROPOSAL 1 | | | | |
| To amend the Trust Instrument to allow |
| the Board of Trustees, if permitted by |
| applicable law, to authorize fund mergers |
| without shareholder approval.* | | |
| | | # of | | % of |
| | | Votes | | Votes |
| Affirmative | | 7,963,915,275.00 | | 80.395 |
| Against | | 1,604,213,132.51 | | 16.194 |
| Abstain | | 331,409,117.16 | | 3.346 |
| Broker | | | | |
| Non Votes . | | 6,453,184.00 | | .065 |
| TOTAL | | 9,905,990,708.67 | | 100.000 |
| PROPOSAL 2 | | | | |
| To elect a Board of Trustees.* | | |
| | | # of | | % of |
| | | Votes | | Votes |
| Laura B. Cronin | | |
| Affirmative | | 9,373,053,787.27 | | 94.620 |
| Withheld | | 532,936,921.40 | | 5.380 |
| TOTAL | | 9,905,990,708.67 | | 100.000 |
| Dennis J. Dirks | | | | |
| Affirmative | | 9,385,368,522.63 | | 94.744 |
| Withheld | | 520,622,186.04 | | 5.256 |
| TOTAL | | 9,905,990,708.67 | | 100.000 |
| Robert M. Gates | | |
| Affirmative | | 9,372,071,963.26 | | 94.610 |
| Withheld | | 533,918,745.41 | | 5.390 |
| TOTAL | | 9,905,990,708.67 | | 100.000 |
| George H. Heilmeier | | |
| Affirmative | | 9,374,826,621.61 | | 94.638 |
| Withheld | | 531,164,087.06 | | 5.362 |
| TOTAL | | 9,905,990,708.67 | | 100.000 |
| Abigail P. Johnson | | |
| Affirmative | | 9,349,225,683.70 | | 94.380 |
| Withheld | | 556,765,024.97 | | 5.620 |
| TOTAL | | 9,905,990,708.67 | | 100.000 |
| | | # of | | % of |
| | | Votes | | Votes |
| |
| Edward C. Johnson 3d | | |
| Affirmative | | 9,336,624,684.41 | | 94.252 |
| Withheld | | 569,366,024.26 | | 5.748 |
| TOTAL | | 9,905,990,708.67 | | 100.000 |
| |
| Marie L. Knowles | | |
| Affirmative | | 9,385,202,135.87 | | 94.743 |
| Withheld | | 520,788,572.80 | | 5.257 |
| TOTAL | | 9,905,990,708.67 | | 100.000 |
| Ned C. Lautenbach | | |
| Affirmative | | 9,376,788,549.33 | | 94.658 |
| Withheld | | 529,202,159.34 | | 5.342 |
| TOTAL | | 9,905,990,708.67 | | 100.000 |
| Marvin L. Mann | | |
| Affirmative | | 9,361,169,551.40 | | 94.500 |
| Withheld | | 544,821,157.27 | | 5.500 |
| TOTAL | | 9,905,990,708.67 | | 100.000 |
| William O. McCoy | | |
| Affirmative | | 9,363,552,602.29 | | 94.524 |
| Withheld | | 542,438,106.38 | | 5.476 |
| TOTAL | | 9,905,990,708.67 | | 100.000 |
| Robert L. Reynolds | | |
| Affirmative | | 9,372,289,526.22 | | 94.612 |
| Withheld | | 533,701,182.45 | | 5.388 |
| TOTAL | | 9,905,990,708.67 | | 100.000 |
| Cornelia M. Small | | |
| Affirmative | | 9,384,016,844.12 | | 94.731 |
| Withheld | | 521,973,864.55 | | 5.269 |
| TOTAL | | 9,905,990,708.67 | | 100.000 |
| William S. Stavropoulos | | |
| Affirmative | | 9,373,082,552.28 | | 94.620 |
| Withheld | | 532,908,156.39 | | 5.380 |
| TOTAL | | 9,905,990,708.67 | | 100.000 |
| Kenneth L. Wolfe | | |
| Affirmative | | 9,374,633,251.39 | | 94.636 |
| Withheld | | 531,357,457.28 | | 5.364 |
| TOTAL | | 9,905,990,708.67 | | 100.000 |
* Denotes trust-wide proposals and voting results.
Annual Report
Board Approval of Investment Advisory Contracts and Management Fees
Fidelity Arizona Municipal Income Fund (formerly Spartan Arizona Municipal Income Fund) / Fidelity Arizona Municipal Money Market Fund
Each year, typically in June, the Board of Trustees, including the independent Trustees (together, the Board), votes on the renewal of the management contract and sub advisory agreements (together, the Advisory Contracts) for each fund. The Board, assisted by the advice of fund counsel and independent Trustees’ counsel, requests and considers a broad range of information throughout the year.
The Board meets regularly each month except August and takes into account throughout the year matters bearing on Advisory Contracts. The Board, acting directly and through its separate committees, considers at each of its meetings factors that are relevant to the annual renewal of each fund’s Advisory Contracts, including the services and support provided to each fund and its shareholders by Fidelity. At the time of the renewal, the Board had 11 standing committees, each composed of independent Trustees with varying backgrounds, to which the Board has assigned specific subject matter responsibilities in order to enhance effective decision making by the Board. Each committee has adopted a written charter outlining the structure and purposes of the committee. One such com mittee, the Fixed Income Contract Committee, meets periodically during the first six months of each year and as necessary to consider matters specifically related to the annual renewal of Advisory Contracts. The committee requests and receives information on, and makes recommendations to the independent Trustees concerning, the approval and annual review of the Advisory Contracts.
At its June 2005 meeting, the Board of Trustees, including the independent Trustees, unanimously determined to renew the Advisory Contracts for each fund. In reaching its determination, the Board considered all factors it believed relevant, including (1) the nature, extent, and quality of the services to be provided to each fund and its sharehold ers by Fidelity (including the investment performance of each fund); (2) the competi tiveness of the management fee and total expenses of each fund; (3) the total costs of the services to be provided by and the profits to be realized by the investment adviser and its affiliates from the relationship with each fund; (4) the extent to which economies of scale would be realized as each fund grows; and (5) whether fee levels reflect these economies of scale, if any, for the benefit of fund shareholders.
In determining whether to renew the Advisory Contracts for each fund, the Board ultimately reached a determination, with the assistance of fund counsel and indepen dent Trustees’ counsel, that the renewal of the Advisory Contracts and the compensation to be received by Fidelity under the management contracts is consistent with Fidelity’s fiduciary duty under applicable law. In addition to evaluating the specific factors noted above, the Board, in reaching its determination, is aware that shareholders in each fund have a broad range of investment choices available to them, including a wide choice among mutual funds offered by competitors to Fidelity, and that each fund’s
shareholders, with the opportunity to review and weigh the disclosure provided by the fund in its prospectus and other public disclosures, have chosen to invest in that fund, managed by Fidelity.
Nature, Extent, and Quality of Services Provided by Fidelity. The Board consid ered staffing within the investment adviser, FMR, and the sub advisers (together, the Investment Advisers), including the backgrounds of the funds’ portfolio managers and the funds’ investment objectives and disciplines. The independent Trustees also had discussions with senior management of Fidelity’s investment operations and investment groups. The Board considered the structure of the portfolio manager compensation program and whether this structure provides appropriate incentives.
Fidelity Resources Dedicated to Investment Management and Support Services. The Board reviewed the size, education, and experience of the Investment Advisers’ invest ment staff, their use of technology, and the Investment Advisers’ approach to recruiting, training, and retaining portfolio managers and other research, advisory, and manage ment personnel. The Board considered Fidelity’s extensive global research capabilities that enable the Investment Advisers to aggregate data from various sources in an effort to produce positive investment results. The Board noted that Fidelity’s analysts have access to a variety of technological tools that enable them to perform both fundamental and quantitative analysis and to specialize in various disciplines. The Board also considered that Fidelity’s portfolio managers and analysts have access to daily portfolio attribution that allows for monitoring of a fund’s portfolio, as well as an electronic communication system that provides immediate real time access to research concerning issuers and credit enhancers.
Shareholder and Administrative Services. The Board considered the nature, extent, quality, and cost of administrative, distribution, and shareholder services performed by the Investment Advisers and their affiliates under the Advisory Contracts and under separate agreements covering transfer agency and pricing and bookkeeping services for each fund. The Board also considered the nature and extent of the Investment Advisers’ supervision of third party service providers, principally custodians and subcustodians. The Board reviewed the allocation of fund brokerage, including allocations to brokers affiliated with the Investment Advisers. The Board also considered the resources devoted to, and the record of compliance with, each fund’s compliance policies and procedures.
The Board noted that the growth of fund assets across the complex allows Fidelity to reinvest in the development of services designed to enhance the value or convenience of the Fidelity funds as investment vehicles. These services include 24 hour access to account information and market information through phone representatives and over the Internet, and investor education materials and asset allocation tools.
Investment in a Large Fund Family. The Board considered the benefits to shareholders of investing in a Fidelity fund, including the benefits of investing in a fund that is part of a
51 Annual Report
Board Approval of Investment Advisory Contracts and Management Fees continued
large family of funds offering a variety of investment disciplines and providing for a large variety of mutual fund investor services. For example, fund shareholders are offered the privilege of exchanging shares of a fund for shares of other Fidelity funds, as set forth in the fund’s prospectus, without paying a sales charge. The Board noted that, since the last Advisory Contract renewals in June 2004, Fidelity has taken a number of actions that benefited particular funds, including (i) voluntarily deciding in 2004 to stop using “soft” commission dollars to pay for market data and, instead, to pay for that data out of its own resources, (ii) contractually agreeing to impose management fee reductions and expense limitations on its five Spartan stock index funds and its stock index fund available through variable insurance products, (iii) contractually agreeing to eliminate the management fees on the Fidelity Freedom Funds and the Fidelity Advisor Freedom Funds, (iv) contractually agreeing to reduce the management fees on most of its investment grade taxable bond funds, and (v) contractually agreeing to impose expense limitations on its retail and Spartan investment grade taxable bond funds.
Investment Performance. The Board considered whether each fund has operated within its investment objective, as well as its record of compliance with its investment restric tions. It also reviewed each fund’s absolute investment performance, as well as each fund’s relative investment performance measured against (i) a broad based securities market index (bond fund only, as money market funds are typically not compared against a market index), and (ii) a peer group of mutual funds over multiple periods. For each fund, the following charts considered by the Board show, over the one , three , and five year periods ended December 31, 2004, the fund’s returns, the returns of a broad based securities market index (“benchmark”) (bond fund only), and a range of returns of a peer group of mutual funds identified by Lipper Inc. as having an investment objec tive similar to that of the fund. The Board did not consider that Lipper peer group to be a meaningful comparison for Fidelity Arizona Municipal Money Market Fund, however, because the peer group combines tax exempt money market funds from several different states. The box within each chart shows the 25th percentile return (bottom of box) and the 75th percentile return (top of box) of the Lipper peer group. The percentage beaten number noted below each chart corresponds to the percentile box and represents the percentage of funds in the Lipper peer group whose performance was equal to or lower than that of the fund.
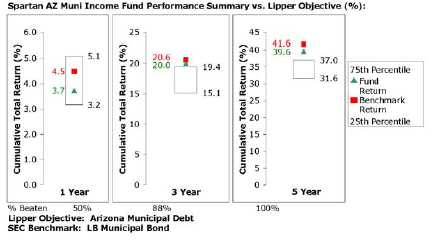
The Board noted that the relative investment performance of the fund has compared favorably to its Lipper peer group over time. The Board also noted that the relative investment performance of the fund was lower than its benchmark over time.
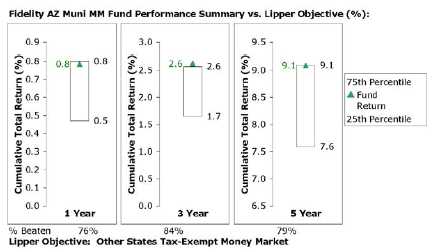
The Board noted that the relative investment performance of the fund has compared favorably to its Lipper peer group over time.
Based on its review, and giving particular weight to the nature and quality of the resources dedicated by the Investment Advisers to maintain and improve relative
53 Annual Report
Board Approval of Investment Advisory Contracts and Management Fees continued
performance, the Board concluded that the nature, extent, and quality of the services provided by Fidelity will benefit each fund’s shareholders, particularly in light of the Board’s view that each fund’s shareholders benefit from investing in a fund that is part of a large family of funds offering a variety of investment disciplines and services.
Competitiveness of Management Fee and Total Fund Expenses. The Board considered each fund’s management fee and total expenses compared to “mapped groups” of competitive funds and classes. Fidelity creates “mapped groups” by combining similar Lipper investment objective categories that have comparable management fee characteristics. Combining Lipper investment objective categories aids the Board’s management fee and total expense comparisons by broadening the competitive group used for comparison and by reducing the number of universes to which various Fidelity funds are compared.
The Board considered two proprietary management fee comparisons for the 12 month periods shown in the charts below. The group of Lipper funds used by the Board for management fee comparisons is referred to below as the “Total Mapped Group” and, for the reasons explained above, is broader than the Lipper peer group used by the Board for performance comparisons. The Total Mapped Group comparison focuses on a fund’s standing relative to the total universe of comparable funds available to investors, in terms of gross management fees before expense reimbursements or caps. “TMG %” represents the percentage of funds in the Total Mapped Group that had management fees that were lower than a fund’s. For example, a TMG % of 17% would mean that 83% of the funds in the Total Mapped Group had higher management fees than a fund. The “Asset Size Peer Group” (ASPG) comparison focuses on a fund’s standing relative to non Fidelity funds similar in size to the fund within the Total Mapped Group. The ASPG represents at least 15% of the funds in the Total Mapped Group with comparable asset size and management fee characteristics, subject to a minimum of 50 funds (or all funds in the Total Mapped Group if fewer than 50). Additional information, such as the ASPG quartile (“quadrant”) in which a fund’s management fee ranked, is also included in the charts and considered by the Board. For a more meaningful comparison of management fees, each fund is compared on the basis of a hypothetical “net management fee,” which is derived by subtracting payments made by FMR for non management expenses (includ ing transfer agent fees, pricing and bookkeeping fees, and custody fees) from the fund’s all inclusive fee. In this regard, the Board realizes that net management fees can vary from year to year because of differences in non management expenses.

The Board noted that each fund’s management fee ranked below the median of its Total Mapped Group and below the median of its ASPG for 2004. Based on its review, the Board concluded that each fund’s management fee was fair and reasonable in light of the services that the fund receives and the other factors considered.
In its review of each fund’s total expenses, the Board considered the fund’s hypothetical net management fee as well as the fund’s all inclusive fee. The Board also considered other expenses, such as transfer agent fees, pricing and bookkeeping fees, and custodial, legal, and audit fees, paid by FMR under the all inclusive arrangement. The Board also
55 Annual Report
Board Approval of Investment Advisory Contracts and Management Fees continued
noted the effects of any waivers and reimbursements on fees and expenses. As part of its review, the Board also considered current and historical total expenses of each fund compared to competitive fund median expenses. Each fund is compared to those funds and classes in the Total Mapped Group (used by the Board for management fee compari sons) that have a similar sales load structure.
The Board noted that each fund’s total expenses ranked below its competitive median for 2004.
In its review of total expenses, the Board also considered Fidelity fee structures and other information on clients that FMR and its affiliates service in other competitive markets, such as other mutual funds advised or subadvised by FMR or its affiliates, pension plan clients, and other institutional clients.
Based on its review, the Board concluded that each fund’s total expenses were reason able in light of the services that the fund and its shareholders receive and the other factors considered.
Costs of the Services and Profitability. The Board considered the revenues earned and the expenses incurred by Fidelity in conducting the business of developing, market ing, distributing, managing, administering and servicing each fund and its shareholders. The Board also considered the level of Fidelity’s profits in respect of all the Fidelity funds.
On an annual basis, FMR presents to the Board Fidelity’s profitability for each fund. Fidelity calculates the profitability for each fund, as well as aggregate profitability for groups of Fidelity funds and all Fidelity funds, using a series of detailed revenue and cost allocation methodologies which originate with the audited books and records of Fidelity. The Audit Committee of the Board reviews any significant changes from the prior year’s methodologies.
PricewaterhouseCoopers LLP (PwC), independent registered accounting firm and auditor to Fidelity and certain Fidelity funds, has been engaged annually by the Board as part of the Board’s assessment of the results of Fidelity’s profitability analysis. PwC’s engagement includes the review and assessment of Fidelity’s methodologies used in determining the revenues and expenses attributable to Fidelity’s mutual fund business, and completion of agreed upon procedures surrounding the mathematical accuracy of fund profitability and its conformity to allocation methodologies. After considering PwC’s reports issued under the engagement and information provided by Fidelity, the Board believes that while other allocation methods may also be reasonable, Fidelity’s profitabil ity methodologies are reasonable in all material respects.
The Board has also reviewed Fidelity’s non fund businesses and any fall out benefits related to the mutual fund business as well as cases where Fidelity’s affiliates may benefit from or be related to the funds’ business. In addition, a special committee of the
Board reviewed services provided to Fidelity by its affiliates and determined that the fees that Fidelity paid for such services were reasonable.
The Board considered the costs of the services provided by and the profits realized by Fidelity in connection with the operation of each fund and determined that the amount of profit is a fair entrepreneurial profit for the management of each fund.
Economies of Scale. The Board considered whether there have been economies of scale in respect of the management of the Fidelity funds, whether the Fidelity funds (including each fund) have appropriately benefited from any such economies of scale, and whether there is potential for realization of any further economies of scale. The Board considered the extent to which each fund will benefit from economies of scale through increased services to the fund, through waivers or reimbursements, or through fee or expense reductions. The Board concluded that any potential economies of scale are being shared between fund shareholders and Fidelity in an appropriate manner.
Additional Information Requested by the Board. In order to develop fully the factual basis for consideration of the Advisory Contracts, the Board requested additional information regarding (i) Fidelity’s fund profitability methodology, including additional detail on various cost allocations; (ii) fall out benefits to Fidelity; and (iii) compensation of portfolio managers and research analysts.
Based on its evaluation of all of the conclusions noted above, and after considering all material factors, the Board ultimately concluded that the existing advisory fee structures are fair and reasonable, and that each fund’s existing Advisory Contracts should be renewed.
57 Annual Report
Investment Adviser
Fidelity Management & Research Company Boston, MA
Sub Advisers
Fidelity Investments Money Management, Inc.
Fidelity International Investment Advisors
Fidelity International Investment Advisors (U.K.) Limited
General Distributor
Fidelity Distributors Corporation Boston, MA
Transfer and Service Agents
Citibank, N.A. New York, NY and
Fidelity Service Company, Inc. Boston, MA
Custodian
Citibank, N.A. New York, NY
The Fidelity Telephone Connection Mutual Fund 24 Hour Service
| Exchanges/Redemptions | | |
| and Account Assistance | | 1-800-544-6666 |
| Product Information | | 1-800-544-6666 |
| Retirement Accounts | | 1-800-544-4774 |
| (8 a.m. - 9 p.m.) | | |
| TDD Service | | 1-800-544-0118 |
| for the deaf and hearing impaired |
| (9 a.m. - 9 p.m. Eastern time) |
| Fidelity Automated Service | | |
| Telephone (FAST® ) | | (automated_phone_logo) 1-800-544-5555 |
(automated_phone_logo) Automated line for quickest service
AZI/SPZ-UANN-1005 1.790910.102

| | Fidelity®
Municipal Money Market
Fund
|
Annual Report
August 31, 2005
|


| Contents | | | | |
| |
| Chairman’s Message | | 4 | | Ned Johnson’s message to shareholders. |
| Shareholder Expense | | 5 | | An example of shareholder expenses. |
| Example | | | | |
| Investment Changes/ | | 6 | | A summary of major shifts in the fund’s |
| Performance | | | | investments over the past six months and |
| | | | | one year, and performance information. |
| Investments | | 7 | | A complete list of the fund’s investments. |
| Financial Statements | | 89 | | Statements of assets and liabilities, |
| | | | | operations, and changes in net assets, |
| | | | | as well as financial highlights. |
| Notes | | 93 | | Notes to the financial statements. |
| Report of Independent | | 97 | | |
| Registered Public | | | | |
| Accounting Firm | | | | |
| Trustees and Officers | | 98 | | |
| Distributions | | 109 | | |
| Proxy Voting Results | | 110 | | |
| Board Approval of | | 111 | | |
| Investment Advisory | | | | |
| Contracts and | | | | |
| Management Fees | | | | |
To view a fund’s proxy voting guidelines and proxy voting record for the 12 month period ended June 30, visit www.fidelity.com/proxyvotingresults or visit the Securities and Exchange Commission’s (SEC) web site at www.sec.gov. You may also call 1-800-544-8544 to request a free copy of the proxy voting guidelines.
Standard & Poor’s, S&P and S&P 500 are registered service marks of The McGraw Hill Companies, Inc. and have been licensed for use by Fidelity Distributors Corporation.
Other third party marks appearing herein are the property of their respective owners. All other marks appearing herein are registered or unregistered trademarks or service marks of FMR Corp. or an affiliated company.
This report and the financial statements contained herein are submitted for the general information of the shareholders of the fund. This report is not authorized for distribution to prospective investors in the fund unless preceded or accompanied by an effective prospectus.
A fund files its complete schedule of portfolio holdings with the SEC for the first and third quarters of each fiscal year on Form N Q. Forms N Q are available on the SEC’s web site at http://www.sec.gov. A fund’s Forms N Q may be reviewed and copied at the SEC’s Public Refer ence Room in Washington, DC. Information regarding the operation of the SEC’s Public Reference Room may be obtained by calling 1 800 SEC 0330. For a complete list of a fund’s portfolio holdings, view the most recent quarterly holdings report, semiannual report, or annual report on Fidelity’s web site at http://www.fidelity.com/holdings.
NOT FDIC INSURED · MAY LOSE VALUE · NO BANK GUARANTEE
Neither the fund nor Fidelity Distributors Corporation is a bank.
3 Annual Report
Chairman’s Message
(photograph of Edward C Johnson 3rd)
Dear Shareholder:
During the past year or so, much has been reported about the mutual fund industry, and much of it has been more critical than I believe is warranted. Allegations that some companies have been less than forthright with their shareholders have cast a shadow on the entire industry. I continue to find these reports disturbing, and assert that they do not create an ac curate picture of the industry overall. Therefore, I would like to remind every one where Fidelity stands on these issues. I will say two things specifically regarding allegations that some mutual fund companies were in violation of the Securities and Exchange Commission’s forward pricing rules or were involved in so called “market timing” activities.
First, Fidelity has no agreements that per mit customers who buy fund shares after 4 p.m. to obtain the 4 p.m. price. This is not a new policy. This is not to say that some one could not deceive the company through fraudulent acts. However, we are extremely diligent in preventing fraud from occurring in this manner and in every other. But I underscore again that Fidelity has no so called “agreements” that sanction illegal practices.
Second, Fidelity continues to stand on record, as we have for years, in opposition to predatory short term trading that adversely affects shareholders in a mutual fund. Back in the 1980s, we initiated a fee which is returned to the fund and, therefore, to investors to discourage this activity. Further, we took the lead several years ago in developing a Fair Value Pricing Policy to prevent market timing on foreign securities in our funds. I am confi dent we will find other ways to make it more difficult for predatory traders to operate. However, this will only be achieved through close cooperation among regulators, legislators and the industry.
Yes, there have been unfortunate instances of unethical and illegal activity within the mutual fund industry from time to time. That is true of any industry. When this occurs, confessed or convicted offend ers should be dealt with appropriately. But we are still concerned about the risk of over regulation and the quick applica tion of simplistic solutions to intricate problems. Every system can be improved, and we support and applaud well thought out improvements by regulators, legisla tors and industry representatives that achieve the common goal of building and protecting the value of investors’ holdings. For nearly 60 years, Fidelity has worked very hard to improve its products and ser vice to justify your trust. When our family founded this company in 1946, we had only a few hundred customers. Today, we serve more than 18 million customers in cluding individual investors and partici pants in retirement plans across America. Let me close by saying that we do not take your trust in us for granted, and we real ize that we must always work to improve all aspects of our service to you. In turn, we urge you to continue your active participation with your financial matters, so that your interests can be well served.
Best regards,
/s/ Edward C. Johnson 3d
Edward C. Johnson 3d
Shareholder Expense Example
As a shareholder of the Fund, you incur two types of costs: (1) transaction costs, and (2) ongoing costs, including management fees and other Fund expenses. This Example is intended to help you understand your ongoing costs (in dollars) of investing in the Fund and to compare these costs with the ongoing costs of investing in other mutual funds. The Example is based on an investment of $1,000 invested at the beginning of the period and held for the entire period (March 1, 2005 to August 31, 2005).
The first line of the table below provides information about actual account values and actual expenses. You may use the information in this line, together with the amount you invested, to estimate the expenses that you paid over the period. Simply divide your account value by $1,000.00 (for example, an $8,600 account value divided by $1,000.00 = 8.6), then multiply the result by the number in the first line under the heading entitled “Expenses Paid During Period” to estimate the expenses you paid on your account during this period. A small balance maintenance fee of $12.00 that is charged once a year may apply for certain accounts with a value of less than $2,000. This fee is not included in the table below. If it was, the estimate of expenses you paid during the period would be higher, and your ending account value lower, by this amount.
Hypothetical Example for Comparison Purposes
The second line of the table below provides information about hypothetical account values and hypothetical expenses based on the Fund’s actual expense ratio and an assumed rate of return of 5% per year before expenses, which is not the Fund’s actual return. The hypothetical account values and expenses may not be used to estimate the actual ending account balance or expenses you paid for the period. You may use this information to compare the ongoing costs of investing in the Fund and other funds. To do so, compare this 5% hypothetical example with the 5% hypothetical examples that appear in the share holder reports of the other funds. A small balance maintenance fee of $12.00 that is charged once a year may apply for certain accounts with a value of less than $2,000. This fee is not included in the table below. If it was, the estimate of expenses you paid during the period would be higher, and your ending account value lower, by this amount.
Please note that the expenses shown in the table are meant to highlight your ongoing costs only and do not reflect any transaction costs. Therefore, the second line of the table is useful in comparing ongoing costs only, and will not help you determine the relative total costs of owning different funds.
| | | | | | | | | | �� | | | Expenses Paid |
| | | | | Beginning | | | | Ending | | | | During Period* |
| | | | | Account Value | | | | Account Value | | | | March 1, 2005 |
| | | | | March 1, 2005 | | | | August 31, 2005 | | to August 31, 2005 |
| Actual | | $ | | 1,000.00 | | $ | | 1,010.20 | | $ | | 2.23 |
| Hypothetical (5% return per year | | | | | | | | | | | | |
| before expenses) | | $ | | 1,000.00 | | $ | | 1,022.99 | | $ | | 2.24 |
* Expenses are equal to the Fund’s annualized expense ratio of .44%; multiplied by the average account value over the period, multiplied by 184/365 (to reflect the one half year period).
5 Annual Report
Investment Changes/Performance
| Maturity Diversification | | | | | | |
| Days | | % of fund’s | | % of fund’s | | % of fund’s |
| | | investments | | investments | | investments |
| | | 8/31/05 | | 2/28/05 | | 8/31/04 |
| 0 – 30 | | 92.4 | | 89.8 | | 91.3 |
| 31 – 90 | | 2.1 | | 1.9 | | 1.7 |
| 91 – 180 | | 0.3 | | 5.0 | | 1.7 |
| 181 – 397 | | 5.2 | | 3.3 | | 5.3 |
| Weighted Average Maturity | | | | | | |
| | | 8/31/05 | | 2/28/05 | | 8/31/04 |
| Fidelity Municipal Money Market | | 24 Days | | 19 Days | | 26 Days |
| All Tax Free Money Market Funds Average* | | 28 Days | | 28 Days | | 36 Days |
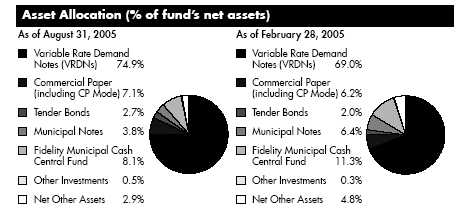
*Source: iMoneyNet, Inc.
| Current and Historical Seven Day Yields | | | | | | |
| | | 8/29/05 | | 5/30/05 | | 2/28/05 | | 11/29/04 | | 8/30/04 |
| Fidelity Municipal Money | | | | | | | | | | |
| Market Fund | | 2.14% | | 2.45% | | 1.39% | | 1.31% | | .91% |
Yield refers to the income paid by the fund over a given period. Yields for money market funds are usually for seven day periods, as they are here, though they are expressed as annual percentage rates. Past performance is no guarantee of future results. Yield will vary and it is possible to lose money by investing in the fund.
Annual Report
Investments August 31, 2005
Showing Percentage of Net Assets
Municipal Securities 97.1%
| | | | | Principal | | Value (Note 1) |
| | | Amount (000s) | | | | (000s) |
| Alabama – 1.3% | | | | | | | | |
| Alabama Gen. Oblig. Participating VRDN Series MS 668, | | | | | | | | |
| 2.52% (Liquidity Facility Morgan Stanley) (c)(g) | | $ | | 6,623 | | $ | | 6,623 |
| Alabama Hsg. Fin. Auth. Multi-family Hsg. Rev.: | | | | | | | | |
| (Cottage Hill Pointe Apts. Proj.) Series 2001 D, 2.62%, LOC | | | | | | | | |
| Southtrust Bank NA, VRDN (c)(f) | | | | 7,500 | | | | 7,500 |
| (Gazebo East Proj.) Series 1991 B, 2.59%, LOC Southtrust | | | | | | | | |
| Bank NA, VRDN (c) | | | | 2,540 | | | | 2,540 |
| (Liberty Square Apts. Proj.) Series C, 2.62%, LOC Southtrust | | | | | | | | |
| Bank NA, VRDN (c)(f) | | | | 8,500 | | | | 8,500 |
| (Sundown Apts. Proj.) Series 2000 E, 2.6%, LOC AmSouth | | | | | | | | |
| Bank NA, Birmingham, VRDN (c)(f) | | | | 6,500 | | | | 6,500 |
| Alabama Hsg. Fin. Auth. Single Family Mtg. Rev. Participating | | | | | | | | |
| VRDN Series Merlots 01 A38, 2.45% (Liquidity Facility | | | | | | | | |
| Wachovia Bank NA) (c)(f)(g) | | | | 14,650 | | | | 14,650 |
| Birmingham Med. Ctr. East Spl. Care Facilities Fing. Auth. Rev. | | | | | | | | |
| Participating VRDN Series MT 16, 2.53% (Liquidity Facility | | | | | | | | |
| Svenska Handelsbanken AB) (c)(g) | | | | 23,055 | | | | 23,055 |
| Birmingham Pub. Park & Recreation Board Lease Rev. (Barber | | | | | | | | |
| Museum Proj.) 2.52%, LOC AmSouth Bank NA, | | | | | | | | |
| Birmingham, VRDN (c) | | | | 16,000 | | | | 16,000 |
| Birmingham Wtrwks. & Swr. Board Wtr. & Swr. Rev. | | | | | | | | |
| Participating VRDN: | | | | | | | | |
| Series EGL 030007 Class A, 2.53% (Liquidity Facility | | | | | | | | |
| Citibank NA, New York) (c)(g) | | | | 4,875 | | | | 4,875 |
| Series EGL 02 6009, 2.53% (Liquidity Facility Citibank NA, | | | | | | | | |
| New York) (c)(g) | | | | 4,100 | | | | 4,100 |
| Courtland Indl. Dev. Board Rev. (Specialty Minerals, Inc. Proj.) | | | | | | | | |
| 2.55%, LOC Wachovia Bank NA, VRDN (c)(f) | | | | 8,000 | | | | 8,000 |
| Cullman Med. Park South Med. Clinic Board Rev. Participating | | | | | | | | |
| VRDN Series MT 121, 2.55% (Liquidity Facility Merrill Lynch | | | | | | | | |
| & Co., Inc.) (c)(g) | | | | 12,250 | | | | 12,250 |
| Decatur Indl. Dev. Board Exempt Facilities Rev. (Nucor Steel | | | | | | | | |
| Decatur LLC Proj.) Series 2003 A, 2.43%, VRDN (c)(f) | | | | 17,000 | | | | 17,000 |
| Fultondale Indl. Dev. Board Indl. Dev. Rev. (Melsur Corp. Proj.) | | | | | | | | |
| 2.64%, LOC AmSouth Bank NA, Birmingham, VRDN (c)(f) | | | | 3,765 | | | | 3,765 |
| Houston County Health Care Auth. Rev. Bonds: | | | | | | | | |
| Series PT 879, 2.15%, tender 11/10/05 (Liquidity Facility | | | | | | | | |
| Merrill Lynch & Co., Inc.) (c)(g)(h) | | | | 10,195 | | | | 10,195 |
| Series PT 880, 2.85%, tender 6/22/06 (Liquidity Facility | | | | | | | | |
| Merrill Lynch & Co., Inc.) (c)(g)(h) | | | | 23,730 | | | | 23,730 |
| Jackson Indl. Dev. Board Rev. (Specialty Minerals, Inc. Proj.) | | | | | | | | |
| 2.55%, LOC Wachovia Bank NA, VRDN (c)(f) | | | | 8,200 | | | | 8,200 |
See accompanying notes which are an integral part of the financial statements.
| Investments continued | | | | | | | | |
| |
| |
| Municipal Securities continued | | | | | | | | |
| | | | | Principal | | Value (Note 1) |
| | | Amount (000s) | | | | (000s) |
| Alabama – continued | | | | | | | | |
| Jefferson County Swr. Rev. Participating VRDN: | | | | | | | | |
| Series EGL 02 6016, 2.53% (Liquidity Facility Citibank NA, | | | | | | | | |
| New York) (c)(g) | | $ | | 5,000 | | $ | | 5,000 |
| Series PT 1838, 2.53% (Liquidity Facility Merrill Lynch & Co., | | | | | | | | |
| Inc.) (c)(g) | | | | 10,520 | | | | 10,520 |
| Series PT 849, 2.53% (Liquidity Facility Landesbank | | | | | | | | |
| Hessen-Thuringen) (c)(g) | | | | 12,495 | | | | 12,495 |
| Lafayette Indl. Dev. Rev. (Kardoes Rubber Co., Inc. Proj.) | | | | | | | | |
| 2.62%, LOC AmSouth Bank NA, Birmingham, VRDN (c)(f) | | | | 3,620 | | | | 3,620 |
| Mobile Indl. Dev. Board Rev. (Newark Group Ind. Proj.) | | | | | | | | |
| 2.47%, LOC Wachovia Bank NA, VRDN (c)(f) | | | | 3,975 | | | | 3,975 |
| Montgomery Indl. Dev. Board Rev. (Feldmeier-Alabama Equip. | | | | | | | | |
| Proj.) Series 1996, 2.69%, LOC Southtrust Bank NA, | | | | | | | | |
| VRDN (c)(f) | | | | 1,215 | | | | 1,215 |
| Roanoke Indl. Dev. Board Indl. Dev. Rev. (Steelfab, Inc. Proj.) | | | | | | | | |
| Series 1997, 2.62%, LOC Bank of America NA, VRDN (c)(f) | | | | 1,220 | | | | 1,220 |
| Univ. of Alabama Gen. Rev. Participating VRDN Series Putters | | | | | | | | |
| 477, 2.53% (Liquidity Facility JPMorgan Chase Bank) (c)(g) . | | | | 4,775 | | | | 4,775 |
| | | | | | | | | 220,303 |
| |
| Alaska – 1.0% | | | | | | | | |
| Alaska Hsg. Fin. Corp.: | | | | | | | | |
| Participating VRDN: | | | | | | | | |
| Series Merlots 99 D, 2.4% (Liquidity Facility Wachovia | | | | | | | | |
| Bank NA) (c)(g) | | | | 12,900 | | | | 12,900 |
| Series Putters 1020, 2.53% (Liquidity Facility JPMorgan | | | | | | | | |
| Chase Bank) (c)(f)(g) | | | | 5,780 | | | | 5,780 |
| Series A, 2.55% (FSA Insured), VRDN (c)(f) | | | | 25,500 | | | | 25,500 |
| Alaska Ind. Dev. & Export Auth. Participating VRDN Series MT | | | | | | | | |
| 129, 2.57% (Liquidity Facility Landesbank | | | | | | | | |
| Hessen-Thuringen) (c)(f)(g) | | | | 4,850 | | | | 4,850 |
| Alaska Indl. Dev. & Export Auth. Rev. Participating VRDN: | | | | | | | | |
| Series PT 1861, 2.54% (Liquidity Facility Merrill Lynch & Co., | | | | | | | | |
| Inc.) (c)(g) | | | | 11,745 | | | | 11,745 |
| Series PT 862, 2.54% (Liquidity Facility Landesbank | | | | | | | | |
| Hessen-Thuringen) (c)(g) | | | | 9,995 | | | | 9,995 |
| Alaska Intl. Arpts. Revs. Participating VRDN: | | | | | | | | |
| Series Merlots 99 I, 2.45% (Liquidity Facility Wachovia Bank | | | | | | | | |
| NA) (c)(f)(g) | | | | 7,500 | | | | 7,500 |
| Series PT 2061, 2.57% (Liquidity Facility Merrill Lynch & Co., | | | | | | | | |
| Inc.) (c)(f)(g) | | | | 6,420 | | | | 6,420 |
| Series ROC II R138, 2.57% (Liquidity Facility Citibank | | | | | | | | |
| NA) (c)(f)(g) | | | | 8,015 | | | | 8,015 |
See accompanying notes which are an integral part of the financial statements.
| Municipal Securities continued | | | | | | | | |
| | | | | Principal | | Value (Note 1) |
| | | Amount (000s) | | | | (000s) |
| Alaska – continued | | | | | | | | |
| Anchorage Gen. Oblig. Participating VRDN Series PT 2652, | | | | | | | | |
| 2.53% (Liquidity Facility Merrill Lynch & Co., Inc.) (c)(g) | | $ | | 12,010 | | $ | | 12,010 |
| Anchorage Wastewtr. Rev. Participating VRDN Series DB 128, | | | | | | | | |
| 2.53% (Liquidity Facility Deutsche Bank AG) (c)(g) | | | | 6,945 | | | | 6,945 |
| Valdez Marine Term. Rev. Bonds (ConocoPhillips Proj.): | | | | | | | | |
| Series 1994 A, 3%, tender 6/1/06 (c) | | | | 24,500 | | | | 24,500 |
| Series 1994 C, 3%, tender 6/1/06 (c) | | | | 24,000 | | | | 24,000 |
| | | | | | | | | 160,160 |
| |
| Arizona – 1.7% | | | | | | | | |
| Arizona School Facilities Board Ctfs. of Prtn. Participating | | | | | | | | |
| VRDN Series ROC II R 4069, 2.53% (Liquidity Facility | | | | | | | | |
| Citigroup Global Markets Hldgs., Inc.) (c)(g) | | | | 8,600 | | | | 8,600 |
| Arizona School Facilities Board State School Impt. Rev. | | | | | | | | |
| Participating VRDN Series Putters 484, 2.53% (Liquidity | | | | | | | | |
| Facility JPMorgan Chase Bank) (c)(g) | | | | 11,935 | | | | 11,935 |
| Arizona Tourism & Sports Auth. Tax Rev. Participating VRDN | | | | | | | | |
| Series PT 2312, 2.53% (Liquidity Facility Merrill Lynch & Co., | | | | | | | | |
| Inc.) (c)(g) | | | | 3,720 | | | | 3,720 |
| Arizona Wtr. Infrastructure Fin. Auth. Rev. Participating VRDN | �� | | | | | | | |
| Series PT 2237, 2.53% (Liquidity Facility Merrill Lynch & Co., | | | | | | | | |
| Inc.) (c)(g) | | | | 14,010 | | | | 14,010 |
| Maricopa County Indl. Dev. Auth. Indl. Dev. Rev.: | | | | | | | | |
| Bonds (American Wtr. Corp. Proj.) Series 1988, 2.8% tender | | | | | | | | |
| 9/7/05, CP mode (f) | | | | 6,035 | | | | 6,035 |
| (Clayton Homes, Inc. Proj.) Series 1998, 2.59%, LOC U.S. | | | | | | | | |
| Bank NA, Minnesota, VRDN (c)(f) | | | | 4,200 | | | | 4,200 |
| Maricopa County Indl. Dev. Auth. Multi-family Hsg. Rev.: | | | | | | | | |
| (Ranchwood Apt. Proj.) Series 2001 A, 2.55%, LOC Fannie | | | | | | | | |
| Mae, VRDN (c)(f) | | | | 9,000 | | | | 9,000 |
| (San Angelin Apts. Proj.) 2.57%, LOC Fannie Mae, | | | | | | | | |
| VRDN (c)(f) | | | | 14,900 | | | | 14,900 |
| (San Lucas Apts. Proj.) 2.57%, LOC Fannie Mae, VRDN (c)(f) | | | | 12,000 | | | | 12,000 |
| (San Martin Apts. Proj.) Series A2, 2.55%, LOC Fannie | | | | | | | | |
| Mae, VRDN (c)(f) | | | | 3,390 | | | | 3,390 |
| (San Miguel Apts. Proj.) 2.57%, LOC Fannie Mae, | | | | | | | | |
| VRDN (c)(f) | | | | 14,900 | | | | 14,900 |
| (Sands Apts. Proj.) Series 2001 A, 2.55%, LOC Fannie Mae, | | | | | | | | |
| VRDN (c)(f) | | | | 7,000 | | | | 7,000 |
| (Village Square Apts. Proj.) 2.57%, LOC Fannie Mae, | | | | | | | | |
| VRDN (c)(f) | | | | 3,800 | | | | 3,800 |
| Maricopa County Indl. Dev. Auth. Single Family Mtg. Rev. | | | | | | | | |
| Participating VRDN Series MS 1165, 2.57% (Liquidity | | | | | | | | |
| Facility Morgan Stanley) (c)(f)(g) | | | | 47,400 | | | | 47,400 |
See accompanying notes which are an integral part of the financial statements.
| Investments continued | | | | | | | | |
| |
| |
| Municipal Securities continued | | | | | | | | |
| | | | | Principal | | Value (Note 1) |
| | | Amount (000s) | | | | (000s) |
| Arizona – continued | | | | | | | | |
| Mesa Util. Sys. Rev. Participating VRDN Series Putters 960, | | | | | | | | |
| 2.53% (Liquidity Facility JPMorgan Chase Bank) (c)(g) | | $ | | 5,200 | | $ | | 5,200 |
| Phoenix Civic Impt. Board Arpt. Rev. Participating VRDN | | | | | | | | |
| Series Merlots 02 A28, 2.45% (Liquidity Facility Wachovia | | | | | | | | |
| Bank NA) (c)(f)(g) | | | | 3,385 | | | | 3,385 |
| Phoenix Civic Impt. Corp. Transit Excise Tax Rev. Participating | | | | | | | | |
| VRDN: | | | | | | | | |
| Series EGL 7050040, 2.53% (Liquidity Facility Citibank | | | | | | | | |
| NA) (c)(g) | | | | 9,475 | | | | 9,475 |
| Series EGL 720050020, 2.53% (Liquidity Facility Citibank | | | | | | | | |
| NA) (c)(g) | | | | 23,035 | | | | 23,035 |
| Phoenix Civic Impt. Corp. Wtr. Sys. Rev. Participating VRDN: | | | | | | | | |
| Series BS 9063, 2.41% (Liquidity Facility Bear Stearns | | | | | | | | |
| Companies, Inc.) (c)(g) | | | | 7,990 | | | | 7,990 |
| Series PT 1401, 2.53% (Liquidity Facility Merrill Lynch & Co., | | | | | | | | |
| Inc.) (c)(g) | | | | 4,410 | | | | 4,410 |
| Phoenix Gen. Oblig. Participating VRDN Series PT 1436, | | | | | | | | |
| 2.53% (Liquidity Facility Merrill Lynch & Co., Inc.) (c)(g) | | | | 1,395 | | | | 1,395 |
| Phoenix Indl. Dev. Auth. Multi-family Hsg. Rev. (Bell Square | | | | | | | | |
| Apt. Proj.) Series 1995, 2.45%, LOC Gen. Elec. Cap. Corp., | | | | | | | | |
| VRDN (c) | | | | 6,000 | | | | 6,000 |
| Phoenix Indl. Dev. Auth. Rev.: | | | | | | | | |
| (Independent Newspaper, Inc. Proj.) Series 2000, 2.64%, | | | | | | | | |
| LOC Wachovia Bank NA, VRDN (c)(f) | | | | 990 | | | | 990 |
| (Plastican Proj.) Series 1997, 2.4%, LOC Fleet Bank NA, | | | | | | | | |
| VRDN (c)(f) | | | | 3,020 | | | | 3,020 |
| Phoenix Indl. Dev. Auth. Single Family Mtg. Rev. Participating | | | | | | | | |
| VRDN Series Merlots 01 A23, 2.45% (Liquidity Facility | | | | | | | | |
| Wachovia Bank NA) (c)(f)(g) | | | | 510 | | | | 510 |
| Pima County Indl. Dev. Auth. Multi-family Hsg. Rev. (Cimarron | | | | | | | | |
| Place Apts. Proj.) 2.55%, LOC Fannie Mae, VRDN (c)(f) | | | | 4,500 | | | | 4,500 |
| Salt River Proj. Agric. Impt. & Pwr. District Elec. Sys. Rev.: | | | | | | | | |
| Participating VRDN Series ROC II R1002, 2.53% (Liquidity | | | | | | | | |
| Facility Citigroup Global Markets Hldgs., Inc.) (c)(g) | | | | 14,150 | | | | 14,150 |
| Series 1997 B: | | | | | | | | |
| 2.7% 9/7/05, CP | | | | 4,900 | | | | 4,900 |
| 2.8% 9/15/05, CP | | | | 18,000 | | | | 18,000 |
| Tolleson Muni. Fin. Corp. Rev. Bonds (American Wtr. Cap. | | | | | | | | |
| Corp. Proj.) 2.73% tender 11/3/05, CP mode | | | | 8,560 | | | | 8,560 |
| Yavapai County Indl. Dev. Auth. Indl. Dev. Rev. (Oxycal Lab. | | | | | | | | |
| Proj.) Series 1999 A, 2.65%, LOC Wells Fargo Bank NA, | | | | | | | | |
| San Francisco, VRDN (c)(f) | | | | 2,045 | | | | 2,045 |
| | | | | | | | | 278,455 |
See accompanying notes which are an integral part of the financial statements.
Annual Report
| Municipal Securities continued | | | | | | | | |
| | | | | Principal | | Value (Note 1) |
| | | Amount (000s) | | | | (000s) |
| Arkansas – 0.7% | | | | | | | | |
| Arkansas Dev. Auth. Indl. Dev. Rev. (Stratton Seed Co. Proj.) | | | | | | | | |
| Series 1999, 2.57%, LOC Bank of America NA, VRDN (c)(f) | | $ | | 2,325 | | $ | | 2,325 |
| Arkansas Dev. Fin. Auth. Participating VRDN Series BA 98 C, | | | | | | | | |
| 2.64% (Liquidity Facility Bank of America NA) (c)(f)(g) | | | | 5,150 | | | | 5,150 |
| Arkansas Dev. Fin. Auth. Envir. Facilities Rev. (Teris LLC Proj.) | | | | | | | | |
| 2.54%, LOC Wachovia Bank NA, VRDN (c)(f) | | | | 24,000 | | | | 24,000 |
| Arkansas Dev. Fin. Auth. Multi-family Hsg. Rev. (Kiehl Partners | | | | | | | | |
| LP Proj.) 2.6%, LOC Fannie Mae, VRDN (c)(f) | | | | 8,200 | | | | 8,200 |
| Arkansas Dev. Fin. Auth. Single Family Mtg. Rev. Participating | | | | | | | | |
| VRDN Series MS 1139, 2.57% (Liquidity Facility Morgan | | | | | | | | |
| Stanley) (c)(f)(g) | | | | 58,240 | | | | 58,240 |
| Blytheville Indl. Dev. Rev. (Arkansas Steel Processing Proj.) | | | | | | | | |
| Series 1992, 2.49%, LOC Fortis Banque SA, VRDN (c)(f) | | | | 9,500 | | | | 9,500 |
| Columbia County Solid Waste Disp. Rev. (Albemarle Corp. | | | | | | | | |
| Proj.) Series 1999, 2.57%, LOC Bank of America NA, | | | | | | | | |
| VRDN (c)(f) | | | | 5,500 | | | | 5,500 |
| Univ. of Arkansas Univ. Revs. Participating VRDN Series PT | | | | | | | | |
| 1948, 2.53% (Liquidity Facility Merrill Lynch & Co., | | | | | | | | |
| Inc.) (c)(g) | | | | 5,730 | | | | 5,730 |
| | | | | | | | | 118,645 |
| |
| California – 1.5% | | | | | | | | |
| Access to Lns. for Learning Student Ln. Corp. Rev.: | | | | | | | | |
| Bonds (Student Ln. Prog.) Series II A7, 2.95%, tender | | | | | | | | |
| 6/1/06, LOC State Street Bank & Trust Co., Boston (c)(f) | | | | 13,350 | | | | 13,350 |
| (Student Ln. Prog.): | | | | | | | | |
| Series VA1, 2.58% (AMBAC Insured), VRDN (c)(f) | | | | 40,000 | | | | 40,000 |
| Series VA2, 2.55% (AMBAC Insured), VRDN (c)(f) | | | | 45,000 | | | | 45,000 |
| California Home Mtg. Fin. Auth. Homebuyers Fund Single | | | | | | | | |
| Family Participating VRDN Series ROC II R321, 2.55% | | | | | | | | |
| (Liquidity Facility Citibank NA) (c)(f)(g) | | | | 95,470 | | | | 95,470 |
| California Hsg. Fin. Agcy. Home Mtg. Rev. Participating | | | | | | | | |
| VRDN: | | | | | | | | |
| Series MT 22, 2.56% (Liquidity Facility Landesbank | | | | | | | | |
| Hessen-Thuringen) (c)(f)(g) | | | | 24,240 | | | | 24,240 |
| Series MT 79, 2.56% (Liquidity Facility Landesbank | | | | | | | | |
| Hessen-Thuringen) (c)(f)(g) | | | | 2,305 | | | | 2,305 |
| Series PT 998, 2.56% (Liquidity Facility Merrill Lynch & Co., | | | | | | | | |
| Inc.) (c)(f)(g) | | | | 24,900 | | | | 24,900 |
| | | | | | | | | 245,265 |
See accompanying notes which are an integral part of the financial statements.
Annual Report
| Investments continued | | | | | | | | |
| |
| |
| Municipal Securities continued | | | | | | | | |
| | | | | Principal | | Value (Note 1) |
| | | Amount (000s) | | | | (000s) |
| Colorado – 3.1% | | | | | | | | |
| Adams & Arapahoe Counties Joint School District #28J Aurora | | | | | | | | |
| Participating VRDN Series PT 1771, 2.53% (Liquidity Facility | | | | | | | | |
| Merrill Lynch & Co., Inc.) (c)(g) | | $ | | 5,865 | | $ | | 5,865 |
| Adams County Hsg. Auth. (Semper Village Apartments Proj.) | | | | | | | | |
| Series 2004 A, 2.57%, LOC Fannie Mae, VRDN (c)(f) | | | | 7,250 | | | | 7,250 |
| Arapaho County School District #6, Littleton Participating | | | | | | | | |
| VRDN Series PT 1983, 2.53% (Liquidity Facility Merrill Lynch | | | | | | | | |
| & Co., Inc.) (c)(g) | | | | 7,410 | | | | 7,410 |
| Aurora Multi-family Hsg. Rev. (Aurora Meadows Apts. Proj.) | | | | | | | | |
| Series 1996, 2.65%, LOC Fannie Mae, VRDN (c)(f) | | | | 13,400 | | | | 13,400 |
| Colorado Health Facilities Auth. Rev.: | | | | | | | | |
| Participating VRDN: | | | | | | | | |
| Series MT 23, 2.53% (Liquidity Facility Svenska | | | | | | | | |
| Handelsbanken AB) (c)(g) | | | | 21,255 | | | | 21,255 |
| Series PA 02 1094, 2.53% (Liquidity Facility Merrill Lynch | | | | | | | | |
| & Co., Inc.) (c)(g) | | | | 6,805 | | | | 6,805 |
| (Boulder Cmnty. Hosp. Proj.) Series 2000, 2.52%, LOC | | | | | | | | |
| JPMorgan Chase Bank, VRDN (c) | | | | 16,700 | | | | 16,700 |
| Colorado Hsg. & Fin. Auth.: | | | | | | | | |
| Participating VRDN: | | | | | | | | |
| Series BA 96 E, 2.64% (Liquidity Facility Bank of America | | | | | | | | |
| NA) (c)(f)(g) | | | | 670 | | | | 670 |
| Series FRRI 00 A3, 2.78% (Liquidity Facility Bayerische | | | | | | | | |
| Hypo-und Vereinsbank AG) (c)(f)(g) | | | | 390 | | | | 390 |
| Series FRRI 00 A4, 2.73% (Liquidity Facility Bayerische | | | | | | | | |
| Hypo-und Vereinsbank AG) (c)(f)(g) | | | | 900 | | | | 900 |
| Series FRRI L37J, 2.53% (Liquidity Facility Lehman Brothers | | | | | | | | |
| Hldgs., Inc.) (c)(f)(g) | | | | 8,495 | | | | 8,495 |
| Series FRRI L9, 2.53% (Liquidity Facility Lehman Brothers | | | | | | | | |
| Hldgs., Inc.) (c)(f)(g) | | | | 1,185 | | | | 1,185 |
| Series LB 03 L31J, 2.53% (Liquidity Facility Lehman | | | | | | | | |
| Brothers Hldgs., Inc.) (c)(f)(g) | | | | 8,300 | | | | 8,300 |
| Series LB 04 F12, 2.53% (Lehman Brothers Hldgs., Inc. | | | | | | | | |
| Guaranteed) (Liquidity Facility Lehman Brothers Hldgs., | | | | | | | | |
| Inc.) (c)(f)(g) | | | | 7,720 | | | | 7,720 |
| Series LB 04 F13, 2.53% (Lehman Brothers Hldgs., Inc. | | | | | | | | |
| Guaranteed) (Liquidity Facility Lehman Brothers Hldgs., | | | | | | | | |
| Inc.) (c)(f)(g) | | | | 7,475 | | | | 7,475 |
| Series LB 05 F4, 2.58% (Lehman Brothers Hldgs., Inc. | | | | | | | | |
| Guaranteed) (Liquidity Facility Lehman Brothers Hldgs., | | | | | | | | |
| Inc.) (c)(f)(g) | | | | 4,400 | | | | 4,400 |
| Series Merlots 01 A20, 2.45% (Liquidity Facility Wachovia | | | | | | | | |
| Bank NA) (c)(f)(g) | | | | 2,240 | | | | 2,240 |
See accompanying notes which are an integral part of the financial statements.
Annual Report
| Municipal Securities continued | | | | | | | | |
| | | | | Principal | | Value (Note 1) |
| | | Amount (000s) | | | | (000s) |
| Colorado – continued | | | | | | | | |
| Colorado Hsg. & Fin. Auth.: – continued | | | | | | | | |
| Participating VRDN: | | | | | | | | |
| Series PT 1373, 2.57% (Liquidity Facility Merrill Lynch & | | | | | | | | |
| Co., Inc.) (c)(f)(g) | | $ | | 2,850 | | $ | | 2,850 |
| Series Putters 120, 2.56% (Liquidity Facility JPMorgan | | | | | | | | |
| Chase Bank) (c)(f)(g) | | | | 2,470 | | | | 2,470 |
| Series 2002 A3, 2.5% (Liquidity Facility Fed. Home Ln. Bank | | | | | | | | |
| Topeka), VRDN (c)(f) | | | | 6,215 | | | | 6,215 |
| Series 2003 A2 Class I, 2.5% (Liquidity Facility Dexia Cr. | | | | | | | | |
| Local de France), VRDN (c)(f) | | | | 21,300 | | | | 21,300 |
| Series 2003 B3, 2.5% (Liquidity Facility JPMorgan Chase | | | | | | | | |
| Bank), VRDN (c)(f) | | | | 17,000 | | | | 17,000 |
| Series 2004 B2 Class I, 2.5% (Liquidity Facility Dexia Cr. | | | | | | | | |
| Local de France), VRDN (c)(f) | | | | 16,000 | | | | 16,000 |
| Series A2 Class 1, 2.5% (Liquidity Facility Dexia Cr. Local de | | | | | | | | |
| France), VRDN (c)(f) | | | | 23,000 | | | | 23,000 |
| Series C2 Class I, 2.5% (Liquidity Facility Dexia Cr. Local de | | | | | | | | |
| France), VRDN (c)(f) | | | | 25,000 | | | | 25,000 |
| Colorado Hsg. & Fin. Auth. Solid Waste Rev. (Republic | | | | | | | | |
| Services, Inc. Proj.) 2.55%, LOC Bank of America NA, | | | | | | | | |
| VRDN (c)(f) | | | | 7,000 | | | | 7,000 |
| Colorado Springs Utils. Rev. Participating VRDN: | | | | | | | | |
| Series SGB 28, 2.53% (Liquidity Facility Societe | | | | | | | | |
| Generale) (c)(g) | | | | 11,480 | | | | 11,480 |
| Series TOC 04 E, 2.52% (Liquidity Facility Goldman Sachs | | | | | | | | |
| Group, Inc.) (c)(g) | | | | 11,650 | | | | 11,650 |
| Colorado Student Oblig. Auth.: | | | | | | | | |
| (Student Ln. Prog.) Series 1990 A, 2.45% (AMBAC Insured), | | | | | | | | |
| VRDN (c)(f) | | | | 45,655 | | | | 45,655 |
| Series 1989 A, 2.39% (AMBAC Insured), VRDN (c)(f) | | | | 14,000 | | | | 14,000 |
| Denver City & County Arpt. Rev. Participating VRDN: | | | | | | | | |
| Series FRRI 01 F12, 2.53% (Liquidity Facility Bank of New | | | | | | | | |
| York, New York) (c)(f)(g) | | | | 5,000 | | | | 5,000 |
| Series Merlots 97 Q, 2.4% (Liquidity Facility Wachovia Bank | | | | | | | | |
| NA) (c)(g) | | | | 6,600 | | | | 6,600 |
| Series PA 762, 2.57% (Liquidity Facility Merrill Lynch & Co., | | | | | | | | |
| Inc.) (c)(f)(g) | | | | 4,995 | | | | 4,995 |
| Series PA 764R, 2.57% (Liquidity Facility Merrill Lynch & | | | | | | | | |
| Co., Inc.) (c)(f)(g) | | | | 4,995 | | | | 4,995 |
| Series PT 2112, 2.57% (Liquidity Facility WestLB AG) (c)(f)(g) | | | | 2,480 | | | | 2,480 |
| Series PT 3124, 2.53% (Liquidity Facility Merrill Lynch & Co., | | | | | | | | |
| Inc.) (c)(g) | | | | 7,250 | | | | 7,250 |
| Series PT 782, 2.57% (Liquidity Facility Merrill Lynch & Co., | | | | | | | | |
| Inc.) (c)(f)(g) | | | | 5,515 | | | | 5,515 |
See accompanying notes which are an integral part of the financial statements.
13 Annual Report
Investments continued
Municipal Securities continued
| | | | | Principal | | Value (Note 1) |
| | | Amount (000s) | | | | (000s) |
| Colorado – continued | | | | | | | | |
| Denver City & County Arpt. Rev. Participating VRDN: - | | | | | | | | |
| continued | | | | | | | | |
| Series PT 920, 2.57% (Liquidity Facility Merrill Lynch & Co., | | | | | | | | |
| Inc.) (c)(f)(g) | | $ | | 1,500 | | $ | | 1,500 |
| Series Putters 1054, 2.4% (Liquidity Facility JPMorgan Chase | | | | | | | | |
| & Co.) (c)(g) | | | | 5,295 | | | | 5,295 |
| Series RF 02 E14, 2.64% (Liquidity Facility Bank of New | | | | | | | | |
| York, New York) (c)(f)(g) | | | | 44,200 | | | | 44,200 |
| Series Stars 104, 2.53% (Liquidity Facility BNP Paribas | | | | | | | | |
| SA) (c)(g) | | | | 5,555 | | | | 5,555 |
| Denver City & County Spl. Facilities Arpt. Rev. (Worldport at | | | | | | | | |
| DIA Proj.) Series A, 2.53%, LOC JPMorgan Chase Bank, | | | | | | | | |
| VRDN (c)(f) | | | | 8,790 | | | | 8,790 |
| El Paso County Co. Single Family Mtg. Rev. Participating | | | | | | | | |
| VRDN Series MS 1136, 2.57% (Liquidity Facility Morgan | | | | | | | | |
| Stanley) (c)(f)(g) | | | | 8,689 | | | | 8,689 |
| Fort Collins Indl. Dev. Rev. (Phelps-Tointon Millwork Proj.) | | | | | | | | |
| Series 1993, 2.65%, LOC JPMorgan Chase Bank, | | | | | | | | |
| VRDN (c)(f) | | | | 840 | | | | 840 |
| Lakewood Hsg. Auth. Multi-family Rev.: | | | | | | | | |
| (Ridgemoor Apts. Proj.) Series 2003 A, 2.57%, LOC Fannie | | | | | | | | |
| Mae, VRDN (c)(f) | | | | 7,250 | | | | 7,250 |
| (Timberleaf Apts. Proj.) 2.57%, LOC Fannie Mae, | | | | | | | | |
| VRDN (c)(f) | | | | 13,850 | | | | 13,850 |
| Lower Colorado River Auth. Rev. Participating VRDN Series | | | | | | | | |
| EGL 01 4313, 2.53% (Liquidity Facility Citibank NA, New | | | | | | | | |
| York) (c)(g) | | | | 7,500 | | | | 7,500 |
| Mountain Village County Hsg. Auth. Hsg. Rev. (Village Courts | | | | | | | | |
| Apts. Proj.) Series 2000 A, 2.64%, LOC U.S. Bank NA, | | | | | | | | |
| Minnesota, VRDN (c) | | | | 7,120 | | | | 7,120 |
| Reg’l. Trans. District Sales Tax Rev. Participating VRDN Series | | | | | | | | |
| MS 01 679, 2.52% (Liquidity Facility Morgan Stanley) (c)(g) | | | | 2,955 | | | | 2,955 |
| Southern Ute Indian Tribe of Southern Ute Indian Reservation | | | | | | | | |
| 2.55%, VRDN (c) | | | | 13,000 | | | | 13,000 |
| Univ. of Colorado Enterprise Sys. Rev. Participating VRDN | | | | | | | | |
| Series EGL 7050046 Class A, 2.53% (Liquidity Facility | | | | | | | | |
| Citibank NA) (c)(g) | | | | 4,620 | | | | 4,620 |
| Weld County School District #6, Greely Participating VRDN | | | | | | | | |
| Series PT 1918, 2.53% (Liquidity Facility Merrill Lynch & Co., | | | | | | | | |
| Inc.) (c)(g) | | | | 4,585 | | | | 4,585 |
| Westminster County Multi-family Hsg. Rev. (Lakeview Apts. | | | | | | | | |
| Proj.) Series 1997, 2.65%, LOC Fannie Mae, VRDN (c)(f) | | | | 7,110 | | | | 7,110 |
| | | | | | | | | 503,774 |
See accompanying notes which are an integral part of the financial statements.
| Municipal Securities continued | | | | | | | | |
| | | | | Principal | | Value (Note 1) |
| | | Amount (000s) | | | | (000s) |
| Connecticut – 0.9% | | | | | | | | |
| Connecticut Gen. Oblig. Participating VRDN: | | | | | | | | |
| Series EGL 7050017, 2.53% (Liquidity Facility Citibank | | | | | | | | |
| NA) (c)(g) | | $ | | 11,660 | | $ | | 11,660 |
| Series EGL 7050078, 2.53% (Liquidity Facility Citibank | | | | | | | | |
| NA) (c)(g) | | | | 19,000 | | | | 19,000 |
| Connecticut Hsg. Fin. Auth. Participating VRDN Series MT 38, | | | | | | | | |
| 2.54% (Liquidity Facility Landesbank Hessen Thuringen) (c)(f)(g) | | | | 125,260 | | | | 125,260 |
| | | | | | | | | 155,920 |
| |
| Delaware – 0.4% | | | | | | | | |
| Delaware Econ. Dev. Auth. Rev. (Delmarva Pwr. & Lt. Co. | | | | | | | | |
| Proj.): | | | | | | | | |
| Series 1988, 2.52%, VRDN (c)(f) | | | | 3,550 | | | | 3,550 |
| Series 1993 C, 2.54%, VRDN (c) | | | | 4,300 | | | | 4,300 |
| Series 1994, 2.52%, VRDN (c)(f) | | | | 11,200 | | | | 11,200 |
| Series 1999 A, 2.52%, VRDN (c) | | | | 6,730 | | | | 6,730 |
| Series 1999 B, 2.57%, VRDN (c)(f) | | | | 9,000 | | | | 9,000 |
| Delaware Hsg. Auth. Rev. Participating VRDN: | | | | | | | | |
| Series 03 L52J, 2.53% (Liquidity Facility Lehman Brothers | | | | | | | | |
| Hldgs., Inc.) (c)(f)(g) | | | | 11,480 | | | | 11,480 |
| Series FRRI 02 L8, 2.53% (Liquidity Facility Lehman Brothers | | | | | | | | |
| Hldgs., Inc.) (c)(f)(g) | | | | 5,925 | | | | 5,925 |
| Series ROC II R359, 2.57% (Liquidity Facility Citibank | | | | | | | | |
| NA) (c)(f)(g) | | | | 2,155 | | | | 2,155 |
| New Castle County Multi-Family Rent Hsg. Rev. (Fairfield | | | | | | | | |
| English Village Proj.) 2.57%, LOC Fannie Mae, VRDN (c)(f) . | | | | 8,500 | | | | 8,500 |
| | | | | | | | | 62,840 |
| |
| District Of Columbia – 1.9% | | | | | | | | |
| District of Columbia Enterprise Zone Rev. (Crowell & Moring | | | | | | | | |
| LLP Proj.) 2.41%, LOC Suntrust Bank, VRDN (c)(f) | | | | 3,300 | | | | 3,300 |
| District of Columbia Gen. Oblig. Participating VRDN: | | | | | | | | |
| Series PT 2451, 2.53% (Liquidity Facility Dexia Cr. Local de | | | | | | | | |
| France) (c)(g) | | | | 5,125 | | | | 5,125 |
| Series ROC II 99 10, 2.53% (Liquidity Facility Citibank | | | | | | | | |
| NA) (c)(g) | | | | 5,905 | | | | 5,905 |
| District of Columbia Hosp. Rev. Participating VRDN Series | | | | | | | | |
| Floaters 01 712, 2.57% (Liquidity Facility Morgan | | | | | | | | |
| Stanley) (c)(g) | | | | 17,660 | | | | 17,660 |
| District of Columbia Hsg. Fin. Agcy. Multi-family Hsg. Rev.: | | | | | | | | |
| (Trenton Park Apts. Proj.) Series 2001, 2.65%, LOC Bank of | | | | | | | | |
| America NA, VRDN (c)(f) | | | | 3,155 | | | | 3,155 |
See accompanying notes which are an integral part of the financial statements.
15 Annual Report
Investments continued
Municipal Securities continued
| | | | | Principal | | Value (Note 1) |
| | | Amount (000s) | | | | (000s) |
| District Of Columbia – continued | | | | | | | | |
| District of Columbia Hsg. Fin. Agcy. Multi-family Hsg. Rev.: - | | | | | | |
| continued | | | | | | | | |
| (WDC I LP Dev. Proj.) Series 2000, 2.54%, LOC Suntrust | | | | | | | | |
| Bank, VRDN (c)(f) | | $ | | 8,520 | | $ | | 8,520 |
| District of Columbia Hsg. Fin. Auth. Cap. Prog. Rev. | | | | | | | | |
| Participating VRDN Series PT 3088, 2.53% (Liquidity Facility | | | | | | |
| Merrill Lynch & Co., Inc.) (c)(g) | | | | 8,640 | | | | 8,640 |
| District of Columbia Rev.: | | | | | | | | |
| (Arnold & Porter Proj.) Series 1999, 2.64%, LOC Branch | | | | | | | | |
| Banking & Trust Co., VRDN (c)(f) | | | | 6,350 | | | | 6,350 |
| (Fort Lincoln New Town/Premium Distributors LLC Proj.) | | | | | | | | |
| Series 2000, 2.54%, LOC Wachovia Bank NA, | | | | | | | | |
| VRDN (c)(f) | | | | 8,660 | | | | 8,660 |
| (Nat’l. Assoc. of Realtors Proj.) Series 2003 A, 2.41%, LOC | | | | | | |
| Suntrust Bank, VRDN (c)(f) | | | | 7,500 | | | | 7,500 |
| District of Columbia Tax Increment Rev. Participating VRDN | | | | | | | | |
| Series PT 1410, 2.53% (Liquidity Facility Merrill Lynch & Co., | | | | | | |
| Inc.) (c)(g) | | | | 5,120 | | | | 5,120 |
| District of Columbia Wtr. & Swr. Auth. Participating VRDN: | | | | | | | | |
| Series EGL 98 5201, 2.53% (Liquidity Facility Citibank NA, | | | | | | |
| New York) (c)(g) | | | | 12,300 | | | | 12,300 |
| Series ROC II 99 5, 2.53% (Liquidity Facility Citibank | | | | | | | | |
| NA) (c)(g) | | | | 9,505 | | | | 9,505 |
| Metropolitan Washington Arpts. Auth. Gen. Arpt. Rev. | | | | | | | | |
| Participating VRDN Series MT 108, 2.57% (Liquidity Facility | | | | | | |
| Svenska Handelsbanken AB) (c)(f)(g) | | | | 1,660 | | | | 1,660 |
| Metropolitan Washington Arpts. Auth. Sys. Rev.: | | | | | | | | |
| Participating VRDN: | | | | | | | | |
| Series EGL 7050026, 2.57% (Liquidity Facility Citibank | | | | | | | | |
| NA) (c)(f)(g) | | | | 5,750 | | | | 5,750 |
| Series EGL 720050023, 2.57% (Liquidity Facility Citibank | | | | | | |
| NA) (c)(f)(g) | | | | 5,975 | | | | 5,975 |
| Series MT 114, 2.57% (Liquidity Facility Svenska | | | | | | | | |
| Handelsbanken AB) (c)(f)(g) | | | | 5,990 | | | | 5,990 |
| Series MT 13, 2.57% (Liquidity Facility Merrill Lynch & | | | | | | | | |
| Co., Inc.) (c)(f)(g) | | | | 5,495 | | | | 5,495 |
| Series PT 1991, 2.57% (Liquidity Facility Merrill Lynch & | | | | | | |
| Co., Inc.) (c)(f)(g) | | | | 3,235 | | | | 3,235 |
| Series PT 2672, 2.57% (Liquidity Facility Dexia Cr. Local | | | | | | |
| de France) (c)(f)(g) | | | | 5,350 | | | | 5,350 |
| Series PT 736, 2.57% (Liquidity Facility Merrill Lynch & | | | | | | | | |
| Co., Inc.) (c)(f)(g) | | | | 4,645 | | | | 4,645 |
| Series Putters 1017, 2.53% (Liquidity Facility JPMorgan | | | | | | | | |
| Chase Bank) (c)(f)(g) | | | | 1,375 | | | | 1,375 |
See accompanying notes which are an integral part of the financial statements.
| Municipal Securities continued | | | | | | | | | | |
| | | | | | | Principal | | Value (Note 1) |
| | | | | Amount (000s) | | | | (000s) |
| District Of Columbia – continued | | | | | | | | | | |
| Metropolitan Washington Arpts. Auth. Sys. Rev.: – continued | | | | | | | | | | |
| Participating VRDN: | | | | | | | | | | |
| Series ROC II R195, 2.57% (Liquidity Facility Citibank | | | | | | | | | | |
| NA) (c)(f)(g) | | | | $ | | 5,995 | | $ | | 5,995 |
| Series Stars 126, 2.57% (Liquidity Facility BNP Paribas | | | | | | | | | | |
| SA) (c)(f)(g) | | | | | | 20,000 | | | | 20,000 |
| Series Stars 130, 2.57% (Liquidity Facility BNP Paribas | | | | | | | | | | |
| SA) (c)(f)(g) | | | | | | 5,170 | | | | 5,170 |
| Series TOC 05 E, 2.56% (Liquidity Facility Goldman Sachs | | | | | | | | |
| Group, Inc.) (c)(f)(g) | | | | | | 19,200 | | | | 19,200 |
| 2.42% (FSA Insured), VRDN (c)(f) | | | | | | 125,945 | | | | 125,945 |
| | | | | | | | | | | 317,525 |
| |
| Florida – 3.7% | | | | | | | | | | |
| Broward County Arpt. Sys. Rev. Participating VRDN Series | | | | | | | | | | |
| Stars 93, 2.57% (Liquidity Facility BNP Paribas SA) (c)(f)(g) | | . | | | | 12,140 | | | | 12,140 |
| Broward County Fin. Auth. Multi-family Hsg. Rev. (Sanctuary | | | | | | | | | | |
| Apts Proj.) Series A, 2.53%, LOC Fannie Mae, VRDN (c)(f) | | . | | | | 16,230 | | | | 16,230 |
| Canaveral Port Auth. Rev. Participating VRDN Series ROC II | | | | | | | | | | |
| R2025, 2.53% (Liquidity Facility Citigroup Global Markets | | | | | | | | | | |
| Hldgs., Inc.) (c)(g) | | | | | | 7,765 | | | | 7,765 |
| Cape Coral Gen. Oblig. 2.63% 10/26/05, LOC Bank of | | | | | | | | | | |
| America NA, CP | | | | | | 10,100 | | | | 10,100 |
| Clipper Tax-Exempt Ctfs. Trust Participating VRDN Series | | | | | | | | | | |
| Clipper 05 17, 2.61% (Liquidity Facility Merrill Lynch & Co., | | | | | | | | |
| Inc.) (c)(f)(g) | | | | | | 17,225 | | | | 17,225 |
| Deltona Util. Sys. Rev. Participating VRDN Series PT 2024, | | | | | | | | | | |
| 2.52% (Liquidity Facility Merrill Lynch & Co., Inc.) (c)(g) | | | | | | 5,205 | | | | 5,205 |
| Escambia County Hsg. Fin. Rev. Participating VRDN Series RF | | | | | | | | | | |
| 00 15, 2.64% (Liquidity Facility Bank of New York, New | | | | | | | | | | |
| York) (c)(f)(g) | | | | | | 6,675 | | | | 6,675 |
| Florida Board of Ed. Cap. Outlay Participating VRDN Series | | | | | | | | | | |
| EGL 7050031, 2.53% (Liquidity Facility Citibank NA) (c)(g) . | | | | 16,310 | | | | 16,310 |
| Florida Board of Ed. Pub. Ed. Participating VRDN: | | | | | | | | | | |
| Series EGL 7050054, 2.53% (Liquidity Facility Citibank | | | | | | | | | | |
| NA) (c)(g) | | | | | | 17,840 | | | | 17,840 |
| Series Putters 473, 2.53% (Liquidity Facility JPMorgan Chase | | | | | | | | |
| Bank) (c)(g) | | | | | | 6,965 | | | | 6,965 |
| Series ROC II R2208, 2.53% (Liquidity Facility Citigroup | | | | | | | | | | |
| Global Markets Hldgs., Inc.) (c)(g) | | | | | | 4,000 | | | | 4,000 |
| Florida Dept. of Envir. Protection Preservation Rev. | | | | | | | | | | |
| Participating VRDN Series Floaters 722, 2.52% (Liquidity | | | | | | | | | | |
| Facility Morgan Stanley) (c)(g) | | | | | | 3,680 | | | | 3,680 |
See accompanying notes which are an integral part of the financial statements.
Annual Report
| Investments continued | | | | | | | | | | |
| |
| |
| Municipal Securities continued | | | | | | | | |
| | | | | | | Principal | | Value (Note 1) |
| | | | | Amount (000s) | | | | (000s) |
| Florida – continued | | | | | | | | | | |
| Florida Hsg. Fin. Corp. Multi-family Mtg. Rev.: | | | | | | | | |
| (Avalon Reserve Apts. Proj.) Series 2003 R1, 2.53%, LOC | | | | | | | | |
| Fannie Mae, VRDN (c)(f) | | | | $ | | 7,500 | | $ | | 7,500 |
| (Lynn Lake Apts. Proj.) Series B1, 2.57%, LOC Freddie Mac, | | | | | | | | |
| VRDN (c)(f) | | | | | | 10,100 | | | | 10,100 |
| Florida Hsg. Fin. Corp. Rev. (Riverside Apts. Proj.) Series 2000 | | | | | | | | |
| 1, 2.4%, LOC Bank of America NA, VRDN (c)(f) | | | | 8,000 | | | | 8,000 |
| Gainesville Utils. Sys. Rev. 2.85% 10/6/05, CP | | | | 19,600 | | | | 19,600 |
| Hillsborough County Aviation Auth. Rev.: | | | | | | | | | | |
| Participating VRDN Series PT 745, 2.57% (Liquidity Facility | | | | | | | | |
| Svenska Handelsbanken AB) (c)(f)(g) | | | | | | 2,500 | | | | 2,500 |
| Series D: | | | | | | | | | | |
| 2.58% 9/15/05, LOC Landesbank Baden-Wuert, CP (f) | | | | 12,300 | | | | 12,300 |
| 2.6% 9/15/05, LOC Landesbank Baden-Wuert, CP (f) | | | | 3,000 | | | | 3,000 |
| Hillsborough County Hsg. Fin. Auth. Multi-family Rev. (Hunters | | | | | | | | |
| Run Apts. Proj.) Series 2002 A, 2.4%, LOC Fannie Mae, | | | | | | | | |
| VRDN (c)(f) | | | | | | 9,000 | | | | 9,000 |
| Jacksonville Aviation Auth. Rev.: | | | | | | | | | | |
| Series B1, 2.55% (FSA Insured), VRDN (c)(f) | | | | 26,050 | | | | 26,050 |
| Series B2, 2.4% (FSA Insured), VRDN (c)(f) | | | | 8,775 | | | | 8,775 |
| 2.4% (FGIC Insured), VRDN (c)(f) | | | | | | 15,500 | | | | 15,500 |
| Jacksonville Health Facilities Auth. Participating VRDN Series | | | | | | | | |
| ROC II R186, 2.53% (Liquidity Facility Citibank NA) (c)(g) | | | | 11,800 | | | | 11,800 |
| JEA Wtr. & Swr. Sys. Rev. Participating VRDN | | | | | | | | |
| Series Putters 805, 2.53% (Liquidity Facility JPMorgan Chase | | | | | | | | |
| Bank) (c)(g) | | | | | | 5,470 | | | | 5,470 |
| Lakeland Wtr. & Wastewtr. Rev. Participating VRDN Series | | | | | | | | |
| Putters 481, 2.53% (Liquidity Facility JPMorgan Chase | | | | | | | | |
| Bank) (c)(g) | | | | | | 4,995 | | | | 4,995 |
| Lee County Arpt. Rev. Participating VRDN | | | | | | | | | | |
| Series PT 2269, 2.57% (Liquidity Facility Merrill Lynch & Co., | | | | | | | | |
| Inc.) (c)(f)(g) | | | | | | 2,880 | | | | 2,880 |
| Lee County Trans. Facilities Participating VRDN Series ROC II | | | | | | | | |
| R342, 2.53% (Liquidity Facility Citibank NA) (c)(g) | | | | 8,265 | | | | 8,265 |
| Miami-Dade County Aviation Rev.: | | | | | | | | | | |
| Participating VRDN Series 2003 L22J, 2.53% (Liquidity | | | | | | | | |
| Facility Lehman Brothers Hldgs., Inc.) (c)(f)(g) | | | | 9,445 | | | | 9,445 |
| Series 2005 A: | | | | | | | | | | |
| 2.58% 10/3/05, LOC BNP Paribas SA, LOC Dexia Cr. | | | | | | | | |
| Local de France, CP (f) | | | | | | 16,000 | | | | 16,000 |
| 2.58% 10/11/05, LOC BNP Paribas SA, LOC Dexia Cr. | | | | | | | | |
| Local de France, CP (f) | | | | | | 17,000 | | | | 17,000 |
| |
| |
| See accompanying notes which are an integral part of the financial statements. | | | | |
| |
| Annual Report | | 18 | | | | | | | | |
| Municipal Securities continued | | | | | | | | |
| | | | | Principal | | Value (Note 1) |
| | | Amount (000s) | | | | (000s) |
| Florida – continued | | | | | | | | |
| Miami-Dade County Edl. Facilities Auth. Rev. Participating | | | | | | | | |
| VRDN Series PT 2097, 2.52% (Liquidity Facility Merrill Lynch | | | | | | | | |
| & Co., Inc.) (c)(g) | | $ | | 1,425 | | $ | | 1,425 |
| Miami-Dade County Health Facilities Auth. Hosp. Rev. | | | | | | | | |
| Participating VRDN Series PT 884, 2.52% (Liquidity Facility | | | | | | | | |
| Merrill Lynch & Co., Inc.) (c)(g) | | | | 5,600 | | | | 5,600 |
| Miami-Dade County Wtr. & Swr. Rev. Bonds 4% 10/1/05 | | | | | | | | |
| (MBIA Insured) | | | | 7,365 | | | | 7,373 |
| Orange County Hsg. Fin. Auth. Homeowner Rev. Participating | | | | | | | | |
| VRDN: | | | | | | | | |
| Series PT 2106, 2.58% (Liquidity Facility Merrill Lynch & Co., | | | | | | | | |
| Inc.) (c)(f)(g) | | | | 4,300 | | | | 4,300 |
| Series PT 2411, 2.58% (Liquidity Facility Merrill Lynch & Co., | | | | | | | | |
| Inc.) (c)(f)(g) | | | | 19,100 | | | | 19,100 |
| Orange County Hsg. Fin. Auth. Multi-family Rev. (West Point | | | | | | | | |
| Villas Apt. Proj.) Series 2000 F, 2.53%, LOC Fannie Mae, | | | | | | | | |
| VRDN (c)(f) | | | | 5,750 | | | | 5,750 |
| Orange County Indl. Dev. Auth. Indl. Dev. Rev. (Advanced | | | | | | | | |
| Drainage Sys., Inc. Proj.) 2.62%, LOC Nat’l. City Bank, | | | | | | | | |
| VRDN (c)(f) | | | | 1,100 | | | | 1,100 |
| Orange County Sales Tax Rev. Participating VRDN Series PT | | | | | | | | |
| 1557, 2.52% (Liquidity Facility Merrill Lynch & Co., | | | | | | | | |
| Inc.) (c)(g) | | | | 9,685 | | | | 9,685 |
| Orlando & Orange County Expressway Auth. Rev.: | | | | | | | | |
| Series 2003 C1, 2.51% (FSA Insured), VRDN (c) | | | | 41,335 | | | | 41,335 |
| Series 2003 C3, 2.51% (FSA Insured), VRDN (c) | | | | 13,750 | | | | 13,750 |
| Osceola County Hsg. Fin. Auth. Multi-family Rev. (Regatta Bay | | | | | | | | |
| Apts. Proj.) Series A, 2.4%, LOC Fannie Mae, VRDN (c)(f) | | | | 3,700 | | | | 3,700 |
| Palm Beach County School Board Ctfs. of Prtn. Participating | | | | | | | | |
| VRDN Series ROC II R297, 2.53% (Liquidity Facility Citibank | | | | | | | | |
| NA) (c)(g) | | | | 6,300 | | | | 6,300 |
| Palm Beach County School District 2.4% 9/6/05, LOC Bank of | | | | | | | | |
| America NA, CP | | | | 17,900 | | | | 17,900 |
| Pinellas County Hsg. Fin. Auth. Single Family Mortgage Rev. | | | | | | | | |
| Participating VRDN: | | | | | | | | |
| Series PT 2239, 2.58% (Liquidity Facility Merrill Lynch & Co., | | | | | | | | |
| Inc.) (c)(f)(g) | | | | 5,690 | | | | 5,690 |
| Series PT 993, 2.58% (Liquidity Facility Merrill Lynch & Co., | | | | | | | | |
| Inc.) (c)(f)(g) | | | | 3,040 | | | | 3,040 |
| Polk County Hsg. Fin. Auth. Multi-family Hsg. Rev. (Cambridge | | | | | | | | |
| Cove Apts. Proj.) Series 2001, 2.4%, LOC AmSouth Bank | | | | | | | | |
| NA, Birmingham, VRDN (c)(f) | | | | 4,900 | | | | 4,900 |
See accompanying notes which are an integral part of the financial statements.
19 Annual Report
| Investments continued | | | | | | | | |
| |
| |
| Municipal Securities continued | | | | | | | | |
| | | | | Principal | | Value (Note 1) |
| | | Amount (000s) | | | | (000s) |
| Florida – continued | | | | | | | | |
| Putnam County Dev. Auth. Poll. Cont. Rev.: | | | | | | | | |
| Bonds (Seminole Elec. Coop., Inc. Proj.) Series 1984 D, | | | | | | | | |
| 2.65%, tender 12/15/05 (Nat’l. Rural Utils. Coop. Fin. | | | | | | | | |
| Corp. Guaranteed) (c) | | $ | | 11,550 | | $ | | 11,550 |
| (Seminole Elec. Coop., Inc. Proj.) Series 1984 H2, 2.65% | | | | | | | | |
| (Nat’l. Rural Utils. Coop. Fin. Corp. Guaranteed), | | | | | | | | |
| VRDN (c) | | | | 6,050 | | | | 6,050 |
| Sunshine State Govt. Fing. Commission Rev.: | | | | | | | | |
| Series 2001 G, 2.6% 9/15/05 (FGIC Insured), CP (f) | | | | 12,095 | | | | 12,095 |
| Series G: | | | | | | | | |
| 2.85% 10/6/05 (FGIC Insured), CP | | | | 21,025 | | | | 21,025 |
| 2.87% 10/6/05 (FGIC Insured), CP (f) | | | | 7,500 | | | | 7,500 |
| 2.9% 9/16/05 (FGIC Insured), CP (f) | | | | 21,295 | | | | 21,295 |
| Tampa Bay Wtr. Util. Sys. Rev. 2.55%, LOC Bank of America | | | | | | | | |
| NA, VRDN (c)(f) | | | | 51,400 | | | | 51,400 |
| | | | | | | | | 604,178 |
| |
| Georgia – 4.2% | | | | | | | | |
| Atlanta Arpt. Rev. Participating VRDN: | | | | | | | | |
| Series Merlots 00 CCC, 2.45% (Liquidity Facility Wachovia | | | | | | | | |
| Bank NA) (c)(f)(g) | | | | 5,000 | | | | 5,000 |
| Series MS 00 313, 2.57% (Liquidity Facility Morgan | | | | | | | | |
| Stanley) (c)(f)(g) | | | | 4,090 | | | | 4,090 |
| Series MS 00 375, 2.52% (Liquidity Facility Morgan | | | | | | | | |
| Stanley) (c)(g) | | | | 14,345 | | | | 14,345 |
| Series MT 43, 2.57% (Liquidity Facility Landesbank | | | | | | | | |
| Hessen-Thuringen) (c)(f)(g) | | | | 7,530 | | | | 7,530 |
| Series PT 2501, 2.57% (Liquidity Facility Merrill Lynch & Co., | | | | | | | | |
| Inc.) (c)(f)(g) | | | | 24,155 | | | | 24,155 |
| Series PT 901, 2.57% (Liquidity Facility BNP Paribas | | | | | | | | |
| SA) (c)(f)(g) | | | | 12,000 | | | | 12,000 |
| Atlanta Gen. Oblig. Participating VRDN Series SG 123, | | | | | | | | |
| 2.53% (Liquidity Facility Societe Generale) (c)(g) | | | | 9,845 | | | | 9,845 |
| Atlanta Urban Residential Fin. Auth. Multi-family Hsg. Rev.: | | | | | | | | |
| (Big Bethel Village Proj.) 2.41%, LOC Suntrust Bank, | | | | | | | | |
| VRDN (c)(f) | | | | 4,475 | | | | 4,475 |
| (Brentwood Creek Apts. Proj.) Series 1999, 2.54%, LOC | | | | | | | | |
| Suntrust Bank, VRDN (c)(f) | | | | 4,425 | | | | 4,425 |
| (Carver Redev. Phase III Proj.) 2.41%, LOC Suntrust Bank, | | | | | | | | |
| VRDN (c)(f) | | | | 6,500 | | | | 6,500 |
| (Carver Redev. Proj.) Series 2000, 2.54%, LOC Suntrust | | | | | | | | |
| Bank, VRDN (c)(f) | | | | 2,955 | | | | 2,955 |
| (Collegetown at Harris Homes Phase I Proj.) 2.57%, LOC | | | | | | | | |
| Fannie Mae, VRDN (c)(f) | | | | 5,650 | | | | 5,650 |
See accompanying notes which are an integral part of the financial statements.
| Municipal Securities continued | | | | | | | | |
| | | | | Principal | | Value (Note 1) |
| | | Amount (000s) | | | | (000s) |
| Georgia – continued | | | | | | | | |
| Atlanta Urban Residential Fin. Auth. Multi-family Hsg. Rev.: - | | | | | | | | |
| continued | | | | | | | | |
| (Peaks at West Atlanta Proj.) Series 2001, 2.41%, LOC | | | | | | | | |
| Suntrust Bank, VRDN (c)(f) | | $ | | 4,910 | | $ | | 4,910 |
| (Villages of Cascade Proj.) Series 1997 A, 2.54%, LOC | | | | | | | | |
| Suntrust Bank, VRDN (c)(f) | | | | 6,285 | | | | 6,285 |
| 2.54%, LOC Wachovia Bank NA, VRDN (c)(f) | | | | 9,600 | | | | 9,600 |
| Atlanta Wtr. & Wastewtr. Rev. Participating VRDN: | | | | | | | | |
| Series BA 02 A, 2.59% (Liquidity Facility Bank of America | | | | | | | | |
| NA) (c)(g) | | | | 4,520 | | | | 4,520 |
| Series EGL 04 2014 Class A, 2.53% (Liquidity Facility | | | | | | | | |
| Citibank NA) (c)(g) | | | | 4,950 | | | | 4,950 |
| Series PT 2373, 2.53% (Liquidity Facility Dexia Cr. Local de | | | | | | | | |
| France) (c)(g) | | | | 19,945 | | | | 19,945 |
| Series ROC II R 324, 2.53% (Liquidity Facility Citibank | | | | | | | | |
| NA) (c)(g) | | | | 10,055 | | | | 10,055 |
| Bartow County Dev. Auth. Multi-family Hsg. Rev. (Somerset | | | | | | | | |
| Cove Apts. Proj.) 2.6%, LOC PNC Bank NA, Pittsburgh, | | | | | | | | |
| VRDN (c)(f) | | | | 5,000 | | | | 5,000 |
| Bibb County Dev. Auth. Solid Waste Disp. Rev. (Swift Creek | | | | | | | | |
| Envir. Proj.) 2.54%, LOC Suntrust Bank, VRDN (c)(f) | | | | 5,100 | | | | 5,100 |
| Bulloch County Dev. Auth. Indl. Dev. Rev. (Gold Kist, Inc. Proj.) | | | | | | | | |
| Series 1995, 2.54%, LOC Wachovia Bank NA, VRDN (c)(f) . | | | | 6,400 | | | | 6,400 |
| Burke County Indl. Dev. Auth. Poll. Cont. Rev.: | | | | | | | | |
| Bonds (Georgia Pwr. Co. Plant Vogtle Proj.) First Series | | | | | | | | |
| 2000, 2.83%, tender 5/5/06 (c) | | | | 20,725 | | | | 20,725 |
| Participating VRDN: | | | | | | | | |
| Series PA 1315, 2.53% (Liquidity Facility Merrill Lynch & | | | | | | | | |
| Co., Inc.) (c)(g) | | | | 6,000 | | | | 6,000 |
| Series ROC II R413, 2.53% (Liquidity Facility Citibank | | | | | | | | |
| NA) (c)(g) | | | | 5,320 | | | | 5,320 |
| Canton Hsg. Auth. Multi-family Hsg. Rev. (Canton Mill Lofts | | | | | | | | |
| Proj.) Series 1999, 2.62%, LOC Branch Banking & Trust Co., | | | | | | | | |
| VRDN (c)(f) | | | | 13,305 | | | | 13,305 |
| Clayton County Dev. Auth. Spl. Facilities Rev. (Delta Air Lines, | | | | | | | | |
| Inc. Proj.): | | | | | | | | |
| Series 2000 B, 2.44%, LOC Gen. Elec. Cap. Corp., | | | | | | | | |
| VRDN (c)(f) | | | | 20,900 | | | | 20,900 |
| Series 2000 C, 2.44%, LOC Gen. Elec. Cap. Corp., | | | | | | | | |
| VRDN (c)(f) | | | | 48,000 | | | | 48,000 |
| Cobb County Dev. Auth. Univ. Facilities Rev. Participating | | | | | | | | |
| VRDN Series MS 983, 2.52% (Liquidity Facility Morgan | | | | | | | | |
| Stanley) (c)(g) | | | | 12,964 | | | | 12,964 |
| |
| See accompanying notes which are an integral part of the financial statements. | | | | |
| |
| 21 | | | | | | Annual Report |
| Investments continued | | | | | | | | |
| |
| |
| Municipal Securities continued | | | | | | | | |
| | | | | Principal | | Value (Note 1) |
| | | Amount (000s) | | | | (000s) |
| Georgia – continued | | | | | | | | |
| Columbia Hsg. Auth. Multi-family Hsg. Rev. (Eagles Trace Apts. | | | | | | | | |
| Proj.) 2.41%, LOC Suntrust Bank, VRDN (c)(f) | | $ | | 6,200 | | $ | | 6,200 |
| Covington Hsg. Auth. Multi-family Rev. (Wellington Ridge Apt. | | | | | | | | |
| Proj.) 2.4%, LOC Freddie Mac, VRDN (c)(f) | | | | 10,335 | | | | 10,335 |
| DeKalb County Dev. Auth. Indl. Dev. Rev. (Qualex Proj.) | | | | | | | | |
| 2.62%, LOC Comerica Bank, Texas, VRDN (c)(f) | | | | 1,800 | | | | 1,800 |
| DeKalb County Hsg. Auth. Multi-family Hsg. Rev.: | | | | | | | | |
| (Villas of Friendly Heights Proj.) Series 2001, 2.54%, LOC | | | | | | | | |
| Suntrust Bank, VRDN (c)(f) | | | | 3,575 | | | | 3,575 |
| (Wesley Club Apts. Proj.) 2.41%, LOC Suntrust Bank, | | | | | | | | |
| VRDN (c)(f) | | | | 5,900 | | | | 5,900 |
| Fulton County Bldg. Auth. Rev. Participating VRDN Series | | | | | | | | |
| Putters 323, 2.53% (Liquidity Facility JPMorgan Chase | | | | | | | | |
| Bank) (c)(g) | | | | 11,670 | | | | 11,670 |
| Fulton County Hsg. Auth. Multi-family Hsg. Rev. (Walton Falls | | | | | | | | |
| Apt. Proj.) Series 1999, 2.54%, LOC Wachovia Bank NA, | | | | | | | | |
| VRDN (c)(f) | | | | 18,000 | | | | 18,000 |
| Fulton DeKalb Hosp. Auth. Hosp. Rev. Participating VRDN | | | | | | | | |
| Series MT 93, 2.53% (Liquidity Facility Merrill Lynch & Co., | | | | | | | | |
| Inc.) (c)(g) | | | | 5,000 | | | | 5,000 |
| Gainesville & Hall County Dev. Auth. Indl. Exempt Facility Rev. | | | | | | | | |
| (Spout Springs Wtr. LLC Proj.) 2.55%, LOC Bank of America | | | | | | | | |
| NA, VRDN (c)(f) | | | | 10,300 | | | | 10,300 |
| Georgia Hsg. & Fin. Auth. Rev. Participating VRDN Series PT | | | | | | | | |
| 504, 2.57% (Liquidity Facility Merrill Lynch & Co., | | | | | | | | |
| Inc.) (c)(f)(g) | | | | 6,375 | | | | 6,375 |
| Georgia Muni. Elec. Auth.: | | | | | | | | |
| Bonds (Gen. Resolution Projs.) Series 1985 A, 2.7% tender | | | | | | | | |
| 9/6/05, LOC Landesbank Hessen-Thuringen, CP mode | | | | 5,000 | | | | 5,000 |
| Series A, 2.7% 9/6/05, LOC Bayerische Landesbank | | | | | | | | |
| Girozentrale, LOC WestLB AG, CP | | | | 9,718 | | | | 9,718 |
| Georgia Muni. Elec. Auth. Pwr. Rev. Participating VRDN: | | | | | | | | |
| Series PA 786, 2.54% (Liquidity Facility Merrill Lynch & Co., | | | | | | | | |
| Inc.) (c)(g) | | | | 4,595 | | | | 4,595 |
| Series PT 1821, 2.53% (Liquidity Facility WestLB AG) (c)(g) . | | | | 9,270 | | | | 9,270 |
| Georgia Port Auth. Rev.: | | | | | | | | |
| (Colonel’s Island Term. Proj.) 2.54%, LOC Suntrust Bank, | | | | | | | | |
| VRDN (c)(f) | | | | 3,100 | | | | 3,100 |
| (Mayor’s Point Term. Proj.) Series 1992, 2.54%, LOC | | | | | | | | |
| Suntrust Bank, VRDN (c)(f) | | | | 1,400 | | | | 1,400 |
| Gwinnett County Dev. Auth. Ctfs. of Prtn. Participating VRDN: | | | | | | | | |
| Series ROC II R6009 2.53% (Liquidity Facility Citibank | | | | | | | | |
| NA) (c)(g) | | | | 9,200 | | | | 9,200 |
See accompanying notes which are an integral part of the financial statements.
Annual Report
| Municipal Securities continued | | | | | | | | |
| | | | | Principal | | Value (Note 1) |
| | | Amount (000s) | | | | (000s) |
| Georgia – continued | | | | | | | | |
| Gwinnett County Dev. Auth. Ctfs. of Prtn. Participating VRDN: | | | | | | | | |
| – continued | | | | | | | | |
| Series Stars 87, 2.53% (Liquidity Facility BNP Paribas | | | | | | | | |
| SA) (c)(g) | | $ | | 16,070 | | $ | | 16,070 |
| Gwinnett County Dev. Auth. Indl. Dev. Rev. (Curtis 1000, Inc. | | | | | | | | |
| Proj.) Series 1996, 2.54%, LOC Wells Fargo Bank NA, San | | | | | | | | |
| Francisco, VRDN (c)(f) | | | | 6,260 | | | | 6,260 |
| Gwinnett County Hsg. Auth. Multi-family Hsg. Rev.: | | | | | | | | |
| (Herrington Mill Apts. Proj.) 2.41%, LOC Suntrust Bank, | | | | | | | | |
| VRDN (c)(f) | | | | 8,000 | | | | 8,000 |
| (Herrington Woods Apt. Proj.) Series 1996 A, 2.39%, LOC | | | | | | | | |
| Fannie Mae, VRDN (c)(f) | | | | 13,335 | | | | 13,335 |
| Henry County Dev. Auth. Solid Waste Rev. (Atlas Roofing | | | | | | | | |
| Corp. Proj.) Series 1997, 2.54%, LOC Fleet Nat’l. Bank, | | | | | | | | |
| VRDN (c)(f) | | | | 12,250 | | | | 12,250 |
| Henry County Wtr. & Swr. Auth. Rev. Participating VRDN | | | | | | | | |
| Series PT 2583, 2.53% (Liquidity Facility Dexia Cr. Local de | | | | | | | | |
| France) (c)(g) | | | | 7,140 | | | | 7,140 |
| Liberty County Indl. Auth. (Hy Sil Manufacturing Co., Inc. | | | | | | | | |
| Proj.) Series 2001 A, 2.54%, LOC Suntrust Bank, | | | | | | | | |
| VRDN (c)(f) | | | | 2,250 | | | | 2,250 |
| Loganville Hsg. Auth. Multi-family Hsg. Rev. (Alexander | | | | | | | | |
| Crossing Apts. Proj.) 2.62%, LOC AmSouth Bank NA, | | | | | | | | |
| Birmingham, VRDN (c)(f) | | | | 15,900 | | | | 15,900 |
| Macon-Bibb County Indl. Auth. Dev. (Diamond Plastics Corp. | | | | | | | | |
| Proj.) Series 1999, 2.55%, LOC Bank of America NA, | | | | | | | | |
| VRDN (c)(f) | | | | 4,300 | | | | 4,300 |
| Metropolitan Atlanta Rapid Transit Series 2004 B, 2.5% | | | | | | | | |
| 9/9/05, LOC Dexia Cr. Local de France, CP | | | | 22,700 | | | | 22,700 |
| Metropolitan Atlanta Rapid Transit Auth. Sales Tax Rev. | | | | | | | | |
| Participating VRDN Series SG 57, 2.53% (Liquidity Facility | | | | | | | | |
| Societe Generale) (c)(g) | | | | 13,605 | | | | 13,605 |
| Miller County Dev. Auth. Indl. Dev. (Birdsong Corp. Proj.) | | | | | | | | |
| 2.54%, LOC Suntrust Bank, VRDN (c)(f) | | | | 2,500 | | | | 2,500 |
| Monroe County Dev. Auth. Poll. Cont. Rev. Bonds Second | | | | | | | | |
| Series 1995, 2.83%, tender 5/5/06 (c) | | | | 12,500 | | | | 12,500 |
| Paulding County Indl. Bldg. Auth. Rev. (Cadillac Products, Inc. | | | | | | | | |
| Proj.) Series 1994, 2.62%, LOC JPMorgan Chase Bank, | | | | | | | | |
| VRDN (c)(f) | | | | 1,600 | | | | 1,600 |
| Roswell Hsg. Auth. Multi-family Hsg. Rev.: | | | | | | | | |
| (Park Ridge Apts. Proj.) 2.56%, LOC Fannie Mae, | | | | | | | | |
| VRDN (c)(f) | | | | 8,200 | | | | 8,200 |
| (Walton Centennial Proj.) Series A, 2.54%, LOC Wachovia | | | | | | | | |
| Bank NA, VRDN (c)(f) | | | | 19,200 | | | | 19,200 |
See accompanying notes which are an integral part of the financial statements.
23 Annual Report
| Investments continued | | | | | | | | |
| |
| |
| Municipal Securities continued | | | | | | | | |
| | | | | Principal | | Value (Note 1) |
| | | Amount (000s) | | | | (000s) |
| Georgia – continued | | | | | | | | |
| Savannah Econ. Dev. Auth. Rev.: | | | | | | | | |
| (Home Depot, Inc. Proj.) Series 1995 A, 2.54%, VRDN (c)(f) | | $ | | 17,100 | | $ | | 17,100 |
| (Kaolin Terminals, Inc. Proj.) 2.55%, LOC Bank of America | | | | | | | | |
| NA, VRDN (c)(f) | | | | 17,950 | | | | 17,950 |
| Savannah Hsg. Auth. Multi-family Hsg. Rev.: | | | | | | | | |
| (Indigo Pointe Apts. Proj.) Series 2001 A, 2.54%, LOC | | | | | | | | |
| Suntrust Bank, VRDN (c)(f) | | | | 3,500 | | | | 3,500 |
| (Live Oak Plantation Proj.) Series 2001 A1, 2.54%, LOC | | | | | | | | |
| Suntrust Bank, VRDN (c)(f) | | | | 2,500 | | | | 2,500 |
| Sugar Hill Hsg. Auth. Multi-family Rev. (Level Creek Apts. Proj.) | | | | | | | | |
| Series 1997, 2.62%, LOC AmSouth Bank NA, Birmingham, | | | | | | | | |
| VRDN (c)(f) | | | | 12,790 | | | | 12,790 |
| Summerville Indl. Dev. Auth. Facility Rev. (Image Ind., Inc. | | | | | | | | |
| Proj.) Series 1997, 2.59%, LOC Wachovia Bank NA, | | | | | | | | |
| VRDN (c)(f) | | | | 19,000 | | | | 19,000 |
| Wayne County Dev. Auth. Solid Waste Disp. Rev. (Republic | | | | | | | | |
| Svcs. of Georgia LP Proj.) Series 2000, 2.53%, LOC Suntrust | | | | | | | | |
| Bank, VRDN (c)(f) | | | | 5,800 | | | | 5,800 |
| Wayne County Indl. Dev. Auth. Wtr. Disp. Rev. (Rayonier Proj.) | | | | | | | | |
| Series 2000, 2.41%, LOC Suntrust Bank, VRDN (c)(f) | | | | 15,000 | | | | 15,000 |
| Worth County Indl. Dev. Auth. Indl. Dev. Rev. (Seabrook | | | | | | | | |
| Peanut Co. Proj.) Series 1996 B, 2.54%, LOC Suntrust Bank, | | | | | | | | |
| VRDN (c)(f) | | | | 3,200 | | | | 3,200 |
| | | | | | | | | 689,037 |
| |
| Hawaii – 0.6% | | | | | | | | |
| Hawaii Arpts. Sys. Rev. Participating VRDN: | | | | | | | | |
| Series MSTC 01 147 Class A, 2.43% (Liquidity Facility Bear | | | | | | | | |
| Stearns Companies, Inc.) (c)(f)(g) | | | | 11,185 | | | | 11,185 |
| Series PA 765, 2.57% (Liquidity Facility Merrill Lynch & Co., | | | | | | | | |
| Inc.) (c)(f)(g) | | | | 4,995 | | | | 4,995 |
| Series PT 830, 2.57% (Liquidity Facility Merrill Lynch & Co., | | | | | | | | |
| Inc.) (c)(f)(g) | | | | 2,215 | | | | 2,215 |
| Series ROC II R59, 2.57% (Liquidity Facility Citibank | | | | | | | | |
| NA) (c)(f)(g) | | | | 7,495 | | | | 7,495 |
| Hawaii Dept. of Budget & Fin. Spl. Purp. Rev. Participating | | | | | | | | |
| VRDN: | | | | | | | | |
| Series PA 1062, 2.57% (Liquidity Facility Merrill Lynch & | | | | | | | | |
| Co., Inc.) (c)(f)(g) | | | | 6,370 | | | | 6,370 |
| Series PA 1224, 2.57% (Liquidity Facility Merrill Lynch & | | | | | | | | |
| Co., Inc.) (c)(f)(g) | | | | 4,670 | | | | 4,670 |
| Series PA 1244, 2.57% (Liquidity Facility Merrill Lynch & | | | | | | | | |
| Co., Inc.) (c)(f)(g) | | | | 2,500 | | | | 2,500 |
See accompanying notes which are an integral part of the financial statements.
Annual Report
| Municipal Securities continued | | | | | | | | |
| | | | | Principal | | Value (Note 1) |
| | | Amount (000s) | | | | (000s) |
| Hawaii – continued | | | | | | | | |
| Hawaii Dept. of Budget & Fin. Spl. Purp. Rev. Participating | | | | | | | | |
| VRDN: – continued | | | | | | | | |
| Series PA 795R, 2.57% (Liquidity Facility Merrill Lynch & | | | | | | | | |
| Co., Inc.) (c)(f)(g) | | $ | | 8,900 | | $ | | 8,900 |
| Hawaii Gen. Oblig. Participating VRDN: | | | | | | | | |
| Series EGL 00 1101, 2.53% (Liquidity Facility Citibank NA, | | | | | | | | |
| New York) (c)(g) | | | | 6,470 | | | | 6,470 |
| Series MS 738, 2.52% (Liquidity Facility Morgan | | | | | | | | |
| Stanley) (c)(g) | | | | 11,745 | | | | 11,745 |
| Series PT 2965, 2.53% (Liquidity Facility Merrill Lynch & Co., | | | | | | | | |
| Inc.) (c)(g) | | | | 26,820 | | | | 26,820 |
| Hawaii Hsg. Fin. & Dev. Corp. Single Family Mtg. Purp. Rev. | | | | | | | | |
| Participating VRDN Series Merlots 01 A15, 2.45% (Liquidity | | | | | | | | |
| Facility Wachovia Bank NA) (c)(f)(g) | | | | 3,465 | | | | 3,465 |
| Honolulu City and County Wastewtr. Sys. Participating VRDN | | | | | | | | |
| Series PT 3084, 2.53% (Liquidity Facility Merrill Lynch & Co., | | | | | | | | |
| Inc.) (c)(g) | | | | 5,375 | | | | 5,375 |
| | | | | | | | | 102,205 |
| |
| Idaho – 0.2% | | | | | | | | |
| Idaho Hsg. & Fin. Assoc.: | | | | | | | | |
| Participating VRDN: | | | | | | | | |
| Series PA 145A, 2.57% (Liquidity Facility Merrill Lynch & | | | | | | | | |
| Co., Inc.) (c)(f)(g) | | | | 466 | | | | 466 |
| Series PT 1152, 2.57% (Liquidity Facility Merrill Lynch & | | | | | | | | |
| Co., Inc.) (c)(f)(g) | | | | 1,580 | | | | 1,580 |
| Series 2003 D, 2.5% (Liquidity Facility Lloyds TSB Bank PLC), | | | | | | | | |
| VRDN (c)(f) | | | | 14,075 | | | | 14,075 |
| Series 2003 E, 2.5% (Liquidity Facility Lloyds TSB Bank PLC), | | | | | | | | |
| VRDN (c)(f) | | | | 8,025 | | | | 8,025 |
| Series D Class I, 2.5% (Liquidity Facility Lloyds TSB Bank | | | | | | | | |
| PLC), VRDN (c)(f) | | | | 10,000 | | | | 10,000 |
| Idaho Hsg. & Fin. Assoc. Hsg. Rev. (Assisted Living Concepts | | | | | | | | |
| Proj.) Series 1997, 2.59%, LOC U.S. Bank NA, Minnesota, | | | | | | | | |
| VRDN (c)(f) | | | | 965 | | | | 965 |
| | | | | | | | | 35,111 |
| |
| Illinois – 7.4% | | | | | | | | |
| Aurora Single Family Mtg. Rev. Participating VRDN Series MS | | | | | | | | |
| 1152, 2.57% (Liquidity Facility Morgan Stanley) (c)(f)(g) | | | | 68,900 | | | | 68,900 |
| Bolingbrook Multi-family Hsg. Rev. (Amberton Apts. Proj.) | | | | | | | | |
| 2.6%, LOC Fannie Mae, VRDN (c)(f) | | | | 19,300 | | | | 19,300 |
| Carol Stream Multi-family Rev. (Saint Charles Square Proj.) | | | | | | | | |
| 2.5%, LOC Fannie Mae, VRDN (c)(f) | | | | 2,000 | | | | 2,000 |
| |
| See accompanying notes which are an integral part of the financial statements. | | | | |
| |
| 25 | | | | | | Annual Report |
| Investments continued | | | | | | | | |
| |
| |
| Municipal Securities continued | | | | | | | | |
| | | | | Principal | | Value (Note 1) |
| | | Amount (000s) | | | | (000s) |
| Illinois – continued | | | | | | | | |
| Chicago Arpt. Spl. Facilities Rev. (Centerpoint O’Hare Proj.) | | | | | | | | |
| 2.45%, LOC JPMorgan Chase Bank, VRDN (c)(f) | | $ | | 39,250 | | $ | | 39,250 |
| Chicago Board of Ed. Participating VRDN: | | | | | | | | |
| Series BA 96 BB, 2.59% (Liquidity Facility Bank of America | | | | | | | | |
| NA) (c)(g) | | | | 18,690 | | | | 18,690 |
| Series EGL 01 1309, 2.53% (Liquidity Facility Citibank NA, | | | | | | | | |
| New York) (c)(g) | | | | 11,205 | | | | 11,205 |
| Series Merlots 01 A47, 2.4% (Liquidity Facility Wachovia | | | | | | | | |
| Bank NA) (c)(g) | | | | 6,065 | | | | 6,065 |
| Series Merlots 05 A15, 2.4% (Liquidity Facility Wachovia | | | | | | | | |
| Bank NA) (c)(g) | | | | 11,465 | | | | 11,465 |
| Series Merlots 97 E, 2.4% (Liquidity Facility Wachovia Bank | | | | | | | | |
| NA) (c)(g) | | | | 8,700 | | | | 8,700 |
| Series Putters 975, 2.53% (Liquidity Facility Dresdner Bank | | | | | | | | |
| AG) (c)(g) | | | | 5,875 | | | | 5,875 |
| Chicago Gen. Oblig. Participating VRDN: | | | | | | | | |
| Series EGL 00 1308, 2.53% (Liquidity Facility Citibank NA, | | | | | | | | |
| New York) (c)(g) | | | | 9,900 | | | | 9,900 |
| Series EGL 98 1302, 2.53% (Liquidity Facility Citibank NA, | | | | | | | | |
| New York) (c)(g) | | | | 11,600 | | | | 11,600 |
| Series PT 3115, 2.53% (Liquidity Facility Merrill Lynch & Co., | | | | | | | | |
| Inc.) (c)(g) | | | | 21,175 | | | | 21,175 |
| Series Putters 510, 2.53% (Liquidity Facility JPMorgan Chase | | | | | | | | |
| Bank) (c)(g) | | | | 5,300 | | | | 5,300 |
| Chicago Indl. Dev. Rev.: | | �� | | | | | | |
| (Chicago Scenic Studios, Inc. Proj.) Series 2000, 2.66%, | | | | | | | | |
| LOC Harris NA, VRDN (c)(f) | | | | 3,695 | | | | 3,695 |
| (MRC Polymers, Inc. Proj.) Series 2001, 2.56%, LOC Lasalle | | | | | | | | |
| Bank NA, VRDN (c)(f) | | | | 5,940 | | | | 5,940 |
| Chicago O’Hare Int’l. Arpt. Rev. Participating VRDN: | | | | | | | | |
| Series BA 99 X2, 2.64% (Liquidity Facility Bank of America | | | | | | | | |
| NA) (c)(f)(g) | | | | 32,670 | | | | 32,670 |
| Series BA 99 X1, 2.64% (Liquidity Facility Bank of America | | | | | | | | |
| NA) (c)(f)(g) | | | | 14,995 | | | | 14,995 |
| Series Merlots 01 A85, 2.45% (Liquidity Facility Wachovia | | | | | | | | |
| Bank NA) (c)(f)(g) | | | | 5,720 | | | | 5,720 |
| Series MT 53, 2.57% (Liquidity Facility Landesbank | | | | | | | | |
| Hessen-Thuringen) (c)(f)(g) | | | | 16,650 | | | | 16,650 |
| Series MT 59, 2.57% (Liquidity Facility Merrill Lynch & Co., | | | | | | | | |
| Inc.) (c)(f)(g) | | | | 6,145 | | | | 6,145 |
| Series PA 1198, 2.57% (Liquidity Facility Merrill Lynch & | | | | | | | | |
| Co., Inc.) (c)(f)(g) | | | | 3,425 | | | | 3,425 |
See accompanying notes which are an integral part of the financial statements.
| Municipal Securities continued | | | | | | | | |
| | | | | Principal | | Value (Note 1) |
| | | Amount (000s) | | | | (000s) |
| Illinois – continued | | | | | | | | |
| Chicago O’Hare Int’l. Arpt. Rev. Participating VRDN: - | | | | | | | | |
| continued | | | | | | | | |
| Series PA 1199, 2.57% (Liquidity Facility Merrill Lynch & | | | | | | | | |
| Co., Inc.) (c)(f)(g) | | $ | | 7,000 | | $ | | 7,000 |
| Series PA 1200, 2.57% (Liquidity Facility Merrill Lynch & | | | | | | | | |
| Co., Inc.) (c)(f)(g) | | | | 2,250 | | | | 2,250 |
| Series PT 2345, 2.57% (Liquidity Facility Merrill Lynch & Co., | | | | | | | | |
| Inc.) (c)(f)(g) | | | | 2,640 | | | | 2,640 |
| Series PT 2718, 2.57% (Liquidity Facility Merrill Lynch & Co., | | | | | | | | |
| Inc.) (c)(f)(g) | | | | 6,190 | | | | 6,190 |
| Series PT 755, 2.57% (Liquidity Facility Merrill Lynch & Co., | | | | | | | | |
| Inc.) (c)(f)(g) | | | | 7,000 | | | | 7,000 |
| Series PT 756, 2.57% (Liquidity Facility Merrill Lynch & Co., | | | | | | | | |
| Inc.) (c)(f)(g) | | | | 7,990 | | | | 7,990 |
| Series PT 980, 2.57% (Liquidity Facility Merrill Lynch & Co., | | | | | | | | |
| Inc.) (c)(f)(g) | | | | 1,330 | | | | 1,330 |
| Series Putters 253, 2.56% (Liquidity Facility JPMorgan Chase | | | | | | | | |
| Bank) (c)(f)(g) | | | | 9,995 | | | | 9,995 |
| Series Putters 368Z, 2.56% (Liquidity Facility JPMorgan | | | | | | | | |
| Chase Bank) (c)(f)(g) | | | | 10,850 | | | | 10,850 |
| Series Putters 370, 2.56% (Liquidity Facility JPMorgan Chase | | | | | | | | |
| Bank) (c)(f)(g) | | | | 4,995 | | | | 4,995 |
| Series Putters 383, 2.56% (Liquidity Facility JPMorgan Chase | | | | | | | | |
| Bank) (c)(f)(g) | | | | 4,995 | | | | 4,995 |
| Series Putters 496, 2.56% (Liquidity Facility PNC Bank NA, | | | | | | | | |
| Pittsburgh) (c)(f)(g) | | | | 10,685 | | | | 10,685 |
| Series Putters 670, 2.56% (Liquidity Facility JPMorgan Chase | | | | | | | | |
| & Co.) (c)(f)(g) | | | | 7,430 | | | | 7,430 |
| Series Putters 845Z, 2.56% (Liquidity Facility JPMorgan | | | | | | | | |
| Chase Bank) (c)(f)(g) | | | | 14,640 | | | | 14,640 |
| Series ROC II R69, 2.57% (Liquidity Facility Citibank | | | | | | | | |
| NA) (c)(f)(g) | | | | 18,070 | | | | 18,070 |
| Series ROC II R70, 2.57% (Liquidity Facility Citibank | | | | | | | | |
| NA) (c)(f)(g) | | | | 3,570 | | | | 3,570 |
| Chicago O’Hare Int’l. Arpt. Spl. Facilities Rev. (O’Hare Tech | | | | | | | | |
| Ctr. II LLC Proj.) 2.57%, LOC Lasalle Bank NA, VRDN (c)(f) | | | | 10,500 | | | | 10,500 |
| Chicago Park District Participating VRDN Series PT 2935, | | | | | | | | |
| 2.53% (Liquidity Facility Merrill Lynch & Co., Inc.) (c)(g) | | | | 10,960 | | | | 10,960 |
| Chicago Pub. Bldg. Commission Bldg. Rev. Participating | | | | | | | | |
| VRDN: | | | | | | | | |
| Series PA 473, 2.53% (Liquidity Facility Merrill Lynch & Co., | | | | | | | | |
| Inc.) (c)(g) | | | | 4,195 | | | | 4,195 |
| Series PT 2041, 2.53% (Liquidity Facility Merrill Lynch & Co., | | | | | | | | |
| Inc.) (c)(g) | | | | 7,805 | | | | 7,805 |
See accompanying notes which are an integral part of the financial statements.
Annual Report
| Investments continued | | | | | | | | |
| |
| |
| |
| Municipal Securities continued | | | | | | | | |
| | | | | Principal | | Value (Note 1) |
| | | Amount (000s) | | | | (000s) |
| Illinois – continued | | | | | | | | |
| Chicago Sales Tax Rev. Participating VRDN Series Merlots 00 | | | | | | | | |
| AAA, 2.4% (Liquidity Facility Wachovia Bank NA) (c)(g) | | $ | | 12,470 | | $ | | 12,470 |
| Chicago Single Family Mtg. Rev. Participating VRDN: | | | | | | | | |
| Series FRRI 00 L12, 2.58% (Liquidity Facility Lehman | | | | | | | | |
| Brothers Hldgs., Inc.) (c)(f)(g) | | | | 510 | | | | 510 |
| Series FRRI 02 L24J, 2.53% (Liquidity Facility Lehman | | | | | | | | |
| Brothers Hldgs., Inc.) (c)(f)(g) | | | | 1,045 | | | | 1,045 |
| Series Merlots 00 A31, 2.45% (Liquidity Facility Wachovia | | | | | | | | |
| Bank NA) (c)(f)(g) | | | | 80 | | | | 80 |
| Chicago Wastewtr. Transmission Rev. Participating VRDN | | | | | | | | |
| Series Merlots 01 A125, 2.4% (Liquidity Facility Wachovia | | | | | | | | |
| Bank NA) (c)(g) | | | | 4,965 | | | | 4,965 |
| Chicago Wtr. Rev. Participating VRDN: | | | | | | | | |
| Series BA 02 E, 2.59% (Liquidity Facility Bank of America | | | | | | | | |
| NA) (c)(g) | | | | 9,995 | | | | 9,995 |
| Series Merlots 00 TT, 2.4% (Liquidity Facility Wachovia Bank | | | | | | | | |
| NA) (c)(g) | | | | 18,785 | | | | 18,785 |
| Series Merlots 97 V, 2.4% (Liquidity Facility Wachovia Bank | | | | | | | | |
| NA) (c)(g) | | | | 8,280 | | | | 8,280 |
| City of Rolling Meadows Solid Waste Disp. Rev. (BFI Waste | | | | | | | | |
| Sys. of North America Proj.) Series 1999, 2.59%, LOC | | | | | | | | |
| JPMorgan Chase Bank, VRDN (c)(f) | | | | 19,580 | | | | 19,580 |
| Clipper Tax-Exempt Ctfs. Trust Participating VRDN Series | | | | | | | | |
| Clipper 05 21, 2.57% (Liquidity Facility State Street Bank & | | | | | | | | |
| Trust Co., Boston) (c)(g) | | | | 30,000 | | | | 30,000 |
| Cook County Gen. Oblig. Participating VRDN Series PA 591, | | | | | | | | |
| 2.53% (Liquidity Facility Merrill Lynch & Co., Inc.) (c)(g) | | | | 5,300 | | | | 5,300 |
| Cook County School District # 162 Matteson Participating | | | | | | | | |
| VRDN Series PT 3040, 2.53% (Liquidity Facility Merrill Lynch | | | | | | | | |
| & Co., Inc.) (c)(g) | | | | 6,380 | | | | 6,380 |
| Cook County School District #135 Participating VRDN Series | | | | | | | | |
| PT 3120, 2.53% (Liquidity Facility Merrill Lynch & Co., | | | | | | | | |
| Inc.) (c)(g) | | | | 5,705 | | | | 5,705 |
| DuPage County Trans. Rev. Participating VRDN Series PT | | | | | | | | |
| 3008, 2.53% (Liquidity Facility Merrill Lynch & Co., | | | | | | | | |
| Inc.) (c)(g) | | | | 9,300 | | | | 9,300 |
| Fulton Indl. Dev. Rev. (J.T. Cullen Co., Inc. Proj.) 2.4%, LOC | | | | | | | | |
| U.S. Bank NA, Minnesota, VRDN (c)(f) | | | | 5,005 | | | | 5,005 |
| Hodgkins Indl. Dev. Rev. (Central Blacktop Co., Inc. Proj.) | | | | | | | | |
| 2.66%, LOC Harris NA, VRDN (c)(f) | | | | 3,685 | | | | 3,685 |
| Illinois Dev. Fin. Auth. Envir. Facilities Rev. Bonds (American | | | | | | | | |
| Wtr. Cap. Corp. Proj.) Series 1997, 2.78% tender 11/3/05, | | | | | | | | |
| CP mode (f) | | | | 23,325 | | | | 23,325 |
See accompanying notes which are an integral part of the financial statements.
| Municipal Securities continued | | | | | | | | |
| | | | | Principal | | Value (Note 1) |
| | | Amount (000s) | | | | (000s) |
| Illinois – continued | | | | | | | | |
| Illinois Dev. Fin. Auth. Indl. Dev. Rev.: | | | | | | | | |
| (Cloverhill Pastry Vend Corp. Proj.) 2.6%, LOC M&I Marshall | | | | | | | | |
| & Ilsley Bank, VRDN (c)(f) | | $ | | 3,210 | | $ | | 3,210 |
| (Delta-Unibus Corp. Proj.) Series 2001, 2.6%, LOC Bank of | | | | | | | | |
| America NA, VRDN (c)(f) | | | | 3,400 | | | | 3,400 |
| (Mapes & Sprowl Steel Ltd. Proj.) Series 1996 A, 2.65%, | | | | | | | | |
| LOC Harris NA, VRDN (c)(f) | | | | 2,352 | | | | 2,352 |
| (R&R Enterprises 2nd Proj.) Series 1999 A, 2.66%, LOC | | | | | | | | |
| Harris NA, VRDN (c)(f) | | | | 4,660 | | | | 4,660 |
| Illinois Dev. Fin. Auth. Rev. (Rich Prods. Corp. Proj.) Series | | | | | | | | |
| 1998, 2.54%, LOC HSBC Bank USA, VRDN (c)(f) | | | | 7,825 | | | | 7,825 |
| Illinois Dev. Fin. Auth. Solid Waste Disp. Rev. (Waste Mgmt., | | | | | | | | |
| Inc. Proj.): | | | | | | | | |
| 2.55%, LOC JPMorgan Chase Bank, VRDN (c)(f) | | | | 5,000 | | | | 5,000 |
| 2.55%, LOC Wachovia Bank NA, VRDN (c)(f) | | | | 16,000 | | | | 16,000 |
| Illinois Dev. Fin. Auth. Wtr. Facilities Rev. (Illinois American | | | | | | | | |
| Wtr. Co. Proj.) 2.55% (MBIA Insured), VRDN (c)(f) | | | | 9,860 | | | | 9,860 |
| Illinois Edl. Facilities Auth. Revs. Participating VRDN: | | | | | | | | |
| Series MACN 05 D, 2.53% (Liquidity Facility Bank of | | | | | | | | |
| America NA) (c)(g) | | | | 7,010 | | | | 7,010 |
| Series Merlots 97 U, 2.4% (Liquidity Facility Wachovia Bank | | | | | | | | |
| NA) (c)(g) | | | | 9,040 | | | | 9,040 |
| Illinois Fin. Auth. Rev. Participating VRDN Series PT 3029, | | | | | | | | |
| 2.53% (Liquidity Facility Merrill Lynch & Co., Inc.) (c)(g) | | | | 7,800 | | | | 7,800 |
| Illinois Gen. Oblig. Participating VRDN: | | | | | | | | |
| Series EGL 00 1304, 2.53% (Liquidity Facility Citibank NA, | | | | | | | | |
| New York) (c)(g) | | | | 9,100 | | | | 9,100 |
| Series EGL 02 1301, 2.53% (Liquidity Facility Citibank NA, | | | | | | | | |
| New York) (c)(g) | | | | 5,900 | | | | 5,900 |
| Series EGL 02 1304, 2.53% (Liquidity Facility Citibank NA, | | | | | | | | |
| New York) (c)(g) | | | | 5,040 | | | | 5,040 |
| Series EGL 02 6025, 2.53% (Liquidity Facility Citibank NA, | | | | | | | | |
| New York) (c)(g) | | | | 9,900 | | | | 9,900 |
| Series MSTC 01 148, 2.41% (Liquidity Facility Bear Stearns | | | | | | | | |
| Companies, Inc.) (c)(g) | | | | 12,435 | | | | 12,435 |
| Series PT 1882, 2.53% (Liquidity Facility Merrill Lynch & Co., | | | | | | | | |
| Inc.) (c)(g) | | | | 18,420 | | | | 18,420 |
| Series PT 379, 2.53% (Liquidity Facility DEPFA BANK | | | | | | | | |
| PLC) (c)(g) | | | | 10,465 | | | | 10,465 |
| Series PT 871, 2.53% (Liquidity Facility Landesbank | | | | | | | | |
| Hessen-Thuringen) (c)(g) | | | | 4,000 | | | | 4,000 |
| Series Putters 02 321, 2.53% (Liquidity Facility JPMorgan | | | | | | | | |
| Chase & Co.) (c)(g) | | | | 14,485 | | | | 14,485 |
See accompanying notes which are an integral part of the financial statements.
Annual Report
| Investments continued | | | | | | | | |
| |
| |
| Municipal Securities continued | | | | | | | | |
| | | | | Principal | | Value (Note 1) |
| | | Amount (000s) | | | | (000s) |
| Illinois – continued | | | | | | | | |
| Illinois Gen. Oblig. Participating VRDN: – continued | | | | | | | | |
| Series Putters 842, 2.53% (Liquidity Facility Dresdner Bank | | | | | | | | |
| AG) (c)(g) | | $ | | 9,095 | | $ | | 9,095 |
| Series ROC II R4536, 2.53% (Liquidity Facility Citigroup | | | | | | | | |
| Global Markets Hldgs., Inc.) (c)(g) | | | | 5,175 | | | | 5,175 |
| Illinois Health Facilities Auth. Rev.: | | | | | | | | |
| Bonds: | | | | | | | | |
| (Evanston Northwestern Health Care Corp. Proj.) Series | | | | | | | | |
| 1996, 2.9% tender 9/15/05, CP mode | | | | 19,000 | | | | 19,000 |
| Series PT 977, 2.15%, tender 11/10/05 (Liquidity Facility | | | | | | | | |
| Svenska Handelsbanken AB) (c)(g)(h) | | | | 9,755 | | | | 9,755 |
| Participating VRDN Series PA 848R, 2.53% (Liquidity Facility | | | | | | | | |
| Merrill Lynch & Co., Inc.) (c)(g) | | | | 5,190 | | | | 5,190 |
| Illinois Int’l. Port District Facilities (Southdown, Inc. Proj.) Series | | | | | | | | |
| 2000, 2.42%, LOC Wachovia Bank NA, VRDN (c)(f) | | | | 8,500 | | | | 8,500 |
| Illinois Reg’l. Trans. Auth. Participating VRDN: | | | | | | | | |
| Series 720050003 Class A, 2.53% (Liquidity Facility | | | | | | | | |
| Citibank NA) (c)(g) | | | | 4,400 | | | | 4,400 |
| Series Merlots 01 A48, 2.4% (Liquidity Facility Wachovia | | | | | | | | |
| Bank NA) (c)(g) | | | | 8,905 | | | | 8,905 |
| Series Merlots 02 A23, 2.4% (Liquidity Facility Wachovia | | | | | | | | |
| Bank NA) (c)(g) | | | | 11,775 | | | | 11,775 |
| Series Merlots 02 A24, 2.4% (Liquidity Facility Wachovia | | | | | | | | |
| Bank NA) (c)(g) | | | | 4,965 | | | | 4,965 |
| Series Merlots 02 A41, 2.4% (Liquidity Facility Wachovia | | | | | | | | |
| Bank NA) (c)(g) | | | | 8,475 | | | | 8,475 |
| Series MSTC 9044, 2.41% (Liquidity Facility Bear Stearns | | | | | | | | |
| Companies, Inc.) (c)(g) | | | | 8,200 | | | | 8,200 |
| Series PT 2317, 2.53% (Liquidity Facility Merrill Lynch & Co., | | | | | | | | |
| Inc.) (c)(g) | | | | 5,360 | | | | 5,360 |
| Series PT 2394, 2.53% (Liquidity Facility Dexia Cr. Local de | | | | | | | | |
| France) (c)(g) | | | | 24,900 | | | | 24,900 |
| Series PT 2398, 2.53% (Liquidity Facility Dexia Cr. Local de | | | | | | | | |
| France) (c)(g) | | | | 26,220 | | | | 26,220 |
| Series SG 3, 2.54% (Liquidity Facility Societe | | | | | | | | |
| Generale) (c)(g) | | | | 4,000 | | | | 4,000 |
| Series SGB 19, 2.53% (Liquidity Facility Societe | | | | | | | | |
| Generale) (c)(g) | | | | 8,675 | | | | 8,675 |
| Illinois Sales Tax Rev. Participating VRDN: | | | | | | | | |
| Series EGL 00 1302, 2.53% (Liquidity Facility Citibank NA, | | | | | | | | |
| New York) (c)(g) | | | | 5,000 | | | | 5,000 |
| Series PT 1929, 2.53% (Liquidity Facility Merrill Lynch & Co., | | | | | | | | |
| Inc.) (c)(g) | | | | 7,615 | | | | 7,615 |
See accompanying notes which are an integral part of the financial statements.
Annual Report
| Municipal Securities continued | | | | | | | | |
| | | | | Principal | | Value (Note 1) |
| | | Amount (000s) | | | | (000s) |
| Illinois – continued | | | | | | | | |
| Illinois Sales Tax Rev. Participating VRDN: – continued | | | | | | | | |
| Series ROC II R4542, 2.53% (Liquidity Facility Citigroup | | | | | | | | |
| Global Markets Hldgs., Inc.) (c)(g) | | $ | | 4,985 | | $ | | 4,985 |
| Illinois Student Assistance Commission Student Ln. Rev.: | | | | | | | | |
| Series 1996 A, 2.39%, LOC Bank of America NA, | | | | | | | | |
| VRDN (c)(f) | | | | 3,700 | | | | 3,700 |
| Series 1998 A, 2.45% (MBIA Insured), VRDN (c)(f) | | | | 1,450 | | | | 1,450 |
| Illinois Toll Hwy. Auth. Toll Hwy. Rev. Participating VRDN: | | | | | | | | |
| Series PT 3127, 2.53% (Liquidity Facility Merrill Lynch & Co., | | | | | | | | |
| Inc.) (c)(g) | | | | 10,715 | | | | 10,715 |
| Series Putters 1014, 2.53% (Liquidity Facility JPMorgan | | | | | | | | |
| Chase Bank) (c)(g) | | | | 6,980 | | | | 6,980 |
| Series Putters 963, 2.53% (Liquidity Facility JPMorgan Chase | | | | | | | | |
| Bank) (c)(g) | | | | 12,065 | | | | 12,065 |
| Series Putters 965, 2.53% (Liquidity Facility Dresdner Bank | | | | | | | | |
| AG) (c)(g) | | | | 32,345 | | | | 32,345 |
| Kane & DeKalb Counties Cmnty. Unit School District #302 | | | | | | | | |
| Participating VRDN Series Putters 283, 2.53% (Liquidity | | | | | | | | |
| Facility JPMorgan Chase Bank) (c)(g) | | | | 4,600 | | | | 4,600 |
| Lisle Village Multi-family Hsg. Rev. (Devonshire of Lisle Proj.) | | | | | | | | |
| Series 1991, 2.41%, LOC Freddie Mac, VRDN (c)(f) | | | | 6,000 | | | | 6,000 |
| McLean & Woodford Counties Cmnty. Unit School District #5 | | | | | | | | |
| Participating VRDN Series PT 1989, 2.53% (Liquidity Facility | | | | | | | | |
| Merrill Lynch & Co., Inc.) (c)(g) | | | | 5,480 | | | | 5,480 |
| Metropolitan Pier & Exposition Auth. Dedicated Sales Tax Rev. | | | | | | | | |
| Participating VRDN Series EGL 00 1306, 2.53% (Liquidity | | | | | | | | |
| Facility Citibank NA, New York) (c)(g) | | | | 10,520 | | | | 10,520 |
| Metropolitan Pier & Exposition Auth. Dedicated State Tax Rev. | | | | | | | | |
| Participating VRDN: | | | | | | | | |
| Series EGL 02 6001, 2.53% (Liquidity Facility Citibank NA, | | | | | | | | |
| New York) (c)(g) | | | | 4,600 | | | | 4,600 |
| Series PZ 45, 2.57% (Liquidity Facility Merrill Lynch & Co., | | | | | | | | |
| Inc.) (c)(g) | | | | 4,500 | | | | 4,500 |
| Series PZ 52, 2.57% (Liquidity Facility Merrill Lynch & Co., | | | | | | | | |
| Inc.) (c)(g) | | | | 7,575 | | | | 7,575 |
| Series TOC 05 V1, 2.57% (Liquidity Facility Goldman Sachs | | | | | | | | |
| Group, Inc.) (c)(g) | | | | 9,290 | | | | 9,290 |
| Series TOC 05 Z5, 2.57% (Liquidity Facility Goldman Sachs | | | | | | | | |
| Group, Inc.) (c)(g) | | | | 17,700 | | | | 17,700 |
| Mundelein Indl. Dev. Rev. (Print-O-Tape Proj.) Series 1997, | | | | | | | | |
| 2.66%, LOC Harris NA, VRDN (c)(f) | | | | 3,705 | | | | 3,705 |
| Northern Illinois Univ. Revs. Participating VRDN Series PT | | | | | | | | |
| 2320, 2.53% (Liquidity Facility Merrill Lynch & Co., | | | | | | | | |
| Inc.) (c)(g) | | | | 7,140 | | | | 7,140 |
See accompanying notes which are an integral part of the financial statements.
Annual Report
| Investments continued | | | | | | | | |
| |
| |
| |
| Municipal Securities continued | | | | | | | | |
| | | | | Principal | | Value (Note 1) |
| | | Amount (000s) | | | | (000s) |
| Illinois – continued | | | | | | | | |
| Palos Hills Multi-family Hsg. Rev. (Green Oaks Proj.) Series | | | | | | | | |
| 1998, 2.46%, LOC Fannie Mae, VRDN (c)(f) | | $ | | 10,630 | | $ | | 10,630 |
| Roaring Fork Muni. Prods LLC Participating VRDN Series RF 05 | | | | | | | | |
| 12, 2.57% (Liquidity Facility Bank of New York, New | | | | | | | | |
| York) (c)(g) | | | | 12,895 | | | | 12,895 |
| Rockford Indl. Dev. Rev. (Ringcan Corp. Proj.) Series 1998, | | | | | | | | |
| 2.54%, LOC Suntrust Bank, VRDN (c)(f) | | | | 800 | | | | 800 |
| Saint Charles Indl. Dev. Rev. (Pier 1 Imports-Midwest, Inc. | | | | | | | | |
| Proj.) Series 1986, 2.41%, LOC JPMorgan Chase Bank, | | | | | | | | |
| VRDN (c)(f) | | | | 9,500 | | | | 9,500 |
| Schaumburg Village Gen. Oblig. Participating VRDN Series | | | | | | | | |
| Merlots 04 C33, 2.4% (Liquidity Facility Wachovia Bank | | | | | | | | |
| NA) (c)(g) | | | | 4,890 | | | | 4,890 |
| Univ. of Illinois Auxiliary Facilities Sys. Rev. Participating | | | | | | | | |
| VRDN: | | | | | | | | |
| Series IXIS 05 10, 2.53% (Liquidity Facility CDC Fin.-CDC | | | | | | | | |
| IXIS) (c)(g) | | | | 4,000 | | | | 4,000 |
| Series Merlots 00 S, 2.4% (Liquidity Facility Wachovia Bank | | | | | | | | |
| NA) (c)(g) | | | | 3,500 | | | | 3,500 |
| Series Merlots 01 A105, 2.4% (Liquidity Facility Wachovia | | | | | | | | |
| Bank NA) (c)(g) | | | | 3,160 | | | | 3,160 |
| West Chicago Indl. Dev. Auth. Indl. Dev. Rev. (Bison Gear & | | | | | | | | |
| Engineering Corp. Proj.) 2.65%, LOC Bank of America NA, | | | | | | | | |
| VRDN (c)(f) | | | | 4,472 | | | | 4,472 |
| Will County Multi-family Hsg. Rev. (Sierena Dev. Proj.) 2.57%, | | | | | | | | |
| LOC Lasalle Bank NA, VRDN (c)(f) | | | | 12,915 | | | | 12,915 |
| Winnebago County Gen. Oblig. Participating VRDN Series PT | | | | | | | | |
| 2070, 2.53% (Liquidity Facility Merrill Lynch & Co., | | | | | | | | |
| Inc.) (c)(g) | | | | 5,675 | | | | 5,675 |
| | | | | | | | | 1,223,059 |
| |
| Indiana – 1.2% | | | | | | | | |
| Anderson Econ. Dev. Auth. Rev. (AppleCreek Commons Proj.) | | | | | | | | |
| 2.56%, LOC Fed. Home Ln. Bank, Indianapolis, VRDN (c)(f) . | | | | 5,965 | | | | 5,965 |
| Carmel Clay Parks Bldg. Corp. Participating VRDN Series | | | | | | | | |
| Putters 539, 2.53% (Liquidity Facility JPMorgan Chase | | | | | | | | |
| Bank) (c)(g) | | | | 5,800 | | | | 5,800 |
| Columbus City Rev. (Rock-Tenn Co. Mill Division Proj.) Series | | | | | | | | |
| 1995, 2.54%, LOC Suntrust Bank, VRDN (c)(f) | | | | 6,750 | | | | 6,750 |
| Crawford County Econ. Dev. Rev. (Jasper Engine Exchange | | | | | | | | |
| Proj.) Series 1997, 2.64%, LOC PNC Bank NA, Pittsburgh, | | | | | | | | |
| VRDN (c)(f) | | | | 3,200 | | | | 3,200 |
| Elkhart County Multi-family Hsg. Rev. (Pedcor Investments Proj.) | | | | | | | | |
| Series 2000, 2.57%, LOC Fed. Home Ln. Bank, Indianapolis, | | | | | | | | |
| VRDN (c)(f) | | | | 8,048 | | | | 8,048 |
See accompanying notes which are an integral part of the financial statements.
Annual Report
| Municipal Securities continued | | | | | | | | |
| | | | | Principal | | Value (Note 1) |
| | | Amount (000s) | | | | (000s) |
| Indiana – continued | | | | | | | | |
| Franklin Econ. Dev. Rev. (Pedcor Investments LP-Lakeview II | | | | | | | | |
| Proj.) 2.55%, LOC Fed. Home Ln. Bank, Indianapolis, | | | | | | | | |
| VRDN (c)(f) | | $ | | 2,062 | | $ | | 2,062 |
| Hammond Swr. & Solid Waste Disp. Rev. (Cargill, Inc. Proj.) | | | | | | | | |
| 2.42%, VRDN (c)(f) | | | | 6,500 | | | | 6,500 |
| Hebron Econ. Dev. Rev. (Aarons Misty Glen Apt. Proj.) Series | | | | | | | | |
| 1996 A, 2.57%, LOC Fed. Home Ln. Bank, Indianapolis, | | | | | | | | |
| VRDN (c)(f) | | | | 2,975 | | | | 2,975 |
| Indiana Bond Bank Rev. Participating VRDN Series MSTC 01 | | | | | | | | |
| 177, 2.41% (Liquidity Facility Bear Stearns Companies, | | | | | | | | |
| Inc.) (c)(g) | | | | 17,000 | | | | 17,000 |
| Indiana Dev. Fin. Auth. Solid Waste Disp. Rev. (Waste Mgmt., | | | | | | | | |
| Inc. Proj.): | | | | | | | | |
| Series 2002 A, 2.55%, LOC JPMorgan Chase Bank, | | | | | | | | |
| VRDN (c)(f) | | | | 6,250 | | | | 6,250 |
| Series 2002 B, 2.54%, LOC JPMorgan Chase Bank, | | | | | | | | |
| VRDN (c)(f) | | | | 7,000 | | | | 7,000 |
| Indiana Health Facility Fing. Auth. Rev. Participating VRDN | | | | | | | | |
| Series PA 972, 2.53% (Liquidity Facility Merrill Lynch & Co., | | | | | | | | |
| Inc.) (c)(g) | | | | 7,400 | | | | 7,400 |
| Indiana Hsg. Fin. Auth. Single Family Mtg. Rev. Participating | | | | | | | | |
| VRDN: | | | | | | | | |
| Series Clipper 05 12, 2.69% (Liquidity Facility State Street | | | | | | | | |
| Bank & Trust Co., Boston) (c)(f)(g) | | | | 14,092 | | | | 14,092 |
| Series Merlots 01 A2, 2.45% (Liquidity Facility Wachovia | | | | | | | | |
| Bank NA) (c)(f)(g) | | | | 1,155 | | | | 1,155 |
| Series Merlots 97 H, 2.45% (Liquidity Facility Wachovia | | | | | | | | |
| Bank NA) (c)(f)(g) | | | | 3,745 | | | | 3,745 |
| Series ROC II R99, 2.57% (Liquidity Facility Citibank | | | | | | | | |
| NA) (c)(f)(g) | | | | 3,680 | | | | 3,680 |
| Indiana Trans. Fin. Auth. Hwy. Participating VRDN: | | | | | | | | |
| Series MT 33, 2.53% (Liquidity Facility Merrill Lynch & Co., | | | | | | | | |
| Inc.) (c)(g) | | | | 5,915 | | | | 5,915 |
| Series Putters 479, 2.53% (Liquidity Facility PNC Bank NA, | | | | | | | | |
| Pittsburgh) (c)(g) | | | | 7,465 | | | | 7,465 |
| Indianapolis Econ. Dev. Multi-family Hsg. Rev. 2.6%, LOC Fed. | | | | | | | | |
| Home Ln. Bank, Cincinnati, VRDN (c)(f) | | | | 9,968 | | | | 9,968 |
| Indianapolis Econ. Dev. Rev.: | | | | | | | | |
| (Pine Glen Apts. Proj.) 2.54%, LOC Fed. Home Ln. Bank, | | | | | | | | |
| Cincinnati, VRDN (c)(f) | | | | 6,300 | | | | 6,300 |
| (US LLC Proj.) Series 1996, 2.65%, LOC JPMorgan Chase | | | | | | | | |
| Bank, VRDN (c)(f) | | | | 400 | | | | 400 |
See accompanying notes which are an integral part of the financial statements.
Annual Report
| Investments continued | | | | | | | | |
| |
| |
| Municipal Securities continued | | | | | | | | |
| | | | | Principal | | Value (Note 1) |
| | | Amount (000s) | | | | (000s) |
| Indiana – continued | | | | | | | | |
| Indianapolis Local Pub. Impt. Bond Bank Participating VRDN: | | | | | | | | |
| Series MT 150, 2.57% (Liquidity Facility Merrill Lynch & Co., | | | | | | | | |
| Inc.) (c)(f)(g) | | $ | | 7,170 | | $ | | 7,170 |
| Series MT 39, 2.57% (Liquidity Facility Svenska | | | | | | | | |
| Handelsbanken AB) (c)(f)(g) | | | | 14,580 | | | | 14,580 |
| IPS Multi-School Bldg. Corp. Participating VRDN Series PT | | | | | | | | |
| 2297, 2.53% (Liquidity Facility Merrill Lynch & Co., | | | | | | | | |
| Inc.) (c)(g) | | | | 5,675 | | | | 5,675 |
| Lawrence County Indl. Dev. Rev. (D&M Tool Proj.) 2.79%, LOC | | | | | | | | |
| Huntington Nat’l. Bank, Columbus, VRDN (c)(f) | | | | 1,000 | | | | 1,000 |
| Lawrence Econ. Dev. Rev. (Westminster Village North Proj.) | | | | | | | | |
| 2.54%, LOC U.S. Bank NA, Minnesota, VRDN (c) | | | | 8,400 | | | | 8,400 |
| Muncie Indl. Dev. Rev. (Diamond Plastics Corp. Proj.) Series | | | | | | | | |
| 1996, 2.6%, LOC Bank of America NA, VRDN (c)(f) | | | | 1,100 | | | | 1,100 |
| Rockport Indl. Dev. Rev. (AK Steel Corp. Proj.): | | | | | | | | |
| Series 1998 A, 2.41%, LOC PNC Bank NA, Pittsburgh, | | | | | | | | |
| VRDN (c)(f) | | | | 10,000 | | | | 10,000 |
| Series 1999 A, 2.41%, LOC PNC Bank NA, Pittsburgh, | | | | | | | | |
| VRDN (c)(f) | | | | 10,000 | | | | 10,000 |
| Rockport Poll. Cont. Rev. (AK Steel Corp. Proj.) Series 1997 A, | | | | | | | | |
| 2.41%, LOC PNC Bank NA, Pittsburgh, VRDN (c)(f) | | | | 10,000 | | | | 10,000 |
| Whitley County Ind. Econ. Dev. Rev. (Chromasource, Inc. Proj.) | | | | | | | | |
| 2.62%, LOC Nat’l. City Bank, Indiana, VRDN (c)(f) | | | | 4,835 | | | | 4,835 |
| | | | | | | | | 204,430 |
| |
| Iowa 0.3% | | | | | | | | |
| Iowa Fin. Auth.: | | | | | | | | |
| Bonds Series 2005 C, 2.95%, tender 11/1/05 (Liquidity | | | | | | | | |
| Facility State Street Bank & Trust Co., Boston) (c)(f) | | | | 12,000 | | | | 12,000 |
| Participating VRDN: | | | | | | | | |
| Series 2003 L21J, 2.53% (Liquidity Facility Lehman | | | | | | | | |
| Brothers Hldgs., Inc.) (c)(f)(g) | | | | 9,140 | | | | 9,140 |
| Series LB 04 L33J, 2.62% (Liquidity Facility Lehman | | | | | | | | |
| Brothers Hldgs., Inc.) (c)(f)(g) | | | | 12,075 | | | | 12,075 |
| Iowa Fin. Auth. Indl. Dev. Rev. (Grafco Industries Proj.) Series | | | | | | | | |
| 1999, 2.6%, LOC Bank of America NA, VRDN (c)(f) | | | | 2,500 | | | | 2,500 |
| Iowa Fin. Auth. Single Family Rev.: | | | | | | | | |
| Participating VRDN: | | | | | | | | |
| Series BA 00 N, 2.64% (Liquidity Facility Bank of America | | | | | | | | |
| NA) (c)(f)(g) | | | | 8,675 | | | | 8,675 |
See accompanying notes which are an integral part of the financial statements.
Annual Report
| Municipal Securities continued | | | | | | | | |
| | | | | Principal | | Value (Note 1) |
| | | Amount (000s) | | | | (000s) |
| Iowa – continued | | | | | | | | |
| Iowa Fin. Auth. Single Family Rev.: – continued | | | | | | | | |
| Participating VRDN: | | | | | | | | |
| Series ROC II R74, 2.57% (Liquidity Facility Citibank | | | | | | | | |
| NA) (c)(f)(g) | | $ | | 2,870 | | $ | | 2,870 |
| (Mtg. Backed Securities Prog.) Series 2004 G, 2.5% | | | | | | | | |
| (Liquidity Facility State Street Bank & Trust Co., Boston), | | | | | | | | |
| VRDN (c)(f) | | | | 4,500 | | | | 4,500 |
| | | | | | | | | 51,760 |
| |
| Kansas 0.5% | | | | | | | | |
| Chanute Indl. Dev. Rev. (Ash Grove Cement Co. Proj.) Series | | | | | | | | |
| 2000, 2.55%, LOC Bank of America NA, VRDN (c)(f) | | | | 25,100 | | | | 25,100 |
| Kansas Dept. of Trans. Hwy. Rev. Participating VRDN: | | | | | | | | |
| Series EGL 00 1601, 2.53% (Liquidity Facility Citibank NA, | | | | | | | | |
| New York) (c)(g) | | | | 5,000 | | | | 5,000 |
| Series EGL 04 1005, 2.53% (Liquidity Facility Citibank | | | | | | | | |
| NA) (c)(g) | | | | 3,800 | | | | 3,800 |
| Kansas Dev. Fin. Auth. Multi-family Rev. (Summit Woods Proj.) | | | | | | | | |
| Series G1, 2.54%, LOC Fannie Mae, VRDN (c)(f) | | | | 5,000 | | | | 5,000 |
| Lenexa Multi-family Hsg. Rev. (Meadows Apts. Proj.) Series A, | | | | | | | | |
| 2.54%, LOC Fannie Mae, VRDN (c)(f) | | | | 7,800 | | | | 7,800 |
| Olathe Gen. Oblig. BAN Series A, 4% 6/1/06 | | | | 24,470 | | | | 24,680 |
| Sedgwick & Shawnee Counties Participating VRDN Series PT | | | | | | | | |
| 674, 2.58% (Liquidity Facility Svenska Handelsbanken | | | | | | | | |
| AB) (c)(f)(g) | | | | 1,935 | | | | 1,935 |
| Wichita Hosp. Rev. Participating VRDN Series MT 64, 2.53% | | | | | | | | |
| (Liquidity Facility Svenska Handelsbanken AB) (c)(g) | | | | 7,180 | | | | 7,180 |
| | | | | | | | | 80,495 |
| |
| Kentucky 0.9% | | | | | | | | |
| Carroll County Solid Waste Disp. Rev. (North American | | | | | | | | |
| Stainless LP Proj.) Series 2000, 2.55%, LOC JPMorgan | | | | | | | | |
| Chase Bank, VRDN (c)(f) | | | | 10,000 | | | | 10,000 |
| Daviess County Exempt Facilities Rev. (Kimberly-Clark Tissue | | | | | | | | |
| Co. Proj.) 2.43% (Kimberly-Clark Corp. Guaranteed), | | | | | | | | |
| VRDN (c)(f) | | | | 4,000 | | | | 4,000 |
| Daviess County Solid Waste Disp. Facilities Rev. (Scott Paper | | | | | | | | |
| Co. Proj.): | | | | | | | | |
| Series 1993 A, 2.43% (Kimberly-Clark Corp. Guaranteed), | | | | | | | | |
| VRDN (c)(f) | | | | 24,050 | | | | 24,050 |
| Series 1993 B, 2.43% (Kimberly-Clark Corp. Guaranteed), | | | | | | | | |
| VRDN (c)(f) | | | | 8,900 | | | | 8,900 |
| Elizabethtown Indl. Bldg. Rev. (Altec Industries, Inc. Proj.) | | | | | | | | |
| Series 1997, 2.45%, LOC Wachovia Bank NA, VRDN (c)(f) . | | | | 5,000 | | | | 5,000 |
See accompanying notes which are an integral part of the financial statements.
35 Annual Report
| Investments continued | | | | | | | | |
| |
| |
| |
| Municipal Securities continued | | | | | | | | |
| | | | | Principal | | Value (Note 1) |
| | | Amount (000s) | | | | (000s) |
| Kentucky – continued | | | | | | | | |
| Henderson County Indl. Dev. Auth. (Pittsburg Tank & Tower Co. | | | | | | | | |
| Proj.) 2.62%, LOC U.S. Bank NA, Minnesota, VRDN (c)(f) | | $ | | 100 | | $ | | 100 |
| Jefferson County Indl. Bldg. Rev. (Wynn Starr Foods Proj.) | | | | | | | | |
| Series 1996, 2.65%, LOC JPMorgan Chase Bank, | | | | | | | | |
| VRDN (c)(f) | | | | 1,110 | | | | 1,110 |
| Jefferson County Poll. Cont. Rev. Bonds (Louisville Gas & Elec. | | | | | | | | |
| Co. Proj.) Series 1992 A, 2.72% tender 9/6/05, CP mode . | | | | 5,000 | | | | 5,000 |
| Kenton County Arpt. Board Arpt. Rev. Participating VRDN: | | | | | | | | |
| Series FRRI 02 L15, 2.53% (Liquidity Facility Lehman | | | | | | | | |
| Brothers Hldgs., Inc.) (c)(f)(g) | | | | 5,475 | | | | 5,475 |
| Series PT 490, 2.57% (Liquidity Facility BNP Paribas | | | | | | | | |
| SA) (c)(f)(g) | | | | 6,245 | | | | 6,245 |
| Series PT 521, 2.57% (Liquidity Facility BNP Paribas | | | | | | | | |
| SA) (c)(f)(g) | | | | 6,245 | | | | 6,245 |
| Kentucky Econ. Dev. Fin. Auth. Indl. Bldg. Rev. (Republic Svcs., | | | | | | | | |
| Inc. Proj.) Series 2000, 2.55%, LOC Bank of America NA, | | | | | | | | |
| VRDN (c)(f) | | | | 5,000 | | | | 5,000 |
| Kentucky Hsg. Corp. Hsg. Rev. Participating VRDN Series 03 | | | | | | | | |
| L49J, 2.53% (Liquidity Facility Lehman Brothers Hldgs., | | | | | | | | |
| Inc.) (c)(f)(g) | | | | 3,745 | | | | 3,745 |
| Kentucky Hsg. Corp. Single Family Mtg. Rev. Participating | | | | | | | | |
| VRDN Series PT 740, 2.58% (Liquidity Facility Lloyds TSB | | | | | | | | |
| Bank PLC) (c)(f)(g) | | | | 4,000 | | | | 4,000 |
| Larue County Indl. Dev. Rev. (CMH Hodgenville, Inc. Proj.) | | | | | | | | |
| Series 2000, 2.59%, LOC U.S. Bank NA, Minnesota, | | | | | | | | |
| VRDN (c)(f) | | | | 6,000 | | | | 6,000 |
| Laurel County Solid Waste Disp. Rev. (Waste Mgmt. of | | | | | | | | |
| Kentucky LLC Proj.) 2.59%, LOC Wachovia Bank NA, | | | | | | | | |
| VRDN (c)(f) | | | | 7,300 | | | | 7,300 |
| Logan County Solid Waste Disp. (Waste Mgmt. of Kentucky | | | | | | | | |
| LLC Proj.) 2.59%, LOC Wachovia Bank NA, VRDN (c)(f) | | | | 7,450 | | | | 7,450 |
| Louisville & Jefferson County Swr. District Rev. Participating | | | | | | | | |
| VRDN Series EGL 99 1701, 2.53% (Liquidity Facility | | | | | | | | |
| Citibank NA, New York) (c)(g) | | | | 6,115 | | | | 6,115 |
| Mason County Poll. Cont. Rev. (East Kentucky Pwr. Coop. | | | | | | | | |
| Proj.): | | | | | | | | |
| Series 1984 B1, 2.65% (Nat’l. Rural Utils. Coop. Fin. Corp. | | | | | | | | |
| Guaranteed), VRDN (c) | | | | 17,350 | | | | 17,350 |
| Series 1984 B2, 2.65% (Nat’l. Rural Utils. Coop. Fin. Corp. | | | | | | | | |
| Guaranteed), VRDN (c) | | | | 11,230 | | | | 11,230 |
See accompanying notes which are an integral part of the financial statements.
Annual Report
| Municipal Securities continued | | | | | | | | |
| | | | | Principal | | Value (Note 1) |
| | | Amount (000s) | | | | (000s) |
| Kentucky – continued | | | | | | | | |
| Mason County Poll. Cont. Rev. (East Kentucky Pwr. Coop. | | | | | | | | |
| Proj.): – continued | | | | | | | | |
| Series 1984 B3, 2.65% (Nat’l. Rural Utils. Coop. Fin. Corp. | | | | | | | | |
| Guaranteed), VRDN (c) | | $ | | 9,570 | | $ | | 9,570 |
| Walton Indl. Bldg. Rev. (Clarion Manufacturing Corp. of | | | | | | | | |
| America Proj.) 2.62%, LOC Fifth Third Bank, Cincinnati, | | | | | | | | |
| VRDN (c)(f) | | | | 2,385 | | | | 2,385 |
| | | | | | | | | 156,270 |
| |
| Louisiana – 2.3% | | | | | | | | |
| East Baton Rouge Mtg. Fing. Auth. Single Family Rev. | | | | | | | | |
| Participating VRDN: | | | | | | | | |
| Series MS 973, 2.57% (Liquidity Facility Morgan | | | | | | | | |
| Stanley) (c)(f)(g) | | | | 54,210 | | | | 54,210 |
| Series MS 996, 2.57% (Liquidity Facility Morgan | | | | | | | | |
| Stanley) (c)(f)(g) | | | | 9,995 | | | | 9,995 |
| Ernest N. Morial-New Orleans Exhibit Hall Auth. Spl. Tax | | | | | | | | |
| Participating VRDN Series ROC II R4038, 2.53% (Liquidity | | | | | | | | |
| Facility Citigroup Global Markets Hldgs., Inc.) (c)(g) | | | | 8,125 | | | | 8,125 |
| Iberville Parish Rev. (Dow Chemical Co. Proj.) Series 1999, | | | | | | | | |
| 2.55%, VRDN (c)(f) | | | | 7,500 | | | | 7,500 |
| Lafayette Utils. Rev. Participating VRDN: | | | | | | | | |
| Series Merlots B23, 2.4% (Liquidity Facility Wachovia Bank | | | | | | | | |
| NA) (c)(g) | | | | 14,000 | | | | 14,000 |
| Series PT 2323, 2.53% (Liquidity Facility Merrill Lynch & Co., | | | | | | | | |
| Inc.) (c)(g) | | | | 5,235 | | | | 5,235 |
| Lake Charles Hbr. & Term. District Dock & Wharf Rev. | | | | | | | | |
| (Conoco, Inc. Proj.) 2.5%, LOC JPMorgan Chase Bank, | | | | | | | | |
| VRDN (c)(f) | | | | 14,400 | | | | 14,400 |
| Louisiana Gas & Fuel Tax Rev. Participating VRDN: | | | | | | | | |
| Series EGL 7050038, 2.53% (Liquidity Facility Citibank | | | | | | | | |
| NA) (c)(g) | | | | 4,350 | | | | 4,350 |
| Series ROC II R7009, 2.53% (Liquidity Facility Citibank | | | | | | | | |
| NA) (c)(g) | | | | 16,000 | | | | 16,000 |
| Louisiana Hsg. Fin. Agcy. Mtg. Rev.: | | | | | | | | |
| Participating VRDN: | | | | | | | | |
| Series LB 99 A52, 2.68% (Liquidity Facility Bayerische | | | | | | | | |
| Hypo-und Vereinsbank AG) (c)(f)(g) | | | | 3,290 | | | | 3,290 |
| Series MS 1066, 2.57% (Liquidity Facility Morgan | | | | | | | | |
| Stanley) (c)(f)(g) | | | | 11,400 | | | | 11,400 |
| Series PT 516, 2.57% (Liquidity Facility Merrill Lynch & | | | | | | | | |
| Co., Inc.) (c)(f)(g) | | | | 4,080 | | | | 4,080 |
| Series ROC II R351, 2.57% (Liquidity Facility Citibank | | | | | | | | |
| NA) (c)(f)(g) | | | | 5,350 | | | | 5,350 |
See accompanying notes which are an integral part of the financial statements.
Annual Report
| Investments continued | | | | | | | | |
| |
| |
| Municipal Securities continued | | | | | | | | |
| | | | | Principal | | Value (Note 1) |
| | | Amount (000s) | | | | (000s) |
| Louisiana – continued | | | | | | | | |
| Louisiana Hsg. Fin. Agcy. Mtg. Rev.: – continued | | | | | | | | |
| Participating VRDN Series Clipper 05 11, 2.64% (Liquidity | | | | | | | | |
| Facility State Street Bank & Trust Co., Boston) (c)(f)(g) | | $ | | 5,132 | | $ | | 5,132 |
| Louisiana Pub. Facilities Auth. Rev. Participating VRDN | | | | | | | | |
| Series MT 46, 2.53% (Liquidity Facility Landesbank | | | | | | | | |
| Hessen-Thuringen) (c)(g) | | | | 7,995 | | | | 7,995 |
| New Orleans Aviation Board Rev. Series 1997 A, 2.55% | | | | | | | | |
| (MBIA Insured), VRDN (c)(f) | | | | 19,785 | | | | 19,785 |
| New Orleans Fin. Auth. Single Family Mortgage Rev. | | | | | | | | |
| Participating VRDN: | | | | | | | | |
| Series MS 1137, 2.57% (Liquidity Facility Morgan | | | | | | | | |
| Stanley) (c)(f)(g) | | | | 22,135 | | | | 22,135 |
| Series MS 857, 2.57% (Liquidity Facility Morgan | | | | | | | | |
| Stanley) (c)(f)(g) | | | | 22,135 | | | | 22,135 |
| New Orleans Gen. Oblig. Participating VRDN Series EGL 00 | | | | | | | | |
| 1801, 2.53% (Liquidity Facility Citibank NA, New | | | | | | | | |
| York) (c)(g) | | | | 5,790 | | | | 5,790 |
| New Orleans Indl. Dev. Board Multi-family Hsg. Rev. (LGD | | | | | | | | |
| Rental I Proj.) 2.54%, LOC Wachovia Bank NA, VRDN (c)(f) | | | | 6,500 | | | | 6,500 |
| Plaquemines Parish Envir. Rev. (BP Exploration & Oil, Inc. Proj.) | | | | | | | | |
| Series 1994, 2.44%, VRDN (c)(f) | | | | 21,050 | | | | 21,050 |
| Port New Orleans Board Commerce Rev. 2.55%, LOC BNP | | | | | | | | |
| Paribas SA, VRDN (c)(f) | | | | 9,855 | | | | 9,855 |
| South Louisiana Port Commission Port Facilities Rev. (Holnam, | | | | | | | | |
| Inc. Proj.) 2.45%, LOC Wachovia Bank NA, VRDN (c)(f) | | | | 12,600 | | | | 12,600 |
| West Baton Rouge Parish Indl. District #3 Rev.: | | | | | | | | |
| Bonds (Dow Chemical Co. Proj.) Series 1991, 2.8% tender | | | | | | | | |
| 10/17/05, CP mode | | | | 16,200 | | | | 16,200 |
| (Dow Chemical Co. Proj.): | | | | | | | | |
| Series 1993, 2.55%, VRDN (c)(f) | | | | 15,000 | | | | 15,000 |
| Series 1994 A, 2.55%, VRDN (c)(f) | | | | 8,200 | | | | 8,200 |
| Series 1994 B, 2.45%, VRDN (c) | | | | 8,900 | | | | 8,900 |
| Series 1995, 2.55%, VRDN (c)(f) | | | | 43,600 | | | | 43,600 |
| | | | | | | | | 382,812 |
| |
| Maine – 0.6% | | | | | | | | |
| Maine Hsg. Auth. Gen. Hsg. Rev. Participating VRDN: | | | | | | | | |
| Series MT 12, 2.58% (Liquidity Facility Merrill Lynch & Co., | | | | | | | | |
| Inc.) (c)(f)(g) | | | | 3,330 | | | | 3,330 |
| Series MT 3, 2.58% (Liquidity Facility Lloyds TSB Bank | | | | | | | | |
| PLC) (c)(f)(g) | | | | 21,160 | | | | 21,160 |
| Series MT 6, 2.58% (Liquidity Facility Merrill Lynch & Co., | | | | | | | | |
| Inc.) (c)(f)(g) | | | | 12,495 | | | | 12,495 |
See accompanying notes which are an integral part of the financial statements.
Annual Report
| Municipal Securities continued | | | | | | | | |
| | | | | Principal | | Value (Note 1) |
| | | Amount (000s) | | | | (000s) |
| Maine – continued | | | | | | | | |
| Maine Hsg. Auth. Gen. Hsg. Rev. Participating VRDN: - | | | | | | | | |
| continued | | | | | | | | |
| Series MT 77, 2.58% (Liquidity Facility Lloyds TSB Bank | | | | | | | | |
| PLC) (c)(f)(g) | | $ | | 8,665 | | $ | | 8,665 |
| Series PT 2336, 2.54% (Liquidity Facility Merrill Lynch & Co., | | | | | | | | |
| Inc.) (c)(g) | | | | 2,160 | | | | 2,160 |
| Series PT 2352, 2.58% (Liquidity Facility Merrill Lynch & Co., | | | | | | | | |
| Inc.) (c)(f)(g) | | | | 4,950 | | | | 4,950 |
| Series PT 2487, 2.54% (Liquidity Facility Merrill Lynch & Co., | | | | | | | | |
| Inc.) (c)(g) | | | | 5,790 | | | | 5,790 |
| Maine Hsg. Auth. Mtg. Purchase Rev.: | | | | | | | | |
| Participating VRDN Series BA 99 P, 2.64% (Liquidity Facility | | | | | | | | |
| Bank of America NA) (c)(f)(g) | | | | 13,295 | | | | 13,295 |
| Series 2003 E1, 2.54% (AMBAC Insured), VRDN (c) | | | | 10,000 | | | | 10,000 |
| Maine Pub. Util. Fin. Pub. Util. Rev. (Maine Pub. Svc. Co. Proj.) | | | | | | | | |
| Series 2000, 2.5%, LOC Bank of New York, New York, | | | | | | | | |
| VRDN (c)(f) | | | | 9,000 | | | | 9,000 |
| Maine Tpk. Auth. Tpk. Rev. Participating VRDN Series EGL 00 | | | | | | | | |
| 1901, 2.53% (Liquidity Facility Citibank NA, New | | | | | | | | |
| York) (c)(g) | | | | 2,000 | | | | 2,000 |
| | | | | | | | | 92,845 |
| |
| Maryland 1.6% | | | | | | | | |
| Anne Arundel County Econ. Dev. Rev. Bonds (Baltimore Gas & | | | | | | | | |
| Elec. Co. Proj.) 2.58% tender 9/2/05, LOC Wachovia Bank | | | | | | | | |
| NA, CP mode (f) | | | | 35,000 | | | | 35,000 |
| Anne Arundel County Port Facilities Rev. Bonds (Baltimore Gas | | | | | | | | |
| & Elec. Co. Proj.) Series 1985, 2.6% tender 9/9/05, LOC | | | | | | | | |
| Wachovia Bank NA, CP mode | | | | 21,100 | | | | 21,100 |
| Baltimore County Econ. Dev. Rev. (Blue Circle, Inc. Proj.) Series | | | | | | | | |
| 1992, 2.5%, LOC Danske Bank AS, VRDN (c) | | | | 2,000 | | | | 2,000 |
| Baltimore County Gen. Oblig. (Notre Dame Preparatory | | | | | | | | |
| School Proj.) 2.54%, LOC Manufacturers & Traders Trust | | | | | | | | |
| Co., VRDN (c) | | | | 6,750 | | | | 6,750 |
| Baltimore County Poll. Cont. Rev. Bonds (Baltimore Gas & Elec. | | | | | | | | |
| Co. Proj.) Series 1985, 2.75% tender 9/23/05, LOC | | | | | | | | |
| Wachovia Bank NA, CP mode | | | | 26,805 | | | | 26,805 |
| Baltimore Rev. Participating VRDN Series SGA 20, 2.41% | | | | | | | | |
| (Liquidity Facility Societe Generale) (c)(g) | | | | 13,900 | | | | 13,900 |
| Maryland Cmnty. Dev. Administration Dept. of Hsg. & Cmnty. | | | | | | | | |
| Dev.: | | | | | | | | |
| Participating VRDN: | | | | | | | | |
| Series LB 04 L24, 2.53% (Liquidity Facility Lehman | | | | | | | | |
| Brothers Hldgs., Inc.) (c)(f)(g) | | | | 12,315 | | | | 12,315 |
See accompanying notes which are an integral part of the financial statements.
39 Annual Report
| Investments continued | | | | | | | | |
| |
| |
| Municipal Securities continued | | | | | | | | |
| | | | | Principal | | Value (Note 1) |
| | | Amount (000s) | | | | (000s) |
| Maryland – continued | | | | | | | | |
| Maryland Cmnty. Dev. Administration Dept. of Hsg. & Cmnty. | | | | | | | | |
| Dev.: – continued | | | | | | | | |
| Participating VRDN: | | | | | | | | |
| Series LB 04 L59J, 2.53% (Liquidity Facility Lehman | | | | | | | | |
| Brothers Hldgs., Inc.) (c)(f)(g) | | $ | | 7,435 | | $ | | 7,435 |
| Series LB 04 L75J, 2.53% (Liquidity Facility Lehman | | | | | | | | |
| Brothers Hldgs., Inc.) (c)(f)(g) | | | | 9,860 | | | | 9,860 |
| (Parlane Apts. Proj.) Series 2001 C, 2.41%, LOC Fannie | | | | | | | | |
| Mae, VRDN (c)(f) | | | | 1,400 | | | | 1,400 |
| Maryland Econ. Dev. Auth. Rev. (Grafco Ind. Ltd. Proj.) Series | | | | | | | | |
| 1996, 2.55%, LOC Bank of America NA, VRDN (c)(f) | | | | 1,800 | | | | 1,800 |
| Maryland Econ. Dev. Corp. Air Cargo (AFCO Cargo BWI II | | | | | | | | |
| LLC Proj.) 2.54%, LOC Suntrust Bank, VRDN (c)(f) | | | | 1,700 | | | | 1,700 |
| Maryland Econ. Dev. Corp. Lease Rev. Participating VRDN | | | | | | | | |
| Series Floaters L9J, 2.53% (Liquidity Facility Lehman Brothers | | | | | | | | |
| Hldgs., Inc.) (c)(f)(g) | | | | 21,675 | | | | 21,675 |
| Maryland Energy Fing. Administration Ltd. Oblig. Rev. | | | | | | | | |
| (Comfort Link Proj.) 2.41%, LOC Suntrust Bank, VRDN (c)(f) . | | | | 15,000 | | | | 15,000 |
| Maryland Health & Higher Edl. Facilities Auth. Rev.: | | | | | | | | |
| Participating VRDN: | | | | | | | | |
| Series MS 867, 2.52% (Liquidity Facility Morgan | | | | | | | | |
| Stanley) (c)(g) | | | | 20,000 | | | | 20,000 |
| Series SGA 143, 2.41% (Liquidity Facility Societe | | | | | | | | |
| Generale) (c)(g) | | | | 8,295 | | | | 8,295 |
| Series A, 2.8% 9/9/05 (Liquidity Facility Bank of America | | | | | | | | |
| NA), CP | | | | 12,465 | | | | 12,465 |
| Montgomery County Hsg. Opportunity Commission Single | | | | | | | | |
| Family Mtg. Rev. Participating VRDN: | | | | | | | | |
| Series LB 04 5, 2.53% (Liquidity Facility Lehman Brothers | | | | | | | | |
| Hldgs., Inc.) (c)(f)(g) | | | | 2,600 | | | | 2,600 |
| Series MT 88, 2.54% (Liquidity Facility Landesbank | | | | | | | | |
| Hessen-Thuringen) (c)(g) | | | | 10,500 | | | | 10,500 |
| Northeast Maryland Waste Disp. Auth. Resource Recovery | | | | | | | | |
| Rev. Participating VRDN Series EGL 97 C2001, 2.53% | | | | | | | | |
| (Liquidity Facility Citibank NA, New York) (c)(g) | | | | 8,415 | | | | 8,415 |
| Northeast Maryland Waste Disp. Auth. Solid Waste Rev. | | | | | | | | |
| Participating VRDN: | | | | | | | | |
| Series PT 766, 2.57% (Liquidity Facility Landesbank | | | | | | | | |
| Hessen-Thuringen) (c)(f)(g) | | | | 7,735 | | | | 7,735 |
| Series PT 842, 2.57% (Liquidity Facility Lloyds TSB Bank | | | | | | | | |
| PLC) (c)(f)(g) | | | | 9,995 | | | | 9,995 |
| Prince Georges County Econ. Dev. Rev. (Cintas Corp. #41 | | | | | | | | |
| Proj.) 2.59%, LOC PNC Bank NA, Pittsburgh, VRDN (c)(f) | | | | 645 | | | | 645 |
| | | | | | | | | 257,390 |
See accompanying notes which are an integral part of the financial statements.
Annual Report
| Municipal Securities continued | | | | | | | | |
| | | | | Principal | | Value (Note 1) |
| | | Amount (000s) | | | | (000s) |
| Michigan – 2.8% | | | | | | | | |
| Detroit City School District Participating VRDN: | | | | | | | | |
| Series BA 02 H, 2.57% (Liquidity Facility Bank of America | | | | | | | | |
| NA) (c)(g) | | $ | | 4,620 | | $ | | 4,620 |
| Series EGL 7050072, 2.53% (Liquidity Facility Citibank | | | | | | | | |
| NA) (c)(g) | | | | 21,200 | | | | 21,200 |
| Series EGL 720050065, 2.53% (Liquidity Facility Citibank | | | | | | | | |
| NA) (c)(g) | | | | 9,900 | | | | 9,900 |
| Series ROC II R4004, 2.53% (Liquidity Facility Citigroup | | | | | | | | |
| Global Markets Hldgs., Inc.) (c)(g) | | | | 4,755 | | | | 4,755 |
| Detroit Gen. Oblig. Participating VRDN Series EGL 04 1006 | | | | | | | | |
| Class A, 2.53% (Liquidity Facility Citibank NA) (c)(g) | | | | 8,910 | | | | 8,910 |
| Detroit Swr. Disp. Rev. Participating VRDN: | | | | | | | | |
| Series AAB 05 3, 2.53% (Liquidity Facility ABN-AMRO Bank | | | | | | | | |
| NV) (c)(g) | | | | 14,420 | | | | 14,420 |
| Series EGL 72005001, 2.53% (Liquidity Facility Citibank | | | | | | | | |
| NA) (c)(g) | | | | 7,365 | | | | 7,365 |
| Series Merlots 00 I, 2.4% (Liquidity Facility Wachovia Bank | | | | | | | | |
| NA) (c)(g) | | | | 3,200 | | | | 3,200 |
| Series Merlots 04 B2, 2.4% (Liquidity Facility Wachovia | | | | | | | | |
| Bank NA) (c)(g) | | | | 9,300 | | | | 9,300 |
| Detroit Wtr. Supply Sys. Rev. Participating VRDN: | | | | | | | | |
| Series Merlots 00 D, 2.4% (Liquidity Facility Wachovia Bank | | | | | | | | |
| NA) (c)(g) | | | | 6,995 | | | | 6,995 |
| Series Putters 200, 2.53% (Liquidity Facility JPMorgan Chase | | | | | | | | |
| Bank) (c)(g) | | | | 4,100 | | | | 4,100 |
| Series Putters 345, 2.53% (Liquidity Facility JPMorgan Chase | | | | | | | | |
| Bank) (c)(g) | | | | 8,495 | | | | 8,495 |
| Detroit Wtr. Sys. Rev. Participating VRDN Series EGL 99 2202, | | | | | | | | |
| 2.53% (Liquidity Facility Citibank NA, New York) (c)(g) | | | | 12,520 | | | | 12,520 |
| Fitzgerald Pub. School District Participating VRDN Series | | | | | | | | |
| Putters 561, 2.53% (Liquidity Facility JPMorgan Chase | | | | | | | | |
| Bank) (c)(g) | | | | 1,000 | | | | 1,000 |
| Kentwood Pub. Schools Participating VRDN Series EGL 03 24, | | | | | | | | |
| 2.53% (Liquidity Facility Citibank NA, New York) (c)(g) | | | | 9,585 | | | | 9,585 |
| Lakeview School District Calhoun County Participating VRDN | | | | | | | | |
| Series PT 1624, 2.52% (Liquidity Facility Merrill Lynch & Co., | | | | | | | | |
| Inc.) (c)(g) | | | | 7,215 | | | | 7,215 |
| Macomb County Hosp. Fin. Auth. Rev. (Mount Clemens Gen. | | | | | | | | |
| Hosp. Proj.) Series 2003 A1, 2.44%, LOC Comerica Bank, | | | | | | | | |
| Detroit, VRDN (c) | | | | 14,720 | | | | 14,720 |
| Michigan Bldg. Auth. Rev. Participating VRDN: | | | | | | | | |
| Series LB 03 L34J, 2.53% (Liquidity Facility Lehman Brothers | | | | | | | | |
| Hldgs., Inc.) (c)(g) | | | | 10,645 | | | | 10,645 |
See accompanying notes which are an integral part of the financial statements.
41 Annual Report
| Investments continued | | | | | | | | |
| |
| |
| Municipal Securities continued | | | | | | | | |
| | | | | Principal | | Value (Note 1) |
| | | Amount (000s) | | | | (000s) |
| Michigan – continued | | | | | | | | |
| Michigan Bldg. Auth. Rev. Participating VRDN: – continued | | | | | | | | |
| Series PT 1954, 2.52% (Liquidity Facility Merrill Lynch & Co., | | | | | | | | |
| Inc.) (c)(g) | | $ | | 8,625 | | $ | | 8,625 |
| Michigan Gen. Oblig. Participating VRDN Series PT 2021, | | | | | | | | |
| 2.52% (Liquidity Facility Merrill Lynch & Co., Inc.) (c)(g) | | | | 4,435 | | | | 4,435 |
| Michigan Higher Ed. Student Ln. Auth. Rev. 2.39% (AMBAC | | | | | | | | |
| Insured), VRDN (c)(f) | | | | 9,000 | | | | 9,000 |
| Michigan Hosp. Fin. Auth. Hosp. Rev. Bonds Series PT 732, | | | | | | | | |
| 2.95%, tender 7/20/06 (Liquidity Facility Svenska | | | | | | | | |
| Handelsbanken AB) (c)(g)(h) | | | | 4,300 | | | | 4,300 |
| Michigan Hsg. Dev. Auth. Multi-family Hsg. Rev. (Lexington | | | | | | | | |
| Place Apts. Proj.) Series 1999 A, 2.53%, LOC Bank of | | | | | | | | |
| America NA, VRDN (c)(f) | | | | 7,520 | | | | 7,520 |
| Michigan Hsg. Dev. Auth. Rental Hsg. Rev. Series 2002 A, | | | | | | | | |
| 2.5% (MBIA Insured), VRDN (c)(f) | | | | 6,200 | | | | 6,200 |
| Michigan Hsg. Dev. Auth. Single Family Mtg. Rev.: | | | | | | | | |
| Series 1999 B2, 2.5% (MBIA Insured), VRDN (c)(f) | | | | 6,200 | | | | 6,200 |
| Series 2002 A, 2.5% (MBIA Insured), VRDN (c)(f) | | | | 4,000 | | | | 4,000 |
| Michigan Muni. Bond Auth. Rev.: | | | | | | | | |
| Participating VRDN: | | | | | | | | |
| Series BA 02 F, 2.57% (Liquidity Facility Bank of America | | | | | | | | |
| NA) (c)(g) | | | | 4,995 | | | | 4,995 |
| Series EGL 00 2201, 2.53% (Liquidity Facility Citibank | | | | | | | | |
| NA, New York) (c)(g) | | | | 10,110 | | | | 10,110 |
| Series MS 718, 2.52% (Liquidity Facility Morgan | | | | | | | | |
| Stanley) (c)(g) | | | | 17,169 | | | | 17,169 |
| RAN Series 2005 B2, 4% 8/18/06, LOC JPMorgan Chase | | | | | | | | |
| Bank | | | | 135,700 | | | | 137,069 |
| Michigan Strategic Fund Ltd. Oblig. Rev.: | | | | | | | | |
| (Fintex LLC Proj.) Series 2000, 2.66%, LOC Comerica Bank, | | | | | | | | |
| Detroit, VRDN (c)(f) | | | | 1,720 | | | | 1,720 |
| (Majestic Ind., Inc. Proj.) 2.66%, LOC Comerica Bank, | | | | | | | | |
| Detroit, VRDN (c)(f) | | | | 1,700 | | | | 1,700 |
| (Orchestra Place Renewal Proj.) Series 2000, 2.59%, LOC | | | | | | | | |
| ABN AMRO Bank NV, VRDN (c) | | | | 6,500 | | | | 6,500 |
| (YMCA Metropolitan Lansing Proj.) 2.6%, LOC Standard | | | | | | | | |
| Fed. Bank, VRDN (c) | | | | 9,900 | | | | 9,900 |
| Michigan Trunk Line Participating VRDN Series Floaters 01 | | | | | | | | |
| 569, 2.52% (Liquidity Facility Morgan Stanley) (c)(g) | | | | 8,450 | | | | 8,450 |
| Michigan Trunk Line Fund Participating VRDN: | | | | | | | | |
| Series Clipper 05 27, 2.61% (Liquidity Facility State Street | | | | | | | | |
| Bank & Trust Co., Boston) (c)(g) | | | | 13,620 | | | | 13,620 |
| Series EGL 7050042 Class A, 2.53% (Liquidity Facility | | | | | | | | |
| Citibank NA) (c)(g) | | | | 7,660 | | | | 7,660 |
See accompanying notes which are an integral part of the financial statements.
Annual Report
| Municipal Securities continued | | | | | | | | |
| | | | | Principal | | Value (Note 1) |
| | | Amount (000s) | | | | (000s) |
| Michigan – continued | | | | | | | | |
| Wayne County Arpt. Auth. Rev. Participating VRDN: | | | | | | | | |
| Series EGL 720050029, 2.57% (Liquidity Facility Citibank | | | | | | | | |
| NA) (c)(f)(g) | | $ | | 8,600 | | $ | | 8,600 |
| Series Putters 836, 2.56% (Liquidity Facility JPMorgan Chase | | | | | | | | |
| & Co.) (c)(f)(g) | | | | 7,610 | | | | 7,610 |
| Series Stars 132, 2.57% (Liquidity Facility BNP Paribas | | | | | | | | |
| SA) (c)(f)(g) | | | | 20,845 | | | | 20,845 |
| | | | | | | | | 465,173 |
| |
| Minnesota 2.8% | | | | | | | | |
| Anoka County Solid Waste Disp. Rev. Bonds (United Pwr. | | | | | | | | |
| Assoc. Proj.) Series 1988 A, 2.65% tender 9/9/05 (Nat’l. | | | | | | | | |
| Rural Utils. Coop. Fin. Corp. Guaranteed), CP mode (f) | | | | 3,350 | | | | 3,350 |
| Bloomington Health Care Facilities Rev. Participating VRDN | | | | | | | | |
| Series FRRI 03 L1J, 2.48% (Liquidity Facility Lehman Brothers | | | | | | | | |
| Hldgs., Inc.) (c)(g) | | | | 18,560 | | | | 18,560 |
| Dakota County Cmnty. Dev. Agcy. Multi-family Hsg. Rev.: | | | | | | | | |
| (Brentwood Hills Apts. Proj.) Series A, 2.42%, LOC Lasalle | | | | | | | | |
| Bank NA, VRDN (c)(f) | | | | 7,195 | | | | 7,195 |
| (Regatta Commons Proj.) Series A, 2.42%, LOC Lasalle Bank | | | | | | | | |
| NA, VRDN (c)(f) | | | | 3,100 | | | | 3,100 |
| Dakota County Cmnty. Dev. Agcy. Single Family Rev. | | | | | | | | |
| Participating VRDN: | | | | | | | | |
| Series MT 60, 2.58% (Liquidity Facility Landesbank | | | | | | | | |
| Hessen-Thuringen) (c)(f)(g) | | | | 8,775 | | | | 8,775 |
| Series MT 61, 2.58% (Liquidity Facility Landesbank | | | | | | | | |
| Hessen-Thuringen) (c)(f)(g) | | | | 20,780 | | | | 20,780 |
| Series PT 2816, 2.58% (Liquidity Facility Merrill Lynch & Co., | | | | | | | | |
| Inc.) (c)(f)(g) | | | | 9,205 | | | | 9,205 |
| Eagan Multi-family Rev. (Thomas Lake Place Apts. Proj.) Series | | | | | | | | |
| 2003 A1, 2.54%, LOC Fannie Mae, VRDN (c)(f) | | | | 4,325 | | | | 4,325 |
| Farmington Ind. School District #192 Participating VRDN | | | | | | | | |
| Series EGL 7050030 Class A, 2.53% (Liquidity Facility | | | | | | | | |
| Citibank NA) (c)(g) | | | | 23,380 | | | | 23,380 |
| Hennepin County Gen. Oblig. Series 1996 C, 2.6%, | | | | | | | | |
| VRDN (c)(f) | | | | 700 | | | | 700 |
| Hennepin County Hsg. & Redev. Auth. Multi-family Rev. (Stone | | | | | | | | |
| Arch Apts. Proj.) 2.54%, LOC Lasalle Bank NA, VRDN (c)(f) | | | | 5,600 | | | | 5,600 |
| Minneapolis & Saint Paul Hsg. Fin. Board Rev. Participating | | | | | | | | |
| VRDN: | | | | | | | | |
| Series MT 118, 2.58% (Liquidity Facility Landesbank | | | | | | | | |
| Hessen-Thuringen) (c)(f)(g) | | | | 21,000 | | | | 21,000 |
| Series MT 120, 2.54% (Liquidity Facility Landesbank | | | | | | | | |
| Hessen-Thuringen) (c)(g) | | | | 24,570 | | | | 24,570 |
See accompanying notes which are an integral part of the financial statements.
Annual Report
Investments continued
Municipal Securities continued
| | | | | Principal | | Value (Note 1) |
| | | Amount (000s) | | | | (000s) |
| Minnesota – continued | | | | | | | | |
| Minneapolis & Saint Paul Metropolitan Arpts. Commission | | | | | | | | |
| Arpt. Rev. Participating VRDN: | | | | | | | | |
| Series PT 1442, 2.57% (Liquidity Facility Merrill Lynch & Co., | | | | | | | | |
| Inc.) (c)(f)(g) | | $ | | 5,240 | | $ | | 5,240 |
| Series PT 1457, 2.58% (Liquidity Facility Merrill Lynch & Co., | | | | | | | | |
| Inc.) (c)(f)(g) | | | | 5,205 | | | | 5,205 |
| Series PT 1459, 2.58% (Liquidity Facility Merrill Lynch & Co., | | | | | | | | |
| Inc.) (c)(f)(g) | | | | 5,640 | | | | 5,640 |
| Series PT 2844, 2.57% (Liquidity Facility Merrill Lynch & Co., | | | | | | | | |
| Inc.) (c)(f)(g) | | | | 7,430 | | | | 7,430 |
| Series PT 2855, 2.57% (Liquidity Facility Merrill Lynch & Co., | | | | | | | | |
| Inc.) (c)(f)(g) | | | | 4,995 | | | | 4,995 |
| Series PT 735, 2.57% (Liquidity Facility BNP Paribas | | | | | | | | |
| SA) (c)(f)(g) | | | | 5,225 | | | | 5,225 |
| Series Putters 1029, 2.53% (Liquidity Facility JPMorgan | | | | | | | | |
| Chase & Co.) (c)(g) | | | | 5,040 | | | | 5,040 |
| Series Putters 941, 2.56% (Liquidity Facility JPMorgan Chase | | | | | | | | |
| Bank) (c)(f)(g) | | | | 4,140 | | | | 4,140 |
| Minneapolis Rev. Bonds 2.6%, tender 10/14/05 (c) | | | | 6,820 | | | | 6,820 |
| Minnesota Gen. Oblig. Participating VRDN Series MS 01 719, | | | | | | | | |
| 2.52% (Liquidity Facility Morgan Stanley) (c)(g) | | | | 36,500 | | | | 36,500 |
| Minnesota Hsg. Fin. Agcy.: | | | | | | | | |
| Bonds: | | | | | | | | |
| Series 2005 E, 2.95% 5/18/06 (f) | | | | 54,600 | | | | 54,600 |
| Series 2005 F, 2.95% 5/18/06 (f) | | | | 14,985 | | | | 14,985 |
| Participating VRDN: | | | | | | | | |
| Series LB 03 L28J, 2.58% (Liquidity Facility Lehman | | | | | | | | |
| Brothers Hldgs., Inc.) (c)(f)(g) | | | | 9,100 | | | | 9,100 |
| Series LB 04 L23, 2.53% (Liquidity Facility Lehman | | | | | | | | |
| Brothers Hldgs., Inc.) (c)(f)(g) | | | | 7,485 | | | | 7,485 |
| Series Merlots 01 B3, 2.45% (Liquidity Facility Wachovia | | | | | | | | |
| Bank NA) (c)(f)(g) | | | | 1,960 | | | | 1,960 |
| Series G, 2.52% (Liquidity Facility Lloyds TSB Bank PLC), | | | | | | | | |
| VRDN (c)(f) | | | | 8,955 | | | | 8,955 |
| Minnesota School District Tax & Aid Anticipation Borrowing | | | | | | | | |
| Prog. Ctfs. of Prtn. TAN Series 2004 A, 3% 9/2/05 | | | | 73,915 | | | | 73,916 |
| Rochester Health Care Facilities Rev. Bonds (Mayo | | | | | | | | |
| Foundation/Mayo Med. Ctr. Proj.): | | | | | | | | |
| Series 2000 A, 2.5% tender 9/9/05, CP mode | | | | 11,300 | | | | 11,300 |
| Series 2001 D: | | | | | | | | |
| 2.5% tender 9/9/05, CP mode | | | | 4,500 | | | | 4,500 |
| 2.75% tender 9/8/05, CP mode | | | | 15,000 | | | | 15,000 |
See accompanying notes which are an integral part of the financial statements.
| Municipal Securities continued | | | | | | | | |
| | | | | Principal | | Value (Note 1) |
| | | Amount (000s) | | | | (000s) |
| Minnesota – continued | | | | | | | | |
| Southern Minnesota Muni. Pwr. Agcy. Pwr. Supply Sys. Rev. | | | | | | | | |
| Series A, 2.55% 9/2/05 (Liquidity Facility Landesbank | | | | | | | | |
| Hessen-Thuringen), CP | | $ | | 19,000 | | $ | | 19,000 |
| Univ. of Minnesota Participating VRDN Series MS 01 648, | | | | | | | | |
| 2.52% (Liquidity Facility Morgan Stanley) (c)(g) | | | | 2,500 | | | | 2,500 |
| | | | | | | | | 460,076 |
| |
| Mississippi – 1.0% | | | | | | | | |
| Mississippi Bus. Fin. Corp. Envir. Impt. Rev. (Trex Co., Inc. | | | | | | | | |
| Proj.) 2.55%, LOC JPMorgan Chase Bank, VRDN (c)(f) | | | | 20,300 | | | | 20,300 |
| Mississippi Bus. Fin. Corp. Rev. (Calgon Carbon Corp. Proj.) | | | | | | | | |
| Series 1997, 2.64%, LOC PNC Bank NA, Pittsburgh, | | | | | | | | |
| VRDN (c)(f) | | | | 2,925 | | | | 2,925 |
| Mississippi Bus. Fin. Corp. Solid Waste Disp. Rev. (Waste | | | | | | | | |
| Mgmt., Inc. Proj.) 2.41%, LOC Fleet Nat’l. Bank, VRDN (c)(f) | | | | 5,000 | | | | 5,000 |
| Mississippi Gen. Oblig.: | | | | | | | | |
| Participating VRDN: | | | | | | | | |
| Series EGL 99 2401, 2.53% (Liquidity Facility Citibank | | | | | | | | |
| NA, New York) (c)(g) | | | | 10,900 | | | | 10,900 |
| Series Putters 138, 2.53% (Liquidity Facility JPMorgan | | | | | | | | |
| Chase & Co.) (c)(g) | | | | 11,935 | | | | 11,935 |
| BAN Series A, 2.75% 10/1/05 | | | | 12,915 | | | | 12,915 |
| Mississippi Home Corp. Multi-family Hsg. Rev.: | | | | | | | | |
| (Bristol Park Apts. Proj.) Series 2001 1, 2.62%, LOC | | | | | | | | |
| Southtrust Bank NA, VRDN (c)(f) | | | | 8,200 | | | | 8,200 |
| (Cambridge Park Apts. Proj.) Series 2001 3, 2.62%, LOC | | | | | | | | |
| Southtrust Bank NA, VRDN (c)(f) | | | | 9,800 | | | | 9,800 |
| (Colony Park Apts. Proj.) Series 1998 I, 2.62%, LOC | | | | | | | | |
| AmSouth Bank NA, Birmingham, VRDN (c)(f) | | | | 8,000 | | | | 8,000 |
| Mississippi Home Corp. Single Family Rev. Participating VRDN | | | | | | | | |
| Series MS 989, 2.57% (Liquidity Facility Morgan | | | | | | | | |
| Stanley) (c)(f)(g) | | | | 72,124 | | | | 72,124 |
| | | | | | | | | 162,099 |
| |
| Missouri – 1.5% | | | | | | | | |
| Bi-State Dev. Agcy. Rev. Participating VRDN Series SG 175, | | | | | | | | |
| 2.53% (Liquidity Facility Societe Generale) (c)(g) | | | | 18,000 | | | | 18,000 |
| Grandview Indl. Dev. Auth. Multi-family Hsg. Rev. (Briarwood | | | | | | | | |
| Apts. Proj.) 2.57%, LOC Fannie Mae, VRDN (c)(f) | | | | 13,000 | | | | 13,000 |
| Kansas City Ind. Dev. Auth. Multi-family Hsg. Rev. (Orchards | | | | | | | | |
| Apts. Proj.) 2.55%, LOC Fannie Mae, VRDN (c)(f) | | | | 10,750 | | | | 10,750 |
| Kansas City Indl. Dev. Auth. Air Cargo Facility Rev. (Kansas | | | | | | | | |
| City Air Cargo Svcs. Proj.) 2.57%, LOC JPMorgan Chase | | | | | | | | |
| Bank, VRDN (c)(f) | | | | 7,300 | | | | 7,300 |
See accompanying notes which are an integral part of the financial statements.
Annual Report
| Investments continued | | | | | | | | |
| |
| |
| Municipal Securities continued | | | | | | | | |
| | | | | Principal | | Value (Note 1) |
| | | Amount (000s) | | | | (000s) |
| Missouri – continued | | | | | | | | |
| Kansas City Passenger Facilities Charge Rev. Participating | | | | | | | | |
| VRDN Series MT 17, 2.57% (Liquidity Facility BNP Paribas | | | | | | | | |
| SA) (c)(f)(g) | | $ | | 11,810 | | $ | | 11,810 |
| Missouri Board Pub. Bldgs. Spl. Oblig. Participating VRDN | | | | | | | | |
| Series Merlots B38, 2.4% (Liquidity Facility Wachovia Bank | | | | | | | | |
| NA) (c)(g) | | | | 9,340 | | | | 9,340 |
| Missouri Dev. Fin. Board Indl. Dev. Rev. (Kawasaki Motors | | | | | | | | |
| Manufacturing Corp. Proj.) Series 1999, 2.54%, LOC | | | | | | | | |
| WestLB AG, VRDN (c)(f) | | | | 8,000 | | | | 8,000 |
| Missouri Health & Edl. Facilities Auth. Edl. Facilities Rev.: | | | | | | | | |
| Participating VRDN Series Merlots 00 B10, 2.4% (Liquidity | | | | | | | | |
| Facility Wachovia Bank NA) (c)(g) | | | | 13,300 | | | | 13,300 |
| (Lutheran High School Assoc. Proj.) 2.65%, LOC U.S. Bank | | | | | | | | |
| NA, Minnesota, VRDN (c) | | | | 5,000 | | | | 5,000 |
| Missouri Health & Edl. Facilities Auth. Health Facilities Rev.: | | | | | | | | |
| Participating VRDN: | | | | | | | | |
| Series MS 1049, 2.52% (Liquidity Facility Morgan | | | | | | | | |
| Stanley) (c)(g) | | | | 8,140 | | | | 8,140 |
| Series Putters 362, 2.53% (Liquidity Facility JPMorgan | | | | | | | | |
| Chase Bank) (c)(g) | | | | 10,815 | | | | 10,815 |
| (SSM Health Care Sys. Proj.) 2.36% (FGIC Insured), | | | | | | | | |
| VRDN (c) | | | | 20,000 | | | | 20,000 |
| Missouri Health & Edl. Facilities Auth. Rev. Participating VRDN | | | | | | | | |
| Series EGL 03 48, 2.53% (Liquidity Facility Citibank NA, | | | | | | | | |
| New York) (c)(g) | | | | 9,835 | | | | 9,835 |
| Missouri Hsg. Dev. Commission Single Family Mtg. Rev. | | | | | | | | |
| Participating VRDN: | | | | | | | | |
| Series BA 02 K, 2.62% (Liquidity Facility Bank of America | | | | | | | | |
| NA) (c)(f)(g) | | | | 5,125 | | | | 5,125 |
| Series Clipper 05 14, 2.69% (Liquidity Facility State Street | | | | | | | | |
| Bank & Trust Co., Boston) (c)(f)(g) | | | | 10,322 | | | | 10,322 |
| Series FRRI 03 L5J, 2.53% (Liquidity Facility Lehman Brothers | | | | | | | | |
| Hldgs., Inc.) (c)(f)(g) | | | | 7,125 | | | | 7,125 |
| Series FRRI A64, 2.68% (Liquidity Facility Bayerische | | | | | | | | |
| Hypo-und Vereinsbank AG) (c)(f)(g) | | | | 1,110 | | | | 1,110 |
| Series LB 04 L15, 2.53% (Liquidity Facility Lehman Brothers | | | | | | | | |
| Hldgs., Inc.) (c)(f)(g) | | | | 4,405 | | | | 4,405 |
| Series LB 04 L35J, 2.53% (Liquidity Facility Lehman Brothers | | | | | | | | |
| Hldgs., Inc.) (c)(f)(g) | | | | 6,865 | | | | 6,865 |
| Series Merlots 01 A28, 2.45% (Liquidity Facility Wachovia | | | | | | | | |
| Bank NA) (c)(f)(g) | | | | 2,295 | | | | 2,295 |
| Series PT 2038, 2.57% (Liquidity Facility Merrill Lynch & Co., | | | | | | | | |
| Inc.) (c)(f)(g) | | | | 4,745 | | | | 4,745 |
See accompanying notes which are an integral part of the financial statements.
Annual Report
| Municipal Securities continued | | | | | | | | |
| | | | | Principal | | Value (Note 1) |
| | | Amount (000s) | | | | (000s) |
| Missouri – continued | | | | | | | | |
| Missouri Hsg. Dev. Commission Single Family Mtg. Rev. | | | | | | | | |
| Participating VRDN: – continued | | | | | | | | |
| Series PT 2972, 2.57% (Liquidity Facility Merrill Lynch & Co., | | | | | | | | |
| Inc.) (c)(f)(g) | | $ | | 4,360 | | $ | | 4,360 |
| Series Putters 224, 2.56% (Liquidity Facility JPMorgan Chase | | | | | | | | |
| Bank) (c)(f)(g) | | | | 2,415 | | | | 2,415 |
| Saint Charles County Indl. Dev. Auth. Multi-family Rev. (Peine | | | | | | | | |
| Lakes Apts. Proj.) 2.54%, LOC Wachovia Bank NA, | | | | | | | | |
| VRDN (c)(f) | | | | 2,150 | | | | 2,150 |
| Saint Louis Arpt. Rev. Participating VRDN Series PT 2993, | | | | | | | | |
| 2.53% (Liquidity Facility Merrill Lynch & Co., Inc.) (c)(g) | | | | 17,755 | | | | 17,755 |
| Saint Louis Indl. Dev. Auth. (Metropolitan Lofts Apts. Proj.) | | | | | | | | |
| Series 2003 A, 2.42%, LOC Fannie Mae, VRDN (c)(f) | | | | 13,250 | | | | 13,250 |
| Saint Louis Indl. Dev. Auth. Elderly Hsg. Rev. (Homer G. Phillips | | | | | | | | |
| Historic Restoration Proj.): | | | | | | | | |
| Series 2001 A, 2.42%, LOC Lasalle Bank NA, VRDN (c)(f) | | | | 4,500 | | | | 4,500 |
| Series B, 2.42%, LOC Lasalle Bank NA, VRDN (c)(f) | | | | 15,500 | | | | 15,500 |
| | | | | | | | | 247,212 |
| |
| Montana 0.2% | | | | | | | | |
| Montana Board of Hsg. Participating VRDN: | | | | | | | | |
| Series BA 00 I, 2.64% (Liquidity Facility Bank of America | | | | | | | | |
| NA) (c)(f)(g) | | | | 4,795 | | | | 4,795 |
| Series LB 03 L33J, 2.58% (Liquidity Facility Lehman Brothers | | | | | | | | |
| Hldgs., Inc.) (c)(f)(g) | | | | 18,235 | | | | 18,235 |
| Series LB 04 6, 2.53% (Liquidity Facility Lehman Brothers | | | | | | | | |
| Hldgs., Inc.) (c)(f)(g) | | | | 7,635 | | | | 7,635 |
| Series Merlots 02 A19, 2.45% (Liquidity Facility Wachovia | | | | | | | | |
| Bank NA) (c)(f)(g) | | | | 2,305 | | | | 2,305 |
| | | | | | | | | 32,970 |
| |
| Nebraska – 1.5% | | | | | | | | |
| Douglas County Solid Waste Disp. Rev. (Waste Mgmt., Inc. | | | | | | | | |
| Proj.) Series A, 2.55%, LOC Bank of America NA, | | | | | | | | |
| VRDN (c)(f) | | | | 3,000 | | | | 3,000 |
| Nebhelp, Inc. Rev. Series C, 2.65% (MBIA Insured), | | | | | | | | |
| VRDN (c)(f) | | | | 15,300 | | | | 15,300 |
| Nebraska Invt. Fin. Auth. Single Family Hsg. Rev.: | | | | | | | | |
| Participating VRDN: | | | | | | | | |
| Series BA 00 H, 2.64% (Liquidity Facility Bank of America | | | | | | | | |
| NA) (c)(f)(g) | | | | 260 | | | | 260 |
| Series BA 98 J, 2.64% (Liquidity Facility Bank of America | | | | | | | | |
| NA) (c)(f)(g) | | | | 14,995 | | | | 14,995 |
See accompanying notes which are an integral part of the financial statements.
47 Annual Report
Investments continued
Municipal Securities continued
| | | | | Principal | | Value (Note 1) |
| | | Amount (000s) | | | | (000s) |
| Nebraska – continued | | | | | | | | |
| Nebraska Invt. Fin. Auth. Single Family Hsg. Rev.: – continued | | | | | | | | |
| Participating VRDN: | | | | | | | | |
| Series FRRI L31, 2.53% (Liquidity Facility Lehman Brothers | | | | | | | | |
| Hldgs., Inc.) (c)(f)(g) | | $ | | 2,135 | | $ | | 2,135 |
| Series Merlots 00 O, 2.45% (Liquidity Facility Wachovia | | | | | | | | |
| Bank NA) (c)(f)(g) | | | | 475 | | | | 475 |
| Series Merlots 00 UU, 2.45% (Liquidity Facility Wachovia | | | | | | | | |
| Bank NA) (c)(f)(g) | | | | 3,995 | | | | 3,995 |
| Series 2000 F, 2.5% (Liquidity Facility Fed. Home Ln. Bank | | | | | | | | |
| Topeka), VRDN (c)(f) | | | | 25,315 | | | | 25,315 |
| Series 2000 G, 2.5% (Liquidity Facility Fed. Home Ln. Bank | | | | | | | | |
| Topeka), VRDN (c)(f) | | | | 410 | | | | 410 |
| Series 2001 B, 2.5% (Liquidity Facility Fed. Home Ln. Bank | | | | | | | | |
| Topeka), VRDN (c)(f) | | | | 22,515 | | | | 22,515 |
| Series 2001 E, 2.5% (Liquidity Facility Fed. Home Ln. Bank | | | | | | | | |
| Topeka), VRDN (c)(f) | | | | 8,590 | | | | 8,590 |
| Series 2002 B, 2.5% (Liquidity Facility Fed. Home Ln. Bank | | | | | | | | |
| Topeka), VRDN (c)(f) | | | | 23,795 | | | | 23,795 |
| Series 2002 F: | | | | | | | | |
| 2.5% (Liquidity Facility Fed. Home Ln. Bank Topeka), | | | | | | | | |
| VRDN (c)(f) | | | | 22,165 | | | | 22,165 |
| 2.5% (Liquidity Facility Fed. Home Ln. Bank Topeka), | | | | | | | | |
| VRDN (c)(f) | | | | 2,415 | | | | 2,415 |
| Series 2003 B, 2.5% (Liquidity Facility Fed. Home Ln. Bank | | | | | | | | |
| Topeka), VRDN (c)(f) | | | | 15,295 | | | | 15,295 |
| Series 2003 E, 2.5% (Liquidity Facility Fed. Home Ln. Bank | | | | | | | | |
| Topeka), VRDN (c)(f) | | | | 9,780 | | | | 9,780 |
| Series 2004 B, 2.5% (Liquidity Facility Fed. Home Ln. Bank | | | | | | | | |
| Topeka), VRDN (c)(f) | | | | 11,850 | | | | 11,850 |
| Series 2004 G, 2.5% (Liquidity Facility Fed. Home Ln. Bank | | | | | | | | |
| Topeka), VRDN (c)(f) | | | | 10,000 | | | | 10,000 |
| Series 2005 B, 2.5% (Liquidity Facility Fed. Home Ln. Bank | | | | | | | | |
| Topeka), VRDN (c)(f) | | | | 16,000 | | | | 16,000 |
| Nebraska Pub. Pwr. District Rev. Participating VRDN Series | | | | | | | | |
| EGL 04 16 Class A, 2.53% (Liquidity Facility Citibank | | | | | | | | |
| NA) (c)(g) | | | | 5,330 | | | | 5,330 |
| Omaha Gen. Oblig. Participating VRDN Series EGL 04 10, | | | | | | | | |
| 2.53% (Liquidity Facility Citibank NA) (c)(g) | | | | 5,065 | | | | 5,065 |
| Omaha Pub. Pwr. District Elec. Rev.: | | | | | | | | |
| Participating VRDN Series ROC II R7008, 2.53% (Liquidity | | | | | | | | |
| Facility Citibank NA) (c)(g) | | | | 8,085 | | | | 8,085 |
See accompanying notes which are an integral part of the financial statements.
| Municipal Securities continued | | | | | | |
| | | Principal | | Value (Note 1) |
| Amount (000s) | | | | (000s) |
| Nebraska – continued | | | | | | |
| Omaha Pub. Pwr. District Elec. Rev.: – continued | | | | | | |
| 2.8% 9/15/05 (Liquidity Facility JPMorgan Chase Bank), CP $ | | 10,000 | | $ | | 10,000 |
| Omaha Spl. Oblig. Participating VRDN Series DB 125, 2.53% | | | | | | |
| (Liquidity Facility Deutsche Bank AG) (c)(g) | | 8,255 | | | | 8,255 |
| | | | | | | 245,025 |
| |
| Nevada 1.6% | | | | | | |
| Clark County Arpt. Rev.: | | | | | | |
| Participating VRDN: | | | | | | |
| Series EGL 720050024, 2.53% (Liquidity Facility Citibank | | | | | | |
| NA) (c)(g) | | 17,205 | | | | 17,205 |
| Series MT 31, 2.57% (Liquidity Facility Landesbank | | | | | | |
| Hessen-Thuringen) (c)(f)(g) | | 11,590 | | | | 11,590 |
| Series PT 2358, 2.57% (Liquidity Facility Merrill Lynch & | | | | | | |
| Co., Inc.) (c)(f)(g) | | 5,215 | | | | 5,215 |
| Series Putters 498, 2.56% (Liquidity Facility PNC Bank | | | | | | |
| NA, Pittsburgh) (c)(f)(g) | | 21,275 | | | | 21,275 |
| Series Stars 137, 2.53% (Liquidity Facility BNP Paribas | | | | | | |
| SA) (c)(g) | | 15,490 | | | | 15,490 |
| Series 2004 B, 2.42% (XL Cap. Assurance, Inc. Insured), | | | | | | |
| VRDN (c)(f) | | 10,100 | | | | 10,100 |
| Series C, 2.45% (XL Cap. Assurance, Inc. Insured), | | | | | | |
| VRDN (c)(f) | | 37,900 | | | | 37,900 |
| Clark County Gen. Oblig.: | | | | | | |
| Participating VRDN Series Putters 996, 2.53% (Liquidity | | | | | | |
| Facility Dresdner Bank AG) (c)(g) | | 6,550 | | | | 6,550 |
| Series 2003 A, 2.7% 9/2/05, CP | | 15,300 | | | | 15,300 |
| Clark County Las Vegas-McCarran Int’l. Arpt. Passenger | | | | | | |
| Facility Charge Rev. Participating VRDN Series Stars 91, | | | | | | |
| 2.57% (Liquidity Facility BNP Paribas SA) (c)(f)(g) | | 4,795 | | | | 4,795 |
| Clark County School District Participating VRDN: | | | | | | |
| Series FRRI 02 D, 2.55% (Liquidity Facility Bank of New | | | | | | |
| York, New York) (c)(g) | | 5,910 | | | | 5,910 |
| Series PA 1220, 2.53% (Liquidity Facility Merrill Lynch & | | | | | | |
| Co., Inc.) (c)(g) | | 13,425 | | | | 13,425 |
| Series PT 2406, 2.53% (Liquidity Facility Merrill Lynch & Co., | | | | | | |
| Inc.) (c)(g) | | 5,915 | | | | 5,915 |
| Series PT 2555, 2.53% (Liquidity Facility Merrill Lynch & Co., | | | | | | |
| Inc.) (c)(g) | | 10,980 | | | | 10,980 |
| Series PT 2565, 2.53% (Liquidity Facility Merrill Lynch & Co., | | | | | | |
| Inc.) (c)(g) | | 10,235 | | | | 10,235 |
| Series ROC II R2184, 2.53% (Liquidity Facility Citigroup | | | | | | |
| Global Markets Hldgs., Inc.) (c)(g) | | 14,585 | | | | 14,585 |
See accompanying notes which are an integral part of the financial statements.
49 Annual Report
| Investments continued | | | | | | | | |
| |
| |
| |
| Municipal Securities continued | | | | | | | | |
| | | | | Principal | | Value (Note 1) |
| | | Amount (000s) | | | | (000s) |
| Nevada – continued | | | | | | | | |
| Director of State Dept. Bus. & Ind. Indl. Dev. Rev. (Valley Joist, | | | | | | | | |
| Inc. Proj.) Series A, 2.62%, LOC AmSouth Bank NA, | | | | | | | | |
| Birmingham, VRDN (c)(f) | | $ | | 8,060 | | $ | | 8,060 |
| Las Vegas Valley Wtr. District Participating VRDN Series PT | | | | | | | | |
| 1672, 2.53% (Liquidity Facility Merrill Lynch & Co., | | | | | | | | |
| Inc.) (c)(g) | | | | 5,310 | | | | 5,310 |
| Nevada Gen. Oblig. Participating VRDN Series SGB 31, | | | | | | | | |
| 2.53% (Liquidity Facility Societe Generale) (c)(g) | | | | 23,100 | | | | 23,100 |
| Nevada Hsg. Division: | | | | | | | | |
| Participating VRDN Series Merlots 00 A6, 2.45% (Liquidity | | | | | | | | |
| Facility Wachovia Bank NA) (c)(f)(g) | | | | 2,750 | | | | 2,750 |
| (Horizon Apt. Hsg. Proj.) Series 2000 A, 2.55%, LOC | | | | | | | | |
| Fannie Mae, VRDN (c)(f) | | | | 5,510 | | | | 5,510 |
| Series 2002 A, 2.55%, LOC Fannie Mae, VRDN (c)(f) | | | | 7,510 | | �� | | 7,510 |
| Reno-Tahoe Arpt. Auth. New Arpt. Rev. Participating VRDN | | | | | | | | |
| Series PT 3108, 2.53% (Liquidity Facility Merrill Lynch & Co., | | | | | | | | |
| Inc.) (c)(g) | | | | 9,050 | | | | 9,050 |
| | | | | | | | | 267,760 |
| |
| New Hampshire – 1.2% | | | | | | | | |
| Clipper Tax-Exempt Ctfs. Trust Participating VRDN Series | | | | | | | | |
| Clipper 05 3, 2.6% (Liquidity Facility State Street Bank & | | | | | | | | |
| Trust Co., Boston) (c)(f)(g) | | | | 53,441 | | | | 53,441 |
| Manchester Arpt. Rev. 2.5% (FGIC Insured), VRDN (c)(f) | | | | 34,570 | | | | 34,570 |
| Manchester School Facilities Rev. Participating VRDN Series BS | | | | | | | | |
| 217, 2.41% (Liquidity Facility Bear Stearns Companies, | | | | | | | | |
| Inc.) (c)(g) | | | | 14,445 | | | | 14,445 |
| New Hampshire Bus. Fin. Auth. Poll. Cont. Rev. Bonds (New | | | | | | | | |
| England Pwr. Co. Proj.) Series 1990 A, 2.63% tender | | | | | | | | |
| 9/6/05, CP mode (f) | | | | 20,000 | | | | 20,000 |
| New Hampshire Bus. Fin. Auth. Rev. (Luminescent Sys., Inc. | | | | | | | | |
| Proj.) Series 1998, 2.6%, LOC HSBC Bank USA, VRDN (c)(f) | | | | 3,350 | | | | 3,350 |
| New Hampshire Bus. Fin. Auth. Solid Waste Disp. Rev. (Lonza | | | | | | | | |
| Biologies, Inc. Proj.) 2.59%, LOC Deutsche Bank AG, | | | | | | | | |
| VRDN (c)(f) | | | | 20,000 | | | | 20,000 |
| New Hampshire Higher Edl. & Health Facilities Auth. Rev. | | | | | | | | |
| Participating VRDN Series MS 866, 2.53% (Liquidity Facility | | | | | | | | |
| Morgan Stanley) (c)(g) | | | | 22,000 | | | | 22,000 |
| New Hampshire Hsg. Fin. Auth. Single Family Rev. | | | | | | | | |
| Participating VRDN: | | | | | | | | |
| Series BA 01 B, 2.64% (Liquidity Facility Bank of America | | | | | | | | |
| NA) (c)(f)(g) | | | | 2,050 | | | | 2,050 |
| Series Merlots 00 A29, 2.45% (Liquidity Facility Wachovia | | | | | | | | |
| Bank NA) (c)(f)(g) | | | | 2,405 | | | | 2,405 |
See accompanying notes which are an integral part of the financial statements.
| Municipal Securities continued | | | | | | | | |
| | | | | Principal | | Value (Note 1) |
| | | Amount (000s) | | | | (000s) |
| New Hampshire – continued | | | | | | | | |
| New Hampshire Hsg. Fin. Auth. Single Family Rev. | | | | | | | | |
| Participating VRDN: – continued | | | | | | | | |
| Series Merlots 00 B13, 2.45% (Liquidity Facility Wachovia | | | | | | | | |
| Bank NA) (c)(f)(g) | | $ | | 655 | | $ | | 655 |
| Series Merlots 01 A51, 2.45% (Liquidity Facility Wachovia | | | | | | | | |
| Bank NA) (c)(f)(g) | | | | 3,100 | | | | 3,100 |
| Series Merlots 97 F, 2.45% (Liquidity Facility Wachovia Bank | | | | | | | | |
| NA) (c)(f)(g) | | | | 2,395 | | | | 2,395 |
| Series PA 351, 2.57% (Liquidity Facility Merrill Lynch & Co., | | | | | | | | |
| Inc.) (c)(f)(g) | | | | 970 | | | | 970 |
| Series PT 348, 2.57% (Liquidity Facility Merrill Lynch & Co., | | | | | | | | |
| Inc.) (c)(f)(g) | | | | 955 | | | | 955 |
| Series Putters 357, 2.56% (Liquidity Facility JPMorgan Chase | | | | | | | | |
| & Co.) (c)(f)(g) | | | | 10,455 | | | | 10,455 |
| | | | | | | | | 190,791 |
| |
| New Jersey – 0.8% | | | | | | | | |
| New Jersey Gen. Oblig. TRAN Series 2005 A, 4% 6/23/06 . | | | | 116,700 | | | | 117,767 |
| New Jersey Trans. Trust Fund Auth. Participating VRDN Series | | | | | | | | |
| EGL 720050001 Class A, 2.53% (Liquidity Facility Citibank | | | | | | | | |
| NA) (c)(g) | | | | 17,500 | | | | 17,500 |
| | | | | | | | | 135,267 |
| |
| New Mexico – 0.2% | | | | | | | | |
| Bernalillo County Gross Receipt Tax Rev. Participating VRDN | | | | | | | | |
| Series BA 04B, 2.53% (Liquidity Facility Bank of America | | | | | | | | |
| NA) (c)(g) | | | | 5,160 | | | | 5,160 |
| Dona Ana County Indl. Dev. Rev. (Karr Tool & Manufacturing | | | | | | | | |
| Proj.) Series 1996, 2.42%, LOC U.S. Bank NA, Minnesota, | | | | | | | | |
| VRDN (c)(f) | | | | 1,785 | | | | 1,785 |
| Espanol Indl. Dev. Rev. (Nambee Mills, Inc. Proj.) Series A, | | | | | | | | |
| 2.72%, LOC Nat’l. City Bank, Indiana, VRDN (c)(f) | | | | 940 | | | | 940 |
| New Mexico Mtg. Fin. Auth. Participating VRDN: | | | | | | | | |
| Series Clipper 05 15, 2.69% (Liquidity Facility State Street | | | | | | | | |
| Bank & Trust Co., Boston) (c)(f)(g) | | | | 11,500 | | | | 11,500 |
| Series FRRI 03 L15, 2.53% (Liquidity Facility Lehman | | | | | | | | |
| Brothers Hldgs., Inc.) (c)(f)(g) | | | | 6,410 | | | | 6,410 |
| Series Merlots 00 A9, 2.45% (Liquidity Facility Wachovia | | | | | | | | |
| Bank NA) (c)(f)(g) | | | | 1,450 | | | | 1,450 |
| Series Merlots 01 A37, 2.45% (Liquidity Facility Wachovia | | | | | | | | |
| Bank NA) (c)(f)(g) | | | | 6,420 | | | | 6,420 |
See accompanying notes which are an integral part of the financial statements.
51 Annual Report
| Investments continued | | | | | | | | |
| |
| |
| Municipal Securities continued | | | | | | | | |
| | | | | Principal | | Value (Note 1) |
| | | Amount (000s) | | | | (000s) |
| New Mexico – continued | | | | | | | | |
| New Mexico Mtg. Fin. Auth. Participating VRDN: – continued | | | | | | | | |
| Series PA 118, 2.58% (Liquidity Facility Merrill Lynch & Co., | | | | | | | | |
| Inc.) (c)(f)(g) | | $ | | 445 | | $ | | 445 |
| Series PT 225, 2.57% (Liquidity Facility Merrill Lynch & Co., | | | | | | | | |
| Inc.) (c)(f)(g) | | | | 6,955 | | | | 6,955 |
| | | | | | | | | 41,065 |
| |
| New York – 1.1% | | | | | | | | |
| Bank of New York Muni. Ctfs. trust various states Participating | | | | | | | | |
| VRDN Series BNY 02 3, 2.55% (Liquidity Facility Bank of | | | | | | | | |
| New York, New York) (c)(f)(g) | | | | 1,500 | | | | 1,500 |
| Energy Northwest Elec. Rev. Participating VRDN Series MSTC | | | | | | | | |
| 02 188, 2.41% (Liquidity Facility Bear Stearns Companies, | | | | | | | | |
| Inc.) (c)(g) | | | | 10,995 | | | | 10,995 |
| New York City Gen. Oblig. Participating VRDN Series ROC II | | | | | | | | |
| R251, 2.56% (Citigroup Global Markets Hldgs., Inc. | | | | | | | | |
| Guaranteed) (Liquidity Facility Citigroup Global Markets | | | | | | | | |
| Hldgs., Inc.) (c)(g) | | | | 38,200 | | | | 38,200 |
| New York State Dorm. Auth. Revs. Participating VRDN Series | | | | | | | | |
| PT 2646, 2.52% (Liquidity Facility Merrill Lynch & Co., | | | | | | | | |
| Inc.) (c)(g) | | | | 32,630 | | | | 32,630 |
| New York State Hsg. Fin. Agcy. Rev. Series A, 2.35%, LOC | | | | | | | | |
| Landesbank Hessen-Thuringen, VRDN (c) | | | | 30,000 | | | | 30,000 |
| New York State Mtg. Agcy. Rev. Participating VRDN Series PA | | | | | | | | |
| 410, 2.54% (Liquidity Facility Merrill Lynch & Co., | | | | | | | | |
| Inc.) (c)(f)(g) | | | | 3,650 | | | | 3,650 |
| New York State Pwr. Auth. & Gen. Purp. Rev. Series 1997 2, | | | | | | | | |
| 2.5% 9/1/05, CP | | | | 53,940 | | | | 53,940 |
| New York Transitional Fin. Auth. Rev. Bonds Series FRRI 01 | | | | | | | | |
| N11, 2.6%, tender 9/14/05 (Liquidity Facility Bank of New | | | | | | | | |
| York, New York) (c)(g)(h) | | | | 10,000 | | | | 10,000 |
| | | | | | | | | 180,915 |
| |
| Non State Specific 0.9% | | | | | | | | |
| Clipper Tax-Exempt Ctfs. Trust Participating VRDN: | | | | | | | | |
| Series Clipper 04 11, 2.64% (Liquidity Facility State Street | | | | | | | | |
| Bank & Trust Co., Boston) (c)(f)(g) | | | | 27,156 | | | | 27,156 |
| Series Clipper 05 18, 2.64% (Liquidity Facility Merrill Lynch | | | | | | | | |
| & Co., Inc.) (c)(f)(g) | | | | 28,635 | | | | 28,635 |
| Series Clipper 05 19, 2.64% (Liquidity Facility Merrill Lynch | | | | | | | | |
| & Co., Inc.) (c)(f)(g) | | | | 15,360 | | | | 15,360 |
| Series Clipper 05 7, 2.61% (Liquidity Facility State Street | | | | | | | | |
| Bank & Trust Co., Boston) (c)(g) | | | | 17,100 | | | | 17,100 |
See accompanying notes which are an integral part of the financial statements.
Annual Report
| Municipal Securities continued | | | | | | | | |
| | | | | Principal | | Value (Note 1) |
| | | Amount (000s) | | | | (000s) |
| Non State Specific continued | | | | | | | | |
| Lehman Brothers Pooled Muni. Trust Receipts Participating | | | | | | | | |
| VRDN: | | | | | | | | |
| Series LB 04 L68J, 2.53% (Liquidity Facility Lehman Brothers | | | | | | | | |
| Hldgs., Inc.) (c)(f)(g) | | $ | | 22,445 | | $ | | 22,445 |
| Series LB 05 L11, 2.53% (Liquidity Facility Lehman Brothers | | | | | | | | |
| Hldgs., Inc.) (c)(f)(g) | | | | 13,915 | | | | 13,915 |
| Series LB 05 LJ5, 2.53% (Liquidity Facility Lehman Brothers | | | | | | | | |
| Hldgs., Inc.) (c)(f)(g) | | | | 26,580 | | | | 26,580 |
| | | | | | | | | 151,191 |
| |
| North Carolina – 1.3% | | | | | | | | |
| Catawba County Indl. Facilities & Poll. Cont. Fin. Auth. Rev. | | | | | | | | |
| (Kroehler Furniture Proj.) Series 1998, 2.62%, LOC Nat’l. | | | | | | | | |
| City Bank, VRDN (c)(f) | | | | 2,700 | | | | 2,700 |
| Charlotte Arpt. Rev. Participating VRDN Series ROC II 99 R9, | | | | | | | | |
| 2.57% (Liquidity Facility Citibank NA) (c)(f)(g) | | | | 3,000 | | | | 3,000 |
| Charlotte Wtr. & Swr. Sys. Rev. 2.8% 1/20/06 (Liquidity | | | | | | | | |
| Facility Wachovia Bank NA), CP | | | | 14,800 | | | | 14,800 |
| Columbus County Indl. Facilities & Poll. Cont. Rev. | | | | | | | | |
| (Conflandey, Inc. Proj.) 2.6%, LOC BNP Paribas SA, | | | | | | | | |
| VRDN (c)(f) | | | | 3,500 | | | | 3,500 |
| Concord Multi-family Hsg. Rev. (Concord Chase Apts. Proj.) | | | | | | | | |
| 2.54%, LOC Suntrust Bank, VRDN (c)(f) | | | | 5,655 | | | | 5,655 |
| Forsyth County Ctfs. of Prtn. Participating VRDN: | | | | | | | | |
| Series ROC II R7010, 2.53% (Liquidity Facility Citibank | | | | | | | | |
| NA) (c)(g) | | | | 16,215 | | | | 16,215 |
| Series ROC II R7529, 2.53% (Liquidity Facility Citibank | | | | | | | | |
| NA) (c)(g) | | | | 10,855 | | | | 10,855 |
| Gaston County Indl. Facilities & Poll. Cont. Fing. Auth. Rev. | | | | | | | | |
| (Duke Energy Corp. Proj.) Series 1999, 2.56%, VRDN (c)(f) . | | | | 1,200 | | | | 1,200 |
| Henderson County Indl. Facilities & Poll. Cont. Fin. Auth. Rev. | | | | | | | | |
| (American Coating Technologies Proj.) 2.7%, LOC | | | | | | | | |
| Huntington Nat’l. Bank, Columbus, VRDN (c)(f) | | | | 3,650 | | | | 3,650 |
| North Carolina Agric. Fin. Auth. Agric. Dev. Rev. (J.W. Jones | | | | | | | | |
| Lumber Co. Proj.) Series 2000, 2.54%, LOC Wachovia Bank | | | | | | | | |
| NA, VRDN (c)(f) | | | | 4,000 | | | | 4,000 |
| North Carolina Gen. Oblig. Participating VRDN Series PT | | | | | | | | |
| 1962, 2.53% (Liquidity Facility Merrill Lynch & Co., | | | | | | | | |
| Inc.) (c)(g) | | | | 5,430 | | | | 5,430 |
| North Carolina Hsg. Fin. Agcy. Home Ownership Rev. | | | | | | | | |
| Participating VRDN: | | | | | | | | |
| Series Clipper 05 8, 2.57% (Liquidity Facility State Street | | | | | | | | |
| Bank & Trust Co., Boston) (c)(f)(g) | | | | 25,300 | | | | 25,300 |
See accompanying notes which are an integral part of the financial statements.
Annual Report
Investments continued
Municipal Securities continued
| | | | | Principal | | Value (Note 1) |
| | | Amount (000s) | | | | (000s) |
| North Carolina – continued | | | | | | | | |
| North Carolina Hsg. Fin. Agcy. Home Ownership Rev. | | | | | | | | |
| Participating VRDN: – continued | | | | | | | | |
| Series FRRI 02 L7, 2.53% (Liquidity Facility Lehman Brothers | | | | | | | | |
| Hldgs., Inc.) (c)(f)(g) | | $ | | 5,150 | | $ | | 5,150 |
| Series FRRI 03 L17, 2.53% (Liquidity Facility Lehman | | | | | | | | |
| Brothers Hldgs., Inc.) (c)(f)(g) | | | | 2,100 | | | | 2,100 |
| North Carolina Med. Care Commission Rev. Participating | | | | | | | | |
| VRDN Series ROC II R296, 2.53% (Liquidity Facility Citibank | | | | | | | | |
| NA) (c)(g) | | | | 3,000 | | | | 3,000 |
| North Carolina Muni. Pwr. Agcy. #1 Catawba Elec. Rev. | | | | | | | | |
| Participating VRDN Series Putters 341, 2.53% (Liquidity | | | | | | | | |
| Facility JPMorgan Chase & Co.) (c)(g) | | | | 13,415 | | | | 13,415 |
| Piedmont Triad Arpt. Auth. Series B, 2.55% (XL Cap. | | | | | | | | |
| Assurance, Inc. Insured), VRDN (c)(f) | | | | 11,500 | | | | 11,500 |
| Piedmont Triad Arpt. Auth. Spl. Facilities Rev. (Triad Int’l. | | | | | | | | |
| Maintenance Corp. Proj.) Series 1989, 2.7%, LOC Citibank | | | | | | | | |
| NA, New York, VRDN (c)(f) | | | | 6,900 | | | | 6,900 |
| Rockingham County Indl. Facilities & Poll. Cont. Fing. Auth. | | | | | | | | |
| Rev.: | | | | | | | | |
| (New Generation Corp. Proj.) Series 1999, 2.54%, LOC | | | | | | | | |
| Wachovia Bank NA, VRDN (c)(f) | | | | 3,000 | | | | 3,000 |
| (Pine Brick Co., Inc. Proj.) Series 2000, 2.54%, LOC | | | | | | | | |
| Wachovia Bank NA, VRDN (c)(f) | | | | 7,300 | | | | 7,300 |
| Sampson County Indl. Facilities & Poll. Cont. Fing. Auth. Envir. | | | | | | | | |
| Facilities Rev. (Sampson County Disp., Inc. Proj.) 2.54%, | | | | | | | | |
| LOC Wachovia Bank NA, VRDN (c)(f) | | | | 34,355 | | | | 34,355 |
| Union County Indl. Facilities & Poll. Cont. Fing. Auth. Indl. Dev. | | | | | | | | |
| Rev. (Greiner Vacuette NA Proj.) 2.54%, LOC Wachovia | | | | | | | | |
| Bank NA, VRDN (c)(f) | | | | 7,500 | | | | 7,500 |
| Union County Indl. Facilities & Poll. Cont. Fing. Auth. Rev. | | | | | | | | |
| (Rock Tenn Converting Corp. Proj.) 2.54%, LOC Suntrust | | | | | | | | |
| Bank, VRDN (c)(f) | | | | 2,750 | | | | 2,750 |
| Univ. Sys. Pool Rev. Participating VRDN Series PT 1614, | | | | | | | | |
| 2.53% (Liquidity Facility Merrill Lynch & Co., Inc.) (c)(g) | | | | 9,030 | | | | 9,030 |
| Wake County Hsg. Auth. Multi-family Rev. (Grove at Cary Park | | | | | | | | |
| Apt. Proj.) Series 2001 A, 2.41%, LOC Suntrust Bank, | | | | | | | | |
| VRDN (c)(f) | | | | 6,840 | | | | 6,840 |
| Wake County Indl. Facilities & Poll. Cont. Fin. Agcy. Indl. Dev. | | | | | | | | |
| Rev. (Carolina Indl. LLC Proj.) Series 1997, 2.66%, LOC | | | | | | | | |
| Harris NA, VRDN (c)(f) | | | | 1,650 | | | | 1,650 |
| Wilmington Hsg. Auth. Multi-family Rev. (Garden Lake Estates | | | | | | | | |
| Proj.) Series 1999, 2.54%, LOC Suntrust Bank, VRDN (c)(f) . | | | | 5,400 | | | | 5,400 |
| | | | | | | | | 216,195 |
See accompanying notes which are an integral part of the financial statements.
| Municipal Securities continued | | | | | | | | |
| | | | | Principal | | Value (Note 1) |
| | | Amount (000s) | | | | (000s) |
| North Dakota 0.1% | | | | | | | | |
| Mercer County Poll. Cont. Rev. (United Pwr. Assoc. Proj.) Series | | | | | | | | |
| 1994 C, 2.65% (Nat’l. Rural Utils. Coop. Fin. Corp. | | | | | | | | |
| Guaranteed), VRDN (c) | | $ | | 8,545 | | $ | | 8,545 |
| Ohio – 1.3% | | | | | | | | |
| Cincinnati Student Ln. Fdg. Corp. Student Ln. Rev.: | | | | | | | | |
| Series 1998 A1, 2.42% (Liquidity Facility Sallie Mae), | | | | | | | | |
| VRDN (c)(f) | | | | 35,700 | | | | 35,700 |
| Series 1998 A2, 2.42% (Liquidity Facility Sallie Mae), | | | | | | | | |
| VRDN (c)(f) | | | | 34,200 | | | | 34,200 |
| Cincinnati Technical & Cmnty. College Gen. Receipts | | | | | | | | |
| Participating VRDN Series PT 02 1587, 2.52% (Liquidity | | | | | | | | |
| Facility Merrill Lynch & Co., Inc.) (c)(g) | | | | 6,480 | | | | 6,480 |
| Cuyahoga County Health Care Facilities Rev. (Althenheim | | | | | | | | |
| Proj.) 2.54%, LOC U.S. Bank NA, Minnesota, VRDN (c) | | | | 7,800 | | | | 7,800 |
| Delaware County Health Care Facilities (Willow Brook | | | | | | | | |
| Christian Cmnty. Proj.) Series 1999, 2.65%, LOC Huntington | | | | | | | | |
| Nat’l. Bank, Columbus, VRDN (c) | | | | 5,800 | | | | 5,800 |
| Ohio Gen. Oblig. Participating VRDN Series ROC II R1068, | | | | | | | | |
| 2.53% (Liquidity Facility Citigroup Global Markets Hldgs., | | | | | | | | |
| Inc.) (c)(g) | | | | 2,895 | | | | 2,895 |
| Ohio Higher Edl. Facility Commission Rev.: | | | | | | | | |
| 2.5% 9/9/05 (Liquidity Facility JPMorgan Chase Bank), CP . | | | | 13,000 | | | | 13,000 |
| 2.75% 9/8/05 (Liquidity Facility JPMorgan Chase Bank), CP | | | | 9,000 | | | | 9,000 |
| Ohio Hsg. Fin. Agcy. Mtg. Rev. Participating VRDN: | | | | | | | | |
| Series BA 00 F, 2.64% (Liquidity Facility Bank of America | | | | | | | | |
| NA) (c)(f)(g) | | | | 6,130 | | | | 6,130 |
| Series BA 00 Q, 2.64% (Liquidity Facility Bank of America | | | | | | | | |
| NA) (c)(f)(g) | | | | 750 | | | | 750 |
| Series BA 98 B, 2.64% (Liquidity Facility Bank of America | | | | | | | | |
| NA) (c)(f)(g) | | | | 20,300 | | | | 20,300 |
| Series BA 98 Q, 2.64% (Liquidity Facility Bank of America | | | | | | | | |
| NA) (c)(f)(g) | | | | 20,395 | | | | 20,395 |
| Series BA 99 Q, 2.64% (Liquidity Facility Bank of America | | | | | | | | |
| NA) (c)(f)(g) | | | | 825 | | | | 825 |
| Series LB 03 L46J, 2.53% (Liquidity Facility Lehman Brothers | | | | | | | | |
| Hldgs., Inc.) (c)(f)(g) | | | | 4,915 | | | | 4,915 |
| Series PT 241, 2.57% (Liquidity Facility Merrill Lynch & Co., | | | | | | | | |
| Inc.) (c)(f)(g) | | | | 4,280 | | | | 4,280 |
| Series PT 582, 2.57% (Liquidity Facility Svenska | | | | | | | | |
| Handelsbanken AB) (c)(f)(g) | | | | 3,100 | | | | 3,100 |
| Ohio Hsg. Fin. Agcy. Multi-family Hsg. Rev.: | | | | | | | | |
| (Club at Spring Valley Apts. Proj.) Series 1996 A, 2.42%, | | | | | | | | |
| LOC Key Bank NA, VRDN (c)(f) | | | | 3,800 | | | | 3,800 |
See accompanying notes which are an integral part of the financial statements.
Annual Report
| Investments continued | | | | | | | | |
| |
| |
| Municipal Securities continued | | | | | | | | |
| | | | | Principal | | Value (Note 1) |
| | | Amount (000s) | | | | (000s) |
| Ohio – continued | | | | | | | | |
| Ohio Hsg. Fin. Agcy. Multi-family Hsg. Rev.: – continued | | | | | | | | |
| (Pedcor Invt. Willowlake Apts. Proj.) Series A, 2.57%, LOC | | | | | | | | |
| Fed. Home Ln. Bank, Indianapolis, VRDN (c)(f) | | $ | | 2,400 | | $ | | 2,400 |
| Ohio Solid Waste Rev. (BP Products NA, Inc. Proj.) 2.44% (BP | | | | | | | | |
| PLC Guaranteed), VRDN (c)(f) | | | | 20,700 | | | | 20,700 |
| Ohio Wtr. Dev. Auth. (Waste Mgmt., Inc. Proj.) Series B, | | | | | | | | |
| 2.48%, LOC Fleet Bank NA, VRDN (c)(f) | | | | 8,100 | | | | 8,100 |
| Richland County Indl. Dev. Rev. (Sabin Robbins Paper Co. | | | | | | | | |
| Proj.) Series 1997, 2.62%, LOC Standard Fed. Bank, | | | | | | | | |
| VRDN (c)(f) | | | | 800 | | | | 800 |
| Stark County Indl. Dev. Rev. (H-P Products, Inc. Proj.) 2.51%, | | | | | | | | |
| LOC Key Bank NA, VRDN (c)(f) | | | | 2,200 | | | | 2,200 |
| | | | | | | | | 213,570 |
| |
| Oklahoma – 1.1% | | | | | | | | |
| Clipper Tax-Exempt Trust Participating VRDN Series Clipper 04 | | | | | | | | |
| 3, 2.61% (Liquidity Facility State Street Bank & Trust Co., | | | | | | | | |
| Boston) (c)(f)(g) | | | | 24,500 | | | | 24,500 |
| Comanche County Indl. Dev. Auth. Rev. (Silver Line Plastics | | | | | | | | |
| Corp. Proj.) Series 2000, 2.54%, LOC Wachovia Bank NA, | | | | | | | | |
| VRDN (c)(f) | | | | 7,100 | | | | 7,100 |
| Grand River Dam Auth. Rev. Participating VRDN Series PT | | | | | | | | |
| 1953, 2.53% (Liquidity Facility Merrill Lynch & Co., | | | | | | | | |
| Inc.) (c)(g) | | | | 9,995 | | | | 9,995 |
| Guymon Util. Auth. Rev. (Seaboard Proj.) Series 1995, 2.54%, | | | | | | | | |
| LOC Suntrust Bank, VRDN (c)(f) | | | | 3,300 | | | | 3,300 |
| Muskogee Med. Ctr. Auth. Rev. 2.55%, LOC Bank of America | | | | | | | | |
| NA, VRDN (c) | | | | 7,400 | | | | 7,400 |
| Oklahoma City Gen. Oblig. Participating VRDN Series Putters | | | | | | | | |
| 743, 2.53% (Liquidity Facility JPMorgan Chase Bank) (c)(g) . | | | | 2,595 | | | | 2,595 |
| Oklahoma Dev. Fin. Auth. Rev.: | | | | | | | | |
| Bonds (ConocoPhillips Co. Proj.) 2.42%, tender | | | | | | | | |
| 12/1/05 (c)(f) | | | | 10,000 | | | | 10,000 |
| (ConocoPhillips Co. Proj.) 2.41%, LOC JPMorgan Chase | | | | | | | | |
| Bank, VRDN (c)(f) | | | | 3,000 | | | | 3,000 |
| (Shawnee Fdg. LP Proj.) Series 1996, 2.54%, LOC Bank of | | | | | | | | |
| Nova Scotia, VRDN (c)(f) | | | | 3,100 | | | | 3,100 |
| Oklahoma Gen. Oblig. Participating VRDN Series PT 1879, | | | | | | | | |
| 2.53% (Liquidity Facility Merrill Lynch & Co., Inc.) (c)(g) | | | | 9,620 | | | | 9,620 |
| Oklahoma Hsg. Fin. Agcy. Single Family Mtg. Rev. | | | | | | | | |
| Participating VRDN: | | | | | | | | |
| Series LB 03 L29J, 2.53% (Liquidity Facility Lehman Brothers | | | | | | | | |
| Hldgs., Inc.) (c)(f)(g) | | | | 6,100 | | | | 6,100 |
See accompanying notes which are an integral part of the financial statements.
Annual Report
| Municipal Securities continued | | | | | | | | |
| | | | | Principal | | Value (Note 1) |
| | | Amount (000s) | | | | (000s) |
| Oklahoma – continued | | | | | | | | |
| Oklahoma Hsg. Fin. Agcy. Single Family Mtg. Rev. | | | | | | | | |
| Participating VRDN: – continued | | | | | | | | |
| Series LB 99 A5, 2.68% (Liquidity Facility Bayerische | | | | | | | | |
| Hypo-und Vereinsbank AG) (c)(f)(g) | | $ | | 2,135 | | $ | | 2,135 |
| Series PT 167, 2.57% (Liquidity Facility BNP Paribas | | | | | | | | |
| SA) (c)(f)(g) | | | | 1,380 | | | | 1,380 |
| Oklahoma Student Ln. Auth. Rev.: | | | | | | | | |
| Series 2002 A1, 2.39% (MBIA Insured), VRDN (c)(f) | | | | 22,125 | | | | 22,125 |
| Series 2003 A2, 2.39% (MBIA Insured), VRDN (c)(f) | | | | 24,000 | | | | 24,000 |
| Series A, 2.39% (MBIA Insured), VRDN (c)(f) | | | | 10,000 | | | | 10,000 |
| Tulsa County Hsg. Fin. Auth. Single Family Mtg. Rev. | | | | | | | | |
| Participating VRDN: | | | | | | | | |
| Series MS 01 582, 2.57% (Liquidity Facility Morgan | | | | | | | | |
| Stanley) (c)(f)(g) | | | | 14,100 | | | | 14,100 |
| Series MS 1068, 2.57% (Liquidity Facility Morgan | | | | | | | | |
| Stanley) (c)(f)(g) | | | | 5,870 | | | | 5,870 |
| Tulsa Indl. Auth. Indl. Dev. Rev. (Southwest United Ind., | | | | | | | | |
| Inc./Southwest Aeroservices Proj.) Series 1998, 2.6%, LOC | | | | | | | | |
| Bank of America NA, VRDN (c)(f) | | | | 2,200 | | | | 2,200 |
| Tulsa Int’l. Arpt. Gen. Rev. Participating VRDN: | | | | | | | | |
| Series BA 97 B1, 2.69% (Liquidity Facility Bank of America | | | | | | | | |
| NA) (c)(f)(g) | | | | 9,485 | | | | 9,485 |
| Series BA 97 B2, 2.64% (Liquidity Facility Bank of America | | | | | | | | |
| NA) (c)(g) | | | | 7,000 | | | | 7,000 |
| | | | | | | | | 185,005 |
| |
| Oregon – 0.6% | | | | | | | | |
| Clackamus County School District #7J Participating VRDN | | | | | | | | |
| Series PT 3066, 2.53% (Liquidity Facility Merrill Lynch & Co., | | | | | | | | |
| Inc.) (c)(g) | | | | 9,525 | | | | 9,525 |
| Multnomah County Hosp. Facilities Auth. Rev. Participating | | | | | | | | |
| VRDN Series PA 1257, 2.54% (Liquidity Facility Merrill | | | | | | | | |
| Lynch & Co., Inc.) (c)(g) | | | | 5,000 | | | | 5,000 |
| Oregon Dept. Administrative Services Participating VRDN | | | | | | | | |
| Series EGL 04 2011, 2.53% (Liquidity Facility Citibank | | | | | | | | |
| NA) (c)(g) | | | | 4,500 | | | | 4,500 |
| Oregon Econ. & Cmnty. Econ. Dev. Rev. (American Bridge Co. | | | | | | | | |
| Proj.) Series 205, 2.62%, LOC Nat’l. City Bank, PA, | | | | | | | | |
| VRDN (c)(f) | | | | 4,585 | | | | 4,585 |
| Oregon Gen. Oblig. Participating VRDN Series ROC II R6001, | | | | | | | | |
| 2.53% (Liquidity Facility Citibank NA) (c)(g) | | | | 4,950 | | | | 4,950 |
| Oregon Hsg. & Cmnty. Svcs. Dept. Mtg. Rev. Participating | | | | | | | | |
| VRDN Series Merlots 01 B5, 2.45% (Liquidity Facility | | | | | | | | |
| Wachovia Bank NA) (c)(f)(g) | | | | 6,615 | | | | 6,615 |
| |
| See accompanying notes which are an integral part of the financial statements. | | | | |
| |
| 57 | | | | | | Annual Report |
| Investments continued | | | | | | | | |
| |
| |
| Municipal Securities continued | | | | | | | | |
| | | | | Principal | | Value (Note 1) |
| | | Amount (000s) | | | | (000s) |
| Oregon – continued | | | | | | | | |
| Port Morrow Poll. Cont. Rev. Participating VRDN Series FRRI | | | | | | | | |
| 03 F4J, 2.58% (Lehman Brothers Hldgs., Inc. Guaranteed) | | | | | | | | |
| (Liquidity Facility Lehman Brothers Hldgs., Inc.) (c)(g) | | $ | | 11,750 | | $ | | 11,750 |
| Port of Portland Arpt. Rev. Participating VRDN Series PT 683, | | | | | | | | |
| 2.57% (Liquidity Facility Svenska Handelsbanken AB) (c)(f)(g) | | | | 10,690 | | | | 10,690 |
| Portland Cmnty. College District Participating VRDN: | | | | | | | | |
| Series PT 3001, 2.53% (Liquidity Facility Merrill Lynch & Co., | | | | | | | | |
| Inc.) (c)(g) | | | | 18,950 | | | | 18,950 |
| Series ROC II R5040, 2.53% (Liquidity Facility Citigroup | | | | | | | | |
| Global Markets Hldgs., Inc.) (c)(g) | | | | 11,900 | | | | 11,900 |
| Portland Hsg. Auth. Rev.: | | | | | | | | |
| (New Columbia – Cecelia Proj.) 2.55%, LOC Bank of | | | | | | | | |
| America NA, VRDN (c)(f) | | | | 200 | | | | 200 |
| (New Columbia – Trouton Proj.) 2.55%, LOC Bank of | | | | | | | | |
| America NA, VRDN (c)(f) | | | | 12,365 | | | | 12,365 |
| | | | | | | | | 101,030 |
| |
| Pennsylvania – 4.6% | | | | | | | | |
| Allegheny County Arpt. Rev. Participating VRDN Series PA | | | | | | | | |
| 567, 2.57% (Liquidity Facility Merrill Lynch & Co., | | | | | | | | |
| Inc.) (c)(f)(g) | | | | 10,905 | | | | 10,905 |
| Allegheny County Hosp. Dev. Auth. Rev. Bonds Series PT 762, | | | | | | | | |
| 2.85%, tender 6/15/06 (Liquidity Facility Landesbank | | | | | | | | |
| Hessen-Thuringen) (c)(g)(h) | | | | 36,315 | | | | 36,315 |
| Allegheny County Indl. Dev. Auth. Rev. (UPMC Children’s | | | | | | | | |
| Hosp. Proj.) Series 2004 A, 2.6%, VRDN (c) | | | | 40,400 | | | | 40,400 |
| Berks County Indl. Dev. Auth. Indl. Dev. Rev. Bonds (American | | | | | | | | |
| Wtr. Cap. Corp. Proj.) Series 1996, 2.63% tender 9/19/05, | | | | | | | | |
| CP mode (f) | | | | 16,700 | | | | 16,700 |
| Bucks County Indl. Dev. Auth. Wtr. Facilities Rev. Participating | | | | | | | | |
| VRDN Series PA 1139, 2.54% (Liquidity Facility Merrill | | | | | | | | |
| Lynch & Co., Inc.) (c)(f)(g) | | | | 6,000 | | | | 6,000 |
| Cambria County Ind. Dev. Auth. (Cambria Cogen Co. Proj.): | | | | | | | | |
| Series 1998 A1, 2.52%, LOC Bayerische Hypo-und | | | | | | | | |
| Vereinsbank AG, VRDN (c)(f) | | | | 70,300 | | | | 70,300 |
| Series 1998 A2, 2.57%, LOC Bayerische Hypo-und | | | | | | | | |
| Vereinsbank AG, VRDN (c)(f) | | | | 12,805 | | | | 12,805 |
| Crawford County Indl. Dev. Auth. Rev. (Clear Lake Lumber, Inc. | | | | | | | | |
| Proj.) Series 1997, 2.64%, LOC PNC Bank NA, Pittsburgh, | | | | | | | | |
| VRDN (c)(f) | | | | 2,675 | | | | 2,675 |
| Harrisburg Auth. Wtr. Rev. Series A, 2.54% (FGIC Insured), | | | | | | | | |
| VRDN (c) | | | | 11,200 | | | | 11,200 |
| Lehigh County Indl. Dev. Auth. Rev. (Mancor Industries, Inc. | | | | | | | | |
| Proj.) 2.64%, LOC PNC Bank NA, Pittsburgh, VRDN (c)(f) | | | | 3,000 | | | | 3,000 |
See accompanying notes which are an integral part of the financial statements.
| Municipal Securities continued | | | | | | | | |
| | | | | Principal | | Value (Note 1) |
| | | Amount (000s) | | | | (000s) |
| Pennsylvania – continued | | | | | | | | |
| Montgomery Higher Ed. & Health Auth. Hosp. Rev. | | | | | | | | |
| Participating VRDN Series MSTC 98 31 Class A, 2.43% | | | | | | | | |
| (Liquidity Facility Bear Stearns Companies, Inc.) (c)(g) | | $ | | 11,925 | | $ | | 11,925 |
| Northampton County Indl. Dev. Auth. Rev.: | | | | | | | | |
| Bonds (American Wtr. Cap. Corp. Proj.): | | | | | | | | |
| Series 1988, 2.8% tender 9/7/05, CP mode (f) | | | | 18,250 | | | | 18,250 |
| Series 1991, 2.78% tender 11/3/05, CP mode (f) | | | | 15,450 | | | | 15,450 |
| (Binney & Smith, Inc. Proj.) Series 1997 A, 2.42%, LOC | | | | | | | | |
| JPMorgan Chase Bank, VRDN (c)(f) | | | | 1,900 | | | | 1,900 |
| Pennsylvania Econ. Dev. Fing. Auth. Exempt Facilities Rev. | | | | | | | | |
| (Merck & Co. Proj.) Series 2000, 2.56%, VRDN (c)(f) | | | | 17,000 | | | | 17,000 |
| Pennsylvania Econ. Dev. Fing. Auth. Indl. Dev. Rev.: | | | | | | | | |
| (Giffen, Schlaegle & Pirilla Group Proj.) Series 1992 A3, | | | | | | | | |
| 2.59%, LOC PNC Bank NA, Pittsburgh, VRDN (c)(f) | | | | 125 | | | | 125 |
| Series 1994 B3, 2.59%, LOC PNC Bank NA, Pittsburgh, | | | | | | | | |
| VRDN (c)(f) | | | | 800 | | | | 800 |
| Series 1996 D5, 2.59%, LOC PNC Bank NA, Pittsburgh, | | | | | | | | |
| VRDN (c)(f) | | | | 1,800 | | | | 1,800 |
| Series 1997 B1, 2.59%, LOC PNC Bank NA, Pittsburgh, | | | | | | | | |
| VRDN (c)(f) | | | | 1,000 | | | | 1,000 |
| Series 1997 B4, 2.59%, LOC PNC Bank NA, Pittsburgh, | | | | | | | | |
| VRDN (c)(f) | | | | 1,000 | | | | 1,000 |
| Series 1997 B6, 2.59%, LOC PNC Bank NA, Pittsburgh, | | | | | | | | |
| VRDN (c)(f) | | | | 400 | | | | 400 |
| Series 1997 B8, 2.59%, LOC PNC Bank NA, Pittsburgh, | | | | | | | | |
| VRDN (c)(f) | | | | 700 | | | | 700 |
| Series 1997 B9, 2.59%, LOC PNC Bank NA, Pittsburgh, | | | | | | | | |
| VRDN (c)(f) | | | | 600 | | | | 600 |
| Pennsylvania Econ. Dev. Fing. Auth. Wastewtr. Treatment Rev. | | | | | | | | |
| (Sunoco, Inc. (R&M) Proj.): | | | | | | | | |
| Series A, 2.715% (Sunoco, Inc. Guaranteed), VRDN (c)(f) | | | | 8,400 | | | | 8,400 |
| Series B, 2.54% (Sunoco, Inc. Guaranteed), VRDN (c)(f) | | | | 6,900 | | | | 6,900 |
| Pennsylvania Gen. Oblig. Participating VRDN: | | | | | | | | |
| Series Putters 512, 2.53% (Liquidity Facility PNC Bank NA, | | | | | | | | |
| Pittsburgh) (c)(g) | | | | 13,965 | | | | 13,965 |
| Series Putters 939, 2.53% (Liquidity Facility JPMorgan Chase | | | | | | | | |
| Bank) (c)(g) | | | | 8,300 | | | | 8,300 |
| Pennsylvania Higher Ed. Assistance Agcy. Student Ln. Rev.: | | | | | | | | |
| Series 1988 C, 2.41%, LOC Sallie Mae, VRDN (c)(f) | | | | 9,450 | | | | 9,450 |
| Series 1997 A, 2.45% (AMBAC Insured), VRDN (c)(f) | | | | 18,600 | | | | 18,600 |
| Series 2000 A, 2.45% (AMBAC Insured), VRDN (c)(f) | | | | 21,800 | | | | 21,800 |
| Series 2001 B, 2.54% (FSA Insured), VRDN (c)(f) | | | | 31,200 | | | | 31,200 |
| Series 2002 B, 2.55% (FSA Insured), VRDN (c)(f) | | | | 47,200 | | | | 47,200 |
See accompanying notes which are an integral part of the financial statements.
59 Annual Report
| Investments continued | | | | | | | | |
| |
| |
| Municipal Securities continued | | | | | | | | |
| | | | | Principal | | Value (Note 1) |
| | | Amount (000s) | | | | (000s) |
| Pennsylvania – continued | | | | | | | | |
| Pennsylvania Higher Ed. Assistance Agcy. Student Ln. Rev.: - | | | | | | | | |
| continued | | | | | | | | |
| Series A: | | | | | | | | |
| 2.45% (AMBAC Insured), VRDN (c)(f) | | $ | | 20,000 | | $ | | 20,000 |
| 2.55% (FSA Insured), VRDN (c)(f) | | | | 69,800 | | | | 69,800 |
| Series A1, 2.45% (AMBAC Insured), VRDN (c)(f) | | | | 35,400 | | | | 35,400 |
| 2.41% (AMBAC Insured), VRDN (c)(f) | | | | 54,600 | | | | 54,600 |
| Pennsylvania Higher Edl. Facilities Auth. Hosp. Rev. | | | | | | | | |
| Participating VRDN Series MT 42, 2.55% (Liquidity Facility | | | | | | | | |
| Lloyds TSB Bank PLC) (c)(g) | | | | 15,000 | | | | 15,000 |
| Pennsylvania Hsg. Fin. Agcy. Participating VRDN: | | | | | | | | |
| Series LB 04 L80, 2.53% (Liquidity Facility Lehman Brothers | | | | | | | | |
| Hldgs., Inc.) (c)(f)(g) | | | | 6,370 | | | | 6,370 |
| Series PA 1235, 2.56% (Liquidity Facility Merrill Lynch & | | | | | | | | |
| Co., Inc.) (c)(f)(g) | | | | 3,800 | | | | 3,800 |
| Series PT 2068, 2.56% (Liquidity Facility Merrill Lynch & Co., | | | | | | | | |
| Inc.) (c)(f)(g) | | | | 9,920 | | | | 9,920 |
| Series PT 2190, 2.56% (Liquidity Facility Merrill Lynch & Co., | | | | | | | | |
| Inc.) (c)(f)(g) | | | | 10,120 | | | | 10,120 |
| Series PT 890, 2.56% (Liquidity Facility Merrill Lynch & Co., | | | | | | | | |
| Inc.) (c)(f)(g) | | | | 22,600 | | | | 22,600 |
| Pennsylvania Tpk. Commission Oil Franchise Tax Rev. | | | | | | | | |
| Participating VRDN Series Putters 366Z, 2.53% (Liquidity | | | | | | | | |
| Facility JPMorgan Chase Bank) (c)(g) | | | | 5,000 | | | | 5,000 |
| Philadelphia Arpt. Rev. Participating VRDN Series SG 118, | | | | | | | | |
| 2.57% (Liquidity Facility Societe Generale) (c)(f)(g) | | | | 9,715 | | | | 9,715 |
| Philadelphia Auth. for Indl. Dev. Arpt. Rev. Participating VRDN | | | | | | | | |
| Series PA 882, 2.57% (Liquidity Facility Merrill Lynch & Co., | | | | | | | | |
| Inc.) (c)(f)(g) | | | | 3,795 | | | | 3,795 |
| Philadelphia Redev. Auth. Rev. Participating VRDN Series DB | | | | | | | | |
| 134, 2.54% (Liquidity Facility Deutsche Bank AG) (c)(f)(g) | | | | 6,815 | | | | 6,815 |
| Philadelphia School District Participating VRDN Series EGL | | | | | | | | |
| 7050036, 2.53% (Liquidity Facility Citibank NA) (c)(g) | | | | 10,820 | | | | 10,820 |
| Pittsburgh Urban Redev. Auth. Single Family Mortgage Rev. | | | | | | | | |
| Participating VRDN Series PT 996, 2.56% (Liquidity Facility | | | | | | | | |
| Merrill Lynch & Co., Inc.) (c)(f)(g) | | | | 18,600 | | | | 18,600 |
| Pittsburgh Wtr. & Swr. Auth. Wtr. & Swr. Sys. Rev. | | | | | | | | |
| Participating VRDN Series MS 01 752, 2.52% (Liquidity | | | | | | | | |
| Facility Morgan Stanley) (c)(g) | | | | 3,715 | | | | 3,715 |
| | | | | | | | | 753,135 |
| |
| Rhode Island – 0.2% | | | | | | | | |
| Narragansett Bay Commission Wastewtr. Sys. Rev. Series | | | | | | | | |
| 2004 A, 2.37% (MBIA Insured), VRDN (c) | | | | 20,600 | | | | 20,600 |
See accompanying notes which are an integral part of the financial statements.
Annual Report
| Municipal Securities continued | | | | | | | | |
| | | | | Principal | | Value (Note 1) |
| | | Amount (000s) | | | | (000s) |
| Rhode Island – continued | | | | | | | | |
| Rhode Island Econ. Dev. Corp. Participating VRDN: | | | | | | | | |
| Series PT 2954, 2.57% (Liquidity Facility Merrill Lynch & Co., | | | | | | | | |
| Inc.) (c)(f)(g) | | $ | | 2,255 | | $ | | 2,255 |
| Series Putters 971, 2.53% (Liquidity Facility JPMorgan Chase | | | | | | | | |
| & Co.) (c)(f)(g) | | | | 1,740 | | | | 1,740 |
| Rhode Island Hsg. & Mtg. Fin. Corp. Bonds Series 41C, | | | | | | | | |
| 3.375% 11/1/05 (f) | | | | 13,480 | | | | 13,496 |
| Rhode Island Indl. Facilities Corp. Indl. Dev. Rev. (NFA Corp. | | | | | | | | |
| Proj.) 2.55%, LOC Fleet Bank NA, VRDN (c)(f) | | | | 2,400 | | | | 2,400 |
| | | | | | | | | 40,491 |
| |
| South Carolina – 1.9% | | | | | | | | |
| Berkeley County School District Participating VRDN Series | | | | | | | | |
| MSCO 01 656, 2.52% (Liquidity Facility Morgan | | | | | | | | |
| Stanley) (c)(g) | | | | 8,618 | | | | 8,618 |
| Charleston County School District Participating VRDN Series PT | | | | | | | | |
| 2100, 2.53% (Liquidity Facility Merrill Lynch & Co., | | | | | | | | |
| Inc.) (c)(g) | | | | 13,745 | | | | 13,745 |
| Darlington County Indl. Dev. Rev. (Nucor Corp. Proj.) Series A, | | | | | | | | |
| 2.43%, VRDN (c)(f) | | | | 4,100 | | | | 4,100 |
| Dorchester County Indl. Dev. Rev. (SYN Strand, Inc. Proj.) | | | | | | | | |
| Series 1994, 2.54%, LOC Wachovia Bank NA, VRDN (c)(f) . | | | | 6,650 | | | | 6,650 |
| Florence-Darlington Commission for Technical Ed. Spl. Fee Rev. | | | | | | | | |
| Participating VRDN Series PT 2549, 2.53% (Liquidity Facility | | | | | | | | |
| Merrill Lynch & Co., Inc.) (c)(g) | | | | 6,230 | | | | 6,230 |
| Greer Combined Util. Sys. Rev. Participating VRDN Series | | | | | | | | |
| Merlots 02 A30, 2.4% (Liquidity Facility Wachovia Bank | | | | | | | | |
| NA) (c)(g) | | | | 3,760 | | | | 3,760 |
| Med. Univ. Hosp. Auth. Hosp. Facilities Rev. Participating | | | | | | | | |
| VRDN Series Austin 05 A, 2.54% (Liquidity Facility Bank of | | | | | | | | |
| America NA) (c)(g) | | | | 36,465 | | | | 36,465 |
| Oconee County Poll. Cont. Rev. (Duke Energy Corp. Proj.) | | | | | | | | |
| Series A, 2.44%, VRDN (c) | | | | 16,000 | | | | 16,000 |
| Orangeburg County Solid Waste Disp. Facilities Rev. | | | | | | | | |
| Participating VRDN Series Merlots 97 B, 2.45% (Liquidity | | | | | | | | |
| Facility Wachovia Bank NA) (c)(f)(g) | | | | 8,825 | | | | 8,825 |
| Richland County School District #2 Participating VRDN Series | | | | | | | | |
| PT 1646, 2.53% (Liquidity Facility Merrill Lynch & Co., | | | | | | | | |
| Inc.) (c)(g) | | | | 18,060 | | | | 18,060 |
| South Carolina Hsg. Fin. & Dev. Auth. Mtg. Rev. Participating | | | | | | | | |
| VRDN: | | | | | | | | |
| Series BA 01 L, 2.64% (Liquidity Facility Bank of America | | | | | | | | |
| NA) (c)(f)(g) | | | | 2,705 | | | | 2,705 |
| Series PA 1072, 2.57% (Liquidity Facility Merrill Lynch & | | | | | | | | |
| Co., Inc.) (c)(f)(g) | | | | 5,370 | | | | 5,370 |
See accompanying notes which are an integral part of the financial statements.
61 Annual Report
Investments continued
Municipal Securities continued
| | | | | Principal | | Value (Note 1) |
| | | Amount (000s) | | | | (000s) |
| South Carolina – continued | | | | | | | | |
| South Carolina Hsg. Fin. & Dev. Auth. Mtg. Rev. Participating | | | | | | | | |
| VRDN: – continued | | | | | | | | |
| Series PT 326, 2.57% (Liquidity Facility BNP Paribas | | | | | | | | |
| SA) (c)(f)(g) | | $ | | 13,995 | | $ | | 13,995 |
| Series ROC II R398, 2.57% (Liquidity Facility Citibank | | | | | | | | |
| NA) (c)(f)(g) | | | | 2,095 | | | | 2,095 |
| South Carolina Hsg. Fin. & Dev. Auth. Multi-family Rev.: | | | | | | | | |
| (Cedarwoods Apts. Proj.) 2.41%, LOC Suntrust Bank, | | | | | | | | |
| VRDN (c)(f) | | | | 3,000 | | | | 3,000 |
| (City Heights Apt. Proj.) Series 2000 A1, 2.54%, LOC | | | | | | | | |
| Suntrust Bank, VRDN (c)(f) | | | | 5,620 | | | | 5,620 |
| (Spartanburg Terrace Apt. Proj.) Series 2000 C1, 2.54%, | | | | | | | | |
| LOC Suntrust Bank, VRDN (c)(f) | | | | 1,960 | | | | 1,960 |
| South Carolina Jobs Econ. Dev. Auth. Econ. Dev. Rev.: | | | | | | | | |
| (Alfmeier Corp. Proj.) 2.59%, LOC Bayerische Landesbank | | | | | | | | |
| Girozentrale, VRDN (c)(f) | | | | 2,100 | | | | 2,100 |
| (Carolina Ceramics LLC Proj.) 2.54%, LOC Wachovia Bank | | | | | | | | |
| NA, VRDN (c)(f) | | | | 4,000 | | | | 4,000 |
| (Carolinas Recycling Group Proj.) Series 2001, 2.54%, LOC | | | | | | | | |
| Wachovia Bank NA, VRDN (c)(f) | | | | 4,200 | | | | 4,200 |
| (Chambers Richland Co. Landfill Proj.) Series 1997, 2.54%, | | | | | | | | |
| LOC Suntrust Bank, VRDN (c)(f) | | | | 9,000 | | | | 9,000 |
| (Keys Printing Co. Proj.) 2.64%, LOC JPMorgan Chase Bank, | | | | | | | | |
| VRDN (c)(f) | | | | 1,700 | | | | 1,700 |
| (Mohawk Ind., Inc. Proj.): | | | | | | | | |
| Series 1997 A, 2.59%, LOC Wachovia Bank NA, | | | | | | | | |
| VRDN (c)(f) | | | | 1,100 | | | | 1,100 |
| Series 1997 B, 2.59%, LOC Wachovia Bank NA, | | | | | | | | |
| VRDN (c)(f) | | | | 1,800 | | | | 1,800 |
| Series C, 2.59%, LOC Wachovia Bank NA, VRDN (c)(f) | | | | 6,225 | | | | 6,225 |
| (Ring Missouri LP Proj.) Series 1999, 2.54%, LOC Suntrust | | | | | | | | |
| Bank, VRDN (c)(f) | | | | 3,600 | | | | 3,600 |
| (Turnils North America Proj.) Series 1999, 2.42%, LOC | | | | | | | | |
| Wachovia Bank NA, VRDN (c)(f) | | | | 4,700 | | | | 4,700 |
| (Waste Mgmt. of South Carolina, Inc. Proj.) Series 2003 A, | | | | | | | | |
| 2.41%, LOC Wachovia Bank NA, VRDN (c)(f) | | | | 5,000 | | | | 5,000 |
| South Carolina Ports Auth. Ports Rev. Series 1998 B, 2.5% | | | | | | | | |
| (FSA Insured), VRDN (c)(f) | | | | 25,000 | | | | 25,000 |
| South Carolina Pub. Svc. Auth. Rev. Participating VRDN: | | | | | | | | |
| Series EGL 04 17, 2.53% (Liquidity Facility Citibank | | | | | | | | |
| NA) (c)(g) | | | | 7,660 | | | | 7,660 |
| Series Merlots 00 L, 2.4% (Liquidity Facility Wachovia Bank | | | | | | | | |
| NA) (c)(g) | | | | 6,500 | | | | 6,500 |
See accompanying notes which are an integral part of the financial statements.
| Municipal Securities continued | | | | | | | | |
| | | | | Principal | | Value (Note 1) |
| | | Amount (000s) | | | | (000s) |
| South Carolina – continued | | | | | | | | |
| South Carolina Pub. Svc. Auth. Rev. Participating VRDN: - | | | | | | | | |
| continued | | | | | | | | |
| Series Merlots B6, 2.4% (Liquidity Facility Wachovia Bank | | | | | | | | |
| NA) (c)(g) | | $ | | 9,870 | | $ | | 9,870 |
| South Carolina Trans. Infrastructure Bank Rev. Participating | | | | | | | | |
| VRDN: | | | | | | | | |
| Series MS 728, 2.52% (Liquidity Facility Morgan | | | | | | | | |
| Stanley) (c)(g) | | | | 12,500 | | | | 12,500 |
| Series PT 2304, 2.53% (Liquidity Facility Merrill Lynch & Co., | | | | | | | | |
| Inc.) (c)(g) | | | | 12,790 | | | | 12,790 |
| Series PT 2306, 2.53% (Liquidity Facility Merrill Lynch & Co., | | | | | | | | |
| Inc.) (c)(g) | | | | 5,180 | | | | 5,180 |
| York County Poll. Cont. Rev. Bonds (Duke Energy Corp. Proj.) | | | | | | | | |
| 2.7% tender 10/4/05, CP mode | | | | 26,000 | | | | 26,000 |
| | | | | | | | | 306,123 |
| |
| South Dakota 0.4% | | | | | | | | |
| South Dakota Hsg. Dev. Auth.: | | | | | | | | |
| Participating VRDN Series Clipper 05 9, 2.69% (Liquidity | | | | | | | | |
| Facility State Street Bank & Trust Co., Boston) (c)(f)(g) | | | | 15,810 | | | | 15,810 |
| (Harmony Heights Proj.) Series 2001, 2.65%, LOC Fannie | | | | | | | | |
| Mae, VRDN (c)(f) | | | | 6,500 | | | | 6,500 |
| Series 2005 G, 2.45% (Liquidity Facility DEPFA BANK PLC), | | | | | | | | |
| VRDN (c)(f) | | | | 8,300 | | | | 8,300 |
| 2.55% (Liquidity Facility Landesbank Hessen-Thuringen), | | | | | | | | |
| VRDN (c)(f) | | | | 10,000 | | | | 10,000 |
| South Dakota Hsg. Dev. Auth. Single Family Rev. Participating | | | | | | | | |
| VRDN: | | | | | | | | |
| Series MT 104, 2.54% (Liquidity Facility Merrill Lynch & Co., | | | | | | | | |
| Inc.) (c)(g) | | | | 9,220 | | | | 9,220 |
| Series PT 888, 2.54% (Liquidity Facility Merrill Lynch & Co., | | | | | | | | |
| Inc.) (c)(g) | | | | 5,340 | | | | 5,340 |
| Series PT 889, 2.58% (Liquidity Facility Merrill Lynch & Co., | | | | | | | | |
| Inc.) (c)(f)(g) | | | | 1,800 | | | | 1,800 |
| Series PT 907, 2.58% (Liquidity Facility Merrill Lynch & Co., | | | | | | | | |
| Inc.) (c)(f)(g) | | | | 7,320 | | | | 7,320 |
| Series PT 957, 2.58% (Liquidity Facility Merrill Lynch & Co., | | | | | | | | |
| Inc.) (c)(f)(g) | | | | 4,630 | | | | 4,630 |
| | | | | | | | | 68,920 |
| |
| Tennessee – 1.6% | | | | | | | | |
| Chattanooga Indl. Dev. Board Indl. Rev. (Burner Systems Int’l., | | | | | | | | |
| Inc. Proj.) 2.55%, LOC JPMorgan Chase Bank, VRDN (c)(f) . | | | | 4,500 | | | | 4,500 |
See accompanying notes which are an integral part of the financial statements.
63 Annual Report
| Investments continued | | | | | | | | | | |
| |
| |
| |
| Municipal Securities continued | | | | | | | | |
| | | | | | | Principal | | Value (Note 1) |
| | | | | Amount (000s) | | | | (000s) |
| Tennessee – continued | | | | | | | | | | |
| Cumberland County Indl. Dev. Board Indl. Dev. Rev. (Delbar | | | | | | | | |
| Products, Inc. Proj.) 2.64%, LOC PNC Bank NA, Pittsburgh, | | | | | | | | |
| VRDN (c)(f) | | | | $ | | 1,300 | | $ | | 1,300 |
| Jackson Indl. Dev. Board Solid Waste Disp. Rev. (Florida Steel | | | | | | | | |
| Corp. Proj.) Series 1995, 2.55%, LOC Bank of America NA, | | | | | | | | |
| VRDN (c)(f) | | | | | | 8,000 | | | | 8,000 |
| Johnson City Health & Edl. Hosp. Rev. Participating VRDN | | | | | | | | |
| Series PT 922, 2.56% (Liquidity Facility Lloyds TSB Bank | | | | | | | | |
| PLC) (c)(g) | | | | | | 23,000 | | | | 23,000 |
| Lewisburg Indl. Dev. Board (Waste Mgmt., Inc., Proj.) 2.59%, | | | | | | | | |
| LOC Wachovia Bank NA, VRDN (c)(f) | | | | | | 10,000 | | | | 10,000 |
| Loudon County Indl. Dev. Board Exempt Facilities Rev. | | | | | | | | |
| (Kimberly Clark Corp. Proj.) 2.43%, VRDN (c)(f) | | | | 11,600 | | | | 11,600 |
| McMinn County Indl. Dev. Board Solid Waste Disp. Facilities | | | | | | | | |
| Rev. (Bowater, Inc. Proj.) Series 1999, 2.54%, LOC | | | | | | | | |
| Wachovia Bank NA, VRDN (c)(f) | | | | | | 20,000 | | | | 20,000 |
| Memphis Elec. Sys. Rev. Participating VRDN: | | | | | | | | |
| Series Putters 377, 2.53% (Liquidity Facility JPMorgan Chase | | | | | | | | |
| Bank) (c)(g) | | | | | | 14,000 | | | | 14,000 |
| Series Putters 378, 2.53% (Liquidity Facility JPMorgan Chase | | | | | | | | |
| Bank) (c)(g) | | | | | | 17,865 | | | | 17,865 |
| Memphis-Shelby County Arpt. Auth. Arpt. Rev. Participating | | | | | | | | |
| VRDN: | | | | | | | | | | |
| Series Merlots 00 C, 2.45% (Liquidity Facility Wachovia | | | | | | | | |
| Bank NA) (c)(f)(g) | | | | | | 22,000 | | | | 22,000 |
| Series PT 706, 2.57% (Liquidity Facility Merrill Lynch & Co., | | | | | | | | |
| Inc.) (c)(f)(g) | | | | | | 5,525 | | | | 5,525 |
| Series PT 718, 2.57% (Liquidity Facility BNP Paribas | | | | | | | | |
| SA) (c)(f)(g) | | | | | | 4,995 | | | | 4,995 |
| Metropolitan Govt. Nashville & Davidson County Participating | | | | | | | | |
| VRDN Series ROC II R371, 2.53% (Liquidity Facility Citibank | | | | | | | | |
| NA) (c)(g) | | | | | | 6,165 | | | | 6,165 |
| Metropolitan Govt. Nashville & Davidson County Health & Edl. | | | | | | | | |
| Facilities Board Rev. 2.8% 9/16/05, CP | | | | | | 10,000 | | | | 10,000 |
| Metropolitan Nashville Arpt. Auth. Passenger Fac. Charge Rev. | | | | | | | | |
| 2.41%, LOC Suntrust Bank, VRDN (c)(f) | | | | | | 10,400 | | | | 10,400 |
| Morristown Indl. Dev. Board Indl. Dev. Rev. (BOS Automotive | | | | | | | | |
| Prod. Proj.) 2.59%, LOC Landesbank Baden-Wuert, | | | | | | | | |
| VRDN (c)(f) | | | | | | 5,000 | | | | 5,000 |
| Selmer McNairy County Indl. Dev. Board Rev. (United Stainless | | | | | | | | |
| Proj.) 2.55%, LOC Lasalle Bank NA, VRDN (c)(f) | | | | 5,000 | | | | 5,000 |
| Sevier County Pub. Bldg. Auth. Rev. Series II D1, 2.56% | | | | | | | | |
| (AMBAC Insured), VRDN (c)(f) | | | | | | 16,870 | | | | 16,870 |
| |
| |
| See accompanying notes which are an integral part of the financial statements. | | | | |
| |
| Annual Report | | 64 | | | | | | | | |
| Municipal Securities continued | | | | | | | | |
| | | | | Principal | | Value (Note 1) |
| | | Amount (000s) | | | | (000s) |
| Tennessee – continued | | | | | | | | |
| Shelby County Gen. Oblig. Participating VRDN: | | | | | | | | |
| Series EGL 00 4201, 2.53% (Liquidity Facility Citibank NA, | | | | | | | | |
| New York) (c)(g) | | $ | | 16,045 | | $ | | 16,045 |
| Series EGL 01 4202, 2.53% (Liquidity Facility Citibank NA, | | | | | | | | |
| New York) (c)(g) | | | | 15,550 | | | | 15,550 |
| South Pittsburg Indl. Dev. Board Rev. (Lodge Manufacturing | | | | | | | | |
| Proj.) 2.54%, LOC Suntrust Bank, VRDN (c)(f) | | | | 1,000 | | | | 1,000 |
| Tennessee Hsg. Dev. Agcy. Participating VRDN: | | | | | | | | |
| Series BA 01 H, 2.62% (Liquidity Facility Bank of America | | | | | | | | |
| NA) (c)(f)(g) | | | | 3,225 | | | | 3,225 |
| Series FRRI 02 L13, 2.53% (Liquidity Facility Lehman | | | | | | | | |
| Brothers Hldgs., Inc.) (c)(f)(g) | | | | 5,860 | | | | 5,860 |
| Series LB L32J, 2.58% (Liquidity Facility Lehman Brothers | | | | | | | | |
| Hldgs., Inc.) (c)(f)(g) | | | | 4,500 | | | | 4,500 |
| Series Merlots 05 C3, 2.45% (Liquidity Facility Wachovia | | | | | | | | |
| Bank NA) (c)(f)(g) | | | | 6,005 | | | | 6,005 |
| Tennessee School Board Auth. Participating VRDN Series PT | | | | | | | | |
| 3025, 2.53% (Liquidity Facility Merrill Lynch & Co., | | | | | | | | |
| Inc.) (c)(g) | | | | 9,710 | | | | 9,710 |
| White County Indl. Dev. Board Indl. Dev. Rev. (Genlyte Thomas | | | | | | | | |
| Group LLC Proj.) Series 2001, 2.41%, LOC Bank of America | | | | | | | | |
| NA, VRDN (c)(f) | | | | 5,000 | | | | 5,000 |
| | | | | | | | | 263,115 |
| |
| Texas 15.2% | | | | | | | | |
| Austin Arpt. Sys. Rev. Participating VRDN Series Merlots 00 J, | | | | | | | | |
| 2.45% (Liquidity Facility Wachovia Bank NA) (c)(f)(g) | | | | 21,805 | | | | 21,805 |
| Austin Elec. Util. Sys. Rev. Participating VRDN Series EGL 01 | | | | | | | | |
| 4302, 2.53% (Liquidity Facility Citibank NA, New | | | | | | | | |
| York) (c)(g) | | | | 9,300 | | | | 9,300 |
| Austin Util. Sys. Rev. Participating VRDN Series BA 98 V, | | | | | | | | |
| 2.57% (Liquidity Facility Bank of America NA) (c)(g) | | | | 6,750 | | | | 6,750 |
| Austin Wtr. & Wastewtr. Sys. Rev. Participating VRDN: | | | | | | | | |
| Series EGL 00 4303, 2.53% (Liquidity Facility Citibank NA, | | | | | | | | |
| New York) (c)(g) | | | | 10,195 | | | | 10,195 |
| Series Merlots 00 LLL, 2.4% (Liquidity Facility Wachovia | | | | | | | | |
| Bank NA) (c)(g) | | | | 7,135 | | | | 7,135 |
| Series Merlots 01 A63, 2.4% (Liquidity Facility Wachovia | | | | | | | | |
| Bank NA) (c)(g) | | | | 6,415 | | | | 6,415 |
| Series Merlots 02 A1, 2.4% (Liquidity Facility Wachovia | | | | | | | | |
| Bank NA) (c)(g) | | | | 2,065 | | | | 2,065 |
| Series ROC II R6029, 2.53% (Liquidity Facility Citibank | | | | | | | | |
| NA) (c)(g) | | | | 4,990 | | | | 4,990 |
| |
| |
| See accompanying notes which are an integral part of the financial statements. | | | | |
| |
| 65 | | | | | | Annual Report |
| Investments continued | | | | | | | | |
| |
| |
| |
| Municipal Securities continued | | | | | | | | |
| | | | | Principal | | Value (Note 1) |
| | | Amount (000s) | | | | (000s) |
| Texas continued | | | | | | | | |
| Austin Wtr. & Wastewtr. Sys. Rev. Participating VRDN: - | | | | | | | | |
| continued | | | | | | | | |
| Series ROC II R7014, 2.53% (Liquidity Facility Citibank | | | | | | | | |
| NA) (c)(g) | | $ | | 6,375 | | $ | | 6,375 |
| Bexar County Health Facilities Dev. Corp. Rev. (Warm Springs | | | | | | | | |
| Rehabilitation Proj.) Series 1997, 2.55%, LOC JPMorgan | | | | | | | | |
| Chase Bank, VRDN (c) | | | | 3,400 | | | | 3,400 |
| Bexar County Hsg. Fin. Corp. Multi-family Hsg. Rev. (Rosemont | | | | | | | | |
| at Acme Apts. Proj.) 2.57%, LOC Wachovia Bank NA, | | | | | | | | |
| VRDN (c)(f) | | | | 6,750 | | | | 6,750 |
| Board of Regents of The Univ. of Texas Sys. Permanent Univ. | | | | | | | | |
| Fund Participating VRDN: | | | | | | | | |
| Series MS 1023, 2.52% (Liquidity Facility Morgan | | | | | | | | |
| Stanley) (c)(g) | | | | 8,000 | | | | 8,000 |
| Series SG B55, 2.53% (Liquidity Facility Societe | | | | | | | | |
| Generale) (c)(g) | | | | 26,000 | | | | 26,000 |
| Brazos River Auth. Poll. Cont. Rev.: | | | | | | | | |
| (Texas Utils. Elec. Co. Proj.) 2.41%, LOC Wachovia Bank | | | | | | | | |
| NA, VRDN (c)(f) | | | | 57,700 | | | | 57,700 |
| (Texas Utils. Energy Co. Proj.) Series A, 2.45%, LOC | | | | | | | | |
| Wachovia Bank NA, VRDN (c)(f) | | | | 10,000 | | | | 10,000 |
| Brazos River Hbr. Navigation Brazoria County Envir. Facilities | | | | | | | | |
| Rev.: | | | | | | | | |
| (Dow Chemical Co. Proj.) Series A2, 2.55%, VRDN (c)(f) | | | | 9,500 | | | | 9,500 |
| (JT Venture Proj.) Series 1998, 2.44%, LOC JPMorgan Chase | | | | | | | | |
| Bank, VRDN (c)(f) | | | | 25,000 | | | | 25,000 |
| (Merey Sweeny LP Proj.) Series 2000 A, 2.44%, LOC | | | | | | | | |
| JPMorgan Chase Bank, VRDN (c)(f) | | | | 3,600 | | | | 3,600 |
| Brazosport Independent School District Participating VRDN | | | | | | | | |
| Series PT 2315, 2.53% (Liquidity Facility Merrill Lynch & Co., | | | | | | | | |
| Inc.) (c)(g) | | | | 5,350 | | | | 5,350 |
| Brownsville Indl. Dev. Corp. Rev. (Rich-Seapak Corp. Proj.) | | | | | | | | |
| Series 1997, 2.54%, LOC HSBC Bank USA, VRDN (c)(f) | | | | 6,250 | | | | 6,250 |
| Brownsville Util. Sys. Rev. Participating VRDN Series ROC II | | | | | | | | |
| R4074, 2.53% (Liquidity Facility Citigroup Global Markets | | | | | | | | |
| Hldgs., Inc.) (c)(g) | | | | 10,415 | | | | 10,415 |
| Burleson Gen. Oblig. Participating VRDN Series PT 2545, | | | | | | | | |
| 2.53% (Liquidity Facility Merrill Lynch & Co., Inc.) (c)(g) | | | | 6,625 | | | | 6,625 |
| Calhoun County Navigation District Envir. Facilities Rev. | | | | | | | | |
| (Formosa Plastics Corp. Proj.) 2.54%, LOC Wachovia Bank | | | | | | | | |
| NA, VRDN (c)(f) | | | | 6,885 | | | | 6,885 |
| Calhoun County Navigation District Poll. Cont. Rev. (Formosa | | | | | | | | |
| Plastics Corp., Texas Proj.) 2.54%, LOC Wachovia Bank NA, | | | | | | | | |
| VRDN (c)(f) | | | | 10,000 | | | | 10,000 |
See accompanying notes which are an integral part of the financial statements.
Annual Report
| Municipal Securities continued | | | | | | | | |
| | | | | Principal | | Value (Note 1) |
| | | Amount (000s) | | | | (000s) |
| Texas continued | | | | | | | | |
| Calhoun County Navigation District Port Rev. (Formosa Plastics | | | | | | | | |
| Corp. Proj.) Series 2000, 2.55%, LOC Bank of America NA, | | | | | | | | |
| VRDN (c)(f) | | $ | | 5,500 | | $ | | 5,500 |
| Calhoun County Solid Waste Disp. Rev. (Formosa Plastics | | | | | | | | |
| Corp. Proj.): | | | | | | | | |
| Series 2000, 2.54%, LOC Wachovia Bank NA, VRDN (c)(f) . | | | | 22,100 | | | | 22,100 |
| 2.54%, LOC Wachovia Bank NA, VRDN (c)(f) | | | | 22,100 | | | | 22,100 |
| Cap. Area Hsg. Fin. Corp. Multi-family Hsg. Rev. (Marble Falls | | | | | | | | |
| Vistas Apts. Proj.) 2.57%, LOC Fannie Mae, VRDN (c)(f) | | | | 3,000 | | | | 3,000 |
| Crowley Independent School District Participating VRDN Series | | | | | | | | |
| PT 3041, 2.53% (Liquidity Facility Merrill Lynch & Co., | | | | | | | | |
| Inc.) (c)(g) | | | | 12,375 | | | | 12,375 |
| Cypress-Fairbanks Independent School District: | | | | | | | | |
| Bonds Series AAB 02 13, 2.42%, tender 9/7/05 (Liquidity | | | | | | | | |
| Facility ABN AMRO Bank NV) (c)(g) | | | | 9,940 | | | | 9,940 |
| Participating VRDN: | | | | | | | | |
| Series Merlots C16, 2.4% (Liquidity Facility Wachovia | | | | | | | | |
| Bank NA) (c)(g) | | | | 4,990 | | | | 4,990 |
| Series PT 1649, 2.53% (Liquidity Facility Merrill Lynch & | | | | | | | | |
| Co., Inc.) (c)(g) | | | | 990 | | | | 990 |
| Dallas Area Rapid Transit Sales Tax Rev.: | | | | | | | | |
| Participating VRDN Series PA 1195, 2.53% (Liquidity Facility | | | | | | | | |
| Merrill Lynch & Co., Inc.) (c)(g) | | | | 5,265 | | | | 5,265 |
| Series 2001: | | | | | | | | |
| 2.78% 9/15/05 (Liquidity Facility Bayerische Landesbank | | | | | | | | |
| Girozentrale) (Liquidity Facility WestLB AG), CP | | | | 20,000 | | | | 20,000 |
| 2.9% 11/2/05 (Liquidity Facility Bayerische Landesbank | | | | | | | | |
| Girozentrale) (Liquidity Facility WestLB AG), CP | | | | 15,100 | | | | 15,100 |
| Dallas County Util. & Reclamation District Rev. Participating | | | | | | | | |
| VRDN Series PA 1136R, 2.53% (Liquidity Facility Merrill | | | | | | | | |
| Lynch & Co., Inc.) (c)(g) | | | | 6,575 | | | | 6,575 |
| Dallas Fort Worth Int’l. Arpt. Rev. Participating VRDN: | | | | | | | | |
| Series EGL 03 20, 2.57% (Liquidity Facility Citibank NA, | | | | | | | | |
| New York) (c)(f)(g) | | | | 16,800 | | | | 16,800 |
| Series FRRI 02 L29J, 2.53% (Liquidity Facility Lehman | | | | | | | | |
| Brothers Hldgs., Inc.) (c)(f)(g) | | | | 12,735 | | | | 12,735 |
| Series Merlots 00 II, 2.45% (Liquidity Facility Wachovia Bank | | | | | | | | |
| NA) (c)(f)(g) | | | | 11,695 | | | | 11,695 |
| Series Merlots 02 A13, 2.45% (Liquidity Facility Wachovia | | | | | | | | |
| Bank NA) (c)(f)(g) | | | | 4,780 | | | | 4,780 |
| Series PT 2156, 2.57% (Liquidity Facility Merrill Lynch & Co., | | | | | | | | |
| Inc.) (c)(f)(g) | | | | 2,620 | | | | 2,620 |
See accompanying notes which are an integral part of the financial statements.
67 Annual Report
| Investments continued | | | | | | | | | | |
| |
| |
| Municipal Securities continued | | | | | | | | |
| | | | | | | Principal | | Value (Note 1) |
| | | | | Amount (000s) | | | | (000s) |
| Texas continued | | | | | | | | | | |
| Dallas Fort Worth Int’l. Arpt. Rev. Participating VRDN: - | | | | | | | | |
| continued | | | | | | | | | | |
| Series PT 2318, 2.57% (Liquidity Facility Merrill Lynch & Co., | | | | | | | | |
| Inc.) (c)(f)(g) | | | | $ | | 5,625 | | $ | | 5,625 |
| Series PT 682, 2.57% (Liquidity Facility Svenska | | | | | | | | |
| Handelsbanken AB) (c)(f)(g) | | | | | | 9,005 | | | | 9,005 |
| Series Putters 1019, 2.56% (Liquidity Facility JPMorgan | | | | | | | | |
| Chase Bank) (c)(f)(g) | | | | | | 2,035 | | | | 2,035 |
| Series Putters 201, 2.56% (Liquidity Facility JPMorgan Chase | | | | | | | | |
| Bank) (c)(f)(g) | | | | | | 18,245 | | | | 18,245 |
| Series Putters 202, 2.56% (Liquidity Facility JPMorgan Chase | | | | | | | | |
| Bank) (c)(f)(g) | | | | | | 23,220 | | | | 23,220 |
| Series Putters 350, 2.56% (Liquidity Facility JPMorgan Chase | | | | | | | | |
| Bank) (c)(f)(g) | | | | | | 7,140 | | | | 7,140 |
| Series Putters 353, 2.56% (Liquidity Facility JPMorgan Chase | | | | | | | | |
| Bank) (c)(f)(g) | | | | | | 7,220 | | | | 7,220 |
| Series Putters 354, 2.56% (Liquidity Facility JPMorgan Chase | | | | | | | | |
| Bank) (c)(f)(g) | | | | | | 5,000 | | | | 5,000 |
| Series Putters 355, 2.56% (Liquidity Facility JPMorgan Chase | | | | | | | | |
| Bank) (c)(f)(g) | | | | | | 7,995 | | | | 7,995 |
| Series Putters 778, 2.56% (Liquidity Facility JPMorgan Chase | | | | | | | | |
| Bank) (c)(f)(g) | | | | | | 4,015 | | | | 4,015 |
| Series RF 03 4, 2.64% (Liquidity Facility Bank of New York, | | | | | | | | |
| New York) (c)(f)(g) | | | | | | 17,310 | | | | 17,310 |
| 2.57% (Liquidity Facility Citibank NA) (c)(f)(g) | | | | 3,000 | | | | 3,000 |
| Dallas Fort Worth Reg’l. Arpt. Rev. Participating VRDN Series | | | | | | | | |
| EGL 95 4301 Class A, 2.53% (Liquidity Facility Citibank | | | | | | | | |
| NA, New York) (c)(g) | | | | | | 24,435 | | | | 24,435 |
| Dallas Gen. Oblig. Participating VRDN Series Putters 598, | | | | | | | | |
| 2.53% (Liquidity Facility JPMorgan Chase & Co.) (c)(g) | | | | 5,885 | | | | 5,885 |
| Dallas Independent School District Participating VRDN: | | | | | | | | |
| Series EGL 7050034, Class A, 2.53% (Liquidity Facility | | | | | | | | |
| Citibank NA) (c)(g) | | | | | | 19,060 | | | | 19,060 |
| Series PT 2181, 2.53% (Liquidity Facility Merrill Lynch & Co., | | | | | | | | |
| Inc.) (c)(g) | | | | | | 3,645 | | | | 3,645 |
| Denton County Gen. Oblig. Participating VRDN Series PT | | | | | | | | |
| 2983, 2.53% (Liquidity Facility Merrill Lynch & Co., | | | | | | | | |
| Inc.) (c)(g) | | | | | | 6,940 | | | | 6,940 |
| Denton Util. Sys. Rev. Participating VRDN: | | | | | | | | | | |
| Series MS 00 428, 2.52% (Liquidity Facility Morgan | | | | | | | | |
| Stanley) (c)(g) | | | | | | 9,220 | | | | 9,220 |
| Series MS 01 635, 2.52% (Liquidity Facility Morgan | | | | | | | | |
| Stanley) (c)(g) | | | | | | 15,210 | | | | 15,210 |
| |
| See accompanying notes which are an integral part of the financial statements. | | | | |
| |
| Annual Report | | 68 | | | | | | | | |
| Municipal Securities continued | | | | | | | | |
| | | | | Principal | | Value (Note 1) |
| | | Amount (000s) | | | | (000s) |
| Texas continued | | | | | | | | |
| Dripping Springs Independent School District Participating | | | | | | | | |
| VRDN Series PT 3107, 2.53% (Liquidity Facility Merrill Lynch | | | | | | | | |
| & Co., Inc.) (c)(g) | | $ | | 9,095 | | $ | | 9,095 |
| Dublin Econ. Dev. Corp. Indl. Dev. Auth. Rev. (Universal | | | | | | | | |
| Blanchers LLC Proj.) 2.66%, LOC Harris NA, VRDN (c)(f) | | | | 4,200 | | | | 4,200 |
| Eagle Mountain & Saginaw Independent School District | | | | | | | | |
| Participating VRDN Series SGA 03 141, 2.41% (Liquidity | | | | | | | | |
| Facility Societe Generale) (c)(g) | | | | 6,000 | | | | 6,000 |
| Ector County Independent School District Participating VRDN | | | | | | | | |
| Series EGL 02 4301, 2.53% (Liquidity Facility Citibank NA, | | | | | | | | |
| New York) (c)(g) | | | | 4,120 | | | | 4,120 |
| El Paso Gen. Oblig.: | | | | | | | | |
| Series 2004 B, 2.6% 9/8/05, CP | | | | 20,000 | | | | 20,000 |
| 2.51% 9/1/05, CP | | | | 43,800 | | | | 43,800 |
| Fort Bend County Hsg. Fin. Corp. Single Family Rev. | | | | | | | | |
| Participating VRDN Series FRRI 02 L14, 2.53% (Liquidity | | | | | | | | |
| Facility Lehman Brothers Hldgs., Inc.) (c)(f)(g) | | | | 2,775 | | | | 2,775 |
| Frenship Independent School District Participating VRDN Series | | | | | | | | |
| PT 3036, 2.53% (Liquidity Facility Merrill Lynch & Co., | | | | | | | | |
| Inc.) (c)(g) | | | | 5,990 | | | | 5,990 |
| Frisco Gen. Oblig. Participating VRDN Series PT 1933, 2.53% | | | | | | | | |
| (Liquidity Facility Merrill Lynch & Co., Inc.) (c)(g) | | | | 16,085 | | | | 16,085 |
| Frisco Independent School District Participating VRDN Series | | | | | | | | |
| DB 157, 2.53% (Liquidity Facility Deutsche Bank AG) (c)(g) . | | | | 7,300 | | | | 7,300 |
| Galveston Indl. Dev. Corp. Rev. (Mitchell Interests Proj.) 2.53%, | | | | | | | | |
| LOC JPMorgan Chase Bank, VRDN (c)(f) | | | | 1,500 | | | | 1,500 |
| Garland Hsg. Fin. Corp. Multi-family Hsg. Rev. (Primerose at | | | | | | | | |
| Crist Apts. Proj.) 2.6%, LOC Wachovia Bank NA, | | | | | | | | |
| VRDN (c)(f) | | | | 6,900 | | | | 6,900 |
| Garland Independent School District Participating VRDN Series | | | | | | | | |
| ROC II R2213, 2.53% (Liquidity Facility Citigroup Global | | | | | | | | |
| Markets Hldgs., Inc.) (c)(g) | | | | 5,360 | | | | 5,360 |
| Georgetown Indl. Dev. Corp. Rev. (Chatsworth Products, Inc. | | | | | | | | |
| Proj.) Series 1996, 2.65%, LOC Suntrust Bank, VRDN (c)(f) . | | | | 4,475 | | | | 4,475 |
| Granbury Independent School District Participating VRDN | | | | | | | | |
| Series PT 3080, 2.53% (Liquidity Facility Merrill Lynch & Co., | | | | | | | | |
| Inc.) (c)(g) | | | | 7,665 | | | | 7,665 |
| Grapevine Gen. Oblig. Participating VRDN: | | | | | | | | |
| Series PT 3055, 2.53% (Liquidity Facility Merrill Lynch & Co., | | | | | | | | |
| Inc.) (c)(g) | | | | 5,305 | | | | 5,305 |
| Series PT 3056, 2.53% (Liquidity Facility Merrill Lynch & Co., | | | | | | | | |
| Inc.) (c)(g) | | | | 7,060 | | | | 7,060 |
| Greater East Texas Higher Ed. Auth. Student Ln. Rev. Bonds | | | | | | | | |
| Series 1993 B, 2.95%, tender 6/1/06, LOC State Street | | | | | | | | |
| Bank & Trust Co., Boston (a)(c)(f) | | | | 15,000 | | | | 15,000 |
| See accompanying notes which are an integral part of the financial statements. | | | | |
| |
| 69 | | | | | | Annual Report |
| Investments continued | | | | | | | | |
| |
| |
| |
| Municipal Securities continued | | | | | | | | |
| | | | | Principal | | Value (Note 1) |
| | | Amount (000s) | | | | (000s) |
| Texas continued | | | | | | | | |
| Gulf Coast Indl. Dev. Auth. (Mueller Flow Tech., Inc. Proj.) | | | | | | | | |
| Series 1997, 2.53%, LOC JPMorgan Chase Bank, | | | | | | | | |
| VRDN (c)(f) | | $ | | 3,280 | | $ | | 3,280 |
| Gulf Coast Indl. Dev. Auth. Envir. Facilities Rev. (Citgo | | | | | | | | |
| Petroleum Corp. Proj.) Series 1999, 2.44%, LOC BNP | | | | | | | | |
| Paribas SA, VRDN (c)(f) | | | | 17,300 | | | | 17,300 |
| Gulf Coast Indl. Dev. Auth. Solid Waste Disp. Rev. (Citgo | | | | | | | | |
| Petroleum Corp. Proj.) 2.44%, LOC Royal Bank of Scotland | | | | | | | | |
| Plc, VRDN (c)(f) | | | | 50,000 | | | | 50,000 |
| Gulf Coast Waste Disp. Auth. Envir. Facilities Rev.: | | | | | | | | |
| (Air Products Proj.) 2.43% (Air Products & Chemicals, Inc. | | | | | | | | |
| Guaranteed), VRDN (c)(f) | | | | 11,300 | | | | 11,300 |
| (BP Prods. North America, Inc. Proj.) 2.44%, VRDN (c)(f) | | | | 18,250 | | | | 18,250 |
| Gulf Coast Waste Disp. Auth. Solid Waste Disp. Rev. (Waste | | | | | | | | |
| Mgmt., Inc. Proj.) Series A, 2.55%, LOC JPMorgan Chase | | | | | | | | |
| Bank, VRDN (c)(f) | | | | 14,000 | | | | 14,000 |
| Harlingen Indl. Dev. Auth. Indl. Dev. Rev. (Gibbs Texas Die | | | | | | | | |
| Casting Proj.) 2.78%, LOC Fifth Third Bank, Cincinnati, | | | | | | | | |
| VRDN (c)(f) | | | | 5,150 | | | | 5,150 |
| Harris County Cultural Ed. Facilities Fin. Corp. Rev. (Houston | | | | | | | | |
| Music Hall-Hobby Ctr. Proj.) Series 1999, 2.55%, LOC | | | | | | | | |
| JPMorgan Chase Bank, VRDN (c) | | | | 4,900 | | | | 4,900 |
| Harris County Flood District Cont. Ctfs. of Prtn. Series F, 2.57% | | | | | | | | |
| 9/1/05, LOC Landesbank Hessen-Thuringen, CP | | | | 7,300 | | | | 7,300 |
| Harris County Gen. Oblig. Participating VRDN: | | | | | | | | |
| Series EGL 01 4305, 2.53% (Liquidity Facility Citibank NA, | | | | | | | | |
| New York) (c)(g) | | | | 20,600 | | | | 20,600 |
| Series PT 1623, 2.53% (Liquidity Facility Merrill Lynch & Co., | | | | | | | | |
| Inc.) (c)(g) | | | | 5,995 | | | | 5,995 |
| Harris County Hsg. Fin. Corp. Multi-family Hsg. Rev.: | | | | | | | | |
| (Baypointe Apts. Proj.) 2.48%, LOC Citibank NA, | | | | | | | | |
| VRDN (c)(f) | | | | 6,800 | | | | 6,800 |
| (Louetta Village Apts. Proj.) 2.57%, LOC Fannie Mae, | | | | | | | | |
| VRDN (c)(f) | | | | 7,100 | | | | 7,100 |
| (Primrose Aldine Bender Apt. Proj.) 2.57%, LOC Fannie | | | | | | | | |
| Mae, VRDN (c)(f) | | | | 6,170 | | | | 6,170 |
| (Primrose at Bammel Apts. Proj.) 2.57%, LOC Fannie Mae, | | | | | | | | |
| VRDN (c)(f) | | | | 12,600 | | | | 12,600 |
| (Quail Chase Apts. Proj.) Series 1999, 2.54%, LOC Gen. | | | | | | | | |
| Elec. Cap. Corp., VRDN (c)(f) | | | | 11,110 | | | | 11,110 |
| (Wellington Park Apts. Proj.) 2.57%, LOC Fannie Mae, | | | | | | | | |
| VRDN (c)(f) | | | | 5,500 | | | | 5,500 |
See accompanying notes which are an integral part of the financial statements.
| Municipal Securities continued | | | | | | | | |
| | | | | Principal | | Value (Note 1) |
| | | Amount (000s) | | | | (000s) |
| Texas continued | | | | | | | | |
| Houston Arpt. Sys. Rev. Participating VRDN: | | | | | | | | |
| Series Merlots 01 B4, 2.45% (Liquidity Facility Wachovia | | | | | | | | |
| Bank NA) (c)(f)(g) | | $ | | 4,675 | | $ | | 4,675 |
| Series MSTC 00 98, 2.41% (Liquidity Facility Bear Stearns | | | | | | | | |
| Companies, Inc.) (c)(g) | | | | 19,965 | | | | 19,965 |
| Series PT 1468, 2.57% (Liquidity Facility Merrill Lynch & Co., | | | | | | | | |
| Inc.) (c)(f)(g) | | | | 10,200 | | | | 10,200 |
| Series ROC II R40, 2.57% (Liquidity Facility Citibank | | | | | | | | |
| NA) (c)(f)(g) | | | | 10,125 | | | | 10,125 |
| Series ROC II R41, 2.57% (Liquidity Facility Citibank | | | | | | | | |
| NA) (c)(f)(g) | | | | 12,825 | | | | 12,825 |
| Houston Gen. Oblig.: | | | | | | | | |
| Participating VRDN: | | | | | | | | |
| Series EGL 04 1008 Class A, 2.53% (Liquidity Facility | | | | | | | | |
| Citibank NA) (c)(g) | | | | 10,000 | | | | 10,000 |
| Series PT 2974, 2.53% (Liquidity Facility Merrill Lynch & | | | | | | | | |
| Co., Inc.) (c)(g) | | | | 7,470 | | | | 7,470 |
| Series E, 2.55% 9/6/05 (Liquidity Facility Bank of America | | | | | | | | |
| NA), CP | | | | 10,000 | | | | 10,000 |
| Houston Hsg. Fin. Corp. Multi-family Hsg. Rev.: | | | | | | | | |
| (Fairlake Cove Apts. Proj.) 2.48%, LOC Citibank NA, | | | | | | | | |
| VRDN (c)(f) | | | | 5,000 | | | | 5,000 |
| (Little Nell Apts. Proj.) 2.57%, LOC Fannie Mae, VRDN (c)(f) | | | | 13,700 | | | | 13,700 |
| (Mayfair Park Apts. Proj.) 2.57%, LOC Fannie Mae, | | | | | | | | |
| VRDN (c)(f) | | | | 3,000 | | | | 3,000 |
| Houston Hsg. Fin. Corp. Single Family Mtg. Rev. Participating | | | | | | | | |
| VRDN Series PT 631, 2.57% (Liquidity Facility Merrill Lynch | | | | | | | | |
| & Co., Inc.) (c)(f)(g) | | | | 2,200 | | | | 2,200 |
| Houston Independent School District: | | | | | | | | |
| Bonds 2.77%, tender 6/14/06 (Permanent School Fund of | | | | | | | | |
| Texas Guaranteed) (c) | | | | 54,500 | | | | 54,500 |
| Participating VRDN Series MT 83, 2.53% (Liquidity Facility | | | | | | | | |
| BNP Paribas SA) (c)(g) | | | | 6,745 | | | | 6,745 |
| Houston Indl. Dev. Corp. Rev. (Aero Houston East LP Proj.) | | | | | | | | |
| Series 2003 A, 2.55%, LOC JPMorgan Chase Bank, | | | | | | | | |
| VRDN (c)(f) | | | | 4,970 | | | | 4,970 |
| Houston Util. Sys. Rev. Participating VRDN: | | | | | | | | |
| Merlots 04 B17, 2.4% (Liquidity Facility Wachovia Bank | | | | | | | | |
| NA) (c)(g) | | | | 4,680 | | | | 4,680 |
| ROC II R 4063, 2.53% (Liquidity Facility Citigroup Global | | | | | | | | |
| Markets Hldgs., Inc.) (c)(g) | | | | 9,980 | | | | 9,980 |
| Series DB 108, 2.53% (Liquidity Facility Deutsche Bank | | | | | | | | |
| AG) (c)(g) | | | | 7,300 | | | | 7,300 |
See accompanying notes which are an integral part of the financial statements.
71 Annual Report
| Investments continued | | | | | | | | |
| |
| |
| |
| Municipal Securities continued | | | | | | | | |
| | | | | Principal | | Value (Note 1) |
| | | Amount (000s) | | | | (000s) |
| Texas continued | | | | | | | | |
| Houston Util. Sys. Rev. Participating VRDN: – continued | | | | | | | | |
| Series Merlots C13, 2.4% (Liquidity Facility Wachovia Bank | | | | | | | | |
| NA) (c)(g) | | $ | | 7,695 | | $ | | 7,695 |
| Series TOC 04 A, 2.52% (Liquidity Facility Goldman Sachs | | | | | | | | |
| Group, Inc.) (c)(g) | | | | 12,600 | | | | 12,600 |
| Houston Wtr. & Swr. Sys. Rev. Participating VRDN: | | | | | | | | |
| Series EGL 02 4302, 2.53% (Liquidity Facility Citibank NA, | | | | | | | | |
| New York) (c)(g) | | | | 21,830 | | | | 21,830 |
| Series Merlots C20, 2.4% (Liquidity Facility Wachovia Bank | | | | | | | | |
| NA) (c)(g) | | | | 3,275 | | | | 3,275 |
| Series SGB 24, 2.53% (Liquidity Facility Societe | | | | | | | | |
| Generale) (c)(g) | | | | 6,840 | | | | 6,840 |
| Jewett Econ. Dev. Corp. Indl. Dev. Rev. (Nucor Corp. Proj.) | | | | | | | | |
| 2.43%, VRDN (c)(f) | | | | 6,300 | | | | 6,300 |
| Katy Independent School District Participating VRDN Series PT | | | | | | | | |
| 1598, 2.53% (Liquidity Facility Merrill Lynch & Co., | | | | | | | | |
| Inc.) (c)(g) | | | | 5,640 | | | | 5,640 |
| Keller Independent School District Participating VRDN Series | | | | | | | | |
| PT 3035, 2.53% (Liquidity Facility Merrill Lynch & Co., | | | | | | | | |
| Inc.) (c)(g) | | | | 16,790 | | | | 16,790 |
| Lancaster Independent School District Participating VRDN | | | | | | | | |
| Series PA 1264, 2.53% (Liquidity Facility Merrill Lynch & | | | | | | | | |
| Co., Inc.) (c)(g) | | | | 7,500 | | | | 7,500 |
| Laredo Int’l. Toll Bridge Rev. Participating VRDN Series PT | | | | | | | | |
| 3106, 2.53% (Liquidity Facility Merrill Lynch & Co., | | | | | | | | |
| Inc.) (c)(g) | | | | 6,875 | | | | 6,875 |
| Leander Independent School District Participating VRDN Series | | | | | | | | |
| Piper 2005 C, 2.59% (Liquidity Facility Bank of New York, | | | | | | | | |
| New York) (c)(g) | | | | 8,840 | | | | 8,840 |
| Lower Colorado River Auth. Rev. Participating VRDN: | | | | | | | | |
| Series EGL 00 4302, 2.53% (Liquidity Facility Citibank NA, | | | | | | | | |
| New York) (c)(g) | | | | 6,000 | | | | 6,000 |
| Series MSCO 01 577, 2.52% (Liquidity Facility Morgan | | | | | | | | |
| Stanley) (c)(g) | | | | 7,915 | | | | 7,915 |
| Series PT 2004, 2.53% (Liquidity Facility Merrill Lynch & Co., | | | | | | | | |
| Inc.) (c)(g) | | | | 5,765 | | | | 5,765 |
| Series PT 2270, 2.53% (Liquidity Facility Merrill Lynch & Co., | | | | | | | | |
| Inc.) (c)(g) | | | | 16,310 | | | | 16,310 |
| Lower Neches Valley Auth. Indl. Dev. Corp. Exempt Facilities | | | | | | | | |
| Rev. (Onyx Envir. Svcs. Proj.) 2.55%, LOC Fleet Nat’l. Bank, | | | | | | | | |
| VRDN (c)(f) | | | | 3,400 | | | | 3,400 |
| Lubbock Gen. Oblig. Participating VRDN Series ROC II | | | | | | | | |
| R4532, 2.53% (Liquidity Facility Citigroup Global Markets | | | | | | | | |
| Hldgs., Inc.) (c)(g) | | | | 5,150 | | | | 5,150 |
See accompanying notes which are an integral part of the financial statements.
Annual Report
| Municipal Securities continued | | | | | | | | |
| | | | | Principal | | Value (Note 1) |
| | | Amount (000s) | | | | (000s) |
| Texas continued | | | | | | | | |
| McAllen Independent School District Participating VRDN: | | | | | | | | |
| Seires SGB 61, 2.53% (Liquidity Facility Societe | | | | | | | | |
| Generale) (c)(g) | | $ | | 13,600 | | $ | | 13,600 |
| Series PT 3082, 2.53% (Liquidity Facility Merrill Lynch & Co., | | | | | | | | |
| Inc.) (c)(g) | | | | 11,860 | | | | 11,860 |
| McAllen Wtrwks. & Swr. Sys. Rev. Participating VRDN Series | | | | | | | | |
| Putters 1064, 2.4% (Liquidity Facility JPMorgan Chase & | | | | | | | | |
| Co.) (c)(g) | | | | 5,920 | | | | 5,920 |
| Mineral Wells Ind. Dev. Corp. Rev. (Ameron Int’l. Corp. Proj.) | | | | | | | | |
| 2.71%, LOC Bank of America NA, VRDN (c)(f) | | | | 7,200 | | | | 7,200 |
| Montgomery County Gen. Oblig. Participating VRDN Series PT | | | | | | | | |
| 2339, 2.53% (Liquidity Facility Merrill Lynch & Co., | | | | | | | | |
| Inc.) (c)(g) | | | | 6,925 | | | | 6,925 |
| Nacogdoches County Hosp. District Sales Tax Rev. | | | | | | | | |
| Participating VRDN Series Merlots 01 A59, 2.4% (Liquidity | | | | | | | | |
| Facility Wachovia Bank NA) (c)(g) | | | | 5,105 | | | | 5,105 |
| North Central Health Facilities Dev. Corp. Rev. Bonds (Dallas | | | | | | | | |
| Methodist Hosp. Proj.) Series 1998: | | | | | | | | |
| 2.55% tender 9/6/05 (AMBAC Insured) (Liquidity Facility | | | | | | | | |
| Dexia Cr. Local de France), CP mode | | | | 7,000 | | | | 7,000 |
| 2.9% tender 11/4/05 (AMBAC Insured) (Liquidity Facility | | | | | | | | |
| Dexia Cr. Local de France), CP mode | | | | 10,000 | | | | 10,000 |
| North East Texas Independent School District Participating | | | | | | | | |
| VRDN: | | | | | | | | |
| Series Putters 393, 2.53% (Liquidity Facility JPMorgan Chase | | | | | | | | |
| Bank) (c)(g) | | | | 6,840 | | | | 6,840 |
| Series SG 143, 2.53% (Liquidity Facility Societe | | | | | | | | |
| Generale) (c)(g) | | | | 13,000 | | | | 13,000 |
| Northside Independent School District Participating VRDN | | | | | | | | |
| Series PT 2254, 2.53% (Liquidity Facility Merrill Lynch & Co., | | | | | | | | |
| Inc.) (c)(g) | | | | 5,370 | | | | 5,370 |
| Odessa Wtr. & Swr. Rev. Participating VRDN Series EGL 01 | | | | | | | | |
| 4307, 2.53% (Liquidity Facility Citibank NA, New | | | | | | | | |
| York) (c)(g) | | | | 9,500 | | | | 9,500 |
| Pearland Gen. Oblig. Participating VRDN Series PT 2364, | | | | | | | | |
| 2.53% (Liquidity Facility Merrill Lynch & Co., Inc.) (c)(g) | | | | 5,780 | | | | 5,780 |
| Plano Independent School District: | | | | | | | | |
| Bonds 2.85%, tender 1/26/06 (Permanent School Fund of | | | | | | | | |
| Texas Guaranteed) (c) | | | | 16,115 | | | | 16,115 |
| Participating VRDN Series ROC II R2106, 2.53% (Liquidity | | | | | | | | |
| Facility Citigroup Global Markets Hldgs., Inc.) (c)(g) | | | | 6,485 | | | | 6,485 |
| Polly Ryon Hosp. Auth. Texas Rev. (Polly Ryon Memorial Hosp. | | | | | | | | |
| Proj.) 2.55%, LOC JPMorgan Chase Bank, VRDN (c) | | | | 6,450 | | | | 6,450 |
See accompanying notes which are an integral part of the financial statements.
73 Annual Report
| Investments continued | | | | | | | | |
| |
| |
| Municipal Securities continued | | | | | | | | |
| | | | | Principal | | Value (Note 1) |
| | | Amount (000s) | | | | (000s) |
| Texas continued | | | | | | | | |
| Port Arthur Navigation District Indl. Dev. Corp. Exempt | | | | | | | | |
| Facilities Rev. (Air Products & Chemicals, Inc. Proj.) 2.45% | | | | | | | | |
| (Air Products & Chemicals, Inc. Guaranteed), VRDN (c)(f) | | $ | | 8,300 | | $ | | 8,300 |
| Port Corpus Christi Indl. Dev. Corp. Envir. Facilities Rev. (Citgo | | | | | | | | |
| Petroleum Corp. Proj.) Series 1998, 2.44%, LOC JPMorgan | | | | | | | | |
| Chase Bank, VRDN (c)(f) | | | | 19,200 | | | | 19,200 |
| Port of Port Arthur Navigation District Envir. Facilities Rev. | | | | | | | | |
| (Motiva Enterprises LLC Proj.) 2.46%, VRDN (c)(f) | | | | 50,630 | | | | 50,630 |
| Princeton Independent School District Participating VRDN | | | | | | | | |
| Series SGB 02 41A, 2.53% (Liquidity Facility Societe | | | | | | | | |
| Generale) (c)(g) | | | | 3,500 | | | | 3,500 |
| Round Rock Independent School District Participating VRDN | | | | | | | | |
| Series EGL 050064, 2.53% (Liquidity Facility Citibank | | | | | | | | |
| NA) (c)(g) | | | | 11,000 | | | | 11,000 |
| San Antonio Arpt. Sys. Rev. Participating VRDN: | | | | | | | | |
| Series MT 136, 2.57% (Liquidity Facility Merrill Lynch & Co., | | | | | | | | |
| Inc.) (c)(f)(g) | | | | 4,995 | | | | 4,995 |
| Series MT 29, 2.57% (Liquidity Facility Landesbank | | | | | | | | |
| Hessen-Thuringen) (c)(f)(g) | | | | 17,465 | | | | 17,465 |
| Series PT 2796, 2.57% (Liquidity Facility Merrill Lynch & Co., | | | | | | | | |
| Inc.) (c)(f)(g) | | | | 6,015 | | | | 6,015 |
| Series PT 924, 2.57% (Liquidity Facility Lloyds TSB Bank | | | | | | | | |
| PLC) (c)(f)(g) | | | | 5,000 | | | | 5,000 |
| Series Putters 888, 2.56% (Liquidity Facility JPMorgan Chase | | | | | | | | |
| & Co.) (c)(f)(g) | | | | 6,360 | | | | 6,360 |
| Series Stars 107, 2.57% (Liquidity Facility BNP Paribas | | | | | | | | |
| SA) (c)(f)(g) | | | | 4,310 | | | | 4,310 |
| Series Stars 134, 2.57% (Liquidity Facility BNP Paribas | | | | | | | | |
| SA) (c)(f)(g) | | | | 4,865 | | | | 4,865 |
| San Antonio Elec. & Gas Systems Rev.: | | | | | | | | |
| Participating VRDN: | | | | | | | | |
| Series Merlots 01 A10, 2.4% (Liquidity Facility Wachovia | | | | | | | | |
| Bank NA) (c)(g) | | | | 5,775 | | | | 5,775 |
| Series PT 1708, 2.54% (Liquidity Facility Merrill Lynch & | | | | | | | | |
| Co., Inc.) (c)(g) | | | | 7,495 | | | | 7,495 |
| Series PT 2649, 2.53% (Liquidity Facility Merrill Lynch & | | | | | | | | |
| Co., Inc.) (c)(g) | | | | 13,075 | | | | 13,075 |
| Series Putters 771, 2.53% (Liquidity Facility JPMorgan | | | | | | | | |
| Chase & Co.) (c)(g) | | | | 8,140 | | | | 8,140 |
| Series SG 105, 2.53% (Liquidity Facility Societe | | | | | | | | |
| Generale) (c)(g) | | | | 9,500 | | | | 9,500 |
| Series A: | | | | | | | | |
| 2.57% 9/15/05, CP | | | | 7,500 | | | | 7,500 |
| 2.78% 9/8/05, CP | | | | 22,000 | | | | 22,000 |
See accompanying notes which are an integral part of the financial statements.
| Municipal Securities continued | | | | | | | | |
| | | | | Principal | | Value (Note 1) |
| | | Amount (000s) | | | | (000s) |
| Texas continued | | | | | | | | |
| San Antonio Gen. Oblig. Participating VRDN Series ROC II | | | | | | | | |
| R7519, 2.53% (Liquidity Facility Citibank NA) (c)(g) | | $ | | 5,155 | | $ | | 5,155 |
| San Antonio Independent School District Bonds Series AAB 01 | | | | | | | | |
| 28, 2.42%, tender 9/7/05 (Liquidity Facility ABN-AMRO | | | | | | | | |
| Bank NV) (c)(g) | | | | 15,500 | | | | 15,500 |
| San Antonio Indl. Dev. Auth. Indl. Dev. Rev. (LGC Bldg. & KLN | | | | | | | | |
| Steel Proj.) Series 1998, 2.6%, LOC Bank of America NA, | | | | | | | | |
| VRDN (c)(f) | | | | 3,300 | | | | 3,300 |
| San Antonio Muni. Drainage Util. Sys. Rev. Participating | | | | | | | | |
| VRDN Series Putters 811T, 2.53% (Liquidity Facility | | | | | | | | |
| JPMorgan Chase Bank) (c)(g) | | | | 14,325 | | | | 14,325 |
| San Antonio Wtr. Sys. Rev.: | | | | | | | | |
| Participating VRDN: | | | | | | | | |
| Series Merlots 00 VV, 2.4% (Liquidity Facility Wachovia | | | | | | | | |
| Bank NA) (c)(g) | | | | 8,700 | | | | 8,700 |
| Series SG 02 159, 2.53% (Liquidity Facility Societe | | | | | | | | |
| Generale) (c)(g) | | | | 22,500 | | | | 22,500 |
| Series 2001 A, 2.9% 11/2/05 (Liquidity Facility Bank of | | | | | | | | |
| America NA), CP | | | | 39,500 | | | | 39,500 |
| San Marcos Consolidated Independent School District | | | | | | | | |
| Participating VRDN Series PT 2284, 2.53% (Liquidity Facility | | | | | | | | |
| Merrill Lynch & Co., Inc.) (c)(g) | | | | 8,755 | | | | 8,755 |
| Tarrant County Health Facilities Dev. Corp. Health Sys. Rev. | | | | | | | | |
| Participating VRDN Series Merlots 00 BB, 2.4% (Liquidity | | | | | | | | |
| Facility Wachovia Bank NA) (c)(g) | | | | 7,885 | | | | 7,885 |
| Tarrant County Health Facilities Dev. Corp. Rev. (Carter Blood | | | | | | | | |
| Care Proj.) Series 1998, 2.55%, LOC JPMorgan Chase | | | | | | | | |
| Bank, VRDN (c) | | | | 9,325 | | | | 9,325 |
| Terrell Dev. Corp. Indl. Dev. Rev. (Consolidated Sys. Proj.) | | | | | | | | |
| 2.54%, LOC Wachovia Bank NA, VRDN (c)(f) | | | | 3,600 | | | | 3,600 |
| Texas Dept. Hsg. & Cmnty. Affairs Mtg. Rev. Participating | | | | | | | | |
| VRDN Series LB 04 L2, 2.53% (Liquidity Facility Lehman | | | | | | | | |
| Brothers Hldgs., Inc.) (c)(f)(g) | | | | 6,130 | | | | 6,130 |
| Texas Dept. Hsg. & Cmnty. Affairs Residential Mtg. Rev. | | | | | | | | |
| Participating VRDN Series LB 05 L4J, 2.53% (Liquidity | | | | | | | | |
| Facility Lehman Brothers Hldgs., Inc.) (c)(f)(g) | | | | 10,515 | | | | 10,515 |
| Texas Dept. Hsg. & Cmnty. Affairs Single Family Rev.: | | | | | | | | |
| Participating VRDN: | | | | | | | | |
| Series FRRI 02 L9, 2.53% (Liquidity Facility Lehman | | | | | | | | |
| Brothers Hldgs., Inc.) (c)(f)(g) | | | | 10,465 | | | | 10,465 |
| Series LB 04 L16, 2.53% (Liquidity Facility Lehman | | | | | | | | |
| Brothers Hldgs., Inc.) (c)(f)(g) | | | | 4,955 | | | | 4,955 |
| Series LB 04 L79, 2.53% (Liquidity Facility Lehman | | | | | | | | |
| Brothers Hldgs., Inc.) (c)(f)(g) | | | | 9,925 | | | | 9,925 |
See accompanying notes which are an integral part of the financial statements.
75 Annual Report
| Investments continued | | | | | | | | | | |
| |
| |
| Municipal Securities continued | | | | | | | | | | |
| | | | | | | Principal | | Value (Note 1) |
| | | | | Amount (000s) | | | | (000s) |
| Texas continued | | | | | | | | | | |
| Texas Dept. Hsg. & Cmnty. Affairs Single Family Rev.: - | | | | | | | | | | |
| continued | | | | | | | | | | |
| Participating VRDN: | | | | | | | | | | |
| Series ROC II R178, 2.57% (Liquidity Facility Citibank | | | | | | | | | | |
| NA) (c)(f)(g) | | | | $ | | 4,150 | | $ | | 4,150 |
| Series 2004 B, 2.42% (FSA Insured), VRDN (c)(f) | | | | | | 15,300 | | | | 15,300 |
| Series 2004 D, 2.54% (FSA Insured), VRDN (c)(f) | | | | | | 5,800 | | | | 5,800 |
| Texas Dept. of Hsg. & Cmnty. Affairs Multi-family Rev.: | | | | | | | | | | |
| (Bristol Apts. Proj.) 2.57%, LOC Fannie Mae, VRDN (c)(f) | | | | | | 4,000 | | | | 4,000 |
| (Chisholm Trail Proj.) 2.57%, LOC Fannie Mae, VRDN (c)(f) | | . | | | | 6,000 | | | | 6,000 |
| (Lafayette Village Apts. Proj.) 2.6%, LOC Bank of America | | | | | | | | | | |
| NA, VRDN (c)(f) | | | | | | 7,000 | | | | 7,000 |
| (Pinnacle Apts. Proj.) 2.57%, LOC Fannie Mae, VRDN (c)(f) | | . | | | | 7,500 | | | | 7,500 |
| (Post Oak East Apts. Proj.) Series A, 2.57%, LOC Fannie | | | | | | | | | | |
| Mae, VRDN (c)(f) | | | | | | 8,000 | | | | 8,000 |
| Texas Gen. Oblig.: | | | | | | | | | | |
| Bonds (College Student Ln. Prog.) 2.5%, tender 9/1/05 | | | | | | | | | | |
| (Liquidity Facility Landesbank Hessen-Thuringen) (c)(f) | | | | | | 32,245 | | | | 32,245 |
| Participating VRDN: | | | | | | | | | | |
| Series FRRI 01 L41, 2.58% (Liquidity Facility Lehman | | | | | | | | | | |
| Brothers Hldgs., Inc.) (c)(f)(g) | | | | | | 13,370 | | | | 13,370 |
| Series MACN 05 I, 2.53% (Liquidity Facility Bank of | | | | | | | | | | |
| America NA) (c)(g) | | | | | | 4,695 | | | | 4,695 |
| Series Merlots 00 QQ, 2.45% (Liquidity Facility Wachovia | | | | | | | | |
| Bank NA) (c)(f)(g) | | | | | | 22,050 | | | | 22,050 |
| Series MT 109, 2.53% (Liquidity Facility Svenska | | | | | | | | | | |
| Handelsbanken AB) (c)(f)(g) | | | | | | 5,475 | | | | 5,475 |
| Series PA 1063, 2.57% (Liquidity Facility Merrill Lynch & | | | | | | | | | | |
| Co., Inc.) (c)(f)(g) | | | | | | 8,995 | | | | 8,995 |
| Series PA 631R, 2.57% (Liquidity Facility Merrill Lynch & | | | | | | | | | | |
| Co., Inc.) (c)(f)(g) | | | | | | 7,600 | | | | 7,600 |
| Series PA 975, 2.57% (Liquidity Facility Merrill Lynch & | | | | | | | | | | |
| Co., Inc.) (c)(f)(g) | | | | | | 7,495 | | | | 7,495 |
| Series PT 1191, 2.58% (Liquidity Facility Merrill Lynch & | | | | | | | | | | |
| Co., Inc.) (c)(f)(g) | | | | | | 1,645 | | | | 1,645 |
| Series PT 3049, 2.53% (Liquidity Facility Merrill Lynch & | | | | | | | | | | |
| Co., Inc.) (c)(g) | | | | | | 8,540 | | | | 8,540 |
| Series PT 524, 2.57% (Liquidity Facility Merrill Lynch & | | | | | | | | | | |
| Co., Inc.) (c)(f)(g) | | | | | | 5,635 | | | | 5,635 |
| (Veterans Hsg. Assistance Prog.): | | | | | | | | | | |
| Fund II Series 2002 A2, 2.41%, VRDN (c)(f) | | | | | | 20,565 | | | | 20,565 |
| Series A, 2.5% (Liquidity Facility State Street Bank & Trust | | | | | | | | | | |
| Co., Boston), VRDN (c)(f) | | | | | | 25,920 | | | | 25,920 |
| (Veterans Land Proj.) Series A, 2.41%, VRDN (c)(f) | | | | | | 30,525 | | | | 30,525 |
See accompanying notes which are an integral part of the financial statements.
Annual Report
| Municipal Securities continued | | | | | | |
| | | Principal | | Value (Note 1) |
| | | Amount (000s) | | | | (000s) |
| Texas continued | | | | | | |
| Texas Gen. Oblig.: – continued | | | | | | |
| TRAN 4.5% 8/31/06 (b) | | $ 247,000 | | $ | | 250,584 |
| Texas Pub. Fin. Auth. Series 2002 A, 2.7% 9/9/05 (Liquidity | | | | | | |
| Facility Texas Gen. Oblig.), CP | | 12,500 | | | | 12,500 |
| Texas Tpk. Auth. 1 Tier Rev. Participating VRDN Series EGL 02 | | | | | | |
| 6004, 2.53% (Liquidity Facility Citibank NA, New | | | | | | |
| York) (c)(g) | | 12,650 | | | | 12,650 |
| Texas Tpk. Auth. Central Tpk. Sys. Rev. Participating VRDN | | | | | | |
| Series PZ 66, 2.57% (Liquidity Facility Merrill Lynch & Co., | | | | | | |
| Inc.) (c)(g) | | 5,550 | | | | 5,550 |
| Town Ctr. Impt. District Sales & Hotel Occupancy Tax | | | | | | |
| Participating VRDN Series PA 884R, 2.53% (Liquidity Facility | | | | | | |
| Merrill Lynch & Co., Inc.) (c)(g) | | 5,000 | | | | 5,000 |
| Travis County Hsg. Fin. Corp. (Rosemont at Old Manor Apts.) | | | | | | |
| 2.57%, LOC Fannie Mae, VRDN (c)(f) | | 6,700 | | | | 6,700 |
| Tyler Health Facilities Dev. Corp. Hosp. Rev. Participating | | | | | | |
| VRDN Series PT 833, 2.53% (Liquidity Facility Svenska | | | | | | |
| Handelsbanken AB) (c)(g) | | 17,175 | | | | 17,175 |
| Univ. of Texas Univ. Revs.: | | | | | | |
| Participating VRDN Series Putters 584, 2.53% (Liquidity | | | | | | |
| Facility JPMorgan Chase Bank) (c)(g) | | 5,000 | | | | 5,000 |
| Series 2002 A, 2.55% 9/1/05 (Liquidity Facility Utmico), CP | | 11,000 | | | | 11,000 |
| Victory Street Pub. Facility Corp. Multi-family Hsg. Rev. | | | | | | |
| (Uvalde Ranch Apts. Proj.) 2.6%, LOC Bank of America NA, | | | | | | |
| VRDN (c)(f) | | 6,650 | | | | 6,650 |
| Waxahachie Gen. Oblig. Participating VRDN Series PT 2273, | | | | | | |
| 2.53% (Liquidity Facility Merrill Lynch & Co., Inc.) (c)(g) | | 5,530 | | | | 5,530 |
| Ysleta Independent School District Participating VRDN Series | | | | | | |
| Putters 1039, 2.4% (Liquidity Facility JPMorgan Chase & | | | | | | |
| Co.) (c)(g) | | 8,900 | | | | 8,900 |
| | | | | | | 2,499,874 |
| |
| Utah 0.2% | | | | | | |
| Central Utah Wtr. Conservancy District Wtr. Conservancy Rev. | | | | | | |
| Participating VRDN Series ROC II R2202, 2.53% (Liquidity | | | | | | |
| Facility Citigroup Global Markets Hldgs., Inc.) (c)(g) | | 8,565 | | | | 8,565 |
| Intermountain Pwr. Agcy. Pwr. Supply Rev. Participating VRDN | | | | | | |
| Series EGL 96 C4402 Class A, 2.53% (Liquidity Facility | | | | | | |
| Citibank NA, New York) (c)(g) | | 4,170 | | | | 4,170 |
| Salt Lake County Hosp. Rev. Participating VRDN Series PT 877, | | | | | | |
| 2.53% (Liquidity Facility Landesbank Hessen Thuringen) (c)(g) . | | 9,990 | | | | 9,990 |
See accompanying notes which are an integral part of the financial statements.
Annual Report
| Investments continued | | | | | | | | |
| |
| |
| Municipal Securities continued | | | | | | | | |
| | | | | Principal | | Value (Note 1) |
| | | Amount (000s) | | | | (000s) |
| Utah – continued | | | | | | | | |
| Toole City Indl. Dev. Rev. (Nelson & Sons Proj.) Series 1997, | | | | | | | | |
| 2.51%, LOC Key Bank NA, VRDN (c)(f) | | $ | | 370 | | $ | | 370 |
| Utah Bldg. Ownership Auth. Lease Rev. Participating VRDN | | | | | | | | |
| Series Putters 536, 2.53% (Liquidity Facility JPMorgan Chase | | | | | | | | |
| Bank) (c)(g) | | | | 10,365 | | | | 10,365 |
| | | | | | | | | 33,460 |
| |
| Vermont – 0.4% | | | | | | | | |
| Vermont Edl. & Health Bldgs. Fing. Agcy. Rev. Participating | | | | | | | | |
| VRDN Series Merlots 00 B7, 2.4% (Liquidity Facility | | | | | | | | |
| Wachovia Bank NA) (c)(g) | | | | 10,220 | | | | 10,220 |
| Vermont Hsg. Fin. Agcy. Single Family: | | | | | | | | |
| Participating VRDN: | | | | | | | | |
| Series LB 04 L13, 2.53% (Liquidity Facility Lehman | | | | | | | | |
| Brothers Hldgs., Inc.) (c)(f)(g) | | | | 2,850 | | | | 2,850 |
| Series LB 04 L76, 2.53% (Liquidity Facility Lehman | | | | | | | | |
| Brothers Hldgs., Inc.) (c)(f)(g) | | | | 5,925 | | | | 5,925 |
| Series 17 A, 2.47% (FSA Insured), VRDN (c)(f) | | | | 7,500 | | | | 7,500 |
| Vermont Indl. Dev. Auth. Indl. Dev. Rev. (Ryegate Proj.) Series | | | | | | | | |
| 1990, 2.45%, LOC ABN AMRO Bank NV, VRDN (c)(f) | | | | 8,100 | | | | 8,100 |
| Vermont Student Assistant Corp. Ed. Ln. Rev. Series 2005 QQ, | | | | | | | | |
| 2.42% (AMBAC Insured), VRDN (c)(f) | | | | 30,000 | | | | 30,000 |
| | | | | | | | | 64,595 |
| |
| Virginia – 2.1% | | | | | | | | |
| Alexandria Redev. & Hsg. Auth. Multi-family Hsg. Rev. | | | | | | | | |
| (Fairfield Village Square Proj.) Series A, 2.57%, LOC Fannie | | | | | | | | |
| Mae, VRDN (c)(f) | | | | 10,000 | | | | 10,000 |
| Arlington Co. Indl. Dev. Auth. Multi-family Hsg. Rev. (Gates of | | | | | | | | |
| Ballston Apartments) 2.42%, LOC Rbc Centura Bank Rocky, | | | | | | | | |
| VRDN (c)(f) | | | | 14,000 | | | | 14,000 |
| Botetourt County Indl. Dev. Auth. Indl. Dev. Rev. (Virginia | | | | | | | | |
| Forge Co. Proj.) Series 1996, 2.66%, LOC Harris NA, | | | | | | | | |
| VRDN (c)(f) | | | | 1,165 | | | | 1,165 |
| Charles City County Econ. Dev. Auth. Solid Waste Disp. Rev. | | | | | | | | |
| (Waste Mgmt., Inc. Proj.) Series A, 2.55%, LOC JPMorgan | | | | | | | | |
| Chase Bank, VRDN (c)(f) | | | | 4,500 | | | | 4,500 |
| Chesterfield County Indl. Dev. Auth. Rev. Participating VRDN: | | | | | | | | |
| Series PT 2133, 2.58% (Liquidity Facility Merrill Lynch & Co., | | | | | | | | |
| Inc.) (c)(g) | | | | 11,000 | | | | 11,000 |
| Series PT 886, 2.58% (Liquidity Facility Lloyds TSB Bank | | | | | | | | |
| PLC) (c)(g) | | | | 13,600 | | | | 13,600 |
| Fairfax County Econ. Dev. Rev. Exempt Facilities Rev. (Hilltop | | | | | | | | |
| Sand & Gravel, Inc. Proj.) Series 2000, 2.54%, LOC | | | | | | | | |
| Wachovia Bank NA, VRDN (c)(f) | | | | 4,600 | | | | 4,600 |
See accompanying notes which are an integral part of the financial statements.
| Municipal Securities continued | | | | | | | | |
| | | | | Principal | | Value (Note 1) |
| | | Amount (000s) | | | | (000s) |
| Virginia – continued | | | | | | | | |
| Fairfax County Wtr. Auth. Wtr. Rev. Participating VRDN Series | | | | | | | | |
| ROC II R349, 2.53% (Liquidity Facility Citibank NA) (c)(g) | | $ | | 5,000 | | $ | | 5,000 |
| Frederick County Indl. Dev. Auth. Rev. (Nat’l. Wildlife | | | | | | | | |
| Federation Proj.) Series 1996, 2.55%, LOC Bank of America | | | | | | | | |
| NA, VRDN (c)(f) | | | | 6,810 | | | | 6,810 |
| Halifax County Indl. Dev. Auth. Exempt Facilities Rev. | | | | | | | | |
| Participating VRDN Series PA 1104, 2.56% (Liquidity Facility | | | | | | | | |
| Merrill Lynch & Co., Inc.) (c)(f)(g) | | | | 5,245 | | | | 5,245 |
| Halifax County Indl. Dev. Auth. Poll. Cont. Rev. Bonds (Virginia | | | | | | | | |
| Elec. & Pwr. Co. Proj.) Series 1992: | | | | | | | | |
| 2.6% tender 9/9/05, CP mode (f) | | | | 10,000 | | | | 10,000 |
| 2.75% tender 9/7/05, CP mode (f) | | | | 34,800 | | | | 34,800 |
| Hampton Indl. Dev. Auth. Exempt Facilities Rev. (USA Waste of | | | | | | | | |
| Virginia Landfills, Inc. Proj.) Series 2000, 2.54%, LOC | | | | | | | | |
| Wachovia Bank NA, VRDN (c)(f) | | | | 10,000 | | | | 10,000 |
| Louisa Indl. Dev. Auth. Poll. Cont. Rev. Bonds (Virginia Elec. & | | | | | | | | |
| Pwr. Co. Proj.): | | | | | | | | |
| Series 1984: | | | | | | | | |
| 2.52% tender 9/7/05, CP mode | | | | 3,400 | | | | 3,400 |
| 2.77% tender 10/3/05, CP mode | | | | 2,400 | | | | 2,400 |
| 2.78% tender 10/14/05, CP mode | | | | 4,000 | | | | 4,000 |
| Series 1987: | | | | | | | | |
| 2.6% tender 9/9/05, CP mode | | | | 1,700 | | | | 1,700 |
| 2.7% tender 9/7/05, CP mode | | | | 13,100 | | | | 13,100 |
| Norfolk Econ. Dev. Auth. Hosp. Facilities Rev. Participating | | | | | | | | |
| VRDN Series ROC II R322, 2.53% (Liquidity Facility Citibank | | | | | | | | |
| NA) (c)(g) | | | | 13,475 | | | | 13,475 |
| Norfolk Econ. Dev. Auth. New Empowerment Zone Facility | | | | | | | | |
| Rev. (Metropolitan Machine Corp. Proj.) 2.54%, LOC | | | | | | | | |
| Wachovia Bank NA, VRDN (c)(f) | | | | 6,600 | | | | 6,600 |
| Petersburg Indl. Dev. Auth. Rev. (Rebar Hldgs. LLC Proj.) | | | | | | | | |
| 2.59%, LOC Wachovia Bank NA, VRDN (c)(f) | | | | 4,210 | | | | 4,210 |
| Portsmouth Indl. Dev. Auth. Enterprise Zone Facility Rev. | | | | | | | | |
| (Ocean Marine LLC Proj.) Series 2001 B, 2.59%, LOC | | | | | | | | |
| Wachovia Bank NA, VRDN (c)(f) | | | | 3,000 | | | | 3,000 |
| Portsmouth Indl. Dev. Auth. New Empowerment Zone Facility | | | | | | | | |
| Rev. (Ocean Marine LLC Proj.) Series A, 2.54%, LOC | | | | | | | | |
| Wachovia Bank NA, VRDN (c)(f) | | | | 6,300 | | | | 6,300 |
| Prince William County Indl. Dev. Auth. Poll. Cont. Rev. Bonds | | | | | | | | |
| (Virginia Elec. & Pwr. Co. Proj.) 2.6% tender 9/9/05, CP | | | | | | | | |
| mode | | | | 9,800 | | | | 9,800 |
| Prince William County Indl. Dev. Auth. Swr. (Dale Svc. Corp. | | | | | | | | |
| Proj.) Series 2000, 2.54%, LOC Wachovia Bank NA, | | | | | | | | |
| VRDN (c)(f) | | | | 8,540 | | | | 8,540 |
| |
| See accompanying notes which are an integral part of the financial statements. | | | | |
| |
| 79 | | | | | | Annual Report |
| Investments continued | | | | | | | | |
| |
| |
| |
| Municipal Securities continued | | | | | | | | |
| | | | | Principal | | Value (Note 1) |
| | | Amount (000s) | | | | (000s) |
| Virginia – continued | | | | | | | | |
| Pulaski County Indl. Dev. Auth. Indl. Dev. Rev. (Pulaski | | | | | | | | |
| Furniture Proj.) 2.54%, LOC Wachovia Bank NA, | | | | | | | | |
| VRDN (c)(f) | | $ | | 9,000 | | $ | | 9,000 |
| Sussex County Indl. Dev. Auth. Solid Waste Disp. Rev. (Atlantic | | | | | | | | |
| Waste Disp. Proj.) 2.59%, LOC JPMorgan Chase Bank, | | | | | | | | |
| VRDN (c)(f) | | | | 10,000 | | | | 10,000 |
| Univ. of Virginia Univ. Revs. Participating VRDN Series EGL 03 | | | | | | | | |
| 30, 2.53% (Liquidity Facility Citibank NA, New York) (c)(g) . | | | | 3,300 | | | | 3,300 |
| Virginia College Bldg. Auth. Edl. Facilities Rev. Participating | | | | | | | | |
| VRDN Series MS 01 721, 2.52% (Liquidity Facility Morgan | | | | | | | | |
| Stanley) (c)(g) | | | | 23,300 | | | | 23,300 |
| Virginia Commonwealth Trans. Board Trans. Rev. Participating | | | | | | | | |
| VRDN: | | | | | | | | |
| Series EGL 99 4601, 2.53% (Liquidity Facility Citibank NA, | | | | | | | | |
| New York) (c)(g) | | | | 7,000 | | | | 7,000 |
| Series MS 01 727, 2.52% (Liquidity Facility Morgan | | | | | | | | |
| Stanley) (c)(g) | | | | 6,000 | | | | 6,000 |
| Virginia Hsg. Dev. Auth. Commonwealth Mtg. Bonds Series A, | | | | | | | | |
| 2.63%, tender 9/14/05 (c)(f) | | | | 73,100 | | | | 73,100 |
| Virginia Port Auth. Commonwealth Port Rev. Participating | | | | | | | | |
| VRDN Series DB 138, 2.56% (Liquidity Facility Deutsche | | | | | | | | |
| Bank AG) (c)(f)(g) | | | | 7,285 | | | | 7,285 |
| | | | | | | | | 346,230 |
| |
| Washington 4.3% | | | | | | | | |
| Bellevue Gen. Oblig. Participating VRDN Series EGL 04 1011 | | | | | | | | |
| Class A, 2.53% (Liquidity Facility Citibank NA) (c)(g) | | | | 6,050 | | | | 6,050 |
| Chelan County Pub. Util. District #1 Rev. Participating VRDN: | | | | | | | | |
| Series Merlots 00 R, 2.45% (Liquidity Facility Wachovia | | | | | | | | |
| Bank NA) (c)(f)(g) | | | | 14,955 | | | | 14,955 |
| Series Merlots 01 B1, 2.45% (Liquidity Facility Wachovia | | | | | | | | |
| Bank NA) (c)(f)(g) | | | | 6,990 | | | | 6,990 |
| Series PA 1047, 2.57% (Liquidity Facility Merrill Lynch & | | | | | | | | |
| Co., Inc.) (c)(f)(g) | | | | 8,995 | | | | 8,995 |
| Series PT 950, 2.53% (Liquidity Facility Merrill Lynch & Co., | | | | | | | | |
| Inc.) (c)(g) | | | | 4,995 | | | | 4,995 |
| Clark County Pub. Util. District #1 Elec. Rev. Participating | | | | | | | | |
| VRDN Series Merlots 02 A3, 2.4% (Liquidity Facility | | | | | | | | |
| Wachovia Bank NA) (c)(g) | | | | 4,480 | | | | 4,480 |
| Douglas County Pub. Util. District #1 Wells Hydroelectric Rev. | | | | | | | | |
| Participating VRDN Series PT 3062, 2.57% (Liquidity Facility | | | | | | | | |
| Merrill Lynch & Co., Inc.) (c)(f)(g) | | | | 6,360 | | | | 6,360 |
See accompanying notes which are an integral part of the financial statements.
| Municipal Securities continued | | | | | | | | |
| | | | | Principal | | Value (Note 1) |
| | | Amount (000s) | | | | (000s) |
| Washington – continued | | | | | | | | |
| Energy Northwest Elec. Rev. Participating VRDN: | | | | | | | | |
| Series PT 1392, 2.53% (Liquidity Facility Merrill Lynch & Co., | | | | | | | | |
| Inc.) (c)(g) | | $ | | 5,280 | | $ | | 5,280 |
| Series PT 2960, 2.53% (Liquidity Facility Merrill Lynch & Co., | | | | | | | | |
| Inc.) (c)(g) | | | | 34,105 | | | | 34,105 |
| Series Putters 242, 2.53% (Liquidity Facility JPMorgan Chase | | | | | | | | |
| Bank) (c)(g) | | | | 2,100 | | | | 2,100 |
| Series Putters 256, 2.53% (Liquidity Facility JPMorgan Chase | | | | | | | | |
| Bank) (c)(g) | | | | 2,800 | | | | 2,800 |
| Series ROC II R152, 2.53% (Liquidity Facility Citibank | | | | | | | | |
| NA) (c)(g) | | | | 4,465 | | | | 4,465 |
| Everett Indl. Dev. Corp. Exempt Facilities Rev. 2.43%, | | | | | | | | |
| VRDN (c)(f) | | | | 3,200 | | | | 3,200 |
| Goat Hill Properties Lease Rev. Participating VRDN: | | | | | | | | |
| Series Putters 705, 2.53% (Liquidity Facility JPMorgan Chase | | | | | | | | |
| & Co.) (c)(g) | | | | 1,560 | | | | 1,560 |
| Series Putters 957, 2.53% (Liquidity Facility JPMorgan Chase | | | | | | | | |
| & Co.) (c)(g) | | | | 7,365 | | | | 7,365 |
| Grant County Pub. Util. District #2 Elec. Rev. Participating | | | | | | | | |
| VRDN Series PT 780, 2.53% (Liquidity Facility Lloyds TSB | | | | | | | | |
| Bank PLC) (c)(g) | | | | 7,000 | | | | 7,000 |
| Grant County Pub. Util. District #2 Wanapum Hydro Elec. Rev. | | | | | | | | |
| Participating VRDN Series MT 69, 2.57% (Liquidity Facility | | | | | | | | |
| Merrill Lynch & Co., Inc.) (c)(f)(g) | | | | 5,025 | | | | 5,025 |
| King County Hsg. Auth. Rev. (Overlake TOD Hsg. Proj.) | | | | | | | | |
| 2.55%, LOC Bank of America NA, VRDN (c)(f) | | | | 5,785 | | | | 5,785 |
| King County Rural Library District Participating VRDN: | | | | | | | | |
| Series PT 3053, 2.53% (Liquidity Facility Merrill Lynch & Co., | | | | | | | | |
| Inc.) (c)(g) | | | | 17,920 | | | | 17,920 |
| Series Putters 1009, 2.53% (Liquidity Facility JPMorgan | | | | | | | | |
| Chase Bank) (c)(g) | | | | 5,940 | | | | 5,940 |
| King County School District #401 Highline Pub. Schools | | | | | | | | |
| Participating VRDN Series ROC II R4561, 2.53% (Liquidity | | | | | | | | |
| Facility Citigroup Global Markets Hldgs., Inc.) (c)(g) | | | | 5,275 | | | | 5,275 |
| King County School District #408 Auburn Participating VRDN | | | | | | | | |
| Series PT 3090, 2.53% (Liquidity Facility Merrill Lynch & Co., | | | | | | | | |
| Inc.) (c)(g) | | | | 6,335 | | | | 6,335 |
| King County Swr. Rev. Participating VRDN: | | | | | | | | |
| Series Merlots 00 E, 2.4% (Liquidity Facility Wachovia Bank | | | | | | | | |
| NA) (c)(g) | | | | 6,300 | | | | 6,300 |
| Series PA 1179, 2.53% (Liquidity Facility Merrill Lynch & | | | | | | | | |
| Co., Inc.) (c)(g) | | | | 8,480 | | | | 8,480 |
| Series PT 796, 2.53% (Liquidity Facility Lloyds TSB Bank | | | | | | | | |
| PLC) (c)(g) | | | | 9,030 | | | | 9,030 |
| |
| See accompanying notes which are an integral part of the financial statements. | | | | |
| |
| 81 | | | | | | Annual Report |
| Investments continued | | | | | | | | |
| |
| |
| Municipal Securities continued | | | | | | | | |
| | | | | Principal | | Value (Note 1) |
| | | Amount (000s) | | | | (000s) |
| Washington – continued | | | | | | | | |
| Pierce County Econ. Dev. Corp. Rev. (Pacific LLC Proj.) 2.53%, | | | | | | | | |
| LOC Wells Fargo Bank NA, San Francisco, VRDN (c)(f) | | $ | | 2,990 | | $ | | 2,990 |
| Pierce County School District #403 Bethel Participating VRDN | | | | | | | | |
| Series PT 1647, 2.53% (Liquidity Facility Merrill Lynch & Co., | | | | | | | | |
| Inc.) (c)(g) | | | | 11,200 | | | | 11,200 |
| Port of Seattle Gen. Oblig.: | | | | | | | | |
| Participating VRDN Series Stars 128, 2.57% (Liquidity | | | | | | | | |
| Facility BNP Paribas SA) (c)(f)(g) | | | | 9,490 | | | | 9,490 |
| Series 2002 B2, 2.65% 9/1/05, LOC Bayerische | | | | | | | | |
| Landesbank Girozentrale, CP (f) | | | | 3,890 | | | | 3,890 |
| Port of Seattle Passenger Facilities Charge Rev. Participating | | | | | | | | |
| VRDN Series MT 110, 2.57% (Liquidity Facility BNP Paribas | | | | | | | | |
| SA) (c)(f)(g) | | | | 9,320 | | | | 9,320 |
| Port of Seattle Rev.: | | | | | | | | |
| Participating VRDN: | | | | | | | | |
| Series MS 1028, 2.52% (Liquidity Facility Morgan | | | | | | | | |
| Stanley) (c)(g) | | | | 2,845 | | | | 2,845 |
| Series PA 752, 2.57% (Liquidity Facility Merrill Lynch & | | | | | | | | |
| Co., Inc.) (c)(f)(g) | | | | 4,995 | | | | 4,995 |
| Series PT 3044, 2.53% (Liquidity Facility Merrill Lynch & | | | | | | | | |
| Co., Inc.) (c)(g) | | | | 13,460 | | | | 13,460 |
| Series PT 654, 2.57% (Liquidity Facility Merrill Lynch & | | | | | | | | |
| Co., Inc.) (c)(f)(g) | | | | 3,725 | | | | 3,725 |
| Series PT 728, 2.57% (Liquidity Facility BNP Paribas | | | | | | | | |
| SA) (c)(f)(g) | | | | 4,430 | | | | 4,430 |
| Series ROC II R362, 2.57% (Liquidity Facility Citibank | | | | | | | | |
| NA) (c)(f)(g) | | | | 9,675 | | | | 9,675 |
| Series ROC II R7015, 2.53% (Liquidity Facility Citibank | | | | | | | | |
| NA) (c)(g) | | | | 3,995 | | | | 3,995 |
| Series 1997, 2.53%, LOC Bank of New York, New York, | | | | | | | | |
| VRDN (c)(f) | | | | 101,830 | | | | 101,830 |
| Series 2001 A1, 2.7% 9/6/05, LOC Bank of America NA, | | | | | | | | |
| CP | | | | 9,330 | | | | 9,330 |
| Series 2001 B1, 2.58% 9/1/05, LOC Bank of America NA, | | | | | | | | |
| CP (f) | | | | 5,775 | | | | 5,775 |
| Port of Tacoma Rev. Series A, 2.75% 9/8/05, LOC WestLB | | | | | | | | |
| AG, CP | | | | 8,275 | | | | 8,275 |
| Port Tacoma Gen. Oblig. Participating VRDN Series PA 1185, | | | | | | | | |
| 2.53% (Liquidity Facility Merrill Lynch & Co., Inc.) (c)(g) | | | | 17,970 | | | | 17,970 |
| Seattle Drainage & Wastewtr. Rev. Participating VRDN: | | | | | | | | |
| Series PA 1175, 2.53% (Liquidity Facility Merrill Lynch & | | | | | | | | |
| Co., Inc.) (c)(g) | | | | 8,490 | | | | 8,490 |
| Series PT 2241, 2.53% (Liquidity Facility Merrill Lynch & Co., | | | | | | | | |
| Inc.) (c)(g) | | | | 6,610 | | | | 6,610 |
See accompanying notes which are an integral part of the financial statements.
Annual Report
| Municipal Securities continued | | | | | | | | |
| | | | | Principal | | Value (Note 1) |
| | | Amount (000s) | | | | (000s) |
| Washington – continued | | | | | | | | |
| Seattle Hsg. Auth. Rev. (NewHolly Phase III Proj.) 2.57%, LOC | | | | | | | | |
| Key Bank NA, VRDN (c)(f) | | $ | | 2,455 | | $ | | 2,455 |
| Seattle Muni. Lt. & Pwr. Rev.: | | | | | | | | |
| Bonds Series 1990, 2.35% tender 11/15/05, LOC | | | | | | | | |
| JPMorgan Chase Bank, CP mode | | | | 5,600 | | | | 5,600 |
| Participating VRDN: | | | | | | | | |
| Series Merlots 01 A56, 2.4% (Liquidity Facility Wachovia | | | | | | | | |
| Bank NA) (c)(g) | | | | 18,485 | | | | 18,485 |
| Series PT 2495, 2.53% (Liquidity Facility Merrill Lynch & | | | | | | | | |
| Co., Inc.) (c)(g) | | | | 8,280 | | | | 8,280 |
| Seattle Wtr. Sys. Rev. Participating VRDN Series SGA 90, | | | | | | | | |
| 2.41% (Liquidity Facility Societe Generale) (c)(g) | | | | 15,815 | | | | 15,815 |
| Tacoma Gen. Oblig. Series 2002 A, 2.6% 9/1/05, LOC Bank | | | | | | | | |
| of America NA, CP | | | | 7,900 | | | | 7,900 |
| U.S. Bancorp Piper Jaffray Fdg. Trust Participating VRDN | | | | | | | | |
| Series FRRI 02 B, 2.55% (Liquidity Facility Bank of New York, | | | | | | | | |
| New York) (c)(g) | | | | 2,727 | | | | 2,727 |
| Vancouver Hsg. Auth. Rev. (Anthem Park at Uptown Village | | | | | | | | |
| Proj.) 2.6%, LOC Bank of America NA, VRDN (c)(f) | | | | 1,500 | | | | 1,500 |
| Washington Econ. Dev. Fin. Auth. Rev. (Hunter Douglas Proj.) | | | | | | | | |
| Series 1997 A, 2.54%, LOC ABN AMRO Bank NV, | | | | | | | | |
| VRDN (c)(f) | | | | 3,500 | | | | 3,500 |
| Washington Econ. Dev. Fin. Auth. Solid Waste Disp. Rev. | | | | | | | | |
| (Waste Mgmt., Inc. Proj.) Series D, 2.55%, LOC JPMorgan | | | | | | | | |
| Chase Bank, VRDN (c)(f) | | | | 8,000 | | | | 8,000 |
| Washington Gen. Oblig. Participating VRDN: | | | | | | | | |
| Series EGL 00 4704, 2.53% (Liquidity Facility Citibank NA, | | | | | | | | |
| New York) (c)(g) | | | | 5,600 | | | | 5,600 |
| Series EGL 00 4705, 2.53% (Liquidity Facility Citibank NA, | | | | | | | | |
| New York) (c)(g) | | | | 16,300 | | | | 16,300 |
| Series EGL 7050032, 2.53% (Liquidity Facility Citibank | | | | | | | | |
| NA) (c)(g) | | | | 5,175 | | | | 5,175 |
| Series EGL 7050037, 2.53% (Liquidity Facility Citibank | | | | | | | | |
| NA) (c)(g) | | | | 6,000 | | | | 6,000 |
| Series EGL 7050067, 2.53% (Liquidity Facility Citibank | | | | | | | | |
| NA) (c)(g) | | | | 11,000 | | | | 11,000 |
| Series EGL 98 4702, 2.53% (Liquidity Facility Citibank NA, | | | | | | | | |
| New York) (c)(g) | | | | 12,200 | | | | 12,200 |
| Series Merlots B22, 2.4% (Liquidity Facility Wachovia Bank | | | | | | | | |
| NA) (c)(g) | | | | 3,790 | | | | 3,790 |
| Series MSTC 9048, 2.41% (Liquidity Facility Bear Stearns | | | | | | | | |
| Companies, Inc.) (c)(g) | | | | 9,990 | | | | 9,990 |
| Series Piper 05 B, 2.59% (Liquidity Facility Bank of New | | | | | | | | |
| York, New York) (c)(g) | | | | 8,745 | | | | 8,745 |
See accompanying notes which are an integral part of the financial statements.
Annual Report
| Investments continued | | | | | | | | | | |
| |
| |
| Municipal Securities continued | | | | | | | | |
| | | | | | | Principal | | Value (Note 1) |
| | | | | Amount (000s) | | | | (000s) |
| Washington – continued | | | | | | | | | | |
| Washington Gen. Oblig. Participating VRDN: – continued | | | | | | | | |
| Series PT 1856, 2.53% (Liquidity Facility Merrill Lynch & Co., | | | | | | | | |
| Inc.) (c)(g) | | | | $ | | 5,535 | | $ | | 5,535 |
| Series PT 2093, 2.53% (Liquidity Facility Merrill Lynch & Co., | | | | | | | | |
| Inc.) (c)(g) | | | | | | 2,865 | | | | 2,865 |
| Series Putters 514, 2.53% (Liquidity Facility PNC Bank NA, | | | | | | | | |
| Pittsburgh) (c)(g) | | | | | | 14,780 | | | | 14,780 |
| Series Putters 747, 2.53% (Liquidity Facility JPMorgan Chase | | | | | | | | |
| & Co.) (c)(g) | | | | | | 5,945 | | | | 5,945 |
| Series RF 05 1, 2.57% (Liquidity Facility Bank of New York, | | | | | | | | |
| New York) (c)(g) | | | | | | 10,710 | | | | 10,710 |
| Series SGA 35, 2.41% (Liquidity Facility Societe | | | | | | | | |
| Generale) (c)(g) | | | | | | 12,500 | | | | 12,500 |
| Series SGB 09, 2.53% (Liquidity Facility Societe | | | | | | | | |
| Generale) (c)(g) | | | | | | 9,100 | | | | 9,100 |
| Series SGB 11, 2.53% (Liquidity Facility Societe | | | | | | | | |
| Generale) (c)(g) | | | | | | 6,200 | | | | 6,200 |
| Washington Hsg. Fin. Commission Participating VRDN Series | | | | | | | | |
| LB 04 8, 2.53% (Liquidity Facility Lehman Brothers Hldgs., | | | | | | | | |
| Inc.) (c)(f)(g) | | | | | | 4,595 | | | | 4,595 |
| Washington Hsg. Fin. Commission Multi-family Hsg. Rev.: | | | | | | | | |
| (Fairwinds Redmond Proj.) Series A, 2.6%, LOC Bank of | | | | | | | | |
| America NA, VRDN (c)(f) | | | | | | 7,500 | | | | 7,500 |
| (Merrill Gardens at Queen Anne Proj.) Series A, 2.6%, LOC | | | | | | | | |
| Bank of America NA, VRDN (c)(f) | | | | | | 8,680 | | | | 8,680 |
| (Merrill Gardens at Renton Centre Proj.) Series A, 2.6%, | | | | | | | | |
| LOC Bank of America NA, VRDN (c)(f) | | | | 10,395 | | | | 10,395 |
| (Silver Creek Apts. Proj.) Series A, 2.57%, LOC Fannie Mae, | | | | | | | | |
| VRDN (c)(f) | | | | | | 4,100 | | | | 4,100 |
| (The Lodge at Eagle Ridge Proj.) Series A, 2.6%, LOC Bank | | | | | | | | |
| of America NA, VRDN (c)(f) | | | | | | 9,485 | | | | 9,485 |
| (The Vintage at Everett Sr. Living Proj.) Series 2004 A, | | | | | | | | |
| 2.57%, LOC Fannie Mae, VRDN (c)(f) | | | | | | 5,250 | | | | 5,250 |
| (The Vintage at Richland Sr. Living Proj.) Series 2004 A, | | | | | | | | |
| 2.57%, LOC Fannie Mae, VRDN (c)(f) | | | | | | 8,225 | | | | 8,225 |
| | | | | | | | | | | 708,012 |
| |
| West Virginia – 0.5% | | | | | | | | | | |
| Grant County Cmnty. Solid Waste Disp. Rev. Bonds (Virginia | | | | | | | | |
| Elec. & Pwr. Co. Proj.) Series 1996, 2.65% tender 9/7/05, | | | | | | | | |
| CP mode (f) | | | | | | 18,700 | | | | 18,700 |
| Grant County Poll. Cont. Rev. Bonds (Virginia Elec. & Pwr. Co. | | | | | | | | |
| Proj.) Series 1986, 2.75% tender 9/7/05, CP mode (f) | | | | 7,400 | | | | 7,400 |
| |
| See accompanying notes which are an integral part of the financial statements. | | | | |
| |
| Annual Report | | 84 | | | | | | | | |
| Municipal Securities continued | | | | | | | | |
| | | | | Principal | | Value (Note 1) |
| | | Amount (000s) | | | | (000s) |
| West Virginia – continued | | | | | | | | |
| Harrison County Commission Solid Waste Disp. Rev. (Waste | | | | | | | | |
| Mgmt., Inc. Proj.) Series A, 2.59%, LOC Wachovia Bank | | | | | | | | |
| NA, VRDN (c)(f) | | $ | | 8,420 | | $ | | 8,420 |
| Marion County Solid Waste Disp. Rev. (Grant Town | | | | | | | | |
| Cogeneration Proj.): | | | | | | | | |
| Series 1990 B, 2.44%, LOC Deutsche Bank AG, VRDN (c)(f) | | | | 5,555 | | | | 5,555 |
| Series 1990 D, 2.44%, LOC Deutsche Bank AG, VRDN (c)(f) | | | | 13,700 | | | | 13,700 |
| West Virginia Econ. Dev. Auth. Ind. Rev. (Smith Svc., Inc. Proj.) | | | | | | | | |
| Series 1999, 2.79%, LOC Huntington Nat’l. Bank, | | | | | | | | |
| Columbus, VRDN (c)(f) | | | | 4,470 | | | | 4,470 |
| West Virginia Pub. Energy Auth. Energy Rev. Bonds | | | | | | | | |
| (Morgantown Energy Assoc. Proj.): | | | | | | | | |
| 2.5% tender 9/9/05, LOC Dexia Cr. Local de France, CP | | | | | | | | |
| mode (f) | | | | 14,600 | | | | 14,600 |
| 2.75% tender 9/9/05, LOC Dexia Cr. Local de France, CP | | | | | | | | |
| mode (f) | | | | 1,200 | | | | 1,200 |
| Wood County Commission Solid Waste Disp. Rev. (Waste | | | | | | | | |
| Mgmt., Inc. Proj.) Series A, 2.59%, LOC Wachovia Bank | | | | | | | | |
| NA, VRDN (c)(f) | | | | 6,580 | | | | 6,580 |
| | | | | | | | | 80,625 |
| |
| Wisconsin – 1.5% | | | | | | | | |
| Northland Pines School District Participating VRDN Series PT | | | | | | | | |
| 2257, 2.53% (Liquidity Facility Merrill Lynch & Co., | | | | | | | | |
| Inc.) (c)(g) | | | | 10,630 | | | | 10,630 |
| Pewuakee School District Participating VRDN Series PT 3012, | | | | | | | | |
| 2.53% (Liquidity Facility Merrill Lynch & Co., Inc.) (c)(g) | | | | 6,755 | | | | 6,755 |
| Platteville Indl. Dev. Rev. (Woodward Communications Proj.) | | | | | | | | |
| 2.66%, LOC Harris NA, VRDN (c)(f) | | | | 2,400 | | | | 2,400 |
| Pleasant Prairie Gen. Oblig. 2.54% (XL Cap. Assurance, Inc. | | | | | | | | |
| Insured), VRDN (c) | | | | 10,000 | | | | 10,000 |
| Pleasant Prairie Village Indl. Dev. Rev. (Muskie Enterprises, Inc. | | | | | | | | |
| Proj.) Series 1995, 2.66%, LOC Harris NA, VRDN (c)(f) | | | | 3,000 | | | | 3,000 |
| Racine Indl. Dev. Rev. (Burlington Graphic Sys. Proj.) Series | | | | | | | | |
| 1994, 2.65%, LOC Harris NA, VRDN (c)(f) | | | | 1,040 | | | | 1,040 |
| Raymond Indl. Dev. Rev. (Richard S. Werner, Inc. Proj.) Series | | | | | | | | |
| 1996, 2.65%, LOC JPMorgan Chase Bank, VRDN (c)(f) | | | | 1,555 | | | | 1,555 |
| River Falls Indl. Dev. Rev. (Quadion Corp. Proj.) 2.59%, LOC | | | | | | | | |
| U.S. Bank NA, Minnesota, VRDN (c)(f) | | | | 1,540 | | | | 1,540 |
| Southeast Wisconsin Professional Baseball Park District Sales | | | | | | | | |
| Tax Rev. Participating VRDN Series Merlots 00 Y, 2.4% | | | | | | | | |
| (Liquidity Facility Wachovia Bank NA) (c)(g) | | | | 5,000 | | | | 5,000 |
| Sturgeon Bay Indl. Dev. Rev. (Marine Travelift Proj.) Series | | | | | | | | |
| 1996, 2.42%, LOC Wells Fargo Bank NA, San Francisco, | | | | | | | | |
| VRDN (c)(f) | | | | 1,980 | | | | 1,980 |
See accompanying notes which are an integral part of the financial statements.
85 Annual Report
| Investments continued | | | | | | | | |
| |
| |
| Municipal Securities continued | | | | | | | | |
| | | | | Principal | | Value (Note 1) |
| | | Amount (000s) | | | | (000s) |
| Wisconsin – continued | | | | | | | | |
| Sturtevant Indl. Dev. Rev. (Quadra, Inc. Proj.) 2.65%, LOC | | | | | | |
| JPMorgan Chase Bank, VRDN (c)(f) | | $ | | 1,275 | | $ | | 1,275 |
| Sun Prairie Indl. Rev. (Flambeau Corp. Proj.) Series 1995, | | | | | | |
| 2.42%, LOC Wells Fargo Bank NA, San Francisco, | | | | | | | | |
| VRDN (c)(f) | | | | 3,085 | | | | 3,085 |
| Univ. of Wisconsin Hosp. & Clinics Auth. Participating VRDN | | | | | | |
| Series Merlots 00 RR, 2.4% (Liquidity Facility Wachovia Bank | | | | | | |
| NA) (c)(g) | | | | 5,830 | | | | 5,830 |
| Wilmot Union High School District Participating VRDN Series | | | | | | |
| PT 2258, 2.53% (Liquidity Facility Merrill Lynch & Co., | | | | | | | | |
| Inc.) (c)(g) | | | | 9,640 | | | | 9,640 |
| Wisconsin Clean Wtr. Rev. Participating VRDN Series MS 645, | | | | | | |
| 2.52% (Liquidity Facility Morgan Stanley) (c)(g) | | | | 3,785 | | | | 3,785 |
| Wisconsin Gen. Oblig. Participating VRDN: | | | | | | | | |
| Series EGL 94 4904 Class A, 2.57% (Liquidity Facility | | | | | | | | |
| Citibank NA, New York) (c)(f)(g) | | | | 1,250 | | | | 1,250 |
| Series Putters 531, 2.53% (Liquidity Facility JPMorgan Chase | | | | | | |
| Bank) (c)(g) | | | | 8,485 | | | | 8,485 |
| Wisconsin Health & Edl. Facilities Auth. Rev. Participating | | | | | | |
| VRDN: | | | | | | | | |
| Series PA 970, 2.53% (Liquidity Facility Merrill Lynch & Co., | | | | | | |
| Inc.) (c)(g) | | | | 3,000 | | | | 3,000 |
| Series PT 761, 2.53% (Liquidity Facility Svenska | | | | | | | | |
| Handelsbanken AB) (c)(g) | | | | 20,000 | | | | 20,000 |
| Series PT 873, 2.53% (Liquidity Facility Merrill Lynch & Co., | | | | | | |
| Inc.) (c)(g) | | | | 10,765 | | | | 10,765 |
| Wisconsin Hsg. & Econ. Dev. Auth. Home Ownership Rev.: | | | | | | |
| Participating VRDN: | | | | | | | | |
| Series PT 445, 2.57% (Liquidity Facility Merrill Lynch & | | | | | | |
| Co., Inc.) (c)(f)(g) | | | | 3,525 | | | | 3,525 |
| Series ROC II R397, 2.57% (Liquidity Facility Citibank | | | | | | |
| NA) (c)(f)(g) | | | | 4,200 | | | | 4,200 |
| Series 2003 B, 2.41% (Liquidity Facility State Street Bank & | | | | | | |
| Trust Co., Boston), VRDN (c)(f) | | | | 30,400 | | | | 30,400 |
| Series 2004 E, 2.41% (Liquidity Facility Lloyds TSB Bank | | | | | | |
| PLC), VRDN (c)(f) | | | | 17,900 | | | | 17,900 |
| Series E, 2.41% (Liquidity Facility Fed. Home Ln. Bank - | | | | | | |
| Chicago), VRDN (c)(f) | | | | 10,890 | | | | 10,890 |
| Wisconsin Hsg. & Econ. Dev. Auth. Hsg. Rev.: | | | | | | | | |
| Series 2002 A, 2.41% (MBIA Insured), VRDN (c)(f) | | | | 7,235 | | | | 7,235 |
| Series 2002 B, 2.41% (MBIA Insured), VRDN (c)(f) | | | | 3,050 | | | | 3,050 |
| Wisconsin Hsg. & Econ. Dev. Auth. Single Family Rev. | | | | | | | | |
| Participating VRDN Series MT 106, 2.58% (Liquidity Facility | | | | | | |
| Lloyds TSB Bank PLC) (c)(f)(g) | | | | 12,525 | | | | 12,525 |
See accompanying notes which are an integral part of the financial statements.
| Municipal Securities continued | | | | | | | | | | |
| | | | | Principal | | | | Value (Note 1) |
| | | Amount (000s) | | | | | | (000s) |
| Wisconsin – continued | | | | | | | | | | |
| Wisconsin Trans. Rev.: | | | | | | | | | | |
| Participating VRDN Series ROC II R7000, 2.53% (Liquidity | | | | | | | | | | |
| Facility Citibank NA) (c)(g) | | $ | | 5,990 | | | | $ | | 5,990 |
| Series 1997 A, 2.6% 9/8/05, CP | | | | 42,175 | | | | | | 42,175 |
| | | | | | | | | | | 248,905 |
| |
| Wyoming – 0.1% | | | | | | | | | | |
| Wyoming Cmnty. Dev. Auth. Hsg. Rev. Participating VRDN: | | | | | | | | | | |
| Series PA 833R, 2.57% (Liquidity Facility Merrill Lynch & | | | | | | | | | | |
| Co., Inc.) (c)(f)(g) | | | | 6,370 | | | | | | 6,370 |
| Series PT 01 359, 2.57% (Liquidity Facility Merrill Lynch & | | | | | | | | | | |
| Co., Inc.) (c)(f)(g) | | | | 5,970 | | | | | | 5,970 |
| | | | | | | | | | | 12,340 |
| |
| Other – 8.1% | | | | | | | | | | |
| Fidelity Municipal Cash Central Fund, 2.49% (d)(e) | | | | 1,344,253 | | | | | | 1,344,253 |
| |
| TOTAL INVESTMENT PORTFOLIO 97.1% | | | | | | | | | | |
| (Cost $16,016,446) | | | | | | | | 16,016,446 |
| |
| |
| NET OTHER ASSETS – 2.9% | | | | | | | | | | 481,124 |
| NET ASSETS 100% | | | | | | $ | | 16,497,570 |
| Security Type Abbreviations |
| BAN | | — | | BOND ANTICIPATION NOTE |
| CP | | | | COMMERCIAL PAPER |
| RAN | | | | REVENUE ANTICIPATION |
| | | | | NOTE |
| TAN | | — | | TAX ANTICIPATION NOTE |
| TRAN | | | | TAX AND REVENUE |
| | | | | ANTICIPATION NOTE |
| VRDN | | — | | VARIABLE RATE DEMAND |
| | | | | NOTE |
Legend
(a) Security exempt from registration under Rule 144A of the Securities Act of 1933.
These securities may be resold in transactions exempt from registration, normally to qualified institutional buyers. At the period end, the value of these securities amounted to $15,000,000 or 0.1% of net assets.
(b) Security or a portion of the security purchased on a delayed delivery or when-issued basis.
(c) The coupon rate shown on floating or adjustable rate securities represents the rate at period end.
See accompanying notes which are an integral part of the financial statements.
Annual Report
Investments continued
(d) Information in this report regarding holdings by state and security types does not reflect the holdings of the Fidelity Municipal Cash Central Fund. (e) Affiliated fund that is available only to investment companies and other accounts managed by Fidelity Investments. The rate quoted is the annualized seven-day yield of the fund at period end. A complete listing of the fund’s holdings as of its most recent quarter end is available upon request. (f) Private activity obligations whose interest is subject to the federal alternative minimum tax for individuals. (g) Provides evidence of ownership in one or more underlying municipal bonds. (h) Restricted securities – Investment in securities not registered under the Securities Act of 1933 (excluding 144A issues). At the end of the period, the value of restricted securities (excluding 144A issues) amounted to $94,295,000 or 0.6% of net assets.
| Additional information on each holding is as follows: |
| | | | | | |
| |
| | | Acquisition | | | | |
| Security | | Date | | Cost (000s) |
| Allegheny County | | | | | | |
| Hosp. Dev. Auth. | | | | | | |
| Rev. Bonds Series | | | | | | |
| PT 762, 2.85%, | | | | | | |
| tender 6/15/06 | | | | | | |
| (Liquidity Facility | | | | | | |
| Landesbank | | | | | | |
| Hessen Thuringen) | | 6/17/05 | | $ | | 36,315 |
| Houston County | | | | | | |
| Health Care Auth. | | | | | | |
| Rev. Bonds Series | | | | | | |
| PT 879, 2.15%, | | | | | | |
| tender 11/10/05 | | | | | | |
| (Liquidity Facility | | | | | | |
| Merrill Lynch & | | | | | | |
| Co., Inc.) | | 11/6/03 | | $ | | 10,195 |
| | | Acquisition | | | | |
| Security | | Date | | Cost (000s) |
| Houston County | | | | | | |
| Health Care Auth. | | | | | | |
| Rev. Bonds Series | | | | | | |
| PT 880, 2.85%, | | | | | | |
| tender 6/22/06 | | | | | | |
| (Liquidity Facility | | | | | | |
| Merrill Lynch & | | | | | | |
| Co., Inc.) | | 6/21/05 | | $ | | 23,730 |
| Illinois Health | | | | | | |
| Facilities Auth. | | | | | | |
| Rev. Bonds Series | | | | | | |
| PT 977, 2.15%, | | | | | | |
| tender 11/10/05 | | | | | | |
| (Liquidity Facility | | | | | | |
| Svenska | | | | | | |
| Handelsbanken | | | | | | |
| AB) | | 6/3/04 | | $ | | 9,755 |
| Michigan Hosp. | | | | | | |
| Fin. Auth. Hosp. | | | | | | |
| Rev. Bonds Series | | | | | | |
| PT 732, 2.95%, | | | | | | |
| tender 7/20/06 | | | | | | |
| (Liquidity Facility | | | | | | |
| Svenska | | | | | | |
| Handelsbanken | | | | | | |
| AB) | | 1/30/03 | | $ | | 4,300 |
| New York | | | | | | |
| Transitional Fin. | | | | | | |
| Auth. Rev. Bonds | | | | | | |
| Series FRRI 01 | | | | | | |
| N11, 2.6%, | | | | | | |
| tender 9/14/05 | | | | | | |
| (Liquidity Facility | | | | | | |
| Bank of New | | | | | | |
| York, New York) | | 7/17/02 | | $ | | 10,000 |
See accompanying notes which are an integral part of the financial statements.
Annual Report
| Financial Statements | | | | | | | | |
| |
| |
| Statement of Assets and Liabilities | | | | | | | | |
| Amounts in thousands (except per share amount) | | | | | | | | August 31, 2005 |
| |
| Assets | | | | | | | | |
| Investment in securities, at value (cost $16,016,446) | | | | | | | | |
| See accompanying schedule | | | | | | $ | | 16,016,446 |
| Cash | | | | | | | | 589,320 |
| Receivable for investments sold | | | | | | | | |
| Regular delivery | | | | | | | | 31,113 |
| Delayed delivery | | | | | | | | 56,915 |
| Receivable for fund shares sold | | | | | | | | 197,703 |
| Interest receivable | | | | | | | | 70,322 |
| Prepaid expenses | | | | | | | | 17 |
| Other receivables | | | | | | | | 1,628 |
| Total assets | | | | | | | | 16,963,464 |
| |
| Liabilities | | | | | | | | |
| Payable for investments purchased | | | | | | | | |
| Regular delivery | | $ | | 42,250 | | | | |
| Delayed delivery | | | | 250,586 | | | | |
| Payable for fund shares redeemed | | | | 165,696 | | | | |
| Distributions payable | | | | 300 | | | | |
| Accrued management fee | | | | 3,752 | | | | |
| Other affiliated payables | | | | 2,219 | | | | |
| Other payables and accrued expenses | | | | 1,091 | | | | |
| Total liabilities | | | | | | | | 465,894 |
| |
| Net Assets | | | | | | $ | | 16,497,570 |
| Net Assets consist of: | | | | | | | | |
| Paid in capital | | | | | | $ | | 16,497,561 |
| Distributions in excess of net investment income | | | | | | | | (17) |
| Accumulated undistributed net realized gain (loss) on | | | | | | | | |
| investments | | | | | | | | 26 |
| Net Assets, for 16,495,274 shares outstanding | | | | | | $ | | 16,497,570 |
| Net Asset Value, offering price and redemption price per | | | | | | |
| share ($16,497,570 ÷ 16,495,274 shares) | | | | | | $ | | 1.00 |
See accompanying notes which are an integral part of the financial statements.
89 Annual Report
| Financial Statements continued | | | | | | |
| |
| |
| Statement of Operations | | | | | | |
| Amounts in thousands | | | | Year ended August 31, 2005 |
| |
| Investment Income | | | | | | |
| Interest | | | | $ | | 330,235 |
| |
| Expenses | | | | | | |
| Management fee | | $ | | 44,577 | | |
| Transfer agent fees | | | | 24,834 | | |
| Accounting fees and expenses | | | | 1,038 | | |
| Independent trustees’ compensation | | | | 82 | | |
| Custodian fees and expenses | | | | 225 | | |
| Registration fees | | | | 514 | | |
| Audit | | | | 122 | | |
| Legal | | | | 47 | | |
| Miscellaneous | | | | 1,012 | | |
| Total expenses before reductions | | | | 72,451 | | |
| Expense reductions | | | | (10,361) | | 62,090 |
| |
| Net investment income | | | | | | 268,145 |
| |
| Net realized gain (loss) on investment securities | | | | | | (168) |
| Net increase in net assets resulting from operations | | | | $ | | 267,977 |
See accompanying notes which are an integral part of the financial statements.
| Statement of Changes in Net Assets | | | | | | | | |
| | | | | Year ended | | | | Year ended |
| | | | | August 31, | | | | August 31, |
| Amounts in thousands | | | | 2005 | | | | 2004 |
| Increase (Decrease) in Net Assets | | | | | | | | |
| Operations | | | | | | | | |
| Net investment income | | $ | | 268,145 | | $ | | 98,359 |
| Net realized gain (loss) | | | | (168) | | | | 458 |
| Net increase in net assets resulting | | | | | | | | |
| from operations | | | | 267,977 | | | | 98,817 |
| Distributions to shareholders from net investment income . | | | | (268,091) | | | | (98,359) |
| Share transactions at net asset value of $1.00 per share | | | | | | | | |
| Proceeds from sales of shares | | | | 52,515,388 | | | | 44,181,849 |
| Reinvestment of distributions | | | | 265,207 | | | | 97,029 |
| Cost of shares redeemed | | | | (51,919,337) | | | | (42,599,950) |
| Net increase (decrease) in net assets and shares re- | | | | | | | | |
| sulting from share transactions | | | | 861,258 | | | | 1,678,928 |
| Total increase (decrease) in net assets | | | | 861,144 | | | | 1,679,386 |
| |
| Net Assets | | | | | | | | |
| Beginning of period | | | | 15,636,426 | | | | 13,957,040 |
| End of period (including distributions in excess of net | | | | | | | | |
| investment income of $17 and $0, respectively) | | $ | | 16,497,570 | | $ | | 15,636,426 |
See accompanying notes which are an integral part of the financial statements.
91 Annual Report
| Financial Highlights | | | | | | | | | | | | |
| |
| Years ended August 31, | | 2005 | | 2004 | | 2003 | | 2002 | | | | 2001 |
| Selected Per Share Data | | | | | | | | | | | | |
| Net asset value, beginning of | | | | | | | | | | | | |
| period | | $ 1.00 | | $ 1.00 | | $ 1.00 | | $ 1.00 | | $ | | 1.00 |
| Income from Investment | | | | | | | | | | | | |
| Operations | | | | | | | | | | | | |
| Net investment income | | 016 | | .007 | | .009 | | .014 | | | | .032 |
| Distributions from net investment | | | | | | | | | | | | |
| income | | (.016) | | (.007) | | (.009) | | (.014) | | | | (.032) |
| Net asset value, end of period | | $ 1.00 | | $ 1.00 | | $ 1.00 | | $ 1.00 | | $ | | 1.00 |
| Total ReturnA | | 1.66% | | .67% | | .88% | | 1.38% | | | | 3.29% |
| Ratios to Average Net AssetsB | | | | | | | | | | | | |
| Expenses before expense | | | | | | | | | | | | |
| reductions | | 45% | | .44% | | .44% | | .43% | | | | .45% |
| Expenses net of voluntary | | | | | | | | | | | | |
| waivers, if any | | 45% | | .44% | | .44% | | .43% | | | | .45% |
| Expenses net of all reductions | | 38% | | .43% | | .42% | | .39% | | | | .42% |
| Net investment income | | 1.65% | | .67% | | .87% | | 1.35% | | | | 3.21% |
| Supplemental Data | | | | | | | | | | | | |
| Net assets, end of period | | | | | | | | | | | | |
| (in millions) | | $16,498 | | $15,636 | | $13,957 | | $11,728 | | $ | | 9,843 |
A Total returns would have been lower had certain expenses not been reduced during the periods shown.
B Expense ratios reflect operating expenses of the fund. Expenses before reductions do not reflect amounts reimbursed by the investment adviser or reductions from brokerage service arrangements or other expense offset arrangements and do not represent the amount paid by the fund during periods when reimbursements or reductions occur. Expenses net of any voluntary waivers reflect expenses after reimbursement by the investment adviser but prior to reductions from brokerage service arrangements or other expense offset arrangements. Expenses net of all reductions repre sent the net expenses paid by the fund.
See accompanying notes which are an integral part of the financial statements.
Notes to Financial Statements
For the period ended August 31, 2005
(Amounts in thousands except ratios)
|
1. Significant Accounting Policies.
Fidelity Municipal Money Market Fund (the fund) is a fund of Fidelity Union Street Trust II (the trust) and is authorized to issue an unlimited number of shares. The trust is registered under the Investment Company Act of 1940, as amended (the 1940 Act), as an open end management investment company organized as a Delaware statutory trust. The financial statements have been prepared in conformity with accounting principles generally accepted in the United States of America, which require management to make certain estimates and assumptions at the date of the financial statements. The following summarizes the significant accounting policies of the fund:
Security Valuation. Net asset value per share is calculated as of the close of business of the New York Stock Exchange, normally 4:00 p.m. Eastern time. As permitted under Rule
2a 7 of the 1940 Act, and certain conditions therein, securities are valued initially at cost and thereafter assume a constant amortization to maturity of any discount or premium. Investments in open end investment companies are valued at their net asset value each business day.
Investment Transactions and Income. Security transactions are accounted for as of trade date. Gains and losses on securities sold are determined on the basis of identified cost. Interest income is accrued as earned. Interest income includes coupon interest and amortization of premium and accretion of discount on debt securities.
Expenses. Most expenses of the trust can be directly attributed to a fund. Expenses which cannot be directly attributed are apportioned among each fund in the trust.
Income Tax Information and Distributions to Shareholders. Each year, the fund intends to qualify as a regulated investment company by distributing all of its taxable income and realized gains under Subchapter M of the Internal Revenue Code. As a result, no provision for income taxes is required in the accompanying financial statements.
Dividends are declared daily and paid monthly from net investment income. Distribu tions from realized gains, if any, are recorded on the ex dividend date. Income and capital gain distributions are determined in accordance with income tax regulations, which may differ from generally accepted accounting principles. In addition, the fund will claim a portion of the payment made to redeeming shareholders as a distribution for income tax purposes.
Capital accounts within the financial statements are adjusted for permanent book tax differences. These adjustments have no impact on net assets or the results of operations. Temporary book tax differences will reverse in a subsequent period.
Book tax differences are primarily due to short term capital gains, deferred trustees compensation, and losses deferred due to excise tax regulations.
93 Annual Report
Notes to Financial Statements continued
(Amounts in thousands except ratios)
1. Significant Accounting Policies continued
Income Tax Information and Distributions to Shareholders continued
|
The fund purchases municipal securities whose interest, in the opinion of the issuer, is free from federal income tax. There is no assurance that the Internal Revenue Service
(IRS) will agree with this opinion. In the event the IRS determines that the issuer does not comply with relevant tax requirements, interest payments from a security could become federally taxable, possibly retroactively to the date the security was issued.
The tax basis components of distributable earnings and the federal tax cost as of period end were as follows:
| Unrealized appreciation | | $ | | — | | | | |
| Unrealized depreciation | | | | — | | | | |
| Net unrealized appreciation (depreciation) | | | | — | | | | |
| Undistributed ordinary income | | | | 209 | | | | |
| |
| Cost for federal income tax purposes | | $ | | 16,016,446 | | | | |
| The tax character of distributions paid was as follows: | | | | |
| |
| | | | | August 31, | | | | August 31, |
| | | | | 2005 | | | | 2004 |
| Tax exempt Income | | $ | | 268,091 | | $ | | 98,359 |
| Long term Capital Gains | | | | — | | | �� | — |
| Total | | $ | | 268,091 | | $ | | 98,359 |
| |
| 2. Operating Policies. | | | | | | | | |
Delayed Delivery Transactions and When Issued Securities. The fund may purchase or sell securities on a delayed delivery or when issued basis. Payment and delivery may take place after the customary settlement period for that security. The price of the underlying securities and the date when the securities will be delivered and paid for are fixed at the time the transaction is negotiated. During the time a delayed delivery sell is outstanding, the contract is marked to market daily and equivalent deliverable securities are held for the transaction. The value of the securities purchased on a delayed delivery or when issued basis are identified as such in the fund’s Schedule of Investments. The fund may receive compensation for interest forgone in the purchase of a delayed delivery or when issued security. With respect to purchase commitments, the fund identifies securities as segregated in its records with a value at least equal to the amount of the commitment. Losses may arise due to changes in the value of the underly ing securities or if the counterparty does not perform under the contract’s terms, or if the issuer does not issue the securities due to political, economic, or other factors.
2. Operating Policies continued
Restricted Securities. The fund may invest in securities that are subject to legal or contractual restrictions on resale. These securities generally may be resold in transac tions exempt from registration or to the public if the securities are registered. Disposal of these securities may involve time consuming negotiations and expense, and prompt sale at an acceptable price may be difficult. Information regarding restricted securities is included at the end of the fund’s Schedule of Investments.
3. Fees and Other Transactions with Affiliates.
Management Fee. Fidelity Management & Research Company (FMR) and its affiliates provide the fund with investment management related services for which the fund pays a monthly management fee. The management fee is the sum of an individual fund fee rate that is based on an annual rate of .15% of the fund’s average net assets and a group fee rate that averaged .12% during the period. The group fee rate is based upon the average net assets of all the mutual funds advised by FMR. The group fee rate decreases as assets under management increase and increases as assets under management decrease. For the period, the total annual management fee rate was .27% of the fund’s average net assets.
Transfer Agent and Accounting Fees. Citibank, N.A. (Citibank) is the custodian, transfer agent and shareholder servicing agent for the fund. Citibank has entered into a sub arrangement with Fidelity Service Company, Inc. (FSC), an affiliate of FMR, under which FSC performs the activities associated with the fund’s transfer and shareholder servicing agent and accounting functions. The fund pays account fees and asset based fees that vary according to account size and type of account. FSC pays for typesetting, printing and mailing of shareholder reports, except proxy statements. The accounting fee is based on the level of average net assets for the month. For the period, the transfer agent fees were equivalent to an annual rate of .15% of average net assets.
Affiliated Central Funds. The fund may invest in Money Market Central Funds which seek preservation of capital and current income and are managed by Fidelity Invest ments Money Management, Inc. (FIMM), an affiliate of FMR.
The Central Funds do not pay a management fee. Income distributions earned by the fund are recorded as income in the accompanying financial statements and totaled $34,722 for the period.
95 Annual Report
Notes to Financial Statements continued
(Amounts in thousands except ratios)
4. Expense Reductions.
|
Through arrangements with the fund’s custodian and transfer agent, credits realized as a result of uninvested cash balances were used to reduce the fund’s expenses. During the period, these credits reduced the fund’s custody and transfer agent expenses by $225 and $10,136, respectively.
The fund’s organizational documents provide former and current trustees and officers with a limited indemnification against liabilities arising in connection with the perfor mance of their duties to the fund. In the normal course of business, the fund may also enter into contracts that provide general indemnifications. The fund’s maximum expo sure under these arrangements is unknown as this would be dependent on future claims that may be made against the fund. The risk of material loss from such claims is consid ered remote.
Report of Independent Registered Public Accounting Firm
To the Trustees of Fidelity Union Street Trust II and the Shareholders of Fidelity Municipal Money Market Fund:
In our opinion, the accompanying statement of assets and liabilities, including the sched ule of investments, and the related statements of operations and of changes in net assets and the financial highlights present fairly, in all material respects, the financial position of Fidelity Municipal Money Market Fund (a fund of Fidelity Union Street Trust II) at August 31, 2005 and the results of its operations, the changes in its net assets and the financial highlights for the periods indicated, in conformity with accounting principles generally accepted in the United States of America. These financial statements and financial highlights (hereafter referred to as “financial statements”) are the responsibility of the Fidelity Municipal Money Market Fund’s management; our responsibility is to express an opinion on these financial statements based on our audits. We conducted our audits of these financial statements in accordance with the standards of the Public Company Accounting Oversight Board (United States). Those standards require that we plan and perform the audit to obtain reasonable assurance about whether the financial statements are free of material misstatement. An audit includes examining, on a test basis, evidence supporting the amounts and disclosures in the financial statements, assessing the accounting principles used and significant estimates made by management, and evaluating the overall financial statement presentation. We believe that our audits, which included confirmation of securities at August 31, 2005 by correspondence with the custo dian and brokers, provide a reasonable basis for our opinion.
/s/ PricewaterhouseCoopers LLP PricewaterhouseCoopers LLP
Boston, Massachusetts
October 10, 2005
|
97 Annual Report
Trustees and Officers
The Trustees, Members of the Advisory Board, and executive officers of the trust and fund, as applicable, are listed below. The Board of Trustees governs the fund and is responsible for protecting the interests of shareholders. The Trustees are experienced executives who meet periodically throughout the year to oversee the fund’s activities, review contractual arrangements with companies that provide services to the fund, and review the fund’s performance. Except for William O. McCoy, Stephen P. Jonas, and Kenneth L. Wolfe, each of the Trustees oversees 321 funds advised by FMR or an affiliate. Mr. McCoy oversees 323 funds advised by FMR or an affiliate. Mr. Jonas and Mr. Wolfe oversee 312 funds advised by FMR or an affiliate.
The Trustees hold office without limit in time except that (a) any Trustee may resign; (b) any Trustee may be removed by written instrument, signed by at least two thirds of the number of Trustees prior to such removal; (c) any Trustee who requests to be retired or who has become incapacitated by illness or injury may be retired by written instru ment signed by a majority of the other Trustees; and (d) any Trustee may be removed at any special meeting of shareholders by a two thirds vote of the outstanding voting securities of the trust. Each Trustee who is not an interested person (as defined in the 1940 Act) (Independent Trustee), shall retire not later than the last day of the calendar year in which his or her 72nd birthday occurs. The Independent Trustees may waive this mandatory retirement age policy with respect to individual Trustees. The executive officers and Advisory Board Members hold office without limit in time, except that any officer and Advisory Board Member may resign or may be removed by a vote of a majority of the Trustees at any regular meeting or any special meeting of the Trustees. Except as indicated, each individual has held the office shown or other offices in the same company for the past five years.
The fund’s Statement of Additional Information (SAI) includes more information about the Trustees. To request a free copy, call Fidelity at 1-800-544-8544.
Correspondence intended for each Trustee who is an interested person may be sent to Fidelity Investments, 82 Devonshire Street, Boston, Massachusetts 02109.
| | Name, Age; Principal Occupation
Edward C. Johnson 3d (75)**
|
Year of Election or Appointment: 1991
Mr. Johnson is Chairman of the Board of Trustees. Mr. Johnson serves as Chief Executive Officer, Chairman, and a Director of FMR Corp.; a Director and Chairman of the Board and of the Executive Committee of FMR; Chairman and a Director of Fidelity Management & Research (Far East) Inc.; Chairman and a Director of Fidelity Investments Money Management, Inc.; and Chairman (2001 present) and a Director (2000 present) of FMR Co., Inc.
| | Name, Age; Principal Occupation
Abigail P. Johnson (43)**
|
Year of Election or Appointment: 2001
Ms. Johnson serves as President of Fidelity Employer Services Company (FESCO) (2005 present). She is President and a Director of Fidelity Investments Money Management, Inc. (2001 present), FMR Co., Inc. (2001 present), and a Director of FMR Corp. Previously, Ms. Johnson served as President and a Director of FMR (2001 2005), Senior Vice President of the Fidelity funds (2001 2005), and managed a number of Fidelity funds.
Year of Election or Appointment: 2005
Mr. Jonas is Senior Vice President of Municipal Money Market (2005 present). He also serves as Senior Vice President of other Fidelity funds (2005 present). Mr. Jonas is Executive Director of FMR (2005 present). Previously, Mr. Jonas served as President of Fidelity Enterprise Operations and Risk Services (2004 2005), Chief Adminis trative Officer (2002 2004), and Chief Financial Officer of FMR Co. (1998 2000). Mr. Jonas has been with Fidelity Investments since 1987 and has held various financial and management positions including Chief Financial Officer of FMR. In addition, he serves on the Boards of Boston Ballet (2003 present) and Simmons College (2003 present).
Year of Election or Appointment: 2003
Mr. Reynolds is a Director (2003 present) and Chief Operating Officer (2002 present) of FMR Corp. He also serves on the Board at Fidelity Investments Canada, Ltd. (2000 present). Previously, Mr. Reynolds served as President of Fidelity Investments Institutional Retirement Group (1996 2000).
* Trustees have been determined to be “Interested Trustees” by virtue of, among other things, their affiliation with the trust or various entities under common control with FMR.
** Edward C. Johnson 3d, Trustee, is Abigail P. Johnson’s father.
99 Annual Report
Trustees and Officers - continued
Independent Trustees:
Correspondence intended for each Independent Trustee (that is, the Trustees other than the Interested Trustees) may be sent to Fidelity Investments, P.O. Box 55235, Boston, Massachusetts 02205 5235.
| | Name, Age; Principal Occupation
Dennis J. Dirks (57)
|
Year of Election or Appointment: 2005
Prior to his retirement in May 2003, Mr. Dirks was Chief Operating Officer and a member of the Board of The Depository Trust & Clearing Corporation (DTCC) (1999 2003). He also served as President, Chief Operating Officer, and Board member of The Depository Trust Company (DTC) (1999 2003) and President and Board member of the National Securities Clearing Corporation (NSCC) (1999 2003). In addition, Mr. Dirks served as Chief Executive Officer and Board member of the Government Securities Clearing Corporation (2001 2003) and Chief Executive Officer and Board member of the Mortgage Backed Securities Clearing Corporation (2001 2003). Mr. Dirks also serves as a Trustee of Manhattan College (2005 present).
Year of Election or Appointment: 1997
Dr. Gates is Vice Chairman of the Independent Trustees (2005 present). Dr. Gates is President of Texas A&M University (2002 present). He was Director of the Central Intelligence Agency (CIA) from 1991 to 1993. From 1989 to 1991, Dr. Gates served as Assistant to the President of the United States and Deputy National Security Advisor. Dr. Gates is a Director of NACCO Industries, Inc. (mining and manufacturing), Parker Drilling Co., Inc. (drilling and rental tools for the energy industry, 2001 present), and Brinker International (restaurant management, 2003 present). Previously, Dr. Gates served as a Director of LucasVarity PLC (automotive components and diesel engines), a Director of TRW Inc. (automotive, space, defense, and information technology), and Dean of the George Bush School of Government and Public Service at Texas A&M University (1999 2001). Dr. Gates also is a Trustee of the Forum for International Policy.
Name, Age; Principal Occupation
George H. Heilmeier (69)
|
Year of Election or Appointment: 2004
Dr. Heilmeier is Chairman Emeritus of Telcordia Technologies (commu nication software and systems), where prior to his retirement, he served as company Chairman and Chief Executive Officer. He currently serves on the Boards of Directors of The Mitre Corporation (systems engineer ing and information technology support for the government), and HRL Laboratories (private research and development, 2004 present). He is Chairman of the General Motors Science & Technology Advisory Board and a Life Fellow of the Institute of Electrical and Electronics Engineers (IEEE) (2000 present). Dr. Heilmeier is a member of the Defense Science Board and the National Security Agency Advisory Board. He is also a member of the National Academy of Engineering, the American Acad emy of Arts and Sciences, and the Board of Overseers of the School of Engineering and Applied Science of the University of Pennsylvania. Pre viously, Dr. Heilmeier served as a Director of TRW Inc. (automotive, space, defense, and information technology, 1992 2002), Compaq (1994 2002), Automatic Data Processing, Inc. (ADP) (technology based business outsourcing, 1995 2002), INET Technologies Inc. (telecommu nications network surveillance, 2001 2004), and Teletech Holdings (cus tomer management services). He is the recipient of the 2005 Kyoto Prize in Advanced Technology for his invention of the liquid display.
Year of Election or Appointment: 2001
Prior to Ms. Knowles’ retirement in June 2000, she served as Executive Vice President and Chief Financial Officer of Atlantic Richfield Company (ARCO) (diversified energy, 1996 2000). From 1993 to 1996, she was a Senior Vice President of ARCO and President of ARCO Transportation Company. She served as a Director of ARCO from 1996 to 1998. She currently serves as a Director of Phelps Dodge Corporation (copper mining and manufacturing) and McKesson Corporation (healthcare ser vice, 2002 present). Ms. Knowles is a Trustee of the Brookings Institution and the Catalina Island Conservancy and also serves as a member of the Advisory Board for the School of Engineering of the University of Southern California.
101 Annual Report
Trustees and Officers - continued
| | Name, Age; Principal Occupation
Ned C. Lautenbach (61)
|
Year of Election or Appointment: 2000
Mr. Lautenbach has been a partner of Clayton, Dubilier & Rice, Inc. (private equity investment firm) since September 1998. Previously, Mr. Lautenbach was with the International Business Machines Corpora tion (IBM) from 1968 until his retirement in 1998. Mr. Lautenbach serves as a Director of Italtel Holding S.p.A. (telecommunications (Milan, Italy), 2004 present) and Eaton Corporation (diversified industrial) as well as the Philharmonic Center for the Arts in Naples, Florida. He also is a member of the Board of Trustees of Fairfield University (2005 present), as well as a member of the Council on Foreign Relations.
Year of Election or Appointment: 1993
Mr. Mann is Chairman of the Independent Trustees (2001 present). He is Chairman Emeritus of Lexmark International, Inc. (computer peripherals), where he served as CEO until April 1998, retired as Chairman May 1999, and remains a member of the Board. Prior to 1991, he held the positions of Vice President of International Business Machines Corpora tion (IBM) and President and General Manager of various IBM divisions and subsidiaries. He is a member of the Executive Committee of the Independent Director’s Council of the Investment Company Institute. In addition, Mr. Mann is a member of the President’s Cabinet at the Uni versity of Alabama and the Board of Visitors of the Culverhouse College of Commerce and Business Administration at the University of Alabama.
Year of Election or Appointment: 1997
Prior to his retirement in December 1994, Mr. McCoy was Vice Chair man of the Board of BellSouth Corporation (telecommunications) and President of BellSouth Enterprises. He is currently a Director of Liberty Corporation (holding company), Duke Realty Corporation (real estate), and Progress Energy, Inc. (electric utility). He is also a partner of Frank lin Street Partners (private investment management firm) and a member of the Research Triangle Foundation Board. In addition, Mr. McCoy served as the Interim Chancellor (1999 2000) and a member of the Board of Visitors for the University of North Carolina at Chapel Hill and currently serves on the Board of Directors of the University of North Carolina Health Care System and the Board of Visitors of the Kenan Flagler Business School (University of North Carolina at Chapel Hill). He also served as Vice President of Finance for the University of North Carolina (16 school system).
Name, Age; Principal Occupation
Cornelia M. Small (61)
|
Year of Election or Appointment: 2005
Ms. Small is a member (2000 present) and Chairperson (2002 present) of the Investment Committee, and a member (2002 present) of the Board of Trustees of Smith College. Previously, she served as Chief Investment Officer (1999 2000), Director of Global Equity Investments (1996 1999), and a member of the Board of Directors of Scudder, Stevens & Clark (1990 1997) and Scudder Kemper Investments (1997 1998). In addition, Ms. Small served as Co Chair (2000 2003) of the Annual Fund for the Fletcher School of Law and Diplomacy.
William S. Stavropoulos (66)
|
Year of Election or Appointment: 2002
Mr. Stavropoulos is Chairman of the Board (2000 present) and a Member of the Board of Directors of The Dow Chemical Company. Since joining The Dow Chemical Company in 1967, Mr. Stavropoulos served in numerous senior management positions, including President (1993 2000; 2002 2003), CEO (1995 2000; 2002 2004), and Chair man of the Executive Committee (2000 2004). Currently, he is a Direc tor of NCR Corporation (data warehousing and technology solutions), BellSouth Corporation (telecommunications), Chemical Financial Corpo ration, Maersk Inc. (industrial conglomerate, 2002 present), and Metal mark Capital (private equity investment firm, 2005 present). He also serves as a member of the Board of Trustees of the American Enterprise Institute for Public Policy Research. In addition, Mr. Stavropoulos is a member of The Business Council, J.P. Morgan International Council and the University of Notre Dame Advisory Council for the College of Science.
Year of Election or Appointment: 2005
Mr. Wolfe also serves as a Trustee (2005 present) or Member of the Advisory Board (2004 present) of other investment companies advised by FMR. Prior to his retirement in 2001, Mr. Wolfe was Chairman and Chief Executive Officer of Hershey Foods Corporation (1993 2001). He currently serves as a member of the boards of Adelphia Communica tions Corporation (2003 present), Bausch & Lomb, Inc., and Revlon Inc. (2004 present).
103 Annual Report
Trustees and Officers - continued
Advisory Board Members and Executive Officers:
Correspondence intended for Mr. Gamper may be sent to Fidelity Investments, P.O. Box 55235, Boston, Massachusetts 02205-5235. Correspondence intended for each executive officer and Mr. Lynch may be sent to Fidelity Investments, 82 Devonshire Street, Boston, Massachusetts 02109.
| | Name, Age; Principal Occupation
Albert R. Gamper, Jr. (63)
|
Year of Election or Appointment: 2005
Member of the Advisory Board of Fidelity Union Street Trust II. Prior to his retirement in December 2004, Mr. Gamper served as Chairman of the Board of CIT Group Inc. (commercial finance). During his tenure with CIT Group Inc. Mr. Gamper served in numerous senior management positions, including Chairman (1987 1989; 1999 2001; 2002 2004), Chief Executive Officer (1987 2004), and President (1989 2002). He currently serves as a member of the Board of Directors of Public Service Enterprise Group (utilities, 2001 present), Chairman of the Board of Governors, Rutgers University (2004 present), and Chairman of the Board of Saint Barnabas Health Care System.
Year of Election or Appointment: 2003
Member of the Advisory Board of Fidelity Union Street Trust II. Vice Chairman and a Director of FMR, and Vice Chairman (2001 present) and a Director (2000 present) of FMR Co., Inc. Previously, Mr. Lynch served as a Trustee of the Fidelity funds (1990 2003). In addition, he serves as a Trustee of Boston College, Massachusetts Eye & Ear Infirmary, Historic Deerfield, John F. Kennedy Library, and the Museum of Fine Arts of Boston.
Year of Election or Appointment: 2005
Vice President of Municipal Money Market. Mr. Donovan also serves as Vice President of Fidelity’s High Income Funds (2005 present), Fidelity’s Fixed Income Funds (2005 present), certain Asset Allocation Funds (2005 present), and certain Balanced Funds (2005 present). Mr. Donovan also serves as Executive Vice President of FMR (2005 present) and FMRC (2005 present). Previously, Mr. Donovan served as Vice President and Director of Fidelity’s International Equity Trading group (1998 2005).
Name, Age; Principal Occupation
Charles S. Morrison (44)
|
Year of Election or Appointment: 2005
Vice President of Municipal Money Market. Mr. Morrison also serves as Vice President of Fidelity’s Money Market Funds (2005 present) and certain Asset Allocation Funds (2002 present). Previously, he served as Vice President of Fidelity’s Bond Funds (2002 2005) and certain Balanced Funds (2002 2005). He served as Vice President (2002 2005) and Bond Group Leader (2002 2005) of Fidelity Investments Fixed Income Division. Mr. Morrison is also Vice President of FIMM (2002 present) and FMR (2002 present). Mr. Morrison joined Fidelity Investments in 1987 as a Corporate Bond Analyst in the Fixed Income Research Division.
Year of Election or Appointment: 2002
Vice President of Municipal Money Market. Mr. Murphy also serves as Vice President of Fidelity’s Money Market Funds (2002 present), certain Asset Allocation Funds (2003 present), Fidelity’s Investment Grade Bond Funds (2005 present), and Fidelity’s Balanced Funds (2005 present). He serves as Senior Vice President (2000 present) and Head (2004 present) of the Fidelity Investments Fixed Income Division. Mr. Murphy is also a Senior Vice President of FIMM (2003 present) and a Vice President of FMR (2000 present). Previously, Mr. Murphy served as Money Market Group Leader (2002 2004), Bond Group Leader (2000 2002), and Vice President of Fidelity’s Taxable Bond Funds (2000 2002) and Fidelity’s Municipal Bond Funds (2001 2002). Mr. Murphy joined Fidelity Investments in 1989 as a portfolio manager in the Bond Group.
Year of Election or Appointment: 2001
Vice President of Municipal Money Market. Mr. Lind also serves as Vice President of other funds advised by FMR. Prior to assuming his current responsibilities, Mr. Lind managed a variety of Fidelity funds.
Year of Election or Appointment: 1998
Secretary of Municipal Money Market. He also serves as Secretary of other Fidelity funds; Vice President, General Counsel, and Secretary of FMR Co., Inc. (2001 present) and FMR; Assistant Secretary of Fidelity Management & Research (U.K.) Inc. (2001 present), Fidelity Manage ment & Research (Far East) Inc. (2001 present), and Fidelity Investments Money Management, Inc. (2001 present). Mr. Roiter is an Adjunct Member, Faculty of Law, at Boston College Law School (2003 present). Previously, Mr. Roiter served as Vice President and Secretary of Fidelity Distributors Corporation (FDC) (1998 2005).
105 Annual Report
Trustees and Officers - continued
| | Name, Age; Principal Occupation
|
Year of Election or Appointment: 2003
Assistant Secretary of Municipal Money Market. Mr. Fross also serves as Assistant Secretary of other Fidelity funds (2003 present), Vice President and Secretary of FDC (2005 present), and is an employee of FMR.
Year of Election or Appointment: 2004
President, Treasurer, and Anti Money Laundering (AML) officer of Municipal Money Market. Ms. Reynolds also serves as President, Treasurer, and AML officer of other Fidelity funds (2004) and is a Vice President (2003) and an employee (2002) of FMR. Before joining Fidelity Investments, Ms. Reynolds worked at PricewaterhouseCoopers LLP (PwC) (1980 2002), where she was most recently an audit partner with PwC’s investment management practice.
Year of Election or Appointment: 2002
Chief Financial Officer of Municipal Money Market. Mr. Hayes also serves as Chief Financial Officer of other Fidelity funds (2002 present) and President of Fidelity Investment Operations (2005 present) which includes Fidelity Pricing and Cash Management Services Group (FPCMS), where he served as President (1998 2005). Mr. Hayes serves as Presi dent of Fidelity Service Company (2003 present) where he also serves as a Director. Mr. Hayes also served as President of Fidelity Investments Operations Group (FIOG, 2002 2005).
| | Kenneth A. Rathgeber (58)
|
Year of Election or Appointment: 2004
Chief Compliance Officer of Municipal Money Market. Mr. Rathgeber also serves as Chief Compliance Officer of other Fidelity funds (2004) and Executive Vice President of Risk Oversight for Fidelity Investments (2002). Previously, he served as Executive Vice President and Chief Operating Officer for Fidelity Investments Institutional Services Company, Inc. (1998 2002).
Year of Election or Appointment: 2003
Deputy Treasurer of Municipal Money Market. Mr. Hebble also serves as Deputy Treasurer of other Fidelity funds (2003), and is an employee of FMR. Before joining Fidelity Investments, Mr. Hebble worked at Deutsche Asset Management where he served as Director of Fund Accounting (2002 2003) and Assistant Treasurer of the Scudder Funds (1998 2003).
Name, Age; Principal Occupation
Bryan A. Mehrmann (44)
|
Year of Election or Appointment: 2005
Deputy Treasurer of Municipal Money Market. Mr. Mehrmann also serves as Deputy Treasurer of other Fidelity funds (2005 present) and is an employee of FMR. Previously, Mr. Mehrmann served as Vice Presi dent of Fidelity Investments Institutional Services Group (FIIS)/Fidelity Investments Institutional Operations Corporation, Inc. (FIIOC) Client Services (1998 2004).
Kimberley H. Monasterio (41)
|
Year of Election or Appointment: 2004
Deputy Treasurer of Municipal Money Market. Ms. Monasterio also serves as Deputy Treasurer of other Fidelity funds (2004) and is an employee of FMR (2004). Before joining Fidelity Investments, Ms. Monasterio served as Treasurer (2000 2004) and Chief Financial Officer (2002 2004) of the Franklin Templeton Funds and Senior Vice President of Franklin Templeton Services, LLC (2000 2004).
Year of Election or Appointment: 2005
Deputy Treasurer of Municipal Money Market. Mr. Robins also serves as Deputy Treasurer of other Fidelity funds (2005 present) and is an employee of FMR (2004 present). Before joining Fidelity Investments, Mr. Robins worked at KPMG LLP, where he was a partner in KPMG’s department of professional practice (2002 2004) and a Senior Manager (1999 2000). In addition, Mr. Robins served as Assistant Chief Accountant, United States Securities and Exchange Commission (2000 2002).
Year of Election or Appointment: 2005
Assistant Treasurer of Municipal Money Market. Mr. Byrnes also serves as Assistant Treasurer of other Fidelity funds (2005 present) and is an employee of FMR (2005 present). Previously, Mr. Byrnes served as Vice President of FPCMS (2003 2005). Before joining Fidelity Investments, Mr. Byrnes worked at Deutsche Asset Management where he served as Vice President of the Investment Operations Group (2000 2003).
Year of Election or Appointment: 1986
Assistant Treasurer of Municipal Money Market. Mr. Costello also serves as Assistant Treasurer of other Fidelity funds and is an employee of FMR.
107 Annual Report
Trustees and Officers - continued
| | Name, Age; Principal Occupation
Peter L. Lydecker (51)
|
Year of Election or Appointment: 2004
Assistant Treasurer of Municipal Money Market. Mr. Lydecker also serves as Assistant Treasurer of other Fidelity funds (2004) and is an employee of FMR.
Year of Election or Appointment: 2002
Assistant Treasurer of Municipal Money Market. Mr. Osterheld also serves as Assistant Treasurer of other Fidelity funds (2002) and is an employee of FMR.
Year of Election or Appointment: 2005
Assistant Treasurer of Municipal Money Market. Mr. Ryan also serves as Assistant Treasurer of other Fidelity funds (2005 present) and is an employee of FMR (2005 present). Previously, Mr. Ryan served as Vice President of Fund Reporting in FPCMS (1999 2005).
Year of Election or Appointment: 2005
Assistant Treasurer of Municipal Money Market. Mr. Schiavone also serves as Assistant Treasurer of other Fidelity funds (2005 present) and is an employee of FMR (2005 present). Before joining Fidelity Invest ments, Mr. Schiavone worked at Deutsche Asset Management, where he most recently served as Assistant Treasurer (2003 2005) of the Scudder Funds and Vice President and Head of Fund Reporting (1996 2003).
The fund hereby designates as capital gain dividends: For dividends with respect to the taxable year ended August 31, 2005, $383,000, or, if subsequently determined to be different, the net capital gain of such year, and for dividends with respect to the taxable year ended August 31, 2004, $0, or, if subsequently determined to be different, the excess of: (a) the net capital gain of such year, over (b) amounts previously des ignated as capital gain dividends with respect to such year.
During fiscal year ended 2005, 100% of the fund’s income dividends was free from federal income tax, and 57.45% of the fund’s income dividends was subject to the federal alternative minimum tax.
The fund will notify shareholders in January 2006 of amounts for use in preparing 2005 income tax returns.
109 Annual Report
Proxy Voting Results
A special meeting of the fund’s shareholders was held on April 13, 2005. The results of votes taken among shareholders on proposals before them are reported below. Each vote reported represents one dollar of net asset value held on the record date for the meeting.
| PROPOSAL 1 | | | | |
| To amend the Trust Instrument to allow |
| the Board of Trustees, if permitted by |
| applicable law, to authorize fund mergers |
| without shareholder approval.* | | |
| | | # of | | % of |
| | | Votes | | Votes |
| Affirmative | | 7,963,915,275.00 | | 80.395 |
| Against | | 1,604,213,132.51 | | 16.194 |
| Abstain | | 331,409,117.16 | | 3.346 |
| Broker | | | | |
| Non Votes | | 6,453,184.00 | | .065 |
| TOTAL | | 9,905,990,708.67 | | 100.000 |
| PROPOSAL 2 | | | | |
| To elect a Board of Trustees.* | | |
| | | # of | | % of |
| | | Votes | | Votes |
| Laura B. Cronin | | | | |
| Affirmative | | 9,373,053,787.27 | | 94.620 |
| Withheld | | 532,936,921.40 | | 5.380 |
| TOTAL | | 9,905,990,708.67 | | 100.000 |
| Dennis J. Dirks | | | | |
| Affirmative | | 9,385,368,522.63 | | 94.744 |
| Withheld | | 520,622,186.04 | | 5.256 |
| TOTAL | | 9,905,990,708.67 | | 100.000 |
| Robert M. Gates | | | | |
| Affirmative | | 9,372,071,963.26 | | 94.610 |
| Withheld | | 533,918,745.41 | | 5.390 |
| TOTAL | | 9,905,990,708.67 | | 100.000 |
| George H. Heilmeier | | |
| Affirmative | | 9,374,826,621.61 | | 94.638 |
| Withheld | | 531,164,087.06 | | 5.362 |
| TOTAL | | 9,905,990,708.67 | | 100.000 |
| Abigail P. Johnson | | |
| Affirmative | | 9,349,225,683.70 | | 94.380 |
| Withheld | | 556,765,024.97 | | 5.620 |
| TOTAL | | 9,905,990,708.67 | | 100.000 |
| | | # of | | % of |
| | | Votes | | Votes |
| Edward C. Johnson 3d | | |
| Affirmative | | 9,336,624,684.41 | | 94.252 |
| Withheld | | 569,366,024.26 | | 5.748 |
| TOTAL | | 9,905,990,708.67 | | 100.000 |
| Marie L. Knowles | | |
| Affirmative | | 9,385,202,135.87 | | 94.743 |
| Withheld | | 520,788,572.80 | | 5.257 |
| TOTAL | | 9,905,990,708.67 | | 100.000 |
| Ned C. Lautenbach | | |
| Affirmative | | 9,376,788,549.33 | | 94.658 |
| Withheld | | 529,202,159.34 | | 5.342 |
| TOTAL | | 9,905,990,708.67 | | 100.000 |
| Marvin L. Mann | | | | |
| Affirmative | | 9,361,169,551.40 | | 94.500 |
| Withheld | | 544,821,157.27 | | 5.500 |
| TOTAL | | 9,905,990,708.67 | | 100.000 |
| William O. McCoy | | |
| Affirmative | | 9,363,552,602.29 | | 94.524 |
| Withheld | | 542,438,106.38 | | 5.476 |
| TOTAL | | 9,905,990,708.67 | | 100.000 |
| Robert L. Reynolds | | |
| Affirmative | | 9,372,289,526.22 | | 94.612 |
| Withheld | | 533,701,182.45 | | 5.388 |
| TOTAL | | 9,905,990,708.67 | | 100.000 |
| Cornelia M. Small | | |
| Affirmative | | 9,384,016,844.12 | | 94.731 |
| Withheld | | 521,973,864.55 | | 5.269 |
| TOTAL | | 9,905,990,708.67 | | 100.000 |
| William S. Stavropoulos | | |
| Affirmative | | 9,373,082,552.28 | | 94.620 |
| Withheld | | 532,908,156.39 | | 5.380 |
| TOTAL | | 9,905,990,708.67 | | 100.000 |
| Kenneth L. Wolfe | | | | |
| Affirmative | | 9,374,633,251.39 | | 94.636 |
| Withheld | | 531,357,457.28 | | 5.364 |
| TOTAL | | 9,905,990,708.67 | | 100.000 |
* Denotes trust-wide proposals and voting results.
Annual Report
Board Approval of Investment Advisory Contracts and Management Fees
Fidelity Municipal Money Market Fund
Each year, typically in June, the Board of Trustees, including the independent Trustees (together, the Board), votes on the renewal of the management contract and sub advisory agreements (together, the Advisory Contracts) for the fund. The Board, assisted by the advice of fund counsel and independent Trustees’ counsel, requests and considers a broad range of information throughout the year.
The Board meets regularly each month except August and takes into account throughout the year matters bearing on Advisory Contracts. The Board, acting directly and through its separate committees, considers at each of its meetings factors that are relevant to the annual renewal of the fund’s Advisory Contracts, including the services and support provided to the fund and its shareholders by Fidelity. At the time of the renewal, the Board had 11 standing committees, each composed of independent Trustees with varying backgrounds, to which the Board has assigned specific subject matter responsibilities in order to enhance effective decision making by the Board. Each committee has adopted a written charter outlining the structure and purposes of the committee. One such com mittee, the Fixed Income Contract Committee, meets periodically during the first six months of each year and as necessary to consider matters specifically related to the annual renewal of Advisory Contracts. The committee requests and receives information on, and makes recommendations to the independent Trustees concerning, the approval and annual review of the Advisory Contracts.
At its June 2005 meeting, the Board of Trustees, including the independent Trustees, unanimously determined to renew the Advisory Contracts for the fund. In reaching its determination, the Board considered all factors it believed relevant, including (1) the nature, extent, and quality of the services to be provided to the fund and its shareholders by Fidelity (including the investment performance of the fund); (2) the competitiveness of the management fee and total expenses of the fund; (3) the total costs of the services to be provided by and the profits to be realized by the investment adviser and its affiliates from the relationship with the fund; (4) the extent to which economies of scale would be realized as the fund grows; and (5) whether fee levels reflect these economies of scale, if any, for the benefit of fund shareholders.
In determining whether to renew the Advisory Contracts for the fund, the Board ulti mately reached a determination, with the assistance of fund counsel and independent Trustees’ counsel, that the renewal of the Advisory Contracts and the compensation to be received by Fidelity under the management contract is consistent with Fidelity’s fidu ciary duty under applicable law. In addition to evaluating the specific factors noted above, the Board, in reaching its determination, is aware that shareholders in the fund have a broad range of investment choices available to them, including a wide choice among mutual funds offered by competitors to Fidelity, and that the fund’s shareholders, with the opportunity to review and weigh the disclosure provided by the fund in its
111 Annual Report
Board Approval of Investment Advisory Contracts and Management Fees continued
prospectus and other public disclosures, have chosen to invest in this fund, managed by Fidelity.
Nature, Extent, and Quality of Services Provided by Fidelity. The Board consid ered staffing within the investment adviser, FMR, and the sub advisers (together, the Investment Advisers), including the background of the fund’s portfolio manager and the fund’s investment objective and discipline. The independent Trustees also had discus sions with senior management of Fidelity’s investment operations and investment groups. The Board considered the structure of the portfolio manager compensation program and whether this structure provides appropriate incentives.
Fidelity Resources Dedicated to Investment Management and Support Services. The Board reviewed the size, education, and experience of the Investment Advisers’ invest ment staff, their use of technology, and the Investment Advisers’ approach to recruiting, training, and retaining portfolio managers and other research, advisory, and manage ment personnel. The Board considered Fidelity’s extensive global research capabilities that enable the Investment Advisers to aggregate data from various sources in an effort to produce positive investment results. The Board noted that Fidelity’s analysts have access to a variety of technological tools that enable them to perform both fundamental and quantitative analysis and to specialize in various disciplines. The Board also considered that Fidelity’s portfolio managers and analysts have access to daily portfolio attribution that allows for monitoring of a fund’s portfolio, as well as an electronic communication system that provides immediate real time access to research concerning issuers and credit enhancers.
Shareholder and Administrative Services. The Board considered the nature, extent, quality, and cost of administrative, distribution, and shareholder services performed by the Investment Advisers and their affiliates under the Advisory Contracts and under separate agreements covering transfer agency and pricing and bookkeeping services for the fund. The Board also considered the nature and extent of the Investment Advisers’ supervision of third party service providers, principally custodians and subcustodians. The Board also considered the resources devoted to, and the record of compliance with, the fund’s compliance policies and procedures.
The Board noted that the growth of fund assets across the complex allows Fidelity to reinvest in the development of services designed to enhance the value or convenience of the Fidelity funds as investment vehicles. These services include 24 hour access to account information and market information through phone representatives and over the Internet, and investor education materials and asset allocation tools.
Investment in a Large Fund Family. The Board considered the benefits to shareholders of investing in a Fidelity fund, including the benefits of investing in a fund that is part of a large family of funds offering a variety of investment disciplines and providing for a large variety of mutual fund investor services. For example, fund shareholders are offered the
privilege of exchanging shares of the fund for shares of other Fidelity funds, as set forth in the fund’s prospectus, without paying a sales charge. The Board noted that, since the last Advisory Contract renewals in June 2004, Fidelity has taken a number of actions that benefited particular funds, including (i) voluntarily deciding in 2004 to stop using “soft” commission dollars to pay for market data and, instead, to pay for that data out of its own resources, (ii) contractually agreeing to impose management fee reductions and expense limitations on its five Spartan stock index funds and its stock index fund available through variable insurance products, (iii) contractually agreeing to eliminate the management fees on the Fidelity Freedom Funds and the Fidelity Advisor Freedom Funds, (iv) contractually agreeing to reduce the management fees on most of its investment grade taxable bond funds, and (v) contractually agreeing to impose expense limitations on its retail and Spartan investment grade taxable bond funds.
Investment Performance. The Board considered whether the fund has operated within its investment objective, as well as its record of compliance with its investment restric tions. It also reviewed the fund’s absolute investment performance, as well as the fund’s relative investment performance measured against a peer group of mutual funds deemed appropriate by the Board over multiple periods. The following charts considered by the Board show, over the one , three , and five year periods ended December 31, 2004, the fund’s returns and a range of returns of a peer group of mutual funds identified by Lipper Inc. as having an investment objective similar to that of the fund. The box within each chart shows the 25th percentile return (bottom of box) and the 75th percentile return (top of box) of the Lipper peer group. The percentage beaten number noted below each chart corresponds to the percentile box and represents the percentage of funds in the Lipper peer group whose performance was equal to or lower than that of the fund.

Annual Report
Board Approval of Investment Advisory Contracts and Management Fees continued
The Board noted that the relative investment performance of the fund has compared favorably to its Lipper peer group over time.
Based on its review, and giving particular weight to the nature and quality of the resources dedicated by the Investment Advisers to maintain and improve relative performance, the Board concluded that the nature, extent, and quality of the services provided by Fidelity will benefit the fund’s shareholders, particularly in light of the Board’s view that the fund’s shareholders benefit from investing in a fund that is part of a large family of funds offering a variety of investment disciplines and services.
Competitiveness of Management Fee and Total Fund Expenses. The Board considered the fund’s management fee and total expenses compared to “mapped groups” of competitive funds and classes. Fidelity creates “mapped groups” by combining similar Lipper investment objective categories that have comparable management fee charac teristics. Combining Lipper investment objective categories aids the Board’s manage ment fee and total expense comparisons by broadening the competitive group used for comparison and by reducing the number of universes to which various Fidelity funds are compared.
The Board considered two proprietary management fee comparisons for the 12 month periods shown in the chart below. The group of Lipper funds used by the Board for management fee comparisons is referred to below as the “Total Mapped Group” and, for the reasons explained above, is broader than the Lipper peer group used by the Board for performance comparisons. The Total Mapped Group comparison focuses on a fund’s standing relative to the total universe of comparable funds available to investors, in terms of gross management fees before expense reimbursements or caps. “TMG %” represents the percentage of funds in the Total Mapped Group that had management fees that were lower than the fund’s. For example, a TMG % of 16% would mean that 84% of the funds in the Total Mapped Group had higher management fees than the fund. The “Asset Size Peer Group” (ASPG) comparison focuses on a fund’s standing relative to non Fidelity funds similar in size to the fund within the Total Mapped Group. The ASPG represents at least 15% of the funds in the Total Mapped Group with comparable asset size and management fee characteristics, subject to a minimum of 50 funds (or all funds in the Total Mapped Group if fewer than 50). Additional information, such as the ASPG quartile (“quadrant”) in which the fund’s management fee ranked, is also included in the chart and considered by the Board.
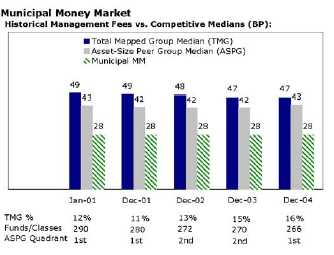
The Board noted that the fund’s management fee ranked below the median of its Total Mapped Group and below the median of its ASPG for 2004. Based on its review, the Board concluded that the fund’s management fee was fair and reasonable in light of the ser vices that the fund receives and the other factors considered.
In its review of the fund’s total expenses, the Board considered the fund’s management fee as well as other fund expenses, such as transfer agent fees, pricing and bookkeeping fees, and custodial, legal, and audit fees. The Board also noted the effects of any waivers and reimbursements on fees and expenses. As part of its review, the Board also consid ered current and historical total expenses of the fund compared to competitive fund median expenses. The fund is compared to those funds and classes in the Total Mapped Group (used by the Board for management fee comparisons) that have a similar sales load structure.
The Board noted that the fund’s total expenses ranked below its competitive median for 2004.
In its review of total expenses, the Board also considered Fidelity fee structures and other information on clients that FMR and its affiliates service in other competitive markets, such as other mutual funds advised or subadvised by FMR or its affiliates, pension plan clients, and other institutional clients.
Based on its review, the Board concluded that the fund’s total expenses were reasonable in light of the services that the fund and its shareholders receive and the other factors considered.
115 Annual Report
Board Approval of Investment Advisory Contracts and Management Fees continued
Costs of the Services and Profitability. The Board considered the revenues earned and the expenses incurred by Fidelity in conducting the business of developing, market ing, distributing, managing, administering and servicing the fund and its shareholders. The Board also considered the level of Fidelity’s profits in respect of all the Fidelity funds.
On an annual basis, FMR presents to the Board Fidelity’s profitability for the fund. Fidelity calculates the profitability for each fund, as well as aggregate profitability for groups of Fidelity funds and all Fidelity funds, using a series of detailed revenue and cost allocation methodologies which originate with the audited books and records of Fidelity. The Audit Committee of the Board reviews any significant changes from the prior year’s methodologies.
PricewaterhouseCoopers LLP (PwC), independent registered accounting firm and auditor to Fidelity and certain Fidelity funds, has been engaged annually by the Board as part of the Board’s assessment of the results of Fidelity’s profitability analysis. PwC’s engagement includes the review and assessment of Fidelity’s methodologies used in determining the revenues and expenses attributable to Fidelity’s mutual fund business, and completion of agreed upon procedures surrounding the mathematical accuracy of fund profitability and its conformity to allocation methodologies. After considering PwC’s reports issued under the engagement and information provided by Fidelity, the Board believes that while other allocation methods may also be reasonable, Fidelity’s profitabil ity methodologies are reasonable in all material respects.
The Board has also reviewed Fidelity’s non fund businesses and any fall out benefits related to the mutual fund business as well as cases where Fidelity’s affiliates may benefit from or be related to the fund’s business. In addition, a special committee of the Board reviewed services provided to Fidelity by its affiliates and determined that the fees that Fidelity paid for such services were reasonable.
The Board considered the costs of the services provided by and the profits realized by Fidelity in connection with the operation of the fund and determined that the amount of profit is a fair entrepreneurial profit for the management of the fund.
Economies of Scale. The Board considered whether there have been economies of scale in respect of the management of the Fidelity funds, whether the Fidelity funds (including the fund) have appropriately benefited from any such economies of scale, and whether there is potential for realization of any further economies of scale. The Board considered the extent to which the fund will benefit from economies of scale through increased services to the fund, through waivers or reimbursements, or through fee or expense reductions, including reductions that occur through operation of the transfer agent agreement. The transfer agent fee varies in part based on the number of accounts in the fund. If the number of accounts decreases or the average account size increases, the overall transfer agent fee rate decreases.
The Board recognized that the fund’s management contract incorporates a “group fee” structure, which provides for lower fee rates as total fund assets under FMR’s manage ment increase, and for higher fee rates as total fund assets under FMR’s management decrease. The Board considered that the group fee is designed to deliver the benefits of economies of scale to fund shareholders when total fund assets increase, even if assets of any particular fund are unchanged or have declined, because some portion of Fidelity’s costs are attributable to services provided to all Fidelity funds, and all funds benefit if those costs can be allocated among more assets. The Board concluded that, given the group fee structure, fund shareholders will achieve a certain level of economies of scale as assets under FMR’s management increase at the fund complex level, regardless of whether Fidelity achieves any such economies of scale.
The Board further concluded that any potential economies of scale are being shared between fund shareholders and Fidelity in an appropriate manner.
Additional Information Requested by the Board. In order to develop fully the factual basis for consideration of the Advisory Contracts, the Board requested additional information regarding (i) Fidelity’s fund profitability methodology, including additional detail on various cost allocations; (ii) fall out benefits to Fidelity; and (iii) compensation of portfolio managers and research analysts.
Based on its evaluation of all of the conclusions noted above, and after considering all material factors, the Board ultimately concluded that the existing advisory fee structures are fair and reasonable, and that the fund’s existing Advisory Contracts should be renewed.
117 Annual Report
Managing Your Investments
Fidelity offers several ways to conveniently manage your personal investments via your telephone or PC. You can access your account information, conduct trades and research your investments 24 hours a day.
By Phone
Fidelity Automated Service Telephone provides a single toll free number to access account balances, positions, quotes and trading. It’s easy to navigate the service, and on your first call, the system will help you create a personal identification number (PIN) for security.


By PC
Fidelity’s web site on the Internet provides a wide range of information, including daily financial news, fund performance, interactive planning tools and news about Fidelity products and services.

* When you call the quotes line, please remember that a fund’s yield and return will vary and, except for money market funds, share price will also vary. This means that you may have a gain or loss when you sell your shares. There is no assurance that money market funds will be able to maintain a stable $1 share price; an investment in a money market fund is not insured or guar anteed by the U.S. government. Total returns are historical and include changes in share price, reinvestment of dividends and capital gains, and the effects of any sales charges.
Annual Report
To Write Fidelity
We’ll give your correspondence immediate attention and send you written confirmation upon completion of your request.

(such as changing name, address, bank, etc.)
Fidelity Investments P.O. Box 770001 Cincinnati, OH 45277-0002

Buying shares
Fidelity Investments P.O. Box 770001 Cincinnati, OH 45277-0003
Overnight Express
Fidelity Investments Attn: Distribution Services 100 Crosby Parkway KC1H Covington, KY 41015
Selling shares
Fidelity Investments P.O. Box 770001 Cincinnati, OH 45277-0035
Overnight Express
Fidelity Investments Attn: Distribution Services 100 Crosby Parkway KC1H Covington, KY 41015
General Correspondence
Fidelity Investments P.O. Box 500 Merrimack, NH 03054-0500

Buying shares
Fidelity Investments P.O. Box 770001 Cincinnati, OH 45277-0003
Selling shares
Fidelity Investments P.O. Box 770001 Cincinnati, OH 45277-0035
Overnight Express
Fidelity Investments Attn: Distribution Services 100 Crosby Parkway KC1H Covington, KY 41015
General Correspondence
Fidelity Investments P.O. Box 500 Merrimack, NH 03054-0500
Annual Report
Investment Adviser
Fidelity Management & Research Company Boston, MA
Investment Sub Adviser
Fidelity Investments Money Management, Inc.
Fidelity International Investment Advisors
Fidelity International Investment Advisors (U.K.) Limited
General Distributor
Fidelity Distributors Corporation Boston, MA
Transfer and Service Agent
Citibank, N.A. New York, NY
Custodian
Citibank, N.A. New York, NY
| The Fidelity Telephone Connection |
| Mutual Fund 24-Hour Service |
| Exchanges/Redemptions | | |
| and Account Assistance | | 1-800-544-6666 |
| Product Information | | 1-800-544-6666 |
| Retirement Accounts | | 1-800-544-4774 |
| (8 a.m. - 9 p.m.) | | |
| TDD Service | | 1-800-544-0118 |
| for the deaf and hearing impaired |
| (9 a.m. - 9 p.m. Eastern time) |
| Fidelity Automated Service | | |
| Telephone (FAST® ) | | (automated_phone_logo) 1-800-544-5555 |
(automated_phone_logo) Automated line for quickest service
MMM-UANN-1005
1.790909.102

Fidelity®
AMT Tax Free Money
Fund
(formerly Spartan® Municipal Money Fund)
|
Annual Report
August 31, 2005
|


| Contents | | | | |
| |
| Chairman’s Message | | 4 | | Ned Johnson’s message to shareholders. |
| |
| Shareholder Expense | | 5 | | An example of shareholder expenses. |
| Example | | | | |
| Investment Changes/ | | 6 | | A summary of major shifts in the fund’s |
| Performance | | | | investments over the past six months |
| | | | | and one year, and performance |
| | | | | information. |
| Investments | | 7 | | A complete list of the fund’s investments. |
| Financial Statements | | 39 | | Statements of assets and liabilities, |
| | | | | operations, and changes in net assets, |
| | | | | as well as financial highlights. |
| Notes | | 43 | | Notes to the financial statements. |
| |
| Report of Independent | | 47 | | |
| Registered Public | | | | |
| Accounting Firm | | | | |
| Trustees and Officers | | 48 | | |
| Distributions | | 59 | | |
| Proxy Voting Results | | 60 | | |
| Board Approval of | | 61 | | |
| Investment Advisory | | | | |
| Contracts and | | | | |
| Management Fees | | | | |
To view a fund’s proxy voting guidelines and proxy voting record for the 12 month period ended June 30, visit www.fidelity.com/proxyvotingresults or visit the Securities and Exchange Commission’s (SEC) web site at www.sec.gov. You may also call 1-800-544-8544 to request a free copy of the proxy voting guidelines.
Standard & Poor’s, S&P and S&P 500 are registered service marks of The McGraw Hill Companies, Inc. and have been licensed for use by Fidelity Distributors Corporation.
Other third party marks appearing herein are the property of their respective owners. All other marks appearing herein are registered or unregistered trademarks or service marks of FMR Corp. or an affiliated company.
Annual Report
This report and the financial statements contained herein are submitted for the general information of the shareholders of the fund. This report is not authorized for distribution to prospective investors in the fund unless preceded or accompanied by an effective prospectus. A fund files its complete schedule of portfolio holdings with the SEC for the first and third quarters of each fiscal year on Form N Q. Forms N Q are available on the SEC’s web site at http://www.sec.gov. A fund’s Forms N Q may be reviewed and copied at the SEC’s Public Refer ence Room in Washington, DC. Information regarding the operation of the SEC’s Public Reference Room may be obtained by calling 1 800 SEC 0330. For a complete list of a fund’s portfolio holdings, view the most recent quarterly holdings report, semiannual report, or annual report on Fidelity’s web site at http://www.fidelity.com/holdings.
NOT FDIC INSURED · MAY LOSE VALUE · NO BANK GUARANTEE
Neither the fund nor Fidelity Distributors Corporation is a bank.
3 Annual Report
3
Chairman’s Message
(Photograph of Edward C Johnson 3d)
Dear Shareholder:
During the past year or so, much has been reported about the mutual fund industry, and much of it has been more critical than I believe is warranted. Allegations that some companies have been less than forthright with their shareholders have cast a shadow on the entire industry. I continue to find these reports disturbing, and assert that they do not create an accurate picture of the industry overall. Therefore, I would like to remind every one where Fidelity stands on these issues. I will say two things specifically regarding allegations that some mutual fund companies were in violation of the Securities and Exchange Commission’s forward pric ing rules or were involved in so called “market timing” activities.
First, Fidelity has no agreements that per mit customers who buy fund shares after 4 p.m. to obtain the 4 p.m. price. This is not a new policy. This is not to say that some one could not deceive the company through fraudulent acts. However, we are extremely diligent in preventing fraud from occurring in this manner and in every other. But I underscore again that Fidelity has no so called “agreements” that sanction illegal practices.
Second, Fidelity continues to stand on record, as we have for years, in opposition to predatory short term trading that adversely affects shareholders in a mutual fund. Back in the 1980s, we initiated a fee which is returned to the fund and, therefore, to investors to discourage this activity. Further, we took the lead sev eral years ago in developing a Fair Value Pricing Policy to prevent market timing on foreign securities in our funds. I am confi dent we will find other ways to make it more difficult for predatory traders to operate. However, this will only be achieved through close cooperation among regulators, legislators and the industry.
Yes, there have been unfortunate instances of unethical and illegal activity within the mutual fund industry from time to time. That is true of any industry. When this occurs, confessed or convicted offend ers should be dealt with appropriately. But we are still concerned about the risk of over regulation and the quick applica tion of simplistic solutions to intricate problems. Every system can be improved, and we support and applaud well thought out improvements by regulators, legisla tors and industry representatives that achieve the common goal of building and protecting the value of investors’ holdings. For nearly 60 years, Fidelity has worked very hard to improve its products and ser vice to justify your trust. When our family founded this company in 1946, we had only a few hundred customers. Today, we serve more than 18 million customers in cluding individual investors and partici pants in retirement plans across America. Let me close by saying that we do not take your trust in us for granted, and we real ize that we must always work to improve all aspects of our service to you. In turn, we urge you to continue your active participation with your financial matters, so that your interests can be well served.
Best regards,
/s/ Edward C. Johnson 3d
Edward C. Johnson 3d
Shareholder Expense Example
As a shareholder of the Fund, you incur two types of costs: (1) transaction costs, and (2) ongoing costs, including management fees and other Fund expenses. This Example is intended to help you understand your ongoing costs (in dollars) of investing in the Fund and to compare these costs with the ongoing costs of investing in other mutual funds. The Example is based on an investment of $1,000 invested at the beginning of the period and held for the entire period (March 1, 2005 to August 31, 2005).
The first line of the table below provides information about actual account values and actual expenses. You may use the information in this line, together with the amount you invested, to estimate the expenses that you paid over the period. Simply divide your account value by $1,000.00 (for example, an $8,600 account value divided by $1,000.00 = 8.6), then multiply the result by the number in the first line under the heading entitled “Expenses Paid During Period” to estimate the expenses you paid on your account during this period. A small balance maintenance fee of $12.00 that is charged once a year may apply for certain accounts with a value of less than $2,000. This fee is not included in the table below. If it was, the estimate of expenses you paid during the period would be higher, and your ending account value lower, by this amount.
Hypothetical Example for Comparison Purposes
The second line of the table below provides information about hypothetical account values and hypothetical expenses based on the Fund’s actual expense ratio and an assumed rate of return of 5% per year before expenses, which is not the Fund’s actual return. The hypothetical account values and expenses may not be used to estimate the actual ending account balance or expenses you paid for the period. You may use this information to compare the ongoing costs of investing in the Fund and other funds. To do so, compare this 5% hypothetical example with the 5% hypothetical examples that appear in the share holder reports of the other funds. A small balance maintenance fee of $12.00 that is charged once a year may apply for certain accounts with a value of less than $2,000. This fee is not included in the table below. If it was, the estimate of expenses you paid during the period would be higher, and your ending account value lower, by this amount.
Please note that the expenses shown in the table are meant to highlight your ongoing costs only and do not reflect any transaction costs. Therefore, the second line of the table is useful in comparing ongoing costs only, and will not help you determine the relative total costs of owning different funds.
| | | | | | | | | | | | | Expenses Paid |
| | | | | Beginning | | | | Ending | | | | During Period* |
| | | | | Account Value | | | | Account Value | | | | March 1, 2005 |
| | | | | March 1, 2005 | | | | August 31, 2005 | | to August 31, 2005 |
| Actual | | $ | | 1,000.00 | | $ | | 1,010.80 | | $ | | 1.67 |
| Hypothetical (5% return per year | | | | | | | | | | | | |
| before expenses) | | $ | | 1,000.00 | | $ | | 1,023.54 | | $ | | 1.68 |
* Expenses are equal to the Fund’s annualized expense ratio of .33%; multiplied by the average account value over the period, multiplied by 184/365 (to reflect the one half year period).
5 Annual Report
Investment Changes/Performance
| Maturity Diversification | | | | | | |
| Days | | % of fund’s | | % of fund’s | | % of fund’s |
| | | investments | | investments | | investments |
| | | 8/31/05 | | 2/28/05 | | 8/31/04 |
| 0 – 30 | | 94.8 | | 94.3 | | 94.9 |
| 31 – 90 | | 1.5 | | 2.3 | | 1.1 |
| 91 – 180 | | 0.2 | | 2.0 | | 0.2 |
| 181 – 397 | | 3.5 | | 1.4 | | 3.8 |
| Weighted Average Maturity | | | | | | |
| | | 8/31/05 | | 2/28/05 | | 8/31/04 |
| Fidelity AMT Tax Free Money Fund | | 19 Days | | 12 Days | | 19 Days |
| All Tax Free Money Market Funds | | | | | | |
| Average* | | 28 Days | | 28 Days | | 36 Days |
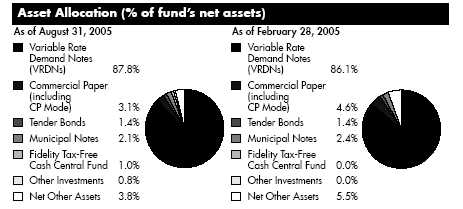
| Current and Historical Seven Day Yields | | | | | | |
| | | 8/29/05 | | 5/30/05 | | 2/28/05 | | 11/29/04 | | 8/30/04 |
| Fidelity AMT Tax Free Money Fund | | 2.22% | | 2.62% | | 1.59% | | 1.38% | | 1.00% |
| If Fidelity had not reimbursed | | | | | | | | | | |
| certain fund expenses | | 2.13% | | 2.52% | | 1.45% | | 1.27% | | 0.89% |
Yield refers to the income paid by the fund over a given period. Yields for money market funds are usually for seven day periods, as they are here, though they are expressed as annual percentage rates. Past performance is no guarantee of future results. Yield will vary and it is possible to lose money by investing in the fund.
*Source: iMoneyNet, Inc.
Annual Report
Investments August 31, 2005
Showing Percentage of Net Assets
Municipal Securities 96.2%
| | | | | Principal | | Value (Note 1) |
| | | Amount (000s) | | | | (000s) |
| Alabama – 2.0% | | | | | | | | |
| Birmingham Med. Ctr. East Spl. Care Facilities Fing. Auth. Rev. | | | | | | | | |
| Participating VRDN Series MT 16, 2.53% (Liquidity Facility | | | | | | | | |
| Svenska Handelsbanken AB) (c)(f) | | $ | | 9,180 | | $ | | 9,180 |
| Birmingham Pub. Park & Recreation Board Rev. (McWane Ctr. | | | | | | | | |
| Proj.) Series 1997, 2.54%, LOC AmSouth Bank NA, | | | | | | | | |
| Birmingham, VRDN (c) | | | | 1,900 | | | | 1,900 |
| Cap. City Edl. Bldg. Auth. Rev. (Montgomery Academy Proj.) | | | | | | | | |
| Series 1999 B, 2.52%, LOC AmSouth Bank NA, | | | | | | | | |
| Birmingham, VRDN (c) | | | | 3,000 | | | | 3,000 |
| Huntsville Health Care Auth. Rev. Series 1998, 2.54%, LOC | | | | | | | | |
| AmSouth Bank NA, Birmingham, VRDN (c) | | | | 5,505 | | | | 5,505 |
| Jefferson County Ltd. Oblig. School Warrants Series B, 2.5% | | | | | | | | |
| (AMBAC Insured), VRDN (c) | | | | 4,100 | | | | 4,100 |
| Jefferson County Swr. Rev. Series 2002 C2, 2.57% (XL Cap. | | | | | | | | |
| Assurance, Inc. Insured), VRDN (c) | | | | 1,000 | | | | 1,000 |
| Montgomery Baptist Med. Ctr. Spl. Care Facilities Fing. Auth. | | | | | | | | |
| Rev. (Baptist Med. Ctr. Proj.) Series 1994 A, 2.54%, LOC | | | | | | | | |
| AmSouth Bank NA, Birmingham, VRDN (c) | | | | 13,800 | | | | 13,800 |
| Morgan County-Decatur Health Care Auth. Hosp. Rev. | | | | | | | | |
| Participating VRDN Series PT 947, 2.53% (Liquidity Facility | | | | | | | | |
| Landesbank Hessen-Thuringen) (c)(f) | | | | 28,690 | | | | 28,690 |
| Tuscaloosa Spl. Care Facilities Fing. Auth. Residential Care | | | | | | | | |
| Family Mortgage Rev. (Capstone Village Proj.) Series C, | | | | | | | | |
| 2.51%, LOC BNP Paribas SA, VRDN (c) | | | | 10,000 | | | | 10,000 |
| | | | | | | | | 77,175 |
| |
| Alaska – 1.3% | | | | | | | | |
| Alaska Hsg. Fin. Corp. Participating VRDN: | | | | | | | | |
| Series BA 97 F, 2.59% (Liquidity Facility Bank of America | | | | | | | | |
| NA) (c)(f) | | | | 6,750 | | | | 6,750 |
| Series DB 162, 2.53% (Liquidity Facility Deutsche Bank | | | | | | | | |
| AG) (c)(f) | | | | 10,000 | | | | 10,000 |
| Series Merlots 99 D, 2.4% (Liquidity Facility Wachovia Bank | | | | | | | | |
| NA) (c)(f) | | | | 3,700 | | | | 3,700 |
| Anchorage Gen. Oblig. Participating VRDN Series PT 2561, | | | | | | | | |
| 2.53% (Liquidity Facility Merrill Lynch & Co., Inc.) (c)(f) | | | | 6,980 | | | | 6,980 |
| Anchorage Lease Rev. Participating VRDN Series PT 2657, | | | | | | | | |
| 2.53% (Liquidity Facility Merrill Lynch & Co., Inc.) (c)(f) | | | | 9,070 | | | | 9,070 |
| Valdez Marine Term. Rev. Bonds (ConocoPhillips Proj.) Series | | | | | | | | |
| 1994 B, 3%, tender 6/1/06 (c) | | | | 12,000 | | | | 12,000 |
| | | | | | | | | 48,500 |
See accompanying notes which are an integral part of the financial statements.
| Investments continued | | | | | | | | |
| |
| |
| |
| Municipal Securities continued | | | | | | | | |
| | | | | Principal | | Value (Note 1) |
| | | Amount (000s) | | | | (000s) |
| Arizona – 2.7% | | | | | | | | |
| Arizona Salt River Proj. Agric. Impt. & Pwr. District Rev. | | | | | | | | |
| Participating VRDN Series EGL 02 301, 2.53% (Liquidity | | | | | | | | |
| Facility Citibank NA, New York) (c)(f) | | $ | | 8,495 | | $ | | 8,495 |
| Arizona School Facilities Board Ctfs. of Prtn. Participating | | | | | | | | |
| VRDN Series RF 04 2, 2.57% (Liquidity Facility Bank of New | | | | | | | | |
| York, New York) (c)(f) | | | | 6,750 | | | | 6,750 |
| Arizona School Facilities Board State School Impt. Rev. | | | | | | | | |
| Participating VRDN Series MS 00 497, 2.52% (Liquidity | | | | | | | | |
| Facility Morgan Stanley) (c)(f) | | | | 6,648 | | | | 6,648 |
| Maricopa County Poll. Cont. Rev. Participating VRDN Series | | | | | | | | |
| ROC II R407, 2.53% (Liquidity Facility Citibank NA) (c)(f) | | | | 4,520 | | | | 4,520 |
| Phoenix Civic Impt. Corp. Excise Tax Rev. Participating VRDN | | | | | | | | |
| Series EGL 03 28, 2.53% (Liquidity Facility Citibank NA, | | | | | | | | |
| New York) (c)(f) | | | | 2,600 | | | | 2,600 |
| Phoenix Civic Impt. Corp. Wtr. Sys. Rev. Participating VRDN | | | | | | | | |
| Series EGL 7050056, 2.53% (Liquidity Facility Citibank | | | | | | | | |
| NA) (c)(f) | | | | 7,900 | | | | 7,900 |
| Salt River Proj. Agric. Impt. & Pwr. District Elec. Sys. Rev.: | | | | | | | | |
| Participating VRDN Series SG 03 160, 2.53% (Liquidity | | | | | | | | |
| Facility Societe Generale) (c)(f) | | | | 44,500 | | | | 44,500 |
| Series 1997 B, 2.5% 9/6/05, CP | | | | 14,425 | | | | 14,425 |
| Series 2004 C, 2.8% 9/15/05, CP | | | | 6,850 | | | | 6,850 |
| | | | | | | | | 102,688 |
| |
| California – 0.2% | | | | | | | | |
| Los Angeles Unified School District Participating VRDN Series | | | | | | | | |
| Putters 488, 2.52% (Liquidity Facility JPMorgan Chase | | | | | | | | |
| Bank) (c)(f) | | | | 8,985 | | | | 8,985 |
| Colorado – 1.4% | | | | | | | | |
| Adams County Rev. (Adams Mental Health Foundation Prog.) | | | | | | | | |
| Series 1997, 2.6%, LOC JPMorgan Chase Bank, VRDN (c) . | | | | 1,435 | | | | 1,435 |
| Arapahoe County Wtr. & Wastewtr. Pub. Impt. District | | | | | | | | |
| Participating VRDN Series PT 2174, 2.53% (Liquidity Facility | | | | | | | | |
| Merrill Lynch & Co., Inc.) (c)(f) | | | | 4,680 | | | | 4,680 |
| Colorado Dept. of Trans. Rev. Participating VRDN Series PT | | | | | | | | |
| 1955, 2.53% (Liquidity Facility Merrill Lynch & Co., | | | | | | | | |
| Inc.) (c)(f) | | | | 10,725 | | | | 10,725 |
| Colorado Health Facilities Auth. Rev. (Boulder Cmnty. Hosp. | | | | | | | | |
| Proj.) Series 2000, 2.52%, LOC JPMorgan Chase Bank, | | | | | | | | |
| VRDN (c) | | | | 4,500 | | | | 4,500 |
| Colorado Springs Utils. Rev. Participating VRDN Series MS | | | | | | | | |
| 1141, 2.52% (Liquidity Facility Morgan Stanley) (c)(f) | | | | 7,325 | | | | 7,325 |
| Denver City & County Arpt. Rev. Participating VRDN Series | | | | | | | | |
| Merlots 97 Q, 2.4% (Liquidity Facility Wachovia Bank | | | | | | | | |
| NA) (c)(f) | | | | 3,160 | | | | 3,160 |
See accompanying notes which are an integral part of the financial statements.
| Municipal Securities continued | | | | | | | | |
| | | | | Principal | | Value (Note 1) |
| | | Amount (000s) | | | | (000s) |
| Colorado – continued | | | | | | | | |
| E-470 Pub. Hwy. Auth. Rev. Participating VRDN: | | | | | | | | |
| Series 04 BS 219 Class A, 2.55% (Liquidity Facility Bear | | | | | | | | |
| Stearns Companies, Inc.) (c)(f) | | $ | | 4,000 | | $ | | 4,000 |
| Series MS 1064, 2.57% (Liquidity Facility Morgan | | | | | | | | |
| Stanley) (c)(f) | | | | 5,310 | | | | 5,310 |
| Series PZ 46, 2.57% (Liquidity Facility Merrill Lynch & Co., | | | | | | | | |
| Inc.) (c)(f) | | | | 1,320 | | | | 1,320 |
| Series TOC 05 Z7, 2.57% (Liquidity Facility Goldman Sachs | | | | | | | | |
| Group, Inc.) (c)(f) | | | | 4,939 | | | | 4,939 |
| Reg’l. Trans. District Sales Tax Rev. Participating VRDN Series | | | | | | | | |
| MS 01 679, 2.52% (Liquidity Facility Morgan Stanley) (c)(f) . | | | | 3,930 | | | | 3,930 |
| Southern Ute Indian Tribe of Southern Ute Indian Reservation | | | | | | | | |
| 2.55%, VRDN (c) | | | | 3,200 | | | | 3,200 |
| | | | | | | | | 54,524 |
| |
| District Of Columbia – 0.9% | | | | | | | | |
| District of Columbia Gen. Oblig. Participating VRDN: | | | | | | | | |
| Series Merlots 01 A127, 2.4% (Liquidity Facility Wachovia | | | | | | | | |
| Bank NA) (c)(f) | | | | 3,125 | | | | 3,125 |
| Series Putters 214, 2.53% (Liquidity Facility JPMorgan Chase | | | | | | | | |
| Bank) (c)(f) | | | | 4,995 | | | | 4,995 |
| District of Columbia Rev.: | | | | | | | | |
| Participating VRDN Series PZ 74, 2.57% (Liquidity Facility | | | | | | | | |
| Merrill Lynch & Co., Inc.) (c)(f) | | | | 5,930 | | | | 5,930 |
| (Defenders of Wildlife Proj.) 2.55%, LOC Bank of America | | | | | | | | |
| NA, VRDN (c) | | | | 2,500 | | | | 2,500 |
| (Edmund Burke School Proj.) 2.5%, LOC Bank of America | | | | | | | | |
| NA, VRDN (c) | | | | 7,500 | | | | 7,500 |
| (The AARP Foundation Proj.) Series 2004, 2.5%, LOC Bank | | | | | | | | |
| of America NA, VRDN (c) | | | | 10,000 | | | | 10,000 |
| | | | | | | | | 34,050 |
| |
| Florida – 6.4% | | | | | | | | |
| Broward County Fin. Auth. Multi-family Hsg. Rev.: | | | | | | | | |
| (Pembroke Village Apts. Proj.) 2.52%, LOC ABN AMRO | | | | | | | | |
| Bank NV, LOC Wachovia Bank NA, VRDN (c) | | | | 7,000 | | | | 7,000 |
| (Pier Club Apts. Proj.) 2.52%, LOC ABN AMRO Bank NV, | | | | | | | | |
| LOC Wachovia Bank NA, VRDN (c) | | | | 10,000 | | | | 10,000 |
| Broward County School Board Ctfs. of Prtn. Participating | | | | | | | | |
| VRDN Series DB 150, 2.52% (Liquidity Facility Deutsche | | | | | | | | |
| Bank AG) (c)(f) | | | | 11,730 | | | | 11,730 |
| Collier County School Board Ctfs. of Prtn. Participating VRDN | | | | | | | | |
| Series PT 2277, 2.52% (Liquidity Facility Merrill Lynch & Co., | | | | | | | | |
| Inc.) (c)(f) | | | | 3,910 | | | | 3,910 |
See accompanying notes which are an integral part of the financial statements.
Investments continued
Municipal Securities continued
| | | | | Principal | | Value (Note 1) |
| | | Amount (000s) | | | | (000s) |
| Florida – continued | | | | | | | | |
| Florida Board of Ed. Cap. Outlay Participating VRDN: | | | | | | | | |
| Series EGL 7050031, 2.53% (Liquidity Facility Citibank | | | | | | | | |
| NA) (c)(f) | | $ | | 3,500 | | $ | | 3,500 |
| Series MSDW 00 374, 2.52% (Liquidity Facility Morgan | | | | | | | | |
| Stanley) (c)(f) | | | | 13,665 | | | | 13,665 |
| Series SGA 03 138, 2.4% (Liquidity Facility Societe | | | | | | | | |
| Generale) (c)(f) | | | | 4,100 | | | | 4,100 |
| Florida Board of Ed. Pub. Ed. Participating VRDN Series ROC | | | | | | | | |
| II R7013, 2.53% (Liquidity Facility Citibank NA) (c)(f) | | | | 3,415 | | | | 3,415 |
| Florida Dept. of Envir. Protection Preservation Rev. | | | | | | | | |
| Participating VRDN: | | | | | | | | |
| Series Floaters 722, 2.52% (Liquidity Facility Morgan | | | | | | | | |
| Stanley) (c)(f) | | | | 7,100 | | | | 7,100 |
| Series MS 01 634, 2.52% (Liquidity Facility Morgan | | | | | | | | |
| Stanley) (c)(f) | | | | 16,370 | | | | 16,370 |
| Florida Dept. of Trans. Tpk. Rev. Participating VRDN Series MS | | | | | | | | |
| 1128, 2.52% (Liquidity Facility Morgan Stanley) (c)(f) | | | | 5,000 | | | | 5,000 |
| Florida Gen. Oblig. Participating VRDN: | | | | | | | | |
| Series ROC II 1000, 2.53% (Liquidity Facility Citigroup | | | | | | | | |
| Global Markets Hldgs., Inc.) (c)(f) | | | | 7,525 | | | | 7,525 |
| Series ROC II R4070, 2.53% (Liquidity Facility Citigroup | | | | | | | | |
| Global Markets Hldgs., Inc.) (c)(f) | | | | 12,920 | | | | 12,920 |
| Florida Hsg. Fin. Agcy. (Town Colony II Proj.) Series 1985 EE, | | | | | | | | |
| 2.41%, LOC Cr. Suisse, VRDN (c) | | | | 10,400 | | | | 10,400 |
| Florida Local Govt. Fin. Auth. Rev. Series A, 2.75% 9/8/05, | | | | | | | | |
| LOC Wachovia Bank NA, CP | | | | 4,806 | | | | 4,806 |
| Florida State Univ., Finl. Assistance, Inc., Edl. & Athletic | | | | | | | | |
| Facilities Impt. Rev. Participating VRDN Series SGB 44, | | | | | | | | |
| 2.53% (Liquidity Facility Societe Generale) (c)(f) | | | | 1,920 | | | | 1,920 |
| Lee County Hosp. Board of Directors Hosp. Rev. (Lee Memorial | | | | | | | | |
| Health Sys. Proj.) Series 1992 B, 2.4%, VRDN (c) | | | | 22,000 | | | | 22,000 |
| Lee Memorial Health Sys. Board of Directors Hosp. Rev. | | | | | | | | |
| Participating VRDN Series PA 1026R, 2.52% (Liquidity | | | | | | | | |
| Facility Merrill Lynch & Co., Inc.) (c)(f) | | | | 1,620 | | | | 1,620 |
| Martin County Poll. Cont. Rev. (Florida Pwr. & Lt. Co. Proj.) | | | | | | | | |
| Series 2000, 2.38%, VRDN (c) | | | | 15,200 | | | | 15,200 |
| Miami Health Facilities Auth. Rev. (Miami Jewish Home and | | | | | | | | |
| Hosp. for the Aged Proj.) 2.36%, LOC Suntrust Bank, | | | | | | | | |
| VRDN (c) | | | | 3,000 | | | | 3,000 |
| Orange County School Board Ctfs. of Prtn. Participating VRDN | | | | | | | | |
| Series ROC II R7501, 2.53% (Liquidity Facility Citibank | | | | | | | | |
| NA) (c)(f) | | | | 4,170 | | | | 4,170 |
See accompanying notes which are an integral part of the financial statements.
| Municipal Securities continued | | | | | | | | |
| | | | | Principal | | Value (Note 1) |
| | | Amount (000s) | | | | (000s) |
| Florida – continued | | | | | | | | |
| Orlando Utils. Commission Wtr. & Elec. Rev. Participating | | | | | | | | |
| VRDN Series PT 2372, 2.51% (Liquidity Facility Dexia Cr. | | | | | | | | |
| Local de France) (c)(f) | | $ | | 6,095 | | $ | | 6,095 |
| Palm Beach County Hsg. Fin. Auth. Multi-family Hsg. Rev. | | | | | | | | |
| (Emerald Bay Club Apts. Proj.) 2.52%, LOC ABN AMRO | | | | | | | | |
| Bank NV, LOC Wachovia Bank NA, VRDN (c) | | | | 6,500 | | | | 6,500 |
| Palm Beach County School District: | | | | | | | | |
| 2.4% 9/6/05, LOC Bank of America NA, CP | | | | 14,500 | | | | 14,500 |
| 2.4% 9/6/05, LOC Bank of America NA, CP | | | | 4,100 | | | | 4,100 |
| Polk County Util. Sys. Rev. Participating VRDN Series EGL | | | | | | | | |
| 720050022, 2.53% (Liquidity Facility Citibank NA) (c)(f) | | | | 9,705 | | | | 9,705 |
| Putnam County Dev. Auth. Poll. Cont. Rev. (Seminole Elec. | | | | | | | | |
| Coop., Inc. Proj.) Series 1984 S, 2.65% (Nat’l. Rural Utils. | | | | | | | | |
| Coop. Fin. Corp. Guaranteed), VRDN (c) | | | | 3,075 | | | | 3,075 |
| Santa Rosa County Health Facilities Rev. (Baptists Hosp., Inc. | | | | | | | | |
| Proj.) 2.5%, LOC Bank of America NA, VRDN (c) | | | | 7,000 | | | | 7,000 |
| Tampa Bay Wtr. Util. Sys. Rev. Participating VRDN Series MS | | | | | | | | |
| 98 112, 2.52% (Liquidity Facility Morgan Stanley) (c)(f) | | | | 5,745 | | | | 5,745 |
| Univ. of North Florida Foundation, Inc. Rev. 2.53%, LOC | | | | | | | | |
| Wachovia Bank NA, VRDN (c) | | | | 3,000 | | | | 3,000 |
| Volusia County Health Facilities Auth. Rev. Participating VRDN | | | | | | | | |
| Series MT 151, 2.52% (Liquidity Facility Landesbank | | | | | | | | |
| Hessen-Thuringen) (c)(f) | | | | 9,700 | | | | 9,700 |
| Volusia County School Board Ctfs. of Prtn. Participating VRDN | | | | | | | | |
| Series Putters 970, 2.53% (Liquidity Facility JPMorgan Chase | | | | | | | | |
| & Co.) (c)(f) | | | | 4,200 | | | | 4,200 |
| | | | | | | | | 242,971 |
| |
| Georgia – 2.7% | | | | | | | | |
| Atlanta Wtr. & Wastewtr. Rev. Participating VRDN Series | | | | | | | | |
| Putters 513, 2.53% (Liquidity Facility PNC Bank NA, | | | | | | | | |
| Pittsburgh) (c)(f) | | | | 14,125 | | | | 14,125 |
| Cobb County Dev. Auth. Univ. Facilities Rev. Participating | | | | | | | | |
| VRDN Series Putters 580, 2.53% (Liquidity Facility JPMorgan | | | | | | | | |
| Chase & Co.) (c)(f) | | | | 3,285 | | | | 3,285 |
| DeKalb County Dev. Auth. Rev. (Marcus Institute Proj.) 2.5%, | | | | | | | | |
| LOC Bank of America NA, VRDN (c) | | | | 10,440 | | | | 10,440 |
| DeKalb County Hosp. Auth. Rev. (DeKalb Med. Ctr. Proj.) | | | | | | | | |
| 2.36%, LOC Suntrust Bank, VRDN (c) | | | | 13,000 | | | | 13,000 |
| DeKalb County Hsg. Auth. Multi-family Hsg. Rev. (Lenox Pointe | | | | | | | | |
| Proj.) Series 1996 A, 2.59%, LOC Southtrust Bank NA, | | | | | | | | |
| VRDN (c) | | | | 10,705 | | | | 10,705 |
| Floyd County Dev. Auth. Rev. (Darlington School Proj.) Series | | | | | | | | |
| 2000, 2.59%, LOC Suntrust Bank, VRDN (c) | | | | 16,400 | | | | 16,400 |
See accompanying notes which are an integral part of the financial statements.
11 Annual Report
| Investments continued | | | | | | | | |
| |
| |
| Municipal Securities continued | | | | | | | | |
| | | | | Principal | | Value (Note 1) |
| | | Amount (000s) | | | | (000s) |
| Georgia – continued | | | | | | | | |
| Georgia Gen. Oblig. Participating VRDN Series MS 1034, | | | | | | | | |
| 2.52% (Liquidity Facility Morgan Stanley) (c)(f) | | $ | | 2,358 | | $ | | 2,358 |
| Georgia Muni. Elec. Auth. Pwr. Rev. Participating VRDN Series | | | | | | | | |
| SG 40, 2.53% (Liquidity Facility Societe Generale) (c)(f) | | | | 14,610 | | | | 14,610 |
| Georgia Road & Thruway Auth. Rev. Participating VRDN | | | | | | | | |
| Series PT 2019, 2.53% (Liquidity Facility Merrill Lynch & Co., | | | | | | | | |
| Inc.) (c)(f) | | | | 5,010 | | | | 5,010 |
| Gwinnett County Wtr. & Swr. Auth. Rev. Participating VRDN | | | | | | | | |
| Series Floaters 01 675, 2.52% (Liquidity Facility Morgan | | | | | | | | |
| Stanley) (c)(f) | | | | 5,900 | | | | 5,900 |
| Putnam County Dev. Auth. Poll. Cont. Rev. Bonds (Georgia | | | | | | | | |
| Pwr. Co. Plant Proj.) First Series 1997, 2.83%, tender | | | | | | | | |
| 5/5/06 (c) | | | | 6,800 | | | | 6,800 |
| | | | | | | | | 102,633 |
| |
| Hawaii – 0.3% | | | | | | | | |
| Hawaii Gen. Oblig. Participating VRDN Series PT 960, 2.53% | | | | | | | | |
| (Liquidity Facility BNP Paribas SA) (c)(f) | | | | 5,900 | | | | 5,900 |
| Honolulu City & County Gen. Oblig. Participating VRDN | | | | | | | | |
| Series PT 2143, 2.53% (Liquidity Facility Merrill Lynch & Co., | | | | | | | | |
| Inc.) (c)(f) | | | | 4,470 | | | | 4,470 |
| | | | | | | | | 10,370 |
| |
| Illinois – 12.3% | | | | | | | | |
| Champaign County Cmnty. Unit School District #116 Urbana | | | | | | | | |
| Participating VRDN Series Floaters 01 669, 2.52% (Liquidity | | | | | | | | |
| Facility Morgan Stanley) (c)(f) | | | | 7,105 | | | | 7,105 |
| Champaign County Gen. Oblig. Participating VRDN | | | | | | | | |
| Series Putters 887, 2.53% (Liquidity Facility JPMorgan | | | | | | | | |
| Chase & Co.) (c)(f) | | | | 5,465 | | | | 5,465 |
| Chicago Board of Ed. Participating VRDN: | | | | | | | | |
| Series AAB 03 16, 2.41% (Liquidity Facility ABN AMRO | | | | | | | | |
| Bank NV) (c)(f) | | | | 9,995 | | | | 9,995 |
| Series BA 96 BB, 2.59% (Liquidity Facility Bank of America | | | | | | | | |
| NA) (c)(f) | | | | 11,100 | | | | 11,100 |
| Series Merlots 97 E, 2.4% (Liquidity Facility Wachovia Bank | | | | | | | | |
| NA) (c)(f) | | | | 3,125 | | | | 3,125 |
| Series MS 01 566, 2.52% (Liquidity Facility Morgan | | | | | | | | |
| Stanley) (c)(f) | | | | 5,000 | | | | 5,000 |
| Series PT 2931, 2.53% (Liquidity Facility Dexia Cr. Local de | | | | | | | | |
| France) (c)(f) | | | | 11,965 | | | | 11,965 |
| Series Putters 199, 2.53% (Liquidity Facility JPMorgan | | | | | | | | |
| Chase Bank) (c)(f) | | | | 10,610 | | | | 10,610 |
| Series SGA 98, 2.41% (Liquidity Facility Societe | | | | | | | | |
| Generale) (c)(f) | | | | 7,820 | | | | 7,820 |
See accompanying notes which are an integral part of the financial statements.
| Municipal Securities continued | | | | | | | | |
| | | | | Principal | | Value (Note 1) |
| | | Amount (000s) | | | | (000s) |
| Illinois – continued | | | | | | | | |
| Chicago Gen. Oblig. Participating VRDN: | | | | | | | | |
| Series Merlots 00 A12, 2.4% (Liquidity Facility Wachovia | | | | | | | | |
| Bank NA) (c)(f) | | $ | | 2,715 | | $ | | 2,715 |
| Series Merlots B24, 2.4% (Liquidity Facility Wachovia Bank | | | | | | | | |
| NA) (c)(f) | | | | 1,995 | | | | 1,995 |
| Series MS 1026, 2.52% (Liquidity Facility Morgan | | | | | | | | |
| Stanley) (c)(f) | | | | 5,000 | | | | 5,000 |
| Series PT 2357, 2.53% (Liquidity Facility Dexia Cr. Local de | | | | | | | | |
| France) (c)(f) | | | | 5,735 | | | | 5,735 |
| Series TOC 05 O, 2.52% (Liquidity Facility Goldman Sachs | | | | | | | | |
| Group, Inc.) (c)(f) | | | | 7,370 | | | | 7,370 |
| Series TOC 05 Z10, 2.57% (Liquidity Facility Goldman | | | | | | | | |
| Sachs Group, Inc.) (c)(f) | | | | 3,050 | | | | 3,050 |
| Chicago Midway Arpt. Rev. Participating VRDN Series Putters | | | | | | | | |
| 229, 2.53% (Liquidity Facility JPMorgan Chase Bank) (c)(f) . | | | | 5,680 | | | | 5,680 |
| Chicago Park District Participating VRDN: | | | | | | | | |
| Series Putters 521, 2.53% (Liquidity Facility JPMorgan Chase | | | | | | | | |
| Bank) (c)(f) | | | | 5,690 | | | | 5,690 |
| Series Putters 710, 2.53% (Liquidity Facility JPMorgan Chase | | | | | | | | |
| Bank) (c)(f) | | | | 6,310 | | | | 6,310 |
| Chicago Pub. Bldg. Commission Bldg. Rev. Participating VRDN | | | | | | | | |
| Series EGL 03 15, 2.53% (Liquidity Facility Citibank NA, | | | | | | | | |
| New York) (c)(f) | | | | 2,800 | | | | 2,800 |
| Chicago Sales Tax Rev. Participating VRDN Series DB 153, | | | | | | | | |
| 2.53% (Liquidity Facility Deutsche Bank AG) (c)(f) | | | | 16,250 | | | | 16,250 |
| Chicago Wastewtr. Transmission Rev. Participating VRDN | | | | | | | | |
| Series PT 2312, 2.53% (Liquidity Facility Merrill Lynch & Co., | | | | | | | | |
| Inc.) (c)(f) | | | | 7,685 | | | | 7,685 |
| Chicago Wtr. Rev. Participating VRDN: | | | | | | | | |
| Series Merlots 00 TT, 2.4% (Liquidity Facility Wachovia Bank | | | | | | | | |
| NA) (c)(f) | | | | 4,600 | | | | 4,600 |
| Series Merlots 97 V, 2.4% (Liquidity Facility Wachovia Bank | | | | | | | | |
| NA) (c)(f) | | | | 4,660 | | | | 4,660 |
| Series MS 01 560, 2.52% (Liquidity Facility Morgan | | | | | | | | |
| Stanley) (c)(f) | | | | 12,000 | | | | 12,000 |
| Cook County Gen. Oblig. Participating VRDN: | | | | | | | | |
| Series EGL 01 1302, 2.53% (Liquidity Facility Citibank NA, | | | | | | | | |
| New York) (c)(f) | | | | 16,850 | | | | 16,850 |
| Series PT 2574, 2.53% (Liquidity Facility Merrill Lynch & Co., | | | | | | | | |
| Inc.) (c)(f) | | | | 5,395 | | | | 5,395 |
| Series Putters 766, 2.53% (Liquidity Facility JPMorgan Chase | | | | | | | | |
| Bank) (c)(f) | | | | 5,395 | | | | 5,395 |
| Hoffman Estates Tax Increment Rev. (Sears, Roebuck & Co. | | | | | | | | |
| Proj.) 2.51%, LOC Northern Trust Co., Chicago, VRDN (c) | | | | 11,600 | | | | 11,600 |
| See accompanying notes which are an integral part of the financial statements. | | | | |
| |
| 13 | | | | | | Annual Report |
| Investments continued | | | | | | | | |
| |
| |
| Municipal Securities continued | | | | | | | | |
| | | | | Principal | | Value (Note 1) |
| | | Amount (000s) | | | | (000s) |
| Illinois – continued | | | | | | | | |
| Illinois Dev. Fin. Auth. Gas Supply Rev. Participating VRDN | | | | | | | | |
| Series PA 1166, 2.53% (Liquidity Facility Merrill Lynch & | | | | | | | | |
| Co., Inc.) (c)(f) | | $ | | 10,805 | | $ | | 10,805 |
| Illinois Edl. Facilities Auth. Revs. Participating VRDN Series | | | | | | | | |
| Merlots 97 U, 2.4% (Liquidity Facility Wachovia Bank | | | | | | | | |
| NA) (c)(f) | | | | 4,535 | | | | 4,535 |
| Illinois Fin. Auth. Rev. (Central DuPage Hosp. Proj.) Series | | | | | | | | |
| 2004 C, 2.52%, VRDN (c) | | | | 24,700 | | | | 24,700 |
| Illinois Gen. Oblig. Participating VRDN: | | | | | | | | |
| Series EGL 00 1304, 2.53% (Liquidity Facility Citibank NA, | | | | | | | | |
| New York) (c)(f) | | | | 2,600 | | | | 2,600 |
| Series EGL 01 1307, 2.53% (Liquidity Facility Citibank NA, | | | | | | | | |
| New York) (c)(f) | | | | 10,675 | | | | 10,675 |
| Series MS 1024, 2.52% (Liquidity Facility Morgan | | | | | | | | |
| Stanley) (c)(f) | | | | 13,545 | | | | 13,545 |
| Series MS 98 143, 2.52% (Liquidity Facility Morgan | | | | | | | | |
| Stanley) (c)(f) | | | | 13,560 | | | | 13,560 |
| Series PT 01 1760, 2.53% (Liquidity Facility BNP Paribas | | | | | | | | |
| SA) (c)(f) | | | | 5,420 | | | | 5,420 |
| Series PT 1975, 2.53% (Liquidity Facility Merrill Lynch & Co., | | | | | | | | |
| Inc.) (c)(f) | | | | 4,070 | | | | 4,070 |
| Series Putters 133, 2.53% (Liquidity Facility JPMorgan Chase | | | | | | | | |
| & Co.) (c)(f) | | | | 19,450 | | | | 19,450 |
| Series Putters 568, 2.53% (Liquidity Facility JPMorgan Chase | | | | | | | | |
| & Co.) (c)(f) | | | | 6,325 | | | | 6,325 |
| Series Putters 605, 2.53% (Liquidity Facility JPMorgan Chase | | | | | | | | |
| Bank) (c)(f) | | | | 1,895 | | | | 1,895 |
| Series Putters 660, 2.53% (Liquidity Facility JPMorgan Chase | | | | | | | | |
| Bank) (c)(f) | | | | 1,495 | | | | 1,495 |
| Series Putters 687, 2.53% (Liquidity Facility JPMorgan Chase | | | | | | | | |
| Bank) (c)(f) | | | | 2,995 | | | | 2,995 |
| Illinois Health Facilities Auth. Rev. Participating VRDN: | | | | | | | | |
| Series PA 1217, 2.53% (Liquidity Facility Merrill Lynch & | | | | | | | | |
| Co., Inc.) (c)(f) | | | | 6,375 | | | | 6,375 |
| Series PT 763, 2.53% (Liquidity Facility Landesbank | | | | | | | | |
| Hessen-Thuringen) (c)(f) | | | | 20,195 | | | | 20,195 |
| Illinois Reg’l. Trans. Auth. Participating VRDN: | | | | | | | | |
| Series BA 03 C, 2.57% (Liquidity Facility Bank of America | | | | | | | | |
| NA) (c)(f) | | | | 7,045 | | | | 7,045 |
| Series EGL 01 1306, 2.53% (Liquidity Facility Citibank NA, | | | | | | | | |
| New York) (c)(f) | | | | 19,275 | | | | 19,275 |
| Series Merlots 01 A73, 2.4% (Liquidity Facility Wachovia | | | | | | | | |
| Bank NA) (c)(f) | | | | 4,920 | | | | 4,920 |
See accompanying notes which are an integral part of the financial statements.
Annual Report
| Municipal Securities continued | | | | | | | | |
| | | | | Principal | | Value (Note 1) |
| | | Amount (000s) | | | | (000s) |
| Illinois – continued | | | | | | | | |
| Illinois Reg’l. Trans. Auth. Participating VRDN: – continued | | | | | | | | |
| Series Merlots 02 A24, 2.4% (Liquidity Facility Wachovia | | | | | | | | |
| Bank NA) (c)(f) | | $ | | 9,940 | | $ | | 9,940 |
| Series MSTC 9044, 2.41% (Liquidity Facility Bear Stearns | | | | | | | | |
| Companies, Inc.) (c)(f) | | | | 7,355 | | | | 7,355 |
| Illinois Sales Tax Rev. Participating VRDN Series ROC II | | | | | | | | |
| R4516, 2.53% (Liquidity Facility Citigroup Global Markets | | | | | | | | |
| Hldgs., Inc.) (c)(f) | | | | 4,490 | | | | 4,490 |
| Kane & DeKalb Counties Cmnty. Unit School District #302 | | | | | | | | |
| Participating VRDN Series Putters 283, 2.53% (Liquidity | | | | | | | | |
| Facility JPMorgan Chase Bank) (c)(f) | | | | 3,240 | | | | 3,240 |
| Kane & DuPage Counties Cmnty. Unit School District #303, | | | | | | | | |
| Saint Charles Participating VRDN Series Putters 824, 2.53% | | | | | | | | |
| (Liquidity Facility JPMorgan Chase Bank) (c)(f) | | | | 3,780 | | | | 3,780 |
| Kane, McHenry, Cook & DeKalb Counties Cmnty. Unit School | | | | | | | | |
| District #300 Carpentersville Participating VRDN Series EGL | | | | | | | | |
| 00 1310, 2.53% (Liquidity Facility Citibank NA, New | | | | | | | | |
| York) (c)(f) | | | | 14,850 | | | | 14,850 |
| Lake County Forest Preservation District Participating VRDN | | | | | | | | |
| Series ROC II R2059, 2.53% (Liquidity Facility Citigroup | | | | | | | | |
| Global Markets Hldgs., Inc.) (c)(f) | | | | 2,044 | | | | 2,044 |
| Maywood Gen. Oblig. Participating VRDN Series PT 2537, | | | | | | | | |
| 2.53% (Liquidity Facility Merrill Lynch & Co., Inc.) (c)(f) | | | | 5,820 | | | | 5,820 |
| Metropolitan Pier & Exposition Auth. Dedicated State Tax Rev. | | | | | | | | |
| Participating VRDN: | | | | | | | | |
| Series EGL 02 6001, 2.53% (Liquidity Facility Citibank NA, | | | | | | | | |
| New York) (c)(f) | | | | 5,400 | | | | 5,400 |
| Series EGL 2004 30, Class A, 2.53% (Liquidity Facility | | | | | | | | |
| Citibank NA) (c)(f) | | | | 4,000 | | | | 4,000 |
| Series PZ 62, 2.57% (Liquidity Facility Merrill Lynch & Co., | | | | | | | | |
| Inc.) (c)(f) | | | | 2,420 | | | | 2,420 |
| Univ. of Illinois Auxiliary Facilities Sys. Rev. Participating | | | | | | | | |
| VRDN: | | | | | | | | |
| Series PT 2620, 2.53% (Liquidity Facility Merrill Lynch & Co., | | | | | | | | |
| Inc.) (c)(f) | | | | 5,215 | | | | 5,215 |
| Series Putters 804, 2.53% (Liquidity Facility Dresdner Bank | | | | | | | | |
| AG) (c)(f) | | | | 5,170 | | | | 5,170 |
| Series SG 65, 2.53% (Liquidity Facility Societe | | | | | | | | |
| Generale) (c)(f) | | | | 5,705 | | | | 5,705 |
| Yorkville Svc. Area 2004-106 Tax (MPI Grande Reserve Proj.) | | | | | | | | |
| 2.51%, LOC Lasalle Bank NA, VRDN (c) | | | | 6,000 | | | | 6,000 |
| | | | | | | | | 468,274 |
See accompanying notes which are an integral part of the financial statements.
15 Annual Report
| Investments continued | | | | | | | | |
| |
| |
| |
| Municipal Securities continued | | | | | | | | |
| | | | | Principal | | Value (Note 1) |
| | | Amount (000s) | | | | (000s) |
| Indiana – 2.4% | | | | | | | | |
| Aurora School Bldg. Corp. Participating VRDN: | | | | | | | | |
| Series PT 2456, 2.53% (Liquidity Facility Merrill Lynch & Co., | | | | | | | | |
| Inc.) (c)(f) | | $ | | 10,415 | | $ | | 10,415 |
| Series Putters 642, 2.53% (Liquidity Facility JPMorgan Chase | | | | | | | | |
| & Co.) (c)(f) | | | | 5,400 | | | | 5,400 |
| Boone County Hosp. Assoc. Lease Rev. Participating VRDN | | | | | | | | |
| Series Putters 908, 2.53% (Liquidity Facility JPMorgan Chase | | | | | | | | |
| & Co.) (c)(f) | | | | 6,120 | | | | 6,120 |
| Carmel School Bldg. Corp. Participating VRDN Series PT 02 | | | | | | | | |
| 1458, 2.53% (Liquidity Facility Merrill Lynch & Co., | | | | | | | | |
| Inc.) (c)(f) | | | | 1,030 | | | | 1,030 |
| Clark Pleasant Cmnty. School Bldg. Corp. Participating VRDN | | �� | | | | | | |
| Series PT 3103, 2.53% (Liquidity Facility Merrill Lynch & Co., | | | | | | | | |
| Inc.) (c)(f) | | | | 6,005 | | | | 6,005 |
| Ctr. Grove School Bldg. Corp. Participating VRDN Series | | | | | | | | |
| Putters 727, 2.53% (Liquidity Facility JPMorgan Chase | | | | | | | | |
| Bank) (c)(f) | | | | 2,470 | | | | 2,470 |
| Dyer Redev. Auth. Econ. Dev. Lease Rent Participating VRDN | | | | | | | | |
| Series DB 139, 2.53% (Liquidity Facility Deutsche Bank | | | | | | | | |
| AG) (c)(f) | | | | 7,480 | | | | 7,480 |
| Franklin Township Independent School Bldg. Corp., Marion | | | | | | | | |
| County Participating VRDN Series PT 3019, 2.53% (Liquidity | | | | | | | | |
| Facility Merrill Lynch & Co., Inc.) (c)(f) | | | | 5,615 | | | | 5,615 |
| Indiana Bond Bank Rev. Participating VRDN Series MSTC 01 | | | | | | | | |
| 177, 2.41% (Liquidity Facility Bear Stearns Companies, | | | | | | | | |
| Inc.) (c)(f) | | | | 13,350 | | | | 13,350 |
| Indiana Health Facilities Fing. Auth. Hosp. Rev.: | | | | | | | | |
| Participating VRDN Series MACN 05 F, 2.53% (Liquidity | | | | | | | | |
| Facility Bank of America NA) (c)(f) | | | | 5,000 | | | | 5,000 |
| (Riverview Hosp. Proj.) 2.51%, LOC Nat’l. City Bank, | | | | | | | | |
| Indiana, VRDN (c) | | | | 5,200 | | | | 5,200 |
| Indiana Trans. Fin. Auth. Hwy. Participating VRDN Series MS | | | | | | | | |
| 942 D, 2.52% (Liquidity Facility Morgan Stanley) (c)(f) | | | | 4,310 | | | | 4,310 |
| Indianapolis Arpt. Auth. Rev. Participating VRDN Series SGA | | | | | | | | |
| 31, 2.41% (Liquidity Facility Societe Generale) (c)(f) | | | | 7,435 | | | | 7,435 |
| Purdue Univ. Rev. Series 2004 S, 2.48%, VRDN (c) | | | | 3,400 | | | | 3,400 |
| Saint Joseph County Health Care Facilities (South Bend Med. | | | | | | | | |
| Foundation Prog.) Series 2000, 2.57%, LOC Nat’l. City | | | | | | | | |
| Bank, Indiana, VRDN (c) | | | | 3,100 | | | | 3,100 |
| Sunman-Dearborn High School Bldg. Corp. Participating | | | | | | | | |
| VRDN Series Putters 671, 2.53% (Liquidity Facility JPMorgan | | | | | | | | |
| Chase & Co.) (c)(f) | | | | 4,990 | | | | 4,990 |
| | | | | | | | | 91,320 |
See accompanying notes which are an integral part of the financial statements.
Annual Report
| Municipal Securities continued | | | | | | | | |
| | | | | Principal | | Value (Note 1) |
| | | Amount (000s) | | | | (000s) |
| Kansas 0.4% | | | | | | | | |
| Kansas Dev. Fin. Auth. Rev. Participating VRDN Series Putters | | | | | | | | |
| 324, 2.53% (Liquidity Facility JPMorgan Chase Bank) (c)(f) . | | $ | | 11,870 | | $ | | 11,870 |
| Wyandotte County-Kansas City Unified Govt. Util. Sys. Rev. | | | | | | | | |
| Participating VRDN Series EGL 04 38, Class A, 2.53% | | | | | | | | |
| (Liquidity Facility Citibank NA) (c)(f) | | | | 4,735 | | | | 4,735 |
| | | | | | | | | 16,605 |
| |
| Kentucky 0.5% | | | | | | | | |
| Clark County Poll. Cont. Rev. Bonds (East Kentucky Pwr. Coop., | | | | | | | | |
| Inc. Proj.) Series J1, 2.6%, tender 10/15/05 (Nat’l. Rural | | | | | | | | |
| Utils. Coop. Fin. Corp. Guaranteed) (c) | | | | 5,955 | | | | 5,955 |
| Kentucky Econ. Dev. Fin. Auth. Hosp. (Highlands Reg’l. Med. | | | | | | | | |
| Ctr. Proj.) Series 1998 A, 2.6%, LOC U.S. Bank NA, | | | | | | | | |
| Minnesota, VRDN (c) | | | | 4,900 | | | | 4,900 |
| Kentucky Property & Bldgs. Commission Revs. Participating | | | | | | | | |
| VRDN Series Putters 740, 2.53% (Liquidity Facility JPMorgan | | | | | | | | |
| Chase Bank) (c)(f) | | | | 4,045 | | | | 4,045 |
| Mason County Poll. Cont. Rev. (East Kentucky Pwr. Coop. Proj.) | | | | | | | | |
| Series 1984 B1, 2.65% (Nat’l. Rural Utils. Coop. Fin. Corp. | | | | | | | | |
| Guaranteed), VRDN (c) | | | | 4,450 | | | | 4,450 |
| | | | | | | | | 19,350 |
| |
| Louisiana – 0.9% | | | | | | | | |
| Louisiana Office Facilities Lease Rev. Participating VRDN | | | | | | | | |
| Series PT 2031, 2.53% (Liquidity Facility Merrill Lynch & Co., | | | | | | | | |
| Inc.) (c)(f) | | | | 5,840 | | | | 5,840 |
| Louisiana Pub. Facilities Auth. Rev. Participating VRDN: | | | | | | | | |
| Series PT 2439, 2.53% (Liquidity Facility Merrill Lynch & Co., | | | | | | | | |
| Inc.) (c)(f) | | | | 6,300 | | | | 6,300 |
| Series Putters 1025Z, 2.53% (Liquidity Facility JPMorgan | | | | | | | | |
| Chase Bank) (c)(f) | | | | 7,495 | | | | 7,495 |
| West Baton Rouge Parish Indl. District #3 Rev.: | | | | | | | | |
| Bonds (Dow Chemical Co. Proj.) Series 1991, 2.8% tender | | | | | | | | |
| 10/17/05, CP mode | | | | 3,400 | | | | 3,400 |
| (Dow Chemical Co. Proj.) Series 1994 B, 2.45%, VRDN (c) . | | | | 10,000 | | | | 10,000 |
| | | | | | | | | 33,035 |
| |
| Maine – 0.1% | | | | | | | | |
| Maine Tpk. Auth. Tpk. Rev. Participating VRDN Series DB 107, | | | | | | | | |
| 2.53% (Liquidity Facility Deutsche Bank AG) (c)(f) | | | | 5,200 | | | | 5,200 |
| Maryland 0.7% | | | | | | | | |
| Baltimore County Poll. Cont. Rev. Bonds (Baltimore Gas & Elec. | | | | | | | | |
| Co. Proj.) Series 1985, 2.75% tender 9/23/05, LOC | | | | | | | | |
| Wachovia Bank NA, CP mode | | | | 3,255 | | | | 3,255 |
See accompanying notes which are an integral part of the financial statements.
17 Annual Report
| Investments continued | | | | | | | | |
| |
| |
| Municipal Securities continued | | | | | | | | |
| | | | | Principal | | Value (Note 1) |
| | | Amount (000s) | | | | (000s) |
| Maryland – continued | | | | | | | | |
| Maryland Cmnty. Dev. Administration Dept. of Hsg. & Cmnty. | | | | | | | | |
| Dev. Participating VRDN Series PT 916, 2.54% (Liquidity | | | | | | | | |
| Facility Merrill Lynch & Co., Inc.) (c)(f) | | $ | | 13,780 | | $ | | 13,780 |
| Maryland Health & Higher Edl. Facilities Auth. Rev. (Kennedy | | | | | | | | |
| Krieger Institute Proj.) Series D, 2.54%, LOC Manufacturers | | | | | | | | |
| & Traders Trust Co., VRDN (c) | | | | 5,329 | | | | 5,329 |
| Ocean City Rev. (Harrison Inn 58 LP Proj.) 2.57%, LOC | | | | | | | | |
| Manufacturers & Traders Trust Co., VRDN (c) | | | | 3,400 | | | | 3,400 |
| | | | | | | | | 25,764 |
| |
| Massachusetts 0.7% | | | | | | | | |
| Massachusetts Bay Trans. Auth. Sales Tax Rev. Participating | | | | | | | | |
| VRDN Series EGL 720050007, 2.52% (Liquidity Facility | | | | | | | | |
| Citibank NA) (c)(f) | | | | 15,000 | | | | 15,000 |
| Massachusetts Gen. Oblig. Participating VRDN: | | | | | | | | |
| Series EGL 04 0005, 2.52% (Liquidity Facility Citibank | | | | | | | | |
| NA) (c)(f) | | | | 8,100 | | | | 8,100 |
| Series MT 127, 2.51% (Liquidity Facility BNP Paribas | | | | | | | | |
| SA) (c)(f) | | | | 5,495 | | | | 5,495 |
| | | | | | | | | 28,595 |
| |
| Michigan – 3.3% | | | | | | | | |
| Clinton Econ. Dev. Corp. Rev. (Clinton Area Care Ctr. Proj.) | | | | | | | | |
| 2.54%, LOC Northern Trust Co., Chicago, VRDN (c) | | | | 5,100 | | | | 5,100 |
| Detroit City School District Participating VRDN: | | | | | | | | |
| Series AAB 04 39, 2.41% (Liquidity Facility ABN AMRO | | | | | | | | |
| Bank NV) (c)(f) | | | | 4,900 | | | | 4,900 |
| Series Putters 388, 2.53% (Liquidity Facility JPMorgan Chase | | | | | | | | |
| Bank) (c)(f) | | | | 3,510 | | | | 3,510 |
| Detroit Swr. Disp. Rev. Participating VRDN Series Merlots 01 | | | | | | | | |
| A112, 2.4% (Liquidity Facility Wachovia Bank NA) (c)(f) | | | | 5,155 | | | | 5,155 |
| Detroit Wtr. Supply Sys. Rev. Participating VRDN Series | | | | | | | | |
| Merlots 00 D, 2.4% (Liquidity Facility Wachovia Bank | | | | | | | | |
| NA) (c)(f) | | | | 2,100 | | | | 2,100 |
| Detroit Wtr. Sys. Rev. Participating VRDN Series EGL 99 2202, | | | | | | | | |
| 2.53% (Liquidity Facility Citibank NA, New York) (c)(f) | | | | 3,900 | | | | 3,900 |
| Forest Hills Pub. Schools Participating VRDN Series PT 1762, | | | | | | | | |
| 2.52% (Liquidity Facility Merrill Lynch & Co., Inc.) (c)(f) | | | | 2,585 | | | | 2,585 |
| Grand Rapids Pub. Schools 2.51%, LOC Fifth Third Bank, | | | | | | | | |
| Cincinnati, VRDN (c) | | | | 1,400 | | | | 1,400 |
| Hudsonville Pub. Schools Participating VRDN Series Putters | | | | | | | | |
| 897, 2.53% (Liquidity Facility JPMorgan Chase Bank) (c)(f) . | | | | 5,760 | | | | 5,760 |
See accompanying notes which are an integral part of the financial statements.
| Municipal Securities continued | | | | | | | | |
| | | | | Principal | | Value (Note 1) |
| | | Amount (000s) | | | | (000s) |
| Michigan – continued | | | | | | | | |
| Jackson County Hosp. Fin. Auth. Hosp. Rev. (W.A. Foote Mem. | | | | | | | | |
| Hosp.) Series 2005 B, 2.51%, LOC Bank of Nova Scotia, | | | | | | | | |
| New York Agcy., VRDN (c) | | $ | | 3,800 | | $ | | 3,800 |
| Macomb County Hosp. Fin. Auth. Rev. (Mount Clemens Gen. | | | | | | | | |
| Hosp. Proj.) Series 2003 A2, 2.49%, LOC Comerica Bank, | | | | | | | | |
| Detroit, VRDN (c) | | | | 8,900 | | | | 8,900 |
| Michigan Bldg. Auth. Rev. Participating VRDN: | | | | | | | | |
| Series MS 907, 2.52% (Liquidity Facility Morgan | | | | | | | | |
| Stanley) (c)(f) | | | | 4,948 | | | | 4,948 |
| Series PT 2234, 2.52% (Liquidity Facility Merrill Lynch & Co., | | | | | | | | |
| Inc.) (c)(f) | | | | 8,230 | | | | 8,230 |
| Series Stars 101, 2.52% (Liquidity Facility BNP Paribas | | | | | | | | |
| SA) (c)(f) | | | | 5,880 | | | | 5,880 |
| Michigan Gen. Oblig. Participating VRDN Series Putters 125, | | | | | | | | |
| 2.53% (Liquidity Facility JPMorgan Chase & Co.) (c)(f) | | | | 8,225 | | | | 8,225 |
| Michigan Hosp. Fin. Auth. Hosp. Rev. (Holland Cmnty. Hosp. | | | | | | | | |
| Proj.) 2.51%, LOC Fifth Third Bank, Cincinnati, VRDN (c) | | | | 3,220 | | | | 3,220 |
| Michigan Muni. Bond Auth. Rev.: | | | | | | | | |
| Participating VRDN Series Stars 141, 2.52% (Liquidity | | | | | | | | |
| Facility BNP Paribas SA) (c)(f) | | | | 3,985 | | | | 3,985 |
| RAN Series 2005 B2, 4% 8/18/06, LOC JPMorgan Chase | | | | | | | | |
| Bank | | | | 20,000 | | | | 20,202 |
| TAN Series 2005 B1, 4% 8/18/06 | | | | 8,500 | | | | 8,590 |
| Michigan Strategic Fund Ltd. Oblig. Rev. (Holland Home | | | | | | | | |
| Oblig. Group Proj.) 2.59%, LOC Huntington Nat’l. Bank, | | | | | | | | |
| Columbus, VRDN (c) | | | | 8,940 | | | | 8,940 |
| Saint Clair County Econ. Dev. Corp. Poll. Cont. Rev. | | | | | | | | |
| Participating VRDN Series MS 00 282, 2.52% (Liquidity | | | | | | | | |
| Facility Morgan Stanley) (c)(f) | | | | 5,000 | | | | 5,000 |
| Southfield Library Bldg. Auth. Participating VRDN Series ROC | | | | | | | | |
| II R7521, 2.53% (Liquidity Facility Citibank NA) (c)(f) | | | | 2,675 | | | | 2,675 |
| | | | | | | | | 127,005 |
| |
| Minnesota 2.0% | | | | | | | | |
| Minneapolis & Saint Paul Hsg. Fin. Board Rev. Participating | | | | | | | | |
| VRDN Series MT 120, 2.54% (Liquidity Facility Landesbank | | | | | | | | |
| Hessen-Thuringen) (c)(f) | | | | 5,160 | | | | 5,160 |
| Minneapolis & Saint Paul Metropolitan Arpts. Commission | | | | | | | | |
| Arpt. Rev. Participating VRDN Series Merlots 00 ZZ, 2.4% | | | | | | | | |
| (Liquidity Facility Wachovia Bank NA) (c)(f) | | | | 3,795 | | | | 3,795 |
| Minneapolis Gen. Oblig. Participating VRDN Series Putters | | | | | | | | |
| 641, 2.53% (Liquidity Facility JPMorgan Chase & Co.) (c)(f) . | | | | 1,320 | | | | 1,320 |
| Minneapolis Rev. Bonds 2.6%, tender 10/14/05 (c) | | | | 7,795 | | | | 7,795 |
See accompanying notes which are an integral part of the financial statements.
19 Annual Report
| Investments continued | | | | | | | | |
| |
| |
| Municipal Securities continued | | | | | | | | |
| | | | | Principal | | Value (Note 1) |
| | | Amount (000s) | | | | (000s) |
| Minnesota – continued | | | | | | | | |
| Minnesota Gen. Oblig. Participating VRDN: | | | | | | | | |
| Series MS 01 719, 2.52% (Liquidity Facility Morgan | | | | | | | | |
| Stanley) (c)(f) | | $ | | 7,300 | | $ | | 7,300 |
| Series PT 2408, 2.52% (Liquidity Facility Dexia Cr. Local de | | | | | | | | |
| France) (c)(f) | | | | 5,620 | | | | 5,620 |
| Minnesota Hsg. Fin. Agcy. Bonds Series 2005 D, 2.9% | | | | | | | | |
| 5/18/06 | | | | 10,760 | | | | 10,760 |
| Rochester Health Care Facilities Rev. Bonds (Mayo | | | | | | | | |
| Foundation/Mayo Med. Ctr. Proj.) Series 2000 A, 2.5% | | | | | | | | |
| tender 9/9/05, CP mode | | | | 8,700 | | | | 8,700 |
| Univ. of Minnesota: | | | | | | | | |
| Series 1999 A, 2.48% (Liquidity Facility Landesbank | | | | | | | | |
| Hessen-Thuringen), VRDN (c) | | | | 18,390 | | | | 18,390 |
| Series 2001 C, 2.48% (Liquidity Facility JPMorgan Chase | | | | | | | | |
| Bank), VRDN (c) | | | | 5,900 | | | | 5,900 |
| | | | | | | | | 74,740 |
| |
| Mississippi – 0.7% | | | | | | | | |
| Mississippi Dev. Bank Spl. Oblig. Participating VRDN Series | | | | | | | | |
| Putters 667, 2.53% (Liquidity Facility JPMorgan Chase & | | | | | | | | |
| Co.) (c)(f) | | | | 3,895 | | | | 3,895 |
| Mississippi Gen. Oblig. Participating VRDN: | | | | | | | | |
| Series EGL 99 2401, 2.53% (Liquidity Facility Citibank NA, | | | | | | | | |
| New York) (c)(f) | | | | 3,600 | | | | 3,600 |
| Series Putters 138, 2.53% (Liquidity Facility JPMorgan Chase | | | | | | | | |
| & Co.) (c)(f) | | | | 9,945 | | | | 9,945 |
| Univ. of Mississippi Edl. Bldg. Corp. Rev. (Campus Impt. Proj.) | | | | | | | | |
| Series 2000 A, 2.52% (MBIA Insured), VRDN (c) | | | | 7,600 | | | | 7,600 |
| | | | | | | | | 25,040 |
| |
| Missouri – 0.1% | | | | | | | | |
| Missouri Health & Edl. Facilities Auth. Rev. Participating VRDN | | | | | | | | |
| Series PA 1049, 2.53% (Liquidity Facility Merrill Lynch & | | | | | | | | |
| Co., Inc.) (c)(f) | | | | 5,110 | | | | 5,110 |
| Nebraska – 0.6% | | | | | | | | |
| Douglas County School District #1 Participating VRDN Series | | | | | | | | |
| ROC II R4058, 2.53% (Liquidity Facility Citigroup Global | | | | | | | | |
| Markets Hldgs., Inc.) (c)(f) | | | | 7,360 | | | | 7,360 |
| Nebraska Pub. Pwr. District Rev. Participating VRDN Series | | | | | | | | |
| EGL 04 14, 2.53% (Liquidity Facility Citibank NA) (c)(f) | | | | 3,200 | | | | 3,200 |
See accompanying notes which are an integral part of the financial statements.
| Municipal Securities continued | | | | | | | | |
| | | | | Principal | | Value (Note 1) |
| | | Amount (000s) | | | | (000s) |
| Nebraska – continued | | | | | | | | |
| Omaha Convention Hotel Corp. Participating VRDN Series PA | | | | | | | | |
| 1078, 2.54% (Liquidity Facility Merrill Lynch & Co., | | | | | | | | |
| Inc.) (c)(f) | | $ | | 4,995 | | $ | | 4,995 |
| Omaha Gen. Oblig. Participating VRDN Series EGL 00 2701, | | | | | | | | |
| 2.53% (Liquidity Facility Citibank NA, New York) (c)(f) | | | | 8,265 | | | | 8,265 |
| | | | | | | | | 23,820 |
| |
| Nevada 0.9% | | | | | | | | |
| Clark County Gen. Oblig. Participating VRDN: | | | | | | | | |
| Series AAB 01 25, 2.42% (Liquidity Facility ABN AMRO | | | | | | | | |
| Bank NV) (c)(f) | | | | 19,505 | | | | 19,505 |
| Series ROC II R1035, 2.53% (Liquidity Facility Citigroup | | | | | | | | |
| Global Markets Hldgs., Inc.) (c)(f) | | | | 2,975 | | | | 2,975 |
| Clark County School District Participating VRDN Series PT | | | | | | | | |
| 1721, 2.53% (Liquidity Facility Merrill Lynch & Co., | | | | | | | | |
| Inc.) (c)(f) | | | | 5,540 | | | | 5,540 |
| Nevada Gen. Oblig. Participating VRDN Series SGB 31, | | | | | | | | |
| 2.53% (Liquidity Facility Societe Generale) (c)(f) | | | | 6,000 | | | | 6,000 |
| | | | | | | | | 34,020 |
| |
| New Hampshire – 0.1% | | | | | | | | |
| New Hampshire Health & Ed. Facilities Auth. Rev. (Riverwoods | | | | | | | | |
| at Exeter Proj.) 2.44%, LOC Fleet Nat’l. Bank, VRDN (c) | | | | 3,090 | | | | 3,090 |
| New Jersey – 2.2% | | | | | | | | |
| Casino Reinvestment Dev. Auth. Rev. Participating VRDN | | | | | | | | |
| Series Merlots 05 A3, 2.39% (Liquidity Facility Wachovia | | | | | | | | |
| Bank NA) (c)(f) | | | | 4,820 | | | | 4,820 |
| New Jersey Econ. Dev. Auth. Rev. Participating VRDN Series | | | | | | | | |
| EGL 720050002 Class A, 2.52% (Liquidity Facility Citibank | | | | | | | | |
| NA) (c)(f) | | | | 5,400 | | | | 5,400 |
| New Jersey Gen. Oblig. Participating VRDN Series PT 2509, | | | | | | | | |
| 2.52% (Liquidity Facility Dexia Cr. Local de France) (c)(f) | | | | 11,840 | | | | 11,840 |
| New Jersey Tpk. Auth. Tpk. Rev. Participating VRDN: | | | | | | | | |
| Series EGL 03 41, 2.52% (Liquidity Facility Citibank NA, | | | | | | | | |
| New York) (c)(f) | | | | 4,100 | | | | 4,100 |
| Series PT 2843, 2.52% (Liquidity Facility Dexia Cr. Local de | | | | | | | | |
| France) (c)(f) | | | | 5,800 | | | | 5,800 |
| Series ROC II R7012, 2.52% (Liquidity Facility Citibank | | | | | | | | |
| NA) (c)(f) | | | | 17,000 | | | | 17,000 |
| New Jersey Trans. Trust Fund Auth. Participating VRDN: | | | | | | | | |
| Series EGL 20030034 Class A, 2.52% (Liquidity Facility | | | | | | | | |
| Citibank NA, New York) (c)(f) | | | | 3,500 | | | | 3,500 |
| Series MS 00 224, 2.51% (Liquidity Facility Morgan | | | | | | | | |
| Stanley) (c)(f) | | | | 9,000 | | | | 9,000 |
See accompanying notes which are an integral part of the financial statements.
Annual Report
| Investments continued | | | | | | | | |
| |
| |
| Municipal Securities continued | | | | | | | | |
| | | | | Principal | | Value (Note 1) |
| | | Amount (000s) | | | | (000s) |
| New Jersey – continued | | | | | | | | |
| New Jersey Trans. Trust Fund Auth. Participating VRDN: - | | | | | | | | |
| continued | | | | | | | | |
| Series PA 958P, 2.52% (Liquidity Facility Merrill Lynch & Co., | | | | | | | | |
| Inc.) (c)(f) | | $ | | 1,000 | | $ | | 1,000 |
| Series PT 2402, 2.52% (Liquidity Facility Dexia Cr. Local de | | | | | | | | |
| France) (c)(f) | | | | 22,590 | | | | 22,590 |
| | | | | | | | | 85,050 |
| |
| New Jersey/Pennsylvania – 0.1% | | | | | | | | |
| Delaware River Port Auth. Pennsylvania & New Jersey Rev. | | | | | | | | |
| Participating VRDN Series PA 606, 2.52% (Liquidity Facility | | | | | | | | |
| Merrill Lynch & Co., Inc.) (c)(f) | | | | 4,000 | | | | 4,000 |
| New Mexico – 0.1% | | | | | | | | |
| Rio Rancho Wtr. & Wastewtr. Sys. Rev. Participating VRDN | | | | | | | | |
| Series Putters 953, 2.53% (Liquidity Facility JPMorgan Chase | | | | | | | | |
| & Co.) (c)(f) | | | | 5,495 | | | | 5,495 |
| New York – 5.1% | | | | | | | | |
| Erie County Gen. Oblig. RAN 3.75% 7/13/06, LOC | | | | | | | | |
| JPMorgan Chase Bank | | | | 8,400 | | | | 8,467 |
| Long Island Pwr. Auth. Elec. Sys. Rev. Participating VRDN: | | | | | | | | |
| Series PA 522, 2.52% (Liquidity Facility Merrill Lynch & Co., | | | | | | | | |
| Inc.) (c)(f) | | | | 10,600 | | | | 10,600 |
| Series PA 996, 2.52% (Liquidity Facility Merrill Lynch & Co., | | | | | | | | |
| Inc.) (c)(f) | | | | 4,900 | | | | 4,900 |
| New York City Gen. Oblig.: | | | | | | | | |
| Bonds: | | | | | | | | |
| Series 2004 E, 3% 11/1/05 | | | | 6,180 | | | | 6,184 |
| Series 2004 F, 3% 11/1/05 | | | | 3,900 | | | | 3,902 |
| Participating VRDN: | | | | | | | | |
| Series PT 962, 2.52% (Liquidity Facility Landesbank | | | | | | | | |
| Hessen-Thuringen) (c)(f) | | | | 16,405 | | | | 16,405 |
| Series ROC II R251, 2.56% (Citigroup Global Markets | | | | | | | | |
| Hldgs., Inc. Guaranteed) (Liquidity Facility Citigroup | | | | | | | | |
| Global Markets Hldgs., Inc.) (c)(f) | | | | 8,000 | | | | 8,000 |
| New York City Indl. Dev. Agcy. Rev. (One Bryant Park LLC | | | | | | | | |
| Proj.) Series A, 2.4%, LOC Bank of America NA, LOC Bank | | | | | | | | |
| of New York, New York, VRDN (c) | | | | 9,500 | | | | 9,500 |
| New York City Muni. Wtr. Fin. Auth. Wtr. & Swr. Sys. Rev. | | | | | | | | |
| Participating VRDN: | | | | | | | | |
| Series EGL 04 15, 2.52% (Liquidity Facility Citibank | | | | | | | | |
| NA) (c)(f) | | | | 10,000 | | | | 10,000 |
| Series EGL 04 27 Class A, 2.52% (Liquidity Facility Citibank | | | | | | | | |
| NA) (c)(f) | | | | 8,485 | | | | 8,485 |
See accompanying notes which are an integral part of the financial statements.
Annual Report
| Municipal Securities continued | | | | | | | | |
| | | | | Principal | | Value (Note 1) |
| | | Amount (000s) | | | | (000s) |
| New York – continued | | | | | | | | |
| New York City Muni. Wtr. Fin. Auth. Wtr. & Swr. Sys. Rev. | | | | | | | | |
| Participating VRDN: – continued | | | | | | | | |
| Series EGL 04 36 Class A, 2.52% (Liquidity Facility Citibank | | | | | | | | |
| NA) (c)(f) | | $ | | 6,500 | | $ | | 6,500 |
| New York Local Govt. Assistance Corp. Participating VRDN | | | | | | | | |
| Series SG 99, 2.52% (Liquidity Facility Societe | | | | | | | | |
| Generale) (c)(f) | | | | 15,500 | | | | 15,500 |
| New York State Dorm. Auth. Revs. Participating VRDN: | | | | | | | | |
| Series PA 1196, 2.52% (Liquidity Facility Merrill Lynch & | | | | | | | | |
| Co., Inc.) (c)(f) | | | | 5,795 | | | | 5,795 |
| Series PA 1265, 2.52% (Liquidity Facility Merrill Lynch & | | | | | | | | |
| Co., Inc.) (c)(f) | | | | 10,000 | | | | 10,000 |
| Series PT 746, 2.52% (Liquidity Facility Merrill Lynch & Co., | | | | | | | | |
| Inc.) (c)(f) | | | | 4,500 | | | | 4,500 |
| New York State Envir. Facilities Corp. Clean Wtr. & Drinking | | | | | | | | |
| Wtr. Rev. Participating VRDN Series PT 2012, 2.52% | | | | | | | | |
| (Liquidity Facility Merrill Lynch & Co., Inc.) (c)(f) | | | | 5,195 | | | | 5,195 |
| New York State Pwr. Auth. & Gen. Purp. Rev. Series 1997 2, | | | | | | | | |
| 2.5% 9/1/05, CP | | | | 13,200 | | | | 13,200 |
| New York State Urban Dev. Corp. Rev. Participating VRDN | | | | | | | | |
| Series EGL 03 57, 2.52% (Liquidity Facility Citibank NA, | | | | | | | | |
| New York) (c)(f) | | | | 9,880 | | | | 9,880 |
| Sales Tax Asset Receivables Corp. Participating VRDN Series | | | | | | | | |
| EGL 04 48 Class A, 2.52% (Liquidity Facility Citibank | | | | | | | | |
| NA) (c)(f) | | | | 9,400 | | | | 9,400 |
| Triborough Bridge & Tunnel Auth. Revs. Participating VRDN: | | | | | | | | |
| Series EGL 02 6011, 2.52% (Liquidity Facility Citibank NA, | | | | | | | | |
| New York) (c)(f) | | | | 7,200 | | | | 7,200 |
| Series EGL 03 4, Class A, 2.52% (Liquidity Facility Citibank | | | | | | | | |
| NA, New York) (c)(f) | | | | 10,700 | | | | 10,700 |
| Series EGL 03 55, 2.52% (Liquidity Facility Citibank NA, | | | | | | | | |
| New York) (c)(f) | | | | 10,000 | | | | 10,000 |
| | | | | | | | | 194,313 |
| |
| New York & New Jersey – 0.2% | | | | | | | | |
| Port Auth. of New York & New Jersey Participating VRDN | | | | | | | | |
| Series EGL 03 59, 2.52% (Liquidity Facility Citibank NA, | | | | | | | | |
| New York) (c)(f) | | | | 7,870 | | | | 7,870 |
| Non State Specific 0.1% | | | | | | | | |
| Clipper Tax-Exempt Ctfs. Trust Participating VRDN Series | | | | | | | | |
| Clipper 05 7, 2.61% (Liquidity Facility State Street Bank & | | | | | | | | |
| Trust Co., Boston) (c)(f) | | | | 3,600 | | | | 3,600 |
See accompanying notes which are an integral part of the financial statements.
Annual Report
| Investments continued | | | | | | | | |
| |
| |
| |
| Municipal Securities continued | | | | | | | | |
| | | | | Principal | | Value (Note 1) |
| | | Amount (000s) | | | | (000s) |
| North Carolina – 2.3% | | | | | | | | |
| Charlotte Ctfs. of Prtn. Participating VRDN Series ROC II | | | | | | | | |
| R4056, 2.53% (Liquidity Facility Citigroup Global Markets | | | | | | | | |
| Hldgs., Inc.) (c)(f) | | $ | | 6,125 | | $ | | 6,125 |
| Greensboro Combined Enterprise Sys. Rev. Series 2005 B, | | | | | | | | |
| 2.5% (Liquidity Facility Bank of America NA), VRDN (c) | | | | 10,100 | | | | 10,100 |
| Mecklenburg County Ctfs. of Prtn. 2.51% (Liquidity Facility | | | | | | | | |
| Bank of America NA), VRDN (c) | | | | 12,380 | | | | 12,380 |
| North Carolina Cap. Facilities Fin. Agcy. Rev. Participating | | | | | | | | |
| VRDN Series EGL 7050060, 2.53% (Liquidity Facility | | | | | | | | |
| Citibank NA) (c)(f) | | | | 15,600 | | | | 15,600 |
| North Carolina Gen. Oblig. Participating VRDN: | | | | | | | | |
| Series IXIS 05 1, 2.52% (Liquidity Facility CDC Fin.-CDC | | | | | | | | |
| IXIS) (c)(f) | | | | 10,000 | | | | 10,000 |
| Series PT 2206, 2.53% (Liquidity Facility Merrill Lynch & Co., | | | | | | | | |
| Inc.) (c)(f) | | | | 7,980 | | | | 7,980 |
| Univ. of North Carolina at Chapel Hill Rev. Participating VRDN | | | | | | | | |
| Series TOC 05 W, 2.39% (Liquidity Facility Goldman Sachs | | | | | | | | |
| Group, Inc.) (c)(f) | | | | 8,000 | | | | 8,000 |
| Winston-Salem Wtr. & Swr. Sys. Rev. Series 2002 C, 2.38% | | | | | | | | |
| (Liquidity Facility Dexia Cr. Local de France), VRDN (c) | | | | 15,700 | | | | 15,700 |
| | | | | | | | | 85,885 |
| |
| North Dakota 0.2% | | | | | | | | |
| North Dakota Muni. Bond Bank Participating VRDN | | | | | | | | |
| Series PT 1919, 2.53% (Liquidity Facility Merrill Lynch & Co., | | | | | | | | |
| Inc.) (c)(f) | | | | 6,535 | | | | 6,535 |
| Ohio – 2.3% | | | | | | | | |
| Cincinnati City School District Participating VRDN Series EGL | | | | | | | | |
| 04 34, 2.52% (Liquidity Facility Citibank NA) (c)(f) | | | | 6,000 | | | | 6,000 |
| Cincinnati Technical & Cmnty. College Gen. Receipts | | | | | | | | |
| Participating VRDN Series PT 1615, 2.52% (Liquidity Facility | | | | | | | | |
| Merrill Lynch & Co., Inc.) (c)(f) | | | | 5,670 | | | | 5,670 |
| Cleveland Arpt. Sys. Rev. Participating VRDN Series SGA 126, | | | | | | | | |
| 2.38% (Liquidity Facility Societe Generale) (c)(f) | | | | 10,685 | | | | 10,685 |
| Darke County Health Care Facilities Rev. (Brethren Retirement | | | | | | | | |
| Cmnty. Proj.) 2.57%, LOC Fifth Third Bank, Cincinnati, | | | | | | | | |
| VRDN (c) | | | | 5,795 | | | | 5,795 |
| Dayton School District Participating VRDN Series SG 173, | | | | | | | | |
| 2.52% (Liquidity Facility Societe Generale) (c)(f) | | | | 12,030 | | | | 12,030 |
| Hamilton County Econ. Dev. Rev. (Contemporary Arts Ctr. | | | | | | | | |
| Proj.) 2.5%, LOC Fifth Third Bank, Cincinnati, VRDN (c) | | | | 2,000 | | | | 2,000 |
| Hamilton County Health Care Facilities Rev. (Twin Towers & | | | | | | | | |
| Twin Lakes Proj.) Series B, 2.52%, LOC U.S. Bank NA, | | | | | | | | |
| Minnesota, VRDN (c) | | | | 1,800 | | | | 1,800 |
See accompanying notes which are an integral part of the financial statements.
| Municipal Securities continued | | | | | | | | |
| | | | | Principal | | Value (Note 1) |
| | | Amount (000s) | | | | (000s) |
| Ohio – continued | | | | | | | | |
| Montgomery County Health Care & Multi-family Hsg. Facilities | | | | | | | | |
| Rev. (Franciscan St. Leonard Proj.) 2.54%, LOC Fifth Third | | | | | | | | |
| Bank, Cincinnati, VRDN (c) | | $ | | 15,270 | | $ | | 15,270 |
| Ohio Gen. Oblig. Participating VRDN Series Putters 511, | | | | | | | | |
| 2.53% (Liquidity Facility PNC Bank NA, Pittsburgh) (c)(f) | | | | 6,860 | | | | 6,860 |
| Ohio Higher Edl. Facility Commission Rev. (Pooled Fing. Prog.) | | | | | | | | |
| Series 2004 B, 2.51%, LOC Fifth Third Bank, Cincinnati, | | | | | | | | |
| VRDN (c) | | | | 7,370 | | | | 7,370 |
| Ohio Tpk. Commission Tpk. Rev. Participating VRDN Series | | | | | | | | |
| MS 98 71, 2.51% (Liquidity Facility Morgan Stanley) (c)(f) | | | | 5,200 | | | | 5,200 |
| Port of Greater Cincinnati Dev. Auth. Rev. (Nat’l. Underground | | | | | | | | |
| Railroad Freedom Ctr., Inc. Proj.) Series 2003 A, 2.45%, | | | | | | | | |
| LOC JPMorgan Chase Bank, LOC Fifth Third Bank, | | | | | | | | |
| Cincinnati, VRDN (c) | | | | 8,500 | | | | 8,500 |
| | | | | | | | | 87,180 |
| |
| Oregon – 1.0% | | | | | | | | |
| Portland Swr. Sys. Rev. Participating VRDN: | | | | | | | | |
| Series MS 00 386, 2.52% (Liquidity Facility Morgan | | | | | | | | |
| Stanley) (c)(f) | | | | 10,800 | | | | 10,800 |
| Series PT 2435, 2.53% (Liquidity Facility Merrill Lynch & Co., | | | | | | | | |
| Inc.) (c)(f) | | | | 4,205 | | | | 4,205 |
| Umatilla County School District #8R Hermiston Participating | | | | | | | | |
| VRDN Series Putters 259, 2.53% (Liquidity Facility JPMorgan | | | | | | | | |
| Chase Bank) (c)(f) | | | | 5,945 | | | | 5,945 |
| Washington, Multnomah & Yamhill County School District #1J | | | | | | | | |
| Participating VRDN Series Putters 171, 2.53% (Liquidity | | | | | | | | |
| Facility JPMorgan Chase Bank) (c)(f) | | | | 5,410 | | | | 5,410 |
| Yamhill County Rev. (George Fox Univ. Proj.) Series A, 2.5%, | | | | | | | | |
| LOC Bank of America NA, VRDN (c) | | | | 10,000 | | | | 10,000 |
| | | | | | | | | 36,360 |
| |
| Pennsylvania – 2.8% | | | | | | | | |
| Allegheny County Hosp. Dev. Auth. Rev. Bonds Series PT 762, | | | | | | | | |
| 2.85%, tender 6/15/06 (Liquidity Facility Landesbank | | | | | | | | |
| Hessen-Thuringen) (c)(f)(g) | | | | 8,900 | | | | 8,900 |
| Allegheny County Indl. Dev. Auth. Rev. (UPMC Children’s | | | | | | | | |
| Hosp. Proj.) Series 2004 A, 2.6%, VRDN (c) | | | | 8,600 | | | | 8,600 |
| Blair County Indl. Dev. Auth. Rev. (Homewood at Martinsburg | | | | | | | | |
| Proj.) 2.54%, LOC Manufacturers & Traders Trust Co., | | | | | | | | |
| VRDN (c) | | | | 3,800 | | | | 3,800 |
| Lancaster Indl. Dev. Auth. Rev. (United Zion Retirement Cmnty. | | | | | | | | |
| Proj.) 2.5%, LOC Citizens Bank of Pennsylvania, VRDN (c) | | | | 5,785 | | | | 5,785 |
| Luzerne County Indl. Dev. Auth. Rev. (United Methodist Homes | | | | | | | | |
| Proj.) 2.4%, LOC Bank of New York, New York, VRDN (c) | | | | 4,800 | | | | 4,800 |
See accompanying notes which are an integral part of the financial statements.
25 Annual Report
| Investments continued | | | | | | | | |
| |
| |
| |
| Municipal Securities continued | | | | | | | | |
| | | | | Principal | | Value (Note 1) |
| | | Amount (000s) | | | | (000s) |
| Pennsylvania – continued | | | | | | | | |
| Montgomery County Indl. Dev. Auth. Poll. Cont. Rev. (Peco | | | | | | | | |
| Energy Co. Proj.) Series 1999 A, 2.33%, LOC Wachovia | | | | | | | | |
| Bank NA, VRDN (c) | | $ | | 15,000 | | $ | | 15,000 |
| Pennsylvania Econ. Dev. Fing. Auth. Rev. (Dr. Gertrude Barber | | | | | | | | |
| Ctr. Proj.) 2.52%, LOC PNC Bank NA, Pittsburgh, VRDN (c) . | | | | 5,930 | | | | 5,930 |
| Pennsylvania Gen. Oblig. Participating VRDN Series MSTC 00 | | | | | | | | |
| 110, 2.3% (Liquidity Facility Bear Stearns Companies, | | | | | | | | |
| Inc.) (c)(f) | | | | 1,000 | | | | 1,000 |
| Pennsylvania Higher Edl. Facilities Auth. Rev. (Marywood Univ. | | | | | | | | |
| Proj.) Series A, 2.52%, LOC PNC Bank NA, Pittsburgh, | | | | | | | | |
| VRDN (c) | | | | 7,460 | | | | 7,460 |
| Pennsylvania Pub. School Bldg. Auth. School Rev. Participating | | | | | | | | |
| VRDN: | | | | | | | | |
| Series AAB 03 24, 2.41% (Liquidity Facility ABN AMRO | | | | | | | | |
| Bank NV) (c)(f) | | | | 2,300 | | | | 2,300 |
| Series Stars 124, 2.52% (Liquidity Facility BNP Paribas | | | | | | | | |
| SA) (c)(f) | | | | 5,100 | | | | 5,100 |
| Pennsylvania Tpk. Commission Oil Franchise Tax Rev. | | | | | | | | |
| Participating VRDN Series ROC II R4552, 2.52% (Liquidity | | | | | | | | |
| Facility Citigroup Global Markets Hldgs., Inc.) (c)(f) | | | | 2,595 | | | | 2,595 |
| Pennsylvania Tpk. Commission Tpk. Rev. Participating VRDN | | | | | | | | |
| Series 04 29 Class A, 2.52% (Liquidity Facility Citibank | | | | | | | | |
| NA) (c)(f) | | | | 8,430 | | | | 8,430 |
| Philadelphia Wtr. & Wastewtr. Rev. Participating VRDN: | | | | | | | | |
| Series MS 773, 2.52% (Liquidity Facility Morgan | | | | | | | | |
| Stanley) (c)(f) | | | | 1,995 | | | | 1,995 |
| Series SG 158, 2.52% (Liquidity Facility Societe | | | | | | | | |
| Generale) (c)(f) | | | | 20,000 | | | | 20,000 |
| Southcentral Pennsylvania Gen. Auth. Rev. (Hanover Lutheran | | | | | | | | |
| Village Proj.) 2.54%, LOC Manufacturers & Traders Trust | | | | | | | | |
| Co., VRDN (c) | | | | 5,300 | | | | 5,300 |
| | | | | | | | | 106,995 |
| |
| Rhode Island – 0.1% | | | | | | | | |
| Rhode Island Health & Edl. Bldg. Corp. Rev. Participating | | | | | | | | |
| VRDN Series PT 2253, 2.53% (Liquidity Facility Merrill Lynch | | | | | | | | |
| & Co., Inc.) (c)(f) | | | | 3,730 | | | | 3,730 |
| South Carolina – 2.7% | | | | | | | | |
| Berkeley County School District Participating VRDN Series | | | | | | | | |
| MSCO 01 656, 2.52% (Liquidity Facility Morgan | | | | | | | | |
| Stanley) (c)(f) | | | | 6,000 | | | | 6,000 |
| Charleston Wtrwks. & Swr. Rev. Series A, 2.52% (Liquidity | | | | | | | | |
| Facility Bank of America NA), VRDN (c) | | | | 9,000 | | | | 9,000 |
See accompanying notes which are an integral part of the financial statements.
Annual Report
| Municipal Securities continued | | | | | | | | |
| | | | | Principal | | Value (Note 1) |
| | | Amount (000s) | | | | (000s) |
| South Carolina – continued | | | | | | | | |
| Chesterfield County School District Participating VRDN Series | | | | | | | | |
| PT 02 1453, 2.53% (Liquidity Facility Merrill Lynch & Co., | | | | | | | | |
| Inc.) (c)(f) | | $ | | 6,445 | | $ | | 6,445 |
| Oconee County Poll. Cont. Rev. (Duke Energy Corp. Proj.) | | | | | | | | |
| Series A, 2.44%, VRDN (c) | | | | 3,700 | | | | 3,700 |
| South Carolina Edl. Facilities Auth. for Private Nonprofit | | | | | | | | |
| Institutions of Higher Learning Edl. Facilities Rev. (Caflin | | | | | | | | |
| Univ. Proj.) 2.5%, LOC Bank of America NA, VRDN (c) | | | | 9,800 | | | | 9,800 |
| South Carolina Gen. Oblig. School Facilities Participating | | | | | | | | |
| VRDN Series MS 1078, 2.52% (Liquidity Facility Morgan | | | | | | | | |
| Stanley) (c)(f) | | | | 4,398 | | | | 4,398 |
| South Carolina Jobs Econ. Dev. Auth. Econ. Dev. Rev. (MUFC | | | | | | | | |
| Central Energy Plant Proj.) 2.5%, LOC Bank of America NA, | | | | | | | | |
| VRDN (c) | | | | 15,000 | | | | 15,000 |
| South Carolina Pub. Svc. Auth. Rev. Participating VRDN Series | | | | | | | | |
| PT 1877, 2.53% (Liquidity Facility Merrill Lynch & Co., | | | | | | | | |
| Inc.) (c)(f) | | | | 5,760 | | | | 5,760 |
| South Carolina Trans. Infrastructure Bank Rev. Participating | | | | | | | | |
| VRDN: | | | | | | | | |
| Series PT 2305, 2.53% (Liquidity Facility Merrill Lynch & Co., | | | | | | | | |
| Inc.) (c)(f) | | | | 7,845 | | | | 7,845 |
| Series PT 2306, 2.53% (Liquidity Facility Merrill Lynch & Co., | | | | | | | | |
| Inc.) (c)(f) | | | | 10,320 | | | | 10,320 |
| Series Putters 316, 2.53% (Liquidity Facility JPMorgan Chase | | | | | | | | |
| & Co.) (c)(f) | | | | 2,480 | | | | 2,480 |
| Series Putters 590, 2.53% (Liquidity Facility JPMorgan Chase | | | | | | | | |
| & Co.) (c)(f) | | | | 2,650 | | | | 2,650 |
| Western Carolina Reg’l. Swr. Auth. Swr. Sys. Rev. Participating | | | | | | | | |
| VRDN Series Floaters 01 606, 2.52% (Liquidity Facility | | | | | | | | |
| Morgan Stanley) (c)(f) | | | | 6,550 | | | | 6,550 |
| York County Poll. Cont. Rev. Bonds (Duke Energy Corp. Proj.) | | | | | | | | |
| 2.7% tender 10/4/05, CP mode | | | | 5,700 | | | | 5,700 |
| York County School District #4 Participating VRDN Series TOC | | | | | | | | |
| 04 F, 2.52% (Liquidity Facility Goldman Sachs Group, | | | | | | | | |
| Inc.) (c)(f) | | | | 5,870 | | | | 5,870 |
| | | | | | | | | 101,518 |
| |
| South Dakota 0.2% | | | | | | | | |
| South Dakota Health & Edl. Facilities Auth. Rev. Participating | | | | | | | | |
| VRDN Series Floaters PT 1406, 2.53% (Liquidity Facility | | | | | | | | |
| Merrill Lynch & Co., Inc.) (c)(f) | | | | 6,205 | | | | 6,205 |
| Tennessee – 2.5% | | | | | | | | |
| Bristol Health & Edl. Facilities Board Rev. Participating VRDN | | | | | | | | |
| Series LB 03 L42J, 2.48% (Liquidity Facility Lehman Brothers | | | | | | | | |
| Hldgs., Inc.) (c)(f) | | | | 23,460 | | | | 23,460 |
See accompanying notes which are an integral part of the financial statements.
Annual Report
| Investments continued | | | | | | | | | | |
| |
| |
| Municipal Securities continued | | | | | | | | |
| | | | | | | Principal | | Value (Note 1) |
| | | | | Amount (000s) | | | | (000s) |
| Tennessee – continued | | | | | | | | | | |
| Elizabethton Health & Edl. Facilities Board Rev. Participating | | | | | | | | |
| VRDN Series PT 894, 2.53% (Liquidity Facility Merrill Lynch | | | | | | | | |
| & Co., Inc.) (c)(f) | | | | $ | | 4,995 | | $ | | 4,995 |
| Memphis Elec. Sys. Rev. Participating VRDN: | | | | | | | | |
| Series MS 879, 2.52% (Liquidity Facility Morgan | | | | | | | | |
| Stanley) (c)(f) | | | | | | 9,245 | | | | 9,245 |
| Series MS 976, 2.52% (Liquidity Facility Morgan | | | | | | | | |
| Stanley) (c)(f) | | | | | | 4,000 | | | | 4,000 |
| Metropolitan Govt. Nashville & Davidson County District | | | | | | | | |
| Energy Sys. Rev. Participating VRDN Series ROC II R2072, | | | | | | | | |
| 2.53% (Liquidity Facility Citigroup Global Markets Hldgs., | | | | | | | | |
| Inc.) (c)(f) | | | | | | 2,120 | | | | 2,120 |
| Montgomery County Pub. Bldg. Auth. Pooled Fing. Rev. | | | | | | | | |
| (Tennessee County Ln. Pool Prog.) Series 1999, 2.5%, LOC | | | | | | | | |
| Bank of America NA, VRDN (c) | | | | | | 23,680 | | | | 23,680 |
| Shelby County Gen. Oblig.: | | | | | | | | | | |
| Participating VRDN Series EGL 01 4201, 2.53% (Liquidity | | | | | | | | |
| Facility Citibank NA, New York) (c)(f) | | | | | | 10,640 | | | | 10,640 |
| Series 2004 ECN, 2.68% 10/7/05, CP | | | | | | 4,750 | | | | 4,750 |
| Shelby County Health Edl. & Hsg. Facilities Board Rev.: | | | | | | | | |
| (Saint Benedict Auburndale School Proj.) 2.53%, LOC | | | | | | | | |
| AmSouth Bank NA, Birmingham, VRDN (c) | | | | 5,000 | | | | 5,000 |
| (Saint Mary’s Episcopal School Proj.) 2.79%, LOC First | | | | | | | | |
| Tennessee Bank NA, Memphis, VRDN (c) | | | | 6,080 | | | | 6,080 |
| | | | | | | | | | | 93,970 |
| |
| Texas 18.6% | | | | | | | | | | |
| Austin Cmnty. College District Rev. Participating VRDN Series | | | | | | | | |
| ROC II R2190, 2.53% (Liquidity Facility Citigroup Global | | | | | | | | |
| Markets Hldgs., Inc.) (c)(f) | | | | | | 5,860 | | | | 5,860 |
| Austin Elec. Util. Sys. Rev. Participating VRDN Series SGA | | | | | | | | |
| 122, 2.41% (Liquidity Facility Societe Generale) (c)(f) | | | | 9,680 | | | | 9,680 |
| Austin Gen. Oblig. Participating VRDN Series DB 160, 2.53% | | | | | | | | |
| (Liquidity Facility Deutsche Bank AG) (c)(f) | | | | 8,615 | | | | 8,615 |
| Austin Hotel Occupancy Tax Rev. 2.52% (CIFG North America | | | | | | | | |
| Insured), VRDN (c) | | | | | | 9,310 | | | | 9,310 |
| Austin Util. Sys. Rev. Participating VRDN Series BA 98 V, | | | | | | | | |
| 2.57% (Liquidity Facility Bank of America NA) (c)(f) | | | | 4,250 | | | | 4,250 |
| Board of Regents of The Texas A&M Univ. Sys. Permanent | | | | | | | | |
| Univ. Fund Participating VRDN Series Putters 605, 2.53% | | | | | | | | |
| (Liquidity Facility JPMorgan Chase & Co.) (c)(f) | | | | 7,215 | | | | 7,215 |
| |
| |
| |
| |
| See accompanying notes which are an integral part of the financial statements. | | | | |
| |
| Annual Report | | 28 | | | | | | | | |
| Municipal Securities continued | | | | | | | | |
| | | | | Principal | | Value (Note 1) |
| | | Amount (000s) | | | | (000s) |
| Texas continued | | | | | | | | |
| Board of Regents of The Univ. of Texas Sys. Permanent Univ. | | | | | | | | |
| Fund Participating VRDN: | | | | | | | | |
| Series Putters 411, 2.53% (Liquidity Facility JPMorgan Chase | | | | | | | | |
| Bank) (c)(f) | | $ | | 2,580 | | $ | | 2,580 |
| Series Putters 517, 2.53% (Liquidity Facility JPMorgan Chase | | | | | | | | |
| Bank) (c)(f) | | | | 12,250 | | | | 12,250 |
| Brazos River Hbr. Navigation Brazoria County Envir. Facilities | | | | | | | | |
| Rev. (Dow Chemical Co. Proj.) Series B1, 2.45%, VRDN (c) . | | | | 8,400 | | | | 8,400 |
| Carrollton-Farmers Branch Independent School District Bonds | | | | | | | | |
| Series 1996, 5.7% 2/15/14 (Pre-Refunded to 2/15/06 @ | | | | | | | | |
| 100) (e) | | | | 3,855 | | | | 3,904 |
| Crowley Independent School District Participating VRDN Series | | | | | | | | |
| MS 1171, 2.39% (Liquidity Facility Morgan Stanley) (c)(f) | | | | 5,445 | | | | 5,445 |
| Cypress-Fairbanks Independent School District Participating | | | | | | | | |
| VRDN: | | | | | | | | |
| Series EGL 00 4304, 2.53% (Liquidity Facility Citibank NA, | | | | | | | | |
| New York) (c)(f) | | | | 5,000 | | | | 5,000 |
| Series PT 2512, 2.53% (Liquidity Facility Merrill Lynch & Co., | | | | | | | | |
| Inc.) (c)(f) | | | | 1,295 | | | | 1,295 |
| Series ROC II R4514, 2.53% (Liquidity Facility Citigroup | | | | | | | | |
| Global Markets Hldgs., Inc.) (c)(f) | | | | 5,505 | | | | 5,505 |
| Dallas Gen. Oblig. Participating VRDN Series MSDW 98 93, | | | | | | | | |
| 2.52% (Liquidity Facility Morgan Stanley) (c)(f) | | | | 7,510 | | | | 7,510 |
| Dallas Independent School District Participating VRDN: | | | | | | | | |
| Series EGL 7050034, Class A, 2.53% (Liquidity Facility | | | | | | | | |
| Citibank NA) (c)(f) | | | | 4,000 | | | | 4,000 |
| Series MS 1046, 2.52% (Liquidity Facility Morgan | | | | | | | | |
| Stanley) (c)(f) | | | | 1,500 | | | | 1,500 |
| Series Putters 1003, 2.53% (Liquidity Facility JPMorgan | | | | | | | | |
| Chase Bank) (c)(f) | | | | 1,970 | | | | 1,970 |
| Denton County Lewisville Independent School District | | | | | | | | |
| Participating VRDN Series Putters 701, 2.53% (Liquidity | | | | | | | | |
| Facility JPMorgan Chase & Co.) (c)(f) | | | | 4,000 | | | | 4,000 |
| Denton Independent School District Participating VRDN Series | | | | | | | | |
| SG 02 166, 2.53% (Liquidity Facility Societe Generale) (c)(f) | | | | 20,120 | | | | 20,120 |
| Denton Util. Sys. Rev. Participating VRDN Series SGA 32, | | | | | | | | |
| 2.41% (Liquidity Facility Societe Generale) (c)(f) | | | | 15,230 | | | | 15,230 |
| Edinburg Consolidated Independent School District | | | | | | | | |
| Participating VRDN Series SGA 106, 2.41% (Liquidity | | | | | | | | |
| Facility Societe Generale) (c)(f) | | | | 8,600 | | | | 8,600 |
| El Paso Gen. Oblig. Participating VRDN Series Putters 843, | | | | | | | | |
| 2.53% (Liquidity Facility JPMorgan Chase Bank) (c)(f) | | | | 3,145 | | | | 3,145 |
| Fort Bend County Gen. Oblig. Participating VRDN Series SGB | | | | | | | | |
| 46, 2.53% (Liquidity Facility Societe Generale) (c)(f) | | | | 4,500 | | | | 4,500 |
| See accompanying notes which are an integral part of the financial statements. | | | | |
| |
| 29 | | | | | | Annual Report |
| Investments continued | | | | | | | | |
| |
| |
| Municipal Securities continued | | | | | | | | |
| | | | | Principal | | Value (Note 1) |
| | | Amount (000s) | | | | (000s) |
| Texas continued | | | | | | | | |
| Frisco Gen. Oblig. Participating VRDN Series PT 1932, 2.53% | | | | | | | | |
| (Liquidity Facility Merrill Lynch & Co., Inc.) (c)(f) | | $ | | 9,540 | | $ | | 9,540 |
| Garland Independent School District Participating VRDN: | | | | | | | | |
| Series Putters 551, 2.53% (Liquidity Facility JPMorgan Chase | | | | | | | | |
| Bank) (c)(f) | | | | 1,640 | | | | 1,640 |
| Series Putters 572, 2.53% (Liquidity Facility JPMorgan Chase | | | | | | | | |
| & Co.) (c)(f) | | | | 2,295 | | | | 2,295 |
| Harris County Gen. Oblig.: | | | | | | | | |
| Participating VRDN: | | | | | | | | |
| Series Putters 586, 2.53% (Liquidity Facility JPMorgan | | | | | | | | |
| Chase & Co.) (c)(f) | | | | 7,665 | | | | 7,665 |
| Series ROC II R1029, 2.53% (Liquidity Facility Citigroup | | | | | | | | |
| Global Markets Hldgs., Inc.) (c)(f) | | | | 3,465 | | | | 3,465 |
| Series 1998 C, 2.75% 10/4/05, CP | | | | 5,000 | | | | 5,000 |
| Harris County Hosp. District Rev. Participating VRDN Series PT | | | | | | | | |
| 726, 2.53% (Liquidity Facility BNP Paribas SA) (c)(f) | | | | 4,995 | | | | 4,995 |
| Harris County-Houston Sports Auth. Spl. Rev. Participating | | | | | | | | |
| VRDN Series PZ 65, 2.57% (Liquidity Facility Merrill Lynch & | | | | | | | | |
| Co., Inc.) (c)(f) | | | | 7,705 | | | | 7,705 |
| Hays Consolidated Independent School District Participating | | | | | | | | |
| VRDN: | | | | | | | | |
| Series PT 2462, 2.53% (Liquidity Facility Merrill Lynch & Co., | | | | | | | | |
| Inc.) (c)(f) | | | | 3,530 | | | | 3,530 |
| Series PT 2543, 2.53% (Liquidity Facility Merrill Lynch & Co., | | | | | | | | |
| Inc.) (c)(f) | | | | 4,040 | | | | 4,040 |
| Houston Arpt. Sys. Rev. Participating VRDN: | | | | | | | | |
| Series Merlots 00 A25, 2.4% (Liquidity Facility Wachovia | | | | | | | | |
| Bank NA) (c)(f) | | | | 12,475 | | | | 12,475 |
| Series SG 03 161, 2.53% (Liquidity Facility Societe | | | | | | | | |
| Generale) (c)(f) | | | | 21,435 | | | | 21,435 |
| Houston Gen. Oblig.: | | | | | | | | |
| Bonds Series PT 969, 2.95%, tender 7/20/06 (Liquidity | | | | | | | | |
| Facility DEPFA BANK PLC) (c)(f)(g) | | | | 12,700 | | | | 12,700 |
| Participating VRDN Series Putters 489, 2.53% (Liquidity | | | | | | | | |
| Facility JPMorgan Chase Bank) (c)(f) | | | | 2,690 | | | | 2,690 |
| Houston Independent School District Participating VRDN Series | | | | | | | | |
| TOC 05 F, 2.58% (Liquidity Facility Goldman Sachs Group, | | | | | | | | |
| Inc.) (c)(f) | | | | 15,400 | | | | 15,400 |
| Houston Util. Sys. Rev. Participating VRDN: | | | | | | | | |
| Merlots 04 B17, 2.4% (Liquidity Facility Wachovia Bank | | | | | | | | |
| NA) (c)(f) | | | | 7,470 | | | | 7,470 |
| Series DB 102, 2.53% (Liquidity Facility Deutsche Bank | | | | | | | | |
| AG) (c)(f) | | | | 5,475 | | | | 5,475 |
See accompanying notes which are an integral part of the financial statements.
| Municipal Securities continued | | | | | | | | |
| | | | | Principal | | Value (Note 1) |
| | | Amount (000s) | | | | (000s) |
| Texas continued | | | | | | | | |
| Houston Util. Sys. Rev. Participating VRDN: – continued | | | | | | | | |
| Series DB 113, 2.53% (Liquidity Facility Deutsche Bank | | | | | | | | |
| AG) (c)(f) | | $ | | 8,020 | | $ | | 8,020 |
| Houston Wtr. & Swr. Sys. Rev. Participating VRDN: | | | | | | | | |
| Series Merlots 02 A16, 2.4% (Liquidity Facility Wachovia | | | | | | | | |
| Bank NA) (c)(f) | | | | 3,785 | | | | 3,785 |
| Series MS 00 427, 2.52% (Liquidity Facility Morgan | | | | | | | | |
| Stanley) (c)(f) | | | | 8,245 | | | | 8,245 |
| Series MS 00 495, 2.52% (Liquidity Facility Morgan | | | | | | | | |
| Stanley) (c)(f) | | | | 6,038 | | | | 6,038 |
| Series SG 120, 2.53% (Liquidity Facility Societe | | | | | | | | |
| Generale) (c)(f) | | | | 15,495 | | | | 15,495 |
| Series Stars 40, 2.53% (Liquidity Facility BNP Paribas | | | | | | | | |
| SA) (c)(f) | | | | 10,680 | | | | 10,680 |
| Irving Independent School District: | | | | | | | | |
| Bonds 0% 2/15/06 (Permanent School Fund of Texas | | | | | | | | |
| Guaranteed) | | | | 3,330 | | | | 3,287 |
| Participating VRDN Series ROC II R2028, 2.53% (Liquidity | | | | | | | | |
| Facility Citigroup Global Markets Hldgs., Inc.) (c)(f) | | | | 3,370 | | | | 3,370 |
| Judson Independent School District Participating VRDN Series | | | | | | | | |
| Putters 662, 2.53% (Liquidity Facility JPMorgan Chase & | | | | | | | | |
| Co.) (c)(f) | | | | 5,285 | | | | 5,285 |
| Lower Colorado River Auth. Rev. Participating VRDN Series PA | | | | | | | | |
| 590R, 2.53% (Liquidity Facility Merrill Lynch & Co., | | | | | | | | |
| Inc.) (c)(f) | | | | 10,200 | | | | 10,200 |
| Lower Colorado River Auth. Transmission Contract Rev. | | | | | | | | |
| Participating VRDN Series PT 1818, 2.53% (Liquidity Facility | | | | | | | | |
| Merrill Lynch & Co., Inc.) (c)(f) | | | | 4,230 | | | | 4,230 |
| Mesquite Independent School District Participating VRDN | | | | | | | | |
| Series PT 1386, 2.53% (Liquidity Facility Merrill Lynch & Co., | | | | | | | | |
| Inc.) (c)(f) | | | | 8,495 | | | | 8,495 |
| Midlothian Independent School District Participating VRDN | | | | | | | | |
| Series PT 2179, 2.53% (Liquidity Facility Merrill Lynch & Co., | | | | | | | | |
| Inc.) (c)(f) | | | | 5,370 | | | | 5,370 |
| New Braunfels Gen. Oblig. Participating VRDN Series PT | | | | | | | | |
| 2211, 2.53% (Liquidity Facility Merrill Lynch & Co., | | | | | | | | |
| Inc.) (c)(f) | | | | 5,640 | | | | 5,640 |
| North East Texas Independent School District Participating | | | | | | | | |
| VRDN Series SG 143, 2.53% (Liquidity Facility Societe | | | | | | | | |
| Generale) (c)(f) | | | | 13,515 | | | | 13,515 |
| North Texas Tollway Auth. Dallas North Tollway Sys. Rev. | | | | | | | | |
| Participating VRDN Series SG 168, 2.53% (Liquidity Facility | | | | | | | | |
| Societe Generale) (c)(f) | | | | 23,940 | | | | 23,940 |
See accompanying notes which are an integral part of the financial statements.
Annual Report
| Investments continued | | | | | | | | |
| |
| |
| Municipal Securities continued | | | | | | | | |
| | | | | Principal | | Value (Note 1) |
| | | Amount (000s) | | | | (000s) |
| Texas continued | | | | | | | | |
| Northside Independent School District Participating VRDN | | | | | | | | |
| Series PT 2329, 2.53% (Liquidity Facility Merrill Lynch & Co., | | | | | | | | |
| Inc.) (c)(f) | | $ | | 4,600 | | $ | | 4,600 |
| Pearland Gen. Oblig. Participating VRDN Series PT 3079, | | | | | | | | |
| 2.53% (Liquidity Facility Merrill Lynch & Co., Inc.) (c)(f) | | | | 5,970 | | | | 5,970 |
| Pflugerville Gen. Oblig. Participating VRDN Series Putters | | | | | | | | |
| 594, 2.53% (Liquidity Facility JPMorgan Chase & Co.) (c)(f) . | | | | 2,925 | | | | 2,925 |
| Round Rock Independent School District Participating VRDN | | | | | | | | |
| Series MS 01 578, 2.52% (Liquidity Facility Morgan | | | | | | | | |
| Stanley) (c)(f) | | | | 7,750 | | | | 7,750 |
| San Antonio Elec. & Gas Systems Rev.: | | | | | | | | |
| Participating VRDN: | | | | | | | | |
| Series MS 876, 2.52% (Liquidity Facility Morgan | | | | | | | | |
| Stanley) (c)(f) | | | | 2,995 | | | | 2,995 |
| Series Putters 777, 2.53% (Liquidity Facility JPMorgan | | | | | | | | |
| Chase Bank) (c)(f) | | | | 6,290 | | | | 6,290 |
| Series ROC II R3011, 2.53% (Liquidity Facility Citigroup | | | | | | | | |
| Global Markets Hldgs., Inc.) (c)(f) | | | | 7,310 | | | | 7,310 |
| Series SG 101, 2.53% (Liquidity Facility Societe | | | | | | | | |
| Generale) (c)(f) | | | | 11,475 | | | | 11,475 |
| Series SG 107, 2.53% (Liquidity Facility Societe | | | | | | | | |
| Generale) (c)(f) | | | | 5,160 | | | | 5,160 |
| Series Stars 112, 2.53% (Liquidity Facility BNP Paribas | | | | | | | | |
| SA) (c)(f) | | | | 20,925 | | | | 20,925 |
| 2.48% (Liquidity Facility Bank of America NA), VRDN (c) | | | | 54,200 | | | | 54,198 |
| San Antonio Independent School District: | | | | | | | | |
| Bonds Series AAB 01 28, 2.42%, tender 9/7/05 (Liquidity | | | | | | | | |
| Facility ABN AMRO Bank NV) (c)(f) | | | | 3,900 | | | | 3,900 |
| Participating VRDN Series EGL 01 4311, 2.53% (Liquidity | | | | | | | | |
| Facility Citibank NA, New York) (c)(f) | | | | 4,800 | | | | 4,800 |
| San Antonio Wtr. Sys. Rev. Participating VRDN Series Merlots | | | | | | | | |
| 00 VV, 2.4% (Liquidity Facility Wachovia Bank NA) (c)(f) | | | | 4,000 | | | | 4,000 |
| Schertz-Cibolo-Universal City Independent School District | | | | | | | | |
| Participating VRDN: | | | | | | | | |
| Series MSTC 01 156 Class A, 2.41% (Liquidity Facility Bear | | | | | | | | |
| Stearns Companies, Inc.) (c)(f) | | | | 10,505 | | | | 10,505 |
| Series PT 1610, 2.53% (Liquidity Facility Merrill Lynch & Co., | | | | | | | | |
| Inc.) (c)(f) | | | | 6,725 | | | | 6,725 |
| Socorro Independent School District Participating VRDN Series | | | | | | | | |
| Putters 1036, 2.53% (Liquidity Facility JPMorgan Chase & | | | | | | | | |
| Co.) (c)(f) | | | | 9,690 | | | | 9,690 |
| Spring Independent School District Participating VRDN Series | | | | | | | | |
| Putters 695, 2.53% (Liquidity Facility JPMorgan Chase & | | | | | | | | |
| Co.) (c)(f) | | | | 5,600 | | | | 5,600 |
See accompanying notes which are an integral part of the financial statements.
| Municipal Securities continued | | | | | | | | |
| | | | | Principal | | Value (Note 1) |
| | | Amount (000s) | | | | (000s) |
| Texas continued | | | | | | | | |
| Texas A&M Univ. Rev. Participating VRDN Series Putters 946, | | | | | | | | |
| 2.53% (Liquidity Facility JPMorgan Chase Bank) (c)(f) | | $ | | 3,800 | | $ | | 3,800 |
| Texas City Indl. Dev. Corp. Marine Term. Participating VRDN | | | | | | | | |
| Series Merlots 00 A34, 2.4% (Liquidity Facility Wachovia | | | | | | | | |
| Bank NA) (c)(f) | | | | 3,905 | | | | 3,905 |
| Texas Gen. Oblig.: | | | | | | | | |
| Participating VRDN: | | | | | | | | |
| Series DB 154, 2.53% (Liquidity Facility Deutsche Bank | | | | | | | | |
| AG) (c)(f) | | | | 10,000 | | | | 10,000 |
| Series ROC II R378, 2.53% (Liquidity Facility Citibank | | | | | | | | |
| NA) (c)(f) | | | | 3,740 | | | | 3,740 |
| Series ROC II R4020, 2.53% (Liquidity Facility Citigroup | | | | | | | | |
| Global Markets Hldgs., Inc.) (c)(f) | | | | 3,565 | | | | 3,565 |
| TRAN 4.5% 8/31/06 (b) | | | | 38,000 | | | | 38,552 |
| Texas Pub. Fin. Auth. Series 2002 B, 2.7% 9/9/05 (Liquidity | | | | | | | | |
| Facility Texas Gen. Oblig.), CP | | | | 6,200 | | | | 6,200 |
| Texas Wtr. Dev. Board Rev. Participating VRDN Series SGA 00 | | | | | | | | |
| 104, 2.41% (Liquidity Facility Societe Generale) (c)(f) | | | | 10,470 | | | | 10,470 |
| Tyler Health Facilities Dev. Corp. Hosp. Rev. Participating | | | | | | | | |
| VRDN Series PT 833, 2.53% (Liquidity Facility Svenska | | | | | | | | |
| Handelsbanken AB) (c)(f) | | | | 3,775 | | | | 3,775 |
| United Independent School District Participating VRDN Series | | | | | | | | |
| PT 3123, 2.53% (Liquidity Facility Merrill Lynch & Co., | | | | | | | | |
| Inc.) (c)(f) | | | | 5,230 | | | | 5,230 |
| Univ. of North Texas Univ. Rev. 2.5% 9/1/05, CP | | | | 4,508 | | | | 4,508 |
| Weslaco Health Facilities Dev. Corp. Rev. Participating VRDN | | | | | | | | |
| Series LB 04 L31J, 2.48% (Liquidity Facility Lehman Brothers | | | | | | | | |
| Hldgs., Inc.) (c)(f) | | | | 15,035 | | | | 15,035 |
| | | | | | | | | 706,597 |
| |
| Utah 0.7% | | | | | | | | |
| Emery County Poll. Cont. Rev. (Pacificorp. Proj.) Series 1991, | | | | | | | | |
| 2.4%, LOC BNP Paribas SA, VRDN (c) | | | | 12,100 | | | | 12,100 |
| Intermountain Pwr. Agcy. Pwr. Supply Rev. Participating VRDN | | | | | | | | |
| Series MS 00 409, 2.52% (Liquidity Facility Morgan | | | | | | | | |
| Stanley) (c)(f) | | | | 13,800 | | | | 13,800 |
| | | | | | | | | 25,900 |
| |
| Virginia – 1.5% | | | | | | | | |
| Chesterfield County Indl. Dev. Auth. Rev. Participating VRDN | | | | | | | | |
| Series PT 886, 2.58% (Liquidity Facility Lloyds TSB Bank | | | | | | | | |
| PLC) (c)(f) | | | | 2,800 | | | | 2,800 |
| Fairfax County Gen. Oblig. Participating VRDN Series MS | | | | | | | | |
| 1036, 2.52% (Liquidity Facility Morgan Stanley) (c)(f) | | | | 1,100 | | | | 1,100 |
See accompanying notes which are an integral part of the financial statements.
Annual Report
| Investments continued | | | | | | | | |
| |
| |
| Municipal Securities continued | | | | | | | | |
| | | | | Principal | | Value (Note 1) |
| | | Amount (000s) | | | | (000s) |
| Virginia – continued | | | | | | | | |
| Hampton Roads Reg’l. Jail Auth. Participating VRDN Series | | | | | | |
| Putters 569, 2.53% (Liquidity Facility JPMorgan Chase | | | | | | |
| Bank) (c)(f) | | $ | | 2,275 | | $ | | 2,275 |
| Louisa Indl. Dev. Auth. Poll. Cont. Rev. Bonds (Virginia Elec. & | | | | | | |
| Pwr. Co. Proj.): | | | | | | | | |
| Series 1984: | | | | | | | | |
| 2.67% tender 9/1/05, CP mode | | | | 3,500 | | | | 3,500 |
| 2.77% tender 10/5/05, CP mode | | | | 4,000 | | | | 4,000 |
| 2.8% tender 10/18/05, CP mode | | | | 3,700 | | | | 3,700 |
| 2.85% tender 10/19/05, CP mode | | | | 4,000 | | | | 4,000 |
| Series 1987, 2.6% tender 9/9/05, CP mode | | | | 1,100 | | | | 1,100 |
| Virginia College Bldg. Auth. Edl. Facilities Rev. Participating | | | | | | |
| VRDN Series MS 01 721, 2.52% (Liquidity Facility Morgan | | | | | | |
| Stanley) (c)(f) | | | | 9,700 | | | | 9,700 |
| Virginia Commonwealth Trans. Board Trans. Rev. Participating | | | | | | |
| VRDN: | | | | | | | | |
| Series EGL 99 4601, 2.53% (Liquidity Facility Citibank NA, | | | | | | |
| New York) (c)(f) | | | | 3,000 | | | | 3,000 |
| Series MS 01 727, 2.52% (Liquidity Facility Morgan | | | | | | |
| Stanley) (c)(f) | | | | 8,400 | | | | 8,400 |
| Virginia Pub. Bldg. Auth. Pub. Facilities Rev. Participating | | | | | | |
| VRDN: | | | | | | | | |
| Series Putters 718, 2.53% (Liquidity Facility PNC Bank NA, | | | | | | |
| Pittsburgh) (c)(f) | | | | 10,160 | | | | 10,160 |
| Series ROC II R 6027, 2.53% (Liquidity Facility Citibank | | | | | | |
| NA) (c)(f) | | | | 3,375 | | | | 3,375 |
| | | | | | | | | 57,110 |
| |
| Washington 6.9% | | | | | | | | |
| Benton County School District #400 Richland Participating | | | | | | |
| VRDN Series PT 1888, 2.53% (Liquidity Facility Merrill Lynch | | | | | | |
| & Co., Inc.) (c)(f) | | | | 6,490 | | | | 6,490 |
| Clark County Pub. Util. District #1 Generating Sys. Rev. | | | | | | |
| Participating VRDN Series Merlots 01 A122, 2.4% (Liquidity | | | | | | |
| Facility Wachovia Bank NA) (c)(f) | | | | 4,095 | | | | 4,095 |
| Clark County School District # 119 Battleground Participating | | | | | | |
| VRDN Series DB 148, 2.53% (Liquidity Facility Deutsche | | | | | | |
| Bank AG) (c)(f) | | | | 5,450 | | | | 5,450 |
| Energy Northwest Elec. Rev. Participating VRDN: | | | | | | |
| Series PT 1606, 2.53% (Liquidity Facility Merrill Lynch & Co., | | | | | | |
| Inc.) (c)(f) | | | | 5,740 | | | | 5,740 |
| Series PT 615, 2.53% (Liquidity Facility Merrill Lynch & Co., | | | | | | |
| Inc.) (c)(f) | | | | 16,255 | | | | 16,255 |
| |
| See accompanying notes which are an integral part of the financial statements. | | | | |
| |
| Annual Report | | 34 | | | | | | |
| Municipal Securities continued | | | | | | | | |
| | | | | Principal | | Value (Note 1) |
| | | Amount (000s) | | | | (000s) |
| Washington – continued | | | | | | | | |
| Energy Northwest Elec. Rev. Participating VRDN: – continued | | | | | | | | |
| Series PT 778, 2.53% (Liquidity Facility Landesbank | | | | | | | | |
| Hessen-Thuringen) (c)(f) | | $ | | 2,000 | | $ | | 2,000 |
| Series PT 982, 2.53% (Liquidity Facility Landesbank | | | | | | | | |
| Hessen-Thuringen) (c)(f) | | | | 6,380 | | | | 6,380 |
| Series Putters 248, 2.53% (Liquidity Facility JPMorgan Chase | | | | | | | | |
| Bank) (c)(f) | | | | 3,785 | | | | 3,785 |
| Series Putters 958, 2.53% (Liquidity Facility Dresdner Bank | | | | | | | | |
| AG) (c)(f) | | | | 10,980 | | | | 10,980 |
| Series Stars 05 113, 2.53% (Liquidity Facility BNP Paribas | | | | | | | | |
| SA) (c)(f) | | | | 9,910 | | | | 9,910 |
| Goat Hill Properties Lease Rev. Participating VRDN Series ROC | | | | | | | | |
| II R2173, 2.53% (Liquidity Facility Citigroup Global Markets | | | | | | | | |
| Hldgs., Inc.) (c)(f) | | | | 1,340 | | | | 1,340 |
| King County Gen. Oblig. Participating VRDN: | | | | | | | | |
| Series PT 1569, 2.53% (Liquidity Facility Merrill Lynch & Co., | | | | | | | | |
| Inc.) (c)(f) | | | | 9,250 | | | | 9,250 |
| Series PT 2248, 2.53% (Liquidity Facility Merrill Lynch & Co., | | | | | | | | |
| Inc.) (c)(f) | | | | 5,575 | | | | 5,575 |
| King County School District #145 Kent Participating VRDN | | | | | | | | |
| Series PT 2449, 2.53% (Liquidity Facility Merrill Lynch & Co., | | | | | | | | |
| Inc.) (c)(f) | | | | 4,530 | | | | 4,530 |
| King County Swr. Rev. Participating VRDN: | | | | | | | | |
| Series Merlots 00 E, 2.4% (Liquidity Facility Wachovia Bank | | | | | | | | |
| NA) (c)(f) | | | | 1,900 | | | | 1,900 |
| Series MS 01 554, 2.52% (Liquidity Facility Morgan | | | | | | | | |
| Stanley) (c)(f) | | | | 9,655 | | | | 9,655 |
| Pierce County Econ. Dev. Corp. Spl. Rev. (Weyerhaeuser Real | | | | | | | | |
| Estate Proj.) Series 1997 A, 2.43%, LOC Bank of America | | | | | | | | |
| NA, VRDN (c) | | | | 7,955 | | | | 7,955 |
| Pierce County School District #3 Puyallup Participating VRDN | | | | | | | | |
| Series Putters 415, 2.53% (Liquidity Facility JPMorgan Chase | | | | | | | | |
| Bank) (c)(f) | | | | 4,255 | | | | 4,255 |
| Port of Seattle Gen. Oblig. Series 2002 A2, 2.6% 9/1/05, | | | | | | | | |
| LOC Bayerische Landesbank Girozentrale, CP | | | | 2,275 | | | | 2,275 |
| Seattle Drainage & Wastewtr. Rev. Participating VRDN Series | | | | | | | | |
| PT 1605, 2.53% (Liquidity Facility Merrill Lynch & Co., | | | | | | | | |
| Inc.) (c)(f) | | | | 6,800 | | | | 6,800 |
| Seattle Gen. Oblig. Participating VRDN Series SGA 03 142, | | | | | | | | |
| 2.41% (Liquidity Facility Societe Generale) (c)(f) | | | | 5,000 | | | | 5,000 |
| Seattle Muni. Lt. & Pwr. Rev. Participating VRDN: | | | | | | | | |
| Series Merlots 01 A56, 2.4% (Liquidity Facility Wachovia | | | | | | | | |
| Bank NA) (c)(f) | | | | 9,885 | | | | 9,885 |
See accompanying notes which are an integral part of the financial statements.
35 Annual Report
Investments continued
Municipal Securities continued
| | | | | Principal | | Value (Note 1) |
| | | Amount (000s) | | | | (000s) |
| Washington – continued | | | | | | | | |
| Seattle Muni. Lt. & Pwr. Rev. Participating VRDN: – continued | | | | | | | | |
| Series PT 2476, 2.53% (Liquidity Facility Merrill Lynch & Co., | | | | | | | | |
| Inc.) (c)(f) | | $ | | 5,235 | | $ | | 5,235 |
| Series ROC II R2055, 2.53% (Liquidity Facility Citigroup | | | | | | | | |
| Global Markets Hldgs., Inc.) (c)(f) | | | | 6,635 | | | | 6,635 |
| Seattle Wtr. Sys. Rev. Participating VRDN Series ROC II | | | | | | | | |
| R4006, 2.53% (Liquidity Facility Citigroup Global Markets | | | | | | | | |
| Hldgs., Inc.) (c)(f) | | | | 4,965 | | | | 4,965 |
| Skagit County Pub. Hosp. District #1 Participating VRDN | | | | | | | | |
| Series PT 2294, 2.53% (Liquidity Facility Merrill Lynch & Co., | | | | | | | | |
| Inc.) (c)(f) | | | | 7,765 | | | | 7,765 |
| Snohomish County School District #332 Granite Falls | | | | | | | | |
| Participating VRDN Series PT 3083, 2.53% (Liquidity Facility | | | | | | | | |
| Merrill Lynch & Co., Inc.) (c)(f) | | | | 7,280 | | | | 7,280 |
| Tacoma Gen. Oblig. Series 2002 B, 2.6% 9/1/05, LOC Bank | | | | | | | | |
| of America NA, CP | | | | 3,400 | | | | 3,400 |
| Washington Gen. Oblig. Participating VRDN: | | | | | | | | |
| Series EGL 96 4701, 2.53% (Liquidity Facility Citibank NA, | | | | | | | | |
| New York) (c)(f) | | | | 4,000 | | | | 4,000 |
| Series EGL 98 4703, 2.53% (Liquidity Facility Citibank NA, | | | | | | | | |
| New York) (c)(f) | | | | 9,900 | | | | 9,900 |
| Series Macon 04 D, 2.57% (Liquidity Facility Bank of | | | | | | | | |
| America NA) (c)(f) | | | | 5,715 | | | | 5,715 |
| Series PT 1937, 2.53% (Liquidity Facility Merrill Lynch & Co., | | | | | | | | |
| Inc.) (c)(f) | | | | 12,760 | | | | 12,760 |
| Series PT 2231, 2.53% (Liquidity Facility Merrill Lynch & Co., | | | | | | | | |
| Inc.) (c)(f) | | | | 15,060 | | | | 15,060 |
| Series PT 2561. 2.53% (Liquidity Facility Merrill Lynch & Co., | | | | | | | | |
| Inc.) (c)(f) | | | | 5,250 | | | | 5,250 |
| Series PT 2736, 2.53% (Liquidity Facility Merrill Lynch & Co., | | | | | | | | |
| Inc.) (c)(f) | | | | 13,975 | | | | 13,975 |
| Series Putters 438Z, 2.53% (Liquidity Facility JPMorgan | | | | | | | | |
| Chase Bank) (c)(f) | | | | 3,300 | | | | 3,300 |
| Series Putters 748, 2.53% (Liquidity Facility JPMorgan Chase | | | | | | | | |
| Bank) (c)(f) | | | | 3,395 | | | | 3,395 |
| Series SGA 35, 2.41% (Liquidity Facility Societe | | | | | | | | |
| Generale) (c)(f) | | | | 8,990 | | | | 8,990 |
| Washington Health Care Facilities Auth. Rev. (Seattle Cancer | | | | | | | | |
| Care Alliance Proj.) 2.52%, LOC Key Bank NA, VRDN (c) | | | | 4,250 | | | | 4,250 |
| Washington Hsg. Fin. Commission Nonprofit Rev. (United Way | | | | | | | | |
| King County Proj.) 2.55%, LOC Bank of America NA, | | | | | | | | |
| VRDN (c) | | | | 2,205 | | | | 2,205 |
| | | | | | | | | 263,585 |
See accompanying notes which are an integral part of the financial statements.
| Municipal Securities continued | | | | | | |
| | | Principal | | Value (Note 1) |
| Amount (000s) | | | | (000s) |
| Wisconsin – 2.0% | | | | | | |
| Milwaukee County Gen. Oblig. RAN Series M5, 4% 9/1/05 . $ | | 10,000 | | $ | | 10,000 |
| Milwaukee Redev. Auth. Rev. Participating VRDN Series PT | | | | | | |
| 2042, 2.53% (Liquidity Facility Merrill Lynch & Co., | | | | | | |
| Inc.) (c)(f) | | 5,985 | | | | 5,985 |
| Wisconsin Gen. Oblig. Participating VRDN: | | | | | | |
| Series PT 1231, 2.53% (Liquidity Facility Merrill Lynch & Co., | | | | | | |
| Inc.) (c)(f) | | 15,540 | | | | 15,540 |
| Series PT 2076, 2.53% (Liquidity Facility Merrill Lynch & Co., | | | | | | |
| Inc.) (c)(f) | | 3,480 | | | | 3,480 |
| Wisconsin Health & Edl. Facilities Auth. Rev.: | | | | | | |
| Participating VRDN: | | | | | | |
| Series PA 970, 2.53% (Liquidity Facility Merrill Lynch & | | | | | | |
| Co., Inc.) (c)(f) | | 2,995 | | | | 2,995 |
| Series PT 761, 2.53% (Liquidity Facility Svenska | | | | | | |
| Handelsbanken AB) (c)(f) | | 10,385 | | | | 10,385 |
| Series PT 917, 2.53% (Liquidity Facility Landesbank | | | | | | |
| Hessen-Thuringen) (c)(f) | | 17,900 | | | | 17,900 |
| (Oakwood Village Proj.) 2.5%, LOC M&I Marshall & Ilsley | | | | | | |
| Bank, VRDN (c) | | 10,555 | | | | 10,555 |
| | | | | | | 76,840 |
| |
| | | Shares | | | | |
| Other – 1.0% | | | | | | |
| Fidelity Tax Free Cash Central Fund, 2.45% (a)(d) | | 38,600 | | | | 38,600 |
| |
| TOTAL INVESTMENT PORTFOLIO 96.2% | | | | | | |
| (Cost $3,660,202) | | | | | | 3,660,202 |
| |
| NET OTHER ASSETS – 3.8% | | | | | | 143,137 |
| NET ASSETS 100% | | | | $ | | 3,803,339 |
| Security Type Abbreviations |
| CP | | | | COMMERCIAL PAPER |
| RAN | | | | REVENUE ANTICIPATION NOTE |
| TAN | | — | | TAX ANTICIPATION NOTE |
| TRAN | | | | TAX AND REVENUE |
| ANTICIPATION NOTE |
| VRDN | | — | | VARIABLE RATE DEMAND NOTE |
See accompanying notes which are an integral part of the financial statements.
Annual Report
Investments continued
Legend
|
(a) Affiliated fund that is available only to investment companies and other accounts managed by Fidelity Investments. The rate quoted is the annualized seven-day yield of the fund at period end. A complete listing of the fund’s holdings as of its most recent quarter end is available upon request. (b) Security or a portion of the security purchased on a delayed delivery or when-issued basis.
(c) The coupon rate shown on floating or adjustable rate securities represents the rate at period end.
(d) Information in this report regarding holdings by state and security types does not reflect the holdings of the Fidelity Tax-Free Cash Central Fund. (e) Security collateralized by an amount sufficient to pay interest and principal. (f) Provides evidence of ownership in one or more underlying municipal bonds.
(g) Restricted securities – Investment in securities not registered under the Securities Act of 1933 (excluding 144A issues). At the end of the period, the value of restricted securities (excluding 144A issues) amounted to $21,600,000 or 0.6% of net assets.
Additional information on each holding is as follows:
| | | Acquisition | | | | |
| Security | | Date | | Cost (000s) |
| Allegheny County | | | | | | |
| Hosp. Dev. Auth. | | | | | | |
| Rev. Bonds Series PT | | | | | | |
| 762, 2.85%, tender | | | | | | |
| 6/15/06 (Liquidity | | | | | | |
| Facility Landesbank | | | | | | |
| Hessen Thuringen) | | 6/17/05 | | $ | | 8,900 |
| Houston Gen. | | | | | | |
| Oblig. Bonds Series | | | | | | |
| PT 969, 2.95%, | | | | | | |
| tender 7/20/06 | | | | | | |
| (Liquidity Facility | | | | | | |
| DEPFA BANK PLC) | | 5/27/04 | | $ | | 12,700 |
See accompanying notes which are an integral part of the financial statements.
| Financial Statements | | | | | | | | |
| |
| |
| Statement of Assets and Liabilities | | | | | | | | |
| Amounts in thousands (except per share amount) | | | | | | | | August 31, 2005 |
| |
| Assets | | | | | | | | |
| Investment in securities, at value (cost $3,660,202) | | | | | | | | |
| See accompanying schedule | | | | | | $ | | 3,660,202 |
| Cash | | | | | | | | 172,441 |
| Receivable for investments sold on a delayed delivery | | | | | | | | |
| basis | | | | | | | | 14,000 |
| Receivable for fund shares sold | | | | | | | | 8,800 |
| Interest receivable | | | | | | | | 17,729 |
| Receivable from investment adviser for expense | | | | | | | | |
| reductions | | | | | | | | 298 |
| Other receivables | | | | | | | | 285 |
| Total assets | | | | | | | | 3,873,755 |
| |
| Liabilities | | | | | | | | |
| Payable for investments purchased | | | | | | | | |
| Regular delivery | | $ | | 13,484 | | | | |
| Delayed delivery | | | | 38,552 | | | | |
| Payable for fund shares redeemed | | | | 16,307 | | | | |
| Distributions payable | | | | 696 | | | | |
| Accrued management fee | | | | 1,372 | | | | |
| Other affiliated payables | | | | 5 | | | | |
| Total liabilities | | | | | | | | 70,416 |
| |
| Net Assets | | | | | | $ | | 3,803,339 |
| Net Assets consist of: | | | | | | | | |
| Paid in capital | | | | | | $ | | 3,803,541 |
| Undistributed net investment income | | | | | | | | 72 |
| Accumulated undistributed net realized gain (loss) on | | | | | | | | |
| investments | | | | | | | | (274) |
| Net Assets, for 3,802,775 shares outstanding | | | | | | $ | | 3,803,339 |
| Net Asset Value, offering price and redemption price per | | | | | | |
| share ($3,803,339 ÷ 3,802,775 shares) | | | | | | $ | | 1.00 |
See accompanying notes which are an integral part of the financial statements.
39 Annual Report
| Financial Statements continued | | | | | | |
| |
| |
| Statement of Operations | | | | | | |
| Amounts in thousands | | | | Year ended August 31, 2005 |
| |
| Investment Income | | | | | | |
| Interest | | | | $ | | 72,858 |
| |
| Expenses | | | | | | |
| Management fee | | $ | | 15,250 | | |
| Independent trustees’ compensation | | | | 17 | | |
| Total expenses before reductions | | | | 15,267 | | |
| Expense reductions | | | | (5,704) | | 9,563 |
| |
| Net investment income | | | | | | 63,295 |
| |
| Net realized gain (loss) on investment securities | | | | | | (268) |
| Net increase in net assets resulting from operations | | | | $ | | 63,027 |
See accompanying notes which are an integral part of the financial statements.
| Statement of Changes in Net Assets | | | | | | | | | | |
| | | | | | | Year ended | | | | Year ended |
| | | | | | | August 31, | | | | August 31, |
| Amounts in thousands | | | | | | 2005 | | | | 2004 |
| Increase (Decrease) in Net Assets | | | | | | | | | | |
| Operations | | | | | | | | | | |
| Net investment income | | | | $ | | 63,295 | | $ | | 23,706 |
| Net realized gain (loss) | | | | | | (268) | | | | 939 |
| Net increase in net assets resulting | | | | | | | | | | |
| from operations | | | | | | 63,027 | | | | 24,645 |
| Distributions to shareholders from net investment income | | . | | | | (63,300) | | | | (23,706) |
| Distributions to shareholders from net realized gain | | | | | | (667) | | | | (604) |
| Total distributions | | | | | | (63,967) | | | | (24,310) |
| Share transactions at net asset value of $1.00 per share | | | | | | | | | | |
| Proceeds from sales of shares | | | | | | 4,222,012 | | | | 3,096,884 |
| Reinvestment of distributions | | | | | | 57,671 | | | | 22,240 |
| Cost of shares redeemed | | | | | | (3,784,488) | | | | (2,848,288) |
| Net increase (decrease) in net assets and shares | | | | | | | | | | |
| resulting from share transactions | | | | | | 495,195 | | | | 270,836 |
| Total increase (decrease) in net assets | | | | | | 494,255 | | | | 271,171 |
| |
| Net Assets | | | | | | | | | | |
| Beginning of period | | | | | | 3,309,084 | | | | 3,037,913 |
| End of period (including undistributed net investment | | | | | | | | | | |
| income of $72 and $0, respectively) | | | | $ | | 3,803,339 | | $ | | 3,309,084 |
See accompanying notes which are an integral part of the financial statements.
41 Annual Report
| Financial Highlights | | | | | | | | | | | | | | | | | | | | |
| |
| Years ended August 31, | | | | 2005 | | | | 2004 | | | | 2003 | | | | 2002 | | | | 2001 |
| Selected Per Share Data | | | | | | | | | | | | | | | | | | | | |
| Net asset value, | | | | | | | | | | | | | | | | | | | | |
| beginning of period | | $ | | 1.00 | | $ | | 1.00 | | $ | | 1.00 | | $ | | 1.00 | | $ | | 1.00 |
| Income from Investment | | | | | | | | | | | | | | | | | | | | |
| Operations | | | | | | | | | | | | | | | | | | | | |
| Net investment income | | | | 018 | | | | .008 | | | | .010 | | | | .015 | | | | .033 |
| Net realized and unrealized | | | | | | | | | | | | | | | | | | | | |
| gain (loss)D | | | | — | | | | — | | | | — | | | | — | | | | — |
| Total from investment | | | | | | | | | | | | | | | | | | | | |
| operations | | | | 018 | | | | .008 | | | | .010 | | | | .015 | | | | .033 |
| Distributions from net investment | | | | | | | | | | | | | | | | | | | | |
| income | | | | (.018) | | | | (.008) | | | | (.010) | | | | (.015) | | | | (.033) |
| Distributions from net realized | | | | | | | | | | | | | | | | | | | | |
| gain | | | | —D | | | | —D | | | | — | | | | — | | | | — |
| Total distributions | | | | (.018) | | | | (.008) | | | | (.010) | | | | (.015) | | | | (.033) |
| Net asset value, end of period | | $ | | 1.00 | | $ | | 1.00 | | $ | | 1.00 | | $ | | 1.00 | | $ | | 1.00 |
| Total ReturnA,B | | | | 1.79% | | | | .79% | | | | .98% | | | | 1.48% | | | | 3.38% |
| Ratios to Average Net AssetsC | | | | | | | | | | | | | | | | | | | | |
| Expenses before expense | | | | | | | | | | | | | | | | | | | | |
| reductions | | | | 43% | | | | .43% | | | | .43% | | | | .44% | | | | .50% |
| Expenses net of voluntary | | | | | | | | | | | | | | | | | | | | |
| waivers, if any | | | | 33% | | | | .33% | | | | .33% | | | | .34% | | | | .40% |
| Expenses net of all reductions | | | | 27% | | | | .32% | | | | .31% | | | | .30% | | | | .37% |
| Net investment income | | | | 1.78% | | | | .76% | | | | .97% | | | | 1.45% | | | | 3.31% |
| Supplemental Data | | | | | | | | | | | | | | | | | | | | |
| Net assets, end of period | | | | | | | | | | | | | | | | | | | | |
| (in millions) | | $ 3,803 | | $ 3,309 | | $ 3,038 | | $ 2,751 | | $ 2,453 |
A Total returns would have been lower had certain expenses not been reduced during the periods shown.
B Total returns do not include the effect of the former account closeout fee.
C Expense ratios reflect operating expenses of the fund. Expenses before reductions do not reflect amounts reimbursed by the investment adviser or reductions from brokerage service arrangements or other expense offset arrangements and do not represent the amount paid by the fund during periods when reimbursements or reductions occur. Expenses net of any voluntary waivers reflect expenses after reimbursement by the investment adviser but prior to reductions from brokerage service arrangements or other expense offset arrangements. Expenses net of all reductions represent the net expenses paid by the fund.
D Amount represents less than $.001 per share.
See accompanying notes which are an integral part of the financial statements.
Notes to Financial Statements
For the period ended August 31, 2005
(Amounts in thousands except ratios)
|
1. Significant Accounting Policies.
Fidelity AMT Tax Free Money Fund (the fund) is a fund of Fidelity Union Street Trust II (the trust) and is authorized to issue an unlimited number of shares. On July 21, 2005, the Board of Trustees approved a change in the name of Spartan Municipal Money Fund to Fidelity AMT Tax Free Money Fund effective August 15, 2005. The trust is registered under the Investment Company Act of 1940, as amended (the 1940 Act), as an open end management investment company organized as a Delaware statutory trust. The financial statements have been prepared in conformity with accounting principles generally accepted in the United States of America, which require management to make certain estimates and assumptions at the date of the financial statements. The following summa rizes the significant accounting policies of the fund:
Security Valuation. Net asset value per share is calculated as of the close of business of the New York Stock Exchange, normally 4:00 p.m. Eastern time. As permitted under Rule
2a 7 of the 1940 Act, and certain conditions therein, securities are valued initially at cost and thereafter assume a constant amortization to maturity of any discount or premium. Investments in open end investment companies are valued at their net asset value each business day.
Investment Transactions and Income. Security transactions are accounted for as of trade date. Gains and losses on securities sold are determined on the basis of identified cost. Interest income is accrued as earned. Interest income includes coupon interest and amortization of premium and accretion of discount on debt securities.
Expenses. Most expenses of the trust can be directly attributed to a fund. Expenses which cannot be directly attributed are apportioned among each fund in the trust.
Income Tax Information and Distributions to Shareholders. Each year, the fund intends to qualify as a regulated investment company by distributing all of its taxable income and realized gains under Subchapter M of the Internal Revenue Code. As a result, no provision for income taxes is required in the accompanying financial statements.
Dividends are declared daily and paid monthly from net investment income. Distribu tions from realized gains, if any, are recorded on the ex dividend date. Income and capital gain distributions are determined in accordance with income tax regulations, which may differ from generally accepted accounting principles. In addition, the fund will claim a portion of the payment made to redeeming shareholders as a distribution for income tax purposes.
Capital accounts within the financial statements are adjusted for permanent book tax differences. These adjustments have no impact on net assets or the results of operations. Temporary book tax differences will reverse in a subsequent period.
43 Annual Report
Notes to Financial Statements continued
(Amounts in thousands except ratios)
1. Significant Accounting Policies continued
Income Tax Information and Distributions to Shareholders continued
|
Book tax differences are primarily due to deferred trustees compensation and losses deferred due to wash sales and excise tax regulations.
The fund purchases municipal securities whose interest, in the opinion of the issuer, is free from federal income tax. There is no assurance that the Internal Revenue Service (IRS) will agree with this opinion. In the event the IRS determines that the issuer does not comply with relevant tax requirements, interest payments from a security could become federally taxable, possibly retroactively to the date the security was issued.
The tax basis components of distributable earnings and the federal tax cost as of period end were as follows:
| Unrealized appreciation | | $ | | — | | | | |
| Unrealized depreciation | | | | — | | | | |
| Net unrealized appreciation (depreciation) | | | | — | | | | |
| Undistributed ordinary income | | | | 77 | | | | |
| |
| Cost for federal income tax purposes | | $ | | 3,660,202 | | | | |
| |
| The tax character of distributions paid was as follows: | | | | |
| |
| | | | | August 31, 2005 | | | | August 31, 2004 |
| Tax exempt Income | | $ | | 63,300 | | $ | | 23,706 |
| Long term Capital Gains | | | | 667 | | | | 604 |
| Total | | $ | | 63,967 | | $ | | 24,310 |
| |
| 2. Operating Policies. | | | | | | | | |
Delayed Delivery Transactions and When Issued Securities. The fund may purchase or sell securities on a delayed delivery or when issued basis. Payment and delivery may take place after the customary settlement period for that security. The price of the underlying securities and the date when the securities will be delivered and paid for are fixed at the time the transaction is negotiated. During the time a delayed delivery sell is outstanding, the contract is marked to market daily and equivalent deliverable securities are held for the transaction. The value of the securities purchased on a delayed delivery or when issued basis are identified as such in the fund’s Schedule of Investments. The fund may receive compensation for interest forgone in the purchase of a delayed delivery or when issued security. With respect to purchase commitments, the fund identifies securities as segregated in its records with a value at least equal to the amount of the commitment. Losses may arise due to changes in the value of the underly ing securities or if the counterparty does not perform under the contract’s terms, or if the issuer does not issue the securities due to political, economic, or other factors.
2. Operating Policies continued
Restricted Securities. The fund may invest in securities that are subject to legal or contractual restrictions on resale. These securities generally may be resold in transac tions exempt from registration or to the public if the securities are registered. Disposal of these securities may involve time consuming negotiations and expense, and prompt sale at an acceptable price may be difficult. Information regarding restricted securities is included at the end of the fund’s Schedule of Investments.
3. Fees and Other Transactions with Affiliates.
Management Fee. Fidelity Management & Research Company (FMR) and its affiliates provide the fund with investment management related services for which the fund pays a monthly management fee that is based on an annual rate of .43% of the fund’s average net assets. FMR pays all other expenses, except the compensation of the independent Trustees and certain exceptions such as interest expense. The management fee paid to FMR by the fund is reduced by an amount equal to the fees and expenses paid by the fund to the independent Trustees.
Affiliated Central Funds. The fund may invest in Money Market Central Funds which seek preservation of capital and current income and are managed by Fidelity Invest ments Money Management, Inc. (FIMM) an affiliate of FMR.
The Money Market Central Funds do not pay a management fee. Income distributions earned by the fund are recorded as income in the accompanying financial statements and totaled $470 for the period.
FMR voluntarily agreed to reimburse the fund to the extent annual operating expenses exceeded .33% of average net assets. Some expenses, for example interest expense, are excluded from this reimbursement. During the period, this reimbursement reduced the fund’s expenses by $3,548.
In addition, through arrangements with the fund’s custodian and transfer agent, credits realized as a result of uninvested cash balances were used to reduce the fund’s manage ment fee. During the period, these credits reduced the fund’s management fee by $2,156.
45 Annual Report
Notes to Financial Statements continued
(Amounts in thousands except ratios)
5. Other.
The fund’s organizational documents provide former and current trustees and officers with a limited indemnification against liabilities arising in connection with the perfor mance of their duties to the fund. In the normal course of business, the fund may also enter into contracts that provide general indemnifications. The fund’s maximum exposure under these arrangements is unknown as this would be dependent on future claims that may be made against the fund. The risk of material loss from such claims is considered remote.
Report of Independent Registered Public Accounting Firm
To the Trustees of Fidelity Union Street Trust II and the Shareholders of Fidelity AMT Tax Free Money Fund (formerly Spartan Municipal Money Fund):
In our opinion, the accompanying statement of assets and liabilities, including the sched ule of investments, and the related statements of operations and of changes in net assets and the financial highlights present fairly, in all material respects, the financial position of Fidelity AMT Tax Free Money Fund (formerly Spartan Municipal Money Fund) (a fund of Fidelity Union Street Trust II) at August 31, 2005 and the results of its operations, the changes in its net assets and the financial highlights for the periods indicated, in confor mity with accounting principles generally accepted in the United States of America. These financial statements and financial highlights (hereafter referred to as “financial state ments”) are the responsibility of the Fidelity AMT Tax Free Money Fund’s management; our responsibility is to express an opinion on these financial statements based on our audits. We conducted our audits of these financial statements in accordance with the standards of the Public Company Accounting Oversight Board (United States). Those standards require that we plan and perform the audit to obtain reasonable assurance about whether the financial statements are free of material misstatement. An audit includes examining, on a test basis, evidence supporting the amounts and disclosures in the financial statements, assessing the accounting principles used and significant esti mates made by management, and evaluating the overall financial statement presentation. We believe that our audits, which included confirmation of securities at August 31, 2005 by correspondence with the custodian and brokers, provide a reasonable basis for our opinion.
/s/ PricewaterhouseCoopers LLP PricewaterhouseCoopers LLP
Boston, Massachusetts
October 10, 2005
|
47 Annual Report
Trustees and Officers
The Trustees, Members of the Advisory Board, and executive officers of the trust and fund, as applicable, are listed below. The Board of Trustees governs the fund and is responsible for protecting the interests of shareholders. The Trustees are experienced executives who meet periodically throughout the year to oversee the fund’s activities, review contractual arrangements with companies that provide services to the fund, and review the fund’s performance. Except for William O. McCoy, Stephen P. Jonas, and Kenneth L. Wolfe, each of the Trustees oversees 321 funds advised by FMR or an affiliate. Mr. McCoy oversees 323 funds advised by FMR or an affiliate. Mr. Jonas and Mr. Wolfe oversee 312 funds advised by FMR or an affiliate.
The Trustees hold office without limit in time except that (a) any Trustee may resign; (b) any Trustee may be removed by written instrument, signed by at least two thirds of the number of Trustees prior to such removal; (c) any Trustee who requests to be retired or who has become incapacitated by illness or injury may be retired by written instru ment signed by a majority of the other Trustees; and (d) any Trustee may be removed at any special meeting of shareholders by a two thirds vote of the outstanding voting securities of the trust. Each Trustee who is not an interested person (as defined in the 1940 Act) (Independent Trustee), shall retire not later than the last day of the calendar year in which his or her 72nd birthday occurs. The Independent Trustees may waive this mandatory retirement age policy with respect to individual Trustees. The executive officers and Advisory Board Members hold office without limit in time, except that any officer and Advisory Board Member may resign or may be removed by a vote of a majority of the Trustees at any regular meeting or any special meeting of the Trustees. Except as indicated, each individual has held the office shown or other offices in the same company for the past five years.
The fund’s Statement of Additional Information (SAI) includes more information about the Trustees. To request a free copy, call Fidelity at 1-800-544-8544.
Correspondence intended for each Trustee who is an interested person may be sent to Fidelity Investments, 82 Devonshire Street, Boston, Massachusetts 02109.
| | Name, Age; Principal Occupation
Edward C. Johnson 3d (75)**
|
Year of Election or Appointment: 1991
Mr. Johnson is Chairman of the Board of Trustees. Mr. Johnson serves as Chief Executive Officer, Chairman, and a Director of FMR Corp.; a Director and Chairman of the Board and of the Executive Committee of FMR; Chairman and a Director of Fidelity Management & Research (Far East) Inc.; Chairman and a Director of Fidelity Investments Money Management, Inc.; and Chairman (2001 present) and a Director (2000 present) of FMR Co., Inc.
| | Name, Age; Principal Occupation
Abigail P. Johnson (43)**
|
Year of Election or Appointment: 2001
Ms. Johnson serves as President of Fidelity Employer Services Company (FESCO) (2005 present). She is President and a Director of Fidelity Investments Money Management, Inc. (2001 present), FMR Co., Inc. (2001 present), and a Director of FMR Corp. Previously, Ms. Johnson served as President and a Director of FMR (2001 2005), Senior Vice President of the Fidelity funds (2001 2005), and managed a number of Fidelity funds.
Year of Election or Appointment: 2005
Mr. Jonas is Senior Vice President of AMT Tax Free Money (2005 present). He also serves as Senior Vice President of other Fidelity funds (2005 present). Mr. Jonas is Executive Director of FMR (2005 present). Previously, Mr. Jonas served as President of Fidelity Enterprise Operations and Risk Services (2004 2005), Chief Adminis trative Officer (2002 2004), and Chief Financial Officer of FMR Co. (1998 2000). Mr. Jonas has been with Fidelity Investments since 1987 and has held various financial and management positions including Chief Financial Officer of FMR. In addition, he serves on the Boards of Boston Ballet (2003 present) and Simmons College (2003 present).
Year of Election or Appointment: 2003
Mr. Reynolds is a Director (2003 present) and Chief Operating Officer (2002 present) of FMR Corp. He also serves on the Board at Fidelity Investments Canada, Ltd. (2000 present). Previously, Mr. Reynolds served as President of Fidelity Investments Institutional Retirement Group (1996 2000).
* Trustees have been determined to be “Interested Trustees” by virtue of, among other things, their affiliation with the trust or various entities under common control with FMR.
** Edward C. Johnson 3d, Trustee, is Abigail P. Johnson’s father.
49 Annual Report
Trustees and Officers - continued
Independent Trustees:
Correspondence intended for each Independent Trustee (that is, the Trustees other than the Interested Trustees) may be sent to Fidelity Investments, P.O. Box 55235, Boston, Massachusetts 02205 5235.
| | Name, Age; Principal Occupation
Dennis J. Dirks (57)
|
Year of Election or Appointment: 2005
Prior to his retirement in May 2003, Mr. Dirks was Chief Operating Officer and a member of the Board of The Depository Trust & Clearing Corporation (DTCC) (1999 2003). He also served as President, Chief Operating Officer, and Board member of The Depository Trust Com pany (DTC) (1999 2003) and President and Board member of the National Securities Clearing Corporation (NSCC) (1999 2003). In addi tion, Mr. Dirks served as Chief Executive Officer and Board member of the Government Securities Clearing Corporation (2001 2003) and Chief Executive Officer and Board member of the Mortgage Backed Securities Clearing Corporation (2001 2003). Mr. Dirks also serves as a Trustee of Manhattan College (2005 present).
Year of Election or Appointment: 1997
Dr. Gates is Vice Chairman of the Independent Trustees (2005 present). Dr. Gates is President of Texas A&M University (2002 present). He was Director of the Central Intelligence Agency (CIA) from 1991 to 1993. From 1989 to 1991, Dr. Gates served as Assistant to the President of the United States and Deputy National Security Advisor. Dr. Gates is a Director of NACCO Industries, Inc. (mining and manufacturing), Parker Drilling Co., Inc. (drilling and rental tools for the energy industry, 2001 present), and Brinker International (restaurant management, 2003 present). Previously, Dr. Gates served as a Director of LucasVarity PLC (automotive components and diesel engines), a Director of TRW Inc. (automotive, space, defense, and information technology), and Dean of the George Bush School of Government and Public Service at Texas A&M University (1999 2001). Dr. Gates also is a Trustee of the Forum for International Policy.
Name, Age; Principal Occupation
George H. Heilmeier (69)
|
Year of Election or Appointment: 2004
Dr. Heilmeier is Chairman Emeritus of Telcordia Technologies (commu nication software and systems), where prior to his retirement, he served as company Chairman and Chief Executive Officer. He currently serves on the Boards of Directors of The Mitre Corporation (systems engineer ing and information technology support for the government), and HRL Laboratories (private research and development, 2004 present). He is Chairman of the General Motors Science & Technology Advisory Board and a Life Fellow of the Institute of Electrical and Electronics Engineers (IEEE) (2000 present). Dr. Heilmeier is a member of the Defense Science Board and the National Security Agency Advisory Board. He is also a member of the National Academy of Engineering, the American Academy of Arts and Sciences, and the Board of Overseers of the School of Engineering and Applied Science of the University of Pennsylvania. Previously, Dr. Heilmeier served as a Director of TRW Inc. (automotive, space, defense, and information technology, 1992 2002), Compaq (1994 2002), Automatic Data Processing, Inc. (ADP) (technology based business outsourcing, 1995 2002), INET Technologies Inc. (telecommu nications network surveillance, 2001 2004), and Teletech Holdings (customer management services). He is the recipient of the 2005 Kyoto Prize in Advanced Technology for his invention of the liquid display.
Year of Election or Appointment: 2001
Prior to Ms. Knowles’ retirement in June 2000, she served as Executive Vice President and Chief Financial Officer of Atlantic Richfield Company (ARCO) (diversified energy, 1996 2000). From 1993 to 1996, she was a Senior Vice President of ARCO and President of ARCO Transportation Company. She served as a Director of ARCO from 1996 to 1998. She currently serves as a Director of Phelps Dodge Corporation (copper mining and manufacturing) and McKesson Corporation (healthcare service, 2002 present). Ms. Knowles is a Trustee of the Brookings Institu tion and the Catalina Island Conservancy and also serves as a member of the Advisory Board for the School of Engineering of the University of Southern California.
51 Annual Report
Trustees and Officers - continued
| | Name, Age; Principal Occupation
Ned C. Lautenbach (61)
|
Year of Election or Appointment: 2000
Mr. Lautenbach has been a partner of Clayton, Dubilier & Rice, Inc. (private equity investment firm) since September 1998. Previously, Mr. Lautenbach was with the International Business Machines Corporation (IBM) from 1968 until his retirement in 1998. Mr. Lautenbach serves as a Director of Italtel Holding S.p.A. (telecommunications (Milan, Italy), 2004 present) and Eaton Corporation (diversified industrial) as well as the Philharmonic Center for the Arts in Naples, Florida. He also is a member of the Board of Trustees of Fairfield University (2005 present), as well as a member of the Council on Foreign Relations.
Year of Election or Appointment: 1993
Mr. Mann is Chairman of the Independent Trustees (2001 present). He is Chairman Emeritus of Lexmark International, Inc. (computer peripherals), where he served as CEO until April 1998, retired as Chairman May 1999, and remains a member of the Board. Prior to 1991, he held the positions of Vice President of International Business Machines Corpora tion (IBM) and President and General Manager of various IBM divisions and subsidiaries. He is a member of the Executive Committee of the Independent Director’s Council of the Investment Company Institute. In addition, Mr. Mann is a member of the President’s Cabinet at the Uni versity of Alabama and the Board of Visitors of the Culverhouse College of Commerce and Business Administration at the University of Alabama.
Year of Election or Appointment: 1997
Prior to his retirement in December 1994, Mr. McCoy was Vice Chair man of the Board of BellSouth Corporation (telecommunications) and President of BellSouth Enterprises. He is currently a Director of Liberty Corporation (holding company), Duke Realty Corporation (real estate), and Progress Energy, Inc. (electric utility). He is also a partner of Frank lin Street Partners (private investment management firm) and a member of the Research Triangle Foundation Board. In addition, Mr. McCoy served as the Interim Chancellor (1999 2000) and a member of the Board of Visitors for the University of North Carolina at Chapel Hill and currently serves on the Board of Directors of the University of North Carolina Health Care System and the Board of Visitors of the Kenan Flagler Business School (University of North Carolina at Chapel Hill). He also served as Vice President of Finance for the University of North Carolina (16 school system).
Name, Age; Principal Occupation
Cornelia M. Small (61)
|
Year of Election or Appointment: 2005
Ms. Small is a member (2000 present) and Chairperson (2002 present) of the Investment Committee, and a member (2002 present) of the Board of Trustees of Smith College. Previously, she served as Chief Investment Officer (1999 2000), Director of Global Equity Investments (1996 1999), and a member of the Board of Directors of Scudder, Stevens & Clark (1990 1997) and Scudder Kemper Investments (1997 1998). In addition, Ms. Small served as Co Chair (2000 2003) of the Annual Fund for the Fletcher School of Law and Diplomacy.
William S. Stavropoulos (66)
|
Year of Election or Appointment: 2002
Mr. Stavropoulos is Chairman of the Board (2000 present) and a Member of the Board of Directors of The Dow Chemical Company. Since joining The Dow Chemical Company in 1967, Mr. Stavropoulos served in numerous senior management positions, including President (1993 2000; 2002 2003), CEO (1995 2000; 2002 2004), and Chair man of the Executive Committee (2000 2004). Currently, he is a Direc tor of NCR Corporation (data warehousing and technology solutions), BellSouth Corporation (telecommunications), Chemical Financial Corpo ration, Maersk Inc. (industrial conglomerate, 2002 present), and Metal mark Capital (private equity investment firm, 2005 present). He also serves as a member of the Board of Trustees of the American Enterprise Institute for Public Policy Research. In addition, Mr. Stavropoulos is a member of The Business Council, J.P. Morgan International Council and the University of Notre Dame Advisory Council for the College of Science.
Year of Election or Appointment: 2005
Mr. Wolfe also serves as a Trustee (2005 present) or Member of the Advisory Board (2004 present) of other investment companies advised by FMR. Prior to his retirement in 2001, Mr. Wolfe was Chairman and Chief Executive Officer of Hershey Foods Corporation (1993 2001). He currently serves as a member of the boards of Adelphia Communica tions Corporation (2003 present), Bausch & Lomb, Inc., and Revlon Inc. (2004 present).
53 Annual Report
Trustees and Officers - continued
Advisory Board Members and Executive Officers:
Correspondence intended for Mr. Gamper may be sent to Fidelity Investments, P.O. Box 55235, Boston, Massachusetts 02205-5235. Correspondence intended for each executive officer and Mr. Lynch may be sent to Fidelity Investments, 82 Devonshire Street, Boston, Massachusetts 02109.
| | Name, Age; Principal Occupation
Albert R. Gamper, Jr. (63)
|
Year of Election or Appointment: 2005
Member of the Advisory Board of Fidelity Union Street Trust II. Prior to his retirement in December 2004, Mr. Gamper served as Chairman of the Board of CIT Group Inc. (commercial finance). During his tenure with CIT Group Inc. Mr. Gamper served in numerous senior management positions, including Chairman (1987 1989; 1999 2001; 2002 2004), Chief Executive Officer (1987 2004), and President (1989 2002). He currently serves as a member of the Board of Directors of Public Service Enterprise Group (utilities, 2001 present), Chairman of the Board of Governors, Rutgers University (2004 present), and Chairman of the Board of Saint Barnabas Health Care System.
Year of Election or Appointment: 2003
Member of the Advisory Board of Fidelity Union Street Trust II. Vice Chairman and a Director of FMR, and Vice Chairman (2001 present) and a Director (2000 present) of FMR Co., Inc. Previously, Mr. Lynch served as a Trustee of the Fidelity funds (1990 2003). In addition, he serves as a Trustee of Boston College, Massachusetts Eye & Ear Infirmary, Historic Deerfield, John F. Kennedy Library, and the Museum of Fine Arts of Boston.
Year of Election or Appointment: 2005
Vice President of AMT Tax Free Money. Mr. Donovan also serves as Vice President of Fidelity’s High Income Funds (2005 present), Fidelity’s Fixed Income Funds (2005 present), certain Asset Allocation Funds (2005 present), and certain Balanced Funds (2005 present). Mr. Donovan also serves as Executive Vice President of FMR (2005 present) and FMRC (2005 present). Previously, Mr. Donovan served as Vice President and Director of Fidelity’s International Equity Trading group (1998 2005).
Name, Age; Principal Occupation
Charles S. Morrison (44)
|
Year of Election or Appointment: 2005
Vice President of AMT Tax Free Money. Mr. Morrison also serves as Vice President of Fidelity’s Money Market Funds (2005 present) and certain Asset Allocation Funds (2002 present). Previously, he served as Vice President of Fidelity’s Bond Funds (2002 2005) and certain Balanced Funds (2002 2005). He served as Vice President (2002 2005) and Bond Group Leader (2002 2005) of Fidelity Investments Fixed Income Division. Mr. Morrison is also Vice President of FIMM (2002 present) and FMR (2002 present). Mr. Morrison joined Fidelity Investments in 1987 as a Corporate Bond Analyst in the Fixed Income Research Division.
Year of Election or Appointment: 2002
Vice President of AMT Tax Free Money. Mr. Murphy also serves as Vice President of Fidelity’s Money Market Funds (2002 present), certain Asset Allocation Funds (2003 present), Fidelity’s Investment Grade Bond Funds (2005 present), and Fidelity’s Balanced Funds (2005 present). He serves as Senior Vice President (2000 present) and Head (2004 present) of the Fidelity Investments Fixed Income Division. Mr. Murphy is also a Senior Vice President of FIMM (2003 present) and a Vice President of FMR (2000 present). Previously, Mr. Murphy served as Money Market Group Leader (2002 2004), Bond Group Leader (2000 2002), and Vice President of Fidelity’s Taxable Bond Funds (2000 2002) and Fidelity’s Municipal Bond Funds (2001 2002). Mr. Murphy joined Fidelity Investments in 1989 as a portfolio manager in the Bond Group.
Year of Election or Appointment: 2004
Vice President of AMT Tax Free Money. Mr. Marchese also serves as Vice President of other funds advised by FMR. Prior to assuming his current responsibilities, Mr. Marchese managed a varity of Fidelity funds.
Year of Election or Appointment: 1998
Secretary of AMT Tax Free Money. He also serves as Secretary of other Fidelity funds; Vice President, General Counsel, and Secretary of FMR Co., Inc. (2001 present) and FMR; Assistant Secretary of Fidelity Man agement & Research (U.K.) Inc. (2001 present), Fidelity Management & Research (Far East) Inc. (2001 present), and Fidelity Investments Money Management, Inc. (2001 present). Mr. Roiter is an Adjunct Member, Faculty of Law, at Boston College Law School (2003 present). Previously, Mr. Roiter served as Vice President and Secretary of Fidelity Distributors Corporation (FDC) (1998 2005).
55 Annual Report
Trustees and Officers - continued
| | Name, Age; Principal Occupation
|
Year of Election or Appointment: 2003
Assistant Secretary of AMT Tax Free Money. Mr. Fross also serves as Assistant Secretary of other Fidelity funds (2003 present), Vice President and Secretary of FDC (2005 present), and is an employee of FMR.
Year of Election or Appointment: 2004
President, Treasurer, and Anti Money Laundering (AML) officer of AMT Tax Free Money. Ms. Reynolds also serves as President, Treasurer, and AML officer of other Fidelity funds (2004) and is a Vice President (2003) and an employee (2002) of FMR. Before joining Fidelity Investments, Ms. Reynolds worked at PricewaterhouseCoopers LLP (PwC) (1980 2002), where she was most recently an audit partner with PwC’s investment management practice.
Year of Election or Appointment: 2002
Chief Financial Officer of AMT Tax Free Money. Mr. Hayes also serves as Chief Financial Officer of other Fidelity funds (2002 present) and President of Fidelity Investment Operations (2005 present) which includes Fidelity Pricing and Cash Management Services Group (FPCMS), where he served as President (1998 2005). Mr. Hayes serves as President of Fidelity Service Company (2003 present) where he also serves as a Director. Mr. Hayes also served as President of Fidelity Investments Operations Group (FIOG, 2002 2005).
| | Kenneth A. Rathgeber (58)
|
Year of Election or Appointment: 2004
Chief Compliance Officer of AMT Tax Free Money. Mr. Rathgeber also serves as Chief Compliance Officer of other Fidelity funds (2004) and Executive Vice President of Risk Oversight for Fidelity Investments (2002). Previously, he served as Executive Vice President and Chief Operating Officer for Fidelity Investments Institutional Services Company, Inc. (1998 2002).
Year of Election or Appointment: 2003
Deputy Treasurer of AMT Tax Free Money. Mr. Hebble also serves as Deputy Treasurer of other Fidelity funds (2003), and is an employee of FMR. Before joining Fidelity Investments, Mr. Hebble worked at Deutsche Asset Management where he served as Director of Fund Accounting (2002 2003) and Assistant Treasurer of the Scudder Funds (1998 2003).
Name, Age; Principal Occupation
Bryan A. Mehrmann (44)
|
Year of Election or Appointment: 2005
Deputy Treasurer of AMT Tax Free Money. Mr. Mehrmann also serves as Deputy Treasurer of other Fidelity funds (2005 present) and is an employee of FMR. Previously, Mr. Mehrmann served as Vice President of Fidelity Investments Institutional Services Group (FIIS)/Fidelity Invest ments Institutional Operations Corporation, Inc. (FIIOC) Client Services (1998 2004).
Kimberley H. Monasterio (41)
|
Year of Election or Appointment: 2004
Deputy Treasurer of AMT Tax Free Money. Ms. Monasterio also serves as Deputy Treasurer of other Fidelity funds (2004) and is an employee of FMR (2004). Before joining Fidelity Investments, Ms. Monasterio served as Treasurer (2000 2004) and Chief Financial Officer (2002 2004) of the Franklin Templeton Funds and Senior Vice President of Franklin Templeton Services, LLC (2000 2004).
Year of Election or Appointment: 2005
Deputy Treasurer of AMT Tax Free Money. Mr. Robins also serves as Deputy Treasurer of other Fidelity funds (2005 present) and is an employee of FMR (2004 present). Before joining Fidelity Investments, Mr. Robins worked at KPMG LLP, where he was a partner in KPMG’s department of professional practice (2002 2004) and a Senior Manager (1999 2000). In addition, Mr. Robins served as Assistant Chief Accountant, United States Securities and Exchange Commission (2000 2002).
Year of Election or Appointment: 2005
Assistant Treasurer of AMT Tax Free Money. Mr. Byrnes also serves as Assistant Treasurer of other Fidelity funds (2005 present) and is an employee of FMR (2005 present). Previously, Mr. Byrnes served as Vice President of FPCMS (2003 2005). Before joining Fidelity Investments, Mr. Byrnes worked at Deutsche Asset Management where he served as Vice President of the Investment Operations Group (2000 2003).
Year of Election or Appointment: 1991
Assistant Treasurer of AMT Tax Free Money. Mr. Costello also serves as Assistant Treasurer of other Fidelity funds and is an employee of FMR.
57 Annual Report
Trustees and Officers - continued
| | Name, Age; Principal Occupation
Peter L. Lydecker (51)
|
Year of Election or Appointment: 2004
Assistant Treasurer of AMT Tax Free Money. Mr. Lydecker also serves as Assistant Treasurer of other Fidelity funds (2004) and is an employee of FMR.
Year of Election or Appointment: 2002
Assistant Treasurer of AMT Tax Free Money. Mr. Osterheld also serves as Assistant Treasurer of other Fidelity funds (2002) and is an employee of FMR.
Year of Election or Appointment: 2005
Assistant Treasurer of AMT Tax Free Money. Mr. Ryan also serves as Assistant Treasurer of other Fidelity funds (2005 present) and is an employee of FMR (2005 present). Previously, Mr. Ryan served as Vice President of Fund Reporting in FPCMS (1999 2005).
Year of Election or Appointment: 2005
Assistant Treasurer of AMT Tax Free Money. Mr. Schiavone also serves as Assistant Treasurer of other Fidelity funds (2005 present) and is an employee of FMR (2005 present). Before joining Fidelity Investments, Mr. Schiavone worked at Deutsche Asset Management, where he most recently served as Assistant Treasurer (2003 2005) of the Scudder Funds and Vice President and Head of Fund Reporting (1996 2003).
The fund hereby designates as capital gain dividends: For dividends with respect to the taxable year ended August 31, 2005, $6,000, or, if subsequently determined to be different, the net capital gain of such year, and for dividends with respect to the taxable year ended August 31, 2004, $662,000, or, if subsequently determined to be differ ent, the excess of: (a) the net capital gain of such year, over (b) amounts previously designated as capital gain dividends with respect to such year.
During fiscal year ended 2005, 100% of the fund’s income dividends was free from federal income tax, and 0.51% of the fund’s income dividends was subject to the federal alternative minimum tax.
The fund will notify shareholders in January 2006 of amounts for use in preparing 2005 income tax returns.
59 Annual Report
Proxy Voting Results
A special meeting of the fund’s shareholders was held on April 13, 2005. The results of votes taken among shareholders on proposals before them are reported below. Each vote reported represents one dollar of net asset value held on the record date for the meeting.
| PROPOSAL 1 | | | | |
| To amend the Trust Instrument to allow |
| the Board of Trustees, if permitted by |
| applicable law, to authorize fund mergers |
| without shareholder approval.* | | |
| | | # of | | % of |
| | | Votes | | Votes |
| Affirmative . | | 7,963,915,275.00 | | 80.395 |
| Against | | 1,604,213,132.51 | | 16.194 |
| Abstain | | 331,409,117.16 | | 3.346 |
| Broker | | | | |
| Non Votes | | 6,453,184.00 | | .065 |
| TOTAL | | 9,905,990,708.67 | | 100.000 |
| PROPOSAL 2 | | | | |
| To elect a Board of Trustees.* | | |
| | | # of | | % of |
| | | Votes | | Votes |
| Laura B. Cronin | | | | |
| Affirmative | | 9,373,053,787.27 | | 94.620 |
| Withheld | | 532,936,921.40 | | 5.380 |
| TOTAL | | 9,905,990,708.67 | | 100.000 |
| Dennis J. Dirks | | | | |
| Affirmative | | 9,385,368,522.63 | | 94.744 |
| Withheld | | 520,622,186.04 | | 5.256 |
| TOTAL | | 9,905,990,708.67 | | 100.000 |
| Robert M. Gates | | | | |
| Affirmative | | 9,372,071,963.26 | | 94.610 |
| Withheld | | 533,918,745.41 | | 5.390 |
| TOTAL | | 9,905,990,708.67 | | 100.000 |
| George H. Heilmeier | | |
| Affirmative | | 9,374,826,621.61 | | 94.638 |
| Withheld | | 531,164,087.06 | | 5.362 |
| TOTAL | | 9,905,990,708.67 | | 100.000 |
| Abigail P. Johnson | | |
| Affirmative | | 9,349,225,683.70 | | 94.380 |
| Withheld | | 556,765,024.97 | | 5.620 |
| TOTAL | | 9,905,990,708.67 | | 100.000 |
| | | # of | | % of |
| | | Votes | | Votes |
| Edward C. Johnson 3d | | |
| Affirmative | | 9,336,624,684.41 | | 94.252 |
| Withheld | | 569,366,024.26 | | 5.748 |
| TOTAL | | 9,905,990,708.67 | | 100.000 |
| Marie L. Knowles | | |
| Affirmative | | 9,385,202,135.87 | | 94.743 |
| Withheld | | 520,788,572.80 | | 5.257 |
| TOTAL | | 9,905,990,708.67 | | 100.000 |
| Ned C. Lautenbach | | |
| Affirmative | | 9,376,788,549.33 | | 94.658 |
| Withheld | | 529,202,159.34 | | 5.342 |
| TOTAL | | 9,905,990,708.67 | | 100.000 |
| Marvin L. Mann | | | | |
| Affirmative | | 9,361,169,551.40 | | 94.500 |
| Withheld | | 544,821,157.27 | | 5.500 |
| TOTAL | | 9,905,990,708.67 | | 100.000 |
| William O. McCoy | | |
| Affirmative | | 9,363,552,602.29 | | 94.524 |
| Withheld | | 542,438,106.38 | | 5.476 |
| TOTAL | | 9,905,990,708.67 | | 100.000 |
| Robert L. Reynolds | | |
| Affirmative | | 9,372,289,526.22 | | 94.612 |
| Withheld | | 533,701,182.45 | | 5.388 |
| TOTAL | | 9,905,990,708.67 | | 100.000 |
| Cornelia M. Small | | |
| Affirmative | | 9,384,016,844.12 | | 94.731 |
| Withheld | | 521,973,864.55 | | 5.269 |
| TOTAL | | 9,905,990,708.67 | | 100.000 |
| William S. Stavropoulos | | |
| Affirmative | | 9,373,082,552.28 | | 94.620 |
| Withheld | | 532,908,156.39 | | 5.380 |
| TOTAL | | 9,905,990,708.67 | | 100.000 |
| Kenneth L. Wolfe | | |
| Affirmative | | 9,374,633,251.39 | | 94.636 |
| Withheld | | 531,357,457.28 | | 5.364 |
| TOTAL | | 9,905,990,708.67 | | 100.000 |
* Denotes trust-wide proposals and voting results.
Annual Report
Board Approval of Investment Advisory Contracts and Management Fees
Fidelity AMT Tax Free Money Fund (formerly Spartan Municipal Money Fund)
Each year, typically in June, the Board of Trustees, including the independent Trustees (together, the Board), votes on the renewal of the management contract and sub advisory agreements (together, the Advisory Contracts) for the fund. The Board, assisted by the advice of fund counsel and independent Trustees’ counsel, requests and considers a broad range of information throughout the year.
The Board meets regularly each month except August and takes into account throughout the year matters bearing on Advisory Contracts. The Board, acting directly and through its separate committees, considers at each of its meetings factors that are relevant to the annual renewal of the fund’s Advisory Contracts, including the services and support provided to the fund and its shareholders by Fidelity. At the time of the renewal, the Board had 11 standing committees, each composed of independent Trustees with varying backgrounds, to which the Board has assigned specific subject matter responsibilities in order to enhance effective decision making by the Board. Each committee has adopted a written charter outlining the structure and purposes of the committee. One such com mittee, the Fixed Income Contract Committee, meets periodically during the first six months of each year and as necessary to consider matters specifically related to the annual renewal of Advisory Contracts. The committee requests and receives information on, and makes recommendations to the independent Trustees concerning, the approval and annual review of the Advisory Contracts.
At its June 2005 meeting, the Board of Trustees, including the independent Trustees, unanimously determined to renew the Advisory Contracts for the fund. In reaching its determination, the Board considered all factors it believed relevant, including (1) the nature, extent, and quality of the services to be provided to the fund and its shareholders by Fidelity (including the investment performance of the fund); (2) the competitiveness of the management fee and total expenses of the fund; (3) the total costs of the services to be provided by and the profits to be realized by the investment adviser and its affiliates from the relationship with the fund; (4) the extent to which economies of scale would be realized as the fund grows; and (5) whether fee levels reflect these economies of scale, if any, for the benefit of fund shareholders.
In determining whether to renew the Advisory Contracts for the fund, the Board ulti mately reached a determination, with the assistance of fund counsel and independent Trustees’ counsel, that the renewal of the Advisory Contracts and the compensation to be received by Fidelity under the management contract is consistent with Fidelity’s fidu ciary duty under applicable law. In addition to evaluating the specific factors noted above, the Board, in reaching its determination, is aware that shareholders in the fund have a broad range of investment choices available to them, including a wide choice among mutual funds offered by competitors to Fidelity, and that the fund’s shareholders, with the opportunity to review and weigh the disclosure provided by the fund in its
61 Annual Report
Board Approval of Investment Advisory Contracts and Management Fees continued
prospectus and other public disclosures, have chosen to invest in this fund, managed by Fidelity.
Nature, Extent, and Quality of Services Provided by Fidelity. The Board consid ered staffing within the investment adviser, FMR, and the sub advisers (together, the Investment Advisers), including the background of the fund’s portfolio manager and the fund’s investment objective and discipline. The independent Trustees also had discus sions with senior management of Fidelity’s investment operations and investment groups. The Board considered the structure of the portfolio manager compensation program and whether this structure provides appropriate incentives.
Fidelity Resources Dedicated to Investment Management and Support Services. The Board reviewed the size, education, and experience of the Investment Advisers’ invest ment staff, their use of technology, and the Investment Advisers’ approach to recruiting, training, and retaining portfolio managers and other research, advisory, and manage ment personnel. The Board considered Fidelity’s extensive global research capabilities that enable the Investment Advisers to aggregate data from various sources in an effort to produce positive investment results. The Board noted that Fidelity’s analysts have access to a variety of technological tools that enable them to perform both fundamental and quantitative analysis and to specialize in various disciplines. The Board also considered that Fidelity’s portfolio managers and analysts have access to daily portfolio attribution that allows for monitoring of a fund’s portfolio, as well as an electronic communication system that provides immediate real time access to research concerning issuers and credit enhancers.
Shareholder and Administrative Services. The Board considered the nature, extent, quality, and cost of administrative, distribution, and shareholder services performed by the Investment Advisers and their affiliates under the Advisory Contracts and under separate agreements covering transfer agency and pricing and bookkeeping services for the fund. The Board also considered the nature and extent of the Investment Advisers’ supervision of third party service providers, principally custodians and subcustodians. The Board also considered the resources devoted to, and the record of compliance with, the fund’s compliance policies and procedures.
The Board noted that the growth of fund assets across the complex allows Fidelity to reinvest in the development of services designed to enhance the value or convenience of the Fidelity funds as investment vehicles. These services include 24 hour access to account information and market information through phone representatives and over the Internet, and investor education materials and asset allocation tools.
Investment in a Large Fund Family. The Board considered the benefits to shareholders of investing in a Fidelity fund, including the benefits of investing in a fund that is part of a large family of funds offering a variety of investment disciplines and providing for a large variety of mutual fund investor services. For example, fund shareholders are offered the
privilege of exchanging shares of the fund for shares of other Fidelity funds, as set forth in the fund’s prospectus, without paying a sales charge. The Board noted that, since the last Advisory Contract renewals in June 2004, Fidelity has taken a number of actions that benefited particular funds, including (i) voluntarily deciding in 2004 to stop using “soft” commission dollars to pay for market data and, instead, to pay for that data out of its own resources, (ii) contractually agreeing to impose management fee reductions and expense limitations on its five Spartan stock index funds and its stock index fund available through variable insurance products, (iii) contractually agreeing to eliminate the management fees on the Fidelity Freedom Funds and the Fidelity Advisor Freedom Funds, (iv) contractually agreeing to reduce the management fees on most of its investment grade taxable bond funds, and (v) contractually agreeing to impose expense limitations on its retail and Spartan investment grade taxable bond funds.
Investment Performance. The Board considered whether the fund has operated within its investment objective, as well as its record of compliance with its investment restric tions. It also reviewed the fund’s absolute investment performance, as well as the fund’s relative investment performance measured against a peer group of mutual funds deemed appropriate by the Board over multiple periods. The following charts considered by the Board show, over the one , three , and five year periods ended December 31, 2004, the fund’s returns and a range of returns of a peer group of mutual funds identified by Lipper Inc. as having an investment objective similar to that of the fund. The box within each chart shows the 25th percentile return (bottom of box) and the 75th percentile return (top of box) of the Lipper peer group. The percentage beaten number noted below each chart corresponds to the percentile box and represents the percentage of funds in the Lipper peer group whose performance was equal to or lower than that of the fund.
Annual Report
Board Approval of Investment Advisory Contracts and Management Fees continued
The Board noted that the relative investment performance of the fund has compared favorably to its Lipper peer group over time.
Based on its review, and giving particular weight to the nature and quality of the resources dedicated by the Investment Advisers to maintain and improve relative performance, the Board concluded that the nature, extent, and quality of the services provided by Fidelity will benefit the fund’s shareholders, particularly in light of the Board’s view that the fund’s shareholders benefit from investing in a fund that is part of a large family of funds offering a variety of investment disciplines and services.
Competitiveness of Management Fee and Total Fund Expenses. The Board considered the fund’s management fee and total expenses compared to “mapped groups” of competitive funds and classes. Fidelity creates “mapped groups” by combining similar Lipper investment objective categories that have comparable management fee charac teristics. Combining Lipper investment objective categories aids the Board’s manage ment fee and total expense comparisons by broadening the competitive group used for comparison and by reducing the number of universes to which various Fidelity funds are compared.
The Board considered two proprietary management fee comparisons for the 12 month periods shown in the chart below. The group of Lipper funds used by the Board for management fee comparisons is referred to below as the “Total Mapped Group” and, for the reasons explained above, is broader than the Lipper peer group used by the Board for performance comparisons. The Total Mapped Group comparison focuses on a fund’s standing relative to the total universe of comparable funds available to investors, in terms of gross management fees before expense reimbursements or caps. “TMG %” represents the percentage of funds in the Total Mapped Group that had management fees that were lower than the fund’s. For example, a TMG % of 17% would mean that 83% of the funds in the Total Mapped Group had higher management fees than the fund. The “Asset Size Peer Group” (ASPG) comparison focuses on a fund’s standing relative to non Fidelity funds similar in size to the fund within the Total Mapped Group. The ASPG represents at least 15% of the funds in the Total Mapped Group with comparable asset size and management fee characteristics, subject to a minimum of 50 funds (or all funds in the Total Mapped Group if fewer than 50). Additional information, such as the ASPG quartile (“quadrant”) in which the fund’s management fee ranked, is also included in the chart and considered by the Board. For a more meaningful comparison of management fees, the fund is compared on the basis of a hypothetical “net management fee,” which is derived by subtracting payments made by FMR for non management expenses (includ ing transfer agent fees, pricing and bookkeeping fees, and custody fees) from the fund’s all inclusive fee. In this regard, the Board realizes that net management fees can vary from year to year because of differences in non management expenses.
The Board noted that the fund’s management fee ranked below the median of its Total Mapped Group and below the median of its ASPG for 2004. Based on its review, the Board concluded that the fund’s management fee was fair and reasonable in light of the ser vices that the fund receives and the other factors considered.
In its review of the fund’s total expenses, the Board considered the fund’s hypothetical net management fee as well as the fund’s all inclusive fee. The Board also considered other expenses, such as transfer agent fees, pricing and bookkeeping fees, and custodial, legal, and audit fees, paid by FMR under the all inclusive arrangement. The Board also noted the effects of any waivers and reimbursements on fees and expenses. As part of its review, the Board also considered current and historical total expenses of the fund compared to competitive fund median expenses. The fund is compared to those funds and classes in the Total Mapped Group (used by the Board for management fee compari sons) that have a similar sales load structure.
The Board noted that the fund’s total expenses ranked below its competitive median for 2004.
In its review of total expenses, the Board also considered Fidelity fee structures and other information on clients that FMR and its affiliates service in other competitive markets, such as other mutual funds advised or subadvised by FMR or its affiliates, pension plan clients, and other institutional clients.
Based on its review, the Board concluded that the fund’s total expenses were reasonable in light of the services that the fund and its shareholders receive and the other factors considered.
65 Annual Report
Board Approval of Investment Advisory Contracts and Management Fees continued
Costs of the Services and Profitability. The Board considered the revenues earned and the expenses incurred by Fidelity in conducting the business of developing, market ing, distributing, managing, administering and servicing the fund and its shareholders. The Board also considered the level of Fidelity’s profits in respect of all the Fidelity funds.
On an annual basis, FMR presents to the Board Fidelity’s profitability for the fund. Fidelity calculates the profitability for each fund, as well as aggregate profitability for groups of Fidelity funds and all Fidelity funds, using a series of detailed revenue and cost allocation methodologies which originate with the audited books and records of Fidelity. The Audit Committee of the Board reviews any significant changes from the prior year’s methodologies.
PricewaterhouseCoopers LLP (PwC), independent registered accounting firm and auditor to Fidelity and certain Fidelity funds, has been engaged annually by the Board as part of the Board’s assessment of the results of Fidelity’s profitability analysis. PwC’s engagement includes the review and assessment of Fidelity’s methodologies used in determining the revenues and expenses attributable to Fidelity’s mutual fund business, and completion of agreed upon procedures surrounding the mathematical accuracy of fund profitability and its conformity to allocation methodologies. After considering PwC’s reports issued under the engagement and information provided by Fidelity, the Board believes that while other allocation methods may also be reasonable, Fidelity’s profitabil ity methodologies are reasonable in all material respects.
The Board has also reviewed Fidelity’s non fund businesses and any fall out benefits related to the mutual fund business as well as cases where Fidelity’s affiliates may benefit from or be related to the fund’s business. In addition, a special committee of the Board reviewed services provided to Fidelity by its affiliates and determined that the fees that Fidelity paid for such services were reasonable.
The Board considered the costs of the services provided by and the profits realized by Fidelity in connection with the operation of the fund and determined that the amount of profit is a fair entrepreneurial profit for the management of the fund.
Economies of Scale. The Board considered whether there have been economies of scale in respect of the management of the Fidelity funds, whether the Fidelity funds (including the fund) have appropriately benefited from any such economies of scale, and whether there is potential for realization of any further economies of scale. The Board considered the extent to which the fund will benefit from economies of scale through increased services to the fund, through waivers or reimbursements, or through fee or expense reductions. The Board concluded that any potential economies of scale are being shared between fund shareholders and Fidelity in an appropriate manner.
Additional Information Requested by the Board. In order to develop fully the factual basis for consideration of the Advisory Contracts, the Board requested additional information regarding (i) Fidelity’s fund profitability methodology, including additional detail on various cost allocations; (ii) fall out benefits to Fidelity; and (iii) compensation of portfolio managers and research analysts.
Based on its evaluation of all of the conclusions noted above, and after considering all material factors, the Board ultimately concluded that the existing advisory fee structures are fair and reasonable, and that the fund’s existing Advisory Contracts should be renewed.
67 Annual Report
Managing Your Investments
Fidelity offers several ways to conveniently manage your personal investments via your telephone or PC. You can access your account information, conduct trades and research your investments 24 hours a day.
By Phone
Fidelity Automated Service Telephone provides a single toll free number to access account balances, positions, quotes and trading. It’s easy to navigate the service, and on your first call, the system will help you create a personal identification number (PIN) for security.


By PC
Fidelity’s web site on the Internet provides a wide range of information, including daily financial news, fund performance, interactive planning tools and news about Fidelity products and services.

* When you call the quotes line, please remember that a fund’s yield and return will vary and, except for money market funds, share price will also vary. This means that you may have a gain or loss when you sell your shares. There is no assurance that money market funds will be able to maintain a stable $1 share price; an investment in a money market fund is not insured or guar anteed by the U.S. government. Total returns are historical and include changes in share price, reinvestment of dividends and capital gains, and the effects of any sales charges.
Annual Report
To Write Fidelity
We’ll give your correspondence immediate attention and send you written confirmation upon completion of your request.

(such as changing name, address, bank, etc.)
Fidelity Investments P.O. Box 770001 Cincinnati, OH 45277-0002

Buying shares
Fidelity Investments P.O. Box 770001 Cincinnati, OH 45277-0003
Overnight Express
Fidelity Investments Attn: Distribution Services 100 Crosby Parkway KC1H Covington, KY 41015
Selling shares
Fidelity Investments P.O. Box 770001 Cincinnati, OH 45277-0035
Overnight Express
Fidelity Investments Attn: Distribution Services 100 Crosby Parkway KC1H Covington, KY 41015
General Correspondence
Fidelity Investments P.O. Box 500 Merrimack, NH 03054-0500

Buying shares
Fidelity Investments P.O. Box 770001 Cincinnati, OH 45277-0003
Selling shares
Fidelity Investments P.O. Box 770001 Cincinnati, OH 45277-0035
Overnight Express
Fidelity Investments Attn: Distribution Services 100 Crosby Parkway KC1H Covington, KY 41015
General Correspondence
Fidelity Investments P.O. Box 500 Merrimack, NH 03054-0500
Annual Report
To Visit Fidelity
For directions and hours, please call 1 800 544 9797.
Arizona
7001 West Ray Road
Chandler, AZ
7373 N. Scottsdale Road
Scottsdale, AZ
California
815 East Birch Street
Brea, CA
1411 Chapin Avenue
Burlingame, CA
851 East Hamilton Avenue
Campbell, CA
19200 Von Karman Avenue
Irvine, CA
601 Larkspur Landing Circle
Larkspur, CA
10100 Santa Monica Blvd.
Los Angeles, CA
27101 Puerta Real
Mission Viejo, CA
73 575 El Paseo
Palm Desert, CA
251 University Avenue
Palo Alto, CA
123 South Lake Avenue
Pasadena, CA
16995 Bernardo Ctr. Drive
Rancho Bernardo, CA
1740 Arden Way
Sacramento, CA
7676 Hazard Center Drive
San Diego, CA
8 Montgomery Street
San Francisco, CA
3793 State Street
Santa Barbara, CA
21701 Hawthorne Boulevard
Torrance, CA
2001 North Main Street
Walnut Creek, CA
6300 Canoga Avenue
Woodland Hills, CA
Colorado
1625 Broadway
Denver, CO
9185 East Westview Road
Littleton, CO
Connecticut
48 West Putnam Avenue
Greenwich, CT
265 Church Street
New Haven, CT
300 Atlantic Street
Stamford, CT
29 South Main Street
West Hartford, CT
Delaware
222 Delaware Avenue
Wilmington, DE
Florida
4400 N. Federal Highway
Boca Raton, FL
121 Alhambra Plaza
Coral Gables, FL 2948
N. Federal Highway
Ft. Lauderdale, FL
1907 West State Road 434
Longwood, FL
8880 Tamiami Trail, North
Naples, FL
3550 Tamiami Trail, South
Sarasota, FL
1502 N. Westshore Blvd.
Tampa, FL
2465 State Road 7
Wellington, FL
3501 PGA Boulevard
West Palm Beach, FL
Georgia
3445 Peachtree Road, N.E.
Atlanta, GA
1000 Abernathy Road
Atlanta, GA
Illinois
One North LaSalle Street
Chicago, IL
875 North Michigan Ave.
Chicago, IL
1415 West 22nd Street
Oak Brook, IL
1700 East Golf Road
Schaumburg, IL
3232 Lake Avenue
Wilmette, IL
Indiana
4729 East 82nd Street
Indianapolis, IN
Kansas
5400 College Boulevard
Overland Park, KS
Maine
Three Canal Plaza
Portland, ME
Maryland
7315 Wisconsin Avenue
Bethesda, MD
One W. Pennsylvania Ave.
Towson, MD
Massachusetts
801 Boylston Street
Boston, MA
155 Congress Street
Boston, MA 300
Granite Street
Braintree, MA
44 Mall Road
Burlington, MA
405 Cochituate Road
Framingham, MA
416 Belmont Street
Worcester, MA
Michigan
500 E. Eisenhower Pkwy.
Ann Arbor, MI
280 Old N. Woodward Ave.
Birmingham, MI
43420 Grand River Avenue
Novi, MI
29155 Northwestern Hwy.
Southfield, MI
Minnesota
7600 France Avenue South
Edina, MN
Missouri
8885 Ladue Road
Ladue, MO
Annual Report
Nevada
2225 Village Walk Drive
Henderson, NV
New Jersey
150 Essex Street
Millburn, NJ
56 South Street
Morristown, NJ
396 Route 17, North
Paramus, NJ
3518 Route 1 North
Princeton, NJ
530 Highway 35
Shrewsbury, NJ
New York
1055 Franklin Avenue
Garden City, NY
37 West Jericho Turnpike
Huntington Station, NY
1271 Avenue of the Americas
New York, NY
61 Broadway
New York, NY
350 Park Avenue
New York, NY
200 Fifth Avenue
New York, NY
733 Third Avenue
New York, NY
11 Penn Plaza
New York, NY
2070 Broadway
New York, NY
1075 Northern Blvd.
Roslyn, NY
North Carolina
4611 Sharon Road
Charlotte, NC
Ohio
3805 Edwards Road
Cincinnati, OH
1324 Polaris Parkway
Columbus, OH
28699 Chagrin Boulevard
Woodmere Village, OH
Oregon
16850 SW 72nd Avenue
Tigard, OR
Pennsylvania
600 West DeKalb Pike
King of Prussia, PA
1735 Market Street
Philadelphia, PA
12001 Perry Highway
Wexford, PA
Rhode Island
47 Providence Place
Providence, RI
Tennessee
6150 Poplar Avenue
Memphis, TN
Texas
10000 Research Boulevard
Austin, TX
4001 Northwest Parkway
Dallas, TX
12532 Memorial Drive
Houston, TX
2701 Drexel Drive
Houston, TX
6500 N. MacArthur Blvd.
Irving, TX
6005 West Park Boulevard
Plano, TX
14100 San Pedro
San Antonio, TX
1576 East Southlake Blvd.
Southlake, TX
19740 IH 45 North
Spring, TX
Utah
215 South State Street
Salt Lake City, UT
Virginia
1861 International Drive
McLean, VA
Washington
411 108th Avenue, N.E.
Bellevue, WA
1518 6th Avenue
Seattle, WA
Washington, DC
1900 K Street, N.W.
Washington, DC
Wisconsin
595 North Barker Road
Brookfield, WI
Fidelity Brokerage Services, Inc., 100 Summer St., Boston, MA 02110 Member NYSE/SIPC
Annual Report
| | Investment Adviser
Fidelity Management & Research Company
Boston, MA
Investment Sub Adviser
Fidelity Investments
Money Management, Inc.
Fidelity International Investment Advisors
Fidelity International Investment Advisors
(U.K.) Limited
General Distributor
Fidelity Distributors Corporation
Boston, MA
Transfer and Service Agent
Citibank, N.A.
New York, NY
Custodian
Citibank, N.A.
New York, NY
The Fidelity Telephone Connection
Mutual Fund 24 Hour Service
|
| Exchanges/Redemptions | | |
| and Account Assistance | | 1-800-544-6666 |
| Product Information | | 1-800-544-6666 |
| Retirement Accounts | | 1-800-544-4774 |
| (8 a.m. - 9 p.m.) | | |
| TDD Service | | 1-800-544-0118 |
| for the deaf and hearing impaired |
| (9 a.m. - 9 p.m. Eastern time) |
| Fidelity Automated Service | | |
| Telephone (FAST® ) | | (automated_phone_logo) 1-800-544-5555 |
(automated_phone_logo) Automated line for quickest service
SMM-UANN-1005
1.790914.102

Item 2. Code of Ethics
As of the end of the period, August 31, 2005, Fidelity Union Street Trust II (the trust) has adopted a code of ethics, as defined in Item 2 of Form N-CSR, that applies to its President and Treasurer and its Chief Financial Officer. A copy of the code of ethics is filed as an exhibit to this Form N-CSR.
Item 3. Audit Committee Financial Expert
The Board of Trustees of the trust has determined that Marie L. Knowles is an audit committee financial expert, as defined in Item 3 of Form N-CSR. Ms. Knowles is independent for purposes of Item 3 of Form N-CSR.
Item 4. Principal Accountant Fees and Services
(a) Audit Fees.
For the fiscal years ended August 31, 2005 and August 31, 2004, the aggregate Audit Fees billed by PricewaterhouseCoopers LLP (PwC) for professional services rendered for the audits of the financial statements, or services that are normally provided in connection with statutory and regulatory filings or engagements for those fiscal years, for the Fidelity AMT Tax-Free Money Fund, Fidelity Arizona Municipal Money Market Fund and Fidelity Municipal Money Market Fund (the funds) and for all funds in the Fidelity Group of Funds are shown in the table below.
Fund | 2005A | 2004A |
Fidelity AMT Tax-Free Money Fund | $42,000 | $41,000 |
Fidelity Arizona Municipal Money Market Fund | $32,000 | $31,000 |
Fidelity Municipal Money Market Fund | $86,000 | $69,000 |
All funds in the Fidelity Group of Funds audited by PwC | $11,600,000 | $10,600,000 |
A | Aggregate amounts may reflect rounding. |
(b) Audit-Related Fees.
In each of the fiscal years ended August 31, 2005 and August 31, 2004 the aggregate Audit-Related Fees billed by PwC for services rendered for assurance and related services to each fund that are reasonably related to the performance of the audit or review of the fund's financial statements, but not reported as Audit Fees, are shown in the table below.
Fund | 2005A | 2004A |
Fidelity AMT Tax-Free Money Fund | $0 | $0 |
Fidelity Arizona Municipal Money Market Fund | $0 | $0 |
Fidelity Municipal Money Market Fund | $0 | $0 |
A | Aggregate amounts may reflect rounding. |
In each of the fiscal years ended August 31, 2005 and August 31, 2004, the aggregate Audit-Related Fees that were billed by PwC that were required to be approved by the Audit Committee for services rendered on behalf of Fidelity Management & Research Company (FMR) and entities controlling, controlled by, or under common control with FMR (not including any sub-adviser whose role is primarily portfolio management and is subcontracted with or overseen by another investment adviser) that provide ongoing services to the funds ("Fund Service Providers") for assurance and related services that relate directly to the operations and financial reporting of each fund that are reasonably related to the performance of the audit or review of the fund's financial statements, but not reported as Audit Fees, are shown in the table below.
Billed By | 2005A | 2004A |
PwC | $0 | $50,000 |
A | Aggregate amounts may reflect rounding. |
Fees included in the audit-related category comprise assurance and related services (e.g., due diligence services) that are traditionally performed by the independent registered public accounting firm. These audit-related services include due diligence related to mergers and acquisitions, accounting consultations and audits in connection with acquisitions, internal control reviews, attest services that are not required by statute or regulation and consultation concerning financial accounting and reporting standards.
(c) Tax Fees.
In each of the fiscal years ended August 31, 2005 and August 31, 2004, the aggregate Tax Fees billed by PwC for professional services rendered for tax compliance, tax advice, and tax planning for each fund is shown in the table below.
Fund | 2005A | 2004A |
Fidelity AMT Tax-Free Money Fund | $1,700 | $1,600 |
Fidelity Arizona Municipal Money Market Fund | $1,700 | $1,600 |
Fidelity Municipal Money Market Fund | $1,700 | $1,600 |
A | Aggregate amounts may reflect rounding. |
In each of the fiscal years ended August 31, 2005 and August 31, 2004, the aggregate Tax Fees billed by PwC that were required to be approved by the Audit Committee for professional services rendered on behalf of the Fund Service Providers for tax compliance, tax advice, and tax planning that relate directly to the operations and financial reporting of each fund is shown in the table below.
Billed By | 2005A | 2004A |
PwC | $0 | $0 |
A | Aggregate amounts may reflect rounding. |
Fees included in the Tax Fees category comprise all services performed by professional staff in the independent registered public accounting firm's tax division except those services related to the audit. Typically, this category would include fees for tax compliance, tax planning, and tax advice. Tax compliance, tax advice, and tax planning services include preparation of original and amended tax returns, claims for refund and tax payment-planning services, assistance with tax audits and appeals, tax advice related to mergers and acquisitions and requests for rulings or technical advice from taxing authorities.
(d) All Other Fees.
In each of the fiscal years ended August 31, 2005 and August 31, 2004, the aggregate Other Fees billed by PwC for all other non-audit services rendered to the funds is shown in the table below.
Fund | 2005A | 2004A |
Fidelity AMT Tax-Free Money Fund | $3,900 | $3,300 |
Fidelity Arizona Municipal Money Market Fund | $1,300 | $1,200 |
Fidelity Municipal Money Market Fund | $13,700 | $11,600 |
A | Aggregate amounts may reflect rounding. |
In each of the fiscal years ended August 31, 2005 and August 31, 2004, the aggregate Other Fees billed by PwC that were required to be approved by the Audit Committee for all other non-audit services rendered on behalf of the Fund Service Providers that relate directly to the operations and financial reporting of each fund is shown in the table below.
Billed By | 2005A | 2004A |
PwC | $280,000 | $280,000 |
A | Aggregate amounts may reflect rounding. |
Fees included in the All Other Fees category include services related to internal control reviews, strategy and other consulting, financial information systems design and implementation, consulting on other information systems, and other tax services unrelated to the fund.
(e) (1) | Audit Committee Pre-Approval Policies and Procedures: |
The trust's Audit Committee must pre-approve all audit and non-audit services provided by the independent registered public accounting firm relating to the operations or financial reporting of the funds. Prior to the commencement of any audit or non-audit services to a fund, the Audit Committee reviews the services to determine whether they are appropriate and permissible under applicable law.
The trust's Audit Committee has adopted policies and procedures to, among other purposes, provide a framework for the Committee's consideration of non-audit services by the audit firms that audit the Fidelity funds. The policies and procedures require that any non-audit service provided by a fund audit firm to a Fidelity Fund and any non-audit service provided by a fund auditor to a Fund Service Provider that relates directly to the operations and financial reporting of a Fidelity fund (Covered Service) are subject to approval by the Audit Committee before such service is provided. Non-audit services provided by a fund audit firm for a Fund Service Provider that do not relate directly to the operations and financial reporting of a Fidelity fund (Non-Covered Service) but that are expected to exceed $50,000 are also subject to pre-approval by the Audit Committee.
All Covered Services, as well as Non-Covered Services that are expected to exceed $50,000, must be approved in advance of provision of the service either: (i) by formal resolution of the Audit Committee, or (ii) by oral or written approval of the service by the Chair of the Audit Committee (or if the Chair is unavailable, such other member of the Audit Committee as may be designated by the Chair to act in the Chair's absence). The approval contemplated by (ii) above is permitted where the Treasurer determines that action on such an engagement is necessary before the next meeting of the Audit Committee. Neither pre-approval nor advance notice of Non-Covered Service engagements for which fees are not expected to exceed $50,000 is required; such engagements are to be reported to the Audit Committee monthly.
(e) (2) | Services approved pursuant to paragraph (c)(7)(i)(C) of Rule 2-01 of Regulation S-X: |
Audit-Related Fees:
There were no amounts that were approved by the Audit Committee pursuant to the de minimis exception for the fiscal years ended August 31, 2005 and August 31, 2004 on behalf of each fund.
There were no amounts that were required to be approved by the Audit Committee pursuant to the de minimis exception for the fiscal years ended August 31, 2005 and August 31, 2004 on behalf of the Fund Service Providers that relate directly to the operations and financial reporting of each fund.
Tax Fees:
There were no amounts that were approved by the Audit Committee pursuant to the de minimis exception for the fiscal years ended August 31, 2005 and August 31, 2004 on behalf of each fund.
There were no amounts that were required to be approved by the Audit Committee pursuant to the de minimis exception for the fiscal years ended August 31, 2005 and August 31, 2004 on behalf of the Fund Service Providers that relate directly to the operations and financial reporting of each fund.
All Other Fees:
There were no amounts that were approved by the Audit Committee pursuant to the de minimis exception for the fiscal years ended August 31, 2005 and August 31, 2004 on behalf of each fund.
There were no amounts that were required to be approved by the Audit Committee pursuant to the de minimis exception for the fiscal years ended August 31, 2005 and August 31, 2004 on behalf of the Fund Service Providers that relate directly to the operations and financial reporting of each fund.
(f) Not Applicable.
(g) For the fiscal years ended August 31, 2005 and August 31, 2004, the aggregate fees billed by PwC of $3,550,000A and $1,850,000A for non-audit services rendered on behalf of the funds, FMR (not including any sub-adviser whose role is primarily portfolio management and is subcontracted with or overseen by another investment adviser) and Fund Service Providers relating to Covered Services and Non-Covered Services are shown in the table below.
| 2005A | 2004A |
Covered Services | $300,000 | $350,000 |
Non-Covered Services | $3,250,000 | $1,500,000 |
A | Aggregate amounts may reflect rounding. |
(h) The trust's Audit Committee has considered Non-Covered Services that were not pre-approved that were provided by PwC to Fund Service Providers to be compatible with maintaining the independence of PwC in its audit of the funds, taking into account representations from PwC, in accordance with Independence Standards Board Standard No.1, regarding its independence from the funds and their related entities.
Item 5. Audit Committee of Listed Registrants
Not applicable.
Item 6. Schedule of Investments
Not applicable.
Item 7. Disclosure of Proxy Voting Policies and Procedures for Closed-End Management Investment Companies
Not applicable.
Item 8. Portfolio Managers of Closed-End Management Investment Companies
Not applicable.
Item 9. Purchase of Equity Securities by Closed-End Management Investment Company and Affiliated Purchasers
Not applicable.
Item 10. Submission of Matters to a Vote of Security Holders
There were no material changes to the procedures by which shareholders may recommend nominees to the trust's Board of Trustees.
Item 11. Controls and Procedures
(a)(i) The President and Treasurer and the Chief Financial Officer have concluded that the trust's disclosure controls and procedures (as defined in Rule 30a-3(c) under the Investment Company Act) provide reasonable assurances that material information relating to the trust is made known to them by the appropriate persons, based on their evaluation of these controls and procedures as of a date within 90 days of the filing date of this report.
(a)(ii) There was no change in the trust's internal control over financial reporting (as defined in Rule 30a-3(d) under the Investment Company Act) that occurred during the second fiscal quarter of the period covered by this report that has materially affected, or is reasonably likely to materially affect, the trust's internal control over financial reporting.
Item 12. Exhibits
(a) | (1) | Code of Ethics pursuant to Item 2 of Form N-CSR is filed and attached hereto as EX-99.CODE ETH. |
(a) | (2) | Certification pursuant to Rule 30a-2(a) under the Investment Company Act of 1940 (17 CFR 270.30a-2(a)) is filed and attached hereto as Exhibit 99.CERT. |
(a) | (3) | Not applicable. |
(b) | | Certification pursuant to Rule 30a-2(b) under the Investment Company Act of 1940 (17 CFR 270.30a-2(b)) is furnished and attached hereto as Exhibit 99.906CERT. |
SIGNATURES
Pursuant to the requirements of the Securities Exchange Act of 1934 and the Investment Company Act of 1940, the registrant has duly caused this report to be signed on its behalf by the undersigned, thereunto duly authorized.
Fidelity Union Street Trust II
By: | /s/Christine Reynolds |
| Christine Reynolds |
| President and Treasurer |
| |
Date: | October 21, 2005 |
Pursuant to the requirements of the Securities Exchange Act of 1934 and the Investment Company Act of 1940, this report has been signed below by the following persons on behalf of the registrant and in the capacities and on the dates indicated.
By: | /s/Christine Reynolds |
| Christine Reynolds |
| President and Treasurer |
| |
Date: | October 21, 2005 |
By: | /s/Timothy F. Hayes |
| Timothy F. Hayes |
| Chief Financial Officer |
| |
Date: | October 21, 2005 |