UNITED STATES
SECURITIES AND EXCHANGE COMMISSION
Washington, D.C. 20549
FORM N-CSR
CERTIFIED SHAREHOLDER REPORT OF REGISTERED
MANAGEMENT INVESTMENT COMPANIES
Investment Company Act file number 811-06452
Fidelity Union Street Trust II
(Exact name of registrant as specified in charter)
245 Summer St., Boston, MA 02210
(Address of principal executive offices) (Zip code)
Margaret Carey, Secretary
245 Summer St.
Boston, Massachusetts 02210
(Name and address of agent for service)
Registrant's telephone number, including area code:
617-563-7000
| |
Date of fiscal year end: | August 31 |
|
|
Date of reporting period: | February 29, 2024 |
Item 1.
Reports to Stockholders
Fidelity® Municipal Money Market Fund
Semi-Annual Report
February 29, 2024
Contents
To view a fund's proxy voting guidelines and proxy voting record for the 12-month period ended June 30, visit http://www.fidelity.com/proxyvotingresults or visit the Securities and Exchange Commission's (SEC) web site at http://www.sec.gov.
You may also call 1-800-544-8544 to request a free copy of the proxy voting guidelines.
Standard & Poor's, S&P and S&P 500 are registered service marks of The McGraw-Hill Companies, Inc. and have been licensed for use by Fidelity Distributors Corporation.
Other third-party marks appearing herein are the property of their respective owners.
All other marks appearing herein are registered or unregistered trademarks or service marks of FMR LLC or an affiliated company. © 2024 FMR LLC. All rights reserved.
This report and the financial statements contained herein are submitted for the general information of the shareholders of the Fund. This report is not authorized for distribution to prospective investors in the Fund unless preceded or accompanied by an effective prospectus.
A fund files its complete schedule of portfolio holdings with the SEC for the first and third quarters of each fiscal year on Form N-PORT. Forms N-PORT are available on the SEC's web site at http://www.sec.gov. A fund's Forms N-PORT may be reviewed and copied at the SEC's Public Reference Room in Washington, DC. Information regarding the operation of the SEC's Public Reference Room may be obtained by calling 1-800-SEC-0330.
For a complete list of a fund's portfolio holdings, view the most recent holdings listing, semiannual report, or annual report on Fidelity's web site at http://www.fidelity.com, http://www.institutional.fidelity.com, or http://www.401k.com, as applicable.
NOT FDIC INSURED •MAY LOSE VALUE •NO BANK GUARANTEE
Neither the Fund nor Fidelity Distributors Corporation is a bank.
| Current 7-Day Yields |
| | | |
| Fidelity® Municipal Money Market Fund | 3.0% | |
| | | |
Yield refers to the income paid by the Fund over a given period. Yield for money market funds is usually for seven-day periods, as it is here, though it is expressed as an annual percentage rate. Past performance is no guarantee of future results. Yield will vary and it's possible to lose money investing in the Fund. | |
| Effective Maturity Diversification (% of Fund's Investments) |
| Days |
| 1 - 7 | 81.3 | |
| 8 - 30 | 0.4 | |
| 31 - 60 | 2.5 | |
| 61 - 90 | 0.9 | |
| 91 - 180 | 5.9 | |
| > 180 | 9.0 | |
| Effective maturity is determined in accordance with the requirements of Rule 2a-7 under the Investment Company Act of 1940. |
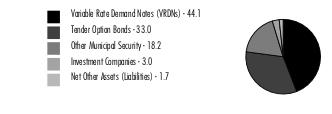
Asset Allocation (% of Fund's net assets) |
|
|
Showing Percentage of Net Assets
| Variable Rate Demand Note - 44.1% |
| | | Principal Amount (a) (000s) | Value ($) (000s) |
| Alabama - 2.8% | | | |
| Decatur Indl. Dev. Board Exempt Facilities Rev. (Nucor Steel Decatur LLC Proj.) Series 2003 A, 3.89% 3/7/24, VRDN (b)(c) | | 31,715 | 31,715 |
| Mobile Indl. Dev. Board Rev.: | | | |
| (Alabama Pwr. Co. Proj.) Series 2001 B, 3.9% 3/1/24, VRDN (b)(c) | | 10,000 | 10,000 |
| (Alabama Pwr. Theodore Plant Proj.) Series A, 3.9% 3/1/24, VRDN (b)(c) | | 2,350 | 2,350 |
| Walker County Econ. & Indl. Dev. Auth. Solid Waste Disp. Rev. (Alabama Pwr. Co. Plant Gorgas Proj.): | | | |
| Series 2007, 3.9% 3/1/24, VRDN (b)(c) | | 4,600 | 4,600 |
| Series 2023: | | | |
3.9% 3/1/24, VRDN (b)(c) | | 29,585 | 29,585 |
3.9% 3/1/24, VRDN (b)(c) | | 9,995 | 9,995 |
| West Jefferson Indl. Dev. Board Solid Waste Disp. Rev.: | | | |
| (Alabama Pwr. Co. Miller Plant Proj.) Series 2008, 3.9% 3/1/24, VRDN (b)(c) | | 3,400 | 3,400 |
| (Alabama Pwr. Co. Plant Miller Proj.) Series 2023, 3.6% 3/7/24, VRDN (b)(c) | | 12,900 | 12,900 |
TOTAL ALABAMA | | | 104,545 |
| Alaska - 0.3% | | | |
| Valdez Marine Term. Rev. (Phillips Trans. Alaska, Inc. Proj.) Series 1994 B, 3.4% 3/7/24 (ConocoPhillips Co. Guaranteed), VRDN (b) | | 13,350 | 13,350 |
| Arizona - 0.9% | | | |
| Maricopa County Poll. Cont. Rev.: | | | |
| (Arizona Pub. Svc. Co. Palo Verde Proj.) Series 2009 A, 3.48% 3/7/24, VRDN (b) | | 2,400 | 2,400 |
| Series 2009 B, 3.48% 3/7/24, VRDN (b) | | 9,900 | 9,900 |
| Maricopa County Rev. Series 2023 B, 3.3% 3/7/24, VRDN (b) | | 12,900 | 12,900 |
| FNMA: | | | |
| Maricopa County Indl. Dev. Auth. Multi-family Hsg. Rev. (Village Square Apts. Proj.) Series 2004, 3.4% 3/7/24, LOC Fannie Mae, VRDN (b)(c) | | 3,200 | 3,200 |
| Pima County Indl. Dev. Auth. Multi-family Hsg. Rev. Series A, 3.36% 3/7/24, LOC Fannie Mae, VRDN (b)(c) | | 4,725 | 4,725 |
TOTAL ARIZONA | | | 33,125 |
| Arkansas - 0.9% | | | |
| Blytheville Indl. Dev. Rev. (Nucor Corp. Proj.): | | | |
| Series 1998, 3.89% 3/7/24, VRDN (b)(c) | | 10,300 | 10,300 |
| Series 2002, 4.2% 3/7/24, VRDN (b)(c) | | 23,100 | 23,100 |
TOTAL ARKANSAS | | | 33,400 |
| Colorado - 0.0% | | | |
| Colorado Edl. & Cultural Facilities Auth. Rev. (Clyfford Still Museum Proj.) Series 2008, 3.33% 3/7/24, LOC Wells Fargo Bank NA, VRDN (b) | | 100 | 100 |
| Connecticut - 2.8% | | | |
| Connecticut Hsg. Fin. Auth.: | | | |
| (Hsg. Mtg. Fin. Prog.) Series 2018 C, 3.26% 3/7/24 (Liquidity Facility TD Banknorth, NA), VRDN (b)(c) | | 17,950 | 17,950 |
| Series 2017 C, 3.26% 3/7/24 (Liquidity Facility TD Banknorth, NA), VRDN (b)(c) | | 50,000 | 50,000 |
| Series 2019 A, 3.3% 3/7/24 (Liquidity Facility U.S. Bank NA, Cincinnati), VRDN (b)(c) | | 10,800 | 10,800 |
| Series 2019 B2, 3.31% 3/7/24 (Liquidity Facility Bank of America NA), VRDN (b)(c) | | 13,225 | 13,225 |
| Series D 3, 3.27% 3/7/24 (Liquidity Facility Sumitomo Mitsui Banking Corp.), VRDN (b)(c) | | 12,315 | 12,315 |
TOTAL CONNECTICUT | | | 104,290 |
| Delaware - 0.2% | | | |
| Delaware Econ. Dev. Auth. Rev. (Delmarva Pwr. & Lt. Co. Proj.) Series 1999 B, 3.7% 3/7/24, VRDN (b)(c) | | 8,200 | 8,200 |
| District Of Columbia - 0.2% | | | |
| District of Columbia Rev. (Fort Lincoln New Town/Premium Distributors LLC Proj.) Series 2000, 3.36% 3/7/24, LOC Wells Fargo Bank NA, VRDN (b)(c) | | 1,910 | 1,910 |
| Metropolitan Washington DC Arpts. Auth. Sys. Rev. Series 2011 A, 3.27% 3/7/24, LOC TD Banknorth, NA, VRDN (b)(c) | | 4,600 | 4,600 |
TOTAL DISTRICT OF COLUMBIA | | | 6,510 |
| Florida - 3.6% | | | |
| Bay County Indl. Rev. Dev. (Gulf Pwr. Co. Proj.) Series 2020, 3.45% 3/7/24, VRDN (b)(c) | | 26,800 | 26,800 |
| Broward County Indl. Dev. Rev. (Florida Pwr. & Lt. Co. Proj.): | | | |
| Series 2015, 3.5% 3/7/24, VRDN (b)(c) | | 29,100 | 29,100 |
| Series 2018 B, 3.5% 3/7/24, VRDN (b)(c) | | 4,900 | 4,900 |
| Escambia County Solid Waste Disp. Rev. (Gulf Pwr. Co. Proj.) Series 2009, 3.4% 3/7/24, VRDN (b) | | 4,000 | 4,000 |
| Florida Hsg. Fin. Corp. Multi-family Mtg. Rev. (Savannah Springs Apts. Proj.) Series G, 3.31% 3/7/24, LOC Citibank NA, VRDN (b)(c) | | 11,360 | 11,360 |
| Jacksonville Poll. Cont. Rev. (Florida Pwr. & Lt. Co. Proj.) Series 1995, 3.65% 3/7/24, VRDN (b) | | 10,140 | 10,140 |
| Lee County Indl. Dev. Auth. Rev. (Florida Pwr. & Lt. Co. Proj.) Series 2016 A: | | | |
| 3.5% 3/7/24, VRDN (b)(c) | | 3,900 | 3,900 |
| 3.75% 3/7/24, VRDN (b)(c) | | 6,300 | 6,300 |
| Miami-Dade County Indl. Dev. Auth. Rev. (Florida Pwr. & Lt. Co. Proj.) Series 2021, 3.4% 3/7/24, VRDN (b)(c) | | 5,800 | 5,800 |
| Mississippi Bus. Fin. Corp. Poll. Cont. Rev. (Gulf Pwr. Co. Proj.) Series 2014, 3.65% 3/7/24, VRDN (b) | | 3,775 | 3,775 |
| FNMA: | | | |
| Collier County Hsg. Fin. Auth. Multi-family Rev. (Sawgrass Pines Apts. Proj.) Series 2003, 3.3% 3/7/24, LOC Fannie Mae, VRDN (b)(c) | | 4,900 | 4,900 |
| Florida Hsg. Fin. Corp. Multi-family Mtg. Rev. Series 2006 H, 3.29% 3/7/24, LOC Fannie Mae, VRDN (b)(c) | | 5,495 | 5,495 |
| Hillsborough County Hsg. Fin. Auth. Multi-family Rev.: | | | |
(Grande Oaks Apts. Proj.) Series A, 3.3% 3/7/24, LOC Fannie Mae, VRDN (b)(c) | | 3,935 | 3,935 |
(Hunters Run Apts. Proj.) Series 2002 A, 3.4% 3/7/24, LOC Fannie Mae, VRDN (b)(c) | | 5,395 | 5,395 |
(Morgan Creek Apts. Proj.) Series 2003, 3.3% 3/7/24, LOC Fannie Mae, VRDN (b)(c) | | 9,100 | 9,100 |
TOTAL FLORIDA | | | 134,900 |
| Georgia - 2.3% | | | |
| Bartow County Dev. Auth. (Georgia Pwr. Co. Plant Bowen Proj.) Series 2022: | | | |
| 3.85% 3/1/24, VRDN (b)(c) | | 15,380 | 15,380 |
| 3.9% 3/1/24, VRDN (b)(c) | | 9,110 | 9,110 |
| Burke County Indl. Dev. Auth. Poll. Cont. Rev. (Georgia Pwr. Co. Plant Vogtle Proj.) Series 2012, 3.9% 3/1/24, VRDN (b)(c) | | 14,400 | 14,400 |
| Gwinnett County Dev. Auth. Indl. Dev. Rev. (Curtis 1000, Inc. Proj.) Series 1996, 3.47% 3/7/24, LOC Wells Fargo Bank NA, VRDN (b)(c) | | 6,460 | 6,460 |
| Monroe County Dev. Auth. Poll. Cont. Rev.: | | | |
| (Gulf Pwr. Co. Plant Scherer Proj.) Series 2010, 3.4% 3/7/24, VRDN (b) | | 2,100 | 2,100 |
| Series 2002 V1, 3.4% 3/7/24, VRDN (b) | | 2,700 | 2,700 |
| Monroe County Dev. Auth. Rev. (Florida Pwr. & Lt. Co. Proj.): | | | |
| Series 2017, 3.45% 3/7/24, VRDN (b)(c) | | 7,800 | 7,800 |
| Series 2019, 3.45% 3/7/24, VRDN (b)(c) | | 20,000 | 20,000 |
| FNMA Atlanta Urban Residential Fin. Auth. Multi-family Hsg. Rev. (Collegetown at Harris Homes Phase I Proj.) Series 2003, 3.29% 3/7/24, LOC Fannie Mae, VRDN (b)(c) | | 7,230 | 7,230 |
TOTAL GEORGIA | | | 85,180 |
| Illinois - 3.8% | | | |
| Chicago Midway Arpt. Rev. Series 2014 C, 3.33% 3/7/24, LOC PNC Bank NA, VRDN (b)(c) | | 84,210 | 84,210 |
| Chicago O'Hare Int'l. Arpt. Spl. Facilities Rev. (Lufthansa German Airlines Proj.) Series 2001, 3.4% 3/7/24, LOC Bayerische Landesbank, VRDN (b)(c) | | 37,770 | 37,770 |
| Illinois Dev. Fin. Auth. Rev. (Glenwood School for Boys Proj.) Series 1998, 3.54% 3/7/24, LOC Northern Trust Co., VRDN (b) | | 2,700 | 2,700 |
| Illinois Fin. Auth. Multi-family Rev. (Hidden Glen Apts. Proj.) Series 2007, 3.4% 3/7/24, LOC U.S. Bank NA, Cincinnati, VRDN (b)(c) | | 5,595 | 5,595 |
| FHLMC: | | | |
| Illinois Fin. Auth. Multi-family Rev. (Villagebrook Apts. Proj.) Series 2005, 3.29% 3/7/24, LOC Freddie Mac, VRDN (b)(c) | | 6,725 | 6,725 |
| Lisle Village Multi-family Hsg. Rev. (Devonshire of Lisle Proj.) Series 1991, 3.36% 3/7/24, LOC Freddie Mac, VRDN (b)(c) | | 6,000 | 6,000 |
TOTAL ILLINOIS | | | 143,000 |
| Indiana - 1.6% | | | |
| Indiana Dev. Fin. Auth. Envir. Rev.: | | | |
| (PSI Energy Proj.): | | | |
Series 2003 A, 3.55% 3/7/24, VRDN (b)(c) | | 36,250 | 36,250 |
Series 2003 B, 3.53% 3/7/24, VRDN (b)(c) | | 23,300 | 23,294 |
| Series 2005, 3.5% 3/7/24, LOC Rabobank Nederland New York Branch, VRDN (b) | | 1,500 | 1,500 |
TOTAL INDIANA | | | 61,044 |
| Iowa - 1.6% | | | |
| Iowa Fin. Auth. Midwestern Disaster Area Rev. (ADM Proj.) Series 2011, 3.4% 3/7/24, VRDN (b) | | 4,300 | 4,300 |
| Iowa Fin. Auth. Solid Waste Facilities (MidAmerican Energy Co. Proj.) Series 2017, 3.85% 3/7/24, VRDN (b)(c) | | 57,200 | 57,200 |
TOTAL IOWA | | | 61,500 |
| Kansas - 2.1% | | | |
| Cygne Poll. Cont. Rev. (Kansas Gas and Elec. Co. Proj.) Series 1994 B, 3.45% 3/7/24, VRDN (b) | | 17,200 | 17,200 |
| Burlington Envir. Impt. Rev. (Kansas City Pwr. and Lt. Co. Proj.): | | | |
| Series 2007 A, 3.5% 3/7/24, VRDN (b) | | 3,200 | 3,200 |
| Series 2007 B, 3.5% 3/7/24, VRDN (b) | | 14,000 | 14,000 |
| Chanute Indl. Dev. Rev. (Ash Grove Cement Co. Proj.): | | | |
| Series 2000, 3.3% 3/7/24, LOC Bank of America NA, VRDN (b)(c) | | 25,100 | 25,100 |
| Series 2002, 3.3% 3/7/24, LOC Bank of America NA, VRDN (b)(c) | | 7,000 | 7,000 |
| St. Mary's Kansas Poll. Cont. Rev. (Kansas Gas and Elec. Co. Proj.) Series 1994, 3.45% 3/7/24, VRDN (b) | | 4,700 | 4,700 |
| Wamego Kansas Poll. Cont. Rfdg. Rev.: | | | |
| (Kansas Gas & Elec. Co. Proj.) Series 1994, 3.45% 3/7/24, VRDN (b) | | 4,100 | 4,100 |
| (Western Resources, Inc. Proj.) Series 1994, 3.45% 3/7/24, VRDN (b) | | 5,200 | 5,200 |
TOTAL KANSAS | | | 80,500 |
| Kentucky - 0.2% | | | |
| Daviess County Exempt Facilities Rev. (Kimberly-Clark Tissue Co. Proj.) Series 1999, 3.45% 3/7/24 (Kimberly-Clark Corp. Guaranteed), VRDN (b)(c) | | 6,070 | 6,070 |
| Louisiana - 1.0% | | | |
| Louisiana Pub. Facilities Auth. Rev.: | | | |
| (Air Products & Chemicals, Inc. Proj.): | | | |
Series 2002, 3.85% 3/7/24, VRDN (b)(c) | | 14,000 | 14,000 |
Series 2003, 3.85% 3/7/24, VRDN (b)(c) | | 18,650 | 18,650 |
| (Christus Health Proj.) Series 2009 B3, 3.2% 3/7/24, LOC Sumitomo Mitsui Trust Bank Ltd., VRDN (b) | | 6,500 | 6,500 |
TOTAL LOUISIANA | | | 39,150 |
| Michigan - 0.2% | | | |
| Michigan Strategic Fund Ltd. Oblig. Rev. (The Kroger Co. Recovery Zone Facilities Bond Proj.) Series 2010, 3.28% 3/7/24, LOC Bank of Nova Scotia, VRDN (b) | | 2,400 | 2,400 |
| FHLMC Livonia Econ. Dev. Corp. (Madonna Univ. Proj.) Series 2009, 3.26% 3/7/24, LOC Fed. Home Ln. Bank Chicago, VRDN (b) | | 3,815 | 3,815 |
TOTAL MICHIGAN | | | 6,215 |
| Mississippi - 1.1% | | | |
| Mississippi Bus. Fin. Corp. Mississippi Pwr. Co. Proj.) Series 2022, 3.7% 3/1/24, VRDN (b)(c) | | 2,270 | 2,270 |
| Mississippi Bus. Fin. Corp. Rev. (Gulf Pwr. Co. Proj.) Series 2019, 3.75% 3/7/24, VRDN (b)(c) | | 23,700 | 23,700 |
| Mississippi Bus. Fin. Corp. Solid Waste Disp. Rev.: | | | |
| (Mississippi Pwr. Co. Proj.) Series 1998, 3.85% 3/1/24, VRDN (b)(c) | | 6,900 | 6,900 |
| (Waste Mgmt., Inc. Proj.) Series 2003, 3.3% 3/7/24, LOC Bank of America NA, VRDN (b)(c) | | 9,500 | 9,500 |
TOTAL MISSISSIPPI | | | 42,370 |
| Nebraska - 1.3% | | | |
| Nebraska Invt. Fin. Auth. Single Family Hsg. Rev.: | | | |
| Series 2015 B, 3.2% 3/7/24 (Liquidity Facility Fed. Home Ln. Bank Topeka), VRDN (b)(c) | | 15,125 | 15,125 |
| Series 2015 D, 3.2% 3/7/24 (Liquidity Facility Fed. Home Ln. Bank Topeka), VRDN (b)(c) | | 11,655 | 11,655 |
| Series 2016 B, 3.2% 3/7/24 (Liquidity Facility Fed. Home Ln. Bank Topeka), VRDN (b)(c) | | 250 | 250 |
| Series 2021 B, 3.2% 3/7/24 (Liquidity Facility Fed. Home Ln. Bank Topeka), VRDN (b)(c) | | 20,000 | 20,000 |
| Stanton County Indl. Dev. Rev.: | | | |
| (Nucor Corp. Proj.) Series 1996, 3.89% 3/7/24, VRDN (b)(c) | | 1,600 | 1,600 |
| Series 1998, 3.89% 3/7/24, VRDN (b)(c) | | 2,200 | 2,200 |
TOTAL NEBRASKA | | | 50,830 |
| Nevada - 2.7% | | | |
| Clark County Arpt. Rev. Series 2008 C1, 3.41% 3/7/24, LOC Bank of America NA, VRDN (b)(c) | | 33,280 | 33,280 |
| Clark County Indl. Dev. Rev.: | | | |
| (Southwest Gas Corp. Proj.) Series 2003 A, 3.3% 3/7/24, LOC Wells Fargo Bank NA, VRDN (b)(c) | | 32,675 | 32,675 |
| Series 2008 A, 3.4% 3/7/24, LOC MUFG Bank Ltd., VRDN (b)(c) | | 35,000 | 35,000 |
TOTAL NEVADA | | | 100,955 |
| New York - 0.5% | | | |
| FNMA New York Hsg. Fin. Agcy. Rev. (Helena Hsg. Proj.) Series 2003 A, 3.34% 3/7/24, LOC Fannie Mae, VRDN (b)(c) | | 18,000 | 18,000 |
| New York And New Jersey - 0.1% | | | |
| Port Auth. of New York & New Jersey: | | | |
| Series 1992 2, SIFMA Municipal Swap Index + 0.050% 3.35% 4/1/24, VRDN (b)(d)(e) | | 500 | 500 |
| Series 1995 4, SIFMA Municipal Swap Index + 0.080% 3.38% 4/1/24, VRDN (b)(c)(d)(e) | | 3,900 | 3,900 |
TOTAL NEW YORK AND NEW JERSEY | | | 4,400 |
| North Carolina - 0.2% | | | |
| Cumberland County Indl. Facilities & Poll. Cont. Fing. Auth. (Cargill, Inc. Proj.) Series 2022, 3.28% 3/7/24, VRDN (b)(c) | | 8,100 | 8,100 |
| Ohio - 0.1% | | | |
| Cuyahoga County Health Care Facilities Rev. (The A.M. McGregor Home Proj.) Series 2014, 3.29% 3/7/24, LOC Northern Trust Co., VRDN (b) | | 2,535 | 2,535 |
| Ohio Hsg. Fin. Agcy. Residential Mtg. Rev. Series 2016 H, 3.2% 3/7/24 (Liquidity Facility Ohio Gen. Oblig.), VRDN (b)(c) | | 235 | 235 |
TOTAL OHIO | | | 2,770 |
| Oregon - 0.2% | | | |
| Portland Hsg. Auth. Rev.: | | | |
| (New Columbia - Cecelia Proj.) Series 2004, 3.3% 3/7/24, LOC Bank of America NA, VRDN (b)(c) | | 2,770 | 2,770 |
| (New Columbia - Trouton Proj.) Series 2005, 3.3% 3/7/24, LOC Bank of America NA, VRDN (b)(c) | | 4,110 | 4,110 |
TOTAL OREGON | | | 6,880 |
| Pennsylvania - 0.1% | | | |
| FNMA Montgomery County Redev. Auth. Multi-family Hsg. Rev. (Kingswood Apts. Proj.) Series 2001 A, 3.26% 3/7/24, LOC Fannie Mae, VRDN (b) | | 2,275 | 2,275 |
| South Carolina - 0.4% | | | |
| South Carolina Jobs-Econ. Dev. Auth. Econ. Dev. Rev. (Waste Mgmt. of South Carolina, Inc. Proj.) Series 2003 A, 3.35% 3/7/24, LOC Wells Fargo Bank NA, VRDN (b)(c) | | 15,000 | 15,000 |
| Tennessee - 0.3% | | | |
| Henderson TN IDB Rev. (Arvin Sango, Inc. Proj.) Series 2012, 3.28% 3/7/24, LOC Bank of Tokyo-Mitsubishi UFJ Ltd., VRDN (b)(c) | | 6,900 | 6,900 |
| Loudon County Indl. Dev. Board Exempt Facilities Rev. (Kimberly-Clark Corp. Proj.) Series 1999, 3.45% 3/7/24, VRDN (b)(c) | | 6,200 | 6,200 |
TOTAL TENNESSEE | | | 13,100 |
| Texas - 5.3% | | | |
| Calhoun County Navigation District Envir. Facilities Rev. (Formosa Plastics Corp. Proj.) Series 2004, 3.36% 3/7/24, LOC Citibank NA, VRDN (b)(c) | | 8,600 | 8,600 |
| Calhoun Port Auth. Envir. Facilities Rev. Series 2007 A, 3.33% 3/7/24, LOC PNC Bank NA, VRDN (b)(c) | | 6,665 | 6,665 |
| Converse Hsg. Fin. Corp. Multi-family Hsg. Rev. (Town Square Apts. Proj.) Series 2007, 3.41% 3/7/24, LOC Citibank NA, VRDN (b)(c) | | 11,360 | 11,360 |
| Jewett Econ. Dev. Corp. Indl. Dev. Rev. (Nucor Corp. Proj.) Series 2003, 3.89% 3/7/24, VRDN (b)(c) | | 12,600 | 12,600 |
| Lower Neches Valley Auth. Indl. Dev. Corp. Exempt Facilities Rev. (Onyx Envir. Svcs. Proj.) Series 2003, 3.29% 3/7/24, LOC Bank of America NA, VRDN (b)(c) | | 10,310 | 10,310 |
| Port Arthur Navigation District Indl. Dev. Corp. Exempt Facilities Rev. (Air Products Proj.): | | | |
| Series 2000, 3.85% 3/7/24, VRDN (b)(c) | | 25,000 | 25,000 |
| Series 2001, 3.85% 3/7/24, VRDN (b)(c) | | 25,000 | 25,000 |
| Series 2002, 3.85% 3/7/24, VRDN (b)(c) | | 22,500 | 22,500 |
| Port Arthur Navigation District Jefferson County Rev. Series 2000 B, 3.54% 3/7/24 (TotalEnergies SE Guaranteed), VRDN (b)(c) | | 10,000 | 10,000 |
| Tarrant County Cultural Ed. Facilities Fin. Corp. Rev. (Christus Health Proj.): | | | |
| Series 2008 C3, 3.2% 3/7/24, LOC TD Banknorth, NA, VRDN (b) | | 10,330 | 10,330 |
| Series 2008 C4, 3.2% 3/7/24, LOC TD Banknorth, NA, VRDN (b) | | 3,900 | 3,900 |
| Texas Gen. Oblig.: | | | |
| Series 2003 A, 3.45% 3/7/24 (Liquidity Facility State Street Bank & Trust Co., Boston), VRDN (b)(c) | | 12,255 | 12,255 |
| Series 2006 D, 3.45% 3/7/24 (Liquidity Facility State Street Bank & Trust Co., Boston), VRDN (b)(c) | | 15,250 | 15,250 |
| Series 2013 A, 3.4% 3/7/24 (Liquidity Facility State Street Bank & Trust Co., Boston), VRDN (b) | | 3,700 | 3,700 |
| Series 2015 A, 3.4% 3/7/24 (Liquidity Facility State Street Bank & Trust Co., Boston), VRDN (b) | | 4,400 | 4,400 |
| FNMA: | | | |
| Harris County Hsg. Fin. Corp. Multi-family Hsg. Rev. (Primrose at Bammel Apts. Proj.) Series 2005, 3.29% 3/7/24, LOC Fannie Mae, VRDN (b)(c) | | 6,280 | 6,280 |
| Texas Dept. of Hsg. & Cmnty. Affairs Multi-family Hsg. Rev. (Residences at Sunset Pointe Proj.) Series 2006, 3.38% 3/7/24, LOC Fannie Mae, VRDN (b)(c) | | 13,915 | 13,915 |
TOTAL TEXAS | | | 202,065 |
| Utah - 0.3% | | | |
| Emery County Poll. Cont. Rev. (PacifiCorp Proj.) Series 1994, 3.85% 3/7/24, VRDN (b) | | 13,300 | 13,300 |
| Virginia - 0.5% | | | |
| FHLMC Arlington County Indl. Dev. Auth. Multi-family Hsg. Rev. Series 2011 A, 3.3% 3/7/24, LOC Freddie Mac, VRDN (b)(c) | | 17,150 | 17,150 |
| Washington - 2.7% | | | |
| King County Hsg. Auth. Rev. (Overlake TOD Hsg. Proj.) Series 2000, 3.3% 3/7/24, LOC Bank of America NA, VRDN (b)(c) | | 15,255 | 15,255 |
| Port of Seattle Rev. Series 2008, 3.42% 3/7/24, LOC Bank of America NA, VRDN (b)(c) | | 28,665 | 28,665 |
| FHLMC Washington Hsg. Fin. Commission Multi-family Hsg. Rev.: | | | |
| (Ballard Landmark Inn Proj.) Series 2015 A, 3.37% 3/7/24, LOC Fed. Home Ln. Bank, San Francisco, VRDN (b)(c) | | 31,590 | 31,590 |
| (The Lodge at Eagle Ridge Proj.) Series A, 3.35% 3/7/24, LOC Fed. Home Ln. Bank, San Francisco, VRDN (b)(c) | | 8,885 | 8,885 |
| FNMA Washington Hsg. Fin. Commission Multi-family Hsg. Rev. (Echo Lake Sr. Apts. Proj.) Series 2006, 3.35% 3/7/24, LOC Fannie Mae, VRDN (b)(c) | | 17,970 | 17,970 |
TOTAL WASHINGTON | | | 102,365 |
| West Virginia - 2.0% | | | |
| West Virginia Econ. Dev. Auth. Solid Waste Disp. Facilities Rev.: | | | |
| (Appalachian Pwr. Co. Amos Proj.) Series 2008 B, 3.32% 3/7/24, VRDN (b)(c) | | 36,475 | 36,475 |
| (Appalachian Pwr. Co.- Mountaineer Proj.) Series 2008 A, 3.28% 3/7/24, VRDN (b)(c) | | 38,900 | 38,900 |
TOTAL WEST VIRGINIA | | | 75,375 |
| Wisconsin - 1.4% | | | |
| Green Bay Redev. Auth. (Green Bay Packaging, Inc. Proj.) Series 2019, 3.3% 3/7/24, LOC Wells Fargo Bank NA, VRDN (b)(c)(f) | | 54,200 | 54,200 |
| Wyoming - 0.4% | | | |
| Laramie County Indl. Dev. Rev. (Cheyenne Lt., Fuel & Pwr. Co. Proj.) Series 2009 A, 3.26% 3/7/24, LOC Wells Fargo Bank NA, VRDN (b)(c) | | 10,000 | 10,000 |
| Sweetwater County Env Imp Rev. (Pacificorp Proj.) Series 1995, 4.1% 3/1/24, VRDN (b)(c) | | 4,100 | 4,100 |
TOTAL WYOMING | | | 14,100 |
| TOTAL VARIABLE RATE DEMAND NOTE (Cost $1,664,314) | | | 1,664,314 |
| | | | |
| Tender Option Bond - 33.0% |
| | | Principal Amount (a) (000s) | Value ($) (000s) |
| Alabama - 0.4% | | | |
| Black Belt Energy Gas District Participating VRDN: | | | |
| Series ZF 16 77, 3.29% 3/7/24 (Liquidity Facility Royal Bank of Canada) (b)(g)(h) | | 2,190 | 2,190 |
| Series ZL 05 09, 3.29% 3/7/24 (Liquidity Facility Royal Bank of Canada) (b)(g)(h) | | 4,515 | 4,515 |
| Huntsville Hosp. Participating VRDN Series XG 03 84, 3.28% 3/7/24 (Liquidity Facility Bank of America NA) (b)(g)(h) | | 1,910 | 1,910 |
| Jefferson County Swr. Rev. Participating VRDN Series XL 05 31, 3.28% 3/7/24 (Liquidity Facility Barclays Bank PLC) (b)(g)(h) | | 2,300 | 2,300 |
| Southeast Energy Auth. Rev. Participating VRDN Series XM 11 31, 3.29% 3/7/24 (Liquidity Facility Royal Bank of Canada) (b)(g)(h) | | 4,000 | 4,000 |
TOTAL ALABAMA | | | 14,915 |
| Arizona - 0.4% | | | |
| Arizona Indl. Dev. Auth. Hosp. Rev. Participating VRDN Series XM 10 13, 3.36% 3/7/24 (Liquidity Facility JPMorgan Chase Bank) (b)(g)(h) | | 675 | 675 |
| Arizona Tourism & Sports Auth. Tax Rev. Participating VRDN Series Floaters E85, 3.27% 3/7/24 (Liquidity Facility Royal Bank of Canada) (b)(g)(h) | | 3,600 | 3,600 |
| Maricopa County Indl. Dev. Auth. Participating VRDN Series E 147, 3.27% 3/7/24 (Liquidity Facility Royal Bank of Canada) (b)(g)(h) | | 6,500 | 6,500 |
| Phoenix Civic Impt. Board Arpt. Rev. Participating VRDN Series YX 12 72, 3.29% 3/7/24 (Liquidity Facility Barclays Bank PLC) (b)(c)(g)(h) | | 2,755 | 2,755 |
TOTAL ARIZONA | | | 13,530 |
| California - 0.4% | | | |
| California Cmnty. Choice Fing. Auth. Clean Energy Proj. Rev. Participating VRDN Series XM 11 38, 3.27% 3/7/24 (Liquidity Facility Royal Bank of Canada) (b)(g)(h) | | 2,000 | 2,000 |
| California Health Facilities Fing. Auth. Rev. Participating VRDN Series Floaters XF 24 67, 3.27% 3/7/24 (Liquidity Facility Morgan Stanley Bank, West Valley City Utah) (b)(g)(h) | | 1,200 | 1,200 |
| Los Angeles Dept. Arpt. Rev. Participating VRDN: | | | |
| Series Floaters XX 10 28, 3.27% 3/7/24 (Liquidity Facility Barclays Bank PLC) (b)(c)(g)(h) | | 880 | 880 |
| Series XM 08 69, 3.29% 3/7/24 (Liquidity Facility JPMorgan Chase Bank) (b)(c)(g)(h) | | 5,165 | 5,165 |
| Series YX 12 29, 3.27% 3/7/24 (Liquidity Facility Barclays Bank PLC) (b)(c)(g)(h) | | 4,980 | 4,980 |
| San Diego County Reg'l. Arpt. Auth. Arpt. Rev. Participating VRDN Series XX 12 15, 3.27% 3/7/24 (Liquidity Facility Barclays Bank PLC) (b)(c)(g)(h) | | 2,000 | 2,000 |
| San Francisco City & County Arpts. Commission Int'l. Arpt. Rev. Participating VRDN Series Floaters XL 01 01, 3.29% 3/7/24 (Liquidity Facility JPMorgan Chase Bank) (b)(c)(g)(h) | | 115 | 115 |
TOTAL CALIFORNIA | | | 16,340 |
| Colorado - 1.5% | | | |
| Colorado Health Facilities Auth. Rev. Bonds Participating VRDN: | | | |
| Series 2023, 3.54% 4/4/24 (Liquidity Facility Barclays Bank PLC) (b)(g)(h) | | 6,475 | 6,475 |
| Series XF 30 40, 3.28% 3/7/24 (Liquidity Facility Barclays Bank PLC) (b)(g)(h) | | 2,625 | 2,625 |
| Series XG 02 51, 3.29% 3/7/24 (Liquidity Facility Bank of America NA) (b)(g)(h) | | 390 | 390 |
| Series XM 08 29, 3.28% 3/7/24 (Liquidity Facility Barclays Bank PLC) (b)(g)(h) | | 3,900 | 3,900 |
| Denver City & County Arpt. Rev. Participating VRDN: | | | |
| Series 2022 XX 12 60, 3.29% 3/7/24 (Liquidity Facility Barclays Bank PLC) (b)(c)(g)(h) | | 7,050 | 7,050 |
| Series 2022 XX 12 61, 3.29% 3/7/24 (Liquidity Facility Barclays Bank PLC) (b)(c)(g)(h) | | 3,750 | 3,750 |
| Series Floaters XG 01 96, 3.32% 3/7/24 (Liquidity Facility Toronto-Dominion Bank) (b)(c)(g)(h) | | 18,835 | 18,835 |
| Series XF 15 13, 3.32% 3/7/24 (Liquidity Facility Toronto-Dominion Bank) (b)(c)(g)(h) | | 6,685 | 6,685 |
| Series XM 11 51, 3.29% 3/7/24 (Liquidity Facility UBS AG) (b)(c)(g)(h) | | 3,750 | 3,750 |
| Series ZF 32 04, 3.29% 3/7/24 (Liquidity Facility Morgan Stanley Bank, West Valley City Utah) (b)(c)(g)(h) | | 2,120 | 2,120 |
TOTAL COLORADO | | | 55,580 |
| Connecticut - 2.6% | | | |
| Connecticut Gen. Oblig. Participating VRDN: | | | |
| Series Floaters 014, 3.28% 3/7/24 (Liquidity Facility Barclays Bank PLC) (b)(g)(h) | | 15,800 | 15,800 |
| Series Floaters 016, 3.28% 3/7/24 (Liquidity Facility Barclays Bank PLC) (b)(g)(h) | | 83,940 | 83,940 |
TOTAL CONNECTICUT | | | 99,740 |
| District Of Columbia - 0.1% | | | |
| Metropolitan Washington Arpts. Auth. Dulles Toll Road Rev. Participating VRDN: | | | |
| Series XF 08 52, 3.27% 3/7/24 (Liquidity Facility JPMorgan Chase Bank) (b)(g)(h) | | 1,355 | 1,355 |
| Series XF 09 20, 3.27% 3/7/24 (Liquidity Facility JPMorgan Chase Bank) (b)(g)(h) | | 2,145 | 2,145 |
| Series XG 02 67, 3.29% 3/7/24 (Liquidity Facility Bank of America NA) (b)(g)(h) | | 920 | 920 |
TOTAL DISTRICT OF COLUMBIA | | | 4,420 |
| Florida - 2.4% | | | |
| Broward County Arpt. Sys. Rev. Participating VRDN Series XG 04 43, 3.31% 3/7/24 (Liquidity Facility Royal Bank of Canada) (b)(c)(g)(h) | | 5,315 | 5,315 |
| Broward County Convention Ctr. Participating VRDN: | | | |
| Series XF 16 41, 3.34% 3/7/24 (Liquidity Facility JPMorgan Chase Bank) (b)(g)(h) | | 3,800 | 3,800 |
| Series XM 11 52, 3.34% 3/7/24 (Liquidity Facility JPMorgan Chase Bank) (b)(g)(h) | | 5,600 | 5,600 |
| County of Broward Tourist Dev. Tax Rev. Participating VRDN Series XL 04 29, 3.35% 3/7/24 (Liquidity Facility Wells Fargo Bank NA) (b)(g)(h) | | 900 | 900 |
| Florida Dept. of Trans. Tpk. Rev. Participating VRDN Series XM 10 72, 3.27% 3/7/24 (Liquidity Facility Morgan Stanley Bank, West Valley City Utah) (b)(g)(h) | | 3,750 | 3,750 |
| Greater Orlando Aviation Auth. Arpt. Facilities Rev. Participating VRDN: | | | |
| Series XF 14 63, 3.34% 3/7/24 (Liquidity Facility Toronto-Dominion Bank) (b)(c)(g)(h) | | 1,205 | 1,205 |
| Series XL 04 30, 3.29% 3/7/24 (Liquidity Facility Barclays Bank PLC) (b)(c)(g)(h) | | 3,750 | 3,750 |
| Series XM 08 96, 3.29% 3/7/24 (Liquidity Facility JPMorgan Chase Bank) (b)(c)(g)(h) | | 6,375 | 6,375 |
| Hillsborough County Aviation Auth. Rev. Participating VRDN Series XF 16 10, 3.29% 3/7/24 (Liquidity Facility JPMorgan Chase Bank) (b)(c)(g)(h) | | 5,455 | 5,455 |
| Hillsborough County Indl. Dev. Participating VRDN Series XG 04 67, 3.28% 3/7/24 (Liquidity Facility Barclays Bank PLC) (b)(g)(h) | | 3,055 | 3,055 |
| JEA Wtr. & Swr. Sys. Rev. Participating VRDN Series XF 16 91, 3.27% 3/7/24 (Liquidity Facility JPMorgan Chase Bank) (b)(g)(h) | | 2,500 | 2,500 |
| Lee County Arpt. Rev. Participating VRDN: | | | |
| Series XF 11 26, 3.32% 3/7/24 (Liquidity Facility Toronto-Dominion Bank) (b)(c)(g)(h) | | 3,195 | 3,195 |
| Series XF 15 23, 3.3% 3/7/24 (Liquidity Facility Royal Bank of Canada) (b)(c)(g)(h) | | 2,430 | 2,430 |
| Miami-Dade County Participating VRDN Series XF 11 59, 3.32% 3/7/24 (Liquidity Facility Toronto-Dominion Bank) (b)(c)(g)(h) | | 6,310 | 6,310 |
| Miami-Dade County Aviation Rev. Participating VRDN Series XX 13 22, 3.29% 3/7/24 (Liquidity Facility Barclays Bank PLC) (b)(c)(g)(h) | | 4,090 | 4,090 |
| Miami-Dade County Edl. Facilities Rev. Participating VRDN Series Floaters XG 01 92, 3.28% 3/7/24 (Liquidity Facility Royal Bank of Canada) (b)(g)(h) | | 5,900 | 5,900 |
| Miami-Dade County Expressway Auth. Participating VRDN Series Floaters XG 02 52, 3.29% 3/7/24 (Liquidity Facility Bank of America NA) (b)(g)(h) | | 6,100 | 6,100 |
| Miami-Dade County Wtr. & Swr. Rev. Participating VRDN Series XF 31 22, 3.27% 3/7/24 (Liquidity Facility Barclays Bank PLC) (b)(g)(h) | | 4,280 | 4,280 |
| Palm Beach County Health Facilities Auth. Hosp. Rev. Participating VRDN Series XG 03 70, 3.34% 3/7/24 (Liquidity Facility Bank of America NA) (b)(g)(h) | | 2,380 | 2,380 |
| South Broward Hosp. District Rev. Participating VRDN Series XG 03 45, 3.27% 3/7/24 (Liquidity Facility Wells Fargo Bank NA) (b)(g)(h) | | 3,300 | 3,300 |
| South Miami Health Facilities Auth. Hosp. Rev. Participating VRDN Series YX 12 86, 3.31% 3/7/24 (Liquidity Facility Barclays Bank PLC) (b)(g)(h) | | 3,500 | 3,500 |
| Tallahassee Health Facilities Rev. Participating VRDN Series XG 04 85, 3.27% 3/7/24 (Liquidity Facility Royal Bank of Canada) (b)(g)(h) | | 2,595 | 2,595 |
| Tampa Bay Wtr. Reg'l. Wtr. Supply Auth. Util. Sys. Rev. Participating VRDN Series ZL 04 85, 3.27% 3/7/24 (Liquidity Facility Wells Fargo Bank NA) (b)(g)(h) | | 2,500 | 2,500 |
| Tampa Health Sys. Rev. Participating VRDN Series XF 31 46, 3.29% 3/7/24 (Liquidity Facility Wells Fargo Bank NA) (b)(g)(h) | | 2,300 | 2,300 |
TOTAL FLORIDA | | | 90,585 |
| Georgia - 1.4% | | | |
| Burke County Indl. Dev. Auth. Poll. Cont. Rev. Participating VRDN: | | | |
| Series E 155, 3.28% 3/7/24 (Liquidity Facility Royal Bank of Canada) (b)(g)(h) | | 19,400 | 19,400 |
| Series Floaters E 107, 3.29% 3/7/24 (Liquidity Facility Royal Bank of Canada) (b)(g)(h) | | 14,800 | 14,800 |
| Fulton County Dev. Auth. Rev. Participating VRDN Series XL 02 68, 3.34% 3/7/24 (Liquidity Facility Bank of America NA) (b)(g)(h) | | 990 | 990 |
| Georgia Muni. Elec. Auth. Pwr. Rev. Participating VRDN: | | | |
| Series XF 31 06, 3.28% 3/7/24 (Liquidity Facility Barclays Bank PLC) (b)(g)(h) | | 8,070 | 8,070 |
| Series XG 04 70, 3.29% 3/7/24 (Liquidity Facility Bank of America NA) (b)(g)(h) | | 6,925 | 6,925 |
| Muni. Elec. Auth. of Georgia Participating VRDN Series XG 02 54, 3.29% 3/7/24 (Liquidity Facility Bank of America NA) (b)(g)(h) | | 3,880 | 3,880 |
TOTAL GEORGIA | | | 54,065 |
| Hawaii - 0.6% | | | |
| Hawaii Arpts. Sys. Rev. Participating VRDN: | | | |
| Series XX 12 17, 3.29% 3/7/24 (Liquidity Facility Barclays Bank PLC) (b)(c)(g)(h) | | 16,635 | 16,635 |
| Series YX 12 52, 3.29% 3/7/24 (Liquidity Facility Barclays Bank PLC) (b)(c)(g)(h) | | 5,895 | 5,895 |
TOTAL HAWAII | | | 22,530 |
| Illinois - 5.9% | | | |
| Chicago Gen. Oblig. Participating VRDN: | | | |
| Series 2022 XF 30 42, 3.28% 3/7/24 (Liquidity Facility Barclays Bank PLC) (b)(g)(h) | | 19,900 | 19,900 |
| Series 2022 XF 30 45, 3.28% 3/7/24 (Liquidity Facility Barclays Bank PLC) (b)(g)(h) | | 7,750 | 7,750 |
| Series Floaters XL 01 05, 3.28% 3/7/24 (Liquidity Facility Barclays Bank PLC) (b)(g)(h) | | 4,400 | 4,400 |
| Series XG 04 34, 3.27% 3/7/24 (Liquidity Facility Royal Bank of Canada) (b)(g)(h) | | 2,750 | 2,750 |
| Series XX 12 64, 3.28% 3/7/24 (Liquidity Facility Barclays Bank PLC) (b)(g)(h) | | 7,055 | 7,055 |
| Chicago O'Hare Int'l. Arpt. Rev. Participating VRDN: | | | |
| Series Floaters XF 07 23, 3.28% 3/7/24 (Liquidity Facility JPMorgan Chase Bank) (b)(c)(g)(h) | | 10,560 | 10,560 |
| Series Floaters XG 02 19, 3.28% 3/7/24 (Liquidity Facility JPMorgan Chase Bank) (b)(c)(g)(h) | | 1,820 | 1,820 |
| Series XF 14 30, 3.31% 3/7/24 (Liquidity Facility Royal Bank of Canada) (b)(c)(g)(h) | | 2,810 | 2,810 |
| Series XX 12 43, 3.29% 3/7/24 (Liquidity Facility Barclays Bank PLC) (b)(c)(g)(h) | | 5,625 | 5,625 |
| Series XX 12 45, 3.29% 3/7/24 (Liquidity Facility Barclays Bank PLC) (b)(c)(g)(h) | | 10,500 | 10,500 |
| Chicago Transit Auth. Participating VRDN Series XL 01 45, 3.28% 3/7/24 (Liquidity Facility Barclays Bank PLC) (b)(g)(h) | | 1,180 | 1,180 |
| Illinois Fin. Auth. Participating VRDN: | | | |
| Series BAML 50 45, 3.32% 3/7/24 (Liquidity Facility Bank of America NA) (b)(g)(h) | | 22,900 | 22,900 |
| Series BAML 50 47, 3.32% 3/7/24 (Liquidity Facility Bank of America NA) (b)(g)(h) | | 22,100 | 22,100 |
| Series XF 30 36, 3.27% 3/7/24 (Liquidity Facility Morgan Stanley Bank, West Valley City Utah) (b)(g)(h) | | 4,000 | 4,000 |
| Illinois Fin. Auth. Rev. Participating VRDN: | | | |
| Series 2022 ZL 03 54, 3.27% 3/7/24 (Liquidity Facility Morgan Stanley Bank, West Valley City Utah) (b)(g)(h) | | 2,500 | 2,500 |
| Series Floaters 017, 3.54% 4/4/24 (Liquidity Facility Barclays Bank PLC) (b)(g)(h) | | 11,300 | 11,300 |
| Series XF 07 11, 3.27% 3/7/24 (Liquidity Facility JPMorgan Chase Bank) (b)(g)(h) | | 11,050 | 11,050 |
| Series XG 04 50, 3.27% 3/7/24 (Liquidity Facility Wells Fargo Bank NA) (b)(g)(h) | | 3,465 | 3,465 |
| Series YX 12 26, 3.28% 3/7/24 (Liquidity Facility Barclays Bank PLC) (b)(g)(h) | | 9,150 | 9,150 |
| Illinois Gen. Oblig. Participating VRDN: | | | |
| Series XF 10 10, 3.28% 3/7/24 (Liquidity Facility Barclays Bank PLC) (b)(g)(h) | | 5,800 | 5,800 |
| Series XM 07 59, 3.29% 3/7/24 (Liquidity Facility Bank of America NA) (b)(g)(h) | | 1,125 | 1,125 |
| Series XM 10 48, 3.29% 3/7/24 (Liquidity Facility Bank of America NA) (b)(g)(h) | | 11,185 | 11,185 |
| Series XM 10 49, 3.29% 3/7/24 (Liquidity Facility Bank of America NA) (b)(g)(h) | | 1,850 | 1,850 |
| Series XX 11 41, 3.28% 3/7/24 (Liquidity Facility Barclays Bank PLC) (b)(g)(h) | | 1,200 | 1,200 |
| Series YX 13 27, 3.28% 3/7/24 (Liquidity Facility Barclays Bank PLC) (b)(g)(h) | | 5,590 | 5,590 |
| Illinois Hsg. Dev. Auth. Participating VRDN Series 2023, 3.27% 3/7/24 (Liquidity Facility Citibank NA) (b)(g)(h) | | 2,500 | 2,500 |
| Illinois Toll Hwy. Auth. Toll Hwy. Rev. Participating VRDN: | | | |
| Series 15 XF0277, 3.3% 3/7/24 (Liquidity Facility JPMorgan Chase Bank) (b)(g)(h) | | 2,000 | 2,000 |
| Series XF 14 22, 3.29% 3/7/24 (Liquidity Facility Royal Bank of Canada) (b)(g)(h) | | 2,670 | 2,670 |
| Series XM 10 02, 3.27% 3/5/24 (Liquidity Facility Morgan Stanley Bank, West Valley City Utah) (b)(g)(h) | | 4,245 | 4,245 |
| Series ZF 31 56, 3.27% 3/7/24 (Liquidity Facility Morgan Stanley Bank, West Valley City Utah) (b)(g)(h) | | 2,165 | 2,165 |
| Metropolitan Pier & Exposition Participating VRDN Series Floaters XF 10 45, 3.36% 3/7/24 (Liquidity Facility Barclays Bank PLC) (b)(g)(h) | | 1,300 | 1,300 |
| RBC Muni. Products, Inc. Trust Participating VRDN Series 2023, 3.29% 3/7/24 (Liquidity Facility Royal Bank of Canada) (b)(g)(h) | | 19,800 | 19,800 |
TOTAL ILLINOIS | | | 222,245 |
| Indiana - 0.1% | | | |
| Indiana Fin. Auth. Health Facilities Rev. Participating VRDN Series XF 15 69, 3.27% 3/7/24 (Liquidity Facility Royal Bank of Canada) (b)(g)(h) | | 4,000 | 4,000 |
| Kansas - 0.1% | | | |
| Univ. of Kansas Hosp. Auth. Health Facilities Rev. Participating VRDN Series XL 04 74, 3.27% 3/7/24 (Liquidity Facility Wells Fargo Bank NA) (b)(g)(h) | | 4,300 | 4,300 |
| Kentucky - 0.1% | | | |
| CommonSpirit Health Participating VRDN Series MIZ 90 21, 3.34% 3/7/24 (Liquidity Facility Mizuho Cap. Markets LLC) (b)(g)(h) | | 2,575 | 2,575 |
| Kentucky Bd Dev. Corp. Indl. Bldg. Participating VRDN Series XM 11 41, 3.29% 3/7/24 (Liquidity Facility Royal Bank of Canada) (b)(g)(h) | | 3,000 | 3,000 |
TOTAL KENTUCKY | | | 5,575 |
| Louisiana - 0.3% | | | |
| Louisiana Pub. Facilities Auth. Rev. Participating VRDN Series YX 12 95, 3.27% 3/7/24 (Liquidity Facility Barclays Bank PLC) (b)(g)(h) | | 5,600 | 5,600 |
| New Orleans Aviation Board Rev. Participating VRDN Series XF 31 48, 3.29% 3/7/24 (Liquidity Facility Barclays Bank PLC) (b)(c)(g)(h) | | 4,500 | 4,500 |
TOTAL LOUISIANA | | | 10,100 |
| Maryland - 0.1% | | | |
| Maryland Health & Higher Edl. Facilities Auth. Rev. Participating VRDN Series XF 31 52, 3.28% 3/7/24 (Liquidity Facility Barclays Bank PLC) (b)(g)(h) | | 2,800 | 2,800 |
| Montgomery County Gen. Oblig. Participating VRDN Series Floaters XG 02 15, 3.28% 3/7/24 (Liquidity Facility Bank of America NA) (b)(g)(h) | | 1,470 | 1,470 |
TOTAL MARYLAND | | | 4,270 |
| Michigan - 0.1% | | | |
| Mclaren Health Care Corp. Participating VRDN Series XL 02 71, 3.34% 3/7/24 (Liquidity Facility Bank of America NA) (b)(g)(h) | | 2,380 | 2,380 |
| Michigan Fin. Auth. Rev. Participating VRDN: | | | |
| Series XF 07 82, 3.27% 3/7/24 (Liquidity Facility JPMorgan Chase Bank) (b)(g)(h) | | 940 | 940 |
| Series XG 04 33, 3.27% 3/7/24 (Liquidity Facility JPMorgan Chase Bank) (b)(g)(h) | | 1,530 | 1,530 |
TOTAL MICHIGAN | | | 4,850 |
| Minnesota - 0.1% | | | |
| Minnesota Hsg. Fin. Agcy. Participating VRDN Series XF 28 79, 3.27% 3/7/24 (Liquidity Facility Morgan Stanley Bank, West Valley City Utah) (b)(g)(h) | | 4,230 | 4,230 |
| Missouri - 1.8% | | | |
| Kansas City Indl. Dev. Auth. Participating VRDN: | | | |
| Series XG 03 96, 3.32% 3/7/24 (Liquidity Facility Toronto-Dominion Bank) (b)(c)(g)(h) | | 10,000 | 10,000 |
| Series XG 04 02, 3.32% 3/7/24 (Liquidity Facility Toronto-Dominion Bank) (b)(c)(g)(h) | | 5,920 | 5,920 |
| Series XG 04 79, 3.32% 3/7/24 (Liquidity Facility Toronto-Dominion Bank) (b)(c)(g)(h) | | 3,025 | 3,025 |
| Series XL 04 58, 3.29% 3/7/24 (Liquidity Facility Barclays Bank PLC) (b)(c)(g)(h) | | 3,840 | 3,840 |
| Kansas City Spl. Oblig. Participating VRDN Series YX 11 93, 3.28% 3/7/24 (Liquidity Facility Barclays Bank PLC) (b)(g)(h) | | 2,900 | 2,900 |
| Missouri Health & Edl. Facilities Auth. Rev. Participating VRDN Series Floaters C16, 3.29% 3/7/24 (Liquidity Facility Royal Bank of Canada) (b)(g)(h) | | 29,900 | 29,900 |
| Missouri Health & Edl. Facilities Rev.: | | | |
| Bonds Series 2023 G 121, 3.44%, tender 6/3/24 (Liquidity Facility Royal Bank of Canada) (b)(g)(h) | | 1,300 | 1,300 |
| Participating VRDN Series Floaters C17, 3.28% 3/7/24 (Liquidity Facility Royal Bank of Canada) (b)(g)(h) | | 8,500 | 8,500 |
| St Louis County Spl. Oblig. Participating VRDN Series XG 03 82, 3.27% 3/7/24 (Liquidity Facility Wells Fargo Bank NA) (b)(g)(h) | | 2,240 | 2,240 |
TOTAL MISSOURI | | | 67,625 |
| Nebraska - 0.0% | | | |
| Central Plains Energy Proj. Rev. Participating VRDN Series 2022 ZL 03 01, 3.29% 3/7/24 (Liquidity Facility Royal Bank of Canada) (b)(g)(h) | | 335 | 335 |
| Nevada - 0.3% | | | |
| Clark County School District Participating VRDN Series XF 14 73, 3.36% 3/7/24 (Liquidity Facility JPMorgan Chase Bank) (b)(g)(h) | | 1,495 | 1,495 |
| Clark County Wtr. Reclamation District Participating VRDN Series XG 05 11, 3.27% 3/7/24 (Liquidity Facility Bank of America NA) (b)(g)(h) | | 9,000 | 9,000 |
TOTAL NEVADA | | | 10,495 |
| New Jersey - 1.1% | | | |
| New Jersey Econ. Dev. Auth. Rev. Participating VRDN: | | | |
| Series Floaters XF 23 93, 3.28% 3/7/24 (Liquidity Facility Barclays Bank PLC) (b)(g)(h) | | 1,750 | 1,750 |
| Series Floaters XL 00 52, 3.28% 3/7/24 (Liquidity Facility Barclays Bank PLC) (b)(g)(h) | | 3,525 | 3,525 |
| New Jersey Hsg. & Mtg. Fin. Agcy. Multi-family Rev. Participating VRDN Series Floater 2024, 3.49% 4/4/24 (Liquidity Facility Barclays Bank PLC) (b)(g)(h) | | 13,600 | 13,600 |
| New Jersey Tpk. Auth. Tpk. Rev. Participating VRDN: | | | |
| Series 2022 XF 04 09, 3.27% 3/7/24 (Liquidity Facility Wells Fargo Bank NA) (b)(g)(h) | | 4,200 | 4,200 |
| Series XM 10 96, 3.29% 3/7/24 (Liquidity Facility Royal Bank of Canada) (b)(g)(h) | | 3,500 | 3,500 |
| New Jersey Trans. Trust Fund Auth. Participating VRDN: | | | |
| Series Floaters XG 02 05, 3.28% 3/7/24 (Liquidity Facility Barclays Bank PLC) (b)(g)(h) | | 1,900 | 1,900 |
| Series Floaters XX 10 93, 3.28% 3/7/24 (Liquidity Facility Barclays Bank PLC) (b)(g)(h) | | 3,900 | 3,900 |
| Series XX 13 29, 3.28% 3/7/24 (Liquidity Facility Barclays Bank PLC) (b)(g)(h) | | 4,250 | 4,250 |
| Series YX 12 68, 3.28% 3/7/24 (Liquidity Facility Barclays Bank PLC) (b)(g)(h) | | 3,500 | 3,500 |
TOTAL NEW JERSEY | | | 40,125 |
| New York - 3.6% | | | |
| New York City Muni. Wtr. Fin. Auth. Wtr. & Swr. Sys. Rev. Participating VRDN: | | | |
| Series Floaters E 129, 3.27% 3/7/24 (Liquidity Facility Royal Bank of Canada) (b)(g)(h) | | 30,700 | 30,700 |
| Series XF 13 36, 3.27% 3/7/24 (Liquidity Facility JPMorgan Chase Bank) (b)(g)(h) | | 4,325 | 4,325 |
| New York Metropolitan Trans. Auth. Rev. Participating VRDN: | | | |
| Series XF 28 68, 3.28% 3/7/24 (Liquidity Facility Barclays Bank PLC) (b)(g)(h) | | 7,000 | 7,000 |
| Series XF 28 78, 3.28% 3/7/24 (Liquidity Facility Barclays Bank PLC) (b)(g)(h) | | 2,200 | 2,200 |
| Series XF 30 00, 3.28% 3/7/24 (Liquidity Facility Barclays Bank PLC) (b)(g)(h) | | 10,000 | 10,000 |
| Series XG 02 90, 3.28% 3/7/24 (Liquidity Facility Barclays Bank PLC) (b)(g)(h) | | 16,420 | 16,420 |
| Series XX 11 56, 3.28% 3/7/24 (Liquidity Facility Barclays Bank PLC) (b)(g)(h) | | 9,165 | 9,165 |
| New York Trans. Dev. Corp. Participating VRDN Series 2022 E 154, 3.34% 3/7/24 (Liquidity Facility Royal Bank of Canada) (b)(c)(g)(h) | | 57,925 | 57,925 |
TOTAL NEW YORK | | | 137,735 |
| New York And New Jersey - 0.5% | | | |
| Port Auth. of New York & New Jersey Participating VRDN: | | | |
| Series ROC 14086, 3.31% 3/7/24 (Liquidity Facility JPMorgan Chase Bank) (b)(c)(g)(h) | | 12,210 | 12,210 |
| Series YX 11 78, 3.31% 3/7/24 (Liquidity Facility Barclays Bank PLC) (b)(c)(g)(h) | | 5,625 | 5,625 |
| Series ZL 02 55, 3.3% 3/7/24 (Liquidity Facility Bank of America NA) (b)(c)(g)(h) | | 1,100 | 1,100 |
TOTAL NEW YORK AND NEW JERSEY | | | 18,935 |
| North Carolina - 0.2% | | | |
| Charlotte Int'l. Arpt. Rev. Participating VRDN Series XG 05 27, 3.33% 3/7/24 (Liquidity Facility Bank of America NA) (b)(c)(g)(h) | | 4,800 | 4,800 |
| Greater Asheville Reg'l. Arpt. Auth. Participating VRDN: | | | |
| Series XF 15 32, 3.32% 3/7/24 (Liquidity Facility Toronto-Dominion Bank) (b)(c)(g)(h) | | 2,330 | 2,330 |
| Series XM 10 11, 3.31% 3/7/24 (Liquidity Facility Royal Bank of Canada) (b)(c)(g)(h) | | 2,100 | 2,100 |
TOTAL NORTH CAROLINA | | | 9,230 |
| Ohio - 0.8% | | | |
| CommonSpirit Health Participating VRDN Series MIZ 90 20, 3.34% 3/7/24 (Liquidity Facility Mizuho Cap. Markets LLC) (b)(g)(h) | | 1,665 | 1,665 |
| Cuyahoga County Ctfs. of Prtn. Participating VRDN Series Floaters XG 02 06, 3.34% 3/7/24 (Liquidity Facility Bank of America NA) (b)(g)(h) | | 5,300 | 5,300 |
| Montgomery County Hosp. Rev. Participating VRDN: | | | |
| Series Floaters E 132, 3.27% 3/7/24 (Liquidity Facility Royal Bank of Canada) (b)(g)(h) | | 3,800 | 3,800 |
| Series XX 12 48, 3.28% 3/7/24 (Liquidity Facility Barclays Bank PLC) (b)(g)(h) | | 5,400 | 5,400 |
| Ohio Higher Edl. Facility Commission Rev. Participating VRDN Series XF 31 14, 3.27% 3/7/24 (Liquidity Facility Morgan Stanley Bank, West Valley City Utah) (b)(g)(h) | | 2,875 | 2,875 |
| Ohio Hosp. Rev. Participating VRDN: | | | |
| Series C18, 3.28% 3/7/24 (Liquidity Facility Royal Bank of Canada) (b)(g)(h) | | 2,400 | 2,400 |
| Series XG 04 90, 3.28% 3/7/24 (Liquidity Facility Barclays Bank PLC) (b)(g)(h) | | 2,610 | 2,610 |
| RBC Muni. Products, Inc. Trust Participating VRDN Series 2023, 3.28% 3/7/24 (Liquidity Facility Royal Bank of Canada) (b)(g)(h) | | 5,000 | 5,000 |
TOTAL OHIO | | | 29,050 |
| Oklahoma - 0.1% | | | |
| Oklahoma Dev. Fin. Auth. Health Sys. Rev. Participating VRDN Series E 140, 3.27% 3/7/24 (Liquidity Facility Royal Bank of Canada) (b)(g)(h) | | 3,105 | 3,105 |
| Oregon - 0.2% | | | |
| Multnomah County School District #1J Portland Participating VRDN Series XF 15 30, 3.27% 3/7/24 (Liquidity Facility JPMorgan Chase Bank) (b)(g)(h) | | 6,250 | 6,250 |
| Pennsylvania - 2.2% | | | |
| Allegheny County Arpt. Auth. Rev. Participating VRDN: | | | |
| Series XF 16 34, 3.3% 3/7/24 (Liquidity Facility Royal Bank of Canada) (b)(c)(g)(h) | | 2,670 | 2,670 |
| Series XG 05 41, 3.3% 3/7/24 (Liquidity Facility Royal Bank of Canada) (b)(c)(g)(h) | | 11,975 | 11,975 |
| Commonwealth Fing. Auth. Tobacco Participating VRDN Series XX 10 80, 3.28% 3/7/24 (Liquidity Facility Barclays Bank PLC) (b)(g)(h) | | 2,700 | 2,700 |
| Lehigh County Gen. Purp. Hosp. Rev. Participating VRDN: | | | |
| Series BAML 23 50 39, 3.32% 4/4/24 (Liquidity Facility Bank of America NA) (b)(g)(h) | | 4,700 | 4,700 |
| Series XF 15 11, 3.28% 3/7/24 (Liquidity Facility Toronto-Dominion Bank) (b)(g)(h) | | 2,855 | 2,855 |
| Montgomery County Higher Ed. & Health Auth. Rev. Participating VRDN Series XG 05 28, 3.28% 3/7/24 (Liquidity Facility Toronto-Dominion Bank) (b)(g)(h) | | 1,875 | 1,875 |
| Pennsylvania Econ. Dev. Fing. Auth. Participating VRDN: | | | |
| Series XG 04 37, 3.29% 3/7/24 (Liquidity Facility Barclays Bank PLC) (b)(c)(g)(h) | | 26,995 | 26,995 |
| Series XM 10 83, 3.32% 3/7/24 (Liquidity Facility Royal Bank of Canada) (b)(c)(g)(h) | | 6,970 | 6,970 |
| Pennsylvania Higher Edl. Facilities Auth. Rev. Participating VRDN Series XG 02 63, 3.27% 3/7/24 (Liquidity Facility Bank of America NA) (b)(g)(h) | | 390 | 390 |
| Pennsylvania State Univ. Participating VRDN Series XM 08 27, 3.27% 3/7/24 (Liquidity Facility JPMorgan Chase Bank) (b)(g)(h) | | 3,100 | 3,100 |
| Pennsylvania Tpk. Commission Tpk. Rev. Participating VRDN Series XM 10 08, 3.27% 3/7/24 (Liquidity Facility Royal Bank of Canada) (b)(g)(h) | | 830 | 830 |
| Philadelphia Arpt. Rev. Participating VRDN Series YX 12 11, 3.29% 3/7/24 (Liquidity Facility Barclays Bank PLC) (b)(c)(g)(h) | | 12,545 | 12,545 |
| Philadelphia Wtr. & Wastewtr. Rev. Participating VRDN Series XF 16 06, 3.28% 3/7/24 (Liquidity Facility Toronto-Dominion Bank) (b)(g)(h) | | 4,400 | 4,400 |
| Southeastern Pennsylvania Trans. Auth. Rev. Participating VRDN Series XG 04 13, 3.27% 3/7/24 (Liquidity Facility Royal Bank of Canada) (b)(g)(h) | | 1,400 | 1,400 |
TOTAL PENNSYLVANIA | | | 83,405 |
| South Carolina - 0.4% | | | |
| South Carolina Ports Auth. Ports Rev. Participating VRDN Series XG 05 52, 3.3% 3/7/24 (Liquidity Facility Royal Bank of Canada) (b)(c)(g)(h) | | 2,590 | 2,590 |
| South Carolina Pub. Svc. Auth. Rev. Participating VRDN: | | | |
| Series 2017 XF 2425, 3.28% 3/7/24 (Liquidity Facility Barclays Bank PLC) (b)(g)(h) | | 100 | 100 |
| Series Floaters XG 02 09, 3.28% 3/7/24 (Liquidity Facility Toronto-Dominion Bank) (b)(g)(h) | | 4,410 | 4,410 |
| Series XL 04 18, 3.28% 3/7/24 (Liquidity Facility Barclays Bank PLC) (b)(g)(h) | | 6,195 | 6,195 |
TOTAL SOUTH CAROLINA | | | 13,295 |
| Tennessee - 0.3% | | | |
| Metropolitan Govt. of Nashville & Davidson County Participating VRDN Series XF 15 97, 3.27% 3/7/24 (Liquidity Facility Royal Bank of Canada) (b)(g)(h) | | 3,085 | 3,085 |
| Metropolitan Nashville Arpt. Auth. Rev. Participating VRDN: | | | |
| Series XL 03 82, 3.31% 3/7/24 (Liquidity Facility Royal Bank of Canada) (b)(c)(g)(h) | | 3,090 | 3,090 |
| Series XL 04 40, 3.3% 3/7/24 (Liquidity Facility Royal Bank of Canada) (b)(c)(g)(h) | | 2,440 | 2,440 |
| Series YX 12 89, 3.29% 3/7/24 (Liquidity Facility Barclays Bank PLC) (b)(c)(g)(h) | | 3,300 | 3,300 |
TOTAL TENNESSEE | | | 11,915 |
| Texas - 1.8% | | | |
| Austin Arpt. Sys. Rev. Participating VRDN Series YX 11 99, 3.29% 3/7/24 (Liquidity Facility Barclays Bank PLC) (b)(c)(g)(h) | | 6,500 | 6,500 |
| Bastrop Independent School District Participating VRDN Series XF 15 78, 3.28% 3/7/24 (Liquidity Facility Toronto-Dominion Bank) (b)(g)(h) | | 4,800 | 4,800 |
| El Paso Wtr. & Swr. Rev. Bonds Series G 124, 3.44%, tender 9/1/24 (Liquidity Facility Royal Bank of Canada) (b)(d)(e)(g)(h) | | 1,300 | 1,300 |
| Harris County Children's Hosp. Participating VRDN Series E-149, 3.27% 3/7/24 (Liquidity Facility Royal Bank of Canada) (b)(g)(h) | | 2,000 | 2,000 |
| Harris County Cultural Ed. Facilities Fin. Corp. Rev. Participating VRDN Series XF 32 03, 3.39% 3/7/24 (Liquidity Facility Wells Fargo Bank NA) (b)(g)(h) | | 2,000 | 2,000 |
| Houston Arpt. Sys. Rev. Participating VRDN Series XF 31 26, 3.29% 3/7/24 (Liquidity Facility Barclays Bank PLC) (b)(c)(g)(h) | | 13,900 | 13,900 |
| Humble Independent School District Participating VRDN Series XF 14 48, 3.27% 3/7/24 (Liquidity Facility Bank of America NA) (b)(g)(h) | | 2,050 | 2,050 |
| Medina Valley Texas Independent School District Participating VRDN Series XG 05 05, 3.28% 3/7/24 (Liquidity Facility Toronto-Dominion Bank) (b)(g)(h) | | 4,000 | 4,000 |
| North Ft. Bend Wtr. Auth. Participating VRDN: | | | |
| Series XL 04 22, 3.35% 3/7/24 (Liquidity Facility Wells Fargo Bank NA) (b)(g)(h) | | 2,300 | 2,300 |
| Series ZF 30 86, 3.27% 3/7/24 (Liquidity Facility Wells Fargo Bank NA) (b)(g)(h) | | 3,990 | 3,990 |
| Spring Branch Independent School District Participating VRDN Series XL 03 35, 3.27% 3/7/24 (Liquidity Facility Bank of America NA) (b)(g)(h) | | 1,875 | 1,875 |
| Tarrant County Cultural Ed. Facilities Fin. Corp. Hosp. Rev. Participating VRDN Series XG 04 21, 3.29% 3/7/24 (Liquidity Facility Bank of America NA) (b)(g)(h) | | 725 | 725 |
| Tarrant County Cultural Ed. Facilities Fin. Corp. Rev. Participating VRDN Series 2021 E1 50, 3.27% 3/7/24 (Liquidity Facility Royal Bank of Canada) (b)(g)(h) | | 5,000 | 5,000 |
| Texas Muni. Gas Acquisition & Supply Corp. Participating VRDN Series XM 11 54, 3.29% 3/7/24 (Liquidity Facility Royal Bank of Canada) (b)(g)(h) | | 2,180 | 2,180 |
| Texas Private Activity Bond Surface Trans. Corp. Participating VRDN Series XM 11 23, 3.31% 3/7/24 (Liquidity Facility Royal Bank of Canada) (b)(c)(g)(h) | | 4,100 | 4,100 |
| Texas Wtr. Dev. Board Rev.: | | | |
| Bonds Series MS 00 17, 3.39%, tender 4/25/24 (Liquidity Facility Morgan Stanley Bank, West Valley City Utah) (b)(d)(g)(h) | | 2,100 | 2,100 |
| Participating VRDN: | | | |
Series XF 13 29, 3.28% 3/7/24 (Liquidity Facility Toronto-Dominion Bank) (b)(g)(h) | | 5,000 | 5,000 |
Series XG 05 30, 3.27% 3/7/24 (Liquidity Facility Wells Fargo Bank NA) (b)(g)(h) | | 2,600 | 2,600 |
TOTAL TEXAS | | | 66,420 |
| Utah - 0.8% | | | |
| Salt Lake City Arpt. Rev. Participating VRDN: | | | |
| Series XF 15 50, 3.32% 3/7/24 (Liquidity Facility Toronto-Dominion Bank) (b)(c)(g)(h) | | 6,885 | 6,885 |
| Series XL 04 57, 3.29% 3/7/24 (Liquidity Facility Barclays Bank PLC) (b)(c)(g)(h) | | 2,700 | 2,700 |
| Series XL 04 59, 3.29% 3/7/24 (Liquidity Facility Barclays Bank PLC) (b)(c)(g)(h) | | 9,685 | 9,685 |
| Series XM 11 46, 3.29% 3/7/24 (Liquidity Facility UBS AG) (b)(c)(g)(h) | | 4,250 | 4,250 |
| Series XX 12 49, 3.29% 3/7/24 (Liquidity Facility Barclays Bank PLC) (b)(c)(g)(h) | | 4,840 | 4,840 |
| Utah County Hosp. Rev. Participating VRDN Series XM 10 03, 3.27% 3/7/24 (Liquidity Facility JPMorgan Chase Bank) (b)(g)(h) | | 2,440 | 2,440 |
TOTAL UTAH | | | 30,800 |
| Virginia - 0.9% | | | |
| Chesapeake Bay Bridge and Tunnel District Gen. Resolution Rev. Participating VRDN Series XF 30 64, 3.28% 3/7/24 (Liquidity Facility Barclays Bank PLC) (b)(g)(h) | | 5,300 | 5,300 |
| Norfolk Econ. Dev. Health Care Facilities Participating VRDN Series 2022 C19, 3.28% 3/7/24 (Liquidity Facility Royal Bank of Canada) (b)(g)(h) | | 2,500 | 2,500 |
| Suffolk Econ. Dev. Auth. Hosp. Facilities Rev. Participating VRDN Series MIZ 90 25, 3.34% 3/7/24 (Liquidity Facility Mizuho Cap. Markets LLC) (b)(g)(h) | | 13,845 | 13,845 |
| Univ. of Virginia Gen. Rev. Participating VRDN Series XG 04 08, 3.27% 3/7/24 (Liquidity Facility Morgan Stanley Bank, West Valley City Utah) (b)(g)(h) | | 3,375 | 3,375 |
| Virginia Small Bus. Fing. Auth. Participating VRDN Series XF 32 17, 3.29% 3/7/24 (Liquidity Facility Barclays Bank PLC) (b)(c)(g)(h) | | 7,100 | 7,100 |
| Williamsburg Econ. Dev. Participating VRDN Series XF 15 46, 3.27% 3/7/24 (Liquidity Facility Royal Bank of Canada) (b)(g)(h) | | 2,905 | 2,905 |
TOTAL VIRGINIA | | | 35,025 |
| Washington - 1.3% | | | |
| Barclays Bank PLC Participating VRDN Series YX 12 41, 3.31% 3/7/24 (Liquidity Facility Barclays Bank PLC) (b)(c)(g)(h) | | 5,825 | 5,825 |
| Central Puget Sound Reg'l. Trans. Auth. Sales & Use Tax Rev. Bonds Series G 123, 3.44%, tender 5/1/24 (Liquidity Facility Royal Bank of Canada) (b)(d)(g)(h) | | 960 | 960 |
| CommonSpirit Health Participating VRDN Series XF 1017, 3.34% 3/7/24 (Liquidity Facility Barclays Bank PLC) (b)(g)(h) | | 1,000 | 1,000 |
| Multicare Health Sys. Participating VRDN Series E 153, 3.27% 3/7/24 (Liquidity Facility Royal Bank of Canada) (b)(g)(h) | | 2,900 | 2,900 |
| Port of Seattle Rev. Participating VRDN: | | | |
| Series 2022 ZF 30 68, 3.29% 3/7/24 (Liquidity Facility Morgan Stanley Bank, West Valley City Utah) (b)(c)(g)(h) | | 2,700 | 2,700 |
| Series 2022 ZL 03 16, 3.31% 3/7/24 (Liquidity Facility Barclays Bank PLC) (b)(c)(g)(h) | | 9,400 | 9,400 |
| Series XF 13 71, 3.38% 3/7/24 (Liquidity Facility JPMorgan Chase Bank) (b)(c)(g)(h) | | 4,300 | 4,300 |
| Series XM 08 75, 3.34% 3/7/24 (Liquidity Facility JPMorgan Chase Bank) (b)(c)(g)(h) | | 1,965 | 1,965 |
| Series ZL 05 13, 3.29% 3/7/24 (Liquidity Facility Morgan Stanley Bank, West Valley City Utah) (b)(c)(g)(h) | | 2,745 | 2,745 |
| Washington Convention Ctr. Pub. Facilities Participating VRDN Series 2022 XX 12 38, 3.28% 3/7/24 (Liquidity Facility Barclays Bank PLC) (b)(g)(h) | | 4,000 | 4,000 |
| Washington Gen. Oblig. Participating VRDN: | | | |
| Series 2022 ZF 14 03, 3.27% 3/7/24 (Liquidity Facility JPMorgan Chase Bank) (b)(g)(h) | | 1,675 | 1,675 |
| Series 2023, 3.29% 3/7/24 (Liquidity Facility Citibank NA) (b)(g)(h) | | 5,550 | 5,550 |
| Washington Health Care Facilities Auth. Rev. Participating VRDN: | | | |
| Series XF 30 62, 3.28% 3/7/24 (Liquidity Facility Barclays Bank PLC) (b)(g)(h) | | 2,300 | 2,300 |
| Series XG 04 75, 3.28% 3/7/24 (Liquidity Facility Toronto-Dominion Bank) (b)(g)(h) | | 5,285 | 5,285 |
TOTAL WASHINGTON | | | 50,605 |
| Wisconsin - 0.1% | | | |
| Wisconsin Health & Edl. Facilities Participating VRDN Series Floaters XF 07 41, 3.27% 3/7/24 (Liquidity Facility JPMorgan Chase Bank) (b)(g)(h) | | 2,715 | 2,715 |
| TOTAL TENDER OPTION BOND (Cost $1,248,340) | | | 1,248,340 |
| | | | |
| Other Municipal Security - 18.2% |
| | | Principal Amount (a) (000s) | Value ($) (000s) |
| Arizona - 0.0% | | | |
| Phoenix Civic Impt. Board Arpt. Rev. Bonds Series 2019 B, 5% 7/1/24 (c) | | 1,200 | 1,204 |
| Colorado - 0.1% | | | |
| Colorado Ed. Ln. Prog. TRAN: | | | |
| Series 2023 A, 5% 6/28/24 | | 2,745 | 2,756 |
| Series 2023 B, 5% 6/28/24 | | 270 | 271 |
| Denver City & County Arpt. Rev. Bonds: | | | |
| Series 2022 A, 5% 11/15/24 (c) | | 500 | 502 |
| Series 2022 D, 5% 11/15/24 (c) | | 1,100 | 1,104 |
TOTAL COLORADO | | | 4,633 |
| Connecticut - 0.5% | | | |
| Connecticut Gen. Oblig. Bonds: | | | |
| Series 2013 A, 4.19% 3/1/24 (b) | | 600 | 600 |
| Series 2015 B, 5% 6/15/24 | | 5,000 | 5,017 |
| Danbury Gen. Oblig. BAN Series 2024, 5% 9/24/24 (f) | | 11,500 | 11,588 |
| Univ. of Connecticut Gen. Oblig. Bonds Series 2018 A, 5% 4/15/24 | | 650 | 651 |
TOTAL CONNECTICUT | | | 17,856 |
| District Of Columbia - 0.6% | | | |
| District of Columbia Income Tax Rev. Bonds Series 2020 A, 5% 3/1/24 | | 500 | 500 |
| Metropolitan Washington DC Arpts. Auth. Sys. Rev. Bonds: | | | |
| Series 2017 A, 5% 10/1/24 (c) | | 12,345 | 12,419 |
| Series 2018 A, 5% 10/1/24 (c) | | 2,000 | 2,013 |
| Series 2019 A, 5% 10/1/24 (c) | | 2,000 | 2,017 |
| Series 2020 A, 5% 10/1/24 (c) | | 7,230 | 7,279 |
| Series 2022 A, 5% 10/1/24 (c) | | 250 | 252 |
TOTAL DISTRICT OF COLUMBIA | | | 24,480 |
| Florida - 3.3% | | | |
| Broward County School Board Ctfs. of Prtn. Bonds Series 2015 A, 5% 7/1/24 | | 4,000 | 4,015 |
| Broward County School District TAN Series 2023, 5% 6/28/24 | | 305 | 306 |
| Florida Local Govt. Fin. Cmnty. Series 2024 A1, 3.5% 4/2/24, LOC JPMorgan Chase Bank, CP | | 6,665 | 6,665 |
| Greater Orlando Aviation Auth. Arpt. Facilities Rev. Bonds: | | | |
| Series 2015, 4% 10/1/24 (c) | | 3,870 | 3,880 |
| Series 2022 A, 5% 10/1/24 (c) | | 1,380 | 1,386 |
| Hillsborough County Aviation Auth. Rev. Bonds Series 2015 B: | | | |
| 5% 10/1/24 (Pre-Refunded to 10/1/24 @ 100) (c) | | 2,145 | 2,163 |
| 5% 10/1/24 (Pre-Refunded to 10/1/24 @ 100) | | 1,750 | 1,762 |
| Miami-Dade County School Board Ctfs. of Prtn. Bonds Series 2015 A, 5% 5/1/24 | | 2,400 | 2,404 |
| Miami-Dade County School District TAN Series 2023, 5% 6/18/24 | | 1,355 | 1,360 |
| Miami-Dade County Wtr. & Swr. Rev. Bonds Series 2015, 5% 10/1/24 | | 865 | 870 |
| Palm Beach County Health Facilities Auth. Hosp. Rev. Bonds Series 2014, 5% 12/1/24 (Pre-Refunded to 12/1/24 @ 100) | | 500 | 504 |
| Pinellas County School District TAN Series 2023, 5% 6/28/24 | | 150 | 151 |
| Polk County Indl. Dev. Auth. Health Sys. Rev. Bonds: | | | |
| Series 2014 A, SIFMA Municipal Swap Index + 0.300% 3.54%, tender 9/26/24 (b)(e) | | 28,200 | 28,200 |
| Series 2014 A1, SIFMA Municipal Swap Index + 0.250% 3.49%, tender 9/26/24 (b)(e) | | 28,900 | 28,900 |
| Tampa Health Sys. Rev. Bonds Series 2012 B, SIFMA Municipal Swap Index + 0.300% 3.54%, tender 9/26/24 (b)(e) | | 42,015 | 42,015 |
TOTAL FLORIDA | | | 124,581 |
| Georgia - 0.4% | | | |
| Atlanta Arpt. Rev. Series 2024 M2, 3.58% 4/2/24, LOC Bank of America NA, CP (c) | | 13,610 | 13,610 |
| Houston County Hosp. Auth. Rev. Bonds: | | | |
| Series 2016 A, 5% 4/1/24 (Pre-Refunded to 4/1/24 @ 100) | | 2,060 | 2,062 |
| Series 2016 B, 5% 4/1/24 (Pre-Refunded to 4/1/24 @ 100) (b) | | 1,400 | 1,400 |
TOTAL GEORGIA | | | 17,072 |
| Illinois - 1.9% | | | |
| Illinois Fin. Auth. Rev. Bonds: | | | |
| (Advocate Health Care Network Proj.) Series 2011 B, SIFMA Municipal Swap Index + 0.300% 3.57%, tender 9/26/24 (b)(e) | | 40,690 | 40,690 |
| Series 2014, 5% 8/1/24 | | 555 | 558 |
| Illinois Gen. Oblig. Bonds: | | | |
| Series 2016, 5% 6/1/24 | | 3,250 | 3,257 |
| Series 2017 D, 5% 11/1/24 | | 7,715 | 7,764 |
| Series 2019 A, 5% 11/1/24 | | 600 | 603 |
| Series 2021 A: | | | |
5% 3/1/24 | | 1,520 | 1,520 |
5% 3/1/25 | | 310 | 315 |
| Series 2021 C, 4% 3/1/24 | | 2,185 | 2,185 |
| Series 2022 A, 5% 3/1/24 | | 610 | 610 |
| Series 2023 C, 5% 5/1/24 | | 350 | 351 |
| Illinois Hsg. Dev. Auth. Bonds Series 2023 G, 3.5%, tender 6/4/24 (b) | | 11,600 | 11,600 |
| Illinois Sales Tax Rev. Bonds Series 2021 C, 5% 6/15/24 | | 1,200 | 1,205 |
TOTAL ILLINOIS | | | 70,658 |
| Louisiana - 0.0% | | | |
| Louisiana Pub. Facilities Auth. Rev. Bonds (Hurricane Recovery Prog.) Series 2014, 5% 6/1/24 (Pre-Refunded to 6/1/24 @ 100) | | 585 | 586 |
| Maryland - 0.2% | | | |
| Maryland Health & Higher Edl. Facilities Auth. Rev. Bonds Series 2014, 5.25% 7/1/24 (Pre-Refunded to 7/1/24 @ 100) | | 3,140 | 3,152 |
| Montgomery County Gen. Oblig. Bonds Series 2013 MD, 3.81%, tender 3/1/24 (b) | | 3,400 | 3,400 |
TOTAL MARYLAND | | | 6,552 |
| Massachusetts - 0.3% | | | |
| Ashland Gen. Oblig. BAN Series 2023, 5% 10/10/24 | | 5,100 | 5,135 |
| Marlborough Gen. Oblig. BAN Series 2023, 5% 6/13/24 | | 4,500 | 4,515 |
TOTAL MASSACHUSETTS | | | 9,650 |
| Michigan - 0.6% | | | |
| Kent Hosp. Fin. Auth. Hosp. Facilities Rev. Bonds (Spectrum Health Sys. Proj.) Series 2015 A, SIFMA Municipal Swap Index + 0.250% 3.49%, tender 9/26/24 (b)(e) | | 18,345 | 18,345 |
| Michigan Fin. Auth. Rev. Bonds: | | | |
| (Mid-Michigan Health Sys. Proj.) Series 2014, 5% 6/1/24 (Pre-Refunded to 6/1/24 @ 100) | | 695 | 697 |
| Series 2015 A, 5% 8/1/24 (Pre-Refunded to 8/1/24 @ 100) | | 710 | 714 |
| Series 2019 MI2, 5%, tender 2/1/25 (b) | | 735 | 746 |
| Royal Oak Hosp. Fin. Auth. Hosp. Rev. Bonds Series 2014 D, 5% 3/1/24 (Pre-Refunded to 3/1/24 @ 100) | | 935 | 935 |
TOTAL MICHIGAN | | | 21,437 |
| Nebraska - 0.1% | | | |
| Omaha Pub. Pwr. District Elec. Rev. Series 2024 A, 3.57% 6/4/24, CP | | 2,600 | 2,600 |
| Nevada - 0.0% | | | |
| Clark County School District Bonds Series 2016 A, 5% 6/15/24 | | 1,370 | 1,374 |
| New Jersey - 1.6% | | | |
| Branchburg Township BAN Series 2023, 5% 10/10/24 | | 3,600 | 3,624 |
| Brick Township Gen. Oblig. BAN Series 2023, 5% 6/12/24 | | 7,300 | 7,327 |
| Florence Township BAN Series 2023, 5% 5/31/24 | | 4,300 | 4,316 |
| Jefferson Township Gen. Oblig. BAN Series 2023, 5% 6/14/24 | | 2,954 | 2,964 |
| New Jersey Gen. Oblig. Bonds Series 2020 A, 5% 6/1/24 | | 41,040 | 41,150 |
TOTAL NEW JERSEY | | | 59,381 |
| New York - 1.4% | | | |
| Bay Shore Union Free School District TAN Series 2023, 5% 6/21/24 | | 7,400 | 7,429 |
| Commack Union Free School District TAN Series 2023, 5% 6/26/24 | | 5,200 | 5,215 |
| Lancaster Central School District BAN Series 2023, 5% 6/7/24 | | 8,200 | 8,227 |
| Queensbury Union Free School District BAN Series 2023, 5% 5/31/24 | | 4,583 | 4,598 |
| Saratoga County Gen. Oblig. BAN Series 2023, 5% 9/20/24 | | 14,500 | 14,602 |
| Sayville Union Free School District TAN Series 2023 B, 5% 6/25/24 | | 5,250 | 5,264 |
| Webster Town BAN Series 2023, 5% 8/28/24 | | 6,590 | 6,631 |
TOTAL NEW YORK | | | 51,966 |
| North Carolina - 0.0% | | | |
| Charlotte Int'l. Arpt. Rev. Bonds: | | | |
| Series 2021 B, 5% 7/1/24 (c) | | 885 | 888 |
| Series 2022 B, 5% 7/1/24 (c) | | 895 | 899 |
TOTAL NORTH CAROLINA | | | 1,787 |
| Ohio - 0.0% | | | |
| Wyoming City School District BAN Series 2023, 5.5% 5/15/24 | | 1,310 | 1,314 |
| Oklahoma - 0.5% | | | |
| Oklahoma City Wtr. Utils. Series 2024 A, 3.58% 4/4/24 (Liquidity Facility State Street Bank & Trust Co., Boston), CP | | 10,400 | 10,400 |
| Tulsa Int'l. Arpt. Gen. Rev. Bonds Series 2015 A: | | | |
| 5% 6/1/24 (Pre-Refunded to 6/1/24 @ 100) (c) | | 2,415 | 2,421 |
| 5% 6/1/24 (Pre-Refunded to 6/1/24 @ 100) (c) | | 925 | 928 |
| 5% 6/1/24 (Pre-Refunded to 6/1/24 @ 100) (c) | | 890 | 893 |
| 5% 6/1/24 (Pre-Refunded to 6/1/24 @ 100) (c) | | 2,000 | 2,005 |
| 5% 6/1/24 (Pre-Refunded to 6/1/24 @ 100) (c) | | 600 | 602 |
| 5% 6/1/24 (Pre-Refunded to 6/1/24 @ 100) (c) | | 1,015 | 1,018 |
TOTAL OKLAHOMA | | | 18,267 |
| Oregon - 0.3% | | | |
| Multnomah County Hosp. Facilities Auth. Rev. Bonds (Mirabella at South Waterfront Proj.) Series 2014 A, 5.5% 10/1/24 (Pre-Refunded to 10/1/24 @ 100) | | 3,200 | 3,233 |
| Port of Portland Arpt. Rev. Bonds: | | | |
| Series 2017 B, 5% 7/1/24 (c) | | 1,490 | 1,493 |
| Series 2019 25B, 5% 7/1/24 (c) | | 1,750 | 1,757 |
| Series 2022, 5% 7/1/24 (c) | | 2,945 | 2,953 |
| Series 26 C, 5% 7/1/24 (c) | | 2,335 | 2,341 |
TOTAL OREGON | | | 11,777 |
| Pennsylvania - 0.1% | | | |
| Commonwealth Fing. Auth. Tobacco Bonds Series 2018, 5% 6/1/24 | | 1,620 | 1,624 |
| Pennsylvania Hsg. Fin. Agcy. Bonds Series 2021 134B, 5% 4/1/24 (c) | | 700 | 701 |
TOTAL PENNSYLVANIA | | | 2,325 |
| South Carolina - 0.1% | | | |
| Charleston County School District Bonds Series 2023 B, 5% 3/1/24 | | 110 | 110 |
| South Carolina Assoc. of Governmental Organizations Ctfs. of Prtn. Bonds Series 2023 B, 5% 3/1/24 | | 2,751 | 2,751 |
TOTAL SOUTH CAROLINA | | | 2,861 |
| Texas - 4.5% | | | |
| Austin Elec. Util. Sys. Rev. Series 2024 A: | | | |
| 3.4% 3/6/24 (Liquidity Facility JPMorgan Chase Bank), CP | | 17,000 | 16,999 |
| 3.59% 6/17/24 (Liquidity Facility JPMorgan Chase Bank), CP | | 9,400 | 9,400 |
| Fort Bend Independent School District: | | | |
| Bonds Series 2022 A, 5% 8/15/24 (Permanent School Fund of Texas Guaranteed) | | 1,400 | 1,407 |
| Series 2024, 3.6% 4/10/24 (Liquidity Facility JPMorgan Chase Bank), CP | | 5,700 | 5,700 |
| Harris County Gen. Oblig.: | | | |
| Series 2024 A1, 3.63% 5/16/24 (Liquidity Facility State Street Bank & Trust Co., Boston), CP | | 2,550 | 2,550 |
| Series 2024 D, 3.7% 6/11/24 (Liquidity Facility JPMorgan Chase Bank), CP | | 4,650 | 4,650 |
| Series 2024 D2: | | | |
3.55% 6/4/24 (Liquidity Facility State Street Bank & Trust Co., Boston), CP | | 2,990 | 2,990 |
3.65% 5/3/24 (Liquidity Facility State Street Bank & Trust Co., Boston), CP | | 1,400 | 1,400 |
| Leander Independent School District Bonds Series 2014 C, 0% 8/15/24 (Pre-Refunded to 8/15/24 @ 32.395) | | 3,200 | 1,036 |
| Lower Colorado River Auth. Rev. Series 2024, 3.5% 3/28/24, LOC JPMorgan Chase Bank, LOC State Street Bank & Trust Co., Boston, CP | | 12,936 | 12,936 |
| Tarrant County Cultural Ed. Facilities Fin. Corp. Hosp. Rev. Bonds (Baylor Health Care Sys. Proj.): | | | |
| Series 2011 B, SIFMA Municipal Swap Index + 0.300% 3.57%, tender 9/26/24 (b)(e) | | 31,700 | 31,700 |
| Series 2013 B, SIFMA Municipal Swap Index + 0.300% 3.57%, tender 9/26/24 (b)(e) | | 31,000 | 31,000 |
| Texas Gen. Oblig. Bonds: | | | |
| Series 2014 A, 5% 10/1/24 (Pre-Refunded to 10/1/24 @ 100) | | 665 | 669 |
| Series 2014, 6% 8/1/24 (c) | | 1,000 | 1,007 |
| Series 2015, 5% 8/1/24 (c) | | 1,195 | 1,200 |
| Series 2021 B, 4% 8/1/24 (c) | | 1,610 | 1,613 |
| Texas Pub. Fin. Auth. Rev. Series 2024 B, 3.65% 5/8/24 (Liquidity Facility Texas Gen. Oblig.), CP | | 18,200 | 18,200 |
| Texas Trans. Commission State Hwy. Fund Rev. Bonds Series 2014 A, 5% 4/1/24 (Pre-Refunded to 4/1/24 @ 100) | | 500 | 501 |
| Univ. of Texas Board of Regents Sys. Rev. Series 2024 A: | | | |
| 3.5% 8/13/24 (Liquidity Facility Univ. of Texas Invt. Mgmt. Co.), CP | | 6,100 | 6,100 |
| 3.55% 8/2/24 (Liquidity Facility Univ. of Texas Invt. Mgmt. Co.), CP | | 5,000 | 5,000 |
| 3.55% 8/5/24 (Liquidity Facility Univ. of Texas Invt. Mgmt. Co.), CP | | 3,800 | 3,800 |
| 3.55% 8/15/24 (Liquidity Facility Univ. of Texas Invt. Mgmt. Co.), CP | | 6,200 | 6,200 |
| 3.55% 8/15/24 (Liquidity Facility Univ. of Texas Invt. Mgmt. Co.), CP | | 3,300 | 3,300 |
TOTAL TEXAS | | | 169,358 |
| Utah - 0.0% | | | |
| Utah County Hosp. Rev. Bonds Series 2020 B1, 5%, tender 8/1/24 (b) | | 605 | 608 |
| Vermont - 0.1% | | | |
| Vermont Econ. Dev. Auth. Rev. Series 2024 D, 3.75% 3/18/24, LOC JPMorgan Chase Bank, CP (c) | | 2,250 | 2,250 |
| Virginia - 0.1% | | | |
| Virginia Pub. Bldg. Auth. Pub. Facilities Rev. Bonds Series 2019 B, 5% 8/1/24 (c) | | 3,055 | 3,071 |
| Washington - 0.7% | | | |
| Grant County Pub. Util. District #2 Bonds Series 2014 B: | | | |
| 5% 7/1/24 (Pre-Refunded to 7/1/24 @ 100) (c) | | 2,005 | 2,013 |
| 5% 7/1/24 (Pre-Refunded to 7/1/24 @ 100) (c) | | 2,105 | 2,114 |
| Port of Seattle Rev. Bonds: | | | |
| Series 2015 C, 5% 4/1/24 (c) | | 4,360 | 4,364 |
| Series 2017 D, 5% 5/1/24 (c) | | 3,500 | 3,507 |
| Series 2018 A, 5% 5/1/24 (c) | | 1,715 | 1,716 |
| Series 2019, 5% 4/1/24 (c) | | 3,500 | 3,504 |
| Series 2021 C, 5% 8/1/24 (c) | | 5,095 | 5,109 |
| Series 2022 B, 5% 8/1/24 (c) | | 4,975 | 4,998 |
TOTAL WASHINGTON | | | 27,325 |
| Wisconsin - 0.8% | | | |
| Madison Metropolitan School District TRAN Series 2023, 5% 9/3/24 | | 8,600 | 8,651 |
| Wisconsin Clean Wtr. Rev. Bonds Series 2015 1, 5% 6/1/24 (Pre-Refunded to 6/1/24 @ 100) | | 1,400 | 1,404 |
| Wisconsin Gen. Oblig.: | | | |
| Series 2023, 3.85% 3/6/24, CP | | 8,508 | 8,508 |
| Series 2024: | | | |
3.7% 11/12/24, CP | | 7,900 | 7,900 |
3.85% 11/4/24, CP | | 4,800 | 4,800 |
TOTAL WISCONSIN | | | 31,263 |
| TOTAL OTHER MUNICIPAL SECURITY (Cost $686,236) | | | 686,236 |
| | | | |
| Investment Company - 3.0% |
| | | Shares | Value ($) (000s) |
Fidelity Municipal Cash Central Fund 3.30% (i)(j) (Cost $112,996) | | 112,972 | 112,996 |
| | | | |
| TOTAL INVESTMENT IN SECURITIES - 98.3% (Cost $3,711,886) | 3,711,886 |
NET OTHER ASSETS (LIABILITIES) - 1.7% | 63,503 |
| NET ASSETS - 100.0% | 3,775,389 |
| | |
Security Type Abbreviations
| BAN | - | BOND ANTICIPATION NOTE |
| CP | - | COMMERCIAL PAPER |
| TAN | - | TAX ANTICIPATION NOTE |
| TRAN | - | TAX AND REVENUE ANTICIPATION NOTE |
| VRDN | - | VARIABLE RATE DEMAND NOTE (A debt instrument that is payable upon demand, either daily, weekly or monthly) |
The date shown for securities represents the date when principal payments must be paid, taking into account any call options exercised by the issuer and any permissible maturity shortening features other than interest rate resets.
Any values shown as $0 in the Schedule of Investments may reflect amounts less than $500.
Legend
| (a) | Amount is stated in United States dollars unless otherwise noted. |
| (b) | Coupon rates for floating and adjustable rate securities reflect the rates in effect at period end. |
| (c) | Private activity obligations whose interest is subject to the federal alternative minimum tax for individuals. |
| (d) | Restricted securities (including private placements) - Investment in securities not registered under the Securities Act of 1933 (excluding 144A issues). At the end of the period, the value of restricted securities (excluding 144A issues) amounted to $8,760,000 or 0.2% of net assets. |
| (e) | Coupon is indexed to a floating interest rate which may be multiplied by a specified factor and/or subject to caps or floors. |
| (f) | Security exempt from registration under Rule 144A of the Securities Act of 1933. These securities may be resold in transactions exempt from registration, normally to qualified institutional buyers. At the end of the period, the value of these securities amounted to $65,788,000 or 1.7% of net assets. |
| (g) | Provides evidence of ownership in one or more underlying municipal bonds. |
| (h) | Coupon rates are determined by re-marketing agents based on current market conditions. |
| (i) | Information in this report regarding holdings by state and security types does not reflect the holdings of the Fidelity Municipal Cash Central Fund. |
| (j) | Affiliated fund that is generally available only to investment companies and other accounts managed by Fidelity Investments. The rate quoted is the annualized seven-day yield of the fund at period end. A complete unaudited listing of the fund's holdings as of its most recent quarter end is available upon request. In addition, each Fidelity Central Fund's financial statements are available on the SEC's website or upon request. |
| Additional information on each restricted holding is as follows: |
| Security | Acquisition Date | Cost ($) (000s) |
| Central Puget Sound Reg'l. Trans. Auth. Sales & Use Tax Rev. Bonds Series G 123, 3.44%, tender 5/1/24 (Liquidity Facility Royal Bank of Canada) | 11/01/23 | 960 |
| | | |
| El Paso Wtr. & Swr. Rev. Bonds Series G 124, 3.44%, tender 9/1/24 (Liquidity Facility Royal Bank of Canada) | 9/01/23 | 1,300 |
| | | |
| Port Auth. of New York & New Jersey Series 1992 2, SIFMA Municipal Swap Index + 0.050% 3.35% 4/1/24, VRDN | 7/15/20 | 500 |
| | | |
| Port Auth. of New York & New Jersey Series 1995 4, SIFMA Municipal Swap Index + 0.080% 3.38% 4/1/24, VRDN | 8/17/20 | 3,900 |
| | | |
| Texas Wtr. Dev. Board Rev. Bonds Series MS 00 17, 3.39%, tender 4/25/24 (Liquidity Facility Morgan Stanley Bank, West Valley City Utah) | 10/12/23 | 2,100 |
| | | |
Affiliated Central Funds
Fiscal year to date information regarding the Fund's investments in Fidelity Central Funds, including the ownership percentage, is presented below.
| Affiliate (Amounts in thousands) | Value, beginning of period ($) | Purchases ($) | Sales Proceeds ($) | Dividend Income ($) | Realized Gain (loss) ($) | Change in Unrealized appreciation (depreciation) ($) | Value, end of period ($) | % ownership, end of period |
| Fidelity Municipal Cash Central Fund 3.30% | 6,590 | 1,065,134 | 958,723 | 1,836 | (5) | - | 112,996 | 5.0% |
| Total | 6,590 | 1,065,134 | 958,723 | 1,836 | (5) | - | 112,996 | |
| | | | | | | | | |
Amounts in the dividend income column in the above table include any capital gain distributions from underlying funds, which are presented in the corresponding line item in the Statement of Operations, if applicable.
Amounts included in the purchases and sales proceeds columns may include in-kind transactions, if applicable.
Investment Valuation
All investments are categorized as Level 2 under the Fair Value Hierarchy. The inputs or methodology used for valuing securities may not be an indication of the risk associated with investing in these securities. For more information on valuation inputs, refer to the Investment Valuation section in the accompanying Notes to Financial Statements.
| Statement of Assets and Liabilities |
| Amounts in thousands (except per-share amount) | | | | February 29, 2024 (Unaudited) |
| | | | | |
| Assets | | | | |
| Investment in securities, at value - See accompanying schedule: | | | | |
Unaffiliated issuers (cost $3,598,890) | $ | 3,598,890 | | |
Fidelity Central Funds (cost $112,996) | | 112,996 | | |
| | | | | |
| | | | | |
| Total Investment in Securities (cost $3,711,886) | | | $ | 3,711,886 |
| Cash | | | | 19 |
| Receivable for investments sold | | | | 50,830 |
| Receivable for fund shares sold | | | | 3,348 |
| Interest receivable | | | | 21,728 |
| Distributions receivable from Fidelity Central Funds | | | | 369 |
| Prepaid expenses | | | | 2 |
Total assets | | | | 3,788,182 |
| Liabilities | | | | |
| Payable for investments purchased | $ | 5,619 | | |
| Payable for fund shares redeemed | | 5,134 | | |
| Distributions payable | | 716 | | |
| Accrued management fee | | 772 | | |
| Other affiliated payables | | 512 | | |
| Other payables and accrued expenses | | 40 | | |
| Total Liabilities | | | | 12,793 |
| Net Assets | | | $ | 3,775,389 |
| Net Assets consist of: | | | | |
| Paid in capital | | | $ | 3,777,542 |
| Total accumulated earnings (loss) | | | | (2,153) |
| Net Assets | | | $ | 3,775,389 |
Net Asset Value, offering price and redemption price per share ($3,775,389 ÷ 3,769,903 shares) | | | $ | 1.00 |
| Statement of Operations |
| Amounts in thousands | | | | Six months ended February 29, 2024 (Unaudited) |
| Investment Income | | | | |
| Interest | | | $ | 68,272 |
| Income from Fidelity Central Funds | | | | 1,836 |
| Total Income | | | | 70,108 |
| Expenses | | | | |
| Management fee | $ | 4,736 | | |
| Transfer agent fees | | 2,970 | | |
| Accounting fees and expenses | | 169 | | |
| Custodian fees and expenses | | 19 | | |
| Independent trustees' fees and expenses | | 6 | | |
| Registration fees | | 78 | | |
| Audit | | 23 | | |
| Legal | | 3 | | |
| Miscellaneous | | 7 | | |
| Total expenses before reductions | | 8,011 | | |
| Expense reductions | | (89) | | |
| Total expenses after reductions | | | | 7,922 |
| Net Investment income (loss) | | | | 62,186 |
| Realized and Unrealized Gain (Loss) | | | | |
| Net realized gain (loss) on: | | | | |
| Investment Securities: | | | | |
| Unaffiliated issuers | | 110 | | |
| Fidelity Central Funds | | (5) | | |
| Total net realized gain (loss) | | | | 105 |
| Net increase in net assets resulting from operations | | | $ | 62,291 |
| Statement of Changes in Net Assets |
| |
| Amount in thousands | | Six months ended February 29, 2024 (Unaudited) | | Year ended August 31, 2023 |
| Increase (Decrease) in Net Assets | | | | |
| Operations | | | | |
| Net investment income (loss) | $ | 62,186 | $ | 101,775 |
| Net realized gain (loss) | | 105 | | 43 |
Net increase in net assets resulting from operations | | 62,291 | | 101,818 |
| Distributions to shareholders | | (64,106) | | (101,791) |
| | | | | |
| Share transactions | | | | |
| Proceeds from sales of shares | | 1,144,985 | | 1,800,019 |
| Reinvestment of distributions | | 59,199 | | 94,454 |
| Cost of shares redeemed | | (1,239,558) | | (2,204,182) |
| | | | | |
Net increase (decrease) in net assets and shares resulting from share transactions | | (35,374) | | (309,709) |
| Total increase (decrease) in net assets | | (37,189) | | (309,682) |
| | | | | |
| Net Assets | | | | |
| Beginning of period | | 3,812,578 | | 4,122,260 |
| End of period | $ | 3,775,389 | $ | 3,812,578 |
| | | | | |
| Other Information | | | | |
| Shares | | | | |
| Sold | | 1,144,985 | | 1,800,019 |
| Issued in reinvestment of distributions | | 59,199 | | 94,454 |
| Redeemed | | (1,239,558) | | (2,204,182) |
| Net increase (decrease) | | (35,374) | | (309,709) |
| | | | | |
Financial Highlights
| Fidelity® Municipal Money Market Fund |
| |
| | Six months ended (Unaudited) February 29, 2024 | | Years ended August 31, 2023 | | 2022 | | 2021 | | 2020 | | 2019 |
Selected Per-Share Data | | | | | | | | | | | | |
| Net asset value, beginning of period | $ | 1.00 | $ | 1.00 | $ | 1.00 | $ | 1.00 | $ | 1.00 | $ | 1.00 |
| Income from Investment Operations | | | | | | | | | | | | |
Net investment income (loss) A | | .016 | | .026 | | .003 | | - B | | .007 | | .013 |
| Net realized and unrealized gain (loss) | | .001 | | - B | | - B | | - B | | .001 | | - B |
| Total from investment operations | | .017 | | .026 | | .003 | | - B | | .008 | | .013 |
| Distributions from net investment income | | (.016) | | (.026) | | (.003) | | - B | | (.007) | | (.013) |
| Distributions from net realized gain | | (.001) | | - | | - B | | - | | (.001) | | - B |
| Total distributions | | (.017) | | (.026) | | (.003) | | - B | | (.008) | | (.013) |
| Net asset value, end of period | $ | 1.00 | $ | 1.00 | $ | 1.00 | $ | 1.00 | $ | 1.00 | $ | 1.00 |
Total Return C,D | | 1.68% | | 2.61% | | .27% | | .01% | | .76% | | 1.30% |
Ratios to Average Net Assets A,E,F | | | | | | | | | | | | |
| Expenses before reductions | | .42% G,H | | .42% | | .41% | | .41% | | .42% | | .42% |
| Expenses net of fee waivers, if any | | .41% G,H | | .42% | | .26% | | .16% | | .41% | | .42% |
| Expenses net of all reductions | | .41% G,H | | .42% | | .26% | | .16% | | .41% | | .42% |
| Net investment income (loss) | | 3.24% G,H | | 2.56% | | .24% | | .01% | | .71% | | 1.29% |
| Supplemental Data | | | | | | | | | | | | |
| Net assets, end of period (in millions) | $ | 3,775 | $ | 3,813 | $ | 4,122 | $ | 4,648 | $ | 5,430 | $ | 6,546 |
ANet investment income (loss) is affected by the timing of the declaration of dividends by any underlying mutual funds or exchange-traded funds (ETFs). Net investment income (loss) of any mutual funds or ETFs is not included in the Fund's net investment income (loss) ratio.
BAmount represents less than $.0005 per share.
CTotal returns for periods of less than one year are not annualized.
DTotal returns would have been lower if certain expenses had not been reduced during the applicable periods shown.
EFees and expenses of any underlying mutual funds or exchange-traded funds (ETFs) are not included in the Fund's expense ratio. The Fund indirectly bears its proportionate share of these expenses. For additional expense information related to investments in Fidelity Central Funds, please refer to the "Investments in Fidelity Central Funds" note found in the Notes to Financial Statements section of the most recent Annual or Semi-Annual report.
FExpense ratios reflect operating expenses of the class. Expenses before reductions do not reflect amounts reimbursed, waived, or reduced through arrangements with the investment adviser, brokerage services, or other offset arrangements, if applicable, and do not represent the amount paid by the class during periods when reimbursements, waivers or reductions occur.
GProxy expenses are not annualized.
HAnnualized.
For the period ended February 29, 2024
(Amounts in thousands except percentages)
1. Organization.
Fidelity Municipal Money Market Fund (the Fund) is a fund of Fidelity Union Street Trust II (the Trust) and is authorized to issue an unlimited number of shares. Share transactions on the Statement of Changes in Net Assets may contain exchanges between affiliated funds. The Trust is registered under the Investment Company Act of 1940, as amended (the 1940 Act), as an open-end management investment company organized as a Delaware statutory trust. Shares of the Fund are only available for purchase by retail shareholders.
2. Investments in Fidelity Central Funds.
Funds may invest in Fidelity Central Funds, which are open-end investment companies generally available only to other investment companies and accounts managed by the investment adviser and its affiliates. The Schedule of Investments lists any Fidelity Central Funds held as an investment as of period end, but does not include the underlying holdings of each Fidelity Central Fund. An investing fund indirectly bears its proportionate share of the expenses of the underlying Fidelity Central Funds.
Based on its investment objective, each Fidelity Central Fund may invest or participate in various investment vehicles or strategies that are similar to those of the investing fund. These strategies are consistent with the investment objectives of the investing fund and may involve certain economic risks which may cause a decline in value of each of the Fidelity Central Funds and thus a decline in the value of the investing fund.
| Fidelity Central Fund | Investment Manager | Investment Objective | Investment Practices | Expense RatioA |
| Fidelity Money Market Central Funds | Fidelity Management & Research Company LLC (FMR) | Each fund seeks to obtain a high level of current income consistent with the preservation of capital and liquidity. | Short-term Investments | Less than .005% |
A Expenses expressed as a percentage of average net assets and are as of each underlying Central Fund's most recent annual or semi-annual shareholder report.
A complete unaudited list of holdings for each Fidelity Central Fund is available upon request or at the Securities and Exchange Commission website at www.sec.gov. In addition, the financial statements of the Fidelity Central Funds which contain the significant accounting policies (including investment valuation policies) of those funds, and are not covered by the Report of Independent Registered Public Accounting Firm, are available on the Securities and Exchange Commission website or upon request.
3. Significant Accounting Policies.
The Fund is an investment company and applies the accounting and reporting guidance of the Financial Accounting Standards Board (FASB) Accounting Standards Codification Topic 946 Financial Services - Investment Companies. The financial statements have been prepared in conformity with accounting principles generally accepted in the United States of America (GAAP), which require management to make certain estimates and assumptions at the date of the financial statements. Actual results could differ from those estimates. Subsequent events, if any, through the date that the financial statements were issued have been evaluated in the preparation of the financial statements. The Fund's Schedule of Investments lists any underlying mutual funds or exchange-traded funds (ETFs) but does not include the underlying holdings of these funds. The following summarizes the significant accounting policies of the Fund:
Investment Valuation. The Fund categorizes the inputs to valuation techniques used to value its investments into a disclosure hierarchy consisting of three levels as shown below:
Level 1 - unadjusted quoted prices in active markets for identical investments
Level 2 - other significant observable inputs (including quoted prices for similar investments, interest rates, prepayment speeds, etc.)
Level 3 - unobservable inputs (including the Fund's own assumptions based on the best information available)
As permitted by compliance with certain conditions under Rule 2a-7 of the 1940 Act, securities are valued at amortized cost, which approximates fair value. The amortized cost of an instrument is determined by valuing it at its original cost and thereafter amortizing any discount or premium from its face value at a constant rate until maturity. Securities held by a money market fund are generally high quality and liquid; however, they are reflected as Level 2 because the inputs used to determine fair value are not quoted prices in an active market.
Investment Transactions and Income. The net asset value per share for processing shareholder transactions is calculated as of the close of business of the New York Stock Exchange (NYSE), normally 4:00 p.m. Eastern time. Security transactions, including the Fund's investment activity in the Fidelity Central Funds, are accounted for as of trade date. Gains and losses on securities sold are determined on the basis of identified cost. Income and capital gain distributions from Fidelity Central Funds, if any, are recorded on the ex-dividend date. Interest income is accrued as earned and includes coupon interest and amortization of premium and accretion of discount on debt securities as applicable.
Expenses. Expenses directly attributable to a fund are charged to that fund. Expenses attributable to more than one fund are allocated among the respective funds on the basis of relative net assets or other appropriate methods. Expenses included in the accompanying financial statements reflect the expenses of that fund and do not include any expenses associated with any underlying mutual funds or exchange-traded funds. Although not included in a fund's expenses, a fund indirectly bears its proportionate share of these expenses through the net asset value of each underlying mutual fund or exchange-traded fund. Expense estimates are accrued in the period to which they relate and adjustments are made when actual amounts are known.
Income Tax Information and Distributions to Shareholders. Each year, the Fund intends to qualify as a regulated investment company under Subchapter M of the Internal Revenue Code, including distributing substantially all of its taxable income and realized gains. As a result, no provision for U.S. Federal income taxes is required. The Fund files a U.S. federal tax return, in addition to state and local tax returns as required. The Fund's federal income tax returns are subject to examination by the Internal Revenue Service (IRS) for a period of three fiscal years after they are filed. State and local tax returns may be subject to examination for an additional fiscal year depending on the jurisdiction.
Distributions are declared and recorded daily and paid monthly from net investment income. Distributions from realized gains, if any, are declared and recorded on the ex-dividend date. Income and capital gain distributions are determined in accordance with income tax regulations, which may differ from GAAP.
Capital accounts within the financial statements are adjusted for permanent book-tax differences. These adjustments have no impact on net assets or the results of operations. Capital accounts are not adjusted for temporary book-tax differences which will reverse in a subsequent period.
Book-tax differences are primarily due to market discount, capital loss carryforwards and losses deferred due to excise tax regulations.
The Fund purchases municipal securities whose interest, in the opinion of the issuer, is free from federal income tax. There is no assurance that the IRS will agree with this opinion. In the event the IRS determines that the issuer does not comply with relevant tax requirements, interest payments from a security could become federally taxable, possibly retroactively to the date the security was issued.
As of period end, the cost and unrealized appreciation (depreciation) in securities for federal income tax purposes were as follows:
| Gross unrealized appreciation | $- |
| Gross unrealized depreciation | - |
| Net unrealized appreciation (depreciation) | $- |
| Tax cost | $3,711,886 |
Capital loss carryforwards are only available to offset future capital gains of the Fund to the extent provided by regulations and may be limited. The capital loss carryforward information presented below, including any applicable limitation, is estimated as of prior fiscal period end and is subject to adjustment.
Restricted Securities (including Private Placements). Funds may invest in securities that are subject to legal or contractual restrictions on resale. These securities generally may be resold in transactions exempt from registration or to the public if the securities are registered. Disposal of these securities may involve time-consuming negotiations and expense, and prompt sale at an acceptable price may be difficult. Information regarding restricted securities held at period end is included at the end of the Schedule of Investments, if applicable.
4. Fees and Other Transactions with Affiliates.
Management Fee. Fidelity Management & Research Company LLC (the investment adviser) and its affiliates provide the Fund with investment management related services for which the Fund pays a monthly management fee. The management fee is the sum of an individual fund fee rate that is based on an annual rate of .15% of the Fund's average net assets and an annualized group fee rate that averaged .10% during the period. The group fee rate is based upon the monthly average net assets of a group of registered investment companies with which the investment adviser has management contracts. The group fee rate decreases as assets under management increase and increases as assets under management decrease. For the reporting period, the total annualized management fee rate was .25% of the Fund's average net assets.
Transfer Agent Fees. Fidelity Investments Institutional Operations Company LLC (FIIOC), an affiliate of the investment adviser, is the transfer, dividend disbursing and shareholder servicing agent for the Fund. During November 2023, the Board approved a change in the transfer agent fees effective December 1, 2023 to a fixed annual rate of 0.1539% of average net assets.
Prior to December 1, 2023, FIIOC received account fees and asset-based fees that varied according to account size and type of account. FIIOC pays for typesetting, printing and mailing of shareholder reports, except proxy statements. For the period, transfer agent fees were equivalent to an annual rate of .15% of average net assets.
Accounting Fees. Fidelity Service Company, Inc. (FSC), an affiliate of the investment adviser, maintains the Fund's accounting records.
During November 2023, the Board approved a change in the accounting fees effective December 1, 2023 to a fixed annual rate of average net assets as follows:
| | % of Average Net Assets |
| Fidelity Municipal Money Market Fund | .0087 |
Prior to December1 2023 the accounting fee was based on the level of average net assets for each month. For the period, the fees were equivalent to the following annualized rates:
| | % of Average Net Assets |
| Fidelity Municipal Money Market Fund | .01 |
Subsequent Event - Management Fee. Effective March 1, 2024, the Fund's management contract will be amended to incorporate administrative services previously covered under separate services agreements (Transfer Agent and Accounting agreements). Any reference to "class" in this note shall mean "the Fund" as the Fund currently offers only one class of shares. The amended contract incorporates a management fee rate that may vary by class. The investment adviser or an affiliate will pay certain expenses of managing and operating the Fund out of each class's management fee.
Each class of the Fund will pay a management fee to the investment adviser. The management fee will be calculated and paid to the investment adviser every month.
When determining a class's management fee, a mandate rate will be calculated based on the monthly average net assets of a group of funds advised by FMR within a designated asset class. A discount rate will be subtracted from the mandate rate once the Fund's monthly average net assets reach a certain level. The mandate rate and discount rate may vary by class.
The annual management fee rate for a class of shares of the Fund will be the lesser of (1) the class's mandate rate reduced by the class's discount rate (if applicable) or (2) the amount set forth in the following table.
| | Maximum Management Fee Rate % |
| Fidelity Municipal Money Market Fund | 0.39 |
One-twelfth of the management fee rate for a class will be applied to the average net assets of the class for the month, giving a dollar amount which is the management fee for the class for that month.
A different management fee rate may be applicable to each class of the Fund. The difference between classes is the result of separate arrangements for class-level services and/or waivers of certain expenses. It is not the result of any difference in advisory or custodial fees or other expenses related to the management of the Fund's assets, which do not vary by class.
Effective March 1, 2024, the Fund's sub-advisory agreements with FMR Investment Management (UK) Limited, Fidelity Management & Research (Hong Kong) Limited, and Fidelity Management & Research (Japan) Limited will be amended to provide that the investment adviser will pay each sub-adviser monthly fees equal to 110% of the sub-adviser's costs for providing sub-advisory services.
Interfund Trades. Funds may purchase from or sell securities to other Fidelity Funds under procedures adopted by the Board. The procedures have been designed to ensure these interfund trades are executed in accordance with Rule 17a-7 of the 1940 Act. Interfund trades during the period are noted in the table below.
| | Purchases ($) | Sales ($) | Realized Gain (Loss) ($) |
| Fidelity Municipal Money Market Fund | 34,935 | 25,800 | - |
5. Expense Reductions.
During the period the investment adviser or an affiliate reimbursed and/or waived a portion of operating expenses in the amount of $89.
6. Other.
A fund's organizational documents provide former and current trustees and officers with a limited indemnification against liabilities arising in connection with the performance of their duties to the fund. In the normal course of business, a fund may also enter into contracts that provide general indemnifications. A fund's maximum exposure under these arrangements is unknown as this would be dependent on future claims that may be made against a fund. The risk of material loss from such claims is considered remote.
7. Risk and Uncertainties.
Many factors affect a fund's performance. Developments that disrupt global economies and financial markets, such as pandemics, epidemics, outbreaks of infectious diseases, war, terrorism, and environmental disasters, may significantly affect a fund's investment performance. The effects of these developments to a fund will be impacted by the types of securities in which a fund invests, the financial condition, industry, economic sector, and geographic location of an issuer, and a fund's level of investment in the securities of that issuer. Significant concentrations in security types, issuers, industries, sectors, and geographic locations may magnify the factors that affect a fund's performance.
As a shareholder, you incur two types of costs: (1) transaction costs, which may include sales charges (loads) on purchase payments or redemption proceeds, as applicable and (2) ongoing costs, which generally include management fees, distribution and/or service (12b-1) fees and other Fund expenses. This Example is intended to help you understand your ongoing costs (in dollars) of investing in a fund and to compare these costs with the ongoing costs of investing in other mutual funds.
| The Example is based on an investment of $1,000 invested at the beginning of the period and held for the entire period (September 1, 2023 to February 29, 2024). |
Actual Expenses
The first line of the accompanying table provides information about actual account values and actual expenses. You may use the information in this line, together with the amount you invested, to estimate the expenses that you paid over the period. Simply divide your account value by $1,000.00 (for example, an $8,600 account value divided by $1,000.00 = 8.6), then multiply the result by the number in the first line for a class/Fund under the heading entitled "Expenses Paid During Period" to estimate the expenses you paid on your account during this period. If any fund is a shareholder of any underlying mutual funds or exchange-traded funds (ETFs) (the Underlying Funds), such fund indirectly bears its proportional share of the expenses of the Underlying Funds in addition to the direct expenses incurred presented in the table. These fees and expenses are not included in the annualized expense ratio used to calculate the expense estimate in the table below.
Hypothetical Example for Comparison Purposes
The second line of the accompanying table provides information about hypothetical account values and hypothetical expenses based on the actual expense ratio and an assumed rate of return of 5% per year before expenses, which is not the actual return. The hypothetical account values and expenses may not be used to estimate the actual ending account balance or expenses you paid for the period. You may use this information to compare the ongoing costs of investing in the Fund and other funds. To do so, compare this 5% hypothetical example with the 5% hypothetical examples that appear in the shareholder reports of the other funds. If any fund is a shareholder of any Underlying Funds, such fund indirectly bears its proportional share of the expenses of the Underlying Funds in addition to the direct expenses as presented in the table. These fees and expenses are not included in the annualized expense ratio used to calculate the expense estimate in the table below.
Please note that the expenses shown in the table are meant to highlight your ongoing costs only and do not reflect any transaction costs. Therefore, the second line of the table is useful in comparing ongoing costs only, and will not help you determine the relative total costs of owning different funds. In addition, if these transactional costs were included, your costs would have been higher.
| | | | | Annualized Expense Ratio- A | | Beginning Account Value September 1, 2023 | | Ending Account Value February 29, 2024 | | Expenses Paid During Period- C September 1, 2023 to February 29, 2024 |
| | | | | | | | | | |
| Fidelity® Municipal Money Market Fund | | | | .41% | | | | | | |
| Actual | | | | | | $ 1,000 | | $ 1,016.80 | | $ 2.06 |
Hypothetical-B | | | | | | $ 1,000 | | $ 1,022.82 | | $ 2.06 |
| |
A Annualized expense ratio reflects expenses net of applicable fee waivers.
B 5% return per year before expenses
C Expenses are equal to the annualized expense ratio, multiplied by the average account value over the period, multiplied by 182/ 366 (to reflect the one-half year period). The fees and expenses of any Underlying Funds are not included in each annualized expense ratio.
Board Approval of Investment Advisory Contracts and Management Fees
Fidelity Municipal Money Market Fund
Each year, the Board of Trustees, including the Independent Trustees (together, the Board), considers the renewal of the fund's management contract with Fidelity Management & Research Company LLC (FMR) and the sub-advisory agreements (together, the Advisory Contracts) for the fund. FMR and the sub-advisers are referred to herein as the Investment Advisers. The Board, assisted by the advice of fund counsel and Independent Trustees' counsel, requests and considers a broad range of information relevant to the renewal of the Advisory Contracts throughout the year.
The Board meets regularly and, at each of its meetings, covers an extensive agenda of topics and materials and considers factors that are relevant to its annual consideration of the renewal of the fund's Advisory Contracts, including the services and support provided to the fund and its shareholders. The Board's Operations Committee, of which all the Independent Trustees are members, meets regularly throughout the year and requests, receives and considers, among other matters, information related to the annual consideration of the renewal of the fund's Advisory Contracts before making its recommendation to the Board. The Board also meets as needed to review matters specifically related to the Board's annual consideration of the renewal of the Advisory Contracts. Members of the Board may also meet from time to time with trustees of other Fidelity funds through joint ad hoc committees to discuss certain matters relevant to all of the Fidelity funds.
At its September 2023 meeting, the Board unanimously determined to renew the fund's Advisory Contracts. In reaching its determination, the Board considered all factors it believed relevant, including (i) the nature, extent, and quality of the services provided to the fund and its shareholders (including the investment performance of the fund); (ii) the competitiveness relative to peer funds of the fund's management fee and total expense ratio; (iii) the total costs of the services provided by and the profits realized by FMR and its affiliates (Fidelity) from its relationships with the fund; and (iv) the extent to which, if any, economies of scale exist and are realized as the fund grows, and whether any economies of scale are appropriately shared with fund shareholders. The Board also considered the broad range of investment choices available to shareholders from FMR's competitors and that the fund's shareholders have chosen to invest in the fund, which is part of the Fidelity family of funds. The Board's decision to renew the Advisory Contracts was not based on any single factor.
The Board reached a determination, with the assistance of fund counsel and Independent Trustees' counsel and through the exercise of its business judgment, that the renewal of the Advisory Contracts was in the best interests of the fund and its shareholders and that the compensation payable under the Advisory Contracts was fair and reasonable in light of all of the surrounding circumstances.
Nature, Extent, and Quality of Services Provided. The Board considered the Investment Advisers' staffing as it relates to the fund, including the backgrounds and experience of investment personnel, and also considered the Investment Advisers' implementation of the fund's investment program. The Independent Trustees also had discussions with senior management of Fidelity's investment operations and investment groups. The Board considered the structure of the investment personnel compensation program and whether this structure provides appropriate incentives to act in the best interests of the fund. Additionally, the Board considered the portfolio managers' investments, if any, in the funds that they manage.
Resources Dedicated to Investment Management and Support Services. The Board reviewed the general qualifications and capabilities of Fidelity's investment staff, including its size, education, experience, and resources, as well as Fidelity's approach to recruiting, managing, training, and compensating investment personnel. The Board noted the resources devoted to Fidelity's global investment organization, and that Fidelity's analysts have extensive resources, tools and capabilities that allow them to conduct quantitative and fundamental analysis, as well as credit analysis of issuers, counterparties and guarantors. Further, the Board considered that Fidelity's investment professionals have sufficient access to global information and data so as to provide competitive investment results over time, and that those professionals also have access to sophisticated tools that permit them to assess portfolio construction and risk and performance attribution characteristics continuously, as well as to transmit new information and research conclusions rapidly around the world. Additionally, in its deliberations, the Board considered Fidelity's trading, risk management, compliance, cybersecurity, and technology and operations capabilities and resources, which are integral parts of the investment management process.
Shareholder and Administrative Services. The Board considered (i) the nature, extent, quality, and cost of advisory, administrative, and shareholder services performed by the Investment Advisers and their affiliates under the Advisory Contracts and under separate agreements covering transfer agency and pricing and bookkeeping services for the fund; (ii) the nature and extent of Fidelity's supervision of third party service providers, principally custodians, subcustodians, and pricing vendors; and (iii) the resources devoted by Fidelity to, and the record of compliance with, the fund's compliance policies and procedures.
The Board noted that the growth of fund assets over time across the complex allows Fidelity to reinvest in the development of services designed to enhance the value and convenience of the Fidelity funds as investment vehicles. These services include 24-hour access to account information and market information over the Internet and through telephone representatives, investor education materials and asset allocation tools. The Board also considered that it reviews customer service metrics such as telephone response times, continuity of services on the website and metrics addressing services at Fidelity Investor Centers.
Investment in a Large Fund Family. The Board considered the benefits to shareholders of investing in a fund that is part of a large family of funds offering a variety of investment disciplines and providing a large variety of fund investor services. The Board noted that Fidelity had taken, or had made recommendations to the Board that resulted in the Fidelity funds taking, a number of actions over the previous year that benefited particular funds and/or the Fidelity funds in general.
Investment Performance. The Board took into account discussions that occur with representatives of the Investment Advisers, and reports that it receives, at Board meetings throughout the year relating to fund investment performance. In this regard the Board noted that as part of regularly scheduled fund reviews and other reports to the Board on fund performance, the Board considered annualized return information for the fund for different time periods, measured against an appropriate peer group of funds with similar objectives (peer group). The Board also considered information about performance attribution. In its evaluation of fund investment performance at meetings throughout the year, the Board gave particular attention to information indicating underperformance of certain Fidelity funds over different time periods and discussed with the Investment Advisers the reasons for such underperformance.
In addition to reviewing absolute and relative fund performance, the Independent Trustees periodically consider the appropriateness of fund performance metrics in evaluating the results achieved. The Independent Trustees generally give greater weight to fund performance over longer time periods than over shorter time periods.
The Board recognizes that in interest rate environments where many competitors waive fees to maintain a minimum yield, relative money market fund performance on a net basis (after fees and expenses) may not be particularly meaningful due to miniscule performance differences among competitor funds. Depending on the circumstances, the Independent Trustees may be satisfied with a fund's performance notwithstanding that it lags its peer group for certain periods.
Based on its review, the Board concluded that the nature, extent, and quality of services provided to the fund under the Advisory Contracts should continue to benefit the shareholders of the fund.
Competitiveness of Management Fee and Total Expense Ratio. The Board was provided with information regarding industry trends in management fees and expenses. In its review of the fund's management fee and total expense ratio, the Board considered the fund's management fee rate as well as other fund or class expenses, as applicable, such as transfer agent fees, pricing and bookkeeping fees, and custodial, legal, and audit fees. The Board also noted that Fidelity may agree to waive fees or reimburse expenses from time to time, and the extent to which, if any, it has done so for the fund.
Comparisons of Management Fees and Total Expense Ratios. Among other things, the Board reviewed data for selected groups of competitive funds and classes (referred to as "mapped groups") that were compiled by Fidelity based on combining similar investment objective categories (as classified by Lipper) that have comparable investment mandates. The data reviewed by the Board included (i) gross management fee comparisons (before taking into account expense reimbursements or caps) relative to the total universe of funds within the mapped group; (ii) gross management fee comparisons relative to a subset of non-Fidelity funds in the mapped group that are similar in size and management fee structure to the fund (referred to as the "asset size peer group"); (iii) total expense comparisons of the fund relative to funds and classes in the mapped group that have a similar sales load structure to the fund (referred to as the "similar sales load structure group"); and (iv) total expense comparisons of the fund relative to funds and classes in the similar sales load structure group that are similar in size and management fee structure to the fund (referred to as the "total expense asset size peer group").
The information provided to the Board indicated that the fund's management fee rate ranked above the competitive median of the mapped group for 2022 and above the competitive median of the asset size peer group for 2022. Further, the information provided to the Board indicated that the total expense ratio of the fund ranked above the competitive median of the similar sales load structure group for 2022 and above the competitive median of the total expense asset size peer group for 2022.
The Board noted that Lipper's definition of retail and institutional money market funds creates challenges for comparisons because Lipper's retail category includes funds that have high investment minimums, unlike the fund, that would typically be considered institutional load. The Board considered that Fidelity believes that, although the management fee and total expenses may rank above the median, the fees that the fund is charged are reasonable for the overall value of the nature and qualify of the services the fund's shareholders receive.
Fees Charged to Other Fidelity Clients. The Board also considered Fidelity fee structures and other information with respect to clients of Fidelity, such as other funds advised or subadvised by Fidelity, pension plan clients, and other institutional clients with similar mandates. The Board noted that a joint ad hoc committee created by it and the boards of other Fidelity funds periodically reviews and compares Fidelity's institutional investment advisory business with its business of providing services to the Fidelity funds and also noted the most recent findings of the committee. The Board noted that the committee's review included a consideration of the differences in services provided, fees charged, and costs incurred, as well as competition in the markets serving the different categories of clients.
Based on its review, the Board concluded that the fund's management fee is fair and reasonable in light of the services that the fund receives and the other factors considered. Further, based on its review of total expense ratios and fees charged to other Fidelity clients, the Board concluded that the fund's total expense ratio was reasonable in light of the services that the fund and its shareholders receive and the other factors considered.
Costs of the Services and Profitability. The Board considered the revenues earned and the expenses incurred by Fidelity in conducting the business of developing, marketing, distributing, managing, administering and servicing the fund and servicing the fund's shareholders. The Board also considered the level of Fidelity's profits in respect of all the Fidelity funds.
On an annual basis, Fidelity presents to the Board information about the profitability of its relationships with the fund. Fidelity calculates profitability information for each fund, as well as aggregate profitability information for groups of Fidelity funds and all Fidelity funds, using a series of detailed revenue and cost allocation methodologies which originate with the books and records of Fidelity on which Fidelity's audited financial statements are based. The Audit Committee of the Board reviews any significant changes from the prior year's methodologies and the full Board approves such changes.
A public accounting firm has been engaged annually by the Board as part of the Board's assessment of Fidelity's profitability analysis. The engagement includes the review and assessment of the methodologies used by Fidelity in determining the revenues and expenses attributable to Fidelity's fund business, and completion of agreed-upon procedures in respect of the mathematical accuracy of certain fund profitability information and its conformity to established allocation methodologies. After considering the reports issued under the engagement and information provided by Fidelity, the Board concluded that while other allocation methods may also be reasonable, Fidelity's profitability methodologies are reasonable in all material respects.
The Board also reviewed Fidelity's non-fund businesses and potential indirect benefits such businesses may have received as a result of their association with Fidelity's fund business (i.e., fall-out benefits) as well as cases where Fidelity's affiliates may benefit from the funds' business. The Board considered areas where potential indirect benefits to the Fidelity funds from their relationships with Fidelity may exist. The Board's consideration of these matters was informed by the findings of a joint ad hoc committee created by it and the boards of other Fidelity funds to evaluate potential fall-out benefits.
The Board considered the costs of the services provided by and the profits realized by Fidelity in connection with the operation of the fund and was satisfied that the profitability was not excessive.
Economies of Scale. The Board considered whether there have been economies of scale in respect of the management of the Fidelity funds, whether the Fidelity funds (including the fund) have appropriately benefited from any such economies of scale, and whether there is potential for realization of any further economies of scale. The Board considered the extent to which the fund will benefit from economies of scale as assets grow through increased services to the fund, through waivers or reimbursements, or through fee or expense ratio reductions. The Board also noted that a committee created by it and the boards of other Fidelity funds periodically analyzes whether Fidelity attains economies of scale in respect of the management and servicing of the Fidelity funds, whether the Fidelity funds have appropriately benefited from such economies of scale, and whether there is potential for realization of any further economies of scale.
The Board recognized that the fund's management contract incorporates a "group fee" structure, which provides for lower group fee rates as total "group assets" increase, and for higher group fee rates as total "group assets" decrease ("group assets" as defined in the management contract). FMR calculates the group fee rates based on a tiered asset "breakpoint" schedule that varies based on asset class. The Board considered that the group fee is designed to deliver the benefits of economies of scale to fund shareholders when total Fidelity fund assets increase, even if assets of any particular fund are unchanged or have declined, because some portion of Fidelity's costs are attributable to services provided to all Fidelity funds, and all funds benefit if those costs can be allocated among more assets. The Board also considered that Fidelity agreed to impose a temporary fee waiver in the form of additional breakpoints to the current breakpoint schedule. The Board concluded that, given the group fee structure, fund shareholders will benefit from lower management fees as "group assets" increase at the fund complex level, regardless of whether Fidelity achieves any such economies of scale.
The Board concluded, taking into account the analysis of the committee, that economies of scale, if any, are being appropriately shared between fund shareholders and Fidelity.
Additional Information Requested by the Board. In order to develop fully the factual basis for consideration of the Fidelity funds' advisory contracts, the Board requested and received additional information on certain topics, including: (i) Fidelity's fund profitability methodology, profitability trends for certain funds, the allocation of various costs to different funds, and the impact of certain factors on fund profitability results; (ii) portfolio manager changes that have occurred during the past year and Fidelity's views regarding portfolio manager investment in the Fidelity funds that they manage; (iii) hiring, training, and retaining personnel; (iv) the arrangements with and compensation paid to certain fund sub-advisers and the treatment of such compensation within Fidelity's fund profitability methodology; (v) the terms of the funds' various management fee structures, including the basic group fee and the terms of Fidelity's voluntary expense limitation arrangements; (vi) Fidelity's transfer agent, pricing and bookkeeping fees, expense and service structures for different funds and classes relative to competitive trends and market conditions; (vii) the impact on fund profitability of recent industry trends, such as the growth in passively managed funds and the changes in flows for different types of funds; (viii) the types of management fee and total expense comparisons provided, and the challenges and limitations associated with such information; (ix) explanations regarding the relative total expense ratios and management fees of certain funds and classes, total expense and management fee competitive trends, and methodologies for total expense and management fee competitive comparisons; (x) information concerning expense limitations applicable to certain funds; and (xi) matters related to money market funds, exchange-traded funds, and target date funds.
Conclusion. Based on its evaluation of all of the conclusions noted above, and after considering all factors it believed relevant, the Board, including the Independent Trustees, concluded that the advisory and sub-advisory fee arrangements are fair and reasonable in light of all of the surrounding circumstances and that the fund's Advisory Contracts should be renewed through September 30, 2024.
Board Approval of Investment Advisory Contracts
Fidelity Municipal Money Market Fund
At its January 2024 meeting, the Board of Trustees, including the Independent Trustees (together, the Board), approved an amended and restated management contract with Fidelity Management & Research Company LLC (FMR) (the Management Contract), and amended and restated sub-advisory agreements (the Sub-Advisory Contracts, and together with the Management Contract, the Advisory Contracts) for the fund, including the fund's sub-advisory agreements with FMR Investment Management (UK) Limited (FMR UK), Fidelity Management & Research (Hong Kong) Limited (FMR H.K.), and Fidelity Management & Research (Japan) Limited (FMR Japan). The Advisory Contracts will be effective March 1, 2024. The Board will consider the annual renewal of the fund's Advisory Contracts in September 2024, following its review of additional materials provided by FMR.
Management Contract. The Board approved the Management Contract, which implements a new fee structure combining the management fee, transfer agent fee (TA Fee), and pricing and bookkeeping fee (P&B Fee) of the fund into a single fee based on tiered schedules and subject to a maximum rate (the Unified Fee). In exchange for the Unified Fee, the fund will receive investment advisory, management, administrative, transfer agent, pricing and bookkeeping services under a single agreement - the Management Contract.
In its consideration of the Management Contract over several meetings, the Board received, reviewed and discussed a comprehensive set of analyses regarding the Unified Fee including (i) the legal framework, (ii) design goals for the Unified Fee, (iii) calculation methodology for the Unified Fee and illustrative examples, (iv) annual and cumulative projected impacts under various scenarios, both in the aggregate and at the fund/class level, (v) explanations of schedules, rate levers and maximum rates and (vi) shareholder benefits and projected savings.
The Board considered that the maximum Unified Fee for the fund would be no higher than the sum of (i) the lowest contractual management fee under the fund's existing management contract, which is the individual fund fee, if any, plus the lowest contractual marginal group fee rate and (ii) the TA and P&B Fee rates, which are fixed fee rates since December 1, 2023 (together, the Unified Fee Cap). The Board noted that, as a result of this Unified Fee Cap, the Unified Fee would be no greater than the fees previously authorized to be charged for the same services. The Board noted that certain expenses such as third-party expenses and certain other miscellaneous expenses would be outside the scope of the Unified Fee and the calculation of such fees would not change as a result of the Unified Fee.
The Board considered that implementation of the Unified Fee, which includes the Unified Fee Cap, would cause all funds subject to a Unified Fee, including the fund, to experience an immediate reduction on contractual fee rates for services provided under the current management contracts. The Board considered that some funds would not experience lower fees as a result of existing fee caps. The Board further considered that, in addition to the contractual fee savings, the Unified Fee offers funds and their shareholders greater protection from future rate increases for services previously offered under separate agreements that are now covered by the Management Contract because such rate increases would require shareholder, as well as Board, approval.
Sub-Advisory Contracts. In connection with the Unified Fee changes, the Board considered the Sub-Advisory Contracts, which changed the arrangements for fees paid by FMR to the sub-advisers under the agreements. The Board noted that the agreements with FMR UK, FMR H.K., and FMR Japan were amended to provide that FMR will compensate each sub-adviser at a fee equal to 110% of the sub-adviser's costs incurred in providing services under the agreement. The Board considered that, under the Sub-Advisory Contracts, FMR, and not the fund, will continue to pay the sub-advisory fees to each applicable sub-adviser.
The Board considered that the approval of the fund's Advisory Contracts will not result in any changes in the investment process or strategies employed in the management of the fund's assets or the day-to-day management of the fund or the persons primarily responsible for such management. Further, the Board considered that the Management Contract would not change the obligations and services of FMR and its affiliates on behalf of the fund, and, in particular, there would be no change in the nature and level of advisory, management, administration, transfer agent, and pricing and bookkeeping services provided to the fund by FMR and its affiliates.
In connection with its consideration of future renewals of the fund's Advisory Contracts, the Board will consider: (i) the nature, extent and quality of services provided to the funds, including shareholder and administrative services and investment performance; (ii) the competitiveness of the management fee and total expenses for the fund; (iii) the costs of the services and profitability, including the revenues earned and the expenses incurred in conducting the business of developing, marketing, distributing, managing, administering, and servicing the fund and its shareholders, to the extent applicable; and (iv) whether there have been economies of scale in respect of the Fidelity funds, whether the Fidelity funds (including the fund) have appropriately benefited from any such economies of scale, and whether there is the potential for realization of any further economies.
Based on its evaluation of all of the conclusions noted above, and after considering all factors it believed relevant, the Board concluded that the fund's management fee structure is fair and reasonable, and that the fund's Advisory Contracts should be approved.
| A special meeting of shareholders was held on October 18, 2023. The results of votes taken among shareholders on the proposal before them are reported below. Each vote reported represents one dollar of net asset value held on the record date for the meeting. |
| Proposal 1 |
| To elect a Board of Trustees. |
| | # of Votes | % of Votes |
| Abigail P. Johnson |
| Affirmative | 3,563,377,070.69 | 93.47 |
| Withheld | 249,002,954.77 | 6.53 |
| TOTAL | 3,812,380,025.46 | 100.00 |
| Jennifer Toolin McAuliffe |
| Affirmative | 3,580,401,452.33 | 93.92 |
| Withheld | 231,978,573.13 | 6.08 |
| TOTAL | 3,812,380,025.46 | 100.00 |
| Christine J. Thompson |
| Affirmative | 3,575,829,590.11 | 93.80 |
| Withheld | 236,550,435.35 | 6.20 |
| TOTAL | 3,812,380,025.46 | 100.00 |
| Elizabeth S. Acton |
| Affirmative | 3,563,692,727.00 | 93.48 |
| Withheld | 248,687,298.46 | 6.52 |
| TOTAL | 3,812,380,025.46 | 100.00 |
| Laura M. Bishop |
| Affirmative | 3,580,620,821.44 | 93.92 |
| Withheld | 231,759,204.02 | 6.08 |
| TOTAL | 3,812,380,025.46 | 100.00 |
| Ann E. Dunwoody |
| Affirmative | 3,556,292,503.45 | 93.28 |
| Withheld | 256,087,522.01 | 6.72 |
| TOTAL | 3,812,380,025.46 | 100.00 |
| John Engler |
| Affirmative | 3,548,916,807.39 | 93.09 |
| Withheld | 263,463,218.07 | 6.91 |
| TOTAL | 3,812,380,025.46 | 100.00 |
| Robert F. Gartland |
| Affirmative | 3,574,560,938.30 | 93.76 |
| Withheld | 237,819,087.16 | 6.24 |
| TOTAL | 3,812,380,025.46 | 100.00 |
| Robert W. Helm |
| Affirmative | 3,561,007,437.32 | 93.41 |
| Withheld | 251,372,588.14 | 6.59 |
| TOTAL | 3,812,380,025.46 | 100.00 |
| Arthur E. Johnson |
| Affirmative | 3,562,676,023.62 | 93.45 |
| Withheld | 249,704,001.84 | 6.55 |
| TOTAL | 3,812,380,025.46 | 100.00 |
| Michael E. Kenneally |
| Affirmative | 3,576,790,948.78 | 93.82 |
| Withheld | 235,589,076.68 | 6.18 |
| TOTAL | 3,812,380,025.46 | 100.00 |
| Mark A. Murray |
| Affirmative | 3,577,292,731.34 | 93.83 |
| Withheld | 235,087,294.12 | 6.17 |
| TOTAL | 3,812,380,025.46 | 100.00 |
| Carol J. Zierhoffer |
| Affirmative | 3,562,554,595.71 | 93.45 |
| Withheld | 249,825,429.75 | 6.55 |
| TOTAL | 3,812,380,025.46 | 100.00 |
| | | |
| Proposal 1 reflects trust wide proposal and voting results. |
1.703548.126
MMM-SANN-0424
Item 2.
Code of Ethics
Not applicable.
Item 3.
Audit Committee Financial Expert
Not applicable.
Item 4.
Principal Accountant Fees and Services
Not applicable.
Item 5.
Audit Committee of Listed Registrants
Not applicable.
Item 6.
Investments
(a)
Not applicable.
(b)
Not applicable
Item 7.
Disclosure of Proxy Voting Policies and Procedures for Closed-End Management Investment Companies
Not applicable.
Item 8.
Portfolio Managers of Closed-End Management Investment Companies
Not applicable.
Item 9.
Purchase of Equity Securities by Closed-End Management Investment Company and Affiliated Purchasers
Not applicable.
Item 10.
Submission of Matters to a Vote of Security Holders
There were no material changes to the procedures by which shareholders may recommend nominees to the Fidelity Union Street Trust II’s Board of Trustees.
Item 11.
Controls and Procedures
(a)(i) The President and Treasurer and the Chief Financial Officer have concluded that the Fidelity Union Street Trust II’s (the “Trust”) disclosure controls and procedures (as defined in Rule 30a-3(c) under the Investment Company Act) provide reasonable
assurances that material information relating to the Trust is made known to them by the appropriate persons, based on their evaluation of these controls and procedures as of a date within 90 days of the filing date of this report.
(a)(ii) There was no change in the Trust’s internal control over financial reporting (as defined in Rule 30a-3(d) under the Investment Company Act) that occurred during the period covered by this report that has materially affected, or is reasonably likely to materially affect, the Trust’s internal control over financial reporting.
Item 12.
Disclosure of Securities Lending Activities for Closed-End Management
Investment Companies
Not applicable.
Item 18.
Recovery of Erroneously Awarded Compensation
(a)
Not applicable.
(b)
Not applicable.
Item 19.
Exhibits
SIGNATURES
Pursuant to the requirements of the Securities Exchange Act of 1934 and the Investment Company Act of 1940, the registrant has duly caused this report to be signed on its behalf by the undersigned, thereunto duly authorized.
Fidelity Union Street Trust II
| |
By: | /s/Laura M. Del Prato |
| Laura M. Del Prato |
| President and Treasurer (Principal Executive Officer) |
|
|
Date: | April 22, 2024 |
Pursuant to the requirements of the Securities Exchange Act of 1934 and the Investment Company Act of 1940, this report has been signed below by the following persons on behalf of the registrant and in the capacities and on the dates indicated.
| |
By: | /s/Laura M. Del Prato |
| Laura M. Del Prato |
| President and Treasurer (Principal Executive Officer) |
|
|
Date: | April 22, 2024 |
| |
By: | /s/John J. Burke III |
| John J. Burke III |
| Chief Financial Officer (Principal Financial Officer) |
|
|
Date: | April 22, 2024 |