.UNITED STATES
SECURITIES AND EXCHANGE COMMISSION
Washington, D.C. 20549
FORM N-CSR
CERTIFIED SHAREHOLDER REPORT OF REGISTERED
MANAGEMENT INVESTMENT COMPANIES
Investment Company Act file number 811-06452
Fidelity Union Street Trust II
(Exact name of registrant as specified in charter)
245 Summer St., Boston, Massachusetts 02210
(Address of principal executive offices) (Zip code)
Nicole Macarchuk, Secretary
245 Summer St.
Boston, Massachusetts 02210
(Name and address of agent for service)
Registrant's telephone number, including area code:
617-563-7000
| |
Date of fiscal year end: | August 31 |
|
|
Date of reporting period: | August 31, 2024 |
Item 1.
Reports to Stockholders
| |
| | ANNUAL SHAREHOLDER REPORT | AS OF AUGUST 31, 2024 | This report describes changes to the Fund that occurred during the reporting period. |
| | Fidelity® Municipal Money Market Fund Fidelity® Municipal Money Market Fund : FTEXX |
| | | |
This annual shareholder report contains information about Fidelity® Municipal Money Market Fund for the period September 1, 2023 to August 31, 2024. You can find additional information about the Fund at fundresearch.fidelity.com/prospectus/sec. You can also request this information by contacting us at 1-800-544-8544 or by sending an e-mail to fidfunddocuments@fidelity.com.
What were your Fund costs for the last year?(based on hypothetical $10,000 investment)
FUND COST (PREVIOUS YEAR)
| | Costs of a $10,000 investment | Costs paid as a percentage of a $10,000 investment | |
| Fidelity® Municipal Money Market Fund | $ 41 | 0.40% | |
Key Fund Statistics (as of August 31, 2024)
KEY FACTS | | |
| Fund Size | $3,801,153,223 | |
| Number of Holdings | 486 | |
| Total Advisory Fee | $12,052,106 | |
What did the Fund invest in?
(as of August 31, 2024)
EFFECTIVE MATURITY DIVERSIFICATION (% of Fund's net assets) |
| Days |
| 1-7 | 78.3 | |
| 8-30 | 5.1 | |
| 31-60 | 3.7 | |
| 61-90 | 1.5 | |
| 91-180 | 0.5 | |
| >180 | 10.3 | |
| |
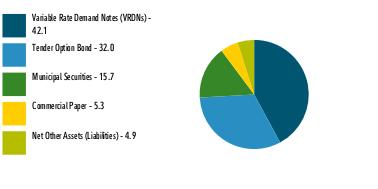
| Variable Rate Demand Notes (VRDNs) | 42.1 |
| Tender Option Bond | 32.0 |
| Municipal Securities | 15.7 |
| Commercial Paper | 5.3 |
| Net Other Assets (Liabilities) | 4.9 |
ASSET ALLOCATION (% of Fund's net assets) |
|
|
How has the Fund changed?
This is a summary of certain changes to the Fund since September 1, 2023. For more complete information, you may review the Fund's next prospectus, which we expect to be available by October 30, 2024 at fundresearch.fidelity.com/prospectus/sec or upon request at 1-800-544-8544 or by sending an e-mail to fidfunddocuments@fidelity.com.
The fund's transfer agent and pricing & bookkeeping fees were changed to a fixed rate effective December 1, 2023, through February 29, 2024, in anticipation of the transition to a new management fee structure. Effective March 1, 2024, the fund's management contract was amended to incorporate administrative services previously covered under separate services agreements (transfer agent and pricing & bookkeeping). The amended contract incorporates a management fee rate that may vary by class. The Adviser or an affiliate pays certain expenses of managing and operating the fund out of each class's management fee. | The fund's principal investment risks were updated in connection with the implementation of recent rule amendments related to money market funds adopted by the SEC.
|
| Fidelity, the Fidelity Investments Logo and all other Fidelity trademarks or service marks used herein are trademarks or service marks of FMR LLC. Any third-party marks that are used herein are trademarks or service marks of their respective owners. © 2024 FMR LLC. All rights reserved. |
| | For additional information about the Fund; including its prospectus, financial information, holdings and proxy information, scan the QR code or visit fundresearch.fidelity.com/prospectus/sec 1.9913584.100 10-TSRA-1024 |
.
Item 2.
Code of Ethics
As of the end of the period, August 31, 2024, Fidelity Union Street Trust II (the trust) has adopted a code of ethics, as defined in Item 2 of Form N-CSR, that applies to its President and Treasurer and its Chief Financial Officer. A copy of the code of ethics is filed as an exhibit to this Form N-CSR.
Item 3.
Audit Committee Financial Expert
The Board of Trustees of the trust has determined that Elizabeth S. Acton is an audit committee financial expert, as defined in Item 3 of Form N-CSR. Ms. Acton is independent for purposes of Item 3 of Form N-CSR.
Item 4.
Principal Accountant Fees and Services
Fees and Services
The following table presents fees billed by PricewaterhouseCoopers LLP (“PwC”) in each of the last two fiscal years for services rendered to Fidelity Municipal Money Market Fund (the “Funds”):
Services Billed by PwC
August 31, 2024 FeesA
|
| Audit Fees | Audit-Related Fees | Tax Fees | All Other Fees |
Fidelity Municipal Money Market Fund | $38,500 | $3,000 | $2,100 | $1,300 |
|
| Audit Fees | Audit-Related Fees | Tax Fees | All Other Fees |
Fidelity Municipal Money Market Fund | $52,000 | $3,000 | $2,100 | $1,300 |
|
|
|
|
|
A Amounts may reflect rounding.
The following table(s) present(s) fees billed by PwC that were required to be approved by the Audit Committee for services that relate directly to the operations and financial reporting of the Fund(s) and that are rendered on behalf of Fidelity Management & Research Company LLC ("FMR") and entities controlling, controlled by, or under
common control with FMR (not including any sub-adviser whose role is primarily portfolio management and is subcontracted with or overseen by another investment adviser) that provide ongoing services to the Fund(s) (“Fund Service Providers”):
Services Billed by PwC
|
| August 31, 2024A | August 31, 2023A |
Audit-Related Fees | $9,437,800 | $8,379,200 |
Tax Fees | $61,000 | $1,000 |
All Other Fees | $35,000 | $- |
A Amounts may reflect rounding.
“Audit-Related Fees” represent fees billed for assurance and related services that are reasonably related to the performance of the fund audit or the review of the fund's financial statements and that are not reported under Audit Fees.
“Tax Fees” represent fees billed for tax compliance, tax advice or tax planning that relate directly to the operations and financial reporting of the fund.
“All Other Fees” represent fees billed for services provided to the fund or Fund Service Provider, a significant portion of which are assurance related, that relate directly to the operations and financial reporting of the fund, excluding those services that are reported under Audit Fees, Audit-Related Fees or Tax Fees.
Assurance services must be performed by an independent public accountant.
* * *
The aggregate non-audit fees billed by PwC for services rendered to the Fund(s), FMR (not including any sub-adviser whose role is primarily portfolio management and is subcontracted with or overseen by another investment adviser), and any Fund Service Provider for each of the last two fiscal years of the Fund(s) are as follows:
|
Billed By | August 31, 2024A | August 31, 2023A |
PwC | $15,014,800 | $13,839,400 |
A Amounts may reflect rounding.
The trust's Audit Committee has considered non-audit services that were not pre-approved that were provided by PwC to Fund Service Providers to be compatible with maintaining the independence of PwC in its(their) audit of the Fund(s), taking into account representations from PwC, in accordance with Public Company Accounting Oversight Board rules, regarding its independence from the Fund(s) and its(their) related entities and FMR’s review of the appropriateness and permissibility under applicable law of such non-audit services prior to their provision to the Fund(s) Service Providers.
Audit Committee Pre-Approval Policies and Procedures
The trust’s Audit Committee must pre-approve all audit and non-audit services provided by a fund’s independent registered public accounting firm relating to the operations or financial reporting of the fund. Prior to the commencement of any audit or non-audit services to a fund, the Audit Committee reviews the services to determine whether they are appropriate and permissible under applicable law.
The Audit Committee has adopted policies and procedures to, among other purposes, provide a framework for the Committee’s consideration of non-audit services by the audit firms that audit the Fidelity funds. The policies and procedures require that any non-audit service provided by a fund audit firm to a Fidelity fund and any non-audit service provided by a fund auditor to a Fund Service Provider that relates directly to the operations and financial reporting of a Fidelity fund (“Covered Service”) are subject to approval by the Audit Committee before such service is provided.
All Covered Services must be approved in advance of provision of the service either: (i) by formal resolution of the Audit Committee, or (ii) by oral or written approval of the service by the Chair of the Audit Committee (or if the Chair is unavailable, such other member of the Audit Committee as may be designated by the Chair to act in the Chair’s absence). The approval contemplated by (ii) above is permitted where the Treasurer determines that action on such an engagement is necessary before the next meeting of the Audit Committee.
Non-audit services provided by a fund audit firm to a Fund Service Provider that do not relate directly to the operations and financial reporting of a Fidelity fund are reported to the Audit Committee periodically.
Non-Audit Services Approved Pursuant to Rule 2-01(c)(7)(i)(C) and (ii) of Regulation S-X (“De Minimis Exception”)
There were no non-audit services approved or required to be approved by the Audit Committee pursuant to the De Minimis Exception during the Fund’s(s’) last two fiscal years relating to services provided to (i) the Fund(s) or (ii) any Fund Service Provider that relate directly to the operations and financial reporting of the Fund(s).
The Registrant has not retained, for the preparation of the audit report on the financial statements included in the Form N-CSR, a registered public accounting firm that has a branch or office that is located in a foreign jurisdiction and that the Public Company Accounting Oversight Board (the “PCAOB”) has determined that the PCAOB is unable to inspect or investigate completely because of a position taken by an authority in the foreign jurisdiction.
The Registrant is not a “foreign issuer,” as defined in 17 CFR 240.3b-4.
Item 5.
Audit Committee of Listed Registrants
Not applicable.
Item 6.
Investments
(a)
Not applicable.
(b)
Not applicable.
Item 7.
Financial Statements and Financial Highlights for Open-End Management Investment Companies
Fidelity® Municipal Money Market Fund
Annual Report
August 31, 2024
Contents
To view a fund's proxy voting guidelines and proxy voting record for the 12-month period ended June 30, visit http://www.fidelity.com/proxyvotingresults or visit the Securities and Exchange Commission's (SEC) web site at http://www.sec.gov.
You may also call 1-800-544-8544 to request a free copy of the proxy voting guidelines.
Standard & Poor's, S&P and S&P 500 are registered service marks of The McGraw-Hill Companies, Inc. and have been licensed for use by Fidelity Distributors Corporation.
Other third-party marks appearing herein are the property of their respective owners.
All other marks appearing herein are registered or unregistered trademarks or service marks of FMR LLC or an affiliated company. © 2024 FMR LLC. All rights reserved.
This report and the financial statements contained herein are submitted for the general information of the shareholders of the Fund. This report is not authorized for distribution to prospective investors in the Fund unless preceded or accompanied by an effective prospectus.
A fund files its complete schedule of portfolio holdings with the SEC for the first and third quarters of each fiscal year on Form N-PORT. Forms N-PORT are available on the SEC's web site at http://www.sec.gov. A fund's Forms N-PORT may be reviewed and copied at the SEC's Public Reference Room in Washington, DC. Information regarding the operation of the SEC's Public Reference Room may be obtained by calling 1-800-SEC-0330.
For a complete list of a fund's portfolio holdings, view the most recent holdings listing, semiannual report, or annual report on Fidelity's web site at http://www.fidelity.com, http://www.institutional.fidelity.com, or http://www.401k.com, as applicable.
NOT FDIC INSURED •MAY LOSE VALUE •NO BANK GUARANTEE
Neither the Fund nor Fidelity Distributors Corporation is a bank.
Item 7: Financial Statements and Financial Highlights for Open-End Management Investment Companies (Annual Report)
Fidelity® Municipal Money Market Fund
Schedule of Investments August 31, 2024
Showing Percentage of Net Assets
| Variable Rate Demand Note - 42.1% |
| | | Principal Amount (a) (000s) | Value ($) (000s) |
| Alabama - 3.9% | | | |
| Decatur Indl. Dev. Board Exempt Facilities Rev. (Nucor Steel Decatur LLC Proj.) Series 2003 A, 3.2% 9/6/24, VRDN (b)(c) | | 31,715 | 31,715 |
| Mobile Indl. Dev. Board Rev.: | | | |
| (Alabama Pwr. Co. Proj.) Series 2001 B, 3.4% 9/3/24, VRDN (b)(c) | | 9,000 | 9,000 |
| (Alabama Pwr. Theodore Plant Proj.) Series A, 3.4% 9/3/24, VRDN (b)(c) | | 6,500 | 6,500 |
| Walker County Econ. & Indl. Dev. Auth. Solid Waste Disp. Rev. (Alabama Pwr. Co. Plant Gorgas Proj.): | | | |
| Series 2007, 3.4% 9/3/24, VRDN (b)(c) | | 6,500 | 6,500 |
| Series 2023: | | | |
3.4% 9/3/24, VRDN (b)(c) | | 40,750 | 40,750 |
3.45% 9/3/24, VRDN (b)(c) | | 11,500 | 11,500 |
| West Jefferson Indl. Dev. Board Solid Waste Disp. Rev.: | | | |
| (Alabama Pwr. Co. Miller Plant Proj.) Series 2008, 3.4% 9/3/24, VRDN (b)(c) | | 25,010 | 25,010 |
| (Alabama Pwr. Co. Plant Miller Proj.) Series 2023, 3.45% 9/6/24, VRDN (b)(c) | | 13,300 | 13,300 |
| Wilsonville Indl. Dev. Board Poll. Cont. Rev. (Alabama Pwr. Co. Gaston Plant Proj.) Series 2008, 3.4% 9/3/24, VRDN (b)(c) | | 4,550 | 4,550 |
TOTAL ALABAMA | | | 148,825 |
| Arizona - 0.6% | | | |
| Maricopa County Indl. Dev. Auth. Rev. (Clayton Homes, Inc. Proj.) Series 1998, 3.06% 9/6/24, LOC U.S. Bank NA, Cincinnati, VRDN (b)(c) | | 3,300 | 3,300 |
| Maricopa County Poll. Cont. Rev.: | | | |
| (Arizona Pub. Svc. Co. Palo Verde Proj.) Series 2009 A, 3.13% 9/6/24, VRDN (b) | | 2,400 | 2,400 |
| Series 2009 B, 3.13% 9/6/24, VRDN (b) | | 9,900 | 9,900 |
| Series 2009 C, 3.2% 9/6/24, VRDN (b) | | 700 | 700 |
| FNMA: | | | |
| Maricopa County Indl. Dev. Auth. Multi-family Hsg. Rev. (Village Square Apts. Proj.) Series 2004, 3.04% 9/6/24, LOC Fannie Mae, VRDN (b)(c) | | 3,200 | 3,200 |
| Pima County Indl. Dev. Auth. Multi-family Hsg. Rev. Series A, 2.99% 9/6/24, LOC Fannie Mae, VRDN (b)(c) | | 4,525 | 4,525 |
TOTAL ARIZONA | | | 24,025 |
| Arkansas - 0.9% | | | |
| Blytheville Indl. Dev. Rev. (Nucor Corp. Proj.): | | | |
| Series 1998, 3.2% 9/6/24, VRDN (b)(c) | | 10,300 | 10,300 |
| Series 2002, 3.4% 9/6/24, VRDN (b)(c) | | 23,100 | 23,100 |
TOTAL ARKANSAS | | | 33,400 |
| Colorado - 0.0% | | | |
| Colorado Edl. & Cultural Facilities Auth. Rev. (Clyfford Still Museum Proj.) Series 2008, 3.1% 9/6/24, LOC Wells Fargo Bank NA, VRDN (b) | | 100 | 100 |
| Connecticut - 2.1% | | | |
| Connecticut Hsg. Fin. Auth.: | | | |
| (Hsg. Mtg. Fin. Prog.) Series 2018 C, 2.95% 9/6/24 (Liquidity Facility TD Banknorth, NA), VRDN (b)(c) | | 17,950 | 17,950 |
| Series 2017 C, 2.95% 9/6/24 (Liquidity Facility TD Banknorth, NA), VRDN (b)(c) | | 50,000 | 50,000 |
| Series 2019 A, 3% 9/6/24 (Liquidity Facility U.S. Bank NA, Cincinnati), VRDN (b)(c) | | 10,800 | 10,800 |
TOTAL CONNECTICUT | | | 78,750 |
| Delaware - 0.0% | | | |
| Delaware Econ. Dev. Auth. Rev. (Delmarva Pwr. & Lt. Co. Proj.) Series 1994, 3.47% 9/3/24, VRDN (b)(c) | | 300 | 300 |
| District Of Columbia - 0.0% | | | |
| District of Columbia Rev. (Fort Lincoln New Town/Premium Distributors LLC Proj.) Series 2000, 3.13% 9/6/24, LOC Wells Fargo Bank NA, VRDN (b)(c) | | 1,910 | 1,910 |
| Florida - 4.7% | | | |
| Bay County Indl. Rev. Dev. (Gulf Pwr. Co. Proj.) Series 2020, 3.2% 9/6/24, VRDN (b)(c) | | 26,800 | 26,800 |
| Broward County Indl. Dev. Rev.: | | | |
| (Florida Pwr. & Lt. Co. Proj.): | | | |
Series 2015, 3.05% 9/6/24, VRDN (b)(c) | | 9,800 | 9,800 |
Series 2018 B, 3.2% 9/6/24, VRDN (b)(c) | | 4,900 | 4,900 |
| Series 2018, 3.2% 9/6/24, VRDN (b)(c) | | 4,700 | 4,700 |
| Escambia County Solid Waste Disp. Rev. (Gulf Pwr. Co. Proj.) Series 2009, 3.15% 9/6/24, VRDN (b) | | 4,000 | 4,000 |
| Florida Hsg. Fin. Corp. Multi-family Mtg. Rev. (Savannah Springs Apts. Proj.) Series G, 3.01% 9/6/24, LOC Citibank NA, VRDN (b)(c) | | 11,245 | 11,245 |
| Hillsborough County Hsg. Fin. Auth. Multi-family Rev. (Claymore Crossings Apt. Proj.) Series 2005, 3.01% 9/6/24, LOC Citibank NA, VRDN (b)(c) | | 465 | 465 |
| Jacksonville Poll. Cont. Rev. (Florida Pwr. & Lt. Co. Proj.) Series 1995, 3.19% 9/6/24, VRDN (b) | | 10,140 | 10,140 |
| Lee County Indl. Dev. Auth. Rev. (Florida Pwr. & Lt. Co. Proj.) Series 2016 A: | | | |
| 3.05% 9/6/24, VRDN (b)(c) | | 8,300 | 8,300 |
| 3.24% 9/6/24, VRDN (b)(c) | | 6,300 | 6,300 |
| Miami-Dade County Indl. Dev. Auth. Rev.: | | | |
| (Florida Pwr. & Lt. Co. Proj.) Series 2021, 3.15% 9/6/24, VRDN (b)(c) | | 5,800 | 5,800 |
| Series 2024 A, 3.15% 9/6/24, VRDN (b)(c) | | 26,200 | 26,200 |
| Series 2024 B, 3.15% 9/6/24, VRDN (b)(c) | | 28,200 | 28,200 |
| Mississippi Bus. Fin. Corp. Poll. Cont. Rev. (Gulf Pwr. Co. Proj.) Series 2014, 3.19% 9/6/24, VRDN (b) | | 3,775 | 3,775 |
| FNMA: | | | |
| Collier County Hsg. Fin. Auth. Multi-family Rev. (Sawgrass Pines Apts. Proj.) Series 2003, 3% 9/6/24, LOC Fannie Mae, VRDN (b)(c) | | 4,800 | 4,800 |
| Florida Hsg. Fin. Corp. Multi-family Mtg. Rev. Series 2006 H, 3.02% 9/6/24, LOC Fannie Mae, VRDN (b)(c) | | 5,395 | 5,395 |
| Hillsborough County Hsg. Fin. Auth. Multi-family Rev.: | | | |
(Grande Oaks Apts. Proj.) Series A, 3% 9/6/24, LOC Fannie Mae, VRDN (b)(c) | | 3,815 | 3,815 |
(Hunters Run Apts. Proj.) Series 2002 A, 3% 9/6/24, LOC Fannie Mae, VRDN (b)(c) | | 5,135 | 5,135 |
(Morgan Creek Apts. Proj.) Series 2003, 3% 9/6/24, LOC Fannie Mae, VRDN (b)(c) | | 8,800 | 8,800 |
TOTAL FLORIDA | | | 178,570 |
| Georgia - 2.9% | | | |
| Bartow County Dev. Auth. (Georgia Pwr. Co. Plant Bowen Proj.) Series 2022: | | | |
| 4.15% 9/3/24, VRDN (b)(c) | | 16,780 | 16,780 |
| 4.2% 9/3/24, VRDN (b)(c) | | 12,935 | 12,935 |
| Burke County Indl. Dev. Auth. Poll. Cont. Rev. (Georgia Pwr. Co. Plant Vogtle Proj.): | | | |
| Series 2012, 3.45% 9/3/24, VRDN (b)(c) | | 13,340 | 13,340 |
| Series 2018, 3.2% 9/3/24, VRDN (b) | | 22,260 | 22,260 |
| Gwinnett County Dev. Auth. Indl. Dev. Rev. (Curtis 1000, Inc. Proj.) Series 1996, 3.08% 9/6/24, LOC Wells Fargo Bank NA, VRDN (b)(c) | | 6,460 | 6,460 |
| Monroe County Dev. Auth. Poll. Cont. Rev. (Gulf Pwr. Co. Plant Scherer Proj.) Series 2010, 3.15% 9/6/24, VRDN (b) | | 2,100 | 2,100 |
| Monroe County Dev. Auth. Rev. (Florida Pwr. & Lt. Co. Proj.): | | | |
| Series 2017, 3.2% 9/6/24, VRDN (b)(c) | | 7,800 | 7,800 |
| Series 2019, 3.15% 9/6/24, VRDN (b)(c) | | 20,000 | 20,000 |
| FNMA Atlanta Urban Residential Fin. Auth. Multi-family Hsg. Rev. (Collegetown at Harris Homes Phase I Proj.) Series 2003, 3.02% 9/6/24, LOC Fannie Mae, VRDN (b)(c) | | 7,030 | 7,030 |
TOTAL GEORGIA | | | 108,705 |
| Illinois - 3.6% | | | |
| Chicago Midway Arpt. Rev. Series 2014 C, 2.96% 9/6/24, LOC PNC Bank NA, VRDN (b)(c) | | 84,210 | 84,210 |
| Chicago O'Hare Int'l. Arpt. Spl. Facilities Rev. (Lufthansa German Airlines Proj.) Series 2001, 2.93% 9/6/24, LOC Bayerische Landesbank, VRDN (b)(c) | | 37,770 | 37,770 |
| Illinois Dev. Fin. Auth. Rev. (Glenwood School for Boys Proj.) Series 1998, 3.12% 9/6/24, LOC Northern Trust Co., VRDN (b) | | 2,700 | 2,700 |
| FHLMC: | | | |
| Illinois Fin. Auth. Multi-family Rev. (Villagebrook Apts. Proj.) Series 2005, 3.02% 9/6/24, LOC Freddie Mac, VRDN (b)(c) | | 6,515 | 6,515 |
| Lisle Village Multi-family Hsg. Rev. (Devonshire of Lisle Proj.) Series 1991, 2.99% 9/6/24, LOC Freddie Mac, VRDN (b)(c) | | 6,000 | 6,000 |
TOTAL ILLINOIS | | | 137,195 |
| Indiana - 1.6% | | | |
| Indiana Dev. Fin. Auth. Envir. Rev.: | | | |
| (PSI Energy Proj.): | | | |
Series 2003 A, 3.25% 9/6/24, VRDN (b)(c) | | 37,150 | 37,150 |
Series 2003 B, 2.96% 9/6/24, VRDN (b)(c) | | 23,300 | 23,295 |
| Series 2005, 3.1% 9/6/24, LOC Cooperatieve Rabobank UA/NY, VRDN (b) | | 1,500 | 1,500 |
TOTAL INDIANA | | | 61,945 |
| Iowa - 1.5% | | | |
| Iowa Fin. Auth. Solid Disp. Waste Rev. (MidAmerican Energy Co. Proj.) Series 2008 A, 3.13% 9/6/24, VRDN (b)(c) | | 600 | 600 |
| Iowa Fin. Auth. Solid Waste Facilities (MidAmerican Energy Co. Proj.) Series 2017, 3.1% 9/6/24, VRDN (b)(c) | | 56,900 | 56,900 |
TOTAL IOWA | | | 57,500 |
| Kansas - 2.1% | | | |
| Cygne Poll. Cont. Rev. (Kansas Gas and Elec. Co. Proj.) Series 1994 B, 3.2% 9/6/24, VRDN (b) | | 17,200 | 17,200 |
| Burlington Envir. Impt. Rev. (Kansas City Pwr. and Lt. Co. Proj.): | | | |
| Series 2007 A, 3.33% 9/6/24, VRDN (b) | | 3,200 | 3,200 |
| Series 2007 B, 3.33% 9/6/24, VRDN (b) | | 14,000 | 14,000 |
| Chanute Indl. Dev. Rev. (Ash Grove Cement Co. Proj.): | | | |
| Series 2000, 3% 9/6/24, LOC Bank of America NA, VRDN (b)(c) | | 25,100 | 25,100 |
| Series 2002, 3% 9/6/24, LOC Bank of America NA, VRDN (b)(c) | | 7,000 | 7,000 |
| St. Mary's Kansas Poll. Cont. Rev. (Kansas Gas and Elec. Co. Proj.) Series 1994, 3.2% 9/6/24, VRDN (b) | | 4,700 | 4,700 |
| Wamego Kansas Poll. Cont. Rfdg. Rev.: | | | |
| (Kansas Gas & Elec. Co. Proj.) Series 1994, 3.2% 9/6/24, VRDN (b) | | 4,100 | 4,100 |
| (Western Resources, Inc. Proj.) Series 1994, 3.2% 9/6/24, VRDN (b) | | 5,200 | 5,200 |
TOTAL KANSAS | | | 80,500 |
| Kentucky - 0.4% | | | |
| Daviess County Exempt Facilities Rev. (Kimberly-Clark Tissue Co. Proj.) Series 1999, 3.2% 9/6/24 (Kimberly-Clark Corp. Guaranteed), VRDN (b)(c) | | 6,070 | 6,070 |
| Meade County Indl. Bldg. Rev. (Nucor Steel Brandenburg Proj.): | | | |
| Series 2020 B1, 3.75% 9/3/24, VRDN (b)(c) | | 1,700 | 1,700 |
| Series 2021 A1, 4.55% 9/3/24, VRDN (b)(c) | | 6,500 | 6,500 |
TOTAL KENTUCKY | | | 14,270 |
| Louisiana - 0.9% | | | |
| Louisiana Pub. Facilities Auth. Rev. (Air Products & Chemicals, Inc. Proj.): | | | |
| Series 2002, 3.14% 9/6/24, VRDN (b)(c) | | 14,000 | 14,000 |
| Series 2003, 3.14% 9/6/24, VRDN (b)(c) | | 18,650 | 18,650 |
TOTAL LOUISIANA | | | 32,650 |
| Michigan - 0.1% | | | |
| Michigan Strategic Fund Ltd. Oblig. Rev. (The Kroger Co. Recovery Zone Facilities Bond Proj.) Series 2010, 2.96% 9/6/24, LOC Bank of Nova Scotia, VRDN (b) | | 2,400 | 2,400 |
| Mississippi - 0.8% | | | |
| Mississippi Bus. Fin. Corp. Mississippi Pwr. Co. Proj.) Series 2022, 4.15% 9/3/24, VRDN (b)(c) | | 2,040 | 2,040 |
| Mississippi Bus. Fin. Corp. Rev. (Gulf Pwr. Co. Proj.) Series 2019, 3.24% 9/6/24, VRDN (b)(c) | | 24,600 | 24,600 |
| Mississippi Bus. Fin. Corp. Solid Waste Disp. Rev. (Mississippi Pwr. Co. Proj.) Series 1998, 4.15% 9/3/24, VRDN (b)(c) | | 5,300 | 5,300 |
TOTAL MISSISSIPPI | | | 31,940 |
| Nebraska - 1.1% | | | |
| Nebraska Invt. Fin. Auth. Single Family Hsg. Rev.: | | | |
| Series 2015 B, 3.6% 9/6/24 (Liquidity Facility Fed. Home Ln. Bank Topeka), VRDN (b)(c) | | 15,080 | 15,080 |
| Series 2015 D, 3.6% 9/6/24 (Liquidity Facility Fed. Home Ln. Bank Topeka), VRDN (b)(c) | | 11,655 | 11,655 |
| Series 2016 B, 3.6% 9/6/24 (Liquidity Facility Fed. Home Ln. Bank Topeka), VRDN (b)(c) | | 7,865 | 7,865 |
| Series 2018 D, 3.6% 9/6/24 (Liquidity Facility Fed. Home Ln. Bank Topeka), VRDN (b)(c) | | 1,950 | 1,950 |
| Stanton County Indl. Dev. Rev.: | | | |
| (Nucor Corp. Proj.) Series 1996, 3.2% 9/6/24, VRDN (b)(c) | | 1,600 | 1,600 |
| Series 1998, 3.2% 9/6/24, VRDN (b)(c) | | 2,200 | 2,200 |
TOTAL NEBRASKA | | | 40,350 |
| Nevada - 3.4% | | | |
| Clark County Arpt. Rev. Series 2008 C1, 2.9% 9/6/24, LOC Bank of America NA, VRDN (b)(c) | | 51,680 | 51,680 |
| Clark County Indl. Dev. Rev.: | | | |
| (Southwest Gas Corp. Proj.) Series 2003 A, 3% 9/6/24, LOC Wells Fargo Bank NA, VRDN (b)(c) | | 44,500 | 44,500 |
| Series 2008 A, 2.8% 9/6/24, LOC MUFG Bank Ltd., VRDN (b)(c) | | 35,000 | 35,000 |
TOTAL NEVADA | | | 131,180 |
| New Hampshire - 0.2% | | | |
| Nat'l. Fin. Auth. N H Health C Series 2024 C, 2.98% 9/6/24, LOC Truist Bank, VRDN (b) | | 7,000 | 7,000 |
| New York - 0.3% | | | |
| FHLMC New York Hsg. Fin. Agcy. Rev. (Theatre Row Tower Hsg. Proj.) Series 2001 A, 3.45% 9/6/24, LOC Freddie Mac, VRDN (b)(c) | | 10,000 | 10,000 |
| New York And New Jersey - 0.1% | | | |
| Port Auth. of New York & New Jersey: | | | |
| Series 1992 2, SIFMA Municipal Swap Index + 0.050% 2.97% 9/30/24, VRDN (b)(d)(e) | | 500 | 500 |
| Series 1995 4, SIFMA Municipal Swap Index + 0.080% 3% 9/30/24, VRDN (b)(c)(d)(e) | | 3,900 | 3,900 |
TOTAL NEW YORK AND NEW JERSEY | | | 4,400 |
| North Carolina - 0.2% | | | |
| Cumberland County Indl. Facilities & Poll. Cont. Fing. Auth. (Cargill, Inc. Proj.) Series 2022, 2.96% 9/6/24, VRDN (b)(c) | | 8,100 | 8,100 |
| Ohio - 0.4% | | | |
| Cuyahoga County Health Care Facilities Rev. (The A.M. McGregor Home Proj.) Series 2014, 2.96% 9/6/24, LOC Northern Trust Co., VRDN (b) | | 2,435 | 2,435 |
| Ohio Hsg. Fin. Agcy. Residential Mtg. Rev.: | | | |
| Series 2016 H, 3.6% 9/6/24 (Liquidity Facility Ohio Gen. Oblig.), VRDN (b)(c) | | 8,465 | 8,465 |
| Series 2016 I, 2.8% 9/6/24 (Liquidity Facility TD Banknorth, NA), VRDN (b)(c) | | 4,495 | 4,495 |
TOTAL OHIO | | | 15,395 |
| Oregon - 0.2% | | | |
| Portland Hsg. Auth. Rev.: | | | |
| (New Columbia - Cecelia Proj.) Series 2004, 2.97% 9/6/24, LOC Bank of America NA, VRDN (b)(c) | | 2,770 | 2,770 |
| (New Columbia - Trouton Proj.) Series 2005, 2.97% 9/6/24, LOC Bank of America NA, VRDN (b)(c) | | 4,010 | 4,010 |
TOTAL OREGON | | | 6,780 |
| South Carolina - 0.0% | | | |
| Darlington County Indl. Dev. Rev. (Nucor Corp. Proj.) Series 2003 A, 3.35% 9/6/24, VRDN (b)(c) | | 532 | 532 |
| Tennessee - 0.5% | | | |
| Henderson TN IDB Rev. (Arvin Sango, Inc. Proj.) Series 2012, 3.01% 9/6/24, LOC Bank of Tokyo-Mitsubishi UFJ Ltd., VRDN (b)(c) | | 10,000 | 10,000 |
| Indl. Dev. Board of Blount County and Cities of Alcoa and Maryville (Maryville Civic Arts Ctr. Proj.) Series 2009 B, 3.03% 9/6/24, LOC Truist Bank, VRDN (b) | | 2,165 | 2,165 |
| Loudon County Indl. Dev. Board Exempt Facilities Rev. (Kimberly-Clark Corp. Proj.) Series 1999, 3.2% 9/6/24, VRDN (b)(c) | | 7,100 | 7,100 |
TOTAL TENNESSEE | | | 19,265 |
| Texas - 3.7% | | | |
| Calhoun County Navigation District Envir. Facilities Rev. (Formosa Plastics Corp. Proj.) Series 2004, 3.1% 9/6/24, LOC Citibank NA, VRDN (b)(c) | | 8,600 | 8,600 |
| Calhoun Port Auth. Envir. Facilities Rev. Series 2007 A, 3% 9/6/24, LOC PNC Bank NA, VRDN (b)(c) | | 7,165 | 7,165 |
| Converse Hsg. Fin. Corp. Multi-family Hsg. Rev. (Town Square Apts. Proj.) Series 2007, 3.1% 9/6/24, LOC Citibank NA, VRDN (b)(c) | | 11,145 | 11,145 |
| Harris County Hosp. District Rev. Series 2010, 2.98% 9/6/24, LOC JPMorgan Chase Bank, VRDN (b) | | 4,400 | 4,400 |
| Jewett Econ. Dev. Corp. Indl. Dev. Rev. (Nucor Corp. Proj.) Series 2003, 3.2% 9/6/24, VRDN (b)(c) | | 12,600 | 12,600 |
| Lower Neches Valley Auth. Indl. Dev. Corp. Exempt Facilities Rev. (Onyx Envir. Svcs. Proj.) Series 2003, 3.04% 9/6/24, LOC Bank of America NA, VRDN (b)(c) | | 10,310 | 10,310 |
| Port Arthur Navigation District Indl. Dev. Corp. Exempt Facilities Rev. (Air Products Proj.) Series 2000, 3.14% 9/6/24, VRDN (b)(c) | | 10,000 | 10,000 |
| Port Arthur Navigation District Jefferson County Rev.: | | | |
| Series 2000 B, 2.87% 9/6/24 (TotalEnergies SE Guaranteed), VRDN (b)(c) | | 10,000 | 10,000 |
| Series 2022 B, 2.87% 9/6/24 (TotalEnergies SE Guaranteed), VRDN (b)(c) | | 10,000 | 10,000 |
| Texas Gen. Oblig.: | | | |
| Series 2003 A, 2.9% 9/6/24 (Liquidity Facility State Street Bank & Trust Co., Boston), VRDN (b)(c) | | 12,045 | 12,045 |
| Series 2006 D, 2.9% 9/6/24 (Liquidity Facility State Street Bank & Trust Co., Boston), VRDN (b)(c) | | 14,750 | 14,750 |
| Series 2013 A, 2.85% 9/6/24 (Liquidity Facility State Street Bank & Trust Co., Boston), VRDN (b) | | 3,695 | 3,695 |
| Series 2015 A, 2.85% 9/6/24 (Liquidity Facility State Street Bank & Trust Co., Boston), VRDN (b) | | 5,570 | 5,570 |
| FNMA: | | | |
| Harris County Hsg. Fin. Corp. Multi-family Hsg. Rev. (Primrose at Bammel Apts. Proj.) Series 2005, 3.02% 9/6/24, LOC Fannie Mae, VRDN (b)(c) | | 6,180 | 6,180 |
| Texas Dept. of Hsg. & Cmnty. Affairs Multi-family Hsg. Rev. (Residences at Sunset Pointe Proj.) Series 2006, 3.06% 9/6/24, LOC Fannie Mae, VRDN (b)(c) | | 13,705 | 13,705 |
TOTAL TEXAS | | | 140,165 |
| Utah - 0.4% | | | |
| Emery County Poll. Cont. Rev. (PacifiCorp Proj.) Series 1994, 3.6% 9/6/24, VRDN (b) | | 14,800 | 14,800 |
| Virginia - 0.6% | | | |
| Winchester Econ. Dev. Auth. Series 2024 B2, 3.08% 9/3/24, LOC Truist Bank, VRDN (b) | | 4,565 | 4,565 |
| FHLMC Arlington County Indl. Dev. Auth. Multi-family Hsg. Rev. Series 2011 A, 3% 9/6/24, LOC Freddie Mac, VRDN (b)(c) | | 17,150 | 17,150 |
TOTAL VIRGINIA | | | 21,715 |
| Washington - 1.1% | | | |
| FHLMC Washington Hsg. Fin. Commission Multi-family Hsg. Rev.: | | | |
| (Ballard Landmark Inn Proj.) Series 2015 A, 3.41% 9/6/24, LOC Fed. Home Ln. Bank, San Francisco, VRDN (b)(c) | | 31,590 | 31,590 |
| (The Lodge at Eagle Ridge Proj.) Series A, 3.06% 9/6/24, LOC Fed. Home Ln. Bank, San Francisco, VRDN (b)(c) | | 9,485 | 9,485 |
TOTAL WASHINGTON | | | 41,075 |
| West Virginia - 2.0% | | | |
| West Virginia Econ. Dev. Auth. Solid Waste Disp. Facilities Rev.: | | | |
| (Appalachian Pwr. Co. Amos Proj.) Series 2008 B, 2.97% 9/6/24, VRDN (b)(c) | | 36,475 | 36,475 |
| (Appalachian Pwr. Co.- Mountaineer Proj.) Series 2008 A, 3% 9/6/24, VRDN (b)(c) | | 39,900 | 39,900 |
TOTAL WEST VIRGINIA | | | 76,375 |
| Wisconsin - 1.4% | | | |
| Green Bay Redev. Auth. (Green Bay Packaging, Inc. Proj.) Series 2019, 3.05% 9/6/24, LOC Wells Fargo Bank NA, VRDN (b)(c)(f) | | 54,600 | 54,600 |
| Wyoming - 0.4% | | | |
| Laramie County Indl. Dev. Rev. (Cheyenne Lt., Fuel & Pwr. Co. Proj.) Series 2009 A, 3.03% 9/6/24, LOC Wells Fargo Bank NA, VRDN (b)(c) | | 10,000 | 10,000 |
| Lincoln County Poll. Cont. Rev. (PacifiCorp Proj.) Series 1994, 3.45% 9/6/24, VRDN (b) | | 1,200 | 1,200 |
| Sweetwater County Env Imp Rev. (Pacificorp Proj.) Series 1995, 3.5% 9/3/24, VRDN (b)(c) | | 2,500 | 2,500 |
TOTAL WYOMING | | | 13,700 |
| TOTAL VARIABLE RATE DEMAND NOTE (Cost $1,598,417) | | | 1,598,417 |
| | | | |
| Tender Option Bond - 32.0% |
| | | Principal Amount (a) (000s) | Value ($) (000s) |
| Alabama - 1.0% | | | |
| Black Belt Energy Gas District Participating VRDN: | | | |
| Series ZF 16 77, 2.97% 9/6/24 (Liquidity Facility Royal Bank of Canada) (b)(g)(h) | | 4,375 | 4,375 |
| Series ZL 05 09, 2.97% 9/6/24 (Liquidity Facility Royal Bank of Canada) (b)(g)(h) | | 4,515 | 4,515 |
| Energy Southeast Ala Coop. District Participating VRDN Series XM 11 72, 2.97% 9/6/24 (Liquidity Facility Royal Bank of Canada) (b)(g)(h) | | 2,000 | 2,000 |
| Huntsville Hosp. Participating VRDN Series XG 03 84, 2.96% 9/6/24 (Liquidity Facility Bank of America NA) (b)(g)(h) | | 1,910 | 1,910 |
| Jefferson County Swr. Rev. Participating VRDN Series XL 05 31, 2.96% 9/6/24 (Liquidity Facility Barclays Bank PLC) (b)(g)(h) | | 2,300 | 2,300 |
| Pittsburg WTSW Participating VRDN 2.95% 9/6/24 (Liquidity Facility JPMorgan Chase Bank) (b)(g)(h) | | 18,700 | 18,700 |
| Southeast Energy Auth. Rev. Participating VRDN Series XM 11 31, 2.97% 9/6/24 (Liquidity Facility Royal Bank of Canada) (b)(g)(h) | | 4,000 | 4,000 |
TOTAL ALABAMA | | | 37,800 |
| Arizona - 0.2% | | | |
| Arizona Indl. Dev. Auth. Hosp. Rev. Participating VRDN Series XM 10 13, 4.22% 9/3/24 (Liquidity Facility JPMorgan Chase Bank) (b)(g)(h) | | 750 | 750 |
| Mizuho Floater / Residual Trust V Participating VRDN: | | | |
| Floater MIZ 91 76, 3.24% 10/4/24 (Liquidity Facility Mizuho Cap. Markets LLC) (b)(d)(g)(h) | | 635 | 635 |
| Series Floater MIZ 91 87, 3.24% 10/4/24 (Liquidity Facility Mizuho Cap. Markets LLC) (b)(d)(g)(h) | | 1,810 | 1,810 |
| Phoenix Civic Impt. Board Arpt. Rev. Participating VRDN Series YX 12 72, 2.97% 9/6/24 (Liquidity Facility Barclays Bank PLC) (b)(c)(g)(h) | | 2,755 | 2,755 |
TOTAL ARIZONA | | | 5,950 |
| California - 0.0% | | | |
| San Francisco City & County Arpts. Commission Int'l. Arpt. Rev. Participating VRDN Series Floaters XL 01 01, 2.97% 9/6/24 (Liquidity Facility JPMorgan Chase Bank) (b)(c)(g)(h) | | 115 | 115 |
| Colorado - 1.5% | | | |
| Colorado Health Facilities Auth. Rev. Bonds Participating VRDN: | | | |
| Series 2023, 3.22% 10/4/24 (Liquidity Facility Barclays Bank PLC) (b)(g)(h) | | 6,475 | 6,475 |
| Series XF 30 40, 2.95% 9/6/24 (Liquidity Facility Barclays Bank PLC) (b)(g)(h) | | 2,625 | 2,625 |
| Series XG 02 51, 2.97% 9/6/24 (Liquidity Facility Bank of America NA) (b)(g)(h) | | 390 | 390 |
| Series XM 08 29, 2.95% 9/6/24 (Liquidity Facility Barclays Bank PLC) (b)(g)(h) | | 3,900 | 3,900 |
| Denver City & County Arpt. Rev. Participating VRDN: | | | |
| Series 2022 XX 12 60, 2.97% 9/6/24 (Liquidity Facility Barclays Bank PLC) (b)(c)(g)(h) | | 7,050 | 7,050 |
| Series 2022 XX 12 61, 2.97% 9/6/24 (Liquidity Facility Barclays Bank PLC) (b)(c)(g)(h) | | 3,750 | 3,750 |
| Series Floaters XG 01 96, 3% 9/6/24 (Liquidity Facility Toronto-Dominion Bank) (b)(c)(g)(h) | | 19,475 | 19,475 |
| Series XF 15 13, 3% 9/6/24 (Liquidity Facility Toronto-Dominion Bank) (b)(c)(g)(h) | | 8,560 | 8,560 |
| Series XM 11 51, 2.97% 9/6/24 (Liquidity Facility UBS AG) (b)(c)(g)(h) | | 3,750 | 3,750 |
| Series ZF 32 04, 2.97% 9/6/24 (Liquidity Facility Morgan Stanley Bank, West Valley City Utah) (b)(c)(g)(h) | | 2,120 | 2,120 |
TOTAL COLORADO | | | 58,095 |
| Connecticut - 2.5% | | | |
| Connecticut Gen. Oblig. Participating VRDN: | | | |
| Series Floaters 014, 2.96% 9/6/24 (Liquidity Facility Barclays Bank PLC) (b)(g)(h) | | 14,800 | 14,800 |
| Series Floaters 016, 2.96% 9/6/24 (Liquidity Facility Barclays Bank PLC) (b)(g)(h) | | 78,540 | 78,540 |
TOTAL CONNECTICUT | | | 93,340 |
| District Of Columbia - 0.1% | | | |
| Metropolitan Washington Arpts. Auth. Dulles Toll Road Rev. Participating VRDN: | | | |
| Series XF 09 20, 2.95% 9/6/24 (Liquidity Facility JPMorgan Chase Bank) (b)(g)(h) | | 2,145 | 2,145 |
| Series XG 02 67, 2.97% 9/6/24 (Liquidity Facility Bank of America NA) (b)(g)(h) | | 920 | 920 |
TOTAL DISTRICT OF COLUMBIA | | | 3,065 |
| Florida - 2.6% | | | |
| Broward County Arpt. Sys. Rev. Participating VRDN Series XG 04 43, 2.99% 9/6/24 (Liquidity Facility Royal Bank of Canada) (b)(c)(g)(h) | | 5,315 | 5,315 |
| Broward County Convention Ctr. Participating VRDN: | | | |
| Series XF 16 41, 3.02% 9/6/24 (Liquidity Facility JPMorgan Chase Bank) (b)(g)(h) | | 3,800 | 3,800 |
| Series XM 11 52, 4.22% 9/3/24 (Liquidity Facility JPMorgan Chase Bank) (b)(g)(h) | | 6,600 | 6,600 |
| County of Broward Tourist Dev. Tax Rev. Participating VRDN Series XL 04 29, 3.03% 9/6/24 (Liquidity Facility Wells Fargo Bank NA) (b)(g)(h) | | 900 | 900 |
| Florida Dev. Fin. Corp. Rev. Participating VRDN: | | | |
| Series XF 17 04, 2.97% 9/6/24 (Liquidity Facility Royal Bank of Canada) (b)(c)(g)(h) | | 18,055 | 18,055 |
| Series XG 05 77, 2.97% 9/6/24 (Liquidity Facility Barclays Bank PLC) (b)(c)(g)(h) | | 5,355 | 5,355 |
| Greater Orlando Aviation Auth. Arpt. Facilities Rev. Participating VRDN: | | | |
| Series XF 14 63, 3.02% 9/6/24 (Liquidity Facility Toronto-Dominion Bank) (b)(c)(g)(h) | | 1,205 | 1,205 |
| Series XL 04 30, 2.97% 9/6/24 (Liquidity Facility Barclays Bank PLC) (b)(c)(g)(h) | | 3,750 | 3,750 |
| Series ZF 32 25, 2.97% 9/6/24 (Liquidity Facility Morgan Stanley Bank, West Valley City Utah) (b)(c)(g)(h) | | 3,745 | 3,745 |
| Hillsborough County Aviation Auth. Rev. Participating VRDN Series XF 16 10, 2.97% 9/6/24 (Liquidity Facility JPMorgan Chase Bank) (b)(c)(g)(h) | | 5,455 | 5,455 |
| Hillsborough County Indl. Dev. Participating VRDN Series XG 04 67, 2.96% 9/6/24 (Liquidity Facility Barclays Bank PLC) (b)(g)(h) | | 3,055 | 3,055 |
| JEA Wtr. & Swr. Sys. Rev. Participating VRDN Series XF 16 91, 2.95% 9/6/24 (Liquidity Facility JPMorgan Chase Bank) (b)(g)(h) | | 2,500 | 2,500 |
| Lee County Arpt. Rev. Participating VRDN: | | | |
| Series XF 11 26, 3% 9/6/24 (Liquidity Facility Toronto-Dominion Bank) (b)(c)(g)(h) | | 3,195 | 3,195 |
| Series XF 15 23, 2.98% 9/6/24 (Liquidity Facility Royal Bank of Canada) (b)(c)(g)(h) | | 2,430 | 2,430 |
| Miami-Dade County Participating VRDN Series XF 11 59, 3% 9/6/24 (Liquidity Facility Toronto-Dominion Bank) (b)(c)(g)(h) | | 6,310 | 6,310 |
| Miami-Dade County Aviation Rev. Participating VRDN Series XX 13 22, 2.97% 9/6/24 (Liquidity Facility Barclays Bank PLC) (b)(c)(g)(h) | | 4,090 | 4,090 |
| Miami-Dade County Edl. Facilities Rev. Participating VRDN Series Floaters XG 01 92, 2.96% 9/6/24 (Liquidity Facility Royal Bank of Canada) (b)(g)(h) | | 5,900 | 5,900 |
| Miami-Dade County Expressway Auth. Participating VRDN Series Floaters XG 02 52, 2.97% 9/6/24 (Liquidity Facility Bank of America NA) (b)(g)(h) | | 6,100 | 6,100 |
| Palm Beach County Health Facilities Auth. Hosp. Rev. Participating VRDN Series XG 03 70, 3.02% 9/6/24 (Liquidity Facility Bank of America NA) (b)(g)(h) | | 2,380 | 2,380 |
| South Broward Hosp. District Rev. Participating VRDN Series XG 03 45, 2.95% 9/6/24 (Liquidity Facility Wells Fargo Bank NA) (b)(g)(h) | | 3,300 | 3,300 |
| South Miami Health Facilities Auth. Hosp. Rev. Participating VRDN Series YX 12 86, 2.99% 9/6/24 (Liquidity Facility Barclays Bank PLC) (b)(g)(h) | | 3,600 | 3,600 |
| Tampa Health Sys. Rev. Participating VRDN Series XF 31 46, 2.97% 9/6/24 (Liquidity Facility Wells Fargo Bank NA) (b)(g)(h) | | 2,300 | 2,300 |
TOTAL FLORIDA | | | 99,340 |
| Georgia - 1.4% | | | |
| Burke County Indl. Dev. Auth. Poll. Cont. Rev. Participating VRDN: | | | |
| Series E 155, 2.96% 9/6/24 (Liquidity Facility Royal Bank of Canada) (b)(g)(h) | | 19,400 | 19,400 |
| Series Floaters E 107, 2.97% 9/6/24 (Liquidity Facility Royal Bank of Canada) (b)(g)(h) | | 14,800 | 14,800 |
| Fulton County Dev. Auth. Rev. Participating VRDN Series XL 02 68, 3.02% 9/6/24 (Liquidity Facility Bank of America NA) (b)(g)(h) | | 990 | 990 |
| Georgia Muni. Elec. Auth. Pwr. Rev. Participating VRDN: | | | |
| Series XF 31 06, 2.96% 9/6/24 (Liquidity Facility Barclays Bank PLC) (b)(g)(h) | | 8,070 | 8,070 |
| Series XG 04 70, 2.97% 9/6/24 (Liquidity Facility Bank of America NA) (b)(g)(h) | | 6,925 | 6,925 |
| Muni. Elec. Auth. of Georgia Participating VRDN Series XG 02 54, 2.97% 9/6/24 (Liquidity Facility Bank of America NA) (b)(g)(h) | | 3,880 | 3,880 |
TOTAL GEORGIA | | | 54,065 |
| Hawaii - 0.6% | | | |
| Hawaii Arpts. Sys. Rev. Participating VRDN: | | | |
| Series XX 12 17, 2.97% 9/6/24 (Liquidity Facility Barclays Bank PLC) (b)(c)(g)(h) | | 16,635 | 16,635 |
| Series YX 12 52, 2.97% 9/6/24 (Liquidity Facility Barclays Bank PLC) (b)(c)(g)(h) | | 5,895 | 5,895 |
TOTAL HAWAII | | | 22,530 |
| Idaho - 0.1% | | | |
| Idaho Hsg. & Fin. Assoc. Single Family Mtg. Participating VRDN Series XG 05 65, 2.97% 9/6/24 (Liquidity Facility Barclays Bank PLC) (b)(g)(h) | | 2,130 | 2,130 |
| Illinois - 5.4% | | | |
| Chicago Gen. Oblig. Participating VRDN: | | | |
| Series 2022 XF 30 42, 2.96% 9/6/24 (Liquidity Facility Barclays Bank PLC) (b)(g)(h) | | 19,900 | 19,900 |
| Series 2022 XF 30 45, 2.96% 9/6/24 (Liquidity Facility Barclays Bank PLC) (b)(g)(h) | | 7,750 | 7,750 |
| Series Floaters XL 01 05, 2.96% 9/6/24 (Liquidity Facility Barclays Bank PLC) (b)(g)(h) | | 4,400 | 4,400 |
| Series XX 12 64, 2.96% 9/6/24 (Liquidity Facility Barclays Bank PLC) (b)(g)(h) | | 7,055 | 7,055 |
| Chicago O'Hare Int'l. Arpt. Rev. Participating VRDN: | | | |
| Series Floaters XF 07 23, 2.96% 9/6/24 (Liquidity Facility JPMorgan Chase Bank) (b)(c)(g)(h) | | 20,560 | 20,560 |
| Series Floaters XG 02 19, 2.96% 9/6/24 (Liquidity Facility JPMorgan Chase Bank) (b)(c)(g)(h) | | 1,820 | 1,820 |
| Series XF 14 30, 2.99% 9/6/24 (Liquidity Facility Royal Bank of Canada) (b)(c)(g)(h) | | 2,810 | 2,810 |
| Series XX 12 43, 2.96% 9/6/24 (Liquidity Facility Barclays Bank PLC) (b)(c)(g)(h) | | 5,625 | 5,625 |
| Series XX 12 45, 2.96% 9/6/24 (Liquidity Facility Barclays Bank PLC) (b)(c)(g)(h) | | 10,500 | 10,500 |
| Chicago Transit Auth. Participating VRDN Series XL 01 45, 2.96% 9/6/24 (Liquidity Facility Barclays Bank PLC) (b)(g)(h) | | 1,180 | 1,180 |
| Illinois Fin. Auth. Participating VRDN: | | | |
| Series BAML 50 45, 3% 9/6/24 (Liquidity Facility Bank of America NA) (b)(g)(h) | | 25,500 | 25,500 |
| Series BAML 50 47, 3% 9/6/24 (Liquidity Facility Bank of America NA) (b)(g)(h) | | 22,100 | 22,100 |
| Series XF 30 36, 2.95% 9/6/24 (Liquidity Facility Morgan Stanley Bank, West Valley City Utah) (b)(g)(h) | | 4,000 | 4,000 |
| Illinois Fin. Auth. Rev. Participating VRDN: | | | |
| Series 2022 ZL 03 54, 2.95% 9/6/24 (Liquidity Facility Morgan Stanley Bank, West Valley City Utah) (b)(g)(h) | | 2,500 | 2,500 |
| Series Floaters 017, 3.22% 10/4/24 (Liquidity Facility Barclays Bank PLC) (b)(g)(h) | | 11,100 | 11,100 |
| Series XF 07 11, 2.95% 9/6/24 (Liquidity Facility JPMorgan Chase Bank) (b)(g)(h) | | 11,050 | 11,050 |
| Series XG 04 50, 2.95% 9/6/24 (Liquidity Facility Wells Fargo Bank NA) (b)(g)(h) | | 3,465 | 3,465 |
| Series YX 12 26, 2.95% 9/6/24 (Liquidity Facility Barclays Bank PLC) (b)(g)(h) | | 9,150 | 9,150 |
| Illinois Gen. Oblig. Participating VRDN: | | | |
| Series XF 10 10, 2.95% 9/6/24 (Liquidity Facility Barclays Bank PLC) (b)(g)(h) | | 5,800 | 5,800 |
| Series XM 07 59, 2.97% 9/6/24 (Liquidity Facility Bank of America NA) (b)(g)(h) | | 1,125 | 1,125 |
| Series XM 10 48, 2.97% 9/6/24 (Liquidity Facility Bank of America NA) (b)(g)(h) | | 11,185 | 11,185 |
| Series XM 10 49, 2.97% 9/6/24 (Liquidity Facility Bank of America NA) (b)(g)(h) | | 1,850 | 1,850 |
| Series YX 13 27, 2.95% 9/6/24 (Liquidity Facility Barclays Bank PLC) (b)(g)(h) | | 5,590 | 5,590 |
| Illinois Hsg. Dev. Auth. Participating VRDN Series 2023, 2.95% 9/6/24 (Liquidity Facility Citibank NA) (b)(g)(h) | | 2,500 | 2,500 |
| Illinois Toll Hwy. Auth. Toll Hwy. Rev. Participating VRDN: | | | |
| Series 15 XF0277, 2.98% 9/6/24 (Liquidity Facility JPMorgan Chase Bank) (b)(g)(h) | | 2,400 | 2,400 |
| Series XF 14 22, 2.97% 9/6/24 (Liquidity Facility Royal Bank of Canada) (b)(g)(h) | | 2,670 | 2,670 |
| Series ZF 31 56, 2.95% 9/6/24 (Liquidity Facility Morgan Stanley Bank, West Valley City Utah) (b)(g)(h) | | 2,165 | 2,165 |
| Metropolitan Pier & Exposition Participating VRDN Series Floaters XF 10 45, 2.98% 9/6/24 (Liquidity Facility Barclays Bank PLC) (b)(g)(h) | | 1,300 | 1,300 |
TOTAL ILLINOIS | | | 207,050 |
| Iowa - 0.2% | | | |
| Iowa Fin. Auth. Rev. Participating VRDN Series BC 240 03, 3.17% 10/4/24 (Liquidity Facility Barclays Bank PLC) (b)(g)(h) | | 7,000 | 7,000 |
| Kansas - 0.1% | | | |
| Univ. of Kansas Hosp. Auth. Health Facilities Rev. Participating VRDN Series XL 04 74, 2.95% 9/6/24 (Liquidity Facility Wells Fargo Bank NA) (b)(g)(h) | | 4,300 | 4,300 |
| Kentucky - 0.1% | | | |
| CommonSpirit Health Participating VRDN Series MIZ 90 21, 3.02% 9/6/24 (Liquidity Facility Mizuho Cap. Markets LLC) (b)(g)(h) | | 2,135 | 2,135 |
| Kentucky Bd Dev. Corp. Indl. Bldg. Participating VRDN Series XM 11 41, 2.97% 9/6/24 (Liquidity Facility Royal Bank of Canada) (b)(g)(h) | | 3,000 | 3,000 |
TOTAL KENTUCKY | | | 5,135 |
| Louisiana - 0.1% | | | |
| New Orleans Aviation Board Rev. Participating VRDN Series XF 31 48, 2.97% 9/6/24 (Liquidity Facility Barclays Bank PLC) (b)(c)(g)(h) | | 4,500 | 4,500 |
| Maryland - 0.1% | | | |
| Maryland Health & Higher Edl. Facilities Auth. Rev. Participating VRDN Series XF 31 52, 2.96% 9/6/24 (Liquidity Facility Barclays Bank PLC) (b)(g)(h) | | 2,800 | 2,800 |
| Montgomery County Gen. Oblig. Participating VRDN Series Floaters XG 02 15, 2.96% 9/6/24 (Liquidity Facility Bank of America NA) (b)(g)(h) | | 825 | 825 |
TOTAL MARYLAND | | | 3,625 |
| Michigan - 0.1% | | | |
| Gerald R. Ford Int'l. Arpt. Auth. Rev. Participating VRDN Series XF 17 17, 3% 9/6/24 (Liquidity Facility Toronto-Dominion Bank) (b)(c)(g)(h) | | 2,700 | 2,700 |
| Mclaren Health Care Corp. Participating VRDN Series XL 02 71, 3.02% 9/6/24 (Liquidity Facility Bank of America NA) (b)(g)(h) | | 2,380 | 2,380 |
TOTAL MICHIGAN | | | 5,080 |
| Minnesota - 0.2% | | | |
| Minnesota Hsg. Fin. Agcy. Participating VRDN Series XF 28 79, 2.95% 9/6/24 (Liquidity Facility Morgan Stanley Bank, West Valley City Utah) (b)(g)(h) | | 3,865 | 3,865 |
| Mizuho Floater / Residual Trust V Participating VRDN Series Floater MIZ 91 86, 3.24% 10/4/24 (Liquidity Facility Mizuho Cap. Markets LLC) (b)(d)(g)(h) | | 2,000 | 2,000 |
TOTAL MINNESOTA | | | 5,865 |
| Missouri - 2.2% | | | |
| Kansas City Indl. Dev. Auth. Participating VRDN: | | | |
| Series XG 03 96, 3% 9/6/24 (Liquidity Facility Toronto-Dominion Bank) (b)(c)(g)(h) | | 10,000 | 10,000 |
| Series XG 04 02, 3% 9/6/24 (Liquidity Facility Toronto-Dominion Bank) (b)(c)(g)(h) | | 5,920 | 5,920 |
| Series XG 04 79, 3% 9/6/24 (Liquidity Facility Toronto-Dominion Bank) (b)(c)(g)(h) | | 3,025 | 3,025 |
| Series XL 04 58, 2.97% 9/6/24 (Liquidity Facility Barclays Bank PLC) (b)(c)(g)(h) | | 3,840 | 3,840 |
| Kansas City Spl. Oblig. Participating VRDN Series YX 11 93, 2.96% 9/6/24 (Liquidity Facility Barclays Bank PLC) (b)(g)(h) | | 2,900 | 2,900 |
| Missouri Health & Edl. Facilities Auth. Rev. Participating VRDN Series Floaters C16, 2.97% 9/6/24 (Liquidity Facility Royal Bank of Canada) (b)(g)(h) | | 34,100 | 34,100 |
| Missouri Health & Edl. Facilities Rev.: | | | |
| Bonds Series 2023 G 121, 3.12%, tender 12/2/24 (Liquidity Facility Royal Bank of Canada) (b)(g)(h) | | 1,100 | 1,100 |
| Participating VRDN Series 2024, 2.95% 9/6/24 (Liquidity Facility Royal Bank of Canada) (b)(g)(h) | | 5,200 | 5,200 |
| Pittsburg WTSW Participating VRDN 2.95% 9/6/24 (Liquidity Facility JPMorgan Chase Bank) (b)(g)(h) | | 9,595 | 9,595 |
| RBC Muni. Products, Inc. Trust Participating VRDN 2.96% 9/6/24 (Liquidity Facility Royal Bank of Canada) (b)(g)(h) | | 4,200 | 4,200 |
| St Louis County Spl. Oblig. Participating VRDN Series XG 03 82, 2.95% 9/6/24 (Liquidity Facility Wells Fargo Bank NA) (b)(g)(h) | | 2,240 | 2,240 |
TOTAL MISSOURI | | | 82,120 |
| Nebraska - 0.0% | | | |
| Central Plains Energy Proj. Rev. Participating VRDN Series 2022 ZL 03 01, 2.97% 9/6/24 (Liquidity Facility Royal Bank of Canada) (b)(g)(h) | | 335 | 335 |
| Nevada - 0.3% | | | |
| Clark County School District Participating VRDN Series XF 14 73, 3.04% 9/6/24 (Liquidity Facility JPMorgan Chase Bank) (b)(g)(h) | | 1,495 | 1,495 |
| Clark County Wtr. Reclamation District Participating VRDN Series XG 05 11, 2.95% 9/6/24 (Liquidity Facility Bank of America NA) (b)(g)(h) | | 9,000 | 9,000 |
TOTAL NEVADA | | | 10,495 |
| New Jersey - 1.1% | | | |
| New Jersey Econ. Dev. Auth. Rev. Participating VRDN: | | | |
| Series Floaters XF 23 93, 2.96% 9/6/24 (Liquidity Facility Barclays Bank PLC) (b)(g)(h) | | 1,750 | 1,750 |
| Series Floaters XL 00 52, 2.96% 9/6/24 (Liquidity Facility Barclays Bank PLC) (b)(g)(h) | | 3,525 | 3,525 |
| New Jersey Hsg. & Mtg. Fin. Agcy. Multi-family Rev. Participating VRDN Series Floater 2024, 3.17% 10/4/24 (Liquidity Facility Barclays Bank PLC) (b)(g)(h) | | 13,600 | 13,600 |
| New Jersey Tpk. Auth. Tpk. Rev. Participating VRDN: | | | |
| Series 2022 XF 04 09, 2.95% 9/6/24 (Liquidity Facility Wells Fargo Bank NA) (b)(g)(h) | | 4,200 | 4,200 |
| Series XM 10 96, 2.97% 9/6/24 (Liquidity Facility Royal Bank of Canada) (b)(g)(h) | | 3,500 | 3,500 |
| New Jersey Trans. Trust Fund Auth. Participating VRDN: | | | |
| Series Floaters XG 02 05, 2.96% 9/6/24 (Liquidity Facility Barclays Bank PLC) (b)(g)(h) | | 1,900 | 1,900 |
| Series Floaters XX 10 93, 2.96% 9/6/24 (Liquidity Facility Barclays Bank PLC) (b)(g)(h) | | 3,900 | 3,900 |
| Series XX 13 29, 2.96% 9/6/24 (Liquidity Facility Barclays Bank PLC) (b)(g)(h) | | 4,250 | 4,250 |
| Series YX 12 68, 2.96% 9/6/24 (Liquidity Facility Barclays Bank PLC) (b)(g)(h) | | 3,500 | 3,500 |
TOTAL NEW JERSEY | | | 40,125 |
| New York - 2.7% | | | |
| New York Metropolitan Trans. Auth. Rev. Participating VRDN: | | | |
| Series XF 28 68, 2.96% 9/6/24 (Liquidity Facility Barclays Bank PLC) (b)(g)(h) | | 7,000 | 7,000 |
| Series XF 28 78, 2.96% 9/6/24 (Liquidity Facility Barclays Bank PLC) (b)(g)(h) | | 2,000 | 2,000 |
| Series XF 30 00, 2.96% 9/6/24 (Liquidity Facility Barclays Bank PLC) (b)(g)(h) | | 10,000 | 10,000 |
| Series XG 02 90, 2.96% 9/6/24 (Liquidity Facility Barclays Bank PLC) (b)(g)(h) | | 16,420 | 16,420 |
| Series XX 11 56, 2.96% 9/6/24 (Liquidity Facility Barclays Bank PLC) (b)(g)(h) | | 9,165 | 9,165 |
| New York Trans. Dev. Corp. Participating VRDN Series 2022 E 154, 3.02% 9/6/24 (Liquidity Facility Royal Bank of Canada) (b)(c)(g)(h) | | 57,925 | 57,925 |
TOTAL NEW YORK | | | 102,510 |
| New York And New Jersey - 0.1% | | | |
| Port Auth. of New York & New Jersey Participating VRDN Series YX 11 78, 2.99% 9/6/24 (Liquidity Facility Barclays Bank PLC) (b)(c)(g)(h) | | 5,625 | 5,625 |
| North Carolina - 0.3% | | | |
| Charlotte Int'l. Arpt. Rev. Participating VRDN Series XG 05 27, 3.01% 9/6/24 (Liquidity Facility Bank of America NA) (b)(c)(g)(h) | | 4,800 | 4,800 |
| Greater Asheville Reg'l. Arpt. Auth. Participating VRDN: | | | |
| Series XF 15 32, 3% 9/6/24 (Liquidity Facility Toronto-Dominion Bank) (b)(c)(g)(h) | | 2,330 | 2,330 |
| Series XM 10 11, 2.99% 9/6/24 (Liquidity Facility Royal Bank of Canada) (b)(c)(g)(h) | | 5,700 | 5,700 |
TOTAL NORTH CAROLINA | | | 12,830 |
| Ohio - 0.8% | | | |
| CommonSpirit Health Participating VRDN Series MIZ 90 20, 3.02% 9/6/24 (Liquidity Facility Mizuho Cap. Markets LLC) (b)(g)(h) | | 1,570 | 1,570 |
| Cuyahoga County Ctfs. of Prtn. Participating VRDN Series Floaters XG 02 06, 3.02% 9/6/24 (Liquidity Facility Bank of America NA) (b)(g)(h) | | 7,400 | 7,400 |
| Middletown Hosp. Facilities Rev. Participating VRDN 3.25% 9/3/24 (Liquidity Facility Bank of America NA) (b)(g)(h) | | 2,700 | 2,700 |
| Montgomery County Hosp. Rev. Participating VRDN Series XX 12 48, 2.96% 9/6/24 (Liquidity Facility Barclays Bank PLC) (b)(g)(h) | | 5,400 | 5,400 |
| Ohio Hosp. Rev. Participating VRDN: | | | |
| Series C18, 2.96% 9/6/24 (Liquidity Facility Royal Bank of Canada) (b)(g)(h) | | 2,400 | 2,400 |
| Series XG 04 90, 2.96% 9/6/24 (Liquidity Facility Barclays Bank PLC) (b)(g)(h) | | 2,610 | 2,610 |
| Ohio Hsg. Fin. Agcy. Residential Mtg. Rev. Participating VRDN Series XL 05 40, 2.95% 9/6/24 (Liquidity Facility JPMorgan Chase Bank) (b)(g)(h) | | 3,500 | 3,500 |
| RBC Muni. Products, Inc. Trust Participating VRDN Series 2023, 2.96% 9/6/24 (Liquidity Facility Royal Bank of Canada) (b)(g)(h) | | 5,000 | 5,000 |
TOTAL OHIO | | | 30,580 |
| Oregon - 0.1% | | | |
| Port of Portland Arpt. Rev. Participating VRDN Series ZF 17 28, 3.02% 9/6/24 (Liquidity Facility Bank of America NA) (b)(c)(g)(h) | | 2,395 | 2,395 |
| Pennsylvania - 2.5% | | | |
| Allegheny County Arpt. Auth. Rev. Participating VRDN: | | | |
| Series XF 16 34, 2.98% 9/6/24 (Liquidity Facility Royal Bank of Canada) (b)(c)(g)(h) | | 2,670 | 2,670 |
| Series XG 05 41, 2.98% 9/6/24 (Liquidity Facility Royal Bank of Canada) (b)(c)(g)(h) | | 12,075 | 12,075 |
| Commonwealth Fing. Auth. Tobacco Participating VRDN Series XX 10 80, 2.96% 9/6/24 (Liquidity Facility Barclays Bank PLC) (b)(g)(h) | | 2,700 | 2,700 |
| Lehigh County Gen. Purp. Hosp. Rev. Participating VRDN: | | | |
| Series BAML 23 50 39, 3% 10/4/24 (Liquidity Facility Bank of America NA) (b)(d)(g)(h) | | 5,740 | 5,740 |
| Series XF 15 11, 2.96% 9/6/24 (Liquidity Facility Toronto-Dominion Bank) (b)(g)(h) | | 2,855 | 2,855 |
| Mizuho Floater / Residual Trust V Participating VRDN Floater MIZ 91 77, 3.24% 10/4/24 (Liquidity Facility Mizuho Cap. Markets LLC) (b)(d)(g)(h) | | 1,565 | 1,565 |
| Montgomery County Higher Ed. & Health Auth. Rev. Participating VRDN: | | | |
| Series XG 05 28, 2.96% 9/6/24 (Liquidity Facility Toronto-Dominion Bank) (b)(g)(h) | | 1,875 | 1,875 |
| Series XG 05 50, 2.95% 9/6/24 (Liquidity Facility Royal Bank of Canada) (b)(g)(h) | | 2,185 | 2,185 |
| Pennsylvania Econ. Dev. Fing. Auth. Participating VRDN: | | | |
| Series XG 04 37, 2.97% 9/6/24 (Liquidity Facility Barclays Bank PLC) (b)(c)(g)(h) | | 26,995 | 26,995 |
| Series XM 10 83, 3% 9/6/24 (Liquidity Facility Royal Bank of Canada) (b)(c)(g)(h) | | 7,470 | 7,470 |
| Pennsylvania Higher Edl. Facilities Auth. Rev. Participating VRDN: | | | |
| Series Floater BA ML 24, 3.3% 9/3/24 (Liquidity Facility Bank of America NA) (b)(g)(h) | | 9,200 | 9,200 |
| Series XG 02 63, 2.95% 9/6/24 (Liquidity Facility Bank of America NA) (b)(g)(h) | | 390 | 390 |
| Pennsylvania State Univ. Participating VRDN Series XM 08 27, 2.95% 9/6/24 (Liquidity Facility JPMorgan Chase Bank) (b)(g)(h) | | 3,100 | 3,100 |
| Philadelphia Arpt. Rev. Participating VRDN Series YX 12 11, 2.97% 9/6/24 (Liquidity Facility Barclays Bank PLC) (b)(c)(g)(h) | | 12,545 | 12,545 |
| Philadelphia Wtr. & Wastewtr. Rev. Participating VRDN Series XF 16 06, 2.96% 9/6/24 (Liquidity Facility Toronto-Dominion Bank) (b)(g)(h) | | 4,400 | 4,400 |
TOTAL PENNSYLVANIA | | | 95,765 |
| South Carolina - 0.4% | | | |
| South Carolina Ports Auth. Ports Rev. Participating VRDN Series XG 05 52, 2.98% 9/6/24 (Liquidity Facility Royal Bank of Canada) (b)(c)(g)(h) | | 2,590 | 2,590 |
| South Carolina Pub. Svc. Auth. Rev. Participating VRDN: | | | |
| Series 2017 XF 2425, 2.96% 9/6/24 (Liquidity Facility Barclays Bank PLC) (b)(g)(h) | | 100 | 100 |
| Series Floaters XG 02 09, 2.96% 9/6/24 (Liquidity Facility Toronto-Dominion Bank) (b)(g)(h) | | 4,410 | 4,410 |
| Series XL 04 18, 2.96% 9/6/24 (Liquidity Facility Barclays Bank PLC) (b)(g)(h) | | 6,195 | 6,195 |
TOTAL SOUTH CAROLINA | | | 13,295 |
| Tennessee - 0.3% | | | |
| Metropolitan Govt. Nashville & Davidson County Health & Edl. Facilities Board Participating VRDN Series MIZ 91 81, 3.24% 10/4/24 (Liquidity Facility Mizuho Cap. Markets LLC) (b)(d)(g)(h) | | 1,300 | 1,300 |
| Metropolitan Nashville Arpt. Auth. Rev. Participating VRDN: | | | |
| Series XL 03 82, 2.99% 9/6/24 (Liquidity Facility Royal Bank of Canada) (b)(c)(g)(h) | | 3,090 | 3,090 |
| Series XL 04 40, 2.98% 9/6/24 (Liquidity Facility Royal Bank of Canada) (b)(c)(g)(h) | | 2,440 | 2,440 |
| Series YX 12 89, 2.97% 9/6/24 (Liquidity Facility Barclays Bank PLC) (b)(c)(g)(h) | | 3,300 | 3,300 |
TOTAL TENNESSEE | | | 10,130 |
| Texas - 1.6% | | | |
| Austin Arpt. Sys. Rev. Participating VRDN: | | | |
| Series XG 05 73, 3% 9/6/24 (Liquidity Facility Toronto-Dominion Bank) (b)(c)(g)(h) | | 3,460 | 3,460 |
| Series YX 11 99, 2.97% 9/6/24 (Liquidity Facility Barclays Bank PLC) (b)(c)(g)(h) | | 6,500 | 6,500 |
| Bastrop Independent School District Participating VRDN Series XF 15 78, 2.96% 9/6/24 (Liquidity Facility Toronto-Dominion Bank) (b)(g)(h) | | 4,800 | 4,800 |
| El Paso Wtr. & Swr. Rev. Bonds Series G 124, 3.12%, tender 9/3/24 (Liquidity Facility Royal Bank of Canada) (b)(d)(e)(g)(h) | | 1,205 | 1,205 |
| Harris County Cultural Ed. Facilities Fin. Corp. Rev. Participating VRDN Series XF 32 03, 3.07% 9/6/24 (Liquidity Facility Wells Fargo Bank NA) (b)(g)(h) | | 4,000 | 4,000 |
| Houston Arpt. Sys. Rev. Participating VRDN Series XF 31 26, 2.97% 9/6/24 (Liquidity Facility Barclays Bank PLC) (b)(c)(g)(h) | | 13,900 | 13,900 |
| Humble Independent School District Participating VRDN Series XF 14 48, 2.95% 9/6/24 (Liquidity Facility Bank of America NA) (b)(g)(h) | | 2,050 | 2,050 |
| Medina Valley Texas Independent School District Participating VRDN Series XG 05 05, 2.96% 9/6/24 (Liquidity Facility Toronto-Dominion Bank) (b)(g)(h) | | 4,000 | 4,000 |
| Mizuho Floater / Residual Trust V Participating VRDN Series Floater MIZ 91 85, 3.24% 10/4/24 (Liquidity Facility Mizuho Cap. Markets LLC) (b)(d)(g)(h) | | 1,900 | 1,900 |
| North Ft. Bend Wtr. Auth. Participating VRDN Series XL 04 22, 3.03% 9/6/24 (Liquidity Facility Wells Fargo Bank NA) (b)(g)(h) | | 2,300 | 2,300 |
| Tarrant County Cultural Ed. Facilities Fin. Corp. Hosp. Rev. Participating VRDN Series XG 04 21, 2.97% 9/6/24 (Liquidity Facility Bank of America NA) (b)(g)(h) | | 725 | 725 |
| Texas Gen. Oblig. Participating VRDN Series MS 3390, 2.96% 9/6/24 (Liquidity Facility Toronto-Dominion Bank) (b)(g)(h) | | 1,000 | 1,000 |
| Texas Muni. Gas Acquisition & Supply Corp. Participating VRDN Series XM 11 54, 2.97% 9/6/24 (Liquidity Facility Royal Bank of Canada) (b)(g)(h) | | 2,180 | 2,180 |
| Texas Private Activity Bond Surface Trans. Corp. Participating VRDN Series XM 11 23, 2.99% 9/6/24 (Liquidity Facility Royal Bank of Canada) (b)(c)(g)(h) | | 4,200 | 4,200 |
| Texas Wtr. Dev. Board Rev.: | | | |
| Bonds Series MS 00 17, 3.07%, tender 10/17/24 (Liquidity Facility Morgan Stanley Bank, West Valley City Utah) (b)(d)(g)(h) | | 2,665 | 2,665 |
| Participating VRDN: | | | |
Series XF 13 29, 2.96% 9/6/24 (Liquidity Facility Toronto-Dominion Bank) (b)(g)(h) | | 5,000 | 5,000 |
Series XG 05 30, 2.95% 9/6/24 (Liquidity Facility Wells Fargo Bank NA) (b)(g)(h) | | 2,600 | 2,600 |
TOTAL TEXAS | | | 62,485 |
| Utah - 0.9% | | | |
| Salt Lake City Arpt. Rev. Participating VRDN: | | | |
| Series XF 15 50, 3% 9/6/24 (Liquidity Facility Toronto-Dominion Bank) (b)(c)(g)(h) | | 6,885 | 6,885 |
| Series XL 04 57, 2.97% 9/6/24 (Liquidity Facility Barclays Bank PLC) (b)(c)(g)(h) | | 2,700 | 2,700 |
| Series XL 04 59, 2.97% 9/6/24 (Liquidity Facility Barclays Bank PLC) (b)(c)(g)(h) | | 17,185 | 17,185 |
| Series XM 11 46, 2.97% 9/6/24 (Liquidity Facility UBS AG) (b)(c)(g)(h) | | 4,250 | 4,250 |
| Series XX 12 49, 2.97% 9/6/24 (Liquidity Facility Barclays Bank PLC) (b)(c)(g)(h) | | 4,840 | 4,840 |
TOTAL UTAH | | | 35,860 |
| Virginia - 1.0% | | | |
| Chesapeake Bay Bridge and Tunnel District Gen. Resolution Rev. Participating VRDN Series XF 30 64, 2.96% 9/6/24 (Liquidity Facility Barclays Bank PLC) (b)(g)(h) | | 5,300 | 5,300 |
| Norfolk Econ. Dev. Health Care Facilities Participating VRDN Series 2022 C19, 2.96% 9/6/24 (Liquidity Facility Royal Bank of Canada) (b)(g)(h) | | 2,500 | 2,500 |
| Suffolk Econ. Dev. Auth. Hosp. Facilities Rev. Participating VRDN Series MIZ 90 25, 3.02% 9/6/24 (Liquidity Facility Mizuho Cap. Markets LLC) (b)(g)(h) | | 21,245 | 21,245 |
| Univ. of Virginia Gen. Rev. Participating VRDN Series XG 04 08, 2.95% 9/6/24 (Liquidity Facility Morgan Stanley Bank, West Valley City Utah) (b)(g)(h) | | 3,375 | 3,375 |
| Virginia Small Bus. Fing. Auth. Participating VRDN Series XF 32 17, 2.97% 9/6/24 (Liquidity Facility Barclays Bank PLC) (b)(c)(g)(h) | | 7,200 | 7,200 |
TOTAL VIRGINIA | | | 39,620 |
| Washington - 1.4% | | | |
| Barclays Bank PLC Participating VRDN Series YX 12 41, 2.99% 9/6/24 (Liquidity Facility Barclays Bank PLC) (b)(c)(g)(h) | | 5,825 | 5,825 |
| Central Puget Sound Reg'l. Trans. Auth. Sales & Use Tax Rev. Bonds Series G 123, 3.12%, tender 11/1/24 (Liquidity Facility Royal Bank of Canada) (b)(d)(g)(h) | | 800 | 800 |
| CommonSpirit Health Participating VRDN Series XF 1017, 2.95% 9/6/24 (Liquidity Facility Barclays Bank PLC) (b)(g)(h) | | 1,000 | 1,000 |
| Port of Seattle Rev. Participating VRDN: | | | |
| Series 2022 ZF 30 68, 2.97% 9/6/24 (Liquidity Facility Morgan Stanley Bank, West Valley City Utah) (b)(c)(g)(h) | | 2,700 | 2,700 |
| Series XF 13 71, 4.25% 9/3/24 (Liquidity Facility JPMorgan Chase Bank) (b)(c)(g)(h) | | 4,300 | 4,300 |
| Series XF 15 99, 2.99% 9/6/24 (Liquidity Facility Royal Bank of Canada) (b)(c)(g)(h) | | 7,360 | 7,360 |
| Series XF 17 30, 3.02% 9/6/24 (Liquidity Facility JPMorgan Chase Bank) (b)(c)(g)(h) | | 1,800 | 1,800 |
| Series XM 08 75, 3.02% 9/6/24 (Liquidity Facility JPMorgan Chase Bank) (b)(c)(g)(h) | | 2,030 | 2,030 |
| Series XM 10 27, 3.06% 9/6/24 (Liquidity Facility JPMorgan Chase Bank) (b)(c)(g)(h) | | 800 | 800 |
| Series ZF 17 38, 2.99% 9/6/24 (Liquidity Facility Bank of America NA) (b)(c)(g)(h) | | 1,100 | 1,100 |
| Series ZF 17 39, 2.99% 9/6/24 (Liquidity Facility Bank of America NA) (b)(c)(g)(h) | | 1,320 | 1,320 |
| Series ZL 05 13, 2.97% 9/6/24 (Liquidity Facility Morgan Stanley Bank, West Valley City Utah) (b)(c)(g)(h) | | 2,745 | 2,745 |
| Washington Convention Ctr. Pub. Facilities Participating VRDN Series 2022 XX 12 38, 2.96% 9/6/24 (Liquidity Facility Barclays Bank PLC) (b)(g)(h) | | 4,000 | 4,000 |
| Washington Gen. Oblig. Participating VRDN: | | | |
| Series 2022 ZF 14 03, 2.95% 9/6/24 (Liquidity Facility JPMorgan Chase Bank) (b)(g)(h) | | 1,675 | 1,675 |
| Series 2023, 2.97% 9/6/24 (Liquidity Facility Citibank NA) (b)(g)(h) | | 5,550 | 5,550 |
| Washington Health Care Facilities Auth. Rev. Participating VRDN: | | | |
| Series 2015 XF0150, 2.97% 9/6/24 (Liquidity Facility Bank of America NA) (b)(g)(h) | | 2,950 | 2,950 |
| Series XF 30 62, 2.96% 9/6/24 (Liquidity Facility Barclays Bank PLC) (b)(g)(h) | | 2,300 | 2,300 |
| Series XG 04 75, 2.96% 9/6/24 (Liquidity Facility Toronto-Dominion Bank) (b)(g)(h) | | 5,285 | 5,285 |
TOTAL WASHINGTON | | | 53,540 |
| TOTAL TENDER OPTION BOND (Cost $1,216,695) | | | 1,216,695 |
| | | | |
| Other Municipal Security - 21.0% |
| | | Principal Amount (a) (000s) | Value ($) (000s) |
| Arizona - 0.1% | | | |
| Phoenix Civic Impt. Board Arpt. Rev. Bonds: | | | |
| Series 2019 B, 5% 7/1/25 (c) | | 535 | 540 |
| Series 2023, 5% 7/1/25 (c) | | 1,000 | 1,010 |
| Salt River Proj. Agricultural Impt. & Pwr. District Elec. Sys. Rev. Series 2024 C, 3.6% 3/4/25, CP | | 2,300 | 2,300 |
TOTAL ARIZONA | | | 3,850 |
| California - 0.9% | | | |
| San Francisco City & County Pub. Util. Commission Wastewtr. Rev. Series 2024 A1, 3.65% 9/17/24, LOC Sumitomo Mitsui Banking Corp., CP | | 16,300 | 16,300 |
| Santa Clara Valley Wtr. District Series 2024 A, 3.65% 9/5/24, LOC MUFG Bank Ltd., CP | | 4,900 | 4,900 |
| Univ. of California Revs. Series 2024, 3.85% 11/14/24, CP | | 13,100 | 13,100 |
TOTAL CALIFORNIA | | | 34,300 |
| Colorado - 0.2% | | | |
| Denver City & County Arpt. Rev. Bonds: | | | |
| Series 2022 A, 5% 11/15/24 (c) | | 1,695 | 1,699 |
| Series 2022 D, 5% 11/15/24 (c) | | 5,185 | 5,196 |
| El Paso County Co. Scd # 012 Bonds Series 2015, 5% 9/15/24 (Pre-Refunded to 9/15/24 @ 100) | | 600 | 600 |
TOTAL COLORADO | | | 7,495 |
| Connecticut - 0.5% | | | |
| Connecticut Gen. Oblig. Bonds Series 2022 D, 5% 9/15/24 | | 500 | 500 |
| Danbury Gen. Oblig. BAN Series 2024, 5% 9/24/24 (f) | | 12,500 | 12,510 |
| East Lyme Gen. Oblig. BAN Series 2024, 4.15% 8/7/25 | | 2,300 | 2,312 |
| New London BAN Series 2024, 4.5% 3/13/25 | | 3,700 | 3,718 |
TOTAL CONNECTICUT | | | 19,040 |
| District Of Columbia - 0.7% | | | |
| Metropolitan Washington DC Arpts. Auth. Sys. Rev. Bonds: | | | |
| Series 2014 A, 5% 10/1/24 (c) | | 1,745 | 1,747 |
| Series 2017 A, 5% 10/1/24 (c) | | 12,580 | 12,591 |
| Series 2018 A, 5% 10/1/24 (c) | | 2,000 | 2,002 |
| Series 2019 A, 5% 10/1/24 (c) | | 3,100 | 3,103 |
| Series 2020 A, 5% 10/1/24 (c) | | 7,730 | 7,737 |
| Series 2022 A, 5% 10/1/24 (c) | | 250 | 250 |
TOTAL DISTRICT OF COLUMBIA | | | 27,430 |
| Florida - 3.1% | | | |
| Greater Orlando Aviation Auth. Arpt. Facilities Rev. Bonds: | | | |
| Series 2015, 4% 10/1/24 (c) | | 3,870 | 3,871 |
| Series 2019 A, 5% 10/1/24 (c) | | 425 | 425 |
| Series 2022 A, 5% 10/1/24 (c) | | 1,380 | 1,381 |
| Hillsborough County Aviation Auth. Rev. Bonds: | | | |
| Series 2015 A, 5% 10/1/24 (Pre-Refunded to 10/1/24 @ 100) (c) | | 1,000 | 1,001 |
| Series 2015 B: | | | |
5% 10/1/24 (Pre-Refunded to 10/1/24 @ 100) (c) | | 2,145 | 2,147 |
5% 10/1/24 (Pre-Refunded to 10/1/24 @ 100) | | 1,750 | 1,752 |
| Miami-Dade County School Board Ctfs. of Prtn. Bonds Series 2015 D, 5% 2/1/25 | | 750 | 754 |
| Miami-Dade County Wtr. & Swr. Rev. Bonds Series 2015, 5% 10/1/24 | | 1,785 | 1,787 |
| Palm Beach County Health Facilities Auth. Hosp. Rev. Bonds Series 2014, 5% 12/1/24 (Pre-Refunded to 12/1/24 @ 100) | | 700 | 702 |
| Polk County Indl. Dev. Auth. Health Sys. Rev. Bonds: | | | |
| Series 2014 A, 0.000% x SIFMA Municipal Swap Index 3.22%, tender 3/28/25 (b)(e) | | 28,200 | 28,200 |
| Series 2014 A1, SIFMA Municipal Swap Index + 0.250% 3.17%, tender 3/28/25 (b)(e) | | 28,900 | 28,900 |
| Tampa Bay Wtr. Reg'l. Wtr. Supply Auth. Util. Sys. Rev. Bonds Series 2005, 5.5% 10/1/24 | | 6,465 | 6,475 |
| Tampa Health Sys. Rev. Bonds Series 2012 B, SIFMA Municipal Swap Index + 0.300% 3.22%, tender 9/23/24 (b)(e) | | 42,015 | 42,015 |
TOTAL FLORIDA | | | 119,410 |
| Georgia - 0.1% | | | |
| Atlanta Arpt. Rev. Series 2024, 3.42% 11/22/24, LOC JPMorgan Chase Bank, CP (c) | | 2,523 | 2,523 |
| Illinois - 1.5% | | | |
| Cook County Gen. Oblig. Bonds Series 2021 A, 5% 11/15/24 | | 840 | 842 |
| Illinois Fin. Auth. Rev. Bonds: | | | |
| (Advocate Health Care Network Proj.) Series 2011 B, SIFMA Municipal Swap Index + 0.300% 3.25%, tender 3/28/25 (b)(e) | | 40,690 | 40,690 |
| Series 2015, 5.25% 5/15/25 (Pre-Refunded to 5/15/25 @ 100) | | 530 | 535 |
| Illinois Gen. Oblig. Bonds: | | | |
| Series 2017 A, 5% 12/1/24 | | 160 | 160 |
| Series 2017 D, 5% 11/1/24 | | 9,660 | 9,676 |
| Series 2018 A, 6% 5/1/25 | | 600 | 608 |
| Series 2018 B, 5% 10/1/24 | | 405 | 405 |
| Series 2019 A, 5% 11/1/24 | | 600 | 601 |
| Series 2020 D, 5% 10/1/24 | | 1,700 | 1,702 |
| Series 2021 A, 5% 3/1/25 | | 310 | 312 |
| Series 2021 B, 5% 3/1/25 | | 175 | 176 |
| Series 2022 B, 5% 3/1/25 | | 140 | 141 |
TOTAL ILLINOIS | | | 55,848 |
| Kansas - 0.3% | | | |
| City of Lawrence Kansas Gen. Oblig. BAN Series 2024 I, 4.5% 5/1/25 | | 9,300 | 9,363 |
| Wichita Gen. Oblig. BAN Series 2023, 5% 10/15/24 | | 2,880 | 2,884 |
TOTAL KANSAS | | | 12,247 |
| Kentucky - 0.1% | | | |
| Kentucky Asset/Liability Commission Gen. Fund Rev. Bonds Series 2021 A, 5% 11/1/24 | | 2,375 | 2,380 |
| Kentucky State Property & Buildings Commission Rev. Bonds Series 2016 B, 5% 11/1/24 | | 500 | 501 |
TOTAL KENTUCKY | | | 2,881 |
| Louisiana - 0.0% | | | |
| Louisiana Gas & Fuel Tax Rev. Bonds Series A, 4.5% 5/1/25 (Pre-Refunded to 5/1/25 @ 100) | | 575 | 579 |
| Maryland - 0.2% | | | |
| Montgomery County Gen. Oblig. Bonds Series 2013 MD, 3.7%, tender 9/3/24 (b) | | 6,635 | 6,635 |
| Massachusetts - 0.8% | | | |
| Ashland Gen. Oblig. BAN Series 2023, 5% 10/10/24 | | 5,100 | 5,106 |
| East Longmeadow Gen. Oblig. BAN Series 2024, 5% 1/30/25 | | 3,900 | 3,923 |
| Framingham Gen. Oblig. BAN Series 2024, 4.5% 12/19/24 | | 4,300 | 4,310 |
| Gloucester Gen. Oblig. BAN Series 2024, 4.75% 9/13/24 | | 6,500 | 6,502 |
| Groton BAN Series 2024, 4.5% 6/20/25 | | 5,700 | 5,740 |
| Nantucket Gen. Oblig. BAN Series 2024 B, 4.5% 3/21/25 | | 6,181 | 6,211 |
TOTAL MASSACHUSETTS | | | 31,792 |
| Michigan - 0.6% | | | |
| Kent Hosp. Fin. Auth. Hosp. Facilities Rev. Bonds (Spectrum Health Sys. Proj.) Series 2015 A, SIFMA Municipal Swap Index + 0.250% 3.17%, tender 3/28/25 (b)(e) | | 18,445 | 18,445 |
| Michigan Fin. Auth. Rev. Bonds: | | | |
| Series 2013 M1, 3.7%, tender 9/3/24 (b) | | 4,985 | 4,985 |
| Series 2019 MI2, 5%, tender 2/1/25 (b) | | 735 | 740 |
TOTAL MICHIGAN | | | 24,170 |
| Nebraska - 0.3% | | | |
| Omaha Pub. Pwr. District Elec. Rev. Series 2024 A: | | | |
| 3.6% 10/23/24, CP | | 3,300 | 3,300 |
| 3.65% 9/9/24, CP | | 1,700 | 1,700 |
| 3.65% 10/2/24, CP | | 2,300 | 2,300 |
| 3.68% 10/16/24, CP | | 3,500 | 3,500 |
TOTAL NEBRASKA | | | 10,800 |
| New Jersey - 1.2% | | | |
| Branchburg Township BAN: | | | |
| Series 2023, 5% 10/10/24 | | 3,600 | 3,604 |
| Series 2024 A, 4.5% 4/24/25 | | 4,700 | 4,727 |
| Cedar Grove Township Gen. Oblig. BAN Series 2024, 4.5% 6/26/25 | | 3,200 | 3,221 |
| Clifton Gen. Oblig. BAN Series 2024 A, 4.5% 5/21/25 | | 2,300 | 2,312 |
| Cranford Township Gen. Oblig. BAN Series 2024, 4% 8/22/25 | | 2,300 | 2,314 |
| East Brunswick Township Gen. Oblig. BAN Series 2024 B, 4% 7/15/25 | | 1,395 | 1,402 |
| Glassboro Gen. Oblig. BAN Series 2024 A, 4.25% 5/30/25 | | 2,800 | 2,815 |
| Ho & Ho Kus BAN Series 2024, 4.75% 5/1/25 | | 1,000 | 1,005 |
| Jefferson Township Gen. Oblig. BAN Series 2024, 4.5% 6/13/25 | | 5,000 | 5,030 |
| Metuchen Gen. Oblig. BAN Series 2024 A, 4.5% 7/9/25 | | 5,000 | 5,038 |
| Monmouth County Impt. Auth. Rev. BAN Series 2024, 4% 3/14/25 (Monmouth County Guaranteed) | | 445 | 446 |
| New Jersey Trans. Trust Fund Auth. Bonds Series A, 5% 12/15/24 | | 1,400 | 1,405 |
| Old Bridge Township Gen. Oblig. BAN Series 2024, 4% 9/5/25 (i) | | 3,000 | 3,025 |
| Point Pleasant Gen. Oblig. BAN Series 2024, 4% 8/29/25 | | 1,800 | 1,812 |
| Springfield Township Gen. Oblig. BAN Series 2024, 4.75% 5/1/25 | | 2,000 | 2,011 |
| Tenafly BAN Series 2024, 4.5% 5/22/25 | | 3,000 | 3,018 |
| West Milford Township Gen. Oblig. BAN Series 2024, 4% 9/12/25 (i) | | 4,100 | 4,134 |
TOTAL NEW JERSEY | | | 47,319 |
| New York - 2.8% | | | |
| Broome County Gen. Oblig. BAN Series 2024, 4.5% 4/25/25 | | 18,842 | 18,938 |
| Burnt Hills Ballston Lake NY BAN Series 2024, 4.5% 6/20/25 | | 6,300 | 6,344 |
| Corning School District Gen. Oblig. BAN Series 2024 B, 4.5% 6/20/25 | | 6,700 | 6,748 |
| East Syracuse-Minoa Central School District BAN Series 2024, 4.5% 7/11/25 | | 3,100 | 3,122 |
| Harrison Cent School District BAN Series 2024, 4.5% 7/25/25 | | 2,300 | 2,319 |
| Kenmore-Tonawanda Union Free School District BAN Series 2024, 4.5% 6/26/25 | | 6,700 | 6,747 |
| Lancaster Gen. Oblig. BAN Series 2024, 4.5% 7/18/25 | | 3,600 | 3,630 |
| Mahopac Cent Scd BAN Series 2024, 4.5% 7/25/25 | | 4,600 | 4,637 |
| New Windsor N Y BAN Series 2024, 4.5% 6/27/25 | | 2,100 | 2,114 |
| New York Pwr. Auth. Series 2024, 3.65% 9/4/24, CP | | 11,700 | 11,700 |
| Ossining Village BAN Series 2024, 4% 9/18/25 (i) | | 6,700 | 6,764 |
| Port Jervis NY City School District BAN Series 2024, 4.5% 6/27/25 | | 2,100 | 2,114 |
| Sachem Central School District of Holbrook TAN Series 2024, 4.5% 6/20/25 | | 16,500 | 16,625 |
| Saratoga County Gen. Oblig. BAN Series 2023, 5% 9/20/24 | | 14,500 | 14,510 |
TOTAL NEW YORK | | | 106,312 |
| Ohio - 0.1% | | | |
| Kings Local School District BAN Series 2024, 4.5% 7/16/25 | | 1,200 | 1,208 |
| Ohio Gen. Oblig. Bonds Series 2015 A, 5% 9/15/24 | | 880 | 880 |
TOTAL OHIO | | | 2,088 |
| Oregon - 0.1% | | | |
| Multnomah County Hosp. Facilities Auth. Rev. Bonds (Mirabella at South Waterfront Proj.) Series 2014 A, 5.5% 10/1/24 (Pre-Refunded to 10/1/24 @ 100) | | 3,200 | 3,205 |
| Oregon Dept. of Trans. Hwy. User Tax Rev. Bonds Series 2015 A, 5% 11/15/24 (Pre-Refunded to 11/15/24 @ 100) | | 1,170 | 1,173 |
| Port of Portland Arpt. Rev. Bonds Series 2019 25B, 5% 7/1/25 (c) | | 120 | 121 |
TOTAL OREGON | | | 4,499 |
| Pennsylvania - 0.1% | | | |
| Commonwealth Fing. Auth. Tobacco Bonds Series 2018, 5% 6/1/25 | | 500 | 505 |
| Montgomery County Indl. Dev. Auth. Bonds Series 2015 A: | | | |
| 5.25% 1/15/25 (Pre-Refunded to 1/15/25 @ 100) | | 520 | 523 |
| 5.25% 1/15/25 (Pre-Refunded to 1/15/25 @ 100) | | 810 | 814 |
| Pennsylvania Gen. Oblig. Bonds Series 2016, 5% 9/15/24 | | 1,700 | 1,701 |
| Philadelphia Wtr. Series 2024 C, 3.85% 9/10/24, LOC The Toronto-Dominion Bank, CP | | 1,000 | 1,000 |
TOTAL PENNSYLVANIA | | | 4,543 |
| South Carolina - 0.4% | | | |
| Anderson County School District No. 004 BAN Series 2024, 4% 3/27/25 | | 15,620 | 15,664 |
| Tennessee - 0.3% | | | |
| Memphis Gen. Oblig. Series 2024 A: | | | |
| 3.67% 9/25/24 (Liquidity Facility TD Banknorth, NA), CP | | 5,800 | 5,800 |
| 3.75% 9/10/24 (Liquidity Facility TD Banknorth, NA), CP | | 5,700 | 5,700 |
TOTAL TENNESSEE | | | 11,500 |
| Texas - 5.3% | | | |
| Dallas Gen. Oblig. Bonds Series 2024 B: | | | |
| 5% 2/15/25 | | 5,285 | 5,321 |
| 5% 2/15/25 | | 7,300 | 7,351 |
| Dallas Independent School District Bonds Series 2015, 4% 2/15/25 (Pre-Refunded to 2/15/25 @ 100) | | 500 | 501 |
| Harris County Cultural Ed. Facilities Fin. Corp. Rev. Bonds: | | | |
| Series 2014 A, 5% 12/1/24 | | 1,300 | 1,304 |
| Series 2020 C2, 5%, tender 9/24/24 (b) | | 500 | 501 |
| Series 2024 B1, 3.67% tender 9/24/24, CP mode | | 7,400 | 7,400 |
| Series 2024 B2, 3.67% tender 9/24/24, CP mode | | 9,000 | 9,000 |
| Series 2024 B3, 3.7% tender 9/24/24, CP mode | | 1,700 | 1,700 |
| Lubbock Cooper Independent School District Bonds Series 2015, 5% 2/15/25 (Pre-Refunded to 2/15/25 @ 100) | | 935 | 941 |
| Port Arthur Independent School District Bonds Series 2015 A, 5% 2/15/25 (Pre-Refunded to 2/15/25 @ 100) | | 565 | 569 |
| Tarrant County Cultural Ed. Facilities Fin. Corp. Hosp. Rev. Bonds (Baylor Health Care Sys. Proj.): | | | |
| Series 2011 B, SIFMA Municipal Swap Index + 0.300% 3.25%, tender 3/28/25 (b)(e) | | 31,700 | 31,700 |
| Series 2013 B, SIFMA Municipal Swap Index + 0.300% 3.25%, tender 3/28/25 (b)(e) | | 31,000 | 31,000 |
| Texas Gen. Oblig. Bonds Series 2014 A, 5% 10/1/24 (Pre-Refunded to 10/1/24 @ 100) | | 1,755 | 1,757 |
| Texas Pub. Fin. Auth. Rev. Series 2024 B, 3.52% 9/19/24 (Liquidity Facility Texas Gen. Oblig.), CP | | 17,000 | 17,000 |
| Univ. of Texas Board of Regents Sys. Rev. Series 2024 A: | | | |
| 3.45% 9/19/24 (Liquidity Facility Univ. of Texas Invt. Mgmt. Co.), CP | | 6,200 | 6,200 |
| 3.45% 9/20/24 (Liquidity Facility Univ. of Texas Invt. Mgmt. Co.), CP | | 4,500 | 4,500 |
| 3.45% 10/16/24 (Liquidity Facility Univ. of Texas Invt. Mgmt. Co.), CP | | 4,700 | 4,700 |
| 3.48% 10/15/24 (Liquidity Facility Univ. of Texas Invt. Mgmt. Co.), CP | | 3,100 | 3,100 |
| 3.5% 10/17/24 (Liquidity Facility Univ. of Texas Invt. Mgmt. Co.), CP | | 4,250 | 4,250 |
| 3.6% 11/20/24 (Liquidity Facility Univ. of Texas Invt. Mgmt. Co.), CP | | 6,000 | 6,000 |
| 3.61% 9/16/24 (Liquidity Facility Univ. of Texas Invt. Mgmt. Co.), CP | | 5,800 | 5,800 |
| 3.62% 11/19/24 (Liquidity Facility Univ. of Texas Invt. Mgmt. Co.), CP | | 6,000 | 6,000 |
| 3.65% 9/9/24 (Liquidity Facility Univ. of Texas Invt. Mgmt. Co.), CP | | 5,800 | 5,800 |
| 3.65% 9/10/24 (Liquidity Facility Univ. of Texas Invt. Mgmt. Co.), CP | | 4,600 | 4,600 |
| 3.65% 9/11/24 (Liquidity Facility Univ. of Texas Invt. Mgmt. Co.), CP | | 4,600 | 4,600 |
| 3.65% 9/12/24 (Liquidity Facility Univ. of Texas Invt. Mgmt. Co.), CP | | 3,500 | 3,500 |
| 3.65% 9/12/24 (Liquidity Facility Univ. of Texas Invt. Mgmt. Co.), CP | | 2,900 | 2,900 |
| 3.65% 10/3/24 (Liquidity Facility Univ. of Texas Invt. Mgmt. Co.), CP | | 2,300 | 2,300 |
| 3.65% 10/7/24 (Liquidity Facility Univ. of Texas Invt. Mgmt. Co.), CP | | 5,800 | 5,800 |
| 3.85% 9/4/24 (Liquidity Facility Univ. of Texas Invt. Mgmt. Co.), CP | | 6,000 | 6,000 |
| 3.85% 9/5/24 (Liquidity Facility Univ. of Texas Invt. Mgmt. Co.), CP | | 2,400 | 2,400 |
| Univ. of Texas Permanent Univ. Fund Rev. Series 2024 A: | | | |
| 3.65% 9/5/24, CP | | 5,800 | 5,800 |
| 3.65% 9/18/24, CP | | 1,700 | 1,700 |
TOTAL TEXAS | | | 201,995 |
| Vermont - 0.1% | | | |
| Vermont Econ. Dev. Auth. Rev. Series 2024 D, 4.05% 9/12/24, LOC JPMorgan Chase Bank, CP (c) | | 2,500 | 2,500 |
| Washington - 0.4% | | | |
| King County Pub. Hosp. District #2 Bonds Series 2015 B, 5% 12/1/24 (Pre-Refunded to 12/1/24 @ 100) | | 875 | 878 |
| Port of Seattle Rev. Bonds: | | | |
| Series 2015 B, 5% 11/12/24 (Pre-Refunded to 11/12/24 @ 100) | | 1,500 | 1,502 |
| Series 2018 A, 5% 5/1/25 (c) | | 5,250 | 5,307 |
| Series 2021, 5% 9/1/24 (c) | | 250 | 250 |
| Series 2024 B, 5% 7/1/25 (c) | | 6,000 | 6,071 |
TOTAL WASHINGTON | | | 14,008 |
| Wisconsin - 0.8% | | | |
| Madison Metropolitan School District TRAN Series 2023, 5% 9/3/24 | | 8,600 | 8,601 |
| Wisconsin Gen. Oblig.: | | | |
| Series 2024 EXT, 3.8% 2/10/25, CP | | 3,188 | 3,188 |
| Series 2024: | | | |
3.6% 5/19/25, CP | | 7,708 | 7,708 |
3.8% 3/10/25, CP | | 2,300 | 2,300 |
3.8% 3/10/25, CP | | 7,000 | 7,000 |
TOTAL WISCONSIN | | | 28,797 |
| TOTAL OTHER MUNICIPAL SECURITY (Cost $798,225) | | | 798,225 |
| | | | |
| Investment Company - 4.3% |
| | | Shares | Value ($) (000s) |
Fidelity Municipal Cash Central Fund 3.22% (j)(k) (Cost $165,221) | | 165,187 | 165,221 |
| | | | |
| TOTAL INVESTMENT IN SECURITIES - 99.4% (Cost $3,778,558) | 3,778,558 |
NET OTHER ASSETS (LIABILITIES) - 0.6% | 22,595 |
| NET ASSETS - 100.0% | 3,801,153 |
| | |
Security Type Abbreviations
| BAN | - | BOND ANTICIPATION NOTE |
| CP | - | COMMERCIAL PAPER |
| TAN | - | TAX ANTICIPATION NOTE |
| TRAN | - | TAX AND REVENUE ANTICIPATION NOTE |
| VRDN | - | VARIABLE RATE DEMAND NOTE (A debt instrument that is payable upon demand, either daily, weekly or monthly) |
The date shown for securities represents the date when principal payments must be paid, taking into account any call options exercised by the issuer and any permissible maturity shortening features other than interest rate resets.
Any values shown as $0 in the Schedule of Investments may reflect amounts less than $500.
Legend
| (a) | Amount is stated in United States dollars unless otherwise noted. |
| (b) | Coupon rates for floating and adjustable rate securities reflect the rates in effect at period end. |
| (c) | Private activity obligations whose interest is subject to the federal alternative minimum tax for individuals. |
| (d) | Restricted securities (including private placements) - Investment in securities not registered under the Securities Act of 1933 (excluding 144A issues). At the end of the period, the value of restricted securities (excluding 144A issues) amounted to $24,020,000 or 0.6% of net assets. |
| (e) | Coupon is indexed to a floating interest rate which may be multiplied by a specified factor and/or subject to caps or floors. |
| (f) | Security exempt from registration under Rule 144A of the Securities Act of 1933. These securities may be resold in transactions exempt from registration, normally to qualified institutional buyers. At the end of the period, the value of these securities amounted to $67,110,000 or 1.8% of net assets. |
| (g) | Provides evidence of ownership in one or more underlying municipal bonds. |
| (h) | Coupon rates are determined by re-marketing agents based on current market conditions. |
| (i) | Security or a portion of the security purchased on a delayed delivery or when-issued basis. |
| (j) | Information in this report regarding holdings by state and security types does not reflect the holdings of the Fidelity Municipal Cash Central Fund. |
| (k) | Affiliated fund that is generally available only to investment companies and other accounts managed by Fidelity Investments. The rate quoted is the annualized seven-day yield of the fund at period end. A complete unaudited listing of the fund's holdings as of its most recent quarter end is available upon request. In addition, each Fidelity Central Fund's financial statements, which are not covered by the Fund's Report of Independent Registered Public Accounting Firm, are available on the SEC's website or upon request. |
| Additional information on each restricted holding is as follows: |
| Security | Acquisition Date | Cost ($) (000s) |
| Central Puget Sound Reg'l. Trans. Auth. Sales & Use Tax Rev. Bonds Series G 123, 3.12%, tender 11/1/24 (Liquidity Facility Royal Bank of Canada) | 5/01/24 | 800 |
| | | |
| El Paso Wtr. & Swr. Rev. Bonds Series G 124, 3.12%, tender 9/3/24 (Liquidity Facility Royal Bank of Canada) | 3/01/24 | 1,205 |
| | | |
| Lehigh County Gen. Purp. Hosp. Rev. Participating VRDN Series BAML 23 50 39, 3% 10/4/24 (Liquidity Facility Bank of America NA) | 5/04/23 - 3/28/24 | 5,740 |
| | | |
| Metropolitan Govt. Nashville & Davidson County Health & Edl. Facilities Board Participating VRDN Series MIZ 91 81, 3.24% 10/4/24 (Liquidity Facility Mizuho Cap. Markets LLC) | 7/11/24 | 1,300 |
| | | |
| Mizuho Floater / Residual Trust V Participating VRDN Floater MIZ 91 76, 3.24% 10/4/24 (Liquidity Facility Mizuho Cap. Markets LLC) | 6/20/24 | 635 |
| | | |
| Mizuho Floater / Residual Trust V Participating VRDN Floater MIZ 91 77, 3.24% 10/4/24 (Liquidity Facility Mizuho Cap. Markets LLC) | 6/20/24 | 1,565 |
| | | |
| Mizuho Floater / Residual Trust V Participating VRDN Series Floater MIZ 91 85, 3.24% 10/4/24 (Liquidity Facility Mizuho Cap. Markets LLC) | 8/21/24 | 1,900 |
| | | |
| Mizuho Floater / Residual Trust V Participating VRDN Series Floater MIZ 91 86, 3.24% 10/4/24 (Liquidity Facility Mizuho Cap. Markets LLC) | 8/21/24 | 2,000 |
| | | |
| Mizuho Floater / Residual Trust V Participating VRDN Series Floater MIZ 91 87, 3.24% 10/4/24 (Liquidity Facility Mizuho Cap. Markets LLC) | 8/21/24 | 1,810 |
| | | |
| Port Auth. of New York & New Jersey Series 1992 2, SIFMA Municipal Swap Index + 0.050% 2.97% 9/30/24, VRDN | 7/15/20 | 500 |
| | | |
| Port Auth. of New York & New Jersey Series 1995 4, SIFMA Municipal Swap Index + 0.080% 3% 9/30/24, VRDN | 8/17/20 | 3,900 |
| | | |
| Texas Wtr. Dev. Board Rev. Bonds Series MS 00 17, 3.07%, tender 10/17/24 (Liquidity Facility Morgan Stanley Bank, West Valley City Utah) | 10/12/23 - 8/05/24 | 2,665 |
| | | |
Affiliated Central Funds
Fiscal year to date information regarding the Fund's investments in Fidelity Central Funds, including the ownership percentage, is presented below.
| Affiliate (Amounts in thousands) | Value, beginning of period ($) | Purchases ($) | Sales Proceeds ($) | Dividend Income ($) | Realized Gain (loss) ($) | Change in Unrealized appreciation (depreciation) ($) | Value, end of period ($) | % ownership, end of period |
| Fidelity Municipal Cash Central Fund 3.22% | 6,590 | 1,761,073 | 1,602,441 | 3,138 | (1) | - | 165,221 | 6.9% |
| Total | 6,590 | 1,761,073 | 1,602,441 | 3,138 | (1) | - | 165,221 | |
| | | | | | | | | |
Amounts in the dividend income column in the above table include any capital gain distributions from underlying funds, which are presented in the corresponding line item in the Statement of Operations, if applicable.
Amounts included in the purchases and sales proceeds columns may include in-kind transactions, if applicable.
Investment Valuation
All investments are categorized as Level 2 under the Fair Value Hierarchy. The inputs or methodology used for valuing securities may not be an indication of the risk associated with investing in these securities. For more information on valuation inputs, refer to the Investment Valuation section in the accompanying Notes to Financial Statements.
Financial Statements
| Statement of Assets and Liabilities |
As of August 31, 2024 Amounts in thousands (except per-share amount) |
| Assets | | | | |
| Investment in securities, at value - See accompanying schedule: | | | | |
Unaffiliated issuers (cost $3,613,337) | $ | 3,613,337 | | |
Fidelity Central Funds (cost $165,221) | | 165,221 | | |
| | | | | |
| | | | | |
| Total Investment in Securities (cost $3,778,558) | | | $ | 3,778,558 |
| Receivable for securities sold on a delayed delivery basis | | | | 15,255 |
| Receivable for fund shares sold | | | | 3,568 |
| Interest receivable | | | | 23,342 |
| Distributions receivable from Fidelity Central Funds | | | | 495 |
| Prepaid expenses | | | | 6 |
Total assets | | | | 3,821,224 |
| Liabilities | | | | |
| Payable to custodian bank | $ | 10 | | |
| Payable for investments purchased on a delayed delivery basis | | 13,923 | | |
| Payable for fund shares redeemed | | 4,097 | | |
| Distributions payable | | 747 | | |
| Accrued management fee | | 1,237 | | |
| Other payables and accrued expenses | | 57 | | |
| Total liabilities | | | | 20,071 |
| Net Assets | | | $ | 3,801,153 |
| Net Assets consist of: | | | | |
| Paid in capital | | | $ | 3,801,337 |
| Total accumulated earnings (loss) | | | | (184) |
| Net Assets | | | $ | 3,801,153 |
Net Asset Value, offering price and redemption price per share ($3,801,153 ÷ 3,795,682 shares) | | | $ | 1.00 |
| Statement of Operations |
| Year ended August 31, 2024 Amounts in thousands |
| Investment Income | | | | |
| Interest | | | $ | 136,055 |
| Income from Fidelity Central Funds | | | | 3,138 |
| Total income | | | | 139,193 |
| Expenses | | | | |
| Management fee | $ | 12,181 | | |
| Transfer agent fees | | 2,970 | | |
| Accounting fees and expenses | | 169 | | |
| Custodian fees and expenses | | 38 | | |
| Independent trustees' fees and expenses | | 12 | | |
| Registration fees | | 115 | | |
| Audit fees | | 46 | | |
| Legal | | 4 | | |
| Miscellaneous | | 13 | | |
| Total expenses before reductions | | 15,548 | | |
| Expense reductions | | (130) | | |
| Total expenses after reductions | | | | 15,418 |
| Net Investment income (loss) | | | | 123,775 |
| Realized and Unrealized Gain (Loss) | | | | |
| Net realized gain (loss) on: | | | | |
| Investment Securities: | | | | |
| Unaffiliated issuers | | 95 | | |
| Fidelity Central Funds | | (1) | | |
| Total net realized gain (loss) | | | | 94 |
| Net increase in net assets resulting from operations | | | $ | 123,869 |
| Statement of Changes in Net Assets |
| |
| Amount in thousands | | Year ended August 31, 2024 | | Year ended August 31, 2023 |
| Increase (Decrease) in Net Assets | | | | |
| Operations | | | | |
| Net investment income (loss) | $ | 123,775 | $ | 101,775 |
| Net realized gain (loss) | | 94 | | 43 |
Net increase in net assets resulting from operations | | 123,869 | | 101,818 |
| Distributions to shareholders | | (125,699) | | (101,791) |
| | | | | |
| Share transactions | | | | |
| Proceeds from sales of shares | | 2,135,303 | | 1,800,019 |
| Reinvestment of distributions | | 116,155 | | 94,454 |
| Cost of shares redeemed | | (2,261,053) | | (2,204,182) |
| | | | | |
Net increase (decrease) in net assets and shares resulting from share transactions | | (9,595) | | (309,709) |
| Total increase (decrease) in net assets | | (11,425) | | (309,682) |
| | | | | |
| Net Assets | | | | |
| Beginning of period | | 3,812,578 | | 4,122,260 |
| End of period | $ | 3,801,153 | $ | 3,812,578 |
| | | | | |
| Other Information | | | | |
| Shares | | | | |
| Sold | | 2,135,303 | | 1,800,019 |
| Issued in reinvestment of distributions | | 116,155 | | 94,454 |
| Redeemed | | (2,261,053) | | (2,204,182) |
| Net increase (decrease) | | (9,595) | | (309,709) |
| | | | | |
Financial Highlights
Fidelity® Municipal Money Market Fund |
| |
| Years ended August 31, | | 2024 | | 2023 | | 2022 | | 2021 | | 2020 |
Selected Per-Share Data | | | | | | | | | | |
| Net asset value, beginning of period | $ | 1.00 | $ | 1.00 | $ | 1.00 | $ | 1.00 | $ | 1.00 |
| Income from Investment Operations | | | | | | | | | | |
Net investment income (loss) A | | .032 | | .026 | | .003 | | - B | | .007 |
| Net realized and unrealized gain (loss) | | .001 | | - B | | - B | | - B | | .001 |
| Total from investment operations | | .033 | | .026 | | .003 | | - B | | .008 |
| Distributions from net investment income | | (.032) | | (.026) | | (.003) | | - B | | (.007) |
| Distributions from net realized gain | | (.001) | | - | | - B | | - | | (.001) |
| Total distributions | | (.033) | | (.026) | | (.003) | | - B | | (.008) |
| Net asset value, end of period | $ | 1.00 | $ | 1.00 | $ | 1.00 | $ | 1.00 | $ | 1.00 |
Total Return C | | | | 2.61% | | .27% | | .01% | | .76% |
Ratios to Average Net Assets A,D,E | | | | | | | | | | |
| Expenses before reductions | | .41% | | .42% | | .41% | | .41% | | .42% |
| Expenses net of fee waivers, if any | | | | .42% | | .26% | | .16% | | .41% |
| Expenses net of all reductions | | .40% | | .42% | | .26% | | .16% | | .41% |
| Net investment income (loss) | | 3.23% | | 2.56% | | .24% | | .01% | | .71% |
| Supplemental Data | | | | | | | | | | |
| Net assets, end of period (in millions) | $ | 3,801 | $ | 3,813 | $ | 4,122 | $ | 4,648 | $ | 5,430 |
ANet investment income (loss) is affected by the timing of the declaration of dividends by any underlying mutual funds or exchange-traded funds (ETFs). Net investment income (loss) of any mutual funds or ETFs is not included in the Fund's net investment income (loss) ratio.
BAmount represents less than $.0005 per share.
CTotal returns would have been lower if certain expenses had not been reduced during the applicable periods shown.
DFees and expenses of any underlying mutual funds or exchange-traded funds (ETFs) are not included in the Fund's expense ratio. The Fund indirectly bears its proportionate share of these expenses. For additional expense information related to investments in Fidelity Central Funds, please refer to the "Investments in Fidelity Central Funds" note found in the Notes to Financial Statements section of the most recent Annual or Semi-Annual report.
EExpense ratios reflect operating expenses of the class. Expenses before reductions do not reflect amounts reimbursed, waived, or reduced through arrangements with the investment adviser, brokerage services, or other offset arrangements, if applicable, and do not represent the amount paid by the class during periods when reimbursements, waivers or reductions occur.
Notes to Financial Statements
For the period ended August 31, 2024
(Amounts in thousands except percentages)
1. Organization.
Fidelity Municipal Money Market Fund (the Fund) is a fund of Fidelity Union Street Trust II (the Trust) and is authorized to issue an unlimited number of shares. Share transactions on the Statement of Changes in Net Assets may contain exchanges between affiliated funds. The Trust is registered under the Investment Company Act of 1940, as amended (the 1940 Act), as an open-end management investment company organized as a Delaware statutory trust. Shares of the Fund are only available for purchase by retail shareholders.
2. Investments in Fidelity Central Funds.
Funds may invest in Fidelity Central Funds, which are open-end investment companies generally available only to other investment companies and accounts managed by the investment adviser and its affiliates. The Schedule of Investments lists any Fidelity Central Funds held as an investment as of period end, but does not include the underlying holdings of each Fidelity Central Fund. An investing fund indirectly bears its proportionate share of the expenses of the underlying Fidelity Central Funds.
Based on its investment objective, each Fidelity Central Fund may invest or participate in various investment vehicles or strategies that are similar to those of the investing fund. These strategies are consistent with the investment objectives of the investing fund and may involve certain economic risks which may cause a decline in value of each of the Fidelity Central Funds and thus a decline in the value of the investing fund.
| Fidelity Central Fund | Investment Manager | Investment Objective | Investment Practices | Expense RatioA |
| Fidelity Money Market Central Funds | Fidelity Management & Research Company LLC (FMR) | Each fund seeks to obtain a high level of current income consistent with the preservation of capital and liquidity. | Short-term Investments | Less than .005% |
A Expenses expressed as a percentage of average net assets and are as of each underlying Central Fund's most recent annual or semi-annual shareholder report.
A complete unaudited list of holdings for each Fidelity Central Fund is available upon request or at the Securities and Exchange Commission website at www.sec.gov. In addition, the financial statements of the Fidelity Central Funds which contain the significant accounting policies (including investment valuation policies) of those funds, and are not covered by the Report of Independent Registered Public Accounting Firm, are available on the Securities and Exchange Commission website or upon request.
3. Significant Accounting Policies.
The Fund is an investment company and applies the accounting and reporting guidance of the Financial Accounting Standards Board (FASB) Accounting Standards Codification Topic 946 Financial Services - Investment Companies. The financial statements have been prepared in conformity with accounting principles generally accepted in the United States of America (GAAP), which require management to make certain estimates and assumptions at the date of the financial statements. Actual results could differ from those estimates. Subsequent events, if any, through the date that the financial statements were issued have been evaluated in the preparation of the financial statements. The Fund's Schedule of Investments lists any underlying mutual funds or exchange-traded funds (ETFs) but does not include the underlying holdings of these funds. The following summarizes the significant accounting policies of the Fund:
Investment Valuation. The Fund categorizes the inputs to valuation techniques used to value its investments into a disclosure hierarchy consisting of three levels as shown below:
Level 1 - unadjusted quoted prices in active markets for identical investments
Level 2 - other significant observable inputs (including quoted prices for similar investments, interest rates, prepayment speeds, etc.)
Level 3 - unobservable inputs (including the Fund's own assumptions based on the best information available)
As permitted by compliance with certain conditions under Rule 2a-7 of the 1940 Act, securities are valued at amortized cost, which approximates fair value. The amortized cost of an instrument is determined by valuing it at its original cost and thereafter amortizing any discount or premium from its face value at a constant rate until maturity. Securities held by a money market fund are generally high quality and liquid; however, they are reflected as Level 2 because the inputs used to determine fair value are not quoted prices in an active market.
Investments in the Fidelity Central Funds are valued at their closing net asset value (NAV) each business day and are categorized as Level 1 in the hierarchy.
Investment Transactions and Income. The net asset value per share for processing shareholder transactions is calculated as of the close of business of the New York Stock Exchange (NYSE), normally 4:00 p.m. Eastern time. Security transactions, including the Fund's investment activity in the Fidelity Central Funds, are accounted for as of trade date. Gains and losses on securities sold are determined on the basis of identified cost. Income and capital gain distributions from Fidelity Central Funds, if any, are recorded on the ex-dividend date. Interest income is accrued as earned and includes coupon interest and amortization of premium and accretion of discount on debt securities as applicable.
Expenses. Expenses directly attributable to a fund are charged to that fund. Expenses attributable to more than one fund are allocated among the respective funds on the basis of relative net assets or other appropriate methods. Expenses included in the accompanying financial statements reflect the expenses of that fund and do not include any expenses associated with any underlying mutual funds or exchange-traded funds. Although not included in a fund's expenses, a fund indirectly bears its proportionate share of these expenses through the net asset value of each underlying mutual fund or exchange-traded fund. Expense estimates are accrued in the period to which they relate and adjustments are made when actual amounts are known.
Income Tax Information and Distributions to Shareholders. Each year, the Fund intends to qualify as a regulated investment company under Subchapter M of the Internal Revenue Code, including distributing substantially all of its taxable income and realized gains. As a result, no provision for U.S. Federal income taxes is required. As of August 31, 2024, the Fund did not have any unrecognized tax benefits in the financial statements; nor is the Fund aware of any tax positions for which it is reasonably possible that the total amounts of unrecognized tax benefits will significantly change in the next twelve months. The Fund files a U.S. federal tax return, in addition to state and local tax returns as required. The Fund's federal income tax returns are subject to examination by the Internal Revenue Service (IRS) for a period of three fiscal years after they are filed. State and local tax returns may be subject to examination for an additional fiscal year depending on the jurisdiction.
Distributions are declared and recorded daily and paid monthly from net investment income. Distributions from realized gains, if any, are declared and recorded on the ex-dividend date. Income and capital gain distributions are determined in accordance with income tax regulations, which may differ from GAAP.
Capital accounts within the financial statements are adjusted for permanent book-tax differences. These adjustments have no impact on net assets or the results of operations. Capital accounts are not adjusted for temporary book-tax differences which will reverse in a subsequent period.
Book-tax differences are primarily due to market discount and capital loss carryforwards.
The Fund purchases municipal securities whose interest, in the opinion of the issuer, is free from federal income tax. There is no assurance that the IRS will agree with this opinion. In the event the IRS determines that the issuer does not comply with relevant tax requirements, interest payments from a security could become federally taxable, possibly retroactively to the date the security was issued.
As of period end, the cost and unrealized appreciation (depreciation) in securities for federal income tax purposes were as follows:
| Gross unrealized appreciation | $- |
| Gross unrealized depreciation | - |
| Net unrealized appreciation (depreciation) | $- |
| Tax Cost | $3,778,558 |
The tax-based components of distributable earnings as of period end were as follows:
| Undistributed tax-exempt income | $0A |
| Capital loss carryforward | $(185) |
A In the amount of less than five hundred dollars.
Capital loss carryforwards are only available to offset future capital gains of the Fund to the extent provided by regulations and may be limited. The capital loss carryforward information presented below, including any applicable limitation, is estimated as of fiscal period end and is subject to adjustment.
The tax character of distributions paid was as follows:
| | August 31, 2024 | August 31, 2023 |
| Tax-exempt Income | 123,715 | 101,791 |
| Ordinary Income | 1,984 | - |
| Total | $125,699 | $101,791 |
Delayed Delivery Transactions and When-Issued Securities. During the period, certain Funds transacted in securities on a delayed delivery or when-issued basis. Payment and delivery may take place after the customary settlement period for that security. The price of the underlying securities and the date when the securities will be delivered and paid for are fixed at the time the transaction is negotiated. Securities purchased on a delayed delivery or when-issued basis are identified as such in the Schedule of Investments. Compensation for interest forgone in the purchase of a delayed delivery or when-issued debt security may be received. With respect to purchase commitments, each applicable Fund identifies securities as segregated in its records with a value at least equal to the amount of the commitment. Payables and receivables associated with the purchases and sales of delayed delivery securities having the same coupon, settlement date and broker are offset. Delayed delivery or when-issued securities that have been purchased from and sold to different brokers are reflected as both payables and receivables in the Statement of Assets and Liabilities under the caption "Delayed delivery", as applicable. Losses may arise due to changes in the value of the underlying securities or if the counterparty does not perform under the contract's terms, or if the issuer does not issue the securities due to political, economic, or other factors.
Restricted Securities (including Private Placements). Funds may invest in securities that are subject to legal or contractual restrictions on resale. These securities generally may be resold in transactions exempt from registration or to the public if the securities are registered. Disposal of these securities may involve time-consuming negotiations and expense, and prompt sale at an acceptable price may be difficult. Information regarding restricted securities held at period end is included at the end of the Schedule of Investments, if applicable.
New Rule Issuance. In July 2023, the Securities and Exchange Commission issued a Final Rule relative to Money Market Reform. Among other things, the Final Rule includes amendments for: (1) Removal of redemption gates except for liquidations; (2) Required liquidity fees for institutional prime and institutional tax-exempt money market funds; (3) Discretionary liquidity fees for non-government money market funds; (4) Higher liquidity requirements; and (5) Changes to reporting requirements for Form N-MFP and Form N-CR. The Final Rule imposes different implementation dates for the amendments through October 2, 2024. The amendments have been implemented to date, and management has concluded that there are no material impacts to the Fund's financial statements and related disclosures.
4. Fees and Other Transactions with Affiliates.
Management Fee. Fidelity Management & Research Company LLC (the investment adviser) and its affiliates provide the Fund with investment management related services for which the Fund pays a monthly management fee.
Effective March 1, 2024, the Fund's management contract was amended to incorporate administrative services previously covered under separate services agreements (Transfer Agent and Accounting agreements). Any reference to "class" in this note shall mean "the Fund" as the Fund currently offers only one class of shares. The amended contract incorporates a management fee rate that may vary by class. The investment adviser or an affiliate pays certain expenses of managing and operating the Fund out of each class's management fee. Each class of the Fund pays a management fee to the investment adviser. The management fee is calculated and paid to the investment adviser every month. When determining a class's management fee, a mandate rate is calculated based on the monthly average net assets of a group of funds advised by FMR within a designated asset class. A discount rate is subtracted from the mandate rate once the Fund's monthly average net assets reach a certain level. The mandate rate and discount rate may vary by class. The annual management fee rate for a class of shares of the Fund is the lesser of (1) the class's mandate rate reduced by the class's discount rate (if applicable) or (2) the amount set forth in the following table.
| | Maximum Management Fee Rate % |
| Fidelity Municipal Money Market Fund | .39 |
One-twelfth of the management fee rate for a class is applied to the average net assets of the class for the month, giving a dollar amount which is the management fee for the class for that month. A different management fee rate may be applicable to each class of the Fund. The difference between classes is the result of separate arrangements for class-level services and/or waivers of certain expenses. It is not the result of any difference in advisory or custodial fees or other expenses related to the management of the Fund's assets, which do not vary by class. For the portion of the reporting period on or after March 1, 2024, the total annualized management fee rates were as follows:
| | Total Management Fee Rate % |
| Fidelity Municipal Money Market Fund | .39 |
Prior to March 1, 2024, the management fee was the sum of an individual fund fee rate that was based on an annual rate of .15% of the Fund's average net assets and an annualized group fee rate that averaged .10% during the period. The group fee rate was based upon the monthly average net assets of a group of registered investment companies with which the investment adviser has management contracts. The group fee rate decreased as assets under management increased and increased as assets under management decreased. For the portion of the reporting period prior to March 1, 2024, the total annualized management fee rate was .25%.
Effective March 1, 2024, the Fund's sub-advisory agreements with FMR Investment Management (UK) Limited, Fidelity Management & Research (Hong Kong) Limited, and Fidelity Management & Research (Japan) Limited were amended to provide that the investment adviser pays each sub-adviser monthly fees equal to 110% of the sub-adviser's costs for providing sub-advisory services.
Transfer Agent Fees. Fidelity Investments Institutional Operations Company LLC (FIIOC), an affiliate of the investment adviser, is the transfer, dividend disbursing and shareholder servicing agent for the Fund. Effective March 1, 2024, each Fund's management contract was amended to incorporate transfer agent services and associated fees previously covered under a separate services agreement. FIIOC pays for typesetting, printing and mailing of shareholder reports, except proxy statements.
During the period December 1, 2023 through February 29, 2024, the transfer agent fees were a fixed annual rate of .1539% of average net assets.
Prior to December 1, 2023, FIIOC received account fees and asset-based fees that varied according to account size and type of account. For the portion of the reporting period prior to March 1, 2024, the fees were equivalent to the annualized rate of .15% of average net assets.
Accounting Fees. Fidelity Service Company, Inc. (FSC), an affiliate of the investment adviser, maintains the Fund's accounting records. Effective March 1, 2024, the Fund's management contract was amended to incorporate accounting services and associated fees previously covered under a separate services agreement.
During the period December 1, 2023 through February 29, 2024, the accounting fees were a fixed annual rate of average net assets as follows:
| | % of Average Net Assets |
| Fidelity Municipal Money Market Fund | .0087 |
Prior to December 1, 2023, the accounting fee was based on the level of average net assets for each month. For the portion of the reporting period prior to March 1, 2024, the fees were equivalent to the following annualized rates:
| | % of Average Net Assets |
| Fidelity Municipal Money Market Fund | .01 |
| | |
Interfund Trades. Funds may purchase from or sell securities to other Fidelity Funds under procedures adopted by the Board. The procedures have been designed to ensure these interfund trades are executed in accordance with Rule 17a-7 of the 1940 Act. Interfund trades during the period are noted in the table below.
| | Purchases ($) | Sales ($) | Realized Gain (Loss)($) |
| Fidelity Municipal Money Market Fund | 64,245 | 180,875 | - |
5. Expense Reductions.
Through arrangements with the Fund's custodian, credits realized as a result of certain uninvested cash balances were used to reduce the Fund's expenses by $1.
In addition, during the period the investment adviser or an affiliate reimbursed and/or waived a portion of operating expenses in the amount of $129.
6. Other.
A fund's organizational documents provide former and current trustees and officers with a limited indemnification against liabilities arising in connection with the performance of their duties to the fund. In the normal course of business, a fund may also enter into contracts that provide general indemnifications. A fund's maximum exposure under these arrangements is unknown as this would be dependent on future claims that may be made against a fund. The risk of material loss from such claims is considered remote.
7. Risk and Uncertainties.
Many factors affect a fund's performance. Developments that disrupt global economies and financial markets, such as pandemics, epidemics, outbreaks of infectious diseases, war, terrorism, and environmental disasters, may significantly affect a fund's investment performance. The effects of these developments to a fund will be impacted by the types of securities in which a fund invests, the financial condition, industry, economic sector, and geographic location of an issuer, and a fund's level of investment in the securities of that issuer. Significant concentrations in security types, issuers, industries, sectors, and geographic locations may magnify the factors that affect a fund's performance.
Report of Independent Registered Public Accounting Firm
To the Board of Trustees of Fidelity Union Street Trust II and Shareholders of Fidelity Municipal Money Market Fund
Opinion on the Financial Statements
We have audited the accompanying statement of assets and liabilities, including the schedule of investments, of Fidelity Municipal Money Market Fund (one of the funds constituting Fidelity Union Street Trust II, referred to hereafter as the "Fund") as of August 31, 2024, the related statement of operations for the year ended August 31, 2024, the statement of changes in net assets for each of the two years in the period ended August 31, 2024, including the related notes, and the financial highlights for each of the five years in the period ended August 31, 2024 (collectively referred to as the "financial statements"). In our opinion, the financial statements present fairly, in all material respects, the financial position of the Fund as of August 31, 2024, the results of its operations for the year then ended, the changes in its net assets for each of the two years in the period ended August 31, 2024 and the financial highlights for each of the five years in the period ended August 31, 2024 in conformity with accounting principles generally accepted in the United States of America.
Basis for Opinion
These financial statements are the responsibility of the Fund's management. Our responsibility is to express an opinion on the Fund's financial statements based on our audits. We are a public accounting firm registered with the Public Company Accounting Oversight Board (United States) (PCAOB) and are required to be independent with respect to the Fund in accordance with the U.S. federal securities laws and the applicable rules and regulations of the Securities and Exchange Commission and the PCAOB.
We conducted our audits of these financial statements in accordance with the standards of the PCAOB. Those standards require that we plan and perform the audit to obtain reasonable assurance about whether the financial statements are free of material misstatement, whether due to error or fraud.
Our audits included performing procedures to assess the risks of material misstatement of the financial statements, whether due to error or fraud, and performing procedures that respond to those risks. Such procedures included examining, on a test basis, evidence regarding the amounts and disclosures in the financial statements. Our audits also included evaluating the accounting principles used and significant estimates made by management, as well as evaluating the overall presentation of the financial statements. Our procedures included confirmation of securities owned as of August 31, 2024 by correspondence with the custodian and brokers; when replies were not received from brokers, we performed other auditing procedures. We believe that our audits provide a reasonable basis for our opinion.
/s/ PricewaterhouseCoopers LLP
Boston, Massachusetts
October 14, 2024
We have served as the auditor of one or more investment companies in the Fidelity group of funds since 1932.
Distributions
(Unaudited)
The dividend and capital gains distributions for the fund(s) are available on Fidelity.com or Institutional.Fidelity.com.
During fiscal year ended 2024, 100% of the fund's income dividends was free from federal income tax, and 52.62% of the fund's income dividends was subject to the federal alternative minimum tax.
The fund will notify shareholders in January 2025 of amounts for use in preparing 2024 income tax returns.
Item 8: Changes in and Disagreements with Accountants for Open-End Management Investment Companies
(Unaudited)
Note: This is not applicable for any fund included in this document.
Item 9: Proxy Disclosures for Open-End Management Investment Companies
(Unaudited)
| A special meeting of shareholders was held on October 18, 2023. The results of votes taken among shareholders on the proposal before them are reported below. Each vote reported represents one dollar of net asset value held on the record date for the meeting. |
| Proposal 1 |
| To elect a Board of Trustees. |
| | # of Votes | % of Votes |
| Abigail P. Johnson |
| Affirmative | 3,563,377,070.69 | 93.47 |
| Withheld | 249,002,954.77 | 6.53 |
| TOTAL | 3,812,380,025.46 | 100.00 |
| Jennifer Toolin McAuliffe |
| Affirmative | 3,580,401,452.33 | 93.92 |
| Withheld | 231,978,573.13 | 6.08 |
| TOTAL | 3,812,380,025.46 | 100.00 |
| Christine J. Thompson |
| Affirmative | 3,575,829,590.11 | 93.80 |
| Withheld | 236,550,435.35 | 6.20 |
| TOTAL | 3,812,380,025.46 | 100.00 |
| Elizabeth S. Acton |
| Affirmative | 3,563,692,727.00 | 93.48 |
| Withheld | 248,687,298.46 | 6.52 |
| TOTAL | 3,812,380,025.46 | 100.00 |
| Laura M. Bishop |
| Affirmative | 3,580,620,821.44 | 93.92 |
| Withheld | 231,759,204.02 | 6.08 |
| TOTAL | 3,812,380,025.46 | 100.00 |
| Ann E. Dunwoody |
| Affirmative | 3,556,292,503.45 | 93.28 |
| Withheld | 256,087,522.01 | 6.72 |
| TOTAL | 3,812,380,025.46 | 100.00 |
| John Engler |
| Affirmative | 3,548,916,807.39 | 93.09 |
| Withheld | 263,463,218.07 | 6.91 |
| TOTAL | 3,812,380,025.46 | 100.00 |
| Robert F. Gartland |
| Affirmative | 3,574,560,938.30 | 93.76 |
| Withheld | 237,819,087.16 | 6.24 |
| TOTAL | 3,812,380,025.46 | 100.00 |
| Robert W. Helm |
| Affirmative | 3,561,007,437.32 | 93.41 |
| Withheld | 251,372,588.14 | 6.59 |
| TOTAL | 3,812,380,025.46 | 100.00 |
| Arthur E. Johnson |
| Affirmative | 3,562,676,023.62 | 93.45 |
| Withheld | 249,704,001.84 | 6.55 |
| TOTAL | 3,812,380,025.46 | 100.00 |
| Michael E. Kenneally |
| Affirmative | 3,576,790,948.78 | 93.82 |
| Withheld | 235,589,076.68 | 6.18 |
| TOTAL | 3,812,380,025.46 | 100.00 |
| Mark A. Murray |
| Affirmative | 3,577,292,731.34 | 93.83 |
| Withheld | 235,087,294.12 | 6.17 |
| TOTAL | 3,812,380,025.46 | 100.00 |
| Carol J. Zierhoffer |
| Affirmative | 3,562,554,595.71 | 93.45 |
| Withheld | 249,825,429.75 | 6.55 |
| TOTAL | 3,812,380,025.46 | 100.00 |
| | | |
| Proposal 1 reflects trust-wide proposal and voting results. |
Item 10: Remuneration Paid to Directors, Officers, and others of Open-End Management Investment Companies
(Unaudited)
Note: This information is disclosed as part of the financial statements for each Fund as part of Item 7: Financial Statements and Financial Highlights for Open-End Management Investment companies.
Item 11: Statement Regarding Basis for Approval of Investment Advisory Contract
(Unaudited)
Note: This is not applicable for any fund included in this document.
1.538360.127
MMM-ANN-1024
Item 8.
Changes in and Disagreements with Accountants for Open-End Management Investment Companies
See Item 7.
Item 9.
Proxy Disclosures for Open-End Management Investment Companies
See Item 7.
Item 10.
Remuneration Paid to Directors, Officers, and Others of Open-End Management Investment Companies
See Item 7.
Item 11.
Statement Regarding Basis for Approval of Investment Advisory Contract
See Item 7.
Item 12.
Disclosure of Proxy Voting Policies and Procedures for Closed-End Management Investment Companies
Not applicable.
Item 13.
Portfolio Managers of Closed-End Management Investment Companies
Not applicable.
Item 14.
Purchase of Equity Securities by Closed-End Management Investment Company and Affiliated Purchasers
Not applicable.
Item 15.
Submission of Matters to a Vote of Security Holders
There were no material changes to the procedures by which shareholders may recommend nominees to the trust’s Board of Trustees.
Item 16.
Controls and Procedures
(a)(i) The President and Treasurer and the Chief Financial Officer have concluded that the trust’s disclosure controls and procedures (as defined in Rule 30a-3(c) under the Investment Company Act) provide reasonable assurances that material information relating to the trust is made known to them by the appropriate persons, based on their evaluation of these controls and procedures as of a date within 90 days of the filing date of this report.
(a)(ii) There was no change in the trust’s internal control over financial reporting (as defined in Rule 30a-3(d) under the Investment Company Act) that occurred during the period covered by this report that has materially affected, or is reasonably likely to materially affect, the trust’s internal control over financial reporting.
Item 17.
Disclosure of Securities Lending Activities for Closed-End Management Investment Companies
Not applicable.
Item 18.
Recovery of Erroneously Awarded Compensation
(a)
Not applicable.
(b)
Not applicable.
Item 19.
Exhibits
SIGNATURES
Pursuant to the requirements of the Securities Exchange Act of 1934 and the Investment Company Act of 1940, the registrant has duly caused this report to be signed on its behalf by the undersigned, thereunto duly authorized.
Fidelity Union Street Trust II
|
By: | /s/Laura M. Del Prato |
| Laura M. Del Prato |
| President and Treasurer (Principal Executive Officer) |
|
|
Date: | October 23, 2024 |
Pursuant to the requirements of the Securities Exchange Act of 1934 and the Investment Company Act of 1940, this report has been signed below by the following persons on behalf of the registrant and in the capacities and on the dates indicated.
|
By: | /s/Laura M. Del Prato |
| Laura M. Del Prato |
| President and Treasurer (Principal Executive Officer) |
|
|
Date: | October 23, 2024 |
|
By: | /s/John J. Burke III |
| John J. Burke III |
| Chief Financial Officer (Principal Financial Officer) |
|
|
Date: | October 23, 2024 |