Exhibit 99.1

Exhibit 99.1
Business, Data and Group Communications Services
CJS Securities, Inc. Summer Small Cap Conference
August 17, 2004
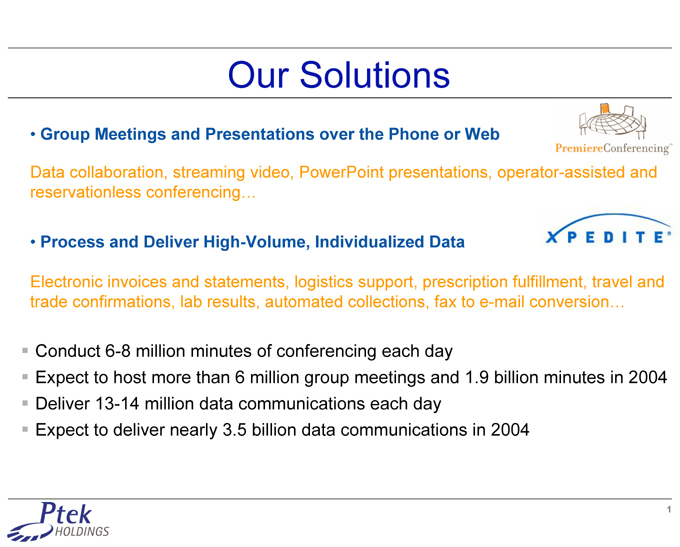
Our Solutions
Group Meetings and Presentations over the Phone or Web
Data collaboration, streaming video, PowerPoint presentations, operator-assisted and reservationless conferencing…
Process and Deliver High-Volume, Individualized Data
Electronic invoices and statements, logistics support, prescription fulfillment, travel and trade confirmations, lab results, automated collections, fax to e-mail conversion…
Conduct 6-8 million minutes of conferencing each day
Expect to host more than 6 million group meetings and 1.9 billion minutes in 2004
Deliver 13-14 million data communications each day
Expect to deliver nearly 3.5 billion data communications in 2004
1
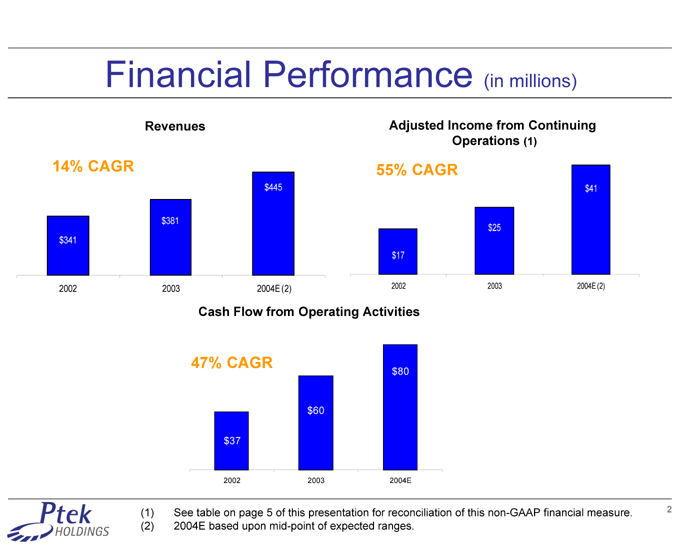
Financial Performance (in millions)
Revenues
14% CAGR
$445
$381
$341
2002 2003 2004E (2)
Adjusted Income from Continuing Operations (1)
55% CAGR
$41
$25
$17
2002 2003 2004E (2)
Cash Flow from Operating Activities
47% CAGR
$80
$60
$37
2002 2003 2004E
(1) See table on page 5 of this presentation for reconciliation of this non-GAAP financial measure. (2) 2004E based upon mid-point of expected ranges.
2
Continuing Growth Strategies
Develop and Deploy New Applications
Increase Direct Sales Force
Expand Channels of Distribution
Wholesalers, Resellers & Agents
Strategic Relationships
Selective Acquisitions
3
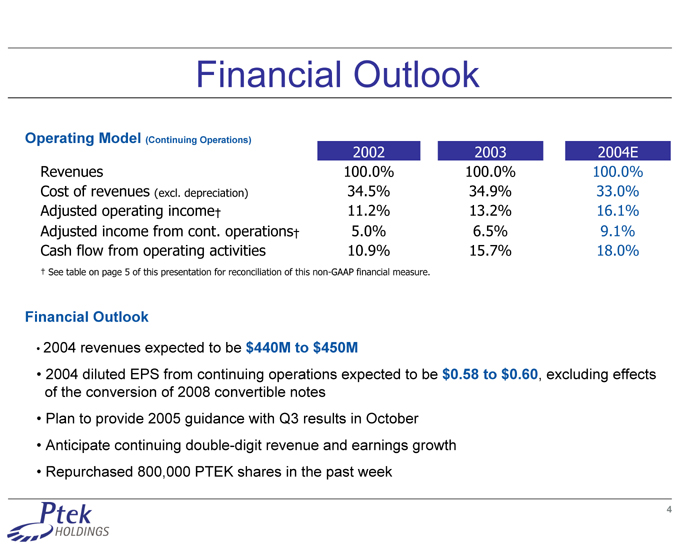
Financial Outlook
Operating Model (Continuing Operations)
2002 2003 2004E
Revenues 100.0% 100.0% 100.0%
Cost of revenues (excl. depreciation) 34.5% 34.9% 33.0%
Adjusted operating income† 11.2% 13.2% 16.1%
Adjusted income from cont. operations† 5.0% 6.5% 9.1%
Cash flow from operating activities 10.9% 15.7% 18.0%
† See table on page 5 of this presentation for reconciliation of this non-GAAP financial measure.
Financial Outlook
2004 revenues expected to be $440M to $450M
2004 diluted EPS from continuing operations expected to be $0.58 to $0.60, excluding effects of the conversion of 2008 convertible notes
Plan to provide 2005 guidance with Q3 results in October
Anticipate continuing double-digit revenue and earnings growth
Repurchased 800,000 PTEK shares in the past week
4
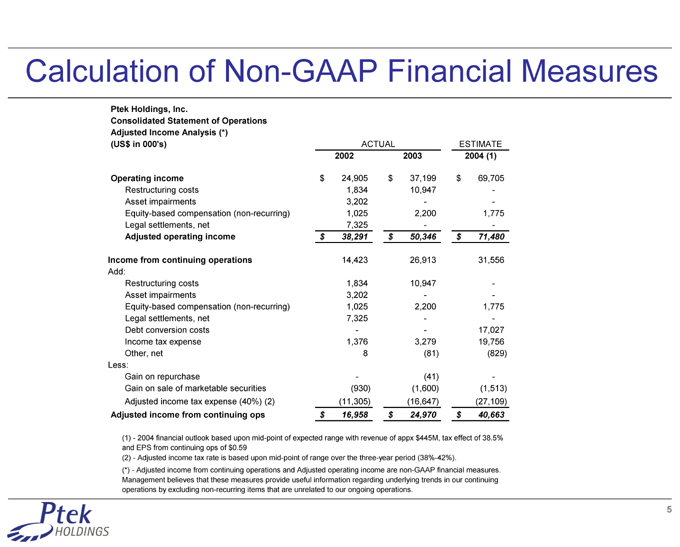
Calculation of Non-GAAP Financial Measures
Ptek Holdings, Inc.
Consolidated Statement of Operations
Adjusted Income Analysis (*)
(US$ in 000’s) ACTUAL ESTIMATE
2002 2003 2004 (1)
Operating income $ 24,905 $ 37,199 $ 69,705
Restructuring costs 1,834 10,947 -
Asset impairments 3,202 - -
Equity-based compensation (non-recurring) 1,025 2,200 1,775
Legal settlements, net 7,325 - -
Adjusted operating income $ 38,291 $ 50,346 $ 71,480
Income from continuing operations 14,423 26,913 31,556
Add:
Restructuring costs 1,834 10,947 -
Asset impairments 3,202 - -
Equity-based compensation (non-recurring) 1,025 2,200 1,775
Legal settlements, net 7,325 - -
Debt conversion costs - - 17,027
Income tax expense 1,376 3,279 19,756
Other, net 8 (81) (829)
Less:
Gain on repurchase - (41) -
Gain on sale of marketable securities (930) (1,600) (1,513)
Adjusted income tax expense (40%) (2) (11,305) (16,647) (27,109)
Adjusted income from continuing ops $ 16,958 $ 24,970 $ 40,663
(1)—2004 financial outlook based upon mid-point of expected range with revenue of appx $445M, tax effect of 38.5% and EPS from continuing ops of $0.59 (2)—Adjusted income tax rate is based upon mid-point of range over the three-year period (38%-42%).
(*)—Adjusted income from continuing operations and Adjusted operating income are non-GAAP financial measures. Management believes that these measures provide useful information regarding underlying trends in our continuing operations by excluding non-recurring items that are unrelated to our ongoing operations.
5
Forward Looking Statements
Statements made in this presentation, other than those concerning historical information, should be considered forward-looking and subject to various risks and uncertainties. Such forward-looking statements are made pursuant to the “safe harbor” provisions of the Private Securities Litigation Reform Act of 1995 and are made based on management’s current expectations or beliefs as well as assumptions made by, and information currently available to, management. A variety of factors could cause actual results to differ materially from those anticipated in Ptek’s forward-looking statements, including, but not limited to, the following factors: technological change; the development of alternatives to our services; our ability to manage our growth; integration of acquired companies; possible adverse effects on our financial condition if we are unable to retain IBM as a significant customer at historical levels; possible adverse results of pending or future litigation or infringement claims; service interruptions; competitive pressures, including pricing pressures; general domestic and international economic, business or political conditions; legislative or regulatory changes; increased financial leverage; our dependence on our subsidiaries for cash flow; and other factors described from time to time in our press releases, reports and other filings with the SEC, including but not limited the “Risk Factors Affecting Future Performance” section of our Annual Report on Form 10-K for the year ended December 31, 2003. All forward-looking statements attributable to us or a person acting on our behalf are expressly qualified in their entirety by this cautionary statement.
6