Life is Complex
Nuveen makes things e-simple.
It only takes a minute to sign up for e-Reports. Once enrolled, you'll receive an e-mail as soon as your Nuveen Investments Fund information is ready—no more waiting for delivery by regular mail. Just click on the link within the e-mail to see the report and save it on your computer if you wish.
Free e-Reports right to your e-mail!
www.investordelivery.com
If you receive your Nuveen Fund dividends and statements from your financial advisor or brokerage account.
or
www.nuveen.com/accountaccess
If you receive your Nuveen Fund dividends and statements directly from Nuveen.
Table of Contents
| Chairman's Letter to Shareholders | 4 |
| | |
| Portfolio Managers' Comments | 5 |
| | |
| Fund Leverage | 11 |
| | |
| Common Share Information | 12 |
| | |
| Risk Considerations | 14 |
| | |
| Performance Overview and Holding Summaries | 16 |
| | |
| Shareholder Meeting Report | 26 |
| | |
| Report of Independent Registered Public Accounting Firm | 28 |
| | |
| Portfolios of Investments | 29 |
| | |
| Statement of Assets and Liabilities | 108 |
| | |
| Statement of Operations | 109 |
| | |
| Statement of Changes in Net Assets | 110 |
| | |
| Statement of Cash Flows | 112 |
| | |
| Financial Highlights | 114 |
| | |
| Notes to Financial Statements | 122 |
| | |
| Additional Fund Information | 136 |
| | |
| Glossary of Terms Used in this Report | 137 |
| | |
| Reinvest Automatically, Easily and Conveniently | 139 |
| | |
| Annual Investment Management Agreement Approval Process | 140 |
| | |
| Board Member & Officers | 148 |
Chairman's Letter to Shareholders
Dear Shareholders,
For better or for worse, the financial markets spent most of the past year waiting for the U.S. Federal Reserve (Fed) to end its accommodative monetary policy. The policy has propped up stock and bond markets since the Great Recession, but the question remains: how will markets behave without its influence? This uncertainty was a considerable source of volatility for stock and bond prices for much of 2015, despite the Fed carefully conveying its intention to raise rates slowly and only when the economy shows evidence of readiness.
As was widely expected, the long-awaited Fed rate hike materialized in mid-December. While the move was interpreted as a vote of confidence on the economy's underlying strength, the Fed emphasized that future rate increases will be gradual and guided by its ongoing assessment of financial conditions. How efficiently the financial markets process the confluence of rising borrowing costs, softer commodity prices, stubbornly low U.S. inflation, and a strong U.S. dollar, against a backdrop of anemic global economic growth, remains to be seen.
Nevertheless, the global recovery continues to be led by the United States. Policy makers in Europe and Japan are deploying their available tools to try to bolster their economies' fragile growth, while Chinese authorities have stepped up efforts to manage China's slowdown. With sentiment regarding China growing increasingly bearish and the Fed now working toward normalizing its interest-rate policy, the actions of the world's central banks remain under intense scrutiny.
In the meantime, asset prices could continue to churn as risks both known and unknown begin to emerge. In times like these, you can look to a professional investment manager with the experience and discipline to maintain the proper perspective on short-term events. And if the daily headlines do concern you, I encourage you to reach out to your financial advisor. Your financial advisor can help you evaluate your investment strategies in light of current events, your time horizon and risk tolerance.
On behalf of the other members of the Nuveen Fund Board, we look forward to continuing to earn your trust in the months and years ahead.
Sincerely,
William J. Schneider
Chairman of the Board
December 21, 2015
Portfolio Managers' Comments
Nuveen Investment Quality Municipal Fund, Inc. (NQM)
Nuveen Select Quality Municipal Fund, Inc. (NQS)
Nuveen Quality Income Municipal Fund, Inc. (NQU)
Nuveen Premier Municipal Income Fund, Inc. (NPF)
Nuveen Municipal High Income Opportunity Fund (NMZ)
These Funds feature portfolio management by Nuveen Asset Management, LLC, an affiliate of Nuveen Investments, Inc. Portfolio managers Christopher L. Drahn, CFA, Thomas C. Spalding, CFA, Daniel J. Close, CFA, and John V. Miller, CFA, review U.S. economic and municipal market conditions, key investment strategies and the twelve-month performance of these five national Funds. Chris has managed NQM since 2011 and Tom has managed NQS and NQU since 2003. Dan assumed portfolio management responsibility for NPF in 2011, while John has managed NMZ since its inception in 2003.
APPROVED FUND REORGANIZATIONS
During August 2015, the Board of Directors/Trustees of the Nuveen Closed-End Funds approved a series of reorganizations for certain Funds, one of which is included in this report (the Target Fund) to create one, larger-national Fund (the Acquiring Fund).
The reorganizations are as follows:
| Target Fund | Symbol | | Acquiring Fund | Symbol |
| Nuveen Quality Municipal Fund, Inc. | NQI | | Nuveen Dividend Advantage Municipal Income Fund | NVG |
| Nuveen Municipal Opportunity Fund, Inc. | NIO | | (to be renamed Nuveen Enhanced AMT-Free Municipal | |
| Nuveen Quality Income Municipal Fund, Inc. | NQU | | Credit Opportunities Fund) | |
See Notes to Financial Statements, Note 1 — General Information and Significant Accounting Policies, Fund Reorganizations for further information.
What factors affected the U.S. economy and the national municipal market during the twelve-month reporting period ended October 31, 2015?
During this reporting period, the U.S. economy continued to expand at a moderate pace. The Federal Reserve (Fed) maintained efforts to bolster growth and promote progress toward its mandates of maximum employment and price stability by holding the benchmark fed funds rate at the record low level of zero to 0.25% that it established in December 2008, a level that remained in place until December 2015 when the Fed increased its benchmark rate to a range of 0.25% to 0.50% (subsequent to the close of this reporting period). At its October 2014 meeting, the Fed announced that it would end its bond-buying stimulus program as of November 1, 2014, after tapering its monthly asset purchases of mortgage-backed and longer-term Treasury securities from the
| Certain statements in this report are forward-looking statements. Discussions of specific investments are for illustration only and are not intended as recommendations of individual investments. The forward-looking statements and other views expressed herein are those of the portfolio managers as of the date of this report. Actual future results or occurrences may differ significantly from those anticipated in any forward-looking statements, and the views expressed herein are subject to change at any time, due to numerous market and other factors. The Funds disclaim any obligation to update publicly or revise any forward-looking statements or views expressed herein. |
Ratings shown are the highest rating given by one of the following national rating agencies: Standard & Poor's (S&P), Moody's Investors Service, Inc. (Moody's) or Fitch, Inc. (Fitch) Credit ratings are subject to change. AAA, AA, A and BBB are investment grade ratings; BB, B, CCC, CC, C and D are below investment grade ratings. Certain bonds backed by U.S. government or agency securities are regarded as having an implied rating equal to the rating of such securities. Holdings designated N/R are not rated by these national rating agencies.
Bond insurance guarantees only the payment of principal and interest on the bond when due, and not the value of the bonds themselves, which will fluctuate with the bond market and the financial success of the issuer and the insurer. Insurance relates specifically to the bonds in the portfolio and not to the share prices of a Fund. No representation is made as to the insurers' ability to meet their commitments.
Refer to the Glossary of Terms Used in this Report for further definition of the terms used within this section.
Portfolio Managers' Comments (continued)
original $85 billion per month to $15 billion per month over the course of seven consecutive meetings (December 2013 through September 2014). In making the announcement, the Fed cited substantial improvement in the labor market as well as sufficient underlying strength in the broader economy to support ongoing progress toward maximum employment in a context of price stability. The Fed also reiterated that it would continue to look at a wide range of factors, including labor market conditions, indicators of inflationary pressures and readings on financial developments, in determining future actions. Additionally, the Fed stated that it would likely maintain the current target range for the fed funds rate for a considerable time, especially if projected inflation continued to run below the Fed's 2% longer run goal. However, if economic data shows faster progress, the Fed indicated that it could raise the fed funds rate sooner than expected.
The Fed changed its language slightly in December 2014, indicating it would be "patient" in normalizing monetary policy. This shift helped ease investors' worries that the Fed might raise rates too soon. However, as employment data released early in 2015 continued to look strong, anticipation began building that the Fed could raise its main policy rate as soon as June. As widely expected, after its March meeting, the Fed eliminated "patient" from its statement, but also highlighted the policymakers' less optimistic view of the economy's overall health as well as downgraded their inflation projections. The Fed's April meeting seemed to further signal that a June rate hike was off the table. While the Fed attributed the first quarter's economic weakness to temporary factors, the meeting minutes from April revealed that many Committee members believed the economic data available in June would be insufficient to meet the Fed's criteria for initiating a rate increase. The June meeting bore out that presumption and the Fed decided to keep the target rate near zero. But the Committee also continued to telegraph the likelihood of at least one rate increase in 2015, which many analysts forecasted for September.
During the September 2015 meeting, the Fed decided to keep the federal funds rate near zero despite broad speculation that it would increase rates. The Committee said it will keep the rate near zero until the economy has seen further improvement toward reaching the Fed's goals of maximum employment and inflation approaching 2%. At the Fed's October 2015 meeting, the Committee again held steady, while opening the door for a potential December rate hike. (The Fed did raise rates at its December meeting, subsequent to the close of this reporting period.)
The U.S. economy proved to be fairly resilient compared to other economies around the globe, boosted by an improving job market, declining gas prices and low mortgage rates. According to the government's gross domestic product (GDP) "second" estimate, the U.S. economy increased at a 2.1% annualized rate in the third quarter of 2015, compared with increases of 3.9% in the second quarter, 0.6% in the first quarter of 2015 and 2.2% in the fourth quarter 2014. The deceleration in real GDP in the third quarter primarily reflected a downturn in private inventory investment and decelerations in exports, in nonresidential fixed investment, in state and local government spending and in residential fixed investment that were partly offset by a deceleration in imports. The Consumer Price Index (CPI) increased 0.2% essentially unchanged year-over-year as of October 2015. The core CPI (which excludes food and energy) increased 0.2% during the same period, below the Fed's unofficial longer term inflation objective of 2.0%. As of October 2015, the U.S. unemployment rate was 5.0%, a figure that is also considered "full employment" by some Fed officials. The housing market continued to post consistent gains as of its most recent reading for September 2015. The average home price in the S&P/Case-Shiller Index of 20 major metropolitan areas rose 5.5% for the twelve months ended September 2015 (most recent data available at the time this report was prepared).
The municipal bond market traded sideways, meaning it ended the reporting period nearly where it started, with considerable volatility in between. With the Fed delaying the start of its interest rate normalization at each successive policy meeting, yet still signaling that a rate hike was likely in 2015, market participants remained highly focused on reassessing the Fed's timing. Complicating the forecasts were global macroeconomic concerns, particularly related to China's slowdown and currency devaluations around the world, as well as an easing of inflation concerns, driven by a stronger U.S. dollar and weakening commodity prices.
The municipal market's supply-demand balance generally remained favorable over this reporting period. Issuance was unusually strong at the beginning of 2015, fueling concerns about potential oversupply conditions. Over the twelve months ended October 31, 2015, municipal bond issuance nationwide totaled $416.9 billion, an increase of 30.4% from the issuance for the twelve-month period ended October 31, 2014. The elevation in gross issuance is due mostly to increased refunding deals as issuers have been actively and aggressively refunding their outstanding debt given the very low interest rate environment. In these
transactions the issuers are issuing new bonds and taking the bond proceeds and redeeming (calling) old bonds. These refunding transactions have ranged from 40%-60% of total issuance over the past few years. Thus, the net issuance (all bonds issued less bonds redeemed) is actually much lower than the gross issuance. In fact, the total municipal bonds outstanding has actually declined in each of the past four calendar years. So, the gross is elevated, but the net is not and this has been an overall positive technical factor on municipal bond investment performance.
What key strategies were used to manage these Funds during the twelve-month reporting period ended October 31, 2015?
Despite the volatility during this period, the low interest rate environment continued to attract investors to spread products, including municipal bonds. Credit spreads relative to Treasuries continued to tighten, helping the broad municipal market achieve a small gain over the twelve-month reporting period. We continued to take a bottom-up approach to identifying sectors that appeared undervalued as well as individual credits that had the potential to perform well over the long term and helped us keep the Funds fully invested.
Much of our trading activity during the reporting period was focused on reinvesting the cash from called bonds. The low interest rate environment continued to make refunding deals attractive to bond issuers, and we continued to see higher levels of this activity in the municipal market during the reporting period, as bond issuers sought to lower costs through refinancings.
In general, the Funds maintained their overall positioning strategies, emphasizing intermediate and longer maturities, lower rated credits and sectors offering higher yields. We would also note we've become more selective at the individual issue level. As investor demand for municipal securities has increased and created a slight supply-demand imbalance, we've started to see underwriters bring new issues to market that are structured with terms more favorable to the issuer and perhaps less advantageous to the investor than in the recent past. In cases where our convictions have been less certain, we've sought compensation for the additional risk or have passed on the deal all together.
NQM's overall positioning strategy remained unchanged throughout this reporting period, focusing on medium to lower rated credits, with overweights to A rated, BBB rated and non-rated bonds and underweights to AAA and AA rated bonds. The Fund's key sector overweight was in health care, while state and local general obligation (GO) bonds were its main underweight position. The health care sector has been an attractive source of ideas for us, as the advent of the Affordable Health Care Act has encouraged health care providers to increase the scale of their businesses through affiliations and consolidations.
In NQS and NQU, we added bonds issued for the City of Chicago and New Jersey because the credits were available at attractive prices, particularly given the insured structure of the Chicago bond and the higher credit quality of the New Jersey issue.
NPF's purchases were mainly from the secondary market with some buying in the new issue market. We continued to seek intermediate- to longer-dated credits and found opportunities across a range of sectors. Additions to NPF included bonds issued for three tollroads, one airport, one public utility, one dedicated tax, one private higher education and two industrial revenue development/pollution control revenue (IDR/PCR).
In NMZ, we continued to focus on research and the selection of individual credits with the potential for improvement as the key contributors to performance. NMZ emphasized bonds with above-market coupons and stable to improving credit fundamentals. During this reporting period, we continued to favor areas of the market that have been key long-term overweight positions in the Fund's portfolio, including land-backed credits, as well as the hospital and education sectors. Land-backed bonds, also known as "dirt bonds," have been an attractive source of opportunities for NMZ, as the real estate market has continued to rebound and credit fundamentals have improved. The Fund bought a Foothills Metropolitan District of Colorado dirt bond on the secondary market and a new issue dirt bond for the STC Metropolitan District of Colorado. In the hospital sector, we bought Loma Linda University Medical Center, a BB+ rated California bond offering an above-market coupon and attractive credit fundamentals. Notable additions in the education sector included a bond issued for the University of Mobile, a private college in Alabama, offering a 6% coupon that we believe has the potential for longer-term value. We also bought a Florida Renaissance Charter School bond, which operates a portfolio of high performing charter schools across the state. We believe the Florida Renaissance Charter School bonds could potentially add value to the Fund if they are pre-refunded in the future. Outside of these three key sectors, we also marginally increased NMZ's exposures to Chicago GOs and tobacco settlement bonds. The Chicago credits were trading at
Portfolio Managers' Comments (continued)
discounted prices due to overly negative sentiment, in our opinion. We believed the bonds had upside potential and after we bought them they rallied on news that the city passed a property tax increase. Improving fundamentals for tobacco settlement bonds helped support our case for buying Buckeye Tobacco Settlement bonds (Ohio) and Golden State Tobacco Securitization bonds (California). However, NMZ's total allocation to tobacco bonds remains below that of the S&P Municipal Bond High Yield Index, as we consider the benchmark's weight to be too high for the Fund given our current assessment of the sector.
Cash for purchases was generated primarily by proceeds from called and matured bonds, which we worked to redeploy to keep the Funds fully invested and support their income streams. As previously mentioned, call activity was elevated during the reporting period, providing ample cash and driving much of our trading. Additionally, in NQM, we took advantage of the late spring/early summer municipal bond market sell-off to try to bolster the Fund's distributable income by a series of swaps and transactions designed to take advantage of the higher yield level then available in the market place. NPF unwound a Chicago Water tender option bond trust and sold most of the proceeds from the trust. We also sold a position in Chicago City Colleges and a portion of the NPF's Detroit Sewers exposure, due to concerns about deteriorating credit fundamentals for both bonds.
In addition, we unwound a portfolio hedge in NPF that was managed with a credit default swap contract on the debt obligations of the U.S. territory of Puerto Rico. During the reporting period, these swap contracts had a negligible impact on performance.
As of October 31, 2015, all of these Funds continued to use inverse floating rate securities. We employ inverse floaters for a variety of reasons, including duration management and income and total return enhancement.
How did the Funds perform during the twelve-month reporting period ended October 31, 2015?
The tables in each Fund's Performance Overview and Holding Summaries section of this report provide the Funds' total returns for the one-year, five-year and ten-year periods ended October 31, 2015. Each Fund's total returns at common share net asset value (NAV) are compared with the performance of corresponding market indexes and a Lipper classification average.
For the twelve months ended October 31, 2015, the total returns at common share NAV for NQM, NQS, NQU and NPF exceeded the return for the national S&P Municipal Bond Index. For the same period, NQM and NQU outperformed the average return for the Lipper General & Insured Leveraged Municipal Debt Funds Classification Average, while NQS and NPF underperformed this Lipper average. NMZ outperformed the return on the S&P Municipal Bond High Yield Index, the S&P Municipal Bond Index and the average return for the Lipper High-Yield Municipal Debt Funds Classification Average.
Key management factors that influenced the Funds' returns included duration and yield curve positioning, credit exposure and sector allocation. Keeping the Funds fully invested throughout the reporting period also was beneficial for performance. In addition, the use of regulatory leverage was an important positive factor affecting the Funds performance. Leverage is discussed in more detail later in the Fund Leverage section of this report.
In this reporting period, municipal bonds with intermediate and longer maturities generally outperformed those with shorter maturities. As interest rates remained relatively stable over the reporting period, the higher yields at the longer end of the maturity range provided a boost to their total returns. In general, the Funds' durations and yield curve positioning were positive for performance. Consistent with our long term strategy, these Funds tended to have longer durations than the municipal market in general, with overweightings in the longer parts of the yield curve that performed well and underweightings in the underperforming shorter end of the curve. Further boosting performance for NPF, NQS and NQU was exposure to zero coupon bonds, which performed well in this reporting period due to their higher durations. NQM and NMZ had much smaller weightings than the other three Funds in zero coupon bonds, which resulted in a smaller contribution to performance.
During this reporting period, lower rated bonds generally outperformed higher quality bonds. Investors have been more willing to accept risk, as credit fundamentals have broadly continued to improve and demand for higher yielding assets remained robust in the low interest rate environment. For these five Funds, credit exposure had a positive impact on performance. These Funds tended to have overweights in A rated and BBB rated bonds, which outperformed the benchmark and underweights in the AAA rated and AA rated categories, which lagged the benchmark.
Sector allocation was advantageous to relative performance for these five Funds. For this reporting period, tobacco was the best performing sector in the municipal market by a wide margin. Tobacco settlement bonds, which are repaid from the money U.S. tobacco companies owe to states under the 1998 Master Settlement Agreement, rallied strongly during this reporting period on several positive developments. After a decade of falling smoking rates, tobacco shipments were up year-to-date in 2015. Declining commodity prices have provided smokers with more disposable income to buy cigarettes. Higher tobacco revenues are bolstering confidence that the tobacco settlement bonds can make timely payments. The sector also benefited from a constructive development on the litigation front. In October 2015, a dispute between the New York Attorney General and tobacco companies was settled, releasing funds from an escrow account to the state and making the money available for bond payments. The municipal market viewed this favorably, as several other states with disputed money held in escrow also may be likely to reach a settlement. The release of these funds would mean an improvement in the sector's fundamentals and possibly the bonds' credit ratings, many of which are rated below investment grade. We would also point out that, as the tobacco sector has been trading at deeply discounted levels, the rally had considerable upside, further boosting performance during this reporting period. Relative to the S&P Municipal Bond Index, the Funds held overweight exposures to tobacco bonds, which was beneficial to performance. (However, as noted earlier in the key strategies section, relative to the S&P Municipal Bond High Yield Index, NMZ was underweight in tobacco.) As of the end of the reporting period, NQU had the highest weighting in tobacco credits, while NQM had the lowest weighting.
As NQM's weighting in tobacco settlement bonds was small, other more prominent sector positions had a larger impact on its relative performance, including its overweight allocation to the health care sector and underweight allocation to GOs. These gains also helped offset the negative impact of NQM's overweight exposure to pre-refunded bonds. Health care bonds have continued to benefit from investor demand for lower rated credits, as well as generally improving credit fundamentals across the sector. In contrast, sectors with comparatively lower yields and higher credit quality, such as GOs and pre-refunded bonds, generally under-performed the market.
NQS and NQU had small allocations to bonds linked to Puerto Rico, the City of Chicago and the State of Illinois, which modestly dampened performance as these credits underperformed the broad market. However, the positive contribution of the two Funds' tobacco holdings more than offset these detractors.
In NPF, exposure to appropriation bonds added value in addition to the Fund's overweight position in tobacco. However, NPF's relative results were somewhat dampened by our individual credit selection, due to the underperformance of the Fund's Chicago-linked credits and New Jersey appropriation bonds.
NMZ's performance was supported by narrowing credit spreads and strengthening fundamentals in key sectors and individual holdings. Excluding Puerto Rico bonds, spreads across the other high yield municipal sectors tightened during this reporting period, contributing to their generally positive performance. Puerto Rico bonds performed poorly over this reporting period as fundamentals continued to deteriorate, and NMZ's lack of exposure to this segment was advantageous relative to the high yield benchmark. However, relative gains were modestly offset by the NMZ's underweight to tobacco bonds, which were the top performing sector but comprise a larger proportion of the high yield benchmark than we believe is prudent for NMZ (as discussed earlier in this annual report).
In contrast to the Puerto Rico-related and tobacco settlement bonds, the other sectors of the high yield municipal market tended to see more moderate returns during this reporting period. In this environment, NMZ's performance was also attributable to the aggregation of individually strong performing holdings that contributed to returns on a bond-by-bond basis. For example, NMZ's longstanding emphasis on land-backed, charter school and hospital bonds continued to serve the Fund well over this reporting period. These groups saw modest spread tightening, which helped offset the effect of this period's interest rate volatility and generate total return for the Fund. Some of the top contributors to NMZ's performance included 3 World Trade Center, a land-backed bond issued for the redevelopment of Lower Manhattan, which outperformed due to an above-market coupon, improving fundamentals and strong performance from New York-related municipal bonds overall. NMZ also benefited from a position in an Illinois Finance Authority bond issued for Silver Cross Hospital, which offered a 7% coupon and was advance refunded during the reporting period. The pre-refunding caused the bond's price to appreciate as its credit rating was upgraded from BBB to AAA and
Portfolio Managers' Comments (continued)
its maturity shortened (as pre-refunded bonds are escrowed in short-term U.S. Treasury securities). A Florida Renaissance Charter School credit, which offered an 8.5% coupon, added value to NMZ's performance in this reporting period, as the bond's spread tightened and its higher coupon contributed total return. Similar to the Silver Cross Hospital bond, a higher coupon Guam GO performed well when it was refinanced during the reporting period, which had a positive impact on NMZ's performance.
An Update Involving Puerto Rico
As noted in the Funds' previous shareholder reports, we continue to monitor situations in the broader municipal market for any impact on the Funds' holdings and performance: the ongoing economic problems of Puerto Rico is one such case. Puerto Rico's continued economic weakening, escalating debt service obligations, and long-standing inability to deliver a balanced budget led to multiple downgrades on its debt over the past two years. Puerto Rico has warned investors since 2014 that the island's debt burden may be unsustainable and the Commonwealth has been exploring various strategies to deal with this burden, including Chapter 9 bankruptcy, which is currently not available by law.
In terms of Puerto Rico holdings, shareholders should note that NQM, NQS and NQU had limited exposure to Puerto Rico debt, 0.26%, 0.29% and 1.02%, respectively, at the end of the reporting period, while NPF and NMZ did not hold any Puerto Rico bonds. The Puerto Rico credits offered higher yields, added diversification and triple exemption (i.e., exemption from most federal, state and local taxes). Puerto Rico general obligation debt is currently rated Caa2/CC/CC (below investment grade) by Moody's, S&P and Fitch, respectively, with negative outlooks.
Fund Leverage
IMPACT OF THE FUNDS' LEVERAGE STRATEGIES ON PERFORMANCE
One important factor impacting the returns of the Funds relative to their comparative benchmarks was the Funds' use of leverage through their issuance of preferred shares and/or investments in inverse floating rate securities, which represent leveraged investments in underlying bonds. The Funds use leverage because our research has shown that, over time, leveraging provides opportunities for additional income, particularly in the recent market environment where short-term market rates are at or near historical lows, meaning that the short-term rates the Fund has been paying on its leveraging instruments have been much lower than the interest the Fund has been earning on its portfolio of long-term bonds that it has bought with the proceeds of that leverage. However, use of leverage also can expose the Fund to additional price volatility. When a Fund uses leverage, the Fund will experience a greater increase in its net asset value if the municipal bonds acquired through the use of leverage increase in value, but it will also experience a correspondingly larger decline in its net asset value if the bonds acquired through leverage decline in value, which will make the Fund's net asset value more volatile, and its total return performance more variable over time. In addition, income in levered funds will typically decrease in comparison to unlevered funds when short-term interest rates increase and increase when short-term interest rates decrease. Leverage made a positive contribution to the performance of these Funds over this reporting period.
As of October 31, 2015, the Funds' percentages of leverage are as shown in the accompanying table.
| | NQM | NQS | NQU | NPF | NMZ | |
| Effective Leverage* | 35.86% | 36.73% | 36.33% | 35.27% | 30.87% | |
| Regulatory Leverage* | 29.64% | 32.79% | 33.50% | 30.00% | 11.28% | |
| * | Effective Leverage is a Fund's effective economic leverage, and includes both regulatory leverage and the leverage effects of certain derivative and other investments in a Fund's portfolio that increase the Fund's investment exposure. Currently, the leverage effects of Tender Option Bond (TOB) inverse floater holdings are included in effective leverage values, in addition to any regulatory leverage. Regulatory leverage consists of preferred shares issued or borrowings of a Fund. Both of these are part of a Fund's capital structure. Regulatory leverage is subject to asset coverage limits set forth in the Investment Company Act of 1940. |
THE FUNDS' REGULATORY LEVERAGE
As of October 31, 2015, the Funds have issued and outstanding Variable Rate MuniFund Term Preferred (VMTP) Shares and Variable Rate Demand Preferred (VRDP) Shares as shown in the accompanying table.
| | | VMTP Shares | | VRDP Shares | | | | |
| | | | | | | Shares Issued at | | | | | | Shares Issued at | | | | |
| | | | Series | | | Liquidation Value | | | Series | | | Liquidation Value | | | Total | |
| NQM | | | 2017 | | $ | 43,500,000 | | | 1 | | $ | 236,800,000 | | $ | 280,300,000 | |
| NQS | | | — | | | — | | | 1 | | $ | 267,500,000 | | $ | 267,500,000 | |
| NQU | | | — | | | — | | | 1 | | $ | 385,400,000 | | $ | 385,400,000 | |
| NPF | | | — | | | — | | | 1 | | $ | 127,700,000 | | $ | 127,700,000 | |
| NMZ | | | 2018 | | $ | 87,000,000 | | | — | | | — | | $ | 87,000,000 | |
During the current reporting period, NMZ refinanced all of its outstanding VMTP Shares with the issuance of the new VMTP Shares.
Refer to Notes to Financial Statements, Note 4 — Fund Shares, Preferred Shares for further details on VMTP and VRDP Shares and each Fund's respective transactions.
Common Share Information
COMMON SHARE DISTRIBUTION INFORMATION
The following information regarding the Funds' distributions is current as of October 31, 2015. Each Fund's distribution levels may vary over time based on each Fund's investment activity and portfolio investment value changes.
During the current reporting period, each Fund's distributions to common shareholders were as shown in the accompanying table.
| | | Per Common Share Amounts | |
| Ex-Dividend Date | | | NQM | | | NQS | | | NQU | | | NPF | | | NMZ | |
| November 2014 | | $ | 0.0820 | | $ | 0.0665 | | $ | 0.0685 | | $ | 0.0720 | | $ | 0.0760 | |
| December | | | 0.0820 | | | 0.0665 | | | 0.0685 | | | 0.0720 | | | 0.0760 | |
| January | | | 0.0820 | | | 0.0665 | | | 0.0685 | | | 0.0720 | | | 0.0760 | |
| February | | | 0.0820 | | | 0.0665 | | | 0.0685 | | | 0.0720 | | | 0.0760 | |
| March | | | 0.0820 | | | 0.0665 | | | 0.0685 | | | 0.0685 | | | 0.0760 | |
| April | | | 0.0820 | | | 0.0665 | | | 0.0685 | | | 0.0685 | | | 0.0760 | |
| May | | | 0.0820 | | | 0.0665 | | | 0.0685 | | | 0.0685 | | | 0.0760 | |
| June | | | 0.0820 | | | 0.0665 | | | 0.0685 | | | 0.0685 | | | 0.0760 | |
| July | | | 0.0820 | | | 0.0665 | | | 0.0685 | | | 0.0685 | | | 0.0760 | |
| August | | | 0.0820 | | | 0.0665 | | | 0.0685 | | | 0.0685 | | | 0.0760 | |
| September | | | 0.0775 | | | 0.0635 | | | 0.0685 | | | 0.0650 | | | 0.0760 | |
| October 2015 | | | 0.0775 | | | 0.0635 | | | 0.0685 | | | 0.0650 | | | 0.0760 | |
| | | | | | | | | | | | | | | | | |
| Ordinary Income Distribution* | | $ | 0.0019 | | $ | 0.0010 | | $ | 0.0003 | | $ | 0.0003 | | $ | 0.0102 | |
| | | | | | | | | | | | | | | | | |
| Market Yield** | | | 6.08 | % | | 5.59 | % | | 5.94 | % | | 5.90 | % | | 6.63 | % |
| Taxable-Equivalent Yield** | | | 8.44 | % | | 7.76 | % | | 8.25 | % | | 8.19 | % | | 9.21 | % |
| * | Distribution paid in December 2014. |
| | |
| ** | Market Yield is based on the Fund's current annualized monthly dividend divided by the Fund's current market price as of the end of the reporting period. Taxable-Equivalent Yield represents the yield that must be earned on a fully taxable investment in order to equal the yield of the Fund on an after-tax basis. It is based on a federal income tax rate of 28.0%. When comparing a Fund to investments that generate qualified dividend income, the Taxable-Equivalent Yield is lower. |
Each Fund in this report seeks to pay regular monthly dividends out of its net investment income at a rate that reflects its past and projected net income performance. To permit each Fund to maintain a more stable monthly dividend, the Fund may pay dividends at a rate that may be more or less than the amount of net income actually earned by the Fund during the period. If a Fund has cumulatively earned more than it has paid in dividends, it will hold the excess in reserve as undistributed net investment income (UNII) as part of the Fund's net asset value. Conversely, if a Fund has cumulatively paid in dividends more than it has earned, the excess will constitute a negative UNII that will likewise be reflected in the Fund's net asset value. Each Fund will, over time, pay all its net investment income as dividends to shareholders.
As of October 31, 2015, the Funds had positive UNII balances for tax purposes and positive UNII balances for financial reporting purposes.
All monthly dividends paid by each Fund during the current reporting period, were paid from net investment income. If a portion of the Fund's monthly distributions was sourced from or comprised of elements other than net investment income, including capital gains and/or a return of capital, shareholders would have received a notice to that effect. For financial reporting purposes, the
composition and per share amounts of each Fund's dividends for the reporting period are presented in this report's Statement of Changes in Net Assets and Financial Highlights, respectively. For income tax purposes, distribution information for each Fund as of its most recent tax year end is presented in Note 6 — Income Tax Information within the Notes to Financial Statements of this report.
COMMON SHARE EQUITY SHELF PROGRAMS
During the current reporting period, NMZ was authorized to issue additional common shares through its ongoing equity shelf programs. Under this program, NMZ, subject to market conditions, may raise additional capital from time to time in varying amounts and offering methods at a net price at or above the Fund's NAV per common share. Under the equity shelf programs, the Fund is authorized to issue the following number of additional common shares:
| | NMZ | |
| Additional Common Shares Authorized | 7,700,000 | |
During the current reporting period, NMZ did not sell any common shares through its equity shelf program.
COMMON SHARE REPURCHASES
During August 2015, the Funds' Board of Directors/Trustees reauthorized an open-market share repurchase program, allowing each Fund to repurchase an aggregate of up to approximately 10% of its outstanding shares.
As of October 31, 2015, and since the inception of the Funds' repurchase programs, the Funds have cumulatively repurchased and retired their outstanding common shares as shown in the accompanying table.
| | NQM | NQS | NQU | NPF | NMZ | |
| Common shares cumulatively repurchased and retired | 0 | 0 | 21,000 | 202,500 | 0 | |
| Common shares authorized for repurchase | 4,160,000 | 3,520,000 | 4,895,000 | 1,990,000 | 5,010,000 | |
During the current reporting period, the following Fund repurchased and retired its common shares at a weighted average price per common share and a weighted average discount per common share as shown in the accompanying table.
| | | | NQU | |
| Common shares repurchased and retired | | | 21,000 | |
| Weighted average price per common share repurchased and retired | | $ | 13.55 | |
| Weighted average discount per common share repurchased and retired | | | 12.34 | % |
OTHER COMMON SHARE INFORMATION
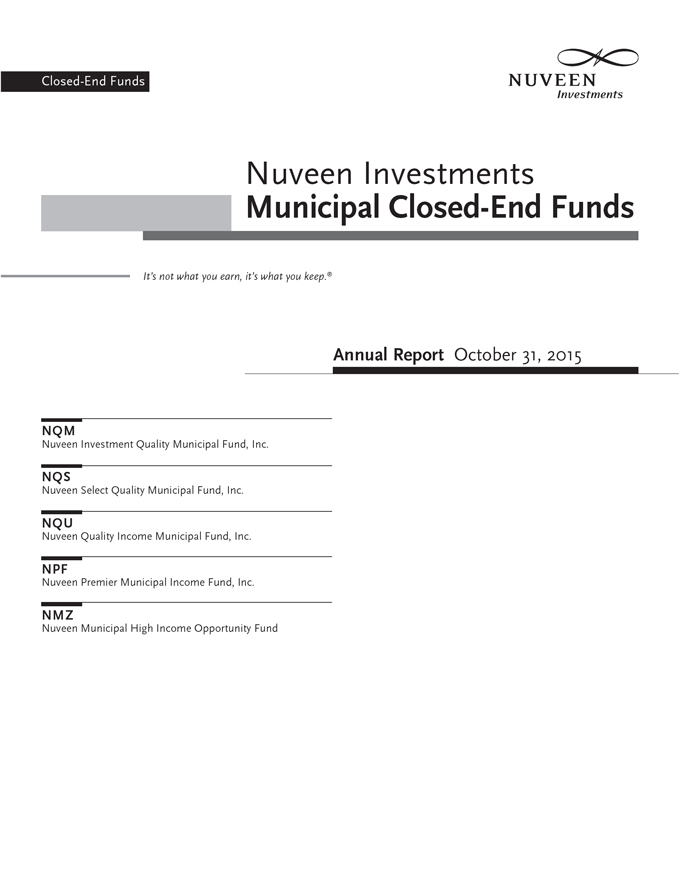
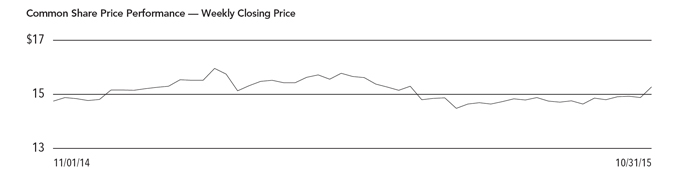
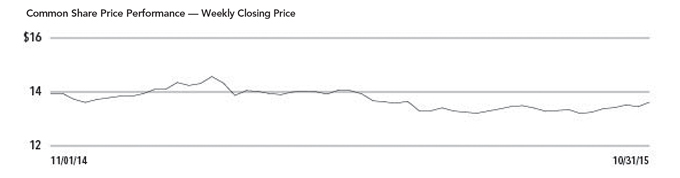
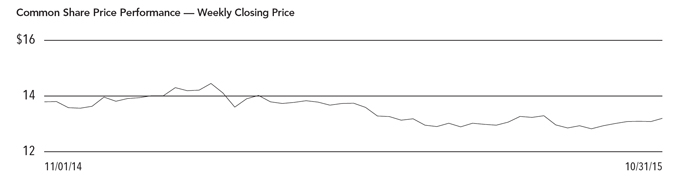
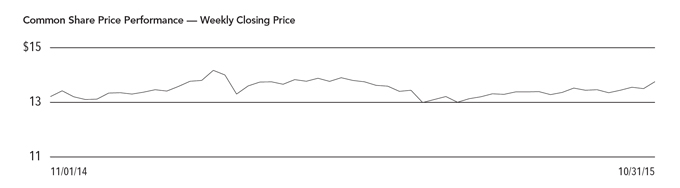
As of October 31, 2015, and during the current reporting period, the Funds' common share prices were trading at a premium/(discount) to their common share NAVs as shown in the accompanying table.
| | | | NQM | | | NQS | | | NQU | | | NPF | | | NMZ | |
| Common share NAV | | $ | 16.01 | | $ | 15.57 | | $ | 15.64 | | $ | 14.98 | | $ | 13.66 | |
| Common share price | | $ | 15.29 | | $ | 13.63 | | $ | 13.83 | | $ | 13.23 | | $ | 13.76 | |
| Premium/(Discount) to NAV | | | (4.50 | )% | | (12.46 | )% | | (11.57 | )% | | (11.68 | )% | | 0.73 | % |
| 12-month average premium/(discount) to NAV | | | (5.96 | )% | | (12.09 | )% | | (12.09 | )% | | (10.92 | )% | | (1.52 | )% |
Risk Considerations
Fund shares are not guaranteed or endorsed by any bank or other insured depository institution, and are not federally insured by the Federal Deposit Insurance Corporation.
Nuveen Investment Quality Municipal Fund, Inc. (NQM)
Investing in closed-end funds involves risk; principal loss is possible. There is no guarantee the Fund's investment objectives will be achieved. Closed-end fund shares may frequently trade at a discount or premium to their net asset value. Debt or fixed income securities such as those held by the Fund, are subject to market risk, credit risk, interest rate risk, derivatives risk, liquidity risk, and income risk. As interest rates rise, bond prices fall. Leverage increases return volatility and magnifies the Fund's potential return and its risks; there is no guarantee a fund's leverage strategy will be successful. These and other risk considerations such as inverse floater risk and tax risk are described in more detail on the Fund's web page at www.nuveen.com/NQM.
Nuveen Select Quality Municipal Fund, Inc. (NQS)
Investing in closed-end funds involves risk; principal loss is possible. There is no guarantee the Fund's investment objectives will be achieved. Closed-end fund shares may frequently trade at a discount or premium to their net asset value. Debt or fixed income securities such as those held by the Fund, are subject to market risk, credit risk, interest rate risk, derivatives risk, liquidity risk, and income risk. As interest rates rise, bond prices fall. Leverage increases return volatility and magnifies the Fund's potential return and its risks; there is no guarantee a fund's leverage strategy will be successful. These and other risk considerations such as inverse floater risk and tax risk are described in more detail on the Fund's web page at www.nuveen.com/NQS.
Nuveen Quality Income Municipal Fund, Inc. (NQU)
Investing in closed-end funds involves risk; principal loss is possible. There is no guarantee the Fund's investment objectives will be achieved. Closed-end fund shares may frequently trade at a discount or premium to their net asset value. Debt or fixed income securities such as those held by the Fund, are subject to market risk, credit risk, interest rate risk, derivatives risk, liquidity risk, and income risk. As interest rates rise, bond prices fall. Leverage increases return volatility and magnifies the Fund's potential return and its risks; there is no guarantee a fund's leverage strategy will be successful. These and other risk considerations such as inverse floater risk and tax risk are described in more detail on the Fund's web page at www.nuveen.com/NQU.
Nuveen Premier Municipal Income Fund, Inc. (NPF)
Investing in closed-end funds involves risk; principal loss is possible. There is no guarantee the Fund's investment objectives will be achieved. Closed-end fund shares may frequently trade at a discount or premium to their net asset value. Debt or fixed income securities such as those held by the Fund, are subject to market risk, credit risk, interest rate risk, derivatives risk, liquidity risk, and income risk. As interest rates rise, bond prices fall. Leverage increases return volatility and magnifies the Fund's potential return and its risks; there is no guarantee a fund's leverage strategy will be successful. These and other risk considerations such as inverse floater risk and tax risk are described in more detail on the Fund's web page at www.nuveen.com/NPF.
Nuveen Municipal High Income Opportunity Fund (NMZ)
Investing in closed-end funds involves risk; principal loss is possible. There is no guarantee the Fund's investment objectives will be achieved. Closed-end fund shares may frequently trade at a discount or premium to their net asset value. Debt or fixed income securities such as those held by the Fund, are subject to market risk, credit risk, interest rate risk, derivatives risk, liquidity risk, and income risk. As interest rates rise, bond prices fall. Lower credit debt securities may be more likely to fail to make timely interest or principal payments. Leverage increases return volatility and magnifies the Fund's potential return and its risks; there is no guarantee a fund's leverage strategy will be successful. These and other risk considerations such as inverse floater risk and tax risk are described in more detail on the Fund's web page at www.nuveen.com/NMZ.
| NQM | |
| | Nuveen Investment Quality Municipal Fund, Inc. |
| | Performance Overview and Holding Summaries as of October 31, 2015 |
Refer to the Glossary of Terms Used in this Report for further definition of the terms used within this section.
Average Annual Total Returns as of October 31, 2015
| | Average Annual |
| | 1-Year | | 5-Year | | 10-Year |
| NQM at Common Share NAV | 5.05% | | 7.69% | | 6.60% |
| NQM at Common Share Price | 10.22% | | 7.24% | | 7.14% |
| S&P Municipal Bond Index | 2.87% | | 4.41% | | 4.69% |
| Lipper General & Insured Leveraged Municipal Debt Funds Classification Average | 4.65% | | 7.47% | | 6.22% |
Past performance is not predictive of future results. Current performance may be higher or lower than the data shown. Returns do not reflect the deduction of taxes that shareholders may have to pay on Fund distributions or upon the sale of Fund shares. Returns at NAV are net of Fund expenses, and assume reinvestment of distributions. Comparative index and Lipper return information is provided for the Fund's shares at NAV only. Indexes and Lipper averages are not available for direct investment.
This data relates to the securities held in the Fund's portfolio of investments as of the end of the reporting period. It should not be construed as a measure of performance for the Fund itself. Holdings are subject to change.
Ratings shown are the highest rating given by one of the following national rating agencies: Standard & Poor's Group, Moody's Investors Service, Inc. or Fitch, Inc. Credit ratings are subject to change. AAA, AA, A and BBB are investment grade ratings; BB, B, CCC, CC, C and D are below-investment grade ratings. Certain bonds backed by U.S. Government or agency securities are regarded as having an implied rating equal to the rating of such securities. Holdings designated N/R are not rated by these national rating agencies.
| Fund Allocation | |
| (% of net assets) | |
| Long-Term Municipal Bonds | 147.4% |
| Corporate Bonds | 0.0% |
| Short-Term Municipal Bonds | 0.4% |
| Other Assets Less Liabilities | 2.5% |
| Net Assets Plus Floating Rate Obligations, VMTP Shares, at Liquidation Value VRDP Shares, at Liquidation Value | 150.3% |
| Floating Rate Obligations | (8.2)% |
| VMTP Shares, at Liquidation Value | (6.5)% |
| VRDP Shares, at Liquidation Value | (35.6)% |
| Net Assets | 100% |
| Credit Quality | |
| (% of total investment exposure) | |
| AAA/U.S. Guaranteed | 11.7% |
| AA | 38.4% |
| A | 25.8% |
| BBB | 14.2% |
| BB or Lower | 5.2% |
| N/R (not rated) | 4.7% |
| Total | 100% |
| Portfolio Composition | |
| (% of total investments) | |
| Health Care | 20.8% |
| Transportation | 14.5% |
| Tax Obligation/Limited | 11.5% |
| Education and Civic Organizations | 10.3% |
| U.S. Guaranteed | 9.5% |
| Tax Obligation/General | 9.3% |
| Utilities | 7.6% |
| Water and Sewer | 7.0% |
| Other | 9.5% |
| Total | 100% |
| States and Territories | |
| (% of total municipal bonds) | |
| California | 15.5% |
| Texas | 10.4% |
| Illinois | 9.5% |
| Florida | 7.9% |
| Colorado | 6.2% |
| Pennsylvania | 3.5% |
| District of Columbia | 3.4% |
| New York | 3.3% |
| Ohio | 3.2% |
| Arizona | 2.6% |
| Minnesota | 2.3% |
| Tennessee | 2.3% |
| Wisconsin | 2.2% |
| Missouri | 2.0% |
| South Carolina | 1.9% |
| Louisiana | 1.9% |
| Nebraska | 1.7% |
| Georgia | 1.6% |
| Other | 18.6% |
| Total | 100% |
| NQS | |
| | Nuveen Select Quality Municipal Fund, Inc. |
| | Performance Overview and Holding Summaries as of October 31, 2015 |
Refer to the Glossary of Terms Used in this Report for further definition of the terms used within this section.
Average Annual Total Returns as of October 31, 2015
| | Average Annual |
| | 1-Year | | 5-Year | | 10-Year |
| NQS at Common Share NAV | 4.53% | | 7.49% | | 6.42% |
| NQS at Common Share Price | 3.26% | | 4.28% | | 5.69% |
| S&P Municipal Bond Index | 2.87% | | 4.41% | | 4.69% |
| Lipper General & Insured Leveraged Municipal Debt Funds Classification Average | 4.65% | | 7.47% | | 6.22% |
Past performance is not predictive of future results. Current performance may be higher or lower than the data shown. Returns do not reflect the deduction of taxes that shareholders may have to pay on Fund distributions or upon the sale of Fund shares. Returns at NAV are net of Fund expenses, and assume reinvestment of distributions. Comparative index and Lipper return information is provided for the Fund's shares at NAV only. Indexes and Lipper averages are not available for direct investment.
This data relates to the securities held in the Fund's portfolio of investments as of the end of the reporting period. It should not be construed as a measure of performance for the Fund itself. Holdings are subject to change.
Ratings shown are the highest rating given by one of the following national rating agencies: Standard & Poor's Group, Moody's Investors Service, Inc. or Fitch, Inc. Credit ratings are subject to change. AAA, AA, A and BBB are investment grade ratings; BB, B, CCC, CC, C and D are below-investment grade ratings. Certain bonds backed by U.S. Government or agency securities are regarded as having an implied rating equal to the rating of such securities. Holdings designated N/R are not rated by these national rating agencies.
| Fund Allocation | |
| (% of net assets) | |
| Long-Term Municipal Bonds | 146.4% |
| Corporate Bonds | 0.0% |
| Other Assets Less Liabilities | 4.9% |
| Net Assets Plus Floating Rate Obligations & VRDP Shares, at Liquidation Value | 151.3% |
| Floating Rate Obligations | (2.5)% |
| VRDP Shares, at Liquidation Value | (48.8)% |
| Net Assets | 100% |
| Credit Quality | |
| (% of total investment exposure) | |
| AAA/U.S. Guaranteed | 16.7% |
| AA | 45.5% |
| A | 21.2% |
| BBB | 7.9% |
| BB or Lower | 7.3% |
| N/R (not rated) | 1.4% |
| Total | 100% |
| Portfolio Composition | |
| (% of total investments) | |
| Transportation | 20.0% |
| Health Care | 18.4% |
| Tax Obligation/Limited | 17.6% |
| Tax Obligation/General | 13.4% |
| U.S. Guaranteed | 8.4% |
| Consumer Staples | 6.3% |
| Utilities | 6.1% |
| Other | 9.8% |
| Total | 100% |
| States and Territories | |
| (% of total municipal bonds) | |
| Texas | 16.4% |
| Illinois | 14.1% |
| California | 7.4% |
| Florida | 5.9% |
| Colorado | 5.5% |
| Ohio | 5.3% |
| Nevada | 3.9% |
| New York | 3.9% |
| Michigan | 3.6% |
| New Jersey | 3.2% |
| South Carolina | 2.7% |
| Pennsylvania | 2.6% |
| Indiana | 2.4% |
| Missouri | 2.3% |
| North Carolina | 1.7% |
| Other | 19.1% |
| Total | 100% |
| NQU | |
| | Nuveen Quality Income Municipal Fund, Inc. |
| | Performance Overview and Holding Summaries as of October 31, 2015 |
Refer to the Glossary of Terms Used in this Report for further definition of the terms used within this section.
Average Annual Total Returns as of October 31, 2015
| | Average Annual |
| | 1-Year | | 5-Year | | 10-Year |
| NQU at Common Share NAV | 5.04% | | 7.21% | | 6.14% |
| NQU at Common Share Price | 5.06% | | 5.07% | | 5.85% |
| S&P Municipal Bond Index | 2.87% | | 4.41% | | 4.69% |
| Lipper General & Insured Leveraged Municipal Debt Funds Classification Average | 4.65% | | 7.47% | | 6.22% |
Past performance is not predictive of future results. Current performance may be higher or lower than the data shown. Returns do not reflect the deduction of taxes that shareholders may have to pay on Fund distributions or upon the sale of Fund shares. Returns at NAV are net of Fund expenses, and assume reinvestment of distributions. Comparative index and Lipper return information is provided for the Fund's shares at NAV only. Indexes and Lipper averages are not available for direct investment.
This data relates to the securities held in the Fund's portfolio of investments as of the end of the reporting period. It should not be construed as a measure of performance for the Fund itself. Holdings are subject to change.
Ratings shown are the highest rating given by one of the following national rating agencies: Standard & Poor's Group, Moody's Investors Service, Inc. or Fitch, Inc. Credit ratings are subject to change. AAA, AA, A and BBB are investment grade ratings; BB, B, CCC, CC, C and D are below-investment grade ratings. Certain bonds backed by U.S. Government or agency securities are regarded as having an implied rating equal to the rating of such securities. Holdings designated N/R are not rated by these national rating agencies.
| Fund Allocation | |
| (% of net assets) | |
| Long-Term Municipal Bonds | 150.4% |
| Corporate Bonds | 0.0% |
| Short-Term Municipal Bonds | 0.3% |
| Other Assets Less Liabilities | 4.1% |
| Net Assets Plus Floating Rate Obligations & VRDP Shares, at Liquidation Value | 154.8% |
| Floating Rate Obligations | (4.4)% |
| VRDP Shares, at Liquidation Value | (50.4)% |
| Net Assets | 100% |
| Credit Quality | |
| (% of total investment exposure) | |
| AAA/U.S. Guaranteed | 14.2% |
| AA | 47.2% |
| A | 17.4% |
| BBB | 9.8% |
| BB or Lower | 10.0% |
| N/R (not rated) | 1.4% |
| Total | 100% |
| Portfolio Composition | |
| (% of total investments) | |
| Health Care | 21.8% |
| Transportation | 21.3% |
| Tax Obligation/Limited | 16.7% |
| Tax Obligation/General | 11.4% |
| U.S. Guaranteed | 8.3% |
| Consumer Staples | 7.4% |
| Other | 13.1% |
| Total | 100% |
| States and Territories | |
| (% of total municipal bonds) | |
| California | 14.3% |
| Illinois | 10.7% |
| Texas | 10.6% |
| Colorado | 6.8% |
| New York | 5.3% |
| Ohio | 4.6% |
| Michigan | 4.0% |
| Florida | 3.0% |
| Indiana | 2.9% |
| Virginia | 2.8% |
| Nevada | 2.6% |
| Missouri | 2.6% |
| New Jersey | 2.5% |
| Louisiana | 2.3% |
| Georgia | 2.2% |
| South Carolina | 2.0% |
| Iowa | 2.0% |
| Other | 18.8% |
| Total | 100% |
| NPF | |
| | Nuveen Premier Municipal Income Fund, Inc. |
| | Performance Overview and Holding Summaries as of October 31, 2015 |
Refer to the Glossary of Terms Used in this Report for further definition of the terms used within this section.
Average Annual Total Returns as of October 31, 2015
| | Average Annual |
| | 1-Year | | 5-Year | | 10-Year |
| NPF at Common Share NAV | 3.14% | | 6.41% | | 5.70% |
| NPF at Common Share Price | 2.36% | | 4.75% | | 5.85% |
| S&P Municipal Bond Index | 2.87% | | 4.41% | | 4.69% |
| Lipper General & Insured Leveraged Municipal Debt Funds Classification Average | 4.65% | | 7.47% | | 6.22% |
Past performance is not predictive of future results. Current performance may be higher or lower than the data shown. Returns do not reflect the deduction of taxes that shareholders may have to pay on Fund distributions or upon the sale of Fund shares. Returns at NAV are net of Fund expenses, and assume reinvestment of distributions. Comparative index and Lipper return information is provided for the Fund's shares at NAV only. Indexes and Lipper averages are not available for direct investment.
This data relates to the securities held in the Fund's portfolio of investments as of the end of the reporting period. It should not be construed as a measure of performance for the Fund itself. Holdings are subject to change.
Ratings shown are the highest rating given by one of the following national rating agencies: Standard & Poor's Group, Moody's Investors Service, Inc. or Fitch, Inc. Credit ratings are subject to change. AAA, AA, A and BBB are investment grade ratings; BB, B, CCC, CC, C and D are below-investment grade ratings. Certain bonds backed by U.S. Government or agency securities are regarded as having an implied rating equal to the rating of such securities. Holdings designated N/R are not rated by these national rating agencies.
| Fund Allocation | |
| (% of net assets) | |
| Long-Term Municipal Bonds | 144.0% |
| Short-Term Municipal Bonds | 1.3% |
| Other Assets Less Liabilities | 5.1% |
| Net Assets Plus Floating Rate Obligations & VRDP Shares, at Liquidation Value | 150.4% |
| Floating Rate Obligations | (7.5)% |
| VRDP Shares, at Liquidation Value | (42.9)% |
| Net Assets | 100% |
| Credit Quality | |
| (% of total investment exposure) | |
| AAA/U.S. Guaranteed | 18.7% |
| AA | 43.2% |
| A | 17.6% |
| BBB | 10.6% |
| BB or Lower | 6.5% |
| N/R (not rated) | 3.4% |
| Total | 100% |
| Portfolio Composition | |
| (% of total investments) | |
| Tax Obligation/Limited | 22.1% |
| Transportation | 17.9% |
| Utilities | 12.7% |
| U.S. Guaranteed | 10.5% |
| Health Care | 9.7% |
| Water and Sewer | 6.6% |
| Tax Obligation/General | 6.2% |
| Other | 14.3% |
| Total | 100% |
| States and Territories | |
| (% of total investments) | |
| California | 14.5% |
| Illinois | 11.3% |
| Texas | 6.4% |
| New York | 5.6% |
| Colorado | 5.3% |
| Louisiana | 4.9% |
| North Carolina | 4.1% |
| New Jersey | 3.8% |
| Arizona | 3.5% |
| Nevada | 3.3% |
| Ohio | 2.6% |
| Kentucky | 2.5% |
| Michigan | 2.3% |
| Indiana | 2.3% |
| Massachusetts | 1.9% |
| Utah | 1.9% |
| Pennsylvania | 1.7% |
| Maryland | 1.6% |
| South Carolina | 1.6% |
| Other | 18.9% |
| Total | 100% |
| NMZ | |
| | Nuveen Municipal High Income Opportunity Fund |
| | Performance Overview and Holding Summaries as of October 31, 2015 |
Refer to the Glossary of Terms Used in this Report for further definition of the terms used within this section.
Average Annual Total Returns as of October 31, 2015
| | Average Annual |
| | 1-Year | | 5-Year | | 10-Year |
| NMZ at Common Share NAV | 6.54% | | 10.08% | | 6.72% |
| NMZ at Common Share Price | 11.49% | | 8.85% | | 6.17% |
| S&P Municipal Bond High Yield Index | 3.47% | | 6.92% | | 5.27% |
| S&P Municipal Bond Index | 2.87% | | 4.41% | | 4.69% |
| Lipper High-Yield Municipal Debt Funds Classification Average | 5.30% | | 7.78% | | 6.18% |
Past performance is not predictive of future results. Current performance may be higher or lower than the data shown. Returns do not reflect the deduction of taxes that shareholders may have to pay on Fund distributions or upon the sale of Fund shares. Returns at NAV are net of Fund expenses, and assume reinvestment of distributions. Comparative index and Lipper return information is provided for the Fund's shares at NAV only. Indexes and Lipper averages are not available for direct investment.
This data relates to the securities held in the Fund's portfolio of investments as of the end of the reporting period. It should not be construed as a measure of performance for the Fund itself. Holdings are subject to change.
Ratings shown are the highest rating given by one of the following national rating agencies: Standard & Poor's Group, Moody's Investors Service, Inc. or Fitch, Inc. Credit ratings are subject to change. AAA, AA, A and BBB are investment grade ratings; BB, B, CCC, CC, C and D are below-investment grade ratings. Certain bonds backed by U.S. Government or agency securities are regarded as having an implied rating equal to the rating of such securities. Holdings designated N/R are not rated by these national rating agencies.
| Fund Allocation | |
| (% of net assets) | |
| Long-Term Municipal Bonds | 111.4% |
| Common Stocks | 1.6% |
| Corporate Bonds | 0.0% |
| Other Assets Less Liabilities | 1.6% |
| Net Assets Plus Floating Rate Obligations & VMTP Shares, at Liquidation Value | 114.6% |
| Floating Rate Obligations | (1.9)% |
| VMTP Shares, at Liquidation Value | (12.7)% |
| Net Assets | 100% |
| Credit Quality | |
| (% of total investment exposure) | |
| AAA/U.S. Guaranteed | 5.6% |
| AA | 24.2% |
| A | 9.4% |
| BBB | 11.9% |
| BB or Lower | 14.7% |
| N/R (not rated) | 33.1% |
| N/A (not applicable) | 1.1% |
| Total | 100% |
| Portfolio Composition | |
| (% of total investments) | |
| Tax Obligation/Limited | 23.0% |
| Education and Civic Organizations | 16.2% |
| Health Care | 13.8% |
| Industrials | 8.1% |
| Transportation | 7.1% |
| Consumer Staples | 5.6% |
| Utilities | 5.0% |
| Long-Term Care | 4.1% |
| Other | 17.1% |
| Total | 100% |
| States and Territories | |
| (% of total municipal bonds) | |
| California | 14.6% |
| Florida | 12.4% |
| Illinois | 8.3% |
| Colorado | 8.2% |
| Texas | 6.2% |
| Ohio | 4.1% |
| Arizona | 3.9% |
| Louisiana | 3.8% |
| New York | 3.1% |
| Indiana | 3.1% |
| Wisconsin | 2.9% |
| Washington | 2.7% |
| Michigan | 2.7% |
| Missouri | 2.0% |
| New Jersey | 2.0% |
| Other | 20.0% |
| Total | 100% |
| Shareholder Meeting Report |
The annual meeting of shareholders was held in the offices of Nuveen Investments on August 5, 2015 for NQM, NQS, NQU, NPF and NMZ; at this meeting the shareholders were asked to elect Board Members.
| | | NQM | | NQS | | NQU | |
| | | | Common and | | | | | | Common and | | | | | | Common and | | | | |
| | | | Preferred | | | Preferred | | | Preferred | | | | | | Preferred | | | | |
| | | | shares voting | | | shares voting | | | shares voting | | | | | | shares voting | | | | |
| | | | together | | | together | | | together | | | Preferred | | | together | | | Preferred | |
| | | | as a class | | | as a class | | | as a class | | | Shares | | | as a class | | | Shares | |
| Approval of the Board Members was reached as follows: | | | | | | | | | | | | | |
| William Adams IV | | | | | | | | | | | | | | | | | | | |
| For | | | 35,386,828 | | | — | | | 26,582,635 | | | — | | | 38,334,633 | | | — | |
| Withhold | | | 813,487 | | | — | | | 2,705,971 | | | — | | | 2,157,480 | | | — | |
| Total | | | 36,200,315 | | | — | | | 29,288,606 | | | — | | | 40,492,113 | | | — | |
| Jack B. Evans | | | | | | | | | | | | | | | | | | | |
| For | | | 35,266,589 | | | — | | | 26,582,031 | | | — | | | 38,344,262 | | | — | |
| Withhold | | | 933,726 | | | — | | | 2,706,575 | | | — | | | 2,147,851 | | | — | |
| Total | | | 36,200,315 | | | — | | | 29,288,606 | | | — | | | 40,492,113 | | | — | |
| William C. Hunter | | | | | | | | | | | | | | | | | | | |
| For | | | — | | | 1,588 | | | — | | | 1,675 | | | — | | | 2,097 | |
| Withhold | | | — | | | 300 | | | — | | | 250 | | | — | | | 481 | |
| Total | | | — | | | 1,888 | | | — | | | 1,925 | | | — | | | 2,578 | |
| David J. Kundert | | | | | | | | | | | | | | | | | | | |
| For | | | 35,231,886 | | | — | | | 26,538,842 | | | — | | | 38,297,668 | | | — | |
| Withhold | | | 968,429 | | | — | | | 2,749,764 | | | — | | | 2,194,445 | | | — | |
| Total | | | 36,200,315 | | | — | | | 29,288,606 | | | — | | | 40,492,113 | | | — | |
| John K. Nelson | | | | | | | | | | | | | | | | | | | |
| For | | | 35,342,022 | | | — | | | 26,582,111 | | | — | | | 38,364,719 | | | — | |
| Withhold | | | 858,293 | | | — | | | 2,706,495 | | | — | | | 2,127,394 | | | — | |
| Total | | | 36,200,315 | | | — | | | 29,288,606 | | | — | | | 40,492,113 | | | — | |
| William J. Schneider | | | | | | | | | | | | | | | | | | | |
| For | | | — | | | 1,588 | | | — | | | 1,675 | | | — | | | 2,097 | |
| Withhold | | | — | | | 300 | | | — | | | 250 | | | — | | | 481 | |
| Total | | | — | | | 1,888 | | | — | | | 1,925 | | | — | | | 2,578 | |
| Thomas S. Schreier, Jr. | | | | | | | | | | | | | | | | | | | |
| For | | | 35,389,150 | | | — | | | 26,582,962 | | | — | | | 38,326,816 | | | — | |
| Withhold | | | 811,165 | | | — | | | 2,705,644 | | | — | | | 2,165,297 | | | — | |
| Total | | | 36,200,315 | | | — | | | 29,288,606 | | | — | | | 40,492,113 | | | — | |
| Judith M. Stockdale | | | | | | | | | | | | | | | | | | | |
| For | | | 35,346,167 | | | — | | | 26,562,021 | | | — | | | 38,336,543 | | | — | |
| Withhold | | | 854,148 | | | — | | | 2,726,585 | | | — | | | 2,155,570 | | | — | |
| Total | | | 36,200,315 | | | — | | | 29,288,606 | | | — | | | 40,492,113 | | | — | |
| Carole E. Stone | | | | | | | | | | | | | | | | | | | |
| For | | | 35,378,790 | | | — | | | 26,569,352 | | | — | | | 38,328,110 | | | — | |
| Withhold | | | 821,525 | | | — | | | 2,719,254 | | | — | | | 2,164,003 | | | — | |
| Total | | | 36,200,315 | | | — | | | 29,288,606 | | | — | | | 40,492,113 | | | — | |
| Virginia L. Stringer | | | | | | | | | | | | | | | | | | | |
| For | | | 35,359,173 | | | — | | | 26,542,126 | | | — | | | 38,319,526 | | | — | |
| Withhold | | | 841,142 | | | — | | | 2,746,480 | | | — | | | 2,172,587 | | | — | |
| Total | | | 36,200,315 | | | — | | | 29,288,606 | | | — | | | 40,492,113 | | | — | |
| Terence J. Toth | | | | | | | | | | | | | | | | | | | |
| For | | | 35,334,442 | | | — | | | 26,583,604 | | | — | | | 38,332,545 | | | — | |
| Withhold | | | 865,873 | | | — | | | 2,705,002 | | | — | | | 2,159,568 | | | — | |
| Total | | | 36,200,315 | | | — | | | 29,288,606 | | | — | | | 40,492,113 | | | — | |
| | | NPF | | NMZ | |
| | | | Common and | | | | | | Common and | | | | |
| | | | Preferred | | | | | | Preferred | | | Preferred | |
| | | | shares voting | | | | | | shares voting | | | shares voting | |
| | | | together | | | Preferred | | | together | | | together | |
| | | | as a class | | | Shares | | | as a class | | | as a class | |
| Approval of the Board Members was reached as follows: | | | | | | | | | | | | | |
| William Adams IV | | | | | | | | | | | | | |
| For | | | 16,799,718 | | | — | | | — | | | — | |
| Withhold | | | 368,792 | | | — | | | — | | | — | |
| Total | | | 17,168,510 | | | — | | | — | | | — | |
| Jack B. Evans | | | | | | | | | | | | | |
| For | | | 16,716,660 | | | — | | | 43,455,493 | | | — | |
| Withhold | | | 451,850 | | | — | | | 1,819,473 | | | — | |
| Total | | | 17,168,510 | | | — | | | 45,274,966 | | | — | |
| William C. Hunter | | | | | | | | | | | | | |
| For | | | — | | | 1,227 | | | — | | | 870 | |
| Withhold | | | — | | | 50 | | | — | | | — | |
| Total | | | — | | | 1,277 | | | — | | | 870 | |
| David J. Kundert | | | | | | | | | | | | | |
| For | | | 16,732,004 | | | — | | | — | | | — | |
| Withhold | | | 436,506 | | | — | | | — | | | — | |
| Total | | | 17,168,510 | | | — | | | — | | | — | |
| John K. Nelson | | | | | | | | | | | | | |
| For | | | 16,781,087 | | | — | | | — | | | — | |
| Withhold | | | 387,423 | | | — | | | — | | | — | |
| Total | | | 17,168,510 | | | — | | | — | | | — | |
| William J. Schneider | | | | | | | | | | | | | |
| For | | | — | | | 1,227 | | | — | | | 870 | |
| Withhold | | | — | | | 50 | | | — | | | — | |
| Total | | | — | | | 1,277 | | | — | | | 870 | |
| Thomas S. Schreier, Jr. | | | | | | | | | | | | | |
| For | | | 16,781,807 | | | — | | | 43,541,654 | | | — | |
| Withhold | | | 386,703 | | | — | | | 1,733,312 | | | — | |
| Total | | | 17,168,510 | | | — | | | 45,274,966 | | | — | |
| Judith M. Stockdale | | | | | | | | | | | | | |
| For | | | 16,671,756 | | | — | | | — | | | — | |
| Withhold | | | 496,754 | | | — | | | — | | | — | |
| Total | | | 17,168,510 | | | — | | | — | | | — | |
| Carole E. Stone | | | | | | | | | | | | | |
| For | | | 16,743,174 | | | — | | | — | | | — | |
| Withhold | | | 425,336 | | | — | | | — | | | — | |
| Total | | | 17,168,510 | | | — | | | — | | | — | |
| Virginia L. Stringer | | | | | | | | | | | | | |
| For | | | 16,714,166 | | | — | | | — | | | — | |
| Withhold | | | 454,344 | | | — | | | — | | | — | |
| Total | | | 17,168,510 | | | — | | | — | | | — | |
| Terence J. Toth | | | | | | | | | | | | | |
| For | | | 16,773,649 | | | — | | | — | | | — | |
| Withhold | | | 394,861 | | | — | | | — | | | — | |
| Total | | | 17,168,510 | | | — | | | — | | | — | |
Report of Independent Registered Public Accounting Firm
To the Board of Directors/Trustees and Shareholders of
Nuveen Investment Quality Municipal Fund, Inc.
Nuveen Select Quality Municipal Fund, Inc.
Nuveen Quality Income Municipal Fund, Inc.
Nuveen Premier Municipal Income Fund, Inc.
Nuveen Municipal High Income Opportunity Fund:
We have audited the accompanying statements of assets and liabilities, including the portfolios of investments, of Nuveen Investment Quality Municipal Fund, Inc., Nuveen Select Quality Municipal Fund, Inc., Nuveen Quality Income Municipal Fund, Inc., Nuveen Premier Municipal Income Fund, Inc. and Nuveen Municipal High Income Opportunity Fund (the "Funds") as of October 31, 2015, and the related statements of operations for the year then ended, the statements of changes in net assets for each of the years in the two-year period then ended, the statements of cash flows for the year then ended and the financial highlights for each of the years in the two-year period then ended. The financial highlights for the periods presented through October 31, 2013, were audited by other auditors whose report dated December 27, 2013, expressed an unqualified opinion on those financial highlights. These financial statements and financial highlights are the responsibility of the Funds' management. Our responsibility is to express an opinion on these financial statements and financial highlights based on our audits.
We conducted our audits in accordance with the standards of the Public Company Accounting Oversight Board (United States). Those standards require that we plan and perform the audit to obtain reasonable assurance about whether the financial statements and financial highlights are free of material misstatement. An audit includes examining, on a test basis, evidence supporting the amounts and disclosures in the financial statements. Our procedures included confirmation of securities owned as of October 31, 2015, by correspondence with the custodian and brokers or other appropriate auditing procedures. An audit also includes assessing the accounting principles used and significant estimates made by management, as well as evaluating the overall financial statement presentation. We believe that our audits provide a reasonable basis for our opinion.
In our opinion, the financial statements and financial highlights referred to above present fairly, in all material respects, the financial position of the Funds as of October 31, 2015, the results of their operations for the year then ended, the changes in their net assets for each of the years in the two-year period then ended, their cash flows for the year then ended and the financial highlights for each of the years in the two-year period then ended, in conformity with U.S. generally accepted accounting principles.
/s/ KPMG LLP
Chicago, Illinois
December 28, 2015
| NQM | | |
| | Nuveen Investment Quality Municipal Fund, Inc. | |
| | Portfolio of Investments | October 31, 2015 |
| | Principal | | | Optional Call | | | | |
| | Amount (000) | | Description (1) | Provisions (2) | Ratings (3) | | Value | |
| | | | LONG-TERM INVESTMENTS 147.4% (99.7% of Total Investments) | | | | | |
| | | | MUNICIPAL BONDS 147.4% (99.7% of Total Investments) | | | | | |
| | | | Alabama – 0.7% (0.5% of Total Investments) | | | | | |
| $ | 3,800 | | Alabama Special Care Facilities Financing Authority, Revenue Bonds, Ascension Health, Series 2006C-2, 5.000%, 11/15/36 (UB) | 11/16 at 100.00 | AA+ | $ | 3,953,064 | |
| | 1,000 | | Jefferson County, Alabama, Limited Obligation School Warrants, Education Tax Revenue Bonds, Series 2004A, 5.250%, 1/01/23 – AGM Insured | 1/16 at 100.00 | AA | | 1,005,820 | |
| | 4,800 | | Total Alabama | | | | 4,958,884 | |
| | | | Alaska – 0.6% (0.4% of Total Investments) | | | | | |
| | | | Northern Tobacco Securitization Corporation, Alaska, Tobacco Settlement Asset-Backed Bonds, Series 2006A: | | | | | |
| | 4,000 | | 5.000%, 6/01/32 | 12/15 at 100.00 | B | | 3,634,040 | |
| | 500 | | 5.000%, 6/01/46 | 12/15 at 100.00 | B | | 419,940 | |
| | 4,500 | | Total Alaska | | | | 4,053,980 | |
| | | | Arizona – 3.8% (2.6% of Total Investments) | | | | | |
| | 980 | | Apache County Industrial Development Authority, Arizona, Pollution Control Revenue Bonds, Tucson Electric Power Company, Series 20102A, 4.500%, 3/01/30 | 3/22 at 100.00 | A3 | | 1,045,258 | |
| | 2,500 | | Arizona Health Facilities Authority, Revenue Bonds, Scottsdale Lincoln Hospitals Project, Series 2014A, 5.000%, 12/01/39 | 12/24 at 100.00 | A2 | | 2,753,850 | |
| | | | Arizona Sports and Tourism Authority, Tax Revenue Bonds, Multipurpose Stadium Facility Project, Refunding Senior Series 2012A: | | | | | |
| | 1,490 | | 5.000%, 7/01/30 | 7/22 at 100.00 | A1 | | 1,615,398 | |
| | 2,500 | | 5.000%, 7/01/32 | 7/22 at 100.00 | A1 | | 2,691,925 | |
| | | | Glendale Industrial Development Authority, Arizona, Revenue Bonds, John C. Lincoln Health Network, Series 2005B: | | | | | |
| | 485 | | 5.250%, 12/01/24 (Pre-refunded 12/01/15) | 12/15 at 100.00 | N/R (4) | | 487,144 | |
| | 265 | | 5.250%, 12/01/25 (Pre-refunded 12/01/15) | 12/15 at 100.00 | N/R (4) | | 266,171 | |
| | 2,000 | | Maricopa County Industrial Development Authority, Arizona, Health Facility Revenue Bonds, Catholic Healthcare West, Series 2007A, 5.250%, 7/01/32 | 7/17 at 100.00 | A | | 2,087,640 | |
| | 2,500 | | Mesa, Arizona, Utility System Revenue Bonds, Tender Option Bond Trust, Series 11032-11034, 15.285%, 7/01/26 – AGM Insured (IF) | 7/17 at 100.00 | AA | | 2,647,800 | |
| | 5,000 | | Phoenix, Arizona, Civic Improvement Corporation, Senior Lien Airport Revenue Bonds, Series 2008, Trust 1132, 9.221%, 1/01/32 (IF) | 7/18 at 100.00 | AA– | | 5,880,800 | |
| | 3,450 | | Salt Verde Financial Corporation, Arizona, Senior Gas Revenue Bonds, Citigroup Energy Inc. Prepay Contract Obligations, Series 2007, 5.000%, 12/01/37 | No Opt. Call | A– | | 3,855,237 | |
| | 1,100 | | Student and Academic Services LLC, Arizona, Lease Revenue Bonds, Northern Arizona University Project, Series 2014, 5.000%, 6/01/34 – BAM Insured | 6/24 at 100.00 | AA | | 1,248,478 | |
| | 895 | | Watson Road Community Facilities District, Arizona, Special Assessment Revenue Bonds, Series 2005, 6.000%, 7/01/30 | 7/16 at 100.00 | N/R | | 902,455 | |
| | 23,165 | | Total Arizona | | | | 25,482,156 | |
| | | | California – 22.5% (15.2% of Total Investments) | | | | | |
| | 1,500 | | ABAG Finance Authority for Non-Profit Corporations, California, Cal-Mortgage Insured Revenue Bonds, Channing House, Series 2010, 6.000%, 5/15/30 | 5/20 at 100.00 | AA– | | 1,754,970 | |
| | 2,500 | | California Health Facilities Financing Authority, Revenue Bonds, Cedars-Sinai Medical Center, Series 2005, 5.000%, 11/15/27 | 11/15 at 100.00 | Aa3 | | 2,509,300 | |
| | 4,285 | | California Health Facilities Financing Authority, Revenue Bonds, Kaiser Permanente System, Series 2006, 5.000%, 4/01/37 | 4/16 at 100.00 | A+ | | 4,339,977 | |
| NQM | Nuveen Investment Quality Municipal Fund, Inc. | |
| | Portfolio of Investments (continued) | October 31, 2015 |
| | Principal | | | Optional Call | | | | |
| | Amount (000) | | Description (1) | Provisions (2) | Ratings (3) | | Value | |
| | | | California (continued) | | | | | |
| $ | 180 | | California Health Facilities Financing Authority, Revenue Bonds, Saint Joseph Health System, Series 2013A, 5.000%, 7/01/37 | 7/23 at 100.00 | AA– | $ | 205,288 | |
| | 5,500 | | California Health Facilities Financing Authority, Revenue Bonds, Sutter Health, 2007A, 5.000%, 11/15/42 (UB) | 11/16 at 100.00 | AA– | | 5,676,715 | |
| | 1,390 | | California Health Facilities Financing Authority, Revenue Bonds, Sutter Health, Tender Option Bond Trust 2015-XF0078, 13.508%, 5/15/40 (IF) | 5/18 at 100.00 | AA– | | 1,913,377 | |
| | 810 | | California State Public Works Board, Lease Revenue Bonds, Various Capital Projects, Series 2009-I, 6.375%, 11/01/34 | 11/19 at 100.00 | A+ | | 975,272 | |
| | 1,530 | | California State Public Works Board, Lease Revenue Bonds, Various Capital Projects, Series 2010A-1, 5.750%, 3/01/30 | 3/20 at 100.00 | A+ | | 1,788,631 | |
| | | | California State, General Obligation Bonds, Various Purpose Series 2010: | | | | | |
| | 2,100 | | 5.250%, 3/01/30 | 3/20 at 100.00 | AA– | | 2,428,398 | |
| | 3,000 | | 5.500%, 3/01/40 | 3/20 at 100.00 | AA– | | 3,459,570 | |
| | | | California Statewide Communities Development Authority, Revenue Bonds, American Baptist Homes of the West, Series 2010: | | | | | |
| | 900 | | 6.000%, 10/01/29 | 10/19 at 100.00 | BBB+ | | 994,725 | |
| | 1,030 | | 6.250%, 10/01/39 | 10/19 at 100.00 | BBB+ | | 1,135,441 | |
| | 1,050 | | California Statewide Communities Development Authority, School Facility Revenue Bonds, Aspire Public Schools, Series 2010, 6.000%, 7/01/40 | 1/19 at 100.00 | BB | | 1,111,289 | |
| | 1,000 | | California Statewide Community Development Authority, Revenue Bonds, Children's Hospital of Los Angeles, Series 2007, 5.000%, 8/15/47 | 8/17 at 100.00 | BBB+ | | 1,036,470 | |
| | | | California Statewide Community Development Authority, Revenue Bonds, Daughters of Charity Health System, Series 2005A: | | | | | |
| | 1,000 | | 5.250%, 7/01/30 | 1/16 at 100.00 | CCC | | 899,360 | |
| | 2,000 | | 5.000%, 7/01/39 | 1/16 at 100.00 | CCC | | 1,790,300 | |
| | 2,530 | | Commerce Joint Power Financing Authority, California, Tax Allocation Bonds, Redevelopment Projects 2 and 3, Refunding Series 2003A, 5.000%, 8/01/28 – RAAI Insured | 2/15 at 100.00 | AA | | 2,533,390 | |
| | 1,260 | | Davis Redevelopment Agency, California, Tax Allocation Bonds, Davis Redevelopment Project, Subordinate Series 2011A, 7.000%, 12/01/36 | 12/21 at 100.00 | A+ | | 1,576,814 | |
| | 3,500 | | Foothill/Eastern Transportation Corridor Agency, California, Toll Road Revenue Bonds, Refunding Senior Lien Series 2015A, 0.000%, 1/15/34 – AGM Insured | No Opt. Call | AA | | 1,665,335 | |
| | 1,500 | | Gavilan Joint Community College District, Santa Clara and San Benito Counties, California, General Obligation Bonds, Election of 2004 Series 2011D, 5.750%, 8/01/35 | 8/21 at 100.00 | Aa2 | | 1,782,870 | |
| | 2,000 | | Glendale Redevelopment Agency, California, Tax Allocation Bonds, Central Glendale Redevelopment Project, Series 2010, 5.500%, 12/01/24 | 12/16 at 100.00 | A | | 2,071,940 | |
| | | | Golden State Tobacco Securitization Corporation, California, Tobacco Settlement Asset-Backed Bonds, Series 2007A-1: | | | | | |
| | 3,000 | | 5.000%, 6/01/33 | 6/17 at 100.00 | B | | 2,676,330 | |
| | 1,000 | | 5.750%, 6/01/47 | 6/17 at 100.00 | B | | 922,380 | |
| | 610 | | 5.125%, 6/01/47 | 6/17 at 100.00 | B | | 518,091 | |
| | 9,740 | | Huntington Park Redevelopment Agency, California, Single Family Residential Mortgage Revenue Refunding Bonds, Series 1986A, 8.000%, 12/01/19 (ETM) | No Opt. Call | Aaa | | 12,529,924 | |
| | 2,000 | | Los Rios Community College District, Sacramento County, California, General Obligation Bonds, Series 2009D, 5.375%, 8/01/34 | 8/19 at 100.00 | AA– | | 2,266,260 | |
| | 250 | | Lynwood Redevelopment Agency, California, Project A Revenue Bonds, Subordinate Lien Series 2011A, 7.000%, 9/01/31 | 9/21 at 100.00 | A– | | 310,573 | |
| | 500 | | Madera County, California, Certificates of Participation, Children's Hospital Central California, Series 2010, 5.375%, 3/15/36 | 3/20 at 100.00 | AA– | | 555,700 | |
| | 6,215 | | Martinez Unified School District, Contra Costa County, California, General Obligation Bonds, Series 2011, 5.875%, 8/01/31 | 8/24 at 100.00 | AA | | 7,776,830 | |
| | 1,160 | | Mount San Antonio Community College District, Los Angeles County, California, General Obligation Bonds, Election of 2008, Series 2013A, 0.000%, 8/01/43 | 8/35 at 100.00 | AA | | 811,745 | |
| | Principal | | | Optional Call | | | | |
| | Amount (000) | | Description (1) | Provisions (2) | Ratings (3) | | Value | |
| | | | California (continued) | | | | | |
| $ | 2,700 | | M-S-R Energy Authority, California, Gas Revenue Bonds, Citigroup Prepay Contracts, Series 2009A, 7.000%, 11/01/34 | No Opt. Call | A | $ | 3,825,090 | |
| | 1,030 | | Natomas Union School District, Sacramento County, California, General Obligation Refunding Bonds, Series 1999, 5.950%, 9/01/21 – NPFG Insured | No Opt. Call | AA– | | 1,131,404 | |
| | 15,770 | | Ontario Redevelopment Financing Authority, San Bernardino County, California, Revenue Refunding Bonds, Redevelopment Project 1, Series 1995, 7.400%, 8/01/25 – NPFG Insured | No Opt. Call | AA– | | 19,475,787 | |
| | 1,265 | | Palomar Pomerado Health Care District, California, Certificates of Participation, Series 2009, 6.750%, 11/01/39 | 11/19 at 100.00 | Ba1 | | 1,401,127 | |
| | 1,650 | | Palomar Pomerado Health Care District, California, Certificates of Participation, Series 2010, 5.250%, 11/01/21 | 11/20 at 100.00 | Ba1 | | 1,782,248 | |
| | 13,145 | | Perris, California, GNMA Mortgage-Backed Securities Program Single Family Mortgage Revenue Bonds, Series 1988B, 8.200%, 9/01/23 (Alternative Minimum Tax) (ETM) | No Opt. Call | Aaa | | 18,574,277 | |
| | 2,500 | | Petaluma, Sonoma County, California, Wastewater Revenue Bonds, Refunding Series 2011, 5.500%, 5/01/32 | 5/21 at 100.00 | AA– | | 2,925,400 | |
| | 2,000 | | Poway Unified School District, San Diego County, California, General Obligation Bonds, School Facilities Improvement District 2007-1, Series 2011A, 0.000%, 8/01/41 | No Opt. Call | AA– | | 666,140 | |
| | 5,000 | | Rialto Unified School District, San Bernardino County, California, General Obligation Bonds, Series 2011A, 0.000%, 8/01/41 – AGM Insured | 8/36 at 100.00 | AA | | 3,865,800 | |
| | 660 | | San Francisco Redevelopment Finance Authority, California, Tax Allocation Revenue Bonds, Mission Bay North Redevelopment Project, Series 2009C, 6.500%, 8/01/39 | 8/19 at 100.00 | A– | | 756,591 | |
| | 2,000 | | San Joaquin Hills Transportation Corridor Agency, Orange County, California, Toll Road Revenue Bonds, Refunding Junior Lien Series 2014B, 5.250%, 1/15/44 | 1/25 at 100.00 | BB+ | | 2,136,820 | |
| | 5,360 | | San Joaquin Hills Transportation Corridor Agency, Orange County, California, Toll Road Revenue Bonds, Refunding Senior Lien Series 2014A, 5.000%, 1/15/44 | 1/25 at 100.00 | BBB– | | 5,686,424 | |
| | 880 | | Santee Community Development Commission, California, Santee Redevelopment Project Tax Allocation Bonds, Series 2011A, 7.000%, 8/01/31 | 2/21 at 100.00 | A | | 1,074,110 | |
| | 5,000 | | Solano Community College District, Solano and Yolo Counties, California, General Obligation Bonds, Election 2012 Series 2013A, 5.000%, 8/01/43 | 8/23 at 100.00 | AA– | | 5,537,350 | |
| | 1,000 | | Union City Community Redevelopment Agency, California, Tax Allocation Revenue Bonds, Redevelopment Project, Subordinate Lien Series 2011, 6.375%, 12/01/23 | 12/21 at 100.00 | A+ | | 1,235,390 | |
| | 95 | | Ventura County Area Housing Authority, California, Multifamily Revenue Bonds, Mira Vista Senior Apartments Project, Series 2006A, 5.000%, 12/01/22 – AMBAC Insured (Alternative Minimum Tax) | 12/16 at 100.00 | N/R | | 96,254 | |
| | 2,000 | | West Contra Costa Unified School District, Contra Costa County, California, General Obligation Bonds, Election 2010 Series 2011A, 5.000%, 8/01/41 | 8/21 at 100.00 | Aa3 | | 2,228,860 | |
| | 3,750 | | Wiseburn School District, Los Angeles County, California, General Obligation Bonds, Series 2011B, 0.000%, 8/01/36 – AGM Insured | 8/31 at 100.00 | AA | | 2,855,888 | |
| | 4,000 | | Yuba Community College District, California, General Obligation Bonds, Election 2006 Series 2011C, 5.250%, 8/01/47 | 8/21 at 100.00 | Aa2 | | 4,624,120 | |
| | 134,845 | | Total California | | | | 149,896,345 | |
| | | | Colorado – 9.2% (6.2% of Total Investments) | | | | | |
| | 3,000 | | Anthem West Metropolitan District, Colorado, General Obligation Bonds, Refunding Series 2015, 5.000%, 12/01/35 – BAM Insured | 12/25 at 100.00 | AA | | 3,333,720 | |
| | 1,000 | | Brighton Crossing Metropolitan District 4, Colorado, General Obligation Bonds, Limited Tax Convertible to Unlimited Tax, Refunding Series 2013, 7.000%, 12/01/23 | 7/18 at 100.00 | N/R | | 1,016,180 | |
| | 2,945 | | Colorado Educational and Cultural Facilities Authority, Charter School Revenue Bonds, Community Leadership Academy, Inc. Second Campus Project, Series 2013, 7.350%, 8/01/43 | 8/23 at 100.00 | BB | | 3,423,592 | |
| | 1,000 | | Colorado Educational and Cultural Facilities Authority, Charter School Revenue Bonds, Peak-to-Peak Charter School, Refunding Series 2014, 5.000%, 8/15/30 | 8/24 at 100.00 | A | | 1,107,040 | |
| | 1,250 | | Colorado Educational and Cultural Facilities Authority, Revenue and Refunding Bonds, University Corporation for Atmospheric Research Project, Series 2012A, 4.500%, 9/01/22 | No Opt. Call | A+ | | 1,413,988 | |
| NQM | Nuveen Investment Quality Municipal Fund, Inc. | |
| | Portfolio of Investments (continued) | October 31, 2015 |
| | Principal | | | Optional Call | | | | |
| | Amount (000) | | Description (1) | Provisions (2) | Ratings (3) | | Value | |
| | | | Colorado (continued) | | | | | |
| $ | 1,465 | | Colorado Health Facilities Authority, Colorado, Revenue Bonds, American Baptist Homes Project, Series 2009A, 7.750%, 8/01/39 | 8/19 at 100.00 | N/R | $ | 1,604,541 | |
| | 3,020 | | Colorado Health Facilities Authority, Colorado, Revenue Bonds, Catholic Health Initiatives, Series 2013A, 5.250%, 1/01/40 | 1/23 at 100.00 | A+ | | 3,315,235 | |
| | | | Colorado Health Facilities Authority, Colorado, Revenue Bonds, Evangelical Lutheran Good Samaritan Society Project, Series 2013A: | | | | | |
| | 2,670 | | 5.000%, 6/01/28 | No Opt. Call | A– | | 2,945,811 | |
| | 2,395 | | 5.000%, 6/01/40 | No Opt. Call | A– | | 2,559,465 | |
| | 220 | | Colorado Health Facilities Authority, Colorado, Revenue Bonds, Evangelical Lutheran Good Samaritan Society Project, Series 2013, 5.625%, 6/01/43 | 6/23 at 100.00 | BBB+ | | 242,354 | |
| | 2,090 | | Colorado Health Facilities Authority, Colorado, Revenue Bonds, Poudre Valley Health System, Series 2005B, 5.250%, 3/01/36 – AGM Insured | 9/18 at 102.00 | AA | | 2,278,643 | |
| | 625 | | Colorado Health Facilities Authority, Colorado, Revenue Bonds, Total Long-Term Care National Obligated Group Project, Series 2010A, 6.000%, 11/15/30 | 11/20 at 100.00 | A | | 694,344 | |
| | 750 | | Colorado Health Facilities Authority, Colorado, Revenue Bonds, Valley View Hospital Association, Series 2008, 5.500%, 5/15/28 | 5/18 at 100.00 | A– | | 816,870 | |
| | 375 | | Colorado Health Facilities Authority, Revenue Bonds, Evangelical Lutheran Good Samaritan Society, Series 2005, 5.000%, 6/01/29 | 6/16 at 100.00 | BBB+ | | 380,764 | |
| | 625 | | Colorado Health Facilities Authority, Revenue Bonds, Evangelical Lutheran Good Samaritan Society, Series 2005, 5.000%, 6/01/29 (Pre-refunded 6/01/16) | 6/16 at 100.00 | N/R (4) | | 642,119 | |
| | 1,000 | | Colorado Housing and Finance Authority, Solid Waste Disposal Revenue Bonds, Waste Management Inc. Project, Series 2004, 5.700%, 7/01/18 (Alternative Minimum Tax) | No Opt. Call | A– | | 1,116,730 | |
| | 2,000 | | Colorado Mesa University, Colorado, Enterprise Revenue Bonds, Series 2012B, 4.250%, 5/15/37 | 5/21 at 100.00 | Aa2 | | 2,096,520 | |
| | 5 | | Colorado Water Resources and Power Development Authority, Clean Water Revenue Bonds, 1996 Series A, 5.900%, 9/01/16 | 3/16 at 100.00 | AAA | | 5,024 | |
| | 3,000 | | Commerce City, Colorado, Sales and Use Tax Revenue Bonds, Series 2014, 5.000%, 8/01/44 – AGM Insured | 8/24 at 100.00 | AA | | 3,338,970 | |
| | 2,000 | | Denver City and County, Colorado, Airport System Revenue Bonds, Series 2012B, 5.000%, 11/15/32 | 11/22 at 100.00 | A+ | | 2,309,980 | |
| | 1,000 | | Denver City and County, Colorado, Airport System Revenue Bonds, Subordinate Lien Series 2013A, 5.250%, 11/15/43 (Alternative Minimum Tax) | 11/23 at 100.00 | A | | 1,096,740 | |
| | | | E-470 Public Highway Authority, Colorado, Senior Revenue Bonds, Capital Appreciation Series 2010A: | | | | | |
| | 385 | | 0.000%, 9/01/35 | No Opt. Call | BBB+ | | 171,310 | |
| | 150 | | 0.000%, 9/01/37 | No Opt. Call | BBB+ | | 62,178 | |
| | 75 | | 0.000%, 9/01/38 | No Opt. Call | BBB+ | | 29,728 | |
| | 20 | | 0.000%, 9/01/39 | No Opt. Call | BBB+ | | 7,472 | |
| | 110 | | 0.000%, 9/01/41 | No Opt. Call | BBB+ | | 36,427 | |
| | | | E-470 Public Highway Authority, Colorado, Senior Revenue Bonds, Series 2000B: | | | | | |
| | 995 | | 0.000%, 9/01/29 – NPFG Insured | No Opt. Call | AA– | | 603,627 | |
| | 2,155 | | 0.000%, 9/01/30 – NPFG Insured | No Opt. Call | AA– | | 1,244,556 | |
| | 50 | | 0.000%, 9/01/31 – NPFG Insured | No Opt. Call | AA– | | 27,569 | |
| | 2,795 | | 0.000%, 9/01/32 – NPFG Insured | No Opt. Call | AA– | | 1,472,015 | |
| | 100 | | 0.000%, 9/01/33 – NPFG Insured | No Opt. Call | AA– | | 50,432 | |
| | 385 | | E-470 Public Highway Authority, Colorado, Toll Revenue Bonds, Series 2004A, 0.000%, 9/01/28 – NPFG Insured | No Opt. Call | AA– | | 246,050 | |
| | | | E-470 Public Highway Authority, Colorado, Toll Revenue Bonds, Series 2004B: | | | | | |
| | 345 | | 0.000%, 9/01/28 – NPFG Insured | 9/20 at 63.98 | AA– | | 184,313 | |
| | 14,500 | | 0.000%, 3/01/36 – NPFG Insured | 9/20 at 41.72 | AA– | | 4,930,435 | |
| | 500 | | Eagle County Air Terminal Corporation, Colorado, Airport Terminal Project Revenue Bonds, Refunding Series 2011A, 5.500%, 5/01/22 (Alternative Minimum Tax) | 5/21 at 100.00 | Baa2 | | 543,015 | |
| | 5,055 | | Park Creek Metropolitan District, Colorado, Senior Limited Property Tax Supported Revenue Refunding Bonds, Series 2011, 6.125%, 12/01/41 – AGM Insured | 12/20 at 100.00 | AA | | 5,944,731 | |
| | Principal | | | Optional Call | | | | |
| | Amount (000) | | Description (1) | Provisions (2) | Ratings (3) | | Value | |
| | | | Colorado (continued) | | | | | |
| $ | 3,000 | | Park Creek Metropolitan District, Colorado, Senior Property Tax Supported Revenue Bonds, Series 2009, 6.250%, 12/01/30 – AGC Insured | 12/19 at 100.00 | AA | $ | 3,437,880 | |
| | 700 | | Public Authority for Colorado Energy, Natural Gas Purchase Revenue Bonds, Colorado Springs Utilities, Series 2008, 6.500%, 11/15/38 | No Opt. Call | A | | 934,948 | |
| | 2,365 | | Regional Transportation District, Colorado, Denver Transit Partners Eagle P3 Project Private Activity Bonds, Series 2010, 6.000%, 1/15/41 | 7/20 at 100.00 | Baa3 | | 2,664,291 | |
| | | | Ute Water Conservancy District, Mesa County, Colorado, Water Revenue Bonds, Refunding Series 2012: | | | | | |
| | 1,000 | | 4.250%, 6/15/27 | 6/22 at 100.00 | AA | | 1,089,110 | |
| | 1,430 | | 4.250%, 6/15/28 | 6/22 at 100.00 | AA | | 1,546,702 | |
| | 350 | | Willow Trace Metropolitan District, Arapahoe County, Colorado, General Obligation Bonds, Refunding Series 2006A, 4.450%, 12/01/35 (Pre-refunded 12/01/15) – CIFG Insured | 12/15 at 100.00 | AA (4) | | 351,313 | |
| | 68,900 | | Total Colorado | | | | 61,316,732 | |
| | | | Connecticut – 1.4% (0.9% of Total Investments) | | | | | |
| | 3,430 | | Connecticut Health and Educational Facilities Authority, Revenue Bonds, Sacred Heart University, Series 2012H, 5.000%, 7/01/24 – AGM Insured | 7/22 at 100.00 | AA | | 3,867,188 | |
| | | | Connecticut Municipal Electric Energy Cooperative, Power Supply System Revenue Bonds, Tender Option Bond Trust 1164: | | | | | |
| | 1,295 | | 17.098%, 1/01/32 (IF) (5) | 1/23 at 100.00 | Aa3 | | 1,981,635 | |
| | 190 | | 16.939%, 1/01/38 (IF) (5) | 1/23 at 100.00 | Aa3 | | 270,324 | |
| | 2,500 | | Harbor Point Infrastructure Improvement District, Connecticut, Special Obligation Revenue Bonds, Harbor Point Project, Series 2010A, 7.875%, 4/01/39 | 4/20 at 100.00 | N/R | | 2,955,825 | |
| | 7,415 | | Total Connecticut | | | | 9,074,972 | |
| | | | District of Columbia – 5.0% (3.4% of Total Investments) | | | | | |
| | 23,745 | | District of Columbia Water and Sewer Authority, Public Utility Revenue Bonds, Series 1998, 5.500%, 10/01/23 – AGM Insured (UB) | No Opt. Call | AA+ | | 28,777,515 | |
| | 3,000 | | District of Columbia, General Obligation Bonds, Series 1998B, 6.000%,
6/01/16 – NPFG Insured | No Opt. Call | Aa1 | | 3,101,940 | |
| | 1,200 | | Washington Convention Center Authority, District of Columbia, Dedicated Tax Revenue Bonds, Tender Option Bond Trust 1606, 11.876%, 10/01/30 – BHAC Insured (IF) (5) | 10/16 at 100.00 | AA+ | | 1,309,164 | |
| | 27,945 | | Total District of Columbia | | | | 33,188,619 | |
| | | | Florida – 11.6% (7.9% of Total Investments) | | | | | |
| | 1,480 | | Atlantic Beach, Florida, Healthcare Facilities Revenue Refunding Bonds, Fleet Landing Project, Series 2013A, 5.000%, 11/15/37 | 11/23 at 100.00 | BBB | | 1,560,586 | |
| | | | Bay County, Florida, Educational Facilities Revenue Refunding Bonds, Bay Haven Charter Academy, Inc. Project, Series 2013A: | | | | | |
| | 450 | | 5.000%, 9/01/45 | 9/23 at 100.00 | BBB– | | 456,966 | |
| | 850 | | 5.000%, 9/01/48 | 9/23 at 100.00 | BBB– | | 861,305 | |
| | 3,730 | | Brevard County Health Facilities Authority, Florida, Health Facilities Revenue Bonds, Health First, Inc. Project, Series 2005, 5.000%, 4/01/24 (Pre-refunded 4/01/16) | 4/16 at 100.00 | A– (4) | | 3,804,936 | |
| | 1,000 | | Brevard County Health Facilities Authority, Florida, Health Facilities Revenue Bonds, Health First, Inc. Project, Series 2009B, 7.000%, 4/01/39 (Pre-refunded 4/01/19) | 4/19 at 100.00 | A– (4) | | 1,201,950 | |
| | 4,315 | | Cape Coral, Florida, Water and Sewer Revenue Bonds, Refunding Series 2011, 5.000%, 10/01/41 – AGM Insured | 10/21 at 100.00 | AA | | 4,854,591 | |
| | 100 | | Florida Development Finance Corporation, Educational Facilities Revenue Bonds, Renaissance Charter School, Inc. Projects, Series 2012A, 6.125%, 6/15/43 | No Opt. Call | N/R | | 101,649 | |
| | 4,165 | | Florida Higher Educational Facilities Financing Authority, Revenue Bonds, Nova Southeastern University Project, Refunding Series 2012A, 5.000%, 4/01/32 | 4/22 at 100.00 | Baa1 | | 4,541,308 | |
| | 1,150 | | Florida Higher Educational Facilities Financing Authority, Revenue Bonds, Nova Southeastern University, Refunding Series 2011, 6.375%, 4/01/31 | 4/21 at 100.00 | Baa1 | | 1,336,519 | |
| | 5,020 | | Hillsborough County Aviation Authority, Florida, Revenue Bonds, Tampa International Airport, Senior Lien Series 2015A, 5.000%, 10/01/44 (Alternative Minimum Tax) | 10/24 at 100.00 | A+ | | 5,420,696 | |
| NQM | Nuveen Investment Quality Municipal Fund, Inc. | |
| | Portfolio of Investments (continued) | October 31, 2015 |
| | Principal | | | Optional Call | | | | |
| | Amount (000) | | Description (1) | Provisions (2) | Ratings (3) | | Value | |
| | | | Florida (continued) | | | | | |
| $ | 2,145 | | Hillsborough County Aviation Authority, Florida, Revenue Bonds, Tampa International Airport, Series 2015A, 5.000%, 10/01/44 | 10/24 at 100.00 | A– | $ | 2,350,019 | |
| | 1,000 | | Miami-Dade County Educational Facilities Authority, Florida, Revenue Bonds, University of Miami, Series 2008A, 5.200%, 4/01/24 (Pre-refunded 4/01/16) | 4/16 at 100.00 | A– (4) | | 1,019,940 | |
| | 13,000 | | Miami-Dade County, Florida, Aviation Revenue Bonds, Miami International Airport Hub, Series 2007B, 4.500%, 10/01/31 – NPFG Insured | 10/17 at 100.00 | AA– | | 13,700,828 | |
| | 5,000 | | Miami-Dade County, Florida, Aviation Revenue Bonds, Refunding Series 2014A, 5.000%, 10/01/35 (Alternative Minimum Tax) | 10/24 at 100.00 | A | | 5,466,000 | |
| | 2,925 | | Miami-Dade County, Florida, Aviation Revenue Bonds, Refunding Series 2015A, 5.000%, 10/01/38 (Alternative Minimum Tax) | 10/25 at 100.00 | A | | 3,187,490 | |
| | 1,000 | | Miami-Dade County, Florida, Water and Sewer System Revenue Bonds, Series 2010, 5.000%, 10/01/39 – AGM Insured | 10/20 at 100.00 | AA | | 1,132,220 | |
| | 7,045 | | Miami-Dade County, Florida, Water and Sewer System Revenue Bonds, Series 2013A, 5.000%, 10/01/42 | 10/22 at 100.00 | Aa3 | | 7,812,482 | |
| | 4,000 | | North Sumter County Utility Dependent District, Florida, Utility Revenue Bonds, Series 2010, 5.375%, 10/01/40 | 10/20 at 100.00 | AA | | 4,502,000 | |
| | 3,000 | | Northern Palm Beach County Improvement District, Florida, Water Control and Improvement Bonds, Development Unit 46B, Series 2007A, 5.350%, 8/01/41 | 8/17 at 100.00 | N/R | | 3,045,090 | |
| | 1,300 | | Palm Beach County Health Facilities Authority, Florida, Revenue Bonds, The Waterford Project, Series 2007, 5.875%, 11/15/37 (Pre-refunded 11/15/17) | 11/17 at 100.00 | A (4) | | 1,437,124 | |
| | 5,895 | | South Miami Health Facilities Authority, Florida, Hospital Revenue, Baptist Health System Obligation Group, Series 2007, 5.000%, 8/15/42 (UB) (5) | 8/17 at 100.00 | AA | | 6,144,064 | |
| | 1,500 | | Sumter County Industrial Development Authority, Florida, Hospital Revenue Bonds, Central Florida Health Alliance Projects, Series 2014A, 5.250%, 7/01/44 | 1/24 at 100.00 | A– | | 1,653,105 | |
| | 65 | | Tolomato Community Development District, Florida, Special Assessment Bonds, Convertible, Capital Appreciation, Series 2012A-2, 0.000%, 5/01/39 | 5/17 at 100.00 | N/R | | 48,846 | |
| | 195 | | Tolomato Community Development District, Florida, Special Assessment Bonds, Convertible, Capital Appreciation, Series 2012A-3, 0.000%, 5/01/40 | 5/19 at 100.00 | N/R | | 116,869 | |
| | 85 | | Tolomato Community Development District, Florida, Special Assessment Bonds, Convertible, Capital Appreciation, Series 2012A-4, 0.000%, 5/01/40 | 5/22 at 100.00 | N/R | | 37,751 | |
| | 120 | | Tolomato Community Development District, Florida, Special Assessment Bonds, Hope Note, Series 2007-3, 6.650%, 5/01/40 (6) | 5/18 at 100.00 | N/R | | 1 | |
| | 10 | | Tolomato Community Development District, Florida, Special Assessment Bonds, Non Performing ParcelSeries 2007-1. RMKT, 6.650%, 5/01/40 (6) | 5/18 at 100.00 | N/R | | 10,203 | |
| | 200 | | Tolomato Community Development District, Florida, Special Assessment Bonds, Refunding Series 2012A-1, 6.650%, 5/01/40 | 5/17 at 100.00 | N/R | | 202,630 | |
| | 290 | | Tolomato Community Development District, Florida, Special Assessment Bonds, Refunding Series 2015-1, 0.000%, 5/01/40 (6) | 5/18 at 100.00 | N/R | | 179,177 | |
| | 180 | | Tolomato Community Development District, Florida, Special Assessment Bonds, Refunding Series 2015-2, 0.000%, 5/01/40 (6) | 5/18 at 100.00 | N/R | | 94,100 | |
| | 195 | | Tolomato Community Development District, Florida, Special Assessment Bonds, Refunding Series 2015-3, 6.610%, 5/01/40 (6) | 5/18 at 100.00 | N/R | | 2 | |
| | 1,170 | | Tolomato Community Development District, Florida, Special Assessment Bonds, Series 2006, 5.400%, 5/01/37 | 11/15 at 100.00 | N/R | | 1,170,831 | |
| | 72,580 | | Total Florida | | | | 77,451,278 | |
| | | | Georgia – 2.3% (1.6% of Total Investments) | | | | | |
| | 1,820 | | Atlanta Development Authority, Georgia, Revenue Bonds, New Downtown Atlanta Stadium Project, Senior Lien Series 2015A-1, 5.250%, 7/01/40 | 7/25 at 100.00 | Aa3 | | 2,092,163 | |
| | 895 | | Atlanta, Georgia, Tax Allocation Bonds, Beltline Project Series 2008A. Remarketed, 7.500%, 1/01/31 | 1/19 at 100.00 | A2 | | 1,034,647 | |
| | Principal | | | Optional Call | | | | |
| | Amount (000) | | Description (1) | Provisions (2) | Ratings (3) | | Value | |
| | | | Georgia (continued) | | | | | |
| $ | 1,510 | | Atlanta, Georgia, Water and Wastewater Revenue Bonds, Series 2009B, 5.250%, 11/01/34 – AGM Insured | 11/19 at 100.00 | AA | $ | 1,694,462 | |
| | 2,000 | | Dalton Development Authority, Georgia, Revenue Certificates, Hamilton Health Care System Inc., Series 1996, 5.500%, 8/15/26 – NPFG Insured | No Opt. Call | AA– | | 2,302,680 | |
| | 2,500 | | Gainesville and Hall County Hospital Authority, Georgia, Revenue Anticipation Certificates, Northeast Georgia Health Services Inc., Series 2010A, 5.000%, 2/15/30 | 2/20 at 100.00 | A | | 2,725,075 | |
| | 3,285 | | Georgia Municipal Electric Authority, Plant Vogtle Units 3 & 4 Project J Bonds, Series 2015A, 5.000%, 7/01/60 | 7/25 at 100.00 | A+ | | 3,494,353 | |
| | 810 | | Georgia Municipal Electric Authority, Project One Special Obligation Bonds, Fourth Crossover Series 1997E, 6.500%, 1/01/20 | No Opt. Call | A1 | | 891,340 | |
| | 1,220 | | Private Colleges and Universities Authority, Georgia, Revenue Bonds, Mercer University, Series 2012A, 5.250%, 10/01/27 | 10/21 at 100.00 | Baa2 | | 1,374,708 | |
| | 14,040 | | Total Georgia | | | | 15,609,428 | |
| | | | Guam – 0.4% (0.3% of Total Investments) | | | | | |
| | 765 | | Government of Guam, Business Privilege Tax Bonds, Series 2011A, 5.000%, 1/01/31 | 1/22 at 100.00 | A | | 840,161 | |
| | 1,770 | | Guam Government Waterworks Authority, Water and Wastewater System Revenue Bonds, Series 2010, 5.625%, 7/01/40 | 7/20 at 100.00 | A– | | 1,933,831 | |
| | 2,535 | | Total Guam | | | | 2,773,992 | |
| | | | Hawaii – 0.5% (0.3% of Total Investments) | | | | | |
| | 3,000 | | Hawaii Department of Budget and Finance, Special Purpose Revenue Bonds, Hawaii Pacific Health Obligated Group, Series 2013A, 5.500%, 7/01/43 | 7/23 at 100.00 | A | | 3,447,120 | |
| | | | Idaho – 0.2% (0.2% of Total Investments) | | | | | |
| | 395 | | Idaho Housing and Finance Association, Single Family Mortgage Revenue Bonds, Series 2009B Class I, 5.650%, 7/01/26 | 7/19 at 100.00 | A1 | | 414,292 | |
| | 1,155 | | Idaho Water Resource Board, Water Resource Loan Program Revenue, Ground Water Rights Mitigation Series 2012A, 4.750%, 9/01/26 | 9/22 at 100.00 | Baa1 | | 1,279,544 | |
| | 1,550 | | Total Idaho | | | | 1,693,836 | |
| | | | Illinois – 14.0% (9.5% of Total Investments) | | | | | |
| | 2,610 | | Chicago, Illinois, Certificates of Participation Tax Increment Revenue Notes, Fullerton/Milwaukee Redevelopment Project, Series 2011A, 6.830%, 3/15/24 | 3/17 at 100.00 | Ba3 | | 2,717,662 | |
| | 3,150 | | Chicago, Illinois, Sales Tax Revenue Bonds, Series 2011A, 5.000%, 1/01/41 | 1/22 at 100.00 | AAA | | 3,173,058 | |
| | 4,000 | | Illinois Educational Facilities Authority, Revenue Bonds, Field Museum of Natural History, Series 2002, 4.450%, 11/01/36 (WI/DD, Settling 11/02/15) | 11/25 at 102.00 | N/R | | 3,998,920 | |
| | 4,985 | | Illinois Finance Authority, Revenue Bonds, Centegra Health System, Series 2012, 5.000%, 9/01/32 | 9/22 at 100.00 | BBB | | 5,263,512 | |
| | 4,750 | | Illinois Finance Authority, Revenue Bonds, Centegra Health System, Series 2014A, 5.000%, 9/01/39 | 9/24 at 100.00 | BBB | | 5,076,658 | |
| | 1,125 | | Illinois Finance Authority, Revenue Bonds, Central DuPage Health, Series 2009B, 5.500%, 11/01/39 | 11/19 at 100.00 | AA+ | | 1,287,405 | |
| | 1,000 | | Illinois Finance Authority, Revenue Bonds, Elmhurst Memorial Healthcare, Series 2008A, 5.625%, 1/01/37 | 1/18 at 100.00 | Baa2 | | 1,067,960 | |
| | 960 | | Illinois Finance Authority, Revenue Bonds, OSF Healthcare System, Refunding Series 2010A, 6.000%, 5/15/39 | 5/20 at 100.00 | A | | 1,104,730 | |
| | 3,215 | | Illinois Finance Authority, Revenue Bonds, OSF Healthcare System, Series 2015A, 5.000%, 11/15/45 | 11/25 at 100.00 | A | | 3,493,933 | |
| | 2,125 | | Illinois Finance Authority, Revenue Bonds, Palos Community Hospital, Series 2010C, 5.125%, 5/15/35 | 5/20 at 100.00 | AA– | | 2,314,423 | |
| | 395 | | Illinois Finance Authority, Revenue Bonds, Proctor Hospital, Series 2006, 5.125%, 1/01/25 | 1/16 at 100.00 | Aa3 | | 397,959 | |
| | 1,000 | | Illinois Finance Authority, Revenue Bonds, Provena Health, Series 2009A, 7.750%, 8/15/34 | 8/19 at 100.00 | BBB+ | | 1,208,090 | |
| NQM | Nuveen Investment Quality Municipal Fund, Inc. | |
| | Portfolio of Investments (continued) | October 31, 2015 |
| | Principal | | | Optional Call | | | | |
| | Amount (000) | | Description (1) | Provisions (2) | Ratings (3) | | Value | |
| | | | Illinois (continued) | | | | | |
| | | | Illinois Finance Authority, Revenue Bonds, Rehabilitation Institute of Chicago, Series 2013A: | | | | | |
| $ | 415 | | 5.500%, 7/01/28 | 7/23 at 100.00 | A– | $ | 477,918 | |
| | 391 | | 6.000%, 7/01/43 | 7/23 at 100.00 | A– | | 457,786 | |
| | 1,000 | | Illinois Finance Authority, Revenue Bonds, Rush University Medical Center Obligated Group, Refunding Series 2006B, 5.250%, 11/01/35 (Pre-refunded 11/01/18) – NPFG Insured | 11/18 at 100.00 | Aaa | | 1,128,200 | |
| | 1,120 | | Illinois Finance Authority, Revenue Bonds, Rush University Medical Center Obligated Group, Series 2009C, 6.625%, 11/01/39 (Pre-refunded 5/01/19) | 5/19 at 100.00 | Aaa | | 1,337,694 | |
| | 1,000 | | Illinois Finance Authority, Revenue Bonds, Sherman Health Systems, Series 2007A, 5.500%, 8/01/37 (Pre-refunded 8/01/17) | 8/17 at 100.00 | N/R (4) | | 1,084,960 | |
| | | | Illinois Finance Authority, Revenue Bonds, Silver Cross Hospital and Medical Centers, Series 2009: | | | | | |
| | 2,000 | | 6.875%, 8/15/38 (Pre-refunded 8/15/19) | 8/19 at 100.00 | N/R (4) | | 2,436,520 | |
| | 3,000 | | 7.000%, 8/15/44 (Pre-refunded 8/15/19) | 8/19 at 100.00 | N/R (4) | | 3,668,700 | |
| | 1,000 | | Illinois Finance Authority, Revenue Bonds, Southern Illinois Healthcare Enterprises, Inc., Series 2005 Remarketed, 5.250%, 3/01/30 – AGM Insured | 3/20 at 100.00 | AA | | 1,110,140 | |
| | 186 | | Illinois Finance Authority, Revenue Bonds, The Clare at Water Tower Project, Capitol Appreciation Series 2010B, 0.000%, 5/15/50 (6) | 1/16 at 18.39 | N/R | | 2 | |
| | 390 | | Illinois Finance Authority, Revenue Bonds, The Clare at Water Tower Project, Refunding Series 2010A, 6.000%, 5/15/28 (6) | 2/16 at 100.00 | N/R | | 4 | |
| | 1,400 | | Illinois Finance Authority, Revenue Bonds, The University of Chicago Medical Center, Series 2009B, 5.000%, 8/15/26 | 8/20 at 100.00 | AA– | | 1,572,578 | |
| | 500 | | Illinois Finance Authority, Revenue Bonds, Three Crowns Park Plaza, Series 2006A, 5.875%, 2/15/26 | 2/16 at 100.00 | N/R | | 502,185 | |
| | 2,910 | | Illinois Finance Authority, Revenue Refunding Bonds, Resurrection Health Care Corporation, Series 2009, 6.125%, 5/15/25 | 5/19 at 100.00 | BBB+ | | 3,252,711 | |
| | 90 | | Illinois Finance Authority, Revenue Refunding Bonds, Resurrection Health Care Corporation, Series 2009, 6.125%, 5/15/25 (Pre-refunded 5/15/19) | 5/19 at 100.00 | N/R (4) | | 105,953 | |
| | | | Illinois State, General Obligation Bonds, February Series 2014: | | | | | |
| | 3,500 | | 5.250%, 2/01/30 | 2/24 at 100.00 | A– | | 3,741,255 | |
| | 4,000 | | 5.250%, 2/01/31 | 2/24 at 100.00 | A– | | 4,258,520 | |
| | 680 | | Illinois State, General Obligation Bonds, May Series 2014, 5.000%, 5/01/36 | 5/24 at 100.00 | A– | | 702,345 | |
| | 2,370 | | Illinois State, General Obligation Bonds, Refunding Series 2012, 5.000%, 8/01/25 | 8/22 at 100.00 | A– | | 2,533,127 | |
| | | | Illinois State, General Obligation Bonds, Series 2012A: | | | | | |
| | 3,225 | | 4.000%, 1/01/26 | 1/22 at 100.00 | A– | | 3,235,352 | |
| | 225 | | 5.000%, 3/01/37 | 3/22 at 100.00 | A– | | 230,132 | |
| | | | Illinois State, General Obligation Bonds, Series 2013: | | | | | |
| | 2,500 | | 5.250%, 7/01/31 | 7/23 at 100.00 | A– | | 2,651,925 | |
| | 275 | | 5.500%, 7/01/38 | 7/23 at 100.00 | A– | | 290,279 | |
| | 1,430 | | Illinois State, Sales Tax Revenue Bonds, Build Illinois Series 2011, 3.750%, 6/15/25 | 6/21 at 100.00 | AAA | | 1,517,831 | |
| | 700 | | Illinois Toll Highway Authority, Toll Highway Revenue Bonds, Tender Option Bond Trust 2015-XF0051, 17.802%, 1/01/21 (IF) | No Opt. Call | AA– | | 971,789 | |
| | 1,875 | | Illinois Toll Highway Authority, Toll Highway Revenue Bonds, Tender Option Bond Trust 2015-XF0052, 17.850%, 1/01/21 (IF) | No Opt. Call | AA– | | 2,602,500 | |
| | 1,510 | | Macon County School District 61 Decatur, Illinois, General Obligation Bonds, Series 2011A, 5.250%, 1/01/39 – AGM Insured | 1/21 at 100.00 | A2 | | 1,648,074 | |
| | 1,525 | | McCook, Illinois, General Obligation Bonds, Series 2008, 5.200%, 12/01/30 | 12/18 at 100.00 | BBB | | 1,661,549 | |
| | 1,890 | | Metropolitan Pier and Exposition Authority, Illinois, McCormick Place Expansion Project Bonds, Refunding Series 2015B, 5.000%, 6/15/52 | 12/25 at 100.00 | BBB+ | | 1,944,167 | |
| | 1,050 | | Metropolitan Pier and Exposition Authority, Illinois, Revenue Bonds, McCormick Place Expansion Project, Capital Appreciation Refunding Series 2010B-1, 5.000%, 6/15/50 | 6/20 at 100.00 | AA | | 1,093,890 | |
| | 6,015 | | Metropolitan Pier and Exposition Authority, Illinois, Revenue Bonds, McCormick Place Expansion Project, Refunding Series 1996A, 0.000%, 12/15/21 – NPFG Insured | No Opt. Call | AA– | | 4,994,796 | |
| | Principal | | | Optional Call | | | | |
| | Amount (000) | | Description (1) | Provisions (2) | Ratings (3) | | Value | |
| | | | Illinois (continued) | | | | | |
| $ | 5,000 | | Metropolitan Pier and Exposition Authority, Illinois, Revenue Bonds, McCormick Place Expansion Project, Series 2002A, 0.000%, 12/15/34 – NPFG Insured | No Opt. Call | AA– | $ | 2,093,250 | |
| | | | Railsplitter Tobacco Settlement Authority, Illinois, Tobacco Settlement Revenue Bonds, Series 2010: | | | | | |
| | 1,550 | | 5.250%, 6/01/21 | No Opt. Call | A | | 1,814,492 | |
| | 4,000 | | 6.250%, 6/01/24 | 6/16 at 100.00 | A | | 4,136,000 | |
| | 800 | | 6.000%, 6/01/28 | 6/21 at 100.00 | A– | | 949,664 | |
| | 1,580 | | University of Illinois, Health Services Facilities System Revenue Bonds, Series 2013, 6.000%, 10/01/32 | 10/23 at 100.00 | A | | 1,828,028 | |
| | 90,417 | | Total Illinois | | | | 93,138,626 | |
| | | | Indiana – 1.9% (1.3% of Total Investments) | | | | | |
| | 1,555 | | Indiana Finance Authority, Educational Facilities Revenue Bonds, Butler University Project, Refunding Series 2012B, 5.000%, 2/01/28 | 2/22 at 100.00 | BBB+ | | 1,740,838 | |
| | 1,050 | | Indiana Finance Authority, Educational Facilities Revenue Bonds, Drexel Foundation For Educational Excellence, Inc., Series 2009A, 7.000%, 10/01/39 | 10/19 at 100.00 | B– | | 1,017,986 | |
| | 1,500 | | Indiana Finance Authority, Hospital Revenue Bonds, Floyd Memorial Hospital and Health Services Project, Refunding Series 2010, 5.125%, 3/01/30 | 3/20 at 100.00 | BBB– | | 1,568,610 | |
| | | | Indiana Finance Authority, Private Activity Bonds, Ohio River Bridges East End Crossing Project, Series 2013A: | | | | | |
| | 3,015 | | 5.000%, 7/01/44 (Alternative Minimum Tax) | 7/23 at 100.00 | BBB | | 3,207,146 | |
| | 1,320 | | 5.000%, 7/01/48 (Alternative Minimum Tax) | 7/23 at 100.00 | BBB | | 1,396,718 | |
| | | | Indiana Finance Authority, Tax-Exempt Private Activity Revenue Bonds, I-69 Section 5 Project, Series 2014: | | | | | |
| | 500 | | 5.250%, 9/01/34 (Alternative Minimum Tax) | 9/24 at 100.00 | BBB | | 557,535 | |
| | 260 | | 5.250%, 9/01/40 (Alternative Minimum Tax) | 9/24 at 100.00 | BBB | | 283,169 | |
| | | | Indiana Health and Educational Facilities Financing Authority, Revenue Bonds, Sisters of Saint Francis Health Services Inc., Series 2006E: | | | | | |
| | 475 | | 5.250%, 11/01/25 – AGM Insured | 5/18 at 100.00 | Aa3 | | 513,670 | |
| | 530 | | 5.250%, 11/01/29 – AGM Insured | 5/18 at 100.00 | Aa3 | | 569,824 | |
| | | | St. Joseph County Hospital Authority, Indiana, Revenue Bonds, Madison Center Inc., Series 2005: | | | | | |
| | 1,550 | | 5.250%, 2/15/23 (6) | 2/16 at 100.00 | N/R | | 75,656 | |
| | 2,500 | | 5.375%, 2/15/34 (6) | 2/16 at 100.00 | N/R | | 122,025 | |
| | 1,275 | | Valparaiso, Indiana, Exempt Facilities Revenue Bonds, Pratt Paper LLC Project, Series 2013, 7.000%, 1/01/44 (Alternative Minimum Tax) | 1/24 at 100.00 | N/R | | 1,555,143 | |
| | 15,530 | | Total Indiana | | | | 12,608,320 | |
| | | | Iowa – 1.9% (1.3% of Total Investments) | | | | | |
| | 1,500 | | Iowa Finance Authority, Iowa, Midwestern Disaster Area Revenue Bonds, Alcoa Inc. Project, Series 2012, 4.750%, 8/01/42 | 8/22 at 100.00 | BBB– | | 1,497,645 | |
| | 3,000 | | Iowa Student Loan Liquidity Corporation, Student Loan Revenue Bonds, Refunding Series 2009-2, 5.500%, 12/01/25 | 12/19 at 100.00 | A1 | | 3,275,460 | |
| | 8,000 | | Iowa Tobacco Settlement Authority, Asset Backed Settlement Revenue Bonds, Series 2005C, 5.500%, 6/01/42 | 12/15 at 100.00 | B+ | | 7,583,040 | |
| | 170 | | Sheldon, Iowa, Health Care Facility Revenue Bonds, Northwest Iowa Health Center Project, Refunding Series 1994, 6.150%, 3/01/16 | 11/15 at 100.00 | A1 | | 170,787 | |
| | 12,670 | | Total Iowa | | | | 12,526,932 | |
| | | | Kansas – 1.1% (0.7% of Total Investments) | | | | | |
| | 1,240 | | Johnson and Miami Counties Unified School District 230, Kansas, General Obligation Bonds, Series 2011A, 5.000%, 9/01/26 | 9/21 at 100.00 | Aa3 | | 1,445,890 | |
| | 1,000 | | Kansas Development Finance Authority, Health Facilities Revenue Bonds, Hays Medical Center Inc., Series 2005L, 5.000%, 11/15/22 | 11/15 at 100.00 | A2 | | 1,003,980 | |
| | 1,540 | | Kansas Development Finance Authority, Hospital Revenue Bonds, Adventist Health System/Sunbelt Obligated Group, Series 2009C, 5.500%, 11/15/29 | 11/19 at 100.00 | Aa2 | | 1,757,263 | |
| NQM | Nuveen Investment Quality Municipal Fund, Inc. | |
| | Portfolio of Investments (continued) | October 31, 2015 |
| | Principal | | | Optional Call | | | | |
| | Amount (000) | | Description (1) | Provisions (2) | Ratings (3) | | Value | |
| | | | Kansas (continued) | | | | | |
| $ | 1,000 | | Olathe, Kansas, Health Facilities Revenue Bonds, Olathe Medical Center, Series 2008, 5.000%, 9/01/29 | 9/17 at 100.00 | A+ | $ | 1,048,060 | |
| | 580 | | Overland Park Transportation Development District, Kansas, Sales Tax Revenue Bonds, Oak Park Mall Project, Series 2010, 5.900%, 4/01/32 | 4/20 at 100.00 | BBB | | 631,318 | |
| | 100 | | Sedgwick and Shawnee Counties, Kansas, GNMA Mortgage-Backed Securities Program Single Family Revenue Bonds, Series 1997A-1, 6.950%, 6/01/29 (Alternative Minimum Tax) | No Opt. Call | Aaa | | 105,358 | |
| | 530 | | Topeka, Kansas, Industrial Revenue Refunding Bonds, Sunwest Hotel Corporation, Series 1988, 9.500%, 10/01/16 (Alternative Minimum Tax) | No Opt. Call | AA+ | | 568,314 | |
| | 780 | | Wyandotte County-Kansas City Unified Government, Kansas, Sales Tax Special Obligation Capital Appreciation Revenue Bonds Redevelopment Project Area B – Major Multi-Sport Athletic Complex Project, Subordinate Lien Series 2010B, 0.000%, 6/01/21 | No Opt. Call | A– | | 574,041 | |
| | 6,770 | | Total Kansas | | | | 7,134,224 | |
| | | | Kentucky – 2.2% (1.5% of Total Investments) | | | | | |
| | 2,000 | | Kentucky Economic Development Finance Authority, Hospital Facilities Revenue Bonds, Owensboro Medical Health System, Series 2010A, 6.000%, 6/01/30 | 6/20 at 100.00 | BBB+ | | 2,274,060 | |
| | 2,605 | | Kentucky Economic Development Finance Authority, Revenue Bonds, Next Generation Kentucky Information Highway Project, Senior Series 2015A, 5.000%, 1/01/45 | 7/25 at 100.00 | BBB+ | | 2,795,660 | |
| | 2,500 | | Louisville-Jefferson County Metro Government, Kentucky, Revenue Bonds, Bellarmine University Inc. Project, Refunding & Improvement Series 2008A, 6.000%, 5/01/38 | 5/18 at 100.00 | Baa3 | | 2,697,550 | |
| | | | Pikeville, Kentucky, Hospital Revenue Bonds, Pikeville Medical Center, Inc. Project, Improvement and Refunding Series 2011: | | | | | |
| | 5,000 | | 6.250%, 3/01/31 | 3/21 at 100.00 | A3 | | 5,751,650 | |
| | 1,250 | | 6.500%, 3/01/41 | 3/21 at 100.00 | A3 | | 1,438,563 | |
| | 13,355 | | Total Kentucky | | | | 14,957,483 | |
| | | | Louisiana – 2.7% (1.9% of Total Investments) | | | | | |
| | 1,000 | | Louisiana Local Government Environmental Facilities & Community Development Authority, Revenue Bonds, Westlake Chemical Corporation Project, Series 2007, 6.750%, 11/01/32 | 11/17 at 100.00 | BBB+ | | 1,084,970 | |
| | 1,380 | | Louisiana Local Government Environmental Facilities and Community Development Authority, Revenue Bonds, Westlake Chemical Corporation Projects, Series 2009A, 6.500%, 8/01/29 | 8/20 at 100.00 | BBB+ | | 1,624,495 | |
| | 8,655 | | Louisiana Public Facilities Authority, Dock and Wharf Revenue Bonds, Impala Warehousing (US) LLC Project, Series 2013, 6.500%, 7/01/36 (Alternative Minimum Tax) | 7/23 at 100.00 | N/R | | 9,636,564 | |
| | 1,810 | | Louisiana Public Facilities Authority, Revenue Bonds, Ochsner Clinic Foundation Project, Series 2007A, 5.500%, 5/15/47 | 5/17 at 100.00 | Baa1 | | 1,896,464 | |
| | 690 | | Louisiana Public Facilities Authority, Revenue Bonds, Ochsner Clinic Foundation Project, Series 2007A, 5.500%, 5/15/47 (Pre-refunded 5/15/17) | 5/17 at 100.00 | N/R (4) | | 742,709 | |
| | 3,000 | | New Orleans Aviation Board, Louisiana, Revenue Bonds, North Terminal Project, Series 2015B, 5.000%, 1/01/40 (Alternative Minimum Tax) | 1/25 at 100.00 | A– | | 3,242,580 | |
| | 16,535 | | Total Louisiana | | | | 18,227,782 | |
| | | | Maine – 0.8% (0.5% of Total Investments) | | | | | |
| | | | Maine Health and Higher Educational Facilities Authority, Revenue Bonds, Maine General Medical Center, Series 2011: | | | | | |
| | 2,000 | | 6.750%, 7/01/36 | 7/21 at 100.00 | BBB– | | 2,270,960 | |
| | 1,000 | | 6.750%, 7/01/41 | 7/21 at 100.00 | BBB– | | 1,133,860 | |
| | 1,720 | | Maine Health and Higher Educational Facilities Authority, Revenue Bonds, Series 2010A, 5.000%, 7/01/40 | 7/20 at 100.00 | AA | | 1,897,900 | |
| | 4,720 | | Total Maine | | | | 5,302,720 | |
| | | | Maryland – 0.1% (0.1% of Total Investments) | | | | | |
| | 515 | | Maryland Health and Higher Educational Facilities Authority, Revenue Bonds, Patterson Park Public Charter School Issue, Series 2010, 6.000%, 7/01/40 | 7/20 at 100.00 | BBB– | | 537,639 | |
| | Principal | | | Optional Call | | | | |
| | Amount (000) | | Description (1) | Provisions (2) | Ratings (3) | | Value | |
| | | | Massachusetts – 2.1% (1.4% of Total Investments) | | | | | |
| | | | Massachusetts Development Finance Agency, Revenue Bonds, Boston University, Tender Option Bond Trust 1163: | | | | | |
| $ | 505 | | 17.158%, 10/01/48 (IF) (5) | 10/23 at 100.00 | A+ | $ | 719,756 | |
| | 930 | | 17.058%, 10/01/48 (IF) (5) | 10/23 at 100.00 | A+ | | 1,325,008 | |
| | 1,825 | | Massachusetts Development Finance Agency, Education Facility Revenue Bonds, Academy of the Pacific Rim Project, Series 2006A, 5.125%,
6/01/31 – ACA Insured | 6/16 at 100.00 | N/R | | 1,829,782 | |
| | 650 | | Massachusetts Development Finance Agency, Health Care Facility Revenue Bonds, Adventcare Project, Series 2007A, 6.750%, 10/15/37 | 10/17 at 100.00 | N/R | | 671,873 | |
| | 845 | | Massachusetts Development Finance Agency, Health Care Facility Revenue Bonds, Adventcare Project, Series 2010, 7.625%, 10/15/37 | 10/20 at 100.00 | N/R | | 942,302 | |
| | 750 | | Massachusetts Development Finance Agency, Resource Recovery Revenue Refunding Bonds, Covanta Energy Project, Series 2012C, 5.250%, 11/01/42 (Alternative Minimum Tax) | 11/17 at 100.00 | BB+ | | 752,115 | |
| | 1,220 | | Massachusetts Development Finance Agency, Revenue Bonds, Loomis Communities, Series 2013A, 5.125%, 1/01/25 | 1/23 at 100.00 | BBB– | | 1,350,796 | |
| | 2,900 | | Massachusetts Health and Educational Facilities Authority, Revenue Refunding Bonds, Suffolk University Issue, Series 2009A, 5.750%, 7/01/39 | 7/19 at 100.00 | BBB | | 3,240,866 | |
| | 3,120 | | Massachusetts Water Resources Authority, General Revenue Bonds, Series 2007A, 4.500%, 8/01/46 – AGM Insured (UB) (5) | 2/17 at 100.00 | AA+ | | 3,167,237 | |
| | 12,745 | | Total Massachusetts | | | | 13,999,735 | |
| | | | Michigan – 1.7% (1.2% of Total Investments) | | | | | |
| | 2,500 | | Detroit, Michigan, Distributable State Aid General Obligation Bonds, Limited Tax Series 2010, 5.000%, 11/01/30 | 11/20 at 100.00 | AA | | 2,653,050 | |
| | 3,495 | | Michigan State Hospital Finance Authority, Hospital Revenue Bonds, Henry Ford Health System, Refunding Series 2009, 5.750%, 11/15/39 | 11/19 at 100.00 | A– | | 3,969,376 | |
| | 1,635 | | Michigan State Hospital Finance Authority, Revenue Bonds, Trinity Health Care Group, Series 2006A, 5.000%, 12/01/31 | 12/16 at 100.00 | AA | | 1,706,368 | |
| | 365 | | Michigan State Hospital Finance Authority, Revenue Bonds, Trinity Health Care Group, Series 2006A, 5.000%, 12/01/31 (Pre-refunded 12/01/16) | 12/16 at 100.00 | Aa2 (4) | | 383,195 | |
| | 1,165 | | Michigan Strategic Fund, Limited Obligation Revenue Bonds, Michigan House of Representatives Facilities, Series 2008A, 5.250%, 10/15/23 – AGC Insured | 10/18 at 100.00 | AA | | 1,291,601 | |
| | 340 | | Monroe County Hospital Finance Authority, Michigan, Mercy Memorial Hospital Corporation Revenue Bonds, Series 2006, 5.500%, 6/01/35 | 6/16 at 100.00 | AA– | | 344,148 | |
| | 1,200 | | Wayne County Airport Authority, Michigan, Revenue Bonds, Detroit Metropolitan Wayne County Airport, Series 2015D, 5.000%, 12/01/45 | 12/25 at 100.00 | A | | 1,303,944 | |
| | 10,700 | | Total Michigan | | | | 11,651,682 | |
| | | | Minnesota – 3.4% (2.3% of Total Investments) | | | | | |
| | 1,000 | | Baytown Township, Minnesota, Lease Revenue Bonds, Saint Croix Preparatory Academy Project, Series 2008, 5.750%, 8/01/42 | 8/16 at 102.00 | BB+ | | 1,013,370 | |
| | 1,000 | | Cuyuna Range Hospital District, Minnesota, Health Care Facilities Gross Revenue Bonds, Refunding Series 2007, 5.000%, 6/01/29 | 6/17 at 100.00 | N/R | | 1,016,880 | |
| | 5,000 | | Dakota and Washington Counties Housing and Redevelopment Authority, Minnesota, GNMA Mortgage-Backed Securities Program Single Family Residential Mortgage Revenue Bonds, Series 1988, 8.450%, 9/01/19 (Alternative Minimum Tax) (ETM) | No Opt. Call | Aaa | | 6,223,000 | |
| | 2,000 | | Duluth Housing & Redevelopment Authority, Minnesota, Lease Revenue Bonds, Duluth Public Schools Academy, Series 2010A, 5.875%, 11/01/40 | 11/20 at 100.00 | BBB– | | 2,119,860 | |
| | 2,000 | | Saint Louis Park, Minnesota, Health Care Facilities Revenue Bonds, Park Nicollet Health Services, Refunding Series 2009, 5.750%, 7/01/39 (Pre-refunded 7/01/19) | 7/19 at 100.00 | Aaa | | 2,338,640 | |
| | 1,520 | | Saint Paul Housing & Redevelopment Authority, Minnesota, Charter School Lease Revenue Bonds, Community of Peace Academy Project, Refunding Series 2015A, 5.000%, 12/01/50 | 12/24 at 100.00 | BBB– | | 1,478,291 | |
| NQM | Nuveen Investment Quality Municipal Fund, Inc. | |
| | Portfolio of Investments (continued) | October 31, 2015 |
| | Principal | | | Optional Call | | | | |
| | Amount (000) | | Description (1) | Provisions (2) | Ratings (3) | | Value | |
| | | | Minnesota (continued) | | | | | |
| | | | Saint Paul Housing and Redevelopment Authority Minnesota, Senior Housing and Health Care Revenue Bonds, Episcopal Homes Project, Series 2013: | | | | | |
| $ | 500 | | 5.000%, 5/01/33 | 5/23 at 100.00 | N/R | $ | 517,380 | |
| | 1,000 | | 5.125%, 5/01/48 | 5/23 at 100.00 | N/R | | 1,029,260 | |
| | 495 | | Saint Paul Housing and Redevelopment Authority, Minnesota, Health Care Facility Revenue Bonds, HealthPartners Obligated Group, Series 2006, 5.250%, 5/15/36 (Pre-refunded 11/15/16) | 11/16 at 100.00 | Aaa | | 520,186 | |
| | 875 | | Saint Paul Housing and Redevelopment Authority, Minnesota, Lease Revenue Bonds, Community of Peace Academy Project, Series 2006A, 5.000%, 12/01/36 (Pre-refunded 12/01/15) | 12/15 at 100.00 | BBB– (4) | | 878,640 | |
| | 400 | | Saint Paul Housing and Redevelopment Authority, Minnesota, Upper Landing Project Tax Increment Revenue Refunding Bonds, Series 2012, 5.000%, 9/01/26 | No Opt. Call | N/R | | 422,884 | |
| | 750 | | St. Paul Housing and Redevelopment Authority, Minnesota, Hospital Revenue Bonds, HealthEast Inc., Series 2015, 5.000%, 11/15/29 | 11/25 at 100.00 | BBB– | | 832,140 | |
| | 3,835 | | Washington County, Minnesota, General Obligation Bonds, Capital Improvement Plan, Series 2007A, 3.500%, 2/01/28 | 8/17 at 100.00 | AAA | | 3,890,071 | |
| | 675 | | Worthington, Minnesota, Housing Revenue Refunding Bonds, Meadows of Worthington Project, Series 2007A, 5.250%, 11/01/28 | 11/15 at 100.00 | N/R | | 675,425 | |
| | 21,050 | | Total Minnesota | | | | 22,956,027 | |
| | | | Mississippi – 0.5% (0.3% of Total Investments) | | | | | |
| | 720 | | Mississippi Business Finance Corporation, Pollution Control Revenue Refunding Bonds, System Energy Resources Inc. Project, Series 1998, 5.875%, 4/01/22 | 4/16 at 100.00 | BBB | | 734,321 | |
| | | | Mississippi Development Bank, Special Obligation Bonds, City of Jackson General Obligation Street Resurfacing Project, Series 2009: | | | | | |
| | 1,325 | | 5.500%, 1/01/23 | 1/19 at 100.00 | Aa2 | | 1,477,070 | |
| | 850 | | 5.800%, 1/01/24 | 1/19 at 100.00 | Aa2 | | 953,428 | |
| | 2,895 | | Total Mississippi | | | | 3,164,819 | |
| | | | Missouri – 3.0% (2.0% of Total Investments) | | | | | |
| | 1,500 | | Boone County, Missouri, Hospital Revenue Bonds, Boone Hospital Center, Series 2008, 5.625%, 8/01/38 | 8/18 at 100.00 | A | | 1,660,635 | |
| | 500 | | Curators of the University of Missouri, System Facilities Revenue Bonds, Refunding Series 2014A, 4.000%, 11/01/33 | 11/24 at 100.00 | AA+ | | 536,335 | |
| | 2,000 | | Hanley Road Corridor Transportation Development District, Brentwood and Maplewood, Missouri, Transportation Sales Revenue Bonds, Refunding Series 2009A, 5.875%, 10/01/36 | 10/19 at 100.00 | A– | | 2,229,680 | |
| | 200 | | Hannibal Industrial Development Authority, Missouri, Health Facilities Revenue Bonds, Hannibal Regional Hospital, Series 2006, 5.000%, 3/01/22 | 3/16 at 100.00 | BBB+ | | 201,766 | |
| | 1,000 | | Jackson County Reorganized School District R-7, Lees Summit, Missouri, General Obligation Bonds, Series 2006, 5.250%, 3/01/26 (Pre-refunded 3/01/16) – NPFG Insured | 3/16 at 100.00 | Aa1 (4) | | 1,016,110 | |
| | 645 | | Missouri Development Finance Board, Infrastructure Facilities Revenue Bonds, Branson Landing Project, Series 2005A, 6.000%, 6/01/20 | No Opt. Call | A | | 706,610 | |
| | 3,080 | | Missouri Health and Educational Facilities Authority, Educational Facilities Revenue Bonds, Saint Louis College of Pharmacy, Series 2013, 5.500%, 5/01/43 | 5/23 at 100.00 | BBB+ | | 3,358,155 | |
| | 1,045 | | Missouri Health and Educational Facilities Authority, Health Facilities Revenue Bonds, CoxHealth, Series 2013A, 5.000%, 11/15/44 | 11/23 at 100.00 | A2 | | 1,141,391 | |
| | 400 | | Missouri Health and Educational Facilities Authority, Revenue Bonds, Maryville University of St. Louis Project, Series 2015, 3.500%, 6/15/30 | 6/22 at 100.00 | BBB+ | | 388,368 | |
| | 3,775 | | Missouri Health and Educational Facilities Authority, Revenue Bonds, Webster University, Series 2011, 5.000%, 4/01/26 | 4/21 at 100.00 | A2 | | 4,195,875 | |
| | 1,000 | | North Central Missouri Regional Water Commission, Waterworks System Revenue Bonds, Series 2006, 5.000%, 1/01/37 | 1/17 at 100.00 | N/R | | 1,020,570 | |
| | 2,000 | | Saint Charles County Public Water Supply District 2, Missouri, Certificates of Participation, Series 2015, 4.125%, 12/01/38 | 12/21 at 100.00 | AA | | 2,044,240 | |
| | Principal | | | Optional Call | | | | |
| | Amount (000) | | Description (1) | Provisions (2) | Ratings (3) | | Value | |
| | | | Missouri (continued) | | | | | |
| $ | 490 | | Saint Louis, Missouri, Airport Revenue Bonds, Lambert-St. Louis International Airport, Refunding Series 2012, 4.250%, 7/01/29 – FGIC Insured (Alternative Minimum Tax) | 7/22 at 100.00 | A– | $ | 501,701 | |
| | 575 | | St. Louis County Industrial Development Authority, Missouri, Revenue Bonds, Friendship Village of Chesterfield, Series 2012, 5.000%, 9/01/42 | No Opt. Call | BBB– | | 587,138 | |
| | 375 | | St. Louis County Industrial Development Authority, Missouri, Revenue Bonds, Friendship Village of Sunset Hills, Series 2013A, 5.875%, 9/01/43 | 9/23 at 100.00 | A– | | 422,010 | |
| | 18,585 | | Total Missouri | | | | 20,010,584 | |
| | | | Montana – 0.1% (0.1% of Total Investments) | | | | | |
| | 600 | | Forsyth, Rosebud County, Montana, Pollution Control Revenue Refunding Bonds, Northwestern Corporation Colstrip Project, Series 2006, 4.650%, 8/01/23 – AMBAC Insured | 8/16 at 100.00 | A1 | | 617,916 | |
| | | | Nebraska – 2.5% (1.7% of Total Investments) | | | | | |
| | 1,500 | | Central Plains Energy Project, Nebraska, Gas Project 3 Revenue Bonds, Series 2012, 5.000%, 9/01/32 | 9/22 at 100.00 | A | | 1,652,925 | |
| | 11,215 | | Lincoln, Nebraska, Electric System Revenue Bonds, Series 2007A, 4.500%, 9/01/37 – NPFG Insured (UB) (5) | 9/16 at 100.00 | AA | | 11,339,487 | |
| | | | University of Nebraska, Revenue Bonds, Omaha Health & Recreation Project, Series 2008: | | | | | |
| | 1,250 | | 5.000%, 5/15/33 | 5/18 at 100.00 | Aa1 | | 1,353,550 | |
| | 2,100 | | 5.000%, 5/15/38 | 5/18 at 100.00 | Aa1 | | 2,273,964 | |
| | 16,065 | | Total Nebraska | | | | 16,619,926 | |
| | | | Nevada – 1.0% (0.7% of Total Investments) | | | | | |
| | 4,025 | | Clark County, Nevada, Airport Revenue Bonds, Subordinate Lien Series 2010B, 5.750%, 7/01/42 | 1/20 at 100.00 | A+ | | 4,666,022 | |
| | 1,600 | | Las Vegas Redevelopment Agency, Nevada, Tax Increment Revenue Bonds, Series 2009A, 8.000%, 6/15/30 | 6/19 at 100.00 | BBB | | 1,817,488 | |
| | 5,625 | | Total Nevada | | | | 6,483,510 | |
| | | | New Jersey – 1.4% (0.9% of Total Investments) | | | | | |
| | 905 | | Camden County Improvement Authority, New Jersey, Health Care Redevelopment Revenue Bonds, Cooper Health System Obligated Group Issue, Series 2013A, 5.750%, 2/15/42 | 2/23 at 100.00 | BBB+ | | 1,022,252 | |
| | 555 | | New Jersey Economic Development Authority, Student Housing Revenue Bonds, Provident Group-Montclair Properties LLC, Montclair State University Student Housing Project, Series 2010A, 5.750%, 6/01/31 | 6/20 at 100.00 | Baa3 | | 618,414 | |
| | 600 | | New Jersey Educational Facilities Authority, Revenue Bonds, University of Medicine and Dentistry of New Jersey, Refunding Series 2009B, 7.500%, 12/01/32 (Pre-refunded 6/01/19) | 6/19 at 100.00 | N/R (4) | | 733,782 | |
| | 680 | | New Jersey Health Care Facilities Financing Authority, New Jersey, Revenue Bonds, Saint Peters University Hospital, Series 2007, 5.750%, 7/01/37 | 7/18 at 100.00 | BB+ | | 703,963 | |
| | 665 | | New Jersey Higher Education Assistance Authority, Student Loan Revenue Bonds, Tender Option Bond Trust PA-4643, 19.917%, 6/01/30 (IF) (5) | 6/19 at 100.00 | AA | | 933,474 | |
| | 855 | | New Jersey Transportation Trust Fund Authority, Transportation System Bonds, Refunding Series 2006A, 5.250%, 12/15/20 | No Opt. Call | A– | | 938,876 | |
| | 700 | | New Jersey Turnpike Authority, Revenue Bonds, Series 2009E, 5.250%, 1/01/40 | 1/19 at 100.00 | A+ | | 769,510 | |
| | 4,250 | | Tobacco Settlement Financing Corporation, New Jersey, Tobacco Settlement Asset-Backed Bonds, Series 2007-1A, 4.750%, 6/01/34 | 6/17 at 100.00 | B– | | 3,446,155 | |
| | 9,210 | | Total New Jersey | | | | 9,166,426 | |
| NQM | Nuveen Investment Quality Municipal Fund, Inc. | |
| | Portfolio of Investments (continued) | October 31, 2015 |
| | Principal | | | Optional Call | | | | |
| | Amount (000) | | Description (1) | Provisions (2) | Ratings (3) | | Value | |
| | | | New Mexico – 0.7% (0.4% of Total Investments) | | | | | |
| | | | Farmington, New Mexico, Hospital Revenue Bonds, San Juan Regional Medical Center Inc., Series 2004A: | | | | | |
| $ | 880 | | 5.125%, 6/01/17 | 12/15 at 100.00 | A3 | $ | 883,529 | |
| | 1,295 | | 5.125%, 6/01/19 | 12/15 at 100.00 | A3 | | 1,299,934 | |
| | 2,000 | | Farmington, New Mexico, Pollution Control Revenue Refunding Bonds, Public Service Company of New Mexico San Juan Project, Series 2010D, 5.900%, 6/01/40 | 6/20 at 100.00 | BBB | | 2,203,020 | |
| | 4,175 | | Total New Mexico | | | | 4,386,483 | |
| | | | New York – 4.8% (3.3% of Total Investments) | | | | | |
| | | | Brooklyn Arena Local Development Corporation, New York, Payment in Lieu of Taxes Revenue Bonds, Barclays Center Project, Series 2009: | | | | | |
| | 1,945 | | 6.000%, 7/15/30 | 1/20 at 100.00 | BBB– | | 2,203,179 | |
| | 3,065 | | 6.250%, 7/15/40 | 1/20 at 100.00 | BBB– | | 3,483,832 | |
| | 490 | | Buffalo and Erie County Industrial Land Development Corporation, New York, Revenue Bonds, Catholic Health System, Inc. Project, Series 2015, 5.250%, 7/01/35 | 7/25 at 100.00 | BBB+ | | 551,030 | |
| | 1,500 | | Hudson Yards Infrastructure Corporation, New York, Revenue Bonds, Senior Fiscal 2012 Series 2011A, 5.750%, 2/15/47 | 2/21 at 100.00 | A | | 1,707,705 | |
| | 4,055 | | Hudson Yards Infrastructure Corporation, New York, Revenue Bonds, Series 2006A, 4.500%, 2/15/47 – NPFG Insured | 2/17 at 100.00 | AA– | | 4,203,494 | |
| | 3,000 | | Long Island Power Authority, New York, Electric System General Revenue Bonds, Series 2014A, 5.000%, 9/01/39 | 9/24 at 100.00 | A– | | 3,341,760 | |
| | 1,000 | | Metropolitan Transportation Authority, New York, Dedicated Tax Fund Bonds, Series 2009B, 5.000%, 11/15/34 | 11/19 at 100.00 | AA | | 1,134,180 | |
| | 5,000 | | Metropolitan Transportation Authority, New York, Transportation Revenue Bonds, Series 2013A, 5.000%, 11/15/38 | 5/23 at 100.00 | AA– | | 5,605,850 | |
| | | | New York City Industrial Development Agency, New York, Civic Facility Revenue Bonds, Bronx Parking Development Company, LLC Project, Series 2007: | | | | | |
| | 500 | | 5.750%, 10/01/37 (7) | 10/17 at 100.00 | N/R | | 178,250 | |
| | 1,000 | | 5.875%, 10/01/46 (8) | 10/17 at 102.00 | N/R | | 356,500 | |
| | 500 | | New York City Municipal Water Finance Authority, New York, Water and Sewerage System Revenue Bonds, Tender Option Bond Trust 2015-XF0097, 17.948%, 6/15/33 (IF) | 6/19 at 100.00 | AA+ | | 739,420 | |
| | 5,000 | | New York Liberty Development Corporation, New York, Liberty Revenue Bonds, 3 World Trade Center Project, Class 1 Series 2014, 5.000%, 11/15/44 | 11/24 at 100.00 | N/R | | 5,068,900 | |
| | | | Port Authority of New York and New Jersey, Special Project Bonds, JFK International Air Terminal LLC Project, Eighth Series 2010: | | | | | |
| | 590 | | 5.500%, 12/01/31 | 12/20 at 100.00 | BBB | | 673,727 | |
| | 1,325 | | 6.000%, 12/01/42 | 12/20 at 100.00 | BBB | | 1,539,319 | |
| | 1,170 | | Suffolk County Economic Development Corporation, New York, Revenue Bonds, Peconic Landing At Southold, Inc. Project, Refunding Series 2010, 5.875%, 12/01/30 | 12/20 at 100.00 | BBB– | | 1,280,471 | |
| | 30,140 | | Total New York | | | | 32,067,617 | |
| | | | North Carolina – 0.2% (0.2% of Total Investments) | | | | | |
| | 1,500 | | North Carolina Capital Facilities Financing Agency, Educational Facilities Revenue Bond, Meredith College, Series 2008A, 6.125%, 6/01/35 | 6/18 at 100.00 | BBB | | 1,594,590 | |
| | | | North Dakota – 0.4% (0.3% of Total Investments) | | | | | |
| | 2,190 | | Fargo, North Dakota, Health System Revenue Bonds, Sanford Health, Refunding Series 2011, 6.250%, 11/01/31 | 11/21 at 100.00 | A+ | | 2,651,937 | |
| | | | Ohio – 4.7% (3.2% of Total Investments) | | | | | |
| | | | Buckeye Tobacco Settlement Financing Authority, Ohio, Tobacco Settlement Asset-Backed Revenue Bonds, Senior Lien, Series 2007A-2: | | | | | |
| | 5,905 | | 5.125%, 6/01/24 | 6/17 at 100.00 | B– | | 5,303,753 | |
| | 2,365 | | 5.875%, 6/01/30 | 6/17 at 100.00 | B– | | 2,114,736 | |
| | 605 | | 5.750%, 6/01/34 | 6/17 at 100.00 | B– | | 530,355 | |
| | 1,000 | | 6.500%, 6/01/47 | 6/17 at 100.00 | B | | 933,630 | |
| | Principal | | | Optional Call | | | | |
| | Amount (000) | | Description (1) | Provisions (2) | Ratings (3) | | Value | |
| | | | Ohio (continued) | | | | | |
| | | | Butler County, Ohio, Hospital Facilities Revenue Bonds, UC Health, Series 2010: | | | | | |
| $ | 1,125 | | 5.250%, 11/01/29 | 11/20 at 100.00 | A | $ | 1,274,074 | |
| | 1,000 | | 5.750%, 11/01/40 | 11/20 at 100.00 | A | | 1,138,320 | |
| | 5,000 | | 5.500%, 11/01/40 | 11/20 at 100.00 | A | | 5,623,650 | |
| | 760 | | Franklin County, Ohio, Healthcare Facilities Revenue Bonds, Ohio Presbyterian Retirement Services, Improvement Series 2010A, 5.625%, 7/01/26 | 7/21 at 100.00 | BBB– | | 820,656 | |
| | 1,400 | | Lorain County Port Authority, Ohio, Recovery Zone Facility Economic Development Revenue Bonds, United State Steel Corporation Project, Series 2010, 6.750%, 12/01/40 | 12/20 at 100.00 | BB– | | 1,408,778 | |
| | 5,765 | | Lucas County, Ohio, Hospital Revenue Bonds, ProMedica Healthcare Obligated Group, Series 2011A, 6.000%, 11/15/41 | 11/21 at 100.00 | AA | | 6,889,867 | |
| | 1,000 | | Miami County, Ohio, Hospital Facilities Revenue Refunding Bonds, Upper Valley Medical Center Inc., Series 2006, 5.250%, 5/15/26 | 5/16 at 100.00 | A | | 1,020,100 | |
| | 1,000 | | Middleburg Heights, Ohio, Hospital Facilities Revenue Bonds, Southwest General Health Center Project, Refunding Series 2011, 5.125%, 8/01/31 | 8/21 at 100.00 | A2 | | 1,086,400 | |
| | 2,000 | | Muskingum County, Ohio, Hospital Facilities Revenue Bonds, Genesis HealthCare System Obligated Group Project, Series 2013, 5.000%, 2/15/33 | 2/23 at 100.00 | BB+ | | 2,077,820 | |
| | 800 | | Ohio Air Quality Development Authority, Ohio, Revenue Bonds, Ohio Valley Electric Corporation Project, Series 2009E, 5.625%, 10/01/19 | No Opt. Call | BBB– | | 895,144 | |
| | 29,725 | | Total Ohio | | | | 31,117,283 | |
| | | | Oklahoma – 1.4% (0.9% of Total Investments) | | | | | |
| | 750 | | Norman Regional Hospital Authority, Oklahoma, Hospital Revenue Bonds, Series 2005, 5.375%, 9/01/36 | 9/16 at 100.00 | BBB– | | 767,325 | |
| | 2,500 | | Tulsa Airports Improvement Trust, Oklahoma, General Airport Revenue Bonds, Series 2015A, 5.000%, 6/01/45 – BAM Insured (Alternative Minimum Tax) | 6/24 at 100.00 | AA | | 2,653,950 | |
| | 5,280 | | Tulsa County Industrial Authority, Oklahoma, Health Care Revenue Bonds, Saint Francis Health System, Series 2006, 5.000%, 12/15/36 (UB) | 12/16 at 100.00 | AA+ | | 5,511,370 | |
| | 88 | | Tulsa County Industrial Authority, Oklahoma, Health Care Revenue Bonds, Saint Francis Health System, Tender Option Bond Trust 3500, 8.554%, 6/15/30 (IF) | 12/16 at 100.00 | AA+ | | 95,011 | |
| | 8,618 | | Total Oklahoma | | | | 9,027,656 | |
| | | | Oregon – 0.2% (0.1% of Total Investments) | | | | | |
| | 1,000 | | Portland, Oregon, Sewer System Revenue Bonds, Series 2006B, 5.000%, 6/15/24 (Pre-refunded 6/15/16) – NPFG Insured | 6/16 at 100.00 | AA– (4) | | 1,029,640 | |
| | | | Pennsylvania – 5.1% (3.4% of Total Investments) | | | | | |
| | 1,100 | | Allegheny Country Industrial Development Authority, Pennsylvania, Environmental Improvement | 11/19 at 100.00 | BB– | | 1,131,405 | |
| | | | Revenue Bonds, United States Steel Corporation Project, Refunding Series 2009, 6.750%, 11/01/24 | | | | | |
| | 2,000 | | Allegheny County Hospital Development Authority, Pennsylvania, Revenue Bonds, University of Pittsburgh Medical Center, Series 2009A, 5.375%, 8/15/29 | 8/19 at 100.00 | Aa3 | | 2,236,400 | |
| | 1,000 | | Bucks County Industrial Development Authority, Pennsylvania, Charter School Revenue Bonds, School Lane Charter School, Series 2007A, 5.000%, 3/15/37 | 3/17 at 100.00 | BBB– | | 1,003,760 | |
| | 3,000 | | Commonwealth Financing Authority, Pennsylvania, State Appropriation Lease Bonds, Series 2006A, 5.000%, 6/01/26 (Pre-refunded 6/01/16) – AGM Insured (UB) | 6/16 at 100.00 | AA (4) | | 3,083,010 | |
| | 100 | | Cumberland County Municipal Authority Revenue Bonds, Pennsylvania, Diakon Lutheran Social Ministries Project, Series 2009, 6.125%, 1/01/29 | 1/19 at 100.00 | BBB+ | | 113,528 | |
| | 900 | | Cumberland County Municipal Authority Revenue Bonds, Pennsylvania, Diakon Lutheran Social Ministries Project, Series 2009, 6.125%, 1/01/29 (Pre-refunded 1/01/19) | 1/19 at 100.00 | N/R (4) | | 1,044,297 | |
| | 1,000 | | Delaware County Authority, Pennsylvania, Revenue Bonds, Neumann College, Series 2008, 6.000%, 10/01/30 | 10/18 at 100.00 | BBB | | 1,109,030 | |
| | 400 | | Pennsylvania Higher Educational Facilities Authority, Revenue Bonds, Edinboro University Foundation Student Housing Project, Series 2010, 6.000%, 7/01/43 | 7/20 at 100.00 | Baa3 | | 426,276 | |
| NQM | Nuveen Investment Quality Municipal Fund, Inc. | |
| | Portfolio of Investments (continued) | October 31, 2015 |
| | Principal | | | Optional Call | | | | |
| | Amount (000) | | Description (1) | Provisions (2) | Ratings (3) | | Value | |
| | | | Pennsylvania (continued) | | | | | |
| $ | 5,130 | | Pennsylvania Public School Building Authority, Lease Revenue Bonds, School District of Philadelphia, Series 2006B, 4.500%, 6/01/32 – AGM Insured | 12/16 at 100.00 | AA | $ | 5,274,153 | |
| | 4,305 | | Pennsylvania Turnpike Commission, Turnpike Revenue Bonds, Series 2015A-1, 5.000%, 12/01/45 | 6/25 at 100.00 | A1 | | 4,749,405 | |
| | 2,000 | | Pennsylvania Turnpike Commission, Turnpike Revenue Bonds, Subordinate Lien Series 2014A-1, 5.000%, 12/01/38 | 12/24 at 100.00 | A– | | 2,189,320 | |
| | 5,000 | | Pennsylvania Turnpike Commission, Turnpike Revenue Bonds, Subordinate Series 2015B-1, 5.000%, 12/01/45 | 12/25 at 100.00 | A– | | 5,433,100 | |
| | 1,595 | | Philadelphia Hospitals and Higher Education Facilities Authority, Pennsylvania, Health System Revenue Bonds, Jefferson Health System, Series 2010B, 5.000%, 5/15/40 (Pre-refunded 5/15/20) | 5/20 at 100.00 | N/R (4) | | 1,861,588 | |
| | 1,425 | | Philadelphia, Pennsylvania, General Obligation Bonds, Refunding Series 2011, 6.500%, 8/01/41 | 8/20 at 100.00 | A+ | | 1,695,707 | |
| | 2,350 | | Union County Hospital Authority, Pennsylvania, Hospital Revenue Bonds, Evangelical Community Hospital Project, Refunding and Improvement Series 2011, 5.500%, 8/01/20 | No Opt. Call | A– | | 2,613,811 | |
| | 31,305 | | Total Pennsylvania | | | | 33,964,790 | |
| | | | Puerto Rico – 0.4% (0.3% of Total Investments) | | | | | |
| | 14,000 | | Puerto Rico Sales Tax Financing Corporation, Sales Tax Revenue Bonds, Series 2007A, 0.000%, 8/01/42 – FGIC Insured | No Opt. Call | AA– | | 2,585,240 | |
| | | | South Carolina – 2.9% (1.9% of Total Investments) | | | | | |
| | 750 | | Educational Facilities Authority of Private Non-Profit Institutions of Higher Learning, South Carolina, Revenue Bonds, Wofford College, Series 2007A, 4.500%, 4/01/30 | 4/17 at 100.00 | A– | | 763,095 | |
| | 650 | | Georgetown County, South Carolina, Environmental Improvement Revenue Bonds, International Paper Company, Senior Lien Series 2005A, 5.550%, 12/01/29 (Pre-refunded 12/01/15) (Alternative Minimum Tax) | 12/15 at 100.00 | BBB (4) | | 653,003 | |
| | 1,640 | | South Carolina Jobs-Economic Development Authority, Economic Development Revenue Bonds, Furman University, Refunding Series 2015, 5.000%, 10/01/45 | 10/25 at 100.00 | AA– | | 1,838,784 | |
| | 1,800 | | South Carolina Public Service Authority, Electric System Revenue Bonds, Santee Cooper, Series 2006A, 5.000%, 1/01/30 (Pre-refunded 1/01/16) – NPFG Insured | 1/16 at 100.00 | AA– (4) | | 1,814,292 | |
| | 12,805 | | South Carolina Public Service Authority, Santee Cooper Revenue Obligations, Refunding Series 2014C, 5.000%, 12/01/39 | 12/24 at 100.00 | AA– | | 14,079,224 | |
| | 17,645 | | Total South Carolina | | | | 19,148,398 | |
| | | | South Dakota – 0.8% (0.5% of Total Investments) | | | | | |
| | 1,300 | | Deadwood, South Dakota, Sales Tax Revenue Bonds, Series 2009B, 6.250%, 12/01/28 | 12/19 at 100.00 | N/R | | 1,415,843 | |
| | 1,460 | | South Dakota Health and Educational Facilities Authority, Revenue Bonds, Sanford Health, Series 2014B, 5.000%, 11/01/44 | 11/24 at 100.00 | A+ | | 1,588,465 | |
| | 910 | | South Dakota Health and Educational Facilities Authority, Revenue Bonds, Sanford Health, Series 2015, 5.000%, 11/01/45 | 11/25 at 100.00 | A+ | | 1,005,350 | |
| | 1,000 | | South Dakota Health and Educational Facilities Authority, Revenue Bonds, Vocational Education Program, Series 2008, 5.500%, 8/01/38 (Pre-refunded 8/01/18) – AGC Insured | 8/18 at 100.00 | AA (4) | | 1,124,580 | |
| | 4,670 | | Total South Dakota | | | | 5,134,238 | |
| | | | Tennessee – 3.4% (2.3% of Total Investments) | | | | | |
| | 2,425 | | Chattanooga Health, Educational and Housing Facility Board, Tennessee, Hospital Revenue Bonds, Catholic Health Initiatives, Series 2013A, 5.250%, 1/01/45 | 1/23 at 100.00 | A+ | | 2,655,690 | |
| | 3,200 | | Johnson City Health and Educational Facilities Board, Tennessee, Revenue Bonds, Mountain States Health Alliance, Series 2006A, 5.500%, 7/01/36 | 7/16 at 100.00 | BBB+ | | 3,286,816 | |
| | | | Metropolitan Government of Nashville-Davidson County Health and Educational Facilities Board, Tennessee, Revenue Bonds, Belmont University Project, Series 2012: | | | | | |
| | 3,000 | | 5.000%, 11/01/23 | 11/21 at 100.00 | BBB+ | | 3,402,180 | |
| | 3,200 | | 5.000%, 11/01/24 | 11/21 at 100.00 | BBB+ | | 3,595,552 | |
| | 3,400 | | 5.000%, 11/01/25 | 11/21 at 100.00 | BBB+ | | 3,801,676 | |
| | 5,000 | | Metropolitan Government of Nashville-Davidson County Health and Educational Facilities Board, Tennessee, Revenue Bonds, Vanderbilt University, Refunding Series 2009B, 5.000%, 10/01/39 | 10/19 at 100.00 | AA+ | | 5,618,450 | |
| | 20,225 | | Total Tennessee | | | | 22,360,364 | |
| | Principal | | | Optional Call | | | | |
| | Amount (000) | | Description (1) | Provisions (2) | Ratings (3) | | Value | |
| | | | Texas – 15.4% (10.4% of Total Investments) | | | | | |
| $ | 5,000 | | Board of Regents, University of Texas System, Financing System Revenue Bonds, Series 2006F, 4.250%, 8/15/36 (UB) | 2/17 at 100.00 | AAA | $ | 5,067,600 | |
| | | | Bryan, Brazos County, Texas, Electric System Revenue Bonds, Refunding Series 2012: | | | | | |
| | 1,000 | | 5.000%, 7/01/28 | 7/22 at 100.00 | A+ | | 1,131,990 | |
| | 1,000 | | 5.000%, 7/01/29 | 7/22 at 100.00 | A+ | | 1,125,830 | |
| | 1,100 | | Central Texas Regional Mobility Authority, Revenue Bonds, Senior Lien Refunding Series 2013A, 5.000%, 1/01/43 – AGM Insured | 1/23 at 100.00 | AA | | 1,201,145 | |
| | 1,250 | | Central Texas Regional Mobility Authority, Revenue Bonds, Senior Lien Series 2010, 5.750%, 1/01/25 | 1/20 at 100.00 | BBB+ | | 1,399,800 | |
| | 1,000 | | Clifton Higher Education Finance Corporation, Texas, Education Revenue Bonds, Idea Public Schools, Series 2013, 6.000%, 8/15/43 | 8/23 at 100.00 | BBB | | 1,183,860 | |
| | 200 | | Decatur Hospital Authority, Texas, Revenue Bonds, Wise Regional Health System, Series 2014A, 5.250%, 9/01/44 | 9/24 at 100.00 | BB+ | | 210,824 | |
| | 2,340 | | Grand Parkway Transportation Corporation, Texas, System Toll Revenue Bonds, First Tier Series 2013A, 5.125%, 10/01/43 | 10/23 at 100.00 | BBB+ | | 2,533,120 | |
| | 215 | | Gulf Coast Industrial Development Authority, Texas, Solid Waste Disposal Revenue Bonds, Citgo Petroleum Corporation Project, Series 1995, 4.875%, 5/01/25 (Alternative Minimum Tax) | 10/22 at 100.00 | BB | | 224,509 | |
| | 1,615 | | Harris County Cultural Education Facilities Finance Corporation, Texas, Revenue Refunding Bonds, Young Men's Christian Association of the Greater Houston Area, Series 2013A, 5.000%, 6/01/28 | 6/23 at 100.00 | Baa3 | | 1,773,625 | |
| | 12,030 | | Houston, Texas, Water and Sewerage System Revenue Bonds, Refunding Junior Lien Series 1998A, 0.000%, 12/01/22 – AGM Insured (ETM) | No Opt. Call | AA+ (4) | | 10,534,190 | |
| | 4,680 | | Houston, Texas, Water and Sewerage System Revenue Bonds, Refunding Junior Lien Series 1998A, 0.000%, 12/01/22 – AGM Insured | No Opt. Call | AA+ | | 4,040,244 | |
| | 1,000 | | Humble Independent School District, Harris County, Texas, General Obligation Bonds, Series 2008A, 5.250%, 2/15/22 – AGC Insured | 2/18 at 100.00 | Aa1 | | 1,095,150 | |
| | | | Kerrville Health Facilities Development Corporation, Texas, Revenue Bonds, Sid Peterson Memorial Hospital Project, Series 2015: | | | | | |
| | 800 | | 5.250%, 8/15/21 | 2/16 at 100.00 | BBB+ | | 806,368 | |
| | 1,220 | | 5.125%, 8/15/26 | 2/16 at 100.00 | BBB+ | | 1,227,186 | |
| | 1,960 | | North Texas Tollway Authority, Special Projects System Revenue Bonds, Series 2011A, 0.000%, 9/01/43 | 9/31 at 100.00 | AA+ | | 1,774,349 | |
| | 1,100 | | North Texas Tollway Authority, System Revenue Bonds, First Tier Series 2009A, 6.250%, 1/01/39 | 1/19 at 100.00 | A1 | | 1,248,291 | |
| | 560 | | North Texas Tollway Authority, System Revenue Bonds, Refunding First Tier, Series 2008A, 5.750%, 1/01/40 | 1/18 at 100.00 | AA | | 608,339 | |
| | 540 | | North Texas Tollway Authority, System Revenue Bonds, Refunding First Tier, Series 2008A, 5.750%, 1/01/40 (Pre-refunded 1/01/18) – AGC Insured | 1/18 at 100.00 | AA (4) | | 598,423 | |
| | 2,050 | | North Texas Tollway Authority, System Revenue Bonds, Refunding First Tier, Series 2015B, 5.000%, 1/01/40 | 1/23 at 100.00 | A1 | | 2,239,318 | |
| | 500 | | North Texas Tollway Authority, System Revenue Bonds, Refunding First Tier, Variable Rate Demand Series 2008-E3, 5.750%, 1/01/38 (Pre-refunded 1/01/16) | 1/16 at 100.00 | A1 (4) | | 504,735 | |
| | 4,370 | | North Texas Tollway Authority, System Revenue Bonds, Refunding Second Tier, Series 2008F, 5.750%, 1/01/38 (Pre-refunded 1/01/18) | 1/18 at 100.00 | A2 (4) | | 4,838,770 | |
| | 1,770 | | North Texas Tollway Authority, System Revenue Bonds, Refunding Second Tier, Series 2015A, 5.000%, 1/01/34 | 1/25 at 100.00 | A2 | | 1,984,011 | |
| | 3,500 | | Plano Independent School District, Collin County, Texas, General Obligation Bonds, Series 2008A, 5.250%, 2/15/34 | 2/18 at 100.00 | Aaa | | 3,812,235 | |
| | 1,000 | | Round Rock Independent School District, Williamson and Travis Counties, Texas, General Obligation Bonds, School Building Series 2009, 5.000%, 8/01/27 | 8/18 at 100.00 | Aaa | | 1,102,660 | |
| | 1,000 | | Sabine River Authority, Texas, Pollution Control Revenue Bonds, TXU Electric Company, Series 2001C, 5.200%, 5/01/28 (6) | 11/15 at 100.00 | C | | 57,500 | |
| NQM | Nuveen Investment Quality Municipal Fund, Inc. | |
| | Portfolio of Investments (continued) | October 31, 2015 |
| | Principal | | | Optional Call | | | | |
| | Amount (000) | | Description (1) | Provisions (2) | Ratings (3) | | Value | |
| | | | Texas (continued) | | | | | |
| $ | 1,300 | | Tarrant County Cultural Education Facilities Finance Corporation, Texas, Hospital Revenue Bonds, Hendrick Medical Center, Series 2009B, 5.250%, 9/01/26 – AGC Insured | 9/19 at 100.00 | AA | $ | 1,450,982 | |
| | 1,770 | | Tarrant County Cultural Education Facilities Finance Corporation, Texas, Hospital Revenue Bonds, Scott & White Healthcare Project, Series 2010, 5.500%, 8/15/45 | 8/20 at 100.00 | AA– | | 2,039,412 | |
| | 140 | | Tarrant County Cultural Education Facilities Finance Corporation, Texas, Hospital Revenue Bonds, Scott & White Healthcare Project, Series 2010, 5.500%, 8/15/45 (Pre-refunded 8/15/20) | 8/20 at 100.00 | N/R (4) | | 166,852 | |
| | 7,500 | | Tarrant County Cultural Education Facilities Finance Corporation, Texas, Revenue Bonds, Texas Health Resources, Series 2007A, 5.000%, 2/15/36 (UB) | 2/17 at 100.00 | AA | | 7,779,375 | |
| | 600 | | Tarrant County Cultural Education Facilities Finance Corporation, Texas, Retirement Facility Revenue Bonds, Northwest Senior Housing-Edgemere Project, Series 2006A, 6.000%, 11/15/26 | 11/16 at 100.00 | BBB | | 631,014 | |
| | 650 | | Texas Municipal Gas Acquisition and Supply Corporation I, Gas Supply Revenue Bonds, Senior Lien Series 2008D, 6.250%, 12/15/26 | No Opt. Call | A– | | 790,712 | |
| | | | Texas Municipal Gas Acquisition and Supply Corporation III, Gas Supply Revenue Bonds, Series 2012: | | | | | |
| | 1,000 | | 5.000%, 12/15/27 | No Opt. Call | A3 | | 1,115,860 | |
| | 4,515 | | 5.000%, 12/15/29 | No Opt. Call | A3 | | 4,962,527 | |
| | 1,620 | | Texas Private Activity Bond Surface Transportation Corporation, Revenue Bonds, NTE Mobility Partners LLC North Tarrant Express Managed Lanes Project, Senior Lien Series 2009, 6.875%, 12/31/39 | 12/19 at 100.00 | Baa2 | | 1,889,633 | |
| | | | Texas Private Activity Bond Surface Transportation Corporation, Senior Lien Revenue Bonds, LBJ Infrastructure Group LLC IH-635 Managed Lanes Project, Series 2010: | | | | | |
| | 1,000 | | 7.000%, 6/30/34 | 6/20 at 100.00 | Baa3 | | 1,189,240 | |
| | 1,000 | | 7.000%, 6/30/40 | 6/20 at 100.00 | Baa3 | | 1,187,300 | |
| | | | Texas Private Activity Bond Surface Transportation Corporation, Senior Lien Revenue Bonds, NTE Mobility Partners Segments 3 Segments 3A & 3B Facility, Series 2013: | | | | | |
| | 1,335 | | 7.000%, 12/31/38 (Alternative Minimum Tax) | 9/23 at 100.00 | BBB– | | 1,658,310 | |
| | 380 | | 6.750%, 6/30/43 (Alternative Minimum Tax) | 9/23 at 100.00 | BBB– | | 462,205 | |
| | 1,000 | | Texas Public Finance Authority, Charter School Finance Corporation Revenue Bonds, Idea Public School Project, Series 2007A, 5.000%, 8/15/37 (Pre-refunded 8/15/17) – ACA Insured | 8/17 at 100.00 | BBB (4) | | 1,079,080 | |
| | 8,335 | | Texas Transportation Commission, Central Texas Turnpike System Revenue Bonds, First Tier Refunding Series 2015B, 0.000%, 8/15/36 | 8/24 at 59.60 | A– | | 3,419,934 | |
| | | | Texas Turnpike Authority, Central Texas Turnpike System Revenue Bonds, First Tier Series 2002A: | | | | | |
| | 7,715 | | 0.000%, 8/15/21 – AMBAC Insured | No Opt. Call | A– | | 6,866,041 | |
| | 9,980 | | 0.000%, 8/15/23 – AMBAC Insured | No Opt. Call | A– | | 8,141,185 | |
| | | | Texas Turnpike Authority, Central Texas Turnpike System Revenue Bonds, First Tier Series 2002A: | | | | | |
| | 2,285 | | 0.000%, 8/15/21 – AMBAC Insured (ETM) | No Opt. Call | A3 (4) | | 2,088,764 | |
| | 2,020 | | 0.000%, 8/15/23 – AMBAC Insured (ETM) | No Opt. Call | A3 (4) | | 1,738,412 | |
| | 1,125 | | Travis County Health Facilities Development Corporation, Texas, Revenue Bonds, Westminster Manor, Series 2010, 7.000%, 11/01/30 | 11/20 at 100.00 | BBB– | | 1,302,030 | |
| | 108,070 | | Total Texas | | | | 102,282,940 | |
| | | | Virgin Islands – 0.2% (0.1% of Total Investments) | | | | | |
| | 250 | | Virgin Islands Public Finance Authority, Matching Fund Loan Notes Revenue Bonds, Subordinate Lien Series 2009A, 6.000%, 10/01/39 | 10/19 at 100.00 | Baa3 | | 273,560 | |
| | 820 | | Virgin Islands Public Finance Authority, Matching Fund Revenue Loan Note – Diageo Project, Series 2009A, 6.750%, 10/01/37 | 10/19 at 100.00 | Baa3 | | 924,821 | |
| | 1,070 | | Total Virgin Islands | | | | 1,198,381 | |
| | Principal | | | Optional Call | | | | |
| | Amount (000) | | Description (1) | Provisions (2) | Ratings (3) | | Value | |
| | | | Virginia – 1.5% (1.0% of Total Investments) | | | | | |
| $ | 1,000 | | Amherst Industrial Development Authority, Virginia, Revenue Bonds, Sweet Briar College, Series 2006, 5.000%, 9/01/26 | 9/16 at 100.00 | CCC | $ | 946,230 | |
| | 515 | | Chesapeake, Virginia, Transportation System Senior Toll Road Revenue Bonds, Capital Appreciation Series 2012B, 0.000%, 7/15/40 | 7/28 at 100.00 | BBB | | 370,532 | |
| | 1,000 | | Fairfax County Redevelopment and Housing Authority, Virginia, Multifamily Housing Revenue Bonds, FHA-Insured Mortgage – Cedar Ridge Project, Series 2007, 4.850%, 10/01/48 (Alternative Minimum Tax) | 4/17 at 100.00 | AA+ | | 1,019,770 | |
| | 4,500 | | Metropolitan Washington Airports Authority, Virginia, Airport System Revenue Bonds, Refunding Series 2013A, 5.000%, 10/01/30 (Alternative Minimum Tax) | 10/23 at 100.00 | AA– | | 5,082,750 | |
| | | | Virginia Small Business Financing Authority, Senior Lien Revenue Bonds, Elizabeth River Crossing, Opco LLC Project, Series 2012: | | | | | |
| | 2,000 | | 6.000%, 1/01/37 (Alternative Minimum Tax) | 7/22 at 100.00 | BBB– | | 2,273,360 | |
| | 500 | | 5.500%, 1/01/42 (Alternative Minimum Tax) | 7/22 at 100.00 | BBB– | | 545,635 | |
| | 9,515 | | Total Virginia | | | | 10,238,277 | |
| | | | Washington – 2.2% (1.5% of Total Investments) | | | | | |
| | 11,345 | | Chelan County Public Utility District 1, Washington, Columbia River-Rock Island Hydro-Electric System Revenue Refunding Bonds, Series 1997A, 0.000%, 6/01/19 – NPFG Insured | No Opt. Call | AA+ | | 10,813,827 | |
| | 845 | | Washington State Health Care Facilities Authority, Revenue Bonds, Central Washington Health Services Association, Series 2009, 6.250%, 7/01/24 | 7/19 at 100.00 | Baa1 | | 940,493 | |
| | 1,155 | | Washington State Health Care Facilities Authority, Revenue Bonds, Central Washington Health Services Association, Series 2009, 6.250%, 7/01/24 (Pre-refunded 7/01/19) | 7/19 at 100.00 | N/R (4) | | 1,371,308 | |
| | 1,000 | | Washington State Health Care Facilities Authority, Revenue Bonds, Northwest Hospital and Medical Center of Seattle, Series 2007, 5.700%, 12/01/32 | 12/17 at 100.00 | N/R | | 1,028,410 | |
| | 320 | | Washington State Housing Finance Commission, Revenue Bonds, Riverview Retirement Community, Refunding Series 2012, 5.000%, 1/01/48 | No Opt. Call | BBB– | | 326,838 | |
| | 14,665 | | Total Washington | | | | 14,480,876 | |
| | | | West Virginia – 1.2% (0.8% of Total Investments) | | | | | |
| | 1,965 | | West Virginia Hospital Finance Authority, Hospital Revenue Bonds, Charleston Area Medical Center, Series 2009A, 5.625%, 9/01/32 | 9/19 at 100.00 | A3 | | 2,170,776 | |
| | 1,000 | | West Virginia Hospital Finance Authority, Hospital Revenue Bonds, Thomas Health System, Inc., Series 2008, 6.500%, 10/01/38 | 10/18 at 100.00 | N/R | | 1,041,331 | |
| | 4,000 | | West Virginia Hospital Finance Authority, Hospital Revenue Bonds, West Virginia United Health System Obligated Group, Refunding and Improvement Series 2013A, 5.500%, 6/01/44 | 6/23 at 100.00 | A | | 4,521,720 | |
| | 6,965 | | Total West Virginia | | | | 7,733,827 | |
| | | | Wisconsin – 3.3% (2.2% of Total Investments) | | | | | |
| | 815 | | Monroe Redevelopment Authority, Wisconsin, Development Revenue Bonds, The Monroe Clinic, Inc., Series 2009, 5.875%, 2/15/39 | 2/19 at 100.00 | A3 | | 892,433 | |
| | 5,000 | | Wisconsin Health and Educational Facilities Authority, Revenue Bonds, Agnesian HealthCare, Inc., Series 2013B, 5.000%, 7/01/36 | 7/23 at 100.00 | A | | 5,442,500 | |
| | 1,035 | | Wisconsin Health and Educational Facilities Authority, Revenue Bonds, Beloit Health System, Inc., Series 2010B, 5.125%, 4/01/36 | 4/20 at 100.00 | A– | | 1,084,483 | |
| | 2,750 | | Wisconsin Health and Educational Facilities Authority, Revenue Bonds, Gundersen Lutheran, Series 2011A, 5.250%, 10/15/39 | 10/21 at 100.00 | A+ | | 3,082,090 | |
| NQM | Nuveen Investment Quality Municipal Fund, Inc. | |
| | Portfolio of Investments (continued) | October 31, 2015 |
| | Principal | | | Optional Call | | | | |
| | Amount (000) | | Description (1) | Provisions (2) | Ratings (3) | | Value | |
| | | | Wisconsin (continued) | | | | | |
| | | | Wisconsin Health and Educational Facilities Authority, Revenue Bonds, Wheaton Franciscan Healthcare System, Series 2006A: | | | | | |
| $ | 3,500 | | 5.250%, 8/15/21 | 8/16 at 100.00 | A– | $ | 3,617,985 | |
| | 1,780 | | 5.250%, 8/15/26 | 8/16 at 100.00 | A– | | 1,837,708 | |
| | 1,000 | | 5.250%, 8/15/34 | 8/16 at 100.00 | A– | | 1,019,240 | |
| | 4,600 | | Wisconsin State, General Obligation Bonds, Series 2006A, 4.750%, 5/01/25 (Pre-refunded 5/01/16) – NPFG Insured (UB) (5) | 5/16 at 100.00 | AA (4) | | 4,702,396 | |
| | 20,480 | | Total Wisconsin | | | | 21,678,835 | |
| $ | 949,220 | | Total Municipal Bonds (cost $892,507,096) | | | | 980,733,065 | |
| | Principal | | | | | | | | |
| | Amount (000) | | Description (1) | Coupon | Maturity | Ratings (3) | | Value | |
| | | | CORPORATE BONDS – 0.0% (0.0% of Total Investments) | | | | | | |
| | | | Transportation – 0.0% (0.0% of Total Investments) | | | | | | |
| $ | 170 | | Las Vegas Monorail Company, Senior Interest Bonds (9), (10) | 5.500% | 7/15/19 | N/R | $ | 8,506 | |
| | 45 | | Las Vegas Monorail Company, Senior Interest Bonds (9), (10) | 3.000% | 7/15/55 | N/R | | 1,810 | |
| $ | 215 | | Total Corporate Bonds (cost $19,307) | | | | | 10,316 | |
| | | | Total Long-Term Investments (cost $892,526,403) | | | | | 980,743,381 | |
| | Principal | | | Optional Call | | | | |
| | Amount (000) | | Description (1) | Provisions (2) | Ratings (3) | | Value | |
| | | | SHORT-TERM INVESTMENTS – 0.4% (0.3% of Total Investments) | | | | | |
| | | | MUNICIPAL BONDS – 0.4% (0.3% of Total Investments) | | | | | |
| | | | California – 0.4% (0.3% of Total Investments) | | | | | |
| $ | 2,400 | | California Statewide Community Development Authority, Revenue Bonds, Daughters of Charity Health System, Series 2014A, 6.000%, 12/15/15 (9) | No Opt. Call | N/R | $ | 2,406,576 | |
| | 235 | | California Statewide Community Development Authority, Revenue Bonds, Daughters of Charity Health System, Series 2014B, 6.000%, 12/15/15 (9) | No Opt. Call | N/R | | 235,644 | |
| | 355 | | California Statewide Community Development Authority, Revenue Bonds, Daughters of Charity Health System, Series 2014C, 6.000%, 12/15/15 (9) | No Opt. Call | N/R | | 355,972 | |
| $ | 2,990 | | Total Short-Term Investments (cost $2,990,000) | | | | 2,998,192 | |
| | | | Total Investments (cost $895,516,403) – 147.8% | | | | 983,741,573 | |
| | | | Floating Rate Obligations – (8.2)% | | | | (54,680,000 | ) |
| | | | Variable Rate MuniFund Term Preferred Shares, at Liquidation Value – (6.5)% (11) | | | | (43,500,000 | ) |
| | | | Variable Rate Demand Preferred Shares, at Liquidation Value – (35.6)% (12) | | | | (236,800,000 | ) |
| | | | Other Assets Less Liabilities – 2.5% | | | | 16,770,664 | |
| | | | Net Assets Applicable to Common Shares – 100% | | | $ | 665,532,237 | |
| (1) | All percentages shown in the Portfolio of Investments are based on net assets applicable to common shares unless otherwise noted. |
| (2) | Optional Call Provisions (not covered by the report of independent registered public accounting firm): Dates (month and year) and prices of the earliest optional call or redemption. There may be other call provisions at varying prices at later dates. Certain mortgage-backed securities may be subject to periodic principal paydowns. |
| (3) | Ratings (not covered by the report of independent registered public accounting firm): Using the highest of Standard & Poor's Group ("Standard & Poor's"), Moody's Investors Service, Inc. ("Moody's") or Fitch, Inc. ("Fitch") rating. Ratings below BBB by Standard & Poor's, Baa by Moody's or BBB by Fitch are considered to be below investment grade. Holdings designated N/R are not rated by any of these national rating agencies. |
| (4) | Backed by an escrow or trust containing sufficient U.S. Government or U.S. Government agency securities, which ensure the timely payment of principal and interest. Certain bonds backed by U.S. Government or agency securities are regarded as having an implied rating equal to the rating of such securities. |
| (5) | Investment, or portion of investment, has been pledged to collateralize the net payment obligations for investments in inverse floating rate transactions. |
| (6) | As of, or subsequent to, the end of the reporting period this security is non-income producing. Non-income producing, in the case of a fixed-income security, generally denotes that the issuer has (1) defaulted on the payment of principal or interest, (2) is under the protection of the Federal Bankruptcy Court or (3) the Fund's Adviser has concluded that the issue is not likely to meet its future interest payment obligations and has ceased accruing additional income on the Fund's records. |
| (7) | On April 1, 2013, the Fund's Adviser determined it was unlikely that this borrower would fulfill its entire obligation on this security, and therefore reduced the security's interest rate of accrual from 5.750% to 2.300%. |
| (8) | On April 1, 2013, the Fund's Adviser determined it was unlikely that this borrower would fulfill its entire obligation on this security, and therefore reduced the security's interest rate of accrual from 5.875% to 2.350%. |
| (9) | Investment valued at fair value using methods determined in good faith by, or at the discretion of, the Board. For fair value measurement disclosure purposes, investment classified as Level 3. See Notes to Financial Statements, Note 2 – Investment Valuation and Fair Value Measurements for more information. |
| (10) | During January 2010, Las Vegas Monorail Company ("Las Vegas Monorail") filed for federal bankruptcy protection. During March 2012, Las Vegas Monorail emerged from federal bankruptcy with the acceptance of a reorganization plan assigned by the Federal Bankruptcy Court. Under the reorganization plan, the Fund surrendered its Las Vegas Monorail Project Revenue Bonds, First Tier, Series 2000 and in turn received two senior interest corporate bonds: the first with an annual coupon rate of 5.500% maturing on July 15, 2019 and the second with an annual coupon rate of 3.000% (5.500% after December 31, 2015) maturing on July 15, 2055. The Fund's custodian is not accruing income for either senior interest corporate bond. |
| (11) | Variable Rate MuniFund Term Preferred Shares, at Liquidation Value as a percentage of Total Investments is 4.4%. |
| (12) | Variable Rate Demand Preferred Shares, at Liquidation Value as a percentage of Total Investments is 24.1%. |
| (ETM) | Escrowed to maturity. |
| (IF) | Inverse floating rate investment. |
| (UB) | Underlying bond of an inverse floating rate trust reflected as a financing transaction. See Notes to Financial Statements, Note 3 – Portfolio Securities and Investments in Derivatives, Inverse Floating Rate Securities for more information. |
| (WI/DD) | Investment, or portion of investment, purchased on a when-issued or delayed delivery basis. |
See accompanying notes to financial statements.
| NQS | | |
| | Nuveen Select Quality Municipal Fund, Inc. | |
| | Portfolio of Investments | October 31, 2015 |
| | Principal | | | Optional Call | | | | |
| | Amount (000) | | Description (1) | Provisions (2) | Ratings (3) | | Value | |
| | | | LONG-TERM INVESTMENTS 146.4% (100.0% of Total Investments) | | | | | |
| | | | MUNICIPAL BONDS 146.4% (100.0% of Total Investments) | | | | | |
| | | | Alaska – 0.2% (0.2% of Total Investments) | | | | | |
| $ | 1,370 | | Northern Tobacco Securitization Corporation, Alaska, Tobacco Settlement Asset-Backed Bonds, Series 2006A, 4.625%, 6/01/23 | 12/15 at 100.00 | Ba1 | $ | 1,370,260 | |
| | | | Arizona – 2.3% (1.6% of Total Investments) | | | | | |
| | 2,300 | | Phoenix Civic Improvement Corporation, Arizona, Senior Lien Airport Revenue Bonds, Series 2008A, 5.000%, 7/01/33 | 7/18 at 100.00 | AA– | | 2,502,584 | |
| | 1,000 | | Pima County Industrial Development Authority, Arizona, Revenue Bonds, Tucson Electric Power Company, Series 2010A, 5.250%, 10/01/40 | 10/20 at 100.00 | A3 | | 1,097,130 | |
| | 8,000 | | Salt Verde Financial Corporation, Arizona, Senior Gas Revenue Bonds, Citigroup Energy Inc. Prepay Contract Obligations, Series 2007, 5.000%, 12/01/37 | No Opt. Call | A– | | 8,939,680 | |
| | 11,300 | | Total Arizona | | | | 12,539,394 | |
| | | | California – 10.8% (7.4% of Total Investments) | | | | | |
| | 5,000 | | Bay Area Toll Authority, California, Revenue Bonds, San Francisco Bay Area Toll Bridge, Series 2013S-4, 5.000%, 4/01/38 | 4/23 at 100.00 | AA– | | 5,576,100 | |
| | | | Calexico Unified School District, Imperial County, California, General Obligation Bonds, Series 2005B: | | | | | |
| | 3,685 | | 0.000%, 8/01/31 – FGIC Insured | No Opt. Call | AA– | | 1,866,489 | |
| | 4,505 | | 0.000%, 8/01/33 – FGIC Insured | No Opt. Call | AA– | | 2,067,750 | |
| | 2,820 | | California County Tobacco Securitization Agency, Tobacco Settlement Asset-Backed Bonds, Sonoma County Tobacco Securitization Corporation, Series 2005, 5.000%, 6/01/26 | 12/15 at 100.00 | B– | | 2,784,553 | |
| | 3,350 | | California State Public Works Board, Lease Revenue Bonds, Department of Health Services, Series 2005K, 5.000%, 11/01/23 (Pre-refunded 12/01/15) | 12/15 at 100.00 | A+ (4) | | 3,363,233 | |
| | 815 | | California State Public Works Board, Lease Revenue Bonds, Various Capital Projects, Series 2013I, 5.000%, 11/01/38 | 11/23 at 100.00 | A+ | | 920,306 | |
| | 1,500 | | California State, General Obligation Bonds, Various Purpose Series 2006, 4.500%, 10/01/29 | 10/16 at 100.00 | AA– | | 1,545,255 | |
| | 1,550 | | California Statewide Community Development Authority, Revenue Bonds, St. Joseph Health System, Series 2007A, 5.750%, 7/01/47 – FGIC Insured | 7/18 at 100.00 | AA– | | 1,715,060 | |
| | 1,000 | | Coachella Valley Unified School District, Riverside County, California, General Obligation Bonds, Series 2005A, 0.000%, 8/01/30 – FGIC Insured | No Opt. Call | AA– | | 535,000 | |
| | | | Colton Joint Unified School District, San Bernardino County, California, General Obligation Bonds, Series 2006C: | | | | | |
| | 3,200 | | 0.000%, 2/01/30 – FGIC Insured | 2/16 at 48.14 | AA– | | 1,522,368 | |
| | 6,800 | | 0.000%, 2/01/35 – FGIC Insured | 2/16 at 36.74 | AA– | | 2,466,904 | |
| | 2,500 | | Golden State Tobacco Securitization Corporation, California, Tobacco Settlement Asset-Backed Bonds, Series 2007A-1, 5.000%, 6/01/33 | 6/17 at 100.00 | B | | 2,230,275 | |
| | 4,500 | | Hemet Unified School District, Riverside County, California, General Obligation Bonds, Series 2008B, 5.125%, 8/01/37 (Pre-refunded 8/01/16) – AGC Insured | 8/16 at 102.00 | AA (4) | | 4,755,825 | |
| | 1,045 | | Lake Tahoe Unified School District, El Dorado County, California, General Obligation Bonds, Series 2001B, 0.000%, 8/01/31 – NPFG Insured | No Opt. Call | AA– | | 543,787 | |
| | 1,160 | | Mount San Antonio Community College District, Los Angeles County, California, General Obligation Bonds, Election of 2008, Series 2013A, 0.000%, 8/01/43 | 8/35 at 100.00 | AA | | 811,745 | |
| | 2,000 | | Murrieta Valley Unified School District Public Financing Authority, California, Special Tax Revenue Bonds, Series 2006A, 5.125%, 9/01/26 – AGM Insured | 9/16 at 100.00 | AA | | 2,073,300 | |
| | 2,615 | | New Haven Unified School District, Alameda County, California, General Obligation Bonds, Series 2004A, 0.000%, 8/01/28 – NPFG Insured | No Opt. Call | AA– | | 1,423,972 | |
| | Principal | | | Optional Call | | | | |
| | Amount (000) | | Description (1) | Provisions (2) | Ratings (3) | | Value | |
| | | | California (continued) | | | | | |
| $ | 2,350 | | Palomar Pomerado Health Care District, California, Certificates of Participation, Series 2009, 6.750%, 11/01/39 | 11/19 at 100.00 | Ba1 | $ | 2,602,884 | |
| | 1,365 | | Palomar Pomerado Health, California, General Obligation Bonds, Capital Appreciation, Election of 2004, Series 2007A, 0.000%, 8/01/21 – NPFG Insured | No Opt. Call | AA– | | 1,200,831 | |
| | 2,000 | | Pasadena, California, Certificates of Participation, Refunding Series 2008C, 5.000%, 2/01/33 | 2/18 at 100.00 | AA+ | | 2,146,080 | |
| | 6,195 | | Peralta Community College District, Alameda County, California, General Obligation Bonds, Election of 2006, Series 2007B, 5.000%, 8/01/37 – AGM Insured (UB) (5) | 8/17 at 100.00 | AA | | 6,613,782 | |
| | 6,000 | | Placentia-Yorba Linda Unified School District, Orange County, California, Certificates of Participation, Series 2006, 0.000%, 10/01/34 – FGIC Insured | No Opt. Call | AA– | | 2,700,180 | |
| | 5,000 | | Riverside County Asset Leasing Corporation, California, Leasehold Revenue Bonds, Riverside County Hospital Project, Series 1997, 0.000%, 6/01/25 – NPFG Insured | No Opt. Call | AA– | | 3,725,750 | |
| | 6,660 | | San Ysidro School District, San Diego County, California, General Obligation Bonds, Refunding Series 2015, 0.000%, 8/01/43 | No Opt. Call | AA | | 1,658,473 | |
| | 2,460 | | Santee School District, County, California, General Obligation Bonds, Capital Appreciation, Election 2006, Series 2008D, 0.000%, 8/01/33 – AGC Insured | No Opt. Call | AA | | 1,195,757 | |
| | 3,000 | | Yuma Community College District, California, General Obligation Bonds, Election 2006 Series 2007B, 0.000%, 8/01/33 – AMBAC Insured | 8/17 at 45.45 | Aa2 | | 1,265,970 | |
| | 83,075 | | Total California | | | | 59,311,629 | |
| | | | Colorado – 8.0% (5.5% of Total Investments) | | | | | |
| | 3,435 | | Colorado Health Facilities Authority, Colorado, Revenue Bonds, Catholic Health Initiatives, Series 2009A, 5.500%, 7/01/34 | 7/19 at 100.00 | A+ | | 3,874,508 | |
| | 1,150 | | Colorado Health Facilities Authority, Colorado, Revenue Bonds, Poudre Valley Health System, Series 2005C, 5.250%, 3/01/40 – AGM Insured | 9/18 at 102.00 | AA | | 1,249,165 | |
| | 5,000 | | Colorado Health Facilities Authority, Colorado, Revenue Bonds, Sisters of Charity of Leavenworth Health Services Corporation, Series 2010A, 5.000%, 1/01/40 | 1/20 at 100.00 | AA– | | 5,500,200 | |
| | 1,500 | | Colorado Health Facilities Authority, Colorado, Revenue Bonds, Valley View Hospital Association, Series 2007, 5.250%, 5/15/42 | 5/17 at 100.00 | A– | | 1,568,730 | |
| | 1,975 | | Denver Convention Center Hotel Authority, Colorado, Revenue Bonds, Convention Center Hotel, Senior Lien Series 2006, 4.625%, 12/01/30 – SYNCORA GTY Insured | 11/16 at 100.00 | BBB– | | 2,000,122 | |
| | | | E-470 Public Highway Authority, Colorado, Senior Revenue Bonds, Series 1997B: | | | | | |
| | 1,420 | | 0.000%, 9/01/23 – NPFG Insured | No Opt. Call | AA– | | 1,137,136 | |
| | 9,615 | | 0.000%, 9/01/25 – NPFG Insured | No Opt. Call | AA– | | 7,073,659 | |
| | 13,000 | | E-470 Public Highway Authority, Colorado, Toll Revenue Bonds, Series 2004B, 0.000%, 9/01/34 – NPFG Insured | 9/20 at 45.40 | AA– | | 4,835,740 | |
| | 5,000 | | Ebert Metropolitan District, Colorado, Limited Tax General Obligation Bonds, Series 2007, 5.350%, 12/01/37 – RAAI Insured | 12/17 at 100.00 | AA | | 5,116,350 | |
| | 5,000 | | Metropolitan Wastewater Reclamation District, Colorado, Sewer Revenue Bonds, Series 2012A, 5.000%, 4/01/17 | No Opt. Call | AAA | | 5,325,250 | |
| | | | Regional Transportation District, Colorado, Denver Transit Partners Eagle P3 Project Private Activity Bonds, Series 2010: | | | | | |
| | 2,500 | | 6.500%, 1/15/30 | 7/20 at 100.00 | Baa3 | | 2,902,850 | |
| | 3,115 | | 6.000%, 1/15/34 | 7/20 at 100.00 | Baa3 | | 3,515,028 | |
| | 52,710 | | Total Colorado | | | | 44,098,738 | |
| | | | Connecticut – 0.9% (0.6% of Total Investments) | | | | | |
| | 5,000 | | Connecticut Health and Educational Facilities Authority, Revenue Bonds, Yale University, Series 2007Z-1, 5.000%, 7/01/42 | 7/16 at 100.00 | AAA | | 5,127,100 | |
| | | | District of Columbia – 2.4% (1.6% of Total Investments) | | | | | |
| | | | District of Columbia Tobacco Settlement Corporation, Tobacco Settlement Asset-Backed Bonds, Series 2001: | | | | | |
| | 405 | | 6.250%, 5/15/24 | 11/15 at 100.00 | A1 | | 405,041 | |
| | 5,580 | | 6.500%, 5/15/33 | No Opt. Call | Baa1 | | 6,919,033 | |
| NQS | Nuveen Select Quality Municipal Fund, Inc. | |
| | Portfolio of Investments (continued) | October 31, 2015 |
| | Principal | | | Optional Call | | | | |
| | Amount (000) | | Description (1) | Provisions (2) | Ratings (3) | | Value | |
| | | | District of Columbia (continued) | | | | | |
| $ | 5,000 | | District of Columbia, General Obligation Bonds, Series 1998B, 6.000%,
6/01/19 – NPFG Insured | No Opt. Call | Aa1 | $ | 5,874,550 | |
| | 10,985 | | Total District of Columbia | | | | 13,198,624 | |
| | | | Florida – 8.6% (5.9% of Total Investments) | | | | | |
| | 3,000 | | Broward County, Florida, Professional Sports Facilities Tax and Revenue Bonds, Broward County Civic Arena Project, Refunding Series 2006A, 5.000%, 9/01/28 – AMBAC Insured | No Opt. Call | AA | | 3,099,210 | |
| | 3,745 | | Citizens Property Insurance Corporation, Florida, Personal and Commercial Lines Account Bonds, Senior Secured Series 2012A-1, 5.000%, 6/01/16 | No Opt. Call | AA– | | 3,848,549 | |
| | 3,175 | | Florida State Turnpike Authority, Turnpike Revenue Bonds, Department of Transportation, Series 2010B, 5.000%, 7/01/40 | No Opt. Call | AA– | | 3,603,212 | |
| | 2,500 | | Greater Orlando Aviation Authority, Florida, Airport Facilities Revenue Bonds, Refunding Series 2009C, 5.000%, 10/01/34 | No Opt. Call | AA– | | 2,798,125 | |
| | 2,290 | | Hillsborough County Aviation Authority, Florida, Revenue Bonds, Tampa International Airport, Subordinate Lien Series 2015B, 5.000%, 10/01/40 | 10/24 at 100.00 | A+ | | 2,536,358 | |
| | 1,000 | | Miami-Dade County, Florida, Aviation Revenue Bonds, Miami International Airport, Refunding Series 2014B, 5.000%, 10/01/37 | 10/24 at 100.00 | A | | 1,125,460 | |
| | 4,000 | | Miami-Dade County, Florida, Aviation Revenue Bonds, Miami International Airport, Series 2009B, 5.500%, 10/01/36 | 10/19 at 100.00 | A | | 4,547,440 | |
| | 4,000 | | Miami-Dade County, Florida, Aviation Revenue Bonds, Miami International Airport, Series 2010B, 5.000%, 10/01/28 | 10/20 at 100.00 | A | | 4,528,880 | |
| | 2,050 | | Miami-Dade County, Florida, Transit System Sales Surtax Revenue Bonds, Refunding Series 2012, 5.000%, 7/01/42 – AGM Insured | 7/22 at 100.00 | AA | | 2,268,653 | |
| | 9,250 | | Port Saint Lucie. Florida, Special Assessment Revenue Bonds, Southwest Annexation District 1B, Series 2007, 5.000%, 7/01/40 – NPFG Insured | 7/17 at 100.00 | AA– | | 9,786,408 | |
| | 3,200 | | Saint John's County, Florida, Sales Tax Revenue Bonds, Series 2006, 5.000%, 10/01/36 (Pre-refunded 10/01/16) – BHAC Insured | 10/16 at 100.00 | AA+ (4) | | 3,336,768 | |
| | 720 | | South Broward Hospital District, Florida, Hospital Revenue Bonds, Memorial Health System, Refunding Series 2006, 5.000%, 5/01/21 – NPFG Insured | 5/16 at 100.00 | AA– | | 735,718 | |
| | 1,965 | | South Broward Hospital District, Florida, Hospital Revenue Bonds, Memorial Health System, Refunding Series 2006, 5.000%, 5/01/21 (Pre-refunded 5/01/16) – NPFG Insured | 5/16 at 100.00 | AA– (4) | | 2,011,983 | |
| | 2,500 | | South Miami Health Facilities Authority, Florida, Revenue Bonds, Baptist Health Systems of South Florida, Tender Option Bond Trust 11151, 18.044%, 2/13/17 (IF) | No Opt. Call | AA | | 2,922,500 | |
| | 43,395 | | Total Florida | | | | 47,149,264 | |
| | | | Georgia – 1.6% (1.1% of Total Investments) | | | | | |
| | 3,065 | | Atlanta, Georgia, Water and Wastewater Revenue Bonds, Refunding Series 2015, 5.000%, 11/01/31 | 5/25 at 100.00 | AA– | | 3,571,338 | |
| | 2,000 | | East Point Building Authority, Georgia, Revenue Bonds, Water & Sewer Project Series 2006A, 5.000%, 2/01/30 – SYNCORA GTY Insured | 2/16 at 100.00 | N/R | | 2,005,500 | |
| | 3,000 | | Medical Center Hospital Authority, Georgia, Revenue Anticipation Certificates, Columbus Regional Healthcare System, Inc. Project, Series 2008, 6.500%, 8/01/38 – AGC Insured | 8/18 at 100.00 | AA | | 3,346,020 | |
| | 8,065 | | Total Georgia | | | | 8,922,858 | |
| | | | Illinois – 20.7% (14.1% of Total Investments) | | | | | |
| | 1,470 | | Chicago Board of Education, Illinois, General Obligation Bonds, Dedicated Revenues Series 2011A, 5.000%, 12/01/41 | 12/21 at 100.00 | BB+ | | 1,279,076 | |
| | | | Chicago Board of Education, Illinois, Unlimited Tax General Obligation Bonds, Dedicated Tax Revenues, Series 1998B-1: | | | | | |
| | 5,440 | | 0.000%, 12/01/25 – FGIC Insured | No Opt. Call | AA– | | 3,258,125 | |
| | 3,510 | | 0.000%, 12/01/31 – FGIC Insured | No Opt. Call | AA– | | 1,449,314 | |
| | 1,500 | | Chicago Board of Education, Illinois, Unlimited Tax General Obligation Bonds, Dedicated Tax Revenues, Series 1999A, 5.500%, 12/01/26 – FGIC Insured | No Opt. Call | AA– | | 1,628,370 | |
| | 1,935 | | Chicago, Illinois, General Airport Revenue Bonds, O'Hare International Airport, Third Lien Series 2005A, 5.250%, 1/01/26 (Pre-refunded 1/01/16) – NPFG Insured | 1/16 at 100.00 | AA– (4) | | 1,951,119 | |
| | Principal | | | Optional Call | | | | |
| | Amount (000) | | Description (1) | Provisions (2) | Ratings (3) | | Value | |
| | | | Illinois (continued) | | | | | |
| $ | 29,245 | | Chicago, Illinois, General Obligation Bonds, City Colleges, Series 1999, 0.000%, 1/01/38 – FGIC Insured | No Opt. Call | AA– | $ | 8,367,287 | |
| | 3,880 | | Chicago, Illinois, General Obligation Bonds, Series 2004A, 5.000%, 1/01/34 – AGM Insured | 1/16 at 100.00 | AA | | 3,883,958 | |
| | 1,500 | | Illinois Finance Authority, Revenue Bonds, Central DuPage Health, Series 2009B, 5.500%, 11/01/39 | 11/19 at 100.00 | AA+ | | 1,716,540 | |
| | 2,000 | | Illinois Finance Authority, Revenue Bonds, Children–s Memorial Hospital, Series 2008A, 5.250%, 8/15/47 – AGC Insured (UB) | 8/18 at 100.00 | AA | | 2,140,740 | |
| | 1,000 | | Illinois Finance Authority, Revenue Bonds, Edward Health Services Corporation, Series 2008A, 5.500%, 2/01/40 – AMBAC Insured | 2/18 at 100.00 | A | | 1,067,090 | |
| | 2,875 | | Illinois Finance Authority, Revenue Bonds, Elmhurst Memorial Healthcare, Series 2008A, 5.625%, 1/01/37 | 1/18 at 100.00 | Baa2 | | 3,070,385 | |
| | 1,750 | | Illinois Finance Authority, Revenue Bonds, Hospital Sisters Services Inc., Series 2007, 5.000%, 3/15/26 | No Opt. Call | AA– | | 1,820,315 | |
| | 1,925 | | Illinois Finance Authority, Revenue Bonds, OSF Healthcare System, Series 2007A, 5.750%, 11/15/37 (Pre-refunded 11/15/17) | 11/17 at 100.00 | A (4) | | 2,120,676 | |
| | 10,000 | | Illinois Finance Authority, Revenue Bonds, Palos Community Hospital, Series 2010C, 5.125%, 5/15/35 | 5/20 at 100.00 | AA– | | 10,891,399 | |
| | 3,975 | | Illinois Finance Authority, Revenue Bonds, Sherman Health Systems, Series 2007A, 5.500%, 8/01/37 (Pre-refunded 8/01/17) | 8/17 at 100.00 | N/R (4) | | 4,312,716 | |
| | 495 | | Illinois Finance Authority, Revenue Bonds, Silver Cross Hospital and Medical Centers, Refunding Series 2015C, 5.000%, 8/15/44 | 8/25 at 100.00 | Baa1 | | 531,635 | |
| | 2,500 | | Illinois Finance Authority, Revenue Bonds, The University of Chicago Medical Center, Series 2011C, 5.500%, 8/15/41 (UB) (5) | 2/21 at 100.00 | AA– | | 2,782,875 | |
| | 4,070 | | Illinois Finance Authority, Revenue Bonds, University of Chicago, Series 2012A, 5.000%, 10/01/51 | 10/21 at 100.00 | AA+ | | 4,346,597 | |
| | 5,000 | | Illinois Finance Authority, Revenue Refunding Bonds, Silver Cross Hospital and Medical Centers, Series 2008A, 5.500%, 8/15/30 | 8/18 at 100.00 | BBB+ | | 5,295,600 | |
| | 2,000 | | Illinois Health Facilities Authority, Revenue Bonds, Midwest Care Center I Inc., Series 2001, 5.950%, 2/20/36 | 2/16 at 100.00 | Aa1 | | 2,009,040 | |
| | 1,395 | | Illinois Toll Highway Authority, Toll Highway Revenue Bonds, Senior Lien Series 2013A, 5.000%, 1/01/38 | 1/23 at 100.00 | AA– | | 1,530,315 | |
| | 9,000 | | McHenry County Community Unit School District 200, Woodstock, Illinois, General Obligation Bonds, Series 2006B, 0.000%, 1/15/23 – FGIC Insured | No Opt. Call | Aa2 | | 7,319,250 | |
| | 5,000 | | Metropolitan Pier and Exposition Authority, Illinois, McCormick Place Expansion Project Bonds, Series 2015A, 5.500%, 6/15/53 | 12/25 at 100.00 | BBB+ | | 5,419,000 | |
| | 2,335 | | Metropolitan Pier and Exposition Authority, Illinois, Revenue Bonds, McCormick Place Expansion Project, Refunding Series 2010B-2, 5.000%, 6/15/50 | 6/20 at 100.00 | BBB+ | | 2,377,287 | |
| | | | Metropolitan Pier and Exposition Authority, Illinois, Revenue Bonds, McCormick Place Expansion Project, Series 2002A: | | | | | |
| | 6,765 | | 0.000%, 12/15/23 – NPFG Insured | No Opt. Call | AA– | | 5,135,717 | |
| | 1,100 | | 0.000%, 12/15/35 – NPFG Insured | No Opt. Call | AA– | | 436,568 | |
| | 3,805 | | 0.000%, 6/15/41 – NPFG Insured | No Opt. Call | AA– | | 1,104,706 | |
| | 1,495 | | University of Illinois, Auxiliary Facilities Systems Revenue Bonds, Series 2006, 5.000%, 4/01/27 | 4/16 at 100.00 | AA– | | 1,522,179 | |
| | 7,415 | | University of Illinois, Auxiliary Facilities Systems Revenue Bonds, Series 2006, 5.000%, 4/01/27 (Pre-refunded 4/01/16) | 4/16 at 100.00 | AA– (4) | | 7,560,927 | |
| | 2,000 | | University of Illinois, Health Services Facilities System Revenue Bonds, Series 2013, 6.250%, 10/01/38 | 10/23 at 100.00 | A | | 2,315,300 | |
| | 12,775 | | Will County Community High School District 210 Lincoln-Way, Illinois, General Obligation Bonds, Series 2006, 0.000%, 1/01/24 – AGM Insured (ETM) | No Opt. Call | A1 (4) | | 10,714,264 | |
| NQS | Nuveen Select Quality Municipal Fund, Inc. | |
| | Portfolio of Investments (continued) | October 31, 2015 |
| | Principal | | | Optional Call | | | | |
| | Amount (000) | | Description (1) | Provisions (2) | Ratings (3) | | Value | |
| | | | Illinois (continued) | | | | | |
| $ | 4,005 | | Will County Community Unit School District 201U, Crete-Monee, Illinois, General Obligation Bonds, Capital Appreciation Series 2004, 0.000%, 11/01/15 – FGIC Insured | No Opt. Call | AA– | $ | 4,004,960 | |
| | 143,160 | | Total Illinois | | | | 113,363,330 | |
| | | | Indiana – 3.6% (2.4% of Total Investments) | | | | | |
| | 2,000 | | Delaware County Hospital Authority, Indiana, Hospital Revenue Bonds, Cardinal Health System, Series 2006, 5.250%, 8/01/36 (Pre-refunded 8/01/16) | 8/16 at 100.00 | N/R (4) | | 2,073,520 | |
| | 4,080 | | Indiana Finance Authority, Hospital Revenue Bonds, Indiana University Health Obligation Group, Refunding 2015A, 5.000%, 12/01/40 | 6/25 at 100.00 | AA– | | 4,518,559 | |
| | 230 | | Indiana Finance Authority, Tax-Exempt Private Activity Revenue Bonds, I-69 Section 5 Project, Series 2014, 5.250%, 9/01/40 (Alternative Minimum Tax) | 9/24 at 100.00 | BBB | | 250,495 | |
| | 2,750 | | Indiana Finance Authority, Wastewater Utility Revenue Bonds, CWA Authority Project, Series 2011B, 5.000%, 10/01/41 | 10/21 at 100.00 | AA– | | 3,008,720 | |
| | 2,225 | | Indiana Health and Educational Facilities Financing Authority, Revenue Bonds, Sisters of Saint Francis Health Services Inc., Series 2006E, 5.250%,
5/15/41 – AGM Insured | 5/18 at 100.00 | Aa3 | | 2,355,875 | |
| | 970 | | Indiana Health Facility Financing Authority, Revenue Bonds, Community Foundation of Northwest Indiana, Series 2007, 5.500%, 3/01/37 | 3/17 at 100.00 | A | | 1,010,449 | |
| | 1,030 | | Indiana Health Facility Financing Authority, Revenue Bonds, Community Foundation of Northwest Indiana, Series 2007, 5.500%, 3/01/37 (Pre-refunded 3/01/17) | 3/17 at 100.00 | N/R (4) | | 1,099,051 | |
| | 2,225 | | Indiana Municipal Power Agency, Power Supply Revenue Bonds, Series 2007A, 5.000%, 1/01/42 – NPFG Insured | 1/17 at 100.00 | AA– | | 2,312,509 | |
| | 3,000 | | Indiana Municipal Power Agency, Power Supply System Revenue Refunding Bonds, Series 2006A, 5.000%, 1/01/32 (Pre-refunded 1/01/16) – AMBAC Insured | 1/16 at 100.00 | AA+ (4) | | 3,024,870 | |
| | 18,510 | | Total Indiana | | | | 19,654,048 | |
| | | | Iowa – 2.0% (1.4% of Total Investments) | | | | | |
| | | | Iowa Finance Authority, Iowa, Midwestern Disaster Area Revenue Bonds, Iowa Fertilizer Company Project, Series 2013: | | | | | |
| | 2,000 | | 5.000%, 12/01/19 | No Opt. Call | BB– | | 2,128,520 | |
| | 5,645 | | 5.500%, 12/01/22 | 12/18 at 100.00 | BB– | | 5,987,652 | |
| | 3,100 | | Iowa Tobacco Settlement Authority, Asset Backed Settlement Revenue Bonds, Series 2005C, 5.625%, 6/01/46 | 12/15 at 100.00 | B+ | | 3,000,180 | |
| | 10,745 | | Total Iowa | | | | 11,116,352 | |
| | | | Kansas – 0.6% (0.4% of Total Investments) | | | | | |
| | 3,050 | | Overland Park Development Corporation, Kansas, First Tier Revenue Bonds, Overland Park Convention Center, Series 2007A, 5.125%, 1/01/22 – AMBAC Insured | 1/17 at 100.00 | BB+ | | 3,078,030 | |
| | | | Kentucky – 1.3% (0.9% of Total Investments) | | | | | |
| | 5,510 | | Kentucky Economic Development Finance Authority, Hospital Revenue Bonds, Baptist Healthcare System Obligated Group, Series 2011, 5.250%, 8/15/46 | 8/21 at 100.00 | A+ | | 5,976,201 | |
| | 1,000 | | Kentucky Economic Development Finance Authority, Louisville Arena Project Revenue Bonds, Louisville Arena Authority, Inc., Series 2008-A1, 6.000%, 12/01/33 – AGC Insured | 6/18 at 100.00 | AA | | 1,091,730 | |
| | 6,510 | | Total Kentucky | | | | 7,067,931 | |
| | | | Louisiana – 2.1% (1.4% of Total Investments) | | | | | |
| | 3,625 | | Louisiana Public Facilities Authority, Revenue Bonds, Ochsner Clinic Foundation Project, Series 2007A, 5.375%, 5/15/43 | 5/17 at 100.00 | Baa1 | | 3,789,466 | |
| | 1,375 | | Louisiana Public Facilities Authority, Revenue Bonds, Ochsner Clinic Foundation Project, Series 2007A, 5.375%, 5/15/43 (Pre-refunded 5/15/17) | 5/17 at 100.00 | N/R (4) | | 1,477,396 | |
| | 5,880 | | Louisiana State, Gasoline and Fuels Tax Revenue Bonds, Series 2006A, 5.000%, 5/01/41 (Pre-refunded 5/01/16) – AGM Insured | 5/16 at 100.00 | Aa1 (4) | | 6,019,532 | |
| | 10,880 | | Total Louisiana | | | | 11,286,394 | |
| | Principal | | | Optional Call | | | | |
| | Amount (000) | | Description (1) | Provisions (2) | Ratings (3) | | Value | |
| | | | Maine – 0.3% (0.2% of Total Investments) | | | | | |
| | | | Maine Health and Higher Educational Facilities Authority, Revenue Bonds, Maine General Medical Center, Series 2011: | | | | | |
| $ | 1,000 | | 6.750%, 7/01/36 | 7/21 at 100.00 | BBB– | $ | 1,135,480 | |
| | 210 | | 6.750%, 7/01/41 | 7/21 at 100.00 | BBB– | | 238,111 | |
| | 1,210 | | Total Maine | | | | 1,373,591 | |
| | | | Maryland – 0.9% (0.6% of Total Investments) | | | | | |
| | 5,000 | | Washington Suburban Sanitary District, Montgomery and Prince George's Counties, Maryland, General Obligation Bonds, Consolidated Public Improvement, Series 2012, 5.000%, 6/01/16 | No Opt. Call | AAA | | 5,141,650 | |
| | | | Massachusetts – 2.2% (1.5% of Total Investments) | | | | | |
| | 4,410 | | Massachusetts Department of Transportation, Metropolitan Highway System Revenue Bonds, Senior Lien Series 2010B, 5.000%, 1/01/32 | 1/20 at 100.00 | A+ | | 4,947,888 | |
| | 500 | | Massachusetts Health and Educational Facilities Authority, Revenue Bonds, CareGroup Inc., Series 2008E-1 &2, 5.125%, 7/01/38 | 7/18 at 100.00 | A– | | 529,150 | |
| | 2,300 | | Massachusetts Health and Educational Facilities Authority, Revenue Refunding Bonds, Suffolk University Issue, Series 2009A, 5.750%, 7/01/39 | 7/19 at 100.00 | BBB | | 2,570,342 | |
| | 3,650 | | Massachusetts School Building Authority, Dedicated Sales Tax Revenue Bonds, Senior Series 2013A, 5.000%, 5/15/43 | 5/23 at 100.00 | AA+ | | 4,155,233 | |
| | 10,860 | | Total Massachusetts | | | | 12,202,613 | |
| | | | Michigan – 5.2% (3.6% of Total Investments) | | | | | |
| | 3,500 | | Detroit, Michigan, Second Lien Sewerage Disposal System Revenue Bonds, Series 2005A, 5.000%, 7/01/35 – NPFG Insured | 1/16 at 100.00 | AA– | | 3,548,160 | |
| | 2,435 | | Detroit, Michigan, Sewage Disposal System Revenue Bonds, Second Lien Series 2006A, 5.500%, 7/01/36 – BHAC Insured | 7/18 at 100.00 | AA+ | | 2,638,834 | |
| | 2,020 | | Detroit, Michigan, Water Supply System Revenue Bonds, Senior Lien Series 2011A, 5.250%, 7/01/41 | 7/21 at 100.00 | BBB+ | | 2,158,451 | |
| | 2,235 | | Detroit, Michigan, Water Supply System Senior Lien Revenue Refunding Bonds, Series 2001C, 4.750%, 7/01/29 – BHAC Insured | 7/18 at 100.00 | AA+ | | 2,360,451 | |
| | 2,690 | | Michigan Finance Authority, Local Government Loan Program Revenue Bonds, Detroit Water & Sewerage Department Water Supply System Local Project, Series 2014C-3, 5.000%, 7/01/32 – AGM Insured | 7/24 at 100.00 | AA | | 2,989,370 | |
| | 1,000 | | Michigan Finance Authority, Local Government Loan Program Revenue Bonds, Detroit Water & Sewerage Department Water Supply System Local Project, Series 2014D-6, 5.000%, 7/01/36 – NPFG Insured | 7/24 at 100.00 | AA– | | 1,084,800 | |
| | 2,500 | | Michigan Finance Authority, Revenue Bonds, Trinity Health Credit Group, Refunding Series 2015, 5.000%, 12/01/31 | 6/22 at 100.00 | AA | | 2,830,250 | |
| | 2,500 | | Michigan Finance Authority, Unemployment Obligation Assessment Revenue Bonds, Series 2012B, 5.000%, 7/01/22 | 7/16 at 100.00 | AAA | | 2,579,475 | |
| | 885 | | Michigan State Building Authority, Revenue Bonds, Refunding Series 2006IA, 0.000%, 10/15/21 – NPFG Insured | 10/16 at 79.00 | Aa2 | | 692,017 | |
| | 1,115 | | Michigan State Building Authority, Revenue Bonds, Refunding Series 2006IA, 0.000%, 10/15/21 (Pre-refunded 10/15/16) – NPFG Insured | 10/16 at 79.00 | Aa2 (4) | | 877,260 | |
| | 5,000 | | Michigan State Building Authority, Revenue Refunding Bonds, Facilities Program, Refunding Series 2015-I, 5.000%, 4/15/28 | 10/25 at 100.00 | Aa2 | | 5,895,650 | |
| | 950 | | Wayne County Airport Authority, Michigan, Revenue Bonds, Detroit Metropolitan Wayne County Airport, Series 2015D, 5.000%, 12/01/40 | 12/25 at 100.00 | A | | 1,038,084 | |
| | 26,830 | | Total Michigan | | | | 28,692,802 | |
| | | | Missouri – 3.4% (2.3% of Total Investments) | | | | | |
| | 890 | | Bi-State Development Agency of the Missouri-Illinois Metropolitan District, Mass Transit Sales Tax Appropriation Bonds, Refunding Combined Lien Series 2013A, 5.000%, 10/01/28 | 10/18 at 100.00 | AA+ | | 985,283 | |
| | 5,000 | | Kansas City Municipal Assistance Corporation, Missouri, Leasehold Revenue Bonds, Series 2004B-1, 0.000%, 4/15/28 – AMBAC Insured | No Opt. Call | AA– | | 3,212,100 | |
| NQS | Nuveen Select Quality Municipal Fund, Inc. | |
| | Portfolio of Investments (continued) | October 31, 2015 |
| | Principal | | | Optional Call | | | | |
| | Amount (000) | | Description (1) | Provisions (2) | Ratings (3) | | Value | |
| | | | Missouri (continued) | | | | | |
| $ | 5,545 | | Missouri Health and Educational Facilities Authority, Health Facilities Revenue Bonds, CoxHealth, Series 2013A, 5.000%, 11/15/48 | 11/23 at 100.00 | A2 | $ | 6,044,383 | |
| | 3,150 | | Missouri Joint Municipal Electric Utility Commission, Power Project Revenue Bonds, Plum Point Project, Series 2006, 5.000%, 1/01/34 (Pre-refunded 1/01/16) – NPFG Insured | 1/16 at 100.00 | AA– (4) | | 3,176,208 | |
| | 5,000 | | Saint Louis, Missouri, Parking Revenue Bonds, Series 2006A, 5.000%, 12/15/31 – NPFG Insured | 12/16 at 100.00 | AA– | | 5,184,350 | |
| | 19,585 | | Total Missouri | | | | 18,602,324 | |
| | | | Nebraska – 1.4% (1.0% of Total Investments) | | | | | |
| | 1,635 | | Douglas County Hospital Authority 3, Nebraska, Health Facilities Revenue Bonds, Nebraska Methodist Health System, Refunding Series 2015, 4.125%, 11/01/36 | 11/25 at 100.00 | A– | | 1,640,984 | |
| | 6,100 | | Omaha Convention Hotel Corporation, Nebraska, Convention Center Revenue Bonds, Series 2007, 5.000%, 2/01/35 – AMBAC Insured | 2/17 at 100.00 | A2 | | 6,232,004 | |
| | 7,735 | | Total Nebraska | | | | 7,872,988 | |
| | | | Nevada – 5.8% (3.9% of Total Investments) | | | | | |
| | 4,500 | | Clark County, Nevada, Airport Revenue Bonds, Subordinate Lien Series 2014A-1, 5.000%, 7/01/16 (Alternative Minimum Tax) | No Opt. Call | A+ | | 4,635,135 | |
| | 5,210 | | Clark County, Nevada, Passenger Facility Charge Revenue Bonds, Las Vegas-McCarran International Airport, Series 2010A, 5.250%, 7/01/39 – AGM Insured | 1/20 at 100.00 | AA | | 5,837,388 | |
| | 4,000 | | Las Vegas Valley Water District, Nevada, General Obligation Bonds, Refunding Series 2015, 5.000%, 6/01/32 | 12/24 at 100.00 | AA+ | | 4,677,080 | |
| | 2,000 | | Las Vegas Valley Water District, Nevada, General Obligation Bonds, Water & Refunding Series 2011C, 4.000%, 6/01/16 | No Opt. Call | AA+ | | 2,044,560 | |
| | 4,000 | | Nevada State, Unemployment Compensation Fund Special Revenue Bonds, Series 2013, 5.000%, 6/01/16 | No Opt. Call | AAA | | 4,113,720 | |
| | 2,280 | | North Las Vegas, Nevada, General Obligation Bonds, Wastewater Reclamation System Series 2006, 5.000%, 10/01/25 – NPFG Insured | 10/16 at 100.00 | AA– | | 2,302,663 | |
| | 5,000 | | North Las Vegas, Nevada, General Obligation Bonds, Series 2006, 5.000%, 5/01/36 – NPFG Insured | 5/16 at 100.00 | AA– | | 4,918,150 | |
| | 2,500 | | Reno, Nevada, Health Facility Revenue Bonds, Catholic Healthcare West, Trust 2634, 18.924%, 7/01/31 – BHAC Insured (IF) (5) | 7/17 at 100.00 | AA+ | | 3,012,100 | |
| | 29,490 | | Total Nevada | | | | 31,540,796 | |
| | | | New Hampshire – 1.0% (0.7% of Total Investments) | | | | | |
| | 5,000 | | New Hampshire Business Finance Authority, Revenue Bonds, Elliot Hospital Obligated Group Issue, Series 2009A, 6.125%, 10/01/39 | 10/19 at 100.00 | Baa1 | | 5,523,900 | |
| | | | New Jersey – 4.7% (3.2% of Total Investments) | | | | | |
| | 1,965 | | New Jersey Economic Development Authority, Private Activity Bonds, The Goethals Bridge Replacement Project, Series 2013, 5.000%, 1/01/31 – AGM Insured (Alternative Minimum Tax) | 1/24 at 100.00 | AA | | 2,171,305 | |
| | 16,840 | | New Jersey Health Care Facilities Financing Authority, Revenue Bonds, Saint Barnabas Health Care System, Refunding Series 2006B, 0.000%, 7/01/35 | 1/17 at 39.39 | A– | | 6,305,064 | |
| | | | New Jersey Transportation Trust Fund Authority, Transportation System Bonds, Series 2006C: | | | | | |
| | 10,000 | | 0.000%, 12/15/32 – AGM Insured | No Opt. Call | AA | | 4,355,600 | |
| | 20,000 | | 0.000%, 12/15/33 – AGM Insured | No Opt. Call | AA | | 8,259,000 | |
| | 3,210 | | New Jersey Transportation Trust Fund Authority, Transportation System Bonds, Series 2012A, 5.000%, 6/15/42 | No Opt. Call | A– | | 3,260,461 | |
| | 2,000 | | Tobacco Settlement Financing Corporation, New Jersey, Tobacco Settlement Asset-Backed Bonds, Series 2007-1A, 5.000%, 6/01/41 | 6/17 at 100.00 | B– | | 1,626,480 | |
| | 54,015 | | Total New Jersey | | | | 25,977,910 | |
| | | | New Mexico – 1.0% (0.6% of Total Investments) | | | | | |
| | 5,115 | | Albuquerque, New Mexico, General Obligation Bonds, General Purpose Series 2013A, 4.000%, 7/01/16 | No Opt. Call | AAA | | 5,246,711 | |
| | Principal | | | Optional Call | | | | |
| | Amount (000) | | Description (1) | Provisions (2) | Ratings (3) | | Value | |
| | | | New York – 5.7% (3.9% of Total Investments) | | | | | |
| $ | 5,005 | | Dormitory Authority of the State of New York, Revenue Bonds, Non State Supported Debt, Vassar College, Series 2007, 5.000%, 7/01/46 | 7/17 at 100.00 | AA– | $ | 5,316,661 | |
| | 2,000 | | Hudson Yards Infrastructure Corporation, New York, Revenue Bonds, Senior Fiscal 2012 Series 2011A, 5.250%, 2/15/47 | 2/21 at 100.00 | A | | 2,188,440 | |
| | | | Hudson Yards Infrastructure Corporation, New York, Revenue Bonds, Series 2006A: | | | | | |
| | 2,000 | | 5.000%, 2/15/47 – FGIC Insured | 2/17 at 100.00 | A | | 2,085,960 | |
| | 3,100 | | 4.500%, 2/15/47 – NPFG Insured | 2/17 at 100.00 | AA– | | 3,213,522 | |
| | 2,925 | | Long Island Power Authority, New York, Electric System Revenue Bonds, Refunding Series 2009A, 5.500%, 4/01/24 (Pre-refunded 4/01/19) | 4/19 at 100.00 | A– (4) | | 3,376,006 | |
| | 2,500 | | Metropolitan Transportation Authority, New York, Transportation Revenue Bonds, Refunding Series 2012F, 5.000%, 11/15/26 | 11/22 at 100.00 | AA– | | 2,926,975 | |
| | 240 | | New York City Industrial Development Agency, New York, American Airlines-JFK International Airport Special Facility Revenue Bonds, Series 2005, 7.500%, 8/01/16 (Alternative Minimum Tax) | No Opt. Call | N/R | | 247,015 | |
| | 6,000 | | New York Liberty Development Corporation, New York, Liberty Revenue Bonds, 3 World Trade Center Project, Class 1 Series 2014, 5.000%, 11/15/44 | 11/24 at 100.00 | N/R | | 6,082,680 | |
| | 2,000 | | New York Liberty Development Corporation, New York, Liberty Revenue Bonds, 4 World Trade Center Project, Series 2011, 5.750%, 11/15/51 | No Opt. Call | A+ | | 2,305,400 | |
| | 3,000 | | Port Authority of New York and New Jersey, Consolidated Revenue Bonds, One Hundred Forty Eighth Series 2007, 5.000%, 8/15/33 (Pre-refunded 8/15/17) – AGM Insured | 8/17 at 100.00 | AA (4) | | 3,236,970 | |
| | 28,770 | | Total New York | | | | 30,979,629 | |
| | | | North Carolina – 2.4% (1.7% of Total Investments) | | | | | |
| | 3,000 | | Charlotte-Mecklenburg Hospital Authority, North Carolina, Health Care Revenue Bonds, DBA Carolinas HealthCare System, Series 2008A, 5.000%, 1/15/47 | 1/18 at 100.00 | AA– | | 3,136,140 | |
| | 5,000 | | North Carolina Medical Care Commission, Health Care Facilities Revenue Refunding Bonds, WakeMed, Series 2012A, 5.000%, 10/01/27 | 10/22 at 100.00 | AA– | | 5,640,550 | |
| | 2,375 | | North Carolina Medical Care Commission, Healthcare Revenue Refunding Bonds, Novant Health Inc., Series 2006, 5.000%, 11/01/39 – NPFG Insured | 11/16 at 100.00 | AA+ | | 2,466,580 | |
| | 1,900 | | North Carolina Turnpike Authority, Triangle Expressway System Revenue Bonds, Series 2009A, 5.750%, 1/01/39 – AGC Insured | 1/19 at 100.00 | AA | | 2,110,900 | |
| | 12,275 | | Total North Carolina | | | | 13,354,170 | |
| | | | North Dakota – 0.4% (0.2% of Total Investments) | | | | | |
| | 1,875 | | Grand Forks, North Dakota, Health Care System Revenue Bonds, Altru Health System Obligated Group, Series 2012, 5.000%, 12/01/32 | 12/21 at 100.00 | A– | | 2,028,450 | |
| | | | Ohio – 7.7% (5.3% of Total Investments) | | | | | |
| | | | Buckeye Tobacco Settlement Financing Authority, Ohio, Tobacco Settlement Asset-Backed Revenue Bonds, Senior Lien, Series 2007A-2: | | | | | |
| | 3,335 | | 5.375%, 6/01/24 | 6/17 at 100.00 | B– | | 3,031,515 | |
| | 875 | | 5.125%, 6/01/24 | 6/17 at 100.00 | B– | | 785,908 | |
| | 2,700 | | 5.875%, 6/01/30 | 6/17 at 100.00 | B– | | 2,414,286 | |
| | 2,755 | | 5.750%, 6/01/34 | 6/17 at 100.00 | B– | | 2,415,088 | |
| | 7,995 | | 5.875%, 6/01/47 | 6/17 at 100.00 | B | | 6,910,638 | |
| | 18,300 | | Buckeye Tobacco Settlement Financing Authority, Ohio, Tobacco Settlement Asset-Backed Revenue Bonds, Senior Lien, Series 2007A-3, 6.250%, 6/01/37 | 6/22 at 100.00 | B– | | 16,747,792 | |
| | 1,730 | | Lucas County, Ohio, Hospital Revenue Bonds, ProMedica Healthcare Obligated Group, Series 2011A, 6.000%, 11/15/41 | 11/21 at 100.00 | AA | | 2,067,558 | |
| | 3,750 | | Ohio Higher Educational Facilities Commission, Revenue Bonds, University Hospitals Health System Inc., Tender Option Bond Trust 2812, 14.919%, 1/15/46 – AMBAC Insured (IF) | 1/17 at 100.00 | A | | 3,886,800 | |
| | 3,685 | | Ohio Turnpike Commission, Turnpike Revenue Bonds, Infrastructure Project, Junior Lien Series 2013A-1, 5.000%, 2/15/48 | 2/23 at 100.00 | A+ | | 4,004,232 | |
| | 45,125 | | Total Ohio | | | | 42,263,817 | |
| NQS | Nuveen Select Quality Municipal Fund, Inc. | |
| | Portfolio of Investments (continued) | October 31, 2015 |
| | Principal | | | Optional Call | | | | |
| | Amount (000) | | Description (1) | Provisions (2) | Ratings (3) | | Value | |
| | | | Oklahoma – 0.6% (0.4% of Total Investments) | | | | | |
| $ | 1,000 | | Fort Sill Apache Tribe of Oklahoma Economic Development Authority, Gaming Enterprise Revenue Bonds, Fort Sill Apache Casino, Series 2011A, 8.500%, 8/25/26 | 8/21 at 100.00 | N/R | $ | 1,178,370 | |
| | 1,675 | | Oklahoma Development Finance Authority, Health System Revenue Bonds, Integris Baptist Medical Center, Series 2008B, 5.250%, 8/15/38 (Pre-refunded 8/15/18) | 8/18 at 100.00 | AA– (4) | | 1,879,752 | |
| | 2,675 | | Total Oklahoma | | | | 3,058,122 | |
| | | | Pennsylvania – 3.8% (2.6% of Total Investments) | | | | | |
| | 1,000 | | Cumberland County Municipal Authority, Pennsylvania, Revenue Bonds, Presbyterian Homes Inc., Refunding Series 2005A, 5.000%, 12/01/21 – RAAI Insured | 12/15 at 100.00 | AA | | 1,002,990 | |
| | 160 | | Erie Water Authority, Erie County, Pennsylvania, Water Revenue Bonds, Series 2008, 5.000%, 12/01/43 (Pre-refunded 12/01/18) – AGM Insured | 12/18 at 100.00 | AA (4) | | 180,059 | |
| | 1,090 | | Erie Water Authority, Erie County, Pennsylvania, Water Revenue Bonds, Series 2008, 5.000%, 12/01/43 – AGM Insured | 12/18 at 100.00 | AA | | 1,192,885 | |
| | 3,250 | | Pennsylvania Housing Finance Agency, Single Family Mortgage Revenue Bonds, Series 2006-96A, 4.650%, 10/01/31 (Alternative Minimum Tax) (UB) | 10/16 at 100.00 | AA+ | | 3,276,553 | |
| | 8,550 | | Pennsylvania Turnpike Commission, Turnpike Revenue Bonds, Capital Appreciation Series 2009E, 0.000%, 12/01/38 | 12/27 at 100.00 | A– | | 9,449,802 | |
| | 5,000 | | Pennsylvania Turnpike Commission, Turnpike Revenue Bonds, Subordinate Series 2009C, 0.000%, 6/01/33 – AGM Insured | 6/26 at 100.00 | AA | | 6,000,550 | |
| | 19,050 | | Total Pennsylvania | | | | 21,102,839 | |
| | | | Puerto Rico – 0.4% (0.3% of Total Investments) | | | | | |
| | 800 | | Puerto Rico Public Buildings Authority, Guaranteed Government Facilities Revenue Refunding Bonds, Series 2002D, 5.450%, 7/01/31 – AMBAC Insured | 7/17 at 100.00 | Caa3 | | 712,712 | |
| | 23,890 | | Puerto Rico Sales Tax Financing Corporation, Sales Tax Revenue Bonds, Series 2007A, 0.000%, 8/01/54 – AMBAC Insured | No Opt. Call | Caa3 | | 1,602,541 | |
| | 24,690 | | Total Puerto Rico | | | | 2,315,253 | |
| | | | South Carolina – 3.9% (2.7% of Total Investments) | | | | | |
| | 2,500 | | Columbia, South Carolina, Waterworks and Sewer System Revenue Bonds, Series 2011A, 5.000%, 2/01/41 | 2/21 at 100.00 | Aa1 | | 2,824,575 | |
| | 21,565 | | Piedmont Municipal Power Agency, South Carolina, Electric Revenue Bonds, Series 2004A-2, 0.000%, 1/01/30 – AMBAC Insured | No Opt. Call | A– | | 12,209,886 | |
| | 1,965 | | South Carolina Public Service Authority, Revenue Bonds, Santee Cooper Electric System, Series 2005B, 5.000%, 1/01/21 (Pre-refunded 1/01/16) – NPFG Insured | 1/16 at 100.00 | AA– (4) | | 1,980,602 | |
| | 4,000 | | South Carolina Public Service Authority, Santee Cooper Revenue Obligations, Refunding & Improvement Series 2015A, 5.000%, 12/01/55 | 6/25 at 100.00 | AA– | | 4,332,320 | |
| | 30,030 | | Total South Carolina | | | | 21,347,383 | |
| | | | South Dakota – 0.2% (0.1% of Total Investments) | | | | | |
| | 910 | | South Dakota Health and Educational Facilities Authority, Revenue Bonds, Sanford Health, Series 2015, 5.000%, 11/01/45 | 11/25 at 100.00 | A+ | | 1,005,350 | |
| | | | Tennessee – 1.0% (0.7% of Total Investments) | | | | | |
| | 1,595 | | Chattanooga Health, Educational and Housing Facility Board, Tennessee, Hospital Revenue Bonds, Catholic Health Initiatives, Series 2013A, 5.250%, 1/01/45 | 1/23 at 100.00 | A+ | | 1,746,732 | |
| | 3,125 | | Johnson City Health and Educational Facilities Board, Tennessee, Hospital Revenue Bonds, Mountain States Health Alliance, Refunding Series 2010A, 6.000%, 7/01/38 | 7/20 at 100.00 | BBB+ | | 3,521,063 | |
| | 4,720 | | Total Tennessee | | | | 5,267,795 | |
| | | | Texas – 24.1% (16.4% of Total Investments) | | | | | |
| | 2,110 | | Brazos River Authority, Texas, Pollution Control Revenue Refunding Bonds, TXU Electric Company, Series 1999C, 7.700%, 3/01/32 (Alternative Minimum Tax) (6) | 4/16 at 100.00 | C | | 121,325 | |
| | 1,000 | | Capital Area Cultural Education Facilities Finance Corporation, Texas, Revenue Bonds, The Roman Catholic Diocese of Austin, Series 2005B. Remarketed, 6.125%, 4/01/45 | 4/20 at 100.00 | Baa1 | | 1,148,500 | |
| | Principal | | | Optional Call | | | | |
| | Amount (000) | | Description (1) | Provisions (2) | Ratings (3) | | Value | |
| | | | Texas (continued) | | | | | |
| $ | 1,000 | | Central Texas Regional Mobility Authority, Revenue Bonds, Senior Lien Series 2011, 6.000%, 1/01/41 | 1/21 at 100.00 | BBB+ | $ | 1,141,330 | |
| | 4,000 | | Dallas-Fort Worth International Airport, Texas, Joint Revenue Bonds, Refunding Series 2012E, 5.000%, 11/01/42 (Alternative Minimum Tax) | No Opt. Call | A+ | | 4,277,600 | |
| | 2,000 | | Ennis Independent School District, Ellis County, Texas, General Obligation Bonds, Series 2006, 0.000%, 8/15/28 (Pre-refunded 8/15/16) | 8/16 at 54.64 | Aaa | | 1,089,920 | |
| | 9,120 | | Grand Parkway Transportation Corporation, Texas, System Toll Revenue Bonds, Subordinate Lien Series 2013B, 5.000%, 4/01/53 | 10/23 at 100.00 | AA+ | | 9,952,656 | |
| | 1,895 | | Harris County Cultural Education Facilities Finance Corporation, Texas, Revenue Bonds, Houston Methodist Hospital System, Series 2015, 4.000%, 12/01/45 | 6/25 at 100.00 | AA | | 1,891,646 | |
| | 3,070 | | Harris County Hospital District, Texas, Revenue Bonds, Series 2007A, 5.250%, 2/15/42 – NPFG Insured | 2/17 at 100.00 | AA+ | | 3,222,640 | |
| | 6,500 | | Harris County-Houston Sports Authority, Texas, Revenue Bonds, Capital Appreciation Refunding Senior Lien Series 2014A, 0.000%, 11/15/47 – AGM Insured | 11/31 at 46.45 | AA | | 1,443,650 | |
| | 7,570 | | Harris County-Houston Sports Authority, Texas, Revenue Bonds, Junior Lien Series 2001H, 0.000%, 11/15/31 – NPFG Insured | No Opt. Call | AA– | | 3,692,873 | |
| | 3,000 | | Houston, Texas, Airport System Revenue Bonds, Refunding Subordinate Lien Series 2007B, 5.000%, 7/01/25 – NPFG Insured | 7/17 at 100.00 | AA– | | 3,190,080 | |
| | 3,500 | | Houston, Texas, First Lien Combined Utility System Revenue Bonds, Refunding Series 2011A, 5.250%, 11/15/30 | No Opt. Call | AA | | 4,107,390 | |
| | | | Houston, Texas, Hotel Occupancy Tax and Special Revenue Bonds, Convention and Entertainment Project, Series 2001B: | | | | | |
| | 3,250 | | 0.000%, 9/01/25 – AMBAC Insured | No Opt. Call | AA | | 2,345,168 | |
| | 4,130 | | 0.000%, 9/01/26 – AMBAC Insured | No Opt. Call | AA | | 2,859,447 | |
| | 8,000 | | Leander Independent School District, Williamson and Travis Counties, Texas, General Obligation Bonds, Refunding Series 2015A, 4.000%, 8/15/37 | 8/25 at 100.00 | AAA | | 8,301,920 | |
| | 9,000 | | Matagorda County Navigation District 1, Texas, Collateralized Revenue Refunding Bonds, Houston Light and Power Company, Series 1997, 5.125%, 11/01/28 – AMBAC Insured (Alternative Minimum Tax) | No Opt. Call | A1 | | 10,746,269 | |
| | 5,000 | | Midland Independent School District, Midland County, Texas, General Obligation Bonds, School Building Series 2007, 5.000%, 2/15/32 | 2/17 at 100.00 | AAA | | 5,259,150 | |
| | 2,000 | | North Texas Tollway Authority, Special Projects System Revenue Bonds, Series 2011A, 5.500%, 9/01/41 (UB) (5) | 9/21 at 100.00 | AA+ | | 2,350,160 | |
| | 7,000 | | North Texas Tollway Authority, System Revenue Bonds, Refunding First Tier Capital Appreciation Series 2008I, 6.500%, 1/01/43 | 1/25 at 100.00 | A1 | | 8,721,790 | |
| | 4,105 | | North Texas Tollway Authority, System Revenue Bonds, Refunding First Tier, Series 2015B, 5.000%, 1/01/40 | 1/23 at 100.00 | A1 | | 4,484,097 | |
| | 5,500 | | North Texas Tollway Authority, System Revenue Bonds, Refunding Second Tier, Series 2015A, 5.000%, 1/01/33 | 1/25 at 100.00 | A2 | | 6,187,995 | |
| | 6,310 | | Pasadena Independent School District, Harris County, Texas, General Obligation Bonds, Series 2006, 5.000%, 2/15/26 (Pre-refunded 2/15/16) | 2/16 at 100.00 | Aaa | | 6,398,845 | |
| | 4,375 | | Tarrant County Cultural & Educational Facilities Financing Corporation, Texas, Revenue Bonds, Texas Health Resources Tender Option Bond Trust 1197, 9.221%, 5/15/39 (IF) (5) | 11/17 at 100.00 | AA | | 4,851,613 | |
| | 2,675 | | Tarrant County Cultural Education Facilities Finance Corporation, Texas, Hospital Revenue Bonds, Scott & White Healthcare Project, Series 2010, 5.500%, 8/15/45 | 8/20 at 100.00 | AA– | | 3,082,162 | |
| | 215 | | Tarrant County Cultural Education Facilities Finance Corporation, Texas, Hospital Revenue Bonds, Scott & White Healthcare Project, Series 2010, 5.500%, 8/15/45 (Pre-refunded 8/15/20) | 8/20 at 100.00 | N/R (4) | | 256,237 | |
| | 5,910 | | Texas Municipal Gas Acquisition and Supply Corporation III, Gas Supply Revenue Bonds, Series 2012, 5.000%, 12/15/23 | No Opt. Call | A3 | | 6,864,465 | |
| | 3,335 | | Texas State, General Obligation Bonds, Water Financial Assistance, Tender Option Bond Trust 2015-XF0075, 13.537%, 2/01/30 (IF) | 8/19 at 100.00 | AAA | | 4,542,170 | |
| NQS | Nuveen Select Quality Municipal Fund, Inc. | |
| | Portfolio of Investments (continued) | October 31, 2015 |
| | Principal | | | Optional Call | | | | |
| | Amount (000) | | Description (1) | Provisions (2) | Ratings (3) | | Value | |
| | | | Texas (continued) | | | | | |
| $ | 5,000 | | Texas State, Transportation Commission Highway Fund Revenue Bonds, First Tier Series 2006A, 4.500%, 4/01/16 | No Opt. Call | AAA | $ | 5,092,100 | |
| | 4,430 | | Texas Transportation Commission, Central Texas Turnpike System Revenue Bonds, First Tier Refunding Series 2012A, 5.000%, 8/15/41 | 8/22 at 100.00 | A– | | 4,819,973 | |
| | 5,000 | | Texas Transportation Commission, Central Texas Turnpike System Revenue Bonds, Second Tier Refunding Series 2015C, 5.000%, 8/15/37 | 8/24 at 100.00 | BBB+ | | 5,436,800 | |
| | 3,000 | | Wichita Falls Independent School District, Wichita County, Texas, General Obligation Bonds, Series 2007, 5.000%, 2/01/23 (Pre-refunded 2/01/17) | 2/17 at 100.00 | AAA | | 3,172,170 | |
| | 820 | | Winter Garden Housing Finance Corporation, Texas, GNMA/FNMA Mortgage-Backed Securities Program Single Family Mortgage Revenue Bonds, Series 1994, 6.950%, 10/01/27 (Alternative Minimum Tax) | 4/16 at 100.00 | CC | | 822,247 | |
| | 133,820 | | Total Texas | | | | 131,874,388 | |
| | | | Virginia – 2.3% (1.6% of Total Investments) | | | | | |
| | 1,500 | | Fairfax County Economic Development Authority, Virginia, Residential Care Facilities Mortgage Revenue Bonds, Goodwin House, Inc., Series 2007A, 5.125%, 10/01/42 | 10/17 at 100.00 | BBB | | 1,555,575 | |
| | 900 | | Henrico County Economic Development Authority, Virginia, Revenue Bonds, Bon Secours Health System Obligated Group, Series 2013, 5.000%, 11/01/30 | No Opt. Call | A | | 1,006,596 | |
| | 5,000 | | Metropolitan Washington Airports Authority, Virginia, Dulles Toll Road Second Senior Lien Revenue Bonds, Series 2009C, 0.000%, 10/01/41 – AGC Insured | 10/26 at 100.00 | AA | | 6,015,800 | |
| | | | Virginia Small Business Financing Authority, Senior Lien Revenue Bonds, Elizabeth River Crossing, Opco LLC Project, Series 2012: | | | | | |
| | 2,470 | | 6.000%, 1/01/37 (Alternative Minimum Tax) | 7/22 at 100.00 | BBB– | | 2,807,600 | |
| | 1,260 | | 5.500%, 1/01/42 (Alternative Minimum Tax) | 7/22 at 100.00 | BBB– | | 1,375,000 | |
| | 11,130 | | Total Virginia | | | | 12,760,571 | |
| | | | Washington – 2.0% (1.4% of Total Investments) | | | | | |
| | 3,750 | | FYI Properties, Washington, Lease Revenue Bonds, Washington State Department of Information Services Project, Series 2009, 5.500%, 6/01/39 (UB) (5) | 6/19 at 100.00 | AA | | 4,214,100 | |
| | 2,000 | | Washington State Health Care Facilities Authority, Revenue Bonds, Fred Hutchinson Cancer Research Center, Series 2009A, 6.000%, 1/01/33 (Pre-refunded 7/01/19) | 7/19 at 100.00 | A (4) | | 2,356,600 | |
| | 2,500 | | Washington State Health Care Facilities Authority, Revenue Bonds, Northwest Hospital and Medical Center of Seattle, Series 2007, 5.700%, 12/01/32 | 12/17 at 100.00 | N/R | | 2,571,025 | |
| | 1,935 | | Washington State Health Care Facilities Authority, Revenue Bonds, Virginia Mason Medical Center, Series 2007B, 5.750%, 8/15/37 – ACA Insured | 8/17 at 100.00 | BBB | | 2,057,776 | |
| | 10,185 | | Total Washington | | | | 11,199,501 | |
| | | | West Virginia – 0.6% (0.4% of Total Investments) | | | | | |
| | 3,000 | | West Virginia Hospital Finance Authority, Hospital Revenue Bonds, West Virginia United Health System Obligated Group, Refunding and Improvement Series 2013A, 5.500%, 6/01/44 | 6/23 at 100.00 | A | | 3,391,290 | |
| | | | Wisconsin – 0.3% (0.2% of Total Investments) | | | | | |
| | 1,500 | | Wisconsin State, General Obligation Bonds, Series 2006A, 5.000%, 5/01/18 (Pre-refunded 5/01/16) – NPFG Insured | 5/16 at 100.00 | AA (4) | | 1,535,281 | |
| $ | 903,350 | | Total Municipal Bonds (cost $745,757,332) | | | | 802,943,076 | |
| | Principal | | | | | | | | |
| | Amount (000) | | Description (1) | Coupon | Maturity | Ratings (3) | | Value | |
| | | | CORPORATE BONDS – 0.0% (0.0% of Total Investments) | | | | | | |
| | | | Transportation – 0.0% (0.0% of Total Investments) | | | | | | |
| $ | 44 | | Las Vegas Monorail Company, Senior Interest Bonds (7), (8) | 5.500% | 7/15/19 | N/R | $ | 2,203 | |
| | 12 | | Las Vegas Monorail Company, Senior Interest Bonds (7), (8) | 3.000% | 7/15/55 | N/R | | 469 | |
| $ | 56 | | Total Corporate Bonds (cost $4,997) | | | | | 2,672 | |
| | | | Total Long-Term Investments (cost $745,762,329) | | | | | 802,945,748 | |
| | | | Floating Rate Obligations – (2.5)% | | | | | (13,455,000 | ) |
| | | | Variable Rate Demand Preferred Shares, at Liquidation Value – (48.8)% (9) | | | | | (267,500,000 | ) |
| | | | Other Assets Less Liabilities – 4.9% | | | | | 26,288,760 | |
| | | | Net Assets Applicable to Common Shares – 100% | | | | $ | 548,279,508 | |
| (1) | All percentages shown in the Portfolio of Investments are based on net assets applicable to common shares unless otherwise noted. |
| (2) | Optional Call Provisions (not covered by the report of independent registered public accounting firm): Dates (month and year) and prices of the earliest optional call or redemption. There may be other call provisions at varying prices at later dates. Certain mortgage-backed securities may be subject to periodic principal paydowns. |
| (3) | Ratings (not covered by the report of independent registered public accounting firm): Using the highest of Standard & Poor's Group ("Standard & Poor's"), Moody's Investors Service, Inc. ("Moody's") or Fitch, Inc. ("Fitch") rating. Ratings below BBB by Standard & Poor's, Baa by Moody's or BBB by Fitch are considered to be below investment grade. Holdings designated N/R are not rated by any of these national rating agencies. |
| (4) | Backed by an escrow or trust containing sufficient U.S. Government or U.S. Government agency securities, which ensure the timely payment of principal and interest. Certain bonds backed by U.S. Government or agency securities are regarded as having an implied rating equal to the rating of such securities. |
| (5) | Investment, or portion of investment, has been pledged to collateralize the net payment obligations for investments in inverse floating rate transactions. |
| (6) | As of, or subsequent to, the end of the reporting period this security is non-income producing. Non-income producing, in the case of a fixed-income security, generally |
| | denotes that the issuer has (1) defaulted on the payment of principal or interest, (2) is under the protection of the Federal Bankruptcy Court or (3) the Fund's Adviser has concluded that the issue is not likely to meet its future interest payment obligations and has ceased accruing additional income on the Fund's records. |
| (7) | Investment valued at fair value using methods determined in good faith by, or at the discretion of, the Board. For fair value measurement disclosure purposes, investment classified as Level 3. See Notes to Financial Statements, Note 2 – Investment Valuation and Fair Value Measurements for more information. |
| (8) | During January 2010, Las Vegas Monorail Company ("Las Vegas Monorail") filed for federal bankruptcy protection. During March 2012, Las Vegas Monorail emerged from federal bankruptcy with the acceptance of a reorganization plan assigned by the Federal Bankruptcy Court. Under the reorganization plan, the Fund surrendered its Las Vegas Monorail Project Revenue Bonds, First Tier, Series 2000 and in turn received two senior interest corporate bonds: the first with an annual coupon rate of 5.500% maturing on July 15, 2019 and the second with an annual coupon rate of 3.000% (5.500% after December 31, 2015) maturing on July 15, 2055. The Fund's custodian is not accruing income for either senior interest corporate bond. |
| (9) | Variable Rate Demand Preferred Shares, at Liquidation Value as a percentage of Total Investments is 33.3%. |
| (ETM) | Escrowed to maturity. |
| (IF) | Inverse floating rate investment. |
| (UB) | Underlying bond of an inverse floating rate trust reflected as a financing transaction. See Notes to Financial Statements, Note 3 – Portfolio Securities and Investments in Derivatives, Inverse Floating Rate Securities for more information. |
See accompanying notes to financial statements.
| NQU | | |
| | Nuveen Quality Income Municipal Fund, Inc. | |
| | Portfolio of Investments | October 31, 2015 |
| | Principal | | | Optional Call | | | | |
| | Amount (000) | | Description (1) | Provisions (2) | Ratings (3) | | Value | |
| | | | LONG-TERM INVESTMENTS 150.4% (99.8% of Total Investments) | | | | | |
| | | | MUNICIPAL BONDS 150.4% (99.8% of Total Investments) | | | | | |
| | | | Alaska – 2.0% (1.3% of Total Investments) | | | | | |
| | | | Northern Tobacco Securitization Corporation, Alaska, Tobacco Settlement Asset-Backed Bonds, Series 2006A: | | | | | |
| $ | 3,975 | | 5.000%, 6/01/32 | 12/15 at 100.00 | B | $ | 3,611,327 | |
| | 13,835 | | 5.000%, 6/01/46 | 12/15 at 100.00 | B | | 11,619,740 | |
| | 17,810 | | Total Alaska | | | | 15,231,067 | |
| | | | Arizona – 1.9% (1.3% of Total Investments) | | | | | |
| | 1,190 | | Maricopa County Industrial Development Authority, Arizona, Health Facility Revenue Bonds, Catholic Healthcare West, Series 2007A, 5.250%, 7/01/32 | 7/17 at 100.00 | A | | 1,242,146 | |
| | 630 | | Mesa, Arizona, Utility System Revenue Refunding Bonds, Series 2002, 5.250%, 7/01/17 – FGIC Insured (ETM) | No Opt. Call | Aa2 (4) | | 679,298 | |
| | 370 | | Mesa, Arizona, Utility System Revenue Refunding Bonds, Series 2002, 5.250%, 7/01/17 – FGIC Insured | No Opt. Call | Aa2 | | 398,919 | |
| | 7,780 | | Phoenix Civic Improvement Corporation, Arizona, Junior Lien Airport Revenue Bonds, Series 2010A, 5.000%, 7/01/40 | 7/20 at 100.00 | A+ | | 8,572,160 | |
| | 2,350 | | Phoenix Civic Improvement Corporation, Arizona, Senior Lien Airport Revenue Bonds, Series 2008A, 5.000%, 7/01/33 | 7/18 at 100.00 | AA– | | 2,556,988 | |
| | 1,000 | | Pima County Industrial Development Authority, Arizona, Revenue Bonds, Tucson Electric Power Company, Series 2010A, 5.250%, 10/01/40 | 10/20 at 100.00 | A3 | | 1,097,130 | |
| | 13,320 | | Total Arizona | | | | 14,546,641 | |
| | | | Arkansas – 0.8% (0.5% of Total Investments) | | | | | |
| | | | Arkansas Development Finance Authority, Tobacco Settlement Revenue Bonds, Arkansas Cancer Research Center Project, Series 2006: | | | | | |
| | 2,500 | | 0.000%, 7/01/36 – AMBAC Insured | No Opt. Call | Aa2 | | 1,049,225 | |
| | 20,125 | | 0.000%, 7/01/46 – AMBAC Insured | No Opt. Call | Aa2 | | 4,871,860 | |
| | 22,625 | | Total Arkansas | | | | 5,921,085 | |
| | | | California – 21.3% (14.1% of Total Investments) | | | | | |
| | 12,550 | | Anaheim Public Financing Authority, California, Lease Revenue Bonds, Public Improvement Project, Series 1997C, 0.000%, 9/01/35 – AGM Insured | No Opt. Call | AA | | 5,540,198 | |
| | 5,000 | | Bay Area Toll Authority, California, Revenue Bonds, San Francisco Bay Area Toll Bridge, Series 2013S-4, 5.000%, 4/01/38 | 4/23 at 100.00 | AA– | | 5,576,100 | |
| | 3,275 | | California County Tobacco Securitization Agency, Tobacco Settlement Asset-Backed Bonds, Los Angeles County Securitization Corporation, Series 2006A, 5.450%, 6/01/28 | 12/18 at 100.00 | B | | 3,281,747 | |
| | 890 | | California Health Facilities Financing Authority, Revenue Bonds, Saint Joseph Health System, Series 2013A, 5.000%, 7/01/37 | 7/23 at 100.00 | AA– | | 1,015,036 | |
| | 2,335 | | California Municipal Finance Authority, Revenue Bonds, Eisenhower Medical Center, Series 2010A, 5.750%, 7/01/40 | 7/20 at 100.00 | Baa2 | | 2,551,501 | |
| | | | California State, General Obligation Bonds, Refunding Series 2005: | | | | | |
| | 16,665 | | 4.750%, 3/01/35 (Pre-refunded 3/01/16) – NPFG Insured | 3/16 at 100.00 | AA– (4) | | 16,920,473 | |
| | 8,335 | | 4.750%, 3/01/35 (Pre-refunded 3/01/16) – NPFG Insured | 3/16 at 100.00 | AA– (4) | | 8,464,109 | |
| | 2,250 | | California State, General Obligation Bonds, Refunding Series 2007, 4.500%, 8/01/28 – AMBAC Insured | 2/17 at 100.00 | AA– | | 2,351,228 | |
| | 16,000 | | California State, General Obligation Bonds, Various Purpose Series 2007, 5.000%, 6/01/37 | 6/17 at 100.00 | AA– | | 16,983,519 | |
| | | | California State, General Obligation Bonds, Various Purpose Series 2010: | | | | | |
| | 3,500 | | 5.250%, 3/01/30 | 3/20 at 100.00 | AA– | | 4,047,330 | |
| | 10,000 | | 5.500%, 11/01/35 | 11/20 at 100.00 | AA– | | 11,862,600 | |
| | Principal | | | Optional Call | | | | |
| | Amount (000) | | Description (1) | Provisions (2) | Ratings (3) | | Value | |
| | | | California (continued) | | | | | |
| $ | 1,360 | | California Statewide Community Development Authority, Revenue Bonds, Daughters of Charity Health System, Series 2005A, 5.250%, 7/01/30 | 1/16 at 100.00 | CCC | $ | 1,223,130 | |
| | 3,600 | | California Statewide Community Development Authority, Revenue Bonds, St. Joseph Health System, Series 2007A, 5.750%, 7/01/47 – FGIC Insured | 7/18 at 100.00 | AA– | | 3,983,364 | |
| | 3,400 | | Coachella Valley Unified School District, Riverside County, California, General Obligation Bonds, Election 2005 Series 2010C, 0.000%, 8/01/33 – AGM Insured | No Opt. Call | AA | | 1,619,352 | |
| | 910 | | Foothill/Eastern Transportation Corridor Agency, California, Toll Road Revenue Bonds, Refunding Series 2013A, 0.000%, 1/15/42 | 1/31 at 100.00 | BBB– | | 691,345 | |
| | | | Golden State Tobacco Securitization Corporation, California, Tobacco Settlement Asset-Backed Bonds, Series 2007A-1: | | | | | |
| | 7,240 | | 4.500%, 6/01/27 | 6/17 at 100.00 | B+ | | 7,105,191 | |
| | 13,090 | | 5.000%, 6/01/33 | 6/17 at 100.00 | B | | 11,677,720 | |
| | 1,500 | | 5.125%, 6/01/47 | 6/17 at 100.00 | B | | 1,273,995 | |
| | 6,020 | | Los Angeles Unified School District, California, General Obligation Bonds, Series 2006G, 5.000%, 7/01/26 (Pre-refunded 7/01/16) – AMBAC Insured | 7/16 at 100.00 | Aa2 (4) | | 6,213,001 | |
| | 5,000 | | Los Angeles Unified School District, Los Angeles County, California, General Obligation Bonds, Series 2007A, 4.500%, 1/01/28 – NPFG Insured | 7/17 at 100.00 | Aa2 | | 5,282,450 | |
| | 1,855 | | Mount San Antonio Community College District, Los Angeles County, California, General Obligation Bonds, Election of 2008, Series 2013A, 0.000%, 8/01/43 | 8/35 at 100.00 | AA | | 1,298,092 | |
| | 3,300 | | M-S-R Energy Authority, California, Gas Revenue Bonds, Citigroup Prepay Contracts, Series 2009B, 6.500%, 11/01/39 | No Opt. Call | A | | 4,453,020 | |
| | 3,290 | | Murrieta Valley Unified School District Public Financing Authority, California, Special Tax Revenue Bonds, Series 2006A, 5.125%, 9/01/26 – AGM Insured | 9/16 at 100.00 | AA | | 3,410,579 | |
| | 5,000 | | Palomar Pomerado Health Care District, California, Certificates of Participation, Series 2010, 6.000%, 11/01/30 | 11/20 at 100.00 | Ba1 | | 5,372,000 | |
| | 3,700 | | Palomar Pomerado Health, California, General Obligation Bonds, Capital Appreciation, Election of 2004, Series 2007A, 0.000%, 8/01/25 – NPFG Insured | No Opt. Call | AA– | | 2,676,654 | |
| | 9,145 | | Pittsburg Redevelopment Agency, California, Tax Allocation Bonds, Los Medanos Community Development Project, Series 1999, 0.000%, 8/01/30 – AMBAC Insured | No Opt. Call | A | | 4,773,964 | |
| | 2,500 | | Redding, California, Electric System Revenue Certificates of Participation, Series 2005, 5.000%, 6/01/30 (Pre-refunded 12/18/15) – NPFG Insured | 12/18 at 100.00 | AA– (4) | | 2,503,675 | |
| | 1,830 | | San Diego Public Facilities Financing Authority, California, Water Utility Revenue Bonds, Tender Option Bond Trust 2015-XF0098, 19.823%, 2/01/33 (IF) | 8/19 at 100.00 | Aa2 | | 2,894,804 | |
| | 7,210 | | San Joaquin Hills Transportation Corridor Agency, Orange County, California, Toll Road Revenue Bonds, Refunding Series 1997A, 0.000%, 1/15/23 – NPFG Insured | No Opt. Call | AA– | | 5,537,568 | |
| | 4,175 | | San Mateo County Community College District, California, General Obligation Bonds, Series 2006C, 0.000%, 9/01/30 – NPFG Insured | No Opt. Call | AAA | | 2,555,935 | |
| | 4,325 | | San Ysidro School District, San Diego County, California, General Obligation Bonds, 1997 Election Series 2012G, 0.000%, 8/01/34 – AGM Insured | No Opt. Call | AA | | 1,942,228 | |
| | 5,690 | | San Ysidro School District, San Diego County, California, General Obligation Bonds, Refunding Series 2015, 0.000%, 8/01/42 | No Opt. Call | AA | | 1,497,039 | |
| | 4,495 | | Stockton-East Water District, California, Certificates of Participation, Refunding Series 2002B, 0.000%, 4/01/28 – FGIC Insured | 4/16 at 100.00 | AA– | | 2,127,708 | |
| | | | Tobacco Securitization Authority of Northern California, Tobacco Settlement Asset-Backed Bonds, Series 2005A-1: | | | | | |
| | 1,245 | | 4.750%, 6/01/23 | 12/15 at 100.00 | B+ | | 1,244,938 | |
| | 1,500 | | 5.500%, 6/01/45 | 12/15 at 100.00 | B– | | 1,355,565 | |
| | 1,345 | | Tobacco Securitization Authority of Southern California, Tobacco Settlement Asset-Backed Bonds, San Diego County Tobacco Asset Securitization Corporation, Senior Series 2006A, 4.750%, 6/01/25 | 12/15 at 100.00 | BBB | | 1,345,094 | |
| | 183,525 | | Total California | | | | 162,652,252 | |
| NQU | Nuveen Quality Income Municipal Fund, Inc. | |
| | Portfolio of Investments (continued) | October 31, 2015 |
| | Principal | | | Optional Call | | | | |
| | Amount (000) | | Description (1) | Provisions (2) | Ratings (3) | | Value | |
| | | | Colorado – 10.3% (6.8% of Total Investments) | | | | | |
| $ | 3,350 | | Colorado Health Facilities Authority, Colorado, Revenue Bonds, Catholic Health Initiatives, Series 2006A, 4.500%, 9/01/38 | 9/16 at 100.00 | A+ | $ | 3,396,632 | |
| | 3,000 | | Colorado Health Facilities Authority, Colorado, Revenue Bonds, Catholic Health Initiatives, Series 2011A, 5.000%, 2/01/41 | 2/21 at 100.00 | A+ | | 3,237,210 | |
| | 4,890 | | Colorado Health Facilities Authority, Colorado, Revenue Bonds, Catholic Health Initiatives, Series 2013A, 5.250%, 1/01/45 | 1/23 at 100.00 | A+ | | 5,342,325 | |
| | 1,000 | | Colorado Health Facilities Authority, Colorado, Revenue Bonds, Poudre Valley Health System, Series 2005C, 5.250%, 3/01/40 – AGM Insured | 9/18 at 102.00 | AA | | 1,086,230 | |
| | 11,830 | | Colorado Health Facilities Authority, Colorado, Revenue Bonds, Sisters of Charity of Leavenworth Health Services Corporation, Series 2010A, 5.000%, 1/01/40 | 1/20 at 100.00 | AA– | | 13,013,473 | |
| | 1,500 | | Colorado Health Facilities Authority, Colorado, Revenue Bonds, Valley View Hospital Association, Series 2007, 5.250%, 5/15/42 | 5/17 at 100.00 | A– | | 1,568,730 | |
| | 3,225 | | Denver City and County, Colorado, Airport System Revenue Bonds, Subordinate Lien Series 2013B, 5.000%, 11/15/43 | 11/23 at 100.00 | A | | 3,568,624 | |
| | 11,700 | | E-470 Public Highway Authority, Colorado, Senior Revenue Bonds, Capital Appreciation Series 2010A, 0.000%, 9/01/41 | No Opt. Call | BBB+ | | 3,874,455 | |
| | 6,525 | | E-470 Public Highway Authority, Colorado, Senior Revenue Bonds, Series 1997B, 0.000%, 9/01/26 – NPFG Insured | No Opt. Call | AA– | | 4,605,149 | |
| | 43,000 | | E-470 Public Highway Authority, Colorado, Senior Revenue Bonds, Series 2000B, 0.000%, 9/01/33 – NPFG Insured | No Opt. Call | AA– | | 21,685,759 | |
| | | | E-470 Public Highway Authority, Colorado, Toll Revenue Bonds, Series 2004A: | | | | | |
| | 1,150 | | 0.000%, 9/01/28 – NPFG Insured | No Opt. Call | AA– | | 734,954 | |
| | 7,000 | | 0.000%, 9/01/34 – NPFG Insured | No Opt. Call | AA– | | 3,372,320 | |
| | 1,180 | | Regional Transportation District, Colorado, Certificates of Participation, Series 2010A, 5.375%, 6/01/31 | 6/20 at 100.00 | Aa3 | | 1,346,946 | |
| | | | Regional Transportation District, Colorado, Denver Transit Partners Eagle P3 Project Private Activity Bonds, Series 2010: | | | | | |
| | 6,500 | | 6.500%, 1/15/30 | 7/20 at 100.00 | Baa3 | | 7,547,410 | |
| | 3,750 | | 6.000%, 1/15/41 | 7/20 at 100.00 | Baa3 | | 4,224,563 | |
| | 109,600 | | Total Colorado | | | | 78,604,780 | |
| | | | Connecticut – 0.9% (0.6% of Total Investments) | | | | | |
| | 6,460 | | Connecticut Health and Educational Facilities Authority, Revenue Bonds, Yale University, Series 2007Z-1, 5.000%, 7/01/42 | 7/16 at 100.00 | AAA | | 6,624,213 | |
| | | | District of Columbia – 0.8% (0.5% of Total Investments) | | | | | |
| | 5,925 | | District of Columbia, Certificates of Participation, Series 2006, 5.250%, 1/01/17 (Pre-refunded 1/01/16) – NPFG Insured | 1/16 at 100.00 | A3 (4) | | 5,975,600 | |
| | | | Florida – 4.6% (3.0% of Total Investments) | | | | | |
| | 870 | | Alachua County Health Facilities Authority, Florida, Revenue Bonds, Shands Teaching Hospital and Clinics Inc., Series 1996A, 6.250%, 12/01/16 – NPFG Insured | No Opt. Call | AA– | | 891,411 | |
| | 4,000 | | Broward County, Florida, Professional Sports Facilities Tax and Revenue Bonds, Broward County Civic Arena Project, Refunding Series 2006A, 5.000%, 9/01/28 – AMBAC Insured | No Opt. Call | AA | | 4,132,280 | |
| | 3,795 | | Hillsborough County Aviation Authority, Florida, Revenue Bonds, Tampa International Airport, Subordinate Lien Series 2015B, 5.000%, 10/01/35 | 10/24 at 100.00 | A+ | | 4,240,116 | |
| | 1,000 | | Miami-Dade County, Florida, Aviation Revenue Bonds, Miami International Airport, Refunding Series 2014B, 5.000%, 10/01/37 | 10/24 at 100.00 | A | | 1,125,460 | |
| | 2,500 | | Miami-Dade County, Florida, Aviation Revenue Bonds, Miami International Airport, Series 2010A-1, 5.375%, 10/01/41 | 10/20 at 100.00 | A | | 2,839,075 | |
| | 2,500 | | Miami-Dade County, Florida, Aviation Revenue Bonds, Miami International Airport, Series 2010B, 5.000%, 10/01/30 | 10/20 at 100.00 | A | | 2,747,450 | |
| | 2,900 | | Miami-Dade County, Florida, Transit System Sales Surtax Revenue Bonds, Refunding Series 2012, 5.000%, 7/01/42 – AGM Insured | 7/22 at 100.00 | AA | | 3,209,314 | |
| | Principal | | | Optional Call | | | | |
| | Amount (000) | | Description (1) | Provisions (2) | Ratings (3) | | Value | |
| | | | Florida (continued) | | | | | |
| $ | 7,200 | | Miami-Dade County, Florida, Water and Sewer System Revenue Bonds, Refunding Series 2008B, 5.250%, 10/01/16 – AGM Insured | No Opt. Call | AA | $ | 7,526,952 | |
| | 5,000 | | Orlando, Florida, Contract Tourist Development Tax Payments Revenue Bonds, Series 2014A, 5.000%, 11/01/44 | 5/24 at 100.00 | AA+ | | 5,528,100 | |
| | 2,690 | | Port Saint Lucie. Florida, Special Assessment Revenue Bonds, Southwest Annexation District 1B, Series 2007, 5.000%, 7/01/33 – NPFG Insured | 7/17 at 100.00 | AA– | | 2,852,906 | |
| | 32,455 | | Total Florida | | | | 35,093,064 | |
| | | | Georgia – 3.3% (2.2% of Total Investments) | | | | | |
| | 3,060 | | Atlanta, Georgia, Water and Wastewater Revenue Bonds, Refunding Series 2015, 5.000%, 11/01/31 | 5/25 at 100.00 | AA– | | 3,565,512 | |
| | 4,000 | | Cobb County Kennestone Hospital Authority, Georgia, Revenue Anticipation Certificates, Refunding Series 2012, 5.000%, 4/01/28 | 4/23 at 100.00 | AA– | | 4,588,680 | |
| | 1,250 | | DeKalb County Hospital Authority, Georgia, Anticipation Certificates Revenue Bonds, DeKalb Medical Center, Inc. Project, Series 2010, 6.000%, 9/01/30 | 9/20 at 100.00 | BBB– | | 1,371,238 | |
| | | | Gainesville and Hall County Hospital Authority, Georgia, Revenue Anticipation Certificates, Northeast Georgia Health Services Inc., Series 2010B: | | | | | |
| | 5,000 | | 5.250%, 2/15/37 | 2/20 at 100.00 | AA– | | 5,517,450 | |
| | 4,050 | | 5.125%, 2/15/40 | 2/20 at 100.00 | AA– | | 4,414,419 | |
| | 5,000 | | Medical Center Hospital Authority, Georgia, Revenue Anticipation Certificates, Columbus Regional Healthcare System, Inc. Project, Series 2008, 6.500%, 8/01/38 – AGC Insured | 8/18 at 100.00 | AA | | 5,576,700 | |
| | 22,360 | | Total Georgia | | | | 25,033,999 | |
| | | | Illinois – 16.2% (10.7% of Total Investments) | | | | | |
| | 3,075 | | Board of Trustees of Southern Illinois University, Housing and Auxiliary Facilities System Revenue Bonds, Series 2006A, 5.000%, 4/01/36 (Pre-refunded 4/01/16) – NPFG Insured | 4/16 at 100.00 | AA– (4) | | 3,135,516 | |
| | 1,470 | | Chicago Board of Education, Illinois, General Obligation Bonds, Dedicated Revenues Series 2011A, 5.000%, 12/01/41 | 12/21 at 100.00 | BB+ | | 1,279,076 | |
| | 4,400 | | Chicago Board of Education, Illinois, Unlimited Tax General Obligation Bonds, Dedicated Tax Revenues, Series 1998B-1, 0.000%, 12/01/15 – FGIC Insured | No Opt. Call | AA– | | 4,391,904 | |
| | 1,100 | | Chicago Transit Authority, Illinois, Sales Tax Receipts Revenue Bonds, Series 2011, 5.250%, 12/01/40 | 12/21 at 100.00 | AA | | 1,169,927 | |
| | 2,180 | | Chicago, Illinois, General Airport Revenue Bonds, O'Hare International Airport, Senior Lien Refunding Series 2013B, 5.000%, 1/01/26 | 1/23 at 100.00 | A | | 2,510,902 | |
| | | | Chicago, Illinois, General Obligation Bonds, City Colleges, Series 1999: | | | | | |
| | 32,670 | | 0.000%, 1/01/32 – FGIC Insured | No Opt. Call | AA– | | 13,534,201 | |
| | 12,360 | | 0.000%, 1/01/37 – FGIC Insured | No Opt. Call | AA– | | 3,741,743 | |
| | 7,750 | | Chicago, Illinois, General Obligation Bonds, Series 2004A, 5.000%, 1/01/34 – AGM Insured | 1/16 at 100.00 | AA | | 7,757,905 | |
| | 3,500 | | Cook County Township High School District 225 Northfield, Illinois, General Obligation Bonds, Series 2007B, 0.000%, 12/01/23 | 12/16 at 72.44 | AAA | | 2,505,790 | |
| | 15,000 | | Illinois Finance Authority, Illinois, Northwestern University, Revenue Bonds, Series 2006, 5.000%, 12/01/42 (Pre-refunded 12/01/15) | 12/15 at 100.00 | AAA | | 15,060,900 | |
| | 2,000 | | Illinois Finance Authority, Revenue Bonds, Children–s Memorial Hospital, Series 2008A, 5.250%, 8/15/47 – AGC Insured (UB) | 8/18 at 100.00 | AA | | 2,140,740 | |
| | 1,340 | | Illinois Finance Authority, Revenue Bonds, Edward Health Services Corporation, Series 2008A, 5.500%, 2/01/40 – AMBAC Insured | 2/18 at 100.00 | A | | 1,429,901 | |
| | 2,500 | | Illinois Finance Authority, Revenue Bonds, Elmhurst Memorial Healthcare, Series 2008A, 5.625%, 1/01/37 | 1/18 at 100.00 | Baa2 | | 2,669,900 | |
| | 1,725 | | Illinois Finance Authority, Revenue Bonds, Ingalls Health System, Series 2013, 4.250%, 5/15/43 | 5/22 at 100.00 | Baa1 | | 1,655,948 | |
| | 4,300 | | Illinois Finance Authority, Revenue Bonds, Memorial Health System, Series 2009, 5.500%, 4/01/34 | 4/19 at 100.00 | AA– | | 4,730,559 | |
| | 1,630 | | Illinois Finance Authority, Revenue Bonds, Northwestern Memorial HealthCare, Series 2013, 5.000%, 8/15/37 | 8/22 at 100.00 | AA+ | | 1,792,087 | |
| | 2,500 | | Illinois Finance Authority, Revenue Bonds, Provena Health, Series 2009A, 7.750%, 8/15/34 | 8/19 at 100.00 | BBB+ | | 3,020,225 | |
| NQU | Nuveen Quality Income Municipal Fund, Inc. | |
| | Portfolio of Investments (continued) | October 31, 2015 |
| | Principal | | | Optional Call | | | | |
| | Amount (000) | | Description (1) | Provisions (2) | Ratings (3) | | Value | |
| | | | Illinois (continued) | | | | | |
| $ | 5,000 | | Illinois Finance Authority, Revenue Bonds, Resurrection Health Care System, Series 1999B, 5.000%, 5/15/24 – AGM Insured | 5/18 at 100.00 | AA | $ | 5,389,800 | |
| | 495 | | Illinois Finance Authority, Revenue Bonds, Silver Cross Hospital and Medical Centers, Refunding Series 2015C, 5.000%, 8/15/44 | 8/25 at 100.00 | Baa1 | | 531,635 | |
| | 5,725 | | Illinois Finance Authority, Revenue Bonds, Silver Cross Hospital and Medical Centers, Series 2009, 7.000%, 8/15/44 (Pre-refunded 8/15/19) | 8/19 at 100.00 | N/R (4) | | 7,001,103 | |
| | 4,500 | | Illinois Finance Authority, Revenue Bonds, The University of Chicago Medical Center, Series 2011C, 5.500%, 8/15/41 (UB) (5) | 2/21 at 100.00 | AA– | | 5,009,175 | |
| | 4,075 | | Illinois Finance Authority, Student Housing Revenue Bonds, Educational Advancement Fund Inc., Refunding Series 2007A, 5.250%, 5/01/34 | 5/17 at 100.00 | BBB+ | | 4,164,120 | |
| | 5,000 | | Illinois Toll Highway Authority, Toll Highway Revenue Bonds, Senior Lien Series 2013A, 5.000%, 1/01/35 | 1/23 at 100.00 | AA– | | 5,528,450 | |
| | 2,890 | | Metropolitan Pier and Exposition Authority, Illinois, McCormick Place Expansion Project Bonds, Series 2015A, 0.000%, 12/15/52 | No Opt. Call | BBB+ | | 366,365 | |
| | 2,335 | | Metropolitan Pier and Exposition Authority, Illinois, Revenue Bonds, McCormick Place Expansion Project, Refunding Series 2010B-2, 5.000%, 6/15/50 | 6/20 at 100.00 | BBB+ | | 2,377,287 | |
| | 8,750 | | Metropolitan Pier and Exposition Authority, Illinois, Revenue Bonds, McCormick Place Expansion Project, Series 1994B, 0.000%, 6/15/28 – NPFG Insured | No Opt. Call | AA– | | 5,265,750 | |
| | 762 | | Montgomery, Illinois, Lakewood Creek Project Special Assessment Bonds, Series 2007, 4.700%, 3/01/30 – RAAI Insured | 3/16 at 100.00 | AA | | 764,591 | |
| | 2,600 | | Regional Transportation Authority, Cook, DuPage, Kane, Lake, McHenry and Will Counties, Illinois, General Obligation Bonds, Series 2000A, 6.500%, 7/01/30 – NPFG Insured | No Opt. Call | AA | | 3,444,220 | |
| | | | Will County Community Unit School District 201U, Crete-Monee, Illinois, General Obligation Bonds, Capital Appreciation Series 2004: | | | | | |
| | 4,005 | | 0.000%, 11/01/15 – FGIC Insured | No Opt. Call | AA– | | 4,004,960 | |
| | 3,330 | | 0.000%, 11/01/22 – NPFG Insured | No Opt. Call | AA– | | 2,719,744 | |
| | 6,390 | | Will County School District 122, New Lenox, Illinois, General Obligation Bonds, Capital Appreciation School Series 2004D, 0.000%, 11/01/24 – AGM Insured | No Opt. Call | Aa3 | | 4,800,679 | |
| | 155,357 | | Total Illinois | | | | 123,895,103 | |
| | | | Indiana – 4.3% (2.9% of Total Investments) | | | | | |
| | 2,640 | | Crown Point Multi-School Building Corporation, Indiana, First Mortgage Bonds, Crown Point Community School Corporation, Series 2000, 0.000%, 1/15/24 – NPFG Insured | No Opt. Call | AA+ | | 2,151,547 | |
| | 2,005 | | Decatur Township-Marion County Multi-School Building Corporation, Indiana, First Mortgage Bonds, Series 2006A, 5.000%, 7/15/26
(Pre-refunded 1/15/17) – AGM Insured | 1/17 at 100.00 | AA+ (4) | | 2,115,656 | |
| | 4,080 | | Indiana Finance Authority, Hospital Revenue Bonds, Indiana University Health Obligation Group, Refunding 2015A, 5.000%, 12/01/40 | 6/25 at 100.00 | AA– | | 4,518,559 | |
| | 4,100 | | Indiana Finance Authority, Private Activity Bonds, Ohio River Bridges East End Crossing Project, Series 2013A, 5.000%, 7/01/48 (Alternative Minimum Tax) | 7/23 at 100.00 | BBB | | 4,338,292 | |
| | 2,400 | | Indiana Finance Authority, Tax-Exempt Private Activity Revenue Bonds, I-69 Section 5 Project, Series 2014, 5.000%, 9/01/46 (Alternative Minimum Tax) | 9/24 at 100.00 | BBB | | 2,575,200 | |
| | 2,750 | | Indiana Finance Authority, Wastewater Utility Revenue Bonds, CWA Authority Project, Series 2011B, 5.000%, 10/01/41 | 10/21 at 100.00 | AA– | | 3,008,720 | |
| | 2,250 | | Indiana Health and Educational Facilities Financing Authority, Revenue Bonds, Sisters of Saint Francis Health Services Inc., Series 2006E, 5.250%,
5/15/41 – AGM Insured | 5/18 at 100.00 | Aa3 | | 2,382,345 | |
| | 2,500 | | Indiana Municipal Power Agency, Power Supply Revenue Bonds, Series 2007A, 5.000%, 1/01/42 – NPFG Insured | 1/17 at 100.00 | AA– | | 2,598,325 | |
| | 2,000 | | Indiana Municipal Power Agency, Power Supply System Revenue Refunding Bonds, Series 2006A, 5.000%, 1/01/32 (Pre-refunded 1/01/16) – AMBAC Insured | 1/16 at 100.00 | AA+ (4) | | 2,016,580 | |
| | 10,000 | | Indianapolis Local Public Improvement Bond Bank, Indiana, Series 1999E, 0.000%, 2/01/26 – AMBAC Insured | No Opt. Call | AA | | 7,450,700 | |
| | 34,725 | | Total Indiana | | | | 33,155,924 | |
| | Principal | | | Optional Call | | | | |
| | Amount (000) | | Description (1) | Provisions (2) | Ratings (3) | | Value | |
| | | | Iowa – 3.0% (2.0% of Total Investments) | | | | | |
| $ | 11,570 | | Iowa Finance Authority, Iowa, Midwestern Disaster Area Revenue Bonds, Iowa Fertilizer Company Project, Series 2013, 5.000%, 12/01/19 | No Opt. Call | BB– | $ | 12,313,488 | |
| | | | Iowa Tobacco Settlement Authority, Asset Backed Settlement Revenue Bonds, Series 2005C: | | | | | |
| | 4,000 | | 5.375%, 6/01/38 | 12/15 at 100.00 | B+ | | 3,777,640 | |
| | 7,000 | | 5.625%, 6/01/46 | 12/15 at 100.00 | B+ | | 6,774,600 | |
| | 22,570 | | Total Iowa | | | | 22,865,728 | |
| | | | Kansas – 0.1% (0.1% of Total Investments) | | | | | |
| | 980 | | Wyandotte County-Kansas City Unified Government, Kansas, Sales Tax Special Obligation Capital Appreciation Revenue Bonds Redevelopment Project Area B – Major Multi-Sport Athletic Complex Project, Subordinate Lien Series 2010B, 0.000%, 6/01/21 | No Opt. Call | A– | | 721,231 | |
| | | | Kentucky – 1.0% (0.7% of Total Investments) | | | | | |
| | 6,015 | | Kentucky Economic Development Finance Authority, Hospital Facilities Revenue Bonds, Owensboro Medical Health System, Series 2010B, 6.375%, 3/01/40 | 6/20 at 100.00 | BBB+ | | 6,886,874 | |
| | 1,000 | | Kentucky Economic Development Finance Authority, Louisville Arena Project Revenue Bonds, Louisville Arena Authority, Inc., Series 2008-A1, 6.000%, 12/01/33 – AGC Insured | 6/18 at 100.00 | AA | | 1,091,730 | |
| | 7,015 | | Total Kentucky | | | | 7,978,604 | |
| | | | Louisiana – 3.4% (2.3% of Total Investments) | | | | | |
| | 10,000 | | Louisiana Public Facilities Authority, Hospital Revenue Bonds, Franciscan Missionaries of Our Lady Health System, Series 1998A, 5.750%, 7/01/25 – AGM Insured (UB) | No Opt. Call | AA | | 11,590,400 | |
| | 6,520 | | Louisiana Public Facilities Authority, Revenue Bonds, Ochsner Clinic Foundation Project, Series 2007A, 5.500%, 5/15/47 | 5/17 at 100.00 | Baa1 | | 6,831,460 | |
| | 2,480 | | Louisiana Public Facilities Authority, Revenue Bonds, Ochsner Clinic Foundation Project, Series 2007A, 5.500%, 5/15/47 (Pre-refunded 5/15/17) | 5/17 at 100.00 | N/R (4) | | 2,669,447 | |
| | 5,000 | | Louisiana State, Gasoline and Fuels Tax Revenue Bonds, Series 2006A, 5.000%, 5/01/41 (Pre-refunded 5/01/16) – AGM Insured | 5/16 at 100.00 | Aa1 (4) | | 5,118,650 | |
| | 24,000 | | Total Louisiana | | | | 26,209,957 | |
| | | | Maine – 0.2% (0.1% of Total Investments) | | | | | |
| | 1,050 | | Maine Health and Higher Educational Facilities Authority, Revenue Bonds, Maine General Medical Center, Series 2011, 6.750%, 7/01/41 | 7/21 at 100.00 | BBB– | | 1,190,553 | |
| | | | Maryland – 0.8% (0.5% of Total Investments) | | | | | |
| | 2,500 | | Maryland Health and Higher Educational Facilities Authority, Revenue Bonds, Adventist Healthcare, Series 2011A, 6.000%, 1/01/26 | 1/22 at 100.00 | Baa2 | | 2,877,625 | |
| | 3,000 | | Maryland Health and Higher Educational Facilities Authority, Revenue Bonds, University of Maryland Medical System Issue, Series 2013A, 5.000%, 7/01/43 | 7/22 at 100.00 | A2 | | 3,275,730 | |
| | 5,500 | | Total Maryland | | | | 6,153,355 | |
| | | | Massachusetts – 2.9% (1.9% of Total Investments) | | | | | |
| | 3,125 | | Massachusetts Department of Transportation, Metropolitan Highway System Revenue Bonds, Senior Lien Series 2010B, 5.000%, 1/01/37 | 1/20 at 100.00 | A+ | | 3,488,875 | |
| | 500 | | Massachusetts Health and Educational Facilities Authority, Revenue Bonds, CareGroup Inc., Series 2008E-1 &2, 5.125%, 7/01/38 | 7/18 at 100.00 | A– | | 529,150 | |
| | 7,405 | | Massachusetts Health and Educational Facilities Authority, Revenue Bonds, Massachusetts Institute of Technology, Series 2002K, 5.500%, 7/01/32 (UB) | No Opt. Call | AAA | | 10,011,856 | |
| | 2,300 | | Massachusetts Health and Educational Facilities Authority, Revenue Refunding Bonds, Suffolk University Issue, Series 2009A, 5.750%, 7/01/39 | 7/19 at 100.00 | BBB | | 2,570,342 | |
| | 4,560 | | Massachusetts School Building Authority, Dedicated Sales Tax Revenue Bonds, Senior Series 2013A, 5.000%, 5/15/43 | 5/23 at 100.00 | AA+ | | 5,191,195 | |
| | 425 | | Massachusetts Water Pollution Abatement Trust, Revenue Bonds, MWRA Loan Program, Subordinate Series 1999A, 5.750%, 8/01/29 | 2/16 at 100.00 | AAA | | 426,874 | |
| | 18,315 | | Total Massachusetts | | | | 22,218,292 | |
| NQU | Nuveen Quality Income Municipal Fund, Inc. | |
| | Portfolio of Investments (continued) | October 31, 2015 |
| | Principal | | | Optional Call | | | | |
| | Amount (000) | | Description (1) | Provisions (2) | Ratings (3) | | Value | |
| | | | Michigan – 6.1% (4.0% of Total Investments) | | | | | |
| $ | 3,785 | | Detroit, Michigan, Second Lien Sewerage Disposal System Revenue Bonds, Series 2005A, 5.000%, 7/01/35 – NPFG Insured | 1/16 at 100.00 | AA– | $ | 3,837,082 | |
| | 2,150 | | Detroit, Michigan, Sewage Disposal System Revenue Bonds, Second Lien Series 2006A, 5.500%, 7/01/36 – BHAC Insured | 7/18 at 100.00 | AA+ | | 2,329,977 | |
| | 2,050 | | Detroit, Michigan, Sewer Disposal System Revenue Bonds, Second Lien, Series 2001E, 5.750%, 7/01/31 – BHAC Insured | 7/18 at 100.00 | AA+ | | 2,246,001 | |
| | 3,920 | | Detroit, Michigan, Water Supply System Senior Lien Revenue Refunding Bonds, Series 2003D, 5.000%, 7/01/28 – NPFG Insured | 7/16 at 100.00 | AA– | | 3,970,372 | |
| | 2,000 | | Kalamazoo Hospital Finance Authority, Michigan, Hospital Revenue Refunding Bonds, Bronson Methodist Hospital, Series 2010, 5.250%, 5/15/36 – AGM Insured | 5/20 at 100.00 | A2 | | 2,154,900 | |
| | 2,950 | | Michigan Finance Authority, Revenue Bonds, Trinity Health Credit Group, Refunding Series 2015, 5.000%, 12/01/33 | 6/22 at 100.00 | AA | | 3,313,588 | |
| | 1,300 | | Michigan Finance Authority, Unemployment Obligation Assessment Revenue Bonds, Series 2012A, 5.000%, 7/01/16 | No Opt. Call | AAA | | 1,342,263 | |
| | 2,500 | | Michigan Finance Authority, Unemployment Obligation Assessment Revenue Bonds, Series 2012B, 5.000%, 7/01/22 | 7/16 at 100.00 | AAA | | 2,579,475 | |
| | 9,375 | | Michigan State Building Authority, Revenue Refunding Bonds, Facilities Program, Refunding Series 2015-I, 5.000%, 4/15/29 | 10/25 at 100.00 | Aa2 | | 10,943,531 | |
| | 5,500 | | Michigan State Hospital Finance Authority, Hospital Revenue Bonds, Henry Ford Health System, Refunding Series 2009, 5.625%, 11/15/29 | 11/19 at 100.00 | A– | | 6,300,305 | |
| | 3,050 | | Michigan Tobacco Settlement Finance Authority, Tobacco Settlement Asset-Backed Revenue Bonds, Series 2008A, 6.875%, 6/01/42 | 6/18 at 100.00 | BB– | | 3,051,952 | |
| | 1,150 | | Royal Oak Hospital Finance Authority, Michigan, Hospital Revenue Bonds, William Beaumont Hospital, Refunding Series 2009V, 8.250%, 9/01/39 (Pre-refunded 9/01/18) | 9/18 at 100.00 | Aaa | | 1,386,544 | |
| | 1,950 | | Wayne County Airport Authority, Michigan, Revenue Bonds, Detroit Metropolitan Wayne County Airport, Series 2005, 5.000%, 12/01/34 (Pre-refunded 12/01/15) – NPFG Insured | 12/15 at 100.00 | AA– (4) | | 1,957,878 | |
| | 950 | | Wayne County Airport Authority, Michigan, Revenue Bonds, Detroit Metropolitan Wayne County Airport, Series 2015D, 5.000%, 12/01/40 | 12/25 at 100.00 | A | | 1,038,084 | |
| | 42,630 | | Total Michigan | | | | 46,451,952 | |
| | | | Minnesota – 1.2% (0.8% of Total Investments) | | | | | |
| | 3,655 | | Dakota and Washington Counties Housing and Redevelopment Authority, Minnesota, GNMA Mortgage-Backed Securities Program Single Family Residential Mortgage Revenue Bonds, Series 1988, 8.450%, 9/01/19 (Alternative Minimum Tax) (ETM) | No Opt. Call | Aaa | | 4,549,013 | |
| | 4,250 | | Maple Grove, Minnesota, Health Care Facilities Revenue Bonds, Maple Grove Hospital Corporation, Series 2007, 5.250%, 5/01/37 | 5/17 at 100.00 | Baa1 | | 4,419,405 | |
| | 7,905 | | Total Minnesota | | | | 8,968,418 | |
| | | | Missouri – 3.9% (2.6% of Total Investments) | | | | | |
| | 890 | | Bi-State Development Agency of the Missouri-Illinois Metropolitan District, Mass Transit Sales Tax Appropriation Bonds, Refunding Combined Lien Series 2013A, 5.000%, 10/01/28 | 10/18 at 100.00 | AA+ | | 985,283 | |
| | 15,000 | | Kansas City Municipal Assistance Corporation, Missouri, Leasehold Revenue Bonds, Series 2004B-1, 0.000%, 4/15/28 – AMBAC Insured | No Opt. Call | AA– | | 9,636,300 | |
| | 8,315 | | Missouri Health and Educational Facilities Authority, Health Facilities Revenue Bonds, CoxHealth, Series 2013A, 5.000%, 11/15/48 | 11/23 at 100.00 | A2 | | 9,063,849 | |
| | 2,370 | | Saint Louis, Missouri, Parking Revenue Bonds, Series 2006A, 4.500%, 12/15/24 – NPFG Insured | 12/16 at 100.00 | AA– | | 2,463,212 | |
| | 15,350 | | Springfield Public Building Corporation, Missouri, Lease Revenue Bonds, Jordan Valley Park Projects, Series 2000A, 0.000%, 6/01/30 – AMBAC Insured | No Opt. Call | N/R | | 8,060,746 | |
| | 41,925 | | Total Missouri | | | | 30,209,390 | |
| | | | Nebraska – 0.1% (0.1% of Total Investments) | | | | | |
| | 1,090 | | Douglas County Hospital Authority 3, Nebraska, Health Facilities Revenue Bonds, Nebraska Methodist Health System, Refunding Series 2015, 4.125%, 11/01/36 | 11/25 at 100.00 | A– | | 1,093,989 | |
| | Principal | | | Optional Call | | | | |
| | Amount (000) | | Description (1) | Provisions (2) | Ratings (3) | | Value | |
| | | | Nevada – 4.0% (2.6% of Total Investments) | | | | | |
| $ | 4,500 | | Clark County, Nevada, Motor Vehicle Fuel Tax Highway Revenue Bonds, Improvement & Refunding Series 2010B, 5.000%, 7/01/28 | 7/19 at 100.00 | AA– | $ | 5,091,120 | |
| | 14,515 | | Clark County, Nevada, Passenger Facility Charge Revenue Bonds, Las Vegas-McCarran International Airport, Series 2010A, 5.250%, 7/01/42 | 1/20 at 100.00 | A+ | | 16,256,799 | |
| | 2,125 | | Las Vegas Valley Water District, Nevada, General Obligation Bonds, Water Series 2012B, 5.000%, 6/01/42 | 6/22 at 100.00 | AA+ | | 2,358,453 | |
| | 2,280 | | North Las Vegas, Nevada, General Obligation Bonds, Wastewater Reclamation System Series 2006, 5.000%, 10/01/25 – NPFG Insured | 10/16 at 100.00 | AA– | | 2,302,663 | |
| | 2,500 | | Reno, Nevada, Health Facility Revenue Bonds, Catholic Healthcare West, Trust 2634, 18.924%, 7/01/31 – BHAC Insured (IF) (5) | 7/17 at 100.00 | AA+ | | 3,012,100 | |
| | 1,100 | | Washoe County, Nevada, Highway Revenue, Motor Vehicle Fuel Tax Bonds, Series 2013, 5.000%, 2/01/38 | 2/19 at 100.00 | A+ | | 1,206,205 | |
| | 27,020 | | Total Nevada | | | | 30,227,340 | |
| | | | New Hampshire – 0.7% (0.5% of Total Investments) | | | | | |
| | 5,000 | | New Hampshire Business Finance Authority, Revenue Bonds, Elliot Hospital Obligated Group Issue, Series 2009A, 6.125%, 10/01/39 | 10/19 at 100.00 | Baa1 | | 5,523,900 | |
| | | | New Jersey – 3.8% (2.5% of Total Investments) | | | | | |
| | 1,965 | | New Jersey Economic Development Authority, Private Activity Bonds, The Goethals Bridge Replacement Project, Series 2013, 5.000%, 1/01/31 – AGM Insured (Alternative Minimum Tax) | 1/24 at 100.00 | AA | | 2,171,305 | |
| | 6,835 | | New Jersey Economic Development Authority, School Facilities Construction Bonds, Series 2005N-1, 5.500%, 9/01/24 – AMBAC Insured | No Opt. Call | A– | | 7,656,157 | |
| | 600 | | New Jersey Health Care Facilities Financing Authority, New Jersey, Revenue Bonds, Saint Peters University Hospital, Refunding Series 2011, 6.000%, 7/01/26 | 7/21 at 100.00 | BB+ | | 653,946 | |
| | 1,500 | | New Jersey Health Care Facilities Financing Authority, New Jersey, Revenue Bonds, Saint Peters University Hospital, Series 2007, 5.750%, 7/01/37 | 7/18 at 100.00 | BB+ | | 1,552,860 | |
| | 10,000 | | New Jersey Health Care Facilities Financing Authority, Revenue Bonds, Saint Barnabas Health Care System, Refunding Series 2006B, 0.000%, 7/01/36 | 1/17 at 37.38 | A– | | 3,551,400 | |
| | 20,000 | | New Jersey Transportation Trust Fund Authority, Transportation System Bonds, Series 2006C, 0.000%, 12/15/33 – AGM Insured | No Opt. Call | AA | | 8,259,000 | |
| | 1,135 | | Rutgers State University, New Jersey, Revenue Bonds, Refunding Series 2013L, 5.000%, 5/01/43 | 5/23 at 100.00 | Aa3 | | 1,265,502 | |
| | 5,000 | | Tobacco Settlement Financing Corporation, New Jersey, Tobacco Settlement Asset-Backed Bonds, Series 2007-1A, 4.750%, 6/01/34 | 6/17 at 100.00 | B– | | 4,054,300 | |
| | 47,035 | | Total New Jersey | | | | 29,164,470 | |
| | | | New York – 8.0% (5.3% of Total Investments) | | | | | |
| | 2,250 | | Dormitory Authority of the State of New York, Insured Revenue Bonds, Mount Sinai School of Medicine, Series 1994A, 5.150%, 7/01/24 – NPFG Insured | No Opt. Call | AA– | | 2,602,013 | |
| | 5,005 | | Dormitory Authority of the State of New York, Revenue Bonds, Non State Supported Debt, Vassar College, Series 2007, 5.000%, 7/01/46 | 7/17 at 100.00 | AA– | | 5,316,661 | |
| | 4,750 | | Dormitory Authority of the State of New York, State Personal Income Tax Revenue Bonds, General Purpose Series 2012B, 5.000%, 3/15/16 | No Opt. Call | AAA | | 4,837,970 | |
| | 2,400 | | Hudson Yards Infrastructure Corporation, New York, Revenue Bonds, Senior Fiscal 2012 Series 2011A, 5.250%, 2/15/47 | 2/21 at 100.00 | A | | 2,626,128 | |
| | | | Hudson Yards Infrastructure Corporation, New York, Revenue Bonds, Series 2006A: | | | | | |
| | 2,185 | | 5.000%, 2/15/47 – FGIC Insured | 2/17 at 100.00 | A | | 2,278,911 | |
| | 2,845 | | 4.500%, 2/15/47 – NPFG Insured | 2/17 at 100.00 | AA– | | 2,949,184 | |
| | 13,600 | | Metropolitan Transportation Authority, New York, Transportation Revenue Bonds, Series 2006B 4.500%, 11/15/32 – AGM Insured (UB) | 11/16 at 100.00 | AA | | 13,814,472 | |
| | 240 | | New York City Industrial Development Agency, New York, American Airlines-JFK International Airport Special Facility Revenue Bonds, Series 2005, 7.500%, 8/01/16 (Alternative Minimum Tax) | No Opt. Call | N/R | | 247,015 | |
| NQU | Nuveen Quality Income Municipal Fund, Inc. | |
| | Portfolio of Investments (continued) | October 31, 2015 |
| | Principal | | | Optional Call | | | | |
| | Amount (000) | | Description (1) | Provisions (2) | Ratings (3) | | Value | |
| | | | New York (continued) | | | | | |
| | | | New York City, New York, General Obligation Bonds, Fiscal Series 2002G: | | | | | |
| $ | 10 | | 5.000%, 8/01/17 | 2/16 at 100.00 | AA | $ | 10,042 | |
| | 75 | | 5.750%, 8/01/18 | 2/16 at 100.00 | AA | | 75,353 | |
| | 7,000 | | New York State Tobacco Settlement Financing Corporation, Tobacco Settlement Asset-Backed and State Contingency Contract-Backed Bonds, Series 2011B, 5.000%, 6/01/18 | No Opt. Call | AA | | 7,748,440 | |
| | | | Port Authority of New York and New Jersey, Special Project Bonds, JFK International Air Terminal LLC Project, Eighth Series 2010: | | | | | |
| | 8,550 | | 5.500%, 12/01/31 | 12/20 at 100.00 | BBB | | 9,763,331 | |
| | 3,155 | | 6.000%, 12/01/36 | 12/20 at 100.00 | BBB | | 3,665,321 | |
| | 2,470 | | Port Authority of New York and New Jersey, Special Project Bonds, JFK International Air Terminal LLC, Sixth Series 1997, 6.250%, 12/01/15 – NPFG Insured (Alternative Minimum Tax) | No Opt. Call | AA– | | 2,481,733 | |
| | 2,500 | | Triborough Bridge and Tunnel Authority, New York, General Purpose Revenue Bonds, Refunding Series 2015A, 5.000%, 11/15/50 | 5/25 at 100.00 | AA– | | 2,792,250 | |
| | 57,035 | | Total New York | | | | 61,208,824 | |
| | | | North Carolina – 1.9% (1.2% of Total Investments) | | | | | |
| | 3,000 | | Charlotte-Mecklenburg Hospital Authority, North Carolina, Health Care Revenue Bonds, DBA Carolinas HealthCare System, Series 2008A, 5.000%, 1/15/47 | 1/18 at 100.00 | AA– | | 3,136,140 | |
| | 5,000 | | North Carolina Medical Care Commission, Health Care Facilities Revenue Refunding Bonds, WakeMed, Series 2012A, 5.000%, 10/01/27 | 10/22 at 100.00 | AA– | | 5,640,550 | |
| | | | North Carolina Medical Care Commission, Health System Revenue Bonds, Mission St. Joseph's Health System, Series 2007: | | | | | |
| | 1,495 | | 4.500%, 10/01/31 (Pre-refunded 10/01/17) (UB) | 10/17 at 100.00 | N/R (4) | | 1,607,588 | |
| | 2,505 | | 4.500%, 10/01/31 (UB) | 10/17 at 100.00 | AA– | | 2,552,445 | |
| | 1,255 | | North Carolina Medical Care Commission, Healthcare Facilities Revenue Bonds, Duke University Health System, Series 2009A, 5.000%, 6/01/39 | 6/19 at 100.00 | AA | | 1,396,978 | |
| | 13,255 | | Total North Carolina | | | | 14,333,701 | |
| | | | North Dakota – 1.4% (1.0% of Total Investments) | | | | | |
| | | | Grand Forks, North Dakota, Health Care System Revenue Bonds, Altru Health System Obligated Group, Series 2012: | | | | | |
| | 7,000 | | 5.000%, 12/01/29 | 12/21 at 100.00 | A– | | 7,693,630 | |
| | 3,000 | | 5.000%, 12/01/32 | 12/21 at 100.00 | A– | | 3,245,520 | |
| | 10,000 | | Total North Dakota | | | | 10,939,150 | |
| | | | Ohio – 7.0% (4.6% of Total Investments) | | | | | |
| | 9,405 | | American Municipal Power Ohio Inc., Prairie State Energy Campus Project Revenue Bonds, Series 2008A, 5.250%, 2/15/43 (Pre-refunded 2/15/18) | 2/18 at 100.00 | N/R (4) | | 10,373,809 | |
| | 595 | | American Municipal Power Ohio Inc., Prairie State Energy Campus Project Revenue Bonds, Series 2008A, 5.250%, 2/15/43 | 2/18 at 100.00 | A1 | | 640,922 | |
| | | | Buckeye Tobacco Settlement Financing Authority, Ohio, Tobacco Settlement Asset-Backed Revenue Bonds, Senior Lien, Series 2007A-2: | | | | | |
| | 1,055 | | 5.125%, 6/01/24 | 6/17 at 100.00 | B– | | 947,580 | |
| | 2,925 | | 5.875%, 6/01/30 | 6/17 at 100.00 | B– | | 2,615,477 | |
| | 5,040 | | 5.750%, 6/01/34 | 6/17 at 100.00 | B– | | 4,418,165 | |
| | 2,715 | | 6.000%, 6/01/42 | 6/17 at 100.00 | B | | 2,377,444 | |
| | 5,950 | | 5.875%, 6/01/47 | 6/17 at 100.00 | B | | 5,143,002 | |
| | 10,000 | | Buckeye Tobacco Settlement Financing Authority, Ohio, Tobacco Settlement Asset-Backed Revenue Bonds, Senior Lien, Series 2007A-3, 6.250%, 6/01/37 | 6/22 at 100.00 | B– | | 9,151,800 | |
| | 10,000 | | Columbus City School District, Franklin County, Ohio, General Obligation Bonds, Series 2006, 4.250%, 12/01/32 – AGM Insured | 12/16 at 100.00 | AA+ | | 10,285,700 | |
| | 2,885 | | Lucas County, Ohio, Hospital Revenue Bonds, ProMedica Healthcare Obligated Group, Series 2011A, 6.000%, 11/15/41 | 11/21 at 100.00 | AA | | 3,447,921 | |
| | Principal | | | Optional Call | | | | |
| | Amount (000) | | Description (1) | Provisions (2) | Ratings (3) | | Value | |
| | | | Ohio (continued) | | | | | |
| $ | 3,685 | | Ohio Turnpike Commission, Turnpike Revenue Bonds, Infrastructure Project, Junior Lien Series 2013A-1, 5.000%, 2/15/48 | 2/23 at 100.00 | A+ | $ | 4,004,232 | |
| | 54,255 | | Total Ohio | | | | 53,406,052 | |
| | | | Oklahoma – 2.1% (1.4% of Total Investments) | | | | | |
| | 1,400 | | Fort Sill Apache Tribe of Oklahoma Economic Development Authority, Gaming Enterprise Revenue Bonds, Fort Sill Apache Casino, Series 2011A, 8.500%, 8/25/26 | 8/21 at 100.00 | N/R | | 1,649,718 | |
| | 3,500 | | Grand River Dam Authority, Oklahoma, Revenue Bonds, Series 2010A, 5.250%, 6/01/40 | 6/20 at 100.00 | A+ | | 3,992,870 | |
| | 1,675 | | Oklahoma Development Finance Authority, Health System Revenue Bonds, Integris Baptist Medical Center, Series 2008B, 5.250%, 8/15/38 (Pre-refunded 8/15/18) | 8/18 at 100.00 | AA– (4) | | 1,879,752 | |
| | 5,840 | | Oklahoma Development Finance Authority, Revenue Bonds, Saint John Health System, Series 2007, 5.000%, 2/15/42 | 2/17 at 100.00 | AA | | 6,068,986 | |
| | 200 | | Oklahoma Development Finance Authority, Revenue Bonds, Saint John Health System, Series 2007, 5.000%, 2/15/42 (Pre-refunded 2/15/17) | 2/17 at 100.00 | N/R (4) | | 211,732 | |
| | 2,000 | | Oklahoma Municipal Power Authority, Power Supply System Revenue Bonds, Series 2007, 4.500%, 1/01/47 – FGIC Insured | 1/17 at 100.00 | AA– | | 2,016,520 | |
| | 14,615 | | Total Oklahoma | | | | 15,819,578 | |
| | | | Pennsylvania – 2.5% (1.7% of Total Investments) | | | | | |
| | 2,000 | | Allegheny County Hospital Development Authority, Pennsylvania, Revenue Bonds, University of Pittsburgh Medical Center, Series 2009A, 5.625%, 8/15/39 | 8/19 at 100.00 | Aa3 | | 2,231,580 | |
| | 7,970 | | Montgomery County Industrial Development Authority, Pennsylvania, FHA Insured Mortgage Revenue Bonds, New Regional Medical Center Project, Series 2010, 5.250%, 8/01/33 (Pre-refunded 8/01/20) | 8/20 at 100.00 | AA (4) | | 9,373,278 | |
| | 1,500 | | Pennsylvania Housing Finance Agency, Single Family Mortgage Revenue Bonds, Series 2006-96A, 4.650%, 10/01/31 (Alternative Minimum Tax) (UB) | 10/16 at 100.00 | AA+ | | 1,512,255 | |
| | 5,000 | | Pennsylvania Turnpike Commission, Turnpike Revenue Bonds, Subordinate Series 2009C, 0.000%, 6/01/33 – AGM Insured | 6/26 at 100.00 | AA | | 6,000,550 | |
| | 16,470 | | Total Pennsylvania | | | | 19,117,663 | |
| | | | Puerto Rico – 1.5% (1.0% of Total Investments) | | | | | |
| | 590 | | Puerto Rico Highway and Transportation Authority, Highway Revenue Bonds, Series 2004J, 5.000%, 7/01/29 – NPFG Insured | 1/16 at 100.00 | AA– | | 547,662 | |
| | | | Puerto Rico Sales Tax Financing Corporation, Sales Tax Revenue Bonds, Series 2007A: | | | | | |
| | 50,000 | | 0.000%, 8/01/47 – AMBAC Insured | No Opt. Call | Caa3 | | 5,430,500 | |
| | 86,250 | | 0.000%, 8/01/54 – AMBAC Insured | No Opt. Call | Caa3 | | 5,785,650 | |
| | 136,840 | | Total Puerto Rico | | | | 11,763,812 | |
| | | | South Carolina – 3.0% (2.0% of Total Investments) | | | | | |
| | 2,850 | | Columbia, South Carolina, Waterworks and Sewer System Revenue Bonds, Series 2011A, 5.000%, 2/01/41 | 2/21 at 100.00 | Aa1 | | 3,220,016 | |
| | 7,600 | | Piedmont Municipal Power Agency, South Carolina, Electric Revenue Bonds, Series 2004A-2, 0.000%, 1/01/31 – AMBAC Insured | No Opt. Call | A– | | 4,109,244 | |
| | 5,000 | | South Carolina Public Service Authority, Revenue Bonds, Santee Cooper Electric System, Series 2005B, 5.000%, 1/01/22 (Pre-refunded 1/01/16) – NPFG Insured | 1/16 at 100.00 | AA– (4) | | 5,039,700 | |
| | 6,000 | | South Carolina Public Service Authority, Santee Cooper Revenue Obligations, Refunding & Improvement Series 2015A, 5.000%, 12/01/55 | 6/25 at 100.00 | AA– | | 6,498,480 | |
| | 3,800 | | South Carolina Transportation Infrastructure Bank, Revenue Bonds, Series 2010A, 5.250%, 10/01/40 | 10/19 at 100.00 | A1 | | 4,247,678 | |
| | 25,250 | | Total South Carolina | | | | 23,115,118 | |
| | | | South Dakota – 0.1% (0.1% of Total Investments) | | | | | |
| | 910 | | South Dakota Health and Educational Facilities Authority, Revenue Bonds, Sanford Health, Series 2015, 5.000%, 11/01/45 | 11/25 at 100.00 | A+ | | 1,005,350 | |
| NQU | Nuveen Quality Income Municipal Fund, Inc. | |
| | Portfolio of Investments (continued) | October 31, 2015 |
| | Principal | | | Optional Call | | | | |
| | Amount (000) | | Description (1) | Provisions (2) | Ratings (3) | | Value | |
| | | | Tennessee – 0.3% (0.2% of Total Investments) | | | | | |
| $ | 2,350 | | Chattanooga-Hamilton County Hospital Authority, Tennessee, Hospital Revenue Bonds, Erlanger Health System, Refunding Series 2014A, 5.000%, 10/01/39 | 10/24 at 100.00 | BBB+ | $ | 2,503,878 | |
| | | | Texas – 16.0% (10.6% of Total Investments) | | | | | |
| | 5,560 | | Beaumont Independent School District, Jefferson County, Texas, General Obligation Bonds, Series 2008, 5.000%, 2/15/38 | 2/17 at 100.00 | AAA | | 5,826,769 | |
| | 1,500 | | Central Texas Regional Mobility Authority, Revenue Bonds, Senior Lien Series 2011, 5.750%, 1/01/31 | 1/21 at 100.00 | BBB+ | | 1,708,425 | |
| | 2,770 | | Dallas-Fort Worth International Airport, Texas, Joint Revenue Bonds, Improvement Series 2012D, 5.000%, 11/01/38 (Alternative Minimum Tax) | No Opt. Call | A+ | | 2,973,041 | |
| | 20,000 | | Grand Parkway Transportation Corporation, Texas, System Toll Revenue Bonds, Subordinate Lien Series 2013B, 5.250%, 10/01/51 | 10/23 at 100.00 | AA+ | | 22,391,797 | |
| | 2,320 | | Harris County Cultural Education Facilities Finance Corporation, Texas, Revenue Bonds, Houston Methodist Hospital System, Series 2015, 5.000%, 12/01/45 | 6/25 at 100.00 | AA | | 2,587,264 | |
| | 6,000 | | Harris County-Houston Sports Authority, Texas, Revenue Bonds, Capital Appreciation Refunding Senior Lien Series 2014A, 0.000%, 11/15/48 | 11/31 at 44.13 | AA | | 1,263,840 | |
| | 1,500 | | Harris County-Houston Sports Authority, Texas, Revenue Bonds, Refunding Senior Lien Series 2014A, 5.000%, 11/15/28 | 11/24 at 100.00 | A2 | | 1,721,940 | |
| | 15,995 | | Harris County-Houston Sports Authority, Texas, Revenue Bonds, Third Lien Series 2004A-3, 0.000%, 11/15/34 – NPFG Insured | 11/24 at 55.69 | AA– | | 5,891,438 | |
| | 4,200 | | Houston, Texas, Airport System Revenue Bonds, Refunding Subordinate Lien Series 2007B, 5.000%, 7/01/25 – NPFG Insured | 7/17 at 100.00 | AA– | | 4,466,112 | |
| | | | Houston, Texas, Hotel Occupancy Tax and Special Revenue Bonds, Convention and Entertainment Project, Series 2001B: | | | | | |
| | 4,130 | | 0.000%, 9/01/26 – AMBAC Insured | No Opt. Call | AA | | 2,859,447 | |
| | 4,865 | | 0.000%, 9/01/27 – AGM Insured | No Opt. Call | AA | | 3,188,521 | |
| | 4,715 | | Houston, Texas, Hotel Occupancy Tax and Special Revenue Bonds, Refunding Series 2015, 5.000%, 9/01/40 | 9/24 at 100.00 | A2 | | 5,184,378 | |
| | 3,275 | | Leander Independent School District, Williamson and Travis Counties, Texas, General Obligation Bonds, Refunding Series 2015A, 5.000%, 8/15/38 | 8/25 at 100.00 | AAA | | 3,778,957 | |
| | 4,000 | | Midway Independent School District, McLennan County, Texas, Unlimited Tax School Building and Refunding Bonds, Series 2000, 0.000%, 8/15/16 | No Opt. Call | Aaa | | 3,992,040 | |
| | 3,000 | | North Texas Tollway Authority, Special Projects System Revenue Bonds, Series 2011A, 5.500%, 9/01/41 (UB) (5) | 9/21 at 100.00 | AA+ | | 3,525,240 | �� |
| | 6,155 | | North Texas Tollway Authority, System Revenue Bonds, Refunding First Tier, Series 2015B, 5.000%, 1/01/40 | 1/23 at 100.00 | A1 | | 6,723,414 | |
| | 4,900 | | North Texas Tollway Authority, System Revenue Bonds, Refunding Second Tier, Series 2015A, 5.000%, 1/01/32 | 1/25 at 100.00 | A2 | | 5,533,570 | |
| | 3,555 | | San Antonio, Texas, Electric and Gas System Revenue Bonds, Refunding Series 1992, 5.000%, 2/01/17 (ETM) | No Opt. Call | AA+ (4) | | 3,646,897 | |
| | 4,375 | | Tarrant County Cultural & Educational Facilities Financing Corporation, Texas, Revenue Bonds, Texas Health Resources Tender Option Bond Trust 1197, 9.221%, 5/15/39 (IF) (5) | 11/17 at 100.00 | AA | | 4,851,613 | |
| | 2,675 | | Tarrant County Cultural Education Facilities Finance Corporation, Texas, Hospital Revenue Bonds, Scott & White Healthcare Project, Series 2010, 5.500%, 8/15/45 | 8/20 at 100.00 | AA– | | 3,082,162 | |
| | 215 | | Tarrant County Cultural Education Facilities Finance Corporation, Texas, Hospital Revenue Bonds, Scott & White Healthcare Project, Series 2010, 5.500%, 8/15/45 (Pre-refunded 8/15/20) | 8/20 at 100.00 | N/R (4) | | 256,237 | |
| | Principal | | | Optional Call | | | | |
| | Amount (000) | | Description (1) | Provisions (2) | Ratings (3) | | Value | |
| | | | Texas (continued) | | | | | |
| $ | 3,565 | | Texas A&M University, Permanent University Fund Bonds, Refunding Series 2006, 5.000%, 7/01/36 (Pre-refunded 7/01/16) | 7/16 at 100.00 | AAA | $ | 3,678,296 | |
| | | | Texas Municipal Gas Acquisition and Supply Corporation III, Gas Supply Revenue Bonds, Series 2012: | | | | | |
| | 3,635 | | 5.000%, 12/15/22 | No Opt. Call | A3 | | 4,284,356 | |
| | 2,500 | | 5.000%, 12/15/26 | No Opt. Call | A3 | | 2,815,100 | |
| | 1,820 | | 5.000%, 12/15/32 | No Opt. Call | A3 | | 1,995,575 | |
| | 3,150 | | Texas Transportation Commission, Central Texas Turnpike System Revenue Bonds, First Tier Refunding Series 2012A, 5.000%, 8/15/41 | 8/22 at 100.00 | A– | | 3,427,295 | |
| | 5,000 | | Texas Transportation Commission, Central Texas Turnpike System Revenue Bonds, Second Tier Refunding Series 2015C, 5.000%, 8/15/37 | 8/24 at 100.00 | BBB+ | | 5,436,800 | |
| | 4,400 | | Texas Turnpike Authority, Central Texas Turnpike System Revenue Bonds, First Tier Series 2002A, 0.000%, 8/15/25 – AMBAC Insured | No Opt. Call | A– | | 3,249,092 | |
| | 1,670 | | Wood County Central Hospital District, Texas, Revenue Bonds, East Texas Medical Center Quitman Project, Series 2011, 6.000%, 11/01/41 | 11/21 at 100.00 | Baa3 | | 1,833,142 | |
| | 131,445 | | Total Texas | | | | 122,172,758 | |
| | | | Utah – 0.2% (0.2% of Total Investments) | | | | | |
| | 1,840 | | West Valley City Municipal Building Authority, Salt Lake County, Utah, Lease Revenue Bonds, Series 2006A., 4.500%, 8/01/24 – FGIC Insured | 8/16 at 100.00 | AA– | | 1,894,022 | |
| | | | Virginia – 4.2% (2.8% of Total Investments) | | | | | |
| | 10,000 | | Metropolitan Washington Airports Authority, Virginia, Dulles Toll Road Revenue Bonds, Dulles Metrorail Capital Appreciation, Second Senior Lien Series 2010B, 0.000%, 10/01/44 | 10/28 at 100.00 | BBB+ | | 10,732,600 | |
| | 11,000 | | Metropolitan Washington Airports Authority, Virginia, Dulles Toll Road Second Senior Lien Revenue Bonds, Series 2009C, 0.000%, 10/01/41 – AGC Insured | 10/26 at 100.00 | AA | | 13,234,760 | |
| | 2,310 | | Northern Virginia Transportation Authority, Virginia, Special Tax Revenue Bonds, Series 2014, 4.000%, 6/01/16 | No Opt. Call | AA+ | | 2,361,998 | |
| | | | Virginia Small Business Financing Authority, Senior Lien Revenue Bonds, Elizabeth River Crossing, Opco LLC Project, Series 2012: | | | | | |
| | 820 | | 6.000%, 1/01/37 (Alternative Minimum Tax) | 7/22 at 100.00 | BBB– | | 932,078 | |
| | 4,310 | | 5.500%, 1/01/42 (Alternative Minimum Tax) | 7/22 at 100.00 | BBB– | | 4,703,374 | |
| | 28,440 | | Total Virginia | | | | 31,964,810 | |
| | | | Washington – 2.1% (1.4% of Total Investments) | | | | | |
| | 2,765 | | Energy Northwest, Washington, Electric Revenue Bonds, Nuclear Project 3, Refunding Series 2010A, 5.000%, 7/01/16 | No Opt. Call | Aa1 | | 2,854,116 | |
| | 3,750 | | FYI Properties, Washington, Lease Revenue Bonds, Washington State Department of Information Services Project, Series 2009, 5.500%, 6/01/39 (UB) (5) | 6/19 at 100.00 | AA | | 4,214,100 | |
| | 3,780 | | Washington Health Care Facilities Authority, Revenue Bonds, Fred Hutchinson Cancer Research Center, Series 2011A, 5.625%, 1/01/35 | 1/21 at 100.00 | A | | 4,197,199 | |
| | 5,000 | | Washington State Health Care Facilities Authority, Revenue Bonds, Providence Health Care Services, Series 2006A, 4.625%, 10/01/34 – NPFG Insured (UB) (5) | 10/16 at 100.00 | AA | | 5,055,550 | |
| | 15,295 | | Total Washington | | | | 16,320,965 | |
| | | | West Virginia – 0.3% (0.2% of Total Investments) | | | | | |
| | 2,000 | | West Virginia Hospital Finance Authority, Hospital Revenue Bonds, West Virginia United Health System Obligated Group, Refunding and Improvement Series 2013A, 5.500%, 6/01/44 | 6/23 at 100.00 | A | | 2,260,860 | |
| NQU | Nuveen Quality Income Municipal Fund, Inc. | |
| | Portfolio of Investments (continued) | October 31, 2015 |
| | Principal | | | Optional Call | | | | |
| | Amount (000) | | Description (1) | Provisions (2) | Ratings (3) | | Value | |
| | | | Wisconsin – 1.3% (0.9% of Total Investments) | | | | | |
| $ | 2,500 | | Wisconsin Health and Educational Facilities Authority, Revenue Bonds, Aurora Health Care, Inc., Series 2013A, 5.125%, 4/15/31 | 4/23 at 100.00 | A2 | $ | 2,772,400 | |
| | 3,670 | | Wisconsin Health and Educational Facilities Authority, Revenue Bonds, Gundersen Lutheran, Series 2011A, 5.250%, 10/15/39 | 10/21 at 100.00 | A+ | | 4,113,189 | |
| | 1,485 | | Wisconsin Health and Educational Facilities Authority, Revenue Bonds, Marshfield Clinic, Series 2012B, 5.000%, 2/15/40 | 2/22 at 100.00 | A– | | 1,611,047 | |
| | 1,500 | | Wisconsin Health and Educational Facilities Authority, Revenue Bonds, Mercy Alliance, Inc., Series 2012, 5.000%, 6/01/39 | 6/22 at 100.00 | A2 | | 1,615,275 | |
| | 9,155 | | Total Wisconsin | | | | 10,111,911 | |
| | | | Wyoming – 0.9% (0.6% of Total Investments) | | | | | |
| | 2,035 | | Campbell County, Wyoming Solid Waste Facilities Revenue Bonds, Basin Electric Power Cooperative – Dry Fork Station Facilities, Series 2009A, 5.750%, 7/15/39 | 7/19 at 100.00 | A1 | | 2,309,481 | |
| | 4,000 | | Wyoming Municipal Power Agency Power Supply System Revenue Bonds, 2008 Series A, 5.375%, 1/01/42 | 1/18 at 100.00 | A2 | | 4,314,360 | |
| | 6,035 | | Total Wyoming | | | | 6,623,841 | |
| $ | 1,381,387 | | Total Municipal Bonds (cost $1,049,028,482) | | | | 1,150,273,200 | |
| | Principal | | | | | | | | |
| | Amount (000) | | Description (1) | Coupon | Maturity | Ratings (3) | | Value | |
| | | | CORPORATE BONDS – 0.0% (0.0% of Total Investments) | | | | | | |
| | | | Transportation – 0.0% (0.0% of Total Investments) | | | | | | |
| $ | 72 | | Las Vegas Monorail Company, Senior Interest Bonds (6), (7) | 5.500% | 7/15/19 | N/R | $ | 3,617 | |
| | 19 | | Las Vegas Monorail Company, Senior Interest Bonds (6), (7) | 3.000% | 7/15/55 | N/R | | 770 | |
| $ | 91 | | Total Corporate Bonds (cost $8,208) | | | | | 4,387 | |
| | | | Total Long-Term Investments (cost $1,049,036,690) | | | | | 1,150,277,587 | |
| | Principal | | | Optional Call | | | | |
| | Amount (000) | | Description (1) | Provisions (2) | Ratings (3) | | Value | |
| | | | SHORT-TERM INVESTMENTS – 0.3% (0.2% of Total Investments) | | | | | |
| | | | MUNICIPAL BONDS – 0.3% (0.2% of Total Investments) | | | | | |
| | | | California – 0.3% (0.2% of Total Investments) | | | | | |
| $ | 1,920 | | California Statewide Community Development Authority, Revenue Bonds, Daughters of Charity Health System, Series 2014A, 6.000%, 12/15/15 (6) | No Opt. Call | N/R | $ | 1,925,261 | |
| | 185 | | California Statewide Community Development Authority, Revenue Bonds, Daughters of Charity Health System, Series 2014B, 6.000%, 12/15/15 (6) | No Opt. Call | N/R | | 185,507 | |
| | 285 | | California Statewide Community Development Authority, Revenue Bonds, Daughters of Charity Health System, Series 2014C, 6.000%, 12/15/15 (6) | No Opt. Call | N/R | | 285,781 | |
| $ | 2,390 | | Total Short-Term Investments (cost $2,390,000) | | | | 2,396,549 | |
| | | | Total Investments (cost $1,051,426,690) – 150.7% | | | | 1,152,674,136 | |
| | | | Floating Rate Obligations – (4.4)% | | | | (33,660,000 | ) |
| | | | Variable Rate Demand Preferred Shares, at Liquidation Value – (50.4)% (8) | | | | (385,400,000 | ) |
| | | | Other Assets Less Liabilities – 4.1% | | | | 31,296,241 | |
| | | | Net Assets Applicable to Common Shares – 100% | | | $ | 764,910,377 | |
| (1) | All percentages shown in the Portfolio of Investments are based on net assets applicable to common shares unless otherwise noted. |
| (2) | Optional Call Provisions (not covered by the report of independent registered public accounting firm): Dates (month and year) and prices of the earliest optional call or redemption. There may be other call provisions at varying prices at later dates. Certain mortgage-backed securities may be subject to periodic principal paydowns. |
| (3) | Ratings (not covered by the report of independent registered public accounting firm): Using the highest of Standard & Poor's Group ("Standard & Poor's"), Moody's Investors Service, Inc. ("Moody's") or Fitch, Inc. ("Fitch") rating. Ratings below BBB by Standard & Poor's, Baa by Moody's or BBB by Fitch are considered to be below investment grade. Holdings designated N/R are not rated by any of these national rating agencies. |
| (4) | Backed by an escrow or trust containing sufficient U.S. Government or U.S. Government agency securities, which ensure the timely payment of principal and interest. Certain bonds backed by U.S. Government or agency securities are regarded as having an implied rating equal to the rating of such securities. |
| (5) | Investment, or portion of investment, has been pledged to collateralize the net payment obligations for investments in inverse floating rate transactions. |
| (6) | Investment valued at fair value using methods determined in good faith by, or at the discretion of, the Board. For fair value measurement disclosure purposes, investment classified as Level 3. See Notes to Financial Statements, Note 2 – Investment Valuation and Fair Value Measurements for more information. |
| (7) | During January 2010, Las Vegas Monorail Company ("Las Vegas Monorail") filed for federal bankruptcy protection. During March 2012, Las Vegas Monorail emerged from federal bankruptcy with the acceptance of a reorganization plan assigned by the Federal Bankruptcy Court. Under the reorganization plan, the Fund surrendered its Las Vegas Monorail Project Revenue Bonds, First Tier, Series 2000 and in turn received two senior interest corporate bonds: the first with an annual coupon rate of 5.500% maturing on July 15, 2019 and the second with an annual coupon rate of 3.000% (5.500% after December 31, 2015) maturing on July 15, 2055. The Fund's custodian is not accruing income for either senior interest corporate bond. |
| (8) | Variable Rate Demand Preferred Shares, at Liquidation Value as a percentage of Total Investments is 33.4%. |
| (ETM) | Escrowed to maturity. |
| (IF) | Inverse floating rate investment. |
| (UB) | Underlying bond of an inverse floating rate trust reflected as a financing transaction. See Notes to Financial Statements, Note 3 – Portfolio Securities and Investments in Derivatives, Inverse Floating Rate Securities for more information. |
See accompanying notes to financial statements.
| NPF | | |
| | Nuveen Premier Municipal Income Fund, Inc. | |
| | Portfolio of Investments | October 31, 2015 |
| | Principal | | | Optional Call | | | | |
| | Amount (000) | | Description (1) | Provisions (2) | Ratings (3) | | Value | |
| | | | LONG-TERM INVESTMENTS 144.0% (99.1% of Total Investments) | | | | | |
| | | | MUNICIPAL BONDS 144.0% (99.1% of Total Investments) | | | | | |
| | | | Alabama – 0.7% (0.5% of Total Investments) | | | | | |
| $ | 2,010 | | Alabama Special Care Facilities Financing Authority, Revenue Bonds, Ascension Health, Series 2006C-2, 5.000%, 11/15/39 | 11/16 at 100.00 | AA+ | $ | 2,088,812 | |
| | | | Alaska – 0.3% (0.2% of Total Investments) | | | | | |
| | 1,000 | | Northern Tobacco Securitization Corporation, Alaska, Tobacco Settlement Asset-Backed Bonds, Series 2006A, 5.000%, 6/01/46 | 12/15 at 100.00 | B | | 839,880 | |
| | | | Arizona – 5.2% (3.5% of Total Investments) | | | | | |
| | 2,335 | | Arizona Sports and Tourism Authority, Tax Revenue Bonds, Multipurpose Stadium Facility Project, Refunding Senior Series 2012A, 5.000%, 7/01/36 | 7/22 at 100.00 | A1 | | 2,471,784 | |
| | | | Downtown Phoenix Hotel Corporation, Arizona, Senior Revenue Bonds, Series 2005A: | | | | | |
| | 2,000 | | 5.250%, 7/01/26 (Pre-refunded 1/01/16) – FGIC Insured | 1/16 at 100.00 | BB (4) | | 2,016,220 | |
| | 500 | | 5.000%, 7/01/36 (Pre-refunded 1/01/16) – FGIC Insured | 1/16 at 100.00 | BB (4) | | 503,840 | |
| | | | Glendale Industrial Development Authority, Arizona, Revenue Bonds, John C. Lincoln Health Network, Series 2005B: | | | | | |
| | 100 | | 5.250%, 12/01/24 (Pre-refunded 12/01/15) | 12/15 at 100.00 | N/R (4) | | 100,442 | |
| | 135 | | 5.250%, 12/01/25 (Pre-refunded 12/01/15) | 12/15 at 100.00 | N/R (4) | | 135,597 | |
| | 7,000 | | Phoenix Civic Improvement Corporation, Arizona, Revenue Bonds, Civic Plaza Expansion Project, Series 2005B, 5.500%, 7/01/39 – FGIC Insured | No Opt. Call | AA | | 8,833,720 | |
| | 1,200 | | Salt Verde Financial Corporation, Arizona, Senior Gas Revenue Bonds, Citigroup Energy Inc. Prepay Contract Obligations, Series 2007, 5.000%, 12/01/37 | No Opt. Call | A– | | 1,340,952 | |
| | 13,270 | | Total Arizona | | | | 15,402,555 | |
| | | | California – 20.3% (14.0% of Total Investments) | | | | | |
| | 3,000 | | Anaheim Public Financing Authority, California, Lease Revenue Bonds, Public Improvement Project, Refunding Series 2007A-1, 4.375%, 3/01/37 – FGIC Insured | 9/17 at 100.00 | AA– | | 3,049,110 | |
| | | | Anaheim Public Financing Authority, California, Lease Revenue Bonds, Public Improvement Project, Series 1997C: | | | | | |
| | 2,945 | | 0.000%, 9/01/27 | No Opt. Call | AA | | 1,948,206 | |
| | 2,455 | | 0.000%, 9/01/32 – AGM Insured | No Opt. Call | AA | | 1,246,821 | |
| | 1,000 | | Arcadia Unified School District, Los Angeles County, California, General Obligation Bonds, Election 2006 Series 2007A, 0.000%, 8/01/33 – AGM Insured | 2/17 at 44.77 | Aa1 | | 431,990 | |
| | 1,055 | | Brisbane School District, San Mateo County, California, General Obligation Bonds, Election 2003 Series 2005, 0.000%, 7/01/35 – AGM Insured | No Opt. Call | AA | | 462,217 | |
| | 1,640 | | Byron Unified School District, Contra Costa County, California, General Obligation Bonds, Series 2007B, 0.000%, 8/01/32 – SYNCORA GTY Insured | No Opt. Call | Aa3 | | 813,374 | |
| | 60 | | Byron Unified School District, Contra Costa County, California, General Obligation Bonds, Series 2007B, 0.000%, 8/01/32 – SYNCORA GTY Insured (ETM) | No Opt. Call | Aa3 (4) | | 38,190 | |
| | 1,700 | | California Health Facilities Financing Authority, Revenue Bonds, Providence Health & Services, Series 2009B, 5.500%, 10/01/39 | 10/19 at 100.00 | AA | | 1,933,529 | |
| | 1,025 | | California Health Facilities Financing Authority, Revenue Bonds, Sutter Health, Tender Option Bond Trust 2015-XF0078, 13.508%, 5/15/40 (IF) | 5/18 at 100.00 | AA– | | 1,410,943 | |
| | 500 | | California Statewide Communities Development Authority, California, Revenue Bonds, Loma Linda University Medical Center, Series 2014A, 5.250%, 12/01/44 | 12/24 at 100.00 | BB+ | | 523,325 | |
| | 500 | | California Statewide Community Development Authority, Revenue Bonds, Daughters of Charity Health System, Series 2005A, 5.000%, 7/01/39 | 1/16 at 100.00 | CCC | | 447,575 | |
| | 1,600 | | California Statewide Community Development Authority, Revenue Bonds, Kaiser Permanente System, Series 2001C, 5.250%, 8/01/31 | 8/16 at 100.00 | A+ | | 1,650,352 | |
| | Principal | | | Optional Call | | | | |
| | Amount (000) | | Description (1) | Provisions (2) | Ratings (3) | | Value | |
| | | | California (continued) | | | | | |
| $ | 5,045 | | Culver City Redevelopment Agency, California, Tax Allocation Revenue Bonds, Redevelopment Project, Capital Appreciation Series 2011A, 0.000%, 11/01/27 | 11/21 at 61.42 | BBB– | $ | 2,409,139 | |
| | 4,000 | | East Bay Municipal Utility District, Alameda and Contra Costa Counties, California, Water System Revenue Bonds, Series 2014C, 5.000%, 6/01/44 | 6/24 at 100.00 | AAA | | 4,559,280 | |
| | 3,010 | | El Camino Community College District, California, General Obligation Bonds, Election of 2002 Series 2012C, 0.000%, 8/01/25 | 8/22 at 100.00 | Aa1 | | 2,304,486 | |
| | 25,000 | | Foothill/Eastern Transportation Corridor Agency, California, Toll Road Revenue Bonds, Series 1995A, 0.000%, 1/01/17 (ETM) | No Opt. Call | Aaa | | 24,893,497 | |
| | 3,060 | | Golden State Tobacco Securitization Corporation, California, Enhanced Tobacco Settlement Asset-Backed Revenue Bonds, Series 2015A, 5.000%, 6/01/45 | 6/25 at 100.00 | A+ | | 3,394,152 | |
| | 3,500 | | Golden State Tobacco Securitization Corporation, California, Tobacco Settlement Asset-Backed Bonds, Series 2007A-1, 5.125%, 6/01/47 | 6/17 at 100.00 | B | | 2,972,655 | |
| | 2,665 | | Los Angeles Department of Water and Power, California, Power System Revenue Bonds, Series 2014B, 5.000%, 7/01/43 | 1/24 at 100.00 | AA– | | 3,005,294 | |
| | 4,615 | | Riverside County Redevelopment Agency, California, Tax Allocation Bonds, Jurupa Valley Project Area, Series 2011B, 0.000%, 10/01/38 | No Opt. Call | A | | 1,572,331 | |
| | 2,000 | | San Francisco, California, Community Facilities District 6, Mission Bay South Public Improvements, Special Tax Refunding Bonds, Series 2013C, 0.000%, 8/01/43 | 8/22 at 29.31 | N/R | | 422,040 | |
| | 1,145 | | Southern Kern Unified School District, Kern County, California, General Obligation Bonds, Series 2006C, 0.000%, 11/01/30 – AGM Insured | No Opt. Call | AA | | 621,002 | |
| | 1,175 | | Southern Kern Unified School District, Kern County, California, General Obligation Bonds, Series 2010B, 0.000%, 11/01/35 – AGM Insured | No Opt. Call | AA | | 498,776 | |
| | 72,695 | | Total California | | | | 60,608,284 | |
| | | | Colorado – 7.7% (5.3% of Total Investments) | | | | | |
| | 500 | | Colorado Educational and Cultural Facilities Authority, Charter School Revenue Bonds, Liberty Common Charter School, Series 2014A, 5.000%, 1/15/44 | 1/24 at 100.00 | A | | 533,940 | |
| | 375 | | Colorado Health Facilities Authority, Revenue Bonds, Evangelical Lutheran Good Samaritan Society, Series 2005, 5.000%, 6/01/29 | 6/16 at 100.00 | BBB+ | | 380,764 | |
| | 625 | | Colorado Health Facilities Authority, Revenue Bonds, Evangelical Lutheran Good Samaritan Society, Series 2005, 5.000%, 6/01/29 (Pre-refunded 6/01/16) | 6/16 at 100.00 | N/R (4) | | 642,119 | |
| | | | Denver, Colorado, Airport System Revenue Bonds, Series 2006: | | | | | |
| | 4,060 | | 5.000%, 11/15/23 – FGIC Insured | 11/16 at 100.00 | AA– | | 4,255,530 | |
| | 6,800 | | 5.000%, 11/15/24 – FGIC Insured | 11/16 at 100.00 | AA– | | 7,116,200 | |
| | 8,940 | | 5.000%, 11/15/25 – FGIC Insured | 11/16 at 100.00 | AA– | | 9,350,882 | |
| | 660 | | Park Creek Metropolitan District, Colorado, Senior Limited Property Tax Supported Revenue Refunding Bonds, Series 2011, 6.125%, 12/01/41 – AGM Insured | 12/20 at 100.00 | AA | | 776,167 | |
| | 21,960 | | Total Colorado | | | | 23,055,602 | |
| | | | Florida – 2.2% (1.5% of Total Investments) | | | | | |
| | 105 | | Marion County Hospital District, Florida, Revenue Bonds, Munroe Regional Medical Center, Series 2007, 5.000%, 10/01/34 (Pre-refunded 10/01/17) | 10/17 at 100.00 | BBB+ (4) | | 113,824 | |
| | 1,500 | | Martin County Industrial Development Authority, Florida, Industrial Development Revenue Refunding Bonds, Indiantown Cogeneration LP, Series 2013, 3.950%, 12/15/21 (Alternative Minimum Tax) | 6/20 at 100.00 | Ba1 | | 1,552,530 | |
| | 1,000 | | South Miami Health Facilities Authority, Florida, Hospital Revenue, Baptist Health System Obligation Group, Refunding Series 2007, 5.000%, 8/15/42 | 8/17 at 100.00 | AA | | 1,042,250 | |
| | 705 | | Southeast Overtown/Park West Community Redevelopment Agency, Florida, Tax Increment Revenue Bonds, Series 2014A-1, 5.000%, 3/01/30 | 3/24 at 100.00 | BBB+ | | 771,517 | |
| | 2,150 | | Sumter County, Florida, Capital Improvement Revenue Bonds, Series 2006, 5.000%, 6/01/30 (Pre-refunded 6/01/16) – AMBAC Insured | 6/16 at 100.00 | A (4) | | 2,209,362 | |
| NPF | Nuveen Premier Municipal Income Fund, Inc. | |
| | Portfolio of Investments (continued) | October 31, 2015 |
| | Principal | | | Optional Call | | | | |
| | Amount (000) | | Description (1) | Provisions (2) | Ratings (3) | | Value | |
| | | | Florida (continued) | | | | | |
| $ | 700 | | Tampa, Florida, Cigarette Tax Allocation Bonds, H. Lee Moffitt Cancer Center Project, Refunding & Capital Improvement Series 2012A, 5.000%, 9/01/29 | 9/22 at 100.00 | A+ | $ | 790,076 | |
| | 6,160 | | Total Florida | | | | 6,479,559 | |
| | | | Georgia – 2.2% (1.5% of Total Investments) | | | | | |
| | | | East Point Building Authority, Georgia, Revenue Bonds, Water & Sewer Project Series 2006A: | | | | | |
| | 2,360 | | 5.000%, 2/01/30 – SYNCORA GTY Insured | 2/16 at 100.00 | N/R | | 2,366,490 | |
| | 1,480 | | 5.000%, 2/01/34 – SYNCORA GTY Insured | 2/16 at 100.00 | N/R | | 1,483,537 | |
| | 1,000 | | Main Street Natural Gas Inc., Georgia, Gas Project Revenue Bonds, Series 2006B, 5.000%, 3/15/20 | No Opt. Call | A | | 1,122,370 | |
| | 1,425 | | Valdosta and Lowndes County Hospital Authority, Georgia, Revenue Certificates, South Georgia Medical Center Project, Series 2011B, 5.000%, 10/01/41 | 10/21 at 100.00 | Aa2 | | 1,562,285 | |
| | 6,265 | | Total Georgia | | | | 6,534,682 | |
| | | | Idaho – 0.3% (0.2% of Total Investments) | | | | | |
| | 310 | | Idaho Water Resource Board, Water Resource Loan Program Revenue, Ground Water Rights Mitigation Series 2012A, 5.000%, 9/01/32 | 9/22 at 100.00 | Baa1 | | 339,617 | |
| | 500 | | Madison County, Idaho, Hospital Revenue Certificates of Participation, Madison Memorial Hospital, Series 2006, 5.250%, 9/01/26 | 9/16 at 100.00 | BB+ | | 505,495 | |
| | 810 | | Total Idaho | | | | 845,112 | |
| | | | Illinois – 16.0% (11.0% of Total Investments) | | | | | |
| | 3,000 | | Bensenville, Illinois, General Obligation Bonds, Series 2011A, 5.000%, 12/15/30 – AGM Insured | 12/21 at 100.00 | AA | | 3,240,870 | |
| | 4,100 | | Chicago Transit Authority, Illinois, Sales Tax Receipts Revenue Bonds, Series 2011, 5.250%, 12/01/40 | 12/21 at 100.00 | AA | | 4,360,637 | |
| | 6,410 | | Chicago, Illinois, Wastewater Transmission Revenue Bonds, Second Lien Series 2001A, 5.500%, 1/01/30 – NPFG Insured | No Opt. Call | AA– | | 7,382,718 | |
| | 1,500 | | Chicago, Illinois, Water Revenue Bonds, Senior Lien Series 2001, 5.750%, 11/01/30 – AMBAC Insured | No Opt. Call | Baa2 | | 1,779,210 | |
| | 4,685 | | Illinois Toll Highway Authority, Toll Highway Revenue Bonds, Senior Lien Series 2015A, 5.000%, 1/01/40 | 7/25 at 100.00 | AA– | | 5,188,122 | |
| | 200 | | Illinois Finance Authority, Revenue Bonds, Proctor Hospital, Series 2006, 5.125%, 1/01/25 | 1/16 at 100.00 | Aa3 | | 201,498 | |
| | 3,000 | | Illinois Finance Authority, Revenue Bonds, University of Chicago, Refunding Series 2015A, 5.000%, 10/01/46 | 10/25 at 100.00 | AA+ | | 3,326,190 | |
| | 1,830 | | Illinois Sports Facility Authority, State Tax Supported Bonds, Refunding Series 2014, 5.250%, 6/15/32 – AGM Insured | 6/24 at 100.00 | AA | | 1,994,005 | |
| | | | Lombard Public Facilities Corporation, Illinois, Second Tier Conference Center and Hotel Revenue Bonds, Series 2005B: | | | | | |
| | 850 | | 5.250%, 1/01/25 (5) | 1/16 at 100.00 | D | | 339,830 | |
| | 1,750 | | 5.250%, 1/01/30 (5) | 1/16 at 100.00 | D | | 699,650 | |
| | | | Metropolitan Pier and Exposition Authority, Illinois, Revenue Bonds, McCormick Place Expansion Project, Refunding Series 1996A: | | | | | |
| | 10,575 | | 0.000%, 12/15/23 – NPFG Insured | No Opt. Call | AA– | | 8,028,117 | |
| | 10,775 | | 0.000%, 12/15/24 – NPFG Insured | No Opt. Call | AA– | | 7,821,680 | |
| | 2,395 | | Southwestern Illinois Development Authority, Local Government Revenue Bonds, Edwardsville Community Unit School District 7 Project, Series 2007, 0.000%, 12/01/22 – AGM Insured | No Opt. Call | AA | | 1,960,044 | |
| | 1,220 | | University of Illinois, Health Services Facilities System Revenue Bonds, Series 2013, 6.000%, 10/01/42 | 10/23 at 100.00 | A | | 1,386,396 | |
| | 52,290 | | Total Illinois | | | | 47,708,967 | |
| | | | Indiana – 3.3% (2.3% of Total Investments) | | | | | |
| | 6,180 | | Crown Point Multi-School Building Corporation, Indiana, First Mortgage Bonds, Crown Point Community School Corporation, Series 2000, 0.000%, 1/15/23 – NPFG Insured | No Opt. Call | AA+ | | 5,204,178 | |
| | 1,500 | | Indiana Finance Authority, Private Activity Bonds, Ohio River Bridges East End Crossing Project, Series 2013B, 5.000%, 7/01/40 (Alternative Minimum Tax) | 7/23 at 100.00 | BBB | | 1,601,730 | |
| | Principal | | | Optional Call | | | | |
| | Amount (000) | | Description (1) | Provisions (2) | Ratings (3) | | Value | |
| | | | Indiana (continued) | | | | | |
| $ | 1,250 | | Portage, Indiana, Economic Development Revenue Bonds, Ameriplex Project, Series 2006, 5.000%, 7/15/23 (Pre-refunded 7/15/16) | 7/16 at 100.00 | A (4) | $ | 1,291,450 | |
| | 1,700 | | Saint Joseph County, Indiana, Educational Facilities Revenue Bonds, University of Notre Dame du Lac Project, Refunding Series 2009, 5.000%, 3/01/36 | 3/18 at 100.00 | Aaa | | 1,843,786 | |
| | 1,000 | | St. Joseph County Hospital Authority, Indiana, Revenue Bonds, Madison Center Inc., Series 2005, 5.250%, 2/15/28 (6) | 2/16 at 100.00 | N/R | | 48,810 | |
| | 11,630 | | Total Indiana | | | | 9,989,954 | |
| | | | Iowa – 2.0% (1.4% of Total Investments) | | | | | |
| | 2,000 | | Iowa Finance Authority, Iowa, Midwestern Disaster Area Revenue Bonds, Iowa Fertilizer Company Project, Series 2013, 5.000%, 12/01/19 | No Opt. Call | BB– | | 2,128,520 | |
| | 4,000 | | Iowa Tobacco Settlement Authority, Asset Backed Settlement Revenue Bonds, Series 2005C, 5.500%, 6/01/42 | 12/15 at 100.00 | B+ | | 3,791,520 | |
| | 6,000 | | Total Iowa | | | | 5,920,040 | |
| | | | Kansas – 2.1% (1.5% of Total Investments) | | | | | |
| | 5,000 | | Wyandotte County/Kansas City Unified Government Board of Public Utilities, Kansas, Utility System Revenue Bonds, Improvement Series 2012B, 5.000%, 9/01/32 | No Opt. Call | A+ | | 5,617,000 | |
| | 915 | | Wyandotte County-Kansas City Unified Government, Kansas, Sales Tax Special Obligation Capital Appreciation Revenue Bonds Redevelopment Project Area B – Major Multi-Sport Athletic Complex Project, Subordinate Lien Series 2010B, 0.000%, 6/01/21 | No Opt. Call | A– | | 673,394 | |
| | 5,915 | | Total Kansas | | | | 6,290,394 | |
| | | | Kentucky – 3.7% (2.5% of Total Investments) | | | | | |
| | 1,700 | | Kentucky Economic Development Finance Authority, Hospital Facilities Revenue Bonds, Owensboro Medical Health System, Series 2010A, 6.500%, 3/01/45 | 6/20 at 100.00 | BBB+ | | 1,949,186 | |
| | 505 | | Kentucky Municipal Power Agency, Power System Revenue Bonds, Prairie State Project Series 2007A, 5.000%, 9/01/37 (Pre-refunded 9/01/17) – NPFG Insured | 9/17 at 100.00 | AA– (4) | | 544,617 | |
| | 1,785 | | Kentucky Municipal Power Agency, Power System Revenue Bonds, Prairie State Project Series 2007A, 5.000%, 9/01/37 – NPFG Insured | 9/17 at 100.00 | AA– | | 1,885,335 | |
| | 5,440 | | Kentucky Public Transportation Infrastructure Authority, First Tier Toll Revenue Bonds, Downtown Crossing Project, Series 2013A, 5.750%, 7/01/49 | 7/23 at 100.00 | Baa3 | | 6,094,595 | |
| | 510 | | Louisville and Jefferson County Metropolitan Government, Kentucky, Industrial Building Revenue Bonds, Sisters of Mercy of the Americas, Series 2006, 5.000%, 10/01/35 | 10/16 at 100.00 | A+ | | 519,032 | |
| | 9,940 | | Total Kentucky | | | | 10,992,765 | |
| | | | Louisiana – 7.1% (4.9% of Total Investments) | | | | | |
| | 2,930 | | Ascension Parish Industrial development Board, Louisiana, Revenue Bonds, Impala Warehousing (US) LLC Project, Series 2013, 6.000%, 7/01/36 | 7/23 at 100.00 | N/R | | 3,237,797 | |
| | 2,665 | | East Baton Rouge Sewerage Commission, Louisiana, Revenue Bonds, Refunding Series 2014B, 5.000%, 2/01/39 | 2/25 at 100.00 | AA | | 3,003,189 | |
| | 1,085 | | Louisiana Public Facilities Authority, Revenue Bonds, Ochsner Clinic Foundation Project, Series 2007A, 5.500%, 5/15/47 | 5/17 at 100.00 | Baa1 | | 1,136,830 | |
| | 415 | | Louisiana Public Facilities Authority, Revenue Bonds, Ochsner Clinic Foundation Project, Series 2007A, 5.500%, 5/15/47 (Pre-refunded 5/15/17) | 5/17 at 100.00 | N/R (4) | | 446,702 | |
| | 330 | | Louisiana Stadium and Exposition District, Revenue Refunding Bonds, Senior Lien Series 2013A, 5.000%, 7/01/36 | 7/23 at 100.00 | A | | 364,898 | |
| | | | Louisiana State, Gasoline and Fuels Tax Revenue Bonds, Series 2006A: | | | | | |
| | 825 | | 4.750%, 5/01/39 (Pre-refunded 5/01/16) – AGM Insured | 5/16 at 100.00 | Aa1 (4) | | 843,538 | |
| | 8,880 | | 4.500%, 5/01/41 (Pre-refunded 5/01/16) – NPFG Insured (UB) | 5/16 at 100.00 | Aa1 (4) | | 9,068,344 | |
| | 5 | | Louisiana State, Gasoline and Fuels Tax Revenue Bonds, Series 2006, Residuals 660-3, 16.222%, 5/01/34 (Pre-refunded 5/01/16) – NPFG Insured (IF) | 5/16 at 100.00 | Aa1 (4) | | 5,423 | |
| | 1,000 | | New Orleans, Louisiana, General Obligation Bonds, Refunding Series 2012, 5.000%, 12/01/28 – AGM Insured | 12/22 at 100.00 | AA | | 1,114,400 | |
| NPF | Nuveen Premier Municipal Income Fund, Inc. | |
| | Portfolio of Investments (continued) | October 31, 2015 |
| | Principal | | | Optional Call | | | | |
| | Amount (000) | | Description (1) | Provisions (2) | Ratings (3) | | Value | |
| | | | Louisiana (continued) | | | | | |
| $ | 1,200 | | New Orleans, Louisiana, Water Revenue Bonds, Refunding Series 2014, 5.000%, 12/01/44 | 12/24 at 100.00 | BBB+ | $ | 1,318,440 | |
| | 485 | | Saint Charles Parish, Louisiana, Gulf Opportunity Zone Revenue Bonds, Valero Project, Series 2010, 4.000%, 12/01/40 (Mandatory put 6/01/22) | No Opt. Call | BBB | | 517,126 | |
| | 19,820 | | Total Louisiana | | | | 21,056,687 | |
| | | | Maine – 1.6% (1.1% of Total Investments) | | | | | |
| | 2,000 | | Maine Health and Higher Educational Facilities Authority Revenue Bonds, Eastern Maine Medical Center Obligated Group Issue, Series 2013, 5.000%, 7/01/33 | 7/23 at 100.00 | BBB | | 2,149,320 | |
| | | | Maine Turnpike Authority, Special Obligation Bonds, Series 2014: | | | | | |
| | 1,290 | | 5.000%, 7/01/33 | No Opt. Call | A | | 1,463,479 | |
| | 1,020 | | 5.000%, 7/01/34 | No Opt. Call | A | | 1,155,517 | |
| | 4,310 | | Total Maine | | | | 4,768,316 | |
| | | | Maryland – 2.4% (1.6% of Total Investments) | | | | | |
| | 5,000 | | Baltimore, Maryland, Revenue Bonds, Wastewater Projects, Series 2014C, 5.000%, 7/01/44 | 1/25 at 100.00 | AA– | | 5,592,050 | |
| | 1,500 | | Maryland Health and Higher Educational Facilities Authority, Revenue Bonds, Western Maryland Health, Series 2006A, 4.750%, 7/01/36 (Pre-refunded 7/01/16) – NPFG Insured | 7/16 at 100.00 | AA– (4) | | 1,543,725 | |
| | 6,500 | | Total Maryland | | | | 7,135,775 | |
| | | | Massachusetts – 2.8% (1.9% of Total Investments) | | | | | |
| | 7,500 | | Massachusetts Department of Transportation, Metropolitan Highway System Revenue Bonds, Senior Lien Series 2010B, 5.000%, 1/01/37 | 1/20 at 100.00 | A+ | | 8,373,300 | |
| | | | Michigan – 3.4% (2.3% of Total Investments) | | | | | |
| | 1,500 | | Michigan Finance Authority, Hospital Revenue Bonds, Sparrow Obligated Group, Series 2012, 5.000%, 11/15/42 | 11/22 at 100.00 | A+ | | 1,614,585 | |
| | 2,000 | | Michigan Finance Authority, State Revolving Fund Revenue Bonds, Clean Water Series 2012, 5.000%, 10/01/31 | 10/22 at 100.00 | AAA | | 2,299,400 | |
| | 815 | | Michigan State Hospital Finance Authority, Revenue Bonds, Trinity Health Care Group, Series 2006A, 5.000%, 12/01/31 | 12/16 at 100.00 | AA | | 850,575 | |
| | 185 | | Michigan State Hospital Finance Authority, Revenue Bonds, Trinity Health Care Group, Series 2006A, 5.000%, 12/01/31 (Pre-refunded 12/01/16) | 12/16 at 100.00 | Aa2 (4) | | 194,222 | |
| | 5,000 | | Michigan Tobacco Settlement Finance Authority, Tobacco Settlement Asset-Backed Revenue Bonds, Series 2008A, 6.875%, 6/01/42 | 6/18 at 100.00 | BB– | | 5,003,200 | |
| | 170 | | Monroe County Hospital Finance Authority, Michigan, Mercy Memorial Hospital Corporation Revenue Bonds, Series 2006, 5.500%, 6/01/35 | 6/16 at 100.00 | AA– | | 172,074 | |
| | 9,670 | | Total Michigan | | | | 10,134,056 | |
| | | | Minnesota – 1.4% (1.0% of Total Investments) | | | | | |
| | | | Minnesota Municipal Power Agency, Electric Revenue Bonds, Refunding Series 2014A: | | | | | |
| | 700 | | 5.000%, 10/01/34 | 10/24 at 100.00 | A2 | | 797,664 | |
| | 500 | | 5.000%, 10/01/35 | 10/24 at 100.00 | A2 | | 568,510 | |
| | 1,000 | | Minnesota State, General Obligation Bonds, Various Purpose, Refunding Series 2010D, 5.000%, 8/01/18 | No Opt. Call | AA+ | | 1,116,530 | |
| | 1,500 | | Western Minnesota Municipal Power Agency, Power Supply Revenue Bonds, Series 2014A, 5.000%, 1/01/46 | 1/24 at 100.00 | Aa3 | | 1,676,670 | |
| | 3,700 | | Total Minnesota | | | | 4,159,374 | |
| | | | Missouri – 0.0% (0.0% of Total Investments) | | | | | |
| | 100 | | Hannibal Industrial Development Authority, Missouri, Health Facilities Revenue Bonds, Hannibal Regional Hospital, Series 2006, 5.000%, 3/01/22 | 3/16 at 100.00 | BBB+ | | 100,883 | |
| | Principal | | | Optional Call | | | | |
| | Amount (000) | | Description (1) | Provisions (2) | Ratings (3) | | Value | |
| | | | Nebraska – 0.8% (0.6% of Total Investments) | | | | | |
| $ | 1,580 | | Douglas County Hospital Authority 2, Nebraska, Health Facilities Revenue Bonds, Nebraska Medical Center, Series 2003, 5.000%, 11/15/16 | No Opt. Call | Aa3 | $ | 1,652,080 | |
| | 515 | | Omaha Public Power District, Nebraska, Separate Electric System Revenue Bonds, Nebraska City 2, Tender Option Bond Trust 11673, 20.228%,
8/01/40 – BHAC Insured (IF) | 2/17 at 100.00 | AA+ | | 858,314 | |
| | 2,095 | | Total Nebraska | | | | 2,510,394 | |
| | | | Nevada – 4.8% (3.3% of Total Investments) | | | | | |
| | 4,000 | | Clark County, Nevada, Airport Revenue Bonds, Subordinate Lien Series 2010B, 5.750%, 7/01/42 | 1/20 at 100.00 | A+ | | 4,637,040 | |
| | 2,500 | | Clark County, Nevada, Passenger Facility Charge Revenue Bonds, Las Vegas-McCarran International Airport, Refunding Series 2015C, 5.000%, 7/01/26 | No Opt. Call | A+ | | 3,029,925 | |
| | 3,835 | | Las Vegas Valley Water District, Nevada, General Obligation Bonds, Refunding Series 2015, 5.000%, 6/01/39 | 12/24 at 100.00 | AA+ | | 4,381,948 | |
| | 2,050 | | Washoe County, Nevada, General Obligation Bonds, Reno-Sparks Convention & Visitors Authority, Refunding Series 2011, 5.000%, 7/01/32 | 7/21 at 100.00 | AA | | 2,321,297 | |
| | 12,385 | | Total Nevada | | | | 14,370,210 | |
| | | | New Hampshire – 1.7% (1.2% of Total Investments) | | | | | |
| | 3,500 | | New Hampshire Health and Education Facilities Authority, Revenue Bonds, Catholic Medical Center, Series 2012, 4.000%, 7/01/32 | No Opt. Call | A– | | 3,519,215 | |
| | 1,110 | | New Hampshire Health and Education Facilities Authority, Revenue Bonds, Dartmouth College, Tender Option Bond Trust 09-7W, 14.276%, 6/01/39 (IF) (7) | 6/19 at 100.00 | AA+ | | 1,526,516 | |
| | 4,610 | | Total New Hampshire | | | | 5,045,731 | |
| | | | New Jersey – 5.5% (3.8% of Total Investments) | | | | | |
| | 1,865 | | New Jersey Economic Development Authority, Private Activity Bonds, The Goethals Bridge Replacement Project, Series 2013, 5.125%, 1/01/39 – AGM Insured (Alternative Minimum Tax) | 1/24 at 100.00 | AA | | 2,026,826 | |
| | 2,000 | | New Jersey Health Care Facilities Financing Authority, Revenue Bonds, Saint Barnabas Health Care System, Refunding Series 2011A, 5.625%, 7/01/32 | 7/21 at 100.00 | A– | | 2,311,220 | |
| | 1,000 | | New Jersey Transportation Trust Fund Authority, Transportation System Bonds, Capital Appreciation Series 2010A, 0.000%, 12/15/26 | No Opt. Call | A– | | 580,940 | |
| | | | New Jersey Transportation Trust Fund Authority, Transportation System Bonds, Series 2006C: | | | | | |
| | 25,000 | | 0.000%, 12/15/35 – AMBAC Insured | No Opt. Call | A– | | 8,301,750 | |
| | 10,000 | | 0.000%, 12/15/36 – AMBAC Insured | No Opt. Call | A– | | 3,137,300 | |
| | 39,865 | | Total New Jersey | | | | 16,358,036 | |
| | | | New York – 8.0% (5.5% of Total Investments) | | | | | |
| | | | Brooklyn Arena Local Development Corporation, New York, Payment in Lieu of Taxes Revenue Bonds, Barclays Center Project, Series 2009: | | | | | |
| | 660 | | 6.000%, 7/15/30 | 1/20 at 100.00 | BBB– | | 747,608 | |
| | 1,600 | | 0.000%, 7/15/44 | No Opt. Call | BBB– | | 403,120 | |
| | 1,100 | | Hudson Yards Infrastructure Corporation, New York, Revenue Bonds, Senior Fiscal 2012 Series 2011A, 5.750%, 2/15/47 | 2/21 at 100.00 | A | | 1,252,317 | |
| | 2,200 | | Hudson Yards Infrastructure Corporation, New York, Revenue Bonds, Series 2006A, 4.500%, 2/15/47 – NPFG Insured | 2/17 at 100.00 | AA– | | 2,280,564 | |
| | 470 | | Long Island Power Authority, New York, Electric System General Revenue Bonds, Series 2014A, 5.000%, 9/01/44 | 9/24 at 100.00 | A– | | 520,154 | |
| | 7,500 | | Long Island Power Authority, New York, Electric System General Revenue Bonds, Series 2006A, 5.000%, 12/01/25 – FGIC Insured (UB) | 6/16 at 100.00 | AA+ | | 7,695,750 | |
| | 2,000 | | New York Convention Center Development Corporation, New York, Hotel Unit Fee Secured Revenue Bonds, Refunding Series 2015, 5.000%, 11/15/45 | 11/25 at 100.00 | Aa3 | | 2,244,940 | |
| | 4,100 | | New York Liberty Development Corporation, New York, Liberty Revenue Bonds, 3 World Trade Center Project, Class 1 Series 2014, 5.000%, 11/15/44 | 11/24 at 100.00 | N/R | | 4,156,498 | |
| | 1,560 | | New York Liberty Development Corporation, New York, Liberty Revenue Bonds, 4 World Trade Center Project, Series 2011, 5.000%, 11/15/44 | 11/21 at 100.00 | A+ | | 1,733,940 | |
| NPF | Nuveen Premier Municipal Income Fund, Inc. | |
| | Portfolio of Investments (continued) | October 31, 2015 |
| | Principal | | | Optional Call | | | | |
| | Amount (000) | | Description (1) | Provisions (2) | Ratings (3) | | Value | |
| | | | New York (continued) | | | | | |
| $ | 1,500 | | New York Liberty Development Corporation, Revenue Bonds, Goldman Sachs Headquarters Issue, Series 2005, 5.250%, 10/01/35 | No Opt. Call | A | $ | 1,778,625 | |
| | 500 | | Onondaga Civic Development Corporation, New York, Revenue Bonds, Saint Joseph's Hospital Health Center Project, Series 2014A, 5.125%, 7/01/31 | 7/19 at 100.00 | BB | | 527,640 | |
| | 395 | | Port Authority of New York and New Jersey, Special Project Bonds, JFK International Air Terminal LLC Project, Eighth Series 2010, 6.000%, 12/01/42 | 12/20 at 100.00 | BBB | | 458,891 | |
| | 23,585 | | Total New York | | | | 23,800,047 | |
| | | | North Carolina – 6.0% (4.1% of Total Investments) | | | | | |
| | | | North Carolina Department of Transportation, Private Activity Revenue Bonds, I-77 Hot Lanes Project, Series 2015: | | | | | |
| | 2,965 | | 5.000%, 12/31/37 (Alternative Minimum Tax) | 6/25 at 100.00 | BBB– | | 3,149,512 | |
| | 1,000 | | 5.000%, 6/30/54 (Alternative Minimum Tax) | 6/25 at 100.00 | BBB– | | 1,042,370 | |
| | 10,300 | | North Carolina Eastern Municipal Power Agency, Power System Revenue Refunding Bonds, Series 1993B, 6.000%, 1/01/22 – CAPMAC Insured (UB) (ETM) (7) | No Opt. Call | Aa3 (4) | | 12,983,150 | |
| | 500 | | North Carolina Municipal Power Agency 1, Catawba Electric Revenue Bonds, Refunding Series 2015A, 5.000%, 1/01/32 | 1/26 at 100.00 | A | | 583,250 | |
| | 14,765 | | Total North Carolina | | | | 17,758,282 | |
| | | | North Dakota – 0.3% (0.2% of Total Investments) | | | | | |
| | 675 | | Burleigh County, North Dakota, Health Care Revenue Bonds, Saint Alexius Medical Center Project, Refunding Series 2012A, 5.000%, 7/01/38 (Pre-refunded 7/01/22) | 7/22 at 100.00 | N/R (4) | | 815,130 | |
| | | | Ohio – 3.7% (2.6% of Total Investments) | | | | | |
| | | | Buckeye Tobacco Settlement Financing Authority, Ohio, Tobacco Settlement Asset-Backed Revenue Bonds, Senior Lien, Series 2007A-2: | | | | | |
| | 4,100 | | 5.125%, 6/01/24 | 6/17 at 100.00 | B– | | 3,682,538 | |
| | 3,410 | | 5.875%, 6/01/47 | 6/17 at 100.00 | B | | 2,947,502 | |
| | 1,000 | | JobsOhio Beverage System, Ohio, Statewide Liquor Profits Revenue Bonds, Senior Lien Series 2013A, 5.000%, 1/01/38 | 1/23 at 100.00 | AA | | 1,105,020 | |
| | | | JobsOhio Beverage System, Ohio, Statewide Senior Lien Liquor Profits Revenue Bonds, Tender Option Bond Trust 1157: | | | | | |
| | 625 | | 17.115%, 1/01/38 (IF) (7) | 1/23 at 100.00 | AA | | 887,550 | |
| | 265 | | 16.990%, 1/01/38 (IF) (7) | 1/23 at 100.00 | AA | | 375,471 | |
| | 1,315 | | 15.983%, 1/01/38 (IF) (7) | 1/23 at 100.00 | AA | | 1,867,405 | |
| | 250 | | Port of Greater Cincinnati Development Authority, Ohio, Economic Development Revenue Bonds, Sisters of Mercy of the Americas, Series 2006, 5.000%, 10/01/25 | 10/16 at 100.00 | A+ | | 257,805 | |
| | 10,965 | | Total Ohio | | | | 11,123,291 | |
| | | | Oklahoma – 2.2% (1.5% of Total Investments) | | | | | |
| | 450 | | Norman Regional Hospital Authority, Oklahoma, Hospital Revenue Bonds, Series 2005, 5.375%, 9/01/36 | 9/16 at 100.00 | BBB– | | 460,395 | |
| | 3,000 | | Tulsa Airports Improvement Trust, Oklahoma, General Airport Revenue Bonds, Series 2013A, 5.625%, 6/01/43 – BAM Insured (Alternative Minimum Tax) | 6/23 at 100.00 | AA | | 3,295,590 | |
| | 2,705 | | Tulsa County Industrial Authority, Oklahoma, Health Care Revenue Bonds, Saint Francis Health System, Series 2006, 5.000%, 12/15/36 | 12/16 at 100.00 | AA+ | | 2,823,533 | |
| | 6,155 | | Total Oklahoma | | | | 6,579,518 | |
| | | | Oregon – 2.2% (1.5% of Total Investments) | | | | | |
| | 2,000 | | Oregon Department of Administrative Services, State Lottery Revenue Bonds, Refunding Series 2014C, 5.000%, 4/01/25 | 4/24 at 100.00 | AAA | | 2,437,260 | |
| | 3,500 | | Oregon Department of Administrative Services, State Lottery Revenue Bonds, Refunding Series 2015D, 5.000%, 4/01/29 | 4/25 at 100.00 | AAA | | 4,197,725 | |
| | 5,500 | | Total Oregon | | | | 6,634,985 | |
| | Principal | | | Optional Call | | | | |
| | Amount (000) | | Description (1) | Provisions (2) | Ratings (3) | | Value | |
| | | | Pennsylvania – 2.5% (1.7% of Total Investments) | | | | | |
| $ | 2,000 | | Allegheny County Sanitary Authority, Pennsylvania, Sewer Revenue Bonds, Series 2005A, 5.000%, 12/01/23 (Pre-refunded 12/01/15) – NPFG Insured | 12/15 at 100.00 | AA– (4) | $ | 2,008,000 | |
| | 4,500 | | Pennsylvania Turnpike Commission, Turnpike Revenue Bonds, Subordinate Series 2009C, 0.000%, 6/01/33 – AGM Insured | 6/26 at 100.00 | AA | | 5,400,495 | |
| | 6,500 | | Total Pennsylvania | | | | 7,408,495 | |
| | | | South Carolina – 2.3% (1.6% of Total Investments) | | | | | |
| | 2,620 | | South Carolina Public Service Authority, Santee Cooper Revenue Obligations, Series 2013A, 5.125%, 12/01/43 | 12/23 at 100.00 | AA– | | 2,888,864 | |
| | 3,455 | | South Carolina Public Service Authority, Santee Cooper Revenue Obligations, Series 2014A, 5.500%, 12/01/54 | 6/24 at 100.00 | AA– | | 3,873,677 | |
| | 6,075 | | Total South Carolina | | | | 6,762,541 | |
| | | | Tennessee – 2.2% (1.5% of Total Investments) | | | | | |
| | 195 | | Johnson City Health and Educational Facilities Board, Tennessee, Hospital Revenue Refunding and Improvement Bonds, Johnson City Medical Center, Series 1998C, 5.125%, 7/01/25 (Pre-refunded 7/01/23) – NPFG Insured | 7/23 at 100.00 | AA– (4) | | 195,821 | |
| | 1,600 | | Johnson City Health and Educational Facilities Board, Tennessee, Revenue Bonds, Mountain States Health Alliance, Series 2006A, 5.500%, 7/01/36 | 7/16 at 100.00 | BBB+ | | 1,643,408 | |
| | 4,000 | | The Tennessee Energy Acquisition Corporation, Gas Revenue Bonds, Series 2006A, 5.250%, 9/01/26 | No Opt. Call | A | | 4,753,760 | |
| | 5,795 | | Total Tennessee | | | | 6,592,989 | |
| | | | Texas – 9.3% (6.4% of Total Investments) | | | | | |
| | 4,280 | | Austin Convention Enterprises Inc., Texas, Convention Center Hotel Revenue Bonds, First Tier Series 2006A, 5.000%, 1/01/34 – SYNCORA GTY Insured | 1/17 at 100.00 | BBB– | | 4,324,041 | |
| | 1,000 | | Bell County Water Control Improvement District 1, Texas, Water Revenue Bonds, Series 2014, 5.000%, 7/10/37 – BAM Insured | 7/23 at 100.00 | AA | | 1,114,640 | |
| | 1,075 | | Brazos River Authority, Texas, Pollution Control Revenue Bonds, TXU Energy Company LLC Project, Series 2003C, 6.750%, 10/01/38 (Alternative Minimum Tax) (6) | 4/16 at 100.00 | C | | 61,813 | |
| | 3,750 | | Grand Parkway Transportation Corporation, Texas, System Toll Revenue Bonds, First Tier Series 2013A, 5.125%, 10/01/43 | 10/23 at 100.00 | BBB+ | | 4,059,488 | |
| | 2,745 | | Gulf Coast Industrial Development Authority, Texas, Solid Waste Disposal Revenue Bonds, Citgo Petroleum Corporation Project, Series 1995, 4.875%, 5/01/25 (Alternative Minimum Tax) | 10/22 at 100.00 | BB | | 2,866,411 | |
| | 500 | | Harris County Metropolitan Transit Authority, Texas, Sales and Use Tax Revenue Bonds, Contractual Obligation Series 2014, 5.000%, 11/01/29 | 11/24 at 100.00 | AA+ | | 591,805 | |
| | | | Harris County-Houston Sports Authority, Texas, Revenue Bonds, Junior Lien Series 2001H: | | | | | |
| | 150 | | 0.000%, 11/15/24 – NPFG Insured | No Opt. Call | AA– | | 104,619 | |
| | 4,440 | | 0.000%, 11/15/29 – NPFG Insured | No Opt. Call | AA– | | 2,385,035 | |
| | | | Harris County-Houston Sports Authority, Texas, Revenue Bonds, Refunding Second Lien Series 2014C: | | | | | |
| | 160 | | 5.000%, 11/15/32 | 11/24 at 100.00 | A3 | | 178,200 | |
| | 600 | | 5.000%, 11/15/33 | 11/24 at 100.00 | A3 | | 666,288 | |
| | | | Kerrville Health Facilities Development Corporation, Texas, Revenue Bonds, Sid Peterson Memorial Hospital Project, Series 2015: | | | | | |
| | 400 | | 5.250%, 8/15/21 | 2/16 at 100.00 | BBB+ | | 403,184 | |
| | 600 | | 5.125%, 8/15/26 | 2/16 at 100.00 | BBB+ | | 603,534 | |
| | 800 | | Love Field Airport Modernization Corporation, Texas, Special Facilities Revenue Bonds, Southwest Airlines Company, Series 2010, 5.250%, 11/01/40 | 11/20 at 100.00 | Baa1 | | 875,800 | |
| | 2,000 | | McCamey County Hospital District, Texas, General Obligation Bonds, Series 2013, 6.125%, 12/01/38 | 12/25 at 100.00 | Baa2 | | 2,217,420 | |
| | 1,735 | | New Hope Cultural Education Facilities Finance Corporation, Texas, Student Housing Revenue Bonds, CHF-Collegiate Housing Foundation – College Station I LLC – Texas A&M University Project, Series 2014A, 5.000%, 4/01/46 – AGM Insured | 4/24 at 100.00 | AA | | 1,855,218 | |
| NPF | Nuveen Premier Municipal Income Fund, Inc. | |
| | Portfolio of Investments (continued) | October 31, 2015 |
| | Principal | | | Optional Call | | | | |
| | Amount (000) | | Description (1) | Provisions (2) | Ratings (3) | | Value | |
| | | | Texas (continued) | | | | | |
| $ | 950 | | North Texas Tollway Authority, System Revenue Bonds, Refunding Second Tier, Series 2008F, 5.750%, 1/01/38 (Pre-refunded 1/01/18) | 1/18 at 100.00 | A2 (4) | $ | 1,051,907 | |
| | 1,000 | | Sabine River Authority, Texas, Pollution Control Revenue Bonds, TXU Electric Company, Series 2001C, 5.200%, 5/01/28 (6) | 11/15 at 100.00 | C | | 57,500 | |
| | 125 | | Tarrant County Cultural and Educational Facilities Finance Corporation, Texas, Revenue Bonds, Texas Health Resources Project, Trust 1031, 17.831%, 2/15/30 (IF) (7) | 2/17 at 100.00 | AA | | 143,625 | |
| | 3,000 | | Tarrant County Cultural Education Facilities Finance Corporation, Texas, Revenue Bonds, Texas Health Resources, Series 2007A, 5.000%, 2/15/36 (UB) | 2/17 at 100.00 | AA | | 3,111,750 | |
| | 1,000 | | Texas Municipal Gas Acquisition and Supply Corporation III, Gas Supply Revenue Bonds, Series 2012, 5.000%, 12/15/31 | No Opt. Call | A3 | | 1,092,510 | |
| | 30,310 | | Total Texas | | | | 27,764,788 | |
| | | | Utah – 2.7% (1.9% of Total Investments) | | | | | |
| | 1,000 | | Central Utah Water Conservancy District, Water Revenue Bonds, Series 2012C, 5.000%, 10/01/42 | 10/22 at 100.00 | AA+ | | 1,114,850 | |
| | 2,000 | | Utah County, Utah, Hospital Revenue Bonds, IHC Health Services Inc., Series 2012, 5.000%, 5/15/43 | 5/21 at 100.00 | AA+ | | 2,207,100 | |
| | 235 | | Utah Housing Corporation, Single Family Mortgage Bonds, Series 2001-D1 Class II, 5.500%, 1/01/21 (Alternative Minimum Tax) | 1/16 at 100.00 | Aaa | | 235,592 | |
| | 4,110 | | Utah Transit Authority, Sales Tax Revenue and Refunding Bonds, Series 2012, 5.000%, 6/15/42 | 6/22 at 100.00 | A+ | | 4,496,998 | |
| | 7,345 | | Total Utah | | | | 8,054,540 | |
| | | | Virginia – 1.5% (1.1% of Total Investments) | | | | | |
| | 1,765 | | Virginia Small Business Financing Authority, Senior Lien Revenue Bonds, 95 Express Lanes LLC Project, Series 2012, 5.000%, 1/01/40 (Alternative Minimum Tax) | 1/22 at 100.00 | BBB– | | 1,834,912 | |
| | 2,520 | | Virginia Small Business Financing Authority, Senior Lien Revenue Bonds, Elizabeth River Crossing, Opco LLC Project, Series 2012, 5.500%, 1/01/42 (Alternative Minimum Tax) | 7/22 at 100.00 | BBB– | | 2,750,000 | |
| | 4,285 | | Total Virginia | | | | 4,584,912 | |
| | | | Washington – 2.2% (1.5% of Total Investments) | | | | | |
| | 2,000 | | Energy Northwest, Washington, Electric Revenue Bonds, Columbia Generating Station, Refunding Series 2014A, 5.000%, 7/01/40 | 7/24 at 100.00 | Aa1 | | 2,267,340 | |
| | 1,000 | | Washington Health Care Facilities Authority, Revenue Bonds, Kadlec Regional Medical Center, Series 2010, 5.500%, 12/01/39 (Pre-refunded 12/01/20) | 12/20 at 100.00 | N/R (4) | | 1,206,400 | |
| | 1,590 | | Washington Health Care Facilities Authority, Revenue Bonds, Kadlec Regional Medical Center, Series 2012, 5.000%, 12/01/42 (Pre-refunded 12/01/21) | 12/21 at 100.00 | N/R (4) | | 1,909,590 | |
| | 1,000 | | Washington Health Care Facilities Authority, Revenue Bonds, Seattle Children's Hospital, Series 2012A, 5.000%, 10/01/42 | 10/22 at 100.00 | Aa2 | | 1,089,520 | |
| | 5,590 | | Total Washington | | | | 6,472,850 | |
| | | | Wisconsin – 0.9% (0.6% of Total Investments) | | | | | |
| | 160 | | Wisconsin Health and Educational Facilities Authority, Revenue Bonds, Divine Savior Healthcare, Series 2006, 5.000%, 5/01/32 | 5/16 at 100.00 | BBB– | | 162,179 | |
| | 2,500 | | Wisconsin State, General Obligation Bonds, Series 2006A, 4.750%, 5/01/25 (Pre-refunded 5/01/16) – FGIC Insured | 5/16 at 100.00 | AA (4) | | 2,555,650 | |
| | 2,660 | | Total Wisconsin | | | | 2,717,829 | |
| | | | Wyoming – 0.5% (0.3% of Total Investments) | | | | | |
| | 1,350 | | Sweetwater County, Wyoming, Solid Waste Disposal Revenue Bonds, FMC Corporation, Series 2005, 5.600%, 12/01/35 (Alternative Minimum Tax) | 12/15 at 100.00 | BBB+ | | 1,354,752 | |
| $ | 452,055 | | Total Long-Term Investments (cost $401,650,731) | | | | 429,194,317 | |
| | Principal | | | Optional Call | | | | |
| | Amount (000) | | Description (1) | Provisions (2) | Ratings (3) | | Value | |
| | | | SHORT-TERM INVESTMENTS – 1.3% (0.9% of Total Investments) | | | | | |
| | | | MUNICIPAL BONDS – 1.3% (0.9% of Total Investments) | | | | | |
| | | | California – 0.8% (0.5% of Total Investments) | | | | | |
| $ | 1,775 | | California Statewide Community Development Authority, Revenue Bonds, Daughters of Charity Health System, Series 2014A, 6.000%, 12/15/15 (8) | No Opt. Call | N/R | $ | 1,779,864 | |
| | 170 | | California Statewide Community Development Authority, Revenue Bonds, Daughters of Charity Health System, Series 2014B, 6.000%, 12/15/15 (8) | No Opt. Call | N/R | | 170,466 | |
| | 260 | | California Statewide Community Development Authority, Revenue Bonds, Daughters of Charity Health System, Series 2014C, 6.000%, 12/15/15 (8) | No Opt. Call | N/R | | 260,712 | |
| | 2,205 | | Total California | | | | 2,211,042 | |
| | | | Illinois – 0.4% (0.3% of Total Investments) | | | | | |
| | 1,200 | | Illinois Finance Authority, Revenue Bonds, University of Chicago, Variable Rate Demand Obligations, Tender Option Bond Trust 2015-XM0114, 0.260%, 7/01/16 (Mandatory put 12/17/15) | No Opt. Call | N/R | | 1,200,000 | |
| | | | New York – 0.1% (0.1% of Total Investments) | | | | | |
| | 400 | | New York State Thruway Authority, General Revenue Bonds, Variable Rate Demand Obligations, Tender Option Bond Trust 3600Z, 0.130%, 1/01/16 (Mandatory put 12/10/15) | No Opt. Call | A-1 | | 400,000 | |
| $ | 3,805 | | Total Short-Term Investments (cost $3,805,000) | | | | 3,811,042 | |
| | | | Total Investments (cost $405,455,731) – 145.3% | | | | 433,005,359 | |
| | | | Floating Rate Obligations – (7.5)% | | | | (22,260,000 | ) |
| | | | Variable Rate Demand Preferred Shares, at Liquidation Value – (42.9)% (9) | | | | (127,700,000 | ) |
| | | | Other Assets Less Liabilities – 5.1% | | | | 14,948,237 | |
| | | | Net Assets Applicable to Common Shares – 100% | | | $ | 297,993,596 | |
| (1) | All percentages shown in the Portfolio of Investments are based on net assets applicable to common shares unless otherwise noted. |
| (2) | Optional Call Provisions (not covered by the report of independent registered public accounting firm): Dates (month and year) and prices of the earliest optional call or redemption. There may be other call provisions at varying prices at later dates. Certain mortgage-backed securities may be subject to periodic principal paydowns. |
| (3) | Ratings (not covered by the report of independent registered public accounting firm): Using the highest of Standard & Poor's Group ("Standard & Poor's"), Moody's Investors Service, Inc. ("Moody's") or Fitch, Inc. ("Fitch") rating. Ratings below BBB by Standard & Poor's, Baa by Moody's or BBB by Fitch are considered to be below investment grade. Holdings designated N/R are not rated by any of these national rating agencies. |
| (4) | Backed by an escrow or trust containing sufficient U.S. Government or U.S. Government agency securities, which ensure the timely payment of principal and interest. Certain bonds backed by U.S. Government or agency securities are regarded as having an implied rating equal to the rating of such securities. |
| (5) | On May 7, 2015, the Fund's Adviser determined it was unlikely that this borrower would fulfill its entire obligation on this security, and therefore reduced the security's interest rate of accrual from 5.250% to 2.100%. |
| (6) | As of, or subsequent to, the end of the reporting period this security is non-income producing. Non-income producing, in the case of a fixed-income security, generally denotes that the issuer has (1) defaulted on the payment of principal or interest, (2) is under the protection of the Federal Bankruptcy Court or (3) the Fund's Adviser has concluded that the issue is not likely to meet its future interest payment obligations and has ceased accruing additional income on the Fund's records. |
| (7) | Investment, or portion of investment, has been pledged to collateralize the net payment obligations for investments in inverse floating rate transactions. |
| (8) | Investment valued at fair value using methods determined in good faith by, or at the discretion of, the Board. For fair value measurement disclosure purposes, investment classified as Level 3. See Notes to Financial Statements, Note 2 – Investment Valuation and Fair Value Measurements for more information. |
| (9) | Variable Rate Demand Preferred Shares, at Liquidation Value as a percentage of Total Investments is 29.5%. |
| (ETM) | Escrowed to maturity. |
| (IF) | Inverse floating rate investment. |
| (UB) | Underlying bond of an inverse floating rate trust reflected as a financing transaction. See Notes to Financial Statements, Note 3 – Portfolio Securities and Investments in Derivatives, Inverse Floating Rate Securities for more information. |
See accompanying notes to financial statements.
| NMZ | | |
| | Nuveen Municipal High Income Opportunity Fund | |
| | Portfolio of Investments | October 31, 2015 |
| | Principal | | | Optional Call | | | | |
| | Amount (000) | | Description (1) | Provisions (2) | Ratings (3) | | Value | |
| | | | LONG-TERM INVESTMENTS 113.0% (100.0% of Total Investments) | | | | | |
| | | | MUNICIPAL BONDS 111.4% (98.6% of Total Investments) | | | | | |
| | | | Alabama – 1.8% (1.6% of Total Investments) | | | | | |
| $ | 1,000 | | Adamsville Solid Waste Disposal Authority, Alabama, Solid Waste Disposal Revenue Bonds, Green Mountain Management LLC Project, Series 2010, 8.750%, 8/01/30 (4) | 8/20 at 100.00 | N/R | $ | 884,060 | |
| | 1,000 | | Alabama Industrial Development Authority, Solid Waste Disposal Revenue Bonds, Pine City Fiber Co. Project, Series 1993, 6.450%, 12/01/23 (Alternative Minimum Tax) | 1/16 at 100.00 | B3 | | 1,004,100 | |
| | 2,000 | | Alabama Private Colleges and University Facilities Authority, Limited Obligation Bonds, University of Mobile Project, Series 2015A, 6.000%, 9/01/45 | 9/25 at 100.00 | N/R | | 2,016,060 | |
| | 1,810 | | Bessemer, Alabama, General Obligation Warrants, Series 2007, 6.500%, 2/01/37 (Pre-refunded 2/01/17) | 2/17 at 101.00 | N/R (5) | | 1,928,971 | |
| | 2,000 | | Industrial Development Board of the City of Selma, Alabama, Environmental Improvement Revenue Bonds, Zilkha Biomass Selma LLC Project, Series 2015, 7.500%, 5/01/25 (Alternative Minimum Tax) | No Opt. Call | N/R | | 1,980,660 | |
| | 2,000 | | Jefferson County, Alabama, General Obligation Refunding Warrants, Series 2003A, 5.000%, 4/01/22 – NPFG Insured | 4/16 at 100.00 | AA– | | 2,000,680 | |
| | 1,000 | | Jefferson County, Alabama, General Obligation Warrants, Series 2004A, 5.000%, 4/01/24 – NPFG Insured | 4/16 at 100.00 | AA– | | 1,000,040 | |
| | 1,000 | | Jefferson County, Alabama, Limited Obligation School Warrants, Education Tax Revenue Bonds, Series 2004A, 5.000%, 1/01/24 | 1/16 at 100.00 | A– | | 1,005,820 | |
| | 1,000 | | Jefferson County, Alabama, Sewer Revenue Warrants, Senior Lien Series 2013C, 0.000%, 10/01/38 – AGM Insured | 10/23 at 105.00 | AA | | 706,160 | |
| | 12,810 | | Total Alabama | | | | 12,526,551 | |
| | | | Arizona – 4.3% (3.8% of Total Investments) | | | | | |
| | 1,420 | | Arizona Health Facilities Authority, Hospital Revenue Bonds, Banner Health Systems, Tender Option Bond Trust 2015-XF2046, 17.606%, 1/01/29 (IF) (6) | 1/18 at 100.00 | AA– | | 1,696,218 | |
| | 1,760 | | Arizona Health Facilities Authority, Hospital Revenue Bonds, Banner Health Systems, Tender Option Bond Trust 4695, 19.494%, 1/01/32 (IF) (6) | 1/18 at 100.00 | AA– | | 2,207,234 | |
| | 1,000 | | Estrella Mountain Ranch Community Facilities District, Goodyear, Arizona, General Obligation Bonds, Series 2007, 6.200%, 7/15/32 | 7/17 at 100.00 | N/R | | 1,036,380 | |
| | 257 | | Estrella Mountain Ranch Community Facilities District, Goodyear, Arizona, Special Assessment Lien Bonds, Series 2001A, 7.875%, 7/01/25 | 1/16 at 100.00 | N/R | | 257,727 | |
| | 3,000 | | Phoenix Industrial Development Authority, Arizona, Lease Revenue Bonds, Rowan University Project, Tender Option Bond Trust 1086, 17.122%, 6/01/42 – AGM Insured (IF) (6) | 6/22 at 100.00 | A | | 3,846,120 | |
| | 25 | | Pima County Industrial Development Authority, Arizona, Charter School Revenue Bonds, Choice Education and Development, Series 2006, 6.000%, 6/01/16 | No Opt. Call | N/R | | 25,321 | |
| | 1,000 | | Pima County Industrial Development Authority, Arizona, Charter School Revenue Bonds, Desert Heights Charter School, Series 2014, 7.250%, 5/01/44 | 5/24 at 100.00 | N/R | | 1,040,760 | |
| | 2,000 | | Pima County Industrial Development Authority, Arizona, Education Facility Revenue Bonds, San Tan Montessori School Project, Series 2014A , 9.000%, 2/01/44 | 2/24 at 100.00 | N/R | | 2,025,580 | |
| | 480 | | Pima County Industrial Development Authority, Arizona, Education Revenue Bonds Legacy Traditional School Project, Series 2009, 8.500%, 7/01/39 (Pre-refunded 7/01/19) | 7/19 at 100.00 | N/R (5) | | 591,307 | |
| | 2,250 | | Pima County Industrial Development Authority, Arizona, Education Revenue Bonds, American Charter School Foundation, Series 2007A, 5.625%, 7/01/38 | 7/17 at 100.00 | BB | | 2,103,750 | |
| | 2,500 | | Pima County Industrial Development Authority, Arizona, Education Revenue Bonds, Carden Traditional Schools Project, Series 2012, 7.500%, 1/01/42 | 1/22 at 100.00 | B | | 2,389,675 | |
| | Principal | | | Optional Call | | | | |
| | Amount (000) | | Description (1) | Provisions (2) | Ratings (3) | | Value | |
| | | | Arizona (continued) | | | | | |
| | | | Pima County Industrial Development Authority, Arizona, Education Revenue Bonds, Paradise Education Center Project, Series 2010: | | | | | |
| $ | 1,315 | | 6.000%, 6/01/40 | 6/19 at 100.00 | BB+ | $ | 1,356,317 | |
| | 500 | | 6.100%, 6/01/45 | 6/19 at 100.00 | BB+ | | 516,500 | |
| | 1,150 | | Pinal County Industrial Development Authority, Arizona, Correctional Facilities Contract Revenue Bonds, Florence West Prison LLC, Series 2002A, 5.250%, 10/01/22 – ACA Insured | 4/16 at 100.00 | BBB– | | 1,151,150 | |
| | 3,575 | | Quechan Indian Tribe of the Fort Yuma Reservation, Arizona, Government Project Bonds, Series 2008, 7.000%, 12/01/27 | 12/17 at 102.00 | B– | | 3,421,954 | |
| | 2,000 | | Quechan Indian Tribe of the Fort Yuma Reservation, Arizona, Tribal Economic Development Bonds, Series 2012A, 9.750%, 5/01/25 | 5/22 at 100.00 | B+ | | 2,245,740 | |
| | 2,500 | | Salt Verde Financial Corporation, Arizona, Senior Gas Revenue Bonds, Citigroup Energy Inc. Prepay Contract Obligations, Series 2007, 5.500%, 12/01/37 | No Opt. Call | A– | | 2,840,700 | |
| | 1,000 | | Yuma County Industrial Development Authority, Arizona, Exempt Revenue Bonds, Far West Water & Sewer Inc. Refunding, Series 2007A, 6.375%, 12/01/37 (Alternative Minimum Tax) | 12/17 at 100.00 | N/R | | 934,420 | |
| | 27,732 | | Total Arizona | | | | 29,686,853 | |
| | | | California – 16.3% (14.4% of Total Investments) | | | | | |
| | 1,470 | | Bay Area Toll Authority, California, Revenue Bonds, San Francisco Bay Area Toll Bridge, Tender Option Bond Trust 2985, 17.986%, 4/01/16 (IF) | No Opt. Call | AA | | 2,077,228 | |
| | 1,000 | | Beaumont Financing Authority, California, Local Agency Revenue Bonds, Improvement Area 7A-1, Series 2015A, 5.000%, 9/01/45 | 9/25 at 100.00 | N/R | | 1,048,240 | |
| | 1,000 | | California Enterprise Development Authority, Recovery Zone Facility Revenue Bonds, SunPower Corporation – Headquarters Project, Series 2010, 8.500%, 4/01/31 | 4/21 at 100.00 | N/R | | 1,142,850 | |
| | 2,205 | | California County Tobacco Securitization Agency, Tobacco Settlement Asset-Backed Bonds, Sonoma County Tobacco Securitization Corporation, Series 2005, 5.125%, 6/01/38 | 12/15 at 100.00 | B– | | 2,066,217 | |
| | | | California Health Facilities Financing Authority, Refunding Revenue Bonds, Stanford Hospital and Clinics, Tender Option Bond Trust 3267: | | | | | |
| | 1,250 | | 19.230%, 5/15/31 (IF) (6) | 11/21 at 100.00 | AA– | | 2,068,300 | |
| | 1,875 | | 20.220%, 11/15/40 (IF) (6) | 11/21 at 100.00 | AA– | | 3,249,300 | |
| | | | California Health Facilities Financing Authority, Revenue Bonds, Stanford Hospitals and Clinics, Tender Option Bond Trust 3294: | | | | | |
| | 250 | | 17.760%, 8/15/41 (IF) (6) | 8/22 at 100.00 | AA– | | 333,630 | |
| | 1,000 | | 17.755%, 8/15/41 (IF) (6) | 8/22 at 100.00 | AA– | | 1,334,420 | |
| | 1,020 | | California Municipal Finance Authority, Mobile Home Park Revenue Bonds, Caritas Affordable Housing Inc. Projects, Series 2014B, 5.875%, 8/15/49 | 8/24 at 100.00 | N/R | | 1,118,481 | |
| | 1,000 | | California Municipal Finance Authority, Mobile Home Park Revenue Bonds, Caritas Projects Series 2010B, 7.250%, 8/15/45 | 8/20 at 100.00 | N/R | | 1,118,630 | |
| | 1,000 | | California Municipal Finance Authority, Revenue Bonds, Harbor Regional Center Project, Series 2009, 8.500%, 11/01/39 (Pre-refunded 11/01/19) | 11/19 at 100.00 | AA (5) | | 1,285,430 | |
| | 1,970 | | California School Finance Authority, Educational Facilities Revenue Bonds, Tri-Valley Learning Corporation, Series 2012A, 7.000%, 6/01/47 | 6/20 at 102.00 | N/R | | 2,151,851 | |
| | 1,300 | | California State, General Obligation Bonds, Tender Option Bond Trust 3162, 20.022%, 3/01/18 – AGM Insured (IF) | No Opt. Call | AA | | 2,096,588 | |
| | | | California Statewide Communities Development Authority, California, Revenue Bonds, Loma Linda University Medical Center, Series 2014A: | | | | | |
| | 2,300 | | 5.250%, 12/01/44 | 12/24 at 100.00 | BB+ | | 2,407,295 | |
| | 1,000 | | 5.500%, 12/01/54 | 12/24 at 100.00 | BB+ | | 1,044,270 | |
| | 520 | | California Statewide Communities Development Authority, Revenue Bonds, American Baptist Homes of the West, Series 2010, 6.250%, 10/01/39 | 10/19 at 100.00 | BBB+ | | 573,232 | |
| | 4,000 | | California Statewide Communities Development Authority, Revenue Bonds, EnerTech Regional Biosolids Project, Series 2007A, 5.500%, 12/01/33 (Alternative Minimum Tax) (4) | No Opt. Call | N/R | | 12,600 | |
| | 1,000 | | California Statewide Communities Development Authority, Special Tax Bonds, Community Facilities District 2012-01, Fancher Creek, Series 2013A, 5.700%, 9/01/43 | 9/23 at 100.00 | N/R | | 1,044,350 | |
| NMZ | Nuveen Municipal High Income Opportunity Fund | |
| | Portfolio of Investments (continued) | October 31, 2015 |
| | Principal | | | Optional Call | | | | |
| | Amount (000) | | Description (1) | Provisions (2) | Ratings (3) | | Value | |
| | | | California (continued) | | | | | |
| $ | 1,650 | | California Statewide Communities Development Authority, Statewide Community Infrastructure Program Revenue Bonds, Series 2011A, 8.000%, 9/02/41 | 9/21 at 100.00 | N/R | $ | 1,786,109 | |
| | 500 | | California Statewide Community Development Authority, Revenue Bonds, California Baptist University, Series 2011A, 7.500%, 11/01/41 | 11/21 at 100.00 | N/R | | 584,435 | |
| | 2,750 | | California Statewide Community Development Authority, Revenue Bonds, Epidaurus Project, Series 2004A, 7.750%, 3/01/34 | 3/16 at 100.00 | N/R | | 2,771,093 | |
| | 1,250 | | California Statewide Community Development Authority, Revenue Bonds, St. Joseph Health System, Series 2007C, 5.750%, 7/01/47 – FGIC Insured | 7/18 at 100.00 | AA– | | 1,380,000 | |
| | 515 | | California Statewide Community Development Authority, Revenue Bonds, Sutter Health, Tender Option Bond Trust 3048, 17.693%, 11/15/38 (IF) | 5/18 at 100.00 | AA– | | 641,577 | |
| | | | California Statewide Community Development Authority, Revenue Bonds, Sutter Health, Tender Option Bond Trust 3102: | | | | | |
| | 745 | | 17.845%, 11/15/38 (IF) (6) | 5/18 at 100.00 | AA– | | 929,417 | |
| | 1,000 | | 18.922%, 11/15/48 (IF) (6) | 5/18 at 100.00 | AA– | | 1,265,440 | |
| | 1,880 | | Daly City Housing Development Finance Agency, California, Mobile Home Park Revenue Bonds, Franciscan Mobile Home Park Project, Refunding Third Tier Series 2007C, 6.500%, 12/15/47 | 12/17 at 100.00 | N/R | | 1,931,305 | |
| | 2,000 | | Daly City Housing Development Finance Agency, California, Mobile Home Park Revenue Bonds, Franciscan Mobile Home Park, Refunding Series 2007A, 5.000%, 12/15/37 | 12/17 at 100.00 | A | | 2,062,500 | |
| | 1,340 | | Elk Grove, California, Special Tax Bonds, Community Facilities District 2005-1, Series 2007, 5.250%, 9/01/37 | 9/16 at 101.00 | N/R | | 1,356,026 | |
| | 500 | | Fontana Public Financing Authority, California, Tax Allocation Revenue Bonds, North Fontana Redevelopment Project, Tender Option Bonds Trust 1013, 18.489%, 9/01/32 – AMBAC Insured (IF) (6) | 1/16 at 100.00 | A+ | | 525,600 | |
| | 1,000 | | Fontana, California, Special Tax Bonds, Community Facilities District 31 Citrus Heights North, Series 2006, 5.000%, 9/01/26 | 9/16 at 100.00 | N/R | | 1,014,320 | |
| | | | Golden State Tobacco Securitization Corporation, California, Tobacco Settlement Asset-Backed Bonds, Series 2007A-1: | | | | | |
| | 6,765 | | 5.000%, 6/01/33 | 6/17 at 100.00 | B | | 6,035,124 | |
| | 9,035 | | 5.750%, 6/01/47 | 6/17 at 100.00 | B | | 8,333,700 | |
| | 2,140 | | 5.125%, 6/01/47 | 6/17 at 100.00 | B | | 1,817,566 | |
| | 2,500 | | Golden State Tobacco Securitization Corporation, California, Tobacco Settlement Asset-Backed Bonds, Series 2007A-2, 5.300%, 6/01/37 | 6/22 at 100.00 | B | | 2,225,925 | |
| | 860 | | Golden State Tobacco Securitization Corporation, California, Tobacco Settlement Asset-Backed Bonds, Tender Option Bond Trust 2015-XF1038, 17.270%, 6/01/45 (IF) (6) | 6/25 at 100.00 | A+ | | 1,235,622 | |
| | 1,500 | | Grossmont Healthcare District, California, General Obligation Bonds, Tender Option Bond Trust 3253, 22.694%, 1/15/19 (IF) (6) | No Opt. Call | Aaa | | 3,090,600 | |
| | | | Hercules Redevelopment Agency, California, Tax Allocation Bonds, Merged Project Area, Series 2005: | | | | | |
| | 1,000 | | 5.000%, 8/01/25 – AMBAC Insured | 2/16 at 100.00 | N/R | | 1,000,400 | |
| | 1,000 | | 5.000%, 8/01/35 – AMBAC Insured | 2/16 at 100.00 | N/R | | 1,000,170 | |
| | 145 | | Lancaster Redevelopment Agency, California, Tax Allocation Bonds, Combined Redevelopment Project Areas Housing Programs, Series 2009, 6.875%, 8/01/39 | No Opt. Call | BBB | | 166,586 | |
| | 190 | | Lancaster Redevelopment Agency, California, Tax Allocation Bonds, Combined Redevelopment Project Areas Housing Programs, Series 2009, 6.875%, 8/01/39 (Pre-refunded 8/01/19) | 8/19 at 100.00 | N/R (5) | | 231,335 | |
| | 550 | | Lathrop Financing Authority, California, Revenue Bonds, Water Supply Project Series 2003, 6.000%, 6/01/35 | 12/15 at 100.00 | N/R | | 550,858 | |
| | 495 | | Lee Lake Public Financing Authority, California, Junior Lien Revenue Bonds, Series 2013B, 5.250%, 9/01/32 | 9/23 at 100.00 | N/R | | 534,971 | |
| | 850 | | Los Angeles County, California, Community Development Commission Headquarters Office Building, Lease Revenue Bonds, Community Development Properties Los Angeles County Inc., Tender Option Bond Trust Series 2011-23B, 18.449%, 9/01/42 (IF) (6) | 9/21 at 100.00 | Aa3 | | 1,334,806 | |
| | 1,825 | | Los Angeles Department of Airports, California, Revenue Bonds, Los Angeles International Airport, Tender Option Bond Trust 10-27B, 18.136%, 5/15/40 (IF) (6) | 5/20 at 100.00 | AA | | 2,788,089 | |
| | Principal | | | Optional Call | | | | |
| | Amount (000) | | Description (1) | Provisions (2) | Ratings (3) | | Value | |
| | | | California (continued) | | | | | |
| $ | 1,000 | | Lynwood Redevelopment Agency, California, Project A Revenue Bonds, Subordinate Lien Series 2011A, 7.000%, 9/01/31 | 9/21 at 100.00 | A– | $ | 1,242,290 | |
| | | | March Joint Powers Redevelopment Agency, California, March Air Force Base Redevelopment Project Tax Allocation Revenue Bonds, Series 2011A: | | | | | |
| | 1,000 | | 7.000%, 8/01/26 | 8/21 at 100.00 | A– | | 1,263,050 | |
| | 1,500 | | 7.500%, 8/01/41 | 8/21 at 100.00 | A– | | 1,898,775 | |
| | 470 | | Moreno Valley Unified School District, Riverside County, California, Special Tax Bonds, Community Facilities District 2005-3, Series 2007, 5.000%, 9/01/37 | 3/16 at 100.00 | N/R | | 478,216 | |
| | 500 | | National City Community Development Commission, California, Tax Allocation Bonds, National City Redevelopment Project, Series 2011, 7.000%, 8/01/32 | 8/21 at 100.00 | A– | | 626,925 | |
| | 330 | | Novato Redevelopment Agency, California, Tax Allocation Bonds, Hamilton Field Redevelopment Project, Series 2011, 6.750%, 9/01/40 | 9/21 at 100.00 | BBB+ | | 398,927 | |
| | | | Palomar Pomerado Health Care District, California, Certificates of Participation, Series 2010: | | | | | |
| | 550 | | 5.250%, 11/01/21 | 11/20 at 100.00 | Ba1 | | 594,083 | |
| | 1,000 | | 6.000%, 11/01/41 | 11/20 at 100.00 | Ba1 | | 1,062,390 | |
| | 250 | | Palomar Pomerado Health, California, General Obligation Bonds, Tender Option Bond Trust 4683, 18.038%, 8/01/37 – NPFG Insured (IF) (6) | 8/17 at 100.00 | AA– | | 307,360 | |
| | 1,000 | | Pittsburg Redevelopment Agency, California, Tax Allocation Bonds, Los Medanos Community Development Project, Refunding Series 2008A, 6.500%, 9/01/28 | 9/18 at 100.00 | BBB– | | 1,092,150 | |
| | 733 | | River Rock Entertainment Authority, California, Revenue Bonds, Senior Notes Series 2011B, 8.000%, 11/01/18 (4) | 11/15 at 104.00 | N/R | | 73,769 | |
| | 1,200 | | Riverside County Redevelopment Agency, California, Tax Allocation Bonds, Jurupa Valley Project Area, Series 2011B, 6.750%, 10/01/30 | 10/21 at 100.00 | A | | 1,478,040 | |
| | | | Sacramento City Financing Authority California, Lease Revenue Bonds, Master Lease Program Facilities Projects, Tender Option Bond Trust 4698: | | | | | |
| | 750 | | 18.064%, 12/01/30 – AMBAC Insured (IF) (6) | No Opt. Call | A+ | | 1,396,710 | |
| | 2,015 | | 18.166%, 12/01/33 – AMBAC Insured (IF) (6) | No Opt. Call | A+ | | 3,819,795 | |
| | 2,500 | | San Bernardino Community College District, California, General Obligation Bonds, Tender Option Bond Trust 11780, 17.486%, 2/01/27 (Pre-refunded 8/01/16 – AGM Insured (IF) | 8/16 at 100.00 | AA (5) | | 2,859,400 | |
| | | | San Buenaventura, California, Revenue Bonds, Community Memorial Health System, Series 2011: | | | | | |
| | 960 | | 8.000%, 12/01/26 | 12/21 at 100.00 | BB | | 1,248,874 | |
| | 1,000 | | 8.000%, 12/01/31 | 12/21 at 100.00 | BB | | 1,255,000 | |
| | 4,000 | | San Joaquin Hills Transportation Corridor Agency, Orange County, California, Toll Road Revenue Bonds, Refunding Junior Lien Series 2014B, 5.250%, 1/15/49 | 1/25 at 100.00 | BB+ | | 4,269,880 | |
| | 3,000 | | San Joaquin Hills Transportation Corridor Agency, Orange County, California, Toll Road Revenue Bonds, Refunding Senior Lien Series 2014A, 5.000%, 1/15/44 | 1/25 at 100.00 | BBB– | | 3,182,700 | |
| | 1,000 | | San Jose, California, Airport Revenue Bonds, Tender Option Bond Trust 2015-XF01212, 17.477%, 9/01/30 – AGM Insured (IF) (6) | 3/17 at 100.00 | AA | | 1,180,680 | |
| | 1,000 | | Santa Margarita Water District, California, Special Tax Bonds, Community Facilities District 2013-1 Village of Sendero, Series 2013, 5.625%, 9/01/43 | 9/23 at 100.00 | N/R | | 1,104,320 | |
| | 1,000 | | Santee Community Development Commission, California, Santee Redevelopment Project Tax Allocation Bonds, Series 2011A, 7.000%, 8/01/41 | 2/21 at 100.00 | A | | 1,220,580 | |
| | 1,000 | | Temecula Public Financing Authority, California, Special Tax Bonds, Community Facilities District 03-02 Roripaugh, Series 2006, 5.450%, 9/01/26 | 3/16 at 100.00 | N/R | | 1,001,700 | |
| | 1,000 | | Temecula Redevelopment Agency, California, Tax Allocation Revenue Bonds, Redevelopment Project 1, Series 2002, 5.250%, 8/01/36 – NPFG Insured | 2/16 at 100.00 | AA– | | 1,001,270 | |
| | 1,890 | | Tobacco Securitization Authority of Northern California, Tobacco Settlement Asset-Backed Bonds, Series 2005A-1, 5.500%, 6/01/45 | 12/15 at 100.00 | B– | | 1,708,012 | |
| | 650 | | Twentynine Palms Redevelopment Agency, California, Tax Allocation Bonds, Four Corners Project Area, Series 2011A, 7.650%, 9/01/42 | 9/21 at 100.00 | BBB+ | | 817,018 | |
| NMZ | Nuveen Municipal High Income Opportunity Fund | |
| | Portfolio of Investments (continued) | October 31, 2015 |
| | Principal | | | Optional Call | | | | |
| | Amount (000) | | Description (1) | Provisions (2) | Ratings (3) | | Value | |
| | | | California (continued) | | | | | |
| $ | 1,250 | | University of California, General Revenue Bonds, Tender Option Bond Trust 2013-24U, 18.260%, 5/15/39 (IF) (6) | 5/23 at 100.00 | AA | $ | 1,902,400 | |
| | 101,693 | | Total California | | | | 111,250,800 | |
| | | | Colorado – 9.2% (8.1% of Total Investments) | | | | | |
| | 989 | | Arista Metropolitan District, Colorado, Special Revenue Bonds, Series 2005, 6.750%, 12/01/35 | 12/15 at 100.00 | N/R | | 989,049 | |
| | 2,000 | | Brighton Crossing Metropolitan District 4, Colorado, General Obligation Bonds, Limited Tax Convertible to Unlimited Tax, Refunding Series 2013, 7.000%, 12/01/23 | 7/18 at 100.00 | N/R | | 2,032,360 | |
| | 2,000 | | Cimarron Metropolitan District, Arvada, Colorado, Limited Tax Revenue Bonds, Convertible to Unlimited Tax, Series 2012, 6.000%, 12/01/22 | 10/17 at 100.00 | N/R | | 2,005,580 | |
| | 750 | | Colorado Educational and Cultural Facilities Authority, Charter School Revenue Bonds, Community Leadership Academy Project, Series 2008, 6.250%, 7/01/28 | 7/18 at 100.00 | BB | | 774,420 | |
| | 1,000 | | Colorado Educational and Cultural Facilities Authority, Charter School Revenue Bonds, Jefferson County School District R-1 – Compass Montessori Secondary School, Series 2006, 5.625%, 2/15/36 | 2/16 at 101.00 | N/R | | 1,001,930 | |
| | 2,320 | | Colorado Educational and Cultural Facilities Authority, Charter School Revenue Bonds, Mountain Phoenix Community School, Series 2012, 7.000%, 10/01/42 | 10/22 at 100.00 | N/R | | 2,404,425 | |
| | 200 | | Colorado Educational and Cultural Facilities Authority, Charter School Revenue Bonds, Skyview Academy Project, Series 2014, 5.375%, 7/01/44 | 7/24 at 100.00 | BB+ | | 209,002 | |
| | 1,860 | | Colorado Educational and Cultural Facilities Authority, Charter School Revenue Bonds, Windsor Academy, Series 2007A, 5.700%, 5/01/37 | 5/17 at 100.00 | BBB– | | 1,888,309 | |
| | 1,825 | | Colorado Educational and Cultural Facilities Authority, Revenue Bonds, Pikes Peak School of Expeditionary Learning Charter School, Series 2008, 6.625%, 6/01/38 | 6/18 at 102.00 | N/R | | 1,910,994 | |
| | 2,500 | | Colorado Health Facilities Authority, Colorado, Revenue Bonds, American Baptist Homes of the Midwest Obligated Group, Series 2013, 8.000%, 8/01/43 | 2/24 at 100.00 | N/R | | 2,949,850 | |
| | 1,350 | | Colorado Health Facilities Authority, Colorado, Revenue Bonds, Colorado Senior Residences Project, Series 2012, 6.750%, 6/01/32 (4) | 6/22 at 100.00 | N/R | | 1,085,211 | |
| | 750 | | Colorado Health Facilities Authority, Health Facilities Revenue Bonds, Sisters of Charity of Leavenworth Health Services Corporation, Tender Option Bond Trust 2015-XF0054, 18.839%, 1/01/18 (IF) | No Opt. Call | AA– | | 1,140,660 | |
| | 1,285 | | Colorado Health Facilities Authority, Revenue Bonds, Craig Hospital Project, Series 2012, 5.000%, 12/01/32 (UB) (6) | 12/22 at 100.00 | A | | 1,423,279 | |
| | 290 | | Colorado Health Facilities Authority, Revenue Bonds, Evangelical Lutheran Good Samaritan Society, Series 2006, 5.250%, 6/01/36 | 6/16 at 100.00 | BBB+ | | 294,025 | |
| | 710 | | Colorado Health Facilities Authority, Revenue Bonds, Evangelical Lutheran Good Samaritan Society, Series 2006, 5.250%, 6/01/36 (Pre-refunded 6/01/16) | 6/16 at 100.00 | N/R (5) | | 730,484 | |
| | | | Colorado Housing and Finance Authority, Revenue Bonds, Confluence Energy LLC Project, Series 2007: | | | | | |
| | 518 | | 5.000%, 9/01/16 (Alternative Minimum Tax) (7) | No Opt. Call | N/R | | 493,753 | |
| | 5,045 | | 6.750%, 4/01/27 (Alternative Minimum Tax) | 4/17 at 100.00 | N/R | | 5,056,200 | |
| | 2,223 | | Colorado Housing and Finance Authority, Revenue Bonds, Confluence Energy LLC Project, Series 2013, 6.875%, 10/01/27 (Alternative Minimum Tax) | No Opt. Call | N/R | | 2,261,509 | |
| | 2,000 | | Compark Business Campus Metropolitan District, Douglas County, Colorado, General Obligation Bonds, Series 2012A, 6.750%, 12/01/39 – RAAI Insured | 12/22 at 100.00 | N/R | | 2,160,000 | |
| | | | Confluence Metropolitan District, Colorado, General Obligation Limited Tax Bonds, Series 2007: | | | | | |
| | 1,000 | | 5.400%, 12/01/27 | 12/17 at 100.00 | N/R | | 948,890 | |
| | 1,500 | | 5.450%, 12/01/34 | 12/17 at 100.00 | N/R | | 1,390,845 | |
| | 1,000 | | Denver City and County, Colorado, Special Facilities Airport Revenue Bonds, United Air Lines Corporation, Series 2007A, 5.250%, 10/01/32 (Alternative Minimum Tax) | 10/17 at 100.00 | BB– | | 1,031,150 | |
| | 2,000 | | E-470 Public Highway Authority, Colorado, Toll Revenue Bonds, Series 2004A, 0.000%, 9/01/27 – NPFG Insured | No Opt. Call | AA– | | 1,356,320 | |
| | 1,023 | | Fitzsimons Village Metropolitan District 1, Aurora, Arapahoe County, Colorado, Tax Increment Public Improvement Fee Supported Revenue Bonds, Series 2010A, 7.500%, 3/01/40 | 3/20 at 100.00 | N/R | | 1,120,819 | |
| | Principal | | | Optional Call | | | | |
| | Amount (000) | | Description (1) | Provisions (2) | Ratings (3) | | Value | |
| | | | Colorado (continued) | | | | | |
| $ | 1,000 | | Fitzsimons Village Metropolitan District 3, Arapahoe County, Colorado, Tax Increment/Public Improvement Fee Supported Revenue Bonds, Series 2014A, 6.000%, 3/01/44 | No Opt. Call | N/R | $ | 1,009,910 | |
| | | | Foothills Metropolitan District, Fort Collins, Colorado, Special Revenue Bonds, Series 2014: | | | | | |
| | 1,000 | | 5.750%, 12/01/30 | 12/24 at 100.00 | N/R | | 1,065,260 | |
| | 1,080 | | 6.000%, 12/01/38 | 12/24 at 100.00 | N/R | | 1,147,576 | |
| | 1,989 | | Great Western Metropolitan District 5, Colorado, General Obligation Limited Tax Revenue Bonds, Series 2009A-1, 9.000%, 8/01/39 (Mandatory put 12/01/19) | 12/19 at 100.00 | N/R | | 2,069,256 | |
| | 2,000 | | Heritage Todd Creek Metropolitan District, Colorado, General Obligation Bonds Limited Tax, Refunding & Improvement Series 2015, 6.125%, 12/01/44 | 12/24 at 100.00 | N/R | | 1,967,860 | |
| | 985 | | Heritage Todd Creek Metropolitan District, Colorado, General Obligation Bonds Limited Tax, Series 2007A, 5.500%, 12/01/37 | 12/17 at 100.00 | N/R | | 970,225 | |
| | 1,000 | | Iliff Commons Metropolitan District 2, City of Aurora, Arapahoe County, Colorado, General Obligation Bonds, Limited Tax Convertible to Unlimited Tax Series 2015, 6.250%, 12/01/44 | 12/20 at 100.00 | N/R | | 1,003,750 | |
| | 3,145 | | Kit Carson County Health Service District, Colorado, Health Care Facility Revenue Bonds, Series 2007, 6.750%, 1/01/34 | 1/18 at 100.00 | N/R | | 3,280,518 | |
| | 1,250 | | Lewis Pointe Metropolitan District, Thornton, Colorado, Limited Tax Convertible to Unlimited Tax General Obligation Bonds, Series 2015A, 6.000%, 12/01/44 | 12/20 at 100.00 | N/R | | 1,257,788 | |
| | 5 | | Maher Ranch Metropolitan District 4, Colorado, General Obligation Limited Tax Bonds, Series 2007, 5.250%, 12/01/36 – RAAI Insured | 12/17 at 100.00 | AA | | 5,121 | |
| | | | Mountain Shadows Metropolitan District, Colorado, General Obligation Limited Tax Bonds, Series 2007: | | | | | |
| | 1,000 | | 5.500%, 12/01/27 | 12/16 at 100.00 | N/R | | 980,250 | |
| | 1,000 | | 5.625%, 12/01/37 | 12/16 at 100.00 | N/R | | 956,610 | |
| | 2,000 | | Murphy Creek Metropolitan District 3, Aurora, Colorado, General Obligation Bonds, Refunding & Improvement Series 2006, 6.125%, 12/01/35 (8) | 12/15 at 100.00 | N/R | | 1,344,740 | |
| | 1,080 | | Promenade at Castle Rock Metropolitan District 1, Colorado, General Obligation Bonds, Limited Tax Series 2015A, 5.750%, 12/01/39 | 12/20 at 103.00 | N/R | | 1,068,142 | |
| | | | Regional Transportation District, Colorado, Denver Transit Partners Eagle P3 Project Private Activity Bonds, Series 2010: | | | | | |
| | 1,000 | | 6.500%, 1/15/30 | 7/20 at 100.00 | Baa3 | | 1,161,140 | |
| | 1,000 | | 6.000%, 1/15/41 | 7/20 at 100.00 | Baa3 | | 1,126,550 | |
| | 1,440 | | Rendezvous Residential Metropolitan District, Colorado, Limited Tax General Obligation Bonds, Refunding Series 2007, 5.375%, 12/01/21 | 12/17 at 100.00 | N/R | | 1,241,640 | |
| | 1,000 | | STC Metropolitan District 2, Superior, Boulder County, Colorado, Limited Tax General Obligation Bonds, Series 2015A, 6.000%, 12/01/38 | 12/19 at 103.00 | N/R | | 955,500 | |
| | 875 | | STC Metropolitan District 2, Superior, Boulder County, Colorado, Limited Tax General Obligation Bonds, Series 2015B, 7.750%, 12/15/38 | 12/19 at 103.00 | N/R | | 864,238 | |
| | 3,000 | | Stone Ridge Metropolitan District 2, Colorado, General Obligation Bonds, Limited Tax Convertible to Unlimited, Series 2007, 7.250%, 12/01/31 (9) | 12/17 at 100.00 | N/R | | 659,850 | |
| | 1,815 | | Three Springs Metropolitan District 3, Durango, La Plata County, Colorado, Property Tax Supported Revenue Bonds, Series 2010, 7.750%, 12/01/39 | 12/20 at 100.00 | N/R | | 1,939,618 | |
| | 64,802 | | Total Colorado | | | | 62,734,606 | |
| | | | Connecticut – 0.8% (0.7% of Total Investments) | | | | | |
| | 2,500 | | Harbor Point Infrastructure Improvement District, Connecticut, Special Obligation Revenue Bonds, Harbor Point Project, Series 2010A, 7.875%, 4/01/39 | 4/20 at 100.00 | N/R | | 2,955,825 | |
| | 5,157 | | Mashantucket Western Pequot Tribe, Connecticut, Special Revenue Bonds, Subordinate Series 2013A, 6.050%, 7/01/31 (4) | No Opt. Call | N/R | | 340,194 | |
| | 1,000 | | Mohegan Tribe of Indians of Connecticut, Gaming Authority Priority Distribution Payment Public Improvement Bonds, Series 2003, 5.250%, 1/01/33 | 1/16 at 100.00 | B– | | 939,690 | |
| | 1,000 | | Stamford, Connecticut, Special Obligation Revenue Bonds, Mill River Corridor Project, Series 2011aA, 7.000%, 4/01/41 (Pre-refunded 4/01/21) | 4/21 at 100.00 | N/R (5) | | 1,280,760 | |
| | 9,657 | | Total Connecticut | | | | 5,516,469 | |
| NMZ | Nuveen Municipal High Income Opportunity Fund | |
| | Portfolio of Investments (continued) | October 31, 2015 |
| | Principal | | | Optional Call | | | | |
| | Amount (000) | | Description (1) | Provisions (2) | Ratings (3) | | Value | |
| | | | Delaware – 0.4% (0.3% of Total Investments) | | | | | |
| $ | 2,500 | | Delaware Economic Development Authority, Revenue Bonds, Odyssey Charter School Inc. Project, Series 2015A, 7.000%, 9/01/45 | 3/25 at 100.00 | N/R | $ | 2,478,025 | |
| | | | District of Columbia – 0.7% (0.6% of Total Investments) | | | | | |
| | 225 | | District of Columbia Tobacco Settlement Corporation, Tobacco Settlement Asset-Backed Bonds, Series 2001, 6.500%, 5/15/33 | No Opt. Call | Baa1 | | 278,993 | |
| | 1,000 | | District of Columbia, Revenue Bonds, Cesar Chavez Public Charter Schools for Public Policy, Series 2011, 7.500%, 11/15/31 | 11/20 at 100.00 | BBB– | | 1,147,540 | |
| | 2,500 | | District of Columbia, Revenue Bonds, Howard University, Tender Option Bond Trust 1006, 22.853%, 10/01/37 (IF) (6) | 4/21 at 100.00 | BBB | | 3,220,400 | |
| | 250 | | District of Columbia, Revenue Bonds, KIPP DC Issue, Series 2013A, 6.000%, 7/01/33 | 7/23 at 100.00 | BBB+ | | 287,660 | |
| | 3,975 | | Total District of Columbia | | | | 4,934,593 | |
| | | | Florida – 13.8% (12.2% of Total Investments) | | | | | |
| | 1,500 | | Alachua County Health Facilities Authority, Florida, Health Facilities Revenue Bonds, Terraces at Bonita Springs Project, Series 2011A, 8.125%, 11/15/46 | No Opt. Call | N/R | | 1,772,880 | |
| | 885 | | Ave Maria Stewardship Community District, Florida, Capital Improvement Revenue Bonds, Series 2006A, 5.125%, 5/01/38 | 5/16 at 100.00 | N/R | | 843,555 | |
| | 1,925 | | Ave Maria Stewardship Community District, Florida, Capital Improvement Revenue Bonds, Series 2012, 6.700%, 5/01/42 | 5/22 at 100.00 | N/R | | 2,025,235 | |
| | 1,735 | | Ave Maria Stewardship Community District, Florida, Capital Improvement Revenue Bonds, Series 2015, 5.375%, 5/01/45 | 5/25 at 100.00 | N/R | | 1,724,833 | |
| | 1,035 | | Beeline Community Development District, Palm Beach County, Florida, Special Assessment Bonds, Series 2008A, 7.000%, 5/01/37 | 5/18 at 100.00 | N/R | | 1,083,842 | |
| | 905 | | Belmont Community Development District, Florida, Capital Improvement Revenue Bonds, Phase 1 Project, Series 2013A, 6.125%, 11/01/33 | 11/24 at 100.00 | N/R | | 989,826 | |
| | 960 | | Boggy Creek Improvement District, Orlando, Florida, Special Assessment Revenue Bonds, Refunding Series 2013, 5.125%, 5/01/43 | 5/23 at 100.00 | N/R | | 992,755 | |
| | 2,700 | | Brevard County, Florida, Industrial Development Revenue Bonds, TUFF Florida Tech Project, Series 2009, 6.500%, 11/01/29 | 11/19 at 100.00 | BB+ | | 2,929,041 | |
| | 700 | | Broward County, Florida, Airport Facility Revenue Bonds, Learjet Inc., Series 2000, 7.500%, 11/01/20 (Alternative Minimum Tax) | 11/16 at 100.00 | B2 | | 704,907 | |
| | 1,435 | | Capital Projects Finance Authority, Student Housing Revenue Bonds, Capital Projects Loan Program – Florida Universities, Series 2001F, 5.000%, 10/01/31 – NPFG Insured | 4/16 at 100.00 | AA– | | 1,434,885 | |
| | 1,000 | | Celebration Pointe Community Development District 1, Alachua County, Florida, Special Assessment Revenue Bonds, Series 2014, 5.125%, 5/01/45 | 5/24 at 100.00 | N/R | | 1,007,430 | |
| | 2,000 | | Collier County Industrial Development Authority, Florida, Continuing Care Community Revenue Bonds, Arlington of Naples Project, Series 2014A, 7.750%, 5/15/35 | 5/24 at 100.00 | N/R | | 2,330,080 | |
| | 1,000 | | Copperstone Community Development District, Manatee County, Florida, Capital Improvement Revenue Bonds, Series 2007, 5.200%, 5/01/38 | 5/17 at 100.00 | N/R | | 1,005,500 | |
| | 995 | | Cordoba Ranch Community Development District, Hillsborough County, Florida, Special Assessment Revenue Bonds, Series 2006, 5.550%, 5/01/37 | 5/16 at 100.00 | N/R | | 1,000,313 | |
| | 900 | | Fishhawk Community Development District IV, Hillsborough County, Florida, Special Assessment Revenue Bonds, Series 2013A, 7.000%, 5/01/33 | 5/23 at 100.00 | N/R | | 973,323 | |
| | 1,850 | | Florida Development Finance Corporation, Educational Facilities Revenue Bonds, Downtown Doral Charter Elementary School Project, Series 2014A, 6.500%, 7/01/44 | 7/24 at 100.00 | N/R | | 1,917,951 | |
| | 1,000 | | Florida Development Finance Corporation, Educational Facilities Revenue Bonds, Renaissance Charter School, Inc. Projects, Series 2010A, 6.000%, 9/15/40 | 9/20 at 100.00 | BB+ | | 1,037,040 | |
| | 3,500 | | Florida Development Finance Corporation, Educational Facilities Revenue Bonds, Renaissance Charter School, Inc. Projects, Series 2011A, 7.625%, 6/15/41 | 6/21 at 100.00 | BB– | | 4,125,520 | |
| | 4,000 | | Florida Development Finance Corporation, Educational Facilities Revenue Bonds, Renaissance Charter School, Inc. Projects, Series 2013A, 8.500%, 6/15/44 | 6/23 at 100.00 | N/R | | 4,628,160 | |
| | Principal | | | Optional Call | | | | |
| | Amount (000) | | Description (1) | Provisions (2) | Ratings (3) | | Value | |
| | | | Florida (continued) | | | | | |
| $ | 2,500 | | Grand Bay at Doral Community Development District, Miami-Dade County, Florida, Special Assessment Bonds, Doral Breeze Project Series 2012, 5.500%, 11/01/32 | 11/22 at 100.00 | N/R | $ | 2,593,850 | |
| | 1,000 | | Grand Bay at Doral Community Development District, Miami-Dade County, Florida, Special Assessment Improvement Bonds, Assessment Area Two Project, Refunding Series 2014A-2, 6.500%, 5/01/39 | 5/24 at 100.00 | N/R | | 990,490 | |
| | 845 | | Grand Hampton Community Development District, Florida, Capital Improvement Revenue Bonds, Series 2005, 5.500%, 5/01/36 | 11/15 at 100.00 | N/R | | 845,068 | |
| | 1,960 | | Harmony Community Development District, Florida, Capital Improvement Revenue Bonds, Special Assessment, Refunding Series 2014, 5.250%, 5/01/32 | 5/24 at 100.00 | N/R | | 1,985,402 | |
| | 2,700 | | Hawks Point Community Development District, Florida, Special Assessment Revenue Bonds, Series 2007A, 5.300%, 5/01/39 | 5/17 at 100.00 | N/R | | 2,738,934 | |
| | 3,000 | | Jacksonville Economic Development Commission, Florida, Health Care Facilities Revenue Bonds, Florida Proton Therapy Institute Project, Series 2007A, 6.250%, 9/01/27 | 9/17 at 100.00 | N/R | | 3,170,010 | |
| | 1,000 | | Lake County, Florida, Industrial Development Revenue Bonds, Crane's View Lodge Project, Series 2012A, 7.125%, 11/01/42 | No Opt. Call | N/R | | 906,820 | |
| | 1,000 | | Lakes by the Bay South Community Development District, Florida, Special Assessment Bonds, Series 2012, 5.750%, 11/01/42 | 11/22 at 100.00 | N/R | | 1,040,800 | |
| | 665 | | Lakewood Ranch Stewardship District, Florida, Special Assessment Revenue Bonds, Lakewood Centre North Project, Series 2015, 4.875%, 5/01/45 | No Opt. Call | N/R | | 667,487 | |
| | 2,000 | | Lee County Industrial Development Authority, Florida, Charter School Revenue Bonds, Lee County Community Charter Schools, Series 2007A, 5.375%, 6/15/37 | 6/17 at 100.00 | BB | | 2,028,280 | |
| | 1,000 | | Lee County Industrial Development Authority, Florida, Healthcare Facilities Revenue Bonds, Shell Point/Alliance Obligated Group, Shell Point Village/Alliance Community Project, Series 2007, 5.000%, 11/15/22 | 5/17 at 100.00 | BBB– | | 1,051,230 | |
| | 750 | | Miami-Dade County Industrial Development Authority, Florida, Revenue Bonds, Youth Co-Op Charter Schools Project, Series 2015A, 6.000%, 9/15/45 | 9/25 at 100.00 | N/R | | 750,488 | |
| | 1,000 | | Miami-Dade County, Florida, Aviation Revenue Bonds, Series 2008, Trust 1145, 18.220%, 10/01/38 – AGC Insured (Alternative Minimum Tax) (IF) (6) | 10/18 at 100.00 | AA | | 1,368,320 | |
| | 1,250 | | Miami-Dade County, Florida, Water and Sewer System Revenue Bonds, Tender Option Bond Trust 11834, 18.065%, 10/01/33 – AGM Insured (IF) | 10/20 at 100.00 | AA | | 1,911,100 | |
| | 1,880 | | Myrtle Creek Improvement District, Florida, Special Assessment Revenue Bonds, Series 2006A, 5.200%, 5/01/37 | 5/16 at 100.00 | N/R | | 1,890,641 | |
| | | | Palm Beach County Health Facilities Authority, Florida, Revenue Bonds, Sinai Residences of Boca Raton Project, Series 2014A: | | | | | |
| | 620 | | 7.000%, 6/01/29 | 6/22 at 102.00 | N/R | | 733,510 | |
| | 3,110 | | 7.500%, 6/01/49 | 6/22 at 102.00 | N/R | | 3,730,352 | |
| | 1,510 | | Palm Glades Community Development District, Florida, Special Assessment Bonds, Series 2006A, 5.300%, 5/01/36 | 5/16 at 100.00 | N/R | | 1,515,859 | |
| | 4,335 | | Pine Island Community Development District, Florida, Special Assessment Bonds, Bella Collina, Series 2004, 5.750%, 5/01/35 | 11/15 at 100.00 | N/R | | 4,335,000 | |
| | 990 | | Poinciana West Community Development District, Florida, Special Assessment Bonds, Series 2007, 6.000%, 5/01/37 | 5/17 at 100.00 | N/R | | 1,007,137 | |
| | 450 | | Port Saint Lucie. Florida, Special Assessment Revenue Bonds, Southwest Annexation District 1B, Series 2007, 5.000%, 7/01/33 – NPFG Insured | 7/17 at 100.00 | AA– | | 477,252 | |
| | 1,855 | | Reunion West Community Development District, Florida, Special Assessment Bonds, Series 2004A-1, 6.250%, 5/01/36 | 5/22 at 100.00 | N/R | | 1,941,591 | |
| | 990 | | Shingle Creek Community Development District, Florida, Special Assessment Revenue Bonds, Series 2015, 5.400%, 11/01/45 | 11/25 at 100.00 | N/R | | 982,724 | |
| | 975 | | South Fork Community Development District, Florida, Capital Improvement Revenue Bonds, Series 2005, 5.350%, 5/01/36 | 11/15 at 100.00 | N/R | | 975,156 | |
| | 1,190 | | Stoneybrook Venice Community Development District, Florida, Capital Improvement Revenue Bonds, Series 2007, 6.750%, 5/01/38 | 5/18 at 100.00 | N/R | | 1,222,404 | |
| NMZ | Nuveen Municipal High Income Opportunity Fund | |
| | Portfolio of Investments (continued) | October 31, 2015 |
| | Principal | | | Optional Call | | | | |
| | Amount (000) | | Description (1) | Provisions (2) | Ratings (3) | | Value | |
| | | | Florida (continued) | | | | | |
| $ | 1,095 | | Sweetwater Creek Community Development District, Saint John's County, Florida, Capital Improvement Revenue Bonds, Series 2007A, 5.500%, 5/01/38 | 5/17 at 100.00 | N/R | $ | 1,099,292 | |
| | 1,250 | | Tolomato Community Development District, Florida, Special Assessment Bonds, Convertible, Capital Appreciation, Series 2012A-2, 0.000%, 5/01/39 | 5/17 at 100.00 | N/R | | 939,350 | |
| | 2,515 | | Tolomato Community Development District, Florida, Special Assessment Bonds, Convertible, Capital Appreciation, Series 2012A-3, 0.000%, 5/01/40 | 5/19 at 100.00 | N/R | | 1,507,315 | |
| | 1,540 | | Tolomato Community Development District, Florida, Special Assessment Bonds, Convertible, Capital Appreciation, Series 2012A-4, 0.000%, 5/01/40 | 5/22 at 100.00 | N/R | | 683,960 | |
| | | | Tolomato Community Development District, Florida, Special Assessment Bonds, Hope Note, Series 2007-3: | | | | | |
| | 120 | | 6.375%, 5/01/17 (4) | 11/15 at 100.00 | N/R | | 1 | |
| | 1,360 | | 6.650%, 5/01/40 (4) | 5/18 at 100.00 | N/R | | 14 | |
| | 2,845 | | Tolomato Community Development District, Florida, Special Assessment Bonds, Hope Note, Series 2007A-2, 5.250%, 5/01/39 (4) | 5/17 at 100.00 | N/R | | 28 | |
| | 120 | | Tolomato Community Development District, Florida, Special Assessment Bonds, Non Performing ParcelSeries 2007-1. RMKT, 6.650%, 5/01/40 (4) | 5/18 at 100.00 | N/R | | 122,436 | |
| | 735 | | Tolomato Community Development District, Florida, Special Assessment Bonds, Non Performing ParcelSeries 2007A-1. RMKT, 5.250%, 5/01/39 | 5/17 at 100.00 | N/R | | 691,466 | |
| | | | Tolomato Community Development District, Florida, Special Assessment Bonds, Refunding Series 2012A-1: | | | | | |
| | 90 | | 6.375%, 5/01/17 | No Opt. Call | N/R | | 89,653 | |
| | 535 | | 5.250%, 5/01/39 | 5/17 at 100.00 | N/R | | 536,236 | |
| | 2,350 | | 6.650%, 5/01/40 | 5/17 at 100.00 | N/R | | 2,380,903 | |
| | 3,740 | | Tolomato Community Development District, Florida, Special Assessment Bonds, Refunding Series 2015-1, 0.000%, 5/01/40 (4) | 5/18 at 100.00 | N/R | | 2,310,759 | |
| | 2,300 | | Tolomato Community Development District, Florida, Special Assessment Bonds, Refunding Series 2015-2, 0.000%, 5/01/40 (4) | 5/18 at 100.00 | N/R | | 1,202,394 | |
| | 2,505 | | Tolomato Community Development District, Florida, Special Assessment Bonds, Refunding Series 2015-3, 6.610%, 5/01/40 (4) | 5/18 at 100.00 | N/R | | 25 | |
| | 4,370 | | Tolomato Community Development District, Florida, Special Assessment Bonds, Series 2006, 5.400%, 5/01/37 | 11/15 at 100.00 | N/R | | 4,373,103 | |
| | 970 | | Two Creeks Community Development District, Florida, Capital Improvement Revenue Bonds, Series 2006, 5.250%, 5/01/37 | 5/16 at 100.00 | N/R | | 967,769 | |
| | 1,000 | | Venetian Parc Community Development District, Miami-Dade County, Florida, Special Assessment Bonds, Area One Project, Series 2013, 6.500%, 11/01/43 | 11/28 at 100.00 | N/R | | 1,157,550 | |
| | 1,000 | | Waterset North Community Development District, Hillsborough County, Florida, Special Assessment Revenue Bonds, Series 2014, 5.500%, 11/01/45 | 11/24 at 100.00 | N/R | | 1,003,940 | |
| | 975 | | West Villages Improvement District, Florida, Special Assessment Revenue Bonds, Series 2006, 5.500%, 5/01/37 | 11/15 at 100.00 | N/R | | 975,088 | |
| | 1,000 | | Windsor at Westside Community Development District, Osceola County, Florida, Special Assessment Bonds, Area 1 Project, Series 2015, 5.125%, 11/01/45 | 11/25 at 100.00 | N/R | | 1,002,720 | |
| | 101,015 | | Total Florida | | | | 94,430,983 | |
| | | | Georgia – 1.6% (1.4% of Total Investments) | | | | | |
| | 1,000 | | Atlanta Urban Residential Finance Authority, Georgia, Multifamily Housing Revenue Bonds, Trestletree Village Apartments, Series 2013A, 5.000%, 11/01/48 | 11/23 at 100.00 | BBB+ | | 1,001,960 | |
| | 890 | | Atlanta, Georgia, Tax Allocation Bonds, Beltline Project Series 2008A. Remarketed, 7.500%, 1/01/31 | 1/19 at 100.00 | A2 | | 1,028,867 | |
| | 1,250 | | Clayton County Development Authority, Georgia, Special Facilities Revenue Bonds, Delta Air Lines, Inc. Project, Series 2009A, 8.750%, 6/01/29 | 6/20 at 100.00 | BB | | 1,532,300 | |
| | 1,880 | | Douglas County Development Authority, Georgia, Charter School Revenue Bonds, Brighten Academy Project, Series 2013A, 7.125%, 10/01/43 | 10/23 at 100.00 | N/R | | 2,049,332 | |
| | Principal | | | Optional Call | | | | |
| | Amount (000) | | Description (1) | Provisions (2) | Ratings (3) | | Value | |
| | | | Georgia (continued) | | | | | |
| $ | 1,000 | | Fulton County Development Authority, Georgia, Revenue Bonds, Amana Academy Project, Series 2013A, 6.500%, 4/01/43 | 4/23 at 100.00 | N/R | $ | 1,005,050 | |
| | 1,000 | | Fulton County Residential Care Facilities Elderly Authority, Georgia, First Mortgage Revenue Bonds, Lenbrook Project, Series 2006A, 5.125%, 7/01/37 | 7/17 at 100.00 | N/R | | 1,007,920 | |
| | 1,140 | | Fulton County Residential Care Facilities Elderly Authority, Georgia, First Mortgage Revenue Bonds, Lenbrook Project, Series 2006B, 7.300%, 7/01/42 (Mandatory put 7/01/23) | No Opt. Call | N/R | | 1,156,439 | |
| | | | Liberty County Industrial Authority, Georgia, Revenue Bonds, Series 2014: | | | | | |
| | 392 | | 5.500%, 7/15/23 | 7/21 at 100.00 | N/R | | 397,237 | |
| | 767 | | 5.500%, 7/15/30 | 7/21 at 100.00 | N/R | | 777,569 | |
| | 842 | | 5.500%, 1/15/36 | 7/21 at 100.00 | N/R | | 853,634 | |
| | 10,161 | | Total Georgia | | | | 10,810,308 | |
| | | | Guam – 0.6% (0.5% of Total Investments) | | | | | |
| | 2,445 | | Guam Government, General Obligation Bonds, 2009 Series A, 7.000%, 11/15/39 (Pre-refunded 11/15/19) | 11/19 at 100.00 | BB– (5) | | 3,017,546 | |
| | | | Guam International Airport Authority, Revenue Bonds, Series 2013C: | | | | | |
| | 330 | | 6.375%, 10/01/43 (Alternative Minimum Tax) | 10/23 at 100.00 | BBB | | 385,787 | |
| | 500 | | 6.125%, 10/01/43 – AGM Insured (Alternative Minimum Tax) | 10/23 at 100.00 | AA | | 581,070 | |
| | 3,275 | | Total Guam | | | | 3,984,403 | |
| | | | Hawaii – 0.4% (0.4% of Total Investments) | | | | | |
| | 875 | | Hawaii Department of Budget and Finance, Private School Revenue Bonds, Montessori of Maui, Series 2007, 5.500%, 1/01/37 | 2/17 at 100.00 | N/R | | 883,278 | |
| | 1,655 | | Hawaii Department of Budget and Finance, Special Purpose Revenue Bonds, Hawaiian Electric Company, Inc. and Subsidiary Projects, Series 2009, 6.500%, 7/01/39 | 7/19 at 100.00 | Baa1 | | 1,878,193 | |
| | 2,530 | | Total Hawaii | | | | 2,761,471 | |
| | | | Idaho – 0.1% (0.1% of Total Investments) | | | | | |
| | 500 | | Idaho Health Facilities Authority, Revenue Bonds, Saint Luke's Health System Project, Tender Option Bond Trust 1102, 16.799%, 3/01/47 – AGM Insured (IF) (6) | 3/22 at 100.00 | A– | | 657,180 | |
| | | | Illinois – 9.2% (8.1% of Total Investments) | | | | | |
| | 1,000 | | Bolingbrook, Illinois, Sales Tax Revenue Bonds, Series 2005, 6.250%, 1/01/24 | 1/17 at 100.00 | N/R | | 999,350 | |
| | 1,000 | | Chicago Board of Education, Illinois, General Obligation Bonds, Dedicated Revenues, Project Series 2015C, 5.250%, 12/01/39 | 12/24 at 100.00 | BB+ | | 900,350 | |
| | 1,813 | | Chicago, Illinois, Certificates of Participation Tax Increment Bonds, 35th and State Redevelopment Project, Series 2012, 6.100%, 1/15/29 | No Opt. Call | N/R | | 1,817,162 | |
| | 2,665 | | Chicago, Illinois, Certificates of Participation, Tax Increment Allocation Revenue Bonds, Diversey-Narragansett Project, Series 2006, 7.460%, 2/15/26 | 2/16 at 100.00 | N/R | | 1,929,194 | |
| | 1,000 | | Chicago, Illinois, General Obligation Bonds, Project and Refunding Series 2005D, 5.500%, 1/01/37 | 1/25 at 100.00 | BBB+ | | 1,030,410 | |
| | 900 | | Chicago, Illinois, General Obligation Bonds, Project and Refunding Series 2014A, 5.250%, 1/01/30 | 1/24 at 100.00 | BBB+ | | 922,149 | |
| | 1,500 | | Chicago, Illinois, General Obligation Bonds, Variable Rate Demand Series 2007F, 5.500%, 1/01/42 | 1/25 at 100.00 | BBB+ | | 1,540,080 | |
| | 4,000 | | Cook County, Illinois, Recovery Zone Facility Revenue Bonds, Navistar International Corporation Project, Series 2010, 6.500%, 10/15/40 | 10/20 at 100.00 | Caa1 | | 4,155,960 | |
| | 2,180 | | Evanston, Illinois, Educational Facility Revenue Bonds, Roycemore School Project, Series 2011, 8.250%, 7/01/41 | 7/21 at 100.00 | N/R | | 2,464,294 | |
| | 1,000 | | Gilberts Village, Kane County, Illinois, Special Tax Bonds, Special Service Area 15, Refunding Series 2014, 5.000%, 3/01/35 – AGM Insured | 3/24 at 100.00 | AA | | 1,076,850 | |
| | 635 | | Illinois Finance Authority Revenue Bonds, Christian Homes, Inc., Refunding Series 2010, 5.500%, 5/15/23 | 11/15 at 100.00 | BBB– | | 635,730 | |
| | 3,370 | | Illinois Finance Authority, Charter School Revenue Bonds, Chicago Charter School Foundation, Series 2007, 5.000%, 12/01/36 | 12/16 at 100.00 | BBB | | 3,387,726 | |
| NMZ | Nuveen Municipal High Income Opportunity Fund | |
| | Portfolio of Investments (continued) | October 31, 2015 |
| | Principal | | | Optional Call | | | | |
| | Amount (000) | | Description (1) | Provisions (2) | Ratings (3) | | Value | |
| | | | Illinois (continued) | | | | | |
| $ | 1,000 | | Illinois Finance Authority, Recovery Zone Facility Revenue Bonds, Navistar International Corporation Project, Series 2010, 6.500%, 10/15/40 | 10/20 at 100.00 | Caa1 | $ | 1,034,540 | |
| | | | Illinois Finance Authority, Revenue Bonds, Admiral at Lake Project, Series 2010A: | | | | | |
| | 500 | | 7.750%, 5/15/30 | 5/20 at 100.00 | N/R | | 569,805 | |
| | 1,625 | | 8.000%, 5/15/46 | 5/20 at 100.00 | N/R | | 1,859,390 | |
| | 1,100 | | Illinois Finance Authority, Revenue Bonds, Elmhurst Memorial Healthcare, Series 2008A, 5.625%, 1/01/37 | 1/18 at 100.00 | Baa2 | | 1,174,756 | |
| | 1,500 | | Illinois Finance Authority, Revenue Bonds, Lake Forest College, Series 2012A, 6.000%, 10/01/48 | 10/22 at 100.00 | BBB– | | 1,633,305 | |
| | 1,000 | | Illinois Finance Authority, Revenue Bonds, Montgomery Place Project, Series 2006A, 5.750%, 5/15/38 | 5/17 at 100.00 | N/R | | 1,008,830 | |
| | 2,500 | | Illinois Finance Authority, Revenue Bonds, OSF Healthcare System, Tender Option Bond Trust 4702, 20.104%, 11/15/37 (Pre-refunded 11/15/17) (IF) (6) | 11/17 at 100.00 | A (5) | | 3,516,500 | |
| | 2,900 | | Illinois Finance Authority, Revenue Bonds, Provena Health, Series 2009A, 7.750%, 8/15/34 | 8/19 at 100.00 | BBB+ | | 3,503,461 | |
| | 1,770 | | Illinois Finance Authority, Revenue Bonds, Sherman Health Systems, Series 2007A, 5.500%, 8/01/37 (Pre-refunded 8/01/17) | 8/17 at 100.00 | N/R (5) | | 1,920,379 | |
| | 165 | | Illinois Finance Authority, Revenue Bonds, Silver Cross Hospital and Medical Centers, Refunding Series 2015C, 5.000%, 8/15/44 | 8/25 at 100.00 | Baa1 | | 177,212 | |
| | | | Illinois Finance Authority, Revenue Bonds, Silver Cross Hospital and Medical Centers, Series 2009: | | | | | |
| | 2,000 | | 6.875%, 8/15/38 (Pre-refunded 8/15/19) | 8/19 at 100.00 | N/R (5) | | 2,436,520 | |
| | 3,850 | | 7.000%, 8/15/44 (Pre-refunded 8/15/19) | 8/19 at 100.00 | N/R (5) | | 4,708,165 | |
| | | | Illinois Finance Authority, Revenue Bonds, The Carle Foundation, Tender Option Bond Trust 2015-XF0121: | | | | | |
| | 250 | | 21.477%, 2/15/19 – AGM Insured (IF) (6) | No Opt. Call | AA | | 426,960 | |
| | 1,685 | | 21.461%, 2/15/35 – AGM Insured (IF) (6) | 8/21 at 100.00 | AA | | 2,876,817 | |
| | 6,020 | | Illinois Finance Authority, Student Housing Revenue Bonds, MJH Education Assistance Illinois IV LLC, Fullerton Village Project, Series 2004A, 5.125%, 6/01/35 (4) | 12/15 at 100.00 | Caa2 | | 5,417,334 | |
| | 200 | | Illinois State, General Obligation Bonds, Series 2012A, 5.000%, 3/01/36 | 3/22 at 100.00 | A– | | 205,116 | |
| | 1,105 | | Lombard Public Facilities Corporation, Illinois, First Tier Conference Center and Hotel Revenue Bonds, Series 2005A-1, 7.125%, 1/01/36 (10) | 1/16 at 100.00 | N/R | | 528,190 | |
| | 2,000 | | Lombard Public Facilities Corporation, Illinois, First Tier Conference Center and Hotel Revenue Bonds, Series 2005A-2, 5.500%, 1/01/36 – ACA Insured | 1/16 at 100.00 | CC | | 1,696,720 | |
| | | | Lombard Public Facilities Corporation, Illinois, Second Tier Conference Center and Hotel Revenue Bonds, Series 2005B: | | | | | |
| | 285 | | 5.250%, 1/01/25 (11) | 1/16 at 100.00 | D | | 113,943 | |
| | 1,175 | | 5.250%, 1/01/36 (11) | 1/16 at 100.00 | D | | 469,765 | |
| | 1,431 | | Lombard Public Facilities Corporation, Illinois, Third Tier Conference Center and Hotel Revenue Bonds, Series 2005C-3, 12.000%, 1/01/36 (4) | 7/18 at 100.00 | N/R | | 128,532 | |
| | 800 | | Railsplitter Tobacco Settlement Authority, Illinois, Tobacco Settlement Revenue Bonds, Series 2010, 6.000%, 6/01/28 | 6/21 at 100.00 | A– | | 949,664 | |
| | 1,000 | | Rantoul, Champaign County, Illinois, Tax Increment Revenue Bonds, Evans Road Series 2013B, 7.000%, 12/01/33 | 12/23 at 100.00 | N/R | | 1,056,428 | |
| | 1,000 | | Southwestern Illinois Development Authority, Health Facility Revenue Bonds, Memorial Group, Inc., Series 2013, 7.125%, 11/01/43 | 11/23 at 100.00 | BB+ | | 1,252,700 | |
| | 750 | | Springfield, Sangamon County, Illinois, Special Service Area, Legacy Pointe, Special Assessment Bonds, Series 2009, 7.875%, 3/01/32 | 3/17 at 102.00 | N/R | | 781,500 | |
| | 953 | | Volo Village, Illinois, Special Service Area 3 Special Tax Bonds, Symphony Meadows Project 1, Series 2006, 6.000%, 3/01/36 | 3/16 at 102.00 | N/R | | 958,470 | |
| | 895 | | Yorkville United City Business District, Illinois, Storm Water and Water Improvement Project Revenue Bonds, Series 2007, 6.000%, 1/01/26 | 1/17 at 102.00 | N/R | | 536,902 | |
| | Principal | | | Optional Call | | | | |
| | Amount (000) | | Description (1) | Provisions (2) | Ratings (3) | | Value | |
| | | | Illinois (continued) | | | | | |
| $ | 1,103 | | Yorkville, Illinois, Special Tax Bonds, Special Service Area 2005-108 Autumn Creek Project, Series 2006, 6.000%, 3/01/36 | 3/16 at 102.00 | N/R | $ | 1,098,279 | |
| | 61,625 | | Total Illinois | | | | 62,899,438 | |
| | | | Indiana – 3.4% (3.0% of Total Investments) | | | | | |
| | 5,860 | | Carmel Redevelopment District, Indiana, Tax Increment Revenue Bonds, Series 2004A, 6.650%, 1/15/24 | 1/16 at 100.00 | N/R | | 5,872,365 | |
| | 1,000 | | Indiana Bond Bank, Special Program Bonds, Hendricks Regional Health Project, Tender Option Bond Trust 10-77W, 18.620%, 4/01/30 – AMBAC Insured (IF) (6) | No Opt. Call | AA | | 1,862,150 | |
| | 1,250 | | Indiana Bond Bank, Special Program Gas Revenue Bonds, JP Morgan Ventures Energy Corporation Guaranteed, Tender Option Bond Trust 2015-XF0115, 17.922%, 4/15/18 (IF) (6) | No Opt. Call | A | | 2,021,050 | |
| | 2,000 | | Indiana Finance Authority, Environmental Improvement Revenue Bonds, United States Steel Corporation Project, Series 2012, 5.750%, 8/01/42 (Alternative Minimum Tax) | No Opt. Call | BB– | | 1,776,800 | |
| | 500 | | Indiana Finance Authority, Hospital Revenue Bonds, King's Daughters' Hospital and Health Services, Series 2010, 5.500%, 8/15/45 | 8/20 at 100.00 | BBB+ | | 539,045 | |
| | | | Indiana Finance Authority, Revenue Bonds, Trinity Health Care Group Revenue Bonds, Tender Option Bond Trust 2015-XF0106: | | | | | |
| | 1,290 | | 17.888%, 6/01/32 (IF) (6) | 12/20 at 100.00 | AA | | 1,824,524 | |
| | 1,250 | | 18.882%, 12/01/32 (IF) (6) | 12/19 at 100.00 | AA | | 1,836,500 | |
| | 1,000 | | Indiana Health and Educational Facilities Financing Authority, Revenue Bonds, Ascension Health, Tender Option Bond Trust 2015-XF0090, 17.850%, 5/15/33 (IF) | 11/16 at 100.00 | AA+ | | 1,156,840 | |
| | 1,000 | | Shoals, Indiana, Exempt Facilities Revenue Bonds, National Gypsum Company Project, Series 2013, 7.250%, 11/01/43 (Alternative Minimum Tax) | 11/23 at 100.00 | N/R | | 1,112,410 | |
| | 1,000 | | St. Joseph County, Indiana, Economic Development Revenue Bonds, Chicago Trail Village Apartments, Series 2005A, 7.500%, 7/01/35 | 7/18 at 100.00 | N/R | | 1,034,430 | |
| | | | Vigo County Hospital Authority, Indiana, Revenue Bonds, Union Hospital, Series 2007: | | | | | |
| | 250 | | 5.700%, 9/01/37 | 9/17 at 100.00 | N/R | | 258,590 | |
| | 4,050 | | 5.800%, 9/01/47 | 9/17 at 100.00 | N/R | | 4,191,183 | |
| | 20,450 | | Total Indiana | | | | 23,485,887 | |
| | | | Iowa – 1.2% (1.1% of Total Investments) | | | | | |
| | 1,000 | | Iowa Finance Authority, Health Facility Revenue Bonds, Care Initiatives Project, Series 2006A, 5.500%, 7/01/25 | 7/16 at 100.00 | BB+ | | 1,015,670 | |
| | 2,570 | | Iowa Finance Authority, Iowa, Midwestern Disaster Area Revenue Bonds, Alcoa Inc. Project, Series 2012, 4.750%, 8/01/42 | 8/22 at 100.00 | BBB– | | 2,565,962 | |
| | 2,215 | | Iowa Finance Authority, Iowa, Midwestern Disaster Area Revenue Bonds, Iowa Fertilizer Company Project, Series 2013, 5.250%, 12/01/25 | 12/23 at 100.00 | BB– | | 2,428,637 | |
| | | | Iowa Tobacco Settlement Authority, Asset Backed Settlement Revenue Bonds, Series 2005C: | | | | | |
| | 1,000 | | 5.375%, 6/01/38 | 12/15 at 100.00 | B+ | | 944,410 | |
| | 1,220 | | 5.625%, 6/01/46 | 12/15 at 100.00 | B+ | | 1,180,716 | |
| | 8,005 | | Total Iowa | | | | 8,135,395 | |
| | | | Kentucky – 0.2% (0.2% of Total Investments) | | | | | |
| | 500 | | Kentucky Economic Development Finance Authority, Hospital Facilities Revenue Bonds, Owensboro Medical Health System, Series 2010A, 6.000%, 6/01/30 | 6/20 at 100.00 | BBB+ | | 568,515 | |
| | 1,000 | | Kentucky Housing Corporation, Multifamily Housing Revenue Bonds, Heritage Green Apartments Project, Series 2015, 5.625%, 5/01/45 | 5/25 at 100.00 | N/R | | 1,001,820 | |
| | 1,500 | | Total Kentucky | | | | 1,570,335 | |
| | | | Louisiana – 4.2% (3.7% of Total Investments) | | | | | |
| | 2,350 | | Ascension Parish Industrial development Board, Louisiana, Revenue Bonds, Impala Warehousing (US) LLC Project, Series 2013, 6.000%, 7/01/36 | 7/23 at 100.00 | N/R | | 2,596,868 | |
| | 8,500 | | Louisiana Local Government Environmental Facilities & Community Development Authority, Revenue Bonds, Westlake Chemical Corporation Project, Series 2007, 6.750%, 11/01/32 | 11/17 at 100.00 | BBB+ | | 9,222,242 | |
| NMZ | Nuveen Municipal High Income Opportunity Fund | |
| | Portfolio of Investments (continued) | October 31, 2015 |
| | Principal | | | Optional Call | | | | |
| | Amount (000) | | Description (1) | Provisions (2) | Ratings (3) | | Value | |
| | | | Louisiana (continued) | | | | | |
| $ | 915 | | Louisiana Local Government Environmental Facilities and Community Development Authority, Revenue Bonds, CDF Healthcare of Louisiana LLC, Series 2006A, 7.000%, 6/01/36 (Pre-refunded 6/01/16) | 6/16 at 101.00 | N/R (5) | $ | 956,934 | |
| | | | Louisiana Local Government Environmental Facilities and Community Development Authority, Revenue Bonds, Southgate Suites Retail Project, Series 2007A: | | | | | |
| | 7,000 | | 6.750%, 12/15/37 (4) | 12/17 at 100.00 | N/R | | 4,504,990 | |
| | 1,115 | | 6.000%, 12/15/37 (4) | 12/15 at 100.00 | N/R | | 612,871 | |
| | 100 | | Louisiana Local Government Environmental Facilities and Community Development Authority, Revenue Bonds, Southgate Suites Retail Project, Series 2007B, 9.000%, 12/15/14 | No Opt. Call | N/R | | 54,966 | |
| | 500 | | Louisiana Local Government Environmental Facilities and Community Development Authority, Revenue Bonds, Westlake Chemical Corporation Projects, Series 2010A-1, 6.500%, 11/01/35 | 11/20 at 100.00 | BBB+ | | 590,410 | |
| | | | Louisiana Local Government Environmental Facilities and Community Development Authority, Revenue Bonds, Woman's Hospital Foundation Project, Tender Option Bonds Trust 1012: | | | | | |
| | 750 | | 20.435%, 10/01/40 (IF) (6) | 10/20 at 100.00 | A | | 1,172,610 | |
| | 750 | | 20.423%, 10/01/40 (IF) (6) | 10/20 at 100.00 | A | | 1,172,348 | |
| | 1,000 | | Louisiana Public Facilities Authority, Dock and Wharf Revenue Bonds, Impala Warehousing (US) LLC Project, Series 2013, 6.500%, 7/01/36 (Alternative Minimum Tax) | 7/23 at 100.00 | N/R | | 1,113,410 | |
| | 2,000 | | Louisiana Public Facilities Authority, Revenue Bonds, Lake Charles Charter Academy Foundation Project, Series 2011A, 7.750%, 12/15/31 | 12/21 at 100.00 | N/R | | 2,256,040 | |
| | 2,110 | | Louisiana Public Facilities Authority, Revenue Bonds, Southwest Louisiana Charter Academy Foundation Project, Series 2013A, 8.125%, 12/15/33 | 12/23 at 100.00 | N/R | | 2,445,659 | |
| | 2,000 | | Louisiana Public Facilities Authority, Solid Waste Disposal Facility Revenue Bonds, Louisiana Pellets Inc. Project, Series 2015, 7.000%, 7/01/24 (Alternative Minimum Tax) | No Opt. Call | N/R | | 2,009,260 | |
| | 29,090 | | Total Louisiana | | | | 28,708,608 | |
| | | | Maine – 0.5% (0.4% of Total Investments) | | | | | |
| | 3,155 | | Portland Housing Development Corporation, Maine, Section 8 Assisted Senior Living Revenue Bonds, Avesta Housing Development Corporation, Series 2004A, 6.000%, 2/01/34 | 2/16 at 100.00 | Baa2 | | 3,167,052 | |
| | | | Maryland – 0.6% (0.6% of Total Investments) | | | | | |
| | 1,210 | | Baltimore, Maryland, Senior Lien Convention Center Hotel Revenue Bonds, Series 2006A, 5.250%, 9/01/39 – SYNCORA GTY Insured | 9/16 at 100.00 | Ba1 | | 1,234,987 | |
| | 3,000 | | Maryland Economic Development Corporation, Revenue Bonds, Chesapeake Bay Hyatt Conference Center, Series 2006A, 5.000%, 12/01/31 (4) | 12/16 at 100.00 | N/R | | 1,710,000 | |
| | 2,500 | | Maryland Economic Development Corporation, Revenue Bonds, Chesapeake Bay Hyatt Conference Center, Series 2006B, 5.250%, 12/01/31 | 12/16 at 100.00 | N/R | | 1,425,000 | |
| | 6,710 | | Total Maryland | | | | 4,369,987 | |
| | | | Massachusetts – 0.1% (0.1% of Total Investments) | | | | | |
| | 90 | | Boston Industrial Development Financing Authority, Massachusetts, Senior Revenue Bonds, Crosstown Center Project, Series 2002, 6.500%, 9/01/35 (Alternative Minimum Tax) (4), (7) | 3/16 at 100.00 | Caa3 | | 82,564 | |
| | 419 | | Massachusetts Development Finance Agency, Revenue Bonds, Northern Berkshire Community Services Inc., Series 2012A, 6.000%, 2/15/43 (4), (7) | 1/16 at 103.00 | D | | 12,367 | |
| | 333 | | Massachusetts Development Finance Agency, Revenue Bonds, Northern Berkshire Community Services Inc., Series 2012B, 0.000%, 2/15/43 (4), (7) | 1/16 at 17.70 | D | | 9,845 | |
| | 475 | | Massachusetts Development Finance Agency, Revenue Bonds, Northern Berkshire Community Services Inc., Series 2012C, 0.000%, 2/15/43 (4), (7) | 1/16 at 103.00 | D | | 14,017 | |
| | 480 | | Massachusetts Port Authority, Special Facilities Revenue Bonds, Delta Air Lines Inc., Series 2001A, 5.000%, 1/01/27 – AMBAC Insured (Alternative Minimum Tax) | 1/16 at 100.00 | N/R | | 480,974 | |
| | 1,797 | | Total Massachusetts | | | | 599,767 | |
| | | | Michigan – 3.0% (2.6% of Total Investments) | | | | | |
| | | | Detroit Local Development Finance Authority, Michigan, Tax Increment Bonds, Series 1998A: | | | | | |
| | 900 | | 5.500%, 5/01/21 | 11/15 at 100.00 | B– | | 875,772 | |
| | 10 | | 5.500%, 5/01/21 – ACA Insured | 11/15 at 100.00 | B– | | 9,731 | |
| | Principal | | | Optional Call | | | | |
| | Amount (000) | | Description (1) | Provisions (2) | Ratings (3) | | Value | |
| | | | Michigan (continued) | | | | | |
| $ | 4,000 | | Detroit, Michigan, Distributable State Aid General Obligation Bonds, Limited Tax Series 2010, 5.250%, 11/01/35 | 11/20 at 100.00 | AA | $ | 4,288,357 | |
| | 88 | | Detroit, Michigan, General Obligation Bonds, Series 2003A, 5.250%, 4/01/22 | 4/16 at 100.00 | N/R | | 87,289 | |
| | 116 | | Detroit, Michigan, General Obligation Bonds, Series 2004A-1, 5.250%,
4/01/19 – AMBAC Insured | 4/16 at 100.00 | N/R | | 116,320 | |
| | 477 | | Michigan Finance Authority, Detroit, Michigan, Local Government Loan Program, Unlimited Tax General Obligation Bonds, Series 2014G-4A, 5.250%, 4/01/22 – SYNCORA GTY Insured | 4/16 at 100.00 | A– | | 476,967 | |
| | 634 | | Michigan Finance Authority, Detroit, Michigan, Local Government Loan Program, Unlimited Tax General Obligation Bonds, Series 2014G-5A, 5.250%, 4/01/19 – AMBAC Insured | 4/16 at 100.00 | A– | | 634,130 | |
| | 970 | | Michigan Finance Authority, Public School Academy Limited Obligation Revenue Bonds, Hope Academy Project, Series 2011, 8.125%, 4/01/41 | 4/21 at 100.00 | BB– | | 842,746 | |
| | 1,000 | | Michigan Finance Authority, Public School Academy Limited Obligation Revenue Bonds, Voyageur Academy Project, Series 2011, 8.000%, 7/15/41 | 7/21 at 100.00 | B– | | 909,450 | |
| | 1,670 | | Michigan Public Educational Facilities Authority, Charter School Revenue Bonds, American Montessori Academy, Series 2007, 6.500%, 12/01/37 | 12/17 at 100.00 | N/R | | 1,694,516 | |
| | 1,000 | | Michigan Public Educational Facilities Authority, Limited Obligation Revenue Bonds, Chandler Park Academy Project, Series 2008, 6.500%, 11/01/35 | 11/15 at 100.00 | BBB | | 1,001,480 | |
| | 1,000 | | Michigan Public Educational Facilities Authority, Limited Obligation Revenue Bonds, Richfield Public School Academy, Series 2007, 5.000%, 9/01/36 | 9/17 at 100.00 | BBB– | | 1,002,190 | |
| | 895 | | Michigan Public Educational Facilities Authority, Limited Obligation Revenue Bonds, David Ellis Academy-West Charter School Project, Series 2007, 5.875%, 6/01/37 | 6/17 at 100.00 | N/R | | 896,291 | |
| | 1,500 | | Michigan State Hospital Finance Authority, Revenue Bonds, Hills and Dales General Hospital, Series 2005A, 6.750%, 11/15/38 | 11/15 at 102.00 | N/R | | 1,531,698 | |
| | 985 | | Michigan Strategic Fund, Limited Obligation Revenue Bonds, Detroit Thermal LLC Project, Series 2013, 8.500%, 12/01/30 (Alternative Minimum Tax) | 12/23 at 100.00 | N/R | | 949,501 | |
| | 940 | | Michigan Strategic Fund, Limited Obligation Revenue Bonds, Events Center Project, Series 2014A, 4.125%, 7/01/45 (Mandatory put 1/01/19) | 7/18 at 100.00 | N/R | | 953,301 | |
| | 905 | | Michigan Strategic Fund, Solid Waste Facility Limited Obligation Revenue Bonds, Canton Renewables, LLC ? Sauk Trail Hills Project, Series 2014, 6.750%, 7/01/22 (Alternative Minimum Tax) | No Opt. Call | N/R | | 931,498 | |
| | 1,000 | | Royal Oak Hospital Finance Authority, Michigan, Hospital Revenue Bonds, William Beaumont Hospital, Refunding Series 2009V, 8.250%, 9/01/39 (Pre-refunded 9/01/18) | 9/18 at 100.00 | Aaa | | 1,205,690 | |
| | | | Summit Academy North, Michigan, Revenue Bonds, Public School Academy Series 2005: | | | | | |
| | 1,000 | | 5.500%, 11/01/30 | 11/15 at 100.00 | BB | | 1,000,010 | |
| | 500 | | 5.500%, 11/01/35 | 11/15 at 100.00 | BB | | 498,195 | |
| | 500 | | Summit Academy, Michigan, Revenue Bonds, Public School Academy Series 2005, 6.375%, 11/01/35 | 11/15 at 100.00 | BB | | 500,315 | |
| | 20,090 | | Total Michigan | | | | 20,405,447 | |
| | | | Minnesota – 0.3% (0.3% of Total Investments) | | | | | |
| | 1,000 | | Columbus, Minnesota, Charter School Lease Revenue Bonds, New Millennium Academy Project, Series 2015A, 6.000%, 7/01/45 | 7/25 at 100.00 | BB | | 1,000,630 | |
| | 1,000 | | Saint Paul Port Authority, Minnesota, Solid Waste Disposal Revenue Bonds, Gerdau Saint Paul Steel Mill Project, Series 2012-7, 4.500%, 10/01/37 (Alternative Minimum Tax) | 10/22 at 100.00 | BBB– | | 950,710 | |
| | 2,000 | | Total Minnesota | | | | 1,951,340 | |
| | | | Mississippi – 0.3% (0.2% of Total Investments) | | | | | |
| | 738 | | Mississippi Home Corporation, Multifamily Housing Revenue Bonds, Tupelo Personal Care Apartments, Series 2004-2, 6.125%, 9/01/34 (Alternative Minimum Tax) | 10/19 at 101.00 | N/R | | 743,642 | |
| | 1,000 | | Warren County, Mississippi, Gulf Opportunity Zone Revenue Bonds, International Paper Company Project, Series 2008A, 6.500%, 9/01/32 | 9/18 at 100.00 | BBB | | 1,127,130 | |
| | 1,738 | | Total Mississippi | | | | 1,870,772 | |
| NMZ | Nuveen Municipal High Income Opportunity Fund | |
| | Portfolio of Investments (continued) | October 31, 2015 |
| | Principal | | | Optional Call | | | | |
| | Amount (000) | | Description (1) | Provisions (2) | Ratings (3) | | Value | |
| | | | Missouri – 2.3% (2.0% of Total Investments) | | | | | |
| $ | 1,000 | | Hanley Road Corridor Transportation Development District, Brentwood and Maplewood, Missouri, Transportation Sales Revenue Bonds, Refunding Series 2009A, 5.875%, 10/01/36 | 10/19 at 100.00 | A– | $ | 1,114,840 | |
| | 2,000 | | Joplin Industrial Development Authority, Missouri, Tax Increment Revenue Bonds, Joplin Recovery TIF Redevelopment Project, Series 2013B, 5.875%, 4/01/36 | 4/23 at 100.00 | N/R | | 2,117,780 | |
| | 2,000 | | Liberty, Missouri, Special Obligation Tax Increment and Special Districts Bonds, Liberty Commons Project, Subordinate Lien Series 2015B, 8.500%, 6/15/46 | 6/25 at 100.00 | N/R | | 2,009,460 | |
| | 5,935 | | Missouri Environmental Improvement and Energy Resources Authority, Water Facility Revenue Bonds, Missouri-American Water Company, Series 2006, 4.600%, 12/01/36 – AMBAC Insured (Alternative Minimum Tax) (UB) (6) | 12/16 at 100.00 | AA+ | | 6,023,491 | |
| | 1,100 | | Saint Louis Industrial Development Authority, Missouri, Confluence Academy Project, Series 2007A, 5.350%, 6/15/32 | 6/18 at 100.00 | N/R | | 1,083,742 | |
| | 970 | | Saint Louis Land Clearance for Redevelopment Authority, Missouri, Tax-Exempt Recovery Zone Facilities Improvement, Special Revenue Bonds, Kiel Opera House Project, Series 2010B, 7.000%, 9/01/35 | 9/20 at 100.00 | N/R | | 1,006,918 | |
| | 1,640 | | Saint Louis, Missouri, Tax Increment Financing Revenue Bonds, Fashion Square Redevelopment Project, Series 2008A, 6.300%, 8/22/26 | 2/16 at 100.00 | N/R | | 1,580,156 | |
| | 732 | | Saint Louis, Missouri, Tax Increment Financing Revenue Bonds, Grace Lofts Redevelopment Projects, Series 2007A, 6.000%, 3/27/26 | 3/16 at 100.00 | N/R | | 684,625 | |
| | 15,377 | | Total Missouri | | | | 15,621,012 | |
| | | | Nebraska – 1.6% (1.4% of Total Investments) | | | | | |
| | 6,485 | | Omaha Public Power District, Nebraska, Separate Electric System Revenue Bonds, Nebraska City 2, Tender Option Bond Trust 11673, 20.228%,
8/01/40 – BHAC Insured (IF) | 2/17 at 100.00 | AA+ | | 10,808,096 | |
| | | | Nevada – 0.9% (0.8% of Total Investments) | | | | | |
| | 2,500 | | Clark County, Nevada, General Obligation Bank Bonds, Southern Nevada Water Authority Loan, Tender Option Bond Trust Series 2010-11836, 18.185%, 6/01/16 (IF) | No Opt. Call | Aa1 | | 3,364,800 | |
| | 500 | | Henderson, Nevada, Limited Obligation Bonds, Local Improvement District T-18, Inspirada Series 2006, 5.125%, 9/01/19 | 3/16 at 100.00 | N/R | | 492,015 | |
| | | | Sparks Tourism Improvement District 1, Legends at Sparks Marina, Nevada, Senior Sales Tax Revenue Bonds Series 2008A: | | | | | |
| | 660 | | 6.500%, 6/15/20 | 6/18 at 100.00 | B1 | | 707,685 | |
| | 1,500 | | 6.750%, 6/15/28 | 6/18 at 100.00 | B1 | | 1,606,290 | |
| | 5,160 | | Total Nevada | | | | 6,170,790 | |
| | | | New Jersey – 2.2% (2.0% of Total Investments) | | | | | |
| | 2,100 | | New Jersey Economic Development Authority, Special Facilities Revenue Bonds, Continental Airlines Inc., Series 1999, 5.250%, 9/15/29 (Alternative Minimum Tax) | 9/22 at 101.00 | BB– | | 2,289,315 | |
| | 1,580 | | New Jersey Economic Development Authority, Special Facilities Revenue Bonds, Continental Airlines Inc., Series 2000A & 2000B, 5.625%, 11/15/30 (Alternative Minimum Tax) | 3/24 at 101.00 | BB– | | 1,760,041 | |
| | 1,000 | | New Jersey Economic Development Authority, Student Housing Revenue Bonds, Provident Group-Montclair Properties LLC, Montclair State University Student Housing Project, Series 2010A, 5.875%, 6/01/42 | 6/20 at 100.00 | Baa3 | | 1,107,160 | |
| | 600 | | New Jersey Educational Facilities Authority, Revenue Bonds, University of Medicine and Dentistry of New Jersey, Refunding Series 2009B, 7.500%, 12/01/32 (Pre-refunded 6/01/19) | 6/19 at 100.00 | N/R (5) | | 733,782 | |
| | 5,200 | | New Jersey Health Care Facilities Financing Authority, New Jersey, Revenue Bonds, Saint Peters University Hospital, Series 2007, 5.750%, 7/01/37 | 7/18 at 100.00 | BB+ | | 5,383,248 | |
| | | | New Jersey Health Care Facilities Financing Authority, Revenue Bonds, Saint Joseph's Healthcare System Obligated Group Issue, Series 2008: | | | | | |
| | 1,000 | | 6.000%, 7/01/18 | No Opt. Call | BBB– | | 1,058,510 | |
| | 2,000 | | 6.625%, 7/01/38 | 7/18 at 100.00 | BBB– | | 2,215,500 | |
| | 765 | | New Jersey Higher Education Assistance Authority, Student Loan Revenue Bonds, Series 2008A, 6.125%, 6/01/30 – AGC Insured (Alternative Minimum Tax) | 6/18 at 100.00 | AA | | 823,836 | |
| | 14,245 | | Total New Jersey | | | | 15,371,392 | |
| | Principal | | | Optional Call | | | | |
| | Amount (000) | | Description (1) | Provisions (2) | Ratings (3) | | Value | |
| | | | New Mexico – 0.9% (0.8% of Total Investments) | | | | | |
| $ | 395 | | Mariposa East Public Improvement District, New Mexico, Revenue Bonds, Capital Appreciation Taxable Series 2015D, 0.000%, 9/01/32 | 3/16 at 44.27 | N/R | $ | 47,325 | |
| | 75 | | Mariposa East Public Improvement District, New Mexico, Special Levy Revenue Bonds, Series 2015A, 5.900%, 9/01/32 | 9/25 at 100.00 | N/R | | 74,519 | |
| | 330 | | Mariposa East Public Improvement District, New Mexico, Special Levy Revenue Bonds, Series 2015B, 5.900%, 9/01/32 | 9/25 at 100.00 | N/R | | 296,314 | |
| | 435 | | Mariposa East Public Improvement District, New Mexico, Special Levy Revenue Bonds, Series 2015C, 5.900%, 9/01/32 | 9/25 at 100.00 | N/R | | 367,914 | |
| | 1,210 | | Mesa Del Sol Public Improvement District 1, Albuquerque, New Mexico, Special Levy Revenue Bonds, Series 2013, 7.250%, 10/01/43 | 10/23 at 100.00 | N/R | | 1,290,526 | |
| | 450 | | Montecito Estates Public Improvement District, New Mexico, Special Levee Revenue Bonds, Series 2007, 7.000%, 10/01/37 | 10/17 at 100.00 | N/R | | 460,521 | |
| | 965 | | New Mexico Hospital Equipment Loan Council, First Mortgage Revenue Bonds, La Vida LLena Project, Series 2010A, 5.875%, 7/01/30 | 7/20 at 100.00 | BBB– | | 1,017,554 | |
| | 1,020 | | Volterra Public Improvement District, Albuquerque, New Mexico, Special Levy Revenue Bonds, Series 2014, 6.750%, 10/01/33 | No Opt. Call | N/R | | 1,083,260 | |
| | 1,575 | | Winrock Town Center Tax Increment Development District, Albuquerque, New Mexico, Gross Receipts Tax Increment Bonds, Senior Lien Series 2015, 6.000%, 5/01/40 | 5/20 at 103.00 | N/R | | 1,652,207 | |
| | 6,455 | | Total New Mexico | | | | 6,290,140 | |
| | | | New York – 3.5% (3.1% of Total Investments) | | | | | |
| | 1,000 | | Brooklyn Arena Local Development Corporation, New York, Payment in Lieu of Taxes Revenue Bonds, Barclays Center Project, Series 2009, 6.375%, 7/15/43 | 1/20 at 100.00 | BBB– | | 1,145,000 | |
| | 1,000 | | Build New York City Resource Corporation, New York, Revenue Bonds, Metropolitan College of New York, Series 2014, 5.500%, 11/01/44 | 11/24 at 100.00 | BB | | 1,066,720 | |
| | | | New York City Industrial Development Agency, New York, American Airlines-JFK International Airport Special Facility Revenue Bonds, Series 2005: | | | | | |
| | 485 | | 7.500%, 8/01/16 (Alternative Minimum Tax) | 2/16 at 100.00 | N/R | | 499,177 | |
| | 1,000 | | 7.625%, 8/01/25 (Alternative Minimum Tax) | 8/16 at 101.00 | N/R | | 1,054,320 | |
| | 1,000 | | 8.000%, 8/01/28 | 8/16 at 101.00 | N/R | | 1,056,390 | |
| | 1,000 | | 7.750%, 8/01/31 (Alternative Minimum Tax) | 8/16 at 101.00 | N/R | | 1,052,540 | |
| | | | New York City Industrial Development Agency, New York, Civic Facility Revenue Bonds, Bronx Parking Development Company, LLC Project, Series 2007: | | | | | |
| | 1,500 | | 5.750%, 10/01/37 (12) | 10/17 at 100.00 | N/R | | 534,750 | |
| | 5,000 | | 5.875%, 10/01/46 (13) | 10/17 at 102.00 | N/R | | 1,782,500 | |
| | 650 | | New York City Industrial Development Agency, New York, Civic Facility Revenue Bonds, Special Needs Facilities Pooled Program, Series 2008A-1, 5.800%, 7/01/23 | 7/16 at 101.00 | N/R | | 641,687 | |
| | 380 | | New York City Industrial Development Agency, New York, Civic Facility Revenue Bonds, Special Needs Facilities Pooled Program, Series 2008A-1, 5.800%, 7/01/23 (Pre-refunded 7/01/16) | 7/16 at 101.00 | N/R (5) | | 397,693 | |
| | 500 | | New York Liberty Development Corporation, Liberty Revenue Bonds, Secured by Port Authority Consolidated Bonds, Tender Option Bonds Trust 1190, 17.980%, 12/15/41 (IF) (6) | 12/21 at 100.00 | AA– | | 746,020 | |
| | 3,250 | | New York Liberty Development Corporation, New York, Liberty Revenue Bonds, 3 World Trade Center Project, Class 2 Series 2014, 5.150%, 11/15/34 | 11/24 at 100.00 | N/R | | 3,382,145 | |
| | 6,000 | | New York Liberty Development Corporation, New York, Liberty Revenue Bonds, 3 World Trade Center Project, Class 3 Series 2014, 7.250%, 11/15/44 | 11/24 at 100.00 | N/R | | 7,121,160 | |
| | 1,375 | | New York Liberty Development Corporation, New York, Liberty Revenue Bonds, Bank of America Tower at One Bryant Park Project, Second Priority Refunding Series 2010, 6.375%, 7/15/49 | 1/20 at 100.00 | A– | | 1,551,880 | |
| | | | New York Liberty Development Corporation, Second Priority Liberty Revenue Refunding Bonds, Bank of America Tower at One Bryant Park Project, Tender Option Bond Trust PT4704: | | | | | |
| | 250 | | 18.525%, 1/15/44 (IF) (6) | 1/20 at 100.00 | AA+ | | 355,470 | |
| | 625 | | 18.525%, 1/15/44 (IF) (6) | 1/20 at 100.00 | AA+ | | 888,675 | |
| NMZ | Nuveen Municipal High Income Opportunity Fund | |
| | Portfolio of Investments (continued) | October 31, 2015 |
| | Principal | | | Optional Call | | | | |
| | Amount (000) | | Description (1) | Provisions (2) | Ratings (3) | | Value | |
| | | | New York (continued) | | | | | |
| $ | 530 | | Port Authority of New York and New Jersey, Special Project Bonds, JFK International Air Terminal LLC Project, Eighth Series 2010, 6.000%, 12/01/42 | 12/20 at 100.00 | BBB | $ | 615,728 | |
| | 25,545 | | Total New York | | | | 23,891,855 | |
| | | | North Carolina – 0.9% (0.8% of Total Investments) | | | | | |
| | 940 | | Charlotte-Mecklenburg Hospital Authority, North Carolina, Health Care Revenue Bonds, DBA Carolinas HealthCare System, Tender Option Bond Trust 11963, 19.162%, 1/15/19 (IF) | No Opt. Call | AA– | | 1,380,578 | |
| | 1,000 | | Gaston County Industrial Facilities and Pollution Control Financing Authority, North Carolina, National Gypsum Company Project Exempt Facilities Revenue Bonds, Series 2005, 5.750%, 8/01/35 (Alternative Minimum Tax) | 2/16 at 100.00 | N/R | | 1,000,850 | |
| | | | North Carolina Capital Facilities Financing Agency, Educational Facilities Revenue Bond, Meredith College, Series 2008A: | | | | | |
| | 1,000 | | 6.000%, 6/01/31 | 6/18 at 100.00 | BBB | | 1,064,320 | |
| | 1,000 | | 6.125%, 6/01/35 | 6/18 at 100.00 | BBB | | 1,063,060 | |
| | 960 | | North Carolina Capital Facilities Financing Agency, Revenue Bonds, Duke University, Series 2008, Tender Option Bond Trust 2015-XF0095, 27.015%, 10/01/36 (IF) | 10/16 at 100.00 | AA+ | | 1,656,134 | |
| | 4,900 | | Total North Carolina | | | | 6,164,942 | |
| | | | Ohio – 4.6% (4.1% of Total Investments) | | | | | |
| | | | Buckeye Tobacco Settlement Financing Authority, Ohio, Tobacco Settlement Asset-Backed Revenue Bonds, Senior Lien, Series 2007A-2: | | | | | |
| | 4,500 | | 5.875%, 6/01/30 | 6/17 at 100.00 | B– | | 4,023,810 | |
| | 5,875 | | 5.750%, 6/01/34 | 6/17 at 100.00 | B– | | 5,150,143 | |
| | 6,000 | | 5.875%, 6/01/47 | 6/17 at 100.00 | B | | 5,186,220 | |
| | 3,455 | | Buckeye Tobacco Settlement Financing Authority, Ohio, Tobacco Settlement Asset-Backed Revenue Bonds, Senior Lien, Series 2007A-3, 6.250%, 6/01/37 | 6/22 at 100.00 | B– | | 3,161,947 | |
| | 1,500 | | Butler County Port Authority, Ohio, Public Infrastructure Revenue Bonds, Liberty Center Project, Liberty Community Authority, Series 2014C, 6.000%, 12/01/43 | 12/22 at 100.00 | N/R | | 1,510,215 | |
| | 1,870 | | Cleveland-Cuyahoga County Port Authority, Ohio, Development Revenue Bonds, Bond Fund Program – Garfield Heights Project, Series 2004D, 5.250%, 5/15/23 | 5/16 at 100.00 | BBB+ | | 1,872,581 | |
| | 2,000 | | Lorain County Port Authority, Ohio, Recovery Zone Facility Economic Development Revenue Bonds, United State Steel Corporation Project, Series 2010, 6.750%, 12/01/40 | 12/20 at 100.00 | BB– | | 2,012,540 | |
| | 1,270 | | Medina County Port Authority, Ohio, Development Revenue Bond, Fiber Network Project, Series 2010B, 6.000%, 12/01/30 | 12/20 at 100.00 | A+ | | 1,458,773 | |
| | 1,250 | | Ohio State, Hospital Facility Revenue Refunding Bonds, Cleveland Clinic Health System Obligated Group, Tender Option Bond Trust 2015-XF0105, 19.828%, 1/01/17 (IF) | No Opt. Call | Aa2 | | 1,871,650 | |
| | 3,000 | | State of Ohio, Solid Waste Disposal Revenue Bonds (USG Corporation Project) Series 1997 Remarketed, 5.600%, 8/01/32 (Alternative Minimum Tax) | 2/16 at 100.00 | B– | | 3,000,090 | |
| | 2,000 | | Tuscarawas County Economic Development and Finance Alliance, Ohio, Higher Education Facilities Revenue Bonds, Ashland University, Refunding & Improvement Series 2015, 6.000%, 3/01/45 | 3/25 at 100.00 | N/R | | 2,011,160 | |
| | 6,000 | | Western Reserve Port Authority, Ohio, Solid Waste Facility Revenue Bonds, Central Waste Inc., Series 2007A, 6.350%, 7/01/27 (Alternative Minimum Tax) (4) | 7/17 at 102.00 | N/R | | 29,880 | |
| | 38,720 | | Total Ohio | | | | 31,289,009 | |
| | | | Oklahoma – 0.5% (0.4% of Total Investments) | | | | | |
| | 2,000 | | Fort Sill Apache Tribe of Oklahoma Economic Development Authority, Gaming Enterprise Revenue Bonds, Fort Sill Apache Casino, Series 2011A, 8.500%, 8/25/26 | 8/21 at 100.00 | N/R | | 2,356,740 | |
| | 920 | | Okeene Municipal Hospital and Schallmo Authority, Oklahoma, Revenue Bonds, Series 2006, 7.000%, 1/01/35 | 1/16 at 101.00 | N/R | | 930,976 | |
| | 2,920 | | Total Oklahoma | | | | 3,287,716 | |
| | Principal | | | Optional Call | | | | |
| | Amount (000) | | Description (1) | Provisions (2) | Ratings (3) | | Value | |
| | | | Pennsylvania – 2.1% (1.9% of Total Investments) | | | | | |
| $ | 500 | | Allegheny Country Industrial Development Authority, Pennsylvania, Environmental Improvement Revenue Bonds, United States Steel Corporation Project, Refunding Series 2009, 6.750%, 11/01/24 | 11/19 at 100.00 | BB– | $ | 514,275 | |
| | 860 | | Berks County Industrial Development Authority, Pennsylvania, First Mortgage Revenue Bonds, One Douglassville Properties Project, Series 2007A, 6.125%, 11/01/34 (Alternative Minimum Tax) | 11/17 at 101.00 | N/R | | 869,718 | |
| | 2,000 | | Chester County Health and Education Facilities Authority, Pennsylvania, Revenue Bonds, Immaculata University, Series 2005, 5.750%, 10/15/37 | 4/16 at 100.00 | N/R | | 2,039,180 | |
| | 1,410 | | Chester County Industrial Development Authority, Pennsylvania, Avon Grove Charter School Revenue Bonds, Series 2007A, 6.375%, 12/15/37 | 12/17 at 100.00 | BBB– | | 1,485,238 | |
| | 185 | | Montgomery County Industrial Development Authority, Pennsylvania, FHA Insured Mortgage Revenue Bonds, New Regional Medical Center Project, Tender Option Bond Trust 62B, 19.390%, 8/01/38 (Pre-refunded 8/01/20) (IF) (6) | 8/20 at 100.00 | AA (5) | | 319,532 | |
| | 4,115 | | Pennsylvania Economic Development Finance Authority, Solid Waste Disposal Revenue Bonds (USG Corporation Project) Series 1999, 6.000%, 6/01/31 (Alternative Minimum Tax) | 12/15 at 100.00 | B– | | 4,115,000 | |
| | 2,500 | | Philadelphia Authority for Industrial Development, Pennsylvania, Revenue Bonds, Nueva Esperanza, Inc. – Esperanza Academy Charter School, Series 2013, 8.000%, 1/01/33 | 1/23 at 100.00 | N/R | | 2,747,650 | |
| | 510 | | Philadelphia Hospitals and Higher Education Facilities Authority, Pennsylvania, Hospital Revenue Bonds, Temple University Health System Obligated Group, Series 2012A, 5.625%, 7/01/36 | No Opt. Call | BBB– | | 550,321 | |
| | 1,000 | | Philadelphia Hospitals and Higher Education Facilities Authority, Pennsylvania, Hospital Revenue Bonds, Temple University Health System Obligated Group, Series 2012B, 6.250%, 7/01/23 | No Opt. Call | BBB– | | 1,053,660 | |
| | 770 | | Scranton, Pennsylvania, General Obligation Bonds, Series 2012A, 8.500%, 9/01/22 | No Opt. Call | N/R | | 808,377 | |
| | 13,850 | | Total Pennsylvania | | | | 14,502,951 | |
| | | | Rhode Island – 0.3% (0.3% of Total Investments) | | | | | |
| | 1,000 | | Rhode Island Health & Educational Building Corporation, Health Facilities Revenue Bonds, Tockwotton Home, Series 2011, 8.375%, 1/01/46 | 1/21 at 100.00 | N/R | | 1,184,960 | |
| | 1,000 | | Rhode Island Student Loan Authority, Student Loan Program Revenue Bonds, Series 2008A, 6.750%, 12/01/28 (Alternative Minimum Tax) | 12/17 at 100.00 | A | | 1,062,860 | |
| | 2,000 | | Total Rhode Island | | | | 2,247,820 | |
| | | | South Carolina – 0.7% (0.6% of Total Investments) | | | | | |
| | 4,000 | | Lancaster County, South Carolina, Special Assessment Bonds, Edgewater II Improvement District, Series 2007A, 7.750%, 11/01/39 (4) | 11/17 at 100.00 | N/R | | 1,199,760 | |
| | 3,477 | | Lancaster County, South Carolina, Special Assessment Bonds, Edgewater II Improvement District, Series 2007B, 7.700%, 11/01/17 (4) | No Opt. Call | N/R | | 1,042,891 | |
| | 1,000 | | South Carolina JOBS Economic Development Authority, Economic Development Revenue Bonds, Midland Valley Preparatory School Project, Series 2014, 7.750%, 11/15/45 | 11/24 at 100.00 | N/R | | 1,082,130 | |
| | 1,250 | | South Carolina Jobs-Economic Development Authority, Hospital Revenue Bonds, Palmetto Health, Refunding Series 2011A, 6.500%, 8/01/39 – AGM Insured | 8/21 at 100.00 | AA | | 1,495,575 | |
| | 9,727 | | Total South Carolina | | | | 4,820,356 | |
| | | | Tennessee – 1.6% (1.4% of Total Investments) | | | | | |
| | 3,000 | | Johnson City Health and Educational Facilities Board, Tennessee, Hospital Revenue Bonds, Mountain States Health Alliance, Refunding Series 2010A, 6.500%, 7/01/38 | 7/20 at 100.00 | BBB+ | | 3,446,430 | |
| | 6,024 | | The Tennessee Energy Acquisition Corporation, Gas Revenue Bonds, Series 2006B, 5.625%, 9/01/26 | No Opt. Call | BBB | | 6,920,492 | |
| | 965 | | Wilson County Health and Educational Facilities Board, Tennessee, Senior Living Revenue Bonds, Rutland Place, Series 2007A, 6.300%, 7/01/37 (4) | 7/17 at 100.00 | N/R | | 708,233 | |
| | 9,989 | | Total Tennessee | | | | 11,075,155 | |
| NMZ | Nuveen Municipal High Income Opportunity Fund | |
| | Portfolio of Investments (continued) | October 31, 2015 |
| | Principal | | | Optional Call | | | | |
| | Amount (000) | | Description (1) | Provisions (2) | Ratings (3) | | Value | |
| | | | Texas – 6.9% (6.1% of Total Investments) | | | | | |
| $ | 2,000 | | Austin Convention Enterprises Inc., Texas, Convention Center Hotel Revenue Bonds, Second Tier Series 2006B, 5.750%, 1/01/34 | 1/17 at 100.00 | BB | $ | 2,057,520 | |
| | 385 | | Austin Convention Enterprises Inc., Texas, Convention Center Hotel Revenue Bonds, Third Tier Series 2001C, 9.750%, 1/01/26 | 1/16 at 100.00 | N/R | | 386,717 | |
| | 4,005 | | Brazos River Authority, Texas, Pollution Control Revenue Refunding Bonds, TXU Electric Company, Series 2001D, 8.250%, 5/01/33 (Alternative Minimum Tax) (4) | 7/18 at 100.00 | N/R | | 230,288 | |
| | 1,000 | | Celina, Texas, Special Assessment Revenue Bonds, Creeks of Legacy Public Improvement District Phase 1 Project, Series 2014, 7.000%, 9/01/40 | 9/22 at 103.00 | N/R | | 1,021,990 | |
| | | | Central Texas Regional Mobility Authority, Revenue Bonds, Senior Lien Series 2011: | | | | | |
| | 1,000 | | 6.750%, 1/01/41 | 1/21 at 100.00 | BBB | | 1,196,270 | |
| | 250 | | 6.000%, 1/01/41 | 1/21 at 100.00 | BBB+ | | 285,333 | |
| | | | Clifton Higher Education Finance Corporation, Texas, Education Revenue Bonds, Tejano Center for Community Concerns, Inc.-Raul Yzaguirre School for Success, Refunding Series 2009A: | | | | | |
| | 2,100 | | 8.750%, 2/15/28 | 2/18 at 100.00 | B+ | | 2,229,486 | |
| | 2,000 | | 9.000%, 2/15/38 | 2/18 at 100.00 | B+ | | 2,126,840 | |
| | 2,910 | | Danbury Higher Education Authority Inc., Texas, Golden Rule Charter School Revenue Bonds, Series 2008A, 6.500%, 8/15/38 (Pre-refunded 2/15/18) | 2/18 at 100.00 | BBB– (5) | | 3,252,449 | |
| | | | Decatur Hospital Authority, Texas, Revenue Bonds, Wise Regional Health System, Series 2013A: | | | | | |
| | 450 | | 6.625%, 9/01/31 | 9/23 at 100.00 | N/R | | 544,248 | |
| | 1,000 | | 6.375%, 9/01/42 | 9/23 at 100.00 | N/R | | 1,167,210 | |
| | 1,500 | | Fort Bend County Industrial Development Corporation, Texas, Revenue Bonds, NRG Energy Inc. Project, Series 2012A. RMKT, 4.750%, 5/01/38 | 11/22 at 100.00 | Baa3 | | 1,487,700 | |
| | 585 | | Gulf Coast Industrial Development Authority, Texas, Solid Waste Disposal Revenue Bonds, Citgo Petroleum Corporation Project, Series 1998, 8.000%, 4/01/28 (Alternative Minimum Tax) | 4/16 at 100.00 | BB+ | | 586,065 | |
| | 940 | | Heart of Texas Education Finance Corporation, Texas, Gateway Charter Academy, Series 2006A, 6.000%, 2/15/36 | 8/16 at 100.00 | N/R | | 959,270 | |
| | 1,000 | | Houston, Texas, Airport System Special Facilities Revenue Bonds, United Airlines Inc. Terminal Improvement Project, Refunding Series 2015B-1, 5.000%, 7/15/35 (Alternative Minimum Tax) | 7/25 at 100.00 | BB– | | 1,050,150 | |
| | 3,875 | | Jefferson County Industrial Development Corporation, Texas, Hurricane Ike Disaster Area Revenue Bonds, Port of Beaumont Petroleum Transload Terminal, LLC Project, Series 2012, 8.250%, 7/01/32 | 7/22 at 100.00 | N/R | | 4,105,369 | |
| | 1,330 | | La Vernia Higher Education Financing Corporation, Texas, Education Revenue Bonds, Amigos Por Vida Friends For Life Public Charter School, Series 2008, 6.375%, 2/15/37 | 2/16 at 100.00 | N/R | | 1,334,961 | |
| | 1,000 | | New Hope Cultural Education Facilities Finance Corporation, Texas, Student Housing Revenue Bonds, CHF-Collegiate Housing Corpus Christi I, L.L.C.-Texas A&M University-Corpus Christi Project, Series 2014A, 5.000%, 4/01/44 | No Opt. Call | BBB– | | 1,027,960 | |
| | 2,250 | | North Texas Tollway Authority, Special Projects System Revenue Bonds, Tender Option Bond Trust 11946, 20.382%, 3/01/19 (IF) | No Opt. Call | AA+ | | 3,825,720 | |
| | 335 | | North Texas Tollway Authority, System Revenue Bonds, Refunding Second Tier, Series 2008F, 5.750%, 1/01/38 (Pre-refunded 1/01/18) | 1/18 at 100.00 | A2 (5) | | 370,935 | |
| | 2,000 | | Red River Health Facilities Development Corporation, Texas, First Mortgage Revenue Bonds, Eden Home Inc., Series 2012, 7.000%, 12/15/32 | No Opt. Call | N/R | | 1,880,420 | |
| | 2,000 | | Sabine River Authority, Texas, Pollution Control Revenue Refunding Bonds, TXU Energy Company LLC Project, Series 2003B, 6.150%, 8/01/22 (4) | 2/16 at 100.00 | C | | 115,000 | |
| | 4,000 | | Texas Municipal Gas Acquisition and Supply Corporation III, Gas Supply Revenue Bonds, Series 2012, 5.000%, 12/15/31 | No Opt. Call | A3 | | 4,370,040 | |
| | 2,810 | | Texas Private Activity Bond Surface Transportation Corporation, Revenue Bonds, NTE Mobility Partners LLC North Tarrant Express Managed Lanes Project, Senior Lien Series 2009, 6.875%, 12/31/39 | 12/19 at 100.00 | Baa2 | | 3,277,696 | |
| | | | Texas Private Activity Bond Surface Transportation Corporation, Senior Lien Revenue Bonds, LBJ Infrastructure Group LLC IH-635 Managed Lanes Project, Series 2010: | | | | | |
| | 1,000 | | 7.000%, 6/30/34 | 6/20 at 100.00 | Baa3 | | 1,189,240 | |
| | 4,500 | | 7.000%, 6/30/40 | 6/20 at 100.00 | Baa3 | | 5,342,850 | |
| | Principal | | | Optional Call | | | | |
| | Amount (000) | | Description (1) | Provisions (2) | Ratings (3) | | Value | |
| | | | Texas (continued) | | | | | |
| $ | 900 | | Texas Public Finance Authority Charter School Finance Corporation, Charter School Revenue Bonds, School of Excellence Education Project, Series 2004A, 7.000%, 12/01/34 | 12/15 at 100.00 | BB | $ | 874,143 | |
| | 550 | | Travis County Health Facilities Development Corporation, Texas, Revenue Bonds, Westminster Manor, Series 2010, 7.000%, 11/01/30 | 11/20 at 100.00 | BBB– | | 636,548 | |
| | 340 | | Trinity River Authority of Texas, Pollution Control Revenue Refunding Bonds, TXU Electric Company, Series 2003, 6.250%, 5/01/28 (Alternative Minimum Tax) (4) | 11/15 at 100.00 | C | | 19,550 | |
| | 48,015 | | Total Texas | | | | 46,951,968 | |
| | | | Utah – 1.8% (1.6% of Total Investments) | | | | | |
| | | | Utah State Charter School Finance Authority, Charter School Revenue Bonds, Noah Webster Academy, Series 2008A: | | | | | |
| | 1,265 | | 6.250%, 6/15/28 | 6/17 at 100.00 | N/R | | 1,295,841 | |
| | 1,430 | | 6.500%, 6/15/38 | 6/17 at 100.00 | N/R | | 1,460,287 | |
| | 1,690 | | Utah State Charter School Finance Authority, Charter School Revenue Bonds, North Davis Preparatory Academy, Series 2010, 6.375%, 7/15/40 | 7/20 at 100.00 | BBB– | | 1,825,572 | |
| | 1,980 | | Utah State Charter School Finance Authority, Charter School Revenue Bonds, Summit Academy High School, Series 2011A, 8.125%, 5/15/31 | 5/21 at 100.00 | N/R | | 2,237,915 | |
| | 5,550 | | Utah State Charter School Finance Authority, Revenue Bonds, Summit Academy Project, Series 2007A, 5.800%, 6/15/38 | 12/17 at 100.00 | BBB– | | 5,699,073 | |
| | 11,915 | | Total Utah | | | | 12,518,688 | |
| | | | Vermont – 0.2% (0.2% of Total Investments) | | | | | |
| | 1,155 | | Vermont Educational and Health Buildings Financing Agency, Revenue Bonds, Vermont Law School Project, Series 2011A, 6.250%, 1/01/41 | 1/21 at 100.00 | Ba1 | | 1,201,015 | |
| | | | Virgin Islands – 0.1% (0.1% of Total Investments) | | | | | |
| | 420 | | Virgin Islands Public Finance Authority, Matching Fund Revenue Loan Note – Diageo Project, Series 2009A, 6.750%, 10/01/37 | 10/19 at 100.00 | Baa3 | | 473,689 | |
| | | | Virginia – 0.7% (0.7% of Total Investments) | | | | | |
| | 789 | | Celebrate Virginia North Community Development Authority, Special Assessment Revenue Bonds, Series 2003B, 6.250%, 3/01/18 (14) | 3/16 at 100.00 | N/R | | 509,307 | |
| | 1,000 | | Giles County Industrial Development Authority, Virginia, Exempt Facility Revenue Bonds, Hoechst Celanese Project, Series 1996, 6.450%, 5/01/26 | 11/15 at 100.00 | BB– | | 1,003,190 | |
| | 9,400 | | Metropolitan Washington Airports Authority, Virginia, Dulles Toll Road Second Senior Lien Revenue Bonds, Series 2009B, 0.000%, 10/01/38 – AGC Insured | No Opt. Call | BBB+ | | 3,258,322 | |
| | | | Virginia Small Business Financing Authority, Senior Lien Revenue Bonds, Elizabeth River Crossing, Opco LLC Project, Series 2012: | | | | | |
| | 100 | | 6.000%, 1/01/37 (Alternative Minimum Tax) | 7/22 at 100.00 | BBB– | | 113,668 | |
| | 130 | | 5.500%, 1/01/42 (Alternative Minimum Tax) | 7/22 at 100.00 | BBB– | | 141,865 | |
| | 11,419 | | Total Virginia | | | | 5,026,352 | |
| | | | Washington – 3.0% (2.7% of Total Investments) | | | | | |
| | 500 | | FYI Properties, Washington, Lease Revenue Bonds, Washington State Department of Information Services Project, Tender Option Bond Trust 11-14W-B, 19.483%, 6/01/39 (IF) (6) | 6/19 at 100.00 | AA | | 747,520 | |
| | 2,415 | | FYI Properties, Washington, Lease Revenue Bonds, Washington State Department of Information Services Project, Tender Option Bond Trust 2009-14A&B, 19.483%, 6/01/34 (IF) (6) | 6/19 at 100.00 | AA | | 3,646,360 | |
| | 3,600 | | Kalispel Indian Tribe, Washington, Priority Distribution Bonds, Series 2008, 6.750%, 1/01/38 | 1/18 at 100.00 | N/R | | 3,662,391 | |
| | 1,000 | | King County Public Hospital District 4, Washington, Hospital Revenue Bonds, Snoqualmie Valley Hospital, Series 2015A, 6.250%, 12/01/45 | No Opt. Call | N/R | | 995,900 | |
| | 1,000 | | Kitsap County Consolidated Housing Authority, Washington, Pooled Tax Credit Housing Revenue Bonds, Series 2007, 5.600%, 6/01/37 (Alternative Minimum Tax) | 6/17 at 100.00 | N/R | | 1,017,070 | |
| | 370 | | Tacoma Consolidated Local Improvement District 65, Washington, Special Assessment Bonds, Series 2013, 5.750%, 4/01/43 | 4/16 at 100.00 | N/R | | 369,745 | |
| NMZ | Nuveen Municipal High Income Opportunity Fund | |
| | Portfolio of Investments (continued) | October 31, 2015 |
| | Principal | | | Optional Call | | | | |
| | Amount (000) | | Description (1) | Provisions (2) | Ratings (3) | | Value | |
| | | | Washington (continued) | | | | | |
| $ | 9,000 | | Washington State Health Care Facilities Authority, Revenue Bonds, Northwest Hospital and Medical Center of Seattle, Series 2007, 5.700%, 12/01/32 | 12/17 at 100.00 | N/R | $ | 9,255,687 | |
| | 15 | | Washington State Health Care Facilities Authority, Revenue Bonds, Virginia Mason Medical Center, Series 2007B, 5.750%, 8/15/37 – ACA Insured | 8/17 at 100.00 | BBB | | 15,952 | |
| | 1,000 | | Washington State Housing Finance Commission, Non-Profit Housing Revenue Bonds, Mirabella Project, Series 2012A, 6.750%, 10/01/47 | No Opt. Call | N/R | | 1,085,470 | |
| | 18,900 | | Total Washington | | | | 20,796,095 | |
| | | | West Virginia – 0.4% (0.4% of Total Investments) | | | | | |
| | 1,472 | | Berkeley, Hardy and Jefferson Counties, West Virginia, as Joint Issuers, Commercial Development Revenue Bonds, Scattered Site Housing Projects, Series 2010, 5.750%, 12/01/44 | No Opt. Call | N/R | | 1,542,671 | |
| | 900 | | Ohio County Commission, West Virginia, Special District Excise Tax Revenue Bonds, Fort Henry Economic Development, Series 2006B, 5.625%, 3/01/36 | 3/16 at 100.00 | BBB | | 906,408 | |
| | 500 | | Ohio County Commission, West Virginia, Tax Increment Revenue Bonds, Fort Henry Centre Financing District, Series 2007A, 5.850%, 6/01/34 | 6/17 at 100.00 | N/R | | 511,430 | |
| | 2,872 | | Total West Virginia | | | | 2,960,509 | |
| | | | Wisconsin – 3.2% (2.8% of Total Investments) | | | | | |
| | 30 | | Green Bay Redevelopment Authority, Wisconsin, Industrial Development Revenue Bonds, Fort James Project, Series 1999, 5.600%, 5/01/19 (Alternative Minimum Tax) | No Opt. Call | N/R | | 33,011 | |
| | 2,000 | | Lac Courte Oreilles Band of Lake Superior Chippewa Indians, Wisconsin, Revenue Bonds, Series 2006, 7.000%, 12/01/26 | 12/18 at 102.00 | N/R | | 2,053,500 | |
| | 1,650 | | Public Finance Authority of Wisconsin, Charter School Revenue Bonds, Thomas Jefferson Classical Academy of Mooresboro, North Carolina, Series 2011, 7.125%, 7/01/42 | 7/19 at 100.00 | BBB– | | 1,790,514 | |
| | 830 | | Public Finance Authority of Wisconsin, Educational Facility Revenue Bonds, Cottonwood Classical Preparatory School in Albuquerque, New Mexico, Series 2012A, 6.250%, 12/01/42 | No Opt. Call | N/R | | 848,501 | |
| | 1,060 | | Public Finance Authority of Wisconsin, Revenue Bonds, Roseman University of Health Sciences, Series 2015, 5.875%, 4/01/45 | 4/25 at 100.00 | BB– | | 1,089,786 | |
| | 1,000 | | Wisconsin Health and Educational Facilities Authority, Revenue Bonds, Froedtert Community Health, Inc. Obligated Group, Tender Option Bond Trust 2015-XF0118, 18.942%, 4/01/17 (IF) (6) | No Opt. Call | AA– | | 1,326,880 | |
| | | | Wisconsin Health and Educational Facilities Authority, Revenue Bonds, Wheaton Franciscan Healthcare System, Series 2006A: | | | | | |
| | 5,995 | | 5.250%, 8/15/26 (UB) | 8/16 at 100.00 | A– | | 6,189,358 | |
| | 4,500 | | 5.250%, 8/15/34 (UB) | 8/16 at 100.00 | A– | | 4,586,580 | |
| | 1,500 | | Wisconsin Health and Educational Facilities Authority, Revenue Bonds, Wheaton Franciscan Healthcare System, Series 2006, Trust 2187, 16.746%, 8/15/34 (IF) | 8/16 at 100.00 | A– | | 1,615,440 | |
| | 2,000 | | Wisconsin Public Finance Authority, Revenue Bonds, SearStone Retirement Community of Cary North Carolina, Series 2012A, 8.625%, 6/01/47 | 6/22 at 100.00 | N/R | | 2,383,899 | |
| | 20,565 | | Total Wisconsin | | | | 21,917,469 | |
| $ | 767,444 | | Total Municipal Bonds (cost $704,375,556) | | | | 762,323,289 | |
| | Shares | | Description (1) | | | | Value | |
| | | | COMMON STOCKS – 1.6% (1.4% of Total Investments) | | | | | |
| | | | Airlines – 1.6% (1.4% of Total Investments) | | | | | |
| | 227,514 | | American Airlines Group Inc. (15) | | | $ | 10,515,697 | |
| | | | Total Common Stocks (cost $6,316,916) | | | | 10,515,697 | |
| | Principal | | | | | | | | |
| | Amount (000) | | Description (1) | Coupon | Maturity | Ratings (3) | | Value | |
| | | | CORPORATE BONDS – 0.0% (0.0% of Total Investments) | | | | | | |
| | | | Transportation – 0.0% (0.0% of Total Investments) | | | | | | |
| $ | 27 | | Las Vegas Monorail Company, Senior Interest Bonds (7), (16) | 5.500% | 7/15/19 | N/R | $ | 1,355 | |
| | 7 | | Las Vegas Monorail Company, Senior Interest Bonds (7), (16) | 3.000% | 7/15/55 | N/R | | 288 | |
| $ | 34 | | Total Corporate Bonds (cost $3,072) | | | | | 1,643 | |
| | | | Total Long-Term Investments (cost $710,695,544) | | | | | 772,840,629 | |
| | | | Floating Rate Obligations – (1.9)% | | | | | (13,280,000 | ) |
| | | | Variable Rate MuniFund Term Preferred Shares, at Liquidation Value – (12.7)% (17) | | | | | (87,000,000 | ) |
| | | | Other Assets Less Liabilities – 1.6% | | | | | 11,548,703 | |
| | | | Net Assets Applicable to Common Shares – 100% | | | | $ | 684,109,332 | |
| (1) | All percentages shown in the Portfolio of Investments are based on net assets applicable to common shares unless otherwise noted. |
| (2) | Optional Call Provisions (not covered by the report of independent registered public accounting firm): Dates (month and year) and prices of the earliest optional call or redemption. There may be other call provisions at varying prices at later dates. Certain mortgage-backed securities may be subject to periodic principal paydowns. |
| (3) | Ratings (not covered by the report of independent registered public accounting firm): Using the highest of Standard & Poor's Group ("Standard & Poor's"), Moody's Investors Service, Inc. ("Moody's") or Fitch, Inc. ("Fitch") rating. Ratings below BBB by Standard & Poor's, Baa by Moody's or BBB by Fitch are considered to be below investment grade. Holdings designated N/R are not rated by any of these national rating agencies. |
| (4) | As of, or subsequent to, the end of the reporting period this security is non-income producing. Non-income producing, in the case of a fixed-income security, generally denotes that the issuer has (1) defaulted on the payment of principal or interest, (2) is under the protection of the Federal Bankruptcy Court or (3) the Fund's Adviser has concluded that the issue is not likely to meet its future interest payment obligations and has ceased accruing additional income on the Fund's records. |
| (5) | Backed by an escrow or trust containing sufficient U.S. Government or U.S. Government agency securities, which ensure the timely payment of principal and interest. Certain bonds backed by U.S. Government or agency securities are regarded as having an implied rating equal to the rating of such securities. |
| (6) | Investment, or portion of investment, has been pledged to collateralize the net payment obligations for investments in inverse floating rate transactions. |
| (7) | Investment valued at fair value using methods determined in good faith by, or at the discretion of, the Board. For fair value measurement disclosure purposes, investment classified as Level 3. See Notes to Financial Statements, Note 2 – Investment Valuation and Fair Value Measurements for more information. |
| (8) | On July 28, 2015, the Fund's Adviser determined it was unlikely that this borrower would fulfill its entire obligation on this security, and therefore reduced the security's interest rate of accrual from 6.125% to 3.675%. On December 9, 2015, the Fund's Adviser determined it was likely that this borrower would fulfill a portion of its obligation on this security, and therefore increased the security's interest rate of accrual from 3.675% to 4.900%. |
| (9) | On June 1, 2013, the Fund's Adviser determined it was unlikely that this borrower would fulfill its entire obligation on the security, and therefore reduced the security's interest rate of accrual from 7.250% to 1.813%. On May 7, 2015, the Fund's Adviser has concluded that the issue is not likely to meet its future interest payment obligations and has ceased accruing additional income on the Fund's records. |
| (10) | On January 7, 2015, the Fund's Adviser determined it was unlikely that this borrower would fulfill its entire obligation on this security, and therefore reduced the security's interest rate of accrual from 7.125% to 5.700%. On November 11, 2015, the Fund's Adviser determined it was unlikely that this borrower would fulfill its entire obligation on this security, and therefore reduced the security's interest rate of accrual from 5.700% to 4.275%. |
| (11) | On May 7, 2015, the Fund's Adviser determined it was unlikely that this borrower would fulfill its entire obligation on this security, and therefore reduced the security's interest rate of accrual from 5.250% to 2.100%. |
| (12) | On April 1, 2013, the Fund's Adviser determined it was unlikely that this borrower would fulfill its entire obligation on this security, and therefore reduced the security's interest rate of accrual from 5.750% to 2.300%. |
| (13) | On April 1, 2013, the Fund's Adviser determined it was unlikely that this borrower would fulfill its entire obligation on this security, and therefore reduced the security's interest rate of accrual from 5.875% to 2.350%. |
| (14) | On September 1, 2013, the Fund's Adviser determined it was unlikely that this borrower would fulfill its entire obligation on this security, and therefore reduced the security's interest rate of accrual from 6.250% to 4.688%. |
| (15) | On November 28, 2011, AMR Corp. ("AMR"), the parent company of American Airlines Group, Inc. ("AAL") filed for federal bankruptcy protection. On December 9, 2013, AMR emerged from federal bankruptcy with the acceptance of its reorganization plan by the bankruptcy court. Under the settlement agreement established to meet AMR's unsecured bond obligations, the bondholders, including the Fund, received a distribution of AAL preferred stock which was converted to AAL common stock over a 120-day period. Every 30 days, a quarter of the preferred stock was converted to AAL common stock based on the 5-day volume-weighted average price and the amount of preferred shares tendered during the optional preferred conversion period. |
| (16) | During January 2010, Las Vegas Monorail Company ("Las Vegas Monorail") filed for federal bankruptcy protection. During March 2012, Las Vegas Monorail emerged from federal bankruptcy with the acceptance of a reorganization plan assigned by the Federal Bankruptcy Court. Under the reorganization plan, the Fund surrendered its Las Vegas Monorail Project Revenue Bonds, First Tier, Series 2000 and in turn received two senior interest corporate bonds: the first with an annual coupon rate of 5.500% maturing on July 15, 2019 and the second with an annual coupon rate of 3.000% (5.500% after December 31, 2015) maturing on July 15, 2055. The Fund's custodian is not accruing income for either senior interest corporate bond. |
| (17) | Variable Rate MuniFund Term Preferred Shares, at Liquidation Value as a percentage of Total Investments is 11.3%. |
| (IF) | Inverse floating rate investment. |
| (UB) | Underlying bond of an inverse floating rate trust reflected as a financing transaction. See Notes to Financial Statements, Note 3 – Portfolio Securities and Investments in Derivatives, Inverse Floating Rate Securities for more information. |
See accompanying notes to financial statements.
| Statement of | | |
| | Assets and Liabilities | October 31, 2015 |
| | | | Investment | | | Select | | | Quality | | | Premier | | | High Income | |
| | | | Quality | | | Quality | | | Income | | | Income | | | Opportunity | |
| | | | (NQM | ) | | (NQS | ) | | (NQU | ) | | (NPF | ) | | (NMZ | ) |
| Assets | | | | | | | | | | | | | | | | |
| Long-term investments, at value (cost $892,526,403, $745,762,329, $1,049,036,690, $401,650,731 and $710,695,544, respectively) | | $ | 980,743,381 | | $ | 802,945,748 | | $ | 1,150,277,587 | | $ | 429,194,317 | | $ | 772,840,629 | |
| Short-term investments, at value (cost $2,990,000, $—, $2,390,000, $3,805,000 and $—, respectively) | | | 2,998,192 | | | — | | | 2,396,549 | | | 3,811,042 | | | — | |
| Cash | | | 1,107,669 | | | 11,793,938 | | | — | | | 2,208,934 | | | — | |
| Receivable for: | | | | | | | | | | | | | | | | |
| Interest | | | 13,647,546 | | | 10,618,373 | | | 14,689,208 | | | 5,855,709 | | | 17,230,282 | |
| Investments sold | | | 8,193,955 | | | 10,260,000 | | | 21,640,702 | | | 7,616,388 | | | 3,279,025 | |
| Deferred offering costs | | | 1,267,142 | | | 1,385,477 | | | 857,106 | | | 679,579 | | | 41,505 | |
| Other assets | | | 309,874 | | | 325,539 | | | 498,359 | | | 168,657 | | | 166,625 | |
| Total assets | | | 1,008,267,759 | | | 837,329,075 | | | 1,190,359,511 | | | 449,534,626 | | | 793,558,066 | |
| Liabilities | | | | | | | | | | | | | | | | |
| Cash overdraft | | | — | | | — | | | 1,450,769 | | | — | | | 4,597,814 | |
| Floating rate obligations | | | 54,680,000 | | | 13,455,000 | | | 33,660,000 | | | 22,260,000 | | | 13,280,000 | |
| Payable for: | | | | | | | | | | | | | | | | |
| Dividends | | | 2,971,510 | | | 2,080,365 | | | 3,111,989 | | | 1,192,244 | | | 3,692,756 | |
| Interest | | | 35,005 | | | — | | | — | | | — | | | 67,741 | |
| Investments purchased | | | 4,004,244 | | | 5,312,257 | | | — | | | — | | | — | |
| Offering costs | | | 18,517 | | | 27,844 | | | 160,507 | | | — | | | 15,881 | |
| Variable Rate MuniFund Term Preferred ("VMTP") Shares, at liquidation value | | | 43,500,000 | | | — | | | — | | | — | | | 87,000,000 | |
| Variable Rate Demand Preferred ("VRDP") Shares, at liquidation value | | | 236,800,000 | | | 267,500,000 | | | 385,400,000 | | | 127,700,000 | | | — | |
| Accrued expenses: | | | | | | | | | | | | | | | | |
| Directors/Trustees fees | | | 127,104 | | | 118,861 | | | 190,596 | | | 67,255 | | | 64,625 | |
| Management fees | | | 549,408 | | | 426,805 | | | 594,526 | | | 234,082 | | | 567,613 | |
| Other | | | 49,734 | | | 128,435 | | | 880,747 | | | 87,449 | | | 162,304 | |
| Total liabilities | | | 342,735,522 | | | 289,049,567 | | | 425,449,134 | | | 151,541,030 | | | 109,448,734 | |
| Net assets applicable to common shares | | $ | 665,532,237 | | $ | 548,279,508 | | $ | 764,910,377 | | $ | 297,993,596 | | $ | 684,109,332 | |
| Common shares outstanding | | | 41,576,384 | | | 35,222,129 | | | 48,920,182 | | | 19,888,518 | | | 50,084,682 | |
| Net asset value ("NAV") per common share outstanding | | $ | 16.01 | | $ | 15.57 | | $ | 15.64 | | $ | 14.98 | | $ | 13.66 | |
| Net assets applicable to common shares consist of: | | | | | | | | | | | | | | | | |
| Common shares, $0.01 par value per share | | $ | 415,764 | | $ | 352,221 | | $ | 489,202 | | $ | 198,885 | | $ | 500,847 | |
| Paid-in surplus | | | 581,299,958 | | | 492,263,404 | | | 674,587,391 | | | 276,342,301 | | | 696,373,405 | |
| Undistributed (Over-distribution of) net investment income | | | 3,120,497 | | | 2,317,400 | | | 5,622,144 | | | 1,795,746 | | | 4,454,256 | |
| Accumulated net realized gain (loss) | | | (7,529,152 | ) | | (3,836,936 | ) | | (17,035,806 | ) | | (7,892,964 | ) | | (79,364,261 | ) |
| Net unrealized appreciation (depreciation) | | | 88,225,170 | | | 57,183,419 | | | 101,247,446 | | | 27,549,628 | | | 62,145,085 | |
| Net assets applicable to common shares | | $ | 665,532,237 | | $ | 548,279,508 | | $ | 764,910,377 | | $ | 297,993,596 | | $ | 684,109,332 | |
| Authorized shares: | | | | | | | | | | | | | | | | |
| Common | | | 200,000,000 | | | 200,000,000 | | | 200,000,000 | | | 200,000,000 | | | Unlimited | |
| Preferred | | | 1,000,000 | | | 1,000,000 | | | 1,000,000 | | | 1,000,000 | | | Unlimited | |
See accompanying notes to financial statements.
| Statement of | | |
| | Operations | Year Ended October 31, 2015 |
| | | | Investment | | | Select | | | Quality | | | Premier | | | High Income | |
| | | | Quality | | | Quality | | | Income | | | Income | | | Opportunity | |
| | | | (NQM | ) | | (NQS | ) | | (NQU | ) | | (NPF | ) | | (NMZ | ) |
| Investment Income | | $ | 48,117,112 | | $ | 35,883,507 | | $ | 51,910,334 | | $ | 20,370,059 | | $ | 54,182,804 | |
| Expenses | | | | | | | | | | | | | | | | |
| Management fees | | | 6,112,989 | | | 5,039,623 | | | 7,012,931 | | | 2,796,055 | | | 6,719,296 | |
| Interest expense and amortization of offering costs | | | 1,158,398 | | | 490,604 | | | 703,329 | | | 319,036 | | | 1,190,996 | |
| Liquidity fees | | | 2,200,775 | | | 2,486,095 | | | 3,885,501 | | | 1,186,820 | | | — | |
| Remarketing fees | | | 240,088 | | | 271,213 | | | 390,753 | | | 129,475 | | | — | |
| Custodian fees | | | 141,463 | | | 107,311 | | | 140,548 | | | 67,765 | | | 128,013 | |
| Directors/Trustees fees | | | 29,192 | | | 21,905 | | | 32,638 | | | 11,492 | | | 20,822 | |
| Professional fees | | | 103,478 | | | 95,332 | | | 31,730 | | | 59,932 | | | 190,451 | |
| Shareholder reporting expenses | | | 95,155 | | | 67,720 | | | 70,586 | | | 40,756 | | | 127,980 | |
| Shareholder servicing agent fees | | | 53,467 | | | 29,151 | | | 62,861 | | | 17,945 | | | 30,582 | |
| Stock exchange listing fees | | | 9,803 | | | 11,306 | | | 15,941 | | | 8,094 | | | 10,018 | |
| Investor relations expenses | | | 56,878 | | | 41,726 | | | 54,035 | | | 22,382 | | | 42,685 | |
| Other | | | 79,299 | | | 59,336 | | | 688,208 | | | 47,562 | | | 114,766 | |
| Total expenses | | | 10,280,985 | | | 8,721,322 | | | 13,089,061 | | | 4,707,314 | | | 8,575,609 | |
| Net investment income (loss) | | | 37,836,127 | | | 27,162,185 | | | 38,821,273 | | | 15,662,745 | | | 45,607,195 | |
| Realized and Unrealized Gain (Loss) | | | | | | | | | | | | | | | | |
| Net realized gain (loss) from: | | | | | | | | | | | | | | | | |
| Investments | | | 1,776,692 | | | 1,503,913 | | | 911,665 | | | 1,108,606 | | | 6,081,066 | |
| Swaps | | | — | | | — | | | — | | | (62,989 | ) | | — | |
| Change in net unrealized appreciation (depreciation) of: | | | | | | | | | | | | | | | | |
| Investments | | | (6,536,755 | ) | | (4,551,516 | ) | | (2,347,440 | ) | | (7,313,709 | ) | | (7,866,745 | ) |
| Swaps | | | — | | | — | | | — | | | 10,657 | | | — | |
| Net realized and unrealized gain (loss) | | | (4,760,063 | ) | | (3,047,603 | ) | | (1,435,775 | ) | | (6,257,435 | ) | | (1,785,679 | ) |
| Net increase (decrease) in net assets applicable to common shares from operations | | $ | 33,076,064 | | $ | 24,114,582 | | $ | 37,385,498 | | $ | 9,405,310 | | $ | 43,821,516 | |
See accompanying notes to financial statements.
| Statement of | |
| | Changes in Net Assets |
| | | Investment Quality (NQM) | | Select Quality (NQS) | | Quality Income (NQU) | |
| | | | Year Ended | | | Year Ended | | | Year Ended | | | Year Ended | | | Year Ended | | | Year Ended | |
| | | | 10/31/15 | | | 10/31/14 | | | 10/31/15 | | | 10/31/14 | | | 10/31/15 | | | 10/31/14 | |
| Operations | | | | | | | | | | | | | | | | | | | |
| Net investment income (loss) | | $ | 37,836,127 | | $ | 34,320,875 | | $ | 27,162,185 | | $ | 28,860,980 | | $ | 38,821,273 | | $ | 43,487,230 | |
| Net realized gain (loss) from: | | | | | | | | | | | | | | | | | | | |
| Investments | | | 1,776,692 | | | (64,553 | ) | | 1,503,913 | | | (4,293,470 | ) | | 911,665 | | | (6,909,830 | ) |
| Swaps | | | — | | | — | | | — | | | — | | | — | | | — | |
| Change in net unrealized appreciation (depreciation) of: | | | | | | | | | | | | | | | | | | | |
| Investments | | | (6,536,755 | ) | | 49,813,914 | | | (4,551,516 | ) | | 55,281,026 | | | (2,347,440 | ) | | 86,176,669 | |
| Swaps | | | — | | | — | | | — | | | — | | | — | | | — | |
| Net increase (decrease) in net assets applicable to common shares from operations | | | 33,076,064 | | | 84,070,236 | | | 24,114,582 | | | 79,848,536 | | | 37,385,498 | | | 122,754,069 | |
| Distributions to Common Shareholders | | | | | | | | | | | | | | | | | | | |
| From net investment income | | | (40,615,969 | ) | | (34,756,677 | ) | | (27,931,151 | ) | | (28,012,163 | ) | | (40,240,021 | ) | | (44,066,101 | ) |
| From accumulated net realized gains | | | — | | | — | | | — | | | — | | | — | | | (1,446,484 | ) |
| Decrease in net assets applicable to common shares from distributions to common shareholders | | | (40,615,969 | ) | | (34,756,677 | ) | | (27,931,151 | ) | | (28,012,163 | ) | | (40,240,021 | ) | | (45,512,585 | ) |
| Capital Share Transactions | | | | | | | | | | | | | | | | | | | |
| Common shares: | | | | | | | | | | | | | | | | | | | |
| Issued in the reorganization | | | — | | | 89,406,453 | | | — | | | — | | | — | | | — | |
| Proceeds from shelf offering, net of offering costs | | | — | | | — | | | — | | | — | | | — | | | — | |
| Net proceeds from shares issued to shareholders due to reinvestment of distributions | | | — | | | — | | | — | | | — | | | — | | | — | |
| Cost of shares repurchased and retired | | | — | | | — | | | — | | | — | | | (284,885 | ) | | — | |
| Cost of shares repurchased through tender offer | | | — | | | — | | | — | | | — | | | — | | | (81,781,801 | ) |
| Net increase (decrease) in net assets applicable to common shares from capital share transactions | | | — | | | 89,406,453 | | | — | | | — | | | (284,885 | ) | | (81,781,801 | ) |
| Net increase (decrease) in net assets applicable to common shares | | | (7,539,905 | ) | | 138,720,012 | | | (3,816,569 | ) | | 51,836,373 | | | (3,139,408 | ) | | (4,540,317 | ) |
| Net assets applicable to common shares at the beginning of period | | | 673,072,142 | | | 534,352,130 | | | 552,096,077 | | | 500,259,704 | | | 768,049,785 | | | 772,590,102 | |
| Net assets applicable to common shares at the end of period | | $ | 665,532,237 | | $ | 673,072,142 | | $ | 548,279,508 | | $ | 552,096,077 | | $ | 764,910,377 | | $ | 768,049,785 | |
| Undistributed (Over-distribution of) net investment income at the end of period | | $ | 3,120,497 | | $ | 5,876,914 | | $ | 2,317,400 | | $ | 3,123,031 | | $ | 5,622,144 | | $ | 6,950,529 | |
See accompanying notes to financial statements.
| | | | | High Income | |
| | | Premier Income (NPF) | | Opportunity (NMZ) | |
| | | | Year Ended | | | Year Ended | | | Year Ended | | | Year Ended | |
| | | | 10/31/15 | | | 10/31/14 | | | 10/31/15 | | | 10/31/14 | |
| Operations | | | | | | | | | | | | | |
| Net investment income (loss) | | $ | 15,662,745 | | $ | 17,001,136 | | $ | 45,607,195 | | $ | 46,520,431 | |
| Net realized gain (loss) from: | | | | | | | | | | | | | |
| Investments | | | 1,108,606 | | | 389,111 | | | 6,081,066 | | | 8,635,597 | |
| Swaps | | | (62,989 | ) | | 10,000 | | | — | | | 361,500 | |
| Change in net unrealized appreciation (depreciation) of: | | | | | | | | | | | | | |
| Investments | | | (7,313,709 | ) | | 26,745,090 | | | (7,866,745 | ) | | 58,135,896 | |
| Swaps | | | 10,657 | | | (10,657 | ) | | — | | | (611,315 | ) |
| Net increase (decrease) in net assets applicable to common shares from operations | | | 9,405,310 | | | 44,134,680 | | | 43,821,516 | | | 113,042,109 | |
| Distributions to Common Shareholders | | | | | | | | | | | | | |
| From net investment income | | | (16,493,549 | ) | | (17,122,025 | ) | | (46,183,645 | ) | | (45,601,431 | ) |
| From accumulated net realized gains | | | — | | | — | | | — | | | — | |
| Decrease in net assets applicable to common shares from distributions to common shareholders | | | (16,493,549 | ) | | (17,122,025 | ) | | (46,183,645 | ) | | (45,601,431 | ) |
| Capital Share Transactions | | | | | | | | | | | | | |
| Common shares: | | | | | | | | | | | | | |
| Issued in the reorganization | | | — | | | — | | | — | | | — | |
| Proceeds from shelf offering, net of offering costs | | | — | | | — | | | — | | | 292,009 | |
| Net proceeds from shares issued to shareholders due to reinvestment of distributions | | | — | | | — | | | 172,186 | | | 172,715 | |
| Cost of shares repurchased and retired | | | — | | | — | | | — | | | — | |
| Cost of shares repurchased through tender offer | | | — | | | — | | | — | | | — | |
| Net increase (decrease) in net assets applicable to common shares from capital share transactions | | | — | | | — | | | 172,186 | | | 464,724 | |
| Net increase (decrease) in net assets applicable to common shares | | | (7,088,239 | ) | | 27,012,655 | | | (2,189,943 | ) | | 67,905,402 | |
| Net assets applicable to common shares at the beginning of period | | | 305,081,835 | | | 278,069,180 | | | 686,299,275 | | | 618,393,873 | |
| Net assets applicable to common shares at the end of period | | $ | 297,993,596 | | $ | 305,081,835 | | $ | 684,109,332 | | $ | 686,299,275 | |
| Undistributed (Over-distribution of) net investment income at the end of period | | $ | 1,795,746 | | $ | 2,844,890 | | $ | 4,454,256 | | $ | 5,369,457 | |
See accompanying notes to financial statements.
| Statement of | | |
| | Cash Flows | Year Ended October 31, 2015 |
| | | | Investment | | | Select | | | Quality | |
| | | | Quality | | | Quality | | | Income | |
| | | | (NQM | ) | | (NQS | ) | | (NQU | ) |
| Cash Flows from Operating Activities: | | | | | | | | | | |
| Net Increase (Decrease) in Net Assets Applicable to Common Shares from Operations | | $ | 33,076,064 | | $ | 24,114,582 | | $ | 37,385,498 | |
| Adjustments to reconcile the net increase (decrease) in net assets applicable to common shares from operations to net cash provided by (used in) operating activities: | | | | | | | | | | |
| Purchases of investments | | | (103,239,664 | ) | | (180,509,934 | ) | | (211,535,912 | ) |
| Proceeds from sales and maturities of investments | | | 118,020,131 | | | 183,798,689 | | | 211,346,413 | |
| Proceeds from (Purchases of) short-term investments, net | | | — | | | 9,395,750 | | | — | |
| Proceeds from (Payments for) swap contracts, net | | | — | | | — | | | — | |
| Investment transaction adjustments, net | | | (213,423 | ) | | (57,098 | ) | | (29,800 | ) |
| Taxes paid on undistributed capital gains | | | (3,596 | ) | | (73 | ) | | (23 | ) |
| Amortization (Accretion) of premiums and discounts, net | | | (878,991 | ) | | (1,919,961 | ) | | (4,530,596 | ) |
| Amortization of deferred offering costs | | | 114,225 | | | 54,294 | | | 34,142 | |
| (Increase) Decrease in: | | | | | | | | | | |
| Credit default swap premiums paid | | | — | | | — | | | — | |
| Receivable for dividends | | | — | | | — | | | — | |
| Receivable for interest | | | 286,337 | | | 79,360 | | | 461,601 | |
| Receivable for investments sold | | | 9,530,841 | | | (8,017,075 | ) | | 4,530,158 | |
| Other assets | | | (25,808 | ) | | (20,334 | ) | | 32,772 | |
| Increase (Decrease) in: | | | | | | | | | | |
| Payable for interest | | | 6,265 | | | — | | | — | |
| Payable for investments purchased | | | (9,444,571 | ) | | (687,743 | ) | | (902,064 | ) |
| Accrued Directors/Trustees fees | | | 24,156 | | | 20,151 | | | 31,211 | |
| Accrued management fees | | | 36,589 | | | (3,682 | ) | | (4,830 | ) |
| Accrued other expenses | | | (336,023 | ) | | (47,359 | ) | | 419,979 | |
| Net realized gain (loss) from: | | | | | | | | | | |
| Investments | | | (1,776,692 | ) | | (1,503,913 | ) | | (911,665 | ) |
| Paydowns | | | — | | | — | | | — | |
| Swaps | | | — | | | — | | | — | |
| Change in net unrealized (appreciation) depreciation of: | | | | | | | | | | |
| Investments | | | 6,536,755 | | | 4,551,516 | | | 2,347,440 | |
| Swaps | | | — | | | — | | | — | |
| Net cash provided by (used in) operating activities | | | 51,712,595 | | | 29,247,170 | | | 38,674,324 | |
| Cash Flows from Financing Activities: | | | | | | | | | | |
| Increase (Decrease) in: | | | | | | | | | | |
| Cash overdraft | | | (4,169,089 | ) | | — | | | 1,450,769 | |
| Floating rate obligations | | | (6,145,000 | ) | | (375,000 | ) | | (4,580,000 | ) |
| Payable for offering costs | | | (29,150 | ) | | (1,385 | ) | | — | |
| Cash distributions paid to common shareholders | | | (40,261,687 | ) | | (28,022,240 | ) | | (40,228,625 | ) |
| Cost of common shares repurchased and retired | | | — | | | — | | | (284,885 | ) |
| Net cash provided by (used in) financing activities | | | (50,604,926 | ) | | (28,398,625 | ) | | (43,642,741 | ) |
| Net Increase (Decrease) in Cash | | | 1,107,669 | | | 848,545 | | | (4,968,417 | ) |
| Cash at the beginning of period | | | — | | | 10,945,393 | | | 4,968,417 | |
| Cash at the end of period | | $ | 1,107,669 | | $ | 11,793,938 | | $ | — | |
| | | | Investment | | | Select | | | Quality | |
| | | | Quality | | | Quality | | | Income | |
| Supplemental Disclosure of Cash Flow Information | | | (NQM | ) | | (NQS | ) | | (NQU | ) |
| Cash paid for interest (excluding amortization of offering costs) | | $ | 1,055,988 | | $ | 436,520 | | $ | 669,187 | |
| Non-cash financing activities not included herein consists of reinvestments of common share distributions | | | — | | | — | | | — | |
See accompanying notes to financial statements.
| | | | Premier | | | High Income | |
| | | | Income | | | Opportunity | |
| | | | (NPF | ) | | (NMZ | ) |
| Cash Flows from Operating Activities: | | | | | | | |
| Net Increase (Decrease) in Net Assets Applicable to Common Shares from Operations | | $ | 9,405,310 | | $ | 43,821,516 | |
| Adjustments to reconcile the net increase (decrease) in net assets applicable to common shares from operations to net cash provided by (used in) operating activities: | | | | | | | |
| Purchases of investments | | | (55,023,589 | ) | | (66,431,624 | ) |
| Proceeds from sales and maturities of investments | | | 78,767,136 | | | 78,711,489 | |
| Proceeds from (Purchases of) short-term investments, net | | | (1,600,000 | ) | | — | |
| Proceeds from (Payments for) swap contracts, net | | | (62,989 | ) | | — | |
| Investment transaction adjustments, net | | | (355,342 | ) | | 67,696 | |
| Taxes paid on undistributed capital gains | | | (9 | ) | | (1,768 | ) |
| Amortization (Accretion) of premiums and discounts, net | | | (2,645,208 | ) | | (1,304,840 | ) |
| Amortization of deferred offering costs | | | 25,221 | | | 66,010 | |
| (Increase) Decrease in: | | | | | | | |
| Credit default swap premiums paid | | | 857,697 | | | — | |
| Receivable for dividends | | | — | | | 22,751 | |
| Receivable for interest | | | 361,160 | | | 200,824 | |
| Receivable for investments sold | | | (4,866,388 | ) | | (3,121,074 | ) |
| Other assets | | | (11,443 | ) | | (106,829 | ) |
| Increase (Decrease) in: | | | | | | | |
| Payable for interest | | | — | | | (20,069 | ) |
| Payable for investments purchased | | | — | | | (13,914,785 | ) |
| Accrued Directors/Trustees fees | | | 11,532 | | | 12,582 | |
| Accrued management fees | | | (9,364 | ) | | (2,401 | ) |
| Accrued other expenses | | | (20,950 | ) | | (21,177 | ) |
Net realized gain (loss) from: | | | | | | | |
| Investments | | | (1,108,606 | ) | | (6,081,066 | ) |
| Paydowns | | | — | | | (82,587 | ) |
| Swaps | | | 62,989 | | | — | |
| Change in net unrealized (appreciation) depreciation of: | | | | | | | |
| Investments | | | 7,313,709 | | | 7,866,745 | |
| Swaps | | | (10,657 | ) | | — | |
| Net cash provided by (used in) operating activities | | | 31,090,209 | | | 39,681,393 | |
| Cash Flows from Financing Activities: | | | | | | | |
| Increase (Decrease) in: | | | | | | | |
| Cash overdraft | | | — | | | 4,597,814 | |
| Floating rate obligations | | | (13,155,000 | ) | | — | |
| Payable for offering costs | | | — | | | (30,695 | ) |
| Cash distributions paid to common shareholders | | | (16,620,215 | ) | | (46,031,661 | ) |
| Cost of common shares repurchased and retired | | | — | | | — | |
| Net cash provided by (used in) financing activities | | | (29,775,215 | ) | | (41,464,542 | ) |
| Net Increase (Decrease) in Cash | | | 1,314,994 | | | (1,783,149 | ) |
| Cash at the beginning of period | | | 893,940 | | | 1,783,149 | |
| Cash at the end of period | | $ | 2,208,934 | | $ | — | |
| | | | Premier | | | High Income | |
| | | | Income | | | Opportunity | |
| Supplemental Disclosure of Cash Flow Information | | | (NPF | ) | | (NMZ | ) |
| Cash paid for interest (excluding amortization of offering costs) | | $ | 292,430 | | $ | 1,060,055 | |
| Non-cash financing activities not included herein consists of reinvestments of common share distributions | | | — | | | 172,186 | |
See accompanying notes to financial statements.
Selected data for a common share outstanding throughout each period:
| | | | | | Investment Operations | | Less Distributions to
Common Shareholders | | Common Share | |
| | | Beginning
Common
Share
NAV | | Net
Investment
Income
(Loss | ) | Net
Realized/
Unrealized
Gain (Loss | ) | Distributions
from Net
Investment
Income to
ARPS
Shareholders | (a) | Distributions
from
Accumu-
lated Net
Realized
Gains to
ARPS
Shareholders | (a) | Total | | From
Net
Investment
Income | | From
Accumu-
lated Net
Realized
Gains | | Total | | Premium
Per
Share
Sold
through
Shelf
Offering | | Shelf
Offering
Costs | | Ending
NAV | | Ending
Share
Price | |
| Investment Quality (NQM) | | | | | | | | | | | | | | | | | | | | | | | | | | | | | | | | | | |
| Year Ended 10/31: | | | | | | | | | | | | | | | | | | | | | | | | | | | | | | | | | | | | | |
| 2015 | | $ | 16.19 | | $ | 0.91 | | $ | (0.11 | ) | $ | — | | $ | — | | $ | 0.80 | | $ | (0.98 | ) | $ | — | | $ | (0.98 | ) | $ | — | | $ | — | | $ | 16.01 | | $ | 15.29 | |
| 2014 | | | 14.85 | | | 0.93 | | | 1.38 | | | — | | | — | | | 2.31 | | | (0.97 | ) | | — | | | (0.97 | ) | | — | | | — | | | 16.19 | | | 14.79 | |
| 2013 | | | 16.60 | | | 0.92 | | | (1.70 | ) | | — | | | — | | | (0.78 | ) | | (0.97 | ) | | — | | | (0.97 | ) | | — | | | — | | | 14.85 | | | 13.69 | |
| 2012 | | | 14.93 | | | 0.93 | | | 1.75 | | | — | | | — | | | 2.68 | | | (1.01 | ) | | — | | | (1.01 | ) | | — | | | — | | | 16.60 | | | 16.64 | |
| 2011 | | | 15.13 | | | 1.00 | | | (0.22 | ) | | (0.01 | ) | | — | | | 0.77 | | | (0.97 | ) | | — | | | (0.97 | ) | | — | | | — | | | 14.93 | | | 14.57 | |
| | | | | | | | | | | | | | | | | | | | | | | | | | | | | | | | | | | | | | | | | |
| Select Quality (NQS) | | | | | | | | | | | | | | | | | | | | | | | | | | | | | | | | | | |
| Year Ended 10/31: | | | | | | | | | | | | | | | | | | | | | | | | | | | | | | | | | | | | | |
| 2015 | | | 15.67 | | | 0.77 | | | (0.08 | ) | | — | | | — | | | 0.69 | | | (0.79 | ) | | — | | | (0.79 | ) | | — | | | — | | | 15.57 | | | 13.63 | |
| 2014 | | | 14.20 | | | 0.82 | | | 1.45 | | | — | | | — | | | 2.27 | | | (0.80 | ) | | — | | | (0.80 | ) | | — | | | — | | | 15.67 | | | 13.98 | |
| 2013 | | | 15.94 | | | 0.77 | | | (1.66 | ) | | — | | | — | | | (0.89 | ) | | (0.82 | ) | | (0.04 | ) | | (0.86 | ) | $ | 0.01 | | | — | * | | 14.20 | | | 12.61 | |
| 2012 | | | 14.31 | | | 0.87 | | | 1.83 | | | — | | | — | | | 2.70 | | | (1.00 | ) | | (0.08 | ) | | (1.08 | ) | | 0.01 | | | — | * | | 15.94 | | | 16.40 | |
| 2011 | | | 14.82 | | | 1.03 | | | (0.40 | ) | | (0.02 | ) | | — | * | | 0.61 | | | (1.04 | ) | | (0.08 | ) | | (1.12 | ) | | — | | | — | | | 14.31 | | | 14.62 | |
| (a) | The amounts shown for Auction Rate Preferred Shares ("ARPS") are based on common share equivalents. |
| (b) | Total Return Based on Common Share NAV is the combination of changes in common share NAV, reinvested dividend income at NAV and reinvested capital gains distributions at NAV, if any. The last dividend declared in the period, which is typically paid on the first business day of the following month, is assumed to be reinvested at the ending NAV. The actual reinvest price for the last dividend declared in the period may often be based on the Fund's market price (and not its NAV), and therefore may be different from the price used in the calculation. Total returns are not annualized. |
| | |
| | Total Return Based on Common Share Price is the combination of changes in the market price per share and the effect of reinvested dividend income and reinvested capital gains distributions, if any, at the average price paid per share at the time of reinvestment. The last dividend declared in the period, which is typically paid on the first business day of the following month, is assumed to be reinvested at the ending market price. The actual reinvestment for the last dividend declared in the period may take place over several days, and in some instances may not be based on the market price, so the actual reinvestment price may be different from the price used in the calculation. Total returns are not annualized. |
| | | | | | | | Common Share Supplemental Data/
Ratios Applicable to Common Shares | |
| | Common Share
Total Returns | | | | | Ratios to Average Net Assets(c) | | | | |
| | | | | | | | | | | | | |
| | Based
on
NAV | (b) | Based
on
Share
Price | (b) | Ending
Net
Assets (000 | ) | Expenses | (e) | Net
Investment
Income (Loss | ) | Portfolio
Turnover
Rate | (f) |
| | | | | | | | | | | | | | | | | | | |
| | | | | | | | | | | | | | | | | | | |
| | | 5.05 | % | | 10.22 | % | $ | 665,532 | | | 1.54 | % | | 5.65 | % | | 10 | % |
| | | 16.03 | | | 15.51 | | | 673,072 | | | 1.67 | (d) | | 6.12 | (d) | | 9 | |
| | | (4.91 | ) | | (12.30 | ) | | 534,352 | | | 1.64 | | | 5.81 | | | 14 | |
| | | 18.37 | | | 21.61 | | | 596,684 | | | 1.66 | | | 5.84 | | | 7 | |
| | | 5.58 | | | 4.45 | | | 535,519 | | | 1.50 | | | 7.03 | | | 12 | |
| | | | | | | | | | | | | | | | | | | |
| | | | | | | | | | | | | | | | | | | |
| | | 4.53 | % | | 3.26 | % | $ | 548,280 | | | 1.59 | | | 4.94 | | | 22 | |
| | | 16.36 | | | 17.62 | | | 552,096 | | | 1.67 | | | 5.50 | | | 14 | |
| | | (5.79 | ) | | (18.37 | ) | | 500,260 | | | 1.76 | | | 5.01 | | | 26 | |
| | | 19.50 | | | 20.32 | | | 557,646 | | | 1.79 | | | 5.71 | | | 24 | |
| | | 4.82 | | | 3.35 | | | 491,453 | | | 1.53 | | | 7.61 | | | 13 | |
| (c) | Ratios do not reflect the effect of dividend payments to ARPS shareholders, during periods when ARPS were outstanding; Net Investment Income (Loss) ratios reflect income earned and expenses incurred on assets attributable to ARPS and other subsequent forms of preferred shares issued by the Fund, where applicable. |
| (d) | During the fiscal year ended October 31, 2014, the Adviser voluntarily reimbursed the Fund for certain expenses incurred in connection with a common shares equity shelf program. As a result, the Expenses and Net Investment Income (Loss) Ratios to Average Net Assets reflect this voluntary expense reimbursement from Adviser. The Expenses and Net Investment Income (Loss) Ratios to Average Net Assets excluding this expense reimbursement from Adviser were as follows: |
| | Ratio to Average Net Assets | |
| | | Net Investment | |
| Investment Quality (NQM) | Expenses | Income (Loss) | |
| Year Ended 10/31: | | | |
| 2014 | 1.68% | 6.11% | |
| (e) | The expense ratios reflect, among other things, all interest expense and other costs related to preferred shares (as described in Note 4 – Fund Shares, Preferred Shares) and/or the interest expense deemed to have been paid by the Fund on the floating rate certificates issued by the special purpose trusts for the self-deposited inverse floaters held by the Fund (as described in Note 3 – Portfolio Securities and Investments in Derivatives, Inverse Floating Rate Securities), where applicable, as follows: |
| Investment Quality (NQM) | | |
| Year Ended 10/31: | | |
| 2015 | 0.54 | % |
| 2014 | 0.56 | |
| 2013 | 0.64 | |
| 2012 | 0.65 | |
| 2011 | 0.40 | |
| Select Quality (NQS) | | |
| Year Ended 10/31: | | |
| 2015 | 0.59 | % |
| 2014 | 0.63 | |
| 2013 | 0.72 | |
| 2012 | 0.76 | |
| 2011 | 0.42 | |
| (f) | Portfolio Turnover Rate is calculated based on the lesser of long-term purchases or sales (as disclosed in Note 5 – Investment Transactions) divided by the average long-term market value during the period. |
| * | Rounds to less than $0.01 per share. |
See accompanying notes to financial statements.
Financial Highlights (continued)
Selected data for a common share outstanding throughout each period:
| | | | | | Investment Operations | | Less Distributions to
Common Shareholders | | Common Share | |
| | | Beginning
Common
Share
NAV | | Net
Investment
Income
(Loss | ) | Net
Realized/
Unrealized
Gain (Loss | ) | Distributions
from Net
Investment
Income to
ARPS
Shareholders | (a) | Distributions
from
Accumu-
lated Net
Realized
Gains to
ARPS
Shareholders | (a) | Total | | From
Net
Investment
Income | | From
Accumu-
lated Net
Realized
Gains | | Total | | Discount
per
Share
Repur-
chased
and
Retired | | Discount
per
Share
Repur-
chased
Through
Tender
Offer | | Ending
NAV | | Ending
Share
Price | |
| Quality Income (NQU) | | | | | | | | | | | | | | | | | | | | | | | | | | | | | | | | | | |
| Year Ended 10/31: | | | | | | | | | | | | | | | | | | | | | | | | | | | | | | | | | | | |
| 2015 | | $ | 15.69 | | $ | 0.79 | | $ | (0.02 | ) | $ | — | | $ | — | | $ | 0.77 | | $ | (0.82 | ) | $ | — | | $ | (0.82 | ) | $ | — | * | $ | — | | $ | 15.64 | | $ | 13.83 | |
| 2014 | | | 14.21 | | | 0.82 | | | 1.48 | | | — | | | — | | | 2.30 | | | (0.82 | ) | | (0.03 | ) | | (0.85 | ) | | — | | | 0.03 | | | 15.69 | | | 13.97 | |
| 2013 | | | 16.15 | | | 0.79 | | | (1.89 | ) | | — | | | — | | | (1.10 | ) | | (0.81 | ) | | (0.03 | ) | | (0.84 | ) | | — | | | — | | | 14.21 | | | 12.64 | |
| 2012 | | | 14.37 | | | 0.86 | | | 1.89 | | | — | | | — | | | 2.75 | | | (0.94 | ) | | (0.03 | ) | | (0.97 | ) | | — | | | — | | | 16.15 | | | 15.81 | |
| 2011 | | | 14.83 | | | 0.93 | | | (0.43 | ) | | (0.01 | ) | | — | | | 0.49 | | | (0.95 | ) | | — | | | (0.95 | ) | | — | | | — | | | 14.37 | | | 13.90 | |
| | | | | | | | | | | | | | | | | | | | | | | | | | | | | | | | | | | | | | | | | |
| Premier Income (NPF) | | | | | | | | | | | | | | | | | | | | | | | | | | | | | | | | | | |
| Year Ended 10/31: | | | | | | | | | | | | | | | | | | | | | | | | | | | | | | | | | | |
| 2015 | | | 15.34 | | | 0.79 | | | (0.32 | ) | | — | | | — | | | 0.47 | | | (0.83 | ) | | — | | | (0.83 | ) | | — | | | — | | | 14.98 | | | 13.23 | |
| 2014 | | | 13.98 | | | 0.85 | | | 1.37 | | | — | | | — | | | 2.22 | | | (0.86 | ) | | — | | | (0.86 | ) | | — | | | — | | | 15.34 | | | 13.74 | |
| 2013 | | | 15.65 | | | 0.82 | | | (1.65 | ) | | — | | | — | | | (0.83 | ) | | (0.84 | ) | | — | | | (0.84 | ) | | — | | | — | | | 13.98 | | | 12.54 | |
| 2012 | | | 14.45 | | | 0.83 | | | 1.29 | | | — | | | — | | | 2.12 | | | (0.92 | ) | | — | | | (0.92 | ) | | — | | | — | | | 15.65 | | | 15.46 | |
| 2011 | | | 14.70 | | | 0.94 | | | (0.29 | ) | | (0.01 | ) | | — | | | 0.64 | | | (0.89 | ) | | — | | | (0.89 | ) | | — | | | — | | | 14.45 | | | 13.91 | |
| (a) | The amounts shown for ARPS are based on common share equivalents. |
| (b) | Total Return Based on Common Share NAV is the combination of changes in common share NAV, reinvested dividend income at NAV and reinvested capital gains distributions at NAV, if any. The last dividend declared in the period, which is typically paid on the first business day of the following month, is assumed to be reinvested at the ending NAV. The actual reinvest price for the last dividend declared in the period may often be based on the Fund's market price (and not its NAV), and therefore may be different from the price used in the calculation. Total returns are not annualized. |
| | |
| | Total Return Based on Common Share Price is the combination of changes in the market price per share and the effect of reinvested dividend income and reinvested capital gains distributions, if any, at the average price paid per share at the time of reinvestment. The last dividend declared in the period, which is typically paid on the first business day of the following month, is assumed to be reinvested at the ending market price. The actual reinvestment for the last dividend declared in the period may take place over several days, and in some instances may not be based on the market price, so the actual reinvestment price may be different from the price used in the calculation. Total returns are not annualized. |
| | | | | | | | Common Share Supplemental Data/
Ratios Applicable to Common Shares | |
| | Common Share
Total Returns | | | | | Ratios to Average Net Assets(c) | | | | |
| | | | | | | | | | | | | |
| | Based
on
NAV | (b) | Based
on
Share
Price | (b) | Ending
Net
Assets (000 | ) | Expenses | (d) | Net
Investment
Income (Loss | ) | Portfolio
Turnover
Rate | (e) |
| | | | | | | | | | | | | | | | | | | |
| | | | | | | | | | | | | | | | | | | |
| | | 5.04 | % | | 5.06 | % | $ | 764,910 | | | 1.71 | % | | 5.07 | % | | 18 | % |
| | | 16.84 | | | 17.69 | | | 768,050 | | | 1.87 | | | 5.45 | | | 9 | |
| | | (7.07 | ) | | (15.18 | ) | | 772,590 | | | 1.81 | | | 5.11 | | | 29 | |
| | | 19.63 | | | 21.16 | | | 878,070 | | | 1.82 | | | 5.58 | | | 17 | |
| | | 3.79 | | | 0.79 | | | 781,061 | | | 1.92 | | | 6.80 | | | 16 | |
| | | | | | | | | | | | | | | | | | | |
| | | | | | | | | | | | | | | | | | | |
| | | 3.14 | | | 2.36 | | | 297,994 | | | 1.56 | | | 5.21 | | | 12 | |
| | | 16.33 | | | 16.88 | | | 305,082 | | | 1.66 | | | 5.84 | | | 11 | |
| | | (5.48 | ) | | (13.84 | ) | | 278,069 | | | 1.74 | | | 5.49 | | | 14 | |
| | | 14.98 | | | 18.11 | | | 311,279 | | | 1.80 | | | 5.42 | | | 18 | |
| | | 4.65 | | | 3.59 | | | 287,473 | | | 1.55 | | | 6.74 | | | 10 | |
| (c) | Ratios do not reflect the effect of dividend payments to ARPS shareholders, during periods when ARPS were outstanding; Net Investment Income (Loss) ratios reflect income earned and expenses incurred on assets attributable to ARPS and other subsequent forms of preferred shares issued by the Fund, where applicable. |
| (d) | The expense ratios reflect, among other things, all interest expense and other costs related to preferred shares (as described in Note 4 – Fund Shares, Preferred Shares) and/or the interest expense deemed to have been paid by the Fund on the floating rate certificates issued by the special purpose trusts for the self-deposited inverse floaters held by the Fund (as described in Note 3 – Portfolio Securities and Investments in Derivatives, Inverse Floating Rate Securities), where applicable, as follows: |
| Quality Income (NQU) | | |
| Year Ended 10/31: | | |
| 2015 | 0.65 | % |
| 2014 | 0.81 | |
| 2013 | 0.80 | |
| 2012 | 0.82 | |
| 2011 | 0.85 | |
| Premier Income (NPF) | | |
| Year Ended 10/31: | | |
| 2015 | 0.54 | % |
| 2014 | 0.58 | |
| 2013 | 0.71 | |
| 2012 | 0.74 | |
| 2011 | 0.44 | |
| (e) | Portfolio Turnover Rate is calculated based on the lesser of long-term purchases or sales (as disclosed in Note 5 – Investment Transactions) divided by the average long-term market value during the period. |
| * | Rounds to less than $0.01 per share. |
See accompanying notes to financial statements.
Financial Highlights (continued)
Selected data for a common share outstanding throughout each period:
| | | | | | Investment Operations | | Less Distributions
to Common Shareholders | | Common Share | |
| | | Beginning
Common
Share
NAV | | Net
Investment
Income
(Loss | ) | Net
Realized/
Unrealized
Gain (Loss | ) | Distributions
from Net
Investment
Income to
ARPS
Shareholders | (a) | Distributions
from
Accumu-
lated Net
Realized
Gains to
ARPS
Shareholders | (a) | Total | | From
Net
Investment
Income | | From
Accumu-
lated Net
Realized
Gains | | Total | | Premium
Per
Share
Sold
through
Shelf
Offering | | Shelf
Offering
Costs | | Ending
NAV | | Ending
Share
Price | |
| High Income Opportunity (NMZ) | | | | | | | | | | | | | | | | | | | | | | | | | | | | | | | | | | |
| Year Ended 10/31: | | | | | | | | | | | | | | | | | | | | | | | | | | | | | | | | | | | | | |
| 2015 | | $ | 13.71 | | $ | 0.91 | | $ | (0.04 | ) | $ | — | | $ | — | | $ | 0.87 | | $ | (0.92 | ) | $ | — | | $ | (0.92 | ) | $ | — | | $ | — | | $ | 13.66 | | $ | 13.76 | |
| 2014 | | | 12.36 | | | 0.93 | | | 1.33 | | | — | | | — | | | 2.26 | | | (0.91 | ) | | — | | | (0.91 | ) | | — | * | | — | * | | 13.71 | | | 13.21 | |
| 2013 | | | 13.45 | | | 0.94 | | | (1.20 | ) | | — | | | — | | | (0.26 | ) | | (0.88 | ) | | — | | | (0.88 | ) | | 0.05 | | | — | * | | 12.36 | | | 11.99 | |
| 2012 | | | 11.59 | | | 0.91 | | | 1.78 | | | — | | | — | | | 2.69 | | | (0.90 | ) | | — | | | (0.90 | ) | | 0.07 | | | — | * | | 13.45 | | | 14.22 | |
| 2011 | | | 12.13 | | | 0.96 | | | (0.57 | ) | | (0.01 | ) | | — | | | 0.38 | | | (0.96 | ) | | — | | | (0.96 | ) | | 0.04 | | | — | * | | 11.59 | | | 11.75 | |
| (a) | The amounts shown for ARPS are based on common share equivalents. |
| (b) | Total Return Based on Common Share NAV is the combination of changes in common share NAV, reinvested dividend income at NAV and reinvested capital gains distributions at NAV, if any. The last dividend declared in the period, which is typically paid on the first business day of the following month, is assumed to be reinvested at the ending NAV. The actual reinvest price for the last dividend declared in the period may often be based on the Fund's market price (and not its NAV), and therefore may be different from the price used in the calculation. Total returns are not annualized. |
| | |
| | Total Return Based on Common Share Price is the combination of changes in the market price per share and the effect of reinvested dividend income and reinvested capital gains distributions, if any, at the average price paid per share at the time of reinvestment. The last dividend declared in the period, which is typically paid on the first business day of the following month, is assumed to be reinvested at the ending market price. The actual reinvestment for the last dividend declared in the period may take place over several days, and in some instances may not be based on the market price, so the actual reinvestment price may be different from the price used in the calculation. Total returns are not annualized. |
| | | | | | | | | Common Share Supplemental Data/
Ratios Applicable to Common Shares | |
| | | Common Share
Total Returns | | | | | Ratios to Average Net Assets
Before Reimbursement(c) | | Ratios to Average Net Assets
After Reimbursement(c)(d) | | | | |
| | | | | | | | | | | | | | | | | | |
| | | Based
on
NAV | (b) | Based
on
Share
Price | (b) | Ending
Net
Assets
(000 | ) | Expenses | (e) | Net
Investment
Income (Loss | ) | Expenses | (e) | Net
Investment
Income (Loss | ) | Portfolio
Turnover
Rate | (f) |
| | | | | | | | | | | | | | | | | | | | | | | | | | |
| | | | | | | | | | | | | | | | | | | | | | | | | | |
| | | | 6.54 | % | | 11.49 | % | $ | 684,109 | | | 1.25 | % | | 6.64 | % | | N/A | | | N/A | | | 9 | % |
| | | | 18.90 | | | 18.31 | | | 686,299 | | | 1.28 | | | 7.14 | | | N/A | | | N/A | | | 13 | |
| | | | (1.71 | ) | | (9.71 | ) | | 618,394 | | | 1.28 | | | 7.34 | | | N/A | | | N/A | | | 16 | |
| | | | 24.55 | | | 29.84 | | | 402,573 | | | 1.42 | | | 7.31 | | | 1.41 | % | | 7.32 | % | | 12 | |
| | | | 4.24 | | | (1.22 | ) | | 323,090 | | | 1.52 | | | 8.55 | | | 1.40 | | | 8.66 | | | 32 | |
| (c) | Ratios do not reflect the effect of dividend payments to ARPS shareholders, during periods when ARPS were outstanding; Net Investment Income (Loss) ratios reflect income earned and expenses incurred on assets attributable to ARPS and other subsequent forms of preferred shares issued by the Fund, where applicable. |
| (d) | After expense reimbursement from the Adviser, where applicable. As of November 30, 2011, the Adviser is no longer reimbursing High Income Opportunity (NMZ), for any fees or expenses. |
| (e) | The expense ratios reflect, among other things, all interest expense and other costs related to preferred shares (as described in Note 4 – Fund Shares, Preferred Shares) and/or the interest expense deemed to have been paid by the Fund on the floating rate certificates issued by the special purpose trusts for the self-deposited inverse floaters held by the Fund (as described in Note 3 – Portfolio Securities and Investments in Derivatives, Inverse Floating Rate Securities), where applicable, as follows: |
| High Income Opportunity (NMZ) | | |
| Year Ended 10/31: | | |
| 2015 | 0.17 | % |
| 2014 | 0.19 | |
| 2013 | 0.20 | |
| 2012 | 0.21 | |
| 2011 | 0.15 | |
| (f) | Portfolio Turnover Rate is calculated based on the lesser of long-term purchases or sales (as disclosed in Note 5 – Investment Transactions) divided by the average long-term market value during the period. |
| * | Rounds to less than $0.01 per share. |
| N/A | Fund no longer has a contractual reimbursement agreement with the Adviser. |
See accompanying notes to financial statements.
Financial Highlights (continued)
| | | | | | | | | | | | | | | VMTP and VRDP | |
| | | VMTP Shares | | VRDP Shares | | Shares at the End | |
| | | at the End of Period | | at the End of Period | | of the Period | |
| | | | | | | | | | | | | | | | Asset | |
| | | | Aggregate | | | Asset | | | Aggregate | | | Asset | | | Coverage | |
| | | | Amount | | | Coverage | | | Amount | | | Coverage | | | Per $1 | |
| | | | Outstanding | | | Per $100,000 | | | Outstanding | | | Per $100,000 | | | Liquidation | |
| | | | (000 | ) | | Share | | | (000 | ) | | Share | | | Preference | |
| Investment Quality (NQM) | | | | | | | | | | | | | | | | |
| Year Ended 10/31: | | | | | | | | | | | | | | | | |
| 2015 | | $ | 43,500 | | $ | 337,436 | | $ | 236,800 | | $ | 337,436 | | $ | 3.37 | |
| 2014 | | | 43,500 | | | 340,126 | | | 236,800 | | | 340,126 | | | 3.40 | |
| 2013 | | | — | | | — | | | 236,800 | | | 325,655 | | | — | |
| 2012 | | | — | | | — | | | 211,800 | | | 381,720 | | | — | |
| 2011 | | | — | | | — | | | 211,800 | | | 352,842 | | | — | |
| Select Quality (NQS) | | | | | | | | | | | | | | | | |
| Year Ended 10/31: | | | | | | | | | | | | | | | | |
| 2015 | | | — | | | — | | | 267,500 | | | 304,964 | | | — | |
| 2014 | | | — | | | — | | | 267,500 | | | 306,391 | | | — | |
| 2013 | | | — | | | — | | | 267,500 | | | 287,013 | | | — | |
| 2012 | | | — | | | — | | | 252,500 | | | 320,850 | | | — | |
| 2011 | | | — | | | — | | | 252,500 | | | 294,635 | | | — | |
| Quality Income (NQU) | | | | | | | | | | | | | | | | |
| Year Ended 10/31: | | | | | | | | | | | | | | | | |
| 2015 | | | — | | | — | | | 385,400 | | | 298,472 | | | — | |
| 2014 | | | — | | | — | | | 385,400 | | | 299,286 | | | — | |
| 2013 | | | — | | | — | | | 428,400 | | | 280,343 | | | — | |
| 2012 | | | — | | | — | | | 388,400 | | | 326,074 | | | — | |
| 2011 | | | — | | | — | | | 388,400 | | | 301,097 | | | — | |
| Premier Income (NPF) | | | | | | | | | | | | | | | | |
| Year Ended 10/31: | | | | | | | | | | | | | | | | |
| 2015 | | | — | | | — | | | 127,700 | | | 333,354 | | | — | |
| 2014 | | | — | | | — | | | 127,700 | | | 338,905 | | | — | |
| 2013 | | | — | | | — | | | 127,700 | | | 317,752 | | | — | |
| 2012 | | | — | | | — | | | 127,700 | | | 343,758 | | | — | |
| 2011 | | | — | | | — | | | 127,700 | | | 325,116 | | | — | |
| | | VMTP Shares | | Borrowings | |
| | | at the End of Period | | at the End of Period | |
| | | | Aggregate | | | Asset | | | Aggregate | | | | |
| | | | Amount | | | Coverage | | | Amount | | | Asset | |
| | | | Outstanding | | | Per $100,000 | | | Outstanding | | | Coverage | |
| | | | (000 | ) | | Share | | | (000 | ) | | Per $1,000 | |
| High Income Opportunity (NMZ) | | | | | | | | | | | | | |
| Year Ended 10/31: | | | | | | | | | | | | | |
| 2015 | | $ | 87,000 | | $ | 886,333 | | $ | — | | $ | — | |
| 2014 | | | 87,000 | | | 888,850 | | | — | | | — | |
| 2013 | | | 87,000 | | | 810,798 | | | — | | | — | |
| 2012 | | | — | | | — | | | 50,000 | | | 9,051 | |
| 2011 | | | — | | | — | | | 50,000 | | | 7,462 | |
See accompanying notes to financial statements.
Notes to Financial Statements
1. General Information and Significant Accounting Policies
General Information
Fund Information
The funds covered in this report and their corresponding New York Stock Exchange ("NYSE") or NYSE MKT symbols are as follows (each a "Fund" and collectively, the "Funds"):
| | • | Nuveen Investment Quality Municipal Fund, Inc. (NQM) ("Investment Quality (NQM)") |
| | • | Nuveen Select Quality Municipal Fund, Inc. (NQS) ("Select Quality (NQS)") |
| | • | Nuveen Quality Income Municipal Fund, Inc. (NQU) ("Quality Income (NQU)") |
| | • | Nuveen Premier Municipal Income Fund, Inc. (NPF) ("Premier Income (NPF)") |
| | • | Nuveen Municipal High Income Opportunity Fund (NMZ) ("High Income Opportunity (NMZ)") |
The Funds are registered under the Investment Company Act of 1940, as amended, as diversified, closed-end management investment companies. Common shares of Investment Quality (NQM), Select Quality (NQS), Quality Income (NQU) and Premier Income (NPF) are traded on the NYSE while common shares of High Income Opportunity (NMZ) are traded on the NYSE MKT. Investment Quality (NQM), Select Quality (NQS), Quality Income (NQU) and Premier Income (NPF) were incorporated under the state laws of Minnesota on January 23, 1990, January 23, 1991, January 23, 1991 and July 25, 1991, respectively. High Income Opportunity (NMZ) was organized as a Massachusetts business trust on October 8, 2003.
The end of the reporting period for the Funds is October 31, 2015, and the period covered by these Notes to Financial Statements is the fiscal year ended October 31, 2015 (the "current fiscal period").
Investment Adviser
The Funds' investment adviser is Nuveen Fund Advisors, LLC (the "Adviser"), a wholly-owned subsidiary of Nuveen Investments, Inc. ("Nuveen"). The Adviser is responsible for each Fund's overall investment strategy and asset allocation decisions. The Adviser has entered into sub-advisory agreements with Nuveen Asset Management, LLC (the "Sub-Adviser"), a subsidiary of the Adviser, under which the Sub-Adviser manages the investment portfolios of the Funds.
Investment Objectives and Principal Investment Strategies
Each Fund seeks to provide current income exempt from regular federal income tax by investing primarily in a portfolio of municipal obligations issued by state and local government authorities or certain U.S. territories.
Fund Reorganizations
During August, 2015, the Nuveen funds' Board of Directors/Trustees approved a series of reorganizations for certain funds, one of which is included in this report (the "Reorganizations"). The Reorganizations are intended to create one, larger national Fund, which would potentially offer shareholders the following benefits:
| | • | Improving fund net earnings potential through a broader investment mandate; |
| | • | Creating significantly larger funds that offer greater liquidity and ease of trading; and |
| | • | Eliminating overlapping products and enhancing fund differentiation. |
The proposed Reorganizations are as follows:
| | Target Funds | | Acquiring Fund |
| | Quality Income (NQU) | | Nuveen Dividend Advantage Municipal Income Fund (NVG) |
| | Nuveen Quality Municipal Fund, Inc. (NQI) | | to be renamed Nuveen Enhanced AMT-Free Municipal |
| | Nuveen Municipal Opportunity Fund, Inc. (NIO) | | Credit Opportunities Fund |
The Reorganizations are subject to customary conditions, including shareholder approval at annual shareholder meetings.
Upon the closing of the Reorganizations, the Target Funds will transfer their assets to the Acquiring Fund in exchange for common and preferred shares of the Acquiring Fund and the assumption by the Acquiring Fund of the liabilities of the Target Funds. The Target Funds will then be liquidated,
dissolved and terminated in accordance with their Declaration of Trust. Shareholders of the Target Funds will become shareholders of the Acquiring Fund. Holders of common shares of the Target Funds will receive newly issued common shares of the Acquiring Fund, the aggregate net asset value ("NAV") of which is equal to the aggregate NAV of the common shares of the Target Funds held immediately prior to the Reorganizations (including for this purpose fractional Acquiring Fund shares to which shareholders would be entitled). Holders of preferred shares of the Target Funds will receive on a one-for-one basis newly issued preferred shares of the Acquiring Fund, in exchange for preferred shares of the Target Funds held immediately prior to the Reorganizations.
Significant Accounting Policies
Each Fund is an investment company and follows accounting and reporting guidance under Financial Accounting Standards Board (FASB) Accounting Standards Codification (ASC) Topic 946, "Financial Services-Investment Companies." The following is a summary of significant accounting policies followed by the Funds in the preparation of their financial statements in accordance with U.S. generally accepted accounting principles ("U.S. GAAP").
Investment Transactions
Investment transactions are recorded on a trade date basis. Realized gains and losses from investment transactions are determined on the specific identification method, which is the same basis used for federal income tax purposes. Investments purchased on a when-issued/delayed delivery basis may have extended settlement periods. Any investments so purchased are subject to market fluctuation during this period. The Funds have earmarked securities in their portfolios with a current value at least equal to the amount of the when-issued/delayed delivery purchase commitments.
As of the end of the reporting period, the following Fund's outstanding when-issued/delayed delivery purchase commitments were as follows:
| | | | Investment | |
| | | | Quality | |
| | | | (NQM | ) |
| Outstanding when-issued/delayed delivery purchase commitments | | $ | 4,004,244 | |
Investment Income
Investment income, which reflects the amortization of premiums and accretion of discounts for financial reporting purposes, is recorded on an accrual basis. Investment income also reflects paydown gains and losses, if any.
Professional Fees
Professional fees presented on the Statement of Operations consist of legal fees incurred in the normal course of operations, audit fees, tax consulting fees and, in some cases, workout expenditures. Workout expenditures are incurred in an attempt to protect or enhance an investment or to pursue other claims or legal actions on behalf of Fund shareholders. If a refund is received for workout expenditures paid in a prior reporting period, such amounts will be recognized as "Legal fee refund" on the Statement of Operations.
Dividends and Distributions to Common Shareholders
Dividends from net investment income are declared monthly. Net realized capital gains and/or market discount from investment transactions, if any, are distributed to shareholders at least annually. Furthermore, capital gains are distributed only to the extent they exceed available capital loss carryforwards.
Distributions to common shareholders of net investment income, net realized capital gains and/or market discount, if any, are recorded on the ex-dividend date. The amount and timing of distributions are determined in accordance with federal income tax regulations, which may differ from U.S. GAAP.
Indemnifications
Under the Funds' organizational documents, their officers and directors/trustees are indemnified against certain liabilities arising out of the performance of their duties to the Funds. In addition, in the normal course of business, the Funds enter into contracts that provide general indemnifications to other parties. The Funds' maximum exposure under these arrangements is unknown as this would involve future claims that may be made against the Funds that have not yet occurred. However, the Funds have not had prior claims or losses pursuant to these contracts and expect the risk of loss to be remote.
Netting Agreements
In the ordinary course of business, the Funds may enter into transactions subject to enforceable International Swaps and Derivative Association, Inc. ("ISDA") master agreements or other similar arrangements ("netting agreements"). Generally, the right to offset in netting agreements allows each Fund to offset any exposure to a specific counterparty with any collateral received or delivered to that counterparty based on the terms of the agreements. Generally, each Fund manages its cash collateral and securities collateral on a counterparty basis.
The Funds' investments subject to netting agreements as of the end of the reporting period, if any, are further described in Note 3 – Portfolio Securities and Investments in Derivatives.
Notes to Financial Statements (continued)
Use of Estimates
The preparation of financial statements in conformity with U.S. GAAP requires management to make estimates and assumptions that affect the reported amounts of assets and liabilities at the date of the financial statements and the reported amounts of increases and decreases in net assets applicable to common shares from operations during the reporting period. Actual results may differ from those estimates.
2. Investment Valuation and Fair Value Measurements
The fair valuation input levels as described below are for fair value measurement purposes.
Fair value is defined as the price that would be received upon selling an investment or transferring a liability in an orderly transaction to an independent buyer in the principal or most advantageous market for the investment. A three-tier hierarchy is used to maximize the use of observable market data and minimize the use of unobservable inputs and to establish classification of fair value measurements for disclosure purposes. Observable inputs reflect the assumptions market participants would use in pricing the asset or liability. Observable inputs are based on market data obtained from sources independent of the reporting entity. Unobservable inputs reflect the reporting entity's own assumptions about the assumptions market participants would use in pricing the asset or liability. Unobservable inputs are based on the best information available in the circumstances. The following is a summary of the three-tiered hierarchy of valuation input levels.
| Level 1 – | Inputs are unadjusted and prices are determined using quoted prices in active markets for identical securities. |
| Level 2 – | Prices are determined using other significant observable inputs (including quoted prices for similar securities, interest rates, prepayment speeds, credit risk, etc.). |
| Level 3 – | Prices are determined using significant unobservable inputs (including management's assumptions in determining the fair value of investments). |
Prices of fixed income securities are provided by a pricing service approved by the Funds' Board of Directors/Trustees (the "Board"). The pricing service establishes a security's fair value using methods that may include consideration of the following: yields or prices of investments of comparable quality, type of issue, coupon, maturity and rating, market quotes or indications of value from security dealers, evaluations of anticipated cash flows or collateral, general market conditions and other information and analysis, including the obligor's credit characteristics considered relevant. These securities are generally classified as Level 2. In pricing certain securities, particularly less liquid and lower quality securities, the pricing service may consider information about a security, its issuer or market activity provided by the Adviser. These securities are generally classified as Level 2 or Level 3 depending on the priority of the significant inputs.
Prices of swap contracts are also provided by a pricing service approved by the Board using the same methods as described above and are generally classified as Level 2.
Common stocks and other equity-type securities are valued at the last sales price on the securities exchange on which such securities are primarily traded and are generally classified as Level 1. Securities primarily traded on the NASDAQ National Market ("NASDAQ") are valued at the NASDAQ Official Closing Price and are generally classified as Level 1. However, securities traded on a securities exchange or NASDAQ for which there were no transactions on a given day or securities not listed on a securities exchange or NASDAQ are valued at the quoted bid price and are generally classified as Level 2.
Certain securities may not be able to be priced by the pre-established pricing methods as described above. Such securities may be valued by the Board and/or its appointee at fair value. These securities generally include, but are not limited to, restricted securities (securities which may not be publicly sold without registration under the Securities Act of 1933, as amended) for which a pricing service is unable to provide a market price; securities whose trading has been formally suspended; debt securities that have gone into default and for which there is no current market quotation; a security whose market price is not available from a pre-established pricing source; a security with respect to which an event has occurred that is likely to materially affect the value of the security after the market has closed but before the calculation of a Fund's NAV (as may be the case in non-U.S. markets on which the security is primarily traded) or make it difficult or impossible to obtain a reliable market quotation; and a security whose price, as provided by the pricing service, is not deemed to reflect the security's fair value. As a general principle, the fair value of a security would appear to be the amount that the owner might reasonably expect to receive for it in a current sale. A variety of factors may be considered in determining the fair value of such securities, which may include consideration of the following: yields or prices of investments of comparable quality, type of issue, coupon, maturity and rating, market quotes or indications of value from security dealers, evaluations of anticipated cash flows or collateral, general market conditions and other information and analysis, including the obligor's credit characteristics considered relevant. These securities are generally classified as Level 2 or Level 3 depending on the priority of the significant inputs. Regardless of the method employed to value a particular security, all valuations are subject to review by the Board and/or its appointee.
The inputs or methodologies used for valuing securities are not an indication of the risks associated with investing in those securities. The following is a summary of each Fund's fair value measurements as of the end of the reporting period:
| Investment Quality (NQM) | | | Level 1 | | | Level 2 | | | Level 3 | | | Total | |
| Long-Term Investments*: | | | | | | | | | | | | | |
| Municipal Bonds | | $ | — | | $ | 980,733,065 | | $ | — | | $ | 980,733,065 | |
| Corporate Bonds | | | — | | | — | | | 10,316 | ** | | 10,316 | |
| Short-Term Investments: | | | | | | | | | | | | | |
| Municipal Bonds | | | — | | | — | | | 2,998,192 | ** | | 2,998,192 | |
| Total | | $ | — | | $ | 980,733,065 | | $ | 3,008,508 | | $ | 983,741,573 | |
| Select Quality (NQS) | | | Level 1 | | | Level 2 | | | Level 3 | | | Total | |
| Long-Term Investments*: | | | | | | | | | | | | | |
| Municipal Bonds | | $ | — | | $ | 802,943,076 | | $ | — | | $ | 802,943,076 | |
| Corporate Bonds | | | — | | | — | | | 2,672 | ** | | 2,672 | |
| Total | | $ | — | | $ | 802,943,076 | | $ | 2,672 | | $ | 802,945,748 | |
| Quality Income (NQU) | | | | | | | | | | | | | |
| Long-Term Investments*: | | | | | | | | | | | | | |
| Municipal Bonds | | $ | — | | $ | 1,150,273,200 | | $ | — | | $ | 1,150,273,200 | |
| Corporate Bonds | | | — | | | — | | | 4,387 | ** | | 4,387 | |
| Short-Term Investments: | | | | | | | | | | | | | |
| Municipal Bonds | | | — | | | — | | | 2,396,549 | ** | | 2,396,549 | |
| Total | | $ | — | | $ | 1,150,273,200 | | $ | 2,400,936 | | $ | 1,152,674,136 | |
| | | | | | | | | | | | | | |
| Premier Income (NPF) | | | | | | | | | | | | | |
| Long-Term Investments*: | | | | | | | | | | | | | |
| Municipal Bonds | | $ | — | | $ | 429,194,317 | | $ | — | | $ | 429,194,317 | |
| Short-Term Investments: | | | | | | | | | | | | | |
| Municipal Bonds | | | — | | | 1,600,000 | | | 2,211,042 | ** | | 3,811,042 | |
| Total | | $ | — | | $ | 430,794,317 | | $ | 2,211,042 | | $ | 433,005,359 | |
| High Income Opportunity (NMZ) | | | | | | | | | | | | | |
| Long-Term Investments*: | | | | | | | | | | | | | |
| Municipal Bonds | | $ | — | | $ | 761,710,743 | | $ | 612,546 | ** | $ | 762,323,289 | |
| Common Stocks | | | 10,515,697 | | | — | | | — | | | 10,515,697 | |
| Corporate Bonds | | | — | | | — | | | 1,643 | ** | | 1,643 | |
| Total | | $ | 10,515,697 | | $ | 761,710,743 | | $ | 614,189 | | $ | 772,840,629 | |
| * | Refer to the Fund's Portfolio of Investments for industry and/or state classifications, where applicable. |
| ** | Refer to the Fund's Portfolio of Investments for securities classified as Level 3. |
The Board is responsible for the valuation process and has appointed the oversight of the daily valuation process to the Adviser's Valuation Committee. The Valuation Committee, pursuant to the valuation policies and procedures adopted by the Board, is responsible for making fair value determinations, evaluating the effectiveness of the Funds' pricing policies and reporting to the Board. The Valuation Committee is aided in its efforts by the Adviser's dedicated Securities Valuation Team, which is responsible for administering the daily valuation process and applying fair value methodologies as approved by the Valuation Committee. When determining the reliability of independent pricing services for investments owned by the Funds, the Valuation Committee, among other things, conducts due diligence reviews of the pricing services and monitors the quality of security prices received through various testing reports conducted by the Securities Valuation Team.
The Valuation Committee will consider pricing methodologies it deems relevant and appropriate when making a fair value determination, based on the facts and circumstances specific to the portfolio instrument. Fair value determinations generally will be derived as follows, using public or private market information:
| | (i) | If available, fair value determinations shall be derived by extrapolating from recent transactions or quoted prices for identical or comparable securities. |
| | | |
| | (ii) | If such information is not available, an analytical valuation methodology may be used based on other available information including, but not limited to: analyst appraisals, research reports, corporate action information, issuer financial statements and shelf registration statements. Such analytical valuation methodologies may include, but are not limited to: multiple of earnings, discount from market value of a similar freely-traded security, discounted cash flow analysis, book value or a multiple thereof, risk premium/yield analysis, yield to maturity and/or fundamental investment analysis. |
The purchase price of a portfolio instrument will be used to fair value the instrument only if no other valuation methodology is available or deemed appropriate, and it is determined that the purchase price fairly reflects the instrument's current value.
For each portfolio security that has been fair valued pursuant to the policies adopted by the Board, the fair value price is compared against the last available and next available market quotations. The Valuation Committee reviews the results of such testing and fair valuation occurrences are reported to the Board.
3. Portfolio Securities and Investments in Derivatives
Portfolio Securities
Inverse Floating Rate Securities
Each Fund is authorized to invest in inverse floating rate securities. An inverse floating rate security is created by depositing a municipal bond (referred to as an "Underlying Bond"), typically with a fixed interest rate, into a special purpose tender option bond ("TOB") trust (referred to as the "TOB
Notes to Financial Statements (continued)
Trust") created by or at the direction of one or more Funds. In turn, the TOB Trust issues (a) floating rate certificates (referred to as "Floaters") in face amounts equal to some fraction of the Underlying Bond's par amount or market value, and (b) an inverse floating rate certificate (referred to as an "Inverse Floater") that represents all remaining or residual interest in the TOB Trust. Floaters typically pay short-term tax-exempt interest rates to third parties who are also provided a right to tender their certificate and receive its par value, which may be paid from the proceeds of a remarketing of the Floaters, by a loan to the TOB Trust from a third party liquidity provider ("Liquidity Provider"), or by the sale of assets from the TOB Trust. The Inverse Floater is issued to a long term investor, such as one or more of the Funds. The income received by the Inverse Floater holder varies inversely with the short-term rate paid to holders of the Floaters, and in most circumstances the Inverse Floater holder bears substantially all of the Underlying Bond's downside investment risk and also benefits disproportionately from any potential appreciation of the Underlying Bond's value. The value of an Inverse Floater will be more volatile than that of the Underlying Bond because the interest rate is dependent on not only the fixed coupon rate of the Underlying Bond but also on the short-term interest paid on the Floaters, and because the Inverse Floater essentially bears the risk of loss (and possible gain) of the greater face value of the Underlying Bond.
The Inverse Floater held by a Fund gives the Fund the right to (a) cause the holders of the Floaters to tender their certificates at par (or slightly more than par in certain circumstances), and (b) have the trustee of the TOB Trust (the "Trustee") transfer the Underlying Bond held by the TOB Trust to the Fund, thereby collapsing the TOB Trust.
The Fund may acquire an Inverse Floater in a transaction where it (a) transfers an Underlying Bond that it owns to a TOB Trust created by a third party or (b) transfers an Underlying Bond that it owns, or that it has purchased in a secondary market transaction for the purpose of creating an Inverse Floater, to a TOB Trust created at its direction, and in return receives the Inverse Floater of the TOB Trust (referred to as a "self-deposited Inverse Floater"). A Fund may also purchase an Inverse Floater in a secondary market transaction from a third party creator of the TOB Trust without first owning the Underlying Bond (referred to as an "externally-deposited Inverse Floater").
An investment in a self-deposited Inverse Floater is accounted for as a "financing" transaction (i.e., a secured borrowing). For a self-deposited Inverse Floater, the Underlying Bond deposited into the TOB Trust is identified in the Fund's Portfolio of Investments as "(UB) – Underlying bond of an inverse floating rate trust reflected as a financing transaction," with the Fund recognizing as liabilities, labeled "Floating rate obligations" on the Statement of Assets and Liabilities, (a) the liquidation value of Floaters issued by the TOB Trust, and (b) the amount of any borrowings by the TOB Trust from a Liquidity Provider to enable the TOB Trust to purchase outstanding Floaters in lieu of a remarketing. In addition, the Fund recognizes in "Investment Income" the entire earnings of the Underlying Bond, and recognizes (a) the interest paid to the holders of the Floaters or on the TOB Trust's borrowings, and (b) other expenses related to remarketing, administration, trustee, liquidity and other services to a TOB Trust, as a component of "Interest expense and amortization of offering costs" on the Statement of Operations.
In contrast, an investment in an externally-deposited Inverse Floater is accounted for as a purchase of the Inverse Floater and is identified in the Fund's Portfolio of Investments as "(IF) – Inverse floating rate investment." For an externally-deposited Inverse Floater, a Fund's Statement of Assets and Liabilities recognizes the Inverse Floater and not the Underlying Bond as an asset, and the Fund does not recognize the Floaters, or any related borrowings from a Liquidity Provider, as a liability. Additionally, the Fund reflects in "Investment Income" only the net amount of earnings on the Inverse Floater (net of the interest paid to the holders of the Floaters or the Liquidity Provider as lender, and the expenses of the Trust), and does not show the amount of that interest paid or the expenses of the TOB Trust as described above as interest expense on the Statement of Operations.
Fees paid upon the creation of a TOB Trust for self-deposited Inverse Floaters and externally-deposited Inverse Floaters are recognized as part of the cost basis of the Inverse Floater and are capitalized over the term of the TOB Trust.
As of the end of the reporting period, the aggregate value of Floaters issued by each Fund's TOB Trust for self-deposited Inverse Floaters and externally-deposited Inverse Floaters was as follows:
| | | | Investment | | | Select | | | Quality | | | Premier | | | High Income | |
| | | | Quality | | | Quality | | | Income | | | Income | | | Opportunity | |
| Floating Rate Obligations Outstanding | | | (NQM | ) | | (NQS | ) | | (NQU | ) | | (NPF | ) | | (NMZ | ) |
| Floating rate obligations: self-deposited Inverse Floaters | | $ | 54,680,000 | | $ | 13,455,000 | | $ | 33,660,000 | | $ | 22,260,000 | | $ | 13,280,000 | |
| Floating rate obligations: externally-deposited Inverse Floaters | | | 37,167,000 | | | 37,290,000 | | | 17,365,000 | | | 12,410,000 | | | 205,235,000 | |
| Total | | $ | 91,847,000 | | $ | 50,745,000 | | $ | 51,025,000 | | $ | 34,670,000 | | $ | 218,515,000 | |
During the current fiscal period, the average amount of Floaters (including any borrowings from a Liquidity Provider) outstanding, and the average annual interest rate and fees related to self-deposited Inverse Floaters, were as follows:
| | | | Investment | | | Select | | | Quality | | | Premier | | | High Income | |
| | | | Quality | | | Quality | | | Income | | | Income | | | Opportunity | |
| Self-Deposited Inverse Floaters | | | (NQM | ) | | (NQS | ) | | (NQU | ) | | (NPF | ) | | (NMZ | ) |
| Average floating rate obligations outstanding | | $ | 56,666,575 | | $ | 12,849,863 | | $ | 34,048,986 | | $ | 26,271,041 | | $ | 13,280,000 | |
| Average annual interest rate and fees | | | 0.56 | % | | 0.65 | % | | 0.62 | % | | 0.47 | % | | 0.59 | % |
TOB Trusts are supported by a liquidity facility provided by a Liquidity Provider pursuant to which the Liquidity Provider agrees, in the event that Floaters are (a) tendered to the Trustee for remarketing and the remarketing does not occur, or (b) subject to mandatory tender pursuant to the terms of the TOB Trust agreement, to either purchase Floaters or to provide the Trustee with an advance from a loan facility to fund the purchase of Floaters
by the TOB Trust. In certain circumstances, the Liquidity Provider may otherwise elect to have the Trustee sell the Underlying Bond to retire the Floaters that were tendered and not remarketed prior to providing such a loan. In these circumstances, the Liquidity Provider remains obligated to provide a loan to the extent that the proceeds of the sale of the Underlying Bond are not sufficient to pay the purchase price of the Floaters.
The size of the commitment under the loan facility for a given TOB Trust is at least equal to the balance of that TOB Trust's outstanding Floaters plus any accrued interest. In consideration of the loan facility, fee schedules are in place and are charged by the Liquidity Provider(s). Any loans made by the Liquidity Provider will be secured by the purchased Floaters held by the TOB Trust. Interest paid on any outstanding loan balances will be effectively borne by the Fund that owns the Inverse Floaters of the TOB Trust that has incurred the borrowing and may be at a rate that is greater than the rate that would have been paid had the Floaters been successfully remarketed.
As described above, any amounts outstanding under a liquidity facility are recognized as a component of "Floating rate obligations" on the Statement of Assets and Liabilities by the Fund holding the corresponding Inverse Floaters issued by the borrowing TOB Trust. As of the end of the reporting period, there were no loans outstanding under any such facility.
Each Fund may also enter into shortfall and forbearance agreements (sometimes referred to as a "recourse arrangement" or "credit recovery swap") (TOB Trusts involving such agreements are referred to herein as "Recourse Trusts"), under which a Fund agrees to reimburse the Liquidity Provider for the Trust's Floaters, in certain circumstances, for the amount (if any) by which the liquidation value of the Underlying Bond held by the TOB Trust may fall short of the sum of the liquidation value of the Floaters issued by the TOB Trust plus any amounts borrowed by the TOB Trust from the Liquidity Provider, plus any shortfalls in interest cash flows. Under these agreements, a Fund's potential exposure to losses related to or on an Inverse Floater may increase beyond the value of the Inverse Floater as a Fund may potentially be liable to fulfill all amounts owed to holders of the Floaters or the Liquidity Provider. Any such shortfall amount in the aggregate is recognized as "Unrealized depreciation on Recourse Trusts" on the Statement of Assets and Liabilities.
As of the end of the reporting period, each Fund's maximum exposure to the Floaters issued by Recourse Trusts for self-deposited Inverse Floaters and externally-deposited Inverse Floaters was as follows:
| | | | Investment | | | Select | | | Quality | | | Premier | | | High Income | |
| | | | Quality | | | Quality | | | Income | | | Income | | | Opportunity | |
| Floating Rate Obligations — Recourse Trusts | | | (NQM | ) | | (NQS | ) | | (NQU | ) | | (NPF | ) | | (NMZ | ) |
| Maximum exposure to Recourse Trusts: self deposited Inverse Floaters | | $ | — | | $ | 10,830,000 | | $ | 11,435,000 | | $ | 7,725,000 | | $ | 8,830,000 | |
| Maximum exposure to Recourse Trusts: externally deposited Inverse Floaters | | | 11,560,000 | | | 18,750,000 | | | 7,500,000 | | | 8,825,000 | | | 168,700,000 | |
| | | $ | 11,560,000 | | $ | 29,580,000 | | $ | 18,935,000 | | $ | 16,550,000 | | $ | 177,530,000 | |
Zero Coupon Securities
A zero coupon security does not pay a regular interest coupon to its holders during the life of the security. Income to the holder of the security comes from accretion of the difference between the original purchase price of the security at issuance and the par value of the security at maturity and is effectively paid at maturity. The market prices of zero coupon securities generally are more volatile than the market prices of securities that pay interest periodically.
Investments in Derivatives
In addition to the inverse floating rate securities in which each Fund may invest, which are considered portfolio securities for financial reporting purposes, each Fund is authorized to invest in certain derivative instruments such as futures, options and swap contracts. Each Fund limits its investments in futures, options on futures and swap contracts to the extent necessary for the Adviser to claim the exclusion from registration by the Commodity Futures Trading Commission as a commodity pool operator with respect to the Fund. The Funds record derivative instruments at fair value, with changes in fair value recognized on the Statement of Operations, when applicable. Even though the Funds' investments in derivatives may represent economic hedges, they are not considered to be hedge transactions for financial reporting purposes.
Credit Default Swaps
A Fund may enter into a credit default swap contract to seek to maintain a total return on a particular investment or portion of its portfolio, or to take an active long or short position with respect to the likelihood of a particular issuer's default. Credit default swap contracts involve one party making a stream of payments to another party in exchange for the right to receive a specified return if/when there is a credit event by a third party. Generally, a credit event means bankruptcy, failure to pay, or restructuring. The specific credit events applicable for each credit default swap are stated in the terms of the particular swap agreement. Upon occurrence of a specific credit event with respect to the underlying referenced entity, the Fund will either (i) receive that security, or an equivalent amount of cash, from the counterparty in exchange for payment of the notional amount to the counterparty, or (ii) pay a net settlement amount of the credit default swap contract less the recovery value of the referenced obligation or underlying securities comprising the referenced index. The difference between the value of the security delivered and the notional amount received is recorded as a realized gain or loss. Payments received or made at the beginning of the measurement period are recognized as a component of "Credit default swaps premiums paid and/or received" on the Statement of Assets and Liabilities, when applicable.
Notes to Financial Statements (continued)
Credit default swap contracts are valued daily. Changes in the value of a credit default swap during the fiscal period are recognized as a component of "Change in net unrealized appreciation (depreciation) of swaps" and realized gains and losses are recognized as a component of "Net realized gain (loss) from swaps" on the Statement of Operations.
For over-the-counter swaps, the daily change in the market value of the swap contract, along with any daily interest fees accrued, are recognized as components of "Unrealized appreciation or depreciation on credit default swaps (, net)" on the Statement of Assets and Liabilities.
Investments in swaps cleared through an exchange obligate a Fund and the clearing broker to settle monies on a daily basis representing changes in the prior days "mark-to-market" of the swap. If a Fund has unrealized appreciation the clearing broker would credit the Fund's account with an amount equal to the appreciation and conversely if a Fund has unrealized depreciation the clearing broker would debit a Fund's account with an amount equal to the depreciation. These daily cash settlements are also known as "variation margin." Variation margin is recognized as a receivable and/or payable for "Variation margin on swap contracts" on the Statement of Assets and Liabilities. The maximum potential amount of future payments the Fund could incur as a buyer or seller of protection in a credit default swap contract is limited to the notional amount of the contract. The maximum potential amount would be offset by the recovery value, if any, of the respective referenced entity. In certain instances, a Fund is obligated to deposit cash or eligible securities, also known as "initial margin," into an account at its clearing broker equal to a specified percentage of the contract amount. Cash held by the broker to cover initial margin requirements on open swap contracts, if any, is recognized as "Cash collateral at brokers" on the Statement of Assets and Liabilities.
During the current fiscal period, Premier Income (NPF) invested in credit default swap contracts to manage credit risk.
The average notional amount of credit default swap contracts outstanding during the current fiscal period was as follows:
| | | | Premier | |
| | | | Income | |
| | | | (NPF | ) |
| Average notional amount of credit default swap contracts outstanding* | | $ | 2,100,000 | |
| * | The average notional amount is calculated based on the outstanding notional at the beginning of the fiscal period and at the end of each fiscal quarter within the current fiscal period. |
The following table presents the amount of net realized gain (loss) and change in net unrealized appreciation (depreciation) recognized on swap contracts on the Statement of Operations during the current fiscal period and the primary underlying risk exposure.
| | | | | | | | | | | | | Change in | |
| | | | Underlying | | | Derivative | | | Net Realized | | | Net Unrealized Appreciation | |
| Fund | | | Risk Exposure | | | Instrument | | Gain (Loss) from Swaps | | | (Depreciation) of Swaps | |
| Premier Income (NPF) | | | Credit | | | Swaps | | $ | (62,989 | ) | $ | 10,657 | |
Market and Counterparty Credit Risk
In the normal course of business each Fund may invest in financial instruments and enter into financial transactions where risk of potential loss exists due to changes in the market (market risk) or failure of the other party to the transaction to perform (counterparty credit risk). The potential loss could exceed the value of the financial assets recorded on the financial statements. Financial assets, which potentially expose each Fund to counterparty credit risk, consist principally of cash due from counterparties on forward, option and swap transactions, when applicable. The extent of each Fund's exposure to counterparty credit risk in respect to these financial assets approximates their carrying value as recorded on the Statement of Assets and Liabilities.
Each Fund helps manage counterparty credit risk by entering into agreements only with counterparties the Adviser believes have the financial resources to honor their obligations and by having the Adviser monitor the financial stability of the counterparties. Additionally, counterparties may be required to pledge collateral daily (based on the daily valuation of the financial asset) on behalf of each Fund with a value approximately equal to the amount of any unrealized gain above a pre-determined threshold. Reciprocally, when each Fund has an unrealized loss, the Funds have instructed the custodian to pledge assets of the Funds as collateral with a value approximately equal to the amount of the unrealized loss above a pre-determined threshold. Collateral pledges are monitored and subsequently adjusted if and when the valuations fluctuate, either up or down, by at least the pre-determined threshold amount.
4. Fund Shares
Common Shares
Common Shares Equity Shelf Programs and Offering Costs
The following Funds each filed registration statements with the Securities and Exchange Commission ("SEC") authorizing the Funds to issue additional common shares through an equity shelf program ("Shelf Offerings"), which became effective with the SEC during prior fiscal periods.
Under these Shelf Offerings, the Funds, subject to market conditions, may raise additional equity capital by issuing additional common shares from time to time in varying amounts and by different offering methods at a net price at or above the Fund's NAV per share. In the event a Fund's Shelf Offering registration statement is no longer current, the Fund may not issue additional common shares until a post-effective amendment to the registration statement has been filed with the SEC.
Authorized common shares, common shares issued and offering proceeds, net of offering costs under each Fund's Shelf Offering during the Fund's current and prior fiscal period were as follows:
| | | | | | | High Income | |
| | | Investment Quality (NQM)* | | Select Quality (NQS)* | | Opportunity (NMZ)** | |
| | | | Year | | | Year | | | Year | | | Year | | | Year | | | Year | |
| | | | Ended | | | Ended | | | Ended | | | Ended | | | Ended | | | Ended | |
| | | | 10/31/15 | | | 10/31/14 | | | 10/31/15 | | | 10/31/14 | | | 10/31/15 | | | 10/31/14 | |
| Common shares authorized | | | — | | | 3,500,000 | | | — | | | 3,400,000 | | | 7,700,000 | | | 7,700,000 | |
| Common shares issued | | | — | | | — | | | — | | | — | | | — | | | 22,387 | |
| Offering proceeds, net of offering costs | | $ | — | | $ | — | | $ | — | | $ | — | | $ | — | | $ | 292,009 | |
| * | Represents authorized common shares for the period November 1, 2013 through February 28, 2014. |
| ** | Represents authorized common shares for the fiscal years ended October 31, 2015 and October 31, 2014. |
Costs incurred by the Funds in connection with their Shelf Offerings were recorded as a deferred charge and recognized as a component of "Deferred offering costs" on the Statement of Assets and Liabilities. The deferred assets are reduced during the one-year period that additional shares are sold by reducing the proceeds from such sales and are recognized as a component of "Proceeds from shelf offering, net of offering costs" on the Statement of Changes in Net Assets. Any remaining deferred charges at the end of the one-year life of the Shelf Offering period will be expensed accordingly, as well as any additional Shelf Offering costs the Funds may incur. As Shelf Offering costs are expensed they are recognized as a component of "Other expenses" on the Statement of Operations.
Common Share Transactions
Transactions in common shares during the Funds' current and prior fiscal period were as follows:
| | | Investment Quality (NQM) | | Select Quality (NQS) | |
| | | | Year | | | Year | | | Year | | | Year | |
| | | | Ended | | | Ended | | | Ended | | | Ended | |
| | | | 10/31/15 | | | 10/31/14 | | | 10/31/15 | | | 10/31/14 | |
| Common shares: | | | | | | | | | | | | | |
| Issued in the reorganization | | | — | | | 5,600,111 | | | — | | | — | |
| | | | | | | High Income | |
| | | Quality Income (NQU)* | | Premier Income (NPF)* | | Opportunity (NMZ) | |
| | | | Year | | | Year | | | Year | | | Year | | | Year | | | Year | |
| | | | Ended | | | Ended | | | Ended | | | Ended | | | Ended | | | Ended | |
| | | | 10/31/15 | | | 10/31/14 | | | 10/31/15 | | | 10/31/14 | | | 10/31/15 | | | 10/31/14 | |
| Common shares: | | | | | | | | | | | | | | | | | | | |
| Sold through shelf offering | | | — | | | — | | | — | | | — | | | — | | | 22,387 | |
| Issued to shareholders due to reinvestment of distributions | | | — | | | — | | | — | | | — | | | 12,381 | | | 13,255 | |
| Repurchased and retired (open market purchases) | | | (21,000 | ) | | — | | | — | | | — | | | — | | | — | |
| Repurchased through tender offer | | | — | | | (5,437,909 | ) | | — | | | — | | | — | | | — | |
| Total | | | (21,000 | ) | | (5,437,909 | ) | | — | | | — | | | 12,381 | | | 35,642 | |
| | | | | | | | | | | | | | | | | | | | |
| Weighted average common share: | | | | | | | | | | | | | | | | | | | |
| Premium to NAV per shelf offering share sold | | | — | % | | — | % | | — | % | | — | % | | — | % | | 1.13 | % |
| Price per share repurchased and retired (open market purchases) | | $ | 13.55 | | | — | | | — | | | — | | | — | | | — | |
| Discount per share repurchased and retired (open market purchases) | | | 12.34 | % | | — | % | | — | % | | — | % | | — | % | | — | % |
| * | Quality Income (NQU) and Premier Income (NPF) are not authorized to issue additional common shares through a shelf offering. |
Preferred Shares
Variable Rate MuniFund Term Preferred Shares
The following Funds have issued and outstanding Variable Rate MuniFund Term Preferred ("VMTP") Shares, with a $100,000 liquidation value per share. VMTP Shares are issued via private placement and are not publicly available.
Notes to Financial Statements (continued)
As of the end of the reporting period, VMTP Shares outstanding, at liquidation value, for each Fund were as follows:
| | | | | | | | | | Shares | |
| | | | | | | | | | Outstanding | |
| | | | | | | | | | at $100,000 | |
| | | | | | | Shares | | | Per Share | |
| Fund | | | Series | | | Outstanding | | | Liquidation Value | |
| Investment Quality (NQM) | | | 2017 | | | 435 | | $ | 43,500,000 | |
| High Income Opportunity (NMZ) | | | 2018 | | | 870 | | $ | 87,000,000 | |
On July 1, 2015, High Income Opportunity (NMZ) exchanged all of its outstanding Series 2016 and Series 2016-1 VMTP Shares with the issuance of new Series 2018 VMTP Shares.
Each Fund is obligated to redeem its VMTP Shares by the date as specified in its offering document ("Term Redemption Date"), unless earlier redeemed or repurchased by the Fund. VMTP Shares are subject to optional and mandatory redemption in certain circumstances. The VMTP Shares are subject to redemption at the option of each Fund ("Optional Redemption Date"), subject to payment of premium for one year following the date of issuance ("Premium Expiration Date"), and at par thereafter. The Fund may be obligated to redeem certain of the VMTP Shares if the Fund fails to maintain certain asset coverage and leverage ratio requirements and such failures are not cured by the applicable cure date. The redemption price per share is equal to the sum of the liquidation value per share plus any accumulated but unpaid dividends. The Term Redemption Date, Optional Redemption Date and Premium Expiration Date for each Fund's series of VMTP Shares are as follows:
| | | | | | | Term | | | Optional | | | Premium | |
| Fund | | | Series | | | Redemption Date | | | Redemption Date | | | Expiration Date | |
| Investment Quality (NQM) | | | 2017 | | | May 1, 2017 | | | May 1, 2015 | | | April 30, 2014 | |
| High Income Opportunity (NMZ) | | | 2018 | | | August 1, 2018 | | | July 1, 2016 | | | June 30, 2016 | |
The average liquidation value of VMTP Shares outstanding and annualized dividend rate for each Fund during the current fiscal period were as follows:
| | | | Investment | | | High Income | |
| | | | Quality | | | Opportunity | |
| | | | (NQM | ) | | (NMZ | ) |
| Average liquidation value of VMTP Shares outstanding | | $ | 43,500,000 | | $ | 87,000,000 | |
| Annualized dividend rate | | | 0.99 | % | | 1.10 | % |
VMTP Shares generally do not trade, and market quotations are generally not available. VMTP Shares are short-term or short/intermediate-term instruments that pay a variable dividend rate tied to a short-term index, plus an additional fixed "spread" amount established at the time of issuance. The fair value of VMTP Shares is expected to be approximately their liquidation par value so long as the fixed "spread" on the VMTP Shares remains roughly in line with the "spread" rates being demanded by investors on instruments having similar terms in the current market environment. In present market conditions, the Funds' Adviser has determined that fair value of VMTP Shares is their liquidation value, but their fair value could vary if market conditions change materially. For financial reporting purposes, the liquidation value of VMTP Shares is a liability and is recognized as "Variable Rate MuniFund Term Preferred ("VMTP") Shares, at liquidation value" on the Statement of Assets and Liabilities.
Dividends on the VMTP Shares (which are treated as interest payments for financial reporting purposes) are set weekly. Unpaid dividends on VMTP Shares are recognized as a component of "Interest payable" on the Statement of Assets and Liabilities, when applicable. Dividends accrued on VMTP Shares are recognized as a component of "Interest expense and amortization of offering costs" on the Statement of Operations.
Costs incurred by each Fund in connection with its offering of VMTP Shares were recorded as a deferred charge, which are amortized over the life of the shares and are recognized as components of "Deferred offering costs" on the Statement of Assets and Liabilities and "Interest expense and amortization of offering costs" on the Statement of Operations.
High Income Opportunity (NMZ) incurred offering costs of $85,000 in connection with its issuance of Series 2018 VMTP Shares, which were expensed as incurred and are recognized as a component of "Interest expense and amortization of offering costs" on the Statement of Operations.
Variable Rate Demand Preferred Shares
The following Funds have issued and outstanding Variable Rate Demand Preferred ("VRDP") Shares, with a $100,000 liquidation value per share. VRDP Shares are issued via private placement and are not publicly available.
As of the end of the reporting period, the details of each Fund's VRDP Shares outstanding were as follows:
| | | | | | | | | | Shares | | | | |
| | | | | | | | | | Outstanding at | | | | |
| | | | | | | Shares | | | $ 100,000 Per Share | | | | |
| Fund | | | Series | | | Outstanding | | | Liquidation Value | | | Maturity | |
| Investment Quality (NQM) | | | 1 | | | 2,368 | | $ | 236,800,000 | | | May 1, 2041 | |
| Select Quality (NQS) | | | 1 | | | 2,675 | | $ | 267,500,000 | | | May 1, 2041 | |
| Quality Income (NQU) | | | 1 | | | 3,854 | | $ | 385,400,000 | | | December 1, 2040 | |
| Premier Income (NPF) | | | 1 | | | 1,277 | | $ | 127,700,000 | | | May 1, 2041 | |
VRDP Shares include a liquidity feature that allows VRDP shareholders to have their shares purchased by a liquidity provider with whom each Fund has contracted in the event that purchase orders for VRDP Shares in a remarketing are not sufficient in number to be matched with the sale orders in that remarketing. Each Fund is required to redeem any VRDP Shares that are still owned by the liquidity provider after six months of continuous, unsuccessful remarketing. Each Fund pays an annual remarketing fee of 0.10% on the aggregate principal amount of all VRDP Shares outstanding. Each Fund's VRDP Shares have successfully remarketed since issuance.
Dividends on the VRDP Shares (which are treated as interest payments for financial reporting purposes) are set weekly at a rate established by a remarketing agent; therefore, the market value of the VRDP Shares is expected to approximate its liquidation value. If remarketings for VRDP Shares are continuously unsuccessful for six months, the maximum rate is designed to escalate according to a specified schedule in order to enhance the remarketing agent's ability to successfully remarket the VRDP Shares.
Subject to certain conditions, VRDP Shares may be redeemed, in whole or in part, at any time at the option of each Fund. Each Fund may also redeem certain of the VRDP Shares if the Fund fails to maintain certain asset coverage requirements and such failures are not cured by the applicable cure date. The redemption price per share is equal to the sum of the liquidation value per share plus any accumulated but unpaid dividends.
The average liquidation value of VRDP Shares outstanding and annualized dividend rate for each Fund during the current fiscal period were as follows:
| | | | Investment | | | Select | | | Quality | | | Premier | |
| | | | Quality | | | Quality | | | Income | | | Income | |
| | | | (NQM | ) | | (NQS | ) | | (NQU | ) | | (NPF | ) |
| Average liquidation value of VRDP Shares outstanding | | $ | 236,800,000 | | $ | 267,500,000 | | $ | 385,400,000 | | $ | 127,700,000 | |
| Annualized dividend rate | | | 0.13 | % | | 0.13 | % | | 0.12 | % | | 0.13 | % |
For financial reporting purposes, the liquidation value of VRDP Shares is a liability and recognized as "Variable Rate Demand Preferred ("VRDP") Shares, at liquidation value" on the Statement of Assets and Liabilities. Unpaid dividends on VRDP Shares are recognized as a component of "Interest payable" on the Statement of Assets and Liabilities, when applicable. Dividends accrued on the VRDP Shares are recognized as a component of "Interest expense and amortization of offering costs" on the Statement of Operations. Costs incurred by the Funds in connection with their offerings of VRDP Shares were recorded as a deferred charge, which are amortized over the life of the shares and are recognized as a component of "Deferred offering costs" on the Statement of Assets and Liabilities and "Interest expense and amortization of offerings costs" on the Statement of Operations. In addition to interest expense, each Fund also pays a per annum liquidity fee to the liquidity provider, as well as a remarketing fee, which are recognized as "Liquidity fees" and "Remarketing fees," respectively, on the Statement of Operations.
Preferred Share Transactions
Transactions in preferred shares for the Funds during the Funds' current and prior fiscal period, where applicable, are noted in the following tables.
Transactions in VMTP Shares for the Funds, where applicable, were as follows:
| | | Year Ended | |
| | | October 31, 2015 | |
| High Income Opportunity (NMZ) | | | Series | | | Shares | | | Amount | |
| VMTP Shares issued | | | 2018 | | | 870 | | $ | 87,000,000 | |
| VMTP Shares exchanged | | | 2016 | | | (510 | ) | | (51,000,000 | ) |
| | | | 2016-1 | | | (360 | ) | | (36,000,000 | ) |
| Net increase (decrease) | | | — | | $ | — | | | | |
| | | Year Ended | |
| | | October 31, 2014 | |
| Investment Quality (NQM) | | | Series | | | Shares | | | Amount | |
| VMTP Shares issued in connection with the reorganization | | | 2017 | | | 435 $43,500,000 | | | | |
Notes to Financial Statements (continued)
Transactions in VRDP Shares for the Funds, where applicable, were as follows:
| | | Year Ended | |
| | | October 31, 2014 | |
| Quality Income (NQU) | | | Series | | | Shares | | | Amount | |
| VRDP Shares redeemed | | | 1 | | | (430 | ) | $ | (43,000,000 | ) |
5. Investment Transactions
Long-term purchases and sales (including maturities but excluding derivative transactions, where applicable) during the current fiscal period were as follows:
| | | | Investment | | | Select | | | Quality | | | Premier | | | High Income | |
| | | | Quality | | | Quality | | | Income | | | Income | | | Opportunity | |
| | | | (NQM | ) | | (NQS | ) | | (NQU | ) | | (NPF | ) | | (NMZ | ) |
| Purchases | | $ | 103,239,664 | | $ | 180,509,934 | | $ | 211,535,912 | | $ | 55,023,589 | | $ | 66,431,624 | |
| Sales and maturities | | | 118,020,131 | | | 183,798,689 | | | 211,346,413 | | | 78,767,136 | | | 78,711,489 | |
6. Income Tax Information
Each Fund is a separate taxpayer for federal income tax purposes. Each Fund intends to distribute substantially all of its net investment income and net capital gains to shareholders and to otherwise comply with the requirements of Subchapter M of the Internal Revenue Code applicable to regulated investment companies. Therefore, no federal income tax provision is required. Furthermore, each Fund intends to satisfy conditions that will enable interest from municipal securities, which is exempt from regular federal income tax, to retain such tax-exempt status when distributed to shareholders of the Funds. Net realized capital gains and ordinary income distributions paid by the Funds are subject to federal taxation.
For all open tax years and all major taxing jurisdictions, management of the Funds has concluded that there are no significant uncertain tax positions that would require recognition in the financial statements. Open tax years are those that are open for examination by taxing authorities (i.e., generally the last four tax year ends and the interim tax period since then). Furthermore, management of the Funds is also not aware of any tax positions for which it is reasonably possible that the total amounts of unrecognized tax benefits will significantly change in the next twelve months.
The following information is presented on an income tax basis. Differences between amounts for financial statement and federal income tax purposes are primarily due to timing differences in recognizing taxable market discount, timing differences in recognizing certain gains and losses on investment transactions and the treatment of investments in inverse floating rate securities reflected as financing transactions, if any. To the extent that differences arise that are permanent in nature, such amounts are reclassified within the capital accounts as detailed below. Temporary differences do not require reclassification. Temporary and permanent differences do not impact the NAVs of the Funds.
As of October 31, 2015, the cost and unrealized appreciation (depreciation) of investments (excluding investments in derivatives, where applicable), as determined on a federal income tax basis, were as follows:
| | | | Investment | | | Select | | | Quality | | | Premier | | | High Income | |
| | | | Quality | | | Quality | | | Income | | | Income | | | Opportunity | |
| | | | (NQM | ) | | (NQS | ) | | (NQU | ) | | (NPF | ) | | (NMZ | ) |
| Cost of investments | | $ | 840,782,128 | | $ | 730,496,947 | | $ | 1,023,292,570 | | $ | 387,481,624 | | $ | 696,865,396 | |
| Gross unrealized: | | | | | | | | | | | | | | | | |
| Appreciation | | $ | 96,987,446 | | $ | 64,719,294 | | $ | 114,446,639 | | $ | 34,494,059 | | $ | 96,659,539 | |
| Depreciation | | | (8,606,507 | ) | | (5,725,500 | ) | | (18,721,239 | ) | | (11,230,502 | ) | | (33,964,266 | ) |
| Net unrealized appreciation (depreciation) of investments | | $ | 88,380,939 | | $ | 58,993,794 | | $ | 95,725,400 | | $ | 23,263,557 | | $ | 62,695,273 | |
Permanent differences, primarily due to federal taxes paid, nondeductible offering costs, nondeductible reorganization expenses, paydowns, taxable market discount and treatment of notional principal contracts resulted in reclassifications among the Funds' components of common share net assets as of October 31, 2015, the Funds' tax year end, as follows:
| | | | Investment | | | Select | | | Quality | | | Premier | | | High Income | |
| | | | Quality | | | Quality | | | Income | | | Income | | | Opportunity | |
| | | | (NQM | ) | | (NQS | ) | | (NQU | ) | | (NPF | ) | | (NMZ | ) |
| Paid-in-surplus | | $ | (105,331 | ) | $ | (53,877 | ) | $ | (554,803 | ) | $ | (288,903 | ) | $ | (563,875 | ) |
| Undistributed (Over-distribution of) net investment income | | | 23,425 | | | (36,665 | ) | | 90,363 | | | (218,340 | ) | | (338,751 | ) |
| Accumulated net realized gain (loss) | | | 81,906 | | | 90,542 | | | 464,440 | | | 507,243 | | | 902,626 | |
The tax components of undistributed net tax-exempt income, net ordinary income and net long-term capital gains as of October 31, 2015, the Funds' tax year end, were as follows:
| | | | Investment | | | Select | | | Quality | | | Premier | | | High Income | |
| | | | Quality | | | Quality | | | Income | | | Income | | | Opportunity | |
| | | | (NQM | ) | | (NQS | ) | | (NQU | ) | | (NPF | ) | | (NMZ | ) |
Undistributed net tax-exempt income1 | | $ | 5,019,049 | | $ | 2,884,707 | | $ | 5,447,120 | | $ | 1,593,608 | | $ | 4,443,403 | |
Undistributed net ordinary income2 | | | 53,321 | | | 102,900 | | | 79,367 | | | 3,902 | | | 486,634 | |
| Undistributed net long-term capital gains | | | — | | | — | | | — | | | — | | | — | |
| 1 | Undistributed net tax-exempt income (on a tax basis) has not been reduced for the dividend declared on October 1, 2015, and paid on November 2, 2015. |
| 2 | Net ordinary income consists of taxable market discount income and net short-term capital gains, if any. |
The tax character of distributions paid during the Funds' tax years ended October 31, 2015 and October 31, 2014, was designated for purposes of the dividends paid deduction as follows:
| | | | Investment | | | Select | | | Quality | | | Premier | | | High Income | |
| | | | Quality | | | Quality | | | Income | | | Income | | | Opportunity | |
| 2015 | | | (NQM | ) | | (NQS | ) | | (NQU | ) | | (NPF | ) | | (NMZ | ) |
Distributions from net tax-exempt income3 | | $ | 40,931,352 | | $ | 28,354,502 | | $ | 40,686,293 | | $ | 16,795,766 | | $ | 46,563,908 | |
Distributions from net ordinary income2 | | | 78,262 | | | 35,635 | | | 12,788 | | | 5,672 | | | 511,965 | |
| Distributions from net long-term capital gains | | | — | | | — | | | — | | | — | | | — | |
| | | | Investment | | | Select | | | Quality | | | Premier | | | High Income | |
| | | | Quality | | | Quality | | | Income | | | Income | | | Opportunity | |
| 2014 | | | (NQM | ) | | (NQS | ) | | (NQU | ) | | (NPF | ) | | (NMZ | ) |
| Distributions from net tax-exempt income | | $ | 34,885,847 | | $ | 28,342,465 | | $ | 44,780,190 | | $ | 17,252,294 | | $ | 46,246,196 | |
Distributions from net ordinary income2 | | | 219,455 | | | 10,567 | | | 115,322 | | | 17,900 | | | 250,182 | |
| Distributions from net long-term capital gains | | | — | | | — | | | 1,396,417 | | | — | | | — | |
| 2 | Net ordinary income consists of taxable market discount income and net short-term capital gains, if any. |
| 3 | The Funds hereby designate these amounts paid during the fiscal year ended October 31, 2015, as Exempt Interest Dividends. |
As of October 31, 2015, the Funds' tax year end, the Funds had unused capital loss carryforwards available for federal income tax purposes to be applied against future capital gains, if any. If not applied, the carryforwards will expire as shown in the following table. The losses not subject to expiration will be utilized first by a Fund.
| | | | | | | | | | | | | | | | | |
| | | | Investment | | | Select | | | Quality | | | Premier | | | High Income | |
| | | | Quality | | | Quality | | | Income | | | Income | | | Opportunity | |
| | | | (NQM | )4 | | (NQS | ) | | (NQU | ) | | (NPF | ) | | (NMZ | )4 |
| Expiration: | | | | | | | | | | | | | | | | |
| October 31, 2016 | | $ | 1,349,646 | | $ | — | | $ | — | | $ | — | | $ | 40,199,292 | |
| October 31, 2017 | | | 246,669 | | | — | | | — | | | 2,039,767 | | | 34,954,022 | |
| October 31, 2018 | | | — | | | — | | | — | | | — | | | 1,362,739 | |
| October 31, 2019 | | | — | | | — | | | — | | | 76,136 | | | — | |
| Not subject to expiration | | | 4,782,591 | | | 4,080,913 | | | 8,067,070 | | | — | | | — | |
| Total | | $ | 6,378,906 | | $ | 4,080,913 | | $ | 8,067,070 | | $ | 2,115,903 | | $ | 76,516,053 | |
| 4 | A portion of Investment Quality's (NQM) and High Income Opportunity's (NMZ) capital loss carryforward is subject to an annual limitation under Internal Revenue Code and related regulations. |
As of October 31, 2015, the Funds' tax year end, $371,826 of High Income Opportunity's (NMZ) capital loss carryforward expired.
During the Funds' tax year ended October 31, 2015, the Funds utilized capital loss carryforwards as follows:
| | | | | | | | | | | | | | | | | |
| | | | Investment | | | Select | | | Quality | | | Premier | | | High Income | |
| | | | Quality | | | Quality | | | Income | | | Income | | | Opportunity | |
| | | | (NQM | ) | | (NQS | ) | | (NQU | ) | | (NPF | ) | | (NMZ | ) |
| Utilized capital loss carryforwards | | $ | 1,833,824 | | $ | 1,582,136 | | $ | 893,450 | | $ | 1,487,296 | | $ | 6,611,862 | |
Notes to Financial Statements (continued)
7. Management Fees and Other Transactions with Affiliates
Each Fund's management fee compensates the Adviser for overall investment advisory and administrative services and general office facilities. The Sub-Adviser is compensated for its services to the Funds from the management fees paid to the Adviser.
Each Fund's management fee consists of two components – a fund-level fee, based only on the amount of assets within each individual Fund, and a complex-level fee, based on the aggregate amount of all eligible fund assets managed by the Adviser. This pricing structure enables Fund shareholders to benefit from growth in the assets within their respective Fund as well as from growth in the amount of complex-wide assets managed by the Adviser.
The annual Fund-level fee, payable monthly, for each Fund is calculated according to the following schedules:
| | Investment Quality (NQM) |
| | Select Quality (NQS) |
| | Quality Income (NQU) |
| | Premier Income (NPF) |
| Average Daily Managed Assets* | Fund-Level Fee |
| For the first $125 million | 0.4500 | % |
| For the next $125 million | 0.4375 | |
| For the next $250 million | 0.4250 | |
| For the next $500 million | 0.4125 | |
| For the next $1 billion | 0.4000 | |
| For the next $3 billion | 0.3875 | |
| For managed assets over $5 billion | 0.3750 | |
| | | |
| | High Income Opportunity (NMZ) |
| Average Daily Managed Assets* | Fund-Level Fee |
| For the first $125 million | 0.5500 | % |
| For the next $125 million | 0.5375 | |
| For the next $250 million | 0.5250 | |
| For the next $500 million | 0.5125 | |
| For the next $1 billion | 0.5000 | |
| For managed assets over $2 billion | 0.4750 | |
The annual complex-level fee, payable monthly, for each Fund is calculated according to the following schedule:
| Complex-Level Managed Asset Breakpoint Level* | Effective Rate at Breakpoint Level |
| $55 billion | 0.2000 | % |
| $56 billion | 0.1996 | |
| $57 billion | 0.1989 | |
| $60 billion | 0.1961 | |
| $63 billion | 0.1931 | |
| $66 billion | 0.1900 | |
| $71 billion | 0.1851 | |
| $76 billion | 0.1806 | |
| $80 billion | 0.1773 | |
| $91 billion | 0.1691 | |
| $125 billion | 0.1599 | |
| $200 billion | 0.1505 | |
| $250 billion | 0.1469 | |
| $300 billion | 0.1445 | |
| * | For the fund-level and complex-level fees, managed assets include closed-end fund assets managed by the Adviser that are attributable to certain types of leverage. For these purposes, leverage includes the funds' use of preferred stock and borrowings and certain investments in the residual interest certificates (also called inverse floating rate securities) in tender option bond (TOB) trusts, including the portion of assets held by a TOB trust that has been effectively financed by the trust's issuance of floating rate securities, subject to an agreement by the Adviser as to certain funds to limit the amount of such assets for determining managed assets in certain circumstances. The complex-level fee is calculated based upon the aggregate daily managed assets of all Nuveen Funds that constitute "eligible assets." Eligible assets do not include assets attributable to investments in other Nuveen Funds or assets in excess of $2 billion added to the Nuveen fund complex in connection with the Adviser's assumption of the management of the former First American Funds effective January 1, 2011. As of October 31, 2015, the complex-level fee rate for each Fund was 0.1639%. |
The Funds pay no compensation directly to those of its directors/trustees who are affiliated with the Adviser or to its officers, all of whom receive remuneration for their services to the Funds from the Adviser or its affiliates. The Board has adopted a deferred compensation plan for independent directors/trustees that enables directors/trustees to elect to defer receipt of all or a portion of the annual compensation they are entitled to receive from certain Nuveen-advised funds. Under the plan, deferred amounts are treated as though equal dollar amounts had been invested in shares of select Nuveen-advised funds.
8. Borrowing Arrangements
During the current fiscal period, the Funds participated in an unsecured bank line of credit ("Unsecured Credit Line") under which outstanding balances would bear interest at a variable rate. On December 31, 2014, High Income Opportunity (NMZ) utilized $12,545,726 of the Unsecured Credit Line at an annualized interest rate of 1.34% on its respective outstanding balance. The remaining funds in this report did not draw on this Unsecured Credit Line during the current fiscal period.
During July 2015, the Funds, along with certain other funds managed by the Adviser ("Participating Funds"), established a 364-day, $2.53 billion standby credit facility with a group of lenders, under which the Participating Funds may borrow for various purposes other than leveraging for investment purposes. This credit agreement replaces the Unsecured Credit Line described above. A large portion of this facility's capacity (and its associated costs as described below) is currently dedicated for use by a small number of Participating Funds, which does not include any of the Funds covered by this shareholder report. The remaining capacity under the facility (and the corresponding portion of the facility's annual costs) is separately dedicated to most of the other open-end funds in the Nuveen fund family, along with a number of Nuveen closed-end funds, including all of the Funds covered by this shareholder report. The credit facility expires in July 2016 unless extended or renewed.
The credit facility has the following terms: a fee of 0.15% per annum on unused commitment amounts, and interest at a rate equal to the higher of (a) one-month LIBOR (London Inter-Bank Offered Rate) plus 1.25% per annum or (b) the Fed Funds rate plus 1.25% per annum on amounts borrowed. Participating Funds paid administration, legal and arrangement fees, which are recognized as a component of "Other expenses" on the Statement of Operations, and along with commitment fees, have been allocated among such Participating Funds based upon the relative proportions of the facility's aggregate capacity reserved for them and other factors deemed relevant by the Adviser and the Board of each Participating Fund.
During the current fiscal period, none of the Funds utilized this facility.
Additional Fund Information (Unaudited)
| Board of Directors/Trustees | | | | | | | | | |
| William Adams IV* | | Jack B. Evans | | William C. Hunter | | David J. Kundert | | John K. Nelson | | William J. Schneider | |
| Thomas S. Schreier, Jr.* | | Judith M. Stockdale | | Carole E. Stone | | Virginia L. Stringer** | | Terence J. Toth | | | |
| * | Interested Board Member. |
| ** | Will retire from the Funds' Board of Directors/Trustees effective December 31, 2015. |
| | | | | | | | | | |
| Fund Manager | | Custodian | | Legal Counsel | | Independent Registered | | Transfer Agent and | |
| Nuveen Fund Advisors, LLC | | State Street Bank | | Chapman and Cutler LLP | | Public Accounting Firm | | Shareholder Services | |
| 333 West Wacker Drive | | & Trust Company | | Chicago, IL 60603 | | KPMG LLP | | State Street Bank | |
| Chicago, IL 60606 | | Boston, MA 02111 | | | | Chicago, IL 60601 | | & Trust Company | |
| | | | | | | | | Nuveen Funds | |
| | | | | | | | | P.O. Box 43071 | |
| | | | | | | | | Providence, RI 02940-3071 | |
| | | | | | | | | (800) 257-8787 | |
Quarterly Form N-Q Portfolio of Investments Information
Each Fund is required to file its complete schedule of portfolio holdings with the Securities and Exchange Commission (SEC) for the first and third quarters of each fiscal year on Form N-Q. You may obtain this information directly from the SEC. Visit the SEC on-line at http://www.sec.gov or in person at the SEC's Public Reference Room in Washington, D.C. Call the SEC toll-free at (800) SEC-0330 for room hours and operation.Nuveen Funds' Proxy Voting Information
You may obtain (i) information regarding how each fund voted proxies relating to portfolio securities held during the most recent twelve-month period ended June 30, without charge, upon request, by calling Nuveen Investments toll-free at (800) 257-8787 or on Nuveen's website at www.nuveen.com and (ii) a description of the policies and procedures that each fund used to determine how to vote proxies relating to portfolio securities without charge, upon request, by calling Nuveen Investments toll free at (800) 257-8787. You may also obtain this information directly from the SEC. Visit the SEC on-line at http://www.sec.gov.
CEO Certification Disclosure
Each Fund's Chief Executive Officer (CEO) has submitted to the New York Stock Exchange (NYSE) the annual CEO certification as required by Section 303A.12(a) of the NYSE Listed Company Manual. Each Fund has filed with the SEC the certification of its CEO and Chief Financial Officer required by Section 302 of the Sarbanes-Oxley Act.
Common Share Repurchases
Each Fund intends to repurchase, through its open-market share repurchase program, shares of its own common stock at such times and in such amounts as is deemed advisable. During the period covered by this report, each Fund repurchased shares of its common stock as shown in the accompanying table. Any future repurchases will be reported to shareholders in the next annual or semi-annual report.
| | NQM | NQS | NQU | NPF | NMZ | |
| Common shares repurchased | — | — | 21,000 | — | — | |
FINRA BrokerCheck
The Financial Industry Regulatory Authority (FINRA) provides information regarding the disciplinary history of FINRA member firms and associated investment professionals. This information as well as an investor brochure describing FINRA BrokerCheck is available to the public by calling the FINRA BrokerCheck Hotline number at (800) 289-9999 or by visiting www.FINRA.org.
Glossary of Terms Used in this Report (Unaudited)
| ■ | Auction Rate Bond: An auction rate bond is a security whose interest payments are adjusted periodically through an auction process, which process typically also serves as a means for buying and selling the bond. Auctions that fail to attract enough buyers for all the shares offered for sale are deemed to have "failed," with current holders receiving a formula-based interest rate until the next scheduled auction. |
| | |
| ■ | Average Annual Total Return: This is a commonly used method to express an investment's performance over a particular, usually multi-year time period. It expresses the return that would have been necessary each year to equal the investment's actual cumulative performance (including change in NAV or market price and reinvested dividends and capital gains distributions, if any) over the time period being considered. |
| | |
| ■ | Duration: Duration is a measure of the expected period over which a bond's principal and interest will be paid, and consequently is a measure of the sensitivity of a bond's or bond fund's value to changes when market interest rates change. Generally, the longer a bond's or fund's duration, the more the price of the bond or fund will change as interest rates change. |
| | |
| ■ | Effective Leverage: Effective leverage is a fund's effective economic leverage, and includes both regulatory leverage (see leverage) and the leverage effects of certain derivative investments in the fund's portfolio. Currently, the leverage effects of Tender Option Bond (TOB) inverse floater holdings are included in effective leverage values, in addition to any regulatory leverage. |
| | |
| ■ | Forward Interest Rate Swap: A contractual agreement between two counterparties under which one party agrees to make periodic payments to the other for an agreed period of time based on a fixed rate, while the other party agrees to make periodic payments based on a floating rate of interest based on an underlying index. Alternatively, both series of cash flows to be exchanged could be calculated using floating rates of interest but floating rates that are based upon different underlying indexes. |
| | |
| ■ | Gross Domestic Product (GDP): The total market value of all final goods and services produced in a country/region in a given year, equal to total consumer, investment and government spending, plus the value of exports, minus the value of imports. |
| | |
| ■ | Inverse Floating Rate Securities: Inverse floating rate securities, also known as inverse floaters or tender option bonds (TOBs), are created by depositing a municipal bond, typically with a fixed interest rate, into a special purpose trust. This trust, in turn, (a) issues floating rate certificates typically paying short-term tax-exempt interest rates to third parties in amounts equal to some fraction of the deposited bond's par amount or market value, and (b) issues an inverse floating rate certificate (sometimes referred to as an "inverse floater") to an investor (such as a fund) interested in gaining investment exposure to a long-term municipal bond. The income received by the holder of the inverse floater varies inversely with the short-term rate paid to the floating rate certificates' holders, and in most circumstances the holder of the inverse floater bears substantially all of the underlying bond's downside investment risk. The holder of the inverse floater typically also benefits disproportionately from any potential appreciation of the underlying bond's value. Hence, an inverse floater essentially represents an investment in the underlying bond on a leveraged basis. |
| | |
| ■ | Leverage: Leverage is created whenever a fund has investment exposure (both reward and/or risk) equivalent to more than 100% of the investment capital. |
| | |
| ■ | Lipper General & Insured Leveraged Municipal Debt Funds Classification Average: Calculated using the returns of all closed-end funds in this category. Lipper returns account for the effects of management fees and assume reinvestment of distributions, but do not reflect any applicable sales charges. |
| | |
| ■ | Lipper High-Yield Municipal Debt Funds Classification Average: Calculated using the returns of all closed-end funds in this category. Lipper returns account for the effects of management fees and assume reinvestment of distributions, but do not reflect any applicable sales charges. |
Glossary of Terms Used in this Report (Unaudited) (continued)
| ■ | Net Asset Value (NAV) Per Share: A fund's Net Assets is equal to its total assets (securities, cash, accrued earnings and receivables) less its total liabilities. NAV per share is equal to the fund's Net Assets divided by its number of shares outstanding. |
| | |
| ■ | Pre-Refunding: Pre-Refunding, also known as advanced refundings or refinancings, is a procedure used by state and local governments to refinance municipal bonds to lower interest expenses. The issuer sells new bonds with a lower yield and uses the proceeds to buy U.S. Treasury securities, the interest from which is used to make payments on the higher-yielding bonds. Because of this collateral, pre-refunding generally raises a bond's credit rating and thus its value. |
| | |
| ■ | Regulatory Leverage: Regulatory Leverage consists of preferred shares issued by or borrowings of a fund. Both of these are part of a fund's capital structure. Regulatory leverage is subject to asset coverage limits set in the Investment Company Act of 1940. |
| | |
| ■ | S&P Municipal Bond High Yield Index: An unleveraged, market value-weighted index designed to measure the performance of the tax-exempt, investment-grade U.S. high yield municipal bond market. Index returns assume reinvestment of distributions, but do not reflect any applicable sales charges or management fees. |
| | |
| ■ | S&P Municipal Bond Index: An unleveraged, market value-weighted index designed to measure the performance of the tax-exempt, investment-grade U.S. municipal bond market. Index returns assume reinvestment of distributions, but do not reflect any applicable sales charges or management fees. |
| | |
| ■ | Total Investment Exposure: Total investment exposure is a fund's assets managed by the Adviser that are attributable to financial leverage. For these purposes, financial leverage includes a fund's use of preferred stock and borrowings and investments in the residual interest certificates (also called inverse floating rate securities) in tender option bond (TOB) trusts, including the portion of assets held by a TOB trust that has been effectively financed by the trust's issuance of floating rate securities. |
| | |
| ■ | Zero Coupon Bond: A zero coupon bond does not pay a regular interest coupon to its holders during the life of the bond. Income to the holder of the bond comes from accretion of the difference between the original purchase price of the bond at issuance and the par value of the bond at maturity and is effectively paid at maturity. The market prices of zero coupon bonds generally are more volatile than the market prices of bonds that pay interest periodically. |
Reinvest Automatically, Easily and Conveniently
Nuveen makes reinvesting easy. A phone call is all it takes to set up your reinvestment account.
Nuveen Closed-End Funds Automatic Reinvestment Plan
Nuveen Closed-End Fund allows you to conveniently reinvest distributions in additional Fund shares. By choosing to reinvest, you'll be able to invest money regularly and automatically, and watch your investment grow through the power of compounding. Just like distributions in cash, there may be times when income or capital gains taxes may be payable on distributions that are reinvested. It is important to note that an automatic reinvestment plan does not ensure a profit, nor does it protect you against loss in a declining market.
Easy and convenient
To make recordkeeping easy and convenient, each month you'll receive a statement showing your total distributions, the date of investment, the shares acquired and the price per share, and the total number of shares you own.
How shares are purchased
The shares you acquire by reinvesting will either be purchased on the open market or newly issued by the Fund. If the shares are trading at or above net asset value at the time of valuation, the Fund will issue new shares at the greater of the net asset value or 95% of the then-current market price. If the shares are trading at less than net as -set value, shares for your account will be purchased on the open market. If the Plan Agent begins purchasing Fund shares on the open market while shares are trading below net asset value, but the Fund's shares subsequently trade at or above their net asset value before the Plan Agent is able to complete its purchases, the Plan Agent may cease open-market purchases and may invest the uninvested portion of the distribution in newly-issued Fund shares at a price equal to the greater of the shares' net asset value or 95% of the shares' market value on the last business day immediately prior to the purchase date. Distributions received to purchase shares in the open market will normally be invested shortly after the distribution payment date. No interest will be paid on distributions awaiting reinvestment. Because the market price of the shares may increase before purchases are completed, the average purchase price per share may exceed the market price at the time of valuation, resulting in the acquisition of fewer shares than if the distribution had been paid in shares issued by the Fund. A pro rata portion of any applicable brokerage commissions on open market purchases will be paid by Plan participants. These commissions usually will be lower than those charged on individual transactions.
Flexible
You may change your distribution option or withdraw from the Plan at any time, should your needs or situation change. You can reinvest whether your shares are registered in your name, or in the name of a brokerage firm, bank, or other nominee. Ask your investment advisor if his or her firm will participate on your behalf. Participants whose shares are registered in the name of one firm may not be able to transfer the shares to another firm and continue to participate in the Plan. The Fund reserves the right to amend or terminate the Plan at any time. Although the Fund reserves the right to amend the Plan to include a service charge payable by the participants, there is no direct service charge to participants in the Plan at this time.
Call today to start reinvesting distributions
For more information on the Nuveen Automatic Reinvestment Plan or to enroll in or withdraw from the Plan, speak with your financial advisor or call us at (800) 257-8787.
Annual Investment Management Agreement Approval Process (Unaudited)
The Board of Directors or Trustees (as the case may be) of each Fund (each, a "Board" and each Director or Trustee, a "Board Member"), including the Board Members who are not parties to the Funds' advisory or sub-advisory agreements or "interested persons" of any such parties (the "Independent Board Members"), is responsible for overseeing the performance of the investment adviser and sub-adviser to the respective Fund and determining whether to continue such Fund's advisory agreement (the "Investment Management Agreement") between the Fund and Nuveen Fund Advisors, LLC (the "Adviser") and the sub-advisory agreement (the "Sub-Advisory Agreement" and, together with the Investment Management Agreement, the "Advisory Agreements") between the Adviser and Nuveen Asset Management, LLC (the "Sub-Adviser"). Following an initial term with respect to each Fund upon its commencement of operations, the Board is required to consider the continuation of the Advisory Agreements on an annual basis pursuant to the requirements of the Investment Company Act of 1940, as amended (the "1940 Act"). Accordingly, at an in-person meeting held on May 11-13, 2015 (the "May Meeting"), the Board, including a majority of the Independent Board Members, considered and approved the existing Advisory Agreements for the Funds.
In preparation for its considerations at the May Meeting, the Board received in advance of the meeting extensive materials prepared in connection with the review of the Advisory Agreements. The materials provided a broad range of information regarding the Funds, including, among other things, the nature, extent and quality of services provided by the Adviser and Sub-Adviser (the Adviser and Sub-Adviser are collectively, the "Fund Advisers" and each, a "Fund Adviser"); Fund performance including performance assessments against peers and the appropriate benchmark(s); fee and expense information of the Funds compared to peers; a description and assessment of shareholder service levels for the Funds; a summary of the performance of certain service providers; a review of product initiatives and shareholder communications; and profitability information of the Fund Advisers as described in further detail below. As part of its annual review, the Board also held a separate meeting on April 14-15, 2015 to review the Funds' investment performance and consider an analysis by the Adviser of the Sub-Adviser which generally evaluated the Sub-Adviser's investment team, investment mandate, organizational structure and history, investment philosophy and process, and the performance of the Funds, and any significant changes to the foregoing. During the review, the Independent Board Members asked questions of and requested additional information from management.
The Board considered that the evaluation process with respect to the Fund Advisers is an ongoing process that encompassed the information and knowledge gained throughout the year. The Board, acting directly or through its committees, met regularly during the course of the year and received information and considered factors at each meeting that would be relevant to its annual consideration of the Advisory Agreements, including information relating to Fund performance; Fund expenses; investment team evaluations; and valuation, compliance, regulatory and risk matters. In addition to regular reports, the Adviser provided special reports to the Board to enhance the Board's understanding on topics that impact some or all of the Nuveen funds and the Adviser (such as presentations on risk and stress testing; the new governance, risk and compliance system; cybersecurity developments; Nuveen fund accounting and reporting matters; regulatory developments impacting the investment company industry and the business plans or other matters impacting the Adviser). The Board also met with key investment personnel managing certain Nuveen fund portfolios during the year.
The Board had created several standing committees including the Open-End Funds Committee and the Closed-End Funds Committee to assist the full Board in monitoring and gaining a deeper insight into the distinctive business practices of closed-end and open-end funds. These Committees met prior to each quarterly Board meeting, and the Adviser provided presentations to these Committees permitting them to delve further into specific matters or initiatives impacting the respective product line.
The Board also continued its program of seeking to have the Board Members or a subset thereof visit each sub-adviser to the Nuveen funds at least once over a multiple year rotation, meeting with key investment and business personnel. In this regard, the Independent Board Members made site visits to multiple equity and fixed-income investment teams of the Sub-Adviser in June 2014.
The Board considered the information provided and knowledge gained at these meetings and visits during the year when performing its annual review of the Advisory Agreements. The Independent Board Members also were assisted throughout the process by independent legal counsel. During the course of the year and during their deliberations regarding the review of advisory contracts, the Independent Board Members met with independent legal counsel in executive sessions without management present. The Independent Board Members also received a memorandum from independent legal counsel outlining the legal standards for their consideration of the proposed continuation of the Advisory Agreements. In addition, it is important to recognize that the management arrangements for the Nuveen funds are the result of many years of review and discussion between the Independent Board Members and Fund management and that the Board Members' conclusions may be based, in part, on their consideration of fee arrangements and other factors developed in previous years.
The Board took into account all factors it believed relevant with respect to each Fund, including, among other things: (a) the nature, extent and quality of the services provided by the Fund Advisers; (b) the investment performance of the Funds and Fund Advisers; (c) the advisory fees and costs of the services to be provided to the Funds and the profitability of the Fund Advisers; (d) the extent of any economies of scale; (e) any benefits derived by the Fund Advisers from the relationship with the Funds; and (f) other factors. Each Board Member may have accorded different weight to the various factors in reaching his or her conclusions with respect to the Advisory Agreements of each Fund. The Independent Board Members did not identify any single factor as all-important or controlling. The Independent Board Members' considerations were instead based on a comprehensive consideration of all the information presented. The principal factors considered by the Board and its conclusions are described below.
| A. | Nature, Extent and Quality of Services |
| | In evaluating the renewal of the Advisory Agreements, the Independent Board Members received and considered information regarding the nature, extent and quality of the applicable Fund Adviser's services provided to each respective Fund. The Board reviewed information regarding, among other things, each Fund Adviser's organization and business, the types of services that each Fund Adviser or its affiliates provided to the Funds, the performance record of the Funds (as described in further detail below), and any initiatives that had been undertaken on behalf of the closed-end product line. The Board recognized the high quality of services the Adviser had provided to the Funds over the years and the conscientiousness with which the Adviser provided these services. The Board also considered the improved capital structure of Nuveen Investments, Inc. ("Nuveen") (the parent of the Adviser) following the acquisition of Nuveen by TIAA-CREF in 2014 (the "TIAA-CREF Transaction"). |
| | |
| | With respect to the services, the Board noted the Funds were registered investment companies that operated in a regulated industry and considered the myriad of investment management, administrative, compliance, oversight and other services the Adviser provided to manage and operate the Funds. Such services included, among other things: (a) product management (such as analyzing ways to better position a Nuveen fund in the marketplace, setting dividends; maintaining relationships to gain access to distribution platforms; and providing shareholder communications); (b) fund administration (such as preparing tax returns and other tax compliance services, preparing regulatory filings and shareholder reports; managing fund budgets and expenses; overseeing a fund's various service providers and supporting and analyzing new and existing funds); (c) Board administration (such as supporting the Board and its committees, in relevant part, by organizing and administering the Board and committee meetings and preparing the necessary reports to assist the Board in its duties); (d) compliance (such as monitoring adherence to a fund's investment policies and procedures and applicable law; reviewing the compliance program periodically and developing new policies or updating existing compliance policies and procedures as considered necessary or appropriate; responding to regulatory requests; and overseeing compliance testing of the funds' sub-advisers); (e) legal support (such as preparing or reviewing fund registration statements, proxy statements and other necessary materials; interpreting regulatory requirements and compliance thereof; and maintaining applicable registrations); and (f) investment services (such as overseeing and reviewing the funds' sub-advisers and their investment teams; analyzing performance of the funds; overseeing investment and risk management; evaluating brokerage transactions and securities lending, overseeing the daily valuation process for portfolio securities and developing and recommending valuation policies and methodologies and changes thereto; reporting to the Board on various matters including performance, risk and valuation; and participating in fund development, leverage management, and the developing or interpreting of investment policies and parameters). With respect to closed-end funds, the Adviser |
Annual Investment Management Agreement Approval Process (Unaudited) (continued)
| | also monitored asset coverage levels on leveraged funds, managed leverage, negotiated the terms of leverage, evaluated alternative forms and types of leverage, promoted an orderly secondary market for common shares and maintained an asset maintenance system for compliance with certain rating agency criteria. |
| | |
| | In its review, the Board considered information highlighting the various initiatives that the Adviser had implemented or continued during the last year to enhance its services to the Nuveen funds. The Board recognized that some of these initiatives are a result of a multi-year process. In reviewing the activities of 2014, the Board recognized the Adviser's continued focus on fund rationalization for closed-end funds through mergers, fund closures or repositioning the funds in seeking to enhance shareholder value, reduce costs, improve performance, eliminate fund overlap and better meet shareholder needs. The Board noted the Adviser's investment in additional staffing to strengthen and improve its services to the Nuveen funds, including with respect to risk management and valuation. The Board recognized that expanding the depth and range of its risk oversight activities had been a major priority for the Adviser in recent years, and the Adviser continued to add to the risk management team, develop additional risk management programs and create committees or other teams designated to oversee or evaluate certain risks, such as liquidity risk, enterprise risk, investment risk and cybersecurity risk. The Adviser had also continued to add to the valuation team, launched its centralized securities valuation system which is intended to provide for uniform pricing and reporting across the complex as the system continues to develop, continued to refine its valuation analysis and updated related policies and procedures and evaluated and assessed pricing services. The Board considered the Adviser's ongoing investment in information technology and operations and the various projects of the information technology team to support the continued growth and complexity of the Nuveen funds and increase efficiencies in their operations. The Board also recognized the Adviser's strong commitment to compliance and reviewed information reflecting the compliance group's ongoing activities to enhance its compliance system and refine its compliance procedures as well as the Chief Compliance Officer's report regarding the compliance team, the initiatives the team had undertaken in 2014 and proposed for 2015, the compliance functions and reporting process, the record of compliance with the policies and procedures and its supervision activities of other service providers. |
| | |
| | With respect to the closed-end funds, the Board recognized the extensive resources, expertise and efforts required to oversee and manage the various forms of leverage utilized by various funds, including the development of new forms of leverage to achieve cost savings and/or broaden the array of leverage structures available to the closed-end funds, the development of enhanced reports analyzing the impact of leverage on performance, and the development of new forms of tender option bond structures to address new regulatory requirements. The Board also noted the Adviser's continued capital management services conducting share repurchases and/or share issuances throughout the year and monitoring market conditions to capitalize on opportunities for the closed-end funds. The Board further recognized the Adviser's use of data systems to more effectively solicit shareholder participation when seeking shareholder approvals and to monitor flow trends in various closed-end funds. The Board considered Nuveen's continued commitment to supporting the closed-end fund product line by providing an extensive investor relations program that encompassed, among other things, maintaining and enhancing the closed-end fund website; participating in conferences and education seminars; enhancing the ability for investors to access information; preparing educational materials; and implementing campaigns to educate financial advisers and investors on topics related to closed-end funds and their strategies. |
| | |
| | As noted, the Adviser also oversees the Sub-Adviser who primarily provides the portfolio advisory services to the Funds. The Board recognized the skill and competency of the Adviser in monitoring and analyzing the performance of the Sub-Adviser and managing the sub-advisory relationship. In considering the Sub-Advisory Agreements and supplementing its prior knowledge, the Board considered a current report provided by the Adviser analyzing, among other things, the Sub-Adviser's investment team and changes thereto, investment approach, organization and history, and assets under management, and the investment performance of each Fund. |
| | |
| | Based on their review, the Independent Board Members found that, overall, the nature, extent and quality of services provided to the Funds under each respective Advisory Agreement were satisfactory. |
| B. | The Investment Performance of the Funds and Fund Advisers |
| | The Board, including the Independent Board Members, considered the performance history of each Fund over various time periods. The Board reviewed reports, including an analysis of the Funds' performance and the applicable investment team. The Board reviewed, among other things, each Fund's investment performance both on an absolute basis and in comparison to peer funds (the "Performance Peer Group") and to recognized and/or customized benchmarks (i.e., generally benchmarks derived from multiple recognized benchmarks) for the quarter, one-, three-and five-year periods ending December 31, 2014, as well as performance information reflecting the first quarter of 2015. The Independent Board Members also recognized the importance of the secondary market trading levels for the closed-end fund shares and therefore devoted significant time and focus evaluating the premium and discount levels of the closed-end funds at each of the quarterly meetings throughout the year. At these prior meetings as well as the May Meeting, the Board reviewed, among other things, the respective closed-end fund's premium or discount to net asset value as of a specified date and over various periods as well as in comparison to the premium/discount average in its Lipper peer category. At the May Meeting and/or prior meetings, the Board also reviewed information regarding the key economic, market and competitive trends affecting the closed-end fund market and considered any actions periodically proposed by the Adviser to address the trading discounts of certain funds. The Independent Board Members considered the evaluation of the premium and discount levels of the closed-end funds (either at the Board level or through the Closed-End Funds Committee) to be a continuing priority in their oversight of the closed-end funds. In its review, the Board noted that it also reviewed Fund performance results at each of its quarterly meetings. |
| | |
| | In evaluating performance, the Board recognized several factors that may impact the performance data as well as the consideration given to particular performance data. |
| | • | The performance data reflected a snapshot in time, in this case as of the end of the most recent calendar year or quarter. A different performance period, however, could generate significantly different results. |
| | | |
| | • | Long-term performance can be adversely affected by even one period of significant underperformance so that a single investment decision or theme had the ability to disproportionately affect long-term performance. |
| | | |
| | • | The investment experience of a particular shareholder in a fund would vary depending on when such shareholder invested in the fund, the class held (if multiple classes are offered in the fund) and the performance of the fund (or respective class) during that shareholder's investment period. |
| | | |
| | • | The Board recognized that the funds in the Performance Peer Group may differ somewhat from the Nuveen fund with which it is being compared and due to these differences, performance comparisons between certain of the Nuveen funds and their Performance Peer Groups may be inexact and the relevancy limited. The Board considered that management had classified the Performance Peer Group as low, medium and high in relevancy. The Board took the analysis of the relevancy of the Performance Peer Group into account when considering the comparative performance data. The Board also considered comparative performance of an applicable benchmark. While the Board was cognizant of the relative performance of a Fund's peer set and/or benchmark(s), the Board evaluated Fund performance in light of the respective Fund's investment objectives, investment parameters and guidelines and considered that the variations between the objectives and investment parameters or guidelines of the Fund with its peers and/or benchmarks result in differences in performance results. Further, for funds that utilized leverage, the Board understood that leverage during different periods could provide both benefits and risks to a portfolio as compared to an unlevered benchmark. |
| | With respect to any Nuveen funds for which the Board has identified performance concerns, the Board monitors such funds closely until performance improves, discusses with the Adviser the reasons for such results, considers those steps necessary or appropriate to address such issues, and reviews the results of any efforts undertaken. The Board is aware, however, that shareholders chose to invest or remain invested in a fund knowing that the Adviser manages the fund and knowing the fund's fee structure. |
| | |
| | In considering the performance data, the Independent Board Members noted the following with respect to the Funds: |
Annual Investment Management Agreement Approval Process (Unaudited) (continued)
| | For Nuveen Investment Quality Municipal Fund, Inc. (the "Investment Quality Fund"), the Board noted that the Fund ranked in its Performance Peer Group in the third quartile for the one-and three-year periods and the second quartile in the five-year period. The Fund also outperformed its benchmark in the one-, three-and five-year periods. |
| | |
| | For Nuveen Select Quality Municipal Fund, Inc. (the "Select Quality Fund"), the Board noted that the Fund ranked in its Performance Peer Group in the second quartile for the one-, three-and five-year periods and outperformed its benchmark in each of such periods. |
| | |
| | For Nuveen Quality Income Municipal Fund, Inc. (the "Quality Income Fund"), the Board noted that, although the Fund ranked in its Performance Peer Group in the fourth quartile in the longer five-year period, the Fund ranked in the second quartile in the one-year period and the third quartile in the three-year period. The Fund also outperformed its benchmark in the one-, three-and five-year periods. |
| | |
| | For Nuveen Premier Municipal Income Fund, Inc. (the "Premier Fund"), the Board noted that, although the Fund ranked in its Performance Peer Group in the fourth quartile in the longer three-and five-year periods, the Fund ranked in the third quartile in the one-year period and outperformed its benchmark in the one-, three-and five-year periods. |
| | |
| | For Nuveen Municipal High Income Opportunity Fund (the "High Income Fund"), the Board noted that the Fund ranked in its Performance Peer Group in the first quartile for the one-, three-and five-year periods and outperformed its benchmark in each of such periods. |
| | |
| | Based on their review, the Independent Board Members determined that each Fund's investment performance had been satisfactory. |
| | |
| C. | Fees, Expenses and Profitability |
| | |
| | 1.Fees and Expenses |
| | The Board evaluated the management fees and other fees and expenses of each Fund (expressed as a percentage of average net assets) in absolute terms and in comparison to the fee and expense levels of a comparable universe of funds (the "Peer Universe") selected by an independent third-party fund data provider. The Independent Board Members reviewed the methodology regarding the construction of the Peer Universe for each Fund. The Board reviewed, among other things, such Fund's gross management fees, net management fees and net expense ratios in absolute terms as well as compared to the average and median fee and expense levels of the Peer Universe. The Board noted that the net total expense ratios paid by investors in the Funds were the most representative of an investor's net experience. The Board Members also considered any fee waivers and/or expense reimbursement arrangements currently in effect for the Funds. |
| | |
| | In reviewing the comparative fee and expense information, the Independent Board Members recognized that various factors such as the limited size and particular composition of the Peer Universe (including the inclusion of other Nuveen funds in the peer set); expense anomalies; changes in the funds comprising the Peer Universe from year to year; levels of reimbursement or fee waivers; the timing of information used; the differences in the type and use of leverage (with respect to closed-end funds); and differences in services provided can impact the comparative data limiting the usefulness of the data to help make a conclusive assessment of the Funds' fees and expenses. |
| | |
| | In reviewing the fee schedule for a fund, the Independent Board Members also considered the fund-level and complex-wide breakpoint schedules (described in further detail below) and any fee waivers and reimbursements provided by Nuveen. In reviewing fees and expenses (excluding leverage costs and leveraged assets for the closed-end funds), the Board considered the expenses and fees to be higher if they were over 10 basis points higher, slightly higher if they were approximately 6 to 10 basis points higher, in line if they were within approximately 5 basis points higher than the peer average and below if they were below the peer average of the Peer Universe. In reviewing the reports, the Board noted that the majority of the Nuveen funds had a net expense ratio near or below their peer average. |
| | |
| | The Board noted that the High Income Fund and the Select Quality Fund each had a slightly higher net management fee than the peer average but a net expense ratio that was in line with the peer average. The Board further noted that the Investment Quality Fund, the Quality Income Fund and the Premier Fund each had a slightly higher or higher net management fee and net |
| | expense ratio compared to their respective peer averages. The Board recognized that, in the case of the Investment Quality Fund, the higher net expense ratio was generally due to a one-time cost associated with being the acquiring fund in a merger; in the case of the Quality Income Fund, the slightly higher net expense ratio was primarily due to the costs associated with conducting a tender offer; and, in the case of the Premier Fund, the slightly higher net expense ratio was generally due to a onetime expense accrual adjustment and a decline in the value of the common shares. |
| | |
| | Based on their review of the fee and expense information provided, the Independent Board Members determined that each Fund's management fees (as applicable) to a Fund Adviser were reasonable in light of the nature, extent and quality of services provided to the Fund. |
| | |
| | 2.Comparisons with the Fees of Other Clients |
| | The Board considered information regarding the fees a Fund Adviser assessed to the Nuveen funds compared to that of other clients as described in further detail below. With respect to municipal funds, such other clients of a Fund Adviser may include municipal separately managed accounts and passively managed exchange traded funds (ETFs) sub-advised by the Sub-Adviser. |
| | |
| | The Board recognized that each Fund had an affiliated sub-adviser and therefore the overall Fund management fee can be divided into two components, the fee retained by the Adviser and the fee paid to the Sub-Adviser. In reviewing the nature of the services provided by the Adviser, including through its affiliated sub-advisers, the Board considered the range of advisory fee rates for retail and institutional managed accounts advised by Nuveen-affiliated sub-advisers. The Board also reviewed, among other things, the average fee the affiliated sub-advisers assessed such clients as well as the range of fee rates assessed to the different types of clients (such as retail, institutional and wrap accounts as well as non-Nuveen funds) applicable to such sub-advisers. |
| | |
| | In reviewing the comparative information, the Board also reviewed information regarding the differences between the Funds and the other clients, including differences in services provided, investment policies, investor profiles, compliance and regulatory requirements and account sizes. The Board recognized the breadth of services necessary to operate a registered investment company (as described above) and that, in general terms, the Adviser provided the administrative and other support services to the Funds and, although the Sub-Adviser may provide some of these services, the Sub-Adviser essentially provided the portfolio management services. In general, the Board noted that higher fee levels reflected higher levels of service provided by the Fund Adviser, increased investment management complexity, greater product management requirements and higher levels of business risk or some combination of the foregoing. The Independent Board Members considered the differences in structure and operations of separately managed accounts and hedge funds from registered funds and noted that the range of day-to-day services was not generally of the breadth required for the registered funds. Many of the additional administrative services provided by the Adviser were not required for institutional clients or funds sub-advised by a Nuveen-affiliated sub-adviser that were offered by other fund groups. The Independent Board Members also recognized that the management fee rates of the foreign funds advised by the Adviser may vary due to, among other things, differences in the client base, governing bodies, operational complexities and services covered by the management fee. Given the inherent differences in the various products, particularly the extensive services provided to the Funds, the Independent Board Members believed such facts justify the different levels of fees. |
| | |
| | 3.Profitability of Fund Advisers |
| | In conjunction with their review of fees, the Independent Board Members also considered the profitability of Nuveen for its advisory activities and its financial condition. The Independent Board Members reviewed, among other things, the adjusted operating margins for Nuveen for the last two calendar years, the revenues, expenses, net income (pre-tax and after-tax) and net revenue margins (pre-tax and after-tax) of Nuveen's managed fund advisory activities for the last two calendar years, the allocation methodology used by Nuveen in preparing the profitability data and a history of the adjustments to the methodology due to changes in the business over time. The Independent Board Members also reviewed the revenues, expenses, net income (pre-tax and after-tax) and revenue margin (pre-tax and post-tax) of the Adviser and, as described in further detail below, each affiliated sub-adviser for the 2014 calendar year. In reviewing the profitability data, the Independent Board Members noted the subjective nature of cost allocation methodologies used to determine profitability as other reasonable methods could also have been employed but yield different results. The Independent Board Members reviewed an analysis of the key drivers behind the |
Annual Investment Management Agreement Approval Process (Unaudited) (continued)
| | changes in revenues and expenses that impacted profitability in 2014. The Independent Board Members recognized that Nuveen's net revenue margin from advisory activities for 2014 was consistent with 2013. The Independent Board Members also considered the profitability of Nuveen in comparison to the adjusted operating margins of other investment advisers with publicly available data and with comparable assets under management (based on asset size and asset composition) to Nuveen. The Independent Board Members noted that Nuveen's adjusted operating margins appeared to be reasonable in relation to such other advisers. The Independent Board Members, however, recognized the difficulty of making comparisons of profitability from fund investment advisory contracts as the information is not generally publicly available, the information for the investment advisers that was publicly available may not be representative of the industry and various other factors would impact the profitability data such as differences in services offered, business mix, expense methodology and allocations, capital structure and costs, complex size, and types of funds and other accounts managed. |
| | |
| | The Independent Board Members noted this information supplemented the profitability information requested and received during the year and noted that two Independent Board Members served as point persons to review the profitability analysis and methodologies employed, and any changes thereto, and to keep the Board apprised of such changes during the year. |
| | |
| | The Independent Board Members determined that Nuveen appeared to be sufficiently profitable to operate as a viable investment management firm and to honor its obligations as a sponsor of the Nuveen funds. The Independent Board Members noted the Adviser's continued expenditures to upgrade its investment technology and increase personnel and recognized the Adviser's continued commitment to its business to enhance the Adviser's capacity and capabilities in providing the services necessary to meet the needs of the Nuveen funds as they grow or change over time. The Independent Board Members also noted that the sub-advisory fees for the Nuveen funds are paid by the Adviser, however, the Board recognized that many of the sub-advisers, including the Sub-Adviser, are affiliated with Nuveen. The Independent Board Members also noted the increased resources and support available to Nuveen as well as an improved capital structure as a result of the TIAA-CREF Transaction. |
| | |
| | With respect to the Sub-Adviser, the Independent Board Members reviewed the Sub-Adviser's revenues, expenses and revenue margins (pre-and post-tax) for its advisory activities for the calendar year ended December 31, 2014. The Independent Board Members also reviewed profitability analysis reflecting the revenues, expenses and the revenue margin (pre-and post-tax) by asset type for the Sub-Adviser for the calendar year ended December 31, 2014. |
| | |
| | In evaluating the reasonableness of the compensation, the Independent Board Members also considered other amounts paid to a Fund Adviser by the Funds as well as indirect benefits (such as soft dollar arrangements), if any, the Fund Adviser and its affiliates received or were expected to receive that were directly attributable to the management of a Fund. See Section E below for additional information on indirect benefits a Fund Adviser may receive as a result of its relationship with the Funds. |
| | |
| | Based on their review, the Independent Board Members determined that the Adviser's and the Sub-Adviser's level of profitability was reasonable in light of the respective services provided. |
| | |
| D. | Economies of Scale and Whether Fee Levels Reflect These Economies of Scale |
| | The Independent Board Members recognized that, as the assets of a particular fund or the Nuveen complex in the aggregate increase over time, economies of scale may be realized, and the Independent Board Members considered the extent to which the funds benefit from such economies of scale. Although the Independent Board Members recognized that economies of scale are difficult to measure, the Board recognized that one method to help ensure the shareholders share in these benefits is to include breakpoints in the management fee schedule reducing fee rates as asset levels grow. The Independent Board Members noted that, subject to certain exceptions, the management fees of the funds in the Nuveen complex are generally comprised of a fund-level component and complex-level component. Each component of the management fee for each Fund included breakpoints to reduce management fee rates of the Fund as the Fund grows and, as described below, as the Nuveen complex grows. The Independent Board Members noted that, in the case of closed-end funds, however, such funds may from time-to-time make additional share offerings, but the growth of their assets would occur primarily through the appreciation of such funds' investment portfolios. In addition to fund-specific breakpoint schedules which reduce the fee rates of a particular fund as its assets increase, the Independent Board Members recognized that the Adviser also passed on the benefits of economies of scale through the |
| | complex-wide fee arrangement which reduced management fee rates as assets in the fund complex reached certain levels. The complex-wide fee arrangement seeks to provide the benefits of economies of scale to fund shareholders when total fund complex assets increase, even if assets of a particular fund are unchanged or have decreased. The approach reflected the notion that some of Nuveen's costs were attributable to services provided to all its funds in the complex, and therefore all funds benefit if these costs were spread over a larger asset base. The Independent Board Members reviewed the breakpoint and complex-wide schedules and the fee reductions achieved as a result of such structures for the 2014 calendar year. |
| | |
| | The Independent Board Members also noted that additional economies of scale were shared with shareholders of the Investment Quality Fund through the adoption of a temporary expense cap. The Independent Board Members further considered that as part of the TIAA-CREF Transaction, Nuveen agreed, for a period of two years from the date of the closing of the TIAA-CREF Transaction, not to increase contractual management fees for any Nuveen fund and, with respect to funds with expense caps, not to raise expense cap levels for such funds from levels in effect at that time or scheduled to go into effect prior to the closing of the TIAA-CREF Transaction. The commitment would not limit or otherwise affect mergers or liquidations of any funds in the ordinary course. |
| | Based on their review, the Independent Board Members concluded that the current fee structure was acceptable and reflected economies of scale to be shared with shareholders when assets under management increase. |
| | |
| E. | Indirect Benefits |
| | The Independent Board Members received and considered information regarding potential "fall out" or ancillary benefits the respective Fund Adviser or its affiliates may receive as a result of its relationship with the Funds. With respect to closed-end funds, the Independent Board Members noted any revenues received by affiliates of the Adviser for serving as co-manager in initial public offerings of new closed-end funds. |
| | |
| | In addition to the above, the Independent Board Members considered whether the Fund Adviser received any benefits from soft dollar arrangements whereby a portion of the commissions paid by a Fund for brokerage may be used to acquire research that may be useful to the Fund Adviser in managing the assets of the Fund and other clients. The Funds' portfolio transactions are allocated by the Sub-Adviser. Accordingly, the Independent Board Members considered that the Sub-Adviser may benefit from research provided by broker-dealers executing portfolio transactions on behalf of the Funds. With respect to any fixed income securities, however, the Board recognized that such securities generally trade on a principal basis that does not generate soft dollar credits. Similarly, the Board recognized that any research received pursuant to soft dollar arrangements by the Sub-Adviser may also benefit the Funds and shareholders to the extent the research enhanced the ability of the Sub-Adviser to manage the Funds. The Independent Board Members noted that the Sub-Adviser's profitability may be somewhat lower if it had to acquire any such research services directly. |
| | |
| | Based on their review, the Independent Board Members concluded that any indirect benefits received by a Fund Adviser as a result of its relationship with the Funds were reasonable and within acceptable parameters. |
| | |
| F. | Other Considerations |
| | The Independent Board Members did not identify any single factor discussed previously as all important or controlling. The Board Members, including the Independent Board Members, concluded that the terms of each Advisory Agreement were fair and reasonable, that the respective Fund Adviser's fees were reasonable in light of the services provided to each Fund and that the Advisory Agreements be renewed. |
Board Members & Officers
The management of the Funds, including general supervision of the duties performed for the Funds by the Adviser, is the responsibility of the Board of Trustees of the Funds. The number of trustees of the Funds is currently set at eleven. None of the trustees who are not "interested" persons of the Funds (referred to herein as "independent trustees") has ever been a director or employee of, or consultant to, Nuveen or its affiliates. The names and business addresses of the trustees and officers of the Funds, their principal occupations and other affiliations during the past five years, the number of portfolios each oversees and other directorships they hold are set forth below.
| | Name, | | Position(s) Held | | Year First | | Principal | | Number |
| | Year of Birth | | with the Funds | | Elected or | | Occupation(s) | | of Portfolios |
| | & Address | | | | Appointed | | Including other | | in Fund Complex |
| | | | | | and Term(1) | | Directorships | | Overseen by |
| | | | | | | | During Past 5 Years | | Board Member |
| | | | | | | | | | |
| Independent Board Members: | | | | | | |
| | | | | | | | | | |
| ■ | WILLIAM J. SCHNEIDER
1944
333 W. Wacker Drive
Chicago, IL 60606 | | Chairman and
Board Member | | 1996
Class III | | Chairman of Miller-Valentine Partners, a real estate investment company; formerly, Senior Partner and Chief Operating Officer (retired (2004) of Miller-Valentine Group; an owner in several other Miller Valentine entities; Board Member of Med-America Health System, and WDPR Public Radio station; formerly, member, Business Advisory Council, Cleveland Federal Reserve Bank and University of Dayton Business School Advisory Council. | | 196 |
| | | | | | | | | | |
| ■ | JACK B. EVANS
1948
333 W. Wacker Drive
Chicago, IL 60606 | | Board Member | | 1999
Class III | | President, The Hall-Perrine Foundation, a private philanthropic corporation (since 1996); Director and Chairman, United Fire Group, a publicly held company; formerly, President Pro-Tem of the Board of Regents for the State of Iowa University System; Director, Source Media Group; Life Trustee of Coe College; formerly, Director, Alliant Energy; formerly, Director, Federal Reserve Bank of Chicago; formerly, President and Chief Operating Officer, SCI Financial Group, Inc., a regional financial services firm. | | 196 |
| | | | | | | | | | |
| ■ | WILLIAM C. HUNTER
1948
333 W. Wacker Drive
Chicago, IL 60606 | | Board Member | | 2004
Class I | | Dean Emeritus, formerly, Dean, Tippie College of Business, University of Iowa (2006-2012); Director (since 2004) of Xerox Corporation; Director (since 2005), and President (since July 2012) Beta Gamma Sigma, Inc., The International Business Honor Society; Director of Wellmark, Inc. (since 2009); formerly, Dean and Distinguished Professor of Finance, School of Business at the University of Connecticut (2003-2006); previously, Senior Vice President and Director of Research at the Federal Reserve Bank of Chicago (1995-2003); formerly, Director (1997-2007), Credit Research Center at Georgetown University. | | 196 |
| | | | | | | | | | |
| ■ | DAVID J. KUNDERT
1942
333 W. Wacker Drive
Chicago, IL 60606 | | Board Member | | 2005
Class II | | Formerly, Director, Northwestern Mutual Wealth Management Company (2006-2013), retired (since 2004) as Chairman, JPMorgan Fleming Asset Management, President and CEO, Banc One Investment Advisors Corporation, and President, One Group Mutual Funds; prior thereto, Executive Vice President, Banc One Corporation and Chairman and CEO, Banc One Investment Management Group; Regent Emeritus, Member of Investment Committee, Luther College; member of the Wisconsin Bar Association; member of Board of Directors and Chair of Investment Committee, Greater Milwaukee Foundation; member of the Board of Directors (Milwaukee), College Possible. | | 196 |
| | Name, | | Position(s) Held | | Year First | | Principal | | Number |
| | Year of Birth | | with the Funds | | Elected or | | Occupation(s) | | of Portfolios |
| | & Address | | | | Appointed(1) | | During Past 5 Years | | in Fund Complex |
| | | | | | | | | | Overseen by |
| | | | | | | | | | Board Member |
| | | | | | | | | | |
| Independent Board Members (continued): | | | | | | |
| | | | | | | | | | |
| ■ | JOHN K. NELSON
1962
333 W. Wacker Drive
Chicago, IL 60606 | | Board Member | | 2013
Class II | | Member of Board of Directors of Core12 LLC (since 2008), a private firm which develops branding, marketing and communications strategies for clients; Director of The Curran Center for Catholic American Studies (since 2009) and The President's Council, Fordham University (since 2010); formerly, senior external advisor to the financial services practice of Deloitte Consulting LLP (2012- 2014); formerly, Chairman of the Board of Trustees of Marian University (2010 as trustee, 2011-2014 as Chairman); formerly, Chief Executive Officer of ABN AMRO N.V. North America, and Global Head of its Financial Markets Division (2007-2008); prior senior positions held at ABN AMRO include Corporate Executive Vice President and Head of Global Markets-the Americas (2006- 2007), CEO of Wholesale Banking North America and Global Head of Foreign Exchange and Futures Markets (2001-2006), and Regional Commercial Treasurer and Senior Vice President Trading- North America (1996-2001); formerly, Trustee at St. Edmund Preparatory School in New York City. | | 196 |
| | | | | | | | | | |
| ■ | JUDITH M. STOCKDALE
1947
333 W. Wacker Drive
Chicago, IL 60606 | | Board Member | | 1997
Class I | | Board Member, Land Trust Alliance (since 2013) and U.S. Endowment for Forestry and Communities (since 2013); formerly, Executive Director (1994-2012), Gaylord and Dorothy Donnelley Foundation; prior thereto, Executive Director, Great Lakes Protection Fund (1990-1994). | | 196 |
| | | | | | | | | | |
| ■ | CAROLE E. STONE
1947
333 W. Wacker Drive
Chicago, IL 60606 | | Board Member | | 2007
Class I | | Director, Chicago Board Options Exchange, Inc. (since 2006); Director, C2 Options Exchange, Incorporated (since 2009); Director, CBOE Holdings, Inc. (since 2010); formerly, Commissioner, New York State Commission on Public Authority Reform (2005-2010). | | 196 |
| | | | | | | | | | |
| ■ | VIRGINIA L. STRINGER
1944
333 W. Wacker Drive
Chicago, IL 60606 | | Board Member | | 2011
Class I | | Board Member, Mutual Fund Directors Forum; non-profit board member; former governance consultant; former owner, and President Strategic Management Resources, Inc., a management consulting firm; former Member, Governing Board, Investment Company Institute's Independent Directors Council; previously, held several executive positions in general management, marketing and human resources at IBM and The Pillsbury Company; Independent Director, First American Fund Complex (1987-2010) and Chair (1997-2010). | | 196 |
| | | | | | | | | | |
| ■ | TERENCE J. TOTH
1959
333 W. Wacker Drive
Chicago, IL 60606 | | Board Member | | 2008
Class II | | Managing Partner, Promus Capital (since 2008); Director, Fulcrum IT Service LLC (since 2010), Quality Control Corporation (since 2012) and LogicMark LLC (since 2012); formerly, Director, Legal & General Investment Management America, Inc. (2008-2013); formerly, CEO and President, Northern Trust Global Investments (2004-2007); Executive Vice President, Quantitative Management & Securities Lending (2000-2004); prior thereto, various positions with Northern Trust Company (since 1994); member: Chicago Fellowship Board (since 2005), Catalyst Schools of Chicago Board (since 2008) and Mather Foundation Board (since 2012), and a member of its investment committee; formerly, Member, Northern Trust Mutual Funds Board (2005-2007), Northern Trust Global Investments Board (2004-2007), Northern Trust Japan Board (2004-2007), Northern Trust Securities Inc. Board (2003-2007) and Northern Trust Hong Kong Board (1997-2004). | | 196 |
Board Members & Officers (continued)
| | Name, | | Position(s) Held | | Year First | | Principal | | Number |
| | Year of Birth | | with the Funds | | Elected or | | Occupation(s) | | of Portfolios |
| | & Address | | | | Appointed(1) | | Including other Directorships | | in Fund Complex |
| | | | | | | | During Past 5 Years | | Overseen by |
| | | | | | | | | | Board Member |
| | | | | | | | | | |
| Interested Board Members: | | | | | | |
| | | | | | | | | | |
| ■ | WILLIAM ADAMS IV(2)
1955
333 W. Wacker Drive
Chicago, IL 60606 | | Board Member | | 2013
Class II | | Senior Executive Vice President, Global Structured Products (since 2010); formerly, Executive Vice President, U.S. Structured Products, of Nuveen Investments, Inc. (1999-2010); Co-President of Nuveen Fund Advisors, LLC (since 2011); Executive Vice President of Nuveen Securities, LLC; President (since 2011), formerly, Managing Director (2010-2011) of Nuveen Commodities Asset Management, LLC; Board Member of the Chicago Symphony Orchestra and of Gilda's Club Chicago. | | 196 |
| | | | | | | | | | |
| ■ | THOMAS S. SCHREIER, JR.(2)
1962
333 W. Wacker Drive
Chicago, IL 60606 | | Board Member | | 2013
Class III | | Vice Chairman, Wealth Management of Nuveen Investments, Inc. (since 2011); Co-President of Nuveen Fund Advisors, LLC; Chairman of Nuveen Asset Management, LLC (since 2011); Co-Chief Executive Officer of Nuveen Securities, LLC (since 2011); Member of Board of Governors and Chairman's Council of the Investment Company Institute; Director of Allina Health and a member of its Finance, Audit and Investment Committees: formerly, Chief Executive Officer (2000-2010) and Chief Investment Officer (2007-2010) of FAF Advisors, Inc.; formerly, President of First American Funds (2001-2010). | | 196 |
| | | | | | | | | | |
| | Name, | | Position(s) Held | | Year First | | Principal | | Number |
| | Year of Birth | | with the Funds | | Elected or | | Occupation(s) | | of Portfolios |
| | & Address | | | | Appointed(3) | | During Past 5 Years | | in Fund Complex |
| | | | | | | | | | Overseen |
| | | | | | | | | | by Officer |
| | | | | | | | | | |
| Officers of the Funds: | | | | | | | |
| | | | | | | | | | |
| ■ | GIFFORD R. ZIMMERMAN
1956
333 W. Wacker Drive
Chicago, IL 60606 | | Chief
Administrative
Officer | | 1988 | | Managing Director (since 2002), and Assistant Secretary of Nuveen Securities, LLC; Managing Director (since 2004) and Assistant Secretary (since 1994) of Nuveen Investments, Inc.; Managing Director (since 2002), Assistant Secretary (since 1997) and Co-General Counsel (since 2011) of Nuveen Fund Advisors, LLC; Managing Director, Assistant Secretary and Associate General Counsel of Nuveen Asset Management, LLC (since 2011); Managing Director and Assistant Secretary of Symphony Asset Management LLC (since 2003); Vice President and Assistant Secretary of NWQ Investment Management Company, LLC (since 2002), Nuveen Investments Advisers Inc. (since 2002), Santa Barbara Asset Management, LLC (since 2006), and of Winslow Capital Management, LLC, (since 2010); Vice President and Assistant Secretary (since 2013), formerly, Chief Administrative Officer and Chief Compliance Officer (2006-2013) of Nuveen Commodities Asset Management, LLC; Chartered Financial Analyst. | | 197 |
| | | | | | | | | | |
| ■ | CEDRIC H. ANTOSIEWICZ
1962
333 W. Wacker Drive
Chicago, IL 60606 | | Vice President | | 2007 | | Managing Director of Nuveen Securities, LLC. (since 2004); Managing Director of Nuveen Fund Advisors, LLC (since 2014). | | 89 |
| | | | | | | | | | |
| ■ | MARGO L. COOK
1964
333 W. Wacker Drive
Chicago, IL 60606 | | Vice President | | 2009 | | Senior Executive Vice President of Nuveen Investments, Inc.; Executive Vice President, Investment Services of Nuveen Fund Advisors, LLC (since 2011); Managing Director – Investment Services of Nuveen Commodities Asset Management, LLC (since 2011); Co-Chief Executive Officer (since 2015); previously, Executive Vice President (2013-2015) of Nuveen Securities, LLC; Chartered Financial Analyst. | | 197 |
| | Name, | | Position(s) Held | | Year First | | Principal | | Number |
| | Year of Birth | | with the Funds | | Elected or | | Occupation(s) | | of Portfolios |
| | & Address | | | | Appointed(3) | | During Past 5 Years | | in Fund Complex |
| | | | | | | | | | Overseen |
| | | | | | | | | | by Officer |
| | | | | | | | | | |
| Officers of the Funds (continued): | | | | | | |
| | | | | | | | | | |
| ■ | LORNA C. FERGUSON
1945
333 W. Wacker Drive
Chicago, IL 60606 | | Vice President | | 1998 | | Managing Director (since 2004) of Nuveen Investments Holdings, Inc. | | 197 |
| | | | | | | | | | |
| ■ | STEPHEN D. FOY
1954
333 W. Wacker Drive
Chicago, IL 60606 | | Vice President
and Controller | | 1998 | | Managing Director (since 2014), formerly, Senior Vice President (2013-2014) and Vice President (2005-2013) of Nuveen Fund Advisors, LLC; Chief Financial Officer of Nuveen Commodities Asset Management, LLC (since 2010); Certified Public Accountant. | | 197 |
| | | | | | | | | | |
| ■ | SHERRI A. HLAVACEK
1962
333 W. Wacker Drive
Chicago, IL 60606 | | Vice President
and Treasurer | | 2015 | | Executive Vice President (since May 2015, formerly, Managing Director) and Controller of Nuveen Fund Advisors, LLC; Managing Director and Controller of Nuveen Commodities Asset Management, LLC; Executive Vice President (since May 2015, formerly, Managing Director), Treasurer and Controller of Nuveen Asset Management, LLC; Executive Vice President, Principal Financial Officer (since July 2015, formerly, Managing Director), Treasurer and Corporate Controller of Nuveen Investments, Inc.; Executive Vice President (since May 2015, formerly, Managing Director), Treasurer and Corporate Controller of Nuveen Investments Advisers Inc. and Nuveen Investments Holdings, Inc.; Managing Director, Chief Financial Officer and Corporate Controller of Nuveen Securities, LLC; Vice President, Controller and Treasurer of NWQ Investment Management Company, LLC; Vice President and Controller of Santa Barbara Asset Management, LLC, Tradewinds Global Investors, LLC, Symphony Asset Management LLC and Winslow Capital Management, LLC; Certified Public Accountant. | | 197 |
| | | | | | | | | | |
| ■ | WALTER M. KELLY
1970
333 W. Wacker Drive
Chicago, IL 60606 | | Chief Compliance
Officer and
Vice President | | 2003 | | Senior Vice President (since 2008) of Nuveen Investment Holdings, Inc. | | 197 |
| | | | | | | | | | |
| ■ | TINA M. LAZAR
1961
333 W. Wacker Drive
Chicago, IL 60606 | | Vice President | | 2002 | | Senior Vice President of Nuveen Investments Holdings, Inc. and Nuveen Securities, LLC. | | 197 |
| | | | | | | | | | |
| ■ | KEVIN J. MCCARTHY
1966
333 W. Wacker Drive
Chicago, IL 60606 | | Vice President
and Secretary | | 2007 | | Managing Director and Assistant Secretary (since 2008), Nuveen Securities, LLC; Managing Director (since 2008), Assistant Secretary since 2007) and Co-General Counsel (since 2011) of Nuveen Fund Advisors, LLC; Managing Director, Assistant Secretary and Associate General Counsel (since 2011) of Nuveen Asset Management, LLC; Managing Director and Assistant Secretary, Nuveen Investments, Inc.; Vice President (since 2007) and Assistant Secretary of Nuveen Investments Advisers Inc., NWQ Investment Management Company, LLC, Symphony Asset Management LLC, Santa Barbara Asset Management, LLC, and of Winslow Capital Management, LLC. (since 2010); Vice President and Secretary (since 2010) of Nuveen Commodities Asset Management, LLC. | | 197 |
| | | | | | | | | | |
| ■ | KATHLEEN L. PRUDHOMME
1953
901 Marquette Avenue
Minneapolis, MN 55402 | | Vice President and
Assistant Secretary | | 2011 | | Managing Director, Assistant Secretary and Co-General Counsel (since 2011) of Nuveen Fund Advisors, LLC; Managing Director, Assistant Secretary and Associate General Counsel (since 2011) of Nuveen Asset Management, LLC; Managing Director and Assistant Secretary (since 2011) of Nuveen Securities, LLC; formerly, Deputy General Counsel, FAF Advisors, Inc. (2004-2010). | | 197 |
Board Members & Officers (continued)
| | Name, | | Position(s) Held | | Year First | | Principal | | Number |
| | Year of Birth | | with the Funds | | Elected or | | Occupation(s) | | of Portfolios |
| | & Address | | | | Appointed(3) | | During Past 5 Years | | in Fund Complex |
| | | | | | | | | | Overseen |
| | | | | | | | | | by Officer |
| | | | | | | | | | |
| Officers of the Funds (continued): | | | | | | | | |
| | | | | | | | | | |
| ■ | JOEL T. SLAGER
1978
333 W. Wacker Drive
Chicago, IL 60606 | | Vice President and
Assistant Secretary | | 2013 | | Fund Tax Director for Nuveen Funds (since 2013); previously, Vice President of Morgan Stanley Investment Management, Inc., Assistant Treasurer of the Morgan Stanley Funds (from 2010 to 2013). | | 197 |
| (1) | The Board of Trustees is divided into three classes, Class I, Class II, and Class III, with each being elected to serve until the third succeeding annual shareholders' meeting subsequent to its election or thereafter in each case when its respective successors are duly elected or appointed, except two board members are elected by the holders of Preferred Shares to serve until the next annual shareholders' meeting subsequent to its election or thereafter in each case when its respective successors are duly elected or appointed. Ms. Stringer will retire from the Board as of December 31, 2015. The year first elected or appointed represents the year in which the board member was first elected or appointed to any fund in the Nuveen Complex. |
| (2) | "Interested person" as defined in the 1940 Act, by reason of his position with Nuveen Investments, Inc. and certain of its subsidiaries, which are affiliates of the Nuveen Funds. |
| (3) | Officers serve one year terms through August of each year. The year first elected or appointed represents the year in which the Officer was first elected or appointed to any fund in the Nuveen Complex. |
Notes
Notes
Notes
| Nuveen Investments: |
| Serving Investors for Generations |
Since 1898, financial advisors and their clients have relied on Nuveen Investments to provide dependable investment solutions through continued adherence to proven, long-term investing principles. Today, we offer a range of high quality equity and fixed-income solutions designed to be integral components of a well-diversified core portfolio.
Focused on meeting investor needs.Nuveen Investments provides high-quality investment services designed to help secure the long-term goals of institutional and individual investors as well as the consultants and financial advisors who serve them. Nuveen Investments markets a wide range of specialized investment solutions which provide investors access to capabilities of its high-quality boutique investment affiliates—Nuveen Asset Management, Symphony Asset Management, NWQ Investment Management Company, Santa Barbara Asset Management, Tradewinds Global Investors, Winslow Capital Management and Gresham Investment Management. In total, Nuveen Investments managed more than $220 billion as of September 30, 2015.
Find out how we can help you.To learn more about how the products and services of Nuveen Investments may be able to help you meet your financial goals, talk to your financial advisor, or call us at (800) 257-8787. Please read the information provided carefully before you invest. Investors should consider the investment objective and policies, risk considerations, charges and expenses of any investment carefully. Where applicable, be sure to obtain a prospectus, which contains this and other relevant information. To obtain a prospectus, please contact your securities representative or Nuveen Investments, 333 W. Wacker Dr., Chicago, IL 60606. Please read the prospectus carefully before you invest or send money.
Learn more about Nuveen Funds at: www.nuveen.com/cef
Distributed by Nuveen Investments, LLC | 333 West Wacker Drive | Chicago, IL 60606 | www.nuveen.com | |
EAN-C-1015D 12536-INV-Y-12/16