UNITED STATES
SECURITIES AND EXCHANGE COMMISSION
Washington, D.C. 20549
FORMN-CSR
CERTIFIED SHAREHOLDER REPORT OF REGISTERED
MANAGEMENT INVESTMENT COMPANIES
Investment Company Act file number 811-06463
AIM International Mutual Funds (Invesco International Mutual Funds)
(Exact name of registrant as specified in charter)
11 Greenway Plaza, Suite 1000 Houston, Texas 77046
(Address of principal executive offices) (Zip code)
Sheri Morris 11 Greenway Plaza, Suite 1000 Houston, Texas 77046
(Name and address of agent for service)
Registrant’s telephone number, including area code: (713) 626-1919
| | |
Date of fiscal year end: | | 10/31 |
| |
Date of reporting period: | | 10/31/19 |
| Item 1. | Reports to Stockholders. |
| | | | |
| | |
 | | Annual Report to Shareholders | | October 31, 2019 |
| | |
| | Invesco Asia Pacific Growth Fund |
| | Nasdaq: A: ASIAX∎ C: ASICX∎ Y: ASIYX∎ R6: ASISX |

Beginning on January 1, 2021, as permitted by regulations adopted by the Securities and Exchange Commission, paper copies of the Fund’s shareholder reports will no longer be sent by mail, unless you specifically request paper copies of the reports from the Fund or from your financial intermediary, such as a broker-dealer or bank. Instead, the reports will be made available on the Fund’s website, and you will be notified by mail each time a report is posted and provided with a website link to access the report. If you already elected to receive shareholder reports electronically, you will not be affected by this change and you need not take any action. You may elect to receive shareholder reports and other communications from the Fund electronically by contacting your financial intermediary (such as a broker-dealer or bank) or, if you are a direct investor, by enrolling at invesco.com/edelivery. You may elect to receive all future reports in paper free of charge. If you invest through a financial intermediary, you can contact your financial intermediary to request that you continue to receive paper copies of your shareholder reports. If you invest directly with the Fund, you can call (800)959-4246 to let the Fund know you wish to continue receiving paper copies of your shareholder reports. Your election to receive reports in paper will apply to all funds held with your financial intermediary or all funds held with the fund complex if you invest directly with the Fund. 2 Letters to Shareholders 4 Management’s Discussion 4 Performance Summary 6 Long-Term Fund Performance 8 Supplemental Information 10 Schedule of Investments 12 Financial Statements 15 Financial Highlights 16 Notes to Financial Statements 22 Report of Independent Registered Public Accounting Firm 23 Fund Expenses 24 Approval of Investment Advisory andSub-Advisory Contracts 26 Tax InformationT-1 Trustees and Officers
Letters to Shareholders
| | |

Andrew Schlossberg | | Dear Shareholders: This annual report includes information about your Fund, including performance data and a complete list of its investments as of the close of the reporting period. Inside is a discussion of how your Fund was managed and the factors that affected its performance during the reporting period. Despite marked market volatility along the way, most global equity markets produced solid gains for the reporting period. As the reporting period unfolded in the final months of 2018, global equities were reeling from a sharpsell-off. The catalyst for thesell-off was a combination of ongoing trade concerns between the US and China, fears of a global economic slowdown and lower oil prices from a supply glut. Gains posted earlier in 2018 for global equities were erased, while US Treasury bonds, along with government and municipal bonds, rallied as investors fled to “safe haven” assets. |
At the start of 2019, global equity markets rebounded strongly buoyed by more policy from central banks and optimism about a potentialUS-China trade deal. In May,US-China trade concerns and slowing global growth led to a global equitysell-off and rally in US Treasuries. Despite the Maysell-off, domestic equity markets rallied in June in anticipation of a US Federal Reserve (the Fed) interest rate cut and closed the second quarter with modest gains. ContinuedUS-China trade worries and signs of slowing global economic growth left global equity markets largely flat for the third quarter. As the reporting period came to a close in October 2019, a raft of upbeat positive corporate earnings results and a US interest rate cut buoyed domestic equity results with some domestic indices recording record highs.
The Fed, in fact, both raised and lowered the federal funds rate during the reporting period. Given signs of a strong economy, the Fed raised rates in December 2018. In 2019, however, the Fed altered its outlook on further rate hikes leaving rates unchanged for the first half of the year. In July, the Fed lowered interest rates for the first time in 11 years. It again lowered rates in September and once again in October. As the year continues to unfold, we’ll see how the interplay of interest rates, economic data, geopolitics and a host of other factors affect US and overseas equity and fixed income markets.
Investor uncertainty and market volatility, such as we witnessed during the reporting period, are unfortunate facts of life when it comes to investing. That’s why Invesco encourages investors to work with a professional financial adviser who can stress the importance of starting to save and invest early and the importance of adhering to a disciplined investment plan. A financial adviser who knows your unique financial situation, investment goals and risk tolerance can be an invaluable partner as you seek to achieve your financial goals. He or she can offer a long-term perspective when markets are volatile and time-tested advice and guidance when your financial situation or investment goals change.
Visit our website for more information on your investments
Our website, invesco.com/us, offers a wide range of market insights and investment perspectives. On the website, you’ll find detailed information about our funds, including performance, holdings and portfolio manager commentaries. You can access information about your account by completing a simple, secure online registration. To do so, select “Log In” on the right side of the homepage, and then select “Register for Individual Account Access.”
In addition to the resources accessible on our website and through our mobile app, you can obtain timely updates to help you stay informed about the markets and the economy by connecting with Invesco on Twitter, LinkedIn or Facebook. You can access our blog at blog.invesco.us.com. Our goal is to provide you the information you want, when and where you want it.
Finally, I’m pleased to share with you Invesco’s commitment to both the Principles for Responsible Investment and to considering environmental, social and governance issues in our robust investment process. I invite you to learn more at invesco.com/esg.
Have questions?
For questions about your account, contact an Invesco client services representative at 800 959 4246.
All of us at Invesco look forward to serving your investment management needs. Thank you for investing with us.
Sincerely,

Andrew Schlossberg
Head of the Americas,
Senior Managing Director, Invesco Ltd.
2 Invesco Asia Pacific Growth Fund
| | |

Bruce Crockett | | Dear Shareholders: Among the many important lessons I’ve learned in more than 40 years in a variety of business endeavors is the value of a trusted advocate. As independent chair of the Invesco Funds Board, I can assure you that the members of the Board are strong advocates for the interests of investors in Invesco’s mutual funds. We work hard to represent your interests through oversight of the quality of the investment management services your funds receive and other matters important to your investment, including but not limited to: ∎ Ensuring that Invesco offers a diverse lineup of mutual funds that your financial adviser can use to strive to meet your financial needs as your investment goals change over time. ∎ Monitoring how the portfolio management teams of the Invesco funds are performing in light of |
changing economic and market conditions.
| ∎ | Assessing each portfolio management team’s investment performance within the context of the investment strategy described in the fund’s prospectus. |
| ∎ | Monitoring for potential conflicts of interests that may impact the nature of the services that your funds receive. |
We believe one of the most important services we provide our fund shareholders is the annual review of the funds’ advisory andsub-advisory contracts with Invesco Advisers and its affiliates. This review is required by the Investment Company Act of 1940 and focuses on the nature and quality of the services Invesco provides as the adviser to the Invesco funds and the reasonableness of the fees that it charges for those services. Each year, we spend months carefully reviewing information received from Invesco and a variety of independent sources, such as performance and fee data prepared by Lipper, Inc. (a subsidiary of Broadridge Financial Solutions, Inc.), an independent, third-party firm widely recognized as a leader in its field. We also meet with our independent legal counsel and other independent advisers to review and help us assess the information that we have received. Our goal is to assure that you receive quality investment management services for a reasonable fee.
I trust the measures outlined above provide assurance that you have a worthy advocate when it comes to choosing the Invesco Funds.
On behalf of the Board, we look forward to continuing to represent your interests and serving your needs.
Sincerely,

Bruce L. Crockett
Independent Chair
Invesco Funds Board of Trustees
3 Invesco Asia Pacific Growth Fund
Management’s Discussion of Fund Performance
| | | | |
Performance summary | |
For the fiscal year ended October 31, 2019, Class A shares of Invesco Asia Pacific Growth Fund (the Fund), at net asset value (NAV), outperformed the MSCI All Country Asia Pacificex-Japan Index, the Fund’s broad market/style-specific benchmark. Your Fund’s long-term performance appears later in this report. | |
Fund vs. Indexes | |
Total returns, October 31, 2018 to October 31, 2019, at net asset value (NAV). Performance shown does not include applicable contingent deferred sales charges (CDSC) orfront-end sales charges, which would have reduced performance. | |
Class A Shares | | | 17.17 | % |
Class C Shares | | | 16.29 | |
Class Y Shares | | | 17.48 | |
Class R6 Shares | | | 17.70 | |
MSCI All Country Asia Pacificex-Japan Indexq (Broad Market/ Style-Specific Index) | | | 13.89 | |
Lipper Pacific Regionex-Japan Funds Index⬛ (Peer Group Index) | | | 16.71 | |
Source(s):qRIMES Technologies Corp.;⬛Lipper Inc. | | | | |
Market conditions and your Fund
The fiscal year began with global equity markets, particularly the US, declining sharply at the end of 2018 amid rising interest rates, a flattening US Treasury yield curve, signaling a possible recession, and concerns that higher inflation could result in a more restrictive monetary policy. Investors also had concerns over the Brexit negotiations, ongoing trade tensions between the US and China, declining oil prices and fears of slowing economic growth, particularly in the eurozone.
After a relatively calm start at the beginning of 2019, global equity markets faced greater volatility in the second quarter, hampered by ongoing US and China trade issues, potential for new tariffs and slowing global economic growth. Global equity markets, particularly China, declined sharply in May 2019, ending a four-month rally. Trade and tariff issues, which were not limited to the US and China, clouded the outlook for many
global economies. Disagreement within the UK about its withdrawal from the European Union increased uncertainty for the UK and eurozone economies. Following better performance in June, most global equity markets managed modest positive returns for the second quarter of 2019, with developed markets generally outperforming emerging markets. China was an exception, declining during the second quarter.
Weakening global economic data and the ongoing US and China trade conflict contributed to higher market volatility in the third quarter of 2019. During the third quarter, data released showed slowing manufacturing activity and declining business investment, which was evidence that trade tensions were stifling economic growth across both developed and emerging markets. Global recession concerns caused a sharp equitysell-off in August 2019 as investors crowded into asset classes perceived as safe havens, including US Treasuries and gold. In
September 2019, both the US Federal Reserve and European Central Bank cut interest rates, providing a measure of support for risk assets. Growing optimism about a potential trade deal between the US and China also boosted equities in September. However, except for the US and Japan, performance in most regions declined during the third quarter. Uncertainty about the UK’s withdrawal from the European Union continued to weigh on UK and European equities, while political and trade issues affected areas of Latin America and Asia.
Global equity markets gained in October 2019 amid several positive catalysts, including a US interest rate cut, optimism surrounding US and China trade negotiations, and a raft of upbeat corporate results. The UK equity market provided a flat return during October and while domestic politics continued to dominate the region, European markets made modest gains. October was also a positive month for emerging equity markets with all regions recording gains. Despite increased market volatility, global equity indexes, in both developed and emerging markets, ended the fiscal year in positive territory.
Regardless of the macroeconomic environment, we remain focused on ourbottom-up investment approach of identifying attractive companies that fit our earnings, quality and valuation (EQV) process.
The Fund’s relative outperformance versus the MSCI All Country Asia Pacificex-Japan Index during the fiscal year was primarily driven by stock selection and meaningful overweight exposure to the consumer staples sector. Within the sector, China-based spirits producersWu-liangye YibinandKweichow Moutaicontributed to both the Fund’s absolute and relative performance. The companies benefited from the consumption upgrade
| | | | |
Portfolio Composition | | | | |
By sector % of total net assets | |
| |
Financials | | | 20.21 | % |
Information Technology | | | 15.41 | |
Real Estate | | | 15.35 | |
Consumer Discretionary | | | 12.86 | |
Consumer Staples | | | 12.47 | |
Communication Services | | | 5.36 | |
Industrials | | | 3.77 | |
Other Sectors, Each Less than 2% of Net Assets | | | 3.77 | |
Money Market Funds Plus Other Assets Less Liabilities | | | 10.80 | |
| | | | |
Top 10 Equity Holdings* | | | | |
% of total net assets | |
| |
1. PT Bank Central Asia Tbk | | | 4.45 | % |
2. United Overseas Bank Ltd. | | | 4.17 | |
3. Sunny Optical Technology Group Co., Ltd. | | | 3.92 | |
4. Yum China Holdings, Inc. | | | 3.75 | |
5. Broadcom, Inc. | | | 3.73 | |
6. Swire Properties Ltd. | | | 3.71 | |
7. Taiwan Semiconductor Manufacturing Co., Ltd. | | | 3.64 | |
8. Samsung Electronics Co., Ltd. | | | 3.59 | |
9. PT Telekomunikasi Indonesia (Persero) Tbk | | | 3.41 | |
10. CK Asset Holdings Ltd. | | | 3.39 | |
| | | | |
Total Net Assets | | $ | 731.3 million | |
| |
Total Number of Holdings* | | | 41 | |
The Fund’s holdings are subject to change, and there is no assurance that the Fund will continue to hold any particular security.
*Excluding money market fund holdings, if any.
Data presented here are as of October 31, 2019.
4 Invesco Asia Pacific Growth Fund
cycle in China with the popularity of its premium Baiju brands. Strong stock selection in the information technology sector also contributed to the Fund’s relative results. Strength was seen inSunny Optical TechnologyandBroad-com. An underweight exposure to the energy sector relative to the broad market/style-specific index added to the Fund’s relative return. On a geographic basis, strong stock selection in China was the largest contributor to the Fund’s relative performance. The Fund’s holdings in Indonesia and South Korea outperformed those of the broad market/style-specific index and also contributed to relative results. Overweight exposure to Indonesia and underweight exposure to South Korea benefited the Fund’s relative performance as well.
In contrast, stock selection in the real estate sector detracted from the Fund’s relative performance during the fiscal year. Hong Kong-based companySwire Propertieswas one of the Fund’s largest individual detractors from Fund results during the fiscal year. The Fund’s holdings in the financials sector underperformed those of the broad market/style-specific index and hampered relative results. Thailand-basedKasikornbankwas a notable detractor within the sector. We trimmed our position in the bank during the fiscal year due to concerns about increased structural and cyclical pressures. Geographically, stock selection in Hong Kong was a key detractor from the Fund’s relative performance. Stock selection and overweight exposure in the weaker Malaysian market was a drag on the Fund’s relative return. In a rising market environment, the Fund’s cash exposure (which averaged around 11% during the fiscal year) detracted from the Fund’s performance relative to the broad market/ style-specific benchmark. It is important to note that cash is a residual of ourbottom-up investment process and not the result of anytop-down tactical asset allocation or risk-management allocation decision.
During the fiscal year, we continued to look for opportunities to improve the growth potential and quality of the Fund’s portfolio by adding companies based on our EQV outlook for each company. We added several new holdings, including China-basede-commerce companyAlibaba, online provider of consumer services including food deliveryMeituan Dianpingand Philippines-based banking companyBDO Unibank. We also added to several existing holdings, including China-based companiesYum China
and Sunny Optical Technology. We sold several holdings, includingChina Mobile,Want Want ChinaandLee & Man Paper Manufacturingdue to deteriorating fundamentals. We also reduced our existing positions in Broadcom and Kweichow Moutai during the fiscal year.
As always, we continue to look for high-quality growth companies that we believe exhibit the following characteristics: strong organic revenue growth; high returns on capital; pricing power; strong balance sheets; cash generation; and reasonable valuations. In addition, we continue to favor companies that we believe are able to consistently generate cash during weak economic environments. We believe that this balancedEQV-focused approach may help deliver attractive returns over the long term.
We thank you for your continued investment in Invesco Asia Pacific Growth Fund.
Portfolio managers:
Brent Bates
Shuxin (Steve) Cao
Mark Jason
The views and opinions expressed in management’s discussion of Fund performance are those of Invesco Advisers, Inc. These views and opinions are subject to change at any time based on factors such as market and economic conditions. These views and opinions may not be relied upon as investment advice or recommendations, or as an offer for a particular security. The information is not a complete analysis of every aspect of any market, country, industry, security or the Fund. Statements of fact are from sources considered reliable, but Invesco Advisers, Inc. makes no representation or warranty as to their completeness or accuracy. Although historical performance is no guarantee of future results, these insights may help you understand our investment management philosophy.
See important Fund and, if applicable, index disclosures later in this report.
5 Invesco Asia Pacific Growth Fund
Your Fund’s Long-Term Performance
Results of a $10,000 Investment – Oldest Share Class(es)
Fund and index data from 10/31/09
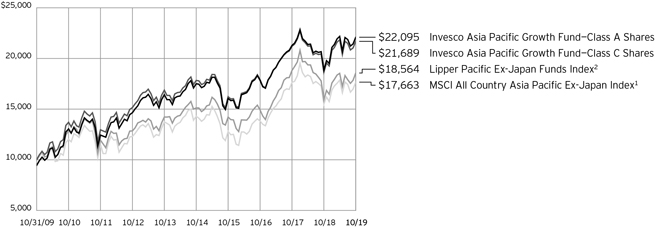
1 Source: RIMES Technologies Corp.
2 Source: Lipper Inc.
Past performance cannot guarantee comparable future results.
The data shown in the chart include reinvested distributions, applicable sales charges and Fund expenses including
management fees. Index results include reinvested dividends, but they do not reflect sales charges. Performance of the peer group, if applicable, reflects fund expenses and management fees; performance
of a market index does not. Performance shown in the chart does not reflect deduction of taxes a shareholder would pay on Fund distributions or sale of Fund shares.
6 Invesco Asia Pacific Growth Fund
| | | | | | |
| | | Average Annual Total Returns | |
| | As of 10/31/19, including maximum applicable sales charges | |
| | |
| | | Class A Shares | | | | |
| | | Inception (11/3/97) | | | 8.49% | |
| | | 10 Years | | | 8.25 | |
| | | 5 Years | | | 3.59 | |
| | | 1 Year | | | 10.74 | |
| | |
| | | Class C Shares | | | | |
| | | Inception (11/3/97) | | | 8.41% | |
| | | 10 Years | | | 8.05 | |
| | | 5 Years | | | 3.99 | |
| | | 1 Year | | | 15.29 | |
| | |
| | | Class Y Shares | | | | |
| | | Inception (10/3/08) | | | 10.88% | |
| | | 10 Years | | | 9.14 | |
| | | 5 Years | | | 5.03 | |
| | | 1 Year | | | 17.48 | |
| | |
| | | Class R6 Shares | | | | |
| | | 10 Years | | | 8.98% | |
| | | 5 Years | | | 5.00 | |
| | 1 Year | | | 17.70 | |
| | | | | | |
| | | Average Annual Total Returns | |
| | As of 9/30/19, the most recent calendar quarter end, including maximum applicable sales charges | |
| | |
| | | Class A Shares | | | | |
| | | Inception (11/3/97) | | | 8.37% | |
| | | 10 Years | | | 7.92 | |
| | | 5 Years | | | 3.45 | |
| | | 1 Year | | | –2.01 | |
| | |
| | | Class C Shares | | | | |
| | | Inception (11/3/97) | | | 8.29% | |
| | | 10 Years | | | 7.72 | |
| | | 5 Years | | | 3.84 | |
| | | 1 Year | | | 1.97 | |
| | |
| | | Class Y Shares | | | | |
| | | Inception (10/3/08) | | | 10.65% | |
| | | 10 Years | | | 8.80 | |
| | | 5 Years | | | 4.88 | |
| | | 1 Year | | | 3.96 | |
| | |
| | | Class R6 Shares | | | | |
| | | 10 Years | | | 8.65% | |
| | | 5 Years | | | 4.84 | |
| | 1 Year | | | 4.17 | |
Class R6 shares incepted on April 4, 2017. Performance shown prior to that date is that of Class A shares and includes the12b-1 fees applicable to Class A shares.
The performance data quoted represent past performance and cannot guarantee comparable future results; current performance may be lower or higher. Please visit invesco.com/performance for the most recentmonth-end performance. Performance figures reflect reinvested distributions, changes in net asset value and the effect of the maximum sales charge unless otherwise stated. Performance figures do not reflect deduction of taxes a shareholder would pay on Fund distributions or sale of Fund shares. Investment return and principal value will fluctuate so that you may have a gain or loss when you sell shares.
The net annual Fund operating expense ratio set forth in the most recent Fund prospectus as of the date of this report for Class A, Class C, Class Y and Class R6 shares was 1.46%, 2.21%, 1.21% and 1.03%, respectively.1 The total annual Fund operating expense ratio set forth in the most recent Fund prospectus as of the date of this report for Class A, Class C, Class Y and Class R6 shares was 1.48%, 2.23%, 1.23% and 1.05%, respectively. The expense ratios presented above may vary from the expense
ratios presented in other sections of this report that are based on expenses incurred during the period covered by this report.
Class A share performance reflects the maximum 5.50% sales charge, and Class C share performance reflects the applicable contingent deferred sales charge (CDSC) for the period involved. The CDSC on Class C shares is 1% for the first year after purchase. Class Y shares and Class R6 shares do not have afront-end sales charge or a CDSC; therefore, performance is at net asset value.
The performance of the Fund’s share classes will differ primarily due to different sales charge structures and class expenses.
Fund performance reflects any applicable fee waivers and/or expense reimbursements. Had the adviser not waived fees and/or reimbursed expenses currently or in the past, returns would have been lower. See current prospectus for more information.
| 1 | Total annual Fund operating expenses after any contractual fee waivers and/or expense reimbursements by the adviser in effect through at least June 30, 2021. See current prospectus for more information. |
7 Invesco Asia Pacific Growth Fund
Invesco Asia Pacific Growth Fund’s investment objective is long-term growth of capital.
| ∎ | Unless otherwise stated, information presented in this report is as of October 31, 2019, and is based on total net assets. |
| ∎ | Unless otherwise noted, all data provided by Invesco. |
| ∎ | To access your Fund’s reports/prospectus, visit invesco.com/fundreports. |
About share classes
| ∎ | Class Y sharesare available only to certain investors. Please see the prospectus for more information. |
| ∎ | Class R6 sharesare available for use by retirement plans that meet certain standards and for institutional investors. Class R6 shares are also available through intermediaries that have established an agreement with Invesco Distributors, Inc. to make such shares available for use in retail omnibus accounts. Please see the prospectus for more information. |
Principal risks of investing in the Fund
| ∎ | Asia pacific region risk(ex-Japan). The level of development of the economies of countries in the Asia Pacific region varies greatly. Furthermore, since the economies of the countries in the region are largely intertwined, if an economic recession is experienced by any of these countries, it will likely adversely impact the economic performance of other countries in the region. Certain economies in the region may be adversely affected by increased competition, high inflation rates, undeveloped financial services sectors, currency fluctuations or restrictions, political and social instability and increased economic volatility. |
| | Investments in companies located or operating in China involve risks not associated with investments in Western nations, such as nationalization, expropriation, or confiscation of property; difficulty in obtaining and/or enforcing judgments; alteration or discontinuation of economic reforms; military conflicts, either internal or with other countries; inflation, currency fluctuations and fluctuations in inflation and interest rates that may have negative effects on the economy and securities markets of China; and China’s dependency on the economies of other Asian countries, many of which are developing countries. |
| | Export growth continues to be a major driver of China’s rapid economic growth. As a result, a reduction in spending on Chinese products and services, the institution of additional tariffs or other trade barriers, including as a result of heightened trade tensions between China and the United States, or a downturn in any of the economies of China’s key trading partners may have an adverse impact on the Chinese economy. In addition, certain securities issued by companies located or operating in China, such as ChinaA-shares, are subject to trading restrictions, quota limitations, and clearing and settlement risks. |
| ∎ | Depositary receipts risk.Investing in depositary receipts involves the same risks as direct investments in foreign securities. In addition, the underlying issuers of certain depositary receipts are under no obligation to distribute shareholder communications or pass through any voting rights with respect to the deposited securities to the holders of such receipts. The Fund may therefore receive less timely information or have less control than if it invested directly in the foreign issuer. |
| ∎ | Derivatives risk.The value of a derivative instrument depends largely on (and is derived from) the value of an underlying security, currency, commodity, interest rate, index or other asset (each referred to as an underlying asset). In addition to risks relating to the underlying assets, the use of derivatives may include other, possibly greater, risks, including counterparty, leverage and liquidity risks. Counterparty risk is the risk that the counterparty to the derivative contract will default on its obligation to pay the Fund the amount owed or otherwise perform under the derivative contract. Derivatives create leverage risk because they do not require payment up front equal to the economic exposure created by holding a position in the derivative. As a result, an adverse change in the value of the |
| | underlying asset could result in the Fund sustaining a loss that is substantially greater than the amount invested in the derivative or the anticipated value of the underlying asset, which may make the Fund’s returns more volatile and increase the risk of loss. Derivative instruments may also be less liquid than more traditional investments and the Fund may be unable to sell or close out its derivative positions at a desirable time or price. This risk may be more acute under adverse market conditions, during which the Fund may be most in need of liquidating its derivative positions. Derivatives may also be harder to value, less tax efficient and subject to changing government regulation that could impact the Fund’s ability to use certain derivatives or their cost. Derivatives strategies may not always be successful. For example, derivatives used for hedging or to gain or limit exposure to a particular market segment may not provide the expected benefits, particularly during adverse market conditions. |
| ∎ | Emerging markets securities risk. Emerging markets (also referred to as developing markets) are generally subject to greater market volatility, political, social and economic instability, uncertain trading markets and more governmental limitations on foreign investment than more developed markets. In addition, companies operating in emerging markets may be subject to lower trading volume and greater price fluctuations than companies in more developed markets. Securities law and the enforcement of systems of taxation in many emerging market countries may change quickly and unpredictably. In addition, investments in emerging markets securities may be subject to additional transaction costs, delays in settlement procedures, and lack of timely information. |
| ∎ | Foreign securities risk.The Fund’s foreign investments may be adversely affected by political and social instability, changes in economic or taxation |
|
This report must be accompanied or preceded by a currently effective Fund prospectus, which contains more complete information, including sales charges and expenses. Investors should read it carefully before investing. |
NOT FDIC INSURED | MAY LOSE VALUE | NO BANK GUARANTEE
8 Invesco Asia Pacific Growth Fund
| | policies, difficulty in enforcing obligations, decreased liquidity or increased volatility. Foreign investments also involve the risk of the possible seizure, nationalization or expropriation of the issuer or foreign deposits (in which the Fund could lose its entire investments in a certain market) and the possible adoption of foreign governmental restrictions such as exchange controls. Unless the Fund has hedged its foreign securities risk, foreign securities risk also involves the risk of negative foreign currency rate fluctuations, which may cause the value of securities denominated in such foreign currency (or other instruments through which the Fund has exposure to foreign currencies) to decline in value. Currency exchange rates may fluctuate significantly over short periods of time. Currency hedging strategies, if used, are not always successful. |
| ∎ | Geographic focus risk. The Fund may from time to time invest a substantial amount of its assets in securities of issuers located in a single country or a limited number of countries. Adverse economic, political or social conditions in those countries may therefore have a significant negative impact on the Fund’s investment performance. |
| ∎ | Growth investing risk. Growth stocks tend to be more expensive relative to the issuing company’s earnings or assets compared with other types of stock. As a result, they tend to be more sensitive to changes in, or investors’ expectations of, the issuing company’s earnings and can be more volatile. |
| ∎ | Management risk. The Fund is actively managed and depends heavily on the Adviser’s judgment about markets, interest rates or the attractiveness, relative values, liquidity, or potential appreciation of particular investments made for the Fund’s portfolio. The Fund could experience losses if these judgments prove to be incorrect. Additionally, legislative, regulatory, or tax developments may adversely affect management of the Fund and, therefore, the ability of the Fund to achieve its investment objective. |
| ∎ | Market risk. The market values of the Fund’s investments, and therefore the value of the Fund’s shares, will go up and down, sometimes rapidly or unpredictably. Market risk may affect a single issuer, industry or section of the economy, or it may affect the market as a whole. Individual stock |
| | prices tend to go up and down more dramatically than those of certain other types of investments, such as bonds. During a general downturn in the financial markets, multiple asset classes may decline in value. When markets perform well, there can be no assurance that specific investments held by the Fund will rise in value. |
| ∎ | Preferred securities risk. Preferred securities are subject to issuer-specific and market risks applicable generally to equity securities. Preferred securities also may be subordinated to bonds or other debt instruments, subjecting them to a greater risk ofnon-payment, may be less liquid than many other securities, such as common stocks, and generally offer no voting rights with respect to the issuer. |
| ∎ | Sector focus risk. The Fund may from time to time invest a significant amount of its assets (i.e. over 25%) in one market sector or group of related industries. In this event, the Fund’s performance will depend to a greater extent on the overall condition of the sector or group of industries and there is increased risk that the Fund will lose significant value if conditions adversely affect that sector or group of industries. |
| ∎ | Small- andmid-capitalization companies risks. Small- andmid-capitalization companies tend to be more vulnerable to changing market conditions, may have little or no operating history or track record of success, and may have more limited product lines and markets, less experienced management and fewer financial resources than larger companies. These companies’ securities may be more volatile and less liquid than those of more established companies, and their returns may vary, sometimes significantly, from the overall securities market. |
About indexes used in this report
| ∎ | TheMSCI All Country Asia Pacificex-Japan Indexis an unmanaged index considered representative of Asia Pacific region stock markets, excluding Japan. The index is computed using the net return, which withholds applicable taxes fornon-resident investors. |
| ∎ | TheLipper Pacific Regionex-Japan Funds Indexis an unmanaged index considered representative of Pacific regionex-Japan funds tracked by Lipper. |
| ∎ | The Fund is not managed to track the performance of any particular index, including the index(es) described here, and consequently, the performance of the Fund may deviate significantly from the performance of the index(es). |
| ∎ | A direct investment cannot be made in an index. Unless otherwise indicated, index results include reinvested dividends, and they do not reflect sales charges. Performance of the peer group, if applicable, reflects fund expenses; performance of a market index does not. |
Other information
| ∎ | The returns shown in management’s discussion of Fund performance are based on net asset values (NAVs) calculated for shareholder transactions. Generally accepted accounting principles require adjustments to be made to the net assets of the Fund at period end for financial reporting purposes, and as such, the NAVs for shareholder transactions and the returns based on those NAVs may differ from the NAVs and returns reported in the Financial Highlights. |
| ∎ | Industry classifications used in this report are generally according to the Global Industry Classification Standard, which was developed by and is the exclusive property and a service mark of MSCI Inc. and Standard & Poor’s. |
9 Invesco Asia Pacific Growth Fund
Schedule of Investments
October 31, 2019
| | | | | | | | |
| | | Shares | | | Value | |
| |
Common Stocks & Other Equity Interests-89.20% | |
Australia-2.34% | | | | | | | | |
Computershare Ltd. | | | 348,886 | | | $ | 3,797,093 | |
| |
CSL Ltd. | | | 75,544 | | | | 13,296,577 | |
| |
| | | | | | | 17,093,670 | |
| |
| | |
China-26.78% | | | | | | | | |
Alibaba Group Holding Ltd., ADR(a) | | | 84,980 | | | | 15,013,417 | |
| |
Angel Yeast Co., Ltd., A Shares | | | 2,554,150 | | | | 10,944,024 | |
| |
China Mengniu Dairy Co. Ltd.(a) | | | 6,031,000 | | | | 24,099,576 | |
| |
Henan Shuanghui Investment & Development Co., Ltd., A Shares | | | 3,278,084 | | | | 13,842,271 | |
| |
Industrial & Commercial Bank of China Ltd., H Shares | | | 10,736,000 | | | | 7,716,366 | |
| |
Kweichow Moutai Co., Ltd., A Shares | | | 33,927 | | | | 5,682,695 | |
| |
Meituan Dianping, B Shares(a) | | | 1,371,400 | | | | 16,385,362 | |
| |
Minth Group Ltd. | | | 1,286,000 | | | | 4,539,756 | |
| |
New Oriental Education & Technology Group, Inc., ADR(a) | | | 69,138 | | | | 8,438,984 | |
| |
Qingdao Port International Co., Ltd., H Shares(b) | | | 6,409,000 | | | | 3,664,497 | |
| |
Sunny Optical Technology Group Co., Ltd. | | | 1,807,100 | | | | 28,664,766 | |
| |
Weibo Corp., ADR(a) | | | 137,381 | | | | 6,757,771 | |
| |
Wuliangye Yibin Co., Ltd., A Shares | | | 1,212,460 | | | | 22,667,403 | |
| |
Yum China Holdings, Inc. | | | 645,384 | | | | 27,428,820 | |
| |
| | | | | | | 195,845,708 | |
| |
| | |
Hong Kong-11.30% | | | | | | | | |
CK Asset Holdings Ltd. | | | 3,560,160 | | | | 24,772,345 | |
| |
CK Hutchison Holdings Ltd. | | | 1,409,160 | | | | 13,012,681 | |
| |
Hongkong Land Holdings Ltd. | | | 3,222,100 | | | | 17,680,239 | |
| |
Swire Properties Ltd. | | | 8,678,600 | | | | 27,167,009 | |
| |
| | | | | | | 82,632,274 | |
| |
| | |
Indonesia-12.28% | | | | | | | | |
PT Bank Central Asia Tbk | | | 14,538,400 | | | | 32,505,768 | |
| |
PT Bank Mandiri (Persero) Tbk | | | 41,342,500 | | | | 20,634,137 | |
| |
PT Pakuwon Jati Tbk | | | 264,401,600 | | | | 11,735,752 | |
| |
PT Telekomunikasi Indonesia (Persero) Tbk | | | 85,773,000 | | | | 24,941,294 | |
| |
| | | | | | | 89,816,951 | |
| |
| | |
Macau-2.45% | | | | | | | | |
Galaxy Entertainment Group Ltd. | | | 2,629,000 | | | | 17,948,619 | |
| |
| | |
Malaysia-4.37% | | | | | | | | |
Bursa Malaysia Bhd. | | | 11,494,850 | | | | 16,622,001 | |
| |
Public Bank Bhd | | | 3,158,700 | | | | 15,324,673 | |
| |
| | | | | | | 31,946,674 | |
| |
| | | | | | | | |
| | | Shares | | | Value | |
| |
Philippines-5.15% | | | | | | | | |
BDO Unibank, Inc. | | | 4,628,990 | | | $ | 14,083,853 | |
| |
Metro Pacific Investments Corp. | | | 56,295,300 | | | | 5,303,881 | |
| |
SM Investments Corp. | | | 537,066 | | | | 10,875,221 | |
| |
SM Prime Holdings, Inc. | | | 9,593,000 | | | | 7,364,135 | |
| |
| | | | | | | 37,627,090 | |
| |
| | |
Singapore-7.39% | | | | | | | | |
Keppel REIT | | | 26,543,700 | | | | 23,562,638 | |
| |
United Overseas Bank Ltd. | | | 1,549,300 | | | | 30,500,430 | |
| |
| | | | | | | 54,063,068 | |
| |
| | |
South Korea-4.62% | | | | | | | | |
NAVER Corp. | | | 53,315 | | | | 7,504,795 | |
| |
Samsung Electronics Co., Ltd. | | | 608,392 | | | | 26,295,373 | |
| |
| | | | | | | 33,800,168 | |
| |
| | |
Taiwan-3.64% | | | | | | | | |
Taiwan Semiconductor Manufacturing Co., Ltd. | | | 2,742,464 | | | | 26,643,806 | |
| |
| | |
Thailand-1.28% | | | | | | | | |
Kasikornbank PCL, Foreign Shares | | | 1,107,000 | | | | 5,113,724 | |
| |
Thai Stanley Electric PCL, Foreign Shares | | | 818,700 | | | | 4,269,785 | |
| |
| | | | | | | 9,383,509 | |
| |
| | |
United States-5.69% | | | | | | | | |
Amcor PLC, CDI | | | 1,502,055 | | | | 14,301,705 | |
| |
Broadcom, Inc. | | | 93,153 | | | | 27,279,856 | |
| |
| | | | | | | 41,581,561 | |
| |
| | |
Vietnam-1.91% | | | | | | | | |
Vietnam Dairy Products JSC | | | 2,494,692 | | | | 13,939,528 | |
| |
Total Common Stocks & Other Equity Interests
(Cost $463,702,569) | | | | 652,322,626 | |
| |
| | |
Money Market Funds-10.58% | | | | | | | | |
Invesco Government & Agency Portfolio, Institutional Class, 1.71%(c) | | | 27,069,917 | | | | 27,069,917 | |
| |
Invesco Liquid Assets Portfolio, Institutional Class, 1.90%(c) | | | 19,334,982 | | | | 19,342,717 | |
| |
Invesco Treasury Portfolio, Institutional Class, 1.66%(c) | | | 30,937,048 | | | | 30,937,048 | |
| |
Total Money Market Funds (Cost $77,344,060) | | | | | | | 77,349,682 | |
| |
TOTAL INVESTMENTS IN SECURITIES-99.78%
(Cost $541,046,629) | | | | 729,672,308 | |
| |
OTHER ASSETS LESS LIABILITIES-0.22% | | | | 1,638,973 | |
| |
NET ASSETS–100.00% | | | | | | $ | 731,311,281 | |
| |
See accompanying Notes to Financial Statements which are an integral part of the financial statements.
10 Invesco Asia Pacific Growth Fund
Investment Abbreviations:
| | | | |
| ADR | | - American Depositary Receipt | | |
| CDI | | - CREST Depository Interest | | |
| REIT | | - Real Estate Investment Trust | | |
Notes to Schedule of Investments:
| (a) | Non-income producing security. |
| (b) | Security purchased or received in a transaction exempt from registration under the Securities Act of 1933, as amended (the “1933 Act”). The security may be resold pursuant to an exemption from registration under the 1933 Act, typically to qualified institutional buyers. The value of this security at October 31, 2019 represented less than 1% of the Fund’s Net Assets. |
| (c) | The money market fund and the Fund are affiliated by having the same investment adviser. The rate shown is the7-day SEC standardized yield as of October 31, 2019. |
See accompanying Notes to Financial Statements which are an integral part of the financial statements.
11 Invesco Asia Pacific Growth Fund
Statement of Assets and Liabilities
October 31, 2019
| | | | |
Assets: | | | | |
| |
Investments in securities, at value
(Cost $463,702,569) | | $ | 652,322,626 | |
| |
Investments in affiliated money market funds, at value (Cost $77,344,060) | | | 77,349,682 | |
| |
Foreign currencies, at value
(Cost $1,906,291) | | | 1,918,645 | |
| |
Receivable for: | | | | |
Investments sold | | | 709,505 | |
| |
Dividends | | | 521,267 | |
| |
Fund shares sold | | | 216,966 | |
| |
Investment for trustee deferred compensation and retirement plans | | | 137,609 | |
| |
Other assets | | | 25,667 | |
| |
Total assets | | | 733,201,967 | |
| |
| |
Liabilities: | | | | |
Payable for: | | | | |
Fund shares reacquired | | | 474,391 | |
| |
Accrued foreign taxes | | | 649,558 | |
| |
Accrued fees to affiliates | | | 488,832 | |
| |
Accrued trustees’ and officers’ fees and benefits | | | 1,869 | |
| |
Accrued other operating expenses | | | 127,103 | |
| |
Trustee deferred compensation and retirement plans | | | 148,933 | |
| |
Total liabilities | | | 1,890,686 | |
| |
Net assets applicable to shares outstanding | | $ | 731,311,281 | |
| |
| |
Net assets consist of: | | | | |
Shares of beneficial interest | | $ | 495,072,301 | |
| |
Distributable earnings | | | 236,238,980 | |
| |
| | $ | 731,311,281 | |
| |
| | | | |
Net Assets: | | | | |
Class A | | $ | 433,120,307 | |
| |
Class C | | $ | 31,408,966 | |
| |
Class Y | | $ | 170,249,272 | |
| |
Class R6 | | $ | 96,532,736 | |
| |
|
Shares outstanding, no par value, with an unlimited number of shares authorized: | |
Class A | | | 13,063,704 | |
| |
Class C | | | 1,038,200 | |
| |
Class Y | | | 5,119,538 | |
| |
Class R6 | | | 2,901,516 | |
| |
Class A: | | | | |
Net asset value per share | | $ | 33.15 | |
| |
Maximum offering price per share
(Net asset value of $33.15 ÷ 94.50%) | | $ | 35.08 | |
| |
Class C: | | | | |
Net asset value and offering price per share | | $ | 30.25 | |
| |
Class Y: | | | | |
Net asset value and offering price per share | | $ | 33.25 | |
| |
Class R6: | | | | |
Net asset value and offering price per share | | $ | 33.27 | |
| |
See accompanying Notes to Financial Statements which are an integral part of the financial statements.
12 Invesco Asia Pacific Growth Fund
Statement of Operations
For the year ended October 31, 2019
| | | | |
Investment income: | | | | |
Dividends (net of foreign withholding taxes of $1,115,104) | | $ | 16,955,886 | |
| |
Dividends from affiliated money market funds | | | 1,774,968 | |
| |
Total investment income | | | 18,730,854 | |
| |
| |
Expenses: | | | | |
Advisory fees | | | 6,787,064 | |
| |
Administrative services fees | | | 118,574 | |
| |
Custodian fees | | | 156,788 | |
| |
Distribution fees: | | | | |
| |
Class A | | | 1,077,149 | |
| |
Class C | | | 399,236 | |
| |
Transfer agent fees - A, C and Y | | | 1,372,752 | |
| |
Transfer agent fees - R6 | | | 8,390 | |
| |
Trustees’ and officers’ fees and benefits | | | 28,931 | |
| |
Registration and filing fees | | | 79,038 | |
| |
Reports to shareholders | | | 81,667 | |
| |
Professional services fees | | | 64,991 | |
| |
Other | | | 15,595 | |
| |
Total expenses | | | 10,190,175 | |
| |
Less: Fees waived and/or expense offset arrangement(s) | | | (98,908 | ) |
| |
Net expenses | | | 10,091,267 | |
| |
Net investment income | | | 8,639,587 | |
| |
| |
Realized and unrealized gain (loss) from: | | | | |
Net realized gain (loss) from: | | | | |
Investment securities (net of foreign taxes of $642,201) | | | 40,057,832 | |
| |
Foreign currencies | | | (226,126 | ) |
| |
| | | 39,831,706 | |
| |
Change in net unrealized appreciation of: Investment securities (net of foreign taxes of $1,984,454) | | | 67,973,561 | |
| |
Foreign currencies | | | 22,147 | |
| |
| | | 67,995,708 | |
| |
Net realized and unrealized gain | | | 107,827,414 | |
| |
Net increase in net assets resulting from operations | | $ | 116,467,001 | |
| |
See accompanying Notes to Financial Statements which are an integral part of the financial statements.
13 Invesco Asia Pacific Growth Fund
Statement of Changes in Net Assets
For the years ended October 31, 2019 and 2018
| | | | | | | | |
| | | 2019 | | | 2018 | |
| |
| | |
Operations: | | | | | | | | |
| | |
Net investment income | | $ | 8,639,587 | | | $ | 9,891,947 | |
| |
Net realized gain | | | 39,831,706 | | | | 38,916,398 | |
| |
Change in net unrealized appreciation (depreciation) | | | 67,995,708 | | | | (141,623,811 | ) |
| |
Net increase (decrease) in net assets resulting from operations | | | 116,467,001 | | | | (92,815,466 | ) |
| |
| | |
Distributions to shareholders from distributable earnings: | | | | | | | | |
| | |
Class A | | | (26,750,392 | ) | | | (37,717,459 | ) |
| |
Class B | | | – | | | | (143,824 | ) |
| |
Class C | | | (3,425,301 | ) | | | (5,230,928 | ) |
| |
Class Y | | | (12,016,731 | ) | | | (20,892,067 | ) |
| |
Class R6 | | | (6,512,306 | ) | | | (9,802,768 | ) |
| |
Total distributions from distributable earnings | | | (48,704,730 | ) | | | (73,787,046 | ) |
| |
| | |
Share transactions–net: | | | | | | | | |
| | |
Class A | | | (1,605,418 | ) | | | (10,135,034 | ) |
| |
Class B | | | – | | | | (2,153,316 | ) |
| |
Class C | | | (25,531,581 | ) | | | (4,250,596 | ) |
| |
Class Y | | | (18,397,911 | ) | | | (53,967,485 | ) |
| |
Class R6 | | | 881,498 | | | | (13,134,106 | ) |
| |
Net increase (decrease) in net assets resulting from share transactions | | | (44,653,412 | ) | | | (83,640,537 | ) |
| |
Net increase (decrease) in net assets | | | 23,108,859 | | | | (250,243,049 | ) |
| |
| | |
Net assets: | | | | | | | | |
| | |
Beginning of year | | | 708,202,422 | | | | 958,445,471 | |
| |
End of year | | $ | 731,311,281 | | | $ | 708,202,422 | |
| |
See accompanying Notes to Financial Statements which are an integral part of the financial statements.
14 Invesco Asia Pacific Growth Fund
Financial Highlights
The following schedule presents financial highlights for a share of the Fund outstanding throughout the periods indicated.
| | | | | | | | | | | | | | | | | | | | | | | | | | | | | | | | | | | | | | | | | | | | | | | | | | | | | | | | |
| | | Net asset
value,
beginning
of period | | | Net
investment
income(a) | | | Net gains
(losses)
on securities
(both
realized and
unrealized) | | | Total from
investment
operations | | | Dividends
from net
investment
income | | | Distributions
from net
realized
gains | | | Total
distributions | | | Net asset
value, end
of period | | | Total
return (b) | | | Net assets,
end of period
(000’s omitted) | | | Ratio of
expenses
to average
net assets
with fee waivers
and/or
expenses
absorbed | | | Ratio of
expenses
to average net
assets without
fee waivers
and/or
expenses
absorbed | | | Ratio of net
investment
income
to average
net assets | | | Portfolio
turnover (c) | |
Class A | | | | | | | | | | | | | | | | | | | | | | | | | | | | | | | | | | | | | | | | | | | | | | | | | | | | | | | | |
Year ended 10/31/19 | | | $30.30 | | | | $0.35 | | | | $4.60 | | | | $4.95 | | | | $(0.34 | ) | | | $(1.76 | ) | | | $(2.10 | ) | | | $33.15 | | | | 17.17 | % | | | $433,120 | | | | 1.43 | %(d) | | | 1.44 | %(d) | | | 1.08 | %(d) | | | 17 | % |
Year ended 10/31/18 | | | 36.95 | | | | 0.36 | | | | (4.21 | ) | | | (3.85 | ) | | | (0.28 | ) | | | (2.52 | ) | | | (2.80 | ) | | | 30.30 | | | | (11.39 | ) | | | 395,319 | | | | 1.44 | | | | 1.46 | | | | 1.04 | | | | 21 | |
Year ended 10/31/17 | | | 31.60 | | | | 0.28 | | | | 5.69 | | | | 5.97 | | | | (0.30 | ) | | | (0.32 | ) | | | (0.62 | ) | | | 36.95 | | | | 19.32 | | | | 495,214 | | | | 1.45 | | | | 1.47 | | | | 0.85 | | | | 18 | |
Year ended 10/31/16 | | | 29.35 | | | | 0.31 | | | | 2.83 | | | | 3.14 | | | | (0.89 | ) | | | – | | | | (0.89 | ) | | | 31.60 | | | | 11.15 | | | | 467,191 | | | | 1.45 | | | | 1.47 | | | | 1.06 | | | | 9 | |
Year ended 10/31/15 | | | 33.43 | | | | 0.83 | (e) | | | (3.54 | ) | | | (2.71 | ) | | | (0.41 | ) | | | (0.96 | ) | | | (1.37 | ) | | | 29.35 | | | | (8.32 | ) | | | 468,366 | | | | 1.44 | | | | 1.45 | | | | 2.63 | (e) | | | 23 | |
Class C | | | | | | | | | | | | | | | | | | | | | | | | | | | | | | | | | | | | | | | | | | | | | | | | | | | | | | | | |
Year ended 10/31/19 | | | 27.77 | | | | 0.10 | | | | 4.21 | | | | 4.31 | | | | (0.07 | ) | | | (1.76 | ) | | | (1.83 | ) | | | 30.25 | | | | 16.29 | | | | 31,409 | | | | 2.18 | (d) | | | 2.19 | (d) | | | 0.33 | (d) | | | 17 | |
Year ended 10/31/18 | | | 34.08 | | | | 0.09 | | | | (3.86 | ) | | | (3.77 | ) | | | (0.02 | ) | | | (2.52 | ) | | | (2.54 | ) | | | 27.77 | | | | (12.05 | ) | | | 53,201 | | | | 2.19 | | | | 2.21 | | | | 0.29 | | | | 21 | |
Year ended 10/31/17 | | | 29.17 | | | | 0.03 | | | | 5.27 | | | | 5.30 | | | | (0.07 | ) | | | (0.32 | ) | | | (0.39 | ) | | | 34.08 | | | | 18.44 | | | | 70,146 | | | | 2.20 | | | | 2.22 | | | | 0.10 | | | | 18 | |
Year ended 10/31/16 | | | 27.10 | | | | 0.08 | | | | 2.63 | | | | 2.71 | | | | (0.64 | ) | | | – | | | | (0.64 | ) | | | 29.17 | | | | 10.34 | | | | 72,872 | | | | 2.20 | | | | 2.22 | | | | 0.31 | | | | 9 | |
Year ended 10/31/15 | | | 30.96 | | | | 0.55 | (e) | | | (3.27 | ) | | | (2.72 | ) | | | (0.18 | ) | | | (0.96 | ) | | | (1.14 | ) | | | 27.10 | | | | (9.02 | ) | | | 79,991 | | | | 2.19 | | | | 2.20 | | | | 1.88 | (e) | | | 23 | |
Class Y | | | | | | | | | | | | | | | | | | | | | | | | | | | | | | | | | | | | | | | | | | | | | | | | | | | | | | | | |
Year ended 10/31/19 | | | 30.41 | | | | 0.43 | | | | 4.60 | | | | 5.03 | | | | (0.43 | ) | | | (1.76 | ) | | | (2.19 | ) | | | 33.25 | | | | 17.44 | | | | 170,249 | | | | 1.18 | (d) | | | 1.19 | (d) | | | 1.33 | (d) | | | 17 | |
Year ended 10/31/18 | | | 37.07 | | | | 0.45 | | | | (4.23 | ) | | | (3.78 | ) | | | (0.36 | ) | | | (2.52 | ) | | | (2.88 | ) | | | 30.41 | | | | (11.17 | ) | | | 172,297 | | | | 1.19 | | | | 1.21 | | | | 1.29 | | | | 21 | |
Year ended 10/31/17 | | | 31.69 | | | | 0.36 | | | | 5.71 | | | | 6.07 | | | | (0.37 | ) | | | (0.32 | ) | | | (0.69 | ) | | | 37.07 | | | | 19.66 | | | | 267,942 | | | | 1.20 | | | | 1.22 | | | | 1.10 | | | | 18 | |
Year ended 10/31/16 | | | 29.45 | | | | 0.39 | | | | 2.82 | | | | 3.21 | | | | (0.97 | ) | | | – | | | | (0.97 | ) | | | 31.69 | | | | 11.42 | | | | 329,748 | | | | 1.20 | | | | 1.22 | | | | 1.31 | | | | 9 | |
Year ended 10/31/15 | | | 33.55 | | | | 0.91 | (e) | | | (3.55 | ) | | | (2.64 | ) | | | (0.50 | ) | | | (0.96 | ) | | | (1.46 | ) | | | 29.45 | | | | (8.12 | ) | | | 268,833 | | | | 1.19 | | | | 1.20 | | | | 2.88 | (e) | | | 23 | |
Class R6 | | | | | | | | | | | | | | | | | | | | | | | | | | | | | | | | | | | | | | | | | | | | | | | | | | | | | | | | |
Year ended 10/31/19 | | | 30.43 | | | | 0.49 | | | | 4.61 | | | | 5.10 | | | | (0.50 | ) | | | (1.76 | ) | | | (2.26 | ) | | | 33.27 | | | | 17.70 | | | | 96,533 | | | | 0.98 | (d) | | | 0.99 | (d) | | | 1.53 | (d) | | | 17 | |
Year ended 10/31/18 | | | 37.10 | | | | 0.51 | | | | (4.22 | ) | | | (3.71 | ) | | | (0.44 | ) | | | (2.52 | ) | | | (2.96 | ) | | | 30.43 | | | | (11.00 | ) | | | 87,386 | | | | 1.01 | | | | 1.03 | | | | 1.47 | | | | 21 | |
Year ended 10/31/17(f) | | | 32.81 | | | | 0.27 | | | | 4.02 | | | | 4.29 | | | | – | | | | – | | | | – | | | | 37.10 | | | | 13.08 | | | | 122,996 | | | | 1.01 | (g) | | | 1.03 | (g) | | | 1.29 | (g) | | | 18 | |
| (a) | Calculated using average shares outstanding. |
| (b) | Includes adjustments in accordance with accounting principles generally accepted in the United States of America and as such, the net asset value for financial reporting purposes and the returns based upon those net asset values may differ from the net asset value and returns for shareholder transactions. Does not include sales charges and is not annualized for periods less than one year, if applicable. |
| (c) | Portfolio turnover is calculated at the fund level and is not annualized for periods less than one year, if applicable. |
| (d) | Ratios are based on average daily net assets (000’s omitted) of $430,860, $39,924, $181,658 and $93,272 for Class A, Class C, Class Y and Class R6 shares, respectively. |
| (e) | Net investment income per share and the ratio of net investment income to average net assets include significant dividends received during the fiscal year ended October 31, 2015. Net investment income per share and the ratio of net investment income to average net assets excluding the significant dividends are $0.38 and 1.18%, $0.10 and 0.43% and $0.46 and 1.43% for Class A, Class C and Class Y shares, respectively. |
| (f) | Commencement date of April 4, 2017. |
See accompanying Notes to Financial Statements which are an integral part of the financial statements.
15 Invesco Asia Pacific Growth Fund
Notes to Financial Statements
October 31, 2019
NOTE 1–Significant Accounting Policies
Invesco Asia Pacific Growth Fund (the “Fund”) is a series portfolio of AIM International Mutual Funds (Invesco International Mutual Funds) (the “Trust”). The Trust is a Delaware statutory trust registered under the Investment Company Act of 1940, as amended (the “1940 Act”), as anopen-end series management investment company authorized to issue an unlimited number of shares of beneficial interest. Information presented in these financial statements pertains only to the Fund. Matters affecting the Fund or each class will be voted on exclusively by the shareholders of the Fund or each class.
The Fund’s investment objective is long-term growth of capital.
The Fund currently consists of four different classes of shares: Class A, Class C, Class Y and Class R6. Class Y shares are available only to certain investors. Class A shares are sold with afront-end sales charge unless certain waiver criteria are met. Under certain circumstances, load waived shares may be subject to contingent deferred sales charges (“CDSC”). Class C shares are sold with a CDSC. Class Y and Class R6 shares are sold at net asset value. Class C shares held for ten years after purchase are eligible for automatic conversion into Class A shares of the same Fund (the “Conversion Feature”). The automatic conversion pursuant to the Conversion Feature will generally occur at the end of the month following the tenth anniversary after a purchase of Class C shares.
The Fund is an investment company and accordingly follows the investment company accounting and reporting guidance in accordance with Financial Accounting Standards Board Accounting Standards Codification Topic 946,Financial Services - Investment Companies.
The following is a summary of the significant accounting policies followed by the Fund in the preparation of its financial statements.
| A. | Security Valuations– Securities, including restricted securities, are valued according to the following policy. |
A security listed or traded on an exchange (except convertible securities) is valued at its last sales price or official closing price as of the close of the customary trading session on the exchange where the security is principally traded, or lacking any sales or official closing price on a particular day, the security may be valued at the closing bid price on that day. Securities traded in theover-the-counter market are valued based on prices furnished by independent pricing services or market makers. When such securities are valued by an independent pricing service they may be considered fair valued. Futures contracts are valued at the final settlement price set by an exchange on which they are principally traded. Listed options are valued at the mean between the last bid and asked prices from the exchange on which they are principally traded. Options not listed on an exchange are valued by an independent source at the mean between the last bid and asked prices. For purposes of determining net asset value (“NAV”) per share, futures and option contracts generally are valued 15 minutes after the close of the customary trading session of the New York Stock Exchange (“NYSE”).
Investments inopen-end andclosed-end registered investment companies that do not trade on an exchange are valued at theend-of-day net asset value per share. Investments inopen-end andclosed-end registered investment companies that trade on an exchange are valued at the last sales price or official closing price as of the close of the customary trading session on the exchange where the security is principally traded.
Debt obligations (including convertible securities) and unlisted equities are fair valued using an evaluated quote provided by an independent pricing service. Evaluated quotes provided by the pricing service may be determined without exclusive reliance on quoted prices, and may reflect appropriate factors such asinstitution-size trading in similar groups of securities, developments related to specific securities, dividend rate (for unlisted equities), yield (for debt obligations), quality, type of issue, coupon rate (for debt obligations), maturity (for debt obligations), individual trading characteristics and other market data. Pricing services generally value debt obligations assuming orderly transactions of institutional round lot size, but a fund may hold or transact in the same securities in smaller, odd lot sizes. Odd lots often trade at lower prices than institutional round lots. Debt obligations are subject to interest rate and credit risks. In addition, all debt obligations involve some risk of default with respect to interest and/or principal payments.
Foreign securities’ (including foreign exchange contracts) prices are converted into U.S. dollar amounts using the applicable exchange rates as of the close of the NYSE. If market quotations are available and reliable for foreign exchange-traded equity securities, the securities will be valued at the market quotations. Because trading hours for certain foreign securities end before the close of the NYSE, closing market quotations may become unreliable. If between the time trading ends on a particular security and the close of the customary trading session on the NYSE, events occur that the investment adviser determines are significant and make the closing price unreliable, the Fund may fair value the security. If the event is likely to have affected the closing price of the security, the security will be valued at fair value in good faith using procedures approved by the Board of Trustees. Adjustments to closing prices to reflect fair value may also be based on a screening process of an independent pricing service to indicate the degree of certainty, based on historical data, that the closing price in the principal market where a foreign security trades is not the current value as of the close of the NYSE. Foreign securities’ prices meeting the approved degree of certainty that the price is not reflective of current value will be priced at the indication of fair value from the independent pricing service. Multiple factors may be considered by the independent pricing service in determining adjustments to reflect fair value and may include information relating to sector indices, American Depositary Receipts and domestic and foreign index futures. Foreign securities may have additional risks including exchange rate changes, potential for sharply devalued currencies and high inflation, political and economic upheaval, the relative lack of issuer information, relatively low market liquidity and the potential lack of strict financial and accounting controls and standards.
Securities for which market prices are not provided by any of the above methods may be valued based upon quotes furnished by independent sources. The last bid price may be used to value equity securities. The mean between the last bid and asked prices is used to value debt obligations, including corporate loans.
Securities for which market quotations are not readily available or became unreliable are valued at fair value as determined in good faith by or under the supervision of the Trust’s officers following procedures approved by the Board of Trustees. Issuer specific events, market trends, bid/asked quotes of brokers and information providers and other market data may be reviewed in the course of making a good faith determination of a security’s fair value.
The Fund may invest in securities that are subject to interest rate risk, meaning the risk that the prices will generally fall as interest rates rise and, conversely, the prices will generally rise as interest rates fall. Specific securities differ in their sensitivity to changes in interest rates
16 Invesco Asia Pacific Growth Fund
depending on their individual characteristics. Changes in interest rates may result in increased market volatility, which may affect the value and/or liquidity of certain Fund investments.
Valuations change in response to many factors including the historical and prospective earnings of the issuer, the value of the issuer’s assets, general economic conditions, interest rates, investor perceptions and market liquidity. Because of the inherent uncertainties of valuation, the values reflected in the financial statements may materially differ from the value received upon actual sale of those investments.
B. Securities Transactions and Investment Income– Securities transactions are accounted for on a trade date basis. Realized gains or losses on sales are computed on the basis of specific identification of the securities sold. Interest income (net of withholding tax, if any) is recorded on the accrual basis from settlement date. Dividend income (net of withholding tax, if any) is recorded on theex-dividend date.
The Fund may periodically participate in litigation related to Fund investments. As such, the Fund may receive proceeds from litigation settlements. Any proceeds received are included in the Statement of Operations as realized gain (loss) for investments no longer held and as unrealized gain (loss) for investments still held.
Brokerage commissions and mark ups are considered transaction costs and are recorded as an increase to the cost basis of securities purchased and/or a reduction of proceeds on a sale of securities. Such transaction costs are included in the determination of net realized and unrealized gain (loss) from investment securities reported in the Statement of Operations and the Statement of Changes in Net Assets and the net realized and unrealized gains (losses) on securities per share in the Financial Highlights. Transaction costs are included in the calculation of the Fund’s net asset value and, accordingly, they reduce the Fund’s total returns. These transaction costs are not considered operating expenses and are not reflected in net investment income reported in the Statement of Operations and the Statement of Changes in Net Assets, or the net investment income per share and the ratios of expenses and net investment income reported in the Financial Highlights, nor are they limited by any expense limitation arrangements between the Fund and the investment adviser.
The Fund allocates income and realized and unrealized capital gains and losses to a class based on the relative net assets of each class.
C. Country Determination– For the purposes of making investment selection decisions and presentation in the Schedule of Investments, the investment adviser may determine the country in which an issuer is located and/or credit risk exposure based on various factors. These factors include the laws of the country under which the issuer is organized, where the issuer maintains a principal office, the country in which the issuer derives 50% or more of its total revenues and the country that has the primary market for the issuer’s securities, as well as other criteria. Among the other criteria that may be evaluated for making this determination are the country in which the issuer maintains 50% or more of its assets, the type of security, financial guarantees and enhancements, the nature of the collateral and the sponsor organization. Country of issuer and/or credit risk exposure has been determined to be the United States of America, unless otherwise noted.
D. Distributions– Distributions from net investment income and net realized capital gain, if any, are generally declared and paid annually and recorded on theex-dividend date. The Fund may elect to treat a portion of the proceeds from redemptions as distributions for federal income tax purposes.
E. Federal Income Taxes –The Fund intends to comply with the requirements of Subchapter M of the Internal Revenue Code of 1986, as amended (the “Internal Revenue Code”), necessary to qualify as a regulated investment company and to distribute substantially all of the Fund’s taxable earnings to shareholders. As such, the Fund will not be subject to federal income taxes on otherwise taxable income (including net realized capital gain) that is distributed to shareholders. Therefore, no provision for federal income taxes is recorded in the financial statements.
The Fund recognizes the tax benefits of uncertain tax positions only when the position is more likely than not to be sustained. Management has analyzed the Fund’s uncertain tax positions and concluded that no liability for unrecognized tax benefits should be recorded related to uncertain tax positions. Management is not aware of any tax positions for which it is reasonably possible that the total amounts of unrecognized tax benefits will change materially in the next 12 months.
The Fund files tax returns in the U.S. Federal jurisdiction and certain other jurisdictions. Generally, the Fund is subject to examinations by such taxing authorities for up to three years after the filing of the return for the tax period.
F. Expenses– Fees provided for under the Rule12b-1 plan of a particular class of the Fund are charged to the operations of such class. Transfer agency fees and expenses and other shareholder recordkeeping fees and expenses attributable to Class R6 are charged to such class. Transfer agency fees and expenses and other shareholder recordkeeping fees and expenses relating to all other classes are allocated among those classes based on relative net assets. All other expenses are allocated among the classes based on relative net assets.
G. Accounting Estimates –The preparation of financial statements in conformity with accounting principles generally accepted in the United States of America (“GAAP”) requires management to make estimates and assumptions that affect the reported amounts of assets and liabilities at the date of the financial statements and the reported amounts of revenues and expenses during the reporting period including estimates and assumptions related to taxation. Actual results could differ from those estimates by a significant amount. In addition, the Fund monitors for material events or transactions that may occur or become known after theperiod-end date and before the date the financial statements are released to print.
H. Indemnifications- Under the Trust’s organizational documents, each Trustee, officer, employee or other agent of the Trust is indemnified against certain liabilities that may arise out of the performance of their duties to the Fund. Additionally, in the normal course of business, the Fund enters into contracts, including the Fund’s servicing agreements, that contain a variety of indemnification clauses. The Fund’s maximum exposure under these arrangements is unknown as this would involve future claims that may be made against the Fund that have not yet occurred. The risk of material loss as a result of such indemnification claims is considered remote.
I. Foreign Currency Translations– Foreign currency is valued at the close of the NYSE based on quotations posted by banks and major currency dealers. Portfolio securities and other assets and liabilities denominated in foreign currencies are translated into U.S. dollar amounts at the date of valuation. Purchases and sales of portfolio securities (net of foreign taxes withheld on disposition) and income items denominated in foreign currencies are translated into U.S. dollar amounts on the respective dates of such transactions. The Fund does not separately account for the portion of the results of operations resulting from changes in foreign exchange rates on investments and the fluctuations arising from changes in market prices of securities held. The combined results of changes in foreign exchange rates and the fluctuation of market prices on investments (net of estimated foreign tax withholding) are included with the net realized and unrealized gain or loss from investments in the Statement of Operations. Reported net realized foreign currency gains or losses arise from (1) sales of foreign currencies, (2) currency gains or losses realized between the trade and settlement dates on securities transactions, and (3) the difference between the amounts of dividends, interest, and foreign withholding taxes recorded on the Fund’s books and the U.S. dollar equivalent of the amounts actually received or paid. Net
17 Invesco Asia Pacific Growth Fund
unrealized foreign currency gains and losses arise from changes in the fair values of assets and liabilities, other than investments in securities at fiscal period end, resulting from changes in exchange rates.
The Fund may invest in foreign securities, which may be subject to foreign taxes on income, gains on investments or currency repatriation, a portion of which may be recoverable. Foreign taxes, if any, are recorded based on the tax regulations and rates that exist in the foreign markets in which the Fund invests and are shown in the Statement of Operations.
| J. | Forward Foreign Currency Contracts– The Fund may engage in foreign currency transactions either on a spot (i.e. for prompt delivery and settlement) basis, or through forward foreign currency contracts, to manage or minimize currency or exchange rate risk. |
The Fund may also enter into forward foreign currency contracts for the purchase or sale of a security denominated in a foreign currency in order to “lock in” the U.S. dollar price of that security, or the Fund may also enter into forward foreign currency contracts that do not provide for physical settlement of the two currencies, but instead are settled by a single cash payment calculated as the difference between the agreed upon exchange rate and the spot rate at settlement based upon an agreed upon notional amount (non-deliverable forwards). The Fund will set aside liquid assets in an amount equal to the dailymark-to-market obligation for forward foreign currency contracts.
A forward foreign currency contract is an obligation between two parties (“Counterparties”) to purchase or sell a specific currency for an agreed-upon price at a future date. The use of forward foreign currency contracts does not eliminate fluctuations in the price of the underlying securities the Fund owns or intends to acquire but establishes a rate of exchange in advance. Fluctuations in the value of these contracts are measured by the difference in the contract date and reporting date exchange rates and are recorded as unrealized appreciation (depreciation) until the contracts are closed. When the contracts are closed, realized gains (losses) are recorded. Realized and unrealized gains (losses) on the contracts are included in the Statement of Operations. The primary risks associated with forward foreign currency contracts include failure of the Counterparty to meet the terms of the contract and the value of the foreign currency changing unfavorably. These risks may be in excess of the amounts reflected in the Statement of Assets and Liabilities.
NOTE 2–Advisory Fees and Other Fees Paid to Affiliates
The Trust has entered into a master investment advisory agreement with Invesco Advisers, Inc. (the “Adviser” or “Invesco”). Under the terms of the investment advisory agreement, the Fund accrues daily and pays monthly an advisory fee to the Adviser based on the annual rate of the Fund’s average daily net assets as follows:
| | |
| Average Daily Net Assets | | Rate |
First $250 million | | 0.935% |
Next $250 million | | 0.910% |
Next $500 million | | 0.885% |
Next $1.5 billion | | 0.860% |
Next $2.5 billion | | 0.835% |
Next $2.5 billion | | 0.810% |
Next $2.5 billion | | 0.785% |
Amount over $10 billion | | 0.760% |
For the year ended October 31, 2019, the effective advisory fee rate incurred by the Fund was 0.91%.
Under the terms of a mastersub-advisory agreement between the Adviser and each of Invesco Asset Management Deutschland GmbH, Invesco Asset Management Limited, Invesco Asset Management (Japan) Limited, Invesco Hong Kong Limited, Invesco Senior Secured Management, Inc. and Invesco Canada Ltd. (collectively, the “AffiliatedSub-Advisers”) the Adviser, not the Fund, will pay 40% of the fees paid to the Adviser to any such AffiliatedSub-Adviser(s) that provide(s) discretionary investment management services to the Fund based on the percentage of assets allocated to such AffiliatedSub-Adviser(s).
The Adviser has contractually agreed, through at least June 30, 2020, to waive advisory fees and/or reimburse expenses of all shares to the extent necessary to limit total annual fund operating expenses after fee waiver and/or reimbursement (excluding certain items discussed below) of Class A, Class C, Class Y and Class R6 shares to 2.25%, 3.00%, 2.00% and 2.00%, respectively, of the Fund’s average daily net assets (the “expense limits”). In determining the Adviser’s obligation to waive advisory fees and/or reimburse expenses, the following expenses are not taken into account, and could cause the total annual fund operating expenses after fee waiver and/or reimbursement to exceed the numbers reflected above: (1) interest, facilities and maintenance fees; (2) taxes; (3) dividend expense on short sales; (4) extraordinary ornon-routine items, including litigation expenses; and (5) expenses that the Fund has incurred but did not actually pay because of an expense offset arrangement. Unless Invesco continues the fee waiver agreement, it will terminate on June 30, 2020. During its term, the fee waiver agreement cannot be terminated or amended to increase the expense limits or reduce the advisory fee waivers without approval of the Board of Trustees. The Adviser did not waive fees and/or reimburse expenses during the period under this expense limit.
Further, the Adviser has contractually agreed, through at least June 30, 2021, to waive the advisory fee payable by the Fund in an amount equal to 100% of the net advisory fees the Adviser receives from the affiliated money market funds on investments by the Fund of uninvested cash in such affiliated money market funds.
For the year ended October 31, 2019, the Adviser waived advisory fees of $89,921.
The Trust has entered into a master administrative services agreement with Invesco pursuant to which the Fund has agreed to pay Invesco for certain administrative costs incurred in providing accounting services to the Fund. For the year ended October 31, 2019, expenses incurred under the agreement are shown in the Statement of Operations asAdministrative services fees. Invesco has entered into asub-administration agreement whereby State Street Bank and Trust Company (“SSB”) serves as fund accountant and provides certain administrative services to the Fund. Pursuant to a custody agreement with the Trust on behalf of the Fund, SSB also serves as the Fund’s custodian.
The Trust has entered into a transfer agency and service agreement with Invesco Investment Services, Inc. (“IIS”) pursuant to which the Fund has agreed to pay IIS a fee for providing transfer agency and shareholder services to the Fund and reimburse IIS for certain expenses incurred by IIS in the course of providing such services. IIS may make payments to intermediaries that provide omnibus account services,sub-accounting services and/or
18 Invesco Asia Pacific Growth Fund
networking services. All fees payable by IIS to intermediaries that provide omnibus account services orsub-accounting services are charged back to the Fund, subject to certain limitations approved by the Trust’s Board of Trustees. For the year ended October 31, 2019, expenses incurred under the agreement are shown in the Statement of Operations asTransfer agent fees.
The Trust has entered into master distribution agreements with Invesco Distributors, Inc. (“IDI”) to serve as the distributor for the Class A, Class C, Class Y and Class R6 shares of the Fund. The Trust has adopted plans pursuant to Rule12b-1 under the 1940 Act with respect to the Fund’s Class A and Class C shares (collectively, the “Plans”). The Fund, pursuant to the Plans, pays IDI compensation at the annual rate of 0.25% of the Fund’s average daily net assets of Class A shares and 1.00% of the average daily net assets of Class C shares. The fees are accrued daily and paid monthly. Of the Plan payments, up to 0.25% of the average daily net assets of each class of shares may be paid to furnish continuing personal shareholder services to customers who purchase and own shares of such classes. Any amounts not paid as a service fee under the Plans would constitute an asset-based sales charge. Rules of the Financial Industry Regulatory Authority (“FINRA”) impose a cap on the total sales charges, including asset-based sales charges, that may be paid by any class of shares of the Fund. For the year ended October 31, 2019, expenses incurred under the Plans are shown in the Statement of Operations asDistribution fees.
Front-end sales commissions and CDSC (collectively, the “sales charges”) are not recorded as expenses of the Fund.Front-end sales commissions are deducted from proceeds from the sales of Fund shares prior to investment in Class A shares of the Fund. CDSC are deducted from redemption proceeds prior to remittance to the shareholder. During the year ended October 31, 2019, IDI advised the Fund that IDI retained $84,322 infront-end sales commissions from the sale of Class A shares and $16,001 and $3,116 from Class A and Class C shares, respectively, for CDSC imposed upon redemptions by shareholders.
Certain officers and trustees of the Trust are officers and directors of the Adviser, IIS and/or IDI.
NOTE 3–Additional Valuation Information
GAAP defines fair value as the price that would be received to sell an asset or paid to transfer a liability in an orderly transaction between market participants at the measurement date, under current market conditions. GAAP establishes a hierarchy that prioritizes the inputs to valuation methods, giving the highest priority to readily available unadjusted quoted prices in an active market for identical assets (Level 1) and the lowest priority to significant unobservable inputs (Level 3), generally when market prices are not readily available or are unreliable. Based on the valuation inputs, the securities or other investments are tiered into one of three levels. Changes in valuation methods may result in transfers in or out of an investment’s assigned level:
| | Level 1 – | Prices are determined using quoted prices in an active market for identical assets. |
| | Level 2 – | Prices are determined using other significant observable inputs. Observable inputs are inputs that other market participants may use in pricing a security. These may include quoted prices for similar securities, interest rates, prepayment speeds, credit risk, yield curves, loss severities, default rates, discount rates, volatilities and others. |
| | Level 3 – | Prices are determined using significant unobservable inputs. In situations where quoted prices or observable inputs are unavailable (for example, when there is little or no market activity for an investment at the end of the period), unobservable inputs may be used. Unobservable inputs reflect the Fund’s own assumptions about the factors market participants would use in determining fair value of the securities or instruments and would be based on the best available information. |
The following is a summary of the tiered valuation input levels, as of October 31, 2019. The level assigned to the securities valuations may not be an indication of the risk or liquidity associated with investing in those securities. Because of the inherent uncertainties of valuation, the values reflected in the financial statements may materially differ from the value received upon actual sale of those investments.
| | | | | | | | | | | | | | |
| | | Level 1 | | | Level 2 | | | Level 3 | | Total | |
| |
Investments in Securities | | | | | | | | | | | | | | |
| |
Australia | | | $ – | | | | $ 17,093,670 | | | $– | | | $ 17,093,670 | |
| |
China | | | 57,638,992 | | | | 138,206,716 | | | – | | | 195,845,708 | |
| |
Hong Kong | | | – | | | | 82,632,274 | | | – | | | 82,632,274 | |
| |
Indonesia | | | – | | | | 89,816,951 | | | – | | | 89,816,951 | |
| |
Macau | | | – | | | | 17,948,619 | | | – | | | 17,948,619 | |
| |
Malaysia | | | – | | | | 31,946,674 | | | – | | | 31,946,674 | |
| |
Philippines | | | – | | | | 37,627,090 | | | – | | | 37,627,090 | |
| |
Singapore | | | – | | | | 54,063,068 | | | – | | | 54,063,068 | |
| |
South Korea | | | – | | | | 33,800,168 | | | – | | | 33,800,168 | |
| |
Taiwan | | | – | | | | 26,643,806 | | | – | | | 26,643,806 | |
| |
Thailand | | | 4,269,785 | | | | 5,113,724 | | | – | | | 9,383,509 | |
| |
United States | | | 27,279,856 | | | | 14,301,705 | | | – | | | 41,581,561 | |
| |
Vietnam | | | – | | | | 13,939,528 | | | – | | | 13,939,528 | |
| |
Money Market Funds | | | 77,349,682 | | | | – | | | – | | | 77,349,682 | |
| |
Total Investments | | | $166,538,315 | | | | $563,133,993 | | | $– | | | $729,672,308 | |
| |
NOTE 4–Expense Offset Arrangement(s)
The expense offset arrangement is comprised of transfer agency credits which result from balances in demand deposit accounts used by the transfer agent for clearing shareholder transactions. For the year ended October 31, 2019, the Fund received credits from this arrangement, which resulted in the reduction of the Fund’s total expenses of $8,987.
19 Invesco Asia Pacific Growth Fund
NOTE 5–Trustees’ and Officers’ Fees and Benefits
Trustees’ and Officers’ Fees and Benefits include amounts accrued by the Fund to pay remuneration to certain Trustees and Officers of the Fund. Trustees have the option to defer compensation payable by the Fund, andTrustees’ and Officers’ Fees and Benefits also include amounts accrued by the Fund to fund such deferred compensation amounts. Those Trustees who defer compensation have the option to select various Invesco Funds in which their deferral accounts shall be deemed to be invested. Finally, certain current Trustees were eligible to participate in a retirement plan that provided for benefits to be paid upon retirement to Trustees over a period of time based on the number of years of service. The Fund may have certain former Trustees who also participate in a retirement plan and receive benefits under such plan.Trustees’ and Officers’ Fees and Benefits include amounts accrued by the Fund to fund such retirement benefits. Obligations under the deferred compensation and retirement plans represent unsecured claims against the general assets of the Fund.
NOTE 6–Cash Balances
The Fund is permitted to temporarily carry a negative or overdrawn balance in its account with State Street Bank and Trust Company, the custodian bank. Such balances, if any atperiod-end, are shown in the Statement of Assets and Liabilities under the payable captionAmount due custodian.To compensate the custodian bank for such overdrafts, the overdrawn Fund may either (1) leave funds as a compensating balance in the account so the custodian bank can be compensated by earning the additional interest; or (2) compensate by paying the custodian bank at a rate agreed upon by the custodian bank and Invesco, not to exceed the contractually agreed upon rate.
NOTE 7–Distributions to Shareholders and Tax Components of Net Assets
Tax Character of Distributions to Shareholders Paid During the Fiscal Years Ended October 31, 2019 and 2018
| | | | | | | | |
| | | 2019 | | | 2018 | |
| |
Ordinary income | | | $11,504,676 | | | | $11,182,364 | |
| |
Long-term capital gain | | | 37,200,054 | | | | 62,604,682 | |
| |
Total distributions | | | $48,704,730 | | | | $73,787,046 | |
| |
Tax Components of Net Assets atPeriod-End:
| | | | |
| | | 2019 | |
| |
Undistributed ordinary income | | $ | 10,601,124 | |
| |
Undistributed long-term capital gain | | | 37,875,978 | |
| |
Net unrealized appreciation – investments | | | 187,872,678 | |
| |
Net unrealized appreciation – foreign currencies | | | 13,679 | |
| |
Temporary book/tax differences | | | (124,479 | ) |
| |
Shares of beneficial interest | | | 495,072,301 | |
| |
Total net assets | | $ | 731,311,281 | |
| |
The difference between book-basis andtax-basis unrealized appreciation (depreciation) is due to differences in the timing of recognition of gains and losses on investments for tax and book purposes. The Fund’s net unrealized appreciation (depreciation) difference is attributable primarily to wash sales and passive foreign investment companies.
The temporary book/tax differences are a result of timing differences between book and tax recognition of income and/or expenses. The Fund’s temporary book/tax differences are the result of the trustee deferral of compensation and retirement plan benefits.
Capital loss carryforward is calculated and reported as of a specific date. Results of transactions and other activity after that date may affect the amount of capital loss carryforward actually available for the Fund to utilize. Capital losses generated in years beginning after December 22, 2010 can be carried forward for an unlimited period, whereas previous losses expire in eight tax years. Capital losses with an expiration period may not be used to offset capital gains until all net capital losses without an expiration date have been utilized. Capital loss carryforwards with no expiration date will retain their character as either short-term or long-term capital losses instead of as short-term capital losses as under prior law. The ability to utilize capital loss carryforwards in the future may be limited under the Internal Revenue Code and related regulations based on the results of future transactions.
The Fund does not have a capital loss carryforward as of October 31, 2019.
NOTE 8–Investment Transactions
The aggregate amount of investment securities (other than short-term securities, U.S. Treasury obligations and money market funds, if any) purchased and sold by the Fund during the year ended October 31, 2019 was $112,320,391 and $200,390,333, respectively. Cost of investments, including any derivatives, on a tax basis includes the adjustments for financial reporting purposes as of the most recently completed federal income tax reportingperiod-end.
| | | | |
| Unrealized Appreciation (Depreciation) of Investments on a Tax Basis | |
| |
Aggregate unrealized appreciation of investments | | | $193,463,331 | |
| |
Aggregate unrealized (depreciation) of investments | | | (5,590,653 | ) |
| |
Net unrealized appreciation of investments | | | $187,872,678 | |
| |
Cost of investments for tax purposes is $541,799,630.
20 Invesco Asia Pacific Growth Fund
NOTE 9–Reclassification of Permanent Differences
Primarily as a result of differing book/tax treatment of foreign currency transactions and foreign taxes, on October 31, 2019, undistributed net investment income was decreased by $868,327, undistributed net realized gain was increased by $868,329 and shares of beneficial interest was decreased by $2. This reclassification had no effect on the net assets of the Fund.
NOTE 10–Share Information
| | | | | | | | | | | | | | | | |
| | | Summary of Share Activity | |
| | | | |
| |
| | | Years ended October 31, | |
| | | | |
| | | 2019(a) | | | 2018 | |
| | | | | | | | |
| | | Shares | | | Amount | | | Shares | | | Amount | |
| |
Sold: | | | | | | | | | | | | | | | | |
Class A | | | 1,158,851 | | | $ | 36,782,554 | | | | 1,664,736 | | | $ | 58,102,426 | |
| |
Class B(b) | | | - | | | | - | | | | 117 | | | | 3,943 | |
| |
Class C | | | 100,245 | | | | 2,918,924 | | | | 220,590 | | | | 7,155,591 | |
| |
Class Y | | | 1,331,908 | | | | 41,475,028 | | | | 1,298,349 | | | | 44,999,004 | |
| |
Class R6 | | | 157,858 | | | | 5,056,872 | | | | 613,960 | | | | 22,226,930 | |
| |
| | | | |
Issued as reinvestment of dividends: | | | | | | | | | | | | | | | | |
Class A | | | 846,013 | | | | 25,008,104 | | | | 1,028,044 | | | | 35,724,540 | |
| |
Class B(b) | | | - | | | | - | | | | 4,055 | | | | 130,898 | |
| |
Class C | | | 115,828 | | | | 3,144,732 | | | | 152,506 | | | | 4,887,809 | |
| |
Class Y | | | 330,511 | | | | 9,779,806 | | | | 505,709 | | | | 17,593,625 | |
| |
Class R6 | | | 60,895 | | | | 1,799,437 | | | | 105,698 | | | | 3,674,057 | |
| |
| | | | |
Conversion of Class B shares to Class A shares:(c) | | | | | | | | | | | | | | | | |
Class A | | | - | | | | - | | | | 53,160 | | | | 1,949,366 | |
| |
Class B | | | - | | | | - | | | | (56,811 | ) | | | (1,949,366 | ) |
| |
| | | | |
Automatic conversion of Class C shares to Class A shares: | | | | | | | | | | | | | | | | |
Class A | | | 664,213 | | | | 20,856,417 | | | | - | | | | - | |
| |
Class C | | | (724,136 | ) | | | (20,856,417 | ) | | | - | | | | - | |
| |
| | | | |
Reacquired: | | | | | | | | | | | | | | | | |
Class A | | | (2,650,540 | ) | | | (84,252,493 | ) | | | (3,102,609 | ) | | | (105,911,366 | ) |
| |
Class B(b) | | | - | | | | - | | | | (9,976 | ) | | | (338,791 | ) |
| |
Class C | | | (369,393 | ) | | | (10,738,820 | ) | | | (515,778 | ) | | | (16,293,996 | ) |
| |
Class Y | | | (2,209,183 | ) | | | (69,652,745 | ) | | | (3,366,641 | ) | | | (116,560,114 | ) |
| |
Class R6 | | | (188,971 | ) | | | (5,974,811 | ) | | | (1,163,140 | ) | | | (39,035,093 | ) |
| |
Net increase (decrease) in share activity | | | (1,375,901 | ) | | $ | (44,653,412 | ) | | | (2,568,031 | ) | | $ | (83,640,537 | ) |
| |
| (a) | There are entities that are record owners of more than 5% of the outstanding shares of the Fund and in the aggregate own 45% of the outstanding shares of the Fund. IDI has an agreement with these entities to sell Fund shares. The Fund, Invesco and/or Invesco affiliates may make payments to these entities, which are considered to be related to the Fund, for providing services to the Fund, Invesco and/or Invesco affiliates including but not limited to services such as securities brokerage, distribution, third party record keeping and account servicing. The Fund has no knowledge as to whether all or any portion of the shares owned of record by these entities are also owned beneficially. |
| (b) | Class B shares activity for the period November 1, 2017 through January 26, 2018 (date of conversion). |
| (c) | Effective as of the close of business January 26, 2018, all outstanding Class B shares were converted to Class A shares. |
21 Invesco Asia Pacific Growth Fund
Report of Independent Registered Public Accounting Firm
To the Board of Trustees of AIM International Mutual Funds (Invesco International Mutual Funds) and Shareholders of Invesco Asia Pacific Growth Fund
Opinion on the Financial Statements
We have audited the accompanying statement of assets and liabilities, including the schedule of investments, of Invesco Asia Pacific Growth Fund (one of the funds constituting AIM International Mutual Funds (Invesco International Mutual Funds), referred to hereafter as the “Fund”) as of October 31, 2019, the related statement of operations for the year ended October 31, 2019, the statement of changes in net assets for each of the two years in the period ended October 31, 2019, including the related notes, and the financial highlights for each of the periods indicated therein (collectively referred to as the “financial statements”). In our opinion, the financial statements present fairly, in all material respects, the financial position of the Fund as of October 31, 2019, the results of its operations for the year then ended, the changes in its net assets for each of the two years in the period ended October 31, 2019 and the financial highlights for each of the periods indicated therein in conformity with accounting principles generally accepted in the United States of America.
Basis for Opinion
These financial statements are the responsibility of the Fund’s management. Our responsibility is to express an opinion on the Fund’s financial statements based on our audits. We are a public accounting firm registered with the Public Company Accounting Oversight Board (United States) (PCAOB) and are required to be independent with respect to the Fund in accordance with the U.S. federal securities laws and the applicable rules and regulations of the Securities and Exchange Commission and the PCAOB.
We conducted our audits of these financial statements in accordance with the standards of the PCAOB. Those standards require that we plan and perform the audit to obtain reasonable assurance about whether the financial statements are free of material misstatement, whether due to error or fraud.
Our audits included performing procedures to assess the risks of material misstatement of the financial statements, whether due to error or fraud, and performing procedures that respond to those risks. Such procedures included examining, on a test basis, evidence regarding the amounts and disclosures in the financial statements. Our audits also included evaluating the accounting principles used and significant estimates made by management, as well as evaluating the overall presentation of the financial statements. Our procedures included confirmation of securities owned as of October 31, 2019 by correspondence with the custodian, transfer agent and brokers; when replies were not received from brokers, we performed other auditing procedures. We believe that our audits provide a reasonable basis for our opinion.
/s/PricewaterhouseCoopers LLP
Houston, Texas
December 23, 2019
We have served as the auditor of one or more of the investment companies in the Invesco group of investment companies since at least 1995. We have not been able to determine the specific year we began serving as auditor.
22 Invesco Asia Pacific Growth Fund
Calculating your ongoing Fund expenses
Example
As a shareholder of the Fund, you incur two types of costs: (1) transaction costs, which may include sales charges (loads) on purchase payments or contingent deferred sales charges on redemptions, if any; and (2) ongoing costs, including management fees, distribution and/or service(12b-1) fees, and other Fund expenses. This example is intended to help you understand your ongoing costs (in dollars) of investing in the Fund and to compare these costs with ongoing costs of investing in other mutual funds. The example is based on an investment of $1,000 invested at the beginning of the period and held for the entire period May 1, 2019 through October 31, 2019.
Actual expenses
The table below provides information about actual account values and actual expenses. You may use the information in this table, together with the amount you invested, to estimate the expenses that you paid over the period. Simply divide your account value by $1,000 (for example, an $8,600 account value divided by $1,000 = 8.6), then multiply the result by the number in the table under the heading entitled “Actual Expenses Paid During Period” to estimate the expenses you paid on your account during this period.
Hypothetical example for comparison purposes
The table below also provides information about hypothetical account values and hypothetical expenses based on the Fund’s actual expense ratio and an assumed rate of return of 5% per year before expenses, which is not the Fund’s actual return.
The hypothetical account values and expenses may not be used to estimate the actual ending account balance or expenses you paid for the period. You may use this information to compare the ongoing costs of investing in the Fund and other funds. To do so, compare this 5% hypothetical example with the 5% hypothetical examples that appear in the shareholder reports of the other funds.
Please note that the expenses shown in the table are meant to highlight your ongoing costs only and do not reflect any transaction costs, such as sales charges (loads) on purchase payments or contingent deferred sales charges on redemptions, if any. Therefore, the hypothetical information is useful in comparing ongoing costs only, and will not help you determine the relative total costs of owning different funds. In addition, if these transaction costs were included, your costs would have been higher.
| | | | | | | | | | | | |
| | | | | ACTUAL | | HYPOTHETICAL (5% annual return before expenses) | | |
| | | Beginning
Account Value
(05/01/19) | | Ending
Account Value
(10/31/19)1 | | Expenses
Paid During
Period2 | | Ending
Account Value
(10/31/19) | | Expenses
Paid During
Period2 | | Annualized
Expense Ratio |
Class A | | $1,000.00 | | $996.40 | | $7.04 | | $1,018.15 | | $7.12 | | 1.40% |
Class C | | 1,000.00 | | 992.80 | | 10.80 | | 1,014.37 | | 10.92 | | 2.15 |
Class Y | | 1,000.00 | | 997.60 | | 5.79 | | 1,019.41 | | 5.85 | | 1.15 |
Class R6 | | 1,000.00 | | 998.80 | | 4.99 | | 1,020.21 | | 5.04 | | 0.99 |
| 1 | The actual ending account value is based on the actual total return of the Fund for the period May 1, 2019 through October 31, 2019, after actual expenses and will differ from the hypothetical ending account value which is based on the Fund’s expense ratio and a hypothetical annual return of 5% before expenses. |
| 2 | Expenses are equal to the Fund’s annualized expense ratio as indicated above multiplied by the average account value over the period, multiplied by 184/365 to reflect the most recent fiscal half year. |
23 Invesco Asia Pacific Growth Fund
Approval of Investment Advisory andSub-Advisory Contracts
At meetings held on June 10, 2019, the Board of Trustees (the Board or the Trustees) of AIM International Mutual Funds (Invesco International Mutual Funds) as a whole, and the independent Trustees, who comprise over 75% of the Board, voting separately, approved the continuance of the Invesco Asia Pacific Growth Fund’s (the Fund) Master Investment Advisory Agreement with Invesco Advisers, Inc. (Invesco Advisers and the investment advisory agreement) and the Master IntergroupSub-Advisory Contract for Mutual Funds with Invesco Asset Management Deutschland GmbH, Invesco Asset Management Limited, Invesco Asset Management (Japan) Limited, Invesco Hong Kong Limited, Invesco Senior Secured Management, Inc. and Invesco Canada Ltd. (collectively, the AffiliatedSub-Advisers and thesub-advisory contracts) for another year, effective July 1, 2019. After evaluating the factors discussed below, among others, the Board approved the renewal of the Fund’s investment advisory agreement and thesub-advisory contracts and determined that the compensation payable by the Fund to Invesco Advisers and by Invesco Advisers to the AffiliatedSub-Advisers is fair and reasonable.
The Board’s Evaluation Process
The Board’s Investments Committee has established threeSub-Committees, which meet throughout the year to review the performance of funds advised by Invesco Advisers (the Invesco Funds). As part of a regularly scheduled basis ofin-person Board meetings, theSub-Committees meet with portfolio managers for their assigned Invesco Funds and other members of management to review detailed information about investment performance and portfolio attributes of these funds. The Board took into account evaluations and reports that it received from the Investments Committee andSub-Committees, as well as the information provided to such committees and the Board throughout the year, in considering whether to approve each Invesco Fund’s investment advisory agreement andsub-advisory contracts.
As part of the contract renewal process, the Board reviews and considers information provided in response to detailed requests for information submitted to management by the independent Trustees with assistance from legal counsel to the independent Trustees. The Board receives comparative investment performance and fee data regarding the Invesco Funds prepared by Invesco Advisers and Broadridge Financial Solutions, Inc. (Broadridge), an independent mutual fund data provider. The Board also receives an independent written evaluation from the Senior Officer, an officer of the Invesco Funds who reports directly to the independent Trustees. The Senior Officer’s
evaluation is prepared as part of his responsibility to manage the process by which the Invesco Funds’ proposed management fees are negotiated during the annual contract renewal process to ensure they are negotiated in a manner that is at arms’ length and reasonable. In addition to meetings with Invesco Advisers and fund counsel throughout the year, the independent Trustees also discuss the continuance of the investment advisory agreement andsub-advisory contracts in separate sessions with the Senior Officer and with independent legal counsel.
The discussion below is a summary of the Senior Officer’s independent written evaluation with respect to the Fund’s investment advisory agreement, as well as a discussion of the material factors and related conclusions that formed the basis for the Board’s approval of the Fund’s investment advisory agreement andsub-advisory contracts. The Trustees’ review and conclusions are based on the comprehensive consideration of all information presented to them during the course of the year and in prior years and are not the result of any single determinative factor. Moreover, one Trustee may have weighed a particular piece of information or factor differently than another Trustee. This information is current as of June 10, 2019.
Factors and Conclusions and Summary of Independent Written Fee Evaluation
| A. | Nature, Extent and Quality of Services Provided by Invesco Advisers and the AffiliatedSub-Advisers |
The Board reviewed the nature, extent and quality of the advisory services provided to the Fund by Invesco Advisers under the Fund’s investment advisory agreement, and the credentials and experience of the officers and employees of Invesco Advisers who provide these services, including the Fund’s portfolio manager(s). The Board’s review included consideration of Invesco Advisers’ investment process oversight and structure, credit analysis and investment risk management. The Board also considerednon-advisory services that Invesco Advisers and its affiliates provide to the Invesco Funds such as various back office support functions, third party oversight, internal audit, valuation, portfolio trading and legal and compliance. The Board also received and reviewed information about Invesco Advisers’ role as administrator of the Invesco Funds’ liquidity risk management program. The Board also reviewed and considered the benefits to shareholders of investing in a fund that is part of the Invesco family of funds under the umbrella of Invesco Ltd., Invesco Advisers’ parent company, and noted Invesco Ltd.’s depth and experience in conducting an investment
management business, as well as its commitment of financial and other resources to such business. The Board reviewed and considered information about the resources that Invesco Advisers intends to continue to commit to managing the Invesco family of funds following Invesco Ltd.’s acquisition of OppenheimerFunds, Inc. and its subsidiaries. The Board concluded that the nature, extent and quality of the services provided to the Fund by Invesco Advisers are appropriate and satisfactory.
The Board reviewed the services that may be provided by the AffiliatedSub-Advisers under thesub-advisory contracts and the credentials and experience of the officers and employees of the AffiliatedSub-Advisers who provide these services. The Board noted the AffiliatedSub-Advisers’ expertise with respect to certain asset classes and that the AffiliatedSub-Advisers have offices and personnel that are located in financial centers around the world. As a result, the Board noted that the AffiliatedSub-Advisers can provide research and investment analysis on the markets and economies of various countries in which the Fund may invest, make recommendations regarding securities and assist with security trades. The Board concluded that thesub-advisory contracts may benefit the Fund and its shareholders by permitting Invesco Advisers to use the resources and talents of the AffiliatedSub-Advisers in managing the Fund. The Board concluded that the nature, extent and quality of the services that may be provided by the AffiliatedSub-Advisers are appropriate and satisfactory.
| B. | Fund Investment Performance |
The Board considered Fund investment performance as a relevant factor in considering whether to approve the investment advisory agreement. The Board did not view Fund investment performance as a relevant factor in considering whether to approve thesub-advisory contracts for the Fund, as no AffiliatedSub-Adviser currently manages assets of the Fund.
The Board compared the Fund’s investment performance over multiple time periods ending December 31, 2018 to the performance of funds in the Broadridge performance universe and against the Lipper Pacific RegionEx-Japan Funds Index. The Board noted that performance of Class A shares of the Fund was in the second quintile of its performance universe for the one, three and five year periods (the first quintile being the best performing funds and the fifth quintile being the worst performing funds). The Board noted that performance of Class A shares of the Fund was above the performance of the Index for the one, three and five year periods.
24 Invesco Asia Pacific Growth Fund
The Trustees also reviewed more recent Fund performance and this review did not change their conclusions.
| C. | Advisory andSub-Advisory Fees and Fund Expenses |
The Board compared the Fund’s contractual management fee rate to the contractual management fee rates of funds in the Fund’s Broadridge expense group. The Board noted that the contractual management fee rate for Class A shares of the Fund was below the median contractual management fee rate of funds in its expense group. The Board noted that the term “contractual management fee” for funds in the expense group may include both advisory and certainnon-portfolio management administrative services fees, but that Broadridge does not provide information on a fund by fund basis as to what is included. The Board also reviewed the methodology used by Broadridge in providing expense group information, which includes using each fund’s contractual management fee schedule (including any applicable breakpoints) as reported in the most recent prospectus or statement of additional information for each fund in the expense group. The Board also considered comparative information regarding the Fund’s total expense ratio and its various components. The Board noted that the Fund’s actual management fees were in the fifth quintile of its expense group and discussed with management reasons for such relative actual management fees.
The Board noted that Invesco Advisers has contractually agreed to waive fees and/or limit expenses of the Fund for the term disclosed in the Fund’s registration statement in an amount necessary to limit total annual operating expenses to a specified percentage of average daily net assets for each class of the Fund.
The Board noted that Invesco Advisers and the AffiliatedSub-Advisers do not manage other similarly managed mutual funds or client accounts.
The Board also considered the services that may be provided by the AffiliatedSub-Advisers pursuant to thesub-advisory contracts, as well as the fees payable by Invesco Advisers to the AffiliatedSub-Advisers pursuant to thesub-advisory contracts.
| D. | Economies of Scale and Breakpoints |
The Board considered the extent to which there may be economies of scale in the provision of advisory services to the Fund. The Board considered Invesco’s reinvestment in its business, including investments in business infrastructure and cybersecurity. The Board also considered that the Fund benefits from economies of scale through contractual breakpoints in the Fund’s advisory fee schedule, which generally operate to reduce the Fund’s expense ratio as it grows in size. The Board noted that the Fund shares directly in economies of scale through lower fees charged by third party service providers based on the
combined size of the Invesco Funds. The Board noted that the Fund may also benefit from economies of scale through initial fee setting, fee waivers and expense reimbursements.
| E. | Profitability and Financial Resources |
The Board reviewed information from Invesco Advisers concerning the costs of the advisory and other services that Invesco Advisers and its affiliates provide to the Fund and the Invesco Funds and the profitability of Invesco Advisers and its affiliates in providing these services. The Board considered the methodology used for calculating profitability and noted the periodic review of such methodology by an independent consultant. The Board noted that Invesco Advisers continues to operate at a net profit from services Invesco Advisers and its affiliates provide to the Invesco Funds and the Fund. The Board did not deem the level of profits realized by Invesco Advisers and its affiliates from providing services to the Fund to be excessive given the nature, extent and quality of the services provided. The Board received information from Invesco Advisers demonstrating that Invesco Advisers and the AffiliatedSub-Advisers are financially sound and have the resources necessary to perform their obligations under the investment advisory agreement andsub-advisory contracts.
F. Collateral Benefits to Invesco Advisers and its Affiliates
The Board considered various other benefits received by Invesco Advisers and its affiliates from the relationship with the Fund, including the fees received for providing administrative, transfer agency and distribution services to the Fund. The Board considered comparative information regarding fees charged for these services, including information provided by Broadridge and other independent sources. The Board considered the performance of Invesco Advisers and its affiliates in providing these services and the organizational structure employed to provide these services. The Board also considered that these services are provided to the Fund pursuant to written contracts that are reviewed and approved on an annual basis by the Board; and that the services are required for the operation of the Fund.
The Board considered the benefits realized by Invesco Advisers and the AffiliatedSub-Advisers as a result of portfolio brokerage transactions executed through “soft dollar” arrangements. The Board noted that soft dollar arrangements may result in the Fund bearing costs to purchase research that may be used by Invesco Advisers or the AffiliatedSub-Advisers with other clients and may reduce Invesco Advisers’ or the AffiliatedSub-Advisers’ expenses. The Board also considered that it receives periodic reports from Invesco representing that these arrangements are consistent with regulatory requirements. The Board did not deem the soft dollar arrangements to be inappropriate.
The Board considered that the Fund’s uninvested cash and cash collateral from any
securities lending arrangements may be invested in money market funds advised by Invesco Advisers pursuant to procedures approved by the Board. The Board considered information regarding the returns of the affiliated money market funds relative to comparable overnight investments, as well as the costs to the Fund of such investments. The Board noted that Invesco Advisers receives advisory fees from these affiliated money market funds attributable to such investments, although Invesco Advisers has contractually agreed to waive through varying periods the advisory fees payable by the Invesco Funds with respect to certain investments in the affiliated money market funds. The waiver is in an amount equal to 100% of the net advisory fee Invesco Advisers receives from the affiliated money market funds with respect to the Fund’s investment in the affiliated money market funds of uninvested cash, but not cash collateral. The Board concluded that the amount of advisory fees received by Invesco Advisers from the Fund’s investment of cash collateral from any securities lending arrangements in the affiliated money market funds is fair and reasonable.
The Board also considered that an affiliated broker may receive commissions for executing certain trades for the Fund. Invesco Advisers and the AffiliatedSub-Advisers may use the affiliated broker to, among other things, control order routing and minimize information leakage, and the Board was advised that such trades are executed in compliance with rules under the federal securities laws and consistent with best execution obligations.
25 Invesco Asia Pacific Growth Fund
Tax Information
Form1099-DIV, Form1042-S and otheryear-end tax information provide shareholders with actual calendar year amounts that should be included in their tax returns. Shareholders should consult their tax advisors.
The following distribution information is being provided as required by the Internal Revenue Code or to meet a specific state’s requirement.
The Fund designates the following amounts or, if subsequently determined to be different, the maximum amount allowable for its fiscal year ended October 31, 2019:
| | | | | | | | | | |
| | | | | | | | | |
Federal and State Income Tax | | | | | | | | |
Long-Term Capital Gain Distributions | | $ | 37,200,054 | | | | | |
Qualified Dividend Income* | | | 82.57 | % | | | | |
Corporate Dividends Received Deduction* | | | 4.54 | % | | | | |
U.S. Treasury Obligations* | | | 0.00 | % | | | | |
Foreign Taxes | | $ | 0.0475 | | | | per share | |
Foreign Source Income | | $ | 0.7477 | | | | per share | |
|
* The above percentages are based on ordinary income dividends paid to shareholders during the Fund’s fiscal year. |
26 Invesco Asia Pacific Growth Fund
Trustees and Officers
The address of each trustee and officer is AIM International Mutual Funds (Invesco International Mutual Funds) (the “Trust”), 11 Greenway Plaza, Suite 1000, Houston, Texas 77046-1173. The trustees serve for the life of the Trust, subject to their earlier death, incapacitation, resignation, retirement or removal as more specifically provided in the Trust’s organizational documents. Each officer serves for a one year term or until their successors are elected and qualified. Column two below includes length of time served with predecessor entities, if any.
| | | | | | | | |
Name, Year of Birth and
Position(s) Held with the Trust | | Trustee and/or Officer Since | | Principal Occupation(s) During Past 5 Years | | Number of Funds in
Fund Complex
Overseen by
Trustee | | Other
Directorship(s)
Held by Trustee
During Past 5
Years |
| Interested Persons | | | | | | | | |
| Martin L. Flanagan1 - 1960 Trustee and Vice Chair | | 2007 | | Executive Director, Chief Executive Officer and President, Invesco Ltd. (ultimate parent of Invesco and a global investment management firm); Trustee and Vice Chair, The Invesco Funds; Vice Chair, Investment Company Institute; and Member of Executive Board, SMU Cox School of Business Formerly: Advisor to the Board, Invesco Advisers, Inc. (formerly known as Invesco Institutional (N.A.), Inc.); Chairman and Chief Executive Officer, Invesco Advisers, Inc. (registered investment adviser); Director, Chairman, Chief Executive Officer and President, Invesco Holding Company (US), Inc. (formerly IVZ Inc.) (holding company), Invesco Group Services, Inc. (service provider) and Invesco North American Holdings, Inc. (holding company); Director, Chief Executive Officer and President, Invesco Holding Company Limited (parent of Invesco and a global investment management firm); Director, Invesco Ltd.; Chairman, Investment Company Institute and President,Co-Chief Executive Officer,Co-President, Chief Operating Officer and Chief Financial Officer, Franklin Resources, Inc. (global investment management organization) | | 229 | | None |
| Philip A. Taylor2- 1954 Trustee | | 2006 | | Vice Chair, Invesco Ltd.; Trustee, The Invesco Funds Formerly: Director, Invesco Canada Ltd. (formerly known as Invesco Trimark Ltd./Invesco Trimark Ltèe) (registered investment adviser and registered transfer agent); Head of the Americas and Senior Managing Director, Invesco Ltd.; Director, Invesco Advisers, Inc. (formerly known as Invesco Institutional (N.A.), Inc.) (registered investment adviser); Director and Chairman, Invesco Investment Services, Inc. (formerly known as Invesco AIM Investment Services, Inc.) (registered transfer agent); Chief Executive Officer, Invesco Corporate Class Inc. (corporate mutual fund company); Chairman and Chief Executive Officer, Invesco Canada Ltd. (formerly known as Invesco Trimark Ltd./Invesco Trimark Ltèe) (registered investment adviser and registered transfer agent); Senior Vice President, The Invesco Funds; Director, Invesco Investment Advisers LLC (formerly known as Van Kampen Asset Management); Director, Chairman, Chief Executive Officer and President, Invesco Management Group, Inc. (formerly known as Invesco AIM Management Group, Inc.) (financial services holding company);Co-Chairman,Co-President andCo-Chief Executive Officer, Invesco Advisers, Inc. (formerly known as Invesco Institutional (N.A.), Inc.) (registered investment adviser); Director, Chief Executive Officer and President, Van Kampen Exchange Corp; President and Principal Executive Officer, The Invesco Funds (other than AIM Treasurer’s Series Trust (Invesco Treasurer’s Series Trust), Short-Term Investments Trust and Invesco Management Trust); Executive Vice President, The Invesco Funds (AIM Treasurer’s Series Trust (Invesco Treasurer’s Series Trust), Short-Term Investments Trust and Invesco Management Trust only); Director and President, INVESCO Funds Group, Inc. (registered investment adviser and registered transfer agent); Director and Chairman, IVZ Distributors, Inc. (formerly known as INVESCO Distributors, Inc.) (registered broker dealer); Director, President and Chairman, Invesco Inc. (holding company), Invesco Canada Holdings Inc. (holding company), Trimark Investments Ltd./Placements Trimark Ltèe and Invesco Financial Services Ltd/Services Financiers Invesco Ltèe; Chief Executive Officer, Invesco Canada Fund Inc. (corporate mutual fund company); Director and Chairman, Van Kampen Investor Services Inc.; Director, Chief Executive Officer and President, 1371 Preferred Inc. (holding company) and Van Kampen Investments Inc.; Director and President, AIM GP Canada Inc. (general partner for limited partnerships) and Van Kampen Advisors, Inc.; Director and Chief Executive Officer, Invesco Trimark Dealer Inc. (registered broker dealer); Director, Invesco Distributors, Inc. (formerly known as Invesco AIM Distributors, Inc.) (registered broker dealer); Manager, Invesco Capital Management LLC; Director, Chief Executive Officer and President, Invesco Advisers, Inc.; Director, Chairman, Chief Executive Officer and President, Invesco AIM Capital Management, Inc.; President, Invesco Trimark Dealer Inc. and Invesco Trimark Ltd./Invesco Trimark Ltèe; Director and President, AIM Trimark Corporate Class Inc. and AIM Trimark Canada Fund Inc.; Senior Managing Director, Invesco Holding Company Limited; Director and Chairman, Fund Management Company (former registered broker dealer); President and Principal Executive Officer, The Invesco Funds (AIM Treasurer’s Series Trust (Invesco Treasurer’s Series Trust), and Short-Term Investments Trust only); President, AIM Trimark Global Fund Inc. and AIM Trimark Canada Fund Inc. | | 229 | | None |
| 1 | Mr. Flanagan is considered an interested person (within the meaning of Section 2(a)(19) of the 1940 Act) of the Trust because he is an officer of the Adviser to the Trust, and an officer and a director of Invesco Ltd., ultimate parent of the Adviser. |
| 2 | Mr. Taylor is considered an interested person (within the meaning of Section 2(a)(19) of the 1940 Act) of the Trust because he is an officer and a director of the Adviser. |
T-1 Invesco Asia Pacific Growth Fund
Trustees and Officers–(continued)
| | | | | | | | |
Name, Year of Birth and Position(s) Held with the Trust | | Trustee and/or Officer Since | | Principal Occupation(s) During Past 5 Years | | Number of
Funds in
Fund Complex
Overseen by
Trustee | | Other
Directorship(s)
Held by Trustee
During Past 5
Years |
| Independent Trustees | | | | | | | | |
| Bruce L. Crockett - 1944 Trustee and Chair | | 1992 | | Chairman, Crockett Technologies Associates (technology consulting company) Formerly: Director, Captaris (unified messaging provider); Director, President and Chief Executive Officer, COMSAT Corporation; Chairman, Board of Governors of INTELSAT (international communications company); ACE Limited (insurance company); Independent Directors Council and Investment Company Institute: Member of the Audit Committee, Investment Company Institute; Member of the Executive Committee and Chair of the Governance Committee, Independent Directors Council | | 229 | | Director and Chairman of the Audit Committee, ALPS (Attorneys Liability Protection Society) (insurance company); Director and Member of the Audit Committee and Compensation Committee, Ferroglobe PLC (metallurgical company) |
| David C. Arch - 1945 Trustee | | 2010 | | Chairman of Blistex Inc. (consumer health care products manufacturer); Member, World Presidents’ Organization | | 229 | | Board member of the Illinois Manufacturers’ Association |
| Beth Ann Brown - 1968 Trustee | | 2019 | | Independent Consultant Formerly: Head of Intermediary Distribution, Managing Director, Strategic Relations, Managing Director, Head of National Accounts, Senior Vice President, National Account Manager and Senior Vice President, Key Account Manager, Columbia Management Investment Advisers LLC; Vice President, Key Account Manager, Liberty Funds Distributor, Inc.; and Trustee of certain Oppenheimer Funds | | 229 | | Director, Board of Directors of Caron Engineering Inc.; President and Director, Acton Shapleigh Youth Conservation Corps (non - profit); and Vice President and Director of Grahamtastic Connection (non- profit) |
| Jack M. Fields - 1952 Trustee | | 1997 | | Chief Executive Officer, Twenty First Century Group, Inc. (government affairs company); and Chairman, Discovery Learning Alliance(non-profit) Formerly: Owner and Chief Executive Officer, Dos Angeles Ranch L.P. (cattle, hunting, corporate entertainment); Director, Insperity, Inc. (formerly known as Administaff) (human resources provider); Chief Executive Officer, Texana Timber LP (sustainable forestry company); Director of Cross Timbers Quail Research Ranch(non-profit); and member of the U.S. House of Representatives | | 229 | | None |
| Cynthia Hostetler - 1962 Trustee | | 2017 | | Non-Executive Director and Trustee of a number of public and private business corporations Formerly: Director, Aberdeen Investment Funds (4 portfolios); Head of Investment Funds and Private Equity, Overseas Private Investment Corporation; President, First Manhattan Bancorporation, Inc.; Attorney, Simpson Thacher & Bartlett LLP | | 229 | | Vulcan Materials Company (construction materials company); Trilinc Global Impact Fund; Genesee & Wyoming, Inc. (railroads); Artio Global Investment LLC (mutual fund complex); Edgen Group, Inc. (specialized energy and infrastructure products distributor); Investment Company Institute (professional organization); Independent Directors Council (professional organization) |
T-2 Invesco Asia Pacific Growth Fund
Trustees and Officers–(continued)
| | | | | | | | |
Name, Year of Birth and Position(s) Held with the Trust | | Trustee and/or Officer Since | | Principal Occupation(s) During Past 5 Years | | Number of
Funds in Fund Complex
Overseen by
Trustee | | Other
Directorship(s)
Held by Trustee
During Past 5
Years |
| Independent Trustees–(continued) | | | | | | |
Eli Jones - 1961 Trustee | | 2016 | | Professor and Dean, Mays Business School - Texas A&M University Formerly: Professor and Dean, Walton College of Business, University of Arkansas and E.J. Ourso College of Business, Louisiana State University; Director, Arvest Bank | | 229 | | Insperity, Inc. (formerly known as Administaff) (human resources provider) |
| Elizabeth Krentzman - 1959 Trustee | | 2019 | | Formerly: Principal and Chief Regulatory Advisor for Asset Management Services and U.S. Mutual Fund Leader of Deloitte & Touche LLP; General Counsel of the Investment Company Institute (trade association); National Director of the Investment Management Regulatory Consulting Practice, Principal, Director and Senior Manager of Deloitte & Touche LLP; Assistant Director of the Division of Investment Management - Office of Disclosure and Investment Adviser Regulation of the U.S. Securities and Exchange Commission and various positions with the Division of Investment Management - Office of Regulatory Policy of the U.S. Securities and Exchange Commission; Associate at Ropes & Gray LLP; Advisory Board Member of the Securities and Exchange Commission Historical Society; and Trustee of certain Oppenheimer Funds | | 229 | | Trustee of the University of Florida National Board Foundation and Audit Committee Member; Member of the Cartica Funds Board of Directors (private investment funds); Member of the University of Florida Law Center Association, Inc. Board of Trustees and Audit Committee Member |
| Anthony J. LaCava, Jr. - 1956 Trustee | | 2019 | | Formerly: Director and Member of the Audit Committee, Blue Hills Bank (publicly traded financial institution) and Managing Partner, KPMG LLP | | 229 | | Blue Hills Bank; Chairman, Bentley University; Member, Business School Advisory Council; and Nominating Committee KPMG LLP |
| Prema Mathai-Davis - 1950 Trustee | | 1998 | | Retired Co-Owner & Partner of Quantalytics Research, LLC, (a FinTech Investment Research Platform for the Self-Directed Investor) | | 229 | | None |
| Joel W. Motley - 1952 Trustee | | 2019 | | Director of Office of Finance, Federal Home Loan Bank; Member of the Vestry of Trinity Wall Street; Managing Director of Carmona Motley Inc. (privately held financial advisor); Member of the Finance and Budget Committee of the Council on Foreign Relations, Member of the Investment Committee and Board of Human Rights Watch and Member of the Investment Committee and Board of Historic Hudson Valley(non-profit cultural organization) Formerly: Managing Director of Public Capital Advisors, LLC (privately held financial advisor); Managing Director of Carmona Motley Hoffman, Inc. (privately held financial advisor); Trustee of certain Oppenheimer Funds; and Director of Columbia Equity Financial Corp. (privately held financial advisor) | | 229 | | Director of Greenwall Foundation (bioethics research foundation); Member of Board and Investment Committee of The Greenwall Foundation; Director of Southern Africa Legal Services Foundation; Board Member and Investment Committee Member of Pulizer Center for Crisis Reporting(non-profit journalism) |
| Teresa M. Ressel - 1962 Trustee | | 2017 | | Non-executive director and trustee of a number of public and private business corporations Formerly: Chief Financial Officer, Olayan America, The Olayan Group (international investor/commercial/industrial); Chief Executive Officer, UBS Securities LLC; Group Chief Operating Officer, Americas, UBS AG; Assistant Secretary for Management & Budget and CFO, US Department of the Treasury | | 229 | | Atlantic Power Corporation (power generation company); ON Semiconductor Corp. (semiconductor supplier) |
T-3 Invesco Asia Pacific Growth Fund
Trustees and Officers–(continued)
| | | | | | | | |
Name, Year of Birth and
Position(s) Held with the Trust | | Trustee
and/or
Officer Since | | Principal Occupation(s) During Past 5 Years | | Number of Funds
in
Fund Complex
Overseen by
Trustee | | Other
Directorship(s)
Held by Trustee
During Past 5
Years |
| Independent Trustees–(continued) | | | | |
| Ann Barnett Stern - 1957 Trustee | | 2017 | | President and Chief Executive Officer, Houston Endowment Inc. (private philanthropic institution) Formerly: Executive Vice President and General Counsel, Texas Children’s Hospital; Attorney, Beck, Redden and Secrest, LLP; Business Law Instructor, University of St. Thomas; Attorney, Andrews & Kurth LLP | | 229 | | Federal Reserve Bank of Dallas |
| Raymond Stickel, Jr. - 1944 Trustee | | 2005 | | Retired Formerly: Director, Mainstay VP Series Funds, Inc. (25 portfolios); Partner, Deloitte & Touche | | 229 | | None |
| Robert C. Troccoli - 1949 Trustee | | 2016 | | Retired Formerly: Adjunct Professor, University of Denver - Daniels College of Business; Senior Partner, KPMG LLP | | 229 | | None |
| Daniel S. Vandivort - 1954 Trustee | | 2019 | | Treasurer, Chairman of the Audit and Finance Committee, and Trustee, Board of Trustees, Huntington Disease Foundation of America; and President, Flyway Advisory Services LLC (consulting and property management) Formerly: Trustee and Governance Chair, of certain Oppenheimer Funds | | 229 | | Chairman and Lead Independent Director, Chairman of the Audit Committee, and Director, Board of Directors, Value Line Funds |
| James D. Vaughn - 1945 Trustee | | 2019 | | Retired Formerly: Managing Partner, Deloitte & Touche LLP; Trustee and Chairman of the Audit Committee, Schroder Funds; Board Member, Mile High United Way, Boys and Girls Clubs, Boy Scouts, Colorado Business Committee for the Arts, Economic Club of Colorado and Metro Denver Network (economic development corporation); and Trustee of certain Oppenheimer Funds | | 229 | | Board member and Chairman of Audit Committeeof AMG National Trust Bank; Trustee and Investment Committee member, University of South Dakota Foundation; Board member, Audit Committee Member and past Board Chair, Junior Achievement(non-profit) |
| Christopher L. WIlson - 1957 Trustee, Vice Chair and Chair Designate | | 2017 | | Reitred Formerly: Director, TD Asset Management USA Inc. (mutual fund complex) (22 portfolios); Managing Partner, CT2, LLC (investing and consulting firm); President/Chief Executive Officer, Columbia Funds, Bank of America Corporation; President/Chief Executive Officer, CDC IXIS Asset Management Services, Inc.; Principal & Director of Operations, Scudder Funds, Scudder, Stevens & Clark, Inc.; Assistant Vice President, Fidelity Investments | | 229 | | ISO New England, Inc.(non-profit organization managing regional electricity market) |
T-4 Invesco Asia Pacific Growth Fund
Trustees and Officers–(continued)
| | | | | | | | | | |
Name, Year of Birth and
Position(s) Held with the Trust | | Trustee and/or Officer Since | | Principal Occupation(s) During Past 5 Years | | Number of
Funds in
Fund Complex
Overseen by
Trustee | | | Other
Directorship(s)
Held by Trustee
During Past 5
Years |
| Other Officers | | | | | | | | |
| | | | | |
| Sheri Morris - 1964 President, Principal Executive Officer and Treasurer | | 1999 | | Head of Global Fund Services, Invesco Ltd.; President, Principal Executive Officer and Treasurer, The Invesco Funds; Vice President, Invesco Advisers, Inc. (formerly known as Invesco Institutional (N.A.), Inc.) (registered investment adviser); and Vice President, Invesco Exchange-Traded Fund Trust, Invesco Exchange-Traded Fund Trust II, Invesco India Exchange-Traded Fund Trust, Invesco Actively Managed Exchange-Traded Fund Trust, Invesco Actively Managed Exchange-Traded Commodity Fund Trust and Invesco Exchange-Traded Self-Indexed Fund Trust; and Vice President, OppenheimerFunds, Inc. Formerly: Vice President and Principal Financial Officer, The Invesco Funds; Vice President, Invesco AIM Advisers, Inc., Invesco AIM Capital Management, Inc. and Invesco AIM Private Asset Management, Inc.; Assistant Vice President and Assistant Treasurer, The Invesco Funds and Assistant Vice President, Invesco Advisers, Inc., Invesco AIM Capital Management, Inc. and Invesco AIM Private Asset Management, Inc.; and Treasurer, Invesco Exchange-Traded FundTrust, Invesco Exchange-Traded Fund Trust II, Invesco India Exchange-Traded Fund Trust and Invesco Actively Managed Exchange-Traded Fund Trust | | | N/A | | | N/A |
| | | | | |
| Russell C. Burk - 1958 Senior Vice President and Senior Officer | | 2005 | | Senior Vice President and Senior Officer, The Invesco Funds | | | N/A | | | N/A |
| | | | | |
| Jeffrey H. Kupor - 1968 Senior Vice President, Chief Legal Officer and Secretary | | 2018 | | Head of Legal of the Americas, Invesco Ltd.; Senior Vice President and Secretary, Invesco Advisers, Inc. (formerly known as Invesco Institutional (N.A.), Inc.) (registered investment adviser); Senior Vice President and Secretary, Invesco Distributors, Inc. (formerly known as Invesco AIM Distributors, Inc.); Vice President and Secretary, Invesco Investment Services, Inc. (formerly known as Invesco AIM Investment Services, Inc.) Senior Vice President, Chief Legal Officer and Secretary, The Invesco Funds; Secretary and General Counsel, Invesco Investment Advisers LLC (formerly known as Van Kampen Asset Management); Secretary and General Counsel, Invesco Capital Markets, Inc. (formerly known as Van Kampen Funds Inc.) and Chief Legal Officer, Invesco Exchange-Traded Fund Trust, Invesco Exchange-Traded Fund Trust II, Invesco India Exchange-Traded Fund Trust, Invesco Actively Managed Exchange-Traded Fund Trust, Invesco Actively Managed Exchange-Traded Commodity Fund Trust and Invesco Exchange-Traded Self-Indexed Fund Trust; Secretary, Invesco Indexing LLC; Secretary, W.L. Ross & Co., LLC Formerly: Secretary and Vice President, Jemstep, Inc.; Head of Legal, Worldwide Institutional, Invesco Ltd.; Secretary and General Counsel, INVESCO Private Capital Investments, Inc.; Senior Vice President, Secretary and General Counsel, Invesco Management Group, Inc. (formerly known as Invesco AIM Management Group, Inc.); Assistant Secretary, INVESCO Asset Management (Bermuda) Ltd.; Secretary and General Counsel, Invesco Private Capital, Inc.; Assistant Secretary and General Counsel, INVESCO Realty, Inc.; Secretary and General Counsel, Invesco Senior Secured Management, Inc.; and Secretary, Sovereign G./P. Holdings Inc. | | | N/A | | | N/A |
| | | | | |
| Andrew R. Schlossberg - 1974 Senior Vice President | | 2019 | | Head of the Americas and Senior Managing Director, Invesco Ltd.; Director and Senior Vice President, Invesco Advisers, Inc. (formerly known as Invesco Institutional (N.A.), Inc.) (registered investment adviser); Director and Chairman, Invesco Investment Services, Inc. (formerly known as Invesco AIM Investment Services, Inc.) (registered transfer agent); Senior Vice President, The Invesco Funds; Director, Invesco Investment Advisers LLC (formerly known as Van Kampen Asset Management); Director, President and Chairman, Invesco Insurance Agency, Inc. Formerly: Director, Invesco UK Limited; Director and Chief Executive, Invesco Asset Management Limited and Invesco Fund Managers Limited; Assistant Vice President, The Invesco Funds; Senior Vice President, Invesco Advisers, Inc. (formerly known as Invesco Institutional (N.A.), Inc.) (registered investment adviser); Director and Chief Executive, Invesco Administration Services Limited and Invesco Global Investment Funds Limited; Director, Invesco Distributors, Inc.; Head of EMEA, Invesco Ltd.; President, Invesco Actively Managed Exchange-Traded Commodity Fund Trust, Invesco Actively Managed Exchange-Traded Fund Trust, Invesco Exchange-Traded Fund Trust, Invesco Exchange-Traded Fund Trust II and Invesco India Exchange-Traded Fund Trust; Managing Director and Principal Executive Officer, Invesco Capital Management LLC | | | N/A | | | N/A |
T-5 Invesco Asia Pacific Growth Fund
Trustees and Officers–(continued)
| | | | | | | | |
Name, Year of Birth and
Position(s) Held with the Trust | | Trustee and/or Officer Since | | Principal Occupation(s) During Past 5 Years | | Number of
Funds in
Fund Complex
Overseen by
Trustee | | Other Directorship(s) Held by Trustee During Past 5 Years |
| Other Officers–(continued) | | | | | | |
| John M. Zerr - 1962 Senior Vice President | | 2006 | | Chief Operating Officer of the Americas; Senior Vice President, Invesco Advisers, Inc. (formerly known as Invesco Institutional (N.A.), Inc.) (registered investment adviser); Senior Vice President, Invesco Distributors, Inc. (formerly known as Invesco AIM Distributors, Inc.); Director and Vice President, Invesco Investment Services, Inc. (formerly known as Invesco AIM Investment Services, Inc.) Senior Vice President, The Invesco Funds; Managing Director, Invesco Capital Management LLC; Director, Invesco Investment Advisers LLC (formerly known as Van Kampen Asset Management); Senior Vice President, Invesco Capital Markets, Inc. (formerly known as Van Kampen Funds Inc.); Manager, Invesco Indexing LLC; Manager, Invesco Specialized Products, LLC; Director and Senior Vice President, Invesco Insurance Agency, Inc.; Member, Invesco Canada Funds Advisory Board; Director, President and Chief Executive Officer, Invesco Corporate Class Inc. (corporate mutual fund company); and Director, Chairman, President and Chief Executive Officer, Invesco Canada Ltd. (formerly known as Invesco Trimark Ltd./Invesco Trimark Ltèe) (registered investment adviser and registered transfer agent) Formerly: Director and Senior Vice President, Invesco Management Group, Inc. (formerly known as Invesco AIM Management Group, Inc.); Secretary and General Counsel, Invesco Management Group, Inc. (formerly known as Invesco AIM Management Group, Inc.); Secretary, Invesco Investment Services, Inc. (formerly known as Invesco AIM Investment Services, Inc.); Chief Legal Officer and Secretary, The Invesco Funds; Secretary and General Counsel, Invesco Investment Advisers LLC (formerly known as Van Kampen Asset Management); Secretary and General Counsel, Invesco Capital Markets, Inc. (formerly known as Van Kampen Funds Inc.); Chief Legal Officer, Invesco Exchange-Traded Fund Trust, Invesco Exchange-Traded Fund Trust II, Invesco India Exchange-Traded Fund Trust, Invesco Actively Managed Exchange-Traded Fund Trust, Invesco Actively Managed Exchange-Traded Commodity Fund Trust and Invesco Exchange-Traded Self-Indexed Fund Trust; Secretary, Invesco Indexing LLC; Director, Secretary, General Counsel and Senior Vice President, Van Kampen Exchange Corp.; Director, Vice President and Secretary, IVZ Distributors, Inc. (formerly known as INVESCO Distributors, Inc.); Director and Vice President, INVESCO Funds Group, Inc.; Director and Vice President, Van Kampen Advisors Inc.; Director, Vice President, Secretary and General Counsel, Van Kampen Investor Services Inc.;Director and Secretary, Invesco Distributors, Inc. (formerly known as Invesco AIM Distributors, Inc.); Director, Senior Vice President, General Counsel and Secretary, Invesco AIM Advisers, Inc. and Van Kampen Investments Inc.; Director, Vice President and Secretary, Fund Management Company; Director, Senior Vice President, Secretary, General Counsel and Vice President, Invesco AIM Capital Management, Inc.; Chief Operating Officer and General Counsel, Liberty Ridge Capital, Inc. (an investment adviser) | | N/A | | N/A |
Gregory G. McGreevey - 1962 Senior Vice President | | 2012 | | Senior Managing Director, Invesco Ltd.; Director, Chairman, President, and Chief Executive Officer, Invesco Advisers, Inc. (formerly known as Invesco Institutional (N.A.), Inc.) (registered investment adviser); Director, Invesco Mortgage Capital, Inc. and Invesco Senior Secured Management, Inc.; and Senior Vice President, The Invesco Funds; and President, SNW Asset Management Corporation Formerly: Senior Vice President, Invesco Management Group, Inc. and Invesco Advisers, Inc.; Assistant Vice President, The Invesco Funds | | N/A | | N/A |
Kelli Gallegos - 1970 Vice President, Principal Financial Officer and Assistant Treasurer | | 2008 | | Principal Financial and Accounting Officer – Investments Pool, Invesco Specialized Products, LLC; Vice President, Principal Financial Officer and Assistant Treasurer, The Invesco Funds; Principal Financial and Accounting Officer – Pooled Investments, Invesco Capital Management LLC; Vice President and Treasurer, Invesco Exchange-Traded Fund Trust, Invesco Exchange-Traded Fund Trust II, Invesco India Exchange-Traded Fund Trust, Invesco Actively Managed Exchange-Traded Fund Trust, Invesco Actively Managed Exchange-Traded Commodity Fund Trust and Invesco Exchange-Traded Self-Indexed Fund Trust Formerly: Assistant Treasurer, Invesco Specialized Products, LLC; Assistant Treasurer, Invesco Exchange-Traded Fund Trust, Invesco Exchange-Traded Fund Trust II, Invesco India Exchange-Traded Fund Trust, Invesco Actively Managed Exchange-Traded Fund Trust, Invesco Actively Managed Exchange-Traded Commodity Fund Trust and Invesco Exchange-Traded Self-Indexed Fund Trust; Assistant Treasurer, Invesco Capital Management LLC; Assistant Vice President, The Invesco Funds | | N/A | | N/A |
T-6 Invesco Asia Pacific Growth Fund
Trustees and Officers–(continued)
| | | | | | | | |
Name, Year of Birth and
Position(s) Held with the Trust | | Trustee
and/or Officer
Since | | Principal Occupation(s) During Past 5 Years | | Number of
Funds in
Fund Complex
Overseen by
Trustee | | Other Directorship(s) Held by Trustee During Past 5 Years |
| Other Officers–(continued) |
| | | | | |
| Crissie M. Wisdom - 1969 Anti-Money Laundering Compliance Officer | | 2013 | | Anti-Money Laundering Compliance Officer, Invesco Advisers, Inc. (formerly known as Invesco Institutional (N.A.), Inc.) (registered investment adviser), Invesco Capital Markets, Inc. (formerly known as Van Kampen Funds Inc.), Invesco Distributors, Inc., Invesco Investment Services, Inc., The Invesco Funds, and Invesco Exchange-Traded Fund Trust, Invesco Exchange-Traded Fund Trust II, Invesco India Exchange-Traded Fund Trust, Invesco Actively Managed Exchange-Traded Fund Trust, Invesco Actively Managed Exchange-Traded Commodity Fund Trust and Invesco Exchange-Traded Self-Indexed Fund Trust; Anti-Money Laundering Compliance Officer and Bank Secrecy Act Officer, INVESCO National Trust Company and Invesco Trust Company; and Fraud Prevention Manager and Controls and Risk Analysis Manager for Invesco Investment Services, Inc. Formerly: Anti-Money Laundering Compliance Officer, Van Kampen Exchange Corp. and Invesco Management Group, Inc. | | N/A | | N/A |
| | | | | |
| Robert R. Leveille - 1969 Chief Compliance Officer | | 2016 | | Chief Compliance Officer, Invesco Advisers, Inc. (registered investment adviser); and Chief Compliance Officer, The Invesco Funds Formerly: Chief Compliance Officer, Putnam Investments and the Putnam Funds | | N/A | | N/A |
The Statement of Additional Information of the Trust includes additional information about the Fund’s Trustees and is available upon request, without charge, by calling 1.800.959.4246. Please refer to the Fund’s Statement of Additional Information for information on the Fund’ssub-advisers.
| | | | | | |
| Office of the Fund11 Greenway Plaza, Suite 1000 Houston, TX 77046-1173 | | Investment Adviser Invesco Advisers, Inc. 1555 Peachtree Street, N.E. Atlanta, GA 30309 | | Distributor Invesco Distributors, Inc. 11 Greenway Plaza, Suite 1000 Houston, TX 77046-1173 | | AuditorsPricewaterhouseCoopers LLP 1000 Louisiana Street, Suite 5800 Houston, TX 77002-5678 |
| | | |
Counsel to the Fund Stradley Ronon Stevens & Young, LLP 2005 Market Street, Suite 2600 Philadelphia, PA 19103-7018 | | Counsel to the Independent TrusteesGoodwin Procter LLP 901 New York Avenue, N.W. Washington, D.C. 20001 | | Transfer Agent Invesco Investment Services, Inc. 11 Greenway Plaza, Suite 1000 Houston, TX 77046-1173 | | Custodian State Street Bank and Trust Company 225 Franklin Street Boston, MA 02110-2801 |
T-7 Invesco Asia Pacific Growth Fund
(This page intentionally left blank)
(This page intentionally left blank)

Go paperless with eDelivery
Visit invesco.com/edelivery to enjoy the convenience and security of anytime electronic access to your investment documents.
With eDelivery, you can elect to have any or all of the following materials delivered straight to your inbox to download, save and print from your own computer:
∎ Fund reports and prospectuses
∎ Quarterly statements
∎ Daily confirmations
∎ Tax forms
Invesco mailing information
Send general correspondence to Invesco Investment Services, Inc., P.O. Box 219078, Kansas City, MO 64121-9078.
Important notice regarding delivery of security holder documents
To reduce Fund expenses, only one copy of most shareholder documents may be mailed to shareholders with multiple accounts at the same address (Householding). Mailing of your shareholder documents may be householded indefinitely unless you instruct us otherwise. If you do not want the mailing of these documents to be combined with those for other members of your household, please contact Invesco Investment Services, Inc. at 800 959 4246 or contact your financial institution. We will begin sending you individual copies for each account within 30 days after receiving your request.
Fund holdings and proxy voting information
The Fund provides a complete list of its holdings four times in each fiscal year, at the quarter-ends. For the second and fourth quarters, the list appears in the Fund’s semiannual and annual reports to shareholders. For the first and third quarters, the Fund files the lists with the Securities and Exchange Commission (SEC) as an exhibit to its reports on FormN-PORT. The most recent list of portfolio holdings is available at invesco.com/completeqtrholdings. Shareholders can also look up the Fund’s FormN-PORT filings on the SEC website, sec.gov. The SEC file numbers for the Fund are shown below.
A description of the policies and procedures that the Fund uses to determine how to vote proxies relating to portfolio securities is available without charge, upon request, from our Client Services department at 800 959 4246, or at invesco.com/proxyguidelines. The information is also available on the SEC website, sec.gov.
| | |
| Information regarding how the Fund voted proxies related to its portfolio securities during the most recent12-month period ended June 30 is available at invesco.com/proxysearch. This information is also available on the SEC website, sec.gov. | |  |
| Invesco Advisers, Inc. is an investment adviser; it provides investment advisory services to individual and institutional clients and does not sell securities. Invesco Distributors, Inc. is the US distributor for Invesco Ltd.’s retail mutual funds, exchange-traded funds and institutional money market funds. Both are wholly owned, indirect subsidiaries of Invesco Ltd. |
| | | | |
| SEC file numbers:811-06463 and033-44611 | | Invesco Distributors, Inc. | | APG-AR-1 |
| | | | |
| | |
 | | Annual Report to Shareholders | | October 31, 2019 |
| | |
| | Invesco European Growth Fund |
| | Nasdaq: | | |
| | A: AEDAX∎ C: AEDCX∎ R: AEDRX∎ Y: AEDYX∎ Investor: EGINX∎ R6: AEGSX |

Letters to Shareholders
| | |

Andrew Schlossberg | | Dear Shareholders: This annual report includes information about your Fund, including performance data and a complete list of its investments as of the close of the reporting period. Inside is a discussion of how your Fund was managed and the factors that affected its performance during the reporting period. Despite marked market volatility along the way, most global equity markets produced solid gains for the reporting period. As the reporting period unfolded in the final months of 2018, global equities were reeling from a sharpsell-off. The catalyst for thesell-off was a combination of ongoing trade concerns between the US and China, fears of a global economic slowdown and lower oil prices from a supply glut. Gains posted earlier in 2018 for global equities were erased, while US Treasury bonds, along with government and municipal bonds, rallied as investors fled to “safe haven” assets. |
At the start of 2019, global equity markets rebounded strongly buoyed by more policy from central banks and optimism about a potentialUS-China trade deal. In May,US-China trade concerns and slowing global growth led to a global equitysell-off and rally in US Treasuries. Despite the Maysell-off, domestic equity markets rallied in June in anticipation of a US Federal Reserve (the Fed) interest rate cut and closed the second quarter with modest gains. ContinuedUS-China trade worries and signs of slowing global economic growth left global equity markets largely flat for the third quarter. As the reporting period came to a close in October 2019, a raft of upbeat positive corporate earnings results and a US interest rate cut buoyed domestic equity results with some domestic indices recording record highs.
The Fed, in fact, both raised and lowered the federal funds rate during the reporting period. Given signs of a strong economy, the Fed raised rates in December 2018. In 2019, however, the Fed altered its outlook on further rate hikes leaving rates unchanged for the first half of the year. In July, the Fed lowered interest rates for the first time in 11 years. It again lowered rates in September and once again in October. As the year continues to unfold, we’ll see how the interplay of interest rates, economic data, geopolitics and a host of other factors affect US and overseas equity and fixed income markets.
Investor uncertainty and market volatility, such as we witnessed during the reporting period, are unfortunate facts of life when it comes to investing. That’s why Invesco encourages investors to work with a professional financial adviser who can stress the importance of starting to save and invest early and the importance of adhering to a disciplined investment plan. A financial adviser who knows your unique financial situation, investment goals and risk tolerance can be an invaluable partner as you seek to achieve your financial goals. He or she can offer a long-term perspective when markets are volatile and time-tested advice and guidance when your financial situation or investment goals change.
Visit our website for more information on your investments
Our website, invesco.com/us, offers a wide range of market insights and investment perspectives. On the website, you’ll find detailed information about our funds, including performance, holdings and portfolio manager commentaries. You can access information about your account by completing a simple, secure online registration. To do so, select “Log In” on the right side of the homepage, and then select “Register for Individual Account Access.”
In addition to the resources accessible on our website and through our mobile app, you can obtain timely updates to help you stay informed about the markets and the economy by connecting with Invesco on Twitter, LinkedIn or Facebook. You can access our blog at blog.invesco.us.com. Our goal is to provide you the information you want, when and where you want it.
Finally, I’m pleased to share with you Invesco’s commitment to both the Principles for Responsible Investment and to considering environmental, social and governance issues in our robust investment process. I invite you to learn more at invesco.com/esg.
Have questions?
For questions about your account, contact an Invesco client services representative at 800 959 4246.
All of us at Invesco look forward to serving your investment management needs. Thank you for investing with us.
Sincerely,

Andrew Schlossberg
Head of the Americas,
Senior Managing Director, Invesco Ltd.
2 Invesco European Growth Fund
| | |

Bruce Crockett | | Dear Shareholders: Among the many important lessons I’ve learned in more than 40 years in a variety of business endeavors is the value of a trusted advocate. As independent chair of the Invesco Funds Board, I can assure you that the members of the Board are strong advocates for the interests of investors in Invesco’s mutual funds. We work hard to represent your interests through oversight of the quality of the investment management services your funds receive and other matters important to your investment, including but not limited to: ∎ Ensuring that Invesco offers a diverse lineup of mutual funds that your financial adviser can use to strive to meet your financial needs as your investment goals change over time. ∎ Monitoring how the portfolio management teams of the Invesco funds are performing in light |
of changing economic and market conditions. |
| ∎ | | Assessing each portfolio management team’s investment performance within the context of the investment strategy described in the fund’s prospectus. |
| ∎ | | Monitoring for potential conflicts of interests that may impact the nature of the services that your funds receive. |
We believe one of the most important services we provide our fund shareholders is the annual review of the funds’ advisory andsub-advisory contracts with Invesco Advisers and its affiliates. This review is required by the Investment Company Act of 1940 and focuses on the nature and quality of the services Invesco provides as the adviser to the Invesco funds and the reasonableness of the fees that it charges for those services. Each year, we spend months carefully reviewing information received from Invesco and a variety of independent sources, such as performance and fee data prepared by Lipper, Inc. (a subsidiary of Broadridge Financial Solutions, Inc.), an independent, third-party firm widely recognized as a leader in its field. We also meet with our independent legal counsel and other independent advisers to review and help us assess the information that we have received. Our goal is to assure that you receive quality investment management services for a reasonable fee.
I trust the measures outlined above provide assurance that you have a worthy advocate when it comes to choosing the Invesco Funds.
On behalf of the Board, we look forward to continuing to represent your interests and serving your needs.
Sincerely,

Bruce L. Crockett
Independent Chair
Invesco Funds Board of Trustees
3 Invesco European Growth Fund
Management’s Discussion of Fund Performance
| | | | |
| Performance summary | | | |
|
For the fiscal year ended October 31, 2019, Class A shares of Invesco European Growth Fund (the Fund), at net asset value (NAV), underperformed the MSCI Europe Growth Index, the Fund’s style-specific benchmark. | |
|
Your Fund’s long-term performance appears later in this report. | |
Fund vs. Indexes | |
Total returns, October 31, 2018 to October 31, 2019, at net asset value (NAV). Performance shown does not include applicable contingent deferred sales charges (CDSC) orfront-end sales charges, which would have reduced performance. | |
| |
Class A Shares | | | 10.57 | % |
| |
Class C Shares | | | 9.72 | |
| |
Class R Shares | | | 10.26 | |
| |
Class Y Shares | | | 10.81 | |
| |
Investor Class Shares | | | 10.61 | |
| |
Class R6 Shares | | | 10.96 | |
| |
MSCI Europe Index▼(Broad Market Index) | | | 10.90 | |
| |
MSCI Europe Growth Index▼(Style-Specific Index) | | | 16.89 | |
| |
Lipper European Funds Index∎(Peer Group Index) | | | 9.34 | |
|
Source(s):▼RIMES Technologies Corp.;∎Lipper Inc. | |
Market conditions and your Fund
The fiscal year began with global equity markets, particularly the US, declining sharply at the end of 2018 amid rising interest rates; a flattening US Treasury yield curve, signaling a possible recession; and concerns that higher inflation could result in a more restrictive monetary policy. Investors also had concerns over the Brexit negotiations, ongoing trade tensions between the US and China, declining oil prices and fears of slowing economic growth, particularly in the eurozone.
After a relatively calm start at the beginning of 2019, global equity markets faced greater volatility in the second quarter and third quarter, hampered by ongoingUS-China trade issues, potential for new tariffs and weakening global economic data. Trade and tariff issues, which were not limited to the US and China, clouded the outlook for many global economies. Disagreement within
the UK about its withdrawal from the European Union increased uncertainty for the UK and eurozone economies.
Global equity markets gained in October 2019 amid several positive catalysts, including a US interest rate cut, optimism surroundingUS-China trade negotiations, and a raft of upbeat corporate results. The UK equity market provided a flat return during October and while domestic politics continued to dominate the region, European markets made modest gains. October was also a positive month for emerging equity markets with all regions recording gains. Despite increased market volatility, global equity indexes, in both developed and emerging markets, ended the fiscal year in positive territory.
Regardless of the macroeconomic environment, we remain focused on ourbottom-up investment approach of identifying attractive companies that fit our earnings, quality and valuation (EQV) process.
| | |
| Portfolio Composition |
| By sector | | % of total net assets |
| | | | |
| |
Industrials | | | 32.89 | % |
| |
Financials | | | 22.85 | |
| |
Consumer Staples | | | 9.79 | |
| |
Health Care | | | 7.56 | |
| |
Consumer Discretionary | | | 6.65 | |
| |
Communication Services | | | 4.18 | |
| |
Energy | | | 4.12 | |
| |
Information Technology | | | 2.88 | |
| |
Other Sectors, Each Less than 2% of Net Assets | | | 2.56 | |
| |
Money Market Funds Plus Other Assets Less Liabilities | | | 6.52 | |
| | |
| Top 10 Equity Holdings* |
| | | % of total net assets |
| | | | |
| |
1. Sberbank of Russia PJSC, Preference Shares | | | 5.86 | % |
| |
2. DCC PLC | | | 5.01 | |
| |
3. Deutsche Boerse AG | | | 2.89 | |
| |
4. SAP S.E. | | | 2.88 | |
| |
5. Wolters Kluwer N.V. | | | 2.87 | |
| |
6. Investor AB, Class B | | | 2.77 | |
| |
7. MorphoSys AG | | | 2.75 | |
| |
8. Philip Morris International, Inc. | | | 2.59 | |
| |
9. Allianz S.E. | | | 2.43 | |
| |
10. MTU Aero Engines AG | | | 2.38 | |
The Fund underperformed its style-specific index, the MSCI Europe Growth Index, for the fiscal year. Stock selection and overweight exposure to the energy sector was among the largest detractors from the Fund’s relative performance. Within the sector,UK-basedJohn Wood Groupwas a notable detractor from the Fund’s relative return. The company is in a transition year due to the integration of the Amec Foster Wheeler acquisition.
The oil & gas industry has been out of favor and the difficult industry conditions make it more challenging for Wood to demonstrate the benefits of the deal. However, the company announced the sale of its nuclear business, which should address any balance sheet concern. The Fund’s holdings in the consumer staples sector underperformed those of the style-specific index and detracted from the Fund’s relative results for the fiscal year. Lack of exposure to strong index performers, including Switzerland-based food processing company Nestle andUK-based beverage company Diageo, hampered the Fund’s relative results.UK-basedBritish American Tobacco was a notable detractor from the Fund’s relative performance as well. After strong performance at the beginning of 2019, the second quarter saw valuation multiples compress in the tobacco sector due to growth concerns in the US. On a geographic basis, the Fund’s holdings in France and the UK underperformed those of the style-specific index and were among the largest detractors from the Fund’s relative performance. In a rising market environment, the Fund’s cash exposure (which averaged around 7.5% during the fiscal year) detracted from the Fund’s performance relative to the style-specific index. It is important to note that cash is a residual of ourbottom-up investment process and not the result of
| | | | |
| | |
Total Net Assets | | $ | 1.3 billion | |
| |
Total Number of Holdings* | | | 55 | |
The Fund’s holdings are subject to change, and there is no assurance that the Fund will continue to hold any particular security.
*Excluding money market fund holdings, if any. Data presented here are as of October 31, 2019.
4 Invesco European Growth Fund
anytop-down tactical asset allocation or risk-management allocation decision.
In contrast, stock selection in the financials sector was the largest contributor to the Fund’s relative performance during the fiscal year. Within the sector,Sberbank of Russiawas a key contributor to the Fund’s absolute and relative results. The Russian bank has continued to deliver strong returns despite a lack-luster Russian economy. Investor perceptions have also improved, partly because Russia’s economy has shown it can function reasonably under sanctions and partly because investors may be distracted by other concerns, including trade wars to which other economies are far more exposed and Middle East flare-ups. The Fund’s holdings in the real estate sector also added to relative Fund performance.UK-based global real estate servicesSavillshad a positive impact on the Fund’s absolute and relative return for the fiscal year. Geographically, stock selection in Germany and exposure to Russia, an area not represented in the style-specific index, were among the largest contributors to the Fund’s relative performance.
During the fiscal year, we continued to look for opportunities to improve the growth potential and quality of the Fund’s portfolio by adding companies based on our EQV outlook for each company. We added several new holdings, including France-based testing, inspection and certification services companyBureau Veritas; Ireland-based contract research organization companyICON; Netherlands-based oil and gas equipment and services companySBM Offshore; and Switzerland-based leading vision care and device holdingAlcon. We sold several holdings, including financials companyIsrael Discount Bank,UK-based asset management companyStandard Life AberdeenandUK-based consumer staples companyUnilever. After owning consumer products maker Unilever for over a decade, we exited our position in early 2019 driven by concerns about rising valuation levels, higher risks to the business, as well as turnover in management.
As always, regardless of the macro-economic environment, we remain focused on abottom-up investment approach of identifying attractive companies that fit ourEQV-focused investment process. We continue to look forhigh-quality growth companies that exhibit the following characteristics: strong organic revenue growth; high returns on capital; pricing power; strong
balance sheets; cash generation; effective capital allocation and reasonable valuations. In addition, we continue to favor companies that are resilient in weak economic environments. Our balancedEQV-focused approach aligns with our goal of delivering attractive returns over the long term.
We thank you for your continued investment in Invesco European Growth Fund.
Portfolio managers:
Matthew Dennis
Borge Endresen
Jason Holzer - Lead
Richard Nield
Clas Olsson - Lead
The views and opinions expressed in management’s discussion of Fund performance are those of Invesco Advisers, Inc. These views and opinions are subject to change at any time based on factors such as market and economic conditions. These views and opinions may not be relied upon as investment advice or recommendations, or as an offer for a particular security. The information is not a complete analysis of every aspect of any market, country, industry, security or the Fund. Statements of fact are from sources considered reliable, but Invesco Advisers, Inc. makes no representation or warranty as to their completeness or accuracy. Although historical performance is no guarantee of future results, these insights may help you understand our investment management philosophy.
See important Fund and, if applicable, index disclosures later in this report.
5 Invesco European Growth Fund
Your Fund’s Long-Term Performance
Results of a $10,000 Investment – Oldest Share Class(es)
Fund and index data from 10/31/09
| 1 | Source: RIMES Technologies Corp. |
Past performance cannot guarantee comparable future results.
The data shown in the chart include reinvested distributions, applicable sales charges and Fund expenses including
management fees. Index results include reinvested dividends, but they do not reflect sales charges. Performance of the peer group, if applicable, reflects fund expenses and management fees;
performance of a market index does not. Performance shown in the chart does not reflect deduction of taxes a shareholder would pay on Fund distributions or sale of Fund shares.
6 Invesco European Growth Fund
| | | | | | |
| | | Average Annual Total Returns | |
| | As of 10/31/19, including maximum applicable sales charges | |
| |
| | | Class A Shares | |
| | | Inception (11/3/97) | | | 9.11 | % |
| | | 10 Years | | | 6.22 | |
| | | 5 Years | | | 2.76 | |
| | | 1 Year | | | 4.49 | |
| |
| | | Class C Shares | |
| | | Inception (11/3/97) | | | 9.04 | % |
| | | 10 Years | | | 6.03 | |
| | | 5 Years | | | 3.16 | |
| | | 1 Year | | | 8.72 | |
| |
| | | Class R Shares | |
| | | Inception (6/3/02) | | | 7.91 | % |
| | | 10 Years | | | 6.56 | |
| | | 5 Years | | | 3.68 | |
| | | 1 Year | | | 10.26 | |
| |
| | | Class Y Shares | |
| | | Inception (10/3/08) | | | 6.92 | % |
| | | 10 Years | | | 7.09 | |
| | | 5 Years | | | 4.20 | |
| | | 1 Year | | | 10.81 | |
| |
| | | Investor Class Shares | |
| | | Inception (9/30/03) | | | 8.73 | % |
| | | 10 Years | | | 6.87 | |
| | | 5 Years | | | 3.99 | |
| | | 1 Year | | | 10.61 | |
| |
| | | Class R6 Shares | |
| | | 10 Years | | | 6.93 | % |
| | | 5 Years | | | 4.14 | |
| | | 1 Year | | | 10.96 | |
Class R6 shares incepted on April 4, 2017. Performance shown prior to that date is that of Class A shares and includes the12b-1 fees applicable to Class A shares.
The performance data quoted represent past performance and cannot guarantee comparable future results; current performance may be lower or higher. Please visit invesco.com/ performance for the most recentmonth-end performance. Performance figures reflect reinvested distributions, changes in net asset value and the effect of the maximum sales charge unless otherwise stated. Performance figures do not reflect deduction of taxes a shareholder would pay on Fund distributions or sale of Fund shares. Investment return and principal value will fluctuate so that you may have a gain or loss when you sell shares.
The net annual Fund operating expense ratio set forth in the most recent Fund prospectus as of the date of this report for Class A, Class C,
| | | | | | |
| | | Average Annual Total Returns | |
| | As of 9/30/19, the most recent calendar quarter end, including maximum applicable sales charges | |
| |
| | | Class A Shares | |
| | | Inception (11/3/97) | | | 9.03 | % |
| | | 10 Years | | | 5.95 | |
| | | 5 Years | | | 1.96 | |
| | | 1 Year | | | –5.20 | |
| |
| | | Class C Shares | |
| | | Inception (11/3/97) | | | 8.97 | % |
| | | 10 Years | | | 5.76 | |
| | | 5 Years | | | 2.36 | |
| | | 1 Year | | | –1.40 | |
| |
| | | Class R Shares | |
| | | Inception (6/3/02) | | | 7.81 | % |
| | | 10 Years | | | 6.29 | |
| | | 5 Years | | | 2.87 | |
| | | 1 Year | | | 0.11 | |
| |
| | | Class Y Shares | |
| | | Inception (10/3/08) | | | 6.75 | % |
| | | 10 Years | | | 6.82 | |
| | | 5 Years | | | 3.39 | |
| | | 1 Year | | | 0.60 | |
| |
| | | Investor Class Shares | |
| | | Inception (9/30/03) | | | 8.62 | % |
| | | 10 Years | | | 6.59 | |
| | | 5 Years | | | 3.18 | |
| | | 1 Year | | | 0.40 | |
| |
| | | Class R6 Shares | |
| | | 10 Years | | | 6.65 | % |
| | | 5 Years | | | 3.32 | |
| | | 1 Year | | | 0.72 | |
Class R, Class Y, Investor Class and Class R6 shares was 1.36%, 2.11%, 1.61%, 1.11%, 1.31% and 1.01%, respectively.1 The total annual Fund operating expense ratio set forth in the most recent Fund prospectus as of the date of this report for Class A, Class C, Class R, Class Y, Investor Class and Class R6 shares was 1.37%, 2.12%, 1.62%, 1.12%, 1.32% and 1.02%, respectively. The expense ratios presented above may vary from the expense ratios presented in other sections of this report that are based on expenses incurred during the period covered by this report.
Class A share performance reflects the maximum 5.50% sales charge, and Class C share performance reflects the applicable contingent deferred sales charge (CDSC) for the period involved. The CDSC on Class C shares is 1% for the first year after purchase. Class R shares, Class Y shares, Investor Class shares and Class R6 shares do not have afront-end sales charge or a
CDSC; therefore, performance is at net asset value.
The performance of the Fund’s share classes will differ primarily due to different sales charge structures and class expenses.
Fund performance reflects any applicable fee waivers and/or expense reimbursements. Had the adviser not waived fees and/or reimbursed expenses currently or in the past, returns would have been lower. See current prospectus for more information.
| 1 | Total annual Fund operating expenses after any contractual fee waivers and/or expense reimbursements by the adviser in effect through at least June 30, 2021. See current prospectus for more information. |
7 Invesco European Growth Fund
Invesco European Growth Fund’s investment objective is long-term growth of capital.
| ∎ | | Unless otherwise stated, information presented in this report is as of October 31, 2019, and is based on total net assets. |
| ∎ | | Unless otherwise noted, all data provided by Invesco. |
| ∎ | | To access your Fund’s reports/prospectus, visit invesco.com/fundreports. |
About share classes
| ∎ | | Class R sharesare generally available only to employer sponsored retirement and benefit plans. Please see the prospectus for more information. |
| ∎ | | Class Y sharesandInvestor Class sharesare available only to certain investors. Please see the prospectus for more information. |
| ∎ | | Class R6 sharesare available for use by retirement plans that meet certain standards and for institutional investors. Class R6 shares are also available through intermediaries that have established an agreement with Invesco Distributors, Inc. to make such shares available for use in retail omnibus accounts. Please see the prospectus for more information. |
Principal risks of investing in the Fund
| ∎ | | Depositary receipts risk. Investing in depositary receipts involves the same risks as direct investments in foreign securities. In addition, the underlying issuers of certain depositary receipts are under no obligation to distribute shareholder communications or pass through any voting rights with respect to the deposited securities to the holders of such receipts. The Fund may therefore receive less timelyin- formation or have less control than if it invested directly in the foreign issuer. |
| ∎ | | Derivatives risk. The value of a derivative instrument depends largely on (and is derived from) the value of an underlying security, currency, commodity, interest rate, index or other asset (each referred to as an underlying asset). In addition to risks relating to the underlying assets, the use of derivatives may include other, possibly greater, risks, including counterparty, leverage and liquidity risks. Counterparty risk is the risk that the counterparty to the derivative contract will default on its obligation to pay the Fund the amount owed or otherwise perform under the |
| | | derivative contract. Derivatives create leverage risk because they do not require payment up front equal to the economic exposure created by holding a position in the derivative. As a result, an adverse change in the value of the underlying asset could result in the Fund sustaining a loss that is substantially greater than the amount invested in the derivative or the anticipated value of the underlying asset, which may make the Fund’s returns more volatile and increase the risk of loss. Derivative instruments may also be less liquid than more traditional investments and the Fund may be unable to sell or close out its derivative positions at a desirable time or price. This risk may be more acute under adverse market conditions, during which the Fund may be most in need of liquidating its derivative positions. Derivatives may also be harder to value, less tax efficient and subject to changing government regulation that could impact the Fund’s ability to use certain derivatives or their cost. Derivatives strategies may not always be successful. For example, derivatives used for hedging or to gain or limit exposure to a particular market segment may not provide the expected benefits, particularly during adverse market conditions. |
| ∎ | | Emerging markets securities risk. Emerging markets (also referred to as developing markets) are generally subject to greater market volatility, political, social and economic instability, uncertain trading markets and more governmental limitations on foreign investment than more developed markets. In addition, companies operating in emerging markets may be subject to lower trading volume and greater price fluctuations than companies in more developed markets. Securities law and the enforcement of systems of taxation in many emerging market countries may change quickly and unpredictably. In addition, investments in emerging markets securities |
| | | may be subject to additional transaction costs, delays in settlement procedures, and lack of timely information. |
| ∎ | | Foreign securities risk. The Fund’s foreign investments may be adversely affected by political and social instability, changes in economic or taxation policies, difficulty in enforcing obligations, decreased liquidity or increased volatility. Foreign investments also involve the risk of the possible seizure, nationalization or expropriation of the issuer or foreign deposits (in which the Fund could lose its entire investments in a certain market) and the possible adoption of foreign governmental restrictions such as exchange controls. Unless the Fund has hedged its foreign securities risk, foreign securities risk also involves the risk of negative foreign currency rate fluctuations, which may cause the value of securities denominated in such foreign currency (or other instruments through which the Fund has exposure to foreign currencies) to decline in value. Currency exchange rates may fluctuate significantly over short periods of time. Currency hedging strategies, if used, are not always successful. |
| ∎ | | Geographic focus risk. The Fund may from time to time invest a substantial amount of its assets in securities of issuers located in a single country or a limited number of countries. Adverse economic, political or social conditions in those countries may therefore have a significant negative impact on the Fund’s investment performance. |
| ∎ | | Growth investing risk. Growth stocks tend to be more expensive relative to the issuing company’s earnings or assets compared with other types of stock. As a result, they tend to be more sensitive to changes in, or investors’ expectations of, the issuing company’s earnings and can be more volatile. |
| ∎ | | Investing in the European Union risk. Investments in certain countries in the European Union are susceptible to high economic risks associated with |
| | | | |
This report must be accompanied or preceded by a currently effective Fund prospectus, which contains more complete information, including sales charges and expenses. Investors should read it carefully before investing. | | |
| | | |
NOT FDIC INSURED | MAY LOSE VALUE | NO BANK GUARANTEE | | |
8 Invesco European Growth Fund
high levels of debt, such as investments in sovereign debt of Greece, Italy and Spain. Efforts of the member states to further unify their economic and monetary policies may increase the potential for the downward movement of one member state’s market to cause a similar effect on other member states’ markets. Separately, the European Union faces issues involving its membership, structure, procedures and policies. The exit of one or more member states from the European Union, such as the United Kingdom (UK) which has announced its intention to exit, would place its currency and banking system in jeopardy. The exit by the UK or other member states will likely result in increased volatility, illiquidity and potentially lower economic growth in the affected markets, which will adversely affect the Fund’s investments.
| ∎ | | Management risk. The Fund is actively managed and depends heavily on the Adviser’s judgment about markets, interest rates or the attractiveness, relative values, liquidity, or potential appreciation of particular investments made for the Fund’s portfolio. The Fund could experience losses if these judgments prove to be incorrect. Additionally, legislative, regulatory, or tax developments may adversely affect management of the Fund and, therefore, the ability of the Fund to achieve its investment objective. |
| ∎ | | Market risk. The market values of the Fund’s investments, and therefore the value of the Fund’s shares, will go up and down, sometimes rapidly or unpredictably. Market risk may affect a single issuer, industry or section of the economy, or it may affect the market as a whole. Individual stock prices tend to go up and down more dramatically than those of certain other types of investments, such as bonds. During a general downturn in the financial markets, multiple asset classes may decline in value. When markets perform well, there can be no assurance that specific investments held by the Fund will rise in value. |
| ∎ | | Preferred securities risk. Preferred securities are subject to issuer-specific and market risks applicable generally to equity securities. Preferred securities also may be subordinated to bonds or other debt instruments, subjecting them to a greater risk ofnon-payment, may be less liquid than many other securities, such as |
| | | common stocks, and generally offer no voting rights with respect to the issuer. |
| ∎ | | Sector focus risk.The Fund may from time to time invest a significant amount of its assets (i.e. over 25%) in one market sector or group of related industries. In this event, the Fund’s performance will depend to a greater extent on the overall condition of the sector or group of industries and there is increased risk that the Fund will lose significant value if conditions adversely affect that sector or group of industries. |
| ∎ | | Small- andmid-capitalization companies risks. Small- andmid-capitalization companies tend to be more vulnerable to changing market conditions, may have little or no operating history or track record of success, and may have more limited product lines and markets, less experienced management and fewer financial resources than larger companies. These companies’ securities may be more volatile and less liquid than those of more established companies, and their returns may vary, sometimes significantly, from the overall securities market. |
About indexes used in this report
| ∎ | | TheMSCI Europe Indexis an unmanaged index considered representative of stocks of developed European countries. The index is computed using the net return, which withholds applicable taxes fornon-resident investors. |
| ∎ | | TheMSCI Europe Growth Indexis an unmanaged index considered representative of European growth stocks. The index is computed using the net return, which withholds applicable taxes fornon-resident investors. |
| ∎ | | TheLipper European Funds Indexis an unmanaged index considered representative of European funds tracked by Lipper. |
| ∎ | | The Fund is not managed to track the performance of any particular index, including the index(es) described here, and consequently, the performance of the Fund may deviate significantly from the performance of the index(es). |
| ∎ | | A direct investment cannot be made in an index. Unless otherwise indicated, index results include reinvested dividends, and they do not reflect sales charges. Performance of the |
| | | peer group, if applicable, reflects fund expenses; performance of a market index does not. |
Other information
| ∎ | | The returns shown in management’s discussion of Fund performance are based on net asset values (NAVs) calculated for shareholder transactions. Generally accepted accounting principles require adjustments to be made to the net assets of the Fund at period end for financial reporting purposes, and as such, the NAVs for shareholder transactions and the returns based on those NAVs may differ from the NAVs and returns reported in the Financial Highlights. |
| ∎ | | Industry classifications used in this report are generally according to the Global Industry Classification Standard, which was developed by and is the exclusive property and a service mark of MSCI Inc. and Standard & Poor’s. |
9 Invesco European Growth Fund
Schedule of Investments
October 31, 2019
| | | | | | | | |
| | | Shares | | | Value | |
Common Stocks & Other Equity Interests–93.48% | |
| | |
Denmark–1.93% | | | | | | | | |
| | |
Carlsberg A/S, Class B | | | 175,332 | | | $ | 24,664,981 | |
| | |
France–15.04% | | | | | | | | |
| | |
Bollore S.A. | | | 6,782,063 | | | | 29,358,242 | |
Bureau Veritas S.A. | | | 923,686 | | | | 23,592,292 | |
Criteo S.A., ADR(a) | | | 575,778 | | | | 9,615,493 | |
EssilorLuxottica S.A. | | | 96,808 | | | | 14,775,678 | |
Kaufman & Broad S.A. | | | 404,795 | | | | 15,431,506 | |
Metropole Television S.A. | | | 730,831 | | | | 12,855,599 | |
Pernod Ricard S.A. | | | 77,151 | | | | 14,245,236 | |
Schneider Electric S.E. | | | 257,374 | | | | 23,977,194 | |
Vicat S.A. | | | 191,176 | | | | 8,103,690 | |
Vinci S.A. | | | 250,967 | | | | 28,168,392 | |
Vivendi S.A. | | | 417,414 | | | | 11,638,792 | |
| | | | | | | | 191,762,114 | |
| | |
Germany–13.33% | | | | | | | | |
| | |
Allianz S.E. | | | 126,819 | | | | 30,951,119 | |
Deutsche Boerse AG | | | 237,908 | | | | 36,857,607 | |
MorphoSys AG(a) | | | 321,250 | | | | 34,999,581 | |
MTU Aero Engines AG | | | 113,601 | | | | 30,343,638 | |
SAP S.E. | | | 277,475 | | | | 36,754,441 | |
| | | | | | | | 169,906,386 | |
| | |
Hungary–0.79% | | | | | | | | |
| | |
Gedeon Richter Plc | | | 541,555 | | | | 10,045,766 | |
| | |
Ireland–3.45% | | | | | | | | |
| | |
Flutter Entertainment PLC | | | 152,712 | | | | 15,744,945 | |
ICON PLC(a) | | | 79,761 | | | | 11,716,891 | |
Origin Enterprises PLC | | | 3,142,459 | | | | 16,486,712 | |
| | | | | | | | 43,948,548 | |
| | |
Italy–4.24% | | | | | | | | |
| | |
Danieli & C. Officine Meccaniche S.p.A., RSP | | | 1,138,513 | | | | 12,510,266 | |
FinecoBank Banca Fineco S.p.A. | | | 2,324,632 | | | | 26,214,212 | |
Mediobanca Banca di Credito Finanziario S.p.A. | | | 1,290,835 | | | | 15,379,931 | |
| | | | | | | | 54,104,409 | |
| | |
Netherlands–5.69% | | | | | | | | |
| | |
Aalberts N.V. | | | 223,332 | | | | 8,986,535 | |
ING Groep N.V. | | | 1,362,520 | | | | 15,394,724 | |
SBM Offshore N.V. | | | 674,083 | | | | 11,596,055 | |
Wolters Kluwer N.V. | | | 495,971 | | | | 36,527,450 | |
| | | | | | | | 72,504,764 | |
| | |
Russia–5.86% | | | | | | | | |
| | |
Sberbank of Russia PJSC, Preference Shares | | | 22,554,481 | | | | 74,750,489 | |
| | | | | | | | |
| | | Shares | | | Value | |
Spain–1.69% | | | | | | | | |
| | |
Construcciones y Auxiliar de Ferrocarriles S.A. | | | 479,029 | | | $ | 21,503,313 | |
| | |
Sweden–2.77% | | | | | | | | |
| | |
Investor AB, Class B | | | 687,621 | | | | 35,285,999 | |
| | |
Switzerland–7.88% | | | | | | | | |
| | |
Alcon, Inc.(a) | | | 206,271 | | | | 12,186,505 | |
Cie Financiere Richemont S.A. | | | 196,445 | | | | 15,465,524 | |
Julius Baer Group Ltd.(a) | | | 214,994 | | | | 9,490,025 | |
Kuehne + Nagel International AG | | | 126,761 | | | | 20,483,057 | |
Novartis AG | | | 247,361 | | | | 21,608,877 | |
OC Oerlikon Corp. AG | | | 1,506,495 | | | | 15,428,216 | |
Tecan Group AG, Class R | | | 24,710 | | | | 5,846,877 | |
| | | | | | | | 100,509,081 | |
| | |
Turkey–2.64% | | | | | | | | |
| | |
Haci Omer Sabanci Holding A.S. | | | 10,715,695 | | | | 15,421,910 | |
Tupras-Turkiye Petrol Rafinerileri A.S. | | | 841,052 | | | | 18,257,301 | |
| | | | | | | | 33,679,211 | |
| | |
United Kingdom–25.58% | | | | | | | | |
| | |
British American Tobacco PLC | | | 558,139 | | | | 19,507,874 | |
Compass Group PLC | | | 876,731 | | | | 23,369,577 | |
DCC PLC | | | 681,736 | | | | 63,914,927 | |
Hays PLC | | | 11,177,625 | | | | 22,799,884 | |
HomeServe PLC | | | 1,600,047 | | | | 24,025,545 | |
IG Group Holdings PLC | | | 2,357,021 | | | | 19,415,792 | |
Informa PLC | | | 1,911,882 | | | | 19,199,150 | |
John Wood Group PLC | | | 1,909,664 | | | | 8,390,874 | |
Jupiter Fund Management PLC | | | 2,738,160 | | | | 12,158,656 | |
Reckitt Benckiser Group PLC | | | 218,249 | | | | 16,872,948 | |
RELX PLC | | | 1,170,979 | | | | 28,192,666 | |
Savills PLC | | | 2,060,016 | | | | 24,539,242 | |
TechnipFMC PLC | | | 717,313 | | | | 14,244,634 | |
Ultra Electronics Holdings PLC | | | 1,168,972 | | | | 29,535,244 | |
| | | | | | | | 326,167,013 | |
| | |
United States–2.59% | | | | | | | | |
| | |
Philip Morris International, Inc. | | | 405,929 | | | | 33,058,858 | |
Total Common Stocks & Other Equity Interests
(Cost $896,285,779) | | | | | | | 1,191,890,932 | |
| |
Money Market Funds–6.29% | | | | | |
| | |
Invesco Government & Agency Portfolio, Institutional Class,
1.71%(b) | | | 28,046,386 | | | | 28,046,386 | |
Invesco Liquid Assets Portfolio, Institutional Class, 1.90%(b) | | | 20,034,653 | | | | 20,042,667 | |
See accompanying Notes to Financial Statements which are an integral part of the financial statements.
10 Invesco European Growth Fund
| | | | | | | | |
| | | Shares | | | Value | |
Money Market Funds–(continued) | | | | | |
Invesco Treasury Portfolio, Institutional Class, 1.66%(b) | | | 32,053,013 | | | $ | 32,053,013 | |
Total Money Market Funds
(Cost $80,136,025) | | | | 80,142,066 | |
TOTAL INVESTMENTS IN
SECURITIES–99.77%
(Cost $976,421,804) | | | | 1,272,032,998 | |
OTHER ASSETS LESS LIABILITIES–0.23% | | | | 2,944,943 | |
NET ASSETS–100.00% | | | | | | $ | 1,274,977,941 | |
Investment Abbreviations:
ADR – American Depositary Receipt
RSP – Registered Savings Plan Shares
Notes to Schedule of Investments:
| (a) | Non-income producing security. |
| (b) | The money market fund and the Fund are affiliated by having the same investment adviser. The rate shown is the7-day SEC standardized yield as of October 31, 2019. |
See accompanying Notes to Financial Statements which are an integral part of the financial statements.
11 Invesco European Growth Fund
Statement of Assets and Liabilities
October 31, 2019
| | | | |
Assets: | | | | |
| |
Investments in securities, at value
(Cost $896,285,779) | | $ | 1,191,890,932 | |
Investments in affiliated money market funds, at value
(Cost $80,136,025) | | | 80,142,066 | |
Foreign currencies, at value (Cost $129,953) | | | 130,485 | |
Receivable for: | | | | |
Dividends | | | 3,495,488 | |
Investments sold | | | 772,156 | |
Fund shares sold | | | 111,577 | |
Investment for trustee deferred compensation and retirement plans | | | 218,311 | |
Other assets | | | 34,977 | |
Total assets | | | 1,276,795,992 | |
| |
Liabilities: | | | | |
| |
Payable for: | | | | |
Investments purchased | | | 23,981 | |
Fund shares reacquired | | | 758,047 | |
Accrued fees to affiliates | | | 629,442 | |
Accrued trustees’ and officers’ fees and benefits | | | 2,182 | |
Accrued other operating expenses | | | 164,528 | |
Trustee deferred compensation and retirement plans | | | 239,871 | |
Total liabilities | | | 1,818,051 | |
Net assets applicable to shares outstanding | | $ | 1,274,977,941 | |
| |
Net assets consist of: | | | | |
| |
Shares of beneficial interest | | $ | 964,730,242 | |
Distributable earnings | | | 310,247,699 | |
| | | $ | 1,274,977,941 | |
| |
Net Assets: | | | | |
| |
Class A | | $ | 386,368,536 | |
Class C | | $ | 38,235,843 | |
Class R | | $ | 7,803,389 | |
Class Y | | $ | 700,808,432 | |
Investor Class | | $ | 133,149,012 | |
Class R6 | | $ | 8,612,729 | |
| | | | |
Shares outstanding, no par value, with an unlimited number of shares authorized: | |
| |
Class A | | | 9,968,251 | |
Class C | | | 1,062,972 | |
Class R | | | 202,208 | |
Class Y | | | 18,037,032 | |
Investor Class | | | 3,443,349 | |
Class R6 | | | 221,645 | |
Class A: | | | | |
Net asset value per share | | $ | 38.76 | |
Maximum offering price per share
(Net asset value of $38.76 ÷ 94.50%) | | $ | 41.02 | |
Class C: | | | | |
Net asset value and offering price per share | | $ | 35.97 | |
Class R: | | | | |
Net asset value and offering price per share | | $ | 38.59 | |
Class Y: | | | | |
Net asset value and offering price per share | | $ | 38.85 | |
Investor Class: | | | | |
Net asset value and offering price per share | | $ | 38.67 | |
Class R6: | | | | |
Net asset value and offering price per share | | $ | 38.86 | |
See accompanying Notes to Financial Statements which are an integral part of the financial statements.
12 Invesco European Growth Fund
Statement of Operations
For the year ended October 31, 2019
| | | | |
Investment income: | | | | |
| |
Dividends (net of foreign withholding taxes of $3,892,322) | | $ | 42,222,306 | |
| |
Dividends from affiliated money market funds | | | 2,070,990 | |
| |
Total investment income | | | 44,293,296 | |
| |
| |
Expenses: | | | | |
| |
Advisory fees | | | 11,749,722 | |
| |
Administrative services fees | | | 210,592 | |
| |
Custodian fees | | | 195,752 | |
| |
Distribution fees: | | | | |
Class A | | | 979,806 | |
| |
Class C | | | 496,227 | |
| |
Class R | | | 43,841 | |
| |
Investor Class | | | 256,782 | |
| |
Transfer agent fees – A, C, R, Y and Investor | | | 2,052,411 | |
| |
Transfer agent fees – R6 | | | 3,931 | |
| |
Trustees’ and officers’ fees and benefits | | | 32,006 | |
| |
Registration and filing fees | | | 131,893 | |
| |
Reports to shareholders | | | 94,773 | |
| |
Professional services fees | | | 74,154 | |
| |
Other | | | 23,527 | |
| |
Total expenses | | | 16,345,417 | |
| |
Less: Fees waived and/or expense offset arrangement(s) | | | (119,356 | ) |
| |
Net expenses | | | 16,226,061 | |
| |
Net investment income | | | 28,067,235 | |
| |
| |
Realized and unrealized gain (loss) from: | | | | |
Net realized gain (loss) from: | | | | |
Investment securities | | | (2,683,277 | ) |
| |
Foreign currencies | | | 550,328 | |
| |
| | | (2,132,949 | ) |
| |
Change in net unrealized appreciation of: | | | | |
Investment securities | | | 101,592,292 | |
| |
Foreign currencies | | | 198,811 | |
| |
| | | 101,791,103 | |
| |
Net realized and unrealized gain | | | 99,658,154 | |
| |
Net increase in net assets resulting from operations | | $ | 127,725,389 | |
| |
See accompanying Notes to Financial Statements which are an integral part of the financial statements.
13 Invesco European Growth Fund
Statement of Changes in Net Assets
For the years ended October 31, 2019 and 2018
| | | | | | | | |
| | | 2019 | | | 2018 | |
| |
Operations: | | | | | | | | |
| | |
Net investment income | | $ | 28,067,235 | | | $ | 26,897,194 | |
| |
Net realized gain (loss) | | | (2,132,949 | ) | | | 14,299,049 | |
| |
Change in net unrealized appreciation (depreciation) | | | 101,791,103 | | | | (242,758,617 | ) |
| |
Net increase (decrease) in net assets resulting from operations | | | 127,725,389 | | | | (201,562,374 | ) |
| |
| | |
Distributions to shareholders from distributable earnings: | | | | | | | | |
| | |
Class A | | | (5,164,427 | ) | | | (9,572,421 | ) |
| |
Class B | | | – | | | | (11,658 | ) |
| |
Class C | | | (308,282 | ) | | | (1,229,971 | ) |
| |
Class R | | | (108,132 | ) | | | (231,397 | ) |
| |
Class Y | | | (12,661,911 | ) | | | (19,371,326 | ) |
| |
Investor Class | | | (1,839,884 | ) | | | (3,182,926 | ) |
| |
Class R6 | | | (171,586 | ) | | | (104,105 | ) |
| |
Total distributions from distributable earnings | | | (20,254,222 | ) | | | (33,703,804 | ) |
| |
| | |
Share transactions–net: | | | | | | | | |
| | |
Class A | | | (49,808,600 | ) | | | (40,024,055 | ) |
| |
Class B | | | – | | | | (1,127,818 | ) |
| |
Class C | | | (37,493,491 | ) | | | (6,640,583 | ) |
| |
Class R | | | (3,679,296 | ) | | | (1,185,751 | ) |
| |
Class Y | | | (176,336,063 | ) | | | 43,065,954 | |
| |
Investor Class | | | (11,598,083 | ) | | | (12,153,116 | ) |
| |
Class R6 | | | (2,094,827 | ) | | | 7,294,371 | |
| |
Net increase (decrease) in net assets resulting from share transactions | | | (281,010,360 | ) | | | (10,770,998 | ) |
| |
Net increase (decrease) in net assets | | | (173,539,193 | ) | | | (246,037,176 | ) |
| |
| | |
Net assets: | | | | | | | | |
| | |
Beginning of year | | | 1,448,517,134 | | | | 1,694,554,310 | |
| |
End of year | | $ | 1,274,977,941 | | | $ | 1,448,517,134 | |
| |
See accompanying Notes to Financial Statements which are an integral part of the financial statements.
14 Invesco European Growth Fund
Financial Highlights
The following schedule presents financial highlights for a share of the Fund outstanding throughout the periods indicated.
| | | | | | | | | | | | | | | | | | | | | | | | | | | | | | | | | | | | | | | | | | | | | | | | | | | | | | | | |
| | | Net asset
value,
beginning
of period | | | Net
investment
income (a) | | | Net gains
(losses) on securities
(both
realized and
unrealized) | | | Total from
investment
operations | | | Dividends
from net
investment
income | | | Distributions
from net realized
gains | | | Total
distributions | | | Net asset
value, end of period | | | Total return(b) | | | Net assets,
end of period
(000’s omitted) | | | Ratio of
expenses
to average
net assets
with fee waivers
and/or
expenses
absorbed | | | Ratio of
expenses
to average net
assets without
fee waivers
and/or
expenses
absorbed | | | Ratio of net investment
income
to average
net assets | | | Portfolio turnover(c) | |
Class A | | | | | | | | | | | | | | | | | | | | | | | | | | | | | | | | | | | | | | | | | | | | | | | | | | | | | | | | |
Year ended 10/31/19 | | $ | 35.55 | | | $ | 0.74 | | | $ | 2.94 | | | $ | 3.68 | | | $ | (0.47 | ) | | $ | – | | | $ | (0.47 | ) | | $ | 38.76 | | | | 10.57 | % | | $ | 386,369 | | | | 1.35 | %(d) | | | 1.36 | %(d) | | | 2.02 | %(d) | | | 10 | % |
Year ended 10/31/18 | | | 40.95 | | | | 0.58 | | | | (5.21 | ) | | | (4.63 | ) | | | (0.77 | ) | | | – | | | | (0.77 | ) | | | 35.55 | | | | (11.54 | ) | | | 402,331 | | | | 1.34 | | | | 1.35 | | | | 1.45 | | | | 16 | |
Year ended 10/31/17 | | | 32.88 | | | | 0.48 | | | | 8.12 | | | | 8.60 | | | | (0.53 | ) | | | – | | | | (0.53 | ) | | | 40.95 | | | | 26.53 | | | | 506,795 | | | | 1.38 | | | | 1.39 | | | | 1.32 | | | | 22 | |
Year ended 10/31/16 | | | 36.65 | | | | 0.50 | | | | (2.61 | ) | | | (2.11 | ) | | | (0.51 | ) | | | (1.15 | ) | | | (1.66 | ) | | | 32.88 | | | | (5.94 | ) | | | 453,114 | | | | 1.34 | | | | 1.36 | | | | 1.47 | | | | 16 | |
Year ended 10/31/15 | | | 37.50 | | | | 0.52 | | | | 0.88 | | | | 1.40 | | | | (0.69 | ) | | | (1.56 | ) | | | (2.25 | ) | | | 36.65 | | | | 4.18 | | | | 575,258 | | | | 1.37 | | | | 1.38 | | | | 1.41 | | | | 14 | |
Class C | | | | | | | | | | | | | | | | | | | | | | | | | | | | | | | | | | | | | | | | | | | | | | | | | | | | | | | | |
Year ended 10/31/19 | | | 32.94 | | | | 0.43 | | | | 2.75 | | | | 3.18 | | | | (0.15 | ) | | | – | | | | (0.15 | ) | | | 35.97 | | | | 9.72 | | | | 38,236 | | | | 2.10 | (d) | | | 2.11 | (d) | | | 1.27 | (d) | | | 10 | |
Year ended 10/31/18 | | | 38.01 | | | | 0.26 | | | | (4.82 | ) | | | (4.56 | ) | | | (0.51 | ) | | | – | | | | (0.51 | ) | | | 32.94 | | | | (12.18 | ) | | | 71,859 | | | | 2.09 | | | | 2.10 | | | | 0.70 | | | | 16 | |
Year ended 10/31/17 | | | 30.50 | | | | 0.19 | | | | 7.56 | | | | 7.75 | | | | (0.24 | ) | | | – | | | | (0.24 | ) | | | 38.01 | | | | 25.58 | | | | 90,488 | | | | 2.13 | | | | 2.14 | | | | 0.57 | | | | 22 | |
Year ended 10/31/16 | | | 34.12 | | | | 0.22 | | | | (2.42 | ) | | | (2.20 | ) | | | (0.27 | ) | | | (1.15 | ) | | | (1.42 | ) | | | 30.50 | | | | (6.63 | ) | | | 86,303 | | | | 2.09 | | | | 2.11 | | | | 0.72 | | | | 16 | |
Year ended 10/31/15 | | | 35.04 | | | | 0.22 | | | | 0.84 | | | | 1.06 | | | | (0.42 | ) | | | (1.56 | ) | | | (1.98 | ) | | | 34.12 | | | | 3.42 | | | | 115,058 | | | | 2.12 | | | | 2.13 | | | | 0.66 | | | | 14 | |
Class R | | | | | | | | | | | | | | | | | | | | | | | | | | | | | | | | | | | | | | | | | | | | | | | | | | | | | | | | |
Year ended 10/31/19 | | | 35.38 | | | | 0.64 | | | | 2.93 | | | | 3.57 | | | | (0.36 | ) | | | – | | | | (0.36 | ) | | | 38.59 | | | | 10.26 | | | | 7,803 | | | | 1.60 | (d) | | | 1.61 | (d) | | | 1.77 | (d) | | | 10 | |
Year ended 10/31/18 | | | 40.76 | | | | 0.48 | | | | (5.18 | ) | | | (4.70 | ) | | | (0.68 | ) | | | – | | | | (0.68 | ) | | | 35.38 | | | | (11.74 | ) | | | 10,795 | | | | 1.59 | | | | 1.60 | | | | 1.20 | | | | 16 | |
Year ended 10/31/17 | | | 32.71 | | | | 0.39 | | | | 8.09 | | | | 8.48 | | | | (0.43 | ) | | | – | | | | (0.43 | ) | | | 40.76 | | | | 26.24 | | | | 13,655 | | | | 1.63 | | | | 1.64 | | | | 1.07 | | | | 22 | |
Year ended 10/31/16 | | | 36.48 | | | | 0.41 | | | | (2.60 | ) | | | (2.19 | ) | | | (0.43 | ) | | | (1.15 | ) | | | (1.58 | ) | | | 32.71 | | | | (6.19 | ) | | | 12,893 | | | | 1.59 | | | | 1.61 | | | | 1.22 | | | | 16 | |
Year ended 10/31/15 | | | 37.33 | | | | 0.42 | | | | 0.89 | | | | 1.31 | | | | (0.60 | ) | | | (1.56 | ) | | | (2.16 | ) | | | 36.48 | | | | 3.93 | | | | 15,280 | | | | 1.62 | | | | 1.63 | | | | 1.16 | | | | 14 | |
Class Y | | | | | | | | | | | | | | | | | | | | | | | | | | | | | | | | | | | | | | | | | | | | | | | | | | | | | | | | |
Year ended 10/31/19 | | | 35.67 | | | | 0.83 | | | | 2.93 | | | | 3.76 | | | | (0.58 | ) | | | – | | | | (0.58 | ) | | | 38.85 | | | | 10.81 | | | | 700,808 | | | | 1.10 | (d) | | | 1.11 | (d) | | | 2.27 | (d) | | | 10 | |
Year ended 10/31/18 | | | 41.06 | | | | 0.68 | | | | (5.21 | ) | | | (4.53 | ) | | | (0.86 | ) | | | – | | | | (0.86 | ) | | | 35.67 | | | | (11.29 | ) | | | 820,248 | | | | 1.09 | | | | 1.10 | | | | 1.70 | | | | 16 | |
Year ended 10/31/17 | | | 32.98 | | | | 0.58 | | | | 8.13 | | | | 8.71 | | | | (0.63 | ) | | | – | | | | (0.63 | ) | | | 41.06 | | | | 26.85 | | | | 911,498 | | | | 1.13 | | | | 1.14 | | | | 1.57 | | | | 22 | |
Year ended 10/31/16 | | | 36.76 | | | | 0.58 | | | | (2.62 | ) | | | (2.04 | ) | | | (0.59 | ) | | | (1.15 | ) | | | (1.74 | ) | | | 32.98 | | | | (5.71 | ) | | | 696,907 | | | | 1.09 | | | | 1.11 | | | | 1.72 | | | | 16 | |
Year ended 10/31/15 | | | 37.62 | | | | 0.61 | | | | 0.88 | | | | 1.49 | | | | (0.79 | ) | | | (1.56 | ) | | | (2.35 | ) | | | 36.76 | | | | 4.46 | | | | 695,157 | | | | 1.12 | | | | 1.13 | | | | 1.66 | | | | 14 | |
Investor Class | | | | | | | | | | | | | | | | | | | | | | | | | | | | | | | | | | | | | | | | | | | | | | | | | | | | | | | | |
Year ended 10/31/19 | | | 35.48 | | | | 0.76 | | | | 2.93 | | | | 3.69 | | | | (0.50 | ) | | | – | | | | (0.50 | ) | | | 38.67 | | | | 10.61 | (e) | | | 133,149 | | | | 1.29 | (d)(e) | | | 1.30 | (d)(e) | | | 2.08 | (d)(e) | | | 10 | |
Year ended 10/31/18 | | | 40.86 | | | | 0.60 | | | | (5.19 | ) | | | (4.59 | ) | | | (0.79 | ) | | | – | | | | (0.79 | ) | | | 35.48 | | | | (11.47 | )(e) | | | 133,359 | | | | 1.29 | (e) | | | 1.30 | (e) | | | 1.50 | (e) | | | 16 | |
Year ended 10/31/17 | | | 32.80 | | | | 0.50 | | | | 8.10 | | | | 8.60 | | | | (0.54 | ) | | | – | | | | (0.54 | ) | | | 40.86 | | | | 26.61 | (e) | | | 166,324 | | | | 1.32 | (e) | | | 1.33 | (e) | | | 1.38 | (e) | | | 22 | |
Year ended 10/31/16 | | | 36.56 | | | | 0.51 | | | | (2.61 | ) | | | (2.10 | ) | | | (0.51 | ) | | | (1.15 | ) | | | (1.66 | ) | | | 32.80 | | | | (5.91 | )(e) | | | 147,804 | | | | 1.31 | (e) | | | 1.33 | (e) | | | 1.50 | (e) | | | 16 | |
Year ended 10/31/15 | | | 37.42 | | | | 0.52 | | | | 0.88 | | | | 1.40 | | | | (0.70 | ) | | | (1.56 | ) | | | (2.26 | ) | | | 36.56 | | | | 4.21 | (e) | | | 178,602 | | | | 1.35 | (e) | | | 1.36 | (e) | | | 1.43 | (e) | | | 14 | |
Class R6 | | | | | | | | | | | | | | | | | | | | | | | | | | | | | | | | | | | | | | | | | | | | | | | | | | | | | | | | |
Year ended 10/31/19 | | | 35.68 | | | | 0.87 | | | | 2.94 | | | | 3.81 | | | | (0.63 | ) | | | – | | | | (0.63 | ) | | | 38.86 | | | | 10.96 | | | | 8,613 | | | | 0.98 | (d) | | | 0.99 | (d) | | | 2.39 | (d) | | | 10 | |
Year ended 10/31/18 | | | 41.09 | | | | 0.72 | | | | (5.21 | ) | | | (4.49 | ) | | | (0.92 | ) | | | – | | | | (0.92 | ) | | | 35.68 | | | | (11.20 | ) | | | 9,925 | | | | 0.99 | | | | 1.00 | | | | 1.80 | | | | 16 | |
Year ended 10/31/17(f) | | | 35.50 | | | | 0.40 | | | | 5.19 | | | | 5.59 | | | | – | | | | – | | | | – | | | | 41.09 | | | | 15.75 | | | | 4,723 | | | | 0.96 | (g) | | | 0.97 | (g) | | | 1.74 | (g) | | | 22 | |
| (a) | Calculated using average shares outstanding. |
| (b) | Includes adjustments in accordance with accounting principles generally accepted in the United States of America and as such, the net asset value for financial reporting purposes and the returns based upon those net asset values may differ from the net asset value and returns for shareholder transactions. Does not include sales charges and is not annualized for periods less than one year, if applicable. |
| (c) | Portfolio turnover is calculated at the fund level and is not annualized for periods less than one year, if applicable. |
| (d) | Ratios are based on average daily net assets (000’s omitted) of $391,922, $49,623, $8,768, $723,982, $131,835 and $9,244 for Class A, Class C, Class R, Class Y, Investor Class and Class R6 shares, respectively. |
| (e) | The total return, ratio of expenses to average net assets and ratio of net investment income to average net assets reflect actual12b-1 fees of 0.19%, 0.20%, 0.19%, 0.22% and 0.22% for each of the years ended October 31, 2019, 2018, 2017, 2016 and 2015, respectively. |
| (f) | Commencement date of April 4, 2017. |
See accompanying Notes to Financial Statements which are an integral part of the financial statements.
15 Invesco European Growth Fund
Notes to Financial Statements
October 31, 2019
NOTE 1–Significant Accounting Policies
Invesco European Growth Fund (the “Fund”) is a series portfolio of AIM International Mutual Funds (Invesco International Mutual Funds) (the “Trust”). The Trust is a Delaware statutory trust registered under the Investment Company Act of 1940, as amended (the “1940 Act”), as anopen-end series management investment company authorized to issue an unlimited number of shares of beneficial interest. Information presented in these financial statements pertains only to the Fund. Matters affecting the Fund or each class will be voted on exclusively by the shareholders of the Fund or each class.
The Fund’s investment objective is long-term growth of capital.
The Fund currently consists of six different classes of shares: Class A, Class C, Class R, Class Y, Investor Class and Class R6. Class Y and Investor Class shares are available only to certain investors. Class A shares are sold with a front-end sales charge unless certain waiver criteria are met. Under certain circumstances, load waived shares may be subject to contingent deferred sales charges (“CDSC”). Class C shares are sold with a CDSC. Class R, Class Y, Investor Class and Class R6 shares are sold at net asset value. Class C shares held for ten years after purchase are eligible for automatic conversion into Class A shares of the same Fund (the “Conversion Feature”). The automatic conversion pursuant to the Conversion Feature will generally occur at the end of the month following the tenth anniversary after a purchase of Class C shares.
The Fund is an investment company and accordingly follows the investment company accounting and reporting guidance in accordance with Financial Accounting Standards Board Accounting Standards Codification Topic 946,Financial Services – Investment Companies.
The following is a summary of the significant accounting policies followed by the Fund in the preparation of its financial statements.
| A. | Security Valuations– Securities, including restricted securities, are valued according to the following policy. |
A security listed or traded on an exchange (except convertible securities) is valued at its last sales price or official closing price as of the close of the customary trading session on the exchange where the security is principally traded, or lacking any sales or official closing price on a particular day, the security may be valued at the closing bid price on that day. Securities traded in theover-the-counter market are valued based on prices furnished by independent pricing services or market makers. When such securities are valued by an independent pricing service they may be considered fair valued. Futures contracts are valued at the final settlement price set by an exchange on which they are principally traded. Listed options are valued at the mean between the last bid and asked prices from the exchange on which they are principally traded. Options not listed on an exchange are valued by an independent source at the mean between the last bid and asked prices. For purposes of determining net asset value (“NAV”) per share, futures and option contracts generally are valued 15 minutes after the close of the customary trading session of the New York Stock Exchange (“NYSE”).
Investments inopen-end andclosed-end registered investment companies that do not trade on an exchange are valued at theend-of-day net asset value per share. Investments inopen-end andclosed-end registered investment companies that trade on an exchange are valued at the last sales price or official closing price as of the close of the customary trading session on the exchange where the security is principally traded.
Debt obligations (including convertible securities) and unlisted equities are fair valued using an evaluated quote provided by an independent pricing service. Evaluated quotes provided by the pricing service may be determined without exclusive reliance on quoted prices, and may reflect appropriate factors such asinstitution-size trading in similar groups of securities, developments related to specific securities, dividend rate (for unlisted equities), yield (for debt obligations), quality, type of issue, coupon rate (for debt obligations), maturity (for debt obligations), individual trading characteristics and other market data. Pricing services generally value debt obligations assuming orderly transactions of institutional round lot size, but a fund may hold or transact in the same securities in smaller, odd lot sizes. Odd lots often trade at lower prices than institutional round lots. Debt obligations are subject to interest rate and credit risks. In addition, all debt obligations involve some risk of default with respect to interest and/or principal payments.
Foreign securities’ (including foreign exchange contracts) prices are converted into U.S. dollar amounts using the applicable exchange rates as of the close of the NYSE. If market quotations are available and reliable for foreign exchange-traded equity securities, the securities will be valued at the market quotations. Because trading hours for certain foreign securities end before the close of the NYSE, closing market quotations may become unreliable. If between the time trading ends on a particular security and the close of the customary trading session on the NYSE, events occur that the investment adviser determines are significant and make the closing price unreliable, the Fund may fair value the security. If the event is likely to have affected the closing price of the security, the security will be valued at fair value in good faith using procedures approved by the Board of Trustees. Adjustments to closing prices to reflect fair value may also be based on a screening process of an independent pricing service to indicate the degree of certainty, based on historical data, that the closing price in the principal market where a foreign security trades is not the current value as of the close of the NYSE. Foreign securities’ prices meeting the approved degree of certainty that the price is not reflective of current value will be priced at the indication of fair value from the independent pricing service. Multiple factors may be considered by the independent pricing service in determining adjustments to reflect fair value and may include information relating to sector indices, American Depositary Receipts and domestic and foreign index futures. Foreign securities may have additional risks including exchange rate changes, potential for sharply devalued currencies and high inflation, political and economic upheaval, the relative lack of issuer information, relatively low market liquidity and the potential lack of strict financial and accounting controls and standards.
Securities for which market prices are not provided by any of the above methods may be valued based upon quotes furnished by independent sources. The last bid price may be used to value equity securities. The mean between the last bid and asked prices is used to value debt obligations, including corporate loans.
Securities for which market quotations are not readily available or became unreliable are valued at fair value as determined in good faith by or under the supervision of the Trust’s officers following procedures approved by the Board of Trustees. Issuer specific events, market trends, bid/asked quotes of brokers and information providers and other market data may be reviewed in the course of making a good faith determination of a security’s fair value.
The Fund may invest in securities that are subject to interest rate risk, meaning the risk that the prices will generally fall as interest rates rise and, conversely, the prices will generally rise as interest rates fall. Specific securities differ in their sensitivity to changes in interest rates
16 Invesco European Growth Fund
depending on their individual characteristics. Changes in interest rates may result in increased market volatility, which may affect the value and/or liquidity of certain Fund investments.
Valuations change in response to many factors including the historical and prospective earnings of the issuer, the value of the issuer’s assets, general economic conditions, interest rates, investor perceptions and market liquidity. Because of the inherent uncertainties of valuation, the values reflected in the financial statements may materially differ from the value received upon actual sale of those investments.
| B. | Securities Transactions and Investment Income– Securities transactions are accounted for on a trade date basis. Realized gains or losses on sales are computed on the basis of specific identification of the securities sold. Interest income (net of withholding tax, if any) is recorded on the accrual basis from settlement date. Dividend income (net of withholding tax, if any) is recorded on theex-dividend date. |
The Fund may periodically participate in litigation related to Fund investments. As such, the Fund may receive proceeds from litigation settlements. Any proceeds received are included in the Statement of Operations as realized gain (loss) for investments no longer held and as unrealized gain (loss) for investments still held.
Brokerage commissions and mark ups are considered transaction costs and are recorded as an increase to the cost basis of securities purchased and/or a reduction of proceeds on a sale of securities. Such transaction costs are included in the determination of net realized and unrealized gain (loss) from investment securities reported in the Statement of Operations and the Statement of Changes in Net Assets and the net realized and unrealized gains (losses) on securities per share in the Financial Highlights. Transaction costs are included in the calculation of the Fund’s net asset value and, accordingly, they reduce the Fund’s total returns. These transaction costs are not considered operating expenses and are not reflected in net investment income reported in the Statement of Operations and the Statement of Changes in Net Assets, or the net investment income per share and the ratios of expenses and net investment income reported in the Financial Highlights, nor are they limited by any expense limitation arrangements between the Fund and the investment adviser.
The Fund allocates income and realized and unrealized capital gains and losses to a class based on the relative net assets of each class.
| C. | Country Determination– For the purposes of making investment selection decisions and presentation in the Schedule of Investments, the investment adviser may determine the country in which an issuer is located and/or credit risk exposure based on various factors. These factors include the laws of the country under which the issuer is organized, where the issuer maintains a principal office, the country in which the issuer derives 50% or more of its total revenues and the country that has the primary market for the issuer’s securities, as well as other criteria. Among the other criteria that may be evaluated for making this determination are the country in which the issuer maintains 50% or more of its assets, the type of security, financial guarantees and enhancements, the nature of the collateral and the sponsor organization. Country of issuer and/or credit risk exposure has been determined to be the United States of America, unless otherwise noted. |
| D. | Distributions– Distributions from net investment income and net realized capital gain, if any, are generally declared and paid annually and recorded on theex-dividend date. The Fund may elect to treat a portion of the proceeds from redemptions as distributions for federal income tax purposes. |
| E. | Federal Income Taxes – The Fund intends to comply with the requirements of Subchapter M of the Internal Revenue Code of 1986, as amended (the “Internal Revenue Code”), necessary to qualify as a regulated investment company and to distribute substantially all of the Fund’s taxable earnings to shareholders. As such, the Fund will not be subject to federal income taxes on otherwise taxable income (including net realized capital gain) that is distributed to shareholders. Therefore, no provision for federal income taxes is recorded in the financial statements. |
The Fund recognizes the tax benefits of uncertain tax positions only when the position is more likely than not to be sustained. Management has analyzed the Fund’s uncertain tax positions and concluded that no liability for unrecognized tax benefits should be recorded related to uncertain tax positions. Management is not aware of any tax positions for which it is reasonably possible that the total amounts of unrecognized tax benefits will change materially in the next 12 months.
The Fund files tax returns in the U.S. Federal jurisdiction and certain other jurisdictions. Generally, the Fund is subject to examinations by such taxing authorities for up to three years after the filing of the return for the tax period.
| F. | Expenses– Fees provided for under the Rule12b-1 plan of a particular class of the Fund are charged to the operations of such class. Transfer agency fees and expenses and other shareholder recordkeeping fees and expenses attributable to Class R6 are charged to such class. Transfer agency fees and expenses and other shareholder recordkeeping fees and expenses relating to all other classes are allocated among those classes based on relative net assets. All other expenses are allocated among the classes based on relative net assets. |
| G. | Accounting Estimates – The preparation of financial statements in conformity with accounting principles generally accepted in the United States of America (“GAAP”) requires management to make estimates and assumptions that affect the reported amounts of assets and liabilities at the date of the financial statements and the reported amounts of revenues and expenses during the reporting period including estimates and assumptions related to taxation. Actual results could differ from those estimates by a significant amount. In addition, the Fund monitors for material events or transactions that may occur or become known after theperiod-end date and before the date the financial statements are released to print. |
| H. | Indemnifications– Under the Trust’s organizational documents, each Trustee, officer, employee or other agent of the Trust is indemnified against certain liabilities that may arise out of the performance of their duties to the Fund. Additionally, in the normal course of business, the Fund enters into contracts, including the Fund’s servicing agreements, that contain a variety of indemnification clauses. The Fund’s maximum exposure under these arrangements is unknown as this would involve future claims that may be made against the Fund that have not yet occurred. The risk of material loss as a result of such indemnification claims is considered remote. |
| I. | Foreign Currency Translations– Foreign currency is valued at the close of the NYSE based on quotations posted by banks and major currency dealers. Portfolio securities and other assets and liabilities denominated in foreign currencies are translated into U.S. dollar amounts at the date of valuation. Purchases and sales of portfolio securities (net of foreign taxes withheld on disposition) and income items denominated in foreign currencies are translated into U.S. dollar amounts on the respective dates of such transactions. The Fund does not separately account for the portion of the results of operations resulting from changes in foreign exchange rates on investments and the fluctuations arising from changes in market prices of securities held. The combined results of changes in foreign exchange rates and the fluctuation of market prices on investments (net of estimated foreign tax withholding) are included with the net realized and unrealized gain or loss from investments in the Statement of Operations. Reported net realized foreign currency gains or losses arise from (1) sales of foreign currencies, (2) currency gains or losses realized between the trade and settlement dates on securities transactions, and (3) the difference between the amounts of dividends, interest, and foreign withholding taxes recorded on the Fund’s books and the U.S. dollar equivalent of the amounts actually received or paid. Net |
17 Invesco European Growth Fund
| | unrealized foreign currency gains and losses arise from changes in the fair values of assets and liabilities, other than investments in securities at fiscal period end, resulting from changes in exchange rates. |
The Fund may invest in foreign securities, which may be subject to foreign taxes on income, gains on investments or currency repatriation, a portion of which may be recoverable. Foreign taxes, if any, are recorded based on the tax regulations and rates that exist in the foreign markets in which the Fund invests and are shown in the Statement of Operations.
| J. | Forward Foreign Currency Contracts– The Fund may engage in foreign currency transactions either on a spot (i.e. for prompt delivery and settlement) basis, or through forward foreign currency contracts, to manage or minimize currency or exchange rate risk. |
The Fund may also enter into forward foreign currency contracts for the purchase or sale of a security denominated in a foreign currency in order to “lock in” the U.S. dollar price of that security, or the Fund may also enter into forward foreign currency contracts that do not provide for physical settlement of the two currencies, but instead are settled by a single cash payment calculated as the difference between the agreed upon exchange rate and the spot rate at settlement based upon an agreed upon notional amount(non-deliverable forwards). The Fund will set aside liquid assets in an amount equal to the dailymark-to-market obligation for forward foreign currency contracts.
A forward foreign currency contract is an obligation between two parties (“Counterparties”) to purchase or sell a specific currency for an agreed-upon price at a future date. The use of forward foreign currency contracts does not eliminate fluctuations in the price of the underlying securities the Fund owns or intends to acquire but establishes a rate of exchange in advance. Fluctuations in the value of these contracts are measured by the difference in the contract date and reporting date exchange rates and are recorded as unrealized appreciation (depreciation) until the contracts are closed. When the contracts are closed, realized gains (losses) are recorded. Realized and unrealized gains (losses) on the contracts are included in the Statement of Operations. The primary risks associated with forward foreign currency contracts include failure of the Counterparty to meet the terms of the contract and the value of the foreign currency changing unfavorably. These risks may be in excess of the amounts reflected in the Statement of Assets and Liabilities.
NOTE 2–Advisory Fees and Other Fees Paid to Affiliates
The Trust has entered into a master investment advisory agreement with Invesco Advisers, Inc. (the “Adviser” or “Invesco”). Under the terms of the investment advisory agreement, the Fund accrues daily and pays monthly an advisory fee to the Adviser based on the annual rate of the Fund’s average daily net assets as follows:
| | | | |
| Average Daily Net Assets | | Rate | |
| First $ 250 million | | | 0.935% | |
| Next $250 million | | | 0.910% | |
| Next $500 million | | | 0.885% | |
| Next $1.5 billion | | | 0.860% | |
| Next $2.5 billion | | | 0.835% | |
| Next $2.5 billion | | | 0.810% | |
| Next $2.5 billion | | | 0.785% | |
| Over $10 billion | | | 0.760% | |
For the year ended October 31, 2019, the effective advisory fee rate incurred by the Fund was 0.89%.
Under the terms of a mastersub-advisory agreement between the Adviser and each of Invesco Asset Management Deutschland GmbH, Invesco Asset Management Limited, Invesco Asset Management (Japan) Limited, Invesco Hong Kong Limited, Invesco Senior Secured Management, Inc. and Invesco Canada Ltd. and separatesub-advisory agreements with Invesco Capital Management LLC and Invesco Asset Management (India) Private Limited (collectively, the “AffiliatedSub-Advisers”) the Adviser, not the Fund, will pay 40% of the fees paid to the Adviser to any such AffiliatedSub-Adviser(s) that provide(s) discretionary investment management services to the Fund based on the percentage of assets allocated to such AffiliatedSub-Adviser(s).
The Adviser has contractually agreed, through at least June 30, 2020, to waive advisory fees and/or reimburse expenses of all shares to the extent necessary to limit total annual fund operating expenses after fee waiver and/or reimbursement (excluding certain items discussed below) of Class A, Class C, Class R, Class Y, Investor Class and Class R6 shares to 2.25%, 3.00%, 2.50%, 2.00%, 2.25% and 2.00%, respectively, of the Fund’s average daily net assets (the “expense limits”). In determining the Adviser’s obligation to waive advisory fees and/or reimburse expenses, the following expenses are not taken into account, and could cause the total annual fund operating expenses after fee waiver and/or reimbursement to exceed the numbers reflected above: (1) interest, facilities and maintenance fees; (2) taxes; (3) dividend expense on short sales; (4) extraordinary ornon-routine items, including litigation expenses; and (5) expenses that the Fund has incurred but did not actually pay because of an expense offset arrangement. Unless Invesco continues the fee waiver agreement, it will terminate on June 30, 2020. During its term, the fee waiver agreement cannot be terminated or amended to increase the expense limits or reduce the advisory fee waivers without approval of the Board of Trustees. The Adviser did not waive fees and/or reimburse expenses during the period under this expense limit.
Further, the Adviser has contractually agreed, through at least June 30, 2021, to waive the advisory fee payable by the Fund in an amount equal to 100% of the net advisory fees the Adviser receives from the affiliated money market funds on investments by the Fund of uninvested cash in such affiliated money market funds.
For the year ended October 31, 2019, the Adviser waived advisory fees of $107,642.
The Trust has entered into a master administrative services agreement with Invesco pursuant to which the Fund has agreed to pay Invesco for certain administrative costs incurred in providing accounting services to the Fund. For the year ended October 31, 2019, expenses incurred under the agreement are shown in the Statement of Operations asAdministrative services fees. Invesco has entered into asub-administration agreement whereby State Street Bank and Trust Company (“SSB”) serves as fund accountant and provides certain administrative services to the Fund. Pursuant to a custody agreement with the Trust on behalf of the Fund, SSB also serves as the Fund’s custodian.
The Trust has entered into a transfer agency and service agreement with Invesco Investment Services, Inc. (“IIS”) pursuant to which the Fund has agreed to pay IIS a fee for providing transfer agency and shareholder services to the Fund and reimburse IIS for certain expenses incurred by IIS in the
18 Invesco European Growth Fund
course of providing such services. IIS may make payments to intermediaries that provide omnibus account services,sub-accounting services and/or networking services. All fees payable by IIS to intermediaries that provide omnibus account services orsub-accounting services are charged back to the Fund, subject to certain limitations approved by the Trust’s Board of Trustees. For the year ended October 31, 2019, expenses incurred under the agreement are shown in the Statement of Operations asTransfer agent fees.
The Trust has entered into master distribution agreements with Invesco Distributors, Inc. (“IDI”) to serve as the distributor for the Class A, Class C, Class R, Class Y, Investor Class and Class R6 shares of the Fund. The Trust has adopted plans pursuant to Rule12b-1 under the 1940 Act with respect to the Fund’s Class A, Class C, Class R, Investor Class shares (collectively, the “Plans”). The Fund, pursuant to the Plans, pays IDI compensation at the annual rate of 0.25% of the Fund’s average daily net assets of Class A shares, 1.00% of the average daily net assets of Class C shares and 0.50% of the average daily net assets of Class R shares. The Fund, pursuant to the Investor Class Plan, reimburses IDI for its allocated share of expenses incurred pursuant to the Investor Class Plan for the period, up to a maximum annual rate of 0.25% of the average daily net assets of Investor Class shares. The fees are accrued daily and paid monthly. Of the Plan payments, up to 0.25% of the average daily net assets of each class of shares may be paid to furnish continuing personal shareholder services to customers who purchase and own shares of such classes. Any amounts not paid as a service fee under the Plans would constitute an asset-based sales charge. Rules of the Financial Industry Regulatory Authority (“FINRA”) impose a cap on the total sales charges, including asset-based sales charges, that may be paid by any class of shares of the Fund. For the year ended October 31, 2019, expenses incurred under the Plans are shown in the Statement of Operations asDistribution fees.
Front-end sales commissions and CDSC (collectively, the “sales charges”) are not recorded as expenses of the Fund.Front-end sales commissions are deducted from proceeds from the sales of Fund shares prior to investment in Class A shares of the Fund. CDSC are deducted from redemption proceeds prior to remittance to the shareholder. During the year ended October 31, 2019, IDI advised the Fund that IDI retained $37,948 infront-end sales commissions from the sale of Class A shares and $50,867 and $8,833 from Class A and Class C shares, respectively, for CDSC imposed upon redemptions by shareholders.
Certain officers and trustees of the Trust are officers and directors of the Adviser, IIS and/or IDI.
NOTE 3–Additional Valuation Information
GAAP defines fair value as the price that would be received to sell an asset or paid to transfer a liability in an orderly transaction between market participants at the measurement date, under current market conditions. GAAP establishes a hierarchy that prioritizes the inputs to valuation methods, giving the highest priority to readily available unadjusted quoted prices in an active market for identical assets (Level 1) and the lowest priority to significant unobservable inputs (Level 3), generally when market prices are not readily available or are unreliable. Based on the valuation inputs, the securities or other investments are tiered into one of three levels. Changes in valuation methods may result in transfers in or out of an investment’s assigned level:
| | | | |
| | | Level 1 – | | Prices are determined using quoted prices in an active market for identical assets. |
| | Level 2 – | | Prices are determined using other significant observable inputs. Observable inputs are inputs that other market participants may use in pricing a security. These may include quoted prices for similar securities, interest rates, prepayment speeds, credit risk, yield curves, loss severities, default rates, discount rates, volatilities and others. |
| | Level 3 – | | Prices are determined using significant unobservable inputs. In situations where quoted prices or observable inputs are unavailable (for example, when there is little or no market activity for an investment at the end of the period), unobservable inputs may be used. Unobservable inputs reflect the Fund’s own assumptions about the factors market participants would use in determining fair value of the securities or instruments and would be based on the best available information. |
The following is a summary of the tiered valuation input levels, as of October 31, 2019. The level assigned to the securities valuations may not be an indication of the risk or liquidity associated with investing in those securities. Because of the inherent uncertainties of valuation, the values reflected in the financial statements may materially differ from the value received upon actual sale of those investments.
| | | | | | | | | | | | | | | | |
| | | Level 1 | | | Level 2 | | | Level 3 | | | Total | |
| |
Investments in Securities | | | | | | | | | | | | | | | | |
| |
Denmark | | $ | – | | | $ | 24,664,981 | | | | $– | | | $ | 24,664,981 | |
| |
France | | | 9,615,493 | | | | 182,146,621 | | | | – | | | | 191,762,114 | |
| |
Germany | | | – | | | | 169,906,386 | | | | – | | | | 169,906,386 | |
| |
Hungary | | | – | | | | 10,045,766 | | | | – | | | | 10,045,766 | |
| |
Ireland | | | 11,716,891 | | | | 32,231,657 | | | | – | | | | 43,948,548 | |
| |
Italy | | | – | | | | 54,104,409 | | | | – | | | | 54,104,409 | |
| |
Netherlands | | | – | | | | 72,504,764 | | | | – | | | | 72,504,764 | |
| |
Russia | | | 74,750,489 | | | | – | | | | – | | | | 74,750,489 | |
| |
Spain | | | – | | | | 21,503,313 | | | | – | | | | 21,503,313 | |
| |
Sweden | | | – | | | | 35,285,999 | | | | – | | | | 35,285,999 | |
| |
Switzerland | | | – | | | | 100,509,081 | | | | – | | | | 100,509,081 | |
| |
Turkey | | | – | | | | 33,679,211 | | | | – | | | | 33,679,211 | |
| |
United Kingdom | | | – | | | | 326,167,013 | | | | – | | | | 326,167,013 | |
| |
United States | | | 33,058,858 | | | | – | | | | – | | | | 33,058,858 | |
| |
Money Market Funds | | | 80,142,066 | | | | – | | | | – | | | | 80,142,066 | |
| |
Total Investments | | $ | 209,283,797 | | | $ | 1,062,749,201 | | | | $– | | | $ | 1,272,032,998 | |
| |
19 Invesco European Growth Fund
NOTE 4–Expense Offset Arrangement(s)
The expense offset arrangement is comprised of transfer agency credits which result from balances in demand deposit accounts used by the transfer agent for clearing shareholder transactions. For the year ended October 31, 2019, the Fund received credits from this arrangement, which resulted in the reduction of the Fund’s total expenses of $11,714.
NOTE 5–Trustees’ and Officers’ Fees and Benefits
Trustees’ and Officers’ Fees and Benefitsinclude amounts accrued by the Fund to pay remuneration to certain Trustees and Officers of the Fund. Trustees have the option to defer compensation payable by the Fund, andTrustees’ and Officers’ Fees and Benefitsalso include amounts accrued by the Fund to fund such deferred compensation amounts. Those Trustees who defer compensation have the option to select various Invesco Funds in which their deferral accounts shall be deemed to be invested. Finally, certain current Trustees were eligible to participate in a retirement plan that provided for benefits to be paid upon retirement to Trustees over a period of time based on the number of years of service. The Fund may have certain former Trustees who also participate in a retirement plan and receive benefits under such plan.Trustees’ and Officers’ Fees and Benefitsinclude amounts accrued by the Fund to fund such retirement benefits. Obligations under the deferred compensation and retirement plans represent unsecured claims against the general assets of the Fund.
NOTE 6–Cash Balances
The Fund is permitted to temporarily carry a negative or overdrawn balance in its account with State Street Bank and Trust Company, the custodian bank. Such balances, if any atperiod-end, are shown in the Statement of Assets and Liabilities under the payable captionAmount due custodian. To compensate the custodian bank for such overdrafts, the overdrawn Fund may either (1) leave funds as a compensating balance in the account so the custodian bank can be compensated by earning the additional interest; or (2) compensate by paying the custodian bank at a rate agreed upon by the custodian bank and Invesco, not to exceed the contractually agreed upon rate.
NOTE 7–Distributions to Shareholders and Tax Components of Net Assets
Tax Character of Distributions to Shareholders Paid During the Fiscal Years Ended October 31, 2019 and 2018
| | | | | | | | |
| | | 2019 | | | 2018 | |
Ordinary income | | $ | 20,254,222 | | | $ | 33,703,804 | |
Tax Components of Net Assets atPeriod-End:
| | | | |
| | 2019 | |
Undistributed ordinary income | | $ | 34,441,473 | |
Net unrealized appreciation – investments | | | 278,930,209 | |
Net unrealized appreciation – foreign currencies | | | 66,957 | |
Temporary book/tax differences | | | (203,077 | ) |
Capital loss carryforward | | | (2,987,863 | ) |
Shares of beneficial interest | | | 964,730,242 | |
Total net assets | | $ | 1,274,977,941 | |
The difference between book-basis andtax-basis unrealized appreciation (depreciation) is due to differences in the timing of recognition of gains and losses on investments for tax and book purposes. The Fund’s net unrealized appreciation difference is attributable primarily to wash sales and passive foreign investment companies.
The temporary book/tax differences are a result of timing differences between book and tax recognition of income and/or expenses. The Fund’s temporary book/tax differences are the result of the trustee deferral of compensation and retirement plan benefits.
Capital loss carryforward is calculated and reported as of a specific date. Results of transactions and other activity after that date may affect the amount of capital loss carryforward actually available for the Fund to utilize. Capital losses generated in years beginning after December 22, 2010 can be carried forward for an unlimited period, whereas previous losses expire in eight tax years. Capital losses with an expiration period may not be used to offset capital gains until all net capital losses without an expiration date have been utilized. Capital loss carryforwards with no expiration date will retain their character as either short-term or long-term capital losses instead of as short-term capital losses as under prior law. The ability to utilize capital loss carryforwards in the future may be limited under the Internal Revenue Code and related regulations based on the results of future transactions.
The Fund has a capital loss carryforward as of October 31, 2019, as follows:
| | | | | | | | | | | | |
| Capital Loss Carryforward* | |
Expiration | | | Short-Term | | | | Long-Term | | | | Total | |
Not subject to expiration | | $ | 2,987,863 | | | $ | – | | | $ | 2,987,863 | |
| * | Capital loss carryforward as of the date listed above is reduced for limitations, if any, to the extent required by the Internal Revenue Code and may be further limited depending upon a variety of factors, including the realization of net unrealized gains or losses as of the date of any reorganization. |
NOTE 8–Investment Transactions
The aggregate amount of investment securities (other than short-term securities, U.S. Treasury obligations and money market funds, if any) purchased and sold by the Fund during the year ended October 31, 2019 was $118,240,386 and $378,897,420, respectively. Cost of
20 Invesco European Growth Fund
investments, including any derivatives, on a tax basis includes the adjustments for financial reporting purposes as of the most recently completed federal income tax reportingperiod-end.
| | | | |
| Unrealized Appreciation (Depreciation) of Investments on a Tax Basis | |
| |
Aggregate unrealized appreciation of investments | | $ | 350,154,300 | |
| |
Aggregate unrealized (depreciation) of investments | | | (71,224,091 | ) |
| |
Net unrealized appreciation of investments | | $ | 278,930,209 | |
| |
Cost of investments for tax purposes is $993,102,789.
NOTE 9–Reclassification of Permanent Differences
Primarily as a result of differing book/tax treatment of foreign currency transactions, on October 31, 2019, undistributed net investment income was increased by $550,401 and undistributed net realized gain (loss) was decreased by $550,401. This reclassification had no effect on the net assets or the distributable earnings of the Fund.
NOTE 10–Share Information
| | | | | | | | | | | | | | | | |
| | | Summary of Share Activity | |
| | | Years ended October 31, | |
| | | 2019(a) | | | 2018 | |
| | | Shares | | | Amount | | | Shares | | | Amount | |
Sold: | | | | | | | | | | | | | | | | |
| | | | |
Class A | | | 751,237 | | | $ | 27,123,459 | | | | 1,738,837 | | | $ | 70,596,040 | |
Class B(b) | | | – | | | | – | | | | 276 | | | | 10,457 | |
Class C | | | 67,166 | | | | 2,239,467 | | | | 441,871 | | | | 16,840,479 | |
Class R | | | 34,739 | | | | 1,257,448 | | | | 62,386 | | | | 2,499,749 | |
Class Y | | | 4,660,942 | | | | 165,361,568 | | | | 8,087,234 | | | | 330,612,058 | |
Investor Class | | | 54,987 | | | | 1,960,821 | | | | 80,220 | | | | 3,254,328 | |
Class R6 | | | 31,879 | | | | 1,165,050 | | | | 282,335 | | | | 11,997,948 | |
| | | | |
Issued as reinvestment of dividends: | | | | | | | | | | | | | | | | |
Class A | | | 138,228 | | | | 4,622,322 | | | | 213,154 | | | | 8,645,499 | |
Class B(b) | | | – | | | | – | | | | 306 | | | | 11,562 | |
Class C | | | 8,593 | | | | 268,453 | | | | 29,224 | | | | 1,104,957 | |
Class R | | | 3,199 | | | | 106,759 | | | | 5,661 | | | | 228,874 | |
Class Y | | | 175,171 | | | | 5,859,477 | | | | 221,896 | | | | 9,006,740 | |
Investor Class | | | 51,563 | | | | 1,719,098 | | | | 73,652 | | | | 2,978,495 | |
Class R6 | | | 5,015 | | | | 167,583 | | | | 2,560 | | | | 103,845 | |
| | | | |
Conversion of Class B shares to Class A shares:(c) | | | | | | | | | | | | | | | | |
Class A | | | – | | | | – | | | | 21,125 | | | | 921,703 | |
Class B | | | – | | | | – | | | | (22,849 | ) | | | (921,703 | ) |
| | | | |
Automatic conversion of Class C shares to Class A shares: | | | | | | | | | | | | | | | | |
Class A | | | 517,108 | | | | 18,495,040 | | | | – | | | | – | |
Class C | | | (554,260 | ) | | | (18,495,040 | ) | | | – | | | | – | |
21 Invesco European Growth Fund
| | | | | | | | | | | | | | | | |
| | | Summary of Share Activity | |
| | | Years ended October 31, | |
| | | 2019(a) | | | 2018 | |
| | | Shares | | | Amount | | | Shares | | | Amount | |
Reacquired: | | | | | | | | | | | | | | | | |
Class A | | | (2,754,517 | ) | | $ | (100,049,421 | ) | | | (3,031,629 | ) | | $ | (120,187,297 | ) |
Class B(b) | | | – | | | | – | | | | (5,961 | ) | | | (228,134 | ) |
Class C | | | (640,261 | ) | | | (21,506,371 | ) | | | (670,019 | ) | | | (24,586,019 | ) |
Class R | | | (140,878 | ) | | | (5,043,503 | ) | | | (97,931 | ) | | | (3,914,374 | ) |
Class Y | | | (9,796,982 | ) | | | (347,557,108 | ) | | | (7,509,740 | ) | | | (296,552,844 | ) |
Investor Class | | | (422,290 | ) | | | (15,278,002 | ) | | | (465,669 | ) | | | (18,385,939 | ) |
Class R6 | | | (93,417 | ) | | | (3,427,460 | ) | | | (121,678 | ) | | | (4,807,422 | ) |
Net increase (decrease) in share activity | | | (7,902,778 | ) | | $ | (281,010,360 | ) | | | (664,739 | ) | | $ | (10,770,998 | ) |
| (a) | There are entities that are record owners of more than 5% of the outstanding shares of the Fund and in the aggregate own 50% of the outstanding shares of the Fund. The Fund and the Fund’s principal underwriter or adviser, are parties to participation agreements with these entities whereby these entities sell units of interest in separate accounts funding variable products that are invested in the Fund. The Fund, Invesco and/or Invesco affiliates may make payments to these entities, which are considered to be related to the Fund, for providing services to the Fund, Invesco and/or Invesco affiliates including but not limited to services such as, securities brokerage, third party record keeping and account servicing and administrative services. The Fund has no knowledge as to whether all or any portion of the shares owned of record by these entities are also owned beneficially. |
| (b) | Class B shares activity for the period November 1, 2017 through January 26, 2018 (date of conversion). |
| (c) | Effective as of the close of business January 26, 2018, all outstanding Class B shares were converted to Class A shares. |
22 Invesco European Growth Fund
Report of Independent Registered Public Accounting Firm
To the Board of Trustees of AIM International Mutual Funds (Invesco International Mutual Funds) and Shareholders of Invesco European Growth Fund
Opinion on the Financial Statements
We have audited the accompanying statement of assets and liabilities, including the schedule of investments, of Invesco European Growth Fund (one of the funds constituting AIM International Mutual Funds (Invesco International Mutual Funds), referred to hereafter as the “Fund”) as of October 31, 2019, the related statement of operations for the year ended October 31, 2019, the statement of changes in net assets for each of the two years in the period ended October 31, 2019, including the related notes, and the financial highlights for each of the periods indicated therein (collectively referred to as the “financial statements”). In our opinion, the financial statements present fairly, in all material respects, the financial position of the Fund as of October 31, 2019, the results of its operations for the year then ended, the changes in its net assets for each of the two years in the period ended October 31, 2019 and the financial highlights for each of the periods indicated therein in conformity with accounting principles generally accepted in the United States of America.
Basis for Opinion
These financial statements are the responsibility of the Fund’s management. Our responsibility is to express an opinion on the Fund’s financial statements based on our audits. We are a public accounting firm registered with the Public Company Accounting Oversight Board (United States) (PCAOB) and are required to be independent with respect to the Fund in accordance with the U.S. federal securities laws and the applicable rules and regulations of the Securities and Exchange Commission and the PCAOB.
We conducted our audits of these financial statements in accordance with the standards of the PCAOB. Those standards require that we plan and perform the audit to obtain reasonable assurance about whether the financial statements are free of material misstatement, whether due to error or fraud.
Our audits included performing procedures to assess the risks of material misstatement of the financial statements, whether due to error or fraud, and performing procedures that respond to those risks. Such procedures included examining, on a test basis, evidence regarding the amounts and disclosures in the financial statements. Our audits also included evaluating the accounting principles used and significant estimates made by management, as well as evaluating the overall presentation of the financial statements. Our procedures included confirmation of securities owned as of October 31, 2019 by correspondence with the custodian, transfer agent and brokers; when replies were not received from brokers, we performed other auditing procedures. We believe that our audits provide a reasonable basis for our opinion.
/s/PricewaterhouseCoopers LLP
Houston, Texas
December 23, 2019
We have served as the auditor of one or more of the investment companies in the Invesco group of investment companies since at least 1995. We have not been able to determine the specific year we began serving as auditor.
23 Invesco European Growth Fund
Calculating your ongoing Fund expenses
Example
As a shareholder of the Fund, you incur two types of costs: (1) transaction costs, which may include sales charges (loads) on purchase payments or contingent deferred sales charges on redemptions, if any; and (2) ongoing costs, including management fees, distribution and/or service(12b-1) fees, and other Fund expenses. This example is intended to help you understand your ongoing costs (in dollars) of investing in the Fund and to compare these costs with ongoing costs of investing in other mutual funds. The example is based on an investment of $1,000 invested at the beginning of the period and held for the entire period May 1, 2019 through October 31, 2019.
Actual expenses
The table below provides information about actual account values and actual expenses. You may use the information in this table, together with the amount you invested, to estimate the expenses that you paid over the period. Simply divide your account value by $1,000 (for example, an $8,600 account value divided by $1,000 = 8.6), then multiply the result by the number in the table under the heading entitled “Actual Expenses Paid During Period” to estimate the expenses you paid on your account during this period.
Hypothetical example for comparison purposes
The table below also provides information about hypothetical account values and hypothetical expenses based on the Fund’s actual expense ratio and an assumed rate of return of 5% per year before expenses, which is not the Fund’s actual return.
The hypothetical account values and expenses may not be used to estimate the actual ending account balance or expenses you paid for the period. You may use this information to compare the ongoing costs of investing in the Fund and other funds. To do so, compare this 5% hypothetical example with the 5% hypothetical examples that appear in the shareholder reports of the other funds.
Please note that the expenses shown in the table are meant to highlight your ongoing costs only and do not reflect any transaction costs, such as sales charges (loads) on purchase payments or contingent deferred sales charges on redemptions, if any. Therefore, the hypothetical information is useful in comparing ongoing costs only, and will not help you determine the relative total costs of owning different funds. In addition, if these transaction costs were included, your costs would have been higher.
| | | | | | | | | | | | | | | | | | | | | | | | |
| | | | | | ACTUAL | | | HYPOTHETICAL
(5% annual return before
expenses) | | | | |
| | Beginning
Account Value
(05/01/19) | | | Ending Account Value
(10/31/19)1 | | | Expenses Paid During
Period2 | | | Ending
Account Value (10/31/19) | | | Expenses Paid During
Period2 | | | Annualized
Expense
Ratio | |
| Class A | | | $1,000.00 | | | | $1,023.80 | | | | $6.84 | | | | $1,018.45 | | | | $6.82 | | | | 1.34 | % |
| Class C | | | 1,000.00 | | | | 1,019.90 | | | | 10.64 | | | | 1,014.67 | | | | 10.61 | | | | 2.09 | |
| Class R | | | 1,000.00 | | | | 1,022.20 | | | | 8.10 | | | | 1,017.19 | | | | 8.08 | | | | 1.59 | |
| Class Y | | | 1,000.00 | | | | 1,024.80 | | | | 5.56 | | | | 1,019.71 | | | | 5.55 | | | | 1.09 | |
| Investor Class | | | 1,000.00 | | | | 1,023.80 | | | | 6.73 | | | | 1,018.55 | | | | 6.72 | | | | 1.32 | |
| Class R6 | | | 1,000.00 | | | | 1,025.60 | | | | 5.00 | | | | 1,020.27 | | | | 4.99 | | | | 0.98 | |
| 1 | The actual ending account value is based on the actual total return of the Fund for the period May 1, 2019 through October 31, 2019, after actual expenses and will differ from the hypothetical ending account value which is based on the Fund’s expense ratio and a hypothetical annual return of 5% before expenses. |
| 2 | Expenses are equal to the Fund’s annualized expense ratio as indicated above multiplied by the average account value over the period, multiplied by 184/365 to reflect the most recent fiscal half year. |
24 Invesco European Growth Fund
Approval of Investment Advisory andSub-Advisory Contracts
At meetings held on June 10, 2019, the Board of Trustees (the Board or the Trustees) of AIM International Mutual Funds (Invesco International Mutual Funds) as a whole, and the independent Trustees, who comprise over 75% of the Board, voting separately, approved the continuance of the Invesco European Growth Fund’s (the Fund) Master Investment Advisory Agreement with Invesco Advisers, Inc. (Invesco Advisers and the investment advisory agreement) and the Master IntergroupSub-Advisory Contract for Mutual Funds with Invesco Asset Management Deutschland GmbH, Invesco Asset Management Limited, Invesco Asset Management (Japan) Limited, Invesco Hong Kong Limited, Invesco Senior Secured Management, Inc. and Invesco Canada Ltd. and separatesub-advisory contracts with Invesco Capital Management LLC and Invesco Asset Management (India) Private Limited (collectively, the AffiliatedSub-Advisers and thesub-advisory contracts) for another year, effective July 1, 2019. After evaluating the factors discussed below, among others, the Board approved the renewal of the Fund’s investment advisory agreement and thesub-advisory contracts and determined that the compensation payable by the Fund to Invesco Advisers and by Invesco Advisers to the AffiliatedSub-Advisers is fair and reasonable.
The Board’s Evaluation Process
The Board’s Investments Committee has established threeSub-Committees, which meet throughout the year to review the performance of funds advised by Invesco Advisers (the Invesco Funds). As part of a regularly scheduled basis ofin-person Board meetings, theSub-Committees meet with portfolio managers for their assigned Invesco Funds and other members of management to review detailed information about investment performance and portfolio attributes of these funds. The Board took into account evaluations and reports that it received from the Investments Committee andSub-Committees, as well as the information provided to such committees and the Board throughout the year, in considering whether to approve each Invesco Fund’s investment advisory agreement andsub-advisory contracts.
As part of the contract renewal process, the Board reviews and considers information provided in response to detailed requests for information submitted to management by the independent Trustees with assistance from legal counsel to the independent Trustees. The Board receives comparative investment performance and fee data regarding the Invesco Funds prepared by Invesco Advisers and Broadridge Financial Solutions, Inc. (Broadridge), an independent mutual fund data provider. The Board also receives an independent written
evaluation from the Senior Officer, an officer of the Invesco Funds who reports directly to the independent Trustees. The Senior Officer’s evaluation is prepared as part of his responsibility to manage the process by which the Invesco Funds’ proposed management fees are negotiated during the annual contract renewal process to ensure they are negotiated in a manner that is at arms’ length and reasonable. In addition to meetings with Invesco Advisers and fund counsel throughout the year, the independent Trustees also discuss the continuance of the investment advisory agreement andsub-advisory contracts in separate sessions with the Senior Officer and with independent legal counsel.
The discussion below is a summary of the Senior Officer’s independent written evaluation with respect to the Fund’s investment advisory agreement, as well as a discussion of the material factors and related conclusions that formed the basis for the Board’s approval of the Fund’s investment advisory agreement andsub-advisory contracts. The Trustees’ review and conclusions are based on the comprehensive consideration of all information presented to them during the course of the year and in prior years and are not the result of any single determinative factor. Moreover, one Trustee may have weighed a particular piece of information or factor differently than another Trustee. This information is current as of June 10, 2019.
Factors and Conclusions and Summary of Independent Written Fee Evaluation
| A. | Nature, Extent and Quality of Services Provided by Invesco Advisers and the AffiliatedSub-Advisers |
The Board reviewed the nature, extent and quality of the advisory services provided to the Fund by Invesco Advisers under the Fund’s investment advisory agreement, and the credentials and experience of the officers and employees of Invesco Advisers who provide these services, including the Fund’s portfolio manager(s). The Board’s review included consideration of Invesco Advisers’ investment process oversight and structure, credit analysis and investment risk management. The Board also considerednon-advisory services that Invesco Advisers and its affiliates provide to the Invesco Funds such as various back office support functions, third party oversight, internal audit, valuation, portfolio trading and legal and compliance. The Board also received and reviewed information about Invesco Advisers’ role as administrator of the Invesco Funds’ liquidity risk management program. The Board also reviewed and considered the benefits to shareholders of investing in a fund that is part of the Invesco family of funds under the
umbrella of Invesco Ltd., Invesco Advisers’ parent company, and noted Invesco Ltd.’s depth and experience in conducting an investment management business, as well as its commitment of financial and other resources to such business. The Board reviewed and considered information about the resources that Invesco Advisers intends to continue to commit to managing the Invesco family of funds following Invesco Ltd.’s acquisition of OppenheimerFunds, Inc. and its subsidiaries. The Board concluded that the nature, extent and quality of the services provided to the Fund by Invesco Advisers are appropriate and satisfactory.
The Board reviewed the services that may be provided by the Affiliated Sub-Advisers under thesub-advisory contracts and the credentials and experience of the officers and employees of the AffiliatedSub-Advisers who provide these services. The Board noted the AffiliatedSub-Advisers’ expertise with respect to certain asset classes and that the AffiliatedSub-Advisers have offices and personnel that are located in financial centers around the world. As a result, the Board noted that the AffiliatedSub-Advisers can provide research and investment analysis on the markets and economies of various countries in which the Fund may invest, make recommendations regarding securities and assist with security trades. The Board concluded that thesub-advisory contracts may benefit the Fund and its shareholders by permitting Invesco Advisers to use the resources and talents of the Affiliated Sub-Advisers in managing the Fund. The Board concluded that the nature, extent and quality of the services that may be provided by the Affiliated Sub-Advisers are appropriate and satisfactory.
| B. | Fund Investment Performance |
The Board considered Fund investment performance as a relevant factor in considering whether to approve the investment advisory agreement. The Board did not view Fund investment performance as a relevant factor in considering whether to approve thesub-advisory contracts for the Fund, as no Affiliated Sub-Adviser currently manages assets of the Fund.
The Board compared the Fund’s investment performance over multiple time periods ending December 31, 2018 to the performance of funds in the Broadridge performance universe and against the Lipper European Funds Index. The Board noted that performance of Class A shares of the Fund was in the fourth quintile of its performance universe for the one and three year periods and the third quintile for the five year period (the first quintile being the best performing funds and the fifth quintile being the
25 Invesco European Growth Fund
worst performing funds). The Board noted that performance of Class A shares of the Fund was below the performance of the Index for the one and three year periods, and above the performance of the Index for the five year period. The Board noted that the Fund’s overweight exposure to certain sectors and regions negatively impacted relative performance. The Trustees also reviewed more recent Fund performance and this review did not change their conclusions.
| C. | Advisory andSub-Advisory Fees and Fund Expenses |
The Board compared the Fund’s contractual management fee rate to the contractual management fee rates of funds in the Fund’s Broadridge expense group. The Board noted that the contractual management fee rate for Class A shares of the Fund was above the median contractual management fee rate of funds in its expense group. The Board noted that the term “contractual management fee” for funds in the expense group may include both advisory and certainnon-portfolio management administrative services fees, but that Broadridge does not provide information on a fund by fund basis as to what is included. The Board also reviewed the methodology used by Broadridge in providing expense group information, which includes using each fund’s contractual management fee schedule (including any applicable breakpoints) as reported in the most recent prospectus or statement of additional information for each fund in the expense group. The Board also considered comparative information regarding the Fund’s total expense ratio and its various components. The Board noted that the Fund’s contractual management fees and total expense ratio were in the fourth quintile of its expense group and that the Fund’s actual management fees were in the fifth quintile of its expense group. The Board discussed with management reasons for such relative actual and contractual management fees and total expenses.
The Board noted that Invesco Advisers has contractually agreed to waive fees and/or limit expenses of the Fund for the term disclosed in the Fund’s registration statement in an amount necessary to limit total annual operating expenses to a specified percentage of average daily net assets for each class of the Fund.
The Board also considered the fees charged by Invesco Advisers and the AffiliatedSub-Advisers to other similarly managed client accounts. The Board noted that Invesco Advisers or the Affiliated Sub-Advisers may charge lower fees to large institutional clients. Invesco Advisers reviewed with the Board differences in the scope of services it provides to the Invesco Funds relative to certain other types of client accounts, including management of cash flows as a result of redemptions and purchases, necessary infrastructure such as officers, office space, technology, legal and distribution,
oversight of service providers, costs and business risks associated with launching new funds and sponsoring and maintaining the product line, preparation of annual registration statement updates and financial information and compliance with federal and state laws and regulations.
The Board also considered the services that may be provided by the AffiliatedSub-Advisers pursuant to thesub-advisory contracts, as well as the fees payable by Invesco Advisers to the AffiliatedSub-Advisers pursuant to thesub-advisory contracts.
| D. | Economies of Scale and Breakpoints |
The Board considered the extent to which there may be economies of scale in the provision of advisory services to the Fund. The Board considered Invesco’s reinvestment in its business, including investments in business infrastructure and cybersecurity. The Board also considered that the Fund benefits from economies of scale through contractual breakpoints in the Fund’s advisory fee schedule, which generally operate to reduce the Fund’s expense ratio as it grows in size. The Board noted that the Fund shares directly in economies of scale through lower fees charged by third party service providers based on the combined size of the Invesco Funds. The Board noted that the Fund may also benefit from economies of scale through initial fee setting, fee waivers and expense reimbursements.
| E. | Profitability and Financial Resources |
The Board reviewed information from Invesco Advisers concerning the costs of the advisory and other services that Invesco Advisers and its affiliates provide to the Fund and the Invesco Funds and the profitability of Invesco Advisers and its affiliates in providing these services. The Board considered the methodology used for calculating profitability and noted the periodic review of such methodology by an independent consultant. The Board noted that Invesco Advisers continues to operate at a net profit from services Invesco Advisers and its affiliates provide to the Invesco Funds and the Fund. The Board did not deem the level of profits realized by Invesco Advisers and its affiliates from providing services to the Fund to be excessive given the nature, extent and quality of the services provided. The Board received information from Invesco Advisers demonstrating that Invesco Advisers and the AffiliatedSub-Advisers are financially sound and have the resources necessary to perform their obligations under the investment advisory agreement andsub-advisory contracts.
| F. | Collateral Benefits to Invesco Advisers and its Affiliates |
The Board considered various other benefits received by Invesco Advisers and its affiliates from the relationship with the Fund, including the fees received for providing administrative, transfer agency and distribution services to the Fund. The Board considered comparative information regarding fees charged for these
services, including information provided by Broadridge and other independent sources. The Board considered the performance of Invesco Advisers and its affiliates in providing these services and the organizational structure employed to provide these services. The Board also considered that these services are provided to the Fund pursuant to written contracts that are reviewed and approved on an annual basis by the Board; and that the services are required for the operation of the Fund.
The Board considered the benefits realized by Invesco Advisers and the AffiliatedSub-Advisers as a result of portfolio brokerage transactions executed through “soft dollar” arrangements. The Board noted that soft dollar arrangements may result in the Fund bearing costs to purchase research that may be used by Invesco Advisers or the AffiliatedSub-Advisers with other clients and may reduce Invesco Advisers’ or the AffiliatedSub-Advisers’ expenses. The Board also considered that it receives periodic reports from Invesco representing that these arrangements are consistent with regulatory requirements. The Board did not deem the soft dollar arrangements to be inappropriate.
The Board considered that the Fund’s uninvested cash and cash collateral from any securities lending arrangements may be invested in money market funds advised by Invesco Advisers pursuant to procedures approved by the Board. The Board considered information regarding the returns of the affiliated money market funds relative to comparable overnight investments, as well as the costs to the Fund of such investments. The Board noted that Invesco Advisers receives advisory fees from these affiliated money market funds attributable to such investments, although Invesco Advisers has contractually agreed to waive through varying periods the advisory fees payable by the Invesco Funds with respect to certain investments in the affiliated money market funds. The waiver is in an amount equal to 100% of the net advisory fee Invesco Advisers receives from the affiliated money market funds with respect to the Fund’s investment in the affiliated money market funds of uninvested cash, but not cash collateral. The Board concluded that the amount of advisory fees received by Invesco Advisers from the Fund’s investment of cash collateral from any securities lending arrangements in the affiliated money market funds is fair and reasonable.
The Board also considered that an affiliated broker may receive commissions for executing certain trades for the Fund. Invesco Advisers and the AffiliatedSub-Advisers may use the affiliated broker to, among other things, control order routing and minimize information leakage, and the Board was advised that such trades are executed in compliance with rules under the federal securities laws and consistent with best execution obligations.
26 Invesco European Growth Fund
Tax Information
Form1099-DIV, Form 1042-S and otheryear-end tax information provide shareholders with actual calendar year amounts that should be included in their tax returns. Shareholders should consult their tax advisors.
The following distribution information is being provided as required by the Internal Revenue Code or to meet a specific state’s requirement.
The Fund designates the following amounts or, if subsequently determined to be different, the maximum amount allowable for its fiscal year ended October 31, 2019:
| | | | | | |
| Federal and State Income Tax |
Qualified Dividend Income* | | | 83.88 | % | | |
Corporate Dividends Received Deduction* | | | 3.30 | % | | |
U.S. Treasury Obligations* | | | 0.00 | % | | |
Foreign Taxes | | $ | 0.1182 | | | per share |
Foreign Source Income | | $ | 1.3503 | | | per share |
| | * | The above percentages are based on ordinary income dividends paid to shareholders during the Fund’s fiscal year. |
27 Invesco European Growth Fund
Trustees and Officers
The address of each trustee and officer is AIM International Mutual Funds (Invesco International Mutual Funds) (the “Trust”), 11 Greenway Plaza, Suite 1000, Houston, Texas77046-1173. The trustees serve for the life of the Trust, subject to their earlier death, incapacitation, resignation, retirement or removal as more specifically provided in the Trust’s organizational documents. Each officer serves for a one year term or until their successors are elected and qualified. Column two below includes length of time served with predecessor entities, if any.
| | | | | | | | | | |
Name, Year of Birth and
Position(s) Held with the Trust | | Trustee and/or Officer Since | | Principal Occupation(s) During Past 5 Years | | Number of
Funds in
Fund Complex
Overseen by
Trustee | | | Other
Directorship(s)
Held by Trustee
During Past
5 Years |
Interested Persons | | | | | | | | | | |
Martin L. Flanagan1 – 1960 Trustee and Vice Chair | | 2007 | | Executive Director, Chief Executive Officer and President, Invesco Ltd. (ultimate parent of Invesco and a global investment management firm); Trustee and Vice Chair, The Invesco Funds; Vice Chair, Investment Company Institute; and Member of Executive Board, SMU Cox School of Business Formerly: Advisor to the Board, Invesco Advisers, Inc. (formerly known as Invesco Institutional (N.A.), Inc.); Chairman and Chief Executive Officer, Invesco Advisers, Inc. (registered investment adviser); Director, Chairman, Chief Executive Officer and President, Invesco Holding Company (US), Inc. (formerly IVZ Inc.) (holding company), Invesco Group Services, Inc. (service provider) and Invesco North American Holdings, Inc. (holding company); Director, Chief Executive Officer and President, Invesco Holding Company Limited (parent of Invesco and a global investment management firm); Director, Invesco Ltd.; Chairman, Investment Company Institute and President,Co-Chief Executive Officer,Co-President, Chief Operating Officer and Chief Financial Officer, Franklin Resources, Inc. (global investment management organization) | | | 229 | | | None |
Philip A. Taylor2– 1954 Trustee | | 2006 | | Vice Chair, Invesco Ltd.; Trustee, The Invesco Funds Formerly: Director, Invesco Canada Ltd. (formerly known as Invesco Trimark Ltd./Invesco Trimark Ltèe) (registered investment adviser and registered transfer agent); Head of the Americas and Senior Managing Director, Invesco Ltd.; Director, Invesco Advisers, Inc. (formerly known as Invesco Institutional (N.A.), Inc.) (registered investment adviser); Director and Chairman, Invesco Investment Services, Inc. (formerly known as Invesco AIM Investment Services, Inc.) (registered transfer agent); Chief Executive Officer, Invesco Corporate Class Inc. (corporate mutual fund company); Chairman and Chief Executive Officer, Invesco Canada Ltd. (formerly known as Invesco Trimark Ltd./Invesco Trimark Ltèe) (registered investment adviser and registered transfer agent); Senior Vice President, The Invesco Funds; Director, Invesco Investment Advisers LLC (formerly known as Van Kampen Asset Management); Director, Chairman, Chief Executive Officer and President, Invesco Management Group, Inc. (formerly known as Invesco AIM Management Group, Inc.) (financial services holding company);Co-Chairman,Co-President andCo-Chief Executive Officer, Invesco Advisers, Inc. (formerly known as Invesco Institutional (N.A.), Inc.) (registered investment adviser); Director, Chief Executive Officer and President, Van Kampen Exchange Corp; President and Principal Executive Officer, The Invesco Funds (other than AIM Treasurer’s Series Trust (Invesco Treasurer’s Series Trust), Short-Term Investments Trust and Invesco Management Trust); Executive Vice President, The Invesco Funds (AIM Treasurer’s Series Trust (Invesco Treasurer’s Series Trust), Short-Term Investments Trust and Invesco Management Trust only); Director and President, INVESCO Funds Group, Inc. (registered investment adviser and registered transfer agent); Director and Chairman, IVZ Distributors, Inc. (formerly known as INVESCO Distributors, Inc.) (registered broker dealer); Director, President and Chairman, Invesco Inc. (holding company), Invesco Canada Holdings Inc. (holding company), Trimark Investments Ltd./Placements Trimark Ltèe and Invesco Financial Services Ltd/Services Financiers Invesco Ltèe; Chief Executive Officer, Invesco Canada Fund Inc. (corporate mutual fund company); Director and Chairman, Van Kampen Investor Services Inc.; Director, Chief Executive Officer and President, 1371 Preferred Inc. (holding company) and Van Kampen Investments Inc.; Director and President, AIM GP Canada Inc. (general partner for limited partnerships) and Van Kampen Advisors, Inc.; Director and Chief Executive Officer, Invesco Trimark Dealer Inc. (registered broker dealer); Director, Invesco Distributors, Inc. (formerly known as Invesco AIM Distributors, Inc.) (registered broker dealer); Manager, Invesco Capital Management LLC; Director, Chief Executive Officer and President, Invesco Advisers, Inc.; Director, Chairman, Chief Executive Officer and President, Invesco AIM Capital Management, Inc.; President, Invesco Trimark Dealer Inc. and Invesco Trimark Ltd./Invesco Trimark Ltèe; Director and President, AIM Trimark Corporate Class Inc. and AIM Trimark Canada Fund Inc.; Senior Managing Director, Invesco Holding Company Limited; Director and Chairman, Fund Management Company (former registered broker dealer); President and Principal Executive Officer, The Invesco Funds (AIM Treasurer’s Series Trust (Invesco Treasurer’s Series Trust), and Short-Term Investments Trust only); President, AIM Trimark Global Fund Inc. and AIM Trimark Canada Fund Inc. | | | 229 | | | None |
| 1 | Mr. Flanagan is considered an interested person (within the meaning of Section 2(a)(19) of the 1940 Act) of the Trust because he is an officer of the Adviser to the Trust, and an officer and a director of Invesco Ltd., ultimate parent of the Adviser. |
| 2 | Mr. Taylor is considered an interested person (within the meaning of Section 2(a)(19) of the 1940 Act) of the Trust because he is an officer and a director of the Adviser. |
T-1 Invesco European Growth Fund
Trustees and Officers–(continued)
| | | | | | | | | | |
Name, Year of Birth and
Position(s) Held with the Trust | | Trustee and/or Officer Since | | Principal Occupation(s)
During Past 5 Years | | Number of
Funds in
Fund Complex
Overseen by
Trustee | | | Other
Directorship(s)
Held by Trustee
During Past
5 Years |
Independent Trustees | | | | | | | | |
Bruce L. Crockett – 1944 Trustee and Chair | | 1992 | | Chairman, Crockett Technologies Associates (technology consulting company) Formerly: Director, Captaris (unified messaging provider); Director, President and Chief Executive Officer, COMSAT Corporation; Chairman, Board of Governors of INTELSAT (international communications company); ACE Limited (insurance company); Independent Directors Council and Investment Company Institute: Member of the Audit Committee, Investment Company Institute; Member of the Executive Committee and Chair of the Governance Committee, Independent Directors Council | | | 229 | | | Director and Chairman of the Audit Committee, ALPS (Attorneys Liability Protection Society) (insurance company); Director and Member of the Audit Committee and Compensation Committee, Ferroglobe PLC (metallurgical company) |
David C. Arch – 1945 Trustee | | 2010 | | Chairman of Blistex Inc. (consumer health care products manufacturer); Member, World Presidents’ Organization | | | 229 | | | Board member of the Illinois Manufacturers’ Association |
Beth Ann Brown – 1968 Trustee | | 2019 | | Independent Consultant Formerly: Head of Intermediary Distribution, Managing Director, Strategic Relations, Managing Director, Head of National Accounts, Senior Vice President, National Account Manager and Senior Vice President, Key Account Manager, Columbia Management Investment Advisers LLC; Vice President, Key Account Manager, Liberty Funds Distributor, Inc.; and Trustee of certain Oppenheimer Funds | | | 229 | | | Director, Board of Directors of Caron Engineering Inc.; President and Director, Acton Shapleigh Youth Conservation Corps (non-profit); and Vice President and Director of Grahamtastic Connection (non- profit) |
Jack M. Fields – 1952 Trustee | | 1997 | | Chief Executive Officer, Twenty First Century Group, Inc. (government affairs company); and Chairman, Discovery Learning Alliance(non-profit) Formerly: Owner and Chief Executive Officer, Dos Angeles Ranch L.P. (cattle, hunting, corporate entertainment); Director, Insperity, Inc. (formerly known as Administaff) (human resources provider); Chief Executive Officer, Texana Timber LP (sustainable forestry company); Director of Cross Timbers Quail Research Ranch(non-profit); and member of the U.S. House of Representatives | | | 229 | | | None |
Cynthia Hostetler – 1962 Trustee | | 2017 | | Non-Executive Director and Trustee of a number of public and private business corporations Formerly: Director, Aberdeen Investment Funds (4 portfolios); Head of Investment Funds and Private Equity, Overseas Private Investment Corporation; President, First Manhattan Bancorporation, Inc.; Attorney, Simpson Thacher & Bartlett LLP | | | 229 | | | Vulcan Materials Company (construction materials company); Trilinc Global Impact Fund; Genesee & Wyoming, Inc. (railroads); Artio Global Investment LLC (mutual fund complex); Edgen Group, Inc. (specialized energy and infrastructure products distributor); Investment Company Institute (professional organization); Independent Directors Council (professional organization) |
T-2 Invesco European Growth Fund
Trustees and Officers–(continued)
| | | | | | | | | | |
Name, Year of Birth and
Position(s)
Held with the Trust | | Trustee and/or Officer
Since | | Principal Occupation(s)
During Past 5 Years | | Number of
Funds in
Fund Complex
Overseen by
Trustee | | | Other
Directorship(s)
Held by Trustee
During Past
5 Years |
Independent Trustees–(continued) | | | | | | |
Eli Jones – 1961 Trustee | | 2016 | | Professor and Dean, Mays Business School - Texas A&M University Formerly: Professor and Dean, Walton College of Business, University of Arkansas and E.J. Ourso College of Business, Louisiana State University; Director, Arvest Bank | | | 229 | | | Insperity, Inc. (formerly known as Administaff) (human resources provider) |
Elizabeth Krentzman – 1959 Trustee | | 2019 | | Formerly: Principal and Chief Regulatory Advisor for Asset Management Services and U.S. Mutual Fund Leader of Deloitte & Touche LLP; General Counsel of the Investment Company Institute (trade association); National Director of the Investment Management Regulatory Consulting Practice, Principal, Director and Senior Manager of Deloitte & Touche LLP; Assistant Director of the Division of Investment Management - Office of Disclosure and Investment Adviser Regulation of the U.S. Securities and Exchange Commission and various positions with the Division of Investment Management - Office of Regulatory Policy of the U.S. Securities and Exchange Commission; Associate at Ropes & Gray LLP; Advisory Board Member of the Securities and Exchange Commission Historical Society; and Trustee of certain Oppenheimer Funds | | | 229 | | | Trustee of the University of Florida National Board Foundation and Audit Committee Member; Member of the Cartica Funds Board of Directors (private investment funds); Member of the University of Florida Law Center Association, Inc. Board of Trustees and Audit Committee Member |
Anthony J. LaCava, Jr. – 1956 Trustee | | 2019 | | Formerly: Director and Member of the Audit Committee, Blue Hills Bank (publicly traded financial institution) and Managing Partner, KPMG LLP | | | 229 | | | Blue Hills Bank; Chairman, Bentley University; Member, Business School Advisory Council; and Nominating Committee KPMG LLP |
Prema Mathai-Davis – 1950 Trustee | | 1998 | | Retired Co-Owner & Partner of Quantalytics Research, LLC, (a FinTech Investment Research Platform for the Self-Directed Investor) | | | 229 | | | None |
Joel W. Motley – 1952 Trustee | | 2019 | | Director of Office of Finance, Federal Home Loan Bank; Member of the Vestry of Trinity Wall Street; Managing Director of Carmona Motley Inc. (privately held financial advisor); Member of the Finance and Budget Committee of the Council on Foreign Relations, Member of the Investment Committee and Board of Human Rights Watch and Member of the Investment Committee and Board of Historic Hudson Valley(non-profit cultural organization) Formerly: Managing Director of Public Capital Advisors, LLC (privately held financial advisor); Managing Director of Carmona Motley Hoffman, Inc. (privately held financial advisor); Trustee of certain Oppenheimer Funds; and Director of Columbia Equity Financial Corp. (privately held financial advisor) | | | 229 | | | Director of Greenwall Foundation (bioethics research foundation); Member of Board and Investment Committee of The Greenwall Foundation; Director of Southern Africa Legal Services Foundation; Board Member and Investment Committee Member of Pulizer Center for Crisis Reporting(non-profit journalism) |
Teresa M. Ressel – 1962 Trustee | | 2017 | | Non-executive director and trustee of a number of public and private business corporations Formerly: Chief Financial Officer, Olayan America, The Olayan Group (international investor/commercial/industrial); Chief Executive Officer, UBS Securities LLC; Group Chief Operating Officer, Americas, UBS AG; Assistant Secretary for Management & Budget and CFO, US Department of the Treasury | | | 229 | | | Atlantic Power Corporation (power generation company); ON Semiconductor Corp. (semiconductor supplier) |
T-3 Invesco European Growth Fund
Trustees and Officers–(continued)
| | | | | | | | | | |
Name, Year of Birth and
Position(s)
Held with the Trust | | Trustee and/or
Officer
Since | | Principal Occupation(s)
During Past 5 Years | | Number of
Funds in
Fund Complex
Overseen by
Trustee | | | Other
Directorship(s)
Held by Trustee
During Past
5 Years |
Independent Trustees–(continued) | | | | | | |
Ann Barnett Stern – 1957 Trustee | | 2017 | | President and Chief Executive Officer, Houston Endowment Inc. (private philanthropic institution) Formerly: Executive Vice President and General Counsel, Texas Children’s Hospital; Attorney, Beck, Redden and Secrest, LLP; Business Law Instructor, University of St. Thomas; Attorney, Andrews & Kurth LLP | | | 229 | | | Federal Reserve Bank of Dallas |
Raymond Stickel, Jr. – 1944 Trustee | | 2005 | | Retired Formerly: Director, Mainstay VP Series Funds, Inc. (25 portfolios); Partner, Deloitte & Touche | | | 229 | | | None |
Robert C. Troccoli – 1949 Trustee | | 2016 | | Retired Formerly: Adjunct Professor, University of Denver - Daniels College of Business; Senior Partner, KPMG LLP | | | 229 | | | None |
Daniel S. Vandivort – 1954 Trustee | | 2019 | | Treasurer, Chairman of the Audit and Finance Committee, and Trustee, Board of Trustees, Huntington Disease Foundation of America; and President, Flyway Advisory Services LLC (consulting and property management) Formerly: Trustee and Governance Chair, of certain Oppenheimer Funds | | | 229 | | | Chairman and Lead Independent Director, Chairman of the Audit Committee, and Director, Board of Directors, Value Line Funds |
James D. Vaughn – 1945 Trustee | | 2019 | | Retired Formerly: Managing Partner, Deloitte & Touche LLP; Trustee and Chairman of the Audit Committee, Schroder Funds; Board Member, Mile High United Way, Boys and Girls Clubs, Boy Scouts, Colorado Business Committee for the Arts, Economic Club of Colorado and Metro Denver Network (economic development corporation); and Trustee of certain Oppenheimer Funds | | | 229 | | | Board member and Chairman of Audit Committee of AMG National Trust Bank; Trustee and Investment Committee member, University of South Dakota Foundation; Board member, Audit Committee Member and past Board Chair, Junior Achievement(non-profit) |
Christopher L. WIlson – 1957 Trustee, Vice Chair and Chair Designate | | 2017 | | Retired Formerly: Director, TD Asset Management USA Inc. (mutual fund complex) (22 portfolios); Managing Partner, CT2, LLC (investing and consulting firm); President/Chief Executive Officer, Columbia Funds, Bank of America Corporation; President/Chief Executive Officer, CDC IXIS Asset Management Services, Inc.; Principal & Director of Operations, Scudder Funds, Scudder, Stevens & Clark, Inc.; Assistant Vice President, Fidelity Investments | | | 229 | | | ISO New England, Inc.(non-profit organization managing regional electricity market) |
T-4 Invesco European Growth Fund
Trustees and Officers–(continued)
| | | | | | | | | | |
Name, Year of Birth and
Position(s) Held with the Trust | | Trustee
and/or
Officer
Since | | Principal Occupation(s)
During Past 5 Years | | Number of
Funds in
Fund Complex
Overseen by
Trustee | | | Other
Directorship(s)
Held by Trustee
During Past
5 Years |
Other Officers | | | | | | | | |
Sheri Morris – 1964 President, Principal Executive Officer and Treasurer | | 1999 | | Head of Global Fund Services, Invesco Ltd.; President, Principal Executive Officer and Treasurer, The Invesco Funds; Vice President, Invesco Advisers, Inc. (formerly known as Invesco Institutional (N.A.), Inc.) (registered investment adviser); and Vice President, Invesco Exchange-Traded Fund Trust, Invesco Exchange-Traded Fund Trust II, Invesco India Exchange-Traded Fund Trust, Invesco Actively Managed Exchange-Traded Fund Trust, Invesco Actively Managed Exchange-Traded Commodity Fund Trust and Invesco Exchange-Traded Self-Indexed Fund Trust; and Vice President, OppenheimerFunds, Inc. Formerly: Vice President and Principal Financial Officer, The Invesco Funds; Vice President, Invesco AIM Advisers, Inc., Invesco AIM Capital Management, Inc. and Invesco AIM Private Asset Management, Inc.; Assistant Vice President and Assistant Treasurer, The Invesco Funds and Assistant Vice President, Invesco Advisers, Inc., Invesco AIM Capital Management, Inc. and Invesco AIM Private Asset Management, Inc.; and Treasurer, Invesco Exchange-Traded Fund Trust, Invesco Exchange-Traded Fund Trust II, Invesco India Exchange-Traded Fund Trust and Invesco Actively Managed Exchange-Traded Fund Trust | | | N/A | | | N/A |
Russell C. Burk – 1958 Senior Vice President and Senior Officer | | 2005 | | Senior Vice President and Senior Officer, The Invesco Funds | | | N/A | | | N/A |
Jeffrey H. Kupor – 1968 Senior Vice President, Chief Legal Officer and Secretary | | 2018 | | Head of Legal of the Americas, Invesco Ltd.; Senior Vice President and Secretary, Invesco Advisers, Inc. (formerly known as Invesco Institutional (N.A.), Inc.) (registered investment adviser); Senior Vice President and Secretary, Invesco Distributors, Inc. (formerly known as Invesco AIM Distributors, Inc.); Vice President and Secretary, Invesco Investment Services, Inc. (formerly known as Invesco AIM Investment Services, Inc.) Senior Vice President, Chief Legal Officer and Secretary, The Invesco Funds; Secretary and General Counsel, Invesco Investment Advisers LLC (formerly known as Van Kampen Asset Management); Secretary and General Counsel, Invesco Capital Markets, Inc. (formerly known as Van Kampen Funds Inc.) and Chief Legal Officer, Invesco Exchange-Traded Fund Trust, Invesco Exchange-Traded Fund Trust II, Invesco India Exchange-Traded Fund Trust, Invesco Actively Managed Exchange-Traded Fund Trust, Invesco Actively Managed Exchange-Traded Commodity Fund Trust and Invesco Exchange-Traded Self-Indexed Fund Trust; Secretary, Invesco Indexing LLC; Secretary, W.L. Ross & Co., LLC Formerly: Secretary and Vice President, Jemstep, Inc.; Head of Legal, Worldwide Institutional, Invesco Ltd.; Secretary and General Counsel, INVESCO Private Capital Investments, Inc.; Senior Vice President, Secretary and General Counsel, Invesco Management Group, Inc. (formerly known as Invesco AIM Management Group, Inc.); Assistant Secretary, INVESCO Asset Management (Bermuda) Ltd.; Secretary and General Counsel, Invesco Private Capital, Inc.; Assistant Secretary and General Counsel, INVESCO Realty, Inc.; Secretary and General Counsel, Invesco Senior Secured Management, Inc.; and Secretary, Sovereign G./P. Holdings Inc. | | | N/A | | | N/A |
Andrew R. Schlossberg – 1974 Senior Vice President | | 2019 | | Head of the Americas and Senior Managing Director, Invesco Ltd.; Director and Senior Vice President, Invesco Advisers, Inc. (formerly known as Invesco Institutional (N.A.), Inc.) (registered investment adviser); Director and Chairman, Invesco Investment Services, Inc. (formerly known as Invesco AIM Investment Services, Inc.) (registered transfer agent); Senior Vice President, The Invesco Funds; Director, Invesco Investment Advisers LLC (formerly known as Van Kampen Asset Management); Director, President and Chairman, Invesco Insurance Agency, Inc. Formerly: Director, Invesco UK Limited; Director and Chief Executive, Invesco Asset Management Limited and Invesco Fund Managers Limited; Assistant Vice President, The Invesco Funds; Senior Vice President, Invesco Advisers, Inc. (formerly known as Invesco Institutional (N.A.), Inc.) (registered investment adviser); Director and Chief Executive, Invesco Administration Services Limited and Invesco Global Investment Funds Limited; Director, Invesco Distributors, Inc.; Head of EMEA, Invesco Ltd.; President, Invesco Actively Managed Exchange-Traded Commodity Fund Trust, Invesco Actively Managed Exchange-Traded Fund Trust, Invesco Exchange-Traded Fund Trust, Invesco Exchange-Traded Fund Trust II and Invesco India Exchange-Traded Fund Trust; Managing Director and Principal Executive Officer, Invesco Capital Management LLC | | | N/A | | | N/A |
T-5 Invesco European Growth Fund
Trustees and Officers–(continued)
| | | | | | | | | | |
Name, Year of Birth and
Position(s)
Held with the Trust | | Trustee
and/or
Officer
Since | | Principal Occupation(s)
During Past 5 Years | | Number of
Funds in
Fund Complex
Overseen by
Trustee | | | Other
Directorship(s)
Held by Trustee
During Past
5 Years |
Other Officers–(continued) | | | | | | |
John M. Zerr – 1962 Senior Vice President | | 2006 | | Chief Operating Officer of the Americas; Senior Vice President, Invesco Advisers, Inc. (formerly known as Invesco Institutional (N.A.), Inc.) (registered investment adviser); Senior Vice President, Invesco Distributors, Inc. (formerly known as Invesco AIM Distributors, Inc.); Director and Vice President, Invesco Investment Services, Inc. (formerly known as Invesco AIM Investment Services, Inc.) Senior Vice President, The Invesco Funds; Managing Director, Invesco Capital Management LLC; Director, Invesco Investment Advisers LLC (formerly known as Van Kampen Asset Management); Senior Vice President, Invesco Capital Markets, Inc. (formerly known as Van Kampen Funds Inc.); Manager, Invesco Indexing LLC; Manager, Invesco Specialized Products, LLC; Director and Senior Vice President, Invesco Insurance Agency, Inc.; Member, Invesco Canada Funds Advisory Board; Director, President and Chief Executive Officer, Invesco Corporate Class Inc. (corporate mutual fund company); and Director, Chairman, President and Chief Executive Officer, Invesco Canada Ltd. (formerly known as Invesco Trimark Ltd./Invesco Trimark Ltèe) (registered investment adviser and registered transfer agent) Formerly: Director and Senior Vice President, Invesco Management Group, Inc. (formerly known as Invesco AIM Management Group, Inc.); Secretary and General Counsel, Invesco Management Group, Inc. (formerly known as Invesco AIM Management Group, Inc.); Secretary, Invesco Investment Services, Inc. (formerly known as Invesco AIM Investment Services, Inc.); Chief Legal Officer and Secretary, The Invesco Funds; Secretary and General Counsel, Invesco Investment Advisers LLC (formerly known as Van Kampen Asset Management); Secretary and General Counsel, Invesco Capital Markets, Inc. (formerly known as Van Kampen Funds Inc.); Chief Legal Officer, Invesco Exchange-Traded Fund Trust, Invesco Exchange-Traded Fund Trust II, Invesco India Exchange-Traded Fund Trust, Invesco Actively Managed Exchange-Traded Fund Trust, Invesco Actively Managed Exchange-Traded Commodity Fund Trust and Invesco Exchange-Traded Self-Indexed Fund Trust; Secretary, Invesco Indexing LLC; Director, Secretary, General Counsel and Senior Vice President, Van Kampen Exchange Corp.; Director, Vice President and Secretary, IVZ Distributors, Inc. (formerly known as INVESCO Distributors, Inc.); Director and Vice President, INVESCO Funds Group, Inc.; Director and Vice President, Van Kampen Advisors Inc.; Director, Vice President, Secretary and General Counsel, Van Kampen Investor Services Inc.; Director and Secretary, Invesco Distributors, Inc. (formerly known as Invesco AIM Distributors, Inc.); Director, Senior Vice President, General Counsel and Secretary, Invesco AIM Advisers, Inc. and Van Kampen Investments Inc.; Director, Vice President and Secretary, Fund Management Company; Director, Senior Vice President, Secretary, General Counsel and Vice President, Invesco AIM Capital Management, Inc.; Chief Operating Officer and General Counsel, Liberty Ridge Capital, Inc. (an investment adviser) | | | N/A | | | N/A |
Gregory G. McGreevey – 1962 Senior Vice President | | 2012 | | Senior Managing Director, Invesco Ltd.; Director, Chairman, President, and Chief Executive Officer, Invesco Advisers, Inc. (formerly known as Invesco Institutional (N.A.), Inc.) (registered investment adviser); Director, Invesco Mortgage Capital, Inc. and Invesco Senior Secured Management, Inc.; and Senior Vice President, The Invesco Funds; and President, SNW Asset Management Corporation Formerly: Senior Vice President, Invesco Management Group, Inc. and Invesco Advisers, Inc.; Assistant Vice President, The Invesco Funds | | | N/A | | | N/A |
Kelli Gallegos – 1970 Vice President, Principal Financial Officer and Assistant Treasurer | | 2008 | | Principal Financial and Accounting Officer - Investments Pool, Invesco Specialized Products, LLC; Vice President, Principal Financial Officer and Assistant Treasurer, The Invesco Funds; Principal Financial and Accounting Officer - Pooled Investments, Invesco Capital Management LLC; Vice President and Treasurer, Invesco Exchange-Traded Fund Trust, Invesco Exchange-Traded Fund Trust II, Invesco India Exchange-Traded Fund Trust, Invesco Actively Managed Exchange-Traded Fund Trust, Invesco Actively Managed Exchange-Traded Commodity Fund Trust and Invesco Exchange-Traded Self-Indexed Fund Trust Formerly: Assistant Treasurer, Invesco Specialized Products, LLC; Assistant Treasurer, Invesco Exchange-Traded Fund Trust, Invesco Exchange-Traded Fund Trust II, Invesco India Exchange-Traded Fund Trust, Invesco Actively Managed Exchange-Traded Fund Trust, Invesco Actively Managed Exchange-Traded Commodity Fund Trust and Invesco Exchange-Traded Self-Indexed Fund Trust; Assistant Treasurer, Invesco Capital Management LLC; Assistant Vice President, The Invesco Funds | | | N/A | | | N/A |
T-6 Invesco European Growth Fund
Trustees and Officers–(continued)
| | | | | | | | |
Name, Year of Birth and
Position(s) Held with the Trust | | Trustee
and/or
Officer
Since | | Principal Occupation(s)
During Past 5 Years | | Number of
Funds in
Fund Complex
Overseen by
Trustee | | Other
Directorship(s)
Held by Trustee
During Past
5 Years |
Other Officers–(continued) | | | | |
Crissie M. Wisdom – 1969 Anti-Money Laundering Compliance Officer | | 2013 | | Anti-Money Laundering Compliance Officer, Invesco Advisers, Inc. (formerly known as Invesco Institutional (N.A.), Inc.) (registered investment adviser), Invesco Capital Markets, Inc. (formerly known as Van Kampen Funds Inc.), Invesco Distributors, Inc., Invesco Investment Services, Inc., The Invesco Funds, and Invesco Exchange-Traded Fund Trust, Invesco Exchange-Traded Fund Trust II, Invesco India Exchange-Traded Fund Trust, Invesco Actively Managed Exchange-Traded Fund Trust, Invesco Actively Managed Exchange-Traded Commodity Fund Trust and Invesco Exchange-Traded Self-Indexed Fund Trust; Anti-Money Laundering Compliance Officer and Bank Secrecy Act Officer, INVESCO National Trust Company and Invesco Trust Company; and Fraud Prevention Manager and Controls and Risk Analysis Manager for Invesco Investment Services, Inc. Formerly: Anti-Money Laundering Compliance Officer, Van Kampen Exchange Corp. and Invesco Management Group, Inc. | | N/A | | N/A |
| Robert R. Leveille – 1969 Chief Compliance Officer | | 2016 | | Chief Compliance Officer, Invesco Advisers, Inc. (registered investment adviser); and Chief Compliance Officer, The Invesco Funds Formerly: Chief Compliance Officer, Putnam Investments and the Putnam Funds | | N/A | | N/A |
The Statement of Additional Information of the Trust includes additional information about the Fund’s Trustees and is available upon request, without charge, by calling 1.800.959.4246. Please refer to the Fund’s Statement of Additional Information for information on the Fund’ssub-advisers.
Office of the Fund
11 Greenway Plaza, Suite 1000
Houston, TX 77046-1173
Counsel to the Fund
Stradley Ronon Stevens & Young, LLP
2005 Market Street, Suite 2600
Philadelphia, PA 19103-7018
Investment Adviser
Invesco Advisers, Inc.
1555 Peachtree Street, N.E.
Atlanta, GA 30309
Counsel to the Independent Trustees
Goodwin Procter LLP
901 New York Avenue, N.W.
Washington, D.C. 20001
Distributor
Invesco Distributors, Inc.
11 Greenway Plaza, Suite 1000
Houston, TX 77046-1173
Transfer Agent
Invesco Investment Services, Inc.
11 Greenway Plaza, Suite 1000
Houston, TX 77046-1173
Auditors
PricewaterhouseCoopers LLP
1000 Louisiana Street, Suite 5800
Houston, TX 77002-5678
Custodian
State Street Bank and Trust Company
225 Franklin Street
Boston, MA 02110-2801
T-7 Invesco European Growth Fund
(This page intentionally left blank)

Go paperless with eDelivery
Visit invesco.com/edelivery to enjoy the convenience and security of anytime electronic access to your investment documents.
With eDelivery, you can elect to have any or all of the following materials delivered straight to your inbox to download, save and print from your own computer:
∎ Fund reports and prospectuses
∎ Quarterly statements
∎ Daily confirmations
∎ Tax forms
Invesco mailing information
Send general correspondence to Invesco Investment Services, Inc., P.O. Box 219078, Kansas City, MO 64121-9078.
Important notice regarding delivery of security holder documents
To reduce Fund expenses, only one copy of most shareholder documents may be mailed to shareholders with multiple accounts at the same address (Householding). Mailing of your shareholder documents may be householded indefinitely unless you instruct us otherwise. If you do not want the mailing of these documents to be combined with those for other members of your household, please contact Invesco Investment Services, Inc. at 800 959 4246 or contact your financial institution. We will begin sending you individual copies for each account within 30 days after receiving your request.
Fund holdings and proxy voting information
The Fund provides a complete list of its holdings four times in each fiscal year, at the quarter-ends. For the second and fourth quarters, the list appears in the Fund’s semiannual and annual reports to shareholders. For the first and third quarters, the Fund files the lists with the Securities and Exchange Commission (SEC) as an exhibit to its reports on FormN-PORT. The most recent list of portfolio holdings is available at invesco.com/completeqtrholdings. Shareholders can also look up the Fund’s FormN-PORT filings on the SEC website, sec.gov. The SEC file numbers for the Fund are shown below.
A description of the policies and procedures that the Fund uses to determine how to vote proxies relating to portfolio securities is available without charge, upon request, from our Client Services department at 800 959 4246, or at invesco.com/proxyguidelines. The information is also available on the SEC website, sec.gov.
| | |
Information regarding how the Fund voted proxies related to its portfolio securities during the most recent12-month period ended June 30 is available at invesco.com/proxysearch. This information is also available on the SEC website, sec.gov. Invesco Advisers, Inc. is an investment adviser; it provides investment advisory services to individual and institutional clients and does not sell securities. Invesco Distributors, Inc. is the US distributor for Invesco Ltd.’s retail mutual funds, exchange-traded funds and institutional money market funds. Both are wholly owned, indirect subsidiaries of Invesco Ltd. | |  |
| | | | |
| SEC file numbers:811-06463 and 033-44611 | | Invesco Distributors, Inc. | | EGR-AR-1 |
| | | | |
| | |
 | | Annual Report to Shareholders | | October 31, 2019 |
| | Invesco Global Growth Fund |
| | Nasdaq: | | |
| | A: AGGAX ∎ C: AGGCX ∎ Y: AGGYX ∎ R5: GGAIX ∎ R6: AGGFX |

Letters to Shareholders
| | | | |

Andrew Schlossberg | | | | Dear Shareholders: This annual report includes information about your Fund, including performance data and a complete list of its investments as of the close of the reporting period. Inside is a discussion of how your Fund was managed and the factors that affected its performance during the reporting period. Despite marked market volatility along the way, most global equity markets produced solid gains for the reporting period. As the reporting period unfolded in the final months of 2018, global equities were reeling from a sharpsell-off. The catalyst for thesell-off was a combination of ongoing trade concerns between the US and China, fears of a global economic slowdown and lower oil prices from a supply glut. Gains posted earlier in 2018 for global equities were erased, while US Treasury bonds, along with government and municipal bonds, rallied as investors fled to “safe haven” assets. |
At the start of 2019, global equity markets rebounded strongly buoyed by more policy from central banks and optimism about a potentialUS-China trade deal. In May,US-China trade concerns and slowing global growth led to a global equitysell-off and rally in US Treasuries. Despite the Maysell-off, domestic equity markets rallied in June in anticipation of a US Federal Reserve (the Fed) interest rate cut and closed the second quarter with modest gains. ContinuedUS-China trade worries and signs of slowing global economic growth left global equity markets largely flat for the third quarter. As the reporting period came to a close in October 2019, a raft of upbeat positive corporate earnings results and a US interest rate cut buoyed domestic equity results with some domestic indices recording record highs.
The Fed, in fact, both raised and lowered the federal funds rate during the reporting period. Given signs of a strong economy, the Fed raised rates in December 2018. In 2019, however, the Fed altered its outlook on further rate hikes leaving rates unchanged for the first half of the year. In July, the Fed lowered interest rates for the first time in 11 years. It again lowered rates in September and once again in October. As the year continues to unfold, we’ll see how the interplay of interest rates, economic data, geopolitics and a host of other factors affect US and overseas equity and fixed income markets.
Investor uncertainty and market volatility, such as we witnessed during the reporting period, are unfortunate facts of life when it comes to investing. That’s why Invesco encourages investors to work with a professional financial adviser who can stress the importance of starting to save and invest early and the importance of adhering to a disciplined investment plan. A financial adviser who knows your unique financial situation, investment goals and risk tolerance can be an invaluable partner as you seek to achieve your financial goals. He or she can offer a long-term perspective when markets are volatile and time-tested advice and guidance when your financial situation or investment goals change.
Visit our website for more information on your investments
Our website, invesco.com/us, offers a wide range of market insights and investment perspectives. On the website, you’ll find detailed information about our funds, including performance, holdings and portfolio manager commentaries. You can access information about your account by completing a simple, secure online registration. To do so, select “Log In” on the right side of the homepage, and then select “Register for Individual Account Access.”
In addition to the resources accessible on our website and through our mobile app, you can obtain timely updates to help you stay informed about the markets and the economy by connecting with Invesco on Twitter, LinkedIn or Facebook. You can access our blog at blog.invesco.us.com. Our goal is to provide you the information you want, when and where you want it.
Finally, I’m pleased to share with you Invesco’s commitment to both the Principles for Responsible Investment and to considering environmental, social and governance issues in our robust investment process. I invite you to learn more at invesco.com/esg.
Have questions?
For questions about your account, contact an Invesco client services representative at 800 959 4246.
All of us at Invesco look forward to serving your investment management needs. Thank you for investing with us.
Sincerely,

Andrew Schlossberg
Head of the Americas,
Senior Managing Director, Invesco Ltd.
2 Invesco Global Growth Fund
| | | | |

Bruce Crockett | | | | Dear Shareholders: Among the many important lessons I’ve learned in more than 40 years in a variety of business endeavors is the value of a trusted advocate. As independent chair of the Invesco Funds Board, I can assure you that the members of the Board are strong advocates for the interests of investors in Invesco’s mutual funds. We work hard to represent your interests through oversight of the quality of the investment management services your funds receive and other matters important to your investment, including but not limited to: ∎ Ensuring that Invesco offers a diverse lineup of mutual funds that your financial adviser can use to strive to meet your financial needs as your investment goals change over time. ∎ Monitoring how the portfolio management teams of the Invesco funds are performing in light of changing economic and market conditions. |
| ∎ | | Assessing each portfolio management team’s investment performance within the context of the investment strategy described in the fund’s prospectus. |
| ∎ | | Monitoring for potential conflicts of interests that may impact the nature of the services that your funds receive. |
We believe one of the most important services we provide our fund shareholders is the annual review of the funds’ advisory andsub-advisory contracts with Invesco Advisers and its affiliates. This review is required by the Investment Company Act of 1940 and focuses on the nature and quality of the services Invesco provides as the adviser to the Invesco funds and the reasonableness of the fees that it charges for those services. Each year, we spend months carefully reviewing information received from Invesco and a variety of independent sources, such as performance and fee data prepared by Lipper, Inc. (a subsidiary of Broadridge Financial Solutions, Inc.), an independent, third-party firm widely recognized as a leader in its field. We also meet with our independent legal counsel and other independent advisers to review and help us assess the information that we have received. Our goal is to assure that you receive quality investment management services for a reasonable fee.
I trust the measures outlined above provide assurance that you have a worthy advocate when it comes to choosing the Invesco Funds.
On behalf of the Board, we look forward to continuing to represent your interests and serving your needs.
Sincerely,

Bruce L. Crockett
Independent Chair
Invesco Funds Board of Trustees
3 Invesco Global Growth Fund
Management’s Discussion of Fund Performance
| | | | |
| | |
| Performance summary | | | |
For the fiscal year ended October 31, 2019, Class A shares of Invesco Global Growth Fund (the Fund), at net asset value (NAV), underperformed the MSCI All Country World Growth Index, the Fund’s style-specific benchmark. Your Fund’s long-term performance appears later in this report. | |
Fund vs. Indexes | | | | |
Total returns, October 31, 2018 to October 31, 2019, at net asset value (NAV). Performance shown does not include applicable contingent deferred sales charges (CDSC) orfront-end sales charges, which would have reduced performance. | |
| |
Class A Shares | | | 15.46 | % |
Class C Shares | | | 14.61 | |
Class Y Shares | | | 15.74 | |
Class R5 Shares | | | 15.84 | |
Class R6 Shares | | | 15.88 | |
MSCI All Country World IndexÚ (Broad Market Index) | | | 12.59 | |
MSCI All Country World Growth IndexÚ (Style-Specific Index) | | | 17.02 | |
Lipper GlobalMulti-Cap Growth Funds Index∎ (Peer Group Index) | | | 14.38 | |
| |
Source(s):ÚRIMES Technologies Corp.;∎Lipper Inc. | | | | |
Market conditions and your Fund
The fiscal year began with global equity markets, particularly the US, declining sharply at the end of 2018 amid rising interest rates, a flattening US Treasury yield curve, signaling a possible recession, and concerns that higher inflation could result in a more restrictive monetary policy. Investors also had concerns over the Brexit negotiations, ongoing trade tensions between the US and China, declining oil prices and fears of slowing economic growth, particularly in the eurozone.
After a relatively calm start at the beginning of 2019, global equity markets faced greater volatility in the second quarter, hampered by ongoing US and China trade issues, potential for new tariffs and slowing global economic growth. Global equity markets, particularly China, declined sharply in May 2019, ending a four-month rally. Trade and tariff issues, which were not limited to the US and China, clouded the outlook for many
global economies. Disagreement within the UK about its withdrawal from the European Union increased uncertainty for the UK and eurozone economies. Following better performance in June, most global equity markets managed modest positive returns for the second quarter of 2019, with developed markets generally outperforming emerging markets. China was an exception, declining during the second quarter.
Weakening global economic data and the ongoing US and China trade conflict contributed to higher market volatility in the third quarter of 2019. During the third quarter, data released showed slowing manufacturing activity and declining business investment, which was evidence that trade tensions were stifling economic growth across both developed and emerging markets. Global recession concerns caused a sharp equitysell-off in August 2019 as investors crowded into asset classes perceived as safe havens, including US Treasuries and gold. In September 2019, both the US Federal Reserve
and European Central Bank cut interest rates, providing a measure of support for risk assets. Growing optimism about a potential trade deal between the US and China also boosted equities in September. However, except for the US and Japan, performance in most regions declined during the third quarter. Uncertainty about the UK’s withdrawl from the European Union continued to weigh on UK and European equities, while political and trade issues affected areas of Latin America and Asia.
Global equity markets gained in October 2019 amid several positive catalysts, including a US interest rate cut, optimism surrounding US and China trade negotiations, and a raft of upbeat corporate results. The UK equity market provided a flat return during October and while domestic politics continued to dominate the region, European markets made modest gains. October was also a positive month for emerging equity
markets with all regions recording gains. Despite increased market volatility, global equity indexes, in both developed and emerging markets, ended the fiscal year in positive territory.
Regardless of the macroeconomic environment, we remain focused on our bottom-up investment approach of identifying attractive companies that fit our earnings, quality and valuation (EQV) process.
On a geographic basis, security selection as well as an overweight to China was a leading contributor to relative performance. Fund holdings in Japan and Germany outperformed those of the MSCI All Country World Growth Index and were also significant contributors to the Fund’s relative performance during the fiscal year. The Fund’s holdings in the UK and Canada, however, underperformed those of the style-specific benchmark and were among the most significant detractors from relative results. In a
| | | | |
| Portfolio Composition | |
By sector | | | % of total net assets | |
| | | | |
| |
Information Technology | | | 24.63 | % |
Consumer Discretionary | | | 18.30 | |
Financials | | | 13.06 | |
Consumer Staples | | | 12.39 | |
Industrials | | | 9.68 | |
Health Care | | | 9.34 | |
Communication Services | | | 8.13 | |
Energy | | | 2.17 | |
Money Market Funds Plus Other Assets Less Liabilities | | | 2.30 | |
| | |
| Top 10 Equity Holdings* |
| % of total net assets |
| | | | |
| |
1. Apple,Inc. | | | 2.77 | % |
2. PhilipMorris International, Inc. | | | 2.57 | |
3. TaiwanSemiconductor ManufacturingCo., Ltd. | | | 2.14 | |
4. BookingHoldings, Inc. | | | 1.98 | |
5. SAPS.E. | | | 1.92 | |
6. ClinigenGroup PLC | | | 1.89 | |
7. FinecoBankBanca Fineco S.p.A. | | | 1.88 | |
8. HoyaCorp. | | | 1.80 | |
9. CGI,Inc. | | | 1.80 | |
10. Alphabet,Inc., Class C | | | 1.80 | |
| | |
Total Net Assets | | $447.0 million |
Total Number of Holdings* | | 76 |
The Fund’s holdings are subject to change, and there is no assurance that the Fund will continue to hold any particular security.
*Excluding money market fund holdings, if any.
Data presented here are as of October 31, 2019.
4 Invesco Global Growth Fund
rising market environment, the Fund’s cash position also detracted from relative performance.
On a sector basis, strong security selection and an overweight to the consumer staples sector contributed to Fund performance relative to the style-specific benchmark. Several alcoholic beverage manufacturers including China-basedKweichow Moutaiand Denmark-based Carlsbergwere leading contributors inthe sector. Stock selection in the consumer discretionary and industrials sectors also positively contributed to relative results. Conversely, the Fund’s holdings in the energy and information technology (IT) sectors, however, underperformed those of the style-specific benchmark and were the most significant detractors from the Fund’s relative performance for the fiscal year. In the energy sector, particular weakness was seen in the Fund’s Canadian energy names includingPrairieSky Royalty, a key detractor fromrelative return. In the IT sector, lack of exposure to strong-performingUS-based companies such as MasterCard and Visa, as well as underweight exposure to Microsoft, detracted from relative Fund performance relative to the style specific index. We sold our holdings in PrairieSky Royalty during the fiscal year.
China-based alcoholic beverage manufacturerWuliangye Yibin was one of the Fund’s leading individual contributors for the fiscal year. The company has benefited from the consumption upgrade cycle in China with the popularity of its premium Baiju brands. In contrast,PeytoExploration & Developmentwas theFund’s largest individual detractor for the fiscal year. Given this, we sold our holdings in the company. Peyto Exploration and other Canadian natural gas equities faced headwinds during the fiscal year driven by low commodity prices.
During the fiscal year, we continued to look for opportunities to improve the growth potential and quality of the Fund’s portfolio by adding companies based on our EQV outlook for each company. We took advantage of market volatility during the fiscal year to put some cash to work at more attractive valuation levels. We added several new holdings, includingUK-based pharmaceutical services companyClinigen Group, France-based consumer products certification and testing companyBureau Veritas, andBrazil-based beverage companyAmbev. Deteriorating fundamentalsand/or valuations led to the sale of several holdings during the fiscal year, includingUS-based BB&T, Japan-based
Asahi Group Holdings, and Ireland-
basedIngersoll Rand.
As always, regardless of the macro-economic environment, we remain focused on abottom-up investment approach of identifying attractive companies that fit ourEQV-focused investment process. We continue to look for high-quality companies that exhibit the following characteristics: strong organic growth; high returns on capital; pricing power; strong balance sheets; cash generation; and reasonable valuations. In addition, we continue to favor companies that are able to consistently generate cash during weak economic environments. Our balancedEQV-focused approach aligns with our goal of delivering attractive returns over the long term.
We thank you for your continued investment in Invesco Global Growth Fund.
Portfolio managers:
Ryan Amerman
Matthew Dennis - Lead
Mark Jason
Mark McDonnell
The views and opinions expressed in management’s discussion of Fund performance are those of Invesco Advisers, Inc. These views and opinions are subject to change at any time based on factors such as market and economic conditions. These views and opinions may not be relied upon as investment advice or recommendations, or as an offer for a particular security. The information is not a complete analysis of every aspect of any market, country, industry, security or the Fund. Statements of fact are from sources considered reliable, but Invesco Advisers, Inc. makes no representation or warranty as to their completeness or accuracy. Although historical performance is no guarantee of future results, these insights may help you understand our investment management philosophy.
See important Fund and, if applicable, index disclosures later in this report.
5 Invesco Global Growth Fund
Your Fund’s Long-Term Performance
Results of a $10,000 Investment – Oldest Share Class(es)
Fund and index data from 10/31/09
| 1 | Source: RIMES Technologies Corp. |
Past performance cannot guarantee comparable future results.
The data shown in the chart include reinvested distributions, applicable sales charges and Fund expenses including
management fees. Index results include reinvested dividends, but they do not reflect sales charges. Performance of the peer group, if applicable, reflects fund expenses and management fees; performance
of a market index does not. Performance shown in the chart does not reflect deduction of taxes a shareholder would pay on Fund distributions or sale of Fund shares.
6 Invesco Global Growth Fund
| | | | | | |
| | | Average Annual Total Returns | |
| | As of 10/31/19, including maximum applicable sales charges | | | | |
| | | Class A Shares | |
| | | Inception (9/15/94) | | | 6.39 | % |
| | | 10 Years | | | 7.63 | |
| | | 5 Years | | | 3.85 | |
| | | 1 Year | | | 9.12 | |
| |
| | | Class C Shares | |
| | | Inception (8/4/97) | | | 4.45 | % |
| | | 10 Years | | | 7.44 | |
| | | 5 Years | | | 4.25 | |
| | | 1 Year | | | 13.61 | |
| |
| | | Class Y Shares | |
| | | Inception (10/3/08) | | | 8.09 | % |
| | | 10 Years | | | 8.51 | |
| | | 5 Years | | | 5.30 | |
| | | 1 Year | | | 15.74 | |
| |
| | | Class R5 Shares | |
| | | Inception (9/28/07) | | | 4.52 | % |
| | | 10 Years | | | 8.69 | |
| | | 5 Years | | | 5.41 | |
| | | 1 Year | | | 15.84 | |
| |
| | | Class R6 Shares | |
| | | 10 Years | | | 8.54 | % |
| | | 5 Years | | | 5.42 | |
| | | 1 Year | | | 15.88 | |
Class R6 shares incepted on September 24, 2012. Performance shown prior to that date is that of Class A shares and includes the12b-1 fees applicable to Class A shares.
The performance data quoted represent past performance and cannot guarantee comparable future results; current performance may be lower or higher. Please visit invesco.com/ performance for the most recentmonth-end performance. Performance figures reflect reinvested distributions, changes in net asset value and the effect of the maximum sales charge unless otherwise stated. Performance figures do not reflect deduction of taxes a shareholder would pay on Fund distributions or sale of Fund shares. Investment return and principal value will fluctuate so that you may have a gain or loss when you sell shares.
The net annual Fund operating expense ratio set forth in the most recent Fund prospectus as of the date of this report for Class A, Class C, Class Y, Class R5 and Class R6 shares was 1.23%, 1.98%, 0.98%, 0.89% and 0.89%, respectively.1 The total annual Fund operating expense ratio set forth in the most recent Fund prospectus as
| | | | | | |
| | | Average Annual Total Returns | |
| | As of 9/30/19, the most recent calendar quarter end, including maximum applicable sales charges | |
| | | Class A Shares | |
| | | Inception (9/15/94) | | | 6.34 | % |
| | | 10 Years | | | 7.34 | |
| | | 5 Years | | | 3.69 | |
| | | 1 Year | | | -0.54 | |
| |
| | | Class C Shares | |
| | | Inception (8/4/97) | | | 4.39 | % |
| | | 10 Years | | | 7.15 | |
| | | 5 Years | | | 4.09 | |
| | | 1 Year | | | 3.49 | |
| |
| | | Class Y Shares | |
| | | Inception (10/3/08) | | | 7.99 | % |
| | | 10 Years | | | 8.22 | |
| | | 5 Years | | | 5.13 | |
| | | 1 Year | | | 5.51 | |
| |
| | | Class R5 Shares | |
| | | Inception (9/28/07) | | | 4.41 | % |
| | | 10 Years | | | 8.41 | |
| | | 5 Years | | | 5.25 | |
| | | 1 Year | | | 5.64 | |
| |
| | | Class R6 Shares | |
| | | 10 Years | | | 8.25 | % |
| | | 5 Years | | | 5.25 | |
| | | 1 Year | | | 5.64 | |
of the date of this report for Class A, Class C, Class Y, Class R5 and Class R6 shares was 1.33%, 2.08%, 1.08%, 0.89% and 0.89%, respectively. The expense ratios presented above may vary from the expense ratios presented in other sections of this report that are based on expenses incurred during the period covered by this report.
Class A share performance reflects the maximum 5.50% sales charge, and Class C share performance reflects the applicable contingent deferred sales charge (CDSC) for the period involved. The CDSC on Class C shares is 1% for the first year after purchase. Class Y, Class R5 and Class R6 shares do not have afront-end sales charge or a CDSC; therefore, performance is at net asset value.
The performance of the Fund’s share classes will differ primarily due to different sales charge structures and class expenses.
Fund performance reflects any applicable fee waivers and/or expense reimbursements. Had the adviser not waived fees and/or reimbursed expenses currently or in the past, returns
would have been lower. See current prospectus for more information.
| 1 | Total annual Fund operating expenses after any contractual fee waivers and/or expense reimbursements by the adviser in effect through at least February 28, 2021. See current prospectus for more information. |
7 Invesco Global Growth Fund
Invesco Global Growth Fund’s investment objective is long-term growth of capital.
| ∎ | | Unless otherwise stated, information presented in this report is as of October 31, 2019, and is based on total net assets. |
| ∎ | | Unless otherwise noted, all data provided by Invesco. |
| ∎ | | To access your Fund’s reports/prospectus, visit invesco.com/fundreports. |
About share classes
| ∎ | | Class Y sharesare available to onlycertain investors. Please see the prospectus for more information. |
| ∎ | | Class R5 sharesand Class R6 sharesare available for use by retirement plans that meet certain standards and for institutional investors. Class R6 shares are also available through intermediaries that have established an agreement with Invesco Distributors, Inc. to make such shares available for use in retail omnibus accounts. Please see the prospectus for more information. |
Principal risks of investing in the Fund
| ∎ | | Depositary receipts risk. Investing indepositary receipts involves the same risks as direct investments in foreign securities. In addition, the underlying issuers of certain depositary receipts are under no obligation to distribute shareholder communications or pass through any voting rights with respect to the deposited securities to the holders of such receipts. The Fund may therefore receive less timely information or have less control than if it invested directly in the foreign issuer. |
| ∎ | | Derivatives risk. The value of a derivative instrument depends largely on (and is derived from) the value of an underlying security, currency, commodity, interest rate, index or other asset (each referred to as an underlying asset). In addition to risks relating to the underlying assets, the use of derivatives may include other, possibly greater, risks, including counterparty, leverage and liquidity risks. Counterparty risk is the risk that the counterparty to the derivative contract will default on its obligation to pay the Fund the amount owed or otherwise perform under the derivative contract. Derivatives create leverage risk because they do not require payment up front equal to the economic exposure created by holding a |
| | | position in the derivative. As a result, an adverse change in the value of the underlying asset could result in the Fund sustaining a loss that is substantially greater than the amount invested in the derivative or the anticipated value of the underlying asset, which may make the Fund’s returns more volatile and increase the risk of loss. Derivative instruments may also be less liquid than more traditional investments and the Fund may be unable to sell or close out its derivative positions at a desirable time or price. This risk may be more acute under adverse market conditions, during which the Fund may be most in need of liquidating its derivative positions. Derivatives may also be harder to value, less tax efficient and subject to changing government regulation that could impact the Fund’s ability to use certain derivatives or their cost. Derivatives strategies may not always be successful. For example, derivatives used for hedging or to gain or limit exposure to a particular market segment may not provide the expected benefits, particularly during adverse market conditions. |
| ∎ | | Emerging markets securities risk.Emerging markets (also referred to as developing markets) are generally subject to greater market volatility, political, social and economic instability, uncertain trading markets and more governmental limitations on foreign investment than more developed markets. In addition, companies operating in emerging markets may be subject to lower trading volume and greater price fluctuations than companies in more developed markets. Securities law and the enforcement of systems of taxation in many emerging market countries may change quickly and unpredictably. The Fund’s investments in ChinaA-shares are subject to trading restrictions, quota limitations and clearing and settlement risks. In addition, investments in emerging markets securities may be |
| | | subject to additional transaction costs, delays in settlement procedures, and lack of timely information. |
| ∎ | | Foreign securities risk. The Fund’sforeign investments may be adversely affected by political and social instability, changes in economic or taxation policies, difficulty in enforcing obligations, decreased liquidity or increased volatility. Foreign investments also involve the risk of the possible seizure, nationalization or expropriation of the issuer or foreign deposits (in which the Fund could lose its entire investments in a certain market) and the possible adoption of foreign governmental restrictions such as exchange controls. Unless the Fund has hedged its foreign securities risk, foreign securities risk also involves the risk of negative foreign currency rate fluctuations, which may cause the value of securities denominated in such foreign currency (or other instruments through which the Fund has exposure to foreign currencies) to decline in value. Currency exchange rates may fluctuate significantly over short periods of time. Currency hedging strategies, if used, are not always successful. |
| ∎ | | Geographic focus risk.The Fund mayfrom time to time invest a substantial amount of its assets in securities of issuers located in a single country or a limited number of countries. Adverse economic, political or social conditions in those countries may therefore have a significant negative impact on the Fund’s investment performance. |
| ∎ | | Growth investing risk. Growth stockstend to be more expensive relative to the issuing company’s earnings or assets compared with other types of stock. As a result, they tend to be more sensitive to changes in, or investors’ expectations of, the issuing company’s earnings and can be more volatile. |
| ∎ | | Investing in the European Union risk.Investments in certain countries in the European Union are susceptible to high economic risks associated with |
|
| This report must be accompanied or preceded by a currently effective Fund prospectus, which contains more complete information, including sales charges and expenses. Investors should read it carefully before investing. |
|
NOT FDIC INSURED | MAY LOSE VALUE | NO BANK GUARANTEE |
8 Invesco Global Growth Fund
| | high levels of debt, such as invest-ments in sovereign debt of Greece, Italy and Spain. Efforts of the member states to further unify their economic and monetary policies may increase the potential for the downward movement of one member state’s market to cause a similar effect on other member states’ markets. Separately, the European Union faces issues involving its membership, structure, procedures and policies. The exit of one or more member states from the European Union, such as the United Kingdom (UK) which has announced its intention to exit, would place its currency and banking system in jeopardy. The exit by the UK or other member states will likely result in increased volatility, illiquidity and potentially lower economic growth in the affected markets, which will adversely affect the Fund’s investments. |
| ∎ | | Management risk. The Fund is activelymanaged and depends heavily on the Adviser’s judgment about markets, interest rates or the attractiveness, relative values, liquidity, or potential appreciation of particular investments made for the Fund’s portfolio. The Fund could experience losses if these judgments prove to be incorrect. Additionally, legislative, regulatory, or tax developments may adversely affect management of the Fund and, therefore, the ability of the Fund to achieve its investment objective. |
| ∎ | | Market risk. The market values of theFund’s investments, and therefore the value of the Fund’s shares, will go up and down, sometimes rapidly or unpredictably. Market risk may affect a single issuer, industry or section of the economy, or it may affect the market as a whole. Individual stock prices tend to go up and down more dramatically than those of certain other types of investments, such as bonds. During a general downturn in the financial markets, multiple asset classes may decline in value. When markets perform well, there can be no assurance that specific investments held by the Fund will rise in value. |
| ∎ | | Mid-Capitalization companies risk.Mid-capitalization companies tend to be more vulnerable to changing market conditions and may have more limited product lines and markets, less experienced management and fewer financial resources than larger companies. These companies’ securities may be more volatile and less liquid than those of more established companies, |
| | | and their returns may vary, some-times significantly, from the overall securities market. |
| ∎ | | Preferred securities risk. Preferredsecurities are subject to issuer-specific and market risks applicable generally to equity securities. Preferred securities also may be subordinated to bonds or other debt instruments, subjecting them to a greater risk ofnon-payment, may be less liquid than many other securities, such as common stocks, and generally offer no voting rights with respect to the issuer. |
| ∎ | | Sector focus risk. The Fund may fromtime to time invest a significant amount of its assets (i.e. over 25%) in one market sector or group of related industries. In this event, the Fund’s performance will depend to a greater extent on the overall condition of the sector or group of industries and there is increased risk that the Fund will lose significant value if conditions adversely affect that sector or group of industries. |
About indexes used in this report
| ∎ | | TheMSCI All Country World Index is an unmanaged index considered representative of large- andmid-cap stocks across developed and emerging markets. The index is computed using the net return, which withholds applicable taxes fornon-resident investors. |
| ∎ | | TheMSCI All Country World GrowthIndexis an unmanaged index considered representative of large- andmid-cap growth stocks of developed and emerging markets. The index is computed using the net return, which withholds applicable taxes fornon-resident investors. |
| ∎ | | TheLipper GlobalMulti-Cap GrowthFunds Indexis an unmanaged indexconsidered representative of globalmulti-cap growth funds tracked by Lipper. |
| ∎ | | The Fund is not managed to track the performance of any particular index, including the index(es) described here, and consequently, the performance of the Fund may deviate significantly from the performance of the index(es). |
| ∎ | | A direct investment cannot be made in an index. Unless otherwise indicated, index results include reinvested dividends, and they do not reflect sales charges. Performance of the peer group, if applicable, reflects fund expenses; performance of a market index does not. |
Other information
| ∎ | | The returns shown in management’s discussion of Fund performance are based on net asset values (NAVs) calculated for shareholder transactions. Generally accepted accounting principles require adjustments to be made to the net assets of the Fund at period end for financial reporting purposes, and as such, the NAVs for shareholder transactions and the returns based on those NAVs may differ from the NAVs and returns reported in the Financial Highlights. |
| ∎ | | Industry classifications used in this report are generally according to the Global Industry Classification Standard, which was developed by and is the exclusive property and a service mark of MSCI Inc. and Standard & Poor’s. |
9 Invesco Global Growth Fund
Schedule of Investments
October 31, 2019
| | | | | | | | |
| | | Shares | | | Value | |
Common Stocks & Other Equity Interests–97.70% | |
| | |
Australia–0.80% | | | | | | | | |
| | |
CSL Ltd. | | | 20,359 | | | $ | 3,583,408 | |
| | |
Brazil–3.38% | | | | | | | | |
| | |
Ambev S.A., ADR | | | 1,370,353 | | | | 5,906,221 | |
B3 S.A.–Brasil, Bolsa, Balcao | | | 399,531 | | | | 4,819,676 | |
Banco Bradesco S.A., ADR | | | 498,717 | | | | 4,368,761 | |
| | | | | | | | 15,094,658 | |
| | |
Canada–3.56% | | | | | | | | |
| | |
CGI, Inc.(a) | | | 103,579 | | | | 8,051,339 | |
Open Text Corp. | | | 151,077 | | | | 6,104,561 | |
Tourmaline Oil Corp. | | | 205,120 | | | | 1,759,818 | |
| | | | | | | | 15,915,718 | |
| | |
China–5.93% | | | | | | | | |
| | |
Alibaba Group Holding Ltd., ADR(a) | | | 42,443 | | | | 7,498,405 | |
Kweichow Moutai Co., Ltd., A Shares | | | 18,090 | | | | 3,030,034 | |
New Oriental Education & Technology Group, Inc., ADR(a) | | | 38,207 | | | | 4,663,546 | |
Wuliangye Yibin Co., Ltd., A Shares | | | 232,284 | | | | 4,342,638 | |
Yum China Holdings, Inc. | | | 164,623 | | | | 6,996,478 | |
| | | | | | | | 26,531,101 | |
| | |
Denmark–1.06% | | | | | | | | |
| | |
Carlsberg A/S, Class B | | | 33,711 | | | | 4,742,324 | |
| | |
France–5.84% | | | | | | | | |
| | |
Bureau Veritas S.A. | | | 307,770 | | | | 7,860,896 | |
Criteo S.A., ADR(a) | | | 216,422 | | | | 3,614,247 | |
Pernod Ricard S.A. | | | 25,554 | | | | 4,718,316 | |
Schneider Electric S.E. | | | 52,361 | | | | 4,877,998 | |
Vivendi S.A. | | | 180,045 | | | | 5,020,211 | |
| | | | | | | | 26,091,668 | |
| | |
Germany–3.64% | | | | | | | | |
| | |
Deutsche Boerse AG | | | 49,618 | | | | 7,687,008 | |
SAP S.E. | | | 64,667 | | | | 8,565,815 | |
| | | | | | | | 16,252,823 | |
| | |
Hong Kong–1.01% | | | | | | | | |
| | |
AIA Group Ltd. | | | 454,600 | | | | 4,510,749 | |
| | |
Indonesia–1.07% | | | | | | | | |
| | |
PT Bank Mandiri (Persero) Tbk | | | 9,632,900 | | | | 4,807,803 | |
| | |
Ireland–1.43% | | | | | | | | |
| | |
Flutter Entertainment PLC | | | 62,050 | | | | 6,397,492 | |
| | |
Israel–1.07% | | | | | | | | |
| | |
Check Point Software Technologies Ltd.(a) | | | 42,412 | | | | 4,767,533 | |
| | | | | | | | |
| | | Shares | | | Value | |
Italy–1.88% | | | | | | | | |
| | |
FinecoBank Banca Fineco S.p.A. | | | 744,919 | | | $ | 8,400,239 | |
| | |
Japan–5.19% | | | | | | | | |
| | |
Hoya Corp. | | | 90,800 | | | | 8,056,448 | |
Keyence Corp. | | | 9,400 | | | | 5,935,230 | |
Koito Manufacturing Co. Ltd. | | | 62,100 | | | | 3,239,034 | |
SMC Corp. | | | 13,800 | | | | 5,957,460 | |
| | | | | | | | 23,188,172 | |
| | |
Mexico–1.03% | | | | | | | | |
| | |
Fomento Economico Mexicano, S.A.B. de C.V., ADR | | | 51,886 | | | | 4,618,892 | |
| | |
Spain–1.49% | | | | | | | | |
| | |
Amadeus IT Group S.A. | | | 89,965 | | | | 6,659,966 | |
| | |
Switzerland–1.60% | | | | | | | | |
| | |
Alcon, Inc.(a) | | | 72,352 | | | | 4,274,561 | |
Cie Financiere Richemont S.A. | | | 36,861 | | | | 2,901,956 | |
| | | | | | | | 7,176,517 | |
| | |
Taiwan–2.14% | | | | | | | | |
| | |
Taiwan Semiconductor Manufacturing Co., Ltd. | | | 986,428 | | | | 9,583,424 | |
| | |
United Kingdom–7.25% | | | | | | | | |
| | |
British American Tobacco PLC | | | 123,275 | | | | 4,308,663 | |
Clinigen Group PLC | | | 783,415 | | | | 8,438,763 | |
Compass Group PLC | | | 169,384 | | | | 4,514,991 | |
Reckitt Benckiser Group PLC | | | 65,038 | | | | 5,028,123 | |
RELX PLC | | | 230,779 | | | | 5,556,270 | |
TechnipFMC PLC | | | 228,873 | | | | 4,545,034 | |
| | | | | | | | 32,391,844 | |
| | |
United States–48.33% | | | | | | | | |
| | |
Activision Blizzard, Inc. | | | 102,007 | | | | 5,715,452 | |
Advance Auto Parts, Inc. | | | 45,615 | | | | 7,411,525 | |
Alphabet, Inc., Class A(a) | | | 6,121 | | | | 7,705,115 | |
Alphabet, Inc., Class C(a) | | | 6,373 | | | | 8,030,681 | |
Aon PLC | | | 26,527 | | | | 5,123,955 | |
Apple, Inc. | | | 49,823 | | | | 12,393,970 | |
Aptiv PLC | | | 70,262 | | | | 6,291,962 | |
Assurant, Inc. | | | 35,470 | | | | 4,471,703 | |
Avanos Medical, Inc.(a) | | | 111,820 | | | | 4,924,553 | |
Baxter International, Inc. | | | 78,367 | | | | 6,010,749 | |
Booking Holdings, Inc.(a) | | | 4,321 | | | | 8,852,735 | |
Broadcom, Inc. | | | 22,852 | | | | 6,692,208 | |
Cisco Systems, Inc. | | | 69,810 | | | | 3,316,673 | |
Comcast Corp., Class A | | | 139,892 | | | | 6,269,959 | |
Dollar General Corp. | | | 28,435 | | | | 4,559,268 | |
Dril-Quip, Inc.(a) | | | 82,430 | | | | 3,381,279 | |
Expedia Group, Inc. | | | 36,319 | | | | 4,963,355 | |
See accompanying Notes to Financial Statements which are an integral part of the financial statements.
10 Invesco Global Growth Fund
| | | | | | | | |
| | | Shares | | | Value | |
United States–(continued) | |
| | |
Fidelity National Information Services, Inc. | | | 25,645 | | | $ | 3,378,985 | |
Gilead Sciences, Inc. | | | 48,419 | | | | 3,084,775 | |
Horizon Therapeutics PLC(a) | | | 116,420 | | | | 3,365,702 | |
IHS Markit Ltd.(a) | | | 112,067 | | | | 7,846,931 | |
Intercontinental Exchange, Inc. | | | 54,286 | | | | 5,120,256 | |
JPMorgan Chase & Co. | | | 55,853 | | | | 6,977,157 | |
Kansas City Southern | | | 56,028 | | | | 7,887,622 | |
KAR Auction Services, Inc. | | | 132,754 | | | | 3,300,264 | |
Las Vegas Sands Corp. | | | 124,768 | | | | 7,715,653 | |
Microsoft Corp. | | | 47,660 | | | | 6,833,014 | |
Mondelez International, Inc., Class A | | | 137,172 | | | | 7,194,671 | |
NCR Corp.(a) | | | 240,163 | | | | 7,015,161 | |
PayPal Holdings, Inc.(a) | | | 66,775 | | | | 6,951,278 | |
Philip Morris International, Inc. | | | 141,239 | | | | 11,502,504 | |
PTC, Inc.(a) | | | 51,578 | | | | 3,451,084 | |
RealPage, Inc.(a) | | | 81,807 | | | | 4,953,414 | |
Sabre Corp. | | | 231,600 | | | | 5,437,968 | |
| | | | | | | | |
| | | Shares | | | Value | |
United States–(continued) | |
Tradeweb Markets, Inc., Class A | | | 50,000 | | | $ | 2,087,500 | |
Wyndham Hotels & Resorts, Inc. | | | 107,537 | | | | 5,803,772 | |
| | | | | | | | 216,022,853 | |
Total Common Stocks & Other Equity Interests
(Cost $296,237,601) | | | | 436,737,184 | |
| |
Money Market Funds–2.16% | | | | | |
| | |
Invesco Government & Agency Portfolio, Institutional Class, 1.71%(b) | | | 3,370,670 | | | | 3,370,670 | |
Invesco Liquid Assets Portfolio, Institutional Class, 1.90%(b) | | | 2,408,237 | | | | 2,409,201 | |
Invesco Treasury Portfolio, Institutional Class, 1.66%(b) | | | 3,852,194 | | | | 3,852,194 | |
Total Money Market Funds
(Cost $9,631,507) | | | | 9,632,065 | |
TOTAL INVESTMENTS IN SECURITIES – 99.86% | |
(Cost $305,869,108) | | | | 446,369,249 | |
OTHER ASSETS LESS LIABILITIES–0.14% | | | | 633,267 | |
NET ASSETS–100.00% | | | | | | $ | 447,002,516 | |
Investment Abbreviations:
| | | | |
ADR | | – | | American Depositary Receipt |
Notes to Schedule of Investments:
| (a) | Non-income producing security. |
| (b) | The money market fund and the Fund are affiliated by having the same investment adviser. The rate shown is the7-day SEC standardized yield as of October 31, 2019. |
See accompanying Notes to Financial Statements which are an integral part of the financial statements.
11 Invesco Global Growth Fund
Statement of Assets and Liabilities
October 31, 2019
| | | | |
Assets: | | | | |
| |
Investments in securities, at value
(Cost $296,237,601) | | $ | 436,737,184 | |
Investments in affiliated money market funds, at value
(Cost $9,631,507) | | | 9,632,065 | |
Foreign currencies, at value
(Cost $827,256) | | | 837,076 | |
Receivable for: | | | | |
Dividends | | | 535,825 | |
Investments sold | | | 225,335 | |
Fund shares sold | | | 62,025 | |
Fund expenses absorbed | | | 9,942 | |
Investment for trustee deferred compensation and retirement plans | | | 137,610 | |
Other assets | | | 27,442 | |
Total assets | | | 448,204,504 | |
| |
Liabilities: | | | | |
| |
Payable for: | | | | |
Investments purchased | | | 268,641 | |
Fund shares reacquired | | | 479,137 | |
Accrued fees to affiliates | | | 209,992 | |
Accrued trustees’ and officers’ fees and benefits | | | 1,655 | |
Accrued other operating expenses | | | 94,359 | |
Trustee deferred compensation and retirement plans | | | 148,204 | |
Total liabilities | | | 1,201,988 | |
Net assets applicable to shares outstanding | | $ | 447,002,516 | |
| |
Net assets consist of: | | | | |
| |
Shares of beneficial interest | | $ | 269,460,406 | |
Distributable earnings | | | 177,542,110 | |
| | | $ | 447,002,516 | |
| | | | |
Net Assets: | | | | |
| |
Class A | | $ | 296,262,071 | |
Class C | | $ | 6,963,335 | |
Class Y | | $ | 13,871,023 | |
Class R5 | | $ | 12,301 | |
Class R6 | | $ | 129,893,786 | |
|
Shares outstanding, no par value, with an unlimited number of shares authorized: | |
| |
Class A | | | 9,204,581 | |
Class C | | | 238,709 | |
Class Y | | | 429,714 | |
Class R5 | | | 384 | |
Class R6 | | | 4,055,992 | |
Class A: | | | | |
Net asset value per share | | $ | 32.19 | |
Maximum offering price per share
(Net asset value of $32.19 ÷ 94.50%) | | $ | 34.06 | |
Class C: | | | | |
Net asset value and offering price per share | | $ | 29.17 | |
Class Y: | | | | |
Net asset value and offering price per share | | $ | 32.28 | |
Class R5: | | | | |
Net asset value and offering price per share | | $ | 32.03 | |
Class R6: | | | | |
Net asset value and offering price per share | | $ | 32.03 | |
See accompanying Notes to Financial Statements which are an integral part of the financial statements.
12 Invesco Global Growth Fund
Statement of Operations
For the year ended October 31, 2019
| | | | |
Investment income: | | | | |
| |
Dividends (net of foreign withholding taxes of $574,640) | | $ | 9,335,692 | |
| |
Dividends from affiliated money market funds | | | 375,052 | |
| |
Total investment income | | | 9,710,744 | |
| |
| |
Expenses: | | | | |
| |
Advisory fees | | | 3,955,822 | |
| |
Administrative services fees | | | 82,517 | |
| |
Custodian fees | | | 44,533 | |
| |
Distribution fees: | | | | |
Class A | | | 719,825 | |
| |
Class C | | | 105,961 | |
| |
Transfer agent fees – A, C and Y | | | 642,621 | |
| |
Trustees’ and officers’ fees and benefits | | | 26,212 | |
| |
Registration and filing fees | | | 77,672 | |
| |
Reports to shareholders | | | 48,986 | |
| |
Professional services fees | | | 76,457 | |
| |
Other | | | 16,694 | |
| |
Total expenses | | | 5,797,300 | |
| |
Less: Fees waived, expenses reimbursed and/or expense offset arrangement(s) | | | (332,635 | ) |
| |
Net expenses | | | 5,464,665 | |
| |
Net investment income | | | 4,246,079 | |
| |
| |
Realized and unrealized gain from: | | | | |
Net realized gain from: | | | | |
Investment securities | | | 33,844,448 | |
| |
Foreign currencies | | | 124,014 | |
| |
| | | 33,968,462 | |
| |
Change in net unrealized appreciation of: | | | | |
Investment securities | | | 39,865,586 | |
| |
Foreign currencies | | | 46,617 | |
| |
| | | 39,912,203 | |
| |
Net realized and unrealized gain | | | 73,880,665 | |
| |
Net increase in net assets resulting from operations | | $ | 78,126,744 | |
| |
See accompanying Notes to Financial Statements which are an integral part of the financial statements.
13 Invesco Global Growth Fund
Statement of Changes in Net Assets
For the years ended October 31, 2019 and 2018
| | | | | | | | |
| | | 2019 | | | 2018 | |
| |
Operations: | | | | | | | | |
| | |
Net investment income | | $ | 4,246,079 | | | $ | 5,787,014 | |
| |
Net realized gain | | | 33,968,462 | | | | 25,853,820 | |
| |
Change in net unrealized appreciation (depreciation) | | | 39,912,203 | | | | (69,466,695 | ) |
| |
Net increase (decrease) in net assets resulting from operations | | | 78,126,744 | | | | (37,825,861 | ) |
| |
| | |
Distributions to shareholders from distributable earnings: | | | | | | | | |
| | |
Class A | | | (13,675,234 | ) | | | (7,829,144 | ) |
| |
Class B | | | – | | | | (20,305 | ) |
| |
| | |
Class C | | | (1,048,995 | ) | | | (473,422 | ) |
| |
Class Y | | | (777,259 | ) | | | (556,509 | ) |
| |
| | |
Class R5 | | | (798 | ) | | | (343 | ) |
| |
Class R6 | | | (14,651,856 | ) | | | (8,498,439 | ) |
| |
Total distributions from distributable earnings | | | (30,154,142 | ) | | | (17,378,162 | ) |
| |
| | |
Share transactions–net: | | | | | | | | |
| | |
Class A | | | (5,625,219 | ) | | | (27,056,591 | ) |
| |
Class B | | | – | | | | (1,193,523 | ) |
| |
Class C | | | (14,154,827 | ) | | | (1,864,316 | ) |
| |
Class Y | | | (2,294,305 | ) | | | (4,591,450 | ) |
| |
Class R6 | | | (155,348,376 | ) | | | (16,151,393 | ) |
| |
Net increase (decrease) in net assets resulting from share transactions | | | (177,422,727 | ) | | | (50,857,273 | ) |
| |
Net increase (decrease) in net assets | | | (129,450,125 | ) | | | (106,061,296 | ) |
| |
| | |
Net assets: | | | | | | | | |
| | |
Beginning of year | | | 576,452,641 | | | | 682,513,937 | |
| |
End of year | | $ | 447,002,516 | | | $ | 576,452,641 | |
| |
See accompanying Notes to Financial Statements which are an integral part of the financial statements.
14 Invesco Global Growth Fund
Financial Highlights
The following schedule presents financial highlights for a share of the Fund outstanding throughout the periods indicated.
| | | | | | | | | | | | | | | | | | | | | | | | | | | | | | | | | | | | | | | | | | | | | | | | | | | | | | | | | | | | | | | | | | | | | | |
| | | Net asset
value,
beginning
of period | | Net
investment
income (loss)(a) | | Net gains
(losses) on securities
(both
realized and
unrealized) | | Total from
investment
operations | | Dividends
from net
investment
income | | Distributions
from net
realized
gains | | Total
distributions | | Net asset
value, end
of period | | Total
return (b) | | Net assets,
end of period
(000’s omitted) | | Ratio of
expenses
to average
net assets
with fee waivers
and/or
expenses
absorbed | | Ratio of
expenses
to average net
assets without
fee waivers
and/or expenses
absorbed | | Ratio of net
investment
income
(loss)
to average
net assets | | Portfolio
turnover (c) |
Class A | | | | | | | | | | | | | | | | | | | | | | | | | | | | | | | | | | | | | | | | | | | | | | | | | | | | | | | | | | | | | | | | | | | | | | |
Year ended 10/31/19 | | | $ | 29.42 | | | | $ | 0.22 | | | | $ | 4.04 | | | | $ | 4.26 | | | | $ | (0.13 | ) | | | $ | (1.36 | ) | | | $ | (1.49 | ) | | | $ | 32.19 | | | | | 15.46 | % | | | $ | 296,262 | | | | | 1.22 | %(d) | | | | 1.32 | %(d) | | | | 0.72 | %(d) | | | | 32 | % |
Year ended 10/31/18 | | | | 32.21 | | | | | 0.24 | | | | | (2.25 | ) | | | | (2.01 | ) | | | | (0.31 | ) | | | | (0.47 | ) | | | | (0.78 | ) | | | | 29.42 | | | | | (6.41 | ) | | | | 273,874 | | | | | 1.22 | | | | | 1.32 | | | | | 0.74 | | | | | 32 | |
Year ended 10/31/17 | | | | 28.00 | | | | | 0.21 | | | | | 4.22 | | | | | 4.43 | | | | | (0.09 | ) | | | | (0.13 | ) | | | | (0.22 | ) | | | | 32.21 | | | | | 15.96 | | | | | 327,317 | | | | | 1.23 | | | | | 1.36 | | | | | 0.72 | | | | | 22 | |
Year ended 10/31/16 | | | | 28.63 | | | | | 0.19 | | | | | 0.32 | | | | | 0.51 | | | | | (0.15 | ) | | | | (0.99 | ) | | | | (1.14 | ) | | | | 28.00 | | | | | 2.00 | | | | | 311,412 | | | | | 1.29 | | | | | 1.38 | | | | | 0.70 | | | | | 19 | |
Year ended 10/31/15 | | | | 31.21 | | | | | 0.16 | | | | | (0.21 | ) | | | | (0.05 | ) | | | | (0.18 | ) | | | | (2.35 | ) | | | | (2.53 | ) | | | | 28.63 | | | | | 0.02 | | | | | 308,940 | | | | | 1.40 | | | | | 1.42 | | | | | 0.55 | | | | | 24 | |
Class C | | | | | | | | | | | | | | | | | | | | | | | | | | | | | | | | | | | | | | | | | | | | | | | | | | | | | | | | | | | | | | | | | | | | | | |
Year ended 10/31/19 | | | | 26.86 | | | | | (0.01 | ) | | | | 3.68 | | | | | 3.67 | | | | | – | | | | | (1.36 | ) | | | | (1.36 | ) | | | | 29.17 | | | | | 14.61 | | | | | 6,963 | | | | | 1.97 | (d) | | | | 2.07 | (d) | | | | (0.03 | )(d) | | | | 32 | |
Year ended 10/31/18 | | | | 29.47 | | | | | (0.00 | ) | | | | (2.05 | ) | | | | (2.05 | ) | | | | (0.09 | ) | | | | (0.47 | ) | | | | (0.56 | ) | | | | 26.86 | | | | | (7.10 | ) | | | | 21,058 | | | | | 1.97 | | | | | 2.07 | | | | | (0.01 | ) | | | | 32 | |
Year ended 10/31/17 | | | | 25.74 | | | | | (0.01 | ) | | | | 3.87 | | | | | 3.86 | | | | | – | | | | | (0.13 | ) | | | | (0.13 | ) | | | | 29.47 | | | | | 15.07 | | | | | 24,995 | | | | | 1.98 | | | | | 2.11 | | | | | (0.03 | ) | | | | 22 | |
Year ended 10/31/16 | | | | 26.45 | | | | | (0.01 | ) | | | | 0.29 | | | | | 0.28 | | | | | – | | | | | (0.99 | ) | | | | (0.99 | ) | | | | 25.74 | | | | | 1.24 | | | | | 23,755 | | | | | 2.04 | | | | | 2.13 | | | | | (0.05 | ) | | | | 19 | |
Year ended 10/31/15 | | | | 29.05 | | | | | (0.06 | ) | | | | (0.19 | ) | | | | (0.25 | ) | | | | – | | | | | (2.35 | ) | | | | (2.35 | ) | | | | 26.45 | | | | | (0.74 | ) | | | | 25,530 | | | | | 2.15 | | | | | 2.17 | | | | | (0.20 | ) | | | | 24 | |
Class Y | | | | | | | | | | | | | | | | | | | | | | | | | | | | | | | | | | | | | | | | | | | | | | | | | | | | | | | | | | | | | | | | | | | | | | |
Year ended 10/31/19 | | | | 29.52 | | | | | 0.29 | | | | | 4.05 | | | | | 4.34 | | | | | (0.22 | ) | | | | (1.36 | ) | | | | (1.58 | ) | | | | 32.28 | | | | | 15.74 | | | | | 13,871 | | | | | 0.97 | (d) | | | | 1.07 | (d) | | | | 0.97 | (d) | | | | 32 | |
Year ended 10/31/18 | | | | 32.31 | | | | | 0.32 | | | | | (2.25 | ) | | | | (1.93 | ) | | | | (0.39 | ) | | | | (0.47 | ) | | | | (0.86 | ) | | | | 29.52 | | | | | (6.16 | ) | | | | 14,935 | | | | | 0.97 | | | | | 1.07 | | | | | 0.99 | | | | | 32 | |
Year ended 10/31/17 | | | | 28.09 | | | | | 0.29 | | | | | 4.23 | | | | | 4.52 | | | | | (0.17 | ) | | | | (0.13 | ) | | | | (0.30 | ) | | | | 32.31 | | | | | 16.24 | | | | | 20,983 | | | | | 0.98 | | | | | 1.11 | | | | | 0.97 | | | | | 22 | |
Year ended 10/31/16 | | | | 28.72 | | | | | 0.26 | | | | | 0.32 | | | | | 0.58 | | | | | (0.22 | ) | | | | (0.99 | ) | | | | (1.21 | ) | | | | 28.09 | | | | | 2.27 | | | | | 12,562 | | | | | 1.04 | | | | | 1.13 | | | | | 0.95 | | | | | 19 | |
Year ended 10/31/15 | | | | 31.30 | | | | | 0.23 | | | | | (0.21 | ) | | | | 0.02 | | | | | (0.25 | ) | | | | (2.35 | ) | | | | (2.60 | ) | | | | 28.72 | | | | | 0.26 | | | | | 7,724 | | | | | 1.15 | | | | | 1.17 | | | | | (0.80 | ) | | | | 24 | |
Class R5 | | | | | | | | | | | | | | | | | | | | | | | | | | | | | | | | | | | | | | | | | | | | | | | | | | | | | | | | | | | | | | | | | | | | | | |
Year ended 10/31/19 | | | | 29.31 | | | | | 0.32 | | | | | 4.01 | | | | | 4.33 | | | | | (0.25 | ) | | | | (1.36 | ) | | | | (1.61 | ) | | | | 32.03 | | | | | 15.84 | | | | | 12 | | | | | 0.86 | (d) | | | | 0.86 | (d) | | | | 1.08 | (d) | | | | 32 | |
Year ended 10/31/18 | | | | 32.09 | | | | | 0.34 | | | | | (2.23 | ) | | | | (1.89 | ) | | | | (0.42 | ) | | | | (0.47 | ) | | | | (0.89 | ) | | | | 29.31 | | | | | (6.08 | ) | | | | 11 | | | | | 0.88 | | | | | 0.88 | | | | | 1.08 | | | | | 32 | |
Year ended 10/31/17 | | | | 27.91 | | | | | 0.32 | | | | | 4.20 | | | | | 4.52 | | | | | (0.21 | ) | | | | (0.13 | ) | | | | (0.34 | ) | | | | 32.09 | | | | | 16.37 | | | | | 12 | | | | | 0.88 | | | | | 0.88 | | | | | 1.07 | | | | | 22 | |
Year ended 10/31/16 | | | | 28.57 | | | | | 0.30 | | | | | 0.30 | | | | | 0.60 | | | | | (0.27 | ) | | | | (0.99 | ) | | | | (1.26 | ) | | | | 27.91 | | | | | 2.35 | | | | | 11 | | | | | 0.89 | | | | | 0.90 | | | | | 1.10 | | | | | 19 | |
Year ended 10/31/15 | | | | 31.17 | | | | | 0.30 | | | | | (0.24 | ) | | | | 0.06 | | | | | (0.31 | ) | | | | (2.35 | ) | | | | (2.66 | ) | | | | 28.57 | | | | | 0.42 | | | | | 11 | | | | | 0.99 | | | | | 0.99 | | | | | 0.96 | | | | | 24 | |
Class R6 | | | | | | | | | | | | | | | | | | | | | | | | | | | | | | | | | | | | | | | | | | | | | | | | | | | | | | | | | | | | | | | | | | | | | | |
Year ended 10/31/19 | | | | 29.30 | | | | | 0.32 | | | | | 4.02 | | | | | 4.34 | | | | | (0.25 | ) | | | | (1.36 | ) | | | | (1.61 | ) | | | | 32.03 | | | | | 15.88 | | | | | 129,894 | | | | | 0.86 | (d) | | | | 0.86 | (d) | | | | 1.08 | (d) | | | | 32 | |
Year ended 10/31/18 | | | | 32.08 | | | | | 0.34 | | | | | (2.23 | ) | | | | (1.89 | ) | | | | (0.42 | ) | | | | (0.47 | ) | | | | (0.89 | ) | | | | 29.30 | | | | | (6.08 | ) | | | | 266,574 | | | | | 0.88 | | | | | 0.88 | | | | | 1.08 | | | | | 32 | |
Year ended 10/31/17 | | | | 27.91 | | | | | 0.32 | | | | | 4.19 | | | | | 4.51 | | | | | (0.21 | ) | | | | (0.13 | ) | | | | (0.34 | ) | | | | 32.08 | | | | | 16.33 | | | | | 308,082 | | | | | 0.88 | | | | | 0.88 | | | | | 1.07 | | | | | 22 | |
Year ended 10/31/16 | | | | 28.56 | | | | | 0.31 | | | | | 0.30 | | | | | 0.61 | | | | | (0.27 | ) | | | | (0.99 | ) | | | | (1.26 | ) | | | | 27.91 | | | | | 2.39 | | | | | 320,339 | | | | | 0.89 | | | | | 0.90 | | | | | 1.10 | | | | | 19 | |
Year ended 10/31/15 | | | | 31.16 | | | | | 0.28 | | | | | (0.22 | ) | | | | 0.06 | | | | | (0.31 | ) | | | | (2.35 | ) | | | | (2.66 | ) | | | | 28.56 | | | | | 0.42 | | | | | 1,274 | | | | | 0.99 | | | | | 0.99 | | | | | 0.96 | | | | | 24 | |
| (a) | Calculated using average shares outstanding. |
| (b) | Includes adjustments in accordance with accounting principles generally accepted in the United States of America and as such, the net asset value for financial reporting purposes and the returns based upon those net asset values may differ from the net asset value and returns for shareholder transactions. Does not include sales charges and is not annualized for periods less than one year, if applicable. |
| (c) | Portfolio turnover is calculated at the fund level and is not annualized for periods less than one year, if applicable. |
| (d) | Ratios are based on average daily net assets (000’s omitted) of $287,930, $10,596, $14,112, $12 and $188,117 for Class A, Class C, Class Y, Class R5 and Class R6 shares, respectively. |
See accompanying Notes to Financial Statements which are an integral part of the financial statements.
15 Invesco Global Growth Fund
Notes to Financial Statements
October 31, 2019
NOTE 1–Significant Accounting Policies
Invesco Global Growth Fund (the “Fund”) is a series portfolio of AIM International Mutual Funds (Invesco International Mutual Funds) (the “Trust”). The Trust is a Delaware statutory trust registered under the Investment Company Act of 1940, as amended (the “1940 Act”), as anopen-end series management investment company authorized to issue an unlimited number of shares of beneficial interest. Information presented in these financial statements pertains only to the Fund. Matters affecting the Fund or each class will be voted on exclusively by the shareholders of the Fund or each class.
The Fund’s investment objective is long-term growth of capital.
The Fund currently consists of five different classes of shares: Class A, Class C, Class Y, Class R5 and Class R6. Class Y shares are available only to certain investors. Class A shares are sold with afront-end sales charge unless certain waiver criteria are met. Under certain circumstances, load waived shares may be subject to contingent deferred sales charges (“CDSC”). Class C shares are sold with a CDSC. Class Y, Class R5 and Class R6 shares are sold at net asset value. Class C shares held for ten years after purchase are eligible for automatic conversion into Class A shares of the same Fund (the Conversion Feature). The automatic conversion pursuant to the Conversion Feature will generally occur at the end of the month following the tenth anniversary after a purchase of Class C shares.
The Fund is an investment company and accordingly follows the investment company accounting and reporting guidance in accordance with Financial Accounting Standards Board Accounting Standards Codification Topic 946,Financial Services – Investment Companies.
The following is a summary of the significant accounting policies followed by the Fund in the preparation of its financial statements.
| A. | Security Valuations– Securities, including restricted securities, are valued according to the following policy. |
A security listed or traded on an exchange (except convertible securities) is valued at its last sales price or official closing price as of the close of the customary trading session on the exchange where the security is principally traded, or lacking any sales or official closing price on a particular day, the security may be valued at the closing bid price on that day. Securities traded in theover-the-counter market are valued based on prices furnished by independent pricing services or market makers. When such securities are valued by an independent pricing service they may be considered fair valued. Futures contracts are valued at the final settlement price set by an exchange on which they are principally traded. Listed options are valued at the mean between the last bid and asked prices from the exchange on which they are principally traded. Options not listed on an exchange are valued by an independent source at the mean between the last bid and asked prices. For purposes of determining net asset value (“NAV”) per share, futures and option contracts generally are valued 15 minutes after the close of the customary trading session of the New York Stock Exchange (“NYSE”).
Investments inopen-end andclosed-end registered investment companies that do not trade on an exchange are valued at theend-of-day net asset value per share. Investments inopen-end andclosed-end registered investment companies that trade on an exchange are valued at the last sales price or official closing price as of the close of the customary trading session on the exchange where the security is principally traded.
Debt obligations (including convertible securities) and unlisted equities are fair valued using an evaluated quote provided by an independent pricing service. Evaluated quotes provided by the pricing service may be determined without exclusive reliance on quoted prices, and may reflect appropriate factors such asinstitution-size trading in similar groups of securities, developments related to specific securities, dividend rate (for unlisted equities), yield (for debt obligations), quality, type of issue, coupon rate (for debt obligations), maturity (for debt obligations), individual trading characteristics and other market data. Pricing services generally value debt obligations assuming orderly transactions of institutional round lot size, but a fund may hold or transact in the same securities in smaller, odd lot sizes. Odd lots often trade at lower prices than institutional round lots. Debt obligations are subject to interest rate and credit risks. In addition, all debt obligations involve some risk of default with respect to interest and/or principal payments.
Foreign securities’ (including foreign exchange contracts) prices are converted into U.S. dollar amounts using the applicable exchange rates as of the close of the NYSE. If market quotations are available and reliable for foreign exchange-traded equity securities, the securities will be valued at the market quotations. Because trading hours for certain foreign securities end before the close of the NYSE, closing market quotations may become unreliable. If between the time trading ends on a particular security and the close of the customary trading session on the NYSE, events occur that the investment adviser determines are significant and make the closing price unreliable, the Fund may fair value the security. If the event is likely to have affected the closing price of the security, the security will be valued at fair value in good faith using procedures approved by the Board of Trustees. Adjustments to closing prices to reflect fair value may also be based on a screening process of an independent pricing service to indicate the degree of certainty, based on historical data, that the closing price in the principal market where a foreign security trades is not the current value as of the close of the NYSE. Foreign securities’ prices meeting the approved degree of certainty that the price is not reflective of current value will be priced at the indication of fair value from the independent pricing service. Multiple factors may be considered by the independent pricing service in determining adjustments to reflect fair value and may include information relating to sector indices, American Depositary Receipts and domestic and foreign index futures. Foreign securities may have additional risks including exchange rate changes, potential for sharply devalued currencies and high inflation, political and economic upheaval, the relative lack of issuer information, relatively low market liquidity and the potential lack of strict financial and accounting controls and standards.
Securities for which market prices are not provided by any of the above methods may be valued based upon quotes furnished by independent sources. The last bid price may be used to value equity securities. The mean between the last bid and asked prices is used to value debt obligations, including corporate loans.
Securities for which market quotations are not readily available or became unreliable are valued at fair value as determined in good faith by or under the supervision of the Trust’s officers following procedures approved by the Board of Trustees. Issuer specific events, market trends, bid/asked quotes of brokers and information providers and other market data may be reviewed in the course of making a good faith determination of a security’s fair value.
The Fund may invest in securities that are subject to interest rate risk, meaning the risk that the prices will generally fall as interest rates rise and, conversely, the prices will generally rise as interest rates fall. Specific securities differ in their sensitivity to changes in interest rates
16 Invesco Global Growth Fund
depending on their individual characteristics. Changes in interest rates may result in increased market volatility, which may affect the value and/or liquidity of certain Fund investments.
Valuations change in response to many factors including the historical and prospective earnings of the issuer, the value of the issuer’s assets, general economic conditions, interest rates, investor perceptions and market liquidity. Because of the inherent uncertainties of valuation, the values reflected in the financial statements may materially differ from the value received upon actual sale of those investments.
| B. | Securities Transactions and Investment Income– Securities transactions are accounted for on a trade date basis. Realized gains orlosses on sales are computed on the basis of specific identification of the securities sold. Interest income (net of withholding tax, if any) is recorded on the accrual basis from settlement date. Dividend income (net of withholding tax, if any) is recorded on theex-dividend date. |
The Fund may periodically participate in litigation related to Fund investments. As such, the Fund may receive proceeds from litigation settlements. Any proceeds received are included in the Statement of Operations as realized gain (loss) for investments no longer held and as unrealized gain (loss) for investments still held.
Brokerage commissions and mark ups are considered transaction costs and are recorded as an increase to the cost basis of securities purchased and/or a reduction of proceeds on a sale of securities. Such transaction costs are included in the determination of net realized and unrealized gain (loss) from investment securities reported in the Statement of Operations and the Statement of Changes in Net Assets and the net realized and unrealized gains (losses) on securities per share in the Financial Highlights. Transaction costs are included in the calculation of the Fund’s net asset value and, accordingly, they reduce the Fund’s total returns. These transaction costs are not considered operating expenses and are not reflected in net investment income reported in the Statement of Operations and the Statement of Changes in Net Assets, or the net investment income per share and the ratios of expenses and net investment income reported in the Financial Highlights, nor are they limited by any expense limitation arrangements between the Fund and the investment adviser.
The Fund allocates income and realized and unrealized capital gains and losses to a class based on the relative net assets of each class.
| C. | Country Determination– For the purposes of making investment selection decisions and presentation in the Schedule of Investments, theinvestment adviser may determine the country in which an issuer is located and/or credit risk exposure based on various factors. These factors include the laws of the country under which the issuer is organized, where the issuer maintains a principal office, the country in which the issuer derives 50% or more of its total revenues and the country that has the primary market for the issuer’s securities, as well as other criteria. Among the other criteria that may be evaluated for making this determination are the country in which the issuer maintains 50% or more of its assets, the type of security, financial guarantees and enhancements, the nature of the collateral and the sponsor organization. Country of issuer and/or credit risk exposure has been determined to be the United States of America, unless otherwise noted. |
| D. | Distributions– Distributions from net investment income and net realized capital gain, if any, are generally declared and paid annually andrecorded on theex-dividend date. The Fund may elect to treat a portion of the proceeds from redemptions as distributions for federal income tax purposes. |
| E. | Federal Income Taxes – The Fund intends to comply with the requirements of Subchapter M of the Internal Revenue Code of 1986, asamended (the “Internal Revenue Code”), necessary to qualify as a regulated investment company and to distribute substantially all of the Fund’s taxable earnings to shareholders. As such, the Fund will not be subject to federal income taxes on otherwise taxable income (including net realized capital gain) that is distributed to shareholders. Therefore, no provision for federal income taxes is recorded in the financial statements. |
The Fund recognizes the tax benefits of uncertain tax positions only when the position is more likely than not to be sustained. Management has analyzed the Fund’s uncertain tax positions and concluded that no liability for unrecognized tax benefits should be recorded related to uncertain tax positions. Management is not aware of any tax positions for which it is reasonably possible that the total amounts of unrecognized tax benefits will change materially in the next 12 months.
The Fund files tax returns in the U.S. Federal jurisdiction and certain other jurisdictions. Generally, the Fund is subject to examinations by such taxing authorities for up to three years after the filing of the return for the tax period.
| F. | Expenses – Fees provided for under the Rule12b-1 plan of a particular class of the Fund are charged to the operations of such class. Transferagency fees and expenses and other shareholder recordkeeping fees and expenses attributable to Class R5 and Class R6 are allocated to each share class based on relative net assets.Sub-accounting fees attributable to Class R5 are charged to the operations of the class. Transfer agency fees and expenses and other shareholder recordkeeping fees and expenses relating to all other classes are allocated among those classes based on relative net assets. All other expenses are allocated among the classes based on relative net assets. |
| G. | Accounting Estimates – The preparation of financial statements in conformity with accounting principles generally accepted in theUnited States of America (“GAAP”) requires management to make estimates and assumptions that affect the reported amounts of assets and liabilities at the date of the financial statements and the reported amounts of revenues and expenses during the reporting period including estimates and assumptions related to taxation. Actual results could differ from those estimates by a significant amount. In addition, the Fund monitors for material events or transactions that may occur or become known after theperiod-end date and before the date the financial statements are released to print. |
| H. | Indemnifications– Under the Trust’s organizational documents, each Trustee, officer, employee or other agent of the Trust is indemnifiedagainst certain liabilities that may arise out of the performance of their duties to the Fund. Additionally, in the normal course of business, the Fund enters into contracts, including the Fund’s servicing agreements, that contain a variety of indemnification clauses. The Fund’s maximum exposure under these arrangements is unknown as this would involve future claims that may be made against the Fund that have not yet occurred. The risk of material loss as a result of such indemnification claims is considered remote. |
| I. | Foreign Currency Translations– Foreign currency is valued at the close of the NYSE based on quotations posted by banks and majorcurrency dealers. Portfolio securities and other assets and liabilities denominated in foreign currencies are translated into U.S. dollar amounts at the date of valuation. Purchases and sales of portfolio securities (net of foreign taxes withheld on disposition) and income items denominated in foreign currencies are translated into U.S. dollar amounts on the respective dates of such transactions. The Fund does not separately account for the portion of the results of operations resulting from changes in foreign exchange rates on investments and the fluctuations arising from changes in market prices of securities held. The combined results of changes in foreign exchange rates and the fluctuation of market prices on investments (net of estimated foreign tax withholding) are included with the net realized and unrealized gain or loss from investments in the Statement of Operations. Reported net realized foreign currency gains or losses arise from (1) sales of foreign currencies, (2) currency gains or losses realized between the trade and settlement dates on securities transactions, and (3) the difference between the amounts of dividends, |
17 Invesco Global Growth Fund
interest, and foreign withholding taxes recorded on the Fund’s books and the U.S. dollar equivalent of the amounts actually received or paid. Net unrealized foreign currency gains and losses arise from changes in the fair values of assets and liabilities, other than investments in securities at fiscal period end, resulting from changes in exchange rates.
The Fund may invest in foreign securities, which may be subject to foreign taxes on income, gains on investments or currency repatriation, a portion of which may be recoverable. Foreign taxes, if any, are recorded based on the tax regulations and rates that exist in the foreign markets in which the Fund invests and are shown in the Statement of Operations.
| J. | Forward Foreign Currency Contracts– The Fund may engage in foreign currency transactions either on a spot (i.e. for prompt deliveryand settlement) basis, or through forward foreign currency contracts, to manage or minimize currency or exchange rate risk. |
The Fund may also enter into forward foreign currency contracts for the purchase or sale of a security denominated in a foreign currency in order to “lock in” the U.S. dollar price of that security, or the Fund may also enter into forward foreign currency contracts that do not provide for physical settlement of the two currencies, but instead are settled by a single cash payment calculated as the difference between the agreed upon exchange rate and the spot rate at settlement based upon an agreed upon notional amount(non-deliverable forwards). The Fund will set aside liquid assets in an amount equal to the dailymark-to-market obligation for forward foreign currency contracts.
A forward foreign currency contract is an obligation between two parties (“Counterparties”) to purchase or sell a specific currency for an agreed-upon price at a future date. The use of forward foreign currency contracts does not eliminate fluctuations in the price of the underlying securities the Fund owns or intends to acquire but establishes a rate of exchange in advance. Fluctuations in the value of these contracts are measured by the difference in the contract date and reporting date exchange rates and are recorded as unrealized appreciation (depreciation) until the contracts are closed. When the contracts are closed, realized gains (losses) are recorded. Realized and unrealized gains (losses) on the contracts are included in the Statement of Operations. The primary risks associated with forward foreign currency contracts include failure of the Counterparty to meet the terms of the contract and the value of the foreign currency changing unfavorably. These risks may be in excess of the amounts reflected in the Statement of Assets and Liabilities.
NOTE 2–Advisory Fees and Other Fees Paid to Affiliates
The Trust has entered into a master investment advisory agreement with Invesco Advisers, Inc. (the “Adviser” or “Invesco”). Under the terms of the investment advisory agreement, the Fund accrues daily and pays monthly an advisory fee to the Adviser based on the annual rate of the Fund’s average daily net assets as follows:
| | | | | | |
| Average Daily Net Assets | | Rate | |
First $250 million | | | 0.800 | % |
Next $250 million | | | 0.780 | % |
Next $500 million | | | 0.760 | % |
Next $1.5 billion | | | 0.740 | % |
Next $2.5 billion | | | 0.720 | % |
Next $2.5 billion | | | 0.700 | % |
Next $2.5 billion | | | 0.680 | % |
Over $10 billion | | | 0.660 | % |
For the year ended October 31, 2019, the effective advisory fee rate incurred by the Fund was 0.79%.
Under the terms of a mastersub-advisory agreement between the Adviser and each of Invesco Asset Management Deutschland GmbH, Invesco Asset Management Limited, Invesco Asset Management (Japan) Limited, Invesco Hong Kong Limited, Invesco Senior Secured Management, Inc. and Invesco Canada Ltd. (collectively, the “AffiliatedSub-Advisers”) the Adviser, not the Fund, will pay 40% of the fees paid to the Adviser to any such AffiliatedSub-Adviser(s) that provide(s) discretionary investment management services to the Fund based on the percentage of assets allocated to such AffiliatedSub-Adviser(s).
The Adviser has contractually agreed, through at least February 28, 2021, to waive advisory fees and/or reimburse expenses to the extent necessary to limit total annual fund operating expenses after fee waiver and/or expense reimbursement (excluding certain items discussed below) of Class A, Class C, Class Y, Class R5 and Class R6 shares to 1.22%, 1.97%, 0.97%, 0.97% and 0.97%, respectively, of average daily net assets (the “expense limits”). In determining the Adviser’s obligation to waive advisory fees and/or reimburse expenses, the following expenses are not taken into account, and could cause the total annual fund operating expenses after fee waiver and/or expense reimbursement to exceed the numbers reflected above: (1) interest; (2) taxes; (3) dividend expense on short sales; (4) extraordinary ornon-routine items, including litigation expenses; and (5) expenses that the Fund has incurred but did not actually pay because of an expense offset arrangement. Unless Invesco continues the fee waiver agreement, it will terminate on February 28, 2021. During its term, the fee waiver agreement cannot be terminated or amended to increase the expense limits or reduce the advisory fee waiver without approval of the Board of Trustees.
Further, the Adviser has contractually agreed, through at least June 30, 2021, to waive the advisory fee payable by the Fund in an amount equal to 100% of the net advisory fees the Adviser receives from the affiliated money market funds on investments by the Fund of uninvested cash in such affiliated money market funds.
For the year ended October 31, 2019, the Adviser waived advisory fees of $19,640 and reimbursed class level expenses of $281,424, $10,357 and $13,793 of Class A, Class C and Class Y shares, respectively.
The Trust has entered into a master administrative services agreement with Invesco pursuant to which the Fund has agreed to pay Invesco for certain administrative costs incurred in providing accounting services to the Fund. For the year ended October 31, 2019, expenses incurred under the agreement are shown in the Statement of Operations asAdministrative services fees. Invesco has entered into asub-administration agreement whereby State Street Bank and Trust Company (“SSB”) serves as fund accountant and provides certain administrative services to the Fund. Pursuant to a custody agreement with the Trust on behalf of the Fund, SSB also serves as the Fund’s custodian.
The Trust has entered into a transfer agency and service agreement with Invesco Investment Services, Inc. (“IIS”) pursuant to which the Fund has agreed to pay IIS a fee for providing transfer agency and shareholder services to the Fund and reimburse IIS for certain expenses incurred by IIS in the
18 Invesco Global Growth Fund
course of providing such services. IIS may make payments to intermediaries that provide omnibus account services,sub-accounting services and/or networking services. All fees payable by IIS to intermediaries that provide omnibus account services orsub-accounting services are charged back to the Fund, subject to certain limitations approved by the Trust’s Board of Trustees. For the year ended October 31, 2019, expenses incurred under the agreement are shown in the Statement of Operations asTransfer agent fees.
The Trust has entered into master distribution agreements with Invesco Distributors, Inc. (“IDI”) to serve as the distributor for the Class A, Class C, Class Y, Class R5 and Class R6 shares of the Fund. The Trust has adopted plans pursuant to Rule12b-1 under the 1940 Act with respect to the Fund’s Class A and Class C shares (collectively, the “Plans”). The Fund, pursuant to the Plans, pays IDI compensation at the annual rate of 0.25% of the Fund’s average daily net assets of Class A shares and 1.00% of the average daily net assets of Class C shares. The fees are accrued daily and paid monthly. Of the Plan payments, up to 0.25% of the average daily net assets of each class of shares may be paid to furnish continuing personal shareholder services to customers who purchase and own shares of such classes. Any amounts not paid as a service fee under the Plans would constitute an asset-based sales charge. Rules of the Financial Industry Regulatory Authority (“FINRA”) impose a cap on the total sales charges, including asset-based sales charges, that may be paid by any class of shares of the Fund. For the year ended October 31, 2019, expenses incurred under the Plans are shown in the Statement of Operations asDistribution fees.
Front-end sales commissions and CDSC (collectively, the “sales charges”) are not recorded as expenses of the Fund.Front-end sales commissions are deducted from proceeds from the sales of Fund shares prior to investment in Class A shares of the Fund. CDSC are deducted from redemption proceeds prior to remittance to the shareholder. During the year ended October 31, 2019, IDI advised the Fund that IDI retained $20,177 infront-end sales commissions from the sale of Class A shares and $346 and $764 from Class A and Class C shares, respectively, for CDSC imposed upon redemptions by shareholders.
For the year ended October 31, 2019, the Fund incurred $2,069 in brokerage commissions with Invesco Capital Markets, Inc., an affiliate of the Adviser and IDI, for portfolio transactions executed on behalf of the Fund.
Certain officers and trustees of the Trust are officers and directors of the Adviser, IIS and/or IDI.
NOTE 3–Additional Valuation Information
GAAP defines fair value as the price that would be received to sell an asset or paid to transfer a liability in an orderly transaction between market participants at the measurement date, under current market conditions. GAAP establishes a hierarchy that prioritizes the inputs to valuation methods, giving the highest priority to readily available unadjusted quoted prices in an active market for identical assets (Level 1) and the lowest priority to significant unobservable inputs (Level 3), generally when market prices are not readily available or are unreliable. Based on the valuation inputs, the securities or other investments are tiered into one of three levels. Changes in valuation methods may result in transfers in or out of an investment’s assigned level:
| | | | |
| | | Level 1 – | | Prices are determined using quoted prices in an active market for identical assets. |
| | Level 2 – | | Prices are determined using other significant observable inputs. Observable inputs are inputs that other market participants may use in pricing a security. These may include quoted prices for similar securities, interest rates, prepayment speeds, credit risk, yield curves, loss severities, default rates, discount rates, volatilities and others. |
| | Level 3 – | | Prices are determined using significant unobservable inputs. In situations where quoted prices or observable inputs are unavailable (for example, when there is little or no market activity for an investment at the end of the period), unobservable inputs may be used. Unobservable inputs reflect the Fund’s own assumptions about the factors market participants would use in determining fair value of the securities or instruments and would be based on the best available information. |
The following is a summary of the tiered valuation input levels, as of October 31, 2019. The level assigned to the securities valuations may not be an indication of the risk or liquidity associated with investing in those securities. Because of the inherent uncertainties of valuation, the values reflected in the financial statements may materially differ from the value received upon actual sale of those investments.
19 Invesco Global Growth Fund
| | | | | | | | | | | | | | | | |
| | | Level 1 | | | Level 2 | | | Level 3 | | | Total | |
Investments in Securities | | | | | | | | | | | | | | | | |
Australia | | $ | – | | | $ | 3,583,408 | | | | $– | | | $ | 3,583,408 | |
Brazil | | | 15,094,658 | | | | – | | | | – | | | | 15,094,658 | |
Canada | | | 15,915,718 | | | | – | | | | – | | | | 15,915,718 | |
China | | | 19,158,429 | | | | 7,372,672 | | | | – | | | | 26,531,101 | |
Denmark | | | – | | | | 4,742,324 | | | | – | | | | 4,742,324 | |
France | | | 3,614,247 | | | | 22,477,421 | | | | – | | | | 26,091,668 | |
Germany | | | – | | | | 16,252,823 | | | | – | | | | 16,252,823 | |
Hong Kong | | | – | | | | 4,510,749 | | | | – | | | | 4,510,749 | |
Indonesia | | | – | | | | 4,807,803 | | | | – | | | | 4,807,803 | |
Ireland | | | – | | | | 6,397,492 | | | | – | | | | 6,397,492 | |
Israel | | | 4,767,533 | | | | – | | | | – | | | | 4,767,533 | |
Italy | | | – | | | | 8,400,239 | | | | – | | | | 8,400,239 | |
Japan | | | – | | | | 23,188,172 | | | | – | | | | 23,188,172 | |
Mexico | | | 4,618,892 | | | | – | | | | – | | | | 4,618,892 | |
Spain | | | – | | | | 6,659,966 | | | | – | | | | 6,659,966 | |
Switzerland | | | – | | | | 7,176,517 | | | | – | | | | 7,176,517 | |
Taiwan | | | – | | | | 9,583,424 | | | | – | | | | 9,583,424 | |
United Kingdom | | | – | | | | 32,391,844 | | | | – | | | | 32,391,844 | |
United States | | | 216,022,853 | | | | – | | | | – | | | | 216,022,853 | |
Money Market Funds | | | 9,632,065 | | | | – | | | | – | | | | 9,632,065 | |
Total Investments | | $ | 288,824,395 | | | $ | 157,544,854 | | | | $– | | | $ | 446,369,249 | |
NOTE 4–Expense Offset Arrangement(s)
The expense offset arrangement is comprised of transfer agency credits which result from balances in demand deposit accounts used by the transfer agent for clearing shareholder transactions. For the year ended October 31, 2019, the Fund received credits from this arrangement, which resulted in the reduction of the Fund’s total expenses of $7,421.
NOTE 5–Trustees’ and Officers’ Fees and Benefits
Trustees’ and Officers’ Fees and Benefitsinclude amounts accrued by the Fund to pay remuneration to certain Trustees and Officers of the Fund.Trustees have the option to defer compensation payable by the Fund, andTrustees’ and Officers’ Fees and Benefits also include amounts accrued by the Fund to fund such deferred compensation amounts. Those Trustees who defer compensation have the option to select various Invesco Funds in which their deferral accounts shall be deemed to be invested. Finally, certain current Trustees were eligible to participate in a retirement plan that provided for benefits to be paid upon retirement to Trustees over a period of time based on the number of years of service. The Fund may have certain former Trustees who also participate in a retirement plan and receive benefits under such plan.Trustees’ and Officers’ Fees and Benefits include amounts accrued by the Fund to fund such retirement benefits. Obligations under the deferred compensation and retirement plans represent unsecured claims against the general assets of the Fund.
NOTE 6–Cash Balances
The Fund is permitted to temporarily carry a negative or overdrawn balance in its account with State Street Bank and Trust Company, the custodian bank. Such balances, if any atperiod-end, are shown in the Statement of Assets and Liabilities under the payable captionAmount due custodian. To compensate the custodian bank for such overdrafts, the overdrawn Fund may either (1) leave funds as a compensating balance in the account so the custodian bank can be compensated by earning the additional interest; or (2) compensate by paying the custodian bank at a rate agreed upon by the custodian bank and Invesco, not to exceed the contractually agreed upon rate.
NOTE 7–Distributions to Shareholders and Tax Components of Net Assets
Tax Character of Distributions to Shareholders Paid During the Fiscal Years Ended October 31, 2019 and 2018
| | | | | | | | | | |
| | | 2019 | | 2018 |
Ordinary income | | | $ | 3,552,426 | | | | $ | 14,245,546 | |
Long-term capital gain | | | | 26,601,716 | | | | | 3,132,616 | |
Total distributions | | | $ | 30,154,142 | | | | $ | 17,378,162 | |
20 Invesco Global Growth Fund
Tax Components of Net Assets atPeriod-End:
| | | | |
| | | 2019 | |
Undistributed ordinary income | | $ | 4,710,594 | |
Undistributed long-term capital gain | | | 33,207,758 | |
Net unrealized appreciation – investments | | | 139,733,519 | |
Net unrealized appreciation – foreign currencies | | | 13,138 | |
Temporary book/tax differences | | | (122,899 | ) |
Shares of beneficial interest | | | 269,460,406 | |
Total net assets | | $ | 447,002,516 | |
The difference between book-basis andtax-basis unrealized appreciation (depreciation) is due to differences in the timing of recognition of gains and losses on investments for tax and book purposes. The Fund’s net unrealized appreciation difference is attributable primarily to wash sales.
The temporary book/tax differences are a result of timing differences between book and tax recognition of income and/or expenses. The Fund’s temporary book/tax differences are the result of the trustee deferral of compensation and retirement plan benefits.
Capital loss carryforward is calculated and reported as of a specific date. Results of transactions and other activity after that date may affect the amount of capital loss carryforward actually available for the Fund to utilize. Capital losses generated in years beginning after December 22, 2010 can be carried forward for an unlimited period, whereas previous losses expire in eight tax years. Capital losses with an expiration period may not be used to offset capital gains until all net capital losses without an expiration date have been utilized. Capital loss carryforwards with no expiration date will retain their character as either short-term or long-term capital losses instead of as short-term capital losses as under prior law. The ability to utilize capital loss carryforwards in the future may be limited under the Internal Revenue Code and related regulations based on the results of future transactions.
The Fund does not have a capital loss carryforward as of October 31, 2019.
NOTE 8–Investment Transactions
The aggregate amount of investment securities (other than short-term securities, U.S. Treasury obligations and money market funds, if any) purchased and sold by the Fund during the year ended October 31, 2019 was $155,843,979 and $350,747,539, respectively. Cost of investments, including any derivatives, on a tax basis includes the adjustments for financial reporting purposes as of the most recently completed federal income tax reportingperiod-end.
| | | | | |
| Unrealized Appreciation (Depreciation) of Investments on a Tax Basis |
Aggregate unrealized appreciation of investments | | | | $147,340,459 | |
Aggregate unrealized (depreciation) of investments | | | | (7,606,940 | ) |
Net unrealized appreciation of investments | | | | $139,733,519 | |
Cost of investments for tax purposes is $306,635,730.
NOTE 9–Reclassification of Permanent Differences
Primarily as a result of differing book/tax treatment of foreign currency transactions and passive foreign investment companies, on October 31, 2019, undistributed net investment income was increased by $93,489 and undistributed net realized gain was decreased by $93,489. This reclassification had no effect on the net assets or the distributable earnings of the Fund.
NOTE 10–Share Information
| | | | | | | | | | | | | | | | | | | | |
| | | Summary of Share Activity | |
| | | Years ended October 31, | |
| | | 2019(a) | | | | | | 2018 | |
| | | Shares | | | Amount | | | | | | Shares | | | Amount | |
Sold: | | | | | | | | | | | | | | | | | | | | |
Class A | | | 395,725 | | | $ | 11,780,680 | | | | | | | | 427,590 | | | $ | 13,677,349 | |
Class B(b) | | | – | | | | – | | | | | | | | 468 | | | | 13,844 | |
Class C | | | 55,848 | | | | 1,487,095 | | | | | | | | 81,984 | | | | 2,411,709 | |
Class Y | | | 102,233 | | | | 3,106,742 | | | | | | | | 165,104 | | | | 5,266,396 | |
Class R6 | | | 165,748 | | | | 4,883,313 | | | | | | | | 522,464 | | | | 16,319,886 | |
Issued as reinvestment of dividends: | | | | | | | | | | | | | | | | | | | | |
Class A | | | 466,247 | | | | 12,542,018 | | | | | | | | 227,141 | | | | 7,198,111 | |
Class B(b) | | | – | | | | – | | | | | | | | 685 | | | | 19,938 | |
Class C | | | 39,666 | | | | 973,019 | | | | | | | | 15,141 | | | | 441,048 | |
Class Y | | | 25,216 | | | | 678,806 | | | | | | | | 14,903 | | | | 472,879 | |
Class R6 | | | 548,984 | | | | 14,646,895 | | | | | | | | 269,994 | | | | 8,496,722 | |
21 Invesco Global Growth Fund
| | | | | | | | | | | | | | | | | | | | |
| | | Summary of Share Activity | |
| | | Years ended October 31, | |
| | | 2019(a) | | | | | | 2018 | |
| | | Shares | | | Amount | | | | | | Shares | | | Amount | |
| | | | | |
Conversion of Class B shares to Class A shares:(c) | | | | | | | | | | | | | | | | | | | | |
Class A | | | – | | | $ | – | | | | | | | | 33,087 | | | $ | 1,133,572 | |
Class B | | | – | | | | – | | | | | | | | (36,236 | ) | | | (1,133,572 | ) |
| | | | | |
Automatic conversion of Class C shares to Class A shares: | | | | | | | | | | | | | | | | | | | | |
Class A | | | 472,761 | | | | 13,379,256 | | | | | | | | – | | | | – | |
Class C | | | (518,953 | ) | | | (13,379,256 | ) | | | | | | | – | | | | – | |
| | | | | |
Reacquired: | | | | | | | | | | | | | | | | | | | | |
Class A | | | (1,438,030 | ) | | | (43,327,173 | ) | | | | | | | (1,542,752 | ) | | | (49,065,623 | ) |
Class B(b) | | | – | | | | – | | | | | | | | (3,072 | ) | | | (93,733 | ) |
Class C | | | (121,737 | ) | | | (3,235,685 | ) | | | | | | | (161,319 | ) | | | (4,717,073 | ) |
Class Y | | | (203,617 | ) | | | (6,079,853 | ) | | | | | | | (323,486 | ) | | | (10,330,725 | ) |
Class R6 | | | (5,755,374 | ) | | | (174,878,584 | ) | | | | | | | (1,297,946 | ) | | | (40,968,001 | ) |
Net increase (decrease) in share activity | | | (5,765,283 | ) | | $ | (177,422,727 | ) | | | | | | | (1,606,250 | ) | | $ | (50,857,273 | ) |
| (a) | There are entities that are record owners of more than 5% of the outstanding shares of the Fund and in the aggregate own 52% of the outstanding shares of the Fund. IDI has an agreement with these entities to sell Fund shares. The Fund, Invesco and/or Invesco affiliates may make payments to these entities, which are considered to be related to the Fund, for providing services to the Fund, Invesco and/or Invesco affiliates including but not limited to services such as securities brokerage, distribution, third party record keeping and account servicing. The Fund has no knowledge as to whether all or any portion of the shares owned of record by these entities are also owned beneficially. |
| (b) | Class B shares activity for the period November 1, 2017 through January 26, 2018 (date of conversion). |
| (c) | Effective as of the close of business January 26, 2018, all outstanding Class B shares were converted to Class A shares. |
NOTE 11–Subsequent Event
The Board of Trustees of the Fund unanimously approved an Agreement and Plan of Reorganization (the “Agreement”) pursuant to which the Fund would acquire all of the assets and liabilities of Invesco Global Small & Mid Cap Growth Fund (the “Target Fund”) in exchange for shares of the Fund.
Shareholders of the Target Fund do not need to approve the reorganization. The reorganization is expected to be consummated in or around April or May 2020. Upon closing of the reorganization, shareholders of the Target Fund will receive shares of the Fund in exchange for their shares of Target Fund, and the Target Fund will liquidate and cease operations.
22 Invesco Global Growth Fund
Report of Independent Registered Public Accounting Firm
To the Board of Trustees of AIM International Mutual Funds (Invesco International Mutual Funds) and Shareholders of Invesco Global Growth Fund
Opinion on the Financial Statements
We have audited the accompanying statement of assets and liabilities, including the schedule of investments, of Invesco Global Growth Fund (one of the funds constituting AIM International Mutual Funds (Invesco International Mutual Funds), referred to hereafter as the “Fund”) as of October 31, 2019, the related statement of operations for the year ended October 31, 2019, the statement of changes in net assets for each of the two years in the period ended October 31, 2019, including the related notes, and the financial highlights for each of the five years in the period ended October 31, 2019 (collectively referred to as the “financial statements”). In our opinion, the financial statements present fairly, in all material respects, the financial position of the Fund as of October 31, 2019, the results of its operations for the year then ended, the changes in its net assets for each of the two years in the period ended October 31, 2019 and the financial highlights for each of the five years in the period ended October 31, 2019 in conformity with accounting principles generally accepted in the United States of America.
Basis for Opinion
These financial statements are the responsibility of the Fund’s management. Our responsibility is to express an opinion on the Fund’s financial statements based on our audits. We are a public accounting firm registered with the Public Company Accounting Oversight Board (United States) (PCAOB) and are required to be independent with respect to the Fund in accordance with the U.S. federal securities laws and the applicable rules and regulations of the Securities and Exchange Commission and the PCAOB.
We conducted our audits of these financial statements in accordance with the standards of the PCAOB. Those standards require that we plan and perform the audit to obtain reasonable assurance about whether the financial statements are free of material misstatement, whether due to error or fraud.
Our audits included performing procedures to assess the risks of material misstatement of the financial statements, whether due to error or fraud, and performing procedures that respond to those risks. Such procedures included examining, on a test basis, evidence regarding the amounts and disclosures in the financial statements. Our audits also included evaluating the accounting principles used and significant estimates made by management, as well as evaluating the overall presentation of the financial statements. Our procedures included confirmation of securities owned as of October 31, 2019 by correspondence with the custodian, transfer agent and brokers; when replies were not received from brokers, we performed other auditing procedures. We believe that our audits provide a reasonable basis for our opinion.
/s/PricewaterhouseCoopers LLP
Houston, Texas
December 23, 2019
We have served as the auditor of one or more of the investment companies in the Invesco group of investment companies since at least 1995. We have not been able to determine the specific year we began serving as auditor.
23 Invesco Global Growth Fund
Calculating your ongoing Fund expenses
Example
As a shareholder of the Fund, you incur two types of costs: (1) transaction costs, which may include sales charges (loads) on purchase payments or contingent deferred sales charges on redemptions, if any; and (2) ongoing costs, including management fees, distribution and/or service(12b-1) fees, and other Fund expenses. This example is intended to help you understand your ongoing costs (in dollars) of investing in the Fund and to compare these costs with ongoing costs of investing in other mutual funds. The example is based on an investment of $1,000 invested at the beginning of the period and held for the entire period May 1, 2019 through October 31, 2019.
Actual expenses
The table below provides information about actual account values and actual expenses. You may use the information in this table, together with the amount you invested, to estimate the expenses that you paid over the period. Simply divide your account value by $1,000 (for example, an $8,600 account value divided by $1,000 = 8.6), then multiply the result by the number in the table under the heading entitled “Actual Expenses Paid During Period” to estimate the expenses you paid on your account during this period.
Hypothetical example for comparison purposes
The table below also provides information about hypothetical account values and hypothetical expenses based on the Fund’s actual expense ratio and an assumed rate of return of 5% per year before expenses, which is not the Fund’s actual return.
The hypothetical account values and expenses may not be used to estimate the actual ending account balance or expenses you paid for the period. You may use this information to compare the ongoing costs of investing in the Fund and other funds. To do so, compare this 5% hypothetical example with the 5% hypothetical examples that appear in the shareholder reports of the other funds.
Please note that the expenses shown in the table are meant to highlight your ongoing costs only and do not reflect any transaction costs, such as sales charges (loads) on purchase payments or contingent deferred sales charges on redemptions, if any. Therefore, the hypothetical information is useful in comparing ongoing costs only, and will not help you determine the relative total costs of owning different funds. In addition, if these transaction costs were included, your costs would have been higher.
| | | | | | | | | | | | | | | | | | | | | | | | | | | | | | |
| | | | | ACTUAL | | HYPOTHETICAL
(5% annual return before
expenses) | | |
| | | Beginning
Account Value
(05/01/19) | | Ending Account Value
(10/31/19)1 | | Expenses Paid During
Period2 | | Ending
Account Value
(10/31/19) | | Expenses
Paid During
Period2 | | Annualized
Expense Ratio |
Class A | | | $ | 1,000.00 | | | | $ | 1,021.30 | | | | $ | 6.22 | | | | $ | 1,019.06 | | | | $ | 6.21 | | | | | 1.22 | % |
Class C | | | | 1,000.00 | | | | | 1,017.10 | | | | | 10.02 | | | | | 1,015.27 | | | | | 10.01 | | | | | 1.97 | |
Class Y | | | | 1,000.00 | | | | | 1,022.50 | | | | | 4.94 | | | | | 1,020.32 | | | | | 4.94 | | | | | 0.97 | |
Class R5 | | | | 1,000.00 | | | | | 1,022.70 | | | | | 4.38 | | | | | 1,020.87 | | | | | 4.38 | | | | | 0.86 | |
Class R6 | | | | 1,000.00 | | | | | 1,023.00 | | | | | 4.39 | | | | | 1,020.87 | | | | | 4.38 | | | | | 0.86 | |
| 1 | The actual ending account value is based on the actual total return of the Fund for the period May 1, 2019 through October 31, 2019, after actual expenses and will differ from the hypothetical ending account value which is based on the Fund’s expense ratio and a hypothetical annual return of 5% before expenses. |
| 2 | Expenses are equal to the Fund’s annualized expense ratio as indicated above multiplied by the average account value over the period, multiplied by 184/365 to reflect the most recent fiscal half year. |
24 Invesco Global Growth Fund
Approval of Investment Advisory andSub-Advisory Contracts
At meetings held on June 10, 2019, the Board of Trustees (the Board or the Trustees) of AIM International Mutual Funds (Invesco International Mutual Funds) as a whole, and the independent Trustees, who comprise over 75% of the Board, voting separately, approved the continuance of the Invesco Global Growth Fund’s (the Fund) Master Investment Advisory Agreement with Invesco Advisers, Inc. (Invesco Advisers and the investment advisory agreement) and the Master IntergroupSub-Advisory Contract for Mutual Funds with Invesco Asset Management Deutschland GmbH, Invesco Asset Management Limited, Invesco Asset Management (Japan) Limited, Invesco Hong Kong Limited, Invesco Senior Secured Management, Inc. and Invesco Canada Ltd. (collectively, the AffiliatedSub-Advisers and thesub-advisory contracts) for another year, effective July 1, 2019. After evaluating the factors discussed below, among others, the Board approved the renewal of the Fund’s investment advisory agreement and thesub-advisory contracts and determined that the compensation payable by the Fund to Invesco Advisers and by Invesco Advisers to the AffiliatedSub-Advisers is fair and reasonable.
The Board’s Evaluation Process
The Board’s Investments Committee has established threeSub-Committees, which meet throughout the year to review the performance of funds advised by Invesco Advisers (the Invesco Funds). As part of a regularly scheduled basis ofin-person Board meetings, theSub-Committees meet with portfolio managers for their assigned Invesco Funds and other members of management to review detailed information about investment performance and portfolio attributes of these funds. The Board took into account evaluations and reports that it received from the Investments Committee andSub-Committees, as well as the information provided to such committees and the Board throughout the year, in considering whether to approve each Invesco Fund’s investment advisory agreement andsub-advisory contracts.
As part of the contract renewal process, the Board reviews and considers information provided in response to detailed requests for information submitted to management by the independent Trustees with assistance from legal counsel to the independent Trustees. The Board receives comparative investment performance and fee data regarding the Invesco Funds prepared by Invesco Advisers and Broadridge Financial Solutions, Inc. (Broadridge), an independent mutual fund data provider. The Board also receives an independent written evaluation from the Senior Officer, an officer of the Invesco Funds who reports directly to the independent Trustees. The Senior Officer’s
evaluation is prepared as part of his responsibility to manage the process by which the Invesco Funds’ proposed management fees are negotiated during the annual contract renewal process to ensure they are negotiated in a manner that is at arms’ length and reasonable. In addition to meetings with Invesco Advisers and fund counsel throughout the year, the independent Trustees also discuss the continuance of the investment advisory agreement andsub-advisory contracts in separate sessions with the Senior Officer and with independent legal counsel.
The discussion below is a summary of the Senior Officer’s independent written evaluation with respect to the Fund’s investment advisory agreement, as well as a discussion of the material factors and related conclusions that formed the basis for the Board’s approval of the Fund’s investment advisory agreement andsub-advisory contracts. The Trustees’ review and conclusions are based on the comprehensive consideration of all information presented to them during the course of the year and in prior years and are not the result of any single determinative factor. Moreover, one Trustee may have weighed a particular piece of information or factor differently than another Trustee. This information is current as of June 10, 2019.
Factors and Conclusions and Summary of Independent Written Fee Evaluation
| A. | Nature, Extent and Quality of Services Provided by Invesco Advisers and the AffiliatedSub-Advisers |
The Board reviewed the nature, extent and quality of the advisory services provided to the Fund by Invesco Advisers under the Fund’s investment advisory agreement, and the credentials and experience of the officers and employees of Invesco Advisers who provide these services, including the Fund’s portfolio manager(s). The Board’s review included consideration of Invesco Advisers’ investment process oversight and structure, credit analysis and investment risk management. The Board also considerednon-advisory services that Invesco Advisers and its affiliates provide to the Invesco Funds such as various back office support functions, third party oversight, internal audit, valuation, portfolio trading and legal and compliance. The Board also received and reviewed information about Invesco Advisers’ role as administrator of the Invesco Funds’ liquidity risk management program. The Board also reviewed and considered the benefits to shareholders of investing in a fund that is part of the Invesco family of funds under the umbrella of Invesco Ltd., Invesco Advisers’ parent company, and noted Invesco Ltd.’s depth and experience in conducting an investment
management business, as well as its commitment of financial and other resources to such business. The Board reviewed and considered information about the resources that Invesco Advisers intends to continue to commit to managing the Invesco family of funds following Invesco Ltd.’s acquisition of OppenheimerFunds, Inc. and its subsidiaries. The Board concluded that the nature, extent and quality of the services provided to the Fund by Invesco Advisers are appropriate and satisfactory.
The Board reviewed the services that may be provided by the AffiliatedSub-Advisers under thesub-advisory contracts and the credentials and experience of the officers and employees of the AffiliatedSub-Advisers who provide these services. The Board noted the AffiliatedSub-Advisers’ expertise with respect to certain asset classes and that the AffiliatedSub-Advisers have offices and personnel that are located in financial centers around the world. As a result, the Board noted that the AffiliatedSub-Advisers can provide research and investment analysis on the markets and economies of various countries in which the Fund may invest, make recommendations regarding securities and assist with security trades. The Board concluded that thesub-advisory contracts may benefit the Fund and its shareholders by permitting Invesco Advisers to use the resources and talents of the AffiliatedSub-Advisers in managing the Fund. The Board concluded that the nature, extent and quality of the services that may be provided by the AffiliatedSub-Advisers are appropriate and satisfactory.
| B. | Fund Investment Performance |
The Board considered Fund investment performance as a relevant factor in considering whether to approve the investment advisory agreement. The Board did not view Fund investment performance as a relevant factor in considering whether to approve thesub-advisory contracts for the Fund, as no AffiliatedSub-Adviser currently manages assets of the Fund.
The Board compared the Fund’s investment performance over multiple time periods ending December 31, 2018 to the performance of funds in the Broadridge performance universe and against the Lipper GlobalMulti-Cap Growth Funds Index. The Board noted that performance of Class A shares of the Fund was in the fifth quintile of its performance universe for the one, three and five year periods (the first quintile being the best performing funds and the fifth quintile being the worst performing funds). The Board noted that performance of Class A shares of the Fund was below the performance of the Index for the one, three and five year periods.
25 Invesco Global Growth Fund
The Board noted that the valuation component of the Fund’s investment process was the primary headwind to relative performance and that holdings in certain sectors also detracted from Fund performance. The Trustees also reviewed more recent Fund performance and this review did not change their conclusions.
| C. | Advisory andSub-Advisory Fees and Fund Expenses |
The Board compared the Fund’s contractual management fee rate to the contractual management fee rates of funds in the Fund’s Broadridge expense group. The Board noted that the contractual management fee rate for Class A shares of the Fund was reasonably comparable to the median contractual management fee rate of funds in its expense group. The Board noted that the term “contractual management fee” for funds in the expense group may include both advisory and certainnon-portfolio management administrative services fees, but that Broadridge does not provide information on a fund by fund basis as to what is included. The Board also reviewed the methodology used by Broadridge in providing expense group information, which includes using each fund’s contractual management fee schedule (including any applicable breakpoints) as reported in the most recent prospectus or statement of additional information for each fund in the expense group. The Board also considered comparative information regarding the Fund’s total expense ratio and its various components.
The Board noted that Invesco Advisers has contractually agreed to waive fees and/or limit expenses of the Fund for the term disclosed in the Fund’s registration statement in an amount necessary to limit total annual operating expenses to a specified percentage of average daily net assets for each class of the Fund.
The Board also considered the fees charged by Invesco Advisers and the AffiliatedSub-Advisers to other similarly managed client accounts. The Board noted that Invesco Advisers or the AffiliatedSub-Advisers may charge lower fees to large institutional clients. Invesco Advisers reviewed with the Board differences in the scope of services it provides to the Invesco Funds relative to certain other types of client accounts, including management of cash flows as a result of redemptions and purchases, necessary infrastructure such as officers, office space, technology, legal and distribution, oversight of service providers, costs and business risks associated with launching new funds and sponsoring and maintaining the product line, preparation of annual registration statement updates and financial information and compliance with federal and state laws and regulations.
The Board also considered the services that may be provided by the AffiliatedSub-Advisers pursuant to thesub-advisory contracts, as well as the fees payable by Invesco Advisers to the
AffiliatedSub-Advisers pursuant to thesub-advisory contracts.
| D. | Economies of Scale and Breakpoints |
The Board considered the extent to which there may be economies of scale in the provision of advisory services to the Fund. The Board considered Invesco’s reinvestment in its business, including investments in business infrastructure and cybersecurity. The Board also considered that the Fund benefits from economies of scale through contractual breakpoints in the Fund’s advisory fee schedule, which generally operate to reduce the Fund’s expense ratio as it grows in size. The Board noted that the Fund shares directly in economies of scale through lower fees charged by third party service providers based on the combined size of the Invesco Funds. The Board noted that the Fund may also benefit from economies of scale through initial fee setting, fee waivers and expense reimbursements.
| E. | Profitability and Financial Resources |
The Board reviewed information from Invesco Advisers concerning the costs of the advisory and other services that Invesco Advisers and its affiliates provide to the Fund and the Invesco Funds and the profitability of Invesco Advisers and its affiliates in providing these services. The Board considered the methodology used for calculating profitability and noted the periodic review of such methodology by an independent consultant. The Board noted that Invesco Advisers continues to operate at a net profit from services Invesco Advisers and its affiliates provide to the Invesco Funds and the Fund. The Board did not deem the level of profits realized by Invesco Advisers and its affiliates from providing services to the Fund to be excessive given the nature, extent and quality of the services provided. The Board received information from Invesco Advisers demonstrating that Invesco Advisers and the AffiliatedSub-Advisers are financially sound and have the resources necessary to perform their obligations under the investment advisory agreement andsub-advisory contracts.
| F. | Collateral Benefits to Invesco Advisers and its Affiliates |
The Board considered various other benefits received by Invesco Advisers and its affiliates from the relationship with the Fund, including the fees received for providing administrative, transfer agency and distribution services to the Fund. The Board considered comparative information regarding fees charged for these services, including information provided by Broadridge and other independent sources. The Board considered the performance of Invesco Advisers and its affiliates in providing these services and the organizational structure employed to provide these services. The Board also considered that these services are provided to the Fund pursuant to written contracts that are reviewed and approved on an annual basis by the Board; and that the services are required for the operation of the Fund.
The Board considered the benefits realized by Invesco Advisers and the AffiliatedSub-Advisers as a result of portfolio brokerage transactions executed through “soft dollar” arrangements. The Board noted that soft dollar arrangements may result in the Fund bearing costs to purchase research that may be used by Invesco Advisers or the AffiliatedSub-Advisers with other clients and may reduce Invesco Advisers’ or the AffiliatedSub-Advisers’ expenses. The Board also considered that it receives periodic reports from Invesco representing that these arrangements are consistent with regulatory requirements. The Board did not deem the soft dollar arrangements to be inappropriate.
The Board considered that the Fund’s uninvested cash and cash collateral from any securities lending arrangements may be invested in money market funds advised by Invesco Advisers pursuant to procedures approved by the Board. The Board considered information regarding the returns of the affiliated money market funds relative to comparable overnight investments, as well as the costs to the Fund of such investments. The Board noted that Invesco Advisers receives advisory fees from these affiliated money market funds attributable to such investments, although Invesco Advisers has contractually agreed to waive through varying periods the advisory fees payable by the Invesco Funds with respect to certain investments in the affiliated money market funds. The waiver is in an amount equal to 100% of the net advisory fee Invesco Advisers receives from the affiliated money market funds with respect to the Fund’s investment in the affiliated money market funds of uninvested cash, but not cash collateral. The Board concluded that the amount of advisory fees received by Invesco Advisers from the Fund’s investment of cash collateral from any securities lending arrangements in the affiliated money market funds is fair and reasonable.
The Board also considered that an affiliated broker may receive commissions for executing certain trades for the Fund. Invesco Advisers and the AffiliatedSub-Advisers may use the affiliated broker to, among other things, control order routing and minimize information leakage, and the Board was advised that such trades are executed in compliance with rules under the federal securities laws and consistent with best execution obligations.
26 Invesco Global Growth Fund
Tax Information
Form1099-DIV, Form1042-S and otheryear-end tax information provide shareholders with actual calendar year amounts that should be included in their tax returns. Shareholders should consult their tax advisors.
The following distribution information is being provided as required by the Internal Revenue Code or to meet a specific state’s requirement.
The Fund designates the following amounts or, if subsequently determined to be different, the maximum amount allowable for its fiscal year ended October 31, 2019:
| | | | | | | | | | |
Federal and State Income Tax | | | | | | | | | | |
Long-Term Capital Gain Distributions | | $ | 26,601,716 | | | | | | | |
Qualified Dividend Income* | | | 86.13 | % | | | | | | |
Corporate Dividends Received Deduction* | | | 99.72 | % | | | | | | |
U.S. Treasury Obligations* | | | 0.00 | % | | | | | | |
Foreign Taxes | | $ | 0.0411 | | | per share | | | | |
Foreign Source Income | | $ | 0.4466 | | | per share | | | | |
| | * | The above percentages are based on ordinary income dividends paid to shareholders during the Fund’s fiscal year. |
27 Invesco Global Growth Fund
Trustees and Officers
The address of each trustee and officer is AIM International Mutual Funds (Invesco International Mutual Funds) (the “Trust”), 11 Greenway Plaza, Suite 1000, Houston, Texas 77046-1173. The trustees serve for the life of the Trust, subject to their earlier death, incapacitation, resignation, retirement or removal as more specifically provided in the Trust’s organizational documents. Each officer serves for a one year term or until their successors are elected and qualified. Column two below includes length of time served with predecessor entities, if any.
| | | | | | | | |
Name, Year of Birth and Position(s)
Held with the Trust | | Trustee and/or Officer Since | | Principal Occupation(s) During Past 5 Years | | Number of
Funds in
Fund Complex
Overseen by
Trustee | | Other
Directorship(s)
Held by Trustee
During Past
5 Years |
Interested Persons | | | | | | | | |
| Martin L. Flanagan1 –1960 Trustee and Vice Chair | | 2007 | | Executive Director, Chief Executive Officer and President, Invesco Ltd. (ultimate parent of Invesco and a global investment management firm); Trustee and Vice Chair, The Invesco Funds; Vice Chair, Investment Company Institute; and Member of Executive Board, SMU Cox School of Business Formerly: Advisor to the Board, Invesco Advisers, Inc. (formerly known as Invesco Institutional (N.A.), Inc.); Chairman and Chief Executive Officer, Invesco Advisers, Inc. (registered investment adviser); Director, Chairman, Chief Executive Officer and President, Invesco Holding Company (US), Inc. (formerly IVZ Inc.) (holding company), Invesco Group Services, Inc. (service provider) and Invesco North American Holdings, Inc. (holding company); Director, Chief Executive Officer and President, Invesco Holding Company Limited (parent of Invesco and a global investment management firm); Director, Invesco Ltd.; Chairman, Investment Company Institute and President,Co-Chief Executive Officer,Co-President, Chief Operating Officer and Chief Financial Officer, Franklin Resources, Inc. (global investment management organization) | | 229 | | None |
| Philip A. Taylor2 – 1954 Trustee | | 2006 | | Vice Chair, Invesco Ltd.; Trustee, The Invesco Funds Formerly: Director, Invesco Canada Ltd. (formerly known as Invesco Trimark Ltd./Invesco Trimark Ltèe) (registered investment adviser and registered transfer agent); Head of the Americas and Senior Managing Director, Invesco Ltd.; Director, Invesco Advisers, Inc. (formerly known as Invesco Institutional (N.A.), Inc.) (registered investment adviser); Director and Chairman, Invesco Investment Services, Inc. (formerly known as Invesco AIM Investment Services, Inc.) (registered transfer agent); Chief Executive Officer, Invesco Corporate Class Inc. (corporate mutual fund company); Chairman and Chief Executive Officer, Invesco Canada Ltd. (formerly known as Invesco Trimark Ltd./Invesco Trimark Ltèe) (registered investment adviser and registered transfer agent); Senior Vice President, The Invesco Funds; Director, Invesco Investment Advisers LLC (formerly known as Van Kampen Asset Management); Director, Chairman, Chief Executive Officer and President, Invesco Management Group, Inc. (formerly known as Invesco AIM Management Group, Inc.) (financial services holding company);Co-Chairman,Co-President andCo-Chief Executive Officer, Invesco Advisers, Inc. (formerly known as Invesco Institutional (N.A.), Inc.) (registered investment adviser); Director, Chief Executive Officer and President, Van Kampen Exchange Corp; President and Principal Executive Officer, The Invesco Funds (other than AIM Treasurer’s Series Trust (Invesco Treasurer’s Series Trust), Short-Term Investments Trust and Invesco Management Trust); Executive Vice President, The Invesco Funds (AIM Treasurer’s Series Trust (Invesco Treasurer’s Series Trust), Short-Term Investments Trust and Invesco Management Trust only); Director and President, INVESCO Funds Group, Inc. (registered investment adviser and registered transfer agent); Director and Chairman, IVZ Distributors, Inc. (formerly known as INVESCO Distributors, Inc.) (registered broker dealer); Director, President and Chairman, Invesco Inc. (holding company), Invesco Canada Holdings Inc. (holding company), Trimark Investments Ltd./Placements Trimark Ltèe and Invesco Financial Services Ltd/Services Financiers Invesco Ltèe; Chief Executive Officer, Invesco Canada Fund Inc. (corporate mutual fund company); Director and Chairman, Van Kampen Investor Services Inc.; Director, Chief Executive Officer and President, 1371 Preferred Inc. (holding company) and Van Kampen Investments Inc.; Director and President, AIM GP Canada Inc. (general partner for limited partnerships) and Van Kampen Advisors, Inc.; Director and Chief Executive Officer, Invesco Trimark Dealer Inc. (registered broker dealer); Director, Invesco Distributors, Inc. (formerly known as Invesco AIM Distributors, Inc.) (registered broker dealer); Manager, Invesco Capital Management LLC; Director, Chief Executive Officer and President, Invesco Advisers, Inc.; Director, Chairman, Chief Executive Officer and President, Invesco AIM Capital Management, Inc.; President, Invesco Trimark Dealer Inc. and Invesco Trimark Ltd./Invesco Trimark Ltèe; Director and President, AIM Trimark Corporate Class Inc. and AIM Trimark Canada Fund Inc.; Senior Managing Director, Invesco Holding Company Limited; Director and Chairman, Fund Management Company (former registered broker dealer); President and Principal Executive Officer, The Invesco Funds (AIM Treasurer’s Series Trust (Invesco Treasurer’s Series Trust), and Short-Term Investments Trust only); President, AIM Trimark Global Fund Inc. and AIM Trimark Canada Fund Inc. | | 229 | | None |
| 1 | Mr. Flanagan is considered an interested person (within the meaning of Section 2(a)(19) of the 1940 Act) of the Trust because he is an officer of the Adviser to the Trust, and an officer and a director of Invesco Ltd., ultimate parent of the Adviser. |
| 2 | Mr. Taylor is considered an interested person (within the meaning of Section 2(a)(19) of the 1940 Act) of the Trust because he is an officer and a director of the Adviser. |
T-1 Invesco Global Growth Fund
Trustees and Officers–(continued)
| | | | | | | | |
Name, Year of Birth and Position(s) Held with the Trust | | Trustee and/or Officer Since | | Principal Occupation(s)
During Past 5 Years | | Number of
Funds in
Fund Complex
Overseen by
Trustee | | Other
Directorship(s)
Held by Trustee
During Past
5 Years |
Independent Trustees | | | | | | | | |
| Bruce L. Crockett – 1944 Trustee and Chair | | 1992 | | Chairman, Crockett Technologies Associates (technology consulting company) Formerly: Director, Captaris (unified messaging provider); Director, President and Chief Executive Officer, COMSAT Corporation; Chairman, Board of Governors of INTELSAT (international communications company); ACE Limited (insurance company); Independent Directors Council and Investment Company Institute: Member of the Audit Committee, Investment Company Institute; Member of the Executive Committee and Chair of the Governance Committee, Independent Directors Council | | 229 | | Director and Chairman of the Audit Committee, ALPS (Attorneys Liability Protection Society) (insurance company); Director and Member of the Audit Committee and Compensation Committee, Ferroglobe PLC (metallurgical company) |
| David C. Arch – 1945 Trustee | | 2010 | | Chairman of Blistex Inc. (consumer health care products manufacturer); Member, World Presidents’ Organization | | 229 | | Board member of the Illinois Manufacturers’ Association |
| Beth Ann Brown – 1968 Trustee | | 2019 | | Independent Consultant Formerly: Head of Intermediary Distribution, Managing Director, Strategic Relations, Managing Director, Head of National Accounts, Senior Vice President, National Account Manager and Senior Vice President, Key Account Manager, Columbia Management Investment Advisers LLC; Vice President, Key Account Manager, Liberty Funds Distributor, Inc.; and Trustee of certain Oppenheimer Funds | | 229 | | Director, Board of Directors of Caron Engineering Inc.; President and Director, Acton Shapleigh Youth Conservation Corps (non - profit); and Vice President and Director of Grahamtastic Connection (non-profit) |
| Jack M. Fields – 1952 Trustee | | 1997 | | Chief Executive Officer, Twenty First Century Group, Inc. (government affairs company); and Chairman, Discovery Learning Alliance(non-profit) Formerly: Owner and Chief Executive Officer, Dos Angeles Ranch L.P. (cattle, hunting, corporate entertainment); Director, Insperity, Inc. (formerly known as Administaff) (human resources provider); Chief Executive Officer, Texana Timber LP (sustainable forestry company); Director of Cross Timbers Quail Research Ranch(non-profit); and member of the U.S. House of Representatives | | 229 | | None |
| Cynthia Hostetler –1962 Trustee | | 2017 | | Non-Executive Director and Trustee of a number of public and private business corporations Formerly: Director, Aberdeen Investment Funds (4 portfolios); Head of Investment Funds and Private Equity, Overseas Private Investment Corporation; President, First Manhattan Bancorporation, Inc.; Attorney, Simpson Thacher & Bartlett LLP | | 229 | | Vulcan Materials Company (construction materials company); Trilinc Global Impact Fund; Genesee & Wyoming, Inc. (railroads); Artio Global Investment LLC (mutual fund complex); Edgen Group, Inc. (specialized energy and infrastructure products distributor); Investment Company Institute (professional organization); Independent Directors Council (professional organization) |
T-2 Invesco Global Growth Fund
Trustees and Officers–(continued)
| | | | | | | | |
Name, Year of Birth and
Position(s) Held with the Trust | | Trustee and/or Officer Since | | Principal Occupation(s) During Past 5 Years | | Number of
Funds in
Fund Complex
Overseen by
Trustee | | Other
Directorship(s)
Held by Trustee
During Past 5
Years |
Independent Trustees–(continued) | | | | |
| Eli Jones – 1961 Trustee | | 2016 | | Professor and Dean, Mays Business School – Texas A&M University Formerly: Professor and Dean, Walton College of Business, University of Arkansas and E.J. Ourso College of Business, Louisiana State University; Director, Arvest Bank | | 229 | | Insperity, Inc. (formerly known as Administaff) (human resources provider) |
| Elizabeth Krentzman –1959 Trustee | | 2019 | | Formerly: Principal and Chief Regulatory Advisor for Asset Management Services and U.S. Mutual Fund Leader of Deloitte & Touche LLP; General Counsel of the Investment Company Institute (trade association); National Director of the Investment Management Regulatory Consulting Practice, Principal, Director and Senior Manager of Deloitte & Touche LLP; Assistant Director of the Division of Investment Management – Office of Disclosure and Investment Adviser Regulation of the U.S. Securities and Exchange Commission and various positions with the Division of Investment Management – Office of Regulatory Policy of the U.S. Securities and Exchange Commission; Associate at Ropes & Gray LLP; Advisory Board Member of the Securities and Exchange Commission Historical Society; and Trustee of certain Oppenheimer Funds | | 229 | | Trustee of the University of Florida National Board Foundation and Audit Committee Member; Member of the Cartica Funds Board of Directors (private investment funds); Member of the University of Florida Law Center Association, Inc. Board of Trustees and Audit Committee Member |
Anthony J. LaCava, Jr. – 1956 Trustee | | 2019 | | Formerly: Director and Member of the Audit Committee, Blue Hills Bank (publicly traded financial institution) and Managing Partner, KPMG LLP | | 229 | | Blue Hills Bank; Chairman, Bentley University; Member, Business School Advisory Council; and Nominating Committee KPMG LLP |
Prema Mathai-Davis – 1950 Trustee | | 1998 | | Retired Co-Owner & Partner of Quantalytics Research, LLC, (a FinTech Investment Research Platform for the Self-Directed Investor) | | 229 | | None |
Joel W. Motley – 1952 Trustee | | 2019 | | Director of Office of Finance, Federal Home Loan Bank; Member of the Vestry of Trinity Wall Street; Managing Director of Carmona Motley Inc. (privately held financial advisor); Member of the Finance and Budget Committee of the Council on Foreign Relations, Member of the Investment Committee and Board of Human Rights Watch and Member of the Investment Committee and Board of Historic Hudson Valley(non-profit cultural organization) Formerly: Managing Director of Public Capital Advisors, LLC (privately held financial advisor); Managing Director of Carmona Motley Hoffman, Inc. (privately held financial advisor); Trustee of certain Oppenheimer Funds; and Director of Columbia Equity Financial Corp. (privately held financial advisor) | | 229 | | Director of Greenwall Foundation (bioethics research foundation); Member of Board and Investment Committee of The Greenwall Foundation; Director of Southern Africa Legal Services Foundation; Board Member and Investment Committee Member of Pulizer Center for Crisis Reporting(non-profit journalism) |
| Teresa M. Ressel – 1962 Trustee | | 2017 | | Non-executive director and trustee of a number of public and private business corporations Formerly: Chief Financial Officer, Olayan America, The Olayan Group (international investor/commercial/industrial); Chief Executive Officer, UBS Securities LLC; Group Chief Operating Officer, Americas, UBS AG; Assistant Secretary for Management & Budget and CFO, US Department of the Treasury | | 229 | | Atlantic Power Corporation (power generation company); ON Semiconductor Corp. (semiconductor supplier) |
T-3 Invesco Global Growth Fund
Trustees and Officers–(continued)
| | | | | | | | |
Name, Year of Birth and Position(s) Held with the Trust | | Trustee and/or Officer Since | | Principal Occupation(s) During Past 5 Years | | Number of
Funds in
Fund Complex
Overseen by
Trustee | | Other
Directorship(s) Held by Trustee During Past 5 Years |
Independent Trustees–(continued) | | | | |
| Ann Barnett Stern – 1957 Trustee | | 2017 | | President and Chief Executive Officer, Houston Endowment Inc. (private philanthropic institution) Formerly: Executive Vice President and General Counsel, Texas Children’s Hospital; Attorney, Beck, Redden and Secrest, LLP; Business Law Instructor, University of St. Thomas; Attorney, Andrews & Kurth LLP | | 229 | | Federal Reserve Bank of Dallas |
Raymond Stickel, Jr. –1944 Trustee | | 2005 | | Retired Formerly: Director, Mainstay VP Series Funds, Inc. (25 portfolios); Partner, Deloitte & Touche | | 229 | | None |
Robert C. Troccoli – 1949 Trustee | | 2016 | | Retired Formerly: Adjunct Professor, University of Denver – Daniels College of Business; Senior Partner, KPMG LLP | | 229 | | None |
Daniel S. Vandivort –1954 Trustee | | 2019 | | Treasurer, Chairman of the Audit and Finance Committee, and Trustee, Board of Trustees, Huntington Disease Foundation of America; and President, Flyway Advisory Services LLC (consulting and property management) Formerly: Trustee and Governance Chair, of certain Oppenheimer Funds | | 229 | | Chairman and Lead Independent Director, Chairman of the Audit Committee, and Director, Board of Directors, Value Line Funds |
James D. Vaughn –1945 Trustee | | 2019 | | Retired Formerly: Managing Partner, Deloitte & Touche LLP; Trustee and Chairman of the Audit Committee, Schroder Funds; Board Member, Mile High United Way, Boys and Girls Clubs, Boy Scouts, Colorado Business Committee for the Arts, Economic Club of Colorado and Metro Denver Network (economic development corporation); and Trustee of certain Oppenheimer Funds | | 229 | | Board member and Chairman of Audit Committee of AMG National Trust Bank; Trustee and Investment Committee member, University of South Dakota Foundation; Board member, Audit Committee Member and past Board Chair, Junior Achievement(non-profit) |
Christopher L. WIlson – 1957 Trustee, Vice Chair and Chair Designate | | 2017 | | Retired Formerly: Director, TD Asset Management USA Inc. (mutual fund complex) (22 portfolios); Managing Partner, CT2, LLC (investing and consulting firm); President/Chief Executive Officer, Columbia Funds, Bank of America Corporation; President/Chief Executive Officer, CDC IXIS Asset Management Services, Inc.; Principal & Director of Operations, Scudder Funds, Scudder, Stevens & Clark, Inc.; Assistant Vice President, Fidelity Investments | | 229 | | ISO New England, Inc.(non-profit organization managing regional electricity market) |
T-4 Invesco Global Growth Fund
Trustees and Officers–(continued)
| | | | | | | | |
Name, Year of Birth and
Position(s) Held with the Trust | | Trustee and/or Officer Since | | Principal Occupation(s) During Past 5 Years | | Number of
Funds in
Fund Complex
Overseen by
Trustee | | Other
Directorship(s)
Held by Trustee
During Past
5 Years |
Other Officers | | | | |
Sheri Morris – 1964 President, Principal Executive Officer and Treasurer | | 1999 | | Head of Global Fund Services, Invesco Ltd.; President, Principal Executive Officer and Treasurer, The Invesco Funds; Vice President, Invesco Advisers, Inc. (formerly known as Invesco Institutional (N.A.), Inc.) (registered investment adviser); and Vice President, Invesco Exchange-Traded Fund Trust, Invesco Exchange-Traded Fund Trust II, Invesco India Exchange-Traded Fund Trust, Invesco Actively Managed Exchange-Traded Fund Trust, Invesco Actively Managed Exchange-Traded Commodity Fund Trust and Invesco Exchange-Traded Self-Indexed Fund Trust; and Vice President, OppenheimerFunds, Inc. Formerly: Vice President and Principal Financial Officer, The Invesco Funds; Vice President, Invesco AIM Advisers, Inc., Invesco AIM Capital Management, Inc. and Invesco AIM Private Asset Management, Inc.; Assistant Vice President and Assistant Treasurer, The Invesco Funds and Assistant Vice President, Invesco Advisers, Inc., Invesco AIM Capital Management, Inc. and Invesco AIM Private Asset Management, Inc.; and Treasurer, Invesco Exchange-Traded FundTrust, Invesco Exchange-Traded Fund Trust II, Invesco India Exchange-Traded Fund Trust and Invesco Actively Managed Exchange-Traded Fund Trust | | N/A | | N/A |
Russell C. Burk – 1958 Senior Vice President and Senior Officer | | 2005 | | Senior Vice President and Senior Officer, The Invesco Funds | | N/A | | N/A |
| Jeffrey H. Kupor – 1968 Senior Vice President, Chief Legal Officer and Secretary | | 2018 | | Head of Legal of the Americas, Invesco Ltd.; Senior Vice President and Secretary, Invesco Advisers, Inc. (formerly known as Invesco Institutional (N.A.), Inc.) (registered investment adviser); Senior Vice President and Secretary, Invesco Distributors, Inc. (formerly known as Invesco AIM Distributors, Inc.); Vice President and Secretary, Invesco Investment Services, Inc. (formerly known as Invesco AIM Investment Services, Inc.) Senior Vice President, Chief Legal Officer and Secretary, The Invesco Funds; Secretary and General Counsel, Invesco Investment Advisers LLC (formerly known as Van Kampen Asset Management); Secretary and General Counsel, Invesco Capital Markets, Inc. (formerly known as Van Kampen Funds Inc.) and Chief Legal Officer, Invesco Exchange-Traded Fund Trust, Invesco Exchange-Traded Fund Trust II, Invesco India Exchange-Traded Fund Trust, Invesco Actively Managed Exchange-Traded Fund Trust, Invesco Actively Managed Exchange-Traded Commodity Fund Trust and Invesco Exchange-Traded Self-Indexed Fund Trust; Secretary, Invesco Indexing LLC; Secretary, W.L. Ross & Co., LLC Formerly: Secretary and Vice President, Jemstep, Inc.; Head of Legal, Worldwide Institutional, Invesco Ltd.; Secretary and General Counsel, INVESCO Private Capital Investments, Inc.; Senior Vice President, Secretary and General Counsel, Invesco Management Group, Inc. (formerly known as Invesco AIM Management Group, Inc.); Assistant Secretary, INVESCO Asset Management (Bermuda) Ltd.; Secretary and General Counsel, Invesco Private Capital, Inc.; Assistant Secretary and General Counsel, INVESCO Realty, Inc.; Secretary and General Counsel, Invesco Senior Secured Management, Inc.; and Secretary, Sovereign G./P. Holdings Inc. | | N/A | | N/A |
| Andrew R. Schlossberg –1974 Senior Vice President | | 2019 | | Head of the Americas and Senior Managing Director, Invesco Ltd.; Director and Senior Vice President, Invesco Advisers, Inc. (formerly known as Invesco Institutional (N.A.), Inc.) (registered investment adviser); Director and Chairman, Invesco Investment Services, Inc. (formerly known as Invesco AIM Investment Services, Inc.) (registered transfer agent); Senior Vice President, The Invesco Funds; Director, Invesco Investment Advisers LLC (formerly known as Van Kampen Asset Management); Director, President and Chairman, Invesco Insurance Agency, Inc. Formerly: Director, Invesco UK Limited; Director and Chief Executive, Invesco Asset Management Limited and Invesco Fund Managers Limited; Assistant Vice President, The Invesco Funds; Senior Vice President, Invesco Advisers, Inc. (formerly known as Invesco Institutional (N.A.), Inc.) (registered investment adviser); Director and Chief Executive, Invesco Administration Services Limited and Invesco Global Investment Funds Limited; Director, Invesco Distributors, Inc.; Head of EMEA, Invesco Ltd.; President, Invesco Actively Managed Exchange-Traded Commodity Fund Trust, Invesco Actively Managed Exchange-Traded Fund Trust, Invesco Exchange-Traded Fund Trust, Invesco Exchange-Traded Fund Trust II and Invesco India Exchange-Traded Fund Trust; Managing Director and Principal Executive Officer, Invesco Capital Management LLC | | N/A | | N/A |
T-5 Invesco Global Growth Fund
Trustees and Officers–(continued)
| | | | | | | | |
Name, Year of Birth and Position(s) Held with the Trust | | Trustee and/or Officer Since | | Principal Occupation(s)
During Past 5 Years | | Number of
Funds in
Fund Complex
Overseen by
Trustee | | Other
Directorship(s)
Held by Trustee
During Past
5 Years |
Other Officers–(continued) | | | | |
| John M. Zerr – 1962 Senior Vice President | | 2006 | | Chief Operating Officer of the Americas; Senior Vice President, Invesco Advisers, Inc. (formerly known as Invesco Institutional (N.A.), Inc.) (registered investment adviser); Senior Vice President, Invesco Distributors, Inc. (formerly known as Invesco AIM Distributors, Inc.); Director and Vice President, Invesco Investment Services, Inc. (formerly known as Invesco AIM Investment Services, Inc.) Senior Vice President, The Invesco Funds; Managing Director, Invesco Capital Management LLC; Director, Invesco Investment Advisers LLC (formerly known as Van Kampen Asset Management); Senior Vice President, Invesco Capital Markets, Inc. (formerly known as Van Kampen Funds Inc.); Manager, Invesco Indexing LLC; Manager, Invesco Specialized Products, LLC; Director and Senior Vice President, Invesco Insurance Agency, Inc.; Member, Invesco Canada Funds Advisory Board; Director, President and Chief Executive Officer, Invesco Corporate Class Inc. (corporate mutual fund company); and Director, Chairman, President and Chief Executive Officer, Invesco Canada Ltd. (formerly known as Invesco Trimark Ltd./Invesco Trimark Ltèe) (registered investment adviser and registered transfer agent) Formerly: Director and Senior Vice President, Invesco Management Group, Inc. (formerly known as Invesco AIM Management Group, Inc.); Secretary and General Counsel, Invesco Management Group, Inc. (formerly known as Invesco AIM Management Group, Inc.); Secretary, Invesco Investment Services, Inc. (formerly known as Invesco AIM Investment Services, Inc.); Chief Legal Officer and Secretary, The Invesco Funds; Secretary and General Counsel, Invesco Investment Advisers LLC (formerly known as Van Kampen Asset Management); Secretary and General Counsel, Invesco Capital Markets, Inc. (formerly known as Van Kampen Funds Inc.); Chief Legal Officer, Invesco Exchange-Traded Fund Trust, Invesco Exchange-Traded Fund Trust II, Invesco India Exchange-Traded Fund Trust, Invesco Actively Managed Exchange-Traded Fund Trust, Invesco Actively Managed Exchange-Traded Commodity Fund Trust and Invesco Exchange-Traded Self-Indexed Fund Trust; Secretary, Invesco Indexing LLC; Director, Secretary, General Counsel and Senior Vice President, Van Kampen Exchange Corp.; Director, Vice President and Secretary, IVZ Distributors, Inc. (formerly known as INVESCO Distributors, Inc.); Director and Vice President, INVESCO Funds Group, Inc.; Director and Vice President, Van Kampen Advisors Inc.; Director, Vice President, Secretary and General Counsel, Van Kampen Investor Services Inc.; Director and Secretary, Invesco Distributors, Inc. (formerly known as Invesco AIM Distributors, Inc.); Director, Senior Vice President, General Counsel and Secretary, Invesco AIM Advisers, Inc. and Van Kampen Investments Inc.; Director, Vice President and Secretary, Fund Management Company; Director, Senior Vice President, Secretary, General Counsel and Vice President, Invesco AIM Capital Management, Inc.; Chief Operating Officer and General Counsel, Liberty Ridge Capital, Inc. (an investment adviser) | | N/A | | N/A |
Gregory G. McGreevey – 1962 Senior Vice President | | 2012 | | Senior Managing Director, Invesco Ltd.; Director, Chairman, President, and Chief Executive Officer, Invesco Advisers, Inc. (formerly known as Invesco Institutional (N.A.), Inc.) (registered investment adviser); Director, Invesco Mortgage Capital, Inc. and Invesco Senior Secured Management, Inc.; and Senior Vice President, The Invesco Funds; and President, SNW Asset Management Corporation Formerly: Senior Vice President, Invesco Management Group, Inc. and Invesco Advisers, Inc.; Assistant Vice President, The Invesco Funds | | N/A | | N/A |
Kelli Gallegos – 1970 Vice President, Principal Financial Officer and Assistant Treasurer | | 2008 | | Principal Financial and Accounting Officer – Investments Pool, Invesco Specialized Products, LLC; Vice President, Principal Financial Officer and Assistant Treasurer, The Invesco Funds; Principal Financial and Accounting Officer – Pooled Investments, Invesco Capital Management LLC; Vice President and Treasurer, Invesco Exchange-Traded Fund Trust, Invesco Exchange-Traded Fund Trust II, Invesco India Exchange-Traded Fund Trust, Invesco Actively Managed Exchange-Traded Fund Trust, Invesco Actively Managed Exchange-Traded Commodity Fund Trust and Invesco Exchange-Traded Self-Indexed Fund Trust Formerly: Assistant Treasurer, Invesco Specialized Products, LLC; Assistant Treasurer, Invesco Exchange-Traded Fund Trust, Invesco Exchange-Traded Fund Trust II, Invesco India Exchange-Traded Fund Trust, Invesco Actively Managed Exchange-Traded Fund Trust, Invesco Actively Managed Exchange-Traded Commodity Fund Trust and Invesco Exchange-Traded Self-Indexed Fund Trust; Assistant Treasurer, Invesco Capital Management LLC; Assistant Vice President, The Invesco Funds | | N/A | | N/A |
T-6 Invesco Global Growth Fund
Trustees and Officers–(continued)
| | | | | | | | |
Name, Year of Birth and Position(s) Held with the Trust | | Trustee and/or Officer Since | | Principal Occupation(s) During Past 5 Years | | Number of
Funds in
Fund Complex
Overseen by
Trustee | | Other
Directorship(s)
Held by Trustee
During Past
5 Years |
Other Officers–(continued) | | | | |
Crissie M. Wisdom – 1969 Anti-Money Laundering Compliance Officer | | 2013 | | Anti-Money Laundering Compliance Officer, Invesco Advisers, Inc. (formerly known as Invesco Institutional (N.A.), Inc.) (registered investment adviser), Invesco Capital Markets, Inc. (formerly known as Van Kampen Funds Inc.), Invesco Distributors, Inc., Invesco Investment Services, Inc., The Invesco Funds, and Invesco Exchange-Traded Fund Trust, Invesco Exchange-Traded Fund Trust II, Invesco India Exchange-Traded Fund Trust, Invesco Actively Managed Exchange-Traded Fund Trust, Invesco Actively Managed Exchange-Traded Commodity Fund Trust and Invesco Exchange-Traded Self-Indexed Fund Trust; Anti-Money Laundering Compliance Officer and Bank Secrecy Act Officer, INVESCO National Trust Company and Invesco Trust Company; and Fraud Prevention Manager and Controls and Risk Analysis Manager for Invesco Investment Services, Inc. Formerly: Anti-Money Laundering Compliance Officer, Van Kampen Exchange Corp. and Invesco Management Group, Inc. | | N/A | | N/A |
| Robert R. Leveille – 1969 Chief Compliance Officer | | 2016 | | Chief Compliance Officer, Invesco Advisers, Inc. (registered investment adviser); and Chief Compliance Officer, The Invesco Funds Formerly: Chief Compliance Officer, Putnam Investments and the Putnam Funds | | N/A | | N/A |
The Statement of Additional Information of the Trust includes additional information about the Fund’s Trustees and is available upon request, without charge, by calling 1.800.959.4246. Please refer to the Fund’s Statement of Additional Information for information on the Fund’ssub-advisers.
Office of the Fund
11 Greenway Plaza, Suite 1000
Houston, TX 77046-1173
Counsel to the Fund
Stradley Ronon Stevens & Young, LLP
2005 Market Street, Suite 2600
Philadelphia, PA 19103-7018
Investment Adviser
Invesco Advisers, Inc.
1555 Peachtree Street, N.E.
Atlanta, GA 30309
Counsel to the Independent Trustees
Goodwin Procter LLP
901 New York Avenue, N.W.
Washington, D.C. 20001
Distributor
Invesco Distributors, Inc.
11 Greenway Plaza, Suite 1000
Houston, TX 77046-1173
Transfer Agent
Invesco Investment Services, Inc.
11 Greenway Plaza, Suite 1000
Houston, TX 77046-1173
Auditors
PricewaterhouseCoopers LLP
1000 Louisiana Street, Suite 5800
Houston, TX 77002-5678
Custodian
State Street Bank and Trust Company
225 Franklin Street
Boston, MA 02110-2801
T-7 Invesco Global Growth Fund
(This page intentionally left blank)

Go paperless with eDelivery
Visit invesco.com/edelivery to enjoy the convenience and security of anytime electronic access to your investment documents.
With eDelivery, you can elect to have any or all of the following materials delivered straight to your inbox to download, save and print from your own computer:
∎ Fund reports and prospectuses
∎ Quarterly statements
∎ Daily confirmations
∎ Tax forms
Invesco mailing information
Send general correspondence to Invesco Investment Services, Inc., P.O. Box 219078, Kansas City, MO 64121-9078.
Important notice regarding delivery of security holder documents
To reduce Fund expenses, only one copy of most shareholder documents may be mailed to shareholders with multiple accounts at the same address (Householding). Mailing of your shareholder documents may be householded indefinitely unless you instruct us otherwise. If you do not want the mailing of these documents to be combined with those for other members of your household, please contact Invesco Investment Services, Inc. at 800 959 4246 or contact your financial institution. We will begin sending you individual copies for each account within 30 days after receiving your request.
Fund holdings and proxy voting information
The Fund provides a complete list of its holdings four times in each fiscal year, at the quarter-ends. For the second and fourth quarters, the list appears in the Fund’s semiannual and annual reports to shareholders. For the first and third quarters, the Fund files the lists with the Securities and Exchange Commission (SEC) as an exhibit to its reports onForm N-PORT. The most recent list of portfolio holdings is available at invesco.com/completeqtrholdings. Shareholders can also look up the Fund’s FormN-PORT filings on the SEC website, sec.gov. The SEC file numbers for the Fund are shown below.
A description of the policies and procedures that the Fund uses to determine how to vote proxies relating to portfolio securities is available without charge, upon request, from our Client Services department at 800 959 4246, or at invesco.com/proxyguidelines. The information is also available on the SEC website, sec.gov.
| | |
Information regarding how the Fund voted proxies related to its portfolio securities during the most recent12-month period ended June 30 is available at invesco.com/proxysearch. This information is also available on the SEC website, sec.gov. Invesco Advisers, Inc. is an investment adviser; it provides investment advisory services to individual and institutional clients and does not sell securities. Invesco Distributors, Inc. is the US distributor for Invesco Ltd.’s retail mutual funds, exchange-traded funds and institutional money market funds. Both are wholly owned, indirect subsidiaries of Invesco Ltd. | | 
|
| | | | |
| SEC file numbers:811-06463 and033-44611 | | Invesco Distributors, Inc. | | GLG-AR-1 |
| | | | |
| | |
 | | Annual Report to Shareholders | | October 31, 2019 |
| | |
| | Invesco Global Opportunities Fund |
| | Nasdaq: | | |
| | A: IAOPX ∎ C: ICOPX ∎ R: IROPX ∎ Y: IYOPX ∎ R5: IIOPX ∎ R6: IFOPX |

Letters to Shareholders
| | |

Andrew Schlossberg | | Dear Shareholders: This annual report includes information about your Fund, including performance data and a complete list of its investments as of the close of the reporting period. Inside is a discussion of how your Fund was managed and the factors that affected its performance during the reporting period. Despite marked market volatility along the way, most global equity markets produced solid gains for the reporting period. As the reporting period unfolded in the final months of 2018, global equities were reeling from a sharpsell-off. The catalyst for thesell-off was a combination of ongoing trade concerns between the US and China, fears of a global economic slowdown and lower oil prices from a supply glut. Gains posted earlier in 2018 for global equities were erased, while US Treasury bonds, along with government and municipal bonds, rallied as investors fled to “safe haven” assets. |
At the start of 2019, global equity markets rebounded strongly buoyed by more policy from central banks and optimism about a potentialUS-China trade deal. In May,US-China trade concerns and slowing global growth led to a global equitysell-off and rally in US Treasuries. Despite the Maysell-off, domestic equity markets rallied in June in anticipation of a US Federal Reserve (the Fed) interest rate cut and closed the second quarter with modest gains. ContinuedUS-China trade worries and signs of slowing global economic growth left global equity markets largely flat for the third quarter. As the reporting period came to a close in October 2019, a raft of upbeat positive corporate earnings results and a US interest rate cut buoyed domestic equity results with some domestic indices recording record highs.
The Fed, in fact, both raised and lowered the federal funds rate during the reporting period. Given signs of a strong economy, the Fed raised rates in December 2018. In 2019, however, the Fed altered its outlook on further rate hikes leaving rates unchanged for the first half of the year. In July, the Fed lowered interest rates for the first time in 11 years. It again lowered rates in September and once again in October. As the year continues to unfold, we’ll see how the interplay of interest rates, economic data, geopolitics and a host of other factors affect US and overseas equity and fixed income markets.
Investor uncertainty and market volatility, such as we witnessed during the reporting period, are unfortunate facts of life when it comes to investing. That’s why Invesco encourages investors to work with a professional financial adviser who can stress the importance of starting to save and invest early and the importance of adhering to a disciplined investment plan. A financial adviser who knows your unique financial situation, investment goals and risk tolerance can be an invaluable partner as you seek to achieve your financial goals. He or she can offer a long-term perspective when markets are volatile and time-tested advice and guidance when your financial situation or investment goals change.
Visit our website for more information on your investments
Our website, invesco.com/us, offers a wide range of market insights and investment perspectives. On the website, you’ll find detailed information about our funds, including performance, holdings and portfolio manager commentaries. You can access information about your account by completing a simple, secure online registration. To do so, select “Log In” on the right side of the homepage, and then select “Register for Individual Account Access.”
In addition to the resources accessible on our website and through our mobile app, you can obtain timely updates to help you stay informed about the markets and the economy by connecting with Invesco on Twitter, LinkedIn or Facebook. You can access our blog at blog.invesco.us.com. Our goal is to provide you the information you want, when and where you want it.
Finally, I’m pleased to share with you Invesco’s commitment to both the Principles for Responsible Investment and to considering environmental, social and governance issues in our robust investment process. I invite you to learn more at invesco.com/esg.
Have questions?
For questions about your account, contact an Invesco client services representative at 800 959 4246.
All of us at Invesco look forward to serving your investment management needs. Thank you for investing with us.
Sincerely,

Andrew Schlossberg
Head of the Americas,
Senior Managing Director, Invesco Ltd.
2 Invesco Global Opportunities Fund
| | |

Bruce Crockett | | Dear Shareholders: Among the many important lessons I’ve learned in more than 40 years in a variety of business endeavors is the value of a trusted advocate. As independent chair of the Invesco Funds Board, I can assure you that the members of the Board are strong advocates for the interests of investors in Invesco’s mutual funds. We work hard to represent your interests through oversight of the quality of the investment management services your funds receive and other matters important to your investment, including but not limited to: ∎ Ensuring that Invesco offers a diverse lineup of mutual funds that your financial adviser can use to strive to meet your financial needs as your investment goals change over time. ∎ Monitoring how the portfolio management teams of the Invesco funds are performing in light of changing economic and market conditions. |
| ∎ | | Assessing each portfolio management team’s investment performance within the context of the investment strategy described in the fund’s prospectus. |
| ∎ | | Monitoring for potential conflicts of interests that may impact the nature of the services that your funds receive. |
We believe one of the most important services we provide our fund shareholders is the annual review of the funds’ advisory andsub-advisory contracts with Invesco Advisers and its affiliates. This review is required by the Investment Company Act of 1940 and focuses on the nature and quality of the services Invesco provides as the adviser to the Invesco funds and the reasonableness of the fees that it charges for those services. Each year, we spend months carefully reviewing information received from Invesco and a variety of independent sources, such as performance and fee data prepared by Lipper, Inc. (a subsidiary of Broadridge Financial Solutions, Inc.), an independent, third-party firm widely recognized as a leader in its field. We also meet with our independent legal counsel and other independent advisers to review and help us assess the information that we have received. Our goal is to assure that you receive quality investment management services for a reasonable fee.
I trust the measures outlined above provide assurance that you have a worthy advocate when it comes to choosing the Invesco Funds.
On behalf of the Board, we look forward to continuing to represent your interests and serving your needs.
Sincerely,

Bruce L. Crockett
Independent Chair
Invesco Funds Board of Trustees
3 Invesco Global Opportunities Fund
Management’s Discussion of Fund Performance
| | | | |
| |
Performance summary For the fiscal year ended October 31, 2019, Class A shares of Invesco Global Opportunities Fund (the Fund), at net asset value (NAV), underperformed the MSCI All Country World Index, the Fund’s broad market/style-specific benchmark. Your Fund’s long-term performance appears later in this report. | |
Fund vs. Indexes | |
Total returns, October 31, 2018 to October 31, 2019, at net asset value (NAV). Performance shown does not include applicable contingent deferred sales charges (CDSC) orfront-end sales charges, which would have reduced performance. | |
| |
Class A Shares | | | 7.90 | % |
Class C Shares | | | 7.06 | |
Class R Shares | | | 7.56 | |
Class Y Shares | | | 8.12 | |
Class R5 Shares | | | 8.12 | |
Class R6 Shares | | | 8.12 | |
MSCI All Country World Indexq (Broad Market/Style-Specific Index) | | | 12.59 | |
Lipper GlobalLarge-Cap Core Funds Index∎ (Peer Group Index) | | | 12.99 | |
| |
Source(s):qRIMES Technologies Corp.;∎Lipper Inc. | | | | |
Market conditions and your Fund
The fiscal year began with global equity markets, particularly the US, declining sharply at the end of 2018 amid rising interest rates, a flattening US Treasury yield curve, signaling a possible recession, and concerns that higher inflation could result in a more restrictive monetary policy. Investors also had concerns over the Brexit negotiations, ongoing trade tensions between the US and China, declining oil prices and fears of slowing economic growth, particularly in the eurozone.
After a relatively calm start at the beginning of 2019, global equity markets faced greater volatility in the second quarter, hampered by ongoing US and China trade issues, potential for new tariffs and slowing global economic growth. Global equity markets, particularly China, declined sharply in May 2019, ending a four-month rally. Trade and tariff issues, which were not limited to the US and China, clouded the outlook for many
global economies. Disagreement within the UK about its withdrawal from the European Union increased uncertainty for the UK and eurozone economies. Following better performance in June, most global equity markets managed modest positive returns for the second quarter of 2019, with developed markets generally outperforming emerging markets. China was an exception, declining during the second quarter.
Weakening global economic data and the ongoing US and China trade conflict contributed to higher market volatility in the third quarter of 2019. During the third quarter, data released showed slowing manufacturing activity and declining business investment, which was evidence that trade tensions were stifling economic growth across both developed and emerging markets. Global recession concerns caused a sharp equitysell-off in August 2019 as investors crowded into asset classes perceived as safe havens, including US Treasuries and gold. In September 2019, both the US Federal Reserve
and European Central Bank cut interest rates, providing a measure of support for risk assets. Growing optimism about a potential trade deal between the US and China also boosted equities in September. However, except for the US and Japan, performance in most regions declined during the third quarter. Uncertainty about the UK’s withdrawal from the European Union continued to weigh on UK and European equities, while political and trade issues affected areas of Latin America and Asia.
Global equity markets gained in October 2019 amid several positive catalysts, including a US interest rate cut, optimism surrounding US and China trade negotiations, and a raft of upbeat corporate results. The UK equity market provided a flat return during October and while domestic politics continued to dominate the region, European markets made modest gains. October was also a positive month for emerging equity markets with all regions recording gains. Despite increased market volatility, global equity indexes, in both developed and emerging markets, ended the fiscal year in positive territory.
For the fiscal year, the Fund underperformed its broad market/style-specific benchmark. The primary driver of underperformance from a sector standpoint was stock selection in energy and consumer discretionary. The sharp correction in oil prices that occurred in late 2018 caused a dampening effect on customer budgets for 2019 and, in turn, resulted in weak results industry-wide. Though oil prices had recovered some-what by the end of the fiscal year, the energy sector remained under pressure for much of the fiscal year, including the Fund’s oil services holdingsBorr Drilling,National Oilwell Varco, and Baker Hughes, all which posted declines.
During the fiscal year, security selection in the industrials sector and a lack of
| | | | |
| |
| Portfolio Composition | |
By sector | | | % of total net assets | |
| |
Financials | | | 23.14 | % |
Industrials | | | 17.52 | |
Consumer Discretionary | | | 15.26 | |
Health Care | | | 11.32 | |
Information Technology | | | 11.07 | |
Energy | | | 10.70 | |
Communication Services | | | 6.42 | |
Consumer Staples | | | 2.54 | |
Other Sectors, Each Less than 2% of Net Assets | | | 3.14 | |
Money Market Funds Plus Other Assets Less Liabilities | | | (1.11 | ) |
| | | | |
| |
| Top 10 Equity Holdings* | |
% of total net assets | |
1. Rolls-Royce Holdings PLC | | | 5.20 | % |
2. Taiwan Semiconductor Manufacturing Co., Ltd. | | | 4.36 | |
3. Texas Instruments, Inc. | | | 3.95 | |
4. Bayer AG | | | 3.85 | |
5. Tencent Holdings Ltd. | | | 3.61 | |
6. Bristol-Myers Squibb Co. | | | 3.59 | |
7. Las Vegas Sands Corp. | | | 3.53 | |
8. Melrose Industries PLC | | | 3.46 | |
9. American Express Co. | | | 3.33 | |
10. First Republic Bank | | | 3.23 | |
| | | | |
| Total Net Assets | | $ | 37.6 million | |
| Total Number of Holdings* | | | 39 | |
The Fund’s holdings are subject to change, and there is no assurance that the Fund will continue to hold any particular security.
* Excluding money market fund holdings, if any.
Data presented here are as of October 31, 2019.
4 Invesco Global Opportunities Fund
exposure to the utilities sector also dampened the Fund’s performance relative to the broad market/style-specific benchmark.
From a geographic perspective, security selection in and overweight exposure to the UK was a key detractor from the Fund’s performance relative to the broad market/style-specific benchmark for the fiscal year. Ongoing Brexit negotiations created volatility for many stocks within the country, includingThomas Cook andRolls Royce. Aeronautics and enginemanufacturer Rolls Royce underperformed amid uncertainty over a global slowdown and costs associated with the Trent 1000 engine fix. Tour operator Thomas Cook faced further headwinds from weak demand resulting in steeper discounts and reduced margins. The company ultimately liquidated in September 2019; however, we exited our position in the company prior to this event.
Security selection in and underweight exposure to the US also detracted from the Fund’s performance relative to the broad market/style-specifc benchmark during the fiscal year. This is due in large part to a lack of exposure to some of the big technology names, such as Microsoft and Apple (not Fund holdings).
At the sector level, the largest contributor to the Fund’s performance versus the broad market/style-specific benchmark for the fiscal year was security selection in financials. Specifically, banking sector holdingsStandard Chartered, Sberbank of Russiaand First Republic Bankwere key contributors.
During the fiscal year, security selection in the communication services and real estate sectors also benefited the Fund’s performance relative to the broad market/style-specific benchmark. Brazilian real estate developerEZ Tec was a key contributor. The company has managed to navigate a challenging downturn in Brazil, and it appears well-positioned to profit from its shrewd land acquisitions. However, in our view, the stock price reflected an expected earnings recovery, so we sold our position in EZ Tec during the fiscal year.
From geographic standpoint, the Fund benefited from strong performance in select emerging markets during the fiscal year, particularly Brazil, Mexico and Russia. Fund holdings in and overweight exposure to Asia also helped the Fund’s relative performance, particularly in Hong Kong, Taiwan and China.TaiwanSemiconductorwas a key individual contributor that performed well as fears over a prolonged slump in the semiconductor
cycle subsided. The company delivered better-than-expected earnings, which we believe signaled a rebound from the current chip downturn.
During the fiscal year, the Fund increased exposure to information technology (IT), purchasing Taiwan Semiconductor,Texas Instruments andSamsung. We also added positions in the industrials sector, includingRyanair andOld Dominion Freight Line. We sold a numberof our holdings including EZ Tec, Novartis, Airbus, Santander, Barclays and Telefonica Brasil, in order to fund these new purchases.
At fiscal year end, the Fund maintained overweight exposure to Europe, particularly the UK. While the US is the Fund’s largest country exposure, it is also the largest underweight exposure relative to the broad market/style-specific benchmark. The Fund held underweight exposures to IT and consumer staple sectors. The Fund’s largest overweight exposures were in the industrials, financials and energy sectors.
As always, we seek to invest in companies with sound fundamentals, good management, strong balance sheets and attractive valuations, regardless of their location. Using ourbottom-up stock approach, we continue to seek out the most attractive and compelling investment opportunities from around the world, unconstrained by limitations on market capitalization, style or sector.
We thank you for your investment in Invesco Global Opportunities Fund.
Portfolio managers:
Stephen Anness - Lead
Joe Dowling
Andrew Hall
The views and opinions expressed in management’s discussion of Fund performance are those of Invesco Advisers, Inc. These views and opinions are subject to change at any time based on factors such as market and economic conditions. These views and opinions may not be relied upon as investment advice or recommendations, or as an offer for a particular security. The information is not a complete analysis of every aspect of any market, country, industry, security or the Fund. Statements of fact are from sources considered reliable, but Invesco Advisers, Inc. makes no representation or warranty as to their completeness or accuracy. Although historical performance is no guarantee of future results, these insights may help you understand our investment management philosophy.
See important Fund and, if applicable, index disclosures later in this report.
5 Invesco Global Opportunities Fund
Your Fund’s Long-Term Performance
Results of a $10,000 Investment – Oldest Share Class(es) since Inception
Fund and index data from 8/3/12
| 1 | Source: RIMES Technologies Corp. |
Past performance cannot guarantee comparable future results.
The data shown in the chart include reinvested distributions, applicable sales charges and Fund expenses including
management fees. Index results include reinvested dividends, but they do not reflect sales charges. Performance of the peer group, if applicable, reflects fund expenses and management fees; performance
of a market index does not. Performance shown in the chart does not reflect deduction of taxes a shareholder would pay on Fund distributions or sale of Fund shares.
6 Invesco Global Opportunities Fund
| | | | |
Average Annual Total Returns | | | | |
As of 10/31/19, including maximum applicable sales charges | | | | |
|
Class A Shares | |
Inception (8/3/12) | | | 9.04 | % |
5 Years | | | 4.09 | |
1 Year | | | 1.99 | |
|
Class C Shares | |
Inception (8/3/12) | | | 9.06 | % |
5 Years | | | 4.48 | |
1 Year | | | 6.07 | |
|
Class R Shares | |
Inception (8/3/12) | | | 9.60 | % |
5 Years | | | 4.98 | |
1 Year | | | 7.56 | |
|
Class Y Shares | |
Inception (8/3/12) | | | 10.15 | % |
5 Years | | | 5.53 | |
1 Year | | | 8.12 | |
|
Class R5 Shares | |
Inception (8/3/12) | | | 10.17 | % |
5 Years | | | 5.54 | |
1 Year | | | 8.12 | |
|
Class R6 Shares | |
Inception | | | 10.17 | % |
5 Years | | | 5.54 | |
1 Year | | | 8.12 | |
Class R6 shares incepted on September 24, 2012. Performance shown prior to that date is that of Class A shares and includes the12b-1 fees applicable to Class A shares.
The performance data quoted represent past performance and cannot guarantee comparable future results; current performance may be lower or higher. Please visit invesco.com/ performance for the most recentmonth-end performance. Performance figures reflect reinvested distributions, changes in net asset value and the effect of the maximum sales charge unless otherwise stated. Performance figures do not reflect deduction of taxes a shareholder would pay on Fund distributions or sale of Fund shares. Investment return and principal value will fluctuate so that you may have a gain or loss when you sell shares.
The net annual Fund operating expense ratio set forth in the most recent Fund prospectus as of the date of this report for Class A, Class C, Class R, Class Y, Class R5 and Class R6 shares was 1.02%, 1.77%, 1.27%, 0.77%, 0.77% and 0.77%, respectively.1 The total annual Fund operating expense ratio set forth in the
| | | | |
Average Annual Total Returns | | | | |
As of 9/30/19, the most recent calendar quarter end, including maximum applicable sales charges | |
|
Class A Shares | |
Inception (8/3/12) | | | 8.57 | % |
5 Years | | | 3.76 | |
1 Year | | | –10.11 | |
|
Class C Shares | |
Inception (8/3/12) | | | 8.60 | % |
5 Years | | | 4.15 | |
1 Year | | | –6.46 | |
|
Class R Shares | |
Inception (8/3/12) | | | 9.12 | % |
5 Years | | | 4.64 | |
1 Year | | | –5.15 | |
|
Class Y Shares | |
Inception (8/3/12) | | | 9.68 | % |
5 Years | | | 5.19 | |
1 Year | | | –4.70 | |
|
Class R5 Shares | |
Inception (8/3/12) | | | 9.69 | % |
5 Years | | | 5.19 | |
1 Year | | | –4.69 | |
|
Class R6 Shares | |
Inception | | | 9.69 | % |
5 Years | | | 5.21 | |
1 Year | | | –4.63 | |
most recent Fund prospectus as of the date of this report for Class A, Class C, Class R, Class Y, Class R5 and Class R6 shares was 1.76%, 2.51%, 2.01%, 1.51%, 1.39% and 1.39%, respectively. The expense ratios presented above may vary from the expense ratios presented in other sections of this report that are based on expenses incurred during the period covered by this report.
Class A share performance reflects the maximum 5.50% sales charge, and Class C share performance reflects the applicable contingent deferred sales charge (CDSC) for the period involved. The CDSC on Class C shares is 1% for the first year after purchase. Class R, Class Y, Class R5 and Class R6 class shares do not have afront-end sales charge or a CDSC; therefore, performance is at net asset value.
The performance of the Fund’s share classes will differ primarily due to different sales charge structures and class expenses.
Fund performance reflects any applicable fee waivers and/or expense reimbursements. Had the adviser not waived fees and/or reimbursed expenses currently or in the past, returns
would have been lower. See current prospectus for more information.
| 1 | Total annual Fund operating expenses after any contractual fee waivers and/or expense reimbursements by the adviser in effect through at least February 28, 2021. See current prospectus for more information. |
7 Invesco Global Opportunities Fund
Invesco Global Opportunities Fund’s investment objective is long-term growth of capital.
| ∎ | | Unless otherwise stated, information presented in this report is as of October 31, 2019, and is based on total net assets. |
| ∎ | | Unless otherwise noted, all data provided by Invesco. |
| ∎ | | To access your Fund’s reports/prospectus, visit invesco.com/fundreports. |
About share classes
| ∎ | | Class R sharesare generally available only to employer sponsored retirement and benefit plans. Please see the prospectus for more information. |
| ∎ | | Class Y sharesare available only tocertain investors. Please see the prospectus for more information. |
| ∎ | | Class R5 sharesand Class R6 sharesare available for use by retirement plans that meet certain standards and for institutional investors. Class R6 shares are also available through intermediaries that have established an agreement with Invesco Distributors, Inc. to make such shares available for use in retail omnibus accounts. Please see the prospectus for more information. |
Principal risks of investing in the Fund
| ∎ | | Convertible securities risk. The marketvalues of convertible securities are affected by market interest rates, the risk of actual issuer default on interest or principal payments and the value of the underlying common stock into which the convertible security may be converted. Additionally, a convertible security is subject to the same types of market and issuer risks as apply to the underlying common stock. In addition, certain convertible securities are subject to involuntary conversions and may undergo principal write-downs upon the occurrence of certain triggering events, and, as a result, are subject to an increased risk of loss. Convertible securities may be rated below investment grade. |
| ∎ | | Depositary receipts risk. Investing indepositary receipts involves the same risks as direct investments in foreign securities. In addition, the underlying issuers of certain depositary receipts are under no obligation to distribute shareholder communications or pass through any voting rights with respect to the deposited securities to the holders of such receipts. The Fund may therefore receive less timely |
| | | information or have less control than if it invested directly in the foreign issuer. |
| ∎ | | Emerging markets securities risk.Emerging markets (also referred to as developing markets) are generally subject to greater market volatility, political, social and economic instability, uncertain trading markets and more governmental limitations on foreign investment than more developed markets. In addition, companies operating in emerging markets may be subject to lower trading volume and greater price fluctuations than companies in more developed markets. Securities law and the enforcement of systems of taxation in many emerging market countries may change quickly and unpredictably. In addition, investments in emerging markets securities may be subject to additional transaction costs, delays in settlement procedures, and lack of timely information. |
| ∎ | | Foreign securities risk.The Fund’sforeign investments may be adversely affected by political and social instability, changes in economic or taxation policies, difficulty in enforcing obligations, decreased liquidity or increased volatility. Foreign investments also involve the risk of the possible seizure, nationalization or expropriation of the issuer or foreign deposits (in which the Fund could lose its entire investments in a certain market) and the possible adoption of foreign governmental restrictions such as exchange controls. Unless the Fund has hedged its foreign securities risk, foreign securities risk also involves the risk of negative foreign currency rate fluctuations, which may cause the value of securities denominated in such foreign currency (or other instruments through which the Fund has exposure to foreign currencies) to decline in value. Currency exchange rates may fluctuate significantly over short periods of time. Currency hedging strategies, if used, are not always successful. |
| ∎ | | Geographic focus risk. The Fund mayfrom time to time invest a substantial amount of its assets in securities of issuers located in a single country or a limited number of countries. Adverse economic, political or social conditions in those countries may therefore have a significant negative impact on the Fund’s investment performance. |
| ∎ | | Investing in the European Union risk.Investments in certain countries in the European Union are susceptible to high economic risks associated with high levels of debt, such as investments in sovereign debt of Greece, Italy and Spain. Efforts of the member states to further unify their economic and monetary policies may increase the potential for the downward movement of one member state’s market to cause a similar effect on other member states’ markets. Separately, the European Union faces issues involving its membership, structure, procedures and policies. The exit of one or more member states from the European Union, such as the United Kingdom (UK) which has announced its intention to exit, would place its currency and banking system in jeopardy. The exit by the UK or other member states will likely result in increased volatility, illiquidity and potentially lower economic growth in the affected markets, which will adversely affect the Fund’s investments. |
| ∎ | | Management risk. The Fund is activelymanaged and depends heavily on the Adviser’s judgment about markets, interest rates or the attractiveness, relative values, liquidity, or potential appreciation of particular investments made for the Fund’s portfolio. The Fund could experience losses if these judgments prove to be incorrect. Additionally, legislative, regulatory, or tax developments may adversely affect management of the Fund and, therefore, the ability of the Fund to achieve its investment objective. |
| ∎ | | Market risk.The market values of theFund’s investments, and therefore the value of the Fund’s shares, will go up |
|
This report must be accompanied or preceded by a currently effective Fund prospectus, which contains more complete information, including sales charges and expenses. Investors should read it carefully before investing. |
NOT FDIC INSURED | MAY LOSE VALUE | NO BANK GUARANTEE |
8 Invesco Global Opportunities Fund
| | and down, sometimes rapidly or unpredictably. Market risk may affect a single issuer, industry or section of the economy, or it may affect the market as a whole. Individual stock prices tend to go up and down more dramatically than those of certain other types of investments, such as bonds. During a general downturn in the financial markets, multiple asset classes may decline in value. When markets perform well, there can be no assurance that specific investments held by the Fund will rise in value. |
| ∎ | | Preferred securities risk. Preferredsecurities are subject to issuer-specific and market risks applicable generally to equity securities. Preferred securities also may be subordinated to bonds or other debt instruments, subjecting them to a greater risk ofnon-payment, may be less liquid than many other securities, such as common stocks, and generally offer no voting rights with respect to the issuer. |
| ∎ | | Sector focus risk. The Fund may fromtime to time invest a significant amount of its assets (i.e. over 25%) in one market sector or group of related industries. In this event, the Fund’s performance will depend to a greater extent on the overall condition of the sector or group of industries and there is increased risk that the Fund will lose significant value if conditions adversely affect that sector or group of industries. |
| ∎ | | Small- andmid-capitalization companies risks. Small- andmid-capitalization companies tend to be more vulnerable to changing market conditions, may have little or no operating history or track record of success, and may have more limited product lines and markets, less experienced management and fewer financial resources than larger companies. These companies’ securities may be more volatile and less liquid than those of more established companies, and their returns may vary, sometimes significantly, from the overall securities market. |
| ∎ | | Warrants Risk. Warrants may be significantly less valuable or worthless on their expiration date and may also be postponed or terminated early, resulting in a partial or total loss. Warrants may also be illiquid. |
About indexes used in this report
| ∎ | | TheMSCI All Country World Index is an unmanaged index considered representative |
| | | of large- andmid-cap stocks across developed and emerging markets. The index is computed using the net return, which withholds applicable taxes fornon-resident investors. |
| ∎ | | TheLipper GlobalLarge-Cap CoreFunds Indexis an unmanaged indexconsidered representative of globallarge-cap core funds tracked by Lipper. |
| ∎ | | The Fund is not managed to track the performance of any particular index, including the index(es) described here, and consequently, the performance of the Fund may deviate significantly from the performance of the index(es). |
| ∎ | | A direct investment cannot be made in an index. Unless otherwise indicated, index results include reinvested dividends, and they do not reflect sales charges. Performance of the peer group, if applicable, reflects fund expenses; performance of a market index does not. |
Other information
| ∎ | | The returns shown in management’s discussion of Fund performance are based on net asset values (NAVs) calculated for shareholder transactions. Generally accepted accounting principles require adjustments to be made to the net assets of the Fund at period end for financial reporting purposes, and as such, the NAVs for shareholder transactions and the returns based on those NAVs may differ from the NAVs and returns reported in the Financial Highlights. |
| ∎ | | Industry classifications used in this report are generally according to the Global Industry Classification Standard, which was developed by and is the exclusive property and a service mark of MSCI Inc. and Standard & Poor’s. |
9 Invesco Global Opportunities Fund
Schedule of Investments
October 31, 2019
| | | | | | | | |
| | | Shares | | | Value | |
Common Stocks & Other Equity Interests–101.11% | |
|
Brazil–2.22% | |
Itau Unibanco Holding S.A., Preference Shares | | | 92,400 | | | $ | 834,723 | |
| | |
Canada–1.75% | | | | | | | | |
| | |
Canadian Natural Resources Ltd. | | | 26,132 | | | | 658,905 | |
| | |
China–6.42% | | | | | | | | |
| | |
NetEase, Inc., ADR | | | 3,697 | | | | 1,056,824 | |
Tencent Holdings Ltd. | | | 33,300 | | | | 1,357,894 | |
| | | | | | | | 2,414,718 | |
| | |
Germany–7.05% | | | | | | | | |
| | |
Bayer AG | | | 18,687 | | | | 1,449,823 | |
Volkswagen AG, Preference Shares | | | 6,322 | | | | 1,203,606 | |
| | | | | | | | 2,653,429 | |
| | |
Hong Kong–2.96% | | | | | | | | |
| | |
Standard Chartered PLC | | | 122,164 | | | | 1,113,270 | |
| | |
Ireland–2.80% | | | | | | | | |
| | |
Ryanair Holdings PLC, ADR(a) | | | 14,136 | | | | 1,055,111 | |
| | |
Japan–1.98% | | | | | | | | |
| | |
Sony Corp. | | | 12,200 | | | | 743,383 | |
| | |
Mexico–1.62% | | | | | | | | |
| | |
Fibra Uno Administracion S.A. de C.V. | | | 401,600 | | | | 610,025 | |
| | |
Russia–2.58% | | | | | | | | |
| | |
Sberbank of Russia PJSC, ADR | | | 65,984 | | | | 970,130 | |
| | |
South Korea–2.76% | | | | | | | | |
| | |
Samsung Electronics Co., Ltd. | | | 24,017 | | | | 1,038,041 | |
| | |
Spain–1.97% | | | | | | | | |
| | |
Industria de Diseno Textil, S.A. | | | 23,651 | | | | 739,378 | |
| | |
Sweden–1.67% | | | | | | | | |
| | |
Autoliv, Inc. | | | 8,068 | | | | 628,013 | |
| | |
Switzerland–1.78% | | | | | | | | |
| | |
Roche Holding AG | | | 2,223 | | | | 670,479 | |
| | | | | | | | |
| | | Shares | | | Value | |
Taiwan–4.36% | | | | | | | | |
| | |
Taiwan Semiconductor Manufacturing Co., Ltd. | | | 169,000 | | | $ | 1,641,882 | |
| | |
United Arab Emirates–1.00% | | | | | | | | |
| | |
Borr Drilling Ltd.(a) | | | 55,426 | | | | 376,276 | |
| | |
United Kingdom–15.80% | | | | | | | | |
| | |
Essentra PLC | | | 115,606 | | | | 571,478 | |
Melrose Industries PLC | | | 470,747 | | | | 1,300,141 | |
Rolls-Royce Holdings PLC(a) | | | 212,714 | | | | 1,954,191 | |
Rolls-Royce Holdings PLC,
Class C(a) | | | 9,404,148 | | | | 12,182 | |
Royal Dutch Shell PLC, Class A | | | 39,613 | | | | 1,148,489 | |
Tesco PLC | | | 313,551 | | | | 957,020 | |
| | | | | | | | 5,943,501 | |
|
United States–42.39% | |
| | |
A.O. Smith Corp. | | | 14,994 | | | | 744,902 | |
Agilent Technologies, Inc. | | | 10,401 | | | | 787,876 | |
American Express Co. | | | 10,685 | | | | 1,253,137 | |
Baker Hughes Co. | | | 49,122 | | | | 1,051,211 | |
Berkshire Hathaway, Inc., Class B(a) | | | 3,491 | | | | 742,117 | |
Booking Holdings, Inc.(a) | | | 536 | | | | 1,098,141 | |
Bristol-Myers Squibb Co. | | | 23,528 | | | | 1,349,801 | |
Citigroup, Inc. | | | 15,098 | | | | 1,084,942 | |
First Republic Bank | | | 11,406 | | | | 1,213,142 | |
JPMorgan Chase & Co. | | | 5,820 | | | | 727,034 | |
Las Vegas Sands Corp. | | | 21,480 | | | | 1,328,323 | |
Markel Corp.(a) | | | 655 | | | | 767,005 | |
National Oilwell Varco, Inc. | | | 34,941 | | | | 790,366 | |
Old Dominion Freight Line, Inc. | | | 4,495 | | | | 818,450 | |
Texas Instruments, Inc. | | | 12,577 | | | | 1,483,960 | |
United Technologies Corp. | | | 4,923 | | | | 706,844 | |
| | | | | | | | 15,947,251 | |
TOTAL INVESTMENTS IN SECURITIES–101.11% | |
(Cost $36,507,267) | | | | 38,038,515 | |
OTHER ASSETS LESS LIABILITIES–(1.11)% | | | | (417,592 | ) |
NET ASSETS–100.00% | | | | | | $ | 37,620,923 | |
Investment Abbreviations:
| | |
| ADR | | – American Depositary Receipt |
Notes to Schedule of Investments:
| (a) | Non-income producing security. |
See accompanying Notes to Financial Statements which are an integral part of the financial statements.
10 Invesco Global Opportunities Fund
Statement of Assets and Liabilities
October 31, 2019
| | | | |
Assets: | | | | |
| |
Investments in securities, at value
(Cost $36,507,267) | | $ | 38,038,515 | |
Foreign currencies, at value
(Cost $478,067) | | | 486,094 | |
Receivable for: | | | | |
Investments sold | | | 228,027 | |
Dividends | | | 109,622 | |
Fund expenses absorbed | | | 35,633 | |
Fund shares sold | | | 34,421 | |
Investment for trustee deferred compensation and retirement plans | | | 20,640 | |
Other assets | | | 32,403 | |
Total assets | | | 38,985,355 | |
| |
Liabilities: | | | | |
| |
Payable for: | | | | |
Investments purchased | | | 241,010 | |
Fund shares reacquired | | | 31,677 | |
Amount due custodian | | | 989,917 | |
Accrued fees to affiliates | | | 27,921 | |
Accrued trustees’ and officers’ fees and benefits | | | 1,307 | |
Accrued other operating expenses | | | 51,780 | |
Trustee deferred compensation and retirement plans | | | 20,820 | |
Total liabilities | | | 1,364,432 | |
Net assets applicable to shares outstanding | | $ | 37,620,923 | |
| |
Net assets consist of: | | | | |
| |
Shares of beneficial interest | | $ | 41,851,343 | |
Distributable earnings (loss) | | | (4,230,420 | ) |
| | | $ | 37,620,923 | |
| |
Net Assets: | | | | |
| |
Class A | | $ | 26,543,365 | |
Class C | | $ | 4,336,743 | |
Class R | | $ | 1,475,459 | |
Class Y | | $ | 5,130,181 | |
Class R5 | | $ | 14,624 | |
Class R6 | | $ | 120,551 | |
| | | | |
Shares outstanding, no par value, with an unlimited number of shares authorized: | |
| |
Class A | | | 1,826,008 | |
Class C | | | 305,635 | |
Class R | | | 102,345 | |
Class Y | | | 351,381 | |
Class R5 | | | 1,001 | |
Class R6 | | | 8,252 | |
Class A: | | | | |
Net asset value per share | | $ | 14.54 | |
Maximum offering price per share
(Net asset value of $14.54 ÷ 94.50%) | | $ | 15.39 | |
Class C: | | | | |
Net asset value and offering price per share | | $ | 14.19 | |
Class R: | | | | |
Net asset value and offering price per share | | $ | 14.42 | |
Class Y: | | | | |
Net asset value and offering price per share | | $ | 14.60 | |
Class R5: | | | | |
Net asset value and offering price per share | | $ | 14.61 | |
Class R6: | | | | |
Net asset value and offering price per share | | $ | 14.61 | |
See accompanying Notes to Financial Statements which are an integral part of the financial statements.
11 Invesco Global Opportunities Fund
Statement of Operations
For the year ended October 31, 2019
| | | | |
Investment income: | | | | |
| |
Dividends (net of foreign withholding taxes of $83,946) | | $ | 1,034,191 | |
| |
| |
Expenses: | | | | |
| |
Advisory fees | | | 302,305 | |
| |
| |
Administrative services fees | | | 12,765 | |
| |
| |
Custodian fees | | | 61,028 | |
| |
Distribution fees: | | | | |
Class A | | | 65,713 | |
| |
Class C | | | 48,979 | |
| |
Class R | | | 5,760 | |
| |
Transfer agent fees – A, C, R and Y | | | 98,142 | |
| |
Transfer agent fees – R5 | | | 9 | |
| |
Transfer agent fees – R6 | | | 68 | |
| |
Trustees’ and officers’ fees and benefits | | | 20,075 | |
| |
Registration and filing fees | | | 83,105 | |
| |
Reports to shareholders | | | 19,074 | |
| |
Professional services fees | | | 51,669 | |
| |
Other | | | 10,853 | |
| |
Total expenses | | | 779,545 | |
| |
Less: Fees waived, expenses reimbursed and/or expense offset arrangement(s) | | | (368,361 | ) |
| |
Net expenses | | | 411,184 | |
| |
Net investment income | | | 623,007 | |
| |
| |
Realized and unrealized gain (loss) from: | | | | |
Net realized gain (loss) from: | | | | |
Investment securities | | | (3,880,146 | ) |
| |
Foreign currencies | | | (50,419 | ) |
| |
| | | (3,930,565 | ) |
| |
Change in net unrealized appreciation of: | | | | |
Investment securities | | | 6,025,398 | |
| |
Foreign currencies | | | 16,276 | |
| |
| | | 6,041,674 | |
| |
Net realized and unrealized gain | | | 2,111,109 | |
| |
Net increase in net assets resulting from operations | | $ | 2,734,116 | |
| |
See accompanying Notes to Financial Statements which are an integral part of the financial statements.
12 Invesco Global Opportunities Fund
Statement of Changes in Net Assets
For the years ended October 31, 2019 and 2018
| | | | | | | | |
| | | 2019 | | | 2018 | |
Operations: | | | | | | | | |
Net investment income | | $ | 623,007 | | | $ | 925,828 | |
| |
Net realized gain (loss) | | | (3,930,565 | ) | | | 277,957 | |
| |
Change in net unrealized appreciation (depreciation) | | | 6,041,674 | | | | (9,360,325 | ) |
| |
Net increase (decrease) in net assets resulting from operations | | | 2,734,116 | | | | (8,156,540 | ) |
| |
| | |
Distributions to shareholders from distributable earnings: | | | | | | | | |
Class A | | | (1,953,842 | ) | | | (172,545 | ) |
| |
Class C | | | (432,496 | ) | | | (22,203 | ) |
| |
Class R | | | (70,652 | ) | | | (4,133 | ) |
| |
Class Y | | | (482,207 | ) | | | (173,633 | ) |
| |
Class R5 | | | (1,134 | ) | | | (161 | ) |
| |
Class R6 | | | (9,961 | ) | | | (149 | ) |
| |
Total distributions from distributable earnings | | | (2,950,292 | ) | | | (372,824 | ) |
| |
| | |
Share transactions–net: | | | | | | | | |
Class A | | | (208,421 | ) | | | 11,126,137 | |
| |
Class C | | | (2,055,435 | ) | | | 2,032,934 | |
| |
Class R | | | 489,318 | | | | 584,526 | |
| |
Class Y | | | (3,393,480 | ) | | | 9,688,955 | |
| |
Class R6 | | | 67,076 | | | | 47,349 | |
| |
Net increase (decrease) in net assets resulting from share transactions | | | (5,100,942 | ) | | | 23,479,901 | |
| |
Net increase (decrease) in net assets | | | (5,317,118 | ) | | | 14,950,537 | |
| |
| | |
Net assets: | | | | | | | | |
Beginning of year | | | 42,938,041 | | | | 27,987,504 | |
| |
End of year | | $ | 37,620,923 | | | $ | 42,938,041 | |
| |
See accompanying Notes to Financial Statements which are an integral part of the financial statements.
13 Invesco Global Opportunities Fund
Financial Highlights
The following schedule presents financial highlights for a share of the Fund outstanding throughout the periods indicated.
| | | | | | | | | | | | | | | | | | | | | | | | | | | | | | | | | | | | | | | | | | | | | | | | | | | | | | | | |
| | | Net asset
value,
beginning
of period | | | Net
investment
income
(loss)(a) | | | Net gains
(losses)
on securities
(both
realized and
unrealized) | | | Total from
investment
operations | | | Dividends
from net
investment
income | | | Distributions
from net
realized
gains | | | Total
distributions | | | Net asset
value, end
of period | | | Total
return(b) | | | Net assets,
end of period
(000’s omitted) | | | Ratio of
expenses
to average
net assets
with fee waivers
and/or
expenses
absorbed | | | Ratio of
expenses
to average net
assets without
fee waivers
and/or
expenses
absorbed | | | Ratio
of net
investment
income
(loss)
to average
net assets | | | Portfolio
turnover(c) | |
Class A | | | | | | | | | | | | | | | | | | | | | | | | | | | | | | | | | | | | | | | | | | | | | | | | | | | | | | | | |
Year ended 10/31/19 | | $ | 14.65 | | | $ | 0.24 | | | $ | 0.75 | | | $ | 0.99 | | | $ | (0.28 | ) | | $ | (0.82 | ) | | $ | (1.10 | ) | | $ | 14.54 | | | | 7.90 | % | | $ | 26,543 | | | | 1.02 | %(d) | | | 1.99 | %(d) | | | 1.72 | %(d) | | | 45 | % |
Year ended 10/31/18 | | | 16.57 | | | | 0.25 | | | | (2.04 | ) | | | (1.79 | ) | | | (0.11 | ) | | | (0.02 | ) | | | (0.13 | ) | | | 14.65 | | | | (10.88 | ) | | | 26,811 | | | | 1.02 | | | | 1.76 | | | | 1.50 | | | | 92 | |
Year ended 10/31/17 | | | 12.77 | | | | 0.13 | | | | 3.84 | | | | 3.97 | | | | (0.17 | ) | | | – | | | | (0.17 | ) | | | 16.57 | | | | 31.42 | | | | 19,643 | | | | 1.07 | | | | 2.69 | | | | 0.90 | | | | 33 | |
Year ended 10/31/16 | | | 13.13 | | | | 0.09 | | | | (0.04 | ) | | | 0.05 | | | | (0.02 | ) | | | (0.39 | ) | | | (0.41 | ) | | | 12.77 | | | | 0.57 | | | | 11,455 | | | | 1.36 | | | | 2.77 | | | | 0.72 | | | | 52 | |
Year ended 10/31/15 | | | 14.74 | | | | 0.06 | | | | 0.11 | | | | 0.17 | | | | (0.22 | ) | | | (1.56 | ) | | | (1.78 | ) | | | 13.13 | | | | 1.76 | | | | 12,405 | | | | 1.36 | | | | 2.94 | | | | 0.43 | | | | 71 | |
Class C | | | | | | | | | | | | | | | | | | | | | | | | | | | | | | | | | | | | | | | | | | | | | | | | | | | | | | | | |
Year ended 10/31/19 | | | 14.30 | | | | 0.13 | | | | 0.73 | | | | 0.86 | | | | (0.15 | ) | | | (0.82 | ) | | | (0.97 | ) | | | 14.19 | | | | 7.06 | | | | 4,337 | | | | 1.77 | (d) | | | 2.74 | (d) | | | 0.97 | (d) | | | 45 | |
Year ended 10/31/18 | | | 16.22 | | | | 0.12 | | | | (1.98 | ) | | | (1.86 | ) | | | (0.04 | ) | | | (0.02 | ) | | | (0.06 | ) | | | 14.30 | | | | (11.51 | ) | | | 6,531 | | | | 1.77 | | | | 2.51 | | | | 0.75 | | | | 92 | |
Year ended 10/31/17 | | | 12.51 | | | | 0.02 | | | | 3.76 | | | | 3.78 | | | | (0.07 | ) | | | – | | | | (0.07 | ) | | | 16.22 | | | | 30.38 | | | | 5,476 | | | | 1.82 | | | | 3.44 | | | | 0.15 | | | | 33 | |
Year ended 10/31/16 | | | 12.93 | | | | (0.00 | ) | | | (0.03 | ) | | | (0.03 | ) | | | – | | | | (0.39 | ) | | | (0.39 | ) | | | 12.51 | | | | (0.08 | ) | | | 2,753 | | | | 2.11 | | | | 3.52 | | | | (0.03 | ) | | | 52 | |
Year ended 10/31/15 | | | 14.51 | | | | (0.04 | ) | | | 0.10 | | | | 0.06 | | | | (0.08 | ) | | | (1.56 | ) | | | (1.64 | ) | | | 12.93 | | | | 0.86 | | | | 2,967 | | | | 2.11 | | | | 3.69 | | | | (0.32 | ) | | | 71 | |
Class R | | | | | | | | | | | | | | | | | | | | | | | | | | | | | | | | | | | | | | | | | | | | | | | | | | | | | | | | |
Year ended 10/31/19 | | | 14.54 | | | | 0.20 | | | | 0.74 | | | | 0.94 | | | | (0.24 | ) | | | (0.82 | ) | | | (1.06 | ) | | | 14.42 | | | | 7.56 | | | | 1,475 | | | | 1.27 | (d) | | | 2.24 | (d) | | | 1.47 | (d) | | | 45 | |
Year ended 10/31/18 | | | 16.46 | | | | 0.21 | | | | (2.02 | ) | | | (1.81 | ) | | | (0.09 | ) | | | (0.02 | ) | | | (0.11 | ) | | | 14.54 | | | | (11.08 | ) | | | 950 | | | | 1.27 | | | | 2.01 | | | | 1.25 | | | | 92 | |
Year ended 10/31/17 | | | 12.69 | | | | 0.10 | | | | 3.81 | | | | 3.91 | | | | (0.14 | ) | | | – | | | | (0.14 | ) | | | 16.46 | | | | 31.06 | | | | 513 | | | | 1.32 | | | | 2.94 | | | | 0.65 | | | | 33 | |
Year ended 10/31/16 | | | 13.05 | | | | 0.06 | | | | (0.03 | ) | | | 0.03 | | | | – | | | | (0.39 | ) | | | (0.39 | ) | | | 12.69 | | | | 0.40 | | | | 261 | | | | 1.61 | | | | 3.02 | | | | 0.47 | | | | 52 | |
Year ended 10/31/15 | | | 14.67 | | | | 0.02 | | | | 0.09 | | | | 0.11 | | | | (0.17 | ) | | | (1.56 | ) | | | (1.73 | ) | | | 13.05 | | | | 1.31 | | | | 218 | | | | 1.61 | | | | 3.19 | | | | 0.18 | | | | 71 | |
Class Y | | | | | | | | | | | | | | | | | | | | | | | | | | | | | | | | | | | | | | | | | | | | | | | | | | | | | | | | |
Year ended 10/31/19 | | | 14.72 | | | | 0.27 | | | | 0.75 | | | | 1.02 | | | | (0.32 | ) | | | (0.82 | ) | | | (1.14 | ) | | | 14.60 | | | | 8.12 | | | | 5,130 | | | | 0.77 | (d) | | | 1.74 | (d) | | | 1.97 | (d) | | | 45 | |
Year ended 10/31/18 | | | 16.63 | | | | 0.30 | | | | (2.05 | ) | | | (1.75 | ) | | | (0.14 | ) | | | (0.02 | ) | | | (0.16 | ) | | | 14.72 | | | | (10.63 | ) | | | 8,579 | | | | 0.77 | | | | 1.51 | | | | 1.75 | | | | 92 | |
Year ended 10/31/17 | | | 12.82 | | | | 0.17 | | | | 3.85 | | | | 4.02 | | | | (0.21 | ) | | | – | | | | (0.21 | ) | | | 16.63 | | | | 31.71 | | | | 2,323 | | | | 0.82 | | | | 2.44 | | | | 1.15 | | | | 33 | |
Year ended 10/31/16 | | | 13.17 | | | | 0.12 | | | | (0.03 | ) | | | 0.09 | | | | (0.05 | ) | | | (0.39 | ) | | | (0.44 | ) | | | 12.82 | | | | 0.90 | | | | 449 | | | | 1.11 | | | | 2.52 | | | | 0.97 | | | | 52 | |
Year ended 10/31/15 | | | 14.81 | | | | 0.09 | | | | 0.09 | | | | 0.18 | | | | (0.26 | ) | | | (1.56 | ) | | | (1.82 | ) | | | 13.17 | | | | 1.90 | | | | 4,681 | | | | 1.11 | | | | 2.69 | | | | 0.68 | | | | 71 | |
Class R5 | | | | | | | | | | | | | | | | | | | | | | | | | | | | | | | | | | | | | | | | | | | | | | | | | | | | | | | | |
Year ended 10/31/19 | | | 14.73 | | | | 0.27 | | | | 0.75 | | | | 1.02 | | | | (0.32 | ) | | | (0.82 | ) | | | (1.14 | ) | | | 14.61 | | | | 8.12 | | | | 15 | | | | 0.77 | (d) | | | 1.55 | (d) | | | 1.97 | (d) | | | 45 | |
Year ended 10/31/18 | | | 16.64 | | | | 0.30 | | | | (2.05 | ) | | | (1.75 | ) | | | (0.14 | ) | | | (0.02 | ) | | | (0.16 | ) | | | 14.73 | | | | (10.62 | ) | | | 15 | | | | 0.77 | | | | 1.39 | | | | 1.75 | | | | 92 | |
Year ended 10/31/17 | | | 12.83 | | | | 0.17 | | | | 3.85 | | | | 4.02 | | | | (0.21 | ) | | | – | | | | (0.21 | ) | | | 16.64 | | | | 31.68 | | | | 17 | | | | 0.82 | | | | 2.24 | | | | 1.15 | | | | 33 | |
Year ended 10/31/16 | | | 13.18 | | | | 0.12 | | | | (0.03 | ) | | | 0.09 | | | | (0.05 | ) | | | (0.39 | ) | | | (0.44 | ) | | | 12.83 | | | | 0.91 | | | | 13 | | | | 1.11 | | | | 2.28 | | | | 0.97 | | | | 52 | |
Year ended 10/31/15 | | | 14.81 | | | | 0.09 | | | | 0.10 | | | | 0.19 | | | | (0.26 | ) | | | (1.56 | ) | | | (1.82 | ) | | | 13.18 | | | | 1.97 | | | | 13 | | | | 1.11 | | | | 2.45 | | | | 0.68 | | | | 71 | |
Class R6 | | | | | | | | | | | | | | | | | | | | | | | | | | | | | | | | | | | | | | | | | | | | | | | | | | | | | | | | |
Year ended 10/31/19 | | | 14.73 | | | | 0.27 | | | | 0.75 | | | | 1.02 | | | | (0.32 | ) | | | (0.82 | ) | | | (1.14 | ) | | | 14.61 | | | | 8.12 | | | | 121 | | | | 0.77 | (d) | | | 1.55 | (d) | | | 1.97 | (d) | | | 45 | |
Year ended 10/31/18 | | | 16.63 | | | | 0.29 | | | | (2.03 | ) | | | (1.74 | ) | | | (0.14 | ) | | | (0.02 | ) | | | (0.16 | ) | | | 14.73 | | | | (10.57 | ) | | | 52 | | | | 0.77 | | | | 1.39 | | | | 1.75 | | | | 92 | |
Year ended 10/31/17 | | | 12.82 | | | | 0.17 | | | | 3.85 | | | | 4.02 | | | | (0.21 | ) | | | – | | | | (0.21 | ) | | | 16.63 | | | | 31.71 | | | | 15 | | | | 0.82 | | | | 2.24 | | | | 1.15 | | | | 33 | |
Year ended 10/31/16 | | | 13.17 | | | | 0.12 | | | | (0.03 | ) | | | 0.09 | | | | (0.05 | ) | | | (0.39 | ) | | | (0.44 | ) | | | 12.82 | | | | 0.90 | | | | 12 | | | | 1.11 | | | | 2.28 | | | | 0.97 | | | | 52 | |
Year ended 10/31/15 | | | 14.81 | | | | 0.09 | | | | 0.09 | | | | 0.18 | | | | (0.26 | ) | | | (1.56 | ) | | | (1.82 | ) | | | 13.17 | | | | 1.89 | | | | 12 | | | | 1.11 | | | | 2.45 | | | | 0.68 | | | | 71 | |
| (a) | Calculated using average shares outstanding. |
| (b) | Includes adjustments in accordance with accounting principles generally accepted in the United States of America and as such, the net asset value for financial reporting purposes and the returns based upon those net asset values may differ from the net asset value and returns for shareholder transactions. Does not include sales charges and is not annualized for periods less than one year, if applicable. |
| (c) | Portfolio turnover is calculated at the fund level and is not annualized for periods less than one year, if applicable. |
| (d) | Ratios are based on average daily net assets (000’s omitted) of $26,285, $4,898, $1,152, $5,334, $14 and $105 for Class A, Class C, Class R, Class Y, Class R5 and Class R6 shares, respectively. |
See accompanying Notes to Financial Statements which are an integral part of the financial statements.
14 Invesco Global Opportunities Fund
Notes to Financial Statements
October 31, 2019
NOTE 1–Significant Accounting Policies
Invesco Global Opportunities Fund (the “Fund”) is a series portfolio of AIM International Mutual Funds (Invesco International Mutual Funds) (the “Trust”). The Trust is a Delaware statutory trust registered under the Investment Company Act of 1940, as amended (the “1940 Act”), as anopen-end series management investment company authorized to issue an unlimited number of shares of beneficial interest. Information presented in these financial statements pertains only to the Fund. Matters affecting the Fund or each class will be voted on exclusively by the shareholders of the Fund or each class.
The Fund’s investment objective is long-term growth of capital.
The Fund currently consists of six different classes of shares: Class A, Class C, Class R, Class Y, Class R5 and Class R6. Class Y shares are available only to certain investors. Class A shares are sold with afront-end sales charge unless certain waiver criteria are met. Under certain circumstances, load waived shares may be subject to contingent deferred sales charges (“CDSC”). Class C shares are sold with a CDSC. Class R, Class Y, Class R5 and Class R6 shares are sold at net asset value. Class C shares held for ten years after purchase are eligible for automatic conversion into Class A shares of the same Fund (the “Conversion Feature”). The automatic conversion pursuant to the Conversion Feature will generally occur at the end of the month following the tenth anniversary after a purchase of Class C shares.
The Fund is an investment company and accordingly follows the investment company accounting and reporting guidance in accordance with Financial Accounting Standards Board Accounting Standards Codification Topic 946,Financial Services – Investment Companies.
The following is a summary of the significant accounting policies followed by the Fund in the preparation of its financial statements.
| A. | Security Valuations– Securities, including restricted securities, are valued according to the following policy. |
A security listed or traded on an exchange (except convertible securities) is valued at its last sales price or official closing price as of the close of the customary trading session on the exchange where the security is principally traded, or lacking any sales or official closing price on a particular day, the security may be valued at the closing bid price on that day. Securities traded in theover-the-counter market are valued based on prices furnished by independent pricing services or market makers. When such securities are valued by an independent pricing service they may be considered fair valued. Futures contracts are valued at the final settlement price set by an exchange on which they are principally traded. Listed options are valued at the mean between the last bid and asked prices from the exchange on which they are principally traded. Options not listed on an exchange are valued by an independent source at the mean between the last bid and asked prices. For purposes of determining net asset value (“NAV”) per share, futures and option contracts generally are valued 15 minutes after the close of the customary trading session of the New York Stock Exchange (“NYSE”).
Investments inopen-end andclosed-end registered investment companies that do not trade on an exchange are valued at theend-of-day net asset value per share. Investments inopen-end andclosed-end registered investment companies that trade on an exchange are valued at the last sales price or official closing price as of the close of the customary trading session on the exchange where the security is principally traded.
Debt obligations (including convertible securities) and unlisted equities are fair valued using an evaluated quote provided by an independent pricing service. Evaluated quotes provided by the pricing service may be determined without exclusive reliance on quoted prices, and may reflect appropriate factors such asinstitution-size trading in similar groups of securities, developments related to specific securities, dividend rate (for unlisted equities), yield (for debt obligations), quality, type of issue, coupon rate (for debt obligations), maturity (for debt obligations), individual trading characteristics and other market data. Pricing services generally value debt obligations assuming orderly transactions of institutional round lot size, but a fund may hold or transact in the same securities in smaller, odd lot sizes. Odd lots often trade at lower prices than institutional round lots. Debt obligations are subject to interest rate and credit risks. In addition, all debt obligations involve some risk of default with respect to interest and/or principal payments.
Foreign securities’ (including foreign exchange contracts) prices are converted into U.S. dollar amounts using the applicable exchange rates as of the close of the NYSE. If market quotations are available and reliable for foreign exchange-traded equity securities, the securities will be valued at the market quotations. Because trading hours for certain foreign securities end before the close of the NYSE, closing market quotations may become unreliable. If between the time trading ends on a particular security and the close of the customary trading session on the NYSE, events occur that the investment adviser determines are significant and make the closing price unreliable, the Fund may fair value the security. If the event is likely to have affected the closing price of the security, the security will be valued at fair value in good faith using procedures approved by the Board of Trustees. Adjustments to closing prices to reflect fair value may also be based on a screening process of an independent pricing service to indicate the degree of certainty, based on historical data, that the closing price in the principal market where a foreign security trades is not the current value as of the close of the NYSE. Foreign securities’ prices meeting the approved degree of certainty that the price is not reflective of current value will be priced at the indication of fair value from the independent pricing service. Multiple factors may be considered by the independent pricing service in determining adjustments to reflect fair value and may include information relating to sector indices, American Depositary Receipts and domestic and foreign index futures. Foreign securities may have additional risks including exchange rate changes, potential for sharply devalued currencies and high inflation, political and economic upheaval, the relative lack of issuer information, relatively low market liquidity and the potential lack of strict financial and accounting controls and standards.
Securities for which market prices are not provided by any of the above methods may be valued based upon quotes furnished by independent sources. The last bid price may be used to value equity securities. The mean between the last bid and asked prices is used to value debt obligations, including corporate loans.
Securities for which market quotations are not readily available or became unreliable are valued at fair value as determined in good faith by or under the supervision of the Trust’s officers following procedures approved by the Board of Trustees. Issuer specific events, market trends, bid/asked quotes of brokers and information providers and other market data may be reviewed in the course of making a good faith determination of a security’s fair value.
The Fund may invest in securities that are subject to interest rate risk, meaning the risk that the prices will generally fall as interest rates rise and, conversely, the prices will generally rise as interest rates fall. Specific securities differ in their sensitivity to changes in interest rates
15 Invesco Global Opportunities Fund
| | depending on their individual characteristics. Changes in interest rates may result in increased market volatility, which may affect the value and/or liquidity of certain Fund investments. |
Valuations change in response to many factors including the historical and prospective earnings of the issuer, the value of the issuer’s assets, general economic conditions, interest rates, investor perceptions and market liquidity. Because of the inherent uncertainties of valuation, the values reflected in the financial statements may materially differ from the value received upon actual sale of those investments.
| B. | Securities Transactions and Investment Income– Securities transactions are accounted for on a trade date basis. Realized gains orlosses on sales are computed on the basis of specific identification of the securities sold. Interest income (net of withholding tax, if any) is recorded on the accrual basis from settlement date. Dividend income (net of withholding tax, if any) is recorded on theex-dividend date. |
The Fund may periodically participate in litigation related to Fund investments. As such, the Fund may receive proceeds from litigation settlements. Any proceeds received are included in the Statement of Operations as realized gain (loss) for investments no longer held and as unrealized gain (loss) for investments still held.
Brokerage commissions and mark ups are considered transaction costs and are recorded as an increase to the cost basis of securities purchased and/or a reduction of proceeds on a sale of securities. Such transaction costs are included in the determination of net realized and unrealized gain (loss) from investment securities reported in the Statement of Operations and the Statement of Changes in Net Assets and the net realized and unrealized gains (losses) on securities per share in the Financial Highlights. Transaction costs are included in the calculation of the Fund’s net asset value and, accordingly, they reduce the Fund’s total returns. These transaction costs are not considered operating expenses and are not reflected in net investment income reported in the Statement of Operations and the Statement of Changes in Net Assets, or the net investment income per share and the ratios of expenses and net investment income reported in the Financial Highlights, nor are they limited by any expense limitation arrangements between the Fund and the investment adviser.
The Fund allocates income and realized and unrealized capital gains and losses to a class based on the relative net assets of each class.
| C. | Country Determination– For the purposes of making investment selection decisions and presentation in the Schedule of Investments, theinvestment adviser may determine the country in which an issuer is located and/or credit risk exposure based on various factors. These factors include the laws of the country under which the issuer is organized, where the issuer maintains a principal office, the country in which the issuer derives 50% or more of its total revenues and the country that has the primary market for the issuer’s securities, as well as other criteria. Among the other criteria that may be evaluated for making this determination are the country in which the issuer maintains 50% or more of its assets, the type of security, financial guarantees and enhancements, the nature of the collateral and the sponsor organization. Country of issuer and/or credit risk exposure has been determined to be the United States of America, unless otherwise noted. |
| D. | Distributions– Distributions from net investment income and net realized capital gain, if any, are generally declared and paid annually andrecorded on theex-dividend date. The Fund may elect to treat a portion of the proceeds from redemptions as distributions for federal income tax purposes. |
| E. | Federal Income Taxes – The Fund intends to comply with the requirements of Subchapter M of the Internal Revenue Code of 1986, asamended (the “Internal Revenue Code”), necessary to qualify as a regulated investment company and to distribute substantially all of the Fund’s taxable earnings to shareholders. As such, the Fund will not be subject to federal income taxes on otherwise taxable income (including net realized capital gain) that is distributed to shareholders. Therefore, no provision for federal income taxes is recorded in the financial statements. |
The Fund recognizes the tax benefits of uncertain tax positions only when the position is more likely than not to be sustained. Management has analyzed the Fund’s uncertain tax positions and concluded that no liability for unrecognized tax benefits should be recorded related to uncertain tax positions. Management is not aware of any tax positions for which it is reasonably possible that the total amounts of unrecognized tax benefits will change materially in the next 12 months.
The Fund files tax returns in the U.S. Federal jurisdiction and certain other jurisdictions. Generally, the Fund is subject to examinations by such taxing authorities for up to three years after the filing of the return for the tax period.
| F. | Expenses – Fees provided for under the Rule12b-1 plan of a particular class of the Fund are charged to the operations of such class. Transferagency fees and expenses and other shareholder recordkeeping fees and expenses attributable to Class R5 and Class R6 are allocated to each share class based on relative net assets.Sub-accounting fees attributable to Class R5 are charged to the operations of the class. Transfer agency fees and expenses and other shareholder recordkeeping fees and expenses relating to all other classes are allocated among those classes based on relative net assets. All other expenses are allocated among the classes based on relative net assets. |
| G. | Accounting Estimates – The preparation of financial statements in conformity with accounting principles generally accepted in theUnited States of America (“GAAP”) requires management to make estimates and assumptions that affect the reported amounts of assets and liabilities at the date of the financial statements and the reported amounts of revenues and expenses during the reporting period including estimates and assumptions related to taxation. Actual results could differ from those estimates by a significant amount. In addition, the Fund monitors for material events or transactions that may occur or become known after theperiod-end date and before the date the financial statements are released to print. |
| H. | Indemnifications – Under the Trust’s organizational documents, each Trustee, officer, employee or other agent of the Trust is indemnifiedagainst certain liabilities that may arise out of the performance of their duties to the Fund. Additionally, in the normal course of business, the Fund enters into contracts, including the Fund’s servicing agreements, that contain a variety of indemnification clauses. The Fund’s maximum exposure under these arrangements is unknown as this would involve future claims that may be made against the Fund that have not yet occurred. The risk of material loss as a result of such indemnification claims is considered remote. |
| I. | Foreign Currency Translations– Foreign currency is valued at the close of the NYSE based on quotations posted by banks and majorcurrency dealers. Portfolio securities and other assets and liabilities denominated in foreign currencies are translated into U.S. dollar amounts at the date of valuation. Purchases and sales of portfolio securities (net of foreign taxes withheld on disposition) and income items denominated in foreign currencies are translated into U.S. dollar amounts on the respective dates of such transactions. The Fund does not separately account for the portion of the results of operations resulting from changes in foreign exchange rates on investments and the fluctuations arising from changes in market prices of securities held. The combined results of changes in foreign exchange rates and the fluctuation of market prices on investments (net of estimated foreign tax withholding) are included with the net realized and unrealized gain or loss from investments in the Statement of Operations. Reported net realized foreign currency gains or losses arise from (1) sales of foreign currencies, (2) currency gains or losses realized between the trade and settlement dates on securities transactions, and (3) the difference between the amounts of dividends, |
16 Invesco Global Opportunities Fund
| | interest, and foreign withholding taxes recorded on the Fund’s books and the U.S. dollar equivalent of the amounts actually received or paid. Net unrealized foreign currency gains and losses arise from changes in the fair values of assets and liabilities, other than investments in securities at fiscal period end, resulting from changes in exchange rates. |
The Fund may invest in foreign securities, which may be subject to foreign taxes on income, gains on investments or currency repatriation, a portion of which may be recoverable. Foreign taxes, if any, are recorded based on the tax regulations and rates that exist in the foreign markets in which the Fund invests and are shown in the Statement of Operations.
| J. | Forward Foreign Currency Contracts– The Fund may engage in foreign currency transactions either on a spot (i.e. for prompt deliveryand settlement) basis, or through forward foreign currency contracts, to manage or minimize currency or exchange rate risk. |
The Fund may also enter into forward foreign currency contracts for the purchase or sale of a security denominated in a foreign currency in order to “lock in” the U.S. dollar price of that security, or the Fund may also enter into forward foreign currency contracts that do not provide for physical settlement of the two currencies, but instead are settled by a single cash payment calculated as the difference between the agreed upon exchange rate and the spot rate at settlement based upon an agreed upon notional amount(non-deliverable forwards). The Fund will set aside liquid assets in an amount equal to the dailymark-to-market obligation for forward foreign currency contracts.
A forward foreign currency contract is an obligation between two parties (“Counterparties”) to purchase or sell a specific currency for an agreed-upon price at a future date. The use of forward foreign currency contracts does not eliminate fluctuations in the price of the underlying securities the Fund owns or intends to acquire but establishes a rate of exchange in advance. Fluctuations in the value of these contracts are measured by the difference in the contract date and reporting date exchange rates and are recorded as unrealized appreciation (depreciation) until the contracts are closed. When the contracts are closed, realized gains (losses) are recorded. Realized and unrealized gains (losses) on the contracts are included in the Statement of Operations. The primary risks associated with forward foreign currency contracts include failure of the Counterparty to meet the terms of the contract and the value of the foreign currency changing unfavorably. These risks may be in excess of the amounts reflected in the Statement of Assets and Liabilities.
NOTE 2–Advisory Fees and Other Fees Paid to Affiliates
The Trust has entered into a master investment advisory agreement with Invesco Advisers, Inc. (the “Adviser” or “Invesco”). Under the terms of the investment advisory agreement, the Fund accrues daily and pays monthly an advisory fee to the Adviser based on the annual rate of the Fund’s average daily net assets as follows:
| | | | |
| Average Daily Net Assets | | Rate | |
| First $250 million | | | 0.800% | |
| Next $250 million | | | 0.780% | |
| Next $500 million | | | 0.760% | |
| Next $1.5 billion | | | 0.740% | |
| Next $2.5 billion | | | 0.720% | |
| Next $2.5 billion | | | 0.700% | |
| Next $2.5 billion | | | 0.680% | |
| Over $10 billion | | | 0.660% | |
For the year ended October 31, 2019, the effective advisory fee rate incurred by the Fund was 0.80%.
Under the terms of a mastersub-advisory agreement between the Adviser and each of Invesco Asset Management Deutschland GmbH, Invesco Asset Management Limited, Invesco Asset Management (Japan) Limited, Invesco Hong Kong Limited, Invesco Senior Secured Management, Inc. and Invesco Canada Ltd. and a separatesub-advisory agreement with Invesco Capital Management LLC (collectively, the “AffiliatedSub-Advisers”) the Adviser, not the Fund, will pay 40% of the fees paid to the Adviser to any such AffiliatedSub-Adviser(s) that provide(s) discretionary investment management services to the Fund based on the percentage of assets allocated to such AffiliatedSub-Adviser(s).
The Adviser has contractually agreed, through at least February 28, 2021, to waive advisory fees and/or reimburse expenses to the extent necessary to limit total annual fund operating expenses after fee waiver and/or expense reimbursement (excluding certain items discussed below) of Class A, Class C, Class R, Class Y, Class R5 and Class R6 shares to 1.02%, 1.77%, 1.27%, 0.77%, 0.77% and 0.77%, respectively, of average daily net assets (the “expense limits”). In determining the Adviser’s obligation to waive advisory fees and/or reimburse expenses, the following expenses are not taken into account, and could cause the total annual fund operating expenses after fee waiver and/or expense reimbursement to exceed the numbers reflected above: (1) interest; (2) taxes; (3) dividend expense on short sales; (4) extraordinary ornon-routine items, including litigation expenses; and (5) expenses that the Fund has incurred but did not actually pay because of an expense offset arrangement. Unless Invesco continues the fee waiver agreement, it will terminate on February 28, 2021. During its term, the fee waiver agreement cannot be terminated or amended to increase the expense limits or reduce the advisory fee waiver without approval of the Board of Trustees.
Further, the Adviser has contractually agreed, through at least June 30, 2021, to waive the advisory fee payable by the Fund in an amount equal to 100% of the net advisory fees the Adviser receives from the affiliated money market funds on investments by the Fund of uninvested cash in such affiliated money market funds.
For the year ended October 31, 2019, the Adviser waived advisory fees of $270,142 and reimbursed class level expenses of $67,385, $12,556, $2,953, $13,675, $9 and $68 of Class A, Class C, Class R, Class Y, Class R5 and Class R6 shares, respectively.
The Trust has entered into a master administrative services agreement with Invesco pursuant to which the Fund has agreed to pay Invesco for certain administrative costs incurred in providing accounting services to the Fund. For the year ended October 31, 2019, expenses incurred under the agreement are shown in the Statement of Operations asAdministrative services fees. Invesco has entered into asub-administration agreement whereby State Street Bank and Trust Company (“SSB”) serves as fund accountant and provides certain administrative services to the Fund. Pursuant to a custody agreement with the Trust on behalf of the Fund, SSB also serves as the Fund’s custodian. The Trust has entered into a transfer agency and service agreement with Invesco Investment Services, Inc. (“IIS”) pursuant to which the Fund has agreed to pay IIS a fee for providing transfer agency and shareholder services to the Fund and reimburse IIS for certain expenses incurred by IIS in the
17 Invesco Global Opportunities Fund
course of providing such services. IIS may make payments to intermediaries that provide omnibus account services,sub-accounting services and/or networking services. All fees payable by IIS to intermediaries that provide omnibus account services orsub-accounting services are charged back to the Fund, subject to certain limitations approved by the Trust’s Board of Trustees. For the year ended October 31, 2019, expenses incurred under the agreement are shown in the Statement of Operations asTransfer agent fees.
The Trust has entered into master distribution agreements with Invesco Distributors, Inc. (“IDI”) to serve as the distributor for the Class A, Class C, Class R, Class Y, Class R5 and Class R6 shares of the Fund. The Trust has adopted plans pursuant to Rule12b-1 under the 1940 Act with respect to the Fund’s Class A, Class C and Class R shares (collectively, the “Plans”). The Fund, pursuant to the Plans, pays IDI compensation at the annual rate of 0.25% of the Fund’s average daily net assets of Class A shares, 1.00% of the average daily net assets of Class C shares and 0.50% of the average daily net assets of Class R shares. The fees are accrued daily and paid monthly. Of the Plan payments, up to 0.25% of the average daily net assets of each class of shares may be paid to furnish continuing personal shareholder services to customers who purchase and own shares of such classes. Any amounts not paid as a service fee under the Plans would constitute an asset-based sales charge. Rules of the Financial Industry Regulatory Authority (“FINRA”) impose a cap on the total sales charges, including asset-based sales charges, that may be paid by any class of shares of the Fund. For the year ended October 31, 2019, expenses incurred under the Plans are shown in the Statement of Operations asDistribution fees.
Front-end sales commissions and CDSC (collectively, the “sales charges”) are not recorded as expenses of the Fund.Front-end sales commissions are deducted from proceeds from the sales of Fund shares prior to investment in Class A shares of the Fund. CDSC are deducted from redemption proceeds prior to remittance to the shareholder. During the year ended October 31, 2019, IDI advised the Fund that IDI retained $10,107 infront-end sales commissions from the sale of Class A shares and $699 and $267 from Class A and Class C shares, respectively, for CDSC imposed upon redemptions by shareholders.
Certain officers and trustees of the Trust are officers and directors of the Adviser, IIS and/or IDI.
NOTE 3–Additional Valuation Information
GAAP defines fair value as the price that would be received to sell an asset or paid to transfer a liability in an orderly transaction between market participants at the measurement date, under current market conditions. GAAP establishes a hierarchy that prioritizes the inputs to valuation methods, giving the highest priority to readily available unadjusted quoted prices in an active market for identical assets (Level 1) and the lowest priority to significant unobservable inputs (Level 3), generally when market prices are not readily available or are unreliable. Based on the valuation inputs, the securities or other investments are tiered into one of three levels. Changes in valuation methods may result in transfers in or out of an investment’s assigned level:
| | | | |
| | | Level 1 – | | Prices are determined using quoted prices in an active market for identical assets. |
| | Level 2 – | | Prices are determined using other significant observable inputs. Observable inputs are inputs that other market participants may use in pricing a security. These may include quoted prices for similar securities, interest rates, prepayment speeds, credit risk, yield curves, loss severities, default rates, discount rates, volatilities and others. |
| | Level 3 – | | Prices are determined using significant unobservable inputs. In situations where quoted prices or observable inputs are unavailable (for example, when there is little or no market activity for an investment at the end of the period), unobservable inputs may be used. Unobservable inputs reflect the Fund’s own assumptions about the factors market participants would use in determining fair value of the securities or instruments and would be based on the best available information. |
The following is a summary of the tiered valuation input levels, as of October 31, 2019. The level assigned to the securities valuations may not be an indication of the risk or liquidity associated with investing in those securities. Because of the inherent uncertainties of valuation, the values reflected in the financial statements may materially differ from the value received upon actual sale of those investments.
| | | | | | | | | | | | | | | | |
| | | Level 1 | | | Level 2 | | | Level 3 | | | Total | |
| |
Investments in Securities | | | | | | | | | | | | | | | | |
�� | |
Brazil | | $ | 834,723 | | | $ | – | | | | $– | | | $ | 834,723 | |
| |
Canada | | | 658,905 | | | | – | | | | – | | | | 658,905 | |
| |
China | | | 1,056,824 | | | | 1,357,894 | | | | – | | | | 2,414,718 | |
| |
Germany | | | – | | | | 2,653,429 | | | | – | | | | 2,653,429 | |
| |
Hong Kong | | | – | | | | 1,113,270 | | | | – | | | | 1,113,270 | |
| |
Ireland | | | 1,055,111 | | | | – | | | | – | | | | 1,055,111 | |
| |
Japan | | | – | | | | 743,383 | | | | – | | | | 743,383 | |
| |
Mexico | | | 610,025 | | | | – | | | | – | | | | 610,025 | |
| |
Russia | | | 970,130 | | | | – | | | | – | | | | 970,130 | |
| |
South Korea | | | – | | | | 1,038,041 | | | | – | | | | 1,038,041 | |
| |
Spain | | | – | | | | 739,378 | | | | – | | | | 739,378 | |
| |
Sweden | | | 628,013 | | | | – | | | | – | | | | 628,013 | |
| |
Switzerland | | | – | | | | 670,479 | | | | – | | | | 670,479 | |
| |
Taiwan | | | – | | | | 1,641,882 | | | | – | | | | 1,641,882 | |
| |
United Arab Emirates | | | – | | | | 376,276 | | | | – | | | | 376,276 | |
| |
United Kingdom | | | – | | | | 5,943,501 | | | | – | | | | 5,943,501 | |
| |
United States | | | 15,947,251 | | | | – | | | | – | | | | 15,947,251 | |
| |
Total Investments | | $ | 21,760,982 | | | $ | 16,277,533 | | | | $– | | | $ | 38,038,515 | |
| |
18 Invesco Global Opportunities Fund
NOTE 4–Expense Offset Arrangement(s)
The expense offset arrangement is comprised of transfer agency credits which result from balances in demand deposit accounts used by the transfer agent for clearing shareholder transactions. For the year ended October 31, 2019, the Fund received credits from this arrangement, which resulted in the reduction of the Fund’s total expenses of $1,573.
NOTE 5–Trustees’ and Officers’ Fees and Benefits
Trustees’ and Officers’ Fees and Benefitsinclude amounts accrued by the Fund to pay remuneration to certain Trustees and Officers of the Fund.Trustees have the option to defer compensation payable by the Fund, andTrustees’ and Officers’ Fees and Benefits also include amounts accrued by the Fund to fund such deferred compensation amounts. Those Trustees who defer compensation have the option to select various Invesco Funds in which their deferral accounts shall be deemed to be invested. Finally, certain current Trustees were eligible to participate in a retirement plan that provided for benefits to be paid upon retirement to Trustees over a period of time based on the number of years of service. The Fund may have certain former Trustees who also participate in a retirement plan and receive benefits under such plan.Trustees’ and Officers’ Fees and Benefits include amounts accrued by the Fund to fund such retirement benefits. Obligations under the deferred compensation and retirement plans represent unsecured claims against the general assets of the Fund.
NOTE 6–Cash Balances
The Fund is permitted to temporarily carry a negative or overdrawn balance in its account with State Street Bank and Trust Company, the custodian bank. Such balances, if any atperiod-end, are shown in the Statement of Assets and Liabilities under the payable captionAmount due custodian. To compensate the custodian bank for such overdrafts, the overdrawn Fund may either (1) leave funds as a compensating balance in the account so the custodian bank can be compensated by earning the additional interest; or (2) compensate by paying the custodian bank at a rate agreed upon by the custodian bank and Invesco, not to exceed the contractually agreed upon rate.
NOTE 7–Distributions to Shareholders and Tax Components of Net Assets
Tax Character of Distributions to Shareholders Paid During the Fiscal Years Ended October 31, 2019 and 2018
| | | | | | | | |
| | 2019 | | | 2018 | |
Ordinary income | | $ | 762,339 | | | $ | 372,824 | |
Long-term capital gain | | | 2,187,953 | | | | – | |
Total distributions | | $ | 2,950,292 | | | $ | 372,824 | |
Tax Components of Net Assets atPeriod-End:
| | | | |
| | 2019 | |
Undistributed ordinary income | | $ | 496,925 | |
Net unrealized appreciation – investments | | | 288,711 | |
Net unrealized appreciation – foreign currencies | | | 7,892 | |
Temporary book/tax differences | | | (16,065 | ) |
Capital loss carryforward | | | (5,007,883 | ) |
Shares of beneficial interest | | | 41,851,343 | |
Total net assets | | $ | 37,620,923 | |
The difference between book-basis andtax-basis unrealized appreciation (depreciation) is due to differences in the timing of recognition of gains and losses on investments for tax and book purposes. The Fund’s net unrealized appreciation difference is attributable primarily to wash sales.
The temporary book/tax differences are a result of timing differences between book and tax recognition of income and/or expenses. The Fund’s temporary book/tax differences are the result of the trustee deferral of compensation and retirement plan benefits.
Capital loss carryforward is calculated and reported as of a specific date. Results of transactions and other activity after that date may affect the amount of capital loss carryforward actually available for the Fund to utilize. The ability to utilize capital loss carryforward in the future may be limited under the Internal Revenue Code and related regulations based on the results of future transactions.
The Fund has a capital loss carryforward as of October 31, 2019, as follows:
| | | | | | | | | | | | |
| Capital Loss Carryforward* | |
Expiration | | | Short-Term | | | | Long-Term | | | | Total | |
Not subject to expiration | | $ | 2,519,470 | | | $ | 2,488,413 | | | $ | 5,007,883 | |
| * | Capital loss carryforwards as of the date listed above are reduced for limitations, if any, to the extent required by the Internal Revenue Code and may be further limited depending upon a variety of factors, including the realization of net unrealized gains or losses as of the date of any reorganization. |
NOTE 8–Investment Transactions
The aggregate amount of investment securities (other than short-term securities, U.S. Treasury obligations and money market funds, if any) purchased and sold by the Fund during the year ended October 31, 2019 was $17,160,646 and $25,607,056, respectively. Cost of investments,
19 Invesco Global Opportunities Fund
including any derivatives, on a tax basis includes the adjustments for financial reporting purposes as of the most recently completed federal income tax reportingperiod-end.
| | | | |
| Unrealized Appreciation (Depreciation) of Investments on a Tax Basis | |
| |
Aggregate unrealized appreciation of investments | | $ | 2,611,009 | |
| |
Aggregate unrealized (depreciation) of investments | | | (2,322,298 | ) |
| |
Net unrealized appreciation of investments | | $ | 288,711 | |
| |
Cost of investments for tax purposes is $37,749,804.
NOTE 9–Reclassification of Permanent Differences
Primarily as a result of differing book/tax treatment of distributions and foreign currency transactions, on October 31, 2019, undistributed net investment income was decreased by $95,473, undistributed net realized gain (loss) was increased by $95,509 and shares of beneficial interest was decreased by $36. This reclassification had no effect on the net assets of the Fund.
NOTE 10–Share Information
| | | | | | | | | | | | | | | | |
| | | Summary of Share Activity | |
| | | Years ended October 31, | |
| | | 2019(a) | | | 2018 | |
| | | Shares | | | Amount | | | Shares | | | Amount | |
Sold: | | | | | | | | | | | | | | | | |
| | | | |
Class A | | | 408,136 | | | $ | 5,559,513 | | | | 1,169,028 | | | $ | 19,724,415 | |
Class C | | | 65,788 | | | | 892,323 | | | | 264,684 | | | | 4,401,247 | |
Class R | | | 50,039 | | | | 675,346 | | | | 53,807 | | | | 908,122 | |
Class Y | | | 189,173 | | | | 2,569,056 | | | | 2,322,327 | | | | 39,576,599 | |
Class R6 | | | 13,140 | | | | 186,243 | | | | 3,754 | | | | 66,969 | |
| | | | |
Issued as reinvestment of dividends: | | | | | | | | | | | | | | | | |
| | | | |
Class A | | | 149,174 | | | | 1,870,607 | | | | 9,969 | | | | 165,591 | |
Class C | | | 33,523 | | | | 413,000 | | | | 1,291 | | | | 21,072 | |
Class R | | | 5,586 | | | | 69,598 | | | | 244 | | | | 4,024 | |
Class Y | | | 36,110 | | | | 453,901 | | | | 1,849 | | | | 30,781 | |
Class R6 | | | 708 | | | | 8,908 | | | | – | | | | – | |
| | | | |
Automatic conversion of Class C shares to Class A shares: | | | | | | | | | | | | | | | | |
| | | | |
Class A | | | 94,189 | | | | 1,294,683 | | | | – | | | | – | |
Class C | | | (95,956 | ) | | | (1,294,683 | ) | | | – | | | | – | |
| | | | |
Reacquired: | | | | | | | | | | | | | | | | |
| | | | |
Class A | | | (654,984 | ) | | | (8,933,224 | ) | | | (535,268 | ) | | | (8,763,869 | ) |
Class C | | | (154,347 | ) | | | (2,066,075 | ) | | | (147,002 | ) | | | (2,389,385 | ) |
Class R | | | (18,657 | ) | | | (255,626 | ) | | | (19,843 | ) | | | (327,620 | ) |
Class Y | | | (456,658 | ) | | | (6,416,437 | ) | | | (1,881,136 | ) | | | (29,918,425 | ) |
Class R6 | | | (9,112 | ) | | | (128,075 | ) | | | (1,168 | ) | | | (19,620 | ) |
Net increase (decrease) in share activity | | | (344,148 | ) | | $ | (5,100,942 | ) | | | 1,242,536 | | | $ | 23,479,901 | |
| (a) | There are entities that are record owners of more than 5% of the outstanding shares of the Fund and in the aggregate own 38% of the outstanding shares of the Fund. IDI has an agreement with these entities to sell Fund shares. The Fund, Invesco and/or Invesco affiliates may make payments to these entities, which are considered to be related to the Fund, for providing services to the Fund, Invesco and/or Invesco affiliates including but not limited to services such as securities brokerage, distribution, third party record keeping and account servicing. The Fund has no knowledge as to whether all or any portion of the shares owned of record by these entities are also owned beneficially. |
20 Invesco Global Opportunities Fund
Report of Independent Registered Public Accounting Firm
To the Board of Trustees of AIM International Mutual Funds (Invesco International Mutual Funds) and Shareholders of Invesco Global Opportunities Fund
Opinion on the Financial Statements
We have audited the accompanying statement of assets and liabilities, including the schedule of investments, of Invesco Global Opportunities Fund (one of the funds constituting AIM International Mutual Funds (Invesco International Mutual Funds), referred to hereafter as the “Fund”) as of October 31, 2019, the related statement of operations for the year ended October 31, 2019, the statement of changes in net assets for each of the two years in the period ended October 31, 2019, including the related notes, and the financial highlights for each of the five years in the period ended October 31, 2019 (collectively referred to as the “financial statements”). In our opinion, the financial statements present fairly, in all material respects, the financial position of the Fund as of October 31, 2019, the results of its operations for the year then ended, the changes in its net assets for each of the two years in the period ended October 31, 2019 and the financial highlights for each of the five years in the period ended October 31, 2019 in conformity with accounting principles generally accepted in the United States of America.
Basis for Opinion
These financial statements are the responsibility of the Fund’s management. Our responsibility is to express an opinion on the Fund’s financial statements based on our audits. We are a public accounting firm registered with the Public Company Accounting Oversight Board (United States) (PCAOB) and are required to be independent with respect to the Fund in accordance with the U.S. federal securities laws and the applicable rules and regulations of the Securities and Exchange Commission and the PCAOB.
We conducted our audits of these financial statements in accordance with the standards of the PCAOB. Those standards require that we plan and perform the audit to obtain reasonable assurance about whether the financial statements are free of material misstatement, whether due to error or fraud.
Our audits included performing procedures to assess the risks of material misstatement of the financial statements, whether due to error or fraud, and performing procedures that respond to those risks. Such procedures included examining, on a test basis, evidence regarding the amounts and disclosures in the financial statements. Our audits also included evaluating the accounting principles used and significant estimates made by management, as well as evaluating the overall presentation of the financial statements. Our procedures included confirmation of securities owned as of October 31, 2019 by correspondence with the custodian, transfer agent and brokers; when replies were not received from brokers, we performed other auditing procedures. We believe that our audits provide a reasonable basis for our opinion.
/s/PricewaterhouseCoopers LLP
Houston, Texas
December 23, 2019
We have served as the auditor of one or more of the investment companies in the Invesco group of investment companies since at least 1995. We have not been able to determine the specific year we began serving as auditor.
21 Invesco Global Opportunities Fund
Calculating your ongoing Fund expenses
Example
As a shareholder of the Fund, you incur two types of costs: (1) transaction costs, which may include sales charges (loads) on purchase payments or contingent deferred sales charges on redemptions, if any; and (2) ongoing costs, including management fees, distribution and/or service(12b-1) fees, and other Fund expenses. This example is intended to help you understand your ongoing costs (in dollars) of investing in the Fund and to compare these costs with ongoing costs of investing in other mutual funds. The example is based on an investment of $1,000 invested at the beginning of the period and held for the entire period May 1, 2019 through October 31, 2019.
Actual expenses
The table below provides information about actual account values and actual expenses. You may use the information in this table, together with the amount you invested, to estimate the expenses that you paid over the period. Simply divide your account value by $1,000 (for example, an $8,600 account value divided by $1,000 = 8.6), then multiply the result by the number in the table under the heading entitled “Actual Expenses Paid During Period” to estimate the expenses you paid on your account during this period.
Hypothetical example for comparison purposes
The table below also provides information about hypothetical account values and hypothetical expenses based on the Fund’s actual expense ratio and an assumed rate of return of 5% per year before expenses, which is not the Fund’s actual return.
The hypothetical account values and expenses may not be used to estimate the actual ending account balance or expenses you paid for the period. You may use this information to compare the ongoing costs of investing in the Fund and other funds. To do so, compare this 5% hypothetical example with the 5% hypothetical examples that appear in the shareholder reports of the other funds.
Please note that the expenses shown in the table are meant to highlight your ongoing costs only and do not reflect any transaction costs, such as sales charges (loads) on purchase payments or contingent deferred sales charges on redemptions, if any. Therefore, the hypothetical information is useful in comparing ongoing costs only, and will not help you determine the relative total costs of owning different funds. In addition, if these transaction costs were included, your costs would have been higher.
| | | | | | | | | | | | | | | | | | | | | | | | |
| | | | | | ACTUAL | | | HYPOTHETICAL
(5% annual return before
expenses) | | | | |
| | Beginning
Account Value
(05/01/19) | | | Ending Account Value
(10/31/19)1 | | | Expenses Paid During
Period2 | | | Ending
Account Value (10/31/19) | | | Expenses Paid During
Period2 | | | Annualized
Expense
Ratio | |
| Class A | | | $1,000.00 | | | | $993.90 | | | | $5.13 | | | | $1,020.06 | | | | $5.19 | | | | 1.02 | % |
| Class C | | | 1,000.00 | | | | 989.50 | | | | 8.88 | | | | 1,016.28 | | | | 9.00 | | | | 1.77 | |
| Class R | | | 1,000.00 | | | | 992.40 | | | | 6.38 | | | | 1,018.80 | | | | 6.46 | | | | 1.27 | |
| Class Y | | | 1,000.00 | | | | 994.60 | | | | 3.87 | | | | 1,021.32 | | | | 3.92 | | | | 0.77 | |
| Class R5 | | | 1,000.00 | | | | 994.60 | | | | 3.87 | | | | 1,021.32 | | | | 3.92 | | | | 0.77 | |
| Class R6 | | | 1,000.00 | | | | 994.60 | | | | 3.87 | | | | 1,021.32 | | | | 3.92 | | | | 0.77 | |
| 1 | The actual ending account value is based on the actual total return of the Fund for the period May 1, 2019 through October 31, 2019, after actual expenses and will differ from the hypothetical ending account value which is based on the Fund’s expense ratio and a hypothetical annual return of 5% before expenses. |
| 2 | Expenses are equal to the Fund’s annualized expense ratio as indicated above multiplied by the average account value over the period, multiplied by 184/365 to reflect the most recent fiscal half year. |
22 Invesco Global Opportunities Fund
Approval of Investment Advisory andSub-Advisory Contracts
At meetings held on June 10, 2019, the Board of Trustees (the Board or the Trustees) of AIM International Mutual Funds (Invesco International Mutual Funds) as a whole, and the independent Trustees, who comprise over 75% of the Board, voting separately, approved the continuance of the Invesco Global Opportunities Fund’s (the Fund) Master Investment Advisory Agreement with Invesco Advisers, Inc. (Invesco Advisers and the investment advisory agreement) and the Master IntergroupSub-Advisory Contract for Mutual Funds with Invesco Asset Management Deutschland GmbH, Invesco Asset Management Limited, Invesco Asset Management (Japan) Limited, Invesco Hong Kong Limited, Invesco Senior Secured Management, Inc. and Invesco Canada Ltd. and a separatesub-advisory contract with Invesco Capital Management LLC (collectively, the AffiliatedSub-Advisers and thesub-advisory contracts) for another year, effective July 1, 2019. After evaluating the factors discussed below, among others, the Board approved the renewal of the Fund’s investment advisory agreement and thesub-advisory contracts and determined that the compensation payable by the Fund to Invesco Advisers and by Invesco Advisers to the AffiliatedSub-Advisers is fair and reasonable.
The Board’s Evaluation ProcessThe Board’s Investments Committee has established threeSub-Committees, which meet throughout the year to review the performance of funds advised by Invesco Advisers (the Invesco Funds). As part of a regularly scheduled basis ofin-person Board meetings, theSub-Committees meet with portfolio managers for their assigned Invesco Funds and other members of management to review detailed information about investment performance and portfolio attributes of these funds. The Board took into account evaluations and reports that it received from the Investments Committee andSub-Committees, as well as the information provided to such committees and the Board throughout the year, in considering whether to approve each Invesco Fund’s investment advisory agreement andsub-advisory contracts.
As part of the contract renewal process, the Board reviews and considers information provided in response to detailed requests for information submitted to management by the independent Trustees with assistance from legal counsel to the independent Trustees. The Board receives comparative investment performance and fee data regarding the Invesco Funds prepared by Invesco Advisers and Broadridge Financial Solutions, Inc. (Broadridge), an independent mutual fund data provider. The Board also receives an independent written evaluation from the Senior Officer, an officer of
the Invesco Funds who reports directly to the independent Trustees. The Senior Officer’s evaluation is prepared as part of his responsibility to manage the process by which the Invesco Funds’ proposed management fees are negotiated during the annual contract renewal process to ensure they are negotiated in a manner that is at arms’ length and reasonable. In addition to meetings with Invesco Advisers and fund counsel throughout the year, the independent Trustees also discuss the continuance of the investment advisory agreement andsub-advisory contracts in separate sessions with the Senior Officer and with independent legal counsel.
The discussion below is a summary of the Senior Officer’s independent written evaluation with respect to the Fund’s investment advisory agreement, as well as a discussion of the material factors and related conclusions that formed the basis for the Board’s approval of the Fund’s investment advisory agreement andsub-advisory contracts. The Trustees’ review and conclusions are based on the comprehensive consideration of all information presented to them during the course of the year and in prior years and are not the result of any single determinative factor. Moreover, one Trustee may have weighed a particular piece of information or factor differently than another Trustee. This information is current as of June 10, 2019.
Factors and Conclusions and Summary of Independent Written Fee Evaluation
| A. | Nature, Extent and Quality of Services Provided by Invesco Advisers and the AffiliatedSub-Advisers |
The Board reviewed the nature, extent and quality of the advisory services provided to the Fund by Invesco Advisers under the Fund’s investment advisory agreement, and the credentials and experience of the officers and employees of Invesco Advisers who provide these services, including the Fund’s portfolio manager(s). The Board’s review included consideration of Invesco Advisers’ investment process oversight and structure, credit analysis and investment risk management. The Board also considerednon-advisory services that Invesco Advisers and its affiliates provide to the Invesco Funds such as various back office support functions, third party oversight, internal audit, valuation, portfolio trading and legal and compliance. The Board also received and reviewed information about Invesco Advisers’ role as administrator of the Invesco Funds’ liquidity risk management program. The Board also reviewed and considered the benefits to shareholders of investing in a fund that is part of the Invesco family of funds under the umbrella of Invesco Ltd., Invesco Advisers’
parent company, and noted Invesco Ltd.’s depth and experience in conducting an investment management business, as well as its commitment of financial and other resources to such business. The Board reviewed and considered information about the resources that Invesco Advisers intends to continue to commit to managing the Invesco family of funds following Invesco Ltd.’s acquisition of OppenheimerFunds, Inc. and its subsidiaries. The Board concluded that the nature, extent and quality of the services provided to the Fund by Invesco Advisers are appropriate and satisfactory.
The Board reviewed the services that may be provided by the AffiliatedSub-Advisers under thesub-advisory contracts and the credentials and experience of the officers and employees of the AffiliatedSub-Advisers who provide these services. The Board noted the AffiliatedSub-Advisers’ expertise with respect to certain asset classes and that the AffiliatedSub-Advisers have offices and personnel that are located in financial centers around the world. As a result, the Board noted that the AffiliatedSub-Advisers can provide research and investment analysis on the markets and economies of various countries in which the Fund may invest, make recommendations regarding securities and assist with security trades. The Board concluded that thesub-advisory contracts may benefit the Fund and its shareholders by permitting Invesco Advisers to use the resources and talents of the AffiliatedSub-Advisers in managing the Fund. The Board concluded that the nature, extent and quality of the services that may be provided by the AffiliatedSub-Advisers are appropriate and satisfactory.
| B. | Fund Investment Performance |
The Board considered Fund investment performance as a relevant factor in considering whether to approve the investment advisory agreement as well as thesub-advisory contracts for the Fund, as Invesco Asset Management Limited currently manages assets of the Fund.
The Board compared the Fund’s investment performance over multiple time periods ending December 31, 2018 to the performance of funds in the Broadridge performance universe and against the Lipper GlobalMulti-Cap Core Funds Index. The Board noted that performance of Class A shares of the Fund was in the fifth quintile of its performance universe for the one, three and five year periods (the first quintile being the best performing funds and the fifth quintile being the worst performing funds). The Board noted that the Fund’s performance was below the performance of the Index for the one, three and five year periods. The Board noted that the Fund’s holdings in and underweight
23 Invesco Global Opportunities Fund
exposure to certain sectors detracted from the Fund’s performance. The Trustees also reviewed more recent Fund performance and this review did not change their conclusions.
| C. | Advisory andSub-Advisory Fees and Fund Expenses |
The Board compared the Fund’s contractual management fee rate to the contractual management fee rates of funds in the Fund’s Broadridge expense group. The Board noted that the contractual management fee rate for Class A shares of the Fund was reasonably comparable to the median contractual management fee rate of funds in its expense group. The Board noted that the term “contractual management fee” for funds in the expense group may include both advisory and certainnon-portfolio management administrative services fees, but that Broadridge does not provide information on a fund by fund basis as to what is included. The Board also reviewed the methodology used by Broadridge in providing expense group information, which includes using each fund’s contractual management fee schedule (including any applicable breakpoints) as reported in the most recent prospectus or statement of additional information for each fund in the expense group. The Board also considered comparative information regarding the Fund’s total expense ratio and its various components. The Board noted that the Fund’s contractual management fees were in the fourth quintile of its expense group and discussed with management reasons for such relative contractual management fees.
The Board noted that Invesco Advisers has contractually agreed to waive fees and/or limit expenses of the Fund for the term disclosed in the Fund’s registration statement in an amount necessary to limit total annual operating expenses to a specified percentage of average daily net assets for each class of the Fund.
The Board also considered the fees charged by Invesco Advisers and the AffiliatedSub-Advisers to other similarly managed client accounts. The Board noted that Invesco Advisers or the AffiliatedSub-Advisers may charge lower fees to large institutional clients. Invesco Advisers reviewed with the Board differences in the scope of services it provides to the Invesco Funds relative to certain other types of client accounts, including management of cash flows as a result of redemptions and purchases, necessary infrastructure such as officers, office space, technology, legal and distribution, oversight of service providers, costs and business risks associated with launching new funds and sponsoring and maintaining the product line, preparation of annual registration statement updates and financial information and compliance with federal and state laws and regulations.
The Board also considered the services that may be provided by the AffiliatedSub-Advisers pursuant to thesub-advisory contracts, as well
as the fees payable by Invesco Advisers to the AffiliatedSub-Advisers pursuant to thesub-advisory contracts. The Board noted that Invesco Advisers retains overall responsibility for, and provides services to,sub-advised Invesco Funds, including oversight of the AffiliatedSub-Advisers as well as the additional services described herein other thanday-to-day portfolio management.
| D. | Economies of Scale and Breakpoints |
The Board considered the extent to which there may be economies of scale in the provision of advisory services to the Fund. The Board considered Invesco’s reinvestment in its business, including investments in business infrastructure and cybersecurity. The Board also considered that the Fund may benefit from economies of scale through contractual breakpoints in the Fund’s advisory fee schedule, which generally operate to reduce the Fund’s expense ratio as it grows in size. The Board noted that the Fund shares directly in economies of scale through lower fees charged by third party service providers based on the combined size of the Invesco Funds. The Board noted that the Fund may also benefit from economies of scale through initial fee setting, fee waivers and expense reimbursements.
| E. | Profitability and Financial Resources |
The Board reviewed information from Invesco Advisers concerning the costs of the advisory and other services that Invesco Advisers and its affiliates provide to the Fund and the Invesco Funds and the profitability of Invesco Advisers and its affiliates in providing these services. The Board considered the methodology used for calculating profitability and noted the periodic review of such methodology by an independent consultant. The Board noted that Invesco Advisers continues to operate at a net profit from services Invesco Advisers and its affiliates provide to the Invesco Funds. The Board received information from Invesco Advisers demonstrating that Invesco Advisers and the AffiliatedSub-Advisers are financially sound and have the resources necessary to perform their obligations under the investment advisory agreement andsub-advisory contracts.
| F. | Collateral Benefits to Invesco Advisers and its Affiliates |
The Board considered various other benefits received by Invesco Advisers and its affiliates from the relationship with the Fund, including the fees received for providing administrative, transfer agency and distribution services to the Fund. The Board considered comparative information regarding fees charged for these services, including information provided by Broadridge and other independent sources. The Board considered the performance of Invesco Advisers and its affiliates in providing these services and the organizational structure employed to provide these services. The Board also considered that these services are provided to the Fund pursuant to written contracts that are reviewed and approved on an annual basis
by the Board; and that the services are required for the operation of the Fund.
The Board considered the benefits realized by Invesco Advisers and the AffiliatedSub-Advisers as a result of portfolio brokerage transactions executed through “soft dollar” arrangements. The Board noted that soft dollar arrangements may result in the Fund bearing costs to purchase research that may be used by Invesco Advisers or the AffiliatedSub-Advisers with other clients and may reduce Invesco Advisers’ or the AffiliatedSub-Advisers’ expenses. The Board also considered that it receives periodic reports from Invesco representing that these arrangements are consistent with regulatory requirements. The Board did not deem the soft dollar arrangements to be inappropriate.
The Board considered that the Fund’s uninvested cash and cash collateral from any securities lending arrangements may be invested in money market funds advised by Invesco Advisers pursuant to procedures approved by the Board. The Board considered information regarding the returns of the affiliated money market funds relative to comparable overnight investments, as well as the costs to the Fund of such investments. The Board noted that Invesco Advisers receives advisory fees from these affiliated money market funds attributable to such investments, although Invesco Advisers has contractually agreed to waive through varying periods the advisory fees payable by the Invesco Funds with respect to certain investments in the affiliated money market funds. The waiver is in an amount equal to 100% of the net advisory fee Invesco Advisers receives from the affiliated money market funds with respect to the Fund’s investment in the affiliated money market funds of uninvested cash, but not cash collateral. The Board concluded that the amount of advisory fees received by Invesco Advisers from the Fund’s investment of cash collateral from any securities lending arrangements in the affiliated money market funds is fair and reasonable.
The Board also considered that an affiliated broker may receive commissions for executing certain trades for the Fund. Invesco Advisers and the AffiliatedSub-Advisers may use the affiliated broker to, among other things, control order routing and minimize information leakage, and the Board was advised that such trades are executed in compliance with rules under the federal securities laws and consistent with best execution obligations.
24 Invesco Global Opportunities Fund
Tax Information
Form1099-DIV, Form1042-S and otheryear-end tax information provide shareholders with actual calendar year amounts that should be included in their tax returns. Shareholders should consult their tax advisors.
The following distribution information is being provided as required by the Internal Revenue Code or to meet a specific state’s requirement.
The Fund designates the following amounts or, if subsequently determined to be different, the maximum amount allowable for its fiscal year ended October 31, 2019:
| | | | | | |
| Federal and State Income Tax |
Long-Term Capital Gain Distributions | | $ | 2,187,953 | | | |
Qualified Dividend Income* | | | 90.78 | % | | |
Corporate Dividends Received Deduction* | | | 39.15 | % | | |
U.S. Treasury Obligations* | | | 0 | % | | |
Foreign Taxes | | $ | 0.0299 | | | per share |
Foreign Source Income | | $ | 0.3204 | | | per share |
| | * | The above percentages are based on ordinary income dividends paid to shareholders during the Fund’s fiscal year. |
25 Invesco Global Opportunities Fund
Trustees and Officers
The address of each trustee and officer is AIM International Mutual Funds (Invesco International Mutual Funds) (the “Trust”), 11 Greenway Plaza, Suite 1000, Houston, Texas 77046-1173. The trustees serve for the life of the Trust, subject to their earlier death, incapacitation, resignation, retirement or removal as more specifically provided in the Trust’s organizational documents. Each officer serves for a one year term or until their successors are elected and qualified. Column two below includes length of time served with predecessor entities, if any.
| | | | | | | | | | |
Name, Year of Birth and
Position(s)
Held with the Trust | | Trustee and/or Officer Since | | Principal Occupation(s) During Past 5 Years | | Number of
Funds in
Fund Complex
Overseen by
Trustee | | | Other
Directorship(s)
Held by Trustee
During Past
5 Years |
Interested Persons | | | | | | | | | | |
| Martin L. Flanagan1 – 1960 Trustee and Vice Chair | | 2007 | | Executive Director, Chief Executive Officer and President, Invesco Ltd. (ultimate parent of Invesco and a global investment management firm); Trustee and Vice Chair, The Invesco Funds; Vice Chair, Investment Company Institute; and Member of Executive Board, SMU Cox School of Business Formerly: Advisor to the Board, Invesco Advisers, Inc. (formerly known as Invesco Institutional (N.A.), Inc.); Chairman and Chief Executive Officer, Invesco Advisers, Inc. (registered investment adviser); Director, Chairman, Chief Executive Officer and President, Invesco Holding Company (US), Inc. (formerly IVZ Inc.) (holding company), Invesco Group Services, Inc. (service provider) and Invesco North American Holdings, Inc. (holding company); Director, Chief Executive Officer and President, Invesco Holding Company Limited (parent of Invesco and a global investment management firm); Director, Invesco Ltd.; Chairman, Investment Company Institute and President,Co-Chief Executive Officer,Co-President, Chief Operating Officer and Chief Financial Officer, Franklin Resources, Inc. (global investment management organization) | | | 229 | | | None |
| Philip A. Taylor2 – 1954 Trustee | | 2006 | | Vice Chair, Invesco Ltd.; Trustee, The Invesco Funds Formerly: Director, Invesco Canada Ltd. (formerly known as Invesco Trimark Ltd./Invesco Trimark Ltèe) (registered investment adviser and registered transfer agent); Head of the Americas and Senior Managing Director, Invesco Ltd.; Director, Invesco Advisers, Inc. (formerly known as Invesco Institutional (N.A.), Inc.) (registered investment adviser); Director and Chairman, Invesco Investment Services, Inc. (formerly known as Invesco AIM Investment Services, Inc.) (registered transfer agent); Chief Executive Officer, Invesco Corporate Class Inc. (corporate mutual fund company); Chairman and Chief Executive Officer, Invesco Canada Ltd. (formerly known as Invesco Trimark Ltd./Invesco Trimark Ltèe) (registered investment adviser and registered transfer agent); Senior Vice President, The Invesco Funds; Director, Invesco Investment Advisers LLC (formerly known as Van Kampen Asset Management); Director, Chairman, Chief Executive Officer and President, Invesco Management Group, Inc. (formerly known as Invesco AIM Management Group, Inc.) (financial services holding company);Co-Chairman,Co-President andCo-Chief Executive Officer, Invesco Advisers, Inc. (formerly known as Invesco Institutional (N.A.), Inc.) (registered investment adviser); Director, Chief Executive Officer and President, Van Kampen Exchange Corp; President and Principal Executive Officer, The Invesco Funds (other than AIM Treasurer’s Series Trust (Invesco Treasurer’s Series Trust), Short-Term Investments Trust and Invesco Management Trust); Executive Vice President, The Invesco Funds (AIM Treasurer’s Series Trust (Invesco Treasurer’s Series Trust), Short-Term Investments Trust and Invesco Management Trust only); Director and President, INVESCO Funds Group, Inc. (registered investment adviser and registered transfer agent); Director and Chairman, IVZ Distributors, Inc. (formerly known as INVESCO Distributors, Inc.) (registered broker dealer); Director, President and Chairman, Invesco Inc. (holding company), Invesco Canada Holdings Inc. (holding company), Trimark Investments Ltd./Placements Trimark Ltèe and Invesco Financial Services Ltd/Services Financiers Invesco Ltèe; Chief Executive Officer, Invesco Canada Fund Inc. (corporate mutual fund company); Director and Chairman, Van Kampen Investor Services Inc.; Director, Chief Executive Officer and President, 1371 Preferred Inc. (holding company) and Van Kampen Investments Inc.; Director and President, AIM GP Canada Inc. (general partner for limited partnerships) and Van Kampen Advisors, Inc.; Director and Chief Executive Officer, Invesco Trimark Dealer Inc. (registered broker dealer); Director, Invesco Distributors, Inc. (formerly known as Invesco AIM Distributors, Inc.) (registered broker dealer); Manager, Invesco Capital Management LLC; Director, Chief Executive Officer and President, Invesco Advisers, Inc.; Director, Chairman, Chief Executive Officer and President, Invesco AIM Capital Management, Inc.; President, Invesco Trimark Dealer Inc. and Invesco Trimark Ltd./Invesco Trimark Ltèe; Director and President, AIM Trimark Corporate Class Inc. and AIM Trimark Canada Fund Inc.; Senior Managing Director, Invesco Holding Company Limited; Director and Chairman, Fund Management Company (former registered broker dealer); President and Principal Executive Officer, The Invesco Funds (AIM Treasurer’s Series Trust (Invesco Treasurer’s Series Trust), and Short-Term Investments Trust only); President, AIM Trimark Global Fund Inc. and AIM Trimark Canada Fund Inc. | | | 229 | | | None |
| 1 | Mr. Flanagan is considered an interested person (within the meaning of Section 2(a)(19) of the 1940 Act) of the Trust because he is an officer of the Adviser to the Trust, and an officer and a director of Invesco Ltd., ultimate parent of the Adviser. |
| 2 | Mr. Taylor is considered an interested person (within the meaning of Section 2(a)(19) of the 1940 Act) of the Trust because he is an officer and a director of the Adviser. |
T-1 Invesco Global Opportunities Fund
Trustees and Officers–(continued)
| | | | | | | | | | |
Name, Year of Birth and
Position(s) Held with the Trust | | Trustee and/or Officer Since | | Principal Occupation(s)
During Past 5 Years | | Number of
Funds in
Fund Complex
Overseen by
Trustee | | | Other
Directorship(s)
Held by Trustee
During Past
5 Years |
Independent Trustees | | | | | | | | |
Bruce L. Crockett – 1944 Trustee and Chair | | 1992 | | Chairman, Crockett Technologies Associates (technology consulting company) Formerly: Director, Captaris (unified messaging provider); Director, President and Chief Executive Officer, COMSAT Corporation; Chairman, Board of Governors of INTELSAT (international communications company); ACE Limited (insurance company); Independent Directors Council and Investment Company Institute: Member of the Audit Committee, Investment Company Institute; Member of the Executive Committee and Chair of the Governance Committee, Independent Directors Council | | | 229 | | | Director and Chairman of the Audit Committee, ALPS (Attorneys Liability Protection Society) (insurance company); Director and Member of the Audit Committee and Compensation Committee, Ferroglobe PLC (metallurgical company) |
David C. Arch – 1945 Trustee | | 2010 | | Chairman of Blistex Inc. (consumer health care products manufacturer); Member, World Presidents’ Organization | | | 229 | | | Board member of the Illinois Manufacturers’ Association |
Beth Ann Brown – 1968 Trustee | | 2019 | | Independent Consultant Formerly: Head of Intermediary Distribution, Managing Director, Strategic Relations, Managing Director, Head of National Accounts, Senior Vice President, National Account Manager and Senior Vice President, Key Account Manager, Columbia Management Investment Advisers LLC; Vice President, Key Account Manager, Liberty Funds Distributor, Inc.; and Trustee of certain Oppenheimer Funds | | | 229 | | | Director, Board of Directors of Caron Engineering Inc.; President and Director, Acton Shapleigh Youth Conservation Corps (non-profit); and Vice President and Director of Grahamtastic Connection (non-profit) |
Jack M. Fields – 1952 Trustee | | 1997 | | Chief Executive Officer, Twenty First Century Group, Inc. (government affairs company); and Chairman, Discovery Learning Alliance(non-profit) Formerly: Owner and Chief Executive Officer, Dos Angeles Ranch L.P. (cattle, hunting, corporate entertainment); Director, Insperity, Inc. (formerly known as Administaff) (human resources provider); Chief Executive Officer, Texana Timber LP (sustainable forestry company); Director of Cross Timbers Quail Research Ranch(non-profit); and member of the U.S. House of Representatives | | | 229 | | | None |
Cynthia Hostetler – 1962 Trustee | | 2017 | | Non-Executive Director and Trustee of a number of public and private business corporations Formerly: Director, Aberdeen Investment Funds (4 portfolios); Head of Investment Funds and Private Equity, Overseas Private Investment Corporation; President, First Manhattan Bancorporation, Inc.; Attorney, Simpson Thacher & Bartlett LLP | | | 229 | | | Vulcan Materials Company (construction materials company); Trilinc Global Impact Fund; Genesee & Wyoming, Inc. (railroads); Artio Global Investment LLC (mutual fund complex); Edgen Group, Inc. (specialized energy and infrastructure products distributor); Investment Company Institute (professional organization); Independent Directors Council (professional organization) |
T-2 Invesco Global Opportunities Fund
Trustees and Officers–(continued)
| | | | | | | | | | |
Name, Year of Birth and
Position(s) Held with the Trust | | Trustee and/or Officer Since | | Principal Occupation(s) During Past 5 Years | | Number of
Funds in
Fund Complex
Overseen by
Trustee | | | Other
Directorship(s)
Held by Trustee
During Past
5 Years |
Independent Trustees–(continued) | | | | | | |
Eli Jones – 1961 Trustee | | 2016 | | Professor and Dean, Mays Business School - Texas A&M University Formerly: Professor and Dean, Walton College of Business, University of Arkansas and E.J. Ourso College of Business, Louisiana State University; Director, Arvest Bank | | | 229 | | | Insperity, Inc. (formerly known as Administaff) (human resources provider) |
Elizabeth Krentzman – 1959 Trustee | | 2019 | | Formerly: Principal and Chief Regulatory Advisor for Asset Management Services and U.S. Mutual Fund Leader of Deloitte & Touche LLP; General Counsel of the Investment Company Institute (trade association); National Director of the Investment Management Regulatory Consulting Practice, Principal, Director and Senior Manager of Deloitte & Touche LLP; Assistant Director of the Division of Investment Management - Office of Disclosure and Investment Adviser Regulation of the U.S. Securities and Exchange Commission and various positions with the Division of Investment Management - Office of Regulatory Policy of the U.S. Securities and Exchange Commission; Associate at Ropes & Gray LLP; Advisory Board Member of the Securities and Exchange Commission Historical Society; and Trustee of certain Oppenheimer Funds | | | 229 | | | Trustee of the University of Florida National Board Foundation and Audit Committee Member; Member of the Cartica Funds Board of Directors (private investment funds); Member of the University of Florida Law Center Association, Inc. Board of Trustees and Audit Committee Member |
Anthony J. LaCava, Jr. – 1956 Trustee | | 2019 | | Formerly: Director and Member of the Audit Committee, Blue Hills Bank (publicly traded financial institution) and Managing Partner, KPMG LLP | | | 229 | | | Blue Hills Bank; Chairman, Bentley University; Member, Business School Advisory Council; and Nominating Committee KPMG LLP |
Prema Mathai-Davis – 1950 Trustee | | 1998 | | Retired Co-Owner & Partner of Quantalytics Research, LLC, (a FinTech Investment Research Platform for the Self-Directed Investor) | | | 229 | | | None |
Joel W. Motley – 1952 Trustee | | 2019 | | Director of Office of Finance, Federal Home Loan Bank; Member of the Vestry of Trinity Wall Street; Managing Director of Carmona Motley Inc. (privately held financial advisor); Member of the Finance and Budget Committee of the Council on Foreign Relations, Member of the Investment Committee and Board of Human Rights Watch and Member of the Investment Committee and Board of Historic Hudson Valley(non-profit cultural organization) Formerly: Managing Director of Public Capital Advisors, LLC (privately held financial advisor); Managing Director of Carmona Motley Hoffman, Inc. (privately held financial advisor); Trustee of certain Oppenheimer Funds; and Director of Columbia Equity Financial Corp. (privately held financial advisor) | | | 229 | | | Director of Greenwall Foundation (bioethics research foundation); Member of Board and Investment Committee of The Greenwall Foundation; Director of Southern Africa Legal Services Foundation; Board Member and Investment Committee Member of Pulizer Center for Crisis Reporting(non-profit journalism) |
Teresa M. Ressel – 1962 Trustee | | 2017 | | Non-executive director and trustee of a number of public and private business corporations Formerly: Chief Financial Officer, Olayan America, The Olayan Group (international investor/commercial/industrial); Chief Executive Officer, UBS Securities LLC; Group Chief Operating Officer, Americas, UBS AG; Assistant Secretary for Management & Budget and CFO, US Department of the Treasury | | | 229 | | | Atlantic Power Corporation (power generation company); ON Semiconductor Corp. (semiconductor supplier) |
T-3 Invesco Global Opportunities Fund
Trustees and Officers–(continued)
| | | | | | | | | | |
Name, Year of Birth and
Position(s) Held with the Trust | | Trustee and/or
Officer
Since | | Principal Occupation(s) During Past 5 Years | | Number of
Funds in
Fund Complex
Overseen by
Trustee | | | Other
Directorship(s)
Held by Trustee
During Past
5 Years |
Independent Trustees–(continued) | | | | | | |
| Ann Barnett Stern – 1957 Trustee | | 2017 | | President and Chief Executive Officer, Houston Endowment Inc. (private philanthropic institution) Formerly: Executive Vice President and General Counsel, Texas Children’s Hospital; Attorney, Beck, Redden and Secrest, LLP; Business Law Instructor, University of St. Thomas; Attorney, Andrews & Kurth LLP | | | 229 | | | Federal Reserve Bank of Dallas |
Raymond Stickel, Jr. – 1944 Trustee | | 2005 | | Retired Formerly: Director, Mainstay VP Series Funds, Inc. (25 portfolios); Partner, Deloitte & Touche | | | 229 | | | None |
Robert C. Troccoli – 1949 Trustee | | 2016 | | Retired Formerly: Adjunct Professor, University of Denver – Daniels College of Business; Senior Partner, KPMG LLP | | | 229 | | �� | None |
Daniel S. Vandivort – 1954 Trustee | | 2019 | | Treasurer, Chairman of the Audit and Finance Committee, and Trustee, Board of Trustees, Huntington Disease Foundation of America; and President, Flyway Advisory Services LLC (consulting and property management) Formerly: Trustee and Governance Chair, of certain Oppenheimer Funds | | | 229 | | | Chairman and Lead Independent Director, Chairman of the Audit Committee, and Director, Board of Directors, Value Line Funds |
James D. Vaughn – 1945 Trustee | | 2019 | | Retired Formerly: Managing Partner, Deloitte & Touche LLP; Trustee and Chairman of the Audit Committee, Schroder Funds; Board Member, Mile High United Way, Boys and Girls Clubs, Boy Scouts, Colorado Business Committee for the Arts, Economic Club of Colorado and Metro Denver Network (economic development corporation); and Trustee of certain Oppenheimer Funds | | | 229 | | | Board member and Chairman of Audit Committee of AMG National Trust Bank; Trustee and Investment Committee member, University of South Dakota Foundation; Board member, Audit Committee Member and past Board Chair, Junior Achievement(non-profit) |
Christopher L. WIlson – 1957 Trustee, Vice Chair and Chair Designate | | 2017 | | Retired Formerly: Director, TD Asset Management USA Inc. (mutual fund complex) (22 portfolios); Managing Partner, CT2, LLC (investing and consulting firm); President/Chief Executive Officer, Columbia Funds, Bank of America Corporation; President/Chief Executive Officer, CDC IXIS Asset Management Services, Inc.; Principal & Director of Operations, Scudder Funds, Scudder, Stevens & Clark, Inc.; Assistant Vice President, Fidelity Investments | | | 229 | | | ISO New England, Inc.(non-profit organization managing regional electricity market) |
T-4 Invesco Global Opportunities Fund
Trustees and Officers–(continued)
| | | | | | | | | | |
Name, Year of Birth and
Position(s) Held with the Trust | | Trustee and/or Officer Since | | Principal Occupation(s) During Past 5 Years | | Number of
Funds in
Fund Complex
Overseen by
Trustee | | | Other
Directorship(s)
Held by Trustee
During Past
5 Years |
Other Officers | | | | | | |
Sheri Morris – 1964 President, Principal Executive Officer and Treasurer | | 1999 | | Head of Global Fund Services, Invesco Ltd.; President, Principal Executive Officer and Treasurer, The Invesco Funds; Vice President, Invesco Advisers, Inc. (formerly known as Invesco Institutional (N.A.), Inc.) (registered investment adviser); and Vice President, Invesco Exchange-Traded Fund Trust, Invesco Exchange-Traded Fund Trust II, Invesco India Exchange-Traded Fund Trust, Invesco Actively Managed Exchange-Traded Fund Trust, Invesco Actively Managed Exchange-Traded Commodity Fund Trust and Invesco Exchange-Traded Self-Indexed Fund Trust; and Vice President, OppenheimerFunds, Inc. Formerly: Vice President and Principal Financial Officer, The Invesco Funds; Vice President, Invesco AIM Advisers, Inc., Invesco AIM Capital Management, Inc. and Invesco AIM Private Asset Management, Inc.; Assistant Vice President and Assistant Treasurer, The Invesco Funds and Assistant Vice President, Invesco Advisers, Inc., Invesco AIM Capital Management, Inc. and Invesco AIM Private Asset Management, Inc.; and Treasurer, Invesco Exchange-Traded FundTrust, Invesco Exchange-Traded Fund Trust II, Invesco India Exchange-Traded Fund Trust and Invesco Actively Managed Exchange-Traded Fund Trust | | | N/A | | | N/A |
Russell C. Burk – 1958 Senior Vice President and Senior Officer | | 2005 | | Senior Vice President and Senior Officer, The Invesco Funds | | | N/A | | | N/A |
| Jeffrey H. Kupor – 1968 Senior Vice President, Chief Legal Officer and Secretary | | 2018 | | Head of Legal of the Americas, Invesco Ltd.; Senior Vice President and Secretary, Invesco Advisers, Inc. (formerly known as Invesco Institutional (N.A.), Inc.) (registered investment adviser); Senior Vice President and Secretary, Invesco Distributors, Inc. (formerly known as Invesco AIM Distributors, Inc.); Vice President and Secretary, Invesco Investment Services, Inc. (formerly known as Invesco AIM Investment Services, Inc.) Senior Vice President, Chief Legal Officer and Secretary, The Invesco Funds; Secretary and General Counsel, Invesco Investment Advisers LLC (formerly known as Van Kampen Asset Management); Secretary and General Counsel, Invesco Capital Markets, Inc. (formerly known as Van Kampen Funds Inc.) and Chief Legal Officer, Invesco Exchange-Traded Fund Trust, Invesco Exchange-Traded Fund Trust II, Invesco India Exchange-Traded Fund Trust, Invesco Actively Managed Exchange-Traded Fund Trust, Invesco Actively Managed Exchange-Traded Commodity Fund Trust and Invesco Exchange-Traded Self-Indexed Fund Trust; Secretary, Invesco Indexing LLC; Secretary, W.L. Ross & Co., LLC Formerly: Secretary and Vice President, Jemstep, Inc.; Head of Legal, Worldwide Institutional, Invesco Ltd.; Secretary and General Counsel, INVESCO Private Capital Investments, Inc.; Senior Vice President, Secretary and General Counsel, Invesco Management Group, Inc. (formerly known as Invesco AIM Management Group, Inc.); Assistant Secretary, INVESCO Asset Management (Bermuda) Ltd.; Secretary and General Counsel, Invesco Private Capital, Inc.; Assistant Secretary and General Counsel, INVESCO Realty, Inc.; Secretary and General Counsel, Invesco Senior Secured Management, Inc.; and Secretary, Sovereign G./P. Holdings Inc. | | | N/A | | | N/A |
Andrew R. Schlossberg – 1974 Senior Vice President | | 2019 | | Head of the Americas and Senior Managing Director, Invesco Ltd.; Director and Senior Vice President, Invesco Advisers, Inc. (formerly known as Invesco Institutional (N.A.), Inc.) (registered investment adviser); Director and Chairman, Invesco Investment Services, Inc. (formerly known as Invesco AIM Investment Services, Inc.) (registered transfer agent); Senior Vice President, The Invesco Funds; Director, Invesco Investment Advisers LLC (formerly known as Van Kampen Asset Management); Director, President and Chairman, Invesco Insurance Agency, Inc. Formerly: Director, Invesco UK Limited; Director and Chief Executive, Invesco Asset Management Limited and Invesco Fund Managers Limited; Assistant Vice President, The Invesco Funds; Senior Vice President, Invesco Advisers, Inc. (formerly known as Invesco Institutional (N.A.), Inc.) (registered investment adviser); Director and Chief Executive, Invesco Administration Services Limited and Invesco Global Investment Funds Limited; Director, Invesco Distributors, Inc.; Head of EMEA, Invesco Ltd.; President, Invesco Actively Managed Exchange-Traded Commodity Fund Trust, Invesco Actively Managed Exchange-Traded Fund Trust, Invesco Exchange-Traded Fund Trust, Invesco Exchange-Traded Fund Trust II and Invesco India Exchange-Traded Fund Trust; Managing Director and Principal Executive Officer, Invesco Capital Management LLC | | | N/A | | | N/A |
T-5 Invesco Global Opportunities Fund
Trustees and Officers–(continued)
| | | | | | | | | | |
Name, Year of Birth and
Position(s) Held with the Trust | | Trustee and/or Officer Since | | Principal Occupation(s)
During Past 5 Years | | Number of
Funds in
Fund Complex
Overseen by
Trustee | | | Other
Directorship(s)
Held by Trustee
During Past
5 Years |
Other Officers–(continued) | | | | | | |
John M. Zerr – 1962 Senior Vice President | | 2006 | | Chief Operating Officer of the Americas; Senior Vice President, Invesco Advisers, Inc. (formerly known as Invesco Institutional (N.A.), Inc.) (registered investment adviser); Senior Vice President, Invesco Distributors, Inc. (formerly known as Invesco AIM Distributors, Inc.); Director and Vice President, Invesco Investment Services, Inc. (formerly known as Invesco AIM Investment Services, Inc.) Senior Vice President, The Invesco Funds; Managing Director, Invesco Capital Management LLC; Director, Invesco Investment Advisers LLC (formerly known as Van Kampen Asset Management); Senior Vice President, Invesco Capital Markets, Inc. (formerly known as Van Kampen Funds Inc.); Manager, Invesco Indexing LLC; Manager, Invesco Specialized Products, LLC; Director and Senior Vice President, Invesco Insurance Agency, Inc.; Member, Invesco Canada Funds Advisory Board; Director, President and Chief Executive Officer, Invesco Corporate Class Inc. (corporate mutual fund company); and Director, Chairman, President and Chief Executive Officer, Invesco Canada Ltd. (formerly known as Invesco Trimark Ltd./Invesco Trimark Ltèe) (registered investment adviser and registered transfer agent) Formerly: Director and Senior Vice President, Invesco Management Group, Inc. (formerly known as Invesco AIM Management Group, Inc.); Secretary and General Counsel, Invesco Management Group, Inc. (formerly known as Invesco AIM Management Group, Inc.); Secretary, Invesco Investment Services, Inc. (formerly known as Invesco AIM Investment Services, Inc.); Chief Legal Officer and Secretary, The Invesco Funds; Secretary and General Counsel, Invesco Investment Advisers LLC (formerly known as Van Kampen Asset Management); Secretary and General Counsel, Invesco Capital Markets, Inc. (formerly known as Van Kampen Funds Inc.); Chief Legal Officer, Invesco Exchange-Traded Fund Trust, Invesco Exchange-Traded Fund Trust II, Invesco India Exchange-Traded Fund Trust, Invesco Actively Managed Exchange-Traded Fund Trust, Invesco Actively Managed Exchange-Traded Commodity Fund Trust and Invesco Exchange-Traded Self-Indexed Fund Trust; Secretary, Invesco Indexing LLC; Director, Secretary, General Counsel and Senior Vice President, Van Kampen Exchange Corp.; Director, Vice President and Secretary, IVZ Distributors, Inc. (formerly known as INVESCO Distributors, Inc.); Director and Vice President, INVESCO Funds Group, Inc.; Director and Vice President, Van Kampen Advisors Inc.; Director, Vice President, Secretary and General Counsel, Van Kampen Investor Services Inc.; Director and Secretary, Invesco Distributors, Inc. (formerly known as Invesco AIM Distributors, Inc.); Director, Senior Vice President, General Counsel and Secretary, Invesco AIM Advisers, Inc. and Van Kampen Investments Inc.; Director, Vice President and Secretary, Fund Management Company; Director, Senior Vice President, Secretary, General Counsel and Vice President, Invesco AIM Capital Management, Inc.; Chief Operating Officer and General Counsel, Liberty Ridge Capital, Inc. (an investment adviser) | | | N/A | | | N/A |
Gregory G. McGreevey – 1962 Senior Vice President | | 2012 | | Senior Managing Director, Invesco Ltd.; Director, Chairman, President, and Chief Executive Officer, Invesco Advisers, Inc. (formerly known as Invesco Institutional (N.A.), Inc.) (registered investment adviser); Director, Invesco Mortgage Capital, Inc. and Invesco Senior Secured Management, Inc.; and Senior Vice President, The Invesco Funds; and President, SNW Asset Management Corporation Formerly: Senior Vice President, Invesco Management Group, Inc. and Invesco Advisers, Inc.; Assistant Vice President, The Invesco Funds | | | N/A | | | N/A |
Kelli Gallegos – 1970 Vice President, Principal Financial Officer and Assistant Treasurer | | 2008 | | Principal Financial and Accounting Officer – Investments Pool, Invesco Specialized Products, LLC; Vice President, Principal Financial Officer and Assistant Treasurer, The Invesco Funds; Principal Financial and Accounting Officer – Pooled Investments, Invesco Capital Management LLC; Vice President and Treasurer, Invesco Exchange-Traded Fund Trust, Invesco Exchange-Traded Fund Trust II, Invesco India Exchange-Traded Fund Trust, Invesco Actively Managed Exchange-Traded Fund Trust, Invesco Actively Managed Exchange-Traded Commodity Fund Trust and Invesco Exchange-Traded Self-Indexed Fund Trust Formerly: Assistant Treasurer, Invesco Specialized Products, LLC; Assistant Treasurer, Invesco Exchange-Traded Fund Trust, Invesco Exchange-Traded Fund Trust II, Invesco India Exchange-Traded Fund Trust, Invesco Actively Managed Exchange-Traded Fund Trust, Invesco Actively Managed Exchange-Traded Commodity Fund Trust and Invesco Exchange-Traded Self-Indexed Fund Trust; Assistant Treasurer, Invesco Capital Management LLC; Assistant Vice President, The Invesco Funds | | | N/A | | | N/A |
T-6 Invesco Global Opportunities Fund
Trustees and Officers–(continued)
| | | | | | | | |
Name, Year of Birth and
Position(s) Held with the Trust | | Trustee
and/or
Officer
Since | | Principal Occupation(s) During Past 5 Years | | Number of
Funds in
Fund Complex
Overseen by
Trustee | | Other
Directorship(s)
Held by Trustee
During Past
5 Years |
Other Officers–(continued) | | | | |
Crissie M. Wisdom –1969 Anti-Money Laundering Compliance Officer | | 2013 | | Anti-Money Laundering Compliance Officer, Invesco Advisers, Inc. (formerly known as Invesco Institutional (N.A.), Inc.) (registered investment adviser), Invesco Capital Markets, Inc. (formerly known as Van Kampen Funds Inc.), Invesco Distributors, Inc., Invesco Investment Services, Inc., The Invesco Funds, and Invesco Exchange-Traded Fund Trust, Invesco Exchange-Traded Fund Trust II, Invesco India Exchange-Traded Fund Trust, Invesco Actively Managed Exchange-Traded Fund Trust, Invesco Actively Managed Exchange-Traded Commodity Fund Trust and Invesco Exchange-Traded Self-Indexed Fund Trust; Anti-Money Laundering Compliance Officer and Bank Secrecy Act Officer, INVESCO National Trust Company and Invesco Trust Company; and Fraud Prevention Manager and Controls and Risk Analysis Manager for Invesco Investment Services, Inc. Formerly: Anti-Money Laundering Compliance Officer, Van Kampen Exchange Corp. and Invesco Management Group, Inc. | | N/A | | N/A |
Robert R. Leveille – 1969 Chief Compliance Officer | | 2016 | | Chief Compliance Officer, Invesco Advisers, Inc. (registered investment adviser); and Chief Compliance Officer, The Invesco Funds Formerly: Chief Compliance Officer, Putnam Investments and the Putnam Funds | | N/A | | N/A |
The Statement of Additional Information of the Trust includes additional information about the Fund’s Trustees and is available upon request, without charge, by calling 1.800.959.4246. Please refer to the Fund’s Statement of Additional Information for information on the Fund’ssub-advisers.
Office of the Fund
11 Greenway Plaza, Suite 1000
Houston, TX 77046-1173
Counsel to the Fund
Stradley Ronon Stevens & Young, LLP
2005 Market Street, Suite 2600
Philadelphia, PA 19103-7018
Investment Adviser
Invesco Advisers, Inc.
1555 Peachtree Street, N.E.
Atlanta, GA 30309
Counsel to the Independent Trustees
Goodwin Procter LLP
901 New York Avenue, N.W.
Washington, D.C. 20001
Distributor
Invesco Distributors, Inc.
11 Greenway Plaza, Suite 1000
Houston, TX 77046-1173
Transfer Agent
Invesco Investment Services, Inc.
11 Greenway Plaza, Suite 1000
Houston, TX 77046-1173
Auditors
PricewaterhouseCoopers LLP
1000 Louisiana Street, Suite 5800
Houston, TX 77002-5678
Custodian
State Street Bank and Trust Company
225 Franklin Street
Boston, MA 02110-2801
T-7 Invesco Global Opportunities Fund
(This page intentionally left blank)
(This page intentionally left blank)
(This page intentionally left blank)

Go paperless with eDelivery
Visit invesco.com/edelivery to enjoy the convenience and security of anytime electronic access to your investment documents. With eDelivery, you can elect to have any or all of the following materials delivered straight to your inbox to download, save and print from your own computer:
∎ Fund reports and prospectuses
∎ Quarterly statements
∎ Daily confirmations
∎ Tax forms
Invesco mailing information
Send general correspondence to Invesco Investment Services, Inc., P.O. Box 219078, Kansas City, MO 64121-9078.
Important notice regarding delivery of security holder documents
To reduce Fund expenses, only one copy of most shareholder documents may be mailed to shareholders with multiple accounts at the same address (Householding). Mailing of your shareholder documents may be householded indefinitely unless you instruct us otherwise. If you do not want the mailing of these documents to be combined with those for other members of your household, please contact Invesco Investment Services, Inc. at 800 959 4246 or contact your financial institution. We will begin sending you individual copies for each account within 30 days after receiving your request.
Fund holdings and proxy voting information
The Fund provides a complete list of its holdings four times in each fiscal year, at the quarter-ends. For the second and fourth quarters, the list appears in the Fund’s semiannual and annual reports to shareholders. For the first and third quarters, the Fund files the lists with the Securities and Exchange Commission (SEC) as an exhibit to its reports on FormN-PORT. The most recent list of portfolio holdings is available at invesco.com/completeqtrholdings. Shareholders can also look up the Fund’s FormN-PORT filings on the SEC website, sec.gov. The SEC file numbers for the Fund are shown below.
A description of the policies and procedures that the Fund uses to determine how to vote proxies relating to portfolio securities is available without charge, upon request, from our Client Services department at 800 959 4246, or at invesco.com/proxyguidelines. The information is also available on the SEC website, sec.gov.
| | |
Information regarding how the Fund voted proxies related to its portfolio securities during the most recent12-month period ended June 30 is available at invesco.com/proxysearch. This information is also available on the SEC website, sec.gov. Invesco Advisers, Inc. is an investment adviser; it provides investment advisory services to individual and institutional clients and does not sell securities. Invesco Distributors, Inc. is the US distributor for Invesco Ltd.’s retail mutual funds, exchange-traded funds and institutional money market funds. Both are wholly owned, indirect subsidiaries of Invesco Ltd. | | 
|
| | | | |
| SEC file numbers: 811-06463 and 033-44611 | | Invesco Distributors, Inc. | | GLOPP-AR-1 |
| | | | |
| | |
 | | Annual Report to Shareholders | | October 31, 2019 |
| | |
| | Invesco Global Responsibility Equity Fund |
| | Nasdaq: | | |
| | A: VSQAX ∎ C: VSQCX ∎ R: VSQRX ∎ Y: VSQYX ∎ R5: VSQFX ∎ R6: VSQSX |

Letters to Shareholders
| | | | |

Andrew Schlossberg | | | | Dear Shareholders: This annual report includes information about your Fund, including performance data and a complete list of its investments as of the close of the reporting period. Inside is a discussion of how your Fund was managed and the factors that affected its performance during the reporting period. Despite marked market volatility along the way, most global equity markets produced solid gains for the reporting period. As the reporting period unfolded in the final months of 2018, global equities were reeling from a sharpsell-off. The catalyst for thesell-off was a combination of ongoing trade concerns between the US and China, fears of a global economic slowdown and lower oil prices from a supply glut. Gains posted earlier in 2018 for global equities were erased, while US Treasury bonds, along with government and municipal bonds, rallied as investors fled to “safe haven” assets. |
At the start of 2019, global equity markets rebounded strongly buoyed by more policy from central banks and optimism about a potentialUS-China trade deal. In May,US-China trade concerns and slowing global growth led to a global equitysell-off and rally in US Treasuries. Despite the Maysell-off, domestic equity markets rallied in June in anticipation of a US Federal Reserve (the Fed) interest rate cut and closed the second quarter with modest gains. ContinuedUS-China trade worries and signs of slowing global economic growth left global equity markets largely flat for the third quarter. As the reporting period came to a close in October 2019, a raft of upbeat positive corporate earnings results and a US interest rate cut buoyed domestic equity results with some domestic indices recording record highs.
The Fed, in fact, both raised and lowered the federal funds rate during the reporting period. Given signs of a strong economy, the Fed raised rates in December 2018. In 2019, however, the Fed altered its outlook on further rate hikes leaving rates unchanged for the first half of the year. In July, the Fed lowered interest rates for the first time in 11 years. It again lowered rates in September and once again in October. As the year continues to unfold, we’ll see how the interplay of interest rates, economic data, geopolitics and a host of other factors affect US and overseas equity and fixed income markets.
Investor uncertainty and market volatility, such as we witnessed during the reporting period, are unfortunate facts of life when it comes to investing. That’s why Invesco encourages investors to work with a professional financial adviser who can stress the importance of starting to save and invest early and the importance of adhering to a disciplined investment plan. A financial adviser who knows your unique financial situation, investment goals and risk tolerance can be an invaluable partner as you seek to achieve your financial goals. He or she can offer a long-term perspective when markets are volatile and time-tested advice and guidance when your financial situation or investment goals change.
Visit our website for more information on your investments
Our website, invesco.com/us, offers a wide range of market insights and investment perspectives. On the website, you’ll find detailed information about our funds, including performance, holdings and portfolio manager commentaries. You can access information about your account by completing a simple, secure online registration. To do so, select “Log In” on the right side of the homepage, and then select “Register for Individual Account Access.”
In addition to the resources accessible on our website and through our mobile app, you can obtain timely updates to help you stay informed about the markets and the economy by connecting with Invesco on Twitter, LinkedIn or Facebook. You can access our blog at blog.invesco.us.com. Our goal is to provide you the information you want, when and where you want it.
Finally, I’m pleased to share with you Invesco’s commitment to both the Principles for Responsible Investment and to considering environmental, social and governance issues in our robust investment process. I invite you to learn more at invesco.com/esg.
Have questions?
For questions about your account, contact an Invesco client services representative at 800 959 4246.
All of us at Invesco look forward to serving your investment management needs. Thank you for investing with us.
Sincerely,

Andrew Schlossberg
Head of the Americas,
Senior Managing Director, Invesco Ltd.
2 Invesco Global Responsibility Equity Fund
| | | | | | |

Bruce Crockett | | | | Dear Shareholders: Among the many important lessons I’ve learned in more than 40 years in a variety of business endeavors is the value of a trusted advocate. As independent chair of the Invesco Funds Board, I can assure you that the members of the Board are strong advocates for the interests of investors in Invesco’s mutual funds. We work hard to represent your interests through oversight of the quality of the investment management services your funds receive and other matters important to your investment, including but not limited to: ∎ Ensuring that Invesco offers a diverse lineup of mutual funds that your financial adviser can use to strive to meet your financial needs as your investment goals change over time. ∎ Monitoring how the portfolio management teams of the Invesco funds are performing in light of |
changing economic and market conditions.
∎ Assessing each portfolio management team’s investment performance within the context of the investment strategy described in the fund’s prospectus.
∎ Monitoring for potential conflicts of interests that may impact the nature of the services that your funds receive.
We believe one of the most important services we provide our fund shareholders is the annual review of the funds’ advisory andsub-advisory contracts with Invesco Advisers and its affiliates. This review is required by the Investment Company Act of 1940 and focuses on the nature and quality of the services Invesco provides as the adviser to the Invesco funds and the reasonableness of the fees that it charges for those services. Each year, we spend months carefully reviewing information received from Invesco and a variety of independent sources, such as performance and fee data prepared by Lipper, Inc. (a subsidiary of Broadridge Financial Solutions, Inc.), an independent, third-party firm widely recognized as a leader in its field. We also meet with our independent legal counsel and other independent advisers to review and help us assess the information that we have received. Our goal is to assure that you receive quality investment management services for a reasonable fee.
I trust the measures outlined above provide assurance that you have a worthy advocate when it comes to choosing the Invesco Funds.
On behalf of the Board, we look forward to continuing to represent your interests and serving your needs.
Sincerely,

Bruce L. Crockett
Independent Chair
Invesco Funds Board of Trustees
3 Invesco Global Responsibility Equity Fund
Management’s Discussion of Fund Performance
| | | | |
Performance summary For the fiscal year ended October 31, 2019, Class A shares of Invesco Global Responsibility Equity Fund (the Fund), at net asset value (NAV), underperformed the MSCI World Index, the Fund’s broad market/style-specific benchmark. Your Fund’s long-term performance appears later in this report. | |
Fund vs. Indexes | | | | |
| Total returns, October 31, 2018 to October 31, 2019, at net asset value (NAV). | | | | |
| Performance shown does not include applicable contingent deferred sales charges (CDSC) orfront-end sales charges, which would have reduced performance. | |
Class A Shares | | | 3.48% | |
Class C Shares | | | 2.66 | |
Class R Shares | | | 3.17 | |
Class Y Shares | | | 3.80 | |
Class R5 Shares | | | 3.71 | |
Class R6 Shares | | | 3.71 | |
MSCI World Indexq (Broad Market/Style-Specific Index) | | | 12.69 | |
Lipper GlobalMulti-Cap Core Funds Index∎ (Peer Group Index) | | | 10.33 | |
| |
Source(s):qRIMES Technologies Corp.;∎Lipper Inc. | | | | |
Market conditions and your Fund
The fiscal year began with global equity markets, particularly the US, declining sharply at the end of 2018 amid rising interest rates, a flattening US Treasury yield curve, signaling a possible recession, and concerns that higher inflation could result in a more restrictive monetary policy. Investors also had concerns over the Brexit negotiations, ongoing trade tensions between the US and China, declining oil prices and fears of slowing economic growth, particularly in the eurozone.
After a relatively calm start at the beginning of 2019, global equity markets faced greater volatility in the second quarter, hampered by ongoing US and China trade issues, potential for new tariffs and slowing global economic growth. Global equity markets, particularly China, declined sharply in May 2019, ending a four-month rally. Trade and tariff issues, which were not limited to the US and
China, clouded the outlook for many global economies. Disagreement within the UK about its withdrawal from the European Union increased uncertainty for the UK and eurozone economies. Following better performance in June, most global equity markets managed modest positive returns for the second quarter of 2019, with developed markets generally outperforming emerging markets. China was an exception, declining during the second quarter.
Weakening global economic data and the ongoing US and China trade conflict contributed to higher market volatility in the third quarter of 2019. During the third quarter, data released showed slowing manufacturing activity and declining business investment, which was evidence that trade tensions were stifling economic growth across both developed and emerging markets. Global recession concerns caused a sharp equitysell-off in August 2019 as investors crowded into asset classes perceived as safe havens,
including US Treasuries and gold. In September 2019, both the US Federal Reserve and European Central Bank cut interest rates, providing a measure of support for risk assets. Growing optimism about a potential trade deal between the US and China also boosted equities in September. However, except for the US and Japan, performance in most regions declined during the third quarter. Uncertainty about the UK’s withdrawal from the European Union continued to weigh on UK and European equities, while political and trade issues affected areas of Latin America and Asia.
Global equity markets gained in October 2019 amid several positive catalysts, including a US interest rate cut, optimism surrounding US and China trade negotiations, and a raft of upbeat corporate results. The UK equity market provided a flat return during October and while domestic politics continued to dominate the region, European markets made modest gains. October was also a positive month for emerging equity markets with all regions recording gains. Despite increased market volatility, global equity indexes, in both developed and emerging markets, ended the fiscal year in positive territory.
Invesco Global Responsibility Equity Fund is a globally conscious portfolio designed to provide exposure to global developed equity markets while excluding companies that do not meet certain social and environmental standards. Companies involved in fossil fuels, nuclear power, firearms and armaments, alcohol, cluster munitions, pornography, tobacco, and generic engineering of crops or animals are targeted for exclusion.
The Fund seeks to provide long-term growth of capital from this filtered universe through stock selection using a proprietary multi-factor model that evaluates fundamental and behavioral factors
| | |
Portfolio Composition |
| By sector | | % of total net assets |
| |
Information Technology | | 20.07% |
Health Care | | 14.40 |
Financials | | 13.59 |
Industrials | | 12.61 |
Consumer Discretionary | | 10.56 |
Consumer Staples | | 10.11 |
Communication Services | | 6.27 |
Materials | | 5.77 |
Real Estate | | 3.83 |
Other Sectors, Each Less than 2% of Net Assets | | 1.38 |
Money Market Funds Plus Other Assets Less Liabilities | | 1.41 |
| | |
Top 10 Equity Holdings* |
| | | % of total net assets |
| |
1. Microsoft Corp. | | 3.37% |
2. Procter & Gamble Co. (The) | | 2.22 |
3. Citigroup, Inc. | | 1.91 |
4. GlaxoSmithKline PLC | | 1.86 |
5. Oracle Corp. | | 1.72 |
6. Biogen, Inc. | | 1.63 |
7. Xerox Holdings Corp. | | 1.62 |
8. Atlas Copco AB, Class A | | 1.54 |
9. Toppan Printing Co., Ltd. | | 1.49 |
10. Roche Holding AG, BR | | 1.49 |
| | | | |
Total Net Assets | | $ | 8.7 million | |
| |
Total Number of Holdings* | | | 134 | |
The Fund’s holdings are subject to change, and there is no assurance that the Fund will continue to hold any particular security.
*Excluding money market fund holdings, if any.
Data presented here are as of October 31, 2019.
4 Invesco Global Responsibility Equity Fund
to forecast individual security returns and risks. The multi-factor model is based on three factors: Quality, Value and Momentum (Earnings and Price)1 and ranks these securities based on their attractiveness relative to industry peers.
Quantitative strategies faced challenges over the fiscal year as several sharp reversals in market sentiment, driven largely by macroeconomic events, such as trade policy and central bank policy, increased factor volatility and reduced the historical benefits of factor diversification. Typically, Value, Quality and Momentum strategies are lowly/negatively correlated. However, in the first part of the fiscal year, all the factors were negative. This is a rare occurrence and we were encouraged to see these historical relationships, especially between Value and Momentum, restored as the fiscal year ended.
The last period where our multi-factor model’s prognostic ability was this challenged was in 2009 as the markets recovered sharply from the onset of the global financial crisis. During the fiscal year, Value factors, which showed strength in 2009, showed the least efficacy. Higher quality companies were only marginally rewarded in the screened universe of investable companies, as favorable monetary policies across the globe provided relief to companies that were reliant on net external financing. As referenced earlier, Price and Earnings Momentum signals also declined and did not offset Value factors, as they had historically done, until much later in the fiscal year.
During the fiscal year, stock selection in the financials sector contributed to the Fund’s performance versus its broad market/style-specific benchmark. This, however, was offset by weaker stock selection in the information technology (IT) sector, which hampered relative results. Stock selection in the consumer discretionary, communications services and industrials sectors also detracted from the Fund’s relative performance.
From a geographic perspective, our multi-factor model showed the least efficacy in the US over the fiscal year. Given its large weighting both in the Fund and in the broad market/style-specific benchmark, the US was the largest detractor from the Fund’s relative performance. Alternatively, stock selection in Japan, the UK and France contributed to the Fund’s relative performance. In addition, the Fund’s mandate to exclude fossil fuels, alcohol and tobacco companies aided relative returns, while the exclusion
of nuclear power generators detracted, as many of these companies had double-digit returns for the fiscal year.
The Fund’s top contributor relative to its broad market/style-specific benchmark for the fiscal year wasSantander Consumer USA.The company’s shares rose after it reported better-than-expected earnings and announced a surprise return of shareholder capital via its $400 million share buyback. Also contributing to the Fund’s return was Canadian technology companyCGI Group.Its shares performed well on increased global sales and healthybook-to-bill ratio. Lastly, shares of French beauty and hair product manufacturerL’Oréalincreased as a result of favorable sales trends, particularly in Asia, as well as the company showing investors its prudent use of capital in makingbolt-on acquisitions.
The Fund’s largest detractor relative to its broad market/style-specific benchmark for the fiscal year was Singapore-basedYangzijiang Shipbuilding.The company’s executive chairman and controlling shareholder took a surprise leave of absence to assist the Chinese government in a confidential investigation. We sold our shares in Yangzijiang Shipbuilding before the close of the fiscal year, as the uncertainty over the company’s leadership would likely be the main driver of its future performance. Also detracting from the Fund’s absolute and relative returns wereUS-based department store retailersKohl’sandMacy’s,which suffered early in the fiscal year as a result of weak earnings results. We exited our positions in these companies before the close of the fiscal year.
At the end of the fiscal year, the Fund had overweight allocations to the consumer discretionary, health care, industrials and IT sectors relative to its broad market/style-specific benchmark. The Fund had underweight allocations to the communications services, energy, financials and utilities sectors.
From a geographic perspective, the Fund’s largest overweight allocations were to Canada, France and Sweden at the end of the fiscal year. The Fund held underweight allocations to the US and Germany.
Please note, the Fund’s strategy is principally implemented through equity investments, but we may also use futures contracts, a derivative instrument, to gain exposure to the equity markets. During the fiscal year, the Fund invested in MSCI World Index futures contracts, which generated a positive return. These contracts were closed by the end of the
fiscal year. Derivatives can be a cost-effective way to gain exposure to asset classes. However, derivatives may amplify traditional investment risks through the creation of leverage and may be less liquid than traditional securities.
Thank you for your investment in Invesco Global Responsibility Equity Fund.
| 1 | The Model’s factors – Quality, Value and Momentum (Earnings and Price) are the foundation of the Fund’s stock selection process. Quality factors assess capital efficiency and stewardship while Value factors evaluate cash flow, dividend and earnings yields. Factors considered in Momentum include, but are not limited to, earnings momentum and earnings revisions and measures of stock price momentum. |
Portfolio managers:
Michael Abata
Nils Huter
Robert Nakouzi
Manuela von Ditfurth
The views and opinions expressed in management’s discussion of Fund performance are those of Invesco Advisers, Inc. These views and opinions are subject to change at any time based on factors such as market and economic conditions. These views and opinions may not be relied upon as investment advice or recommendations, or as an offer for a particular security. The information is not a complete analysis of every aspect of any market, country, industry, security or the Fund. Statements of fact are from sources considered reliable, but Invesco Advisers, Inc. makes no representation or warranty as to their completeness or accuracy. Although historical performance is no guarantee of future results, these insights may help you understand our investment management philosophy.
See important Fund and, if applicable, index disclosures later in this report.
5 Invesco Global Responsibility Equity Fund
Your Fund’s Long-Term Performance
Results of a $10,000 Investment – Oldest Share Class(es) since Inception
Fund and index data from 7/1/16
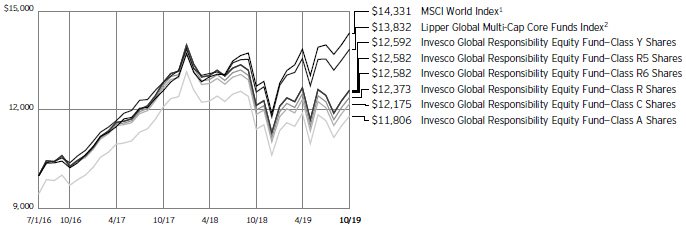
1 Source: RIMES Technologies Corp.
2 Source: Lipper Inc.
Past performance cannot guarantee comparable future results.
The data shown in the chart include reinvested distributions, applicable sales charges and Fund expenses including
management fees. Index results include reinvested dividends, but they do not reflect sales charges. Performance of the peer group, if applicable, reflects fund expenses and management fees; performance
of a market index does not. Performance shown in the chart does not reflect deduction of taxes a shareholder would pay on Fund distributions or sale of Fund shares.
6 Invesco Global Responsibility Equity Fund
| | | | |
Average Annual Total Returns | |
| As of 10/31/19, including maximum applicable sales charges | |
| |
Class A Shares | | | | |
Inception (7/1/16) | | | 5.11% | |
1 Year | | | -2.17 | |
| |
Class C Shares | | | | |
Inception (7/1/16) | | | 6.08% | |
1 Year | | | 1.66 | |
| |
Class R Shares | | | | |
Inception (7/1/16) | | | 6.59% | |
1 Year | | | 3.17 | |
| |
Class Y Shares | | | | |
Inception (7/1/16) | | | 7.16% | |
1 Year | | | 3.80 | |
| |
Class R5 Shares | | | | |
Inception (7/1/16) | | | 7.13% | |
1 Year | | | 3.71 | |
| |
Class R6 Shares | | | | |
Inception (7/1/16) | | | 7.13% | |
1 Year | | | 3.71 | |
The performance data quoted represent past performance and cannot guarantee comparable future results; current performance may be lower or higher. Please visit invesco.com/ performance for the most recentmonth-end performance. Performance figures reflect reinvested distributions, changes in net asset value and the effect of the maximum sales charge unless otherwise stated. Performance figures do not reflect deduction of taxes a shareholder would pay on Fund distributions or sale of Fund shares. Investment return and principal value will fluctuate so that you may have a gain or loss when you sell shares.
The net annual Fund operating expense ratio set forth in the most recent Fund prospectus as of the date of this report for Class A, Class C, Class R, Class Y, Class R5 and Class R6 shares was 0.85%, 1.60%, 1.10%, 0.60%, 0.60% and 0.60%, respectively.1,2 The total annual Fund operating expense ratio set forth in the most recent Fund prospectus as of the date of this report for Class A, Class C, Class R, Class Y, Class R5 and Class R6 shares was 3.40%, 4.15%, 3.65%, 3.15%, 2.93% and 2.88%, respectively. The expense ratios presented above may vary from the expense ratios presented in other sections of this report that are based on expenses incurred during the period covered by this report.
| | | | |
Average Annual Total Returns | |
| As of 9/30/19, the most recent calendar quarter end, including maximum applicable sales charges | |
| |
Class A Shares | | | | |
Inception (7/1/16) | | | 4.42% | |
1 Year | | | -12.33 | |
| |
Class C Shares | | | | |
Inception (7/1/16) | | | 5.43% | |
1 Year | | | -8.92 | |
| |
Class R Shares | | | | |
Inception (7/1/16) | | | 5.96% | |
1 Year | | | -7.50 | |
| |
Class Y Shares | | | | |
Inception (7/1/16) | | | 6.51% | |
1 Year | | | -7.01 | |
| |
Class R5 Shares | | | | |
Inception (7/1/16) | | | 6.48% | |
1 Year | | | -7.09 | |
| |
Class R6 Shares | | | | |
Inception (7/1/16) | | | 6.48% | |
1 Year | | | -7.09 | |
Class A share performance reflects the maximum 5.50% sales charge, and Class C share performance reflects the applicable contingent deferred sales charge (CDSC) for the period involved. The CDSC on Class C shares is 1% for the first year after purchase. Class R, Class Y, Class R5 and Class R6 shares do not have afront-end sales charge or a CDSC; therefore, performance is at net asset value.
The performance of the Fund’s share classes will differ primarily due to different sales charge structures and class expenses.
Fund performance reflects any applicable fee waivers and/or expense reimbursements. Had the adviser not waived fees and/or reimbursed expenses currently or in the past, returns would have been lower. See current prospectus for more information.
| 1 | Total annual Fund operating expenses after any contractual fee waivers and/or expense reimbursements by the adviser in effect through at least February 28, 2021. See current prospectus for more information. |
| 2 | Total annual Fund operating expenses after any contractual fee waivers and/or expense reimbursements by the adviser in effect through at least June 30, 2021. See current prospectus for more information. |
7 Invesco Global Responsibility Equity Fund
Invesco Global Responsibility Equity Fund’s investment objective is long-term growth of capital.
∎ Unless otherwise stated, information presented in this report is as of October 31, 2019, and is based on total net assets.
∎ Unless otherwise noted, all data provided by Invesco.
∎ To access your Fund’s reports/prospectus, visit invesco.com/fundreports.
About share classes
| ∎ | Class R sharesare generally available only to employer sponsored retirement and benefit plans. Please see the prospectus for more information. |
| ∎ | Class Y sharesare available only to certain investors. Please see the prospectus for more information. |
| ∎ | Class R5 sharesandClass R6 sharesare available for use by retirement plans that meet certain standards and for institutional investors. Class R6 shares are also available through intermediaries that have established an agreement with Invesco Distributors, Inc. to make such shares available for use in retail omnibus accounts. Please see the prospectus for more information. |
Principal risks of investing in the Fund
| ∎ | Active trading risk.Active trading of portfolio securities may result in added expenses, a lower return and increased tax liability. |
| ∎ | Depositary receipts risk.Investing in depositary receipts involves the same risks as direct investments in foreign securities. In addition, the underlying issuers of certain depositary receipts are under no obligation to distribute shareholder communications or pass through any voting rights with respect to the deposited securities to the holders of such receipts. The Fund may therefore receive less timely information or have less control than if it invested directly in the foreign issuer. |
| ∎ | Derivatives risk.The value of a derivative instrument depends largely on (and is derived from) the value of an underlying security, currency, commodity, interest rate, index or other asset (each referred to as an underlying asset). In addition to risks relating to the underlying assets, the use of derivatives may include other, possibly greater, risks, including counterparty, leverage and liquidity risks. Counterparty risk is the risk that the |
| | counterparty to the derivative contract will default on its obligation to pay the Fund the amount owed or otherwise perform under the derivative contract. Derivatives create leverage risk because they do not require payment up front equal to the economic exposure created by holding a position in the derivative. As a result, an adverse change in the value of the underlying asset could result in the Fund sustaining a loss that is substantially greater than the amount invested in the derivative or the anticipated value of the underlying asset, which may make the Fund’s returns more volatile and increase the risk of loss. Derivative instruments may also be less liquid than more traditional investments and the Fund may be unable to sell or close out its derivative positions at a desirable time or price. This risk may be more acute under adverse market conditions, during which the Fund may be most in need of liquidating its derivative positions. Derivatives may also be harder to value, less tax efficient and subject to changing government regulation that could impact the Fund’s ability to use certain derivatives or their cost. Derivatives strategies may not always be successful. For example, derivatives used for hedging or to gain or limit exposure to a particular market segment may not provide the expected benefits, particularly during adverse market conditions. |
| ∎ | Environmental and social investing risk.Because the Fund uses environmental and social factors to exclude certain investments fornon-financial reasons, the Fund may forego some market opportunities available to other funds that do not use these criteria. Further, there is a risk that information used by the Fund to evaluate the environmental and social factors may not be readily available, complete or accurate, which could negatively impact the Fund’s ability to |
| | apply its environmental and social standards, which may negatively impact the Fund’s performance. |
| ∎ | Foreign securities risk.The Fund’s foreign investments may be adversely affected by political and social instability, changes in economic or taxation policies, difficulty in enforcing obligations, decreased liquidity or increased volatility. Foreign investments also involve the risk of the possible seizure, nationalization or expropriation of the issuer or foreign deposits (in which the Fund could lose its entire investments in a certain market) and the possible adoption of foreign governmental restrictions such as exchange controls. Unless the Fund has hedged its foreign securities risk, foreign securities risk also involves the risk of negative foreign currency rate fluctuations, which may cause the value of securities denominated in such foreign currency (or other instruments through which the Fund has exposure to foreign currencies) to decline in value. Currency exchange rates may fluctuate significantly over short periods of time. Currency hedging strategies, if used, are not always successful. |
| ∎ | Geographic focus risk.The Fund may from time to time invest a substantial amount of its assets in securities of issuers located in a single country or a limited number of countries. Adverse economic, political or social conditions in those countries may therefore have a significant negative impact on the Fund’s investment performance. |
| ∎ | Investing in the European Union risk. Investments in certain countries in the European Union are susceptible to high economic risks associated with high levels of debt, such as investments in sovereign debt of Greece, Italy and Spain. Efforts of the member states to further unify their economic and monetary policies may increase the potential for the downward movement of one member state’s market to cause a similar effect on other member states’ markets. Separately, |
| | |
| This report must be accompanied or preceded by a currently effective Fund prospectus, which contains more complete information, including sales charges and expenses. Investors should read it carefully before investing. | | |
| | | |
NOT FDIC INSURED | MAY LOSE VALUE | NO BANK GUARANTEE | | |
8 Invesco Global Responsibility Equity Fund
| | the European Union faces issues involving its membership, structure, procedures and policies. The exit of one or more member states from the European Union, such as the United Kingdom (UK) which has announced its intention to exit, would place its currency and banking system in jeopardy. The exit by the UK or other member states will likely result in increased volatility, illiquidity and potentially lower economic growth in the affected markets, which will adversely affect the Fund’s investments. |
| ∎ | Management risk.The Fund is actively managed and depends heavily on the Adviser’s judgment about markets, interest rates or the attractiveness, relative values, liquidity, or potential appreciation of particular investments made for the Fund’s portfolio. The Fund could experience losses if these judgments prove to be incorrect. Additionally, legislative, regulatory, or tax developments may adversely affect management of the Fund and, therefore, the ability of the Fund to achieve its investment objective. |
| ∎ | Market risk.The market values of the Fund’s investments, and therefore the value of the Fund’s shares, will go up and down, sometimes rapidly or unpredictably. Market risk may affect a single issuer, industry or section of the economy, or it may affect the market as a whole. Individual stock prices tend to go up and down more dramatically than those of certain other types of investments, such as bonds. During a general downturn in the financial markets, multiple asset classes may decline in value. When markets perform well, there can be no assurance that specific investments held by the Fund will rise in value. |
| ∎ | Preferred securities risk.Preferred securities are subject to issuer-specific and market risks applicable generally to equity securities. Preferred securities also may be subordinated to bonds or other debt instruments, subjecting them to a greater risk ofnon-payment, may be less liquid than many other securities, such as common stocks, and generally offer no voting rights with respect to the issuer. |
| ∎ | REIT risk/Real estate risk.Investments in real estate related instruments may be affected by economic, legal, cultural, environmental or technological factors that affect property values, rents or occupancies of real estate related to the Fund’s holdings. Shares |
| | of real estate related companies, which tend to be small- andmid-cap companies, may be more volatile and less liquid. |
| ∎ | Small- andmid-capitalization companies risks.Small- andmid-capitalization companies tend to be more vulnerable to changing market conditions, may have little or no operating history or track record of success, and may have more limited product lines and markets, less experienced management and fewer financial resources than larger companies. These companies’ securities may be more volatile and less liquid than those of more established companies, and their returns may vary, sometimes significantly, from the overall securities market. |
About indexes used in this report
| ∎ | TheMSCI World IndexSMis an unmanaged index considered representative of stocks of developed countries. The index is computed using the net return, which withholds applicable taxes fornon-resident investors. |
| ∎ | TheLipper GlobalMulti-Cap Core Funds Indexis an unmanaged index considered representative of globalmulti-cap core funds tracked by Lipper. |
| ∎ | The Fund is not managed to track the performance of any particular index, including the index(es) described here, and consequently, the performance of the Fund may deviate significantly from the performance of the index(es). |
| ∎ | A direct investment cannot be made in an index. Unless otherwise indicated, index results include reinvested dividends, and they do not reflect sales charges. Performance of the peer group, if applicable, reflects fund expenses; performance of a market index does not. |
Other information
| ∎ | The returns shown in management’s discussion of Fund performance are based on net asset values (NAVs) calculated for shareholder transactions. Generally accepted accounting principles require adjustments to be made to the net assets of the Fund at period end for financial reporting purposes, and as such, the NAVs for shareholder transactions and the returns based on those NAVs may differ from the NAVs and returns reported in the Financial Highlights. |
| ∎ | Industry classifications used in this report are generally according to the Global Industry Classification Standard, which was developed by and is the exclusive property and a service mark of MSCI Inc. and Standard & Poor’s. |
9 Invesco Global Responsibility Equity Fund
Schedule of Investments
October 31, 2019
| | | | | | | | |
| | | Shares | | | Value | |
| |
Common Stocks & Other Equity Interests–98.59% | |
| | |
Australia–2.19% | | | | | | | | |
| | |
Fortescue Metals Group Ltd. | | | 21,250 | | | $ | 128,703 | |
| |
| | |
Magellan Financial Group Ltd. | | | 1,259 | | | | 41,692 | |
| |
| | |
Newcrest Mining Ltd. | | | 891 | | | | 19,460 | |
| |
| | |
| | | | | | | 189,855 | |
| |
| | |
Canada–5.12% | | | | | | | | |
| | |
CGI, Inc.(a) | | | 1,558 | | | | 121,106 | |
| |
| | |
Gildan Activewear, Inc. | | | 790 | | | | 20,184 | |
| |
| | |
Hydro One Ltd.(b) | | | 6,463 | | | | 120,172 | |
| |
| | |
Kinross Gold Corp.(a) | | | 3,974 | | | | 19,310 | |
| |
| | |
Manulife Financial Corp. | | | 2,092 | | | | 38,962 | |
| |
| | |
Thomson Reuters Corp. | | | 1,860 | | | | 124,993 | |
| |
| | |
| | | | | | | 444,727 | |
| |
| | |
Denmark–0.65% | | | | | | | | |
| | |
Novo Nordisk A/S, Class B | | | 1,033 | | | | 56,875 | |
| |
| | |
Finland–0.23% | | | | | | | | |
| | |
Metso Oyj | | | 525 | | | | 19,846 | |
| |
| | |
France–4.10% | | | | | | | | |
| | |
Air Liquide S.A. | | | 152 | | | | 20,201 | |
| |
Faurecia S.E. | | | 528 | | | | 24,631 | |
| |
L’Oreal S.A. | | | 344 | | | | 100,481 | |
| |
Peugeot S.A. | | | 5,058 | | | | 128,151 | |
| |
Publicis Groupe S.A. | | | 695 | | | | 29,878 | |
| |
Schneider Electric S.E. | | | 570 | | | | 53,102 | |
| |
| | | | | | | 356,444 | |
| |
| | |
Germany–1.31% | | | | | | | | |
| | |
adidas AG | | | 184 | | | | 56,752 | |
| |
HeidelbergCement AG | | | 765 | | | | 56,846 | |
| |
| | | | | | | 113,598 | |
| |
| | |
Hong Kong–0.52% | | | | | | | | |
| | |
HKT Trust & HKT Ltd. | | | 29,000 | | | | 44,986 | |
| |
| | |
Ireland–0.81% | | | | | | | | |
| | |
AerCap Holdings N.V.(a) | | | 916 | | | | 53,018 | |
| |
CRH PLC | | | 474 | | | | 17,302 | |
| |
| | |
| | | | | | | 70,320 | |
| |
| | |
Israel–0.43% | | | | | | | | |
| | |
Israel Discount Bank Ltd., Class A | | | 4,052 | | | | 18,524 | |
| |
| | |
Teva Pharmaceutical Industries Ltd., ADR(a) | | | 2,265 | | | | 18,460 | |
| |
| | |
| | | | | | | 36,984 | |
| |
| | |
Italy–0.20% | | | | | | | | |
| | |
Buzzi Unicem S.p.A. | | | 706 | | | | 17,105 | |
| |
| | | | | | | | |
| | | Shares | | | Value | |
| |
Japan–9.26% | | | | | | | | |
| | |
AGC, Inc. | | | 3,600 | | | $ | 126,202 | |
| |
| | |
Ajinomoto Co., Inc. | | | 1,000 | | | | 18,974 | |
| |
| | |
Amada Holdings Co. Ltd. | | | 6,200 | | | | 70,450 | |
| |
| | |
Astellas Pharma, Inc. | | | 1,900 | | | | 32,623 | |
| |
| | |
Dai Nippon Printing Co., Ltd. | | | 4,800 | | | | 127,913 | |
| |
| | |
Hitachi, Ltd. | | | 1,200 | | | | 44,743 | |
| |
| | |
Japan Post Insurance Co. Ltd. | | | 1,600 | | | | 25,208 | |
| |
| | |
Kamigumi Co. Ltd. | | | 700 | | | | 15,857 | |
| |
| | |
Kao Corp. | | | 500 | | | | 40,220 | |
| |
| | |
Konica Minolta, Inc. | | | 8,400 | | | | 61,358 | |
| |
| | |
Nippon Electric Glass Co. Ltd. | | | 1,600 | | | | 35,984 | |
| |
| | |
Nissan Motor Co. Ltd. | | | 4,700 | | | | 29,789 | |
| |
| | |
Sekisui House Ltd. | | | 900 | | | | 19,399 | |
| |
Suzuken Co., Ltd. | | | 500 | | | | 26,589 | |
| |
Toppan Printing Co., Ltd. | | | 7,000 | | | | 129,015 | |
| |
| | | | | | | 804,324 | |
| |
| | |
Jordan–0.54% | | | | | | | | |
| | |
Hikma Pharmaceuticals PLC | | | 1,788 | | | | 46,616 | |
| |
| | |
Netherlands–1.81% | | | | | | | | |
| | |
ASM International N.V. | | | 396 | | | | 39,806 | |
| |
NXP Semiconductors N.V. | | | 424 | | | | 48,200 | |
| |
Signify N.V. | | | 760 | | | | 22,288 | |
| |
Wolters Kluwer N.V. | | | 637 | | | | 46,914 | |
| |
| | | | | | | 157,208 | |
| |
| | |
Sweden–3.81% | | | | | | | | |
| | |
Atlas Copco AB, Class A | | | 3,780 | | | | 133,613 | |
| |
Boliden AB(a) | | | 4,657 | | | | 125,293 | |
| |
Hennes & Mauritz AB, Class B | | | 3,443 | | | | 71,965 | |
| |
| | | | | | | 330,871 | |
| |
| | |
Switzerland–3.83% | | | | | | | | |
| | |
LafargeHolcim Ltd.(a) | | | 444 | | | | 22,912 | |
| |
Nestle S.A. | | | 700 | | | | 74,744 | |
| |
Novartis AG | | | 733 | | | | 64,033 | |
| |
Roche Holding AG | | | 138 | | | | 41,622 | |
| |
Roche Holding AG, BR | | | 433 | | | | 128,987 | |
| |
| | | | | | | 332,298 | |
| |
| | |
United Kingdom–5.78% | | | | | | | | |
| | |
Auto Trader Group PLC(b) | | | 16,066 | | | | 117,149 | |
| |
Avast PLC(b) | | | 3,403 | | | | 18,289 | |
| |
Coca-Cola European Partners PLC | | | 837 | | | | 44,788 | |
| |
Fiat Chrysler Automobiles N.V. | | | 4,095 | | | | 63,856 | |
| |
GlaxoSmithKline PLC | | | 7,050 | | | | 161,581 | |
| |
Greggs PLC | | | 2,529 | | | | 58,223 | |
| |
Tate & Lyle PLC | | | 2,439 | | | | 21,268 | |
| |
WPP PLC | | | 1,372 | | | | 17,146 | |
| |
| | | | | | | 502,300 | |
| |
See accompanying Notes to Financial Statements which are an integral part of the financial statements.
10 Invesco Global Responsibility Equity Fund
| | | | | | | | |
| | | Shares | | | Value | |
| |
| | |
United States–58.00% | | | | | | | | |
AbbVie, Inc. | | | 651 | | | $ | 51,787 | |
| |
Aflac, Inc. | | | 1,103 | | | | 58,635 | |
| |
AGCO Corp. | | | 616 | | | | 47,241 | |
| |
Akamai Technologies, Inc.(a) | | | 331 | | | | 28,632 | |
| |
Alexion Pharmaceuticals, Inc.(a) | | | 357 | | | | 37,628 | |
| |
Ally Financial, Inc. | | | 3,844 | | | | 117,742 | |
| |
Alphabet, Inc., Class C(a) | | | 91 | | | | 114,670 | |
| |
Ameriprise Financial, Inc. | | | 278 | | | | 41,947 | |
| |
AmerisourceBergen Corp. | | | 485 | | | | 41,409 | |
| |
Apple, Inc. | | | 372 | | | | 92,539 | |
| |
Applied Materials, Inc. | | | 657 | | | | 35,649 | |
| |
Athene Holding Ltd., Class A(a) | | | 2,063 | | | | 89,431 | |
| |
AutoNation, Inc.(a) | | | 334 | | | | 16,984 | |
| |
AutoZone, Inc.(a) | | | 111 | | | | 127,026 | |
| |
Bank of America Corp. | | | 642 | | | | 20,075 | |
| |
Biogen, Inc.(a) | | | 473 | | | | 141,290 | |
| |
Booking Holdings, Inc.(a) | | | 15 | | | | 30,732 | |
| |
Broadcom, Inc. | | | 89 | | | | 26,064 | |
| |
Cadence Design Systems, Inc.(a) | | | 962 | | | | 62,867 | |
| |
CF Industries Holdings, Inc. | | | 1,221 | | | | 55,372 | |
| |
Cisco Systems, Inc. | | | 1,350 | | | | 64,139 | |
| |
Citigroup, Inc. | | | 2,305 | | | | 165,637 | |
| |
DENTSPLY SIRONA, Inc. | | | 1,120 | | | | 61,354 | |
| |
Discover Financial Services | | | 1,405 | | | | 112,765 | |
| |
Discovery, Inc., Class C(a) | | | 1,251 | | | | 31,575 | |
| |
Ecolab, Inc. | | | 97 | | | | 18,631 | |
| |
Equity Residential | | | 1,210 | | | | 107,279 | |
| |
Essex Property Trust, Inc. | | | 380 | | | | 124,309 | |
| |
Expedia Group, Inc. | | | 127 | | | | 17,356 | |
| |
Facebook, Inc., Class A(a) | | | 363 | | | | 69,569 | |
| |
Fifth Third Bancorp | | | 3,403 | | | | 98,959 | |
| |
FleetCor Technologies, Inc.(a) | | | 110 | | | | 32,364 | |
| |
Ford Motor Co. | | | 9,182 | | | | 78,873 | |
| |
Fortinet, Inc.(a) | | | 201 | | | | 16,394 | |
| |
General Mills, Inc. | | | 1,265 | | | | 64,338 | |
| |
General Motors Co. | | | 1,994 | | | | 74,097 | |
| |
Gilead Sciences, Inc. | | | 1,940 | | | | 123,597 | |
| |
HCA Healthcare, Inc. | | | 277 | | | | 36,991 | |
| |
Hershey Co. (The) | | | 778 | | | | 114,265 | |
| |
Hewlett Packard Enterprise Co. | | | 5,980 | | | | 98,132 | |
| |
HP, Inc. | | | 6,259 | | | | 108,719 | |
| |
Incyte Corp.(a) | | | 616 | | | | 51,695 | |
| |
Jabil, Inc. | | | 743 | | | | 27,357 | |
| |
Johnson Controls International PLC | | | 2,306 | | | | 99,919 | |
| |
| | | | | | | | |
| | | Shares | | | Value | |
| |
| | |
United States–(continued) | | | | | | | | |
JPMorgan Chase & Co. | | | 924 | | | $ | 115,426 | |
| |
Kimberly-Clark Corp. | | | 592 | | | | 78,665 | |
| |
Lam Research Corp. | | | 151 | | | | 40,927 | |
| |
Leidos Holdings, Inc. | | | 213 | | | | 18,367 | |
| |
McKesson Corp. | | | 846 | | | | 112,518 | |
| |
MetLife, Inc. | | | 1,105 | | | | 51,703 | |
| |
Microsoft Corp. | | | 2,039 | | | | 292,331 | |
| |
Mid-America Apartment Communities, Inc. | | | 125 | | | | 17,374 | |
| |
Mondelez International, Inc., Class A | | | 2,423 | | | | 127,086 | |
| |
New York Community Bancorp, Inc. | | | 4,230 | | | | 49,280 | |
| |
NortonLifeLock, Inc. | | | 1,107 | | | | 25,328 | |
| |
Nuance Communications, Inc.(a) | | | 1,428 | | | | 23,305 | |
| |
NVR, Inc.(a) | | | 5 | | | | 18,183 | |
| |
Omnicom Group, Inc. | | | 546 | | | | 42,146 | |
| |
Oracle Corp. | | | 2,737 | | | | 149,139 | |
| |
PACCAR, Inc. | | | 323 | | | | 24,567 | |
| |
Perspecta, Inc. | | | 615 | | | | 16,322 | |
Procter & Gamble Co. (The) | | | 1,548 | | | | 192,741 | |
| |
Public Storage | | | 99 | | | | 22,063 | |
| |
PulteGroup, Inc. | | | 1,490 | | | | 58,468 | |
| |
Santander Consumer USA Holdings, Inc. | | | 2,314 | | | | 58,035 | |
| |
SBA Communications Corp., Class A | | | 254 | | | | 61,125 | |
| |
Synchrony Financial | | | 596 | | | | 21,081 | |
| |
Synopsys, Inc.(a) | | | 547 | | | | 74,255 | |
| |
TEGNA, Inc. | | | 5,126 | | | | 77,044 | |
| |
U.S. Bancorp | | | 962 | | | | 54,853 | |
| |
Universal Health Services, Inc., Class B | | | 110 | | | | 15,121 | |
| |
Whirlpool Corp. | | | 144 | | | | 21,905 | |
| |
Xerox Holdings Corp. | | | 4,151 | | | | 140,843 | |
| |
| | | | | | | 5,036,235 | |
| |
Total Common Stocks & Other Equity Interests
(Cost $8,113,899) | | | | 8,560,592 | |
| |
| | |
Money Market Funds–1.16% | | | | | | | | |
| | |
Invesco Government & Agency Portfolio, Institutional Class, 1.71%(c) | | | 35,294 | | | | 35,294 | |
| |
Invesco Liquid Assets Portfolio, Institutional Class, 1.90%(c) | | | 25,222 | | | | 25,232 | |
| |
Invesco Treasury Portfolio, Institutional Class, 1.66%(c) | | | 40,335 | | | | 40,335 | |
| |
Total Money Market Funds
(Cost $100,858) | | | | | | | 100,861 | |
| |
TOTAL INVESTMENTS IN SECURITIES-99.75%
(Cost $8,214,757) | | | | | | | 8,661,453 | |
| |
OTHER ASSETS LESS LIABILITIES-0.25% | | | | 22,113 | |
| |
NET ASSETS-100.00% | | | | | | $ | 8,683,566 | |
| |
Investment Abbreviations:
| | |
| ADR | | – American Depositary Receipt |
| BR | | – Bearer Shares |
See accompanying Notes to Financial Statements which are an integral part of the financial statements.
11 Invesco Global Responsibility Equity Fund
Notes to Schedule of Investments:
| (a) | Non-income producing security. |
| (b) | Security purchased or received in a transaction exempt from registration under the Securities Act of 1933, as amended (the “1933 Act”). The security may be resold pursuant to an exemption from registration under the 1933 Act, typically to qualified institutional buyers. The aggregate value of these securities at October 31, 2019 was $255,610, which represented 2.94% of the Fund’s Net Assets. |
| (c) | The money market fund and the Fund are affiliated by having the same investment adviser. The rate shown is the7-day SEC standardized yield as of October 31, 2019. |
See accompanying Notes to Financial Statements which are an integral part of the financial statements.
12 Invesco Global Responsibility Equity Fund
Statement of Assets and Liabilities
October 31, 2019
| | | | |
Assets: | | | | |
Investments in securities, at value
(Cost $8,113,899) | | $ | 8,560,592 | |
| |
Investments in affiliated money market funds, at
value (Cost $100,858) | | | 100,861 | |
| |
Foreign currencies, at value (Cost $1,249) | | | 1,250 | |
| |
Receivable for: | | | | |
Investments sold | | | 34,444 | |
| |
Fund expenses absorbed | | | 23,490 | |
| |
Dividends | | | 17,033 | |
| |
Fund shares sold | | | 3,432 | |
| |
Investment for trustee deferred compensation and retirement plans | | | 8,964 | |
| |
Other assets | | | 26,250 | |
| |
Total assets | | | 8,776,316 | |
| |
| |
Liabilities: | | | | |
| |
Payable for: | | | | |
Investments purchased | | | 30,402 | |
| |
Accrued fees to affiliates | | | 2,138 | |
| |
Accrued trustees’ and officers’ fees and benefits | | | 1,502 | |
| |
Accrued other operating expenses | | | 49,744 | |
| |
Trustee deferred compensation and retirement plans | | | 8,964 | |
| |
Total liabilities | | | 92,750 | |
| |
Net assets applicable to shares outstanding | | $ | 8,683,566 | |
| |
| |
Net assets consist of: | | | | |
| |
Shares of beneficial interest | | $ | 8,717,875 | |
| |
Distributable earnings (loss) | | | (34,309 | ) |
| |
| | $ | 8,683,566 | |
| |
| |
Net Assets: | | | | |
| |
Class A | | $ | 1,483,190 | |
| |
Class C | | $ | 242,650 | |
| |
Class R | | $ | 35,180 | |
| |
Class Y | | $ | 522,308 | |
| |
Class R5 | | $ | 21,180 | |
| |
Class R6 | | $ | 6,379,058 | |
| |
| | | | |
Shares outstanding, no par value, with an unlimited number of shares authorized: | |
Class A | | | 125,085 | |
| |
Class C | | | 20,651 | |
| |
Class R | | | 2,978 | |
| |
Class Y | | | 43,873 | |
| |
Class R5 | | | 1,779 | |
| |
Class R6 | | | 535,853 | |
| |
Class A: | | | | |
Net asset value per share | | $ | 11.86 | |
| |
Maximum offering price per share
(Net asset value of $11.86 ÷ 94.50%) | | $ | 12.55 | |
| |
Class C: | | | | |
Net asset value and offering price per share | | $ | 11.75 | |
| |
Class R: | | | | |
Net asset value and offering price per share | | $ | 11.81 | |
| |
Class Y: | | | | |
Net asset value and offering price per share | | $ | 11.91 | |
| |
Class R5: | | | | |
Net asset value and offering price per share | | $ | 11.90 | |
| |
Class R6: | | | | |
Net asset value and offering price per share | | $ | 11.90 | |
| |
See accompanying Notes to Financial Statements which are an integral part of the financial statements.
13 Invesco Global Responsibility Equity Fund
Statement of Operations
For the year ended October 31, 2019
| | | | |
Investment income: | | | | |
| |
Dividends (net of foreign withholding taxes of $9,479) | | $ | 197,372 | |
| |
Dividends from affiliated money market funds | | | 3,403 | |
| |
Total investment income | | | 200,775 | |
| |
| |
Expenses: | | | | |
| |
Advisory fees | | | 55,269 | |
| |
Administrative services fees | | | 9,355 | |
| |
Custodian fees | | | 3,532 | |
| |
Distribution fees: | | | | |
Class A | | | 3,347 | |
| |
Class C | | | 1,789 | |
| |
Class R | | | 160 | |
| |
Transfer agent fees – A, C, R and Y | | | 8,742 | |
| |
Transfer agent fees – R5 | | | 12 | |
| |
Transfer agent fees – R6 | | | 1,152 | |
| |
Trustees’ and officers’ fees and benefits | | | 19,924 | |
| |
Registration and filing fees | | | 79,999 | |
| |
Reports to shareholders | | | 14,745 | |
| |
Professional services fees | | | 52,627 | |
| |
Other | | | 10,257 | |
| |
Total expenses | | | 260,910 | |
| |
Less: Fees waived, expenses reimbursed and/or expense offset arrangement(s) | | | (205,041 | ) |
| |
Net expenses | | | 55,869 | |
| |
Net investment income | | | 144,906 | |
| |
| |
Realized and unrealized gain (loss) from: | | | | |
| |
Net realized gain (loss) from: | | | | |
Investment securities | | | (593,436 | ) |
| |
Foreign currencies | | | 128 | |
| |
| | | (593,308 | ) |
| |
Change in net unrealized appreciation of: | | | | |
Investment securities | | | 759,084 | |
| |
Foreign currencies | | | 62 | |
| |
| | | 759,146 | |
| |
Net realized and unrealized gain | | | 165,838 | |
| |
Net increase in net assets resulting from operations | | $ | 310,744 | |
| |
See accompanying Notes to Financial Statements which are an integral part of the financial statements.
14 Invesco Global Responsibility Equity Fund
Statement of Changes in Net Assets
For the years ended October 31, 2019 and 2018
| | | | | | | | |
| | | 2019 | | | 2018 | |
| |
Operations: | | | | | | | | |
| | |
Net investment income | | $ | 144,906 | | | $ | 135,638 | |
| |
Net realized gain (loss) | | | (593,308 | ) | | | 82,926 | |
| |
Change in net unrealized appreciation (depreciation) | | | 759,146 | | | | (863,772 | ) |
| |
Net increase (decrease) in net assets resulting from operations | | | 310,744 | | | | (645,208 | ) |
| |
| | |
Distributions to shareholders from distributable earnings: | | | | | | | | |
| | |
Class A | | | (31,300 | ) | | | (28,098 | ) |
| |
Class C | | | (1,884 | ) | | | (4,917 | ) |
| |
Class R | | | (685 | ) | | | (456 | ) |
| |
Class Y | | | (11,925 | ) | | | (7,003 | ) |
| |
Class R5 | | | (508 | ) | | | (762 | ) |
| |
Class R6 | | | (178,903 | ) | | | (201,557 | ) |
| |
Total distributions from distributable earnings | | | (225,205 | ) | | | (242,793 | ) |
| |
| | |
Share transactions–net: | | | | | | | | |
| | |
Class A | | | 78,189 | | | | 981,452 | |
| |
Class C | | | 72,486 | | | | 60,145 | |
| |
Class R | | | 3,239 | | | | 21,621 | |
| |
Class Y | | | 69,956 | | | | 300,117 | |
| |
Class R5 | | | 1,723 | | | | 551 | |
| |
Class R6 | | | (551,637 | ) | | | 2,636,230 | |
| |
Net increase (decrease) in net assets resulting from share transactions | | | (326,044 | ) | | | 4,000,116 | |
| |
Net increase (decrease) in net assets | | | (240,505 | ) | | | 3,112,115 | |
| |
| | |
Net assets: | | | | | | | | |
| | |
Beginning of year | | | 8,924,071 | | | | 5,811,956 | |
| |
End of year | | $ | 8,683,566 | | | $ | 8,924,071 | |
| |
See accompanying Notes to Financial Statements which are an integral part of the financial statements.
15 Invesco Global Responsibility Equity Fund
Financial Highlights
The following schedule presents financial highlights for a share of the Fund outstanding throughout the periods indicated.
| | | | | | | | | | | | | | | | | | | | | | | | | | | | | | | | | | | | | | | | | | | | | | | | | | | | | | | | |
| | | Net asset
value,
beginning
of period | | | Net
investment
income(a) | | | Net gains
(losses)
on securities
(both
realized and
unrealized) | | | Total from
investment
operations | | | Dividends
from net
investment
income | | | Distributions
from net
realized
gains | | | Total
distributions | | | Net asset
value, end
of period | | | Total
return (b) | | | Net assets,
end of period
(000’s omitted) | | | Ratio of
expenses
to average
net assets
with fee waivers
and/or
expenses
absorbed | | | Ratio of
expenses
to average net
assets without
fee waivers
and/or
expenses
absorbed | | | Ratio of net
investment
income
to average
net assets | | | Portfolio
turnover (c) | |
Class A | | | | | | | | | | | | | | | | | | | | | | | | | | | | | | | | | | | | | | | | | | | | | | | | | | | | | | | | |
Year ended 10/31/19 | | | $11.76 | | | | $0.17 | | | | $0.21 | | | | $0.38 | | | | $(0.18 | ) | | | $(0.10 | ) | | | $(0.28 | ) | | | $11.86 | | | | 3.48 | % | | | $1,483 | | | | 0.85 | %(d) | | | 3.58 | %(d) | | | 1.51 | %(d) | | | 116 | % |
Year ended 10/31/18 | | | 12.91 | | | | 0.17 | | | | (0.85 | ) | | | (0.68 | ) | | | (0.09 | ) | | | (0.38 | ) | | | (0.47 | ) | | | 11.76 | | | | (5.55 | ) | | | 1,387 | | | | 0.84 | | | | 3.94 | | | | 1.33 | | | | 89 | |
Year ended 10/31/17 | | | 10.45 | | | | 0.14 | | | | 2.39 | | | | 2.53 | | | | (0.06 | ) | | | (0.01 | ) | | | (0.07 | ) | | | 12.91 | | | | 24.36 | | | | 531 | | | | 0.84 | | | | 9.90 | | | | 1.16 | | | | 69 | |
Year ended 10/31/16(e) | | | 10.17 | | | | 0.04 | | | | 0.24 | | | | 0.28 | | | | – | | | | – | | | | – | | | | 10.45 | | | | 2.75 | | | | 46 | | | | 0.84 | (f) | | | 31.57 | (f) | | | 1.13 | (f) | | | 18 | |
Class C | | | | | | | | | | | | | | | | | | | | | | | | | | | | | | | | | | | | | | | | | | | | | | | | | | | | | | | | |
Year ended 10/31/19 | | | 11.63 | | | | 0.09 | | | | 0.20 | | | | 0.29 | | | | (0.07 | ) | | | (0.10 | ) | | | (0.17 | ) | | | 11.75 | | | | 2.66 | | | | 243 | | | | 1.60 | (d) | | | 4.33 | (d) | | | 0.76 | (d) | | | 116 | |
Year ended 10/31/18 | | | 12.83 | | | | 0.07 | | | | (0.84 | ) | | | (0.77 | ) | | | (0.05 | ) | | | (0.38 | ) | | | (0.43 | ) | | | 11.63 | | | | (6.27 | ) | | | 166 | | | | 1.59 | | | | 4.69 | | | | 0.58 | | | | 89 | |
Year ended 10/31/17 | | | 10.42 | | | | 0.05 | | | | 2.39 | | | | 2.44 | | | | (0.02 | ) | | | (0.01 | ) | | | (0.03 | ) | | | 12.83 | | | | 23.49 | | | | 124 | | | | 1.59 | | | | 10.65 | | | | 0.41 | | | | 69 | |
Year ended 10/31/16(e) | | | 10.17 | | | | 0.01 | | | | 0.24 | | | | 0.25 | | | | – | | | | – | | | | – | | | | 10.42 | | | | 2.46 | | | | 10 | | | | 1.59 | (f) | | | 32.32 | (f) | | | 0.38 | (f) | | | 18 | |
Class R | | | | | | | | | | | | | | | | | | | | | | | | | | | | | | | | | | | | | | | | | | | | | | | | | | | | | | | | |
Year ended 10/31/19 | | | 11.71 | | | | 0.15 | | | | 0.20 | | | | 0.35 | | | | (0.15 | ) | | | (0.10 | ) | | | (0.25 | ) | | | 11.81 | | | | 3.17 | | | | 35 | | | | 1.10 | (d) | | | 3.83 | (d) | | | 1.26 | (d) | | | 116 | |
Year ended 10/31/18 | | | 12.88 | | | | 0.14 | | | | (0.85 | ) | | | (0.71 | ) | | | (0.08 | ) | | | (0.38 | ) | | | (0.46 | ) | | | 11.71 | | | | (5.82 | ) | | | 32 | | | | 1.09 | | | | 4.19 | | | | 1.08 | | | | 89 | |
Year ended 10/31/17 | | | 10.44 | | | | 0.11 | | | | 2.39 | | | | 2.50 | | | | (0.05 | ) | | | (0.01 | ) | | | (0.06 | ) | | | 12.88 | | | | 24.04 | | | | 13 | | | | 1.09 | | | | 10.15 | | | | 0.91 | | | | 69 | |
Year ended 10/31/16(e) | | | 10.17 | | | | 0.03 | | | | 0.24 | | | | 0.27 | | | | – | | | | – | | | | – | | | | 10.44 | | | | 2.65 | | | | 10 | | | | 1.09 | (f) | | | 31.82 | (f) | | | 0.88 | (f) | | | 18 | |
Class Y | | | | | | | | | | | | | | | | | | | | | | | | | | | | | | | | | | | | | | | | | | | | | | | | | | | | | | | | |
Year ended 10/31/19 | | | 11.80 | | | | 0.20 | | | | 0.22 | | | | 0.42 | | | | (0.21 | ) | | | (0.10 | ) | | | (0.31 | ) | | | 11.91 | | | | 3.80 | | | | 522 | | | | 0.60 | (d) | | | 3.33 | (d) | | | 1.76 | (d) | | | 116 | |
Year ended 10/31/18 | | | 12.94 | | | | 0.20 | | | | (0.86 | ) | | | (0.66 | ) | | | (0.10 | ) | | | (0.38 | ) | | | (0.48 | ) | | | 11.80 | | | | (5.39 | ) | | | 446 | | | | 0.59 | | | | 3.69 | | | | 1.58 | | | | 89 | |
Year ended 10/31/17 | | | 10.46 | | | | 0.17 | | | | 2.39 | | | | 2.56 | | | | (0.07 | ) | | | (0.01 | ) | | | (0.08 | ) | | | 12.94 | | | | 24.67 | | | | 189 | | | | 0.59 | | | | 9.65 | | | | 1.41 | | | | 69 | |
Year ended 10/31/16(e) | | | 10.17 | | | | 0.05 | | | | 0.24 | | | | 0.29 | | | | – | | | | – | | | | – | | | | 10.46 | | | | 2.85 | | | | 42 | | | | 0.59 | (f) | | | 31.32 | (f) | | | 1.38 | (f) | | | 18 | |
Class R5 | | | | | | | | | | | | | | | | | | | | | | | | | | | | | | | | | | | | | | | | | | | | | | | | | | | | | | | | |
Year ended 10/31/19 | | | 11.80 | | | | 0.20 | | | | 0.21 | | | | 0.41 | | | | (0.21 | ) | | | (0.10 | ) | | | (0.31 | ) | | | 11.90 | | | | 3.71 | | | | 21 | | | | 0.60 | (d) | | | 2.95 | (d) | | | 1.76 | (d) | | | 116 | |
Year ended 10/31/18 | | | 12.94 | | | | 0.20 | | | | (0.86 | ) | | | (0.66 | ) | | | (0.10 | ) | | | (0.38 | ) | | | (0.48 | ) | | | 11.80 | | | | (5.39 | ) | | | 19 | | | | 0.59 | | | | 3.47 | | | | 1.58 | | | | 89 | |
Year ended 10/31/17 | | | 10.46 | | | | 0.17 | | | | 2.39 | | | | 2.56 | | | | (0.07 | ) | | | (0.01 | ) | | | (0.08 | ) | | | 12.94 | | | | 24.67 | | | | 21 | | | | 0.59 | | | | 9.28 | | | | 1.41 | | | | 69 | |
Year ended 10/31/16(e) | | | 10.17 | | | | 0.05 | | | | 0.24 | | | | 0.29 | | | | – | | | | – | | | | – | | | | 10.46 | | | | 2.85 | | | | 10 | | | | 0.59 | (f) | | | 29.53 | (f) | | | 1.38 | (f) | | | 18 | |
Class R6 | | | | | | | | | | | | | | | | | | | | | | | | | | | | | | | | | | | | | | | | | | | | | | | | | | | | | | | | |
Year ended 10/31/19 | | | 11.80 | | | | 0.20 | | | | 0.21 | | | | 0.41 | | | | (0.21 | ) | | | (0.10 | ) | | | (0.31 | ) | | | 11.90 | | | | 3.71 | | | | 6,379 | | | | 0.60 | (d) | | | 2.91 | (d) | | | 1.76 | (d) | | | 116 | |
Year ended 10/31/18 | | | 12.94 | | | | 0.20 | | | | (0.86 | ) | | | (0.66 | ) | | | (0.10 | ) | | | (0.38 | ) | | | (0.48 | ) | | | 11.80 | | | | (5.39 | ) | | | 6,875 | | | | 0.59 | | | | 3.42 | | | | 1.58 | | | | 89 | |
Year ended 10/31/17 | | | 10.46 | | | | 0.17 | | | | 2.39 | | | | 2.56 | | | | (0.07 | ) | | | (0.01 | ) | | | (0.08 | ) | | | 12.94 | | | | 24.67 | | | | 4,935 | | | | 0.59 | | | | 9.28 | | | | 1.41 | | | | 69 | |
Year ended 10/31/16(e) | | | 10.17 | | | | 0.05 | | | | 0.24 | | | | 0.29 | | | | – | | | | – | | | | – | | | | 10.46 | | | | 2.85 | | | | 1,353 | | | | 0.59 | (f) | | | 29.53 | (f) | | | 1.38 | (f) | | | 18 | |
| (a) | Calculated using average shares outstanding. |
| (b) | Includes adjustments in accordance with accounting principles generally accepted in the United States of America and as such, the net asset value for financial reporting purposes and the returns based upon those net asset values may differ from the net asset value and returns for shareholder transactions. Does not include sales charges and is not annualized for periods less than one year, if applicable. |
| (c) | Portfolio turnover is calculated at the fund level and is not annualized for periods less than one year, if applicable. |
| (d) | Ratios are based on average daily net assets (000’s omitted) of $1,339, $179, $32, $474, $20 and $6,460 for Class A, Class C, Class R, Class Y, Class R5 and Class R6 shares, respectively. |
| (e) | Commencement date of July 1, 2016. |
See accompanying Notes to Financial Statements which are an integral part of the financial statements.
16 Invesco Global Responsibility Equity Fund
Notes to Financial Statements
October 31, 2019
NOTE 1–Significant Accounting Policies
Invesco Global Responsibility Equity Fund (the “Fund”) is a series portfolio of AIM International Mutual Funds (Invesco International Mutual Funds) (the “Trust”). The Trust is a Delaware statutory trust registered under the Investment Company Act of 1940, as amended (the “1940 Act”), as anopen-end series management investment company authorized to issue an unlimited number of shares of beneficial interest. Information presented in these financial statements pertains only to the Fund. Matters affecting the Fund or each class will be voted on exclusively by the shareholders of the Fund or each class.
The Fund’s investment objective is long-term growth of capital.
The Fund currently consists of six different classes of shares: Class A, Class C, Class R, Class Y, Class R5 and Class R6. Class Y shares are available only to certain investors. Class A shares are sold with afront-end sales charge unless certain waiver criteria are met. Under certain circumstances, load waived shares may be subject to contingent deferred sales charges (“CDSC”). Class C shares are sold with a CDSC. Class R, Class Y, Class R5 and Class R6 shares are sold at net asset value. Class C shares held for ten years after purchase are eligible for automatic conversion into Class A shares of the same Fund (the “Conversion Feature”). The automatic conversion pursuant to the Conversion Feature will generally occur at the end of the month following the tenth anniversary after a purchase of Class C shares.
The Fund is an investment company and accordingly follows the investment company accounting and reporting guidance in accordance with Financial Accounting Standards Board Accounting Standards Codification Topic 946,Financial Services – Investment Companies.
The following is a summary of the significant accounting policies followed by the Fund in the preparation of its financial statements.
| A. | Security Valuations– Securities, including restricted securities, are valued according to the following policy. |
A security listed or traded on an exchange (except convertible securities) is valued at its last sales price or official closing price as of the close of the customary trading session on the exchange where the security is principally traded, or lacking any sales or official closing price on a particular day, the security may be valued at the closing bid price on that day. Securities traded in theover-the-counter market are valued based on prices furnished by independent pricing services or market makers. When such securities are valued by an independent pricing service they may be considered fair valued. Futures contracts are valued at the final settlement price set by an exchange on which they are principally traded. Listed options are valued at the mean between the last bid and asked prices from the exchange on which they are principally traded. Options not listed on an exchange are valued by an independent source at the mean between the last bid and asked prices. For purposes of determining net asset value (“NAV”) per share, futures and option contracts generally are valued 15 minutes after the close of the customary trading session of the New York Stock Exchange (“NYSE”).
Investments inopen-end andclosed-end registered investment companies that do not trade on an exchange are valued at theend-of-day net asset value per share. Investments inopen-end andclosed-end registered investment companies that trade on an exchange are valued at the last sales price or official closing price as of the close of the customary trading session on the exchange where the security is principally traded.
Debt obligations (including convertible securities) and unlisted equities are fair valued using an evaluated quote provided by an independent pricing service. Evaluated quotes provided by the pricing service may be determined without exclusive reliance on quoted prices, and may reflect appropriate factors such asinstitution-size trading in similar groups of securities, developments related to specific securities, dividend rate (for unlisted equities), yield (for debt obligations), quality, type of issue, coupon rate (for debt obligations), maturity (for debt obligations), individual trading characteristics and other market data. Pricing services generally value debt obligations assuming orderly transactions of institutional round lot size, but a fund may hold or transact in the same securities in smaller, odd lot sizes. Odd lots often trade at lower prices than institutional round lots. Debt obligations are subject to interest rate and credit risks. In addition, all debt obligations involve some risk of default with respect to interest and/or principal payments.
Foreign securities’ (including foreign exchange contracts) prices are converted into U.S. dollar amounts using the applicable exchange rates as of the close of the NYSE. If market quotations are available and reliable for foreign exchange-traded equity securities, the securities will be valued at the market quotations. Because trading hours for certain foreign securities end before the close of the NYSE, closing market quotations may become unreliable. If between the time trading ends on a particular security and the close of the customary trading session on the NYSE, events occur that the investment adviser determines are significant and make the closing price unreliable, the Fund may fair value the security. If the event is likely to have affected the closing price of the security, the security will be valued at fair value in good faith using procedures approved by the Board of Trustees. Adjustments to closing prices to reflect fair value may also be based on a screening process of an independent pricing service to indicate the degree of certainty, based on historical data, that the closing price in the principal market where a foreign security trades is not the current value as of the close of the NYSE. Foreign securities’ prices meeting the approved degree of certainty that the price is not reflective of current value will be priced at the indication of fair value from the independent pricing service. Multiple factors may be considered by the independent pricing service in determining adjustments to reflect fair value and may include information relating to sector indices, American Depositary Receipts and domestic and foreign index futures. Foreign securities may have additional risks including exchange rate changes, potential for sharply devalued currencies and high inflation, political and economic upheaval, the relative lack of issuer information, relatively low market liquidity and the potential lack of strict financial and accounting controls and standards.
Securities for which market prices are not provided by any of the above methods may be valued based upon quotes furnished by independent sources. The last bid price may be used to value equity securities. The mean between the last bid and asked prices is used to value debt obligations, including corporate loans.
Securities for which market quotations are not readily available or became unreliable are valued at fair value as determined in good faith by or under the supervision of the Trust’s officers following procedures approved by the Board of Trustees. Issuer specific events, market trends, bid/asked quotes of brokers and information providers and other market data may be reviewed in the course of making a good faith determination of a security’s fair value.
The Fund may invest in securities that are subject to interest rate risk, meaning the risk that the prices will generally fall as interest rates rise and, conversely, the prices will generally rise as interest rates fall. Specific securities differ in their sensitivity to changes in interest rates
17 Invesco Global Responsibility Equity Fund
depending on their individual characteristics. Changes in interest rates may result in increased market volatility, which may affect the value and/or liquidity of certain Fund investments.
Valuations change in response to many factors including the historical and prospective earnings of the issuer, the value of the issuer’s assets, general economic conditions, interest rates, investor perceptions and market liquidity. Because of the inherent uncertainties of valuation, the values reflected in the financial statements may materially differ from the value received upon actual sale of those investments.
| B. | Securities Transactions and Investment Income– Securities transactions are accounted for on a trade date basis. Realized gains or losses on sales are computed on the basis of specific identification of the securities sold. Interest income (net of withholding tax, if any) is recorded on the accrual basis from settlement date. Dividend income (net of withholding tax, if any) is recorded on theex-dividend date. |
The Fund may periodically participate in litigation related to Fund investments. As such, the Fund may receive proceeds from litigation settlements. Any proceeds received are included in the Statement of Operations as realized gain (loss) for investments no longer held and as unrealized gain (loss) for investments still held.
Brokerage commissions and mark ups are considered transaction costs and are recorded as an increase to the cost basis of securities purchased and/or a reduction of proceeds on a sale of securities. Such transaction costs are included in the determination of net realized and unrealized gain (loss) from investment securities reported in the Statement of Operations and the Statement of Changes in Net Assets and the net realized and unrealized gains (losses) on securities per share in the Financial Highlights. Transaction costs are included in the calculation of the Fund’s net asset value and, accordingly, they reduce the Fund’s total returns. These transaction costs are not considered operating expenses and are not reflected in net investment income reported in the Statement of Operations and the Statement of Changes in Net Assets, or the net investment income per share and the ratios of expenses and net investment income reported in the Financial Highlights, nor are they limited by any expense limitation arrangements between the Fund and the investment adviser.
The Fund allocates income and realized and unrealized capital gains and losses to a class based on the relative net assets of each class.
| C. | Country Determination– For the purposes of making investment selection decisions and presentation in the Schedule of Investments, the investment adviser may determine the country in which an issuer is located and/or credit risk exposure based on various factors. These factors include the laws of the country under which the issuer is organized, where the issuer maintains a principal office, the country in which the issuer derives 50% or more of its total revenues and the country that has the primary market for the issuer’s securities, as well as other criteria. Among the other criteria that may be evaluated for making this determination are the country in which the issuer maintains 50% or more of its assets, the type of security, financial guarantees and enhancements, the nature of the collateral and the sponsor organization. Country of issuer and/or credit risk exposure has been determined to be the United States of America, unless otherwise noted. |
| D. | Distributions– Distributions from net investment income and net realized capital gain, if any, are generally declared and paid annually and recorded on theex-dividend date. The Fund may elect to treat a portion of the proceeds from redemptions as distributions for federal income tax purposes. |
| E. | Federal Income Taxes –The Fund intends to comply with the requirements of Subchapter M of the Internal Revenue Code of 1986, as amended (the “Internal Revenue Code”), necessary to qualify as a regulated investment company and to distribute substantially all of the Fund’s taxable earnings to shareholders. As such, the Fund will not be subject to federal income taxes on otherwise taxable income (including net realized capital gain) that is distributed to shareholders. Therefore, no provision for federal income taxes is recorded in the financial statements. |
The Fund recognizes the tax benefits of uncertain tax positions only when the position is more likely than not to be sustained. Management has analyzed the Fund’s uncertain tax positions and concluded that no liability for unrecognized tax benefits should be recorded related to uncertain tax positions. Management is not aware of any tax positions for which it is reasonably possible that the total amounts of unrecognized tax benefits will change materially in the next 12 months.
The Fund files tax returns in the U.S. Federal jurisdiction and certain other jurisdictions. Generally, the Fund is subject to examinations by such taxing authorities for up to three years after the filing of the return for the tax period.
| F. | Expenses –Fees provided for under the Rule12b-1 plan of a particular class of the Fund are charged to the operations of such class. Transfer agency fees and expenses and other shareholder recordkeeping fees and expenses attributable to Class R5 and Class R6 are allocated to each share class based on relative net assets.Sub-accounting fees attributable to Class R5 are charged to the operations of the class. Transfer agency fees and expenses and other shareholder recordkeeping fees and expenses relating to all other classes are allocated among those classes based on relative net assets. All other expenses are allocated among the classes based on relative net assets. |
| G. | Accounting Estimates –The preparation of financial statements in conformity with accounting principles generally accepted in the United States of America (“GAAP”) requires management to make estimates and assumptions that affect the reported amounts of assets and liabilities at the date of the financial statements and the reported amounts of revenues and expenses during the reporting period including estimates and assumptions related to taxation. Actual results could differ from those estimates by a significant amount. In addition, the Fund monitors for material events or transactions that may occur or become known after theperiod-end date and before the date the financial statements are released to print. |
| H. | Indemnifications– Under the Trust’s organizational documents, each Trustee, officer, employee or other agent of the Trust is indemnified against certain liabilities that may arise out of the performance of their duties to the Fund. Additionally, in the normal course of business, the Fund enters into contracts, including the Fund’s servicing agreements, that contain a variety of indemnification clauses. The Fund’s maximum exposure under these arrangements is unknown as this would involve future claims that may be made against the Fund that have not yet occurred. The risk of material loss as a result of such indemnification claims is considered remote. |
| I. | Foreign Currency Translations– Foreign currency is valued at the close of the NYSE based on quotations posted by banks and major currency dealers. Portfolio securities and other assets and liabilities denominated in foreign currencies are translated into U.S. dollar amounts at the date of valuation. Purchases and sales of portfolio securities (net of foreign taxes withheld on disposition) and income items denominated in foreign currencies are translated into U.S. dollar amounts on the respective dates of such transactions. The Fund does not separately account for the portion of the results of operations resulting from changes in foreign exchange rates on investments and the fluctuations arising from changes in market prices of securities held. The combined results of changes in foreign exchange rates and the fluctuation of market prices on investments (net of estimated foreign tax withholding) are included with the net realized and unrealized gain or loss from investments in the Statement of Operations. Reported net realized foreign currency gains or losses arise from (1) sales of foreign currencies, (2) currency gains or losses realized between the trade and settlement dates on securities transactions, and (3) the difference between the amounts of dividends, |
18 Invesco Global Responsibility Equity Fund
| | interest, and foreign withholding taxes recorded on the Fund’s books and the U.S. dollar equivalent of the amounts actually received or paid. Net unrealized foreign currency gains and losses arise from changes in the fair values of assets and liabilities, other than investments in securities at fiscal period end, resulting from changes in exchange rates. |
The Fund may invest in foreign securities, which may be subject to foreign taxes on income, gains on investments or currency repatriation, a portion of which may be recoverable. Foreign taxes, if any, are recorded based on the tax regulations and rates that exist in the foreign markets in which the Fund invests and are shown in the Statement of Operations.
| J. | Forward Foreign Currency Contracts– The Fund may engage in foreign currency transactions either on a spot (i.e. for prompt delivery and settlement) basis, or through forward foreign currency contracts, to manage or minimize currency or exchange rate risk. |
The Fund may also enter into forward foreign currency contracts for the purchase or sale of a security denominated in a foreign currency in order to “lock in” the U.S. dollar price of that security, or the Fund may also enter into forward foreign currency contracts that do not provide for physical settlement of the two currencies, but instead are settled by a single cash payment calculated as the difference between the agreed upon exchange rate and the spot rate at settlement based upon an agreed upon notional amount(non-deliverable forwards). The Fund will set aside liquid assets in an amount equal to the dailymark-to-market obligation for forward foreign currency contracts.
A forward foreign currency contract is an obligation between two parties (“Counterparties”) to purchase or sell a specific currency for an agreed-upon price at a future date. The use of forward foreign currency contracts does not eliminate fluctuations in the price of the underlying securities the Fund owns or intends to acquire but establishes a rate of exchange in advance. Fluctuations in the value of these contracts are measured by the difference in the contract date and reporting date exchange rates and are recorded as unrealized appreciation (depreciation) until the contracts are closed. When the contracts are closed, realized gains (losses) are recorded. Realized and unrealized gains (losses) on the contracts are included in the Statement of Operations. The primary risks associated with forward foreign currency contracts include failure of the Counterparty to meet the terms of the contract and the value of the foreign currency changing unfavorably. These risks may be in excess of the amounts reflected in the Statement of Assets and Liabilities.
NOTE 2–Advisory Fees and Other Fees Paid to Affiliates
The Trust has entered into a master investment advisory agreement with Invesco Advisers, Inc. (the “Adviser” or “Invesco”). Under the terms of the investment advisory agreement, the Fund accrues daily and pays monthly an advisory fee to the Adviser based on the annual rate of the Fund’s average daily net assets as follows:
| | |
| Average Daily Net Assets | | Rate |
First $ 25 million | | 0.650% |
Over $25 million | | 0.600% |
For the year ended October 31, 2019, the effective advisory fee rate incurred by the Fund was 0.65%.
Under the terms of a mastersub-advisory agreement between the Adviser and each of Invesco Asset Management Deutschland GmbH, Invesco Asset Management Limited, Invesco Asset Management (Japan) Limited, Invesco Hong Kong Limited, Invesco Senior Secured Management, Inc. and Invesco Canada Ltd. and separatesub-advisory agreements with Invesco Capital Management LLC and Invesco Asset Management (India) Private Limited (collectively, the “AffiliatedSub-Advisers”) the Adviser, not the Fund, will pay 40% of the fees paid to the Adviser to any such AffiliatedSub-Adviser(s) that provide(s) discretionary investment management services to the Fund based on the percentage of assets allocated to such AffiliatedSub-Adviser(s).
The Adviser has contractually agreed, through at least February 28, 2021, to waive advisory fees and/or reimburse expenses to the extent necessary to limit total annual fund operating expenses after fee waiver and/or expense reimbursement (excluding certain items discussed below) of Class A, Class C, Class R, Class Y, Class R5 and Class R6 shares to 0.85%, 1.60%, 1.10%, 0.60%, 0.60%, and 0.60%, respectively, of average daily net assets (the “expense limits”). In determining the Adviser’s obligation to waive advisory fees and/or reimburse expenses, the following expenses are not taken into account, and could cause the total annual fund operating expenses after fee waiver and/or expense reimbursement to exceed the numbers reflected above: (1) interest; (2) taxes; (3) dividend expense on short sales; (4) extraordinary ornon-routine items, litigation expenses; and (5) expenses that the Fund has incurred but did not actually pay because of an expense offset arrangement. Unless Invesco continues the fee waiver agreement, it will terminate on February 28, 2021. During its term, the fee waiver agreement cannot be terminated or amended to increase the expense limits or reduce the advisory fee waiver without approval of the Board of Trustees.
Further, the Adviser has contractually agreed, through at least June 30, 2021, to waive the advisory fee payable by the Fund in an amount equal to 100% of the net advisory fees the Adviser receives from the affiliated money market funds on investments by the Fund of uninvested cash in such affiliated money market funds.
For the year ended October 31, 2019, the Adviser waived advisory fees of $55,269, reimbursed fund level expenses of $139,866 and reimbursed class level expenses of $5,670, $758, $136, $2,006, $12 and $1,152 of Class A, Class C, Class R, Class Y, Class R5 and Class R6 shares, respectively.
The Trust has entered into a master administrative services agreement with Invesco pursuant to which the Fund has agreed to pay Invesco for certain administrative costs incurred in providing accounting services to the Fund. For the year ended October 31, 2019, expenses incurred under the agreement are shown in the Statement of Operations asAdministrative services fees. Invesco has entered into asub-administration agreement whereby State Street Bank and Trust Company (“SSB”) serves as fund accountant and provides certain administrative services to the Fund. Pursuant to a custody agreement with the Trust on behalf of the Fund, SSB also serves as the Fund’s custodian.
The Trust has entered into a transfer agency and service agreement with Invesco Investment Services, Inc. (“IIS”) pursuant to which the Fund has agreed to pay IIS a fee for providing transfer agency and shareholder services to the Fund and reimburse IIS for certain expenses incurred by IIS in the course of providing such services. IIS may make payments to intermediaries that provide omnibus account services,sub-accounting services and/or networking services. All fees payable by IIS to intermediaries that provide omnibus account services orsub-accounting services are charged back to the Fund, subject to certain limitations approved by the Trust’s Board of Trustees. For the year ended October 31, 2019, expenses incurred under the agreement are shown in the Statement of Operations asTransfer agent fees.
19 Invesco Global Responsibility Equity Fund
The Trust has entered into master distribution agreements with Invesco Distributors, Inc. (“IDI”) to serve as the distributor for the Class A, Class C, Class R, Class Y, Class R5 and Class R6 shares of the Fund. The Trust has adopted plans pursuant to Rule 12b–1 under the 1940 Act with respect to the Fund’s Class A, Class C and Class R shares (collectively, the “Plans”). The Fund, pursuant to the Plans, pays IDI compensation at the annual rate of 0.25% of the Fund’s average daily net assets of Class A shares, 1.00% of the average daily net assets of Class C shares and 0.50% of the average daily net assets of Class R shares. The fees are accrued daily and paid monthly. Of the Plan payments, up to 0.25% of the average daily net assets of each class of shares may be paid to furnish continuing personal shareholder services to customers who purchase and own shares of such classes. Any amounts not paid as a service fee under the Plans would constitute an asset–based sales charge. Rules of the Financial Industry Regulatory Authority (“FINRA”) impose a cap on the total sales charges, including asset–based sales charges, that may be paid by any class of shares of the Fund. For the year ended October 31, 2019, expenses incurred under the Plans are shown in the Statement of Operations as Distribution fees.
Front–end sales commissions and CDSC (collectively, the “sales charges”) are not recorded as expenses of the Fund. Front–end sales commissions are deducted from proceeds from the sales of Fund shares prior to investment in Class A shares of the Fund. CDSC are deducted from redemption proceeds prior to remittance to the shareholder. During the year ended October 31, 2019, IDI advised the Fund that IDI retained $18 in front–end sales commissions from the sale of Class A shares and $0 and $14 from Class A and Class C shares, respectively, for CDSC imposed upon redemptions by shareholders.
Certain officers and trustees of the Trust are officers and directors of the Adviser, IIS and/or IDI.
NOTE 3–Additional Valuation Information
GAAP defines fair value as the price that would be received to sell an asset or paid to transfer a liability in an orderly transaction between market participants at the measurement date, under current market conditions. GAAP establishes a hierarchy that prioritizes the inputs to valuation methods, giving the highest priority to readily available unadjusted quoted prices in an active market for identical assets (Level 1) and the lowest priority to significant unobservable inputs (Level 3), generally when market prices are not readily available or are unreliable. Based on the valuation inputs, the securities or other investments are tiered into one of three levels. Changes in valuation methods may result in transfers in or out of an investment’s assigned level:
| | |
| Level 1 – | | Prices are determined using quoted prices in an active market for identical assets. |
| Level 2 – | | Prices are determined using other significant observable inputs. Observable inputs are inputs that other market participants may use in pricing a security. These may include quoted prices for similar securities, interest rates, prepayment speeds, credit risk, yield curves, loss severities, default rates, discount rates, volatilities and others. |
| Level 3 – | | Prices are determined using significant unobservable inputs. In situations where quoted prices or observable inputs are unavailable (for example, when there is little or no market activity for an investment at the end of the period), unobservable inputs may be used. |
| | Unobservable inputs reflect the Fund’s own assumptions about the factors market participants would use in determining fair value of the securities or instruments and would be based on the best available information. |
The following is a summary of the tiered valuation input levels, as of October 31, 2019. The level assigned to the securities valuations may not be an indication of the risk or liquidity associated with investing in those securities. Because of the inherent uncertainties of valuation, the values reflected in the financial statements may materially differ from the value received upon actual sale of those investments.
| | | | | | | | | | | | | | | | |
| | | Level 1 | | | Level 2 | | | Level 3 | | | Total | |
| |
Investments in Securities | | | | | | | | | | | | | | | | |
| |
Australia | | $ | – | | | $ | 189,855 | | | | $– | | | $ | 189,855 | |
| |
Canada | | | 444,727 | | | | – | | | | – | | | | 444,727 | |
| |
Denmark | | | – | | | | 56,875 | | | | – | | | | 56,875 | |
| |
Finland | | | – | | | | 19,846 | | | | – | | | | 19,846 | |
| |
France | | | – | | | | 356,444 | | | | – | | | | 356,444 | |
| |
Germany | | | – | | | | 113,598 | | | | – | | | | 113,598 | |
| |
Hong Kong | | | – | | | | 44,986 | | | | – | | | | 44,986 | |
| |
Ireland | | | 53,018 | | | | 17,302 | | | | – | | | | 70,320 | |
| |
Israel | | | 18,460 | | | | 18,524 | | | | – | | | | 36,984 | |
| |
Italy | | | – | | | | 17,105 | | | | – | | | | 17,105 | |
| |
Japan | | | – | | | | 804,324 | | | | – | | | | 804,324 | |
| |
Jordan | | | – | | | | 46,616 | | | | – | | | | 46,616 | |
| |
Netherlands | | | 48,200 | | | | 109,008 | | | | – | | | | 157,208 | |
| |
Sweden | | | – | | | | 330,871 | | | | – | | | | 330,871 | |
| |
Switzerland | | | – | | | | 332,298 | | | | – | | | | 332,298 | |
| |
United Kingdom | | | 44,788 | | | | 457,512 | | | | – | | | | 502,300 | |
| |
United States | | | 5,036,235 | | | | – | | | | – | | | | 5,036,235 | |
| |
Money Market Funds | | | 100,861 | | | | – | | | | – | | | | 100,861 | |
| |
Total Investments | | $ | 5,746,289 | | | $ | 2,915,164 | | | $ | – | | | $ | 8,661,453 | |
| |
20 Invesco Global Responsibility Equity Fund
NOTE 4–Expense Offset Arrangement(s)
The expense offset arrangement is comprised of transfer agency credits which result from balances in demand deposit accounts used by the transfer agent for clearing shareholder transactions. For the year ended October 31, 2019, the Fund received credits from this arrangement, which resulted in the reduction of the Fund’s total expenses of $172.
NOTE 5–Trustees’ and Officers’ Fees and Benefits
Trustees’ and Officers’ Fees and Benefits include amounts accrued by the Fund to pay remuneration to certain Trustees and Officers of the Fund. Trustees have the option to defer compensation payable by the Fund, and Trustees’ and Officers’ Fees and Benefits also include amounts accrued by the Fund to fund such deferred compensation amounts. Those Trustees who defer compensation have the option to select various Invesco Funds in which their deferral accounts shall be deemed to be invested. Obligations under the deferred compensation plan represent unsecured claims against the general assets of the Fund.
NOTE 6–Cash Balances
The Fund is permitted to temporarily carry a negative or overdrawn balance in its account with SSB, the custodian bank. Such balances, if any atperiod-end, are shown in the Statement of Assets and Liabilities under the payable caption Amount due custodian. To compensate the custodian bank for such overdrafts, the overdrawn Fund may either (1) leave funds as a compensating balance in the account so the custodian bank can be compensated by earning the additional interest; or (2) compensate by paying the custodian bank at a rate agreed upon by the custodian bank and Invesco, not to exceed the contractually agreed upon rate.
NOTE 7–Distributions to Shareholders and Tax Components of Net Assets
Tax Character of Distributions to Shareholders Paid During the Fiscal Years Ended October 31, 2019 and 2018
| | | | | | | | |
| | | 2019 | | | 2018 | |
| |
Ordinary income | | $ | 151,909 | | | $ | 206,774 | |
| |
Long-term capital gain | | | 73,296 | | | | 36,019 | |
| |
Total distributions | | $ | 225,205 | | | $ | 242,793 | |
| |
Tax Components of Net Assets atPeriod-End:
| | | | |
| | | 2019 | |
| |
Undistributed ordinary income | | $ | 142,441 | |
| |
Net unrealized appreciation – investments | | | 421,494 | |
| |
Net unrealized appreciation (depreciation) – foreign currencies | | | (94 | ) |
| |
Temporary book/tax differences | | | (6,897 | ) |
| |
Capital loss carryforward | | | (591,253 | ) |
| |
Shares of beneficial interest | | | 8,717,875 | |
| |
Total net assets | | $ | 8,683,566 | |
| |
The difference between book-basis andtax-basis unrealized appreciation (depreciation) is due to differences in the timing of recognition of gains and losses on investments for tax and book purposes. The Fund’s net unrealized appreciation (depreciation) difference is attributable primarily to wash sales and passive foreign investment companies.
The temporary book/tax differences are a result of timing differences between book and tax recognition of income and/or expenses. The Fund’s temporary book/tax differences are the result of the trustee deferral of compensation and retirement plan benefits.
Capital loss carryforward is calculated and reported as of a specific date. Results of transactions and other activity after that date may affect the amount of capital loss carryforward actually available for the Fund to utilize. Capital losses generated in years beginning after December 22, 2010 can be carried forward for an unlimited period, whereas previous losses expire in eight tax years. Capital losses with an expiration period may not be used to offset capital gains until all net capital losses without an expiration date have been utilized. Capital loss carryforwards with no expiration date will retain their character as either short-term or long-term capital losses instead of as short-term capital losses as under prior law. The ability to utilize capital loss carryforwards in the future may be limited under the Internal Revenue Code and related regulations based on the results of future transactions.
The Fund has a capital loss carryforward as of October 31, 2019, as follows:
| | | | | | | | | | |
Capital Loss Carryforward* | |
| |
| Expiration | | Short-Term | | | Long-Term | | Total | |
| |
Not subject to expiration | | $ | 416,454 | | | $174,799 | | $ | 591,253 | |
| |
| * | Capital loss carryforwards as of the date listed above are reduced for limitations, if any, to the extent required by the Internal Revenue Code and may be further limited depending upon a variety of factors, including the realization of net unrealized gains or losses as of the date of any reorganization. |
NOTE 8–Investment Transactions
The aggregate amount of investment securities (other than short-term securities, U.S. Treasury obligations and money market funds, if any) purchased and sold by the Fund during the year ended October 31, 2019 was $9,695,874 and $9,982,257, respectively. Cost of investments,
21 Invesco Global Responsibility Equity Fund
including any derivatives, on a tax basis includes the adjustments for financial reporting purposes as of the most recently completed federal income tax reportingperiod-end.
| | | | |
Unrealized Appreciation (Depreciation) of Investments on a Tax Basis | |
| |
Aggregate unrealized appreciation of investments | | $ | 585,243 | |
| |
Aggregate unrealized (depreciation) of investments | | | (163,749 | ) |
| |
Net unrealized appreciation of investments | | $ | 421,494 | |
| |
Cost of investments for tax purposes is $8,239,959.
NOTE 9–Reclassification of Permanent Differences
Primarily as a result of differing book/tax treatment of passive foreign investment companies and distributions, on October 31, 2019, undistributed net investment income was decreased by $863 and undistributed net realized gain (loss) was increased by $863. This reclassification had no effect on the net assets or the distributable earnings (loss) of the Fund.
NOTE 10–Share Information
| | | | | | | | | | | | | | | | |
| | | Summary of Share Activity | |
| |
| | | Years ended October 31, | |
| | | 2019(a) | | | 2018 | |
| | | Shares | | | Amount | | | Shares | | | Amount | |
| |
| | | | |
Sold: | | | | | | | | | | | | | | | | |
| | | | |
Class A | | | 45,364 | | | $ | 523,796 | | | | 136,784 | | | $ | 1,752,916 | |
| |
Class C | | | 11,783 | | | | 134,617 | | | | 10,002 | | | | 128,684 | |
| |
Class R | | | 619 | | | | 7,105 | | | | 1,708 | | | | 21,670 | |
| |
Class Y | | | 7,839 | | | | 90,940 | | | | 24,844 | | | | 322,596 | |
| |
Class R5 | | | 139 | | | | 1,623 | | | | 51 | | | | 652 | |
| |
Class R6 | | | 54,019 | | | | 617,394 | | | | 304,351 | | | | 3,962,308 | |
| |
| | | | |
Issued as reinvestment of dividends: | | | | | | | | | | | | | | | | |
| | | | |
Class A | | | 2,680 | | | | 29,293 | | | | 1,856 | | | | 23,602 | |
| |
Class C | | | 156 | | | | 1,708 | | | | 354 | | | | 4,485 | |
| |
Class R | | | 40 | | | | 434 | | | | - | | | | - | |
| |
Class Y | | | 932 | | | | 10,198 | | | | 377 | | | | 4,801 | |
| |
Class R5 | | | 18 | | | | 197 | | | | 22 | | | | 283 | |
| |
Class R6 | | | 13,799 | | | | 150,958 | | | | 12,429 | | | | 158,466 | |
| |
| | | | |
Automatic conversion of Class C shares to Class A shares: | | | | | | | | | | | | | | | | |
| | | | |
Class A | | | 168 | | | | 1,912 | | | | - | | | | - | |
| |
Class C | | | (169 | ) | | | (1,912 | ) | | | - | | | | - | |
| |
| | | | |
Reacquired: | | | | | | | | | | | | | | | | |
| | | | |
Class A | | | (41,044 | ) | | | (476,812 | ) | | | (61,824 | ) | | | (795,066 | ) |
| |
Class C | | | (5,377 | ) | | | (61,927 | ) | | | (5,736 | ) | | | (73,024 | ) |
| |
Class R | | | (386 | ) | | | (4,300 | ) | | | (4 | ) | | | (49 | ) |
| |
Class Y | | | (2,646 | ) | | | (31,182 | ) | | | (2,107 | ) | | | (27,280 | ) |
| |
Class R5 | | | (8 | ) | | | (97 | ) | | | (29 | ) | | | (384 | ) |
| |
Class R6 | | | (114,373 | ) | | | (1,319,989 | ) | | | (115,850 | ) | | | (1,484,544 | ) |
| |
Net increase (decrease) in share activity | | | (26,447 | ) | | $ | (326,044 | ) | | | 307,228 | | | $ | 4,000,116 | |
| |
| (a) | There are entities that are record owners of more than 5% of the outstanding shares of the Fund and in the aggregate own 64% of the outstanding shares of the Fund. IDI has an agreement with these entities to sell Fund shares. The Fund, Invesco and/or Invesco affiliates may make payments to these entities, which are considered to be related to the Fund, for providing services to the Fund, Invesco and/or Invesco affiliates including but not limited to services such as securities brokerage, distribution, third party record keeping and account servicing. The Fund has no knowledge as to whether all or any portion of the shares owned of record by these entities are also owned beneficially. |
In addition, 15% of the outstanding shares of the Fund are owned by the Adviser or an affiliate of the Adviser.
22 Invesco Global Responsibility Equity Fund
Report of Independent Registered Public Accounting Firm
To the Board of Trustees of AIM International Mutual Funds (Invesco International Mutual Funds) and Shareholders of Invesco Global Responsibility Equity Fund
Opinion on the Financial Statements
We have audited the accompanying statement of assets and liabilities, including the schedule of investments, of Invesco Global Responsibility Equity Fund (one of the funds constituting AIM International Mutual Funds (Invesco International Mutual Funds), referred to hereafter as the “Fund”) as of October 31, 2019, the related statement of operations for the year ended October 31, 2019, the statement of changes in net assets for each of the two years in the period ended October 31, 2019, including the related notes, and the financial highlights for each of the three years in the period ended October 31, 2019 and the period July 1, 2016 (commencement of operations) through October 31, 2016 (collectively referred to as the “financial statements”). In our opinion, the financial statements present fairly, in all material respects, the financial position of the Fund as of October 31, 2019, the results of its operations for the year then ended, the changes in its net assets for each of the two years in the period ended October 31, 2019 and the financial highlights for each of the three years in the period ended October 31, 2019 and the period July 1, 2016 (commencement of operations) through October 31, 2016 in conformity with accounting principles generally accepted in the United States of America.
Basis for Opinion
These financial statements are the responsibility of the Fund’s management. Our responsibility is to express an opinion on the Fund’s financial statements based on our audits. We are a public accounting firm registered with the Public Company Accounting Oversight Board (United States) (PCAOB) and are required to be independent with respect to the Fund in accordance with the U.S. federal securities laws and the applicable rules and regulations of the Securities and Exchange Commission and the PCAOB.
We conducted our audits of these financial statements in accordance with the standards of the PCAOB. Those standards require that we plan and perform the audit to obtain reasonable assurance about whether the financial statements are free of material misstatement, whether due to error or fraud.
Our audits included performing procedures to assess the risks of material misstatement of the financial statements, whether due to error or fraud, and performing procedures that respond to those risks. Such procedures included examining, on a test basis, evidence regarding the amounts and disclosures in the financial statements. Our audits also included evaluating the accounting principles used and significant estimates made by management, as well as evaluating the overall presentation of the financial statements. Our procedures included confirmation of securities owned as of October 31, 2019 by correspondence with the custodian, transfer agent and brokers; when replies were not received from brokers, we performed other auditing procedures. We believe that our audits provide a reasonable basis for our opinion.
/s/PricewaterhouseCoopers LLP
Houston, Texas
December 23, 2019
We have served as the auditor of one or more of the investment companies in the Invesco group of investment companies since at least 1995. We have not been able to determine the specific year we began serving as auditor.
23 Invesco Global Responsibility Equity Fund
Calculating your ongoing Fund expenses
Example
As a shareholder of the Fund, you incur two types of costs: (1) transaction costs, which may include sales charges (loads) on purchase payments or contingent deferred sales charges on redemptions, if any; and (2) ongoing costs, including management fees, distribution and/or service(12b-1) fees, and other Fund expenses. This example is intended to help you understand your ongoing costs (in dollars) of investing in the Fund and to compare these costs with ongoing costs of investing in other mutual funds. The example is based on an investment of $1,000 invested at the beginning of the period and held for the entire period May 1, 2019 through October 31, 2019.
Actual expenses
The table below provides information about actual account values and actual expenses. You may use the information in this table, together with the amount you invested, to estimate the expenses that you paid over the period. Simply divide your account value by $1,000 (for example, an $8,600 account value divided by $1,000 = 8.6), then multiply the result by the number in the table under the heading entitled “Actual Expenses Paid During Period” to estimate the expenses you paid on your account during this period.
Hypothetical example for comparison purposes
The table below also provides information about hypothetical account values and hypothetical expenses based on the Fund’s actual expense ratio and an assumed rate of return of 5% per year before expenses, which is not the Fund’s actual return.
The hypothetical account values and expenses may not be used to estimate the actual ending account balance or expenses you paid for the period. You may use this information to compare the ongoing costs of investing in the Fund and other funds. To do so, compare this 5% hypothetical example with the 5% hypothetical examples that appear in the shareholder reports of the other funds.
Please note that the expenses shown in the table are meant to highlight your ongoing costs only and do not reflect any transaction costs, such as sales charges (loads) on purchase payments or contingent deferred sales charges on redemptions, if any. Therefore, the hypothetical information is useful in comparing ongoing costs only, and will not help you determine the relative total costs of owning different funds. In addition, if these transaction costs were included, your costs would have been higher.
| | | | | | | | | | | | |
| | | | | | | | | HYPOTHETICAL | | |
| | | | | | | | | (5% annual return before | | |
| | | | | ACTUAL | | expenses) | | |
| | | Beginning | | Ending | | Expenses | | Ending | | Expenses | | Annualized |
| | | Account Value | | Account Value | | Paid During | | Account Value | | Paid During | | Expense |
| | | (05/01/19) | | (10/31/19)1 | | Period2 | | (10/31/19) | | Period2 | | Ratio |
Class A | | $1,000.00 | | $992.50 | | $4.27 | | $1,020.92 | | $4.33 | | 0.85% |
Class C | | 1,000.00 | | 989.10 | | 8.02 | | 1,017.14 | | 8.13 | | 1.60 |
Class R | | 1,000.00 | | 990.80 | | 5.52 | | 1,019.66 | | 5.60 | | 1.10 |
Class Y | | 1,000.00 | | 994.20 | | 3.02 | | 1,022.18 | | 3.06 | | 0.60 |
Class R5 | | 1,000.00 | | 993.30 | | 3.00 | | 1,022.19 | | 3.05 | | 0.60 |
Class R6 | | 1,000.00 | | 993.30 | | 3.01 | | 1,022.18 | | 3.06 | | 0.60 |
| 1 | The actual ending account value is based on the actual total return of the Fund for the period May 1, 2019 through October 31, 2019, after actual expenses and will differ from the hypothetical ending account value which is based on the Fund’s expense ratio and a hypothetical annual return of 5% before expenses. |
| 2 | Expenses are equal to the Fund’s annualized expense ratio as indicated above multiplied by the average account value over the period, multiplied by 184/365 to reflect the most recent fiscal half year. |
24 Invesco Global Responsibility Equity Fund
Approval of Investment Advisory andSub-Advisory Contracts
At meetings held on June 10, 2019, the Board of Trustees (the Board or the Trustees) of AIM International Mutual Funds (Invesco International Mutual Funds) as a whole, and the independent Trustees, who comprise over 75% of the Board, voting separately, approved the continuance of the Invesco Global Responsibility Equity Fund’s (the Fund) Master Investment Advisory Agreement with Invesco Advisers, Inc. (Invesco Advisers and the investment advisory agreement) and the Master IntergroupSub-Advisory Contract for Mutual Funds with Invesco Asset Management Deutschland GmbH, Invesco Asset Management Limited, Invesco Asset Management (Japan) Limited, Invesco Hong Kong Limited, Invesco Senior Secured Management, Inc. and Invesco Canada Ltd. and separatesub-advisory contracts with Invesco Capital Management LLC and Invesco Asset Management (India) Private Limited (collectively, the AffiliatedSub-Advisers and thesub-advisory contracts) for another year, effective July 1, 2019. After evaluating the factors discussed below, among others, the Board approved the renewal of the Fund’s investment advisory agreement and thesub-advisory contracts and determined that the compensation payable by the Fund to Invesco Advisers and by Invesco Advisers to the AffiliatedSub-Advisers is fair and reasonable.
The Board’s Evaluation Process
The Board’s Investments Committee has established threeSub-Committees, which meet throughout the year to review the performance of funds advised by Invesco Advisers (the Invesco Funds). As part of a regularly scheduled basis ofin-person Board meetings, theSub-Committees meet with portfolio managers for their assigned Invesco Funds and other members of management to review detailed information about investment performance and portfolio attributes of these funds. The Board took into account evaluations and reports that it received from the Investments Committee andSub-Committees, as well as the information provided to such committees and the Board throughout the year, in considering whether to approve each Invesco Fund’s investment advisory agreement andsub-advisory contracts.
As part of the contract renewal process, the Board reviews and considers information provided in response to detailed requests for information submitted to management by the independent Trustees with assistance from legal counsel to the independent Trustees. The Board receives comparative investment performance and fee data regarding the Invesco Funds prepared by Invesco Advisers and Broadridge Financial Solutions, Inc. (Broadridge), an independent mutual fund data provider. The Board also receives an independent written
evaluation from the Senior Officer, an officer of the Invesco Funds who reports directly to the independent Trustees. The Senior Officer’s evaluation is prepared as part of his responsibility to manage the process by which the Invesco Funds’ proposed management fees are negotiated during the annual contract renewal process to ensure they are negotiated in a manner that is at arms’ length and reasonable. In addition to meetings with Invesco Advisers and fund counsel throughout the year, the independent Trustees also discuss the continuance of the investment advisory agreement andsub-advisory contracts in separate sessions with the Senior Officer and with independent legal counsel.
The discussion below is a summary of the Senior Officer’s independent written evaluation with respect to the Fund’s investment advisory agreement, as well as a discussion of the material factors and related conclusions that formed the basis for the Board’s approval of the Fund’s investment advisory agreement andsub-advisory contracts. The Trustees’ review and conclusions are based on the comprehensive consideration of all information presented to them during the course of the year and in prior years and are not the result of any single determinative factor. Moreover, one Trustee may have weighed a particular piece of information or factor differently than another Trustee. This information is current as of June 10, 2019.
Factors and Conclusions and Summary of Independent Written Fee Evaluation
| A. | Nature, Extent and Quality of Services Provided by Invesco Advisers and the AffiliatedSub-Advisers |
The Board reviewed the nature, extent and quality of the advisory services provided to the Fund by Invesco Advisers under the Fund’s investment advisory agreement, and the credentials and experience of the officers and employees of Invesco Advisers who provide these services, including the Fund’s portfolio manager(s). The Board’s review included consideration of Invesco Advisers’ investment process oversight and structure, credit analysis and investment risk management. The Board also considerednon-advisory services that Invesco Advisers and its affiliates provide to the Invesco Funds such as various back office support functions, third party oversight, internal audit, valuation, portfolio trading and legal and compliance. The Board also received and reviewed information about Invesco Advisers’ role as administrator of the Invesco Funds’ liquidity risk management program. The Board also reviewed and considered the benefits to shareholders of investing in a fund that is part of the Invesco family of funds under the
umbrella of Invesco Ltd., Invesco Advisers’ parent company, and noted Invesco Ltd.’s depth and experience in conducting an investment management business, as well as its commitment of financial and other resources to such business. The Board reviewed and considered information about the resources that Invesco Advisers intends to continue to commit to managing the Invesco family of funds following Invesco Ltd.’s acquisition of OppenheimerFunds, Inc. and its subsidiaries. The Board concluded that the nature, extent and quality of the services provided to the Fund by Invesco Advisers are appropriate and satisfactory.
The Board reviewed the services that may be provided by the AffiliatedSub-Advisers under thesub-advisory contracts and the credentials and experience of the officers and employees of the AffiliatedSub-Advisers who provide these services. The Board noted the AffiliatedSub-Advisers’ expertise with respect to certain asset classes and that the AffiliatedSub-Advisers have offices and personnel that are located in financial centers around the world. As a result, the Board noted that the AffiliatedSub-Advisers can provide research and investment analysis on the markets and economies of various countries in which the Fund may invest, make recommendations regarding securities and assist with security trades. The Board concluded that thesub-advisory contracts may benefit the Fund and its shareholders by permitting Invesco Advisers to use the resources and talents of the AffiliatedSub-Advisers in managing the Fund. The Board concluded that the nature, extent and quality of the services that may be provided by the AffiliatedSub-Advisers are appropriate and satisfactory.
| B. | Fund Investment Performance |
The Board considered Fund investment performance as a relevant factor in considering whether to approve the investment advisory agreement as well as thesub-advisory contracts for the Fund, as Invesco Asset Management Deutschland GmbH currently manages assets of the Fund.
The Board noted that the Fund only had two full years of performance history and compared the Fund’s investment performance during the past two years ending December 31, 2018 to the performance of funds in the Broadridge performance universe and against the Lipper GlobalMulti-Cap Core Funds Index. The Board noted that performance of Class A shares of the Fund was in the fifth quintile of its performance universe for the one and two year periods (the first quintile being the best performing funds and the fifth quintile being the worst performing funds). The Board noted that performance of
25 Invesco Global Responsibility Equity Fund
Class A shares of the Fund was below the performance of the Index for the one and two year periods. The Board noted that the valuation component of the Fund’s multi-factor model investment process and its overweight and underweight exposure to and security selection in certain sectors detracted from Fund performance. The Trustees also reviewed more recent Fund performance and this review did not change their conclusions.
| C. | Advisory andSub-Advisory Fees and Fund Expenses |
The Board compared the Fund’s contractual management fee rate to the contractual management fee rates of funds in the Fund’s Broadridge expense group. The Board noted that the contractual management fee rate for Class A shares of the Fund was below the median contractual management fee rate of funds in its expense group. The Board noted that the term “contractual management fee” for funds in the expense group may include both advisory and certainnon-portfolio management administrative services fees, but that Broadridge does not provide information on a fund by fund basis as to what is included. The Board also reviewed the methodology used by Broadridge in providing expense group information, which includes using each fund’s contractual management fee schedule (including any applicable breakpoints) as reported in the most recent prospectus or statement of additional information for each fund in the expense group. The Board also considered comparative information regarding the Fund’s total expense ratio and its various components. The Board noted that there were only five funds (including the Fund) in the expense group
The Board noted that Invesco Advisers has contractually agreed to waive fees and/or limit expenses of the Fund for the term disclosed in the Fund’s registration statement in an amount necessary to limit total annual operating expenses to a specified percentage of average daily net assets for each class of the Fund.
The Board also considered the fees charged by Invesco Advisers and the AffiliatedSub-Advisers to other similarly managed client accounts. The Board noted that Invesco Advisers or the AffiliatedSub-Advisers may charge lower fees to large institutional clients. Invesco Advisers reviewed with the Board differences in the scope of services it provides to the Invesco Funds relative to certain other types of client accounts, including management of cash flows as a result of redemptions and purchases, necessary infrastructure such as officers, office space, technology, legal and distribution, oversight of service providers, costs and business risks associated with launching new funds and sponsoring and maintaining the product line, preparation of annual registration statement updates and financial information and
compliance with federal and state laws and regulations.
The Board also considered the services that may be provided by the AffiliatedSub-Advisers pursuant to thesub-advisory contracts, as well as the fees payable by Invesco Advisers to the AffiliatedSub-Advisers pursuant to thesub-advisory contracts. The Board noted that Invesco Advisers retains overall responsibility for, and provides services to,sub-advised Invesco Funds, including oversight of the AffiliatedSub-Advisers as well as the additional services described herein other thanday-to-day portfolio management.
| D. | Economies of Scale and Breakpoints |
The Board considered the extent to which there may be economies of scale in the provision of advisory services to the Fund. The Board considered Invesco’s reinvestment in its business, including investments in business infrastructure and cybersecurity. The Board also considered that the Fund may benefit from economies of scale through contractual breakpoints in the Fund’s advisory fee schedule, which generally operate to reduce the Fund’s expense ratio as it grows in size. The Board noted that the Fund shares directly in economies of scale through lower fees charged by third party service providers based on the combined size of the Invesco Funds. The Board noted that the Fund may also benefit from economies of scale through initial fee setting, fee waivers and expense reimbursements.
| E. | Profitability and Financial Resources |
The Board reviewed information from Invesco Advisers concerning the costs of the advisory and other services that Invesco Advisers and its affiliates provide to the Fund and the Invesco Funds and the profitability of Invesco Advisers and its affiliates in providing these services. The Board considered the methodology used for calculating profitability and noted the periodic review of such methodology by an independent consultant. The Board noted that Invesco Advisers continues to operate at a net profit from services Invesco Advisers and its affiliates provide to the Invesco Funds. The Board received information from Invesco Advisers demonstrating that Invesco Advisers and the AffiliatedSub-Advisers are financially sound and have the resources necessary to perform their obligations under the investment advisory agreement andsub-advisory contracts.
| F. | Collateral Benefits to Invesco Advisers and its Affiliates |
The Board considered various other benefits received by Invesco Advisers and its affiliates from the relationship with the Fund, including the fees received for providing administrative, transfer agency and distribution services to the Fund. The Board considered comparative information regarding fees charged for these services, including information provided by Broadridge and other independent sources. The Board considered the performance of Invesco Advisers and its affiliates in providing these
services and the organizational structure employed to provide these services. The Board also considered that these services are provided to the Fund pursuant to written contracts that are reviewed and approved on an annual basis by the Board; and that the services are required for the operation of the Fund.
The Board considered the benefits realized by Invesco Advisers and the AffiliatedSub-Advisers as a result of portfolio brokerage transactions executed through “soft dollar” arrangements. The Board noted that soft dollar arrangements may result in the Fund bearing costs to purchase research that may be used by Invesco Advisers or the AffiliatedSub-Advisers with other clients and may reduce Invesco Advisers’ or the AffiliatedSub-Advisers’ expenses. The Board also considered that it receives periodic reports from Invesco representing that these arrangements are consistent with regulatory requirements. The Board did not deem the soft dollar arrangements to be inappropriate.
The Board considered that the Fund’s uninvested cash and cash collateral from any securities lending arrangements may be invested in money market funds advised by Invesco Advisers pursuant to procedures approved by the Board. The Board considered information regarding the returns of the affiliated money market funds relative to comparable overnight investments, as well as the costs to the Fund of such investments. The Board noted that Invesco Advisers receives advisory fees from these affiliated money market funds attributable to such investments, although Invesco Advisers has contractually agreed to waive through varying periods the advisory fees payable by the Invesco Funds with respect to certain investments in the affiliated money market funds. The waiver is in an amount equal to 100% of the net advisory fee Invesco Advisers receives from the affiliated money market funds with respect to the Fund’s investment in the affiliated money market funds of uninvested cash, but not cash collateral. The Board concluded that the amount of advisory fees received by Invesco Advisers from the Fund’s investment of cash collateral from any securities lending arrangements in the affiliated money market funds is fair and reasonable.
The Board also considered that an affiliated broker may receive commissions for executing certain trades for the Fund. Invesco Advisers and the AffiliatedSub-Advisers may use the affiliated broker to, among other things, control order routing and minimize information leakage, and the Board was advised that such trades are executed in compliance with rules under the federal securities laws and consistent with best execution obligations.
26 Invesco Global Responsibility Equity Fund
Tax Information
Form1099-DIV, Form1042-S and otheryear-end tax information provide shareholders with actual calendar year amounts that should be included in their tax returns. Shareholders should consult their tax advisors.
The following distribution information is being provided as required by the Internal Revenue Code or to meet a specific state’s requirement. The Fund designates the following amounts or, if subsequently determined to be different, the maximum amount allowable for its fiscal year ended October 31, 2019:
| | | | | | |
| | | | | | |
| | Federal and State Income Tax | | | | |
| | Long-Term Capital Gain Distributions | | $ | 73,296 | |
| | Qualified Dividend Income* | | | 100.00 | % |
| | Corporate Dividends Received Deduction* | | | 54.48 | % |
| | U.S. Treasury Obligations* | | | 0.00 | % |
| | * | The above percentages are based on ordinary income dividends paid to shareholders during the Fund’s fiscal year. |
27 Invesco Global Responsibility Equity Fund
Trustees and Officers
The address of each trustee and officer is AIM International Mutual Funds (Invesco International Mutual Funds) (the “Trust”), 11 Greenway Plaza, Suite 1000, Houston, Texas 77046-1173. The trustees serve for the life of the Trust, subject to their earlier death, incapacitation, resignation, retirement or removal as more specifically provided in the Trust’s organizational documents. Each officer serves for a one year term or until their successors are elected and qualified. Column two below includes length of time served with predecessor entities, if any.
| | | | | | | | |
Name, Year of Birth and Position(s) Held with the Trust | | Trustee and/or Officer Since | | Principal Occupation(s) During Past 5 Years | | Number of Funds in Fund Complex Overseen by Trustee | | Other Directorship(s) Held by Trustee During Past 5 Years |
| | | |
| Interested Persons | | | | |
| Martin L. Flanagan1 – 1960 Trustee and Vice Chair | | 2007 | | Executive Director, Chief Executive Officer and President, Invesco Ltd. (ultimate parent of Invesco and a global investment management firm); Trustee and Vice Chair, The Invesco Funds; Vice Chair, Investment Company Institute; and Member of Executive Board, SMU Cox School of Business Formerly: Advisor to the Board, Invesco Advisers, Inc. (formerly known as Invesco Institutional (N.A.), Inc.); Chairman and Chief Executive Officer, Invesco Advisers, Inc. (registered investment adviser); Director, Chairman, Chief Executive Officer and President, Invesco Holding Company (US), Inc. (formerly IVZ Inc.) (holding company), Invesco Group Services, Inc. (service provider) and Invesco North American Holdings, Inc. (holding company); Director, Chief Executive Officer and President, Invesco Holding Company Limited (parent of Invesco and a global investment management firm); Director, Invesco Ltd.; Chairman, Investment Company Institute and President,Co-Chief Executive Officer,Co-President, Chief Operating Officer and Chief Financial Officer, Franklin Resources, Inc. (global investment management organization) | | 229 | | None |
| Philip A. Taylor2 – 1954 Trustee | | 2006 | | Vice Chair, Invesco Ltd.; Trustee, The Invesco Funds Formerly: Director, Invesco Canada Ltd. (formerly known as Invesco Trimark Ltd./Invesco Trimark Ltèe) (registered investment adviser and registered transfer agent); Head of the Americas and Senior Managing Director, Invesco Ltd.; Director, Invesco Advisers, Inc. (formerly known as Invesco Institutional (N.A.), Inc.) (registered investment adviser); Director and Chairman, Invesco Investment Services, Inc. (formerly known as Invesco AIM Investment Services, Inc.) (registered transfer agent); Chief Executive Officer, Invesco Corporate Class Inc. (corporate mutual fund company); Chairman and Chief Executive Officer, Invesco Canada Ltd. (formerly known as Invesco Trimark Ltd./Invesco Trimark Ltèe) (registered investment adviser and registered transfer agent); Senior Vice President, The Invesco Funds; Director, Invesco Investment Advisers LLC (formerly known as Van Kampen Asset Management); Director, Chairman, Chief Executive Officer and President, Invesco Management Group, Inc. (formerly known as Invesco AIM Management Group, Inc.) (financial services holding company);Co-Chairman,Co-President andCo-Chief Executive Officer, Invesco Advisers, Inc. (formerly known as Invesco Institutional (N.A.), Inc.) (registered investment adviser); Director, Chief Executive Officer and President, Van Kampen Exchange Corp; President and Principal Executive Officer, The Invesco Funds (other than AIM Treasurer’s Series Trust (Invesco Treasurer’s Series Trust), Short-Term Investments Trust and Invesco Management Trust); Executive Vice President, The Invesco Funds (AIM Treasurer’s Series Trust (Invesco Treasurer’s Series Trust), Short-Term Investments Trust and Invesco Management Trust only); Director and President, INVESCO Funds Group, Inc. (registered investment adviser and registered transfer agent); Director and Chairman, IVZ Distributors, Inc. (formerly known as INVESCO Distributors, Inc.) (registered broker dealer); Director, President and Chairman, Invesco Inc. (holding company), Invesco Canada Holdings Inc. (holding company), Trimark Investments Ltd./Placements Trimark Ltèe and Invesco Financial Services Ltd/Services Financiers Invesco Ltèe; Chief Executive Officer, Invesco Canada Fund Inc. (corporate mutual fund company); Director and Chairman, Van Kampen Investor Services Inc.; Director, Chief Executive Officer and President, 1371 Preferred Inc. (holding company) and Van Kampen Investments Inc.; Director and President, AIM GP Canada Inc. (general partner for limited partnerships) and Van Kampen Advisors, Inc.; Director and Chief Executive Officer, Invesco Trimark Dealer Inc. (registered broker dealer); Director, Invesco Distributors, Inc. (formerly known as Invesco AIM Distributors, Inc.) (registered broker dealer); Manager, Invesco Capital Management LLC; Director, Chief Executive Officer and President, Invesco Advisers, Inc.; Director, Chairman, Chief Executive Officer and President, Invesco AIM Capital Management, Inc.; President, Invesco Trimark Dealer Inc. and Invesco Trimark Ltd./Invesco Trimark Ltèe; Director and President, AIM Trimark Corporate Class Inc. and AIM Trimark Canada Fund Inc.; Senior Managing Director, Invesco Holding Company Limited; Director and Chairman, Fund Management Company (former registered broker dealer); President and Principal Executive Officer, The Invesco Funds (AIM Treasurer’s Series Trust (Invesco Treasurer’s Series Trust), and Short-Term Investments Trust only); President, AIM Trimark Global Fund Inc. and AIM Trimark Canada Fund Inc. | | 229 | | None |
| 1 | Mr. Flanagan is considered an interested person (within the meaning of Section 2(a)(19) of the 1940 Act) of the Trust because he is an officer of the Adviser to the Trust, and an officer and a director of Invesco Ltd., ultimate parent of the Adviser. |
| 2 | Mr. Taylor is considered an interested person (within the meaning of Section 2(a)(19) of the 1940 Act) of the Trust because he is an officer and a director of the Adviser. |
T-1 Invesco Global Responsibility Equity Fund
Trustees and Officers–(continued)
| | | | | | | | |
Name, Year of Birth and Position(s) Held with the Trust | | Trustee and/
or Officer
Since | | Principal Occupation(s) During Past 5 Years | | Number of Funds in Fund Complex
Overseen by Trustee | | Other Directorship(s) Held by Trustee During Past 5 Years |
| | | | | |
| Independent Trustees | | | | | | | | |
Bruce L. Crockett – 1944 Trustee and Chair | | 1992 | | Chairman, Crockett Technologies Associates (technology consulting company) Formerly: Director, Captaris (unified messaging provider); Director, President and Chief Executive Officer, COMSAT Corporation; Chairman, Board of Governors of INTELSAT (international communications company); ACE Limited (insurance company); Independent Directors Council and Investment Company Institute: Member of the Audit Committee, Investment Company Institute; Member of the Executive Committee and Chair of the Governance Committee, Independent Directors Council | | 229 | | Director and Chairman of the Audit Committee, ALPS (Attorneys Liability Protection Society) (insurance company); Director and Member of the Audit Committee and Compensation Committee, Ferroglobe PLC (metallurgical company) |
David C. Arch – 1945 Trustee | | 2010 | | Chairman of Blistex Inc. (consumer health care products manufacturer); Member, World Presidents’ Organization | | 229 | | Board member of the Illinois Manufacturers’ Association |
Beth Ann Brown – 1968 Trustee | | 2019 | | Independent Consultant Formerly: Head of Intermediary Distribution, Managing Director, Strategic Relations, Managing Director, Head of National Accounts, Senior Vice President, National Account Manager and Senior Vice President, Key Account Manager, Columbia Management Investment Advisers LLC; Vice President, Key Account Manager, Liberty Funds Distributor, Inc.; and Trustee of certain Oppenheimer Funds | | 229 | | Director, Board of Directors of Caron Engineering Inc.; President and Director, Acton Shapleigh Youth Conservation Corps (non - profit); and Vice President and Director of Grahamtastic Connection (non-profit) |
Jack M. Fields – 1952 Trustee | | 1997 | | Chief Executive Officer, Twenty First Century Group, Inc. (government affairs company); and Chairman, Discovery Learning Alliance(non-profit) Formerly: Owner and Chief Executive Officer, Dos Angeles Ranch L.P. (cattle, hunting, corporate entertainment); Director, Insperity, Inc. (formerly known as Administaff) (human resources provider); Chief Executive Officer, Texana Timber LP (sustainable forestry company); Director of Cross Timbers Quail Research Ranch(non-profit); and member of the U.S. House of Representatives | | 229 | | None |
Cynthia Hostetler – 1962 Trustee | | 2017 | | Non-Executive Director and Trustee of a number of public and private business corporations Formerly: Director, Aberdeen Investment Funds (4 portfolios); Head of Investment Funds and Private Equity, Overseas Private Investment Corporation; President, First Manhattan Bancorporation, Inc.; Attorney, Simpson Thacher & Bartlett LLP | | 229 | | Vulcan Materials Company (construction materials company); Trilinc Global Impact Fund; Genesee & Wyoming, Inc. (railroads); Artio Global Investment LLC (mutual fund complex); Edgen Group, Inc. (specialized energy and infrastructure products distributor); Investment Company Institute (professional organization); Independent Directors Council (professional organization) |
T-2 Invesco Global Responsibility Equity Fund
Trustees and Officers–(continued)
| | | | | | | | |
Name, Year of Birth and Position(s) Held with the Trust | | Trustee and/
or Officer
Since | | Principal Occupation(s) During Past 5 Years | | Number of Funds in Fund Complex
Overseen by Trustee | | Other Directorship(s) Held by Trustee During Past 5 Years |
| | | |
| Independent Trustees–(continued) | | | | |
Eli Jones – 1961 Trustee | | 2016 | | Professor and Dean, Mays Business School - Texas A&M University Formerly: Professor and Dean, Walton College of Business, University of Arkansas and E.J. Ourso College of Business, Louisiana State University; Director, Arvest Bank | | 229 | | Insperity, Inc. (formerly known as Administaff) (human resources provider) |
Elizabeth Krentzman – 1959 Trustee | | 2019 | | Formerly: Principal and Chief Regulatory Advisor for Asset Management Services and U.S. Mutual Fund Leader of Deloitte & Touche LLP; General Counsel of the Investment Company Institute (trade association); National Director of the Investment Management Regulatory Consulting Practice, Principal, Director and Senior Manager of Deloitte & Touche LLP; Assistant Director of the Division of Investment Management - Office of Disclosure and Investment Adviser Regulation of the U.S. Securities and Exchange Commission and various positions with the Division of Investment Management – Office of Regulatory Policy of the U.S. Securities and Exchange Commission; Associate at Ropes & Gray LLP; Advisory Board Member of the Securities and Exchange Commission Historical Society; and Trustee of certain Oppenheimer Funds | | 229 | | Trustee of the University of Florida National Board Foundation and Audit Committee Member; Member of the Cartica Funds Board of Directors (private investment funds); Member of the University of Florida Law Center Association, Inc. Board of Trustees and Audit Committee Member |
Anthony J. LaCava, Jr. – 1956 Trustee | | 2019 | | Formerly: Director and Member of the Audit Committee, Blue Hills Bank (publicly traded financial institution) and Managing Partner, KPMG LLP | | 229 | | Blue Hills Bank; Chairman, Bentley University; Member, Business School Advisory Council; and Nominating Committee KPMG LLP |
Prema Mathai-Davis – 1950 Trustee | | 1998 | | Retired Co-Owner & Partner of Quantalytics Research, LLC, (a FinTech Investment Research Platform for the Self-Directed Investor) | | 229 | | None |
Joel W. Motley – 1952 Trustee | | 2019 | | Director of Office of Finance, Federal Home Loan Bank; Member of the Vestry of Trinity Wall Street; Managing Director of Carmona Motley Inc. (privately held financial advisor); Member of the Finance and Budget Committee of the Council on Foreign Relations, Member of the Investment Committee and Board of Human Rights Watch and Member of the Investment Committee and Board of Historic Hudson Valley(non-profit cultural organization) Formerly: Managing Director of Public Capital Advisors, LLC (privately held financial advisor); Managing Director of Carmona Motley Hoffman, Inc. (privately held financial advisor); Trustee of certain Oppenheimer Funds; and Director of Columbia Equity Financial Corp. (privately held financial advisor) | | 229 | | Director of Greenwall Foundation (bioethics research foundation); Member of Board and Investment Committee of The Greenwall Foundation; Director of Southern Africa Legal Services Foundation; Board Member and Investment Committee Member of Pulizer Center for Crisis Reporting(non-profit journalism) |
| Teresa M. Ressel – 1962 Trustee | | 2017 | | Non-executive director and trustee of a number of public and private business corporations Formerly: Chief Financial Officer, Olayan America, The Olayan Group (international investor/commercial/industrial); Chief Executive Officer, UBS Securities LLC; Group Chief Operating Officer, Americas, UBS AG; Assistant Secretary for Management & Budget and CFO, US Department of the Treasury | | 229 | | Atlantic Power Corporation (power generation company); ON Semiconductor Corp. (semiconductor supplier) |
T-3 Invesco Global Responsibility Equity Fund
Trustees and Officers–(continued)
| | | | | | | | |
Name, Year of Birth and Position(s) Held with the Trust | | Trustee and/
or Officer
Since | | Principal Occupation(s) During Past 5 Years | | Number of Funds in Fund Complex
Overseen by Trustee | | Other Directorship(s) Held by Trustee During Past 5 Years |
| | | |
| Independent Trustees–(continued) | | | | |
| Ann Barnett Stern – 1957 Trustee | | 2017 | | President and Chief Executive Officer, Houston Endowment Inc. (private philanthropic institution) Formerly: Executive Vice President and General Counsel, Texas Children’s Hospital; Attorney, Beck, Redden and Secrest, LLP; Business Law Instructor, University of St. Thomas; Attorney, Andrews & Kurth LLP | | 229 | | Federal Reserve Bank of Dallas |
| Raymond Stickel, Jr. – 1944 Trustee | | 2005 | | Retired Formerly: Director, Mainstay VP Series Funds, Inc. (25 portfolios); Partner, Deloitte & Touche | | 229 | | None |
| Robert C. Troccoli – 1949 Trustee | | 2016 | | Retired Formerly: Adjunct Professor, University of Denver – Daniels College of Business; Senior Partner, KPMG LLP | | 229 | | None |
| Daniel S. Vandivort – 1954 Trustee | | 2019 | | Treasurer, Chairman of the Audit and Finance Committee, and Trustee, Board of Trustees, Huntington Disease Foundation of America; and President, Flyway Advisory Services LLC (consulting and property management) Formerly: Trustee and Governance Chair, of certain Oppenheimer Funds | | 229 | | Chairman and Lead Independent Director, Chairman of the Audit Committee, and Director, Board of Directors, Value Line Funds |
| James D. Vaughn – 1945 Trustee | | 2019 | | Retired Formerly: Managing Partner, Deloitte & Touche LLP; Trustee and Chairman of the Audit Committee, Schroder Funds; Board Member, Mile High United Way, Boys and Girls Clubs, Boy Scouts, Colorado Business Committee for the Arts, Economic Club of Colorado and Metro Denver Network (economic development corporation); and Trustee of certain Oppenheimer Funds | | 229 | | Board member and Chairman of Audit Committee of AMG National Trust Bank; Trustee and Investment Committee member, University of South Dakota Foundation; Board member, Audit Committee Member and past Board Chair, Junior Achievement(non-profit) |
Christopher L. WIlson – 1957 Trustee, Vice Chair and Chair Designate | | 2017 | | Reitred Formerly: Director, TD Asset Management USA Inc. (mutual fund complex) (22 portfolios); Managing Partner, CT2, LLC (investing and consulting firm); President/Chief Executive Officer, Columbia Funds, Bank of America Corporation; President/Chief Executive Officer, CDC IXIS Asset Management Services, Inc.; Principal & Director of Operations, Scudder Funds, Scudder, Stevens & Clark, Inc.; Assistant Vice President, Fidelity Investments | | 229 | | ISO New England, Inc.(non-profit organization managing regional electricity market) |
T-4 Invesco Global Responsibility Equity Fund
Trustees and Officers–(continued)
| | | | | | | | |
Name, Year of Birth and Position(s) Held with the Trust | | Trustee and/
or Officer
Since | | Principal Occupation(s) During Past 5 Years | | Number of Funds in Fund Complex
Overseen by Trustee | | Other Directorship(s) Held by Trustee During Past 5 Years |
| | | |
| Other Officers | | | | |
| Sheri Morris – 1964 President, Principal Executive Officer and Treasurer | | 1999 | | Head of Global Fund Services, Invesco Ltd.; President, Principal Executive Officer and Treasurer, The Invesco Funds; Vice President, Invesco Advisers, Inc. (formerly known as Invesco Institutional (N.A.), Inc.) (registered investment adviser); and Vice President, Invesco Exchange-Traded Fund Trust, Invesco Exchange-Traded Fund Trust II, Invesco India Exchange-Traded Fund Trust, Invesco Actively Managed Exchange-Traded Fund Trust, Invesco Actively Managed Exchange-Traded Commodity Fund Trust and Invesco Exchange-Traded Self-Indexed Fund Trust; and Vice President, OppenheimerFunds, Inc. Formerly: Vice President and Principal Financial Officer, The Invesco Funds; Vice President, Invesco AIM Advisers, Inc., Invesco AIM Capital Management, Inc. and Invesco AIM Private Asset Management, Inc.; Assistant Vice President and Assistant Treasurer, The Invesco Funds and Assistant Vice President, Invesco Advisers, Inc., Invesco AIM Capital Management, Inc. and Invesco AIM Private Asset Management, Inc.; and Treasurer, Invesco Exchange-Traded FundTrust, Invesco Exchange-Traded Fund Trust II, Invesco India Exchange-Traded Fund Trust and Invesco Actively Managed Exchange-Traded Fund Trust | | N/A | | N/A |
| Russell C. Burk – 1958 Senior Vice President and Senior Officer | | 2005 | | Senior Vice President and Senior Officer, The Invesco Funds | | N/A | | N/A |
| Jeffrey H. Kupor – 1968 Senior Vice President, Chief Legal Officer and Secretary | | 2018 | | Head of Legal of the Americas, Invesco Ltd.; Senior Vice President and Secretary, Invesco Advisers, Inc. (formerly known as Invesco Institutional (N.A.), Inc.) (registered investment adviser); Senior Vice President and Secretary, Invesco Distributors, Inc. (formerly known as Invesco AIM Distributors, Inc.); Vice President and Secretary, Invesco Investment Services, Inc. (formerly known as Invesco AIM Investment Services, Inc.) Senior Vice President, Chief Legal Officer and Secretary, The Invesco Funds; Secretary and General Counsel, Invesco Investment Advisers LLC (formerly known as Van Kampen Asset Management); Secretary and General Counsel, Invesco Capital Markets, Inc. (formerly known as Van Kampen Funds Inc.) and Chief Legal Officer, Invesco Exchange-Traded Fund Trust, Invesco Exchange-Traded Fund Trust II, Invesco India Exchange-Traded Fund Trust, Invesco Actively Managed Exchange-Traded Fund Trust, Invesco Actively Managed Exchange-Traded Commodity Fund Trust and Invesco Exchange-Traded Self-Indexed Fund Trust; Secretary, Invesco Indexing LLC; Secretary, W.L. Ross & Co., LLC Formerly: Secretary and Vice President, Jemstep, Inc.; Head of Legal, Worldwide Institutional, Invesco Ltd.; Secretary and General Counsel, INVESCO Private Capital Investments, Inc.; Senior Vice President, Secretary and General Counsel, Invesco Management Group, Inc. (formerly known as Invesco AIM Management Group, Inc.); Assistant Secretary, INVESCO Asset Management (Bermuda) Ltd.; Secretary and General Counsel, Invesco Private Capital, Inc.; Assistant Secretary and General Counsel, INVESCO Realty, Inc.; Secretary and General Counsel, Invesco Senior Secured Management, Inc.; and Secretary, Sovereign G./P. Holdings Inc. | | N/A | | N/A |
Andrew R. Schlossberg – 1974 Senior Vice President | | 2019 | | Head of the Americas and Senior Managing Director, Invesco Ltd.; Director and Senior Vice President, Invesco Advisers, Inc. (formerly known as Invesco Institutional (N.A.), Inc.) (registered investment adviser); Director and Chairman, Invesco Investment Services, Inc. (formerly known as Invesco AIM Investment Services, Inc.) (registered transfer agent); Senior Vice President, The Invesco Funds; Director, Invesco Investment Advisers LLC (formerly known as Van Kampen Asset Management); Director, President and Chairman, Invesco Insurance Agency, Inc. Formerly: Director, Invesco UK Limited; Director and Chief Executive, Invesco Asset Management Limited and Invesco Fund Managers Limited; Assistant Vice President, The Invesco Funds; Senior Vice President, Invesco Advisers, Inc. (formerly known as Invesco Institutional (N.A.), Inc.) (registered investment adviser); Director and Chief Executive, Invesco Administration Services Limited and Invesco Global Investment Funds Limited; Director, Invesco Distributors, Inc.; Head of EMEA, Invesco Ltd.; President, Invesco Actively Managed Exchange-Traded Commodity Fund Trust, Invesco Actively Managed Exchange-Traded Fund Trust, Invesco Exchange-Traded Fund Trust, Invesco Exchange-Traded Fund Trust II and Invesco India Exchange-Traded Fund Trust; Managing Director and Principal Executive Officer, Invesco Capital Management LLC | | N/A | | N/A |
T-5 Invesco Global Responsibility Equity Fund
Trustees and Officers–(continued)
| | | | | | | | |
Name, Year of Birth and Position(s) Held with the Trust | | Trustee and/
or Officer
Since | | Principal Occupation(s) During Past 5 Years | | Number of Funds in Fund Complex
Overseen by Trustee | | Other Directorship(s) Held by Trustee During Past 5 Years |
| | | |
| Other Officers–(continued) | | | | |
John M. Zerr – 1962 Senior Vice President | | 2006 | | Chief Operating Officer of the Americas; Senior Vice President, Invesco Advisers, Inc. (formerly known as Invesco Institutional (N.A.), Inc.) (registered investment adviser); Senior Vice President, Invesco Distributors, Inc. (formerly known as Invesco AIM Distributors, Inc.); Director and Vice President, Invesco Investment Services, Inc. (formerly known as Invesco AIM Investment Services, Inc.) Senior Vice President, The Invesco Funds; Managing Director, Invesco Capital Management LLC; Director, Invesco Investment Advisers LLC (formerly known as Van Kampen Asset Management); Senior Vice President, Invesco Capital Markets, Inc. (formerly known as Van Kampen Funds Inc.); Manager, Invesco Indexing LLC; Manager, Invesco Specialized Products, LLC; Director and Senior Vice President, Invesco Insurance Agency, Inc.; Member, Invesco Canada Funds Advisory Board; Director, President and Chief Executive Officer, Invesco Corporate Class Inc. (corporate mutual fund company); and Director, Chairman, President and Chief Executive Officer, Invesco Canada Ltd. (formerly known as Invesco Trimark Ltd./Invesco Trimark Ltèe) (registered investment adviser and registered transfer agent) Formerly: Director and Senior Vice President, Invesco Management Group, Inc. (formerly known as Invesco AIM Management Group, Inc.); Secretary and General Counsel, Invesco Management Group, Inc. (formerly known as Invesco AIM Management Group, Inc.); Secretary, Invesco Investment Services, Inc. (formerly known as Invesco AIM Investment Services, Inc.); Chief Legal Officer and Secretary, The Invesco Funds; Secretary and General Counsel, Invesco Investment Advisers LLC (formerly known as Van Kampen Asset Management); Secretary and General Counsel, Invesco Capital Markets, Inc. (formerly known as Van Kampen Funds Inc.); Chief Legal Officer, Invesco Exchange-Traded Fund Trust, Invesco Exchange-Traded Fund Trust II, Invesco India Exchange-Traded Fund Trust, Invesco Actively Managed Exchange-Traded Fund Trust, Invesco Actively Managed Exchange-Traded Commodity Fund Trust and Invesco Exchange-Traded Self-Indexed Fund Trust; Secretary, Invesco Indexing LLC; Director, Secretary, General Counsel and Senior Vice President, Van Kampen Exchange Corp.; Director, Vice President and Secretary, IVZ Distributors, Inc. (formerly known as INVESCO Distributors, Inc.); Director and Vice President, INVESCO Funds Group, Inc.; Director and Vice President, Van Kampen Advisors Inc.; Director, Vice President, Secretary and General Counsel, Van Kampen Investor Services Inc.; Director and Secretary, Invesco Distributors, Inc. (formerly known as Invesco AIM Distributors, Inc.); Director, Senior Vice President, General Counsel and Secretary, Invesco AIM Advisers, Inc. and Van Kampen Investments Inc.; Director, Vice President and Secretary, Fund Management Company; Director, Senior Vice President, Secretary, General Counsel and Vice President, Invesco AIM Capital Management, Inc.; Chief Operating Officer and General Counsel, Liberty Ridge Capital, Inc. (an investment adviser) | | N/A | | N/A |
Gregory G. McGreevey – 1962 Senior Vice President | | 2012 | | Senior Managing Director, Invesco Ltd.; Director, Chairman, President, and Chief Executive Officer, Invesco Advisers, Inc. (formerly known as Invesco Institutional (N.A.), Inc.) (registered investment adviser); Director, Invesco Mortgage Capital, Inc. and Invesco Senior Secured Management, Inc.; and Senior Vice President, The Invesco Funds; and President, SNW Asset Management Corporation Formerly: Senior Vice President, Invesco Management Group, Inc. and Invesco Advisers, Inc.; Assistant Vice President, The Invesco Funds | | N/A | | N/A |
Kelli Gallegos – 1970 Vice President, Principal Financial Officer and Assistant Treasurer | | 2008 | | Principal Financial and Accounting Officer – Investments Pool, Invesco Specialized Products, LLC; Vice President, Principal Financial Officer and Assistant Treasurer, The Invesco Funds; Principal Financial and Accounting Officer – Pooled Investments, Invesco Capital Management LLC; Vice President and Treasurer, Invesco Exchange-Traded Fund Trust, Invesco Exchange-Traded Fund Trust II, Invesco India Exchange-Traded Fund Trust, Invesco Actively Managed Exchange-Traded Fund Trust, Invesco Actively Managed Exchange-Traded Commodity Fund Trust and Invesco Exchange-Traded Self-Indexed Fund Trust Formerly: Assistant Treasurer, Invesco Specialized Products, LLC; Assistant Treasurer, Invesco Exchange-Traded Fund Trust, Invesco Exchange-Traded Fund Trust II, Invesco India Exchange-Traded Fund Trust, Invesco Actively Managed Exchange-Traded Fund Trust, Invesco Actively Managed Exchange-Traded Commodity Fund Trust and Invesco Exchange-Traded Self-Indexed Fund Trust; Assistant Treasurer, Invesco Capital Management LLC; Assistant Vice President, The Invesco Funds | | N/A | | N/A |
T-6 Invesco Global Responsibility Equity Fund
Trustees and Officers–(continued)
| | | | | | | | |
Name, Year of Birth and Position(s) Held with the Trust | | Trustee and/
or Officer
Since | | Principal Occupation(s) During Past 5 Years | | Number of Funds in Fund Complex
Overseen by Trustee | | Other Directorship(s) Held by Trustee During Past 5 Years |
| | | |
| Other Officers–(continued) | | | | |
| Crissie M. Wisdom – 1969 Anti-Money Laundering Compliance Officer | | 2013 | | Anti-Money Laundering Compliance Officer, Invesco Advisers, Inc. (formerly known as Invesco Institutional (N.A.), Inc.) (registered investment adviser), Invesco Capital Markets, Inc. (formerly known as Van Kampen Funds Inc.), Invesco Distributors, Inc., Invesco Investment Services, Inc., The Invesco Funds, and Invesco Exchange-Traded Fund Trust, Invesco Exchange-Traded Fund Trust II, Invesco India Exchange-Traded Fund Trust, Invesco Actively Managed Exchange-Traded Fund Trust, Invesco Actively Managed Exchange-Traded Commodity Fund Trust and Invesco Exchange-Traded Self-Indexed Fund Trust; Anti-Money Laundering Compliance Officer and Bank Secrecy Act Officer, INVESCO National Trust Company and Invesco Trust Company; and Fraud Prevention Manager and Controls and Risk Analysis Manager for Invesco Investment Services, Inc. Formerly: Anti-Money Laundering Compliance Officer, Van Kampen Exchange Corp. and Invesco Management Group, Inc. | | N/A | | N/A |
| Robert R. Leveille – 1969 Chief Compliance Officer | | 2016 | | Chief Compliance Officer, Invesco Advisers, Inc. (registered investment adviser); and Chief Compliance Officer, The Invesco Funds Formerly: Chief Compliance Officer, Putnam Investments and the Putnam Funds | | N/A | | N/A |
The Statement of Additional Information of the Trust includes additional information about the Fund’s Trustees and is available upon request, without charge, by calling 1.800.959.4246. Please refer to the Fund’s Statement of Additional Information for information on the Fund’ssub-advisers.
| | | | | | |
| Office of the Fund | | Investment Adviser | | Distributor | | Auditors |
| 11 Greenway Plaza, Suite 1000 | | Invesco Advisers, Inc. | | Invesco Distributors, Inc. | | PricewaterhouseCoopers LLP |
| Houston, TX 77046-1173 | | 1555 Peachtree Street, N.E. | | 11 Greenway Plaza, Suite 1000 | | 1000 Louisiana Street, Suite 5800 |
| | Atlanta, GA 30309 | | Houston, TX 77046-1173 | | Houston, TX 77002-5678 |
| | | |
| Counsel to the Fund | | Counsel to the Independent Trustees | | Transfer Agent | | Custodian |
| Stradley Ronon Stevens & Young, LLP | | Goodwin Procter LLP | | Invesco Investment Services, Inc. | | State Street Bank and Trust Company |
| 2005 Market Street, Suite 2600 | | 901 New York Avenue, N.W. | | 11 Greenway Plaza, Suite 1000 | | 225 Franklin Street |
| Philadelphia, PA 19103-7018 | | Washington, D.C. 20001 | | Houston, TX 77046-1173 | | Boston, MA 02110-2801 |
T-7 Invesco Global Responsibility Equity Fund
(This page intentionally left blank)

Go paperless with eDelivery
Visit invesco.com/edelivery to enjoy the convenience and security of anytime electronic access to your investment documents.
With eDelivery, you can elect to have any or all of the following materials delivered straight to your inbox to download, save and print from your own computer:
∎ Fund reports and prospectuses
∎ Quarterly statements
∎ Daily confirmations
∎ Tax forms
Invesco mailing information
Send general correspondence to Invesco Investment Services, Inc., P.O. Box 219078, Kansas City, MO 64121-9078.
Important notice regarding delivery of security holder documents
To reduce Fund expenses, only one copy of most shareholder documents may be mailed to shareholders with multiple accounts at the same address (Householding). Mailing of your shareholder documents may be householded indefinitely unless you instruct us otherwise. If you do not want the mailing of these documents to be combined with those for other members of your household, please contact Invesco Investment Services, Inc. at 800 959 4246 or contact your financial institution. We will begin sending you individual copies for each account within 30 days after receiving your request.
Fund holdings and proxy voting information
The Fund provides a complete list of its holdings four times in each fiscal year, at the quarter-ends. For the second and fourth quarters, the list appears in the Fund’s semiannual and annual reports to shareholders. For the first and third quarters, the Fund files the lists with the Securities and Exchange Commission (SEC) as an exhibit to its reports on FormN-PORT. The most recent list of portfolio holdings is available at invesco.com/completeqtrholdings. Shareholders can also look up the Fund’s FormN-PORT filings on the SEC website, sec.gov. The SEC file numbers for the Fund are shown below.
A description of the policies and procedures that the Fund uses to determine how to vote proxies relating to portfolio securities is available without charge, upon request, from our Client Services department at 800 959 4246, or at invesco.com/proxyguidelines. The information is also available on the SEC website, sec.gov.
| | |
Information regarding how the Fund voted proxies related to its portfolio securities during the most recent12-month period ended June 30 is available at invesco.com/proxysearch. This information is also available on the SEC website, sec.gov. Invesco Advisers, Inc. is an investment adviser; it provides investment advisory services to individual and institutional clients and does not sell securities. Invesco Distributors, Inc. is the US distributor for Invesco Ltd.’s retail mutual funds, exchange-traded funds and institutional money market funds. Both are wholly owned, indirect subsidiaries of Invesco Ltd. | | |
| | | | |
| SEC file numbers: 811-06463 and 033-44611 | | Invesco Distributors, Inc. | | GLRE-AR-1 |
| | | | | | |
| | | | |
 | | Annual Report to Shareholders | | October 31, 2019 | | |
| | | | |
| | Invesco Global Small & Mid Cap Growth Fund |
| | Nasdaq: | | |
| | A: AGAAX∎ C: AGACX∎ Y: AGAYX∎ R5: GAIIX∎ R6: AGSSX | | |

Letters to Shareholders
| | |

Andrew Schlossberg | | Dear Shareholders: This annual report includes information about your Fund, including performance data and a complete list of its investments as of the close of the reporting period. Inside is a discussion of how your Fund was managed and the factors that affected its performance during the reporting period. Despite marked market volatility along the way, most global equity markets produced solid gains for the reporting period. As the reporting period unfolded in the final months of 2018, global equities were reeling from a sharpsell-off. The catalyst for thesell-off was a combination of ongoing trade concerns between the US and China, fears of a global economic slowdown and lower oil prices from a supply glut. Gains posted earlier in 2018 for global equities were erased, while US Treasury bonds, along with government and municipal bonds, rallied as investors fled to “safe haven” assets. |
|
|
|
|
|
|
|
|
|
|
At the start of 2019, global equity markets rebounded strongly buoyed by more policy from central banks and optimism about a potentialUS-China trade deal. In May,US-China trade concerns and slowing global growth led to a global equitysell-off and rally in US Treasuries. Despite the Maysell-off, domestic equity markets rallied in June in anticipation of a US Federal Reserve (the Fed) interest rate cut and closed the second quarter with modest gains. ContinuedUS-China trade worries and signs of slowing global economic growth left global equity markets largely flat for the third quarter. As the reporting period came to a close in October 2019, a raft of upbeat positive corporate earnings results and a US interest rate cut buoyed domestic equity results with some domestic indices recording record highs.
The Fed, in fact, both raised and lowered the federal funds rate during the reporting period. Given signs of a strong economy, the Fed raised rates in December 2018. In 2019, however, the Fed altered its outlook on further rate hikes leaving rates unchanged for the first half of the year. In July, the Fed lowered interest rates for the first time in 11 years. It again lowered rates in September and once again in October. As the year continues to unfold, we’ll see how the interplay of interest rates, economic data, geopolitics and a host of other factors affect US and overseas equity and fixed income markets.
Investor uncertainty and market volatility, such as we witnessed during the reporting period, are unfortunate facts of life when it comes to investing. That’s why Invesco encourages investors to work with a professional financial adviser who can stress the importance of starting to save and invest early and the importance of adhering to a disciplined investment plan. A financial adviser who knows your unique financial situation, investment goals and risk tolerance can be an invaluable partner as you seek to achieve your financial goals. He or she can offer a long-term perspective when markets are volatile and time-tested advice and guidance when your financial situation or investment goals change.
Visit our website for more information on your investments
Our website, invesco.com/us, offers a wide range of market insights and investment perspectives. On the website, you’ll find detailed information about our funds, including performance, holdings and portfolio manager commentaries. You can access information about your account by completing a simple, secure online registration. To do so, select “Log In” on the right side of the homepage, and then select “Register for Individual Account Access.”
In addition to the resources accessible on our website and through our mobile app, you can obtain timely updates to help you stay informed about the markets and the economy by connecting with Invesco on Twitter, LinkedIn or Facebook. You can access our blog at blog.invesco.us.com. Our goal is to provide you the information you want, when and where you want it.
Finally, I’m pleased to share with you Invesco’s commitment to both the Principles for Responsible Investment and to considering environmental, social and governance issues in our robust investment process. I invite you to learn more at invesco.com/esg.
Have questions?
For questions about your account, contact an Invesco client services representative at 800 959 4246.
All of us at Invesco look forward to serving your investment management needs. Thank you for investing with us.
Sincerely,

Andrew Schlossberg
Head of the Americas,
Senior Managing Director, Invesco Ltd.
| | |
| 2 | | Invesco Global Small & Mid Cap Growth Fund |
| | | | |

Bruce Crockett | | Dear Shareholders: Among the many important lessons I’ve learned in more than 40 years in a variety of business endeavors is the value of a trusted advocate. As independent chair of the Invesco Funds Board, I can assure you that the members of the Board are strong advocates for the interests of investors in Invesco’s mutual funds. We work hard to represent your interests through oversight of the quality of the investment management services your funds receive and other matters important to your investment, including but not limited to: |
| | ∎ | | Ensuring that Invesco offers a diverse lineup of mutual funds that your financial adviser can use to strive to meet your financial needs as your investment goals change over time. |
| | ∎ | | Monitoring how the portfolio management teams of the Invesco funds are performing in light of changing economic and market conditions. |
| ∎ | | Assessing each portfolio management team’s investment performance within the context of the investment strategy described in the fund’s prospectus. |
| ∎ | | Monitoring for potential conflicts of interests that may impact the nature of the services that your funds receive. |
We believe one of the most important services we provide our fund shareholders is the annual review of the funds’ advisory andsub-advisory contracts with Invesco Advisers and its affiliates. This review is required by the Investment Company Act of 1940 and focuses on the nature and quality of the services Invesco provides as the adviser to the Invesco funds and the reasonableness of the fees that it charges for those services. Each year, we spend months carefully reviewing information received from Invesco and a variety of independent sources, such as performance and fee data prepared by Lipper, Inc. (a subsidiary of Broadridge Financial Solutions, Inc.), an independent, third-party firm widely recognized as a leader in its field. We also meet with our independent legal counsel and other independent advisers to review and help us assess the information that we have received. Our goal is to assure that you receive quality investment management services for a reasonable fee.
I trust the measures outlined above provide assurance that you have a worthy advocate when it comes to choosing the Invesco Funds.
On behalf of the Board, we look forward to continuing to represent your interests and serving your needs.
Sincerely,

Bruce L. Crockett
Independent Chair
Invesco Funds Board of Trustees
| | |
| 3 | | Invesco Global Small & Mid Cap Growth Fund |
Management’s Discussion of Fund Performance
| | | | |
| |
Performance summary | |
For the fiscal year ended October 31, 2019, Class A shares of Invesco Global Small & Mid Cap Growth Fund (the Fund), at net asset value (NAV), underperformed the MSCI All Country World Small Mid Cap Growth Index, the Fund’s style-specific benchmark. | |
Your Fund’s long-term performance appears later in this report. | |
| |
Fund vs. Indexes | |
Total returns, October 31, 2018 to October 31, 2019, at net asset value (NAV). Performance shown does not include applicable contingent deferred sales charges (CDSC) orfront-end sales charges, which would have reduced performance. | |
| |
Class A Shares | | | 11.06 | % |
Class C Shares | | | 10.22 | |
Class Y Shares | | | 11.33 | |
Class R5 Shares | | | 11.38 | |
Class R6 Shares | | | 11.49 | |
MSCI All Country World Small Mid Cap Indexq(Broad Market Index) | | | 10.24 | |
MSCI All Country World Small Mid Cap Growth Indexq(Style-Specific Index) | | | 12.74 | |
Lipper GlobalSmall/Mid-Cap Funds Classification Average∎(Peer Group) | | | 7.08 | |
| | |
Source(s):qRIMES Technologies Corp.;∎Lipper Inc. | | | | |
Market conditions and your Fund
The fiscal year began with global equity markets, particularly the US, declining sharply at the end of 2018 amid rising interest rates, a flattening US Treasury yield curve, signaling a possible recession, and concerns that higher inflation could result in a more restrictive monetary policy. Investors also had concerns over the Brexit negotiations, ongoing trade tensions between the US and China, declining oil prices and fears of slowing economic growth, particularly in the eurozone.
After a relatively calm start at the beginning of 2019, global equity markets faced greater volatility in the second quarter and third quarter hampered by ongoing US and China trade issues, potential for new tariffs and weakening global economic data. Disagreement within the UK about its withdrawal from the European Union increased
uncertainty for the UK and eurozone economies.
Global equity markets gained in October 2019 amid several positive catalysts, including a US interest rate cut, optimism surrounding US and China trade negotiations, and a raft of upbeat corporate results. The UK equity market provided a flat return during October and while domestic politics continued to dominate the region, European markets made modest gains. October was also a positive month for emerging equity markets with all regions recording gains. Despite increased market volatility, global equity indexes, in both developed and emerging markets, ended the fiscal year in positive territory.
Regardless of the macroeconomic environment, we remain focused on ourbottom-up investment approach of identifying attractive companies that fit our earnings, quality and valuation (EQV) process.
During the fiscal year, the Fund’s holdings in the industrials and financials sectors outperformed those of the style-specific benchmark and were among the most significant contributors to the Fund’s relative performance. In the industrials sector, Japan-based robotics engineering companyNabtescowas a strong contributor to the Fund’s relative performance. Within the financials sector, German exchange operatorDeutsche Boersewas a notable contributor to both absolute and relative Fund performance. Strong security selection in and underweight exposure to the consumer discretionary sector also added to the Fund’s relative results.
On a geographic basis, stock selection in Japan and Germany contributed to Fund performance relative to the style-specific index during the fiscal year. Underweight exposure to Japan and overweight exposure to Brazil were also advantageous for the Fund’s relative returns.
Brazil-based stock exchange operatorB3was among the leading individual contributors to the Fund’s performance for the fiscal year. B3 is Brazil’s fully integrated equity and derivative exchange and fixed income registration business. At the beginning of the fiscal year, the Brazilian stock market was weakened by lower GDP expectations and rising unemployment. Uncertainty about the outcome of the upcoming presidential election led to an increase in the equity risk premium, and as a consequence, lower share prices. The election of President Bolsonaro, Brazil’s economic recovery and the potential for more fiscal discipline have led to a better economic environment. As the investment climate improves, B3 has benefited from increased trading volumes in both equities and fixed income businesses.
| | | | |
| |
Portfolio Composition | |
By sector | | | % of total net assets | |
| | | | |
| |
Industrials | | | 24.72% | |
Information Technology | | | 17.10 | |
Financials | | | 14.13 | |
Consumer Discretionary | | | 11.08 | |
Health Care | | | 7.56 | |
Real Estate | | | 5.59 | |
Consumer Staples | | | 5.30 | |
Energy | | | 4.73 | |
Communication Services | | | 2.57 | |
Other Sectors, Each Less than 2% of Net Assets | | | 1.14 | |
Money Market Funds Plus Other Assets Less Liabilities | | | 6.08 | |
| | | | |
| | |
Top 10 Equity Holdings* | | | | |
| % of total net assets | |
| |
1. DCC PLC | | | 5.71% | |
2. MorphoSys AG | | | 2.85 | |
3. HomeServe PLC | | | 2.60 | |
4. Deutsche Boerse AG | | | 2.38 | |
5. IHS Markit Ltd. | | | 2.03 | |
6. Onex Corp. | | | 1.98 | |
7. Fairfax Financial Holdings Ltd. | | | 1.98 | |
8. Hongkong Land Holdings Ltd. | | | 1.86 | |
9. Savills PLC | | | 1.86 | |
10. Nabtesco Corp. | | | 1.83 | |
| | | | |
| | |
Total Net Assets | | $ | 443.0 million | |
| |
Total Number of Holdings* | | | 77 | |
The Fund’s holdings are subject to change, and there is no assurance that the Fund will continue to hold any particular security.
*Excluding money market fund holdings, if any.
Data presented here are as of October 31, 2019.
| | |
| 4 | | Invesco Global Small & Mid Cap Growth Fund |
Conversely, the Fund’s holdings in the energy, information technology (IT) and health care sectors underperformed those of the style-specific benchmark during the fiscal year and were among the most significant detractors from the Fund’s relative performance. In the energy sector,John Wood Groupwas a notable detractor from relative Fund performance. Canada-based electronics manufacturing companyCelesticawas among the Fund’s largest individual relative detractors in the IT sector during the fiscal year.
On a geographic basis, holdings in Canada and Ireland underperformed those of the style-specific benchmark during the fiscal year and were significant detractors from the Fund’s relative performance.
The largest overall detractor from Fund performance during the fiscal year wasPeyto Exploration & Development Company. Peyto Exploration and other Canadian natural gas equities faced headwinds during the fiscal year driven by low commodity prices. We sold the position in this company during the fiscal year.
During the fiscal year, we continued to look for opportunities that we believed improved the growth potential and quality of the Fund’s portfolio. As disconcerting as volatility may be, we believe it tends to create long-term opportunities for our shareholders and we caution investors against making investment decisions based on short-term performance. As a reminder, the Fund’s country and sector exposures are shaped by the stocks we select based on their own investment merits, rather than by makingtop-down allocation decisions.
We thank you for your commitment to Invesco Global Small & Mid Cap Growth Fund.
Portfolio managers:
Ryan Amerman - Lead
Shuxin (Steve) Cao - Lead
Borge Endresen
Jason Holzer - Lead
The views and opinions expressed in management’s discussion of Fund performance are those of Invesco Advisers, Inc. These views and opinions are subject to change at any time based on factors such as market and economic conditions. These views and opinions may not be relied upon as investment advice or recommendations, or as an offer for a particular security. The information is not a complete analysis of every aspect of any market, country, industry, security or the Fund. Statements of fact are from sources considered reliable, but Invesco Advisers, Inc. makes no representation or warranty as to their
completeness or accuracy. Although historical performance is no guarantee of future results, these insights may help you understand our investment management philosophy.
See important Fund and, if applicable, index disclosures later in this report.
5 Invesco Global Small & Mid Cap Growth Fund
Your Fund’s Long-Term Performance
Results of a $10,000 Investment – Oldest Share Class(es)
Fund and index data from 10/31/09
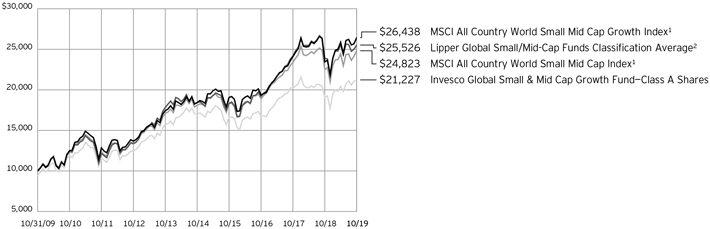
1 Source: RIMES Technologies Corp.
2 Source: Lipper Inc.
Past performance cannot guarantee comparable future results.
The data shown in the chart include reinvested distributions, applicable sales charges and Fund expenses including
management fees. Index results include reinvested dividends, but they do not reflect sales charges. Performance of the peer group, if applicable, reflects fund expenses and management fees; performance
of a market index does not. Performance shown in the chart does not reflect deduction of taxes a shareholder would pay on Fund distributions or sale of Fund shares.
| | |
| 6 | | Invesco Global Small & Mid Cap Growth Fund |
| | | | |
| |
Average Annual Total Returns | |
As of 10/31/19, including maximum applicable sales charges | |
Class A Shares | | | | |
Inception (9/15/94) | | | 7.70 | % |
10 Years | | | 7.82 | |
5 Years | | | 3.37 | |
1 Year | | | 4.96 | |
| |
Class C Shares | | | | |
Inception (8/4/97) | | | 5.71 | % |
10 Years | | | 7.62 | |
5 Years | | | 3.77 | |
1 Year | | | 9.26 | |
| |
Class Y Shares | | | | |
Inception (10/3/08) | | | 8.54 | % |
10 Years | | | 8.69 | |
5 Years | | | 4.81 | |
1 Year | | | 11.33 | |
| |
Class R5 Shares | | | | |
Inception (9/28/07) | | | 4.07 | % |
10 Years | | | 8.87 | |
5 Years | | | 4.92 | |
1 Year | | | 11.38 | |
| |
Class R6 Shares | | | | |
10 Years | | | 8.55 | % |
5 Years | | | 4.78 | |
1 Year | | | 11.49 | |
Class R6 shares incepted on April 4, 2017. Performance shown prior to that date is that of Class A shares and includes the12b-1 fees applicable to Class A shares.
The performance data quoted represent past performance and cannot guarantee comparable future results; current performance may be lower or higher. Please visit invesco.com/ performance for the most recentmonth-end performance. Performance figures reflect reinvested distributions, changes in net asset value and the effect of the maximum sales charge unless otherwise stated. Performance figures do not reflect deduction of taxes a shareholder would pay on Fund distributions or sale of Fund shares. Investment return and principal value will fluctuate so that you may have a gain or loss when you sell shares.
The net annual Fund operating expense ratio set forth in the most recent Fund prospectus as of the date of this report for Class A, Class C, Class Y, Class R5 and Class R6 shares was 1.36%, 2.11%, 1.11%, 1.02% and 0.94%, respectively.1 The total annual Fund operating expense ratio set forth in the most recent Fund prospectus as
| | | | |
| |
Average Annual Total Returns | |
As of 9/30/19, the most recent calendar quarter end, including maximum applicable sales charges | |
| |
Class A Shares | | | | |
Inception (9/15/94) | | | 7.69 | % |
10 Years | | | 7.38 | |
5 Years | | | 3.08 | |
1 Year | | | -2.72 | |
| |
Class C Shares | | | | |
Inception (8/4/97) | | | 5.69 | % |
10 Years | | | 7.18 | |
5 Years | | | 3.46 | |
1 Year | | | 1.27 | |
| |
Class Y Shares | | | | |
Inception (10/3/08) | | | 8.52 | % |
10 Years | | | 8.26 | |
5 Years | | | 4.50 | |
1 Year | | | 3.19 | |
| |
Class R5 Shares | | | | |
Inception (9/28/07) | | | 4.03 | % |
10 Years | | | 8.43 | |
5 Years | | | 4.62 | |
1 Year | | | 3.33 | |
| |
Class R6 Shares | | | | |
10 Years | | | 8.10 | % |
5 Years | | | 4.46 | |
1 Year | | | 3.38 | |
of the date of this report for Class A, Class C, Class Y, Class R5 and Class R6 shares was 1.37%, 2.12%, 1.12%, 1.03% and 0.95%, respectively. The expense ratios presented above may vary from the expense ratios presented in other sections of this report that are based on expenses incurred during the period covered by this report.
Class A share performance reflects the maximum 5.50% sales charge, and Class C share performance reflects the applicable contingent deferred sales charge (CDSC) for the period involved. The CDSC on Class C shares is 1% for the first year after purchase. Class Y, Class R5 and Class R6 shares do not have afront-end sales charge or a CDSC; therefore, performance is at net asset value.
The performance of the Fund’s share classes will differ primarily due to different sales charge structures and class expenses.
Fund performance reflects any applicable fee waivers and/or expense reimbursements. Had the adviser not waived fees and/or reimbursed expenses currently or in the past, returns
would have been lower. See current prospectus for more information.
| 1 | Total annual Fund operating expenses after any contractual fee waivers and/or expense reimbursements by the adviser in effect through at least June 30, 2021. See current prospectus for more information. |
7 Invesco Global Small & Mid Cap Growth Fund
Invesco Global Small & Mid Cap Growth Fund’s investment objective is long-term growth of capital.
| ∎ | | Unless otherwise stated, information presented in this report is as of October 31, 2019, and is based on total net assets. |
| ∎ | | Unless otherwise noted, all data provided by Invesco. |
| ∎ | | To access your Fund’s reports/prospectus, visit invesco.com/fundreports. |
About share classes
| ∎ | | Class Y sharesare available only to certain investors. Please see the prospectus for more information. |
| ∎ | | Class R5 sharesandClass R6 sharesare available for use by retirement plans that meet certain standards and for institutional investors. Class R6 shares are also available through intermediaries that have established an agreement with Invesco Distributors, Inc. to make such shares available for use in retail omnibus accounts. Please see the prospectus for more information. |
Principal risks of investing in the Fund
| ∎ | | Depositary receipts risk. Investing in depositary receipts involves the same risks as direct investments in foreign securities. In addition, the underlying issuers of certain depositary receipts are under no obligation to distribute shareholder communications or pass through any voting rights with respect to the deposited securities to the holders of such receipts. The Fund may therefore receive less timely information or have less control than if it invested directly in the foreign issuer. |
| ∎ | | Derivatives risk. The value of a derivative instrument depends largely on (and is derived from) the value of an underlying security, currency, commodity, interest rate, index or other asset (each referred to as an underlying asset). In addition to risks relating to the underlying assets, the use of derivatives may include other, possibly greater, risks, including counterparty, leverage and liquidity risks. Counterparty risk is the risk that the counterparty to the derivative contract will default on its obligation to pay the Fund the amount owed or otherwise perform under the derivative contract. |
| | Derivatives create leverage risk because they do not require payment up front equal to the economic exposure created by holding a |
position in the derivative. As a result, an adverse change in the value of the underlying asset could result in the Fund sustaining a loss that is substantially greater than the amount invested in the derivative or the anticipated value of the underlying asset, which may make the Fund’s returns more volatile and increase the risk of loss. Derivative instruments may also be less liquid than more traditional investments and the Fund may be unable to sell or close out its derivative positions at a desirable time or price. This risk may be more acute under adverse market conditions, during which the Fund may be most in need of liquidating its derivative positions. Derivatives may also be harder to value, less tax efficient and subject to changing government regulation that could impact the Fund’s ability to use certain derivatives or their cost. Derivatives strategies may not always be successful. For example, derivatives used for hedging or to gain or limit exposure to a particular market segment may not provide the expected benefits, particularly during adverse market conditions.
| ∎ | | Emerging markets securities risk. Emerging markets (also referred to as developing markets) are generally subject to greater market volatility, political, social and economic instability, uncertain trading markets and more governmental limitations on foreign investment than more developed markets. In addition, companies operating in emerging markets may be subject to lower trading volume and greater price fluctuations than companies in more developed markets. Securities law and the enforcement of systems of taxation in many emerging market countries may change quickly and unpredictably. The Fund’s investments in ChinaA-shares are subject to trading restrictions, quota limitations and clearing and settlement risks. In addition, investments in emerging markets securities may be |
This report must be accompanied or preceded by a currently effective Fund prospectus, which contains more complete information, including sales charges and expenses. Investors should read it carefully before investing.
NOT FDIC INSURED | MAY LOSE VALUE | NO BANK GUARANTEE
| | subject to additional transaction costs, delays in settlement procedures, and lack of timely information. |
| ∎ | | Foreign securities risk. The Fund’s foreign investments may be adversely affected by political and social instability, changes in economic or taxation policies, difficulty in enforcing obligations, decreased liquidity or increased volatility. Foreign investments also involve the risk of the possible seizure, nationalization or expropriation of the issuer or foreign deposits (in which the Fund could lose its entire investments in a certain market) and the possible adoption of foreign governmental restrictions such as exchange controls. Unless the Fund has hedged its foreign securities risk, foreign securities risk also involves the risk of negative foreign currency rate fluctuations, which may cause the value of securities denominated in such foreign currency (or other instruments through which the Fund has exposure to foreign currencies) to decline in value. Currency exchange rates may fluctuate significantly over short periods of time. Currency hedging strategies, if used, are not always successful. |
| ∎ | | Geographic focus risk. The Fund may from time to time invest a substantial amount of its assets in securities of issuers located in a single country or a limited number of countries. Adverse economic, political or social conditions in those countries may therefore have a significant negative impact on the Fund’s investment performance. |
| ∎ | | Growth investing risk.Growth stocks tend to be more expensive relative to the issuing company’s earnings or assets compared with other types of stock. As a result, they tend to be more sensitive to changes in, or investors’ expectations of, the issuing company’s earnings and can be more volatile. |
| ∎ | | Investing in the European Union risk. Investments in certain countries in the European Union are susceptible to high economic risks associated with |
| | |
| 8 | | Invesco Global Small & Mid Cap Growth Fund |
| | high levels of debt, such as investments in sovereign debt of Greece, Italy and Spain. Efforts of the member states to further unify their economic and monetary policies may increase the potential for the downward movement of one member state’s market to cause a similar effect on other member states’ markets. Separately, the European Union faces issues involving its membership, structure, procedures and policies. The exit of one or more member states from the European Union, such as the United Kingdom (UK) which has announced its intention to exit, would place its currency and banking system in jeopardy. The exit by the UK or other member states will likely result in increased volatility, illiquidity and potentially lower economic growth in the affected markets, which will adversely affect the Fund’s investments. |
| ∎ | | Management risk. The Fund is actively managed and depends heavily on the Adviser’s judgment about markets, interest rates or the attractiveness, relative values, liquidity, or potential appreciation of particular investments made for the Fund’s portfolio. The Fund could experience losses if these judgments prove to be incorrect. Additionally, legislative, regulatory, or tax developments may adversely affect management of the Fund and, therefore, the ability of the Fund to achieve its investment objective. |
| ∎ | | Market risk. The market values of the Fund’s investments, and therefore the value of the Fund’s shares, will go up and down, sometimes rapidly or unpredictably. Market risk may affect a single issuer, industry or section of the economy, or it may affect the market as a whole. Individual stock prices tend to go up and down more dramatically than those of certain other types of investments, such as bonds. During a general downturn in the financial markets, multiple asset classes may decline in value. When markets perform well, there can be no assurance that specific investments held by the Fund will rise in value. |
| ∎ | | Preferred securities risk. Preferred securities are subject to issuer-specific and market risks applicable generally to equity securities. Preferred securities also may be subordinated to bonds or other debt instruments, subjecting them to a greater risk ofnon-payment, may be less liquid than many other securities, such as common |
| | | stocks, and generally offer no voting rights with respect to the issuer. |
| ∎ | | Sector focus risk.The Fund may from time to time invest a significant amount of its assets (i.e. over 25%) in one market sector or group of related industries. In this event, the Fund’s performance will depend to a greater extent on the overall condition of the sector or group of industries and there is increased risk that the Fund will lose significant value if conditions adversely affect that sector or group of industries. |
| ∎ | | Small- andmid-capitalization companies risks. Small- andmid-capitalization companies tend to be more vulnerable to changing market conditions, may have little or no operating history or track record of success, and may have more limited product lines and markets, less experienced management and fewer financial resources than larger companies. These companies’ securities may be more volatile and less liquid than those of more established companies, and their returns may vary, sometimes significantly, from the overall securities market. |
About indexes used in this report
| ∎ | | TheMSCI All Country World Small Mid Cap Indexis an unmanaged index designed to measure small andmid-cap stocks across developed and emerging markets. The index is computed using the net return, which withholds applicable taxes for non-resident investors. |
| ∎ | | TheMSCI All Country World Small Mid Cap Growth Indexis an unmanaged index designed to measure small andmid-cap growth stocks across developed and emerging markets. The index is computed using the net return, which withholds applicable taxes fornon-resident investors. |
| ∎ | | TheLipper GlobalSmall/Mid-Cap Funds Classification Averagerepresents an average of all funds in the Lipper GlobalSmall/Mid-Cap Funds classification. |
| ∎ | | The Fund is not managed to track the performance of any particular index, including the index(es) described here, and consequently, the performance of the Fund may deviate significantly from the performance of the index(es). |
| ∎ | | A direct investment cannot be made in an index. Unless otherwise indicated, index results include reinvested |
| | | dividends, and they do not reflect sales charges. Performance of the peer group, if applicable, reflects fund expenses; performance of a market index does not. |
Other information
| ∎ | | The returns shown in management’s discussion of Fund performance are based on net asset values (NAVs) calculated for shareholder transactions. Generally accepted accounting principles require adjustments to be made to the net assets of the Fund at period end for financial reporting purposes, and as such, the NAVs for shareholder transactions and the returns based on those NAVs may differ from the NAVs and returns reported in the Financial Highlights. |
| ∎ | | Industry classifications used in this report are generally according to the Global Industry Classification Standard, which was developed by and is the exclusive property and a service mark of MSCI Inc. and Standard & Poor’s. |
9 Invesco Global Small & Mid Cap Growth Fund
Schedule of Investments
October 31, 2019
| | | | | | | | |
| | | Shares | | | Value | |
| |
Common Stocks & Other Equity Interests-93.92% | |
| | |
Australia-0.53% | | | | | | | | |
| | |
Computershare Ltd. | | | 216,251 | | | $ | 2,353,563 | |
| |
| | |
Brazil-3.33% | | | | | | | | |
| | |
B3 S.A.-Brasil, Bolsa, Balcao | | | 578,900 | | | | 6,983,464 | |
| |
Cogna Educacao | | | 677,701 | | | | 1,634,053 | |
| |
Multiplan Empreendimentos Imobiliarios S.A. | | | 509,571 | | | | 3,711,400 | |
| |
Raia Drogasil S.A. | | | 87,900 | | | | 2,410,921 | |
| |
| | | | | | | 14,739,838 | |
| |
| | |
Canada-6.79% | | | | | | | | |
| | |
Celestica, Inc.(a) | | | 380,009 | | | | 2,752,476 | |
| |
Fairfax Financial Holdings Ltd. | | | 20,671 | | | | 8,757,435 | |
| |
Onex Corp. | | | 149,223 | | | | 8,772,559 | |
| |
Open Text Corp. | | | 128,665 | | | | 5,198,961 | |
| |
Tourmaline Oil Corp. | | | 319,530 | | | | 2,741,393 | |
| |
Trican Well Service Ltd.(a) | | | 2,802,736 | | | | 1,830,045 | |
| |
| | | | | | | 30,052,869 | |
| |
| | |
China-2.86% | | | | | | | | |
| | |
Angel Yeast Co., Ltd., A Shares | | | 1,238,871 | | | | 5,308,315 | |
| |
Henan Shuanghui Investment & Development Co., Ltd., A Shares | | | 1,741,787 | | | | 7,354,994 | |
| |
| | | | | | | 12,663,309 | |
| |
| | |
France-1.52% | | | | | | | | |
| | |
Bollore S.A. | | | 1,559,165 | | | | 6,749,324 | |
| |
| | |
Germany-6.98% | | | | | | | | |
| | |
Deutsche Boerse AG | | | 68,108 | | | | 10,551,549 | |
| |
MorphoSys AG(a) | | | 115,964 | | | | 12,634,059 | |
| |
MTU Aero Engines AG | | | 28,900 | | | | 7,719,396 | |
| |
| | | | | | | 30,905,004 | |
| |
| | |
Hong Kong-1.86% | | | | | | | | |
| | |
Hongkong Land Holdings Ltd. | | | 1,497,100 | | | | 8,214,856 | |
| |
| | |
Hungary-0.79% | | | | | | | | |
Gedeon Richter Plc | | | 189,121 | | | | 3,508,167 | |
| |
| | |
Ireland-1.24% | | | | | | | | |
| | |
Origin Enterprises PLC | | | 1,050,254 | | | | 5,510,091 | |
| |
| | |
Israel-1.26% | | | | | | | | |
| | |
Check Point Software Technologies Ltd.(a) | | | 49,676 | | | | 5,584,079 | |
| |
| | |
Japan-3.63% | | | | | | | | |
| | |
Disco Corp. | | | 16,200 | | | | 3,529,034 | |
| |
Koito Manufacturing Co. Ltd. | | | 85,200 | | | | 4,443,892 | |
| |
Nabtesco Corp. | | | 254,500 | | | | 8,118,330 | |
| |
| | | | | | | 16,091,256 | |
| |
| | | | | | | | |
| | | Shares | | | Value | |
| |
Mexico-1.75% | | | | | | | | |
| | |
Grupo Aeroportuario del Pacifico, S.A.B. de C.V., Class B | | | 740,300 | | | $ | 7,761,480 | |
| |
| | |
Netherlands-0.93% | | | | | | | | |
| | |
SBM Offshore N.V. | | | 239,000 | | | | 4,111,448 | |
| |
| | |
Romania-1.52% | | | | | | | | |
| | |
Fondul Proprietatea S.A. | | | 24,772,980 | | | | 6,716,668 | |
| |
| | |
Switzerland-0.46% | | | | | | | | |
| | |
Tecan Group AG, Class R | | | 8,547 | | | | 2,022,390 | |
| |
| | |
Turkey-2.25% | | | | | | | | |
| | |
Haci Omer Sabanci Holding A.S. | | | 2,260,542 | | | | 3,253,347 | |
| |
Tupras-Turkiye Petrol Rafinerileri A.S. | | | 308,925 | | | | 6,706,050 | |
| |
| | | | | | 9,959,397 | |
| |
| | |
United Kingdom-16.45% | | | | | | | | |
| | |
DCC PLC | | | 269,908 | | | | 25,304,737 | |
| |
HomeServe PLC | | | 766,210 | | | | 11,505,045 | |
| |
IG Group Holdings PLC | | | 901,552 | | | | 7,426,470 | |
| |
Informa PLC | | | 661,915 | | | | 6,646,961 | |
| |
John Wood Group PLC | | | 407,487 | | | | 1,790,457 | |
| |
Jupiter Fund Management PLC | | | 958,750 | | | | 4,257,279 | |
| |
Savills PLC | | | 689,358 | | | | 8,211,744 | |
| |
Ultra Electronics Holdings PLC | | | 304,249 | | | | 7,687,155 | |
| |
| | | | | | | 72,829,848 | |
| |
| | |
United States-39.77% | | | | | | | | |
| | |
Activision Blizzard, Inc. | | | 84,641 | | | | 4,742,435 | |
| |
Advance Auto Parts, Inc. | | | 46,142 | | | | 7,497,152 | |
| |
Amphenol Corp., Class A | | | 36,167 | | | | 3,628,635 | |
| |
Aptiv PLC | | | 57,665 | | | | 5,163,901 | |
| |
Assurant, Inc. | | | 43,412 | | | | 5,472,951 | |
| |
Avanos Medical, Inc.(a) | | | 123,413 | | | | 5,435,109 | |
| |
Baxter International, Inc. | | | 52,563 | | | | 4,031,582 | |
| |
Black Knight, Inc.(a) | | | 65,438 | | | | 4,201,120 | |
| |
Centene Corp.(a) | | | 47,879 | | | | 2,541,417 | |
| |
Church & Dwight Co., Inc. | | | 41,102 | | | | 2,874,674 | |
| |
CoStar Group, Inc.(a) | | | 5,660 | | | | 3,110,283 | |
| |
Dollar General Corp. | | | 38,176 | | | | 6,121,140 | |
| |
Dril-Quip, Inc.(a) | | | 91,763 | | | | 3,764,118 | |
| |
Expedia Group, Inc. | | | 56,828 | | | | 7,766,114 | |
| |
Fidelity National Information Services, Inc. | | | 40,754 | | | | 5,369,747 | |
| |
FLIR Systems, Inc. | | | 74,674 | | | | 3,850,191 | |
| |
GoDaddy, Inc., Class A(a) | | | 45,618 | | | | 2,966,539 | |
| |
Horizon Therapeutics PLC(a) | | | 115,092 | | | | 3,327,310 | |
| |
IAA, Inc.(a) | | | 90,501 | | | | 3,452,613 | |
| |
IHS Markit Ltd.(a) | | | 128,125 | | | | 8,971,312 | |
| |
Intercontinental Exchange, Inc. | | | 51,966 | | | | 4,901,433 | |
| |
Kansas City Southern | | | 51,104 | | | | 7,194,421 | |
| |
KAR Auction Services, Inc. | | | 157,706 | | | | 3,920,571 | |
| |
See accompanying Notes to Financial Statements which are an integral part of the financial statements.
| | |
| 10 | | Invesco Global Small & Mid Cap Growth Fund |
| | | | | | | | |
| | | Shares | | | Value | |
| |
United States-(continued) | | | | | | | | |
KLA Corp. | | | 32,663 | | | $ | 5,521,354 | |
| |
NCR Corp.(a) | | | 252,038 | | | | 7,362,030 | |
| |
RealPage, Inc.(a) | | | 94,500 | | | | 5,721,975 | |
| |
Roper Technologies, Inc. | | | 11,093 | | | | 3,737,897 | |
| |
Sabre Corp. | | | 215,543 | | | | 5,060,950 | |
| |
salesforce.com, inc.(a) | | | 11,743 | | | | 1,837,662 | |
| |
SBA Communications Corp., Class A | | | 19,117 | | | | 4,600,506 | |
| |
ServiceMaster Global Holdings, Inc.(a) | | | 91,118 | | | | 3,679,345 | |
| |
ServiceNow, Inc.(a) | | | 16,074 | | | | 3,974,457 | |
| |
Sherwin-Williams Co. (The) | | | 8,788 | | | | 5,029,548 | |
| |
Synopsys, Inc.(a) | | | 24,791 | | | | 3,365,378 | |
| |
Tradeweb Markets, Inc., Class A | | | 52,370 | | | | 2,186,448 | |
| |
TransDigm Group, Inc. | | | 3,093 | | | | 1,627,784 | |
| |
Trex Co., Inc.(a) | | | 29,960 | | | | 2,633,184 | |
| |
Tyler Technologies, Inc.(a) | | | 12,800 | | | | 3,437,056 | |
| |
Wyndham Hotels & Resorts, Inc. | | | 111,981 | | | | 6,043,615 | |
| |
| | | | | | | 176,123,957 | |
| |
Total Common Stocks & Other Equity Interests
(Cost $304,400,277) | | | | 415,897,544 | |
| |
| | | | | | | | |
| | | Shares | | | Value | |
| |
Money Market Funds-5.93% | | | | | | | | |
Invesco Government & Agency Portfolio, Institutional Class, 1.71%(b) | | | 9,196,339 | | | $ | 9,196,339 | |
| |
Invesco Liquid Assets Portfolio, Institutional Class, 1.90%(b) | | | 6,568,715 | | | | 6,571,342 | |
| |
Invesco Treasury Portfolio, Institutional Class, 1.66%(b) | | | 10,510,101 | | | | 10,510,101 | |
| |
Total Money Market Funds (Cost $26,276,178) | | | | 26,277,782 | |
| |
TOTAL INVESTMENTS IN SECURITIES–99.85%
(Cost $330,676,455) | | | | | | | 442,175,326 | |
| |
OTHER ASSETS LESS LIABILITIES-0.15% | | | | | | | 665,010 | |
| |
NET ASSETS-100.00% | | | | | | $ | 442,840,336 | |
| |
Notes to Schedule of Investments:
| (a) | Non-income producing security. |
| (b) | The money market fund and the Fund are affiliated by having the same investment adviser. The rate shown is the7-day SEC standardized yield as of October 31, 2019. |
See accompanying Notes to Financial Statements which are an integral part of the financial statements.
| | |
| 11 | | Invesco Global Small & Mid Cap Growth Fund |
Statement of Assets and Liabilities
October 31, 2019
| | | | |
Assets: | | | | |
| |
Investments in securities, at value
(Cost $304,400,277) | | $ | 415,897,544 | |
| |
Investments in affiliated money market funds, at value
(Cost $26,276,178) | | | 26,277,782 | |
| |
Foreign currencies, at value (Cost $1,010,544) | | | 1,007,460 | |
| |
Receivable for:
| | | | |
Dividends | | | 208,007 | |
| |
Investments sold | | | 162,892 | |
| |
Fund shares sold | | | 56,291 | |
| |
Investment for trustee deferred compensation and retirement plans | | | 211,732 | |
| |
Other assets | | | 26,750 | |
| |
Total assets | | | 443,848,458 | |
| |
| |
Liabilities: | | | | |
| |
Payable for:
| | | | |
Fund shares reacquired | | | 350,872 | |
| |
Accrued fees to affiliates | | | 320,497 | |
| |
Accrued trustees’ and officers’ fees and benefits | | | 1,585 | |
| |
Accrued other operating expenses | | | 108,334 | |
| |
Trustee deferred compensation and retirement plans | | | 226,834 | |
| |
Total liabilities | | | 1,008,122 | |
| |
Net assets applicable to shares outstanding | | $ | 442,840,336 | |
| |
| |
Net assets consist of: | | | | |
| |
Shares of beneficial interest | | $ | 294,153,188 | |
| |
Distributable earnings | | | 148,687,148 | |
| |
| | $ | 442,840,336 | |
| |
| | | | |
Net Assets: | | | | |
| |
Class A | | $ | 411,339,070 | |
| |
Class C | | $ | 10,735,977 | |
| |
Class Y | | $ | 16,081,872 | |
| |
Class R5 | | $ | 3,144,377 | |
| |
Class R6 | | $ | 1,539,040 | |
| |
|
Shares outstanding, no par value, with an unlimited number of shares authorized: | |
| |
Class A | | | 22,777,415 | |
| |
Class C | | | 757,202 | |
| |
Class Y | | | 888,059 | |
| |
Class R5 | | | 175,328 | |
| |
Class R6 | | | 85,794 | |
| |
Class A:
| | | | |
Net asset value per share | | $ | 18.06 | |
| |
Maximum offering price per share
(Net asset value of $18.06 ÷ 94.50%) | | $ | 19.11 | |
| |
Class C:
| | | | |
Net asset value and offering price per share | | $ | 14.18 | |
| |
Class Y:
| | | | |
Net asset value and offering price per share | | $ | 18.11 | |
| |
Class R5:
| | | | |
Net asset value and offering price per share | | $ | 17.93 | |
| |
Class R6:
| | | | |
Net asset value and offering price per share | | $ | 17.94 | |
| |
See accompanying Notes to Financial Statements which are an integral part of the financial statements.
| | |
| 12 | | Invesco Global Small & Mid Cap Growth Fund |
Statement of Operations
For the year ended October 31, 2019
| | | | |
Investment income: | | | | |
| |
Dividends (net of foreign withholding taxes of $455,686) | | $ | 8,960,079 | |
| |
Dividends from affiliated money market funds | | | 501,525 | |
| |
Total investment income | | | 9,461,604 | |
| |
| |
Expenses: | | | | |
Advisory fees | | | 3,499,221 | |
| |
Administrative services fees | | | 72,342 | |
| |
Custodian fees | | | 52,078 | |
| |
Distribution fees: | | | | |
Class A | | | 1,022,106 | |
| |
Class C | | | 128,738 | |
| |
Transfer agent fees – A, C and Y | | | 959,776 | |
| |
Transfer agent fees – R5 | | | 3,131 | |
| |
Transfer agent fees – R6 | | | 583 | |
| |
Trustees’ and officers’ fees and benefits | | | 25,109 | |
| |
Registration and filing fees | | | 77,486 | |
| |
Reports to shareholders | | | 39,418 | |
| |
Professional services fees | | | 58,667 | |
| |
Other | | | 11,251 | |
| |
Total expenses | | | 5,949,906 | |
| |
Less: Fees waived and/or expense offset arrangement(s) | | | (36,779 | ) |
| |
Net expenses | | | 5,913,127 | |
| |
Net investment income | | | 3,548,477 | |
| |
| |
Realized and unrealized gain from: | | | | |
Net realized gain from: | | | | |
Investment securities (net of foreign taxes of $73) | | | 35,816,161 | |
| |
Foreign currencies | | | 37,523 | |
| |
| | | 35,853,684 | |
| |
Change in net unrealized appreciation of: | | | | |
Investment securities | | | 6,177,542 | |
| |
Foreign currencies | | | 36,850 | |
| |
| | | 6,214,392 | |
| |
Net realized and unrealized gain | | | 42,068,076 | |
| |
Net increase in net assets resulting from operations | | $ | 45,616,553 | |
| |
See accompanying Notes to Financial Statements which are an integral part of the financial statements.
| | |
| 13 | | Invesco Global Small & Mid Cap Growth Fund |
Statement of Changes in Net Assets
For the years ended October 31, 2019 and 2018
| | | | | | | | |
| | | 2019 | | | 2018 | |
| |
Operations: | | | | | | | | |
Net investment income | | $ | 3,548,477 | | | $ | 3,237,307 | |
| |
Net realized gain | | | 35,853,684 | | | | 43,423,996 | |
| |
Change in net unrealized appreciation (depreciation) | | | 6,214,392 | | | | (72,586,793 | ) |
| |
Net increase (decrease) in net assets resulting from operations | | | 45,616,553 | | | | (25,925,490 | ) |
| |
| | |
Distributions to shareholders from distributable earnings: | | | | | | | | |
Class A | | | (41,779,982 | ) | | | (37,777,828 | ) |
| |
Class B | | | – | | | | (143,470 | ) |
| |
Class C | | | (2,255,910 | ) | | | (2,109,471 | ) |
| |
Class Y | | | (1,719,347 | ) | | | (1,896,354 | ) |
| |
Class R5 | | | (314,467 | ) | | | (380,134 | ) |
| |
Class R6 | | | (136,235 | ) | | | (26,168 | ) |
| |
Total distributions from distributable earnings | | | (46,205,941 | ) | | | (42,333,425 | ) |
| |
| | |
Share transactions–net: | | | | | | | | |
Class A | | | (3,175,547 | ) | | | (8,564,631 | ) |
| |
Class B | | | – | | | | (1,778,538 | ) |
| |
Class C | | | (7,400,579 | ) | | | (1,406,804 | ) |
| |
Class Y | | | (541,041 | ) | | | (3,246,144 | ) |
| |
Class R5 | | | (774,854 | ) | | | (9,305,118 | ) |
| |
Class R6 | | | 292,145 | | | | 1,122,760 | |
| |
Net increase (decrease) in net assets resulting from share transactions | | | (11,599,876 | ) | | | (23,178,475 | ) |
| |
Net increase (decrease) in net assets | | | (12,189,264 | ) | | | (91,437,390 | ) |
| |
| | |
Net assets: | | | | | | | | |
Beginning of year | | | 455,029,600 | | | | 546,466,990 | |
| |
End of year | | $ | 442,840,336 | | | $ | 455,029,600 | |
| |
See accompanying Notes to Financial Statements which are an integral part of the financial statements.
| | |
| 14 | | Invesco Global Small & Mid Cap Growth Fund |
Financial Highlights
The following schedule presents financial highlights for a share of the Fund outstanding throughout the periods indicated.
| | | | | | | | | | | | | | | | | | | | | | | | | | | | | | | | | | | | | | | | | | | | | | | | | | | | | | | | | | | | | | | | | | | | | | |
| | | Net asset value, beginning of period | | Net investment income (loss)(a) | | Net gains (losses) on securities (both realized and unrealized) | | Total from investment operations | | Dividends from net investment income | | Distributions from net realized gains | | Total distributions | | Net asset value, end of period | | Total return (b) | | Net assets, end of period (000’s omitted) | | Ratio of expenses to average net assets with fee waivers and/or expenses absorbed | | Ratio of
expenses
to average net
assets without
fee waivers
and/or
expenses
absorbed | | Ratio of net
investment
income
(loss) to average
net assets | | Portfolio turnover (c) |
Class A | | | | | | | | | | | | | | | | | | | | | | | | | | | | | | | | | | | | | | | | | | | | | | | | | | | | | | | | | | | | | | | | | | | | | | |
Year ended 10/31/19 | | | $ | 18.24 | | | | $ | 0.14 | | | | $ | 1.55 | | | | $ | 1.69 | | | | $ | (0.10 | ) | | | $ | (1.77 | ) | | | $ | (1.87 | ) | | | $ | 18.06 | | | | | 11.06 | % | | | $ | 411,339 | | | | | 1.32 | %(d) | | | | 1.33 | %(d) | | | | 0.82 | %(d) | | | | 42 | % |
Year ended 10/31/18 | | | | 20.95 | | | | | 0.13 | | | | | (1.18 | ) | | | | (1.05 | ) | | | | (0.25 | ) | | | | (1.41 | ) | | | | (1.66 | ) | | | | 18.24 | | | | | (5.51 | ) | | | | 414,005 | | | | | 1.35 | | | | | 1.36 | | | | | 0.64 | | | | | 33 | |
Year ended 10/31/17 | | | | 17.52 | | | | | 0.12 | | | | | 3.46 | | | | | 3.58 | | | | | (0.12 | ) | | | | (0.03 | ) | | | | (0.15 | ) | | | | 20.95 | | �� | | | 20.63 | | | | | 484,101 | | | | | 1.39 | | | | | 1.40 | | | | | 0.65 | | | | | 25 | |
Year ended 10/31/16 | | | | 18.55 | | | | | 0.12 | | | | | 0.03 | | | | | 0.15 | | | | | (0.10 | ) | | | | (1.08 | ) | | | | (1.18 | ) | | | | 17.52 | | | | | 0.98 | | | | | 451,433 | | | | | 1.35 | | | | | 1.36 | | | | | 0.69 | | | | | 22 | |
Year ended 10/31/15 | | | | 21.59 | | | | | 0.13 | | | | | (0.64 | ) | | | | (0.51 | ) | | | | (0.12 | ) | | | | (2.41 | ) | | | | (2.53 | ) | | | | 18.55 | | | | | (2.28 | ) | | | | 504,020 | | | | | 1.35 | | | | | 1.36 | | | | | 0.69 | | | | | 25 | |
Class C | | | | | | | | | | | | | | | | | | | | | | | | | | | | | | | | | | | | | | | | | | | | | | | | | | | | | | | | | | | | | | | | | | | | | | |
Year ended 10/31/19 | | | | 14.74 | | | | | 0.01 | | | | | 1.20 | | | | | 1.21 | | | | | – | | | | | (1.77 | ) | | | | (1.77 | ) | | | | 14.18 | | | | | 10.22 | | | | | 10,736 | | | | | 2.07 | (d) | | | | 2.08 | (d) | | | | 0.07 | (d) | | | | 42 | |
Year ended 10/31/18 | | | | 17.24 | | | | | (0.02 | ) | | | | (0.96 | ) | | | | (0.98 | ) | | | | (0.11 | ) | | | | (1.41 | ) | | | | (1.52 | ) | | | | 14.74 | | | | | (6.25 | ) | | | | 19,248 | | | | | 2.10 | | | | | 2.11 | | | | | (0.11 | ) | | | | 33 | |
Year ended 10/31/17 | | | | 14.42 | | | | | (0.01 | ) | | | | 2.86 | | | | | 2.85 | | | | | (0.00 | ) | | | | (0.03 | ) | | | | (0.03 | ) | | | | 17.24 | | | | | 19.80 | | | | | 24,011 | | | | | 2.14 | | | | | 2.15 | | | | | (0.10 | ) | | | | 25 | |
Year ended 10/31/16 | | | | 15.49 | | | | | (0.01 | ) | | | | 0.02 | | | | | 0.01 | | | | | – | | | | | (1.08 | ) | | | | (1.08 | ) | | | | 14.42 | | | | | 0.21 | | | | | 23,628 | | | | | 2.10 | | | | | 2.11 | | | | | (0.06 | ) | | | | 22 | |
Year ended 10/31/15 | | | | 18.46 | | | | | (0.01 | ) | | | | (0.55 | ) | | | | (0.56 | ) | | | | – | | | | | (2.41 | ) | | | | (2.41 | ) | | | | 15.49 | | | | | (3.01 | ) | | | | 27,880 | | | | | 2.10 | | | | | 2.11 | | | | | (0.06 | ) | | | | 25 | |
Class Y | | | | | | | | | | | | | | | | | | | | | | | | | | | | | | | | | | | | | | | | | | | | | | | | | | | | | | | | | | | | | | | | | | | | | | |
Year ended 10/31/19 | | | | 18.30 | | | | | 0.18 | | | | | 1.56 | | | | | 1.74 | | | | | (0.15 | ) | | | | (1.78 | ) | | | | (1.93 | ) | | | | 18.11 | | | | | 11.33 | | | | | 16,082 | | | | | 1.07 | (d) | | | | 1.08 | (d) | | | | 1.07 | (d) | | | | 42 | |
Year ended 10/31/18 | | | | 21.02 | | | | | 0.18 | | | | | (1.20 | ) | | | | (1.02 | ) | | | | (0.29 | ) | | | | (1.41 | ) | | | | (1.70 | ) | | | | 18.30 | | | | | (5.29 | ) | | | | 16,634 | | | | | 1.10 | | | | | 1.11 | | | | | 0.89 | | | | | 33 | |
Year ended 10/31/17 | | | | 17.58 | | | | | 0.17 | | | | | 3.47 | | | | | 3.64 | | | | | (0.17 | ) | | | | (0.03 | ) | | | | (0.20 | ) | | | | 21.02 | | | | | 20.93 | | | | | 22,551 | | | | | 1.14 | | | | | 1.15 | | | | | 0.90 | | | | | 25 | |
Year ended 10/31/16 | | | | 18.61 | | | | | 0.16 | | | | | 0.04 | | | | | 0.20 | | | | | (0.15 | ) | | | | (1.08 | ) | | | | (1.23 | ) | | | | 17.58 | | | | | 1.27 | | | | | 15,847 | | | | | 1.10 | | | | | 1.11 | | | | | 0.94 | | | | | 22 | |
Year ended 10/31/15 | | | | 21.66 | | | | | 0.18 | | | | | (0.65 | ) | | | | (0.47 | ) | | | | (0.17 | ) | | | | (2.41 | ) | | | | (2.58 | ) | | | | 18.61 | | | | | (2.04 | ) | | | | 16,721 | | | | | 1.10 | | | | | 1.11 | | | | | 0.94 | | | | | 25 | |
Class R5 | | | | | | | | | | | | | | | | | | | | | | | | | | | | | | | | | | | | | | | | | | | | | | | | | | | | | | | | | | | | | | | | | | | | | | |
Year ended 10/31/19 | | | | 18.15 | | | | | 0.20 | | | | | 1.52 | | | | | 1.72 | | | | | (0.17 | ) | | | | (1.77 | ) | | | | (1.94 | ) | | | | 17.93 | | | | | 11.38 | | | | | 3,144 | | | | | 0.96 | (d) | | | | 0.97 | (d) | | | | 1.18 | (d) | | | | 42 | |
Year ended 10/31/18 | | | | 20.87 | | | | | 0.19 | | | | | (1.18 | ) | | | | (0.99 | ) | | | | (0.32 | ) | | | | (1.41 | ) | | | | (1.73 | ) | | | | 18.15 | | | | | (5.20 | ) | | | | 3,895 | | | | | 1.01 | | | | | 1.02 | | | | | 0.98 | | | | | 33 | |
Year ended 10/31/17 | | | | 17.45 | | | | | 0.19 | | | | | 3.45 | | | | | 3.64 | | | | | (0.19 | ) | | | | (0.03 | ) | | | | (0.22 | ) | | | | 20.87 | | | | | 21.14 | | | | | 13,688 | | | | | 1.01 | | | | | 1.02 | | | | | 1.03 | | | | | 25 | |
Year ended 10/31/16 | | | | 18.50 | | | | | 0.18 | | | | | 0.02 | | | | | 0.20 | | | | | (0.17 | ) | | | | (1.08 | ) | | | | (1.25 | ) | | | | 17.45 | | | | | 1.31 | | | | | 12,873 | | | | | 0.97 | | | | | 0.98 | | | | | 1.07 | | | | | 22 | |
Year ended 10/31/15 | | | | 21.55 | | | | | 0.21 | | | | | (0.65 | ) | | | | (0.44 | ) | | | | (0.20 | ) | | | | (2.41 | ) | | | | (2.61 | ) | | | | 18.50 | | | | | (1.88 | ) | | | | 13,613 | | | | | 0.98 | | | | | 0.99 | | | | | 1.06 | | | | | 25 | |
Class R6 | | | | | | | | | | | | | | | | | | | | | | | | | | | | | | | | | | | | | | | | | | | | | | | | | | | | | | | | | | | | | | | | | | | | | | |
Year ended 10/31/19 | | | | 18.16 | | | | | 0.21 | | | | | 1.53 | | | | | 1.74 | | | | | (0.19 | ) | | | | (1.77 | ) | | | | (1.96 | ) | | | | 17.94 | | | | | 11.49 | | | | | 1,539 | | | | | 0.90 | (d) | | | | 0.91 | (d) | | | | 1.24 | (d) | | | | 42 | |
Year ended 10/31/18 | | | | 20.88 | | | | | 0.21 | | | | | (1.18 | ) | | | | (0.97 | ) | | | | (0.34 | ) | | | | (1.41 | ) | | | | (1.75 | ) | | | | 18.16 | | | | | (5.09 | ) | | | | 1,248 | | | | | 0.93 | | | | | 0.94 | | | | | 1.06 | | | | | 33 | |
Year ended 10/31/17(e) | | | | 18.54 | | | | | 0.14 | | | | | 2.20 | | | | | 2.34 | | | | | – | | | | | – | | | | | – | | | | | 20.88 | | | | | 12.62 | | | | | 311 | | | | | 0.89 | (f) | | | | 0.90 | (f) | | | | 1.15 | (f) | | | | 25 | |
| (a) | Calculated using average shares outstanding. |
| (b) | Includes adjustments in accordance with accounting principles generally accepted in the United States of America and as such, the net asset value for financial reporting purposes and the returns based upon those net asset values may differ from the net asset value and returns for shareholder transactions. Does not include sales charges and is not annualized for periods less than one year, if applicable. |
| (c) | Portfolio turnover is calculated at the fund level and is not annualized for periods less than one year, if applicable. |
| (d) | Ratios are based on average daily net assets (000’s omitted) of $408,842, $12,874, $16,060, $3,133 and $1,299 for Class A, Class C, Class Y, Class R5 and Class R6 shares, respectively. |
| (e) | Commencement date of April 4, 2017. |
See accompanying Notes to Financial Statements which are an integral part of the financial statements.
| | |
| 15 | | Invesco Global Small & Mid Cap Growth Fund |
Notes to Financial Statements
October 31, 2019
NOTE 1–Significant Accounting Policies
Invesco Global Small & Mid Cap Growth Fund (the “Fund”) is a series portfolio of AIM International Mutual Funds (Invesco International Mutual Funds) (the “Trust”). The Trust is a Delaware statutory trust registered under the Investment Company Act of 1940, as amended (the “1940 Act”), as anopen-end series management investment company authorized to issue an unlimited number of shares of beneficial interest. Information presented in these financial statements pertains only to the Fund. Matters affecting the Fund or each class will be voted on exclusively by the shareholders of the Fund or each class.
The Fund’s investment objective is long-term growth of capital.
The Fund currently consists of five different classes of shares: Class A, Class C, Class Y, Class R5 and Class R6. Class Y shares are available only to certain investors. Class A shares are sold with afront-end sales charge unless certain waiver criteria are met. Under certain circumstances, load waived shares may be subject to contingent deferred sales charges (“CDSC”). Class C shares are sold with a CDSC. Class Y, Class R5 and Class R6 shares are sold at net asset value. Class C shares held for ten years after purchase are eligible for automatic conversion into Class A shares of the same Fund (the Conversion Feature). The automatic conversion pursuant to the Conversion Feature will generally occur at the end of the month following the tenth anniversary after a purchase of Class C shares.
The Fund is an investment company and accordingly follows the investment company accounting and reporting guidance in accordance with Financial Accounting Standards Board Accounting Standards Codification Topic 946,Financial Services - Investment Companies.
The following is a summary of the significant accounting policies followed by the Fund in the preparation of its financial statements.
| A. | Security Valuations– Securities, including restricted securities, are valued according to the following policy. |
A security listed or traded on an exchange (except convertible securities) is valued at its last sales price or official closing price as of the close of the customary trading session on the exchange where the security is principally traded, or lacking any sales or official closing price on a particular day, the security may be valued at the closing bid price on that day. Securities traded in theover-the-counter market are valued based on prices furnished by independent pricing services or market makers. When such securities are valued by an independent pricing service they may be considered fair valued. Futures contracts are valued at the final settlement price set by an exchange on which they are principally traded. Listed options are valued at the mean between the last bid and asked prices from the exchange on which they are principally traded. Options not listed on an exchange are valued by an independent source at the mean between the last bid and asked prices. For purposes of determining net asset value (“NAV”) per share, futures and option contracts generally are valued 15 minutes after the close of the customary trading session of the New York Stock Exchange (“NYSE”).
Investments inopen-end andclosed-end registered investment companies that do not trade on an exchange are valued at theend-of-day net asset value per share. Investments inopen-end andclosed-end registered investment companies that trade on an exchange are valued at the last sales price or official closing price as of the close of the customary trading session on the exchange where the security is principally traded.
Debt obligations (including convertible securities) and unlisted equities are fair valued using an evaluated quote provided by an independent pricing service. Evaluated quotes provided by the pricing service may be determined without exclusive reliance on quoted prices, and may reflect appropriate factors such asinstitution-size trading in similar groups of securities, developments related to specific securities, dividend rate (for unlisted equities), yield (for debt obligations), quality, type of issue, coupon rate (for debt obligations), maturity (for debt obligations), individual trading characteristics and other market data. Pricing services generally value debt obligations assuming orderly transactions of institutional round lot size, but a fund may hold or transact in the same securities in smaller, odd lot sizes. Odd lots often trade at lower prices than institutional round lots. Debt obligations are subject to interest rate and credit risks. In addition, all debt obligations involve some risk of default with respect to interest and/or principal payments.
Foreign securities’ (including foreign exchange contracts) prices are converted into U.S. dollar amounts using the applicable exchange rates as of the close of the NYSE. If market quotations are available and reliable for foreign exchange-traded equity securities, the securities will be valued at the market quotations. Because trading hours for certain foreign securities end before the close of the NYSE, closing market quotations may become unreliable. If between the time trading ends on a particular security and the close of the customary trading session on the NYSE, events occur that the investment adviser determines are significant and make the closing price unreliable, the Fund may fair value the security. If the event is likely to have affected the closing price of the security, the security will be valued at fair value in good faith using procedures approved by the Board of Trustees. Adjustments to closing prices to reflect fair value may also be based on a screening process of an independent pricing service to indicate the degree of certainty, based on historical data, that the closing price in the principal market where a foreign security trades is not the current value as of the close of the NYSE. Foreign securities’ prices meeting the approved degree of certainty that the price is not reflective of current value will be priced at the indication of fair value from the independent pricing service. Multiple factors may be considered by the independent pricing service in determining adjustments to reflect fair value and may include information relating to sector indices, American Depositary Receipts and domestic and foreign index futures. Foreign securities may have additional risks including exchange rate changes, potential for sharply devalued currencies and high inflation, political and economic upheaval, the relative lack of issuer information, relatively low market liquidity and the potential lack of strict financial and accounting controls and standards.
Securities for which market prices are not provided by any of the above methods may be valued based upon quotes furnished by independent sources. The last bid price may be used to value equity securities. The mean between the last bid and asked prices is used to value debt obligations, including corporate loans.
Securities for which market quotations are not readily available or became unreliable are valued at fair value as determined in good faith by or under the supervision of the Trust’s officers following procedures approved by the Board of Trustees. Issuer specific events, market trends, bid/asked quotes of brokers and information providers and other market data may be reviewed in the course of making a good faith determination of a security’s fair value.
The Fund may invest in securities that are subject to interest rate risk, meaning the risk that the prices will generally fall as interest rates rise and, conversely, the prices will generally rise as interest rates fall. Specific securities differ in their sensitivity to changes in interest rates
| | |
| 16 | | Invesco Global Small & Mid Cap Growth Fund |
depending on their individual characteristics. Changes in interest rates may result in increased market volatility, which may affect the value and/or liquidity of certain Fund investments.
Valuations change in response to many factors including the historical and prospective earnings of the issuer, the value of the issuer’s assets, general economic conditions, interest rates, investor perceptions and market liquidity. Because of the inherent uncertainties of valuation, the values reflected in the financial statements may materially differ from the value received upon actual sale of those investments.
| B. | Securities Transactions and Investment Income– Securities transactions are accounted for on a trade date basis. Realized gains or losses on sales are computed on the basis of specific identification of the securities sold. Interest income (net of withholding tax, if any) is recorded on the accrual basis from settlement date. Dividend income (net of withholding tax, if any) is recorded on theex-dividend date. |
The Fund may periodically participate in litigation related to Fund investments. As such, the Fund may receive proceeds from litigation settlements. Any proceeds received are included in the Statement of Operations as realized gain (loss) for investments no longer held and as unrealized gain (loss) for investments still held.
Brokerage commissions and mark ups are considered transaction costs and are recorded as an increase to the cost basis of securities purchased and/or a reduction of proceeds on a sale of securities. Such transaction costs are included in the determination of net realized and unrealized gain (loss) from investment securities reported in the Statement of Operations and the Statement of Changes in Net Assets and the net realized and unrealized gains (losses) on securities per share in the Financial Highlights. Transaction costs are included in the calculation of the Fund’s net asset value and, accordingly, they reduce the Fund’s total returns. These transaction costs are not considered operating expenses and are not reflected in net investment income reported in the Statement of Operations and the Statement of Changes in Net Assets, or the net investment income per share and the ratios of expenses and net investment income reported in the Financial Highlights, nor are they limited by any expense limitation arrangements between the Fund and the investment adviser.
The Fund allocates income and realized and unrealized capital gains and losses to a class based on the relative net assets of each class.
| C. | Country Determination– For the purposes of making investment selection decisions and presentation in the Schedule of Investments, the investment adviser may determine the country in which an issuer is located and/or credit risk exposure based on various factors. These factors include the laws of the country under which the issuer is organized, where the issuer maintains a principal office, the country in which the issuer derives 50% or more of its total revenues and the country that has the primary market for the issuer’s securities, as well as other criteria. Among the other criteria that may be evaluated for making this determination are the country in which the issuer maintains 50% or more of its assets, the type of security, financial guarantees and enhancements, the nature of the collateral and the sponsor organization. Country of issuer and/or credit risk exposure has been determined to be the United States of America, unless otherwise noted. |
| D. | Distributions– Distributions from net investment income and net realized capital gain, if any, are generally declared and paid annually and recorded on theex-dividend date. The Fund may elect to treat a portion of the proceeds from redemptions as distributions for federal income tax purposes. |
| E. | Federal Income Taxes–The Fund intends to comply with the requirements of Subchapter M of the Internal Revenue Code of 1986, as amended (the “Internal Revenue Code”), necessary to qualify as a regulated investment company and to distribute substantially all of the Fund’s taxable earnings to shareholders. As such, the Fund will not be subject to federal income taxes on otherwise taxable income (including net realized capital gain) that is distributed to shareholders. Therefore, no provision for federal income taxes is recorded in the financial statements. |
The Fund recognizes the tax benefits of uncertain tax positions only when the position is more likely than not to be sustained. Management has analyzed the Fund’s uncertain tax positions and concluded that no liability for unrecognized tax benefits should be recorded related to uncertain tax positions. Management is not aware of any tax positions for which it is reasonably possible that the total amounts of unrecognized tax benefits will change materially in the next 12 months.
The Fund files tax returns in the U.S. Federal jurisdiction and certain other jurisdictions. Generally, the Fund is subject to examinations by such taxing authorities for up to three years after the filing of the return for the tax period.
| F. | Expenses–Fees provided for under the Rule12b-1 plan of a particular class of the Fund are charged to the operations of such class. Transfer agency fees and expenses and other shareholder recordkeeping fees and expenses attributable to Class R5 and Class R6 are allocated to each share class based on relative net assets.Sub-accounting fees attributable to Class R5 are charged to the operations of the class. Transfer agency fees and expenses and other shareholder recordkeeping fees and expenses relating to all other classes are allocated among those classes based on relative net assets. All other expenses are allocated among the classes based on relative net assets. |
| G. | Accounting Estimates–The preparation of financial statements in conformity with accounting principles generally accepted in the United States of America (“GAAP”) requires management to make estimates and assumptions that affect the reported amounts of assets and liabilities at the date of the financial statements and the reported amounts of revenues and expenses during the reporting period including estimates and assumptions related to taxation. Actual results could differ from those estimates by a significant amount. In addition, the Fund monitors for material events or transactions that may occur or become known after theperiod-end date and before the date the financial statements are released to print. |
| H. | Indemnifications– Under the Trust’s organizational documents, each Trustee, officer, employee or other agent of the Trust is indemnified against certain liabilities that may arise out of the performance of their duties to the Fund. Additionally, in the normal course of business, the Fund enters into contracts, including the Fund’s servicing agreements, that contain a variety of indemnification clauses. The Fund’s maximum exposure under these arrangements is unknown as this would involve future claims that may be made against the Fund that have not yet occurred. The risk of material loss as a result of such indemnification claims is considered remote. |
| I. | Foreign Currency Translations– Foreign currency is valued at the close of the NYSE based on quotations posted by banks and major currency dealers. Portfolio securities and other assets and liabilities denominated in foreign currencies are translated into U.S. dollar amounts at the date of valuation. Purchases and sales of portfolio securities (net of foreign taxes withheld on disposition) and income items denominated in foreign currencies are translated into U.S. dollar amounts on the respective dates of such transactions. The Fund does not separately account for the portion of the results of operations resulting from changes in foreign exchange rates on investments and the fluctuations arising from changes in market prices of securities held. The combined results of changes in foreign exchange rates and the fluctuation of market prices on investments (net of estimated foreign tax withholding) are included with the net realized and unrealized gain or loss from investments in the Statement of Operations. Reported net realized foreign currency gains or losses arise from (1) sales of foreign currencies, (2) currency gains or losses realized between the trade and settlement dates on securities transactions, and (3) the difference between the amounts of dividends, |
| | |
| 17 | | Invesco Global Small & Mid Cap Growth Fund |
| | interest, and foreign withholding taxes recorded on the Fund’s books and the U.S. dollar equivalent of the amounts actually received or paid. Net unrealized foreign currency gains and losses arise from changes in the fair values of assets and liabilities, other than investments in securities at fiscal period end, resulting from changes in exchange rates. |
The Fund may invest in foreign securities, which may be subject to foreign taxes on income, gains on investments or currency repatriation, a portion of which may be recoverable. Foreign taxes, if any, are recorded based on the tax regulations and rates that exist in the foreign markets in which the Fund invests and are shown in the Statement of Operations.
| J. | Forward Foreign Currency Contracts– The Fund may engage in foreign currency transactions either on a spot (i.e. for prompt delivery and settlement) basis, or through forward foreign currency contracts, to manage or minimize currency or exchange rate risk. |
The Fund may also enter into forward foreign currency contracts for the purchase or sale of a security denominated in a foreign currency in order to “lock in” the U.S. dollar price of that security, or the Fund may also enter into forward foreign currency contracts that do not provide for physical settlement of the two currencies, but instead are settled by a single cash payment calculated as the difference between the agreed upon exchange rate and the spot rate at settlement based upon an agreed upon notional amount(non-deliverable forwards). The Fund will set aside liquid assets in an amount equal to the dailymark-to-market obligation for forward foreign currency contracts.
A forward foreign currency contract is an obligation between two parties (“Counterparties”) to purchase or sell a specific currency for an agreed-upon price at a future date. The use of forward foreign currency contracts does not eliminate fluctuations in the price of the underlying securities the Fund owns or intends to acquire but establishes a rate of exchange in advance. Fluctuations in the value of these contracts are measured by the difference in the contract date and reporting date exchange rates and are recorded as unrealized appreciation (depreciation) until the contracts are closed. When the contracts are closed, realized gains (losses) are recorded. Realized and unrealized gains (losses) on the contracts are included in the Statement of Operations. The primary risks associated with forward foreign currency contracts include failure of the Counterparty to meet the terms of the contract and the value of the foreign currency changing unfavorably. These risks may be in excess of the amounts reflected in the Statement of Assets and Liabilities.
NOTE 2–Advisory Fees and Other Fees Paid to Affiliates
The Trust has entered into a master investment advisory agreement with Invesco Advisers, Inc. (the “Adviser” or “Invesco”). Under the terms of the investment advisory agreement, the Fund accrues daily and pays monthly an advisory fee to the Adviser based on the annual rate of the Fund’s average daily net assets as follows:
| | | | | | |
| Average Daily Net Assets | | Rate | |
| |
First $ 250 million | | | 0.800% | |
| |
Next $250 million | | | 0.780% | |
| |
Next $500 million | | | 0.760% | |
| |
Next $1.5 billion | | | 0.740% | |
| |
Next $2.5 billion | | | 0.720% | |
| |
Next $2.5 billion | | | 0.700% | |
| |
Next $2.5 billion | | | 0.680% | |
| |
Over $10 billion | | | 0.660% | |
| |
For the year ended October 31, 2019, the effective advisory fee rate incurred by the Fund was 0.79%.
Under the terms of a mastersub-advisory agreement between the Adviser and each of Invesco Asset Management Deutschland GmbH, Invesco Asset Management Limited, Invesco Asset Management (Japan) Limited, Invesco Hong Kong Limited, Invesco Senior Secured Management, Inc. and Invesco Canada Ltd. (collectively, the “AffiliatedSub-Advisers”) the Adviser, not the Fund, will pay 40% of the fees paid to the Adviser to any such AffiliatedSub-Adviser(s) that provide(s) discretionary investment management services to the Fund based on the percentage of assets allocated to such AffiliatedSub-Adviser(s).
The Adviser has contractually agreed, through at least June 30, 2020, to waive advisory fees and/or reimburse expenses of all shares to the extent necessary to limit total annual fund operating expenses after fee waiver and/or expense reimbursement (excluding certain items discussed below) of Class A, Class C, Class Y, Class R5 and Class R6 shares to 2.25%, 3.00%, 2.00%, 2.00% and 2.00%, respectively, of average daily net assets (the “expense limits”). In determining the Adviser’s obligation to waive advisory fees and/or reimburse expenses, the following expenses are not taken into account, and could cause the total annual fund operating expenses after fee waiver and/or expense reimbursement to exceed the numbers reflected above: (1) interest; (2) taxes; (3) dividend expense on short sales; (4) extraordinary ornon-routine items, including litigation expenses; and (5) expenses that the Fund has incurred but did not actually pay because of an expense offset arrangement. Unless Invesco continues the fee waiver agreement, it will terminate on June 30, 2020. During its term, the fee waiver agreement cannot be terminated or amended to increase the expense limits or reduce the advisory fee waiver without approval of the Board of Trustees. The Adviser did not waive fees and/or reimburse expenses during the period under this expense limit.
Further, the Adviser has contractually agreed, through at least June 30, 2021, to waive the advisory fee payable by the Fund in an amount equal to 100% of the net advisory fees the Adviser receives from the affiliated money market funds on investments by the Fund of uninvested cash in such affiliated money market funds.
For the year ended October 31, 2019, the Adviser waived advisory fees of $25,073.
The Trust has entered into a master administrative services agreement with Invesco pursuant to which the Fund has agreed to pay Invesco for certain administrative costs incurred in providing accounting services to the Fund. For the year ended October 31, 2019, expenses incurred under the agreement are shown in the Statement of Operations asAdministrative services fees. Invesco has entered into asub-administration agreement whereby State Street Bank and Trust Company (“SSB”) serves as fund accountant and provides certain administrative services to the Fund. Pursuant to a custody agreement with the Trust on behalf of the Fund, SSB also serves as the Fund’s custodian.
The Trust has entered into a transfer agency and service agreement with Invesco Investment Services, Inc. (“IIS”) pursuant to which the Fund has agreed to pay IIS a fee for providing transfer agency and shareholder services to the Fund and reimburse IIS for certain expenses incurred by IIS in the
| | |
| 18 | | Invesco Global Small & Mid Cap Growth Fund |
course of providing such services. IIS may make payments to intermediaries that provide omnibus account services,sub-accounting services and/or networking services. All fees payable by IIS to intermediaries that provide omnibus account services orsub-accounting services are charged back to the Fund, subject to certain limitations approved by the Trust’s Board of Trustees. For the year ended October 31, 2019, expenses incurred under the agreement are shown in the Statement of Operations asTransfer agent fees.
The Trust has entered into master distribution agreements with Invesco Distributors, Inc. (“IDI”) to serve as the distributor for the Class A, Class C, Class Y, Class R5 and Class R6 shares of the Fund. The Trust has adopted plans pursuant to Rule12b-1 under the 1940 Act with respect to the Fund’s Class A and Class C shares (collectively, the “Plans”). The Fund, pursuant to the Plans, pays IDI compensation at the annual rate of 0.25% of the Fund’s average daily net assets of Class A shares and 1.00% of the average daily net assets of Class C shares. The fees are accrued daily and paid monthly. Of the Plan payments, up to 0.25% of the average daily net assets of each class of shares may be paid to furnish continuing personal shareholder services to customers who purchase and own shares of such classes. Any amounts not paid as a service fee under the Plans would constitute an asset-based sales charge. Rules of the Financial Industry Regulatory Authority (“FINRA”) impose a cap on the total sales charges, including asset-based sales charges, that may be paid by any class of shares of the Fund. For the year ended October 31, 2019, expenses incurred under the Plans are shown in the Statement of Operations asDistribution fees.
Front-end sales commissions and CDSC (collectively, the “sales charges”) are not recorded as expenses of the Fund.Front-end sales commissions are deducted from proceeds from the sales of Fund shares prior to investment in Class A shares of the Fund. CDSC are deducted from redemption proceeds prior to remittance to the shareholder. During the year ended October 31, 2019, IDI advised the Fund that IDI retained $27,111 infront-end sales commissions from the sale of Class A shares and $279 and $590 from Class A and Class C shares, respectively, for CDSC imposed upon redemptions by shareholders.
For the year ended October 31, 2019, the Fund incurred $129 in brokerage commissions with Invesco Capital Markets, Inc., an affiliate of the Adviser and IDI, for portfolio transactions executed on behalf of the Fund.
Certain officers and trustees of the Trust are officers and directors of the Adviser, IIS and/or IDI.
NOTE 3–Additional Valuation Information
GAAP defines fair value as the price that would be received to sell an asset or paid to transfer a liability in an orderly transaction between market participants at the measurement date, under current market conditions. GAAP establishes a hierarchy that prioritizes the inputs to valuation methods, giving the highest priority to readily available unadjusted quoted prices in an active market for identical assets (Level 1) and the lowest priority to significant unobservable inputs (Level 3), generally when market prices are not readily available or are unreliable. Based on the valuation inputs, the securities or other investments are tiered into one of three levels. Changes in valuation methods may result in transfers in or out of an investment’s assigned level:
| | |
| Level 1 - | | Prices are determined using quoted prices in an active market for identical assets. |
| Level 2 - | | Prices are determined using other significant observable inputs. Observable inputs are inputs that other market participants may use in pricing a security. These may include quoted prices for similar securities, interest rates, prepayment speeds, credit risk, yield curves, loss severities, default rates, discount rates, volatilities and others. |
| Level 3 - | | Prices are determined using significant unobservable inputs. In situations where quoted prices or observable inputs are unavailable (for example, when there is little or no market activity for an investment at the end of the period), unobservable inputs may be used. Unobservable inputs reflect the Fund’s own assumptions about the factors market participants would use in determining fair value of the securities or instruments and would be based on the best available information. |
The following is a summary of the tiered valuation input levels, as of October 31, 2019. The level assigned to the securities valuations may not be an indication of the risk or liquidity associated with investing in those securities. Because of the inherent uncertainties of valuation, the values reflected in the financial statements may materially differ from the value received upon actual sale of those investments.
| | |
| 19 | | Invesco Global Small & Mid Cap Growth Fund |
| | | | | | | | | | | | | | | | |
| | | Level 1 | | | Level 2 | | | Level 3 | | | Total | |
Investments in Securities | | | | | | | | | | | | | | | | |
| |
Australia | | $ | – | | | $ | 2,353,563 | | | | $– | | | $ | 2,353,563 | |
| |
Brazil | | | 14,739,838 | | | | – | | | | – | | | | 14,739,838 | |
| |
Canada | | | 30,052,869 | | | | – | | | | – | | | | 30,052,869 | |
| |
China | | | – | | | | 12,663,309 | | | | – | | | | 12,663,309 | |
| |
France | | | – | | | | 6,749,324 | | | | – | | | | 6,749,324 | |
| |
Germany | | | – | | | | 30,905,004 | | | | – | | | | 30,905,004 | |
| |
Hong Kong | | | – | | | | 8,214,856 | | | | – | | | | 8,214,856 | |
| |
Hungary | | | – | | | | 3,508,167 | | | | – | | | | 3,508,167 | |
| |
Ireland | | | – | | | | 5,510,091 | | | | – | | | | 5,510,091 | |
| |
Israel | | | 5,584,079 | | | | – | | | | – | | | | 5,584,079 | |
| |
Japan | | | – | | | | 16,091,256 | | | | – | | | | 16,091,256 | |
| |
Mexico | | | 7,761,480 | | | | – | | | | – | | | | 7,761,480 | |
| |
Netherlands | | | – | | | | 4,111,448 | | | | – | | | | 4,111,448 | |
| |
Romania | | | – | | | | 6,716,668 | | | | – | | | | 6,716,668 | |
| |
Switzerland | | | – | | | | 2,022,390 | | | | – | | | | 2,022,390 | |
| |
Turkey | | | – | | | | 9,959,397 | | | | – | | | | 9,959,397 | |
| |
United Kingdom | | | – | | | | 72,829,848 | | | | – | | | | 72,829,848 | |
| |
United States | | | 176,123,957 | | | | – | | | | – | | | | 176,123,957 | |
| |
Money Market Funds | | | 26,277,782 | | | | – | | | | – | | | | 26,277,782 | |
| |
Total Investments | | $ | 260,540,005 | | | $ | 181,635,321 | | | | $– | | | $ | 442,175,326 | |
| |
NOTE 4–Expense Offset Arrangement(s)
The expense offset arrangement is comprised of transfer agency credits which result from balances in demand deposit accounts used by the transfer agent for clearing shareholder transactions. For the year ended October 31, 2019, the Fund received credits from this arrangement, which resulted in the reduction of the Fund’s total expenses of $11,706.
NOTE 5–Trustees’ and Officers’ Fees and Benefits
Trustees’ and Officers’ Fees and Benefits include amounts accrued by the Fund to pay remuneration to certain Trustees and Officers of the Fund. Trustees have the option to defer compensation payable by the Fund, andTrustees’ and Officers’ Fees and Benefits also include amounts accrued by the Fund to fund such deferred compensation amounts. Those Trustees who defer compensation have the option to select various Invesco Funds in which their deferral accounts shall be deemed to be invested. Finally, certain current Trustees were eligible to participate in a retirement plan that provided for benefits to be paid upon retirement to Trustees over a period of time based on the number of years of service. The Fund may have certain former Trustees who also participate in a retirement plan and receive benefits under such plan.Trustees’ and Officers’ Fees and Benefits include amounts accrued by the Fund to fund such retirement benefits. Obligations under the deferred compensation and retirement plans represent unsecured claims against the general assets of the Fund.
NOTE 6–Cash Balances
The Fund is permitted to temporarily carry a negative or overdrawn balance in its account with SSB, the custodian bank. Such balances, if any atperiod-end, are shown in the Statement of Assets and Liabilities under the payable captionAmount due custodian. To compensate the custodian bank for such overdrafts, the overdrawn Fund may either (1) leave funds as a compensating balance in the account so the custodian bank can be compensated by earning the additional interest; or (2) compensate by paying the custodian bank at a rate agreed upon by the custodian bank and Invesco, not to exceed the contractually agreed upon rate.
NOTE 7–Distributions to Shareholders and Tax Components of Net Assets
Tax Character of Distributions to Shareholders Paid During the Fiscal Years Ended October 31, 2019 and 2018
| | | | | | | | |
| | | 2019 | | | 2018 | |
| |
Ordinary income | | $ | 2,404,317 | | | $ | 7,680,553 | |
| |
Long-term capital gain | | | 43,801,624 | | | | 34,652,872 | |
| |
Total distributions | | $ | 46,205,941 | | | $ | 42,333,425 | |
| |
| | |
| 20 | | Invesco Global Small & Mid Cap Growth Fund |
| | | | |
| Tax Components of Net Assets atPeriod-End: | | | | |
| | | 2019 | |
| |
Undistributed ordinary income | | $ | 5,312,474 | |
| |
Undistributed long-term capital gain | | | 35,307,041 | |
| |
Net unrealized appreciation – investments | | | 108,261,514 | |
| |
Net unrealized appreciation (depreciation) – foreign currencies | | | (2,927 | ) |
| |
Temporary book/tax differences | | | (190,954 | ) |
| |
Shares of beneficial interest | | | 294,153,188 | |
| |
Total net assets | | $ | 442,840,336 | |
| |
The difference between book-basis andtax-basis unrealized appreciation (depreciation) is due to differences in the timing of recognition of gains and losses on investments for tax and book purposes. The Fund’s net unrealized appreciation difference is attributable primarily to passive foreign investment companies.
The temporary book/tax differences are a result of timing differences between book and tax recognition of income and/or expenses. The Fund’s temporary book/tax differences are the result of the trustee deferral of compensation and retirement plan benefits.
Capital loss carryforward is calculated and reported as of a specific date. Results of transactions and other activity after that date may affect the amount of capital loss carryforward actually available for the Fund to utilize. Capital losses generated in years beginning after December 22, 2010 can be carried forward for an unlimited period, whereas previous losses expire in eight tax years. Capital losses with an expiration period may not be used to offset capital gains until all net capital losses without an expiration date have been utilized. Capital loss carryforwards with no expiration date will retain their character as either short-term or long-term capital losses instead of as short-term capital losses as under prior law. The ability to utilize capital loss carryforwards in the future may be limited under the Internal Revenue Code and related regulations based on the results of future transactions.
The Fund does not have a capital loss carryforward as of October 31, 2019.
NOTE 8–Investment Transactions
The aggregate amount of investment securities (other than short-term securities, U.S. Treasury obligations and money market funds, if any) purchased and sold by the Fund during the year ended October 31, 2019 was $174,901,844 and $236,574,950, respectively. Cost of investments, including any derivatives, on a tax basis includes the adjustments for financial reporting purposes as of the most recently completed federal income tax reportingperiod-end.
| | | | |
| Unrealized Appreciation (Depreciation) of Investments on a Tax Basis | |
| |
Aggregate unrealized appreciation of investments | | $ | 123,800,799 | |
| |
Aggregate unrealized (depreciation) of investments | | | (15,539,285 | ) |
| |
Net unrealized appreciation of investments | | $ | 108,261,514 | |
| |
Cost of investments for tax purposes is $333,913,812.
NOTE 9–Reclassification of Permanent Differences
Primarily as a result of differing book/tax treatment of foreign currency transactions, on October 31, 2019, undistributed net investment income was increased by $37,450 and undistributed net realized gain was decreased by $37,450. This reclassification had no effect on the net assets or the distributable earnings of the Fund.
NOTE 10–Share Information
| | | | | | | | | | | | | | | | |
| | | | Summary of Share Activity | | | | |
| |
| | | Years ended October 31, | |
| | | 2019(a) | | | 2018 | |
| | | Shares | | | Amount | | | Shares | | | Amount | |
Sold: | | | | | | | | | | | | | | | | |
Class A | | | 542,325 | | | $ | 9,214,097 | | | | 779,663 | | | $ | 15,426,746 | |
| |
Class B(b) | | | - | | | | - | | | | 365 | | | | 6,314 | |
| |
Class C | | | 114,476 | | | | 1,548,479 | | | | 131,787 | | | | 2,112,476 | |
| |
Class Y | | | 261,642 | | | | 4,437,034 | | | | 357,194 | | | | 7,140,498 | |
| |
Class R5 | | | 50,859 | | | | 857,301 | | | | 23,211 | | | | 457,682 | |
| |
Class R6 | | | 41,197 | | | | 712,410 | | | | 99,620 | | | | 2,012,954 | |
| |
| | |
| 21 | | Invesco Global Small & Mid Cap Growth Fund |
| | | | | | | | | | | | | | | | |
| | | Summary of Share Activity | |
| | | Years ended October 31, | |
| | | 2019(a) | | | 2018 | |
| | | | | | | | |
| | | Shares | | | Amount | | | Shares | | | Amount | |
| | | | |
Issued as reinvestment of dividends: | | | | | | | | | | | | | | | | |
Class A | | | 2,592,171 | | | $ | 39,919,436 | | | | 1,863,859 | | | $ | 36,158,861 | |
| |
Class B(b) | | | - | | | | - | | | | 8,977 | | | | 141,573 | |
| |
Class C | | | 176,449 | | | | 2,147,391 | | | | 128,467 | | | | 2,027,217 | |
| |
Class Y | | | 99,293 | | | | 1,530,100 | | | | 85,486 | | | | 1,660,142 | |
| |
Class R5 | | | 20,561 | | | | 313,549 | | | | 19,715 | | | | 379,316 | |
| |
Class R6 | | | 8,532 | | | | 130,024 | | | | 1,311 | | | | 25,222 | |
| |
| | | | |
Conversion of Class B shares to Class A shares:(c) | | | | | | | | | | | | | | | | |
Class A | | | - | | | | - | | | | 81,204 | | | | 1,680,113 | |
| |
Class B | | | - | | | | - | | | | (99,328 | ) | | | (1,680,113 | ) |
| |
| | | | |
Automatic conversion of Class C shares to Class A shares: | | | | | | | | | | | | | | | | |
Class A | | | 457,768 | | | | 7,584,185 | | | | - | | | | - | |
| |
Class C | | | (579,823 | ) | | | (7,584,185 | ) | | | - | | | | - | |
| |
| | | | |
Reacquired: | | | | | | | | | | | | | | | | |
Class A | | | (3,508,828 | ) | | | (59,893,265 | ) | | | (3,133,827 | ) | | | (61,830,351 | ) |
| |
Class B(b) | | | - | | | | - | | | | (14,807 | ) | | | (246,312 | ) |
| |
Class C | | | (259,551 | ) | | | (3,512,264 | ) | | | (347,630 | ) | | | (5,546,497 | ) |
| |
Class Y | | | (381,732 | ) | | | (6,508,175 | ) | | | (606,778 | ) | | | (12,046,784 | ) |
| |
Class R5 | | | (110,740 | ) | | | (1,945,704 | ) | | | (484,138 | ) | | | (10,142,116 | ) |
| |
Class R6 | | | (32,645 | ) | | | (550,289 | ) | | | (47,102 | ) | | | (915,416 | ) |
| |
Net increase (decrease) in share activity | | | (508,046 | ) | | $ | (11,599,876 | ) | | | (1,152,751 | ) | | $ | (23,178,475 | ) |
| |
| (a) | There are entities that are record owners of more than 5% of the outstanding shares of the Fund and in the aggregate own 24% of the outstanding shares of the Fund. IDI has an agreement with these entities to sell Fund shares. The Fund, Invesco and/or Invesco affiliates may make payments to these entities, which are considered to be related to the Fund, for providing services to the Fund, Invesco and/or Invesco affiliates including but not limited to services such as securities brokerage, distribution, third party record keeping and account servicing. The Fund has no knowledge as to whether all or any portion of the shares owned of record by these entities are also owned beneficially. |
| (b) | Class B shares activity for the period November 1, 2017 through January 26, 2018 (date of conversion). |
| (c) | Effective as of the close of business January 26, 2018, all outstanding Class B shares were converted to Class A shares. |
NOTE 11–Subsequent Event
The Board of Trustees of the Fund unanimously approved an Agreement and Plan of Reorganization (the “Agreement”) pursuant to which the Fund would transfer all of its assets and liabilities to Invesco Global Growth Fund (the “Acquiring Fund”).
The reorganization is expected to be consummated in or around April or May 2020. Upon closing of the reorganization, shareholders of the Fund will receive shares of the Acquiring Fund in exchange for their shares of the Fund, and the Fund will liquidate and cease operations.
| | |
| 22 | | Invesco Global Small & Mid Cap Growth Fund |
Report of Independent Registered Public Accounting Firm
To the Board of Trustees of AIM International Mutual Funds (Invesco International Mutual Funds) and Shareholders of Invesco Global Small & Mid Cap Growth Fund
Opinion on the Financial Statements
We have audited the accompanying statement of assets and liabilities, including the schedule of investments, of Invesco Global Small & Mid Cap Growth Fund (one of the funds constituting AIM International Mutual Funds (Invesco International Mutual Funds), referred to hereafter as the “Fund”) as of October 31, 2019, the related statement of operations for the year ended October 31, 2019, the statement of changes in net assets for each of the two years in the period ended October 31, 2019, including the related notes, and the financial highlights for each of the periods indicated therein (collectively referred to as the “financial statements”). In our opinion, the financial statements present fairly, in all material respects, the financial position of the Fund as of October 31, 2019, the results of its operations for the year then ended, the changes in its net assets for each of the two years in the period ended October 31, 2019 and the financial highlights for each of the periods indicated therein in conformity with accounting principles generally accepted in the United States of America.
Basis for Opinion
These financial statements are the responsibility of the Fund’s management. Our responsibility is to express an opinion on the Fund’s financial statements based on our audits. We are a public accounting firm registered with the Public Company Accounting Oversight Board (United States) (PCAOB) and are required to be independent with respect to the Fund in accordance with the U.S. federal securities laws and the applicable rules and regulations of the Securities and Exchange Commission and the PCAOB.
We conducted our audits of these financial statements in accordance with the standards of the PCAOB. Those standards require that we plan and perform the audit to obtain reasonable assurance about whether the financial statements are free of material misstatement, whether due to error or fraud.
Our audits included performing procedures to assess the risks of material misstatement of the financial statements, whether due to error or fraud, and performing procedures that respond to those risks. Such procedures included examining, on a test basis, evidence regarding the amounts and disclosures in the financial statements. Our audits also included evaluating the accounting principles used and significant estimates made by management, as well as evaluating the overall presentation of the financial statements. Our procedures included confirmation of securities owned as of October 31, 2019 by correspondence with the custodian and transfer agent. We believe that our audits provide a reasonable basis for our opinion.
/s/PricewaterhouseCoopers LLP
Houston, Texas
December 23, 2019
We have served as the auditor of one or more of the investment companies in the Invesco group of investment companies since at least 1995. We have not been able to determine the specific year we began serving as auditor.
| | |
| 23 | | Invesco Global Small & Mid Cap Growth Fund |
Calculating your ongoing Fund expenses
Example
As a shareholder of the Fund, you incur two types of costs: (1) transaction costs, which may include sales charges (loads) on purchase payments or contingent deferred sales charges on redemptions, if any; and (2) ongoing costs, including management fees, distribution and/or service(12b-1) fees, and other Fund expenses. This example is intended to help you understand your ongoing costs (in dollars) of investing in the Fund and to compare these costs with ongoing costs of investing in other mutual funds. The example is based on an investment of $1,000 invested at the beginning of the period and held for the entire period May 1, 2019 through October 31, 2019.
Actual expenses
The table below provides information about actual account values and actual expenses. You may use the information in this table, together with the amount you invested, to estimate the expenses that you paid over the period. Simply divide your account value by $1,000 (for example, an $8,600 account value divided by $1,000 = 8.6), then multiply the result by the number in the table under the heading entitled “Actual Expenses Paid During Period” to estimate the expenses you paid on your account during this period.
Hypothetical example for comparison purposes
The table below also provides information about hypothetical account values and hypothetical expenses based on the Fund’s actual expense ratio and an assumed rate of return of 5% per year before expenses, which is not the Fund’s actual return.
The hypothetical account values and expenses may not be used to estimate the actual ending account balance or expenses you paid for the period. You may use this information to compare the ongoing costs of investing in the Fund and other funds. To do so, compare this 5% hypothetical example with the 5% hypothetical examples that appear in the shareholder reports of the other funds.
Please note that the expenses shown in the table are meant to highlight your ongoing costs only and do not reflect any transaction costs, such as sales charges (loads) on purchase payments or contingent deferred sales charges on redemptions, if any. Therefore, the hypothetical information is useful in comparing ongoing costs only, and will not help you determine the relative total costs of owning different funds. In addition, if these transaction costs were included, your costs would have been higher.
| | | | | | | | | | | | | | | | | | | | | | | | | | | | | | |
| | | Beginning
Account Value
(05/01/19) | | ACTUAL | | HYPOTHETICAL (5% annual return before
expenses) | | Annualized
Expense
Ratio |
| Ending
Account Value
(10/31/19)1 | | Expenses
Paid During
Period2 | | Ending
Account Value
(10/31/19) | | Expenses
Paid During
Period2 |
|
Class A | | | | $1,000.00 | | | | | $1,038.50 | | | | | $6.89 | | | | | $1,018.45 | | | | | $6.82 | | | | | 1.34 | % |
Class C | | | | 1,000.00 | | | | | 1,034.30 | | | | | 10.72 | | | | | 1,014.67 | | | | | 10.61 | | | | | 2.09 | |
Class Y | | | | 1,000.00 | | | | | 1,039.60 | | | | | 5.60 | | | | | 1,019.71 | | | | | 5.55 | | | | | 1.09 | |
Class R5 | | | | 1,000.00 | | | | | 1,040.00 | | | | | 4.99 | | | | | 1,020.32 | | | | | 4.94 | | | | | 0.97 | |
Class R6 | | | | 1,000.00 | | | | | 1,040.60 | | | | | 4.68 | | | | | 1,020.62 | | | | | 4.63 | | | | | 0.91 | |
| 1 | The actual ending account value is based on the actual total return of the Fund for the period May 1, 2019 through October 31, 2019, after actual expenses and will differ from the hypothetical ending account value which is based on the Fund’s expense ratio and a hypothetical annual return of 5% before expenses. |
| 2 | Expenses are equal to the Fund’s annualized expense ratio as indicated above multiplied by the average account value over the period, multiplied by 184/365 to reflect the most recent fiscal half year. |
| | |
| 24 | | Invesco Global Small & Mid Cap Growth Fund |
Approval of Investment Advisory andSub-Advisory Contracts
At meetings held on June 10, 2019, the Board of Trustees (the Board or the Trustees) of AIM International Mutual Funds (Invesco International Mutual Funds) as a whole, and the independent Trustees, who comprise over 75% of the Board, voting separately, approved the continuance of the Invesco Global Small & Mid Cap Growth Fund’s (the Fund) Master Investment Advisory Agreement with Invesco Advisers, Inc. (Invesco Advisers and the investment advisory agreement) and the Master IntergroupSub-Advisory Contract for Mutual Funds with Invesco Asset Management Deutschland GmbH, Invesco Asset Management Limited, Invesco Asset Management (Japan) Limited, Invesco Hong Kong Limited, Invesco Senior Secured Management, Inc. and Invesco Canada Ltd. (collectively, the AffiliatedSub-Advisers and thesub-advisory contracts) for another year, effective July 1, 2019. After evaluating the factors discussed below, among others, the Board approved the renewal of the Fund’s investment advisory agreement and thesub-advisory contracts and determined that the compensation payable by the Fund to Invesco Advisers and by Invesco Advisers to the AffiliatedSub-Advisers is fair and reasonable.
The Board’s Evaluation Process
The Board’s Investments Committee has established threeSub-Committees, which meet throughout the year to review the performance of funds advised by Invesco Advisers (the Invesco Funds). As part of a regularly scheduled basis ofin-person Board meetings, theSub-Committees meet with portfolio managers for their assigned Invesco Funds and other members of management to review detailed information about investment performance and portfolio attributes of these funds. The Board took into account evaluations and reports that it received from the Investments Committee andSub-Committees, as well as the information provided to such committees and the Board throughout the year, in considering whether to approve each Invesco Fund’s investment advisory agreement andsub-advisory contracts.
As part of the contract renewal process, the Board reviews and considers information provided in response to detailed requests for information submitted to management by the independent Trustees with assistance from legal counsel to the independent Trustees. The Board receives comparative investment performance and fee data regarding the Invesco Funds prepared by Invesco Advisers and Broadridge Financial Solutions, Inc. (Broadridge), an independent mutual fund data provider. The Board also receives an independent written evaluation from the Senior Officer, an officer of the Invesco Funds who reports directly to the independent Trustees. The Senior Officer’s
evaluation is prepared as part of his responsibility to manage the process by which the Invesco Funds’ proposed management fees are negotiated during the annual contract renewal process to ensure they are negotiated in a manner that is at arms’ length and reasonable. In addition to meetings with Invesco Advisers and fund counsel throughout the year, the independent Trustees also discuss the continuance of the investment advisory agreement andsub-advisory contracts in separate sessions with the Senior Officer and with independent legal counsel.
The discussion below is a summary of the Senior Officer’s independent written evaluation with respect to the Fund’s investment advisory agreement, as well as a discussion of the material factors and related conclusions that formed the basis for the Board’s approval of the Fund’s investment advisory agreement andsub-advisory contracts. The Trustees’ review and conclusions are based on the comprehensive consideration of all information presented to them during the course of the year and in prior years and are not the result of any single determinative factor. Moreover, one Trustee may have weighed a particular piece of information or factor differently than another Trustee. This information is current as of June 10, 2019.
Factors and Conclusions and Summary of Independent Written Fee Evaluation
| A. | Nature, Extent and Quality of Services Provided by Invesco Advisers and the AffiliatedSub-Advisers |
The Board reviewed the nature, extent and quality of the advisory services provided to the Fund by Invesco Advisers under the Fund’s investment advisory agreement, and the credentials and experience of the officers and employees of Invesco Advisers who provide these services, including the Fund’s portfolio manager(s). The Board’s review included consideration of Invesco Advisers’ investment process oversight and structure, credit analysis and investment risk management. The Board also considerednon-advisory services that Invesco Advisers and its affiliates provide to the Invesco Funds such as various back office support functions, third party oversight, internal audit, valuation, portfolio trading and legal and compliance. The Board also received and reviewed information about Invesco Advisers’ role as administrator of the Invesco Funds’ liquidity risk management program. The Board also reviewed and considered the benefits to shareholders of investing in a fund that is part of the Invesco family of funds under the umbrella of Invesco Ltd., Invesco Advisers’ parent company, and noted Invesco Ltd.’s depth and experience in conducting an investment
management business, as well as its commitment of financial and other resources to such business. The Board reviewed and considered information about the resources that Invesco Advisers intends to continue to commit to managing the Invesco family of funds following Invesco Ltd.’s acquisition of OppenheimerFunds, Inc. and its subsidiaries. The Board concluded that the nature, extent and quality of the services provided to the Fund by Invesco Advisers are appropriate and satisfactory.
The Board reviewed the services that may be provided by the AffiliatedSub-Advisers under thesub-advisory contracts and the credentials and experience of the officers and employees of the AffiliatedSub-Advisers who provide these services. The Board noted the AffiliatedSub-Advisers’ expertise with respect to certain asset classes and that the AffiliatedSub-Advisers have offices and personnel that are located in financial centers around the world. As a result, the Board noted that the AffiliatedSub-Advisers can provide research and investment analysis on the markets and economies of various countries in which the Fund may invest, make recommendations regarding securities and assist with security trades. The Board concluded that thesub-advisory contracts may benefit the Fund and its shareholders by permitting Invesco Advisers to use the resources and talents of the AffiliatedSub-Advisers in managing the Fund. The Board concluded that the nature, extent and quality of the services that may be provided by the AffiliatedSub-Advisers are appropriate and satisfactory.
B. Fund Investment Performance
The Board considered Fund investment performance as a relevant factor in considering whether to approve the investment advisory agreement. The Board did not view Fund investment performance as a relevant factor in considering whether to approve thesub-advisory contracts for the Fund, as no AffiliatedSub-Adviser currently manages assets of the Fund.
The Board compared the Fund’s investment performance over multiple time periods ending December 31, 2018 to the performance of funds in the Broadridge performance universe and against the Lipper GlobalSmall/Mid-Cap Funds Index. The Board noted that performance of Class A shares of the Fund was in the fourth quintile of its performance universe for the one and five year periods and the fifth quintile for the three year period (the first quintile being the best performing funds and the fifth quintile being the worst performing funds). The Board noted that performance of Class A shares of the Fund was reasonably comparable to the
| | |
| 25 | | Invesco Global Small & Mid Cap Growth Fund |
performance of the Index for the one year period, and below the performance of the Index for the three and five year periods. The Board noted that the Fund’s overweight exposure to and security selection in certain sectors and regions detracted from Fund performance. The Trustees also reviewed more recent Fund performance and this review did not change their conclusions.
| C. | Advisory andSub-Advisory Fees and Fund Expenses |
The Board compared the Fund’s contractual management fee rate to the contractual management fee rates of funds in the Fund’s Broadridge expense group. The Board noted that the contractual management fee rate for Class A shares of the Fund was below the median contractual management fee rate of funds in its expense group. The Board noted that the term “contractual management fee” for funds in the expense group may include both advisory and certainnon-portfolio management administrative services fees, but that Broadridge does not provide information on a fund by fund basis as to what is included. The Board also reviewed the methodology used by Broadridge in providing expense group information, which includes using each fund’s contractual management fee schedule (including any applicable breakpoints) as reported in the most recent prospectus or statement of additional information for each fund in the expense group. The Board also considered comparative information regarding the Fund’s total expense ratio and its various components.
The Board noted that Invesco Advisers has contractually agreed to waive fees and/or limit expenses of the Fund for the term disclosed in the Fund’s registration statement in an amount necessary to limit total annual operating expenses to a specified percentage of average daily net assets for each class of the Fund.
The Board also considered the fees charged by Invesco Advisers and the AffiliatedSub-Advisers to other similarly managed client accounts. The Board noted that Invesco Advisers or the AffiliatedSub-Advisers may charge lower fees to large institutional clients. Invesco Advisers reviewed with the Board differences in the scope of services it provides to the Invesco Funds relative to certain other types of client accounts, including management of cash flows as a result of redemptions and purchases, necessary infrastructure such as officers, office space, technology, legal and distribution, oversight of service providers, costs and business risks associated with launching new funds and sponsoring and maintaining the product line, preparation of annual registration statement updates and financial information and compliance with federal and state laws and regulations.
The Board also considered the services that may be provided by the AffiliatedSub-Advisers
pursuant to thesub-advisory contracts, as well as the fees payable by Invesco Advisers to the AffiliatedSub-Advisers pursuant to thesub-advisory contracts.
| D. | Economies of Scale and Breakpoints |
The Board considered the extent to which there may be economies of scale in the provision of advisory services to the Fund. The Board considered Invesco’s reinvestment in its business, including investments in business infrastructure and cybersecurity. The Board also considered that the Fund benefits from economies of scale through contractual breakpoints in the Fund’s advisory fee schedule, which generally operate to reduce the Fund’s expense ratio as it grows in size. The Board noted that the Fund shares directly in economies of scale through lower fees charged by third party service providers based on the combined size of the Invesco Funds. The Board noted that the Fund may also benefit from economies of scale through initial fee setting, fee waivers and expense reimbursements.
| E. | Profitability and Financial Resources |
The Board reviewed information from Invesco Advisers concerning the costs of the advisory and other services that Invesco Advisers and its affiliates provide to the Fund and the Invesco Funds and the profitability of Invesco Advisers and its affiliates in providing these services. The Board considered the methodology used for calculating profitability and noted the periodic review of such methodology by an independent consultant. The Board noted that Invesco Advisers continues to operate at a net profit from services Invesco Advisers and its affiliates provide to the Invesco Funds and the Fund. The Board did not deem the level of profits realized by Invesco Advisers and its affiliates from providing services to the Fund to be excessive given the nature, extent and quality of the services provided. The Board received information from Invesco Advisers demonstrating that Invesco Advisers and the AffiliatedSub-Advisers are financially sound and have the resources necessary to perform their obligations under the investment advisory agreement andsub-advisory contracts.
| F. | Collateral Benefits to Invesco Advisers and its Affiliates |
The Board considered various other benefits received by Invesco Advisers and its affiliates from the relationship with the Fund, including the fees received for providing administrative, transfer agency and distribution services to the Fund. The Board considered comparative information regarding fees charged for these services, including information provided by Broadridge and other independent sources. The Board considered the performance of Invesco Advisers and its affiliates in providing these services and the organizational structure employed to provide these services. The Board also considered that these services are provided to the Fund pursuant to written contracts that are reviewed and approved on an annual basis
by the Board; and that the services are required for the operation of the Fund.
The Board considered the benefits realized by Invesco Advisers and the AffiliatedSub-Advisers as a result of portfolio brokerage transactions executed through “soft dollar” arrangements. The Board noted that soft dollar arrangements may result in the Fund bearing costs to purchase research that may be used by Invesco Advisers or the AffiliatedSub-Advisers with other clients and may reduce Invesco Advisers’ or the AffiliatedSub-Advisers’ expenses. The Board also considered that it receives periodic reports from Invesco representing that these arrangements are consistent with regulatory requirements. The Board did not deem the soft dollar arrangements to be inappropriate.
The Board considered that the Fund’s uninvested cash and cash collateral from any securities lending arrangements may be invested in money market funds advised by Invesco Advisers pursuant to procedures approved by the Board. The Board considered information regarding the returns of the affiliated money market funds relative to comparable overnight investments, as well as the costs to the Fund of such investments. The Board noted that Invesco Advisers receives advisory fees from these affiliated money market funds attributable to such investments, although Invesco Advisers has contractually agreed to waive through varying periods the advisory fees payable by the Invesco Funds with respect to certain investments in the affiliated money market funds. The waiver is in an amount equal to 100% of the net advisory fee Invesco Advisers receives from the affiliated money market funds with respect to the Fund’s investment in the affiliated money market funds of uninvested cash, but not cash collateral. The Board concluded that the amount of advisory fees received by Invesco Advisers from the Fund’s investment of cash collateral from any securities lending arrangements in the affiliated money market funds is fair and reasonable.
The Board also considered that an affiliated broker may receive commissions for executing certain trades for the Fund. Invesco Advisers and the AffiliatedSub-Advisers may use the affiliated broker to, among other things, control order routing and minimize information leakage, and the Board was advised that such trades are executed in compliance with rules under the federal securities laws and consistent with best execution obligations.
| | |
| 26 | | Invesco Global Small & Mid Cap Growth Fund |
Tax Information
Form1099-DIV, Form1042-S and otheryear-end tax information provide shareholders with actual calendar year amounts that should be included in their tax returns. Shareholders should consult their tax advisors.
The following distribution information is being provided as required by the Internal Revenue Code or to meet a specific state’s requirement.
The Fund designates the following amounts or, if subsequently determined to be different, the maximum amount allowable for its fiscal year ended October 31, 2019:
| | | | | | |
| | | | | | |
| | Federal and State Income Tax | | | | |
| | Long-Term Capital Gain Distributions | | $ | 43,801,624 | |
| | Qualified Dividend Income* | | | 100.00 | % |
| | Corporate Dividends Received Deduction* | | | 35.33 | % |
| | U.S. Treasury Obligations* | | | 0.00 | % |
* The above percentages are based on ordinary income dividends paid to shareholders during the Fund’s fiscal year.
| | |
| 27 | | Invesco Global Small & Mid Cap Growth Fund |
Trustees and Officers
The address of each trustee and officer is AIM International Mutual Funds (Invesco International Mutual Funds) (the “Trust”), 11 Greenway Plaza, Suite 1000, Houston, Texas 77046-1173. The trustees serve for the life of the Trust, subject to their earlier death, incapacitation, resignation, retirement or removal as more specifically provided in the Trust’s organizational documents. Each officer serves for a one year term or until their successors are elected and qualified. Column two below includes length of time served with predecessor entities, if any.
| | | | | | | | |
Name, Year of Birth and
Position(s) Held with the Trust | | Trustee and/or Officer Since | | Principal Occupation(s) During Past 5 Years | | Number of Funds in Fund Complex
Overseen by Trustee | | Other Directorship(s) Held by Trustee During Past 5 Years |
| Interested Persons | | | | | | | | |
Martin L. Flanagan1- 1960 Trustee and Vice Chair | | 2007 | | Executive Director, Chief Executive Officer and President, Invesco Ltd. (ultimate parent of Invesco and a global investment management firm); Trustee and Vice Chair, The Invesco Funds; Vice Chair, Investment Company Institute; and Member of Executive Board, SMU Cox School of Business Formerly: Advisor to the Board, Invesco Advisers, Inc. (formerly known as Invesco Institutional (N.A.), Inc.); Chairman and Chief Executive Officer, Invesco Advisers, Inc. (registered investment adviser); Director, Chairman, Chief Executive Officer and President, Invesco Holding Company (US), Inc. (formerly IVZ Inc.) (holding company), Invesco Group Services, Inc. (service provider) and Invesco North American Holdings, Inc. (holding company); Director, Chief Executive Officer and President, Invesco Holding Company Limited (parent of Invesco and a global investment management firm); Director, Invesco Ltd.; Chairman, Investment Company Institute and President,Co-Chief Executive Officer,Co-President, Chief Operating Officer and Chief Financial Officer, Franklin Resources, Inc. (global investment management organization) | | 229 | | None |
| Philip A. Taylor2- 1954 Trustee | | 2006 | | Vice Chair, Invesco Ltd.; Trustee, The Invesco Funds Formerly: Director, Invesco Canada Ltd. (formerly known as Invesco Trimark Ltd./Invesco Trimark Ltèe) (registered investment adviser and registered transfer agent); Head of the Americas and Senior Managing Director, Invesco Ltd.; Director, Invesco Advisers, Inc. (formerly known as Invesco Institutional (N.A.), Inc.) (registered investment adviser); Director and Chairman, Invesco Investment Services, Inc. (formerly known as Invesco AIM Investment Services, Inc.) (registered transfer agent); Chief Executive Officer, Invesco Corporate Class Inc. (corporate mutual fund company); Chairman and Chief Executive Officer, Invesco Canada Ltd. (formerly known as Invesco Trimark Ltd./Invesco Trimark Ltèe) (registered investment adviser and registered transfer agent); Senior Vice President, The Invesco Funds; Director, Invesco Investment Advisers LLC (formerly known as Van Kampen Asset Management); Director, Chairman, Chief Executive Officer and President, Invesco Management Group, Inc. (formerly known as Invesco AIM Management Group, Inc.) (financial services holding company);Co-Chairman,Co-President andCo-Chief Executive Officer, Invesco Advisers, Inc. (formerly known as Invesco Institutional (N.A.), Inc.) (registered investment adviser); Director, Chief Executive Officer and President, Van Kampen Exchange Corp; President and Principal Executive Officer, The Invesco Funds (other than AIM Treasurer’s Series Trust (Invesco Treasurer’s Series Trust), Short-Term Investments Trust and Invesco Management Trust); Executive Vice President, The Invesco Funds (AIM Treasurer’s Series Trust (Invesco Treasurer’s Series Trust), Short-Term Investments Trust and Invesco Management Trust only); Director and President, INVESCO Funds Group, Inc. (registered investment adviser and registered transfer agent); Director and Chairman, IVZ Distributors, Inc. (formerly known as INVESCO Distributors, Inc.) (registered broker dealer); Director, President and Chairman, Invesco Inc. (holding company), Invesco Canada Holdings Inc. (holding company), Trimark Investments Ltd./Placements Trimark Ltèe and Invesco Financial Services Ltd/Services Financiers Invesco Ltèe; Chief Executive Officer, Invesco Canada Fund Inc. (corporate mutual fund company); Director and Chairman, Van Kampen Investor Services Inc.; Director, Chief Executive Officer and President, 1371 Preferred Inc. (holding company) and Van Kampen Investments Inc.; Director and President, AIM GP Canada Inc. (general partner for limited partnerships) and Van Kampen Advisors, Inc.; Director and Chief Executive Officer, Invesco Trimark Dealer Inc. | | 229 | | None |
| | | | | (registered broker dealer); Director, Invesco Distributors, Inc. (formerly known as Invesco AIM Distributors, Inc.) (registered broker dealer); Manager, Invesco Capital Management LLC; Director, Chief Executive Officer and President, Invesco Advisers, Inc.; Director, Chairman, Chief Executive Officer and President, Invesco AIM Capital Management, Inc.; President, Invesco Trimark Dealer Inc. and Invesco Trimark Ltd./Invesco Trimark Ltèe; Director and President, AIM Trimark Corporate Class Inc. and AIM Trimark Canada Fund Inc.; Senior Managing Director, Invesco Holding Company Limited; Director and Chairman, Fund Management Company (former registered broker dealer); President and Principal Executive Officer, The Invesco Funds (AIM Treasurer’s Series Trust (Invesco Treasurer’s Series Trust), and Short-Term Investments Trust only); President, AIM Trimark Global Fund Inc. and AIM Trimark Canada Fund Inc. | | | | |
| 1 | Mr. Flanagan is considered an interested person (within the meaning of Section 2(a)(19) of the 1940 Act) of the Trust because he is an officer of the Adviser to the Trust, and an officer and a director of Invesco Ltd., ultimate parent of the Adviser. |
| 2 | Mr. Taylor is considered an interested person (within the meaning of Section 2(a)(19) of the 1940 Act) of the Trust because he is an officer and a director of the Adviser. |
| | |
| T-1 | | Invesco Global Small & Mid Cap Growth Fund |
Trustees and Officers–(continued)
| | | | | | | | |
Name, Year of Birth and
Position(s) Held with the Trust | | Trustee and/or Officer Since | | Principal Occupation(s) During Past 5 Years | | Number of
Funds in Fund Complex
Overseen by
Trustee | | Other Directorship(s)
Held by Trustee
During Past 5 Years |
| Independent Trustees | | | | | | | | |
| Bruce L. Crockett - 1944 Trustee and Chair | | 1992 | | Chairman, Crockett Technologies Associates (technology consulting company) Formerly: Director, Captaris (unified messaging provider); Director, President and Chief Executive Officer, COMSAT Corporation; Chairman, Board of Governors of INTELSAT (international communications company); ACE Limited (insurance company); Independent Directors Council and Investment Company Institute: Member of the Audit Committee, Investment Company Institute; Member of the Executive Committee and Chair of the Governance Committee, Independent Directors Council | | 229 | | Director and Chairman of the Audit Committee, ALPS (Attorneys Liability Protection Society) (insurance company); Director and Member of the Audit Committee and Compensation Committee, Ferroglobe PLC (metallurgical company) |
| David C. Arch - 1945 Trustee | | 2010 | | Chairman of Blistex Inc. (consumer health care products manufacturer); Member, World Presidents’ Organization | | 229 | | Board member of the Illinois Manufacturers’ Association |
| Beth Ann Brown - 1968 Trustee | | 2019 | | Independent Consultant Formerly: Head of Intermediary Distribution, Managing Director, Strategic Relations, Managing Director, Head of National Accounts, Senior Vice President, National Account Manager and Senior Vice President, Key Account Manager, Columbia Management Investment Advisers LLC; Vice President, Key Account Manager, Liberty Funds Distributor, Inc.; and Trustee of certain Oppenheimer Funds | | 229 | | Director, Board of Directors of Caron Engineering Inc.; President and Director, Acton Shapleigh Youth Conservation Corps (non - profit); and Vice President and Director of Grahamtastic Connection (non-profit) |
| Jack M. Fields - 1952 Trustee | | 1997 | | Chief Executive Officer, Twenty First Century Group, Inc. (government affairs company); and Chairman, Discovery Learning Alliance(non-profit) Formerly: Owner and Chief Executive Officer, Dos Angeles Ranch L.P. (cattle, hunting, corporate entertainment); Director, Insperity, Inc. (formerly known as Administaff) (human resources provider); Chief Executive Officer, Texana Timber LP (sustainable forestry company); Director of Cross Timbers Quail Research Ranch(non-profit); and member of the U.S. House of Representatives | | 229 | | None |
| Cynthia Hostetler - 1962 Trustee | | 2017 | | Non-Executive Director and Trustee of a number of public and private business corporations Formerly: Director, Aberdeen Investment Funds (4 portfolios); Head of Investment Funds and Private Equity, Overseas Private Investment Corporation; President, First Manhattan Bancorporation, Inc.; Attorney, Simpson Thacher & Bartlett LLP | | 229 | | Vulcan Materials Company (construction materials company); Trilinc Global Impact Fund; Genesee & Wyoming, Inc. (railroads); Artio Global Investment LLC (mutual fund complex); Edgen Group, Inc. (specialized energy and infrastructure products distributor); Investment Company Institute (professional organization); Independent Directors Council (professional organization) |
| | |
| T-2 | | Invesco Global Small & Mid Cap Growth Fund |
Trustees and Officers–(continued)
| | | | | | | | |
Name, Year of Birth and
Position(s) Held with the Trust | | Trustee and/or Officer Since | | Principal Occupation(s) During Past 5 Years | | Number of
Funds in Fund Complex
Overseen by
Trustee | | Other Directorship(s)
Held by Trustee
During Past 5 Years |
| Independent Trustees–(continued) | | | | |
Eli Jones - 1961 Trustee | | 2016 | | Professor and Dean, Mays Business School - Texas A&M University Formerly: Professor and Dean, Walton College of Business, University of Arkansas and E.J. Ourso College of Business, Louisiana State University; Director, Arvest Bank | | 229 | | Insperity, Inc. (formerly known as Administaff) (human resources provider) |
Elizabeth Krentzman - 1959 Trustee | | 2019 | | Formerly: Principal and Chief Regulatory Advisor for Asset Management Services and U.S. Mutual Fund Leader of Deloitte & Touche LLP; General Counsel of the Investment Company Institute (trade association); National Director of the Investment Management Regulatory Consulting Practice, Principal, Director and Senior Manager of Deloitte & Touche LLP; Assistant Director of the Division of Investment Management - Office of Disclosure and Investment Adviser Regulation of the U.S. Securities and Exchange Commission and various positions with the Division of Investment Management - Office of Regulatory Policy of the U.S. Securities and Exchange Commission; Associate at Ropes & Gray LLP; Advisory Board Member of the Securities and Exchange Commission Historical Society; and Trustee of certain Oppenheimer Funds | | 229 | | Trustee of the University of Florida National Board Foundation and Audit Committee Member; Member of the Cartica Funds Board of Directors (private investment funds); Member of the University of Florida Law Center Association, Inc. Board of Trustees and Audit Committee Member |
Anthony J. LaCava, Jr. - 1956 Trustee | | 2019 | | Formerly: Director and Member of the Audit Committee, Blue Hills Bank (publicly traded financial institution) and Managing Partner, KPMG LLP | | 229 | | Blue Hills Bank; Chairman, Bentley University; Member, Business School Advisory Council; and Nominating Committee KPMG LLP |
Prema Mathai-Davis - 1950 Trustee | | 1998 | | Retired Co-Owner & Partner of Quantalytics Research, LLC, (a FinTech Investment Research Platform for the Self-Directed Investor) | | 229 | | None |
Joel W. Motley - 1952 Trustee | | 2019 | | Director of Office of Finance, Federal Home Loan Bank; Member of the Vestry of Trinity Wall Street; Managing Director of Carmona Motley Inc. (privately held financial advisor); Member of the Finance and Budget Committee of the Council on Foreign Relations, Member of the Investment Committee and Board of Human Rights Watch and Member of the Investment Committee and Board of Historic Hudson Valley(non-profit cultural organization) Formerly: Managing Director of Public Capital Advisors, LLC (privately held financial advisor); Managing Director of Carmona Motley Hoffman, Inc. (privately held financial advisor); Trustee of certain Oppenheimer Funds; and Director of Columbia Equity Financial Corp. (privately held financial advisor) | | 229 | | Director of Greenwall Foundation (bioethics research foundation); Member of Board and Investment Committee of The Greenwall Foundation; Director of Southern Africa Legal Services Foundation; Board Member and Investment Committee Member of Pulizer Center for Crisis Reporting(non-profit journalism) |
| Teresa M. Ressel - 1962 Trustee | | 2017 | | Non-executive director and trustee of a number of public and private business corporations Formerly: Chief Financial Officer, Olayan America, The Olayan Group (international investor/commercial/industrial); Chief Executive Officer, UBS Securities LLC; Group Chief Operating Officer, Americas, UBS AG; Assistant Secretary for Management & Budget and CFO, US Department of the Treasury | | 229 | | Atlantic Power Corporation (power generation company); ON Semiconductor Corp. (semiconductor supplier) |
| | |
| T-3 | | Invesco Global Small & Mid Cap Growth Fund |
Trustees and Officers–(continued)
| | | | | | | | |
Name, Year of Birth and
Position(s) Held with the Trust | | Trustee and/or Officer Since | | Principal Occupation(s) During Past 5 Years | | Number of
Funds in Fund Complex
Overseen by
Trustee | | Other Directorship(s)
Held by Trustee
During Past 5 Years |
| Independent Trustees–(continued) | | | | |
Ann Barnett Stern - 1957 Trustee | | 2017 | | President and Chief Executive Officer, Houston Endowment Inc. (private philanthropic institution) Formerly: Executive Vice President and General Counsel, Texas Children’s Hospital; Attorney, Beck, Redden and Secrest, LLP; Business Law Instructor, University of St. Thomas; Attorney, Andrews & Kurth LLP | | 229 | | Federal Reserve Bank of Dallas |
Raymond Stickel, Jr. - 1944 Trustee | | 2005 | | Retired Formerly: Director, Mainstay VP Series Funds, Inc. (25 portfolios); Partner, Deloitte & Touche | | 229 | | None |
Robert C. Troccoli - 1949 Trustee | | 2016 | | Retired Formerly: Adjunct Professor, University of Denver – Daniels College of Business; Senior Partner, KPMG LLP | | 229 | | None |
Daniel S. Vandivort - 1954 Trustee | | 2019 | | Treasurer, Chairman of the Audit and Finance Committee, and Trustee, Board of Trustees, Huntington Disease Foundation of America; and President, Flyway Advisory Services LLC (consulting and property management) Formerly: Trustee and Governance Chair, of certain Oppenheimer Funds | | 229 | | Chairman and Lead Independent Director, Chairman of the Audit Committee, and Director, Board of Directors, Value Line Funds |
| James D. Vaughn - 1945 Trustee | | 2019 | | Retired Formerly: Managing Partner, Deloitte & Touche LLP; Trustee and Chairman of the Audit Committee, Schroder Funds; Board Member, Mile High United Way, Boys and Girls Clubs, Boy Scouts, Colorado Business Committee for the Arts, Economic Club of Colorado and Metro Denver Network (economic development corporation); and Trustee of certain Oppenheimer Funds | | 229 | | Board member and Chairman of Audit Committee of AMG National Trust Bank; Trustee and Investment Committee member, University of South Dakota Foundation; Board member, Audit Committee Member and past Board Chair, Junior Achievement(non-profit) |
Christopher L. WIlson - 1957 Trustee, Vice Chair and Chair Designate | | 2017 | | Reitred Formerly: Director, TD Asset Management USA Inc. (mutual fund complex) (22 portfolios); Managing Partner, CT2, LLC (investing and consulting firm); President/Chief Executive Officer, Columbia Funds, Bank of America Corporation; President/Chief Executive Officer, CDC IXIS Asset Management Services, Inc.; Principal & Director of Operations, Scudder Funds, Scudder, Stevens & Clark, Inc.; Assistant Vice President, Fidelity Investments | | 229 | | ISO New England, Inc.(non-profit organization managing regional electricity market) |
| | |
| T-4 | | Invesco Global Small & Mid Cap Growth Fund |
Trustees and Officers–(continued)
| | | | | | | | |
Name, Year of Birth and
Position(s) Held with the Trust | | Trustee and/or Officer Since | | Principal Occupation(s) During Past 5 Years | | Number of
Funds in Fund Complex
Overseen by
Trustee | | Other Directorship(s)
Held by Trustee
During Past 5 Years |
| | | | | |
| Other Officers | | | | | | | | |
| | | | | |
Sheri Morris - 1964
President, Principal Executive Officer and Treasurer | | 1999 | | Head of Global Fund Services, Invesco Ltd.; President, Principal Executive Officer and Treasurer, The Invesco Funds; Vice President, Invesco Advisers, Inc. (formerly known as Invesco Institutional (N.A.), Inc.) (registered investment adviser); and Vice President, Invesco Exchange-Traded Fund Trust, Invesco Exchange-Traded Fund Trust II, Invesco India Exchange-Traded Fund Trust, Invesco Actively Managed Exchange-Traded Fund Trust, Invesco Actively Managed Exchange-Traded Commodity Fund Trust and Invesco Exchange-Traded Self-Indexed Fund Trust; and Vice President, OppenheimerFunds, Inc. Formerly: Vice President and Principal Financial Officer, The Invesco Funds; Vice President, Invesco AIM Advisers, Inc., Invesco AIM Capital Management, Inc. and Invesco AIM Private Asset Management, Inc.; Assistant Vice President and Assistant Treasurer, The Invesco Funds and Assistant Vice President, Invesco Advisers, Inc., Invesco AIM Capital Management, Inc. and Invesco AIM Private Asset Management, Inc.; and Treasurer, Invesco Exchange-Traded FundTrust, Invesco Exchange-Traded Fund Trust II, Invesco India Exchange-Traded Fund Trust and Invesco Actively Managed Exchange-Traded Fund Trust | | N/A | | N/A |
| | | | | |
Russell C. Burk - 1958
Senior Vice President and Senior Officer | | 2005 | | Senior Vice President and Senior Officer, The Invesco Funds | | N/A | | N/A |
| | | | | |
Jeffrey H. Kupor - 1968
Senior Vice President, Chief Legal Officer and Secretary | | 2018 | | Head of Legal of the Americas, Invesco Ltd.; Senior Vice President and Secretary, Invesco Advisers, Inc. (formerly known as Invesco Institutional (N.A.), Inc.) (registered investment adviser); Senior Vice President and Secretary, Invesco Distributors, Inc. (formerly known as Invesco AIM Distributors, Inc.); Vice President and Secretary, Invesco Investment Services, Inc. (formerly known as Invesco AIM Investment Services, Inc.) Senior Vice President, Chief Legal Officer and Secretary, The Invesco Funds; Secretary and General Counsel, Invesco Investment Advisers LLC (formerly known as Van Kampen Asset Management); Secretary and General Counsel, Invesco Capital Markets, Inc. (formerly known as Van Kampen Funds Inc.) and Chief Legal Officer, Invesco Exchange-Traded Fund Trust, Invesco Exchange-Traded Fund Trust II, Invesco India Exchange-Traded Fund Trust, Invesco Actively Managed Exchange-Traded Fund Trust, Invesco Actively Managed Exchange-Traded Commodity Fund Trust and Invesco Exchange-Traded Self-Indexed Fund Trust; Secretary, Invesco Indexing LLC; Secretary, W.L. Ross & Co., LLC Formerly: Secretary and Vice President, Jemstep, Inc.; Head of Legal, Worldwide Institutional, Invesco Ltd.; Secretary and General Counsel, INVESCO Private Capital Investments, Inc.; Senior Vice President, Secretary and General Counsel, Invesco Management Group, Inc. (formerly known as Invesco AIM Management Group, Inc.); Assistant Secretary, INVESCO Asset Management (Bermuda) Ltd.; Secretary and General Counsel, Invesco Private Capital, Inc.; Assistant Secretary and General Counsel, INVESCO Realty, Inc.; Secretary and General Counsel, Invesco Senior Secured Management, Inc.; and Secretary, Sovereign G./P. Holdings Inc. | | N/A | | N/A |
| | | | | |
| Andrew R. Schlossberg - 1974 Senior Vice President | | 2019 | | Head of the Americas and Senior Managing Director, Invesco Ltd.; Director and Senior Vice President, Invesco Advisers, Inc. (formerly known as Invesco Institutional (N.A.), Inc.) (registered investment adviser); Director and Chairman, Invesco Investment Services, Inc. (formerly known as Invesco AIM Investment Services, Inc.) (registered transfer agent); Senior Vice President, The Invesco Funds; Director, Invesco Investment Advisers LLC (formerly known as Van Kampen Asset Management); Director, President and Chairman, Invesco Insurance Agency, Inc. Formerly: Director, Invesco UK Limited; Director and Chief Executive, Invesco Asset Management Limited and Invesco Fund Managers Limited; Assistant Vice President, The Invesco Funds; Senior Vice President, Invesco Advisers, Inc. (formerly known as Invesco Institutional (N.A.), Inc.) (registered investment adviser); Director and Chief Executive, Invesco Administration Services Limited and Invesco Global Investment Funds Limited; Director, Invesco Distributors, Inc.; Head of EMEA, Invesco Ltd.; President, Invesco Actively Managed Exchange-Traded Commodity Fund Trust, Invesco Actively Managed Exchange-Traded Fund Trust, Invesco Exchange-Traded Fund Trust, Invesco Exchange-Traded Fund Trust II and Invesco India Exchange-Traded Fund Trust; Managing Director and Principal Executive Officer, Invesco Capital Management LLC | | N/A | | N/A |
| | |
| T-5 | | Invesco Global Small & Mid Cap Growth Fund |
Trustees and Officers–(continued)
| | | | | | | | |
Name, Year of Birth and
Position(s) Held with the Trust | | Trustee and/or Officer Since | | Principal Occupation(s) During Past 5 Years | | Number of
Funds in Fund Complex
Overseen by
Trustee | | Other Directorship(s)
Held by Trustee
During Past 5 Years |
| | | | |
| Other Officers–(continued) | | | | | | |
| | | | | |
John M. Zerr - 1962
Senior Vice President | | 2006 | | Chief Operating Officer of the Americas; Senior Vice President, Invesco Advisers, Inc. (formerly known as Invesco Institutional (N.A.), Inc.) (registered investment adviser); Senior Vice President, Invesco Distributors, Inc. (formerly known as Invesco AIM Distributors, Inc.); Director and Vice President, Invesco Investment Services, Inc. (formerly known as Invesco AIM Investment Services, Inc.) Senior Vice President, The Invesco Funds; Managing Director, Invesco Capital Management LLC; Director, Invesco Investment Advisers LLC (formerly known as Van Kampen Asset Management); Senior Vice President, Invesco Capital Markets, Inc. (formerly known as Van Kampen Funds Inc.); Manager, Invesco Indexing LLC; Manager, Invesco Specialized Products, LLC; Director and Senior Vice President, Invesco Insurance Agency, Inc.; Member, Invesco Canada Funds Advisory Board; Director, President and Chief Executive Officer, Invesco Corporate Class Inc. (corporate mutual fund company); and Director, Chairman, President and Chief Executive Officer, Invesco Canada Ltd. (formerly known as Invesco Trimark Ltd./Invesco Trimark Ltèe) (registered investment adviser and registered transfer agent) Formerly: Director and Senior Vice President, Invesco Management Group, Inc. (formerly known as Invesco AIM Management Group, Inc.); Secretary and General Counsel, Invesco Management Group, Inc. (formerly known as Invesco AIM Management Group, Inc.); Secretary, Invesco Investment Services, Inc. (formerly known as Invesco AIM Investment Services, Inc.); Chief Legal Officer and Secretary, The Invesco Funds; Secretary and General Counsel, Invesco Investment Advisers LLC (formerly known as Van Kampen Asset Management); Secretary and General Counsel, Invesco Capital Markets, Inc. (formerly known as Van Kampen Funds Inc.); Chief Legal Officer, Invesco Exchange-Traded Fund Trust, Invesco Exchange-Traded Fund Trust II, Invesco India Exchange-Traded Fund Trust, Invesco Actively Managed Exchange-Traded Fund Trust, Invesco Actively Managed Exchange-Traded Commodity Fund Trust and Invesco Exchange-Traded Self-Indexed Fund Trust; Secretary, Invesco Indexing LLC; Director, Secretary, General Counsel and Senior Vice President, Van Kampen Exchange Corp.; Director, Vice President and Secretary, IVZ Distributors, Inc. (formerly known as INVESCO Distributors, Inc.); Director and Vice President, INVESCO Funds Group, Inc.; Director and Vice President, Van Kampen Advisors Inc.; Director, Vice President, Secretary and General Counsel, Van Kampen Investor Services Inc.; Director and Secretary, Invesco Distributors, Inc. (formerly known as Invesco AIM Distributors, Inc.); Director, Senior Vice President, General Counsel and Secretary, Invesco AIM Advisers, Inc. and Van Kampen Investments Inc.; Director, Vice President and Secretary, Fund Management Company; Director, Senior Vice President, Secretary, General Counsel and Vice President, Invesco AIM Capital Management, Inc.; Chief Operating Officer and General Counsel, Liberty Ridge Capital, Inc. (an investment adviser) | | N/A | | N/A |
| | | | | |
Gregory G. McGreevey - 1962 Senior Vice President | | 2012 | | Senior Managing Director, Invesco Ltd.; Director, Chairman, President, and Chief Executive Officer, Invesco Advisers, Inc. (formerly known as Invesco Institutional (N.A.), Inc.) (registered investment adviser); Director, Invesco Mortgage Capital, Inc. and Invesco Senior Secured Management, Inc.; and Senior Vice President, The Invesco Funds; and President, SNW Asset Management Corporation Formerly: Senior Vice President, Invesco Management Group, Inc. and Invesco Advisers, Inc.; Assistant Vice President, The Invesco Funds | | N/A | | N/A |
| | | | | |
Kelli Gallegos - 1970 Vice President, Principal Financial Officer and Assistant Treasurer | | 2008 | | Principal Financial and Accounting Officer – Investments Pool, Invesco Specialized Products, LLC; Vice President, Principal Financial Officer and Assistant Treasurer, The Invesco Funds; Principal Financial and Accounting Officer – Pooled Investments, Invesco Capital Management LLC; Vice President and Treasurer, Invesco Exchange-Traded Fund Trust, Invesco Exchange-Traded Fund Trust II, Invesco India Exchange-Traded Fund Trust, Invesco Actively Managed Exchange-Traded Fund Trust, Invesco Actively Managed Exchange-Traded Commodity Fund Trust and Invesco Exchange-Traded Self-Indexed Fund Trust Formerly: Assistant Treasurer, Invesco Specialized Products, LLC; Assistant Treasurer, Invesco Exchange-Traded Fund Trust, Invesco Exchange-Traded Fund Trust II, Invesco India Exchange-Traded Fund Trust, Invesco Actively Managed Exchange-Traded Fund Trust, Invesco Actively Managed Exchange-Traded Commodity Fund Trust and Invesco Exchange-Traded Self-Indexed Fund Trust; Assistant Treasurer, Invesco Capital Management LLC; Assistant Vice President, The Invesco Funds | | N/A | | N/A |
| | |
| T-6 | | Invesco Global Small & Mid Cap Growth Fund |
Trustees and Officers–(continued)
| | | | | | | | |
Name, Year of Birth and Position(s) Held with the Trust | | Trustee and/or Officer Since | | Principal Occupation(s) During Past 5 Years | | Number of Funds in Fund Complex Overseen by Trustee | | Other Directorship(s) Held by Trustee During Past 5 Years |
| | | | |
| Other Officers–(continued) | | | | | | |
| | | | | |
| Crissie M. Wisdom - 1969 Anti-Money Laundering Compliance Officer | | 2013 | | Anti-Money Laundering Compliance Officer, Invesco Advisers, Inc. (formerly known as Invesco Institutional (N.A.), Inc.) (registered investment adviser), Invesco Capital Markets, Inc. (formerly known as Van Kampen Funds Inc.), Invesco Distributors, Inc., Invesco Investment Services, Inc., The Invesco Funds, and Invesco Exchange-Traded Fund Trust, Invesco Exchange-Traded Fund Trust II, Invesco India Exchange-Traded Fund Trust, Invesco Actively Managed Exchange-Traded Fund Trust, Invesco Actively Managed Exchange-Traded Commodity Fund Trust and Invesco Exchange-Traded Self-Indexed Fund Trust; Anti-Money Laundering Compliance Officer and Bank Secrecy Act Officer, INVESCO National Trust Company and Invesco Trust Company; and Fraud Prevention Manager and Controls and Risk Analysis Manager for Invesco Investment Services, Inc. Formerly: Anti-Money Laundering Compliance Officer, Van Kampen Exchange Corp. and Invesco Management Group, Inc. | | N/A | | N/A |
| | | | | |
| Robert R. Leveille - 1969 Chief Compliance Officer | | 2016 | | Chief Compliance Officer, Invesco Advisers, Inc. (registered investment adviser); and Chief Compliance Officer, The Invesco Funds Formerly: Chief Compliance Officer, Putnam Investments and the Putnam Funds | | N/A | | N/A |
The Statement of Additional Information of the Trust includes additional information about the Fund’s Trustees and is available upon request, without charge, by calling 1.800.959.4246. Please refer to the Fund’s Statement of Additional Information for information on the Fund’ssub-advisers.
| | | | | | |
| Office of the Fund | | Investment Adviser | | Distributor | | Auditors |
| 11 Greenway Plaza, Suite 1000 | | Invesco Advisers, Inc. | | Invesco Distributors, Inc. | | PricewaterhouseCoopers LLP |
| Houston, TX 77046-1173 | | 1555 Peachtree Street, N.E. | | 11 Greenway Plaza, Suite 1000 | | 1000 Louisiana Street, Suite 5800 |
| | Atlanta, GA 30309 | | Houston, TX 77046-1173 | | Houston, TX 77002-5678 |
| | | |
| Counsel to the Fund | | Counsel to the Independent Trustees | | Transfer Agent | | Custodian |
| Stradley Ronon Stevens & Young, LLP | | Goodwin Procter LLP | | Invesco Investment Services, Inc. | | State Street Bank and Trust Company |
| 2005 Market Street, Suite 2600 | | 901 New York Avenue, N.W. | | 11 Greenway Plaza, Suite 1000 | | 225 Franklin Street |
| Philadelphia, PA 19103-7018 | | Washington, D.C. 20001 | | Houston, TX 77046-1173 | | Boston, MA 02110-2801 |
| | |
| T-7 | | Invesco Global Small & Mid Cap Growth Fund |
(This page intentionally left blank)

Go paperless with eDelivery
Visit invesco.com/edelivery to enjoy the convenience and security of anytime electronic access to your investment documents.
With eDelivery, you can elect to have any or all of the following materials delivered straight to your inbox to download, save and print from your own computer:
∎ Fund reports and prospectuses
∎ Quarterly statements
∎ Daily confirmations
∎ Tax forms
Invesco mailing information
Send general correspondence to Invesco Investment Services, Inc., P.O. Box 219078, Kansas City, MO 64121-9078.
Important notice regarding delivery of security holder documents
To reduce Fund expenses, only one copy of most shareholder documents may be mailed to shareholders with multiple accounts at the same address (Householding). Mailing of your shareholder documents may be householded indefinitely unless you instruct us otherwise. If you do not want the mailing of these documents to be combined with those for other members of your household, please contact Invesco Investment Services, Inc. at 800 959 4246 or contact your financial institution. We will begin sending you individual copies for each account within 30 days after receiving your request.
Fund holdings and proxy voting information
The Fund provides a complete list of its holdings four times in each fiscal year, at the quarter-ends. For the second and fourth quarters, the list appears in the Fund’s semiannual and annual reports to shareholders. For the first and third quarters, the Fund files the lists with the Securities and Exchange Commission (SEC) as an exhibit to its reports on FormN-PORT. The most recent list of portfolio holdings is available at invesco.com/completeqtrholdings. Shareholders can also look up the Fund’s FormN-PORT filings on the SEC website, sec.gov. The SEC file numbers for the Fund are shown below.
A description of the policies and procedures that the Fund uses to determine how to vote proxies relating to portfolio securities is available without charge, upon request, from our Client Services department at 800 959 4246, or at invesco.com/proxyguidelines. The information is also available on the SEC website, sec.gov.
| | |
| Information regarding how the Fund voted proxies related to its portfolio securities during the most recent12-month period ended June 30 is available at invesco.com/proxysearch. This information is also available on the SEC website, sec.gov. | | |
| Invesco Advisers, Inc. is an investment adviser; it provides investment advisory services to individual and institutional clients and does not sell securities. Invesco Distributors, Inc. is the US distributor for Invesco Ltd.’s retail mutual funds, exchange-traded funds and institutional money market funds. Both are wholly owned, indirect subsidiaries of Invesco Ltd. |
| | | | |
| SEC file numbers:811-06463 and033-44611 | | Invesco Distributors, Inc. | | GSMG-AR-1 |
| | | | |
| | |

| | Annual Report to Shareholders | | October 31, 2019 |
| | Invesco International Core Equity Fund |
| | Nasdaq: | | |
| | A: IBVAX∎ C: IBVCX∎ R: IIBRX∎ Y: IBVYX∎ Investor: IIBCX∎ R5: IBVIX∎ R6: IBVFX |

Letters to Shareholders
| | |

Andrew Schlossberg | | Dear Shareholders: This annual report includes information about your Fund, including performance data and a complete list of its investments as of the close of the reporting period. Inside is a discussion of how your Fund was managed and the factors that affected its performance during the reporting period. Despite marked market volatility along the way, most global equity markets produced solid gains for the reporting period. As the reporting period unfolded in the final months of 2018, global equities were reeling from a sharpsell-off. The catalyst for thesell-off was a combination of ongoing trade concerns between the US and China, fears of a global economic slowdown and lower oil prices from a supply glut. Gains posted earlier in 2018 for global equities were erased, while US Treasury bonds, along with government and municipal bonds, rallied as investors fled to “safe haven” assets. |
At the start of 2019, global equity markets rebounded strongly buoyed by more policy from central banks and optimism about a potentialUS-China trade deal. In May,US-China trade concerns and slowing global growth led to a global equitysell-off and rally in US Treasuries. Despite the Maysell-off, domestic equity markets rallied in June in anticipation of a US Federal Reserve (the Fed) interest rate cut and closed the second quarter with modest gains. ContinuedUS-China trade worries and signs of slowing global economic growth left global equity markets largely flat for the third quarter. As the reporting period came to a close in October 2019, a raft of upbeat positive corporate earnings results and a US interest rate cut buoyed domestic equity results with some domestic indices recording record highs.
The Fed, in fact, both raised and lowered the federal funds rate during the reporting period. Given signs of a strong economy, the Fed raised rates in December 2018. In 2019, however, the Fed altered its outlook on further rate hikes leaving rates unchanged for the first half of the year. In July, the Fed lowered interest rates for the first time in 11 years. It again lowered rates in September and once again in October. As the year continues to unfold, we’ll see how the interplay of interest rates, economic data, geopolitics and a host of other factors affect US and overseas equity and fixed income markets.
Investor uncertainty and market volatility, such as we witnessed during the reporting period, are unfortunate facts of life when it comes to investing. That’s why Invesco encourages investors to work with a professional financial adviser who can stress the importance of starting to save and invest early and the importance of adhering to a disciplined investment plan. A financial adviser who knows your unique financial situation, investment goals and risk tolerance can be an invaluable partner as you seek to achieve your financial goals. He or she can offer a long-term perspective when markets are volatile and time-tested advice and guidance when your financial situation or investment goals change.
Visit our website for more information on your investments
Our website, invesco.com/us, offers a wide range of market insights and investment perspectives. On the website, you’ll find detailed information about our funds, including performance, holdings and portfolio manager commentaries. You can access information about your account by completing a simple, secure online registration. To do so, select “Log In” on the right side of the homepage, and then select “Register for Individual Account Access.”
In addition to the resources accessible on our website and through our mobile app, you can obtain timely updates to help you stay informed about the markets and the economy by connecting with Invesco on Twitter, LinkedIn or Facebook. You can access our blog at blog.invesco.us.com. Our goal is to provide you the information you want, when and where you want it.
Finally, I’m pleased to share with you Invesco’s commitment to both the Principles for Responsible Investment and to considering environmental, social and governance issues in our robust investment process. I invite you to learn more at invesco.com/esg.
Have questions?
For questions about your account, contact an Invesco client services representative at 800 959 4246.
All of us at Invesco look forward to serving your investment management needs. Thank you for investing with us.
Sincerely,

Andrew Schlossberg
Head of the Americas,
Senior Managing Director, Invesco Ltd.
2 Invesco International Core Equity Fund
| | |
 | | Dear Shareholders: Among the many important lessons I’ve learned in more than 40 years in a variety of business endeavors is the value of a trusted advocate. As independent chair of the Invesco Funds Board, I can assure you that the members of the Board are strong advocates for the interests of investors in Invesco’s mutual funds. We work hard to represent your interests through oversight of the quality of the investment management services your funds receive and other matters important to your investment, including but not limited to: |
| Bruce Crockett | | ∎ Ensuring that Invesco offers a diverse lineup of mutual funds that your financial adviser can use to strive to meet your financial needs as your investment goals change over time. ∎ Monitoring how the portfolio management teams of the Invesco funds are performing in light |
| | of changing economic and market conditions. |
| ∎ | Assessing each portfolio management team’s investment performance within the context of the investment strategy described in the fund’s prospectus. |
| ∎ | Monitoring for potential conflicts of interests that may impact the nature of the services that your funds receive. |
We believe one of the most important services we provide our fund shareholders is the annual review of the funds’ advisory andsub-advisory contracts with Invesco Advisers and its affiliates. This review is required by the Investment Company Act of 1940 and focuses on the nature and quality of the services Invesco provides as the adviser to the Invesco funds and the reasonableness of the fees that it charges for those services. Each year, we spend months carefully reviewing information received from Invesco and a variety of independent sources, such as performance and fee data prepared by Lipper, Inc. (a subsidiary of Broadridge Financial Solutions, Inc.), an independent, third-party firm widely recognized as a leader in its field. We also meet with our independent legal counsel and other independent advisers to review and help us assess the information that we have received. Our goal is to assure that you receive quality investment management services for a reasonable fee.
I trust the measures outlined above provide assurance that you have a worthy advocate when it comes to choosing the Invesco Funds.
On behalf of the Board, we look forward to continuing to represent your interests and serving your needs.
Sincerely,

Bruce L. Crockett
Independent Chair
Invesco Funds Board of Trustees
3 Invesco International Core Equity Fund
Management’s Discussion of Fund Performance
| | | | |
Performance summary For the fiscal year ended October 31, 2019, Class A shares of Invesco International Core Equity Fund (the Fund), at net asset value (NAV), underperformed the MSCI EAFE® Index, the Fund’s broad market/style-specific benchmark. Your Fund’s long-term performance appears later in this report. | |
| |
Fund vs. Indexes | |
Total returns, October 31, 2018 to October 31, 2019, at net asset value (NAV). Performance shown does not include applicable contingent deferred sales charges (CDSC) or front-end sales charges, which would have reduced performance. | |
| |
Class A Shares | | | 9.74 | % |
Class C Shares | | | 8.98 | |
Class R Shares | | | 9.52 | |
Class Y Shares | | | 10.09 | |
Investor Class Shares | | | 9.77 | |
Class R5 Shares | | | 10.04 | |
Class R6 Shares | | | 10.04 | |
MSCI EAFE Indexq (Broad Market/Style-specific Index) | | | 11.04 | |
Lipper International Large-Cap Core Funds Index⬛ (Peer Group Index) | | | 8.40 | |
| | |
Source(s):qRIMES Technologies Corp.;⬛ Lipper Inc. | | | | |
Market conditions and your Fund
The fiscal year began with global equity markets, particularly the US, declining sharply at the end of 2018 amid rising interest rates, a flattening US Treasury yield curve, signaling a possible recession, and concerns that higher inflation could result in a more restrictive monetary policy. Investors also had concerns over the Brexit negotiations, ongoing trade tensions between the US and China, declining oil prices and fears of slowing economic growth, particularly in the eurozone.
After a relatively calm start at the beginning of 2019, global equity markets faced greater volatility in the second quarter, hampered by ongoing US and China trade issues, potential for new tariffs and slowing global economic growth. Global equity markets, particularly China, declined sharply in May 2019, ending a four-month rally. Trade and tariff issues,
which were not limited to the US and China, clouded the outlook for many global economies. Disagreement within the UK about its withdrawal from the European Union increased uncertainty for the UK and eurozone economies. Following better performance in June, most global equity markets managed modest positive returns for the second quarter of 2019, with developed markets generally outperforming emerging markets. China was an exception, declining during the second quarter.
Weakening global economic data and the ongoing US and China trade conflict contributed to higher market volatility in the third quarter of 2019. During the third quarter, data released showed slowing manufacturing activity and declining business investment, which was evidence that trade tensions were stifling economic growth across both developed and emerging markets. Global recession concerns caused a sharp equity sell-off in
August 2019 as investors crowded into asset classes perceived as safe havens, including US Treasuries and gold. In September 2019, both the US Federal Reserve and European Central Bank cut interest rates, providing a measure of support for risk assets. Growing optimism about a potential trade deal between the US and China also boosted equities in September. However, except for the US and Japan, performance in most regions declined during the third quarter. Uncertainty about the UK’s withdrawal from the European Union continued to weigh on UK and European equities, while political and trade issues affected areas of Latin America and Asia.
Global equity markets gained in October 2019 amid several positive catalysts, including a US interest rate cut, optimism surrounding US and China trade negotiations, and a raft of upbeat corporate results. The UK equity market provided a flat return during October and while domestic politics continued to dominate the region, European markets made modest gains. October was also a positive month for emerging equity markets with all regions recording gains. Despite increased market volatility, global equity indexes, in both developed and emerging markets, ended the fiscal year in positive territory.
The Fund’s investment philosophy seeks to identify differentiated views on changes impacting companies, over a long investment horizon, and across all markets and all sectors. Most notably, during the past fiscal year, our bottom-up fundamental research identified the most differentiated views in a number of unpopular sectors, from the materials sector to the health care sector. Perhaps driven by the sharp market decline in December 2018, or the macroeconomic issues mentioned above, global investors seemed to prefer safety over
| | | | |
| |
Portfolio Composition | |
By sector | | | % of total net assets | |
| | | | |
| |
Financials | | | 18.97 | % |
Industrials | | | 15.04 | |
Health Care | | | 10.58 | |
Information Technology | | | 10.44 | |
Communication Services | | | 9.58 | |
Consumer Staples | | | 9.35 | |
Materials | | | 9.09 | |
Consumer Discretionary | | | 7.15 | |
Energy | | | 5.90 | |
Utilities | | | 2.51 | |
Unknown G1 | | | (0.00 | ) |
Money Market Funds Plus Other Assets Less Liabilities | | | 1.39 | |
| | | | |
| |
Top 10 Equity Holdings* | |
% of total net assets | |
1. SAP S.E. | | | 3.75 | % |
2. Royal Dutch Shell PLC, Class A, ADR | | | 3.47 | |
3. Novartis AG, ADR | | | 3.28 | |
4. Hitachi, Ltd. | | | 2.89 | |
5. BNP Paribas S.A. | | | 2.82 | |
6. Asahi Group Holdings, Ltd. | | | 2.80 | |
7. KDDI Corp. | | | 2.76 | |
8. Sanofi S.A. | | | 2.75 | |
9. Siemens AG | | | 2.75 | |
10. ING Groep N.V. | | | 2.75 | |
| | | | |
| | |
Total Net Assets | | $ | 67.4 million | |
Total Number of Holdings* | | | 55 | |
The Fund’s holdings are subject to change, and there is no assurance that the Fund will continue to hold any particular security.
*Excluding money market fund holdings, if any.
Data presented here are as of October 31, 2019.
4 Invesco International Core Equity Fund
economic growth in both equities and other asset classes (bonds), and according to our fundamental research, left behind unusually attractive opportunities in economically-sensitive sectors in most parts of the world. One example of our research conviction at work is the Fund’s materials sector weighting, which increased during the year to 9% and remaining above the broad market/style-specific benchmark’s 7% weighting.
During the fiscal year, stock selection in the information technology (IT), utilities and consumer discretionary sectors contributed to the Fund’s performance relative to its broad market/style-specific benchmark. Stock selection in the materials sector was the largest detractor from relative performance. Stock selection in the consumer staples and communication services sectors also hampered relative results.
We believe – as part of our investment approach – that equity valuations know no boundary, and indeed, the fiscal year showed our ability to identify opportunities in a wide range of sectors and countries.
From a geographic perspective, holdings in Italy, France and the US were among the strongest contributors to the Fund’s performance versus the broad market/style-specific benchmark for the fiscal year. Regionally, favorable stock selection came from Asia, Europe and the Americas. In addition, stock selection in the utilities, financials, health care, consumer discretionary and communication services sectors contributed to the Fund’s relative performance. Conversely, holdings in the UK and China detracted from the Fund’s relative performance. On a sector basis, stock selection in the consumer staples and materials sectors detracted from the Fund’s relative results. As a result of weak performance in several stocks in the materials sector during the fiscal year, we capitalized on the opportunity to increase the Fund’s weighting across the sector, making it one of the larger overweight exposures versus the Fund’s broad market/style-specific benchmark at fiscalyear-end.
During the fiscal year, the largest contributor to the Fund’s performance wasEnel.This Italian energy company, which has a growing dividend yield of almost five percent, experienced a strong bounceback as management’s restructuring of its sprawling Latam operations contributed to improved earnings. In addition, investors began to increasingly appreciate the power of Enel’s renewable energy portfolio, with over 40% of Enel’s
capital expenditures focused on this growth area.
SAP,a European software company, performed well during the fiscal year. Investors’ confidence was strengthened by the company’s management forecast. We believe SAP demonstrates strong financial performance, and changes in the underlying technology infrastructure and in the company’s set of software solutions will continue to drive absolute growth, reduce growth volatility and raise margins over time.
AIA Group,an Asian life insurer, was another strong contributor over the fiscal year. While the company experienced some volatility in the latter part of the fiscal year due to the protests in Hong Kong, the stock generated significant returns. With itstop-tier management team and unique market position across Asia, the company offers strong secular growth opportunities for the Fund at an attractive valuation. We believe it offers favorable asymmetry in terms of upside opportunity versus downside risk.
During the fiscal year, the largest detractor from the Fund’s performance was Chinese technology companyBaidu.The company’s results showed that its core search business grew much slower than the market expected. We exited the position before the close of the fiscal year, as we questioned the validity of our differentiated thesis for the stock.
European industrial companyArcelorMittalalso detracted from the Fund’s performance during the fiscal year. The company was impacted by data suggesting a global slowdown, particularly in China. However, our conviction in the upside of ArcelorMittal remains intact and we took the opportunity to increase our holdings throughout the fiscal year. At the close of the fiscal year, our view of ArcelorMittal was favorable.Bottom-up fundamentals, easing raw materials costs, increasing free cash flow and significant positives on the environmental, social and governance front – including the world’s least carbon emitting steel plant powered 71% by renewable energy – is likely to continue to drive investor confidence in the stock.
As our investment philosophy indicates, the majority of our portfolio risk(s) comes from stock-specific risk, not country or sector risks. At the close of the fiscal year, and relative to the broad market/style specific benchmark, the Fund maintained slight overweight exposures to the materials, communication services, IT and the industrials sectors. Conversely, the Fund’s most notable un-
derweight position were in the consumer staples sector. Regionally, the held underweight exposure to the UK is relative to the broad market/style-specific benchmark.
Following our mandate, we continue to focus on mitigating risk and providing investors with a high-conviction investment strategy focused onbottom-up company research.
Thank you for your investment in Invesco International Core Equity Fund.
Portfolio managers:
Erik Esselink
Jeffrey Everett
Bert van der Walt
The views and opinions expressed in management’s discussion of Fund performance are those of Invesco Advisers, Inc. These views and opinions are subject to change at any time based on factors such as market and economic conditions. These views and opinions may not be relied upon as investment advice or recommendations, or as an offer for a particular security. The information is not a complete analysis of every aspect of any market, country, industry, security or the Fund. Statements of fact are from sources considered reliable, but Invesco Advisers, Inc. makes no representation or warranty as to their completeness or accuracy. Although historical performance is no guarantee of future results, these insights may help you understand our investment management philosophy.
See important Fund and, if applicable, index disclosures later in this report.
5 Invesco International Core Equity Fund
Your Fund’s Long-Term Performance
Results of a $10,000 Investment – Oldest Share Class(es)
Fund and index data from 10/31/09
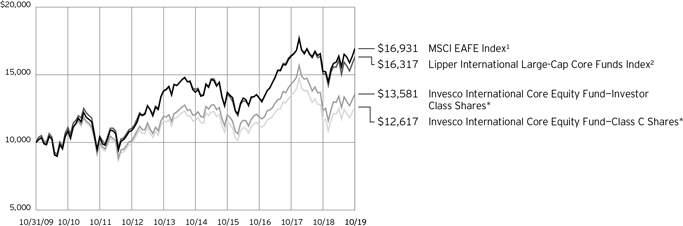
1 Source: RIMES Technologies Corp.
2 Source: Lipper Inc.
*The Fund’s oldest share class (Investor) does not have a sales charge; therefore, the second-oldest share class with a sales charge (Class C) is also included in the chart.
Past performance cannot guarantee comparable future results.
The data shown in the chart include reinvested distributions, applicable sales charges and Fund expenses including
management fees. Index results include reinvested dividends, but they do not reflect sales charges. Performance of the peer group, if applicable, reflects fund expenses and management fees; perfor-
mance of a market index does not. Performance shown in the chart does not reflect deduction of taxes a shareholder would pay on Fund distributions or sale of Fund shares.
6 Invesco International Core Equity Fund
| | | | |
| | |
Average Annual Total Returns | | | | |
| As of 10/31/19, including maximum applicable sales charges | |
| | |
Class A Shares | | | | |
| | |
Inception (3/28/02) | | | 3.59 | % |
10 Years | | | 2.54 | |
5 Years | | | 1.28 | |
1 Year | | | 3.67 | |
| | |
Class C Shares | | | | |
| | |
Inception (2/14/00) | | | 2.04 | % |
10 Years | | | 2.35 | |
5 Years | | | 1.66 | |
1 Year | | | 7.98 | |
| | |
Class R Shares | | | | |
| | |
Inception (11/24/03) | | | 4.11 | % |
10 Years | | | 2.86 | |
5 Years | | | 2.17 | |
1 Year | | | 9.52 | |
| | |
Class Y Shares | | | | |
| | |
Inception (10/3/08) | | | 3.44 | % |
10 Years | | | 3.38 | |
5 Years | | | 2.69 | |
1 Year | | | 10.09 | |
| | |
Investor Class Shares | | | | |
| | |
Inception (10/28/98) | | | 3.38 | % |
10 Years | | | 3.11 | |
5 Years | | | 2.42 | |
1 Year | | | 9.77 | |
| | |
Class R5 Shares | | | | |
| | |
Inception (4/30/04) | | | 4.37 | % |
10 Years | | | 3.61 | |
5 Years | | | 2.78 | |
1 Year | | | 10.04 | |
| | |
Class R6 Shares | | | | |
10 Years | | | 3.42 | % |
5 Years | | | 2.79 | |
1 Year | | | 10.04 | |
| | | | |
| | |
Average Annual Total Returns | | | | |
| As of 9/30/19, the most recent calendar quarter end ,including maximum applicable sales charges | |
| | |
Class A Shares | | | | |
| | |
Inception (3/28/02) | | | 3.41 | % |
10 Years | | | 2.01 | |
5 Years | | | 0.67 | |
1 Year | | | -9.35 | |
| | |
Class C Shares | | | | |
| | |
Inception (2/14/00) | | | 1.88 | % |
10 Years | | | 1.81 | |
5 Years | | | 1.04 | |
1 Year | | | -5.71 | |
| | |
Class R Shares | | | | |
| | |
Inception (11/24/03) | | | 3.92 | % |
10 Years | | | 2.33 | |
5 Years | | | 1.55 | |
1 Year | | | -4.35 | |
| | |
Class Y Shares | | | | |
| | |
Inception (10/3/08) | | | 3.15 | % |
10 Years | | | 2.84 | |
5 Years | | | 2.05 | |
1 Year | | | -3.90 | |
| | |
Investor Class Shares | | | | |
| | |
Inception (10/28/98) | | | 3.23 | % |
10 Years | | | 2.59 | |
5 Years | | | 1.81 | |
1 Year | | | -4.11 | |
| | |
Class R5 Shares | | | | |
| | |
Inception (4/30/04) | | | 4.17 | % |
10 Years | | | 3.07 | |
5 Years | | | 2.15 | |
1 Year | | | -3.91 | |
| | |
Class R6 Shares | | | | |
10 Years | | | 2.89 | % |
5 Years | | | 2.15 | |
1 Year | | | -3.83 | |
on expenses incurred during the period covered by this report.
Class A share performance reflects the maximum 5.50% sales charge, and Class C share performance reflects the applicable contingent deferred sales charge (CDSC) for the period involved. The CDSC on Class C shares is 1% for the first year after purchase. Class R, Class Y, Investor Class, Class R5 and Class R6 shares do not have afront-end sales charge or a CDSC; therefore, performance is at net asset value.
The performance of the Fund’s share classes will differ primarily due to different sales charge structures and class expenses.
Fund performance reflects any applicable fee waivers and/or expense reimbursements. Had the adviser not waived fees and/or reimbursed expenses currently or in the past, returns would have been lower. See current prospectus for more information.
| 1 | Total annual Fund operating expenses after any contractual fee waivers and/or expense reimbursements by the adviser in effect through at least February 28, 2021. See current prospectus for more information. |
Class R6 shares incepted on September 24, 2012. Performance shown prior to that date is that of Investor Class shares and includes the12b-1 fees applicable to Investor Class shares.
The performance data quoted represent past performance and cannot guarantee comparable future results; current performance may be lower or higher. Please visit invesco.com/ performance for the most recentmonth-end performance. Performance figures reflect reinvested distributions, changes in net asset value and the effect of the maximum sales charge unless otherwise stated. Performance figures do not reflect deduction of taxes a shareholder would pay on Fund distributions or sale of Fund shares. Investment return and principal value
will fluctuate so that you may have a gain or loss when you sell shares.
The net annual Fund operating expense ratio set forth in the most recent Fund prospectus as of the date of this report for Class A, Class C, Class R, Class Y, Investor Class, Class R5 and Class R6 shares was 1.12%, 1.87%, 1.37%, 0.87%, 1.12%, 0.87% and 0.87%, respectively.1 The total annual Fund operating expense ratio set forth in the most recent Fund prospectus as of the date of this report for Class A, Class C, Class R, Class Y, Investor Class, Class R5 and Class R6 shares was 1.67%, 2.42%, 1.92%, 1.42%, 1.67%, 1.15% and 1.15%, respectively. The expense ratios presented above may vary from the expense ratios presented in other sections of this report that are based
7 Invesco International Core Equity Fund
Invesco International Core Equity Fund’s investment objective is long-term growth of capital.
∎ Unless otherwise stated, information presented in this report is as of October 31, 2019, and is based on total net assets.
∎ Unless otherwise noted, all data provided by Invesco.
∎ To access your Fund’s reports/prospectus, visit invesco.com/fundreports.
About share classes
| ∎ | Class R sharesare generally available only to employer sponsored retirement and benefit plans. Please see the prospectus for more information. |
| ∎ | Class Y sharesandInvestor Class shares are available only to certain investors. Please see the prospectus for more information. |
| ∎ | Class R5 sharesandClass R6 sharesare available for use by retirement plans that meet certain standards and for institutional investors. Class R6 shares are also available through intermediaries that have established an agreement with Invesco Distributors, Inc. to make such shares available for use in retail omnibus accounts. Please see the prospectus for more information. |
Principal risks of investing in the Fund
| ∎ | Depositary receipts risk.Investing in depositary receipts involves the same risks as direct investments in foreign securities. In addition, the underlying issuers of certain depositary receipts are under no obligation to distribute shareholder communications or pass through any voting rights with respect to the deposited securities to the holders of such receipts. The Fund may therefore receive less timely information or have less control than if it invested directly in the foreign issuer. |
| ∎ | Derivatives risk.The value of a derivative instrument depends largely on (and is derived from) the value of an underlying security, currency, commodity, interest rate, index or other asset (each referred to as an underlying asset). In addition to risks relating to the underlying assets, the use of derivatives may include other, possibly greater, risks, including counterparty, leverage and liquidity risks. Counterparty risk is the risk that the counterparty to the derivative contract will default on its obligation to pay the Fund the amount owed or |
| | otherwise perform under the derivative contract. Derivatives create leverage risk because they do not require payment up front equal to the economic exposure created by holding a position in the derivative. As a result, an adverse change in the value of the underlying asset could result in the Fund sustaining a loss that is substantially greater than the amount invested in the derivative or the anticipated value of the underlying asset, which may make the Fund’s returns more volatile and increase the risk of loss. Derivative instruments may also be less liquid than more traditional investments and the Fund may be unable to sell or close out its derivative positions at a desirable time or price. This risk may be more acute under adverse market conditions, during which the Fund may be most in need of liquidating its derivative positions. Derivatives may also be harder to value, less tax efficient and subject to changing government regulation that could impact the Fund’s ability to use certain derivatives or their cost. Derivatives strategies may not always be successful. For example, derivatives used for hedging or to gain or limit exposure to a particular market segment may not provide the expected benefits, particularly during adverse market conditions. |
| ∎ | Emerging markets securities risk. Emerging markets (also referred to as developing markets) are generally subject to greater market volatility, political, social and economic instability, uncertain trading markets and more governmental limitations on foreign investment than more developed markets. In addition, companies operating in emerging markets may be subject to lower trading volume and greater price fluctuations than companies in more developed markets. Securities law and the enforcement of systems of taxation in many emerging market countries may change quickly and unpredictably. The Fund’s investments in ChinaA-shares are subject |
| | to trading restrictions, quota limitations and clearing and settlement risks. In addition, investments in emerging markets securities may be subject to additional transaction costs, delays in settlement procedures, and lack of timely information. |
| ∎ | Foreign securities risk.The Fund’s foreign investments may be adversely affected by political and social instability, changes in economic or taxation policies, difficulty in enforcing obligations, decreased liquidity or increased volatility. Foreign investments also involve the risk of the possible seizure, nationalization or expropriation of the issuer or foreign deposits (in which the Fund could lose its entire investments in a certain market) and the possible adoption of foreign governmental restrictions such as exchange controls. Unless the Fund has hedged its foreign securities risk, foreign securities risk also involves the risk of negative foreign currency rate fluctuations, which may cause the value of securities denominated in such foreign currency (or other instruments through which the Fund has exposure to foreign currencies) to decline in value. Currency exchange rates may fluctuate significantly over short periods of time. Currency hedging strategies, if used, are not always successful. |
| ∎ | Geographic focus risk.The Fund may from time to time invest a substantial amount of its assets in securities of issuers located in a single country or a limited number of countries. Adverse economic, political or social conditions in those countries may therefore have a significant negative impact on the Fund’s investment performance. |
| ∎ | Investing in the European Union risk. Investments in certain countries in the European Union are susceptible to high economic risks associated with high levels of debt, such as investments in sovereign debt of Greece, Italy and Spain. Efforts of the member states to further unify their economic and monetary policies may increase |
| | |
This report must be accompanied or preceded by a currently effective Fund prospectus, which contains more complete information, including sales charges and expenses. Investors should read it carefully before investing. | | |
NOT FDIC INSURED | MAY LOSE VALUE | NO BANK GUARANTEE
8 Invesco International Core Equity Fund
| | the potential for the downward movement of one member state’s market to cause a similar effect on other member states’ markets. Separately, the European Union faces issues involving its membership, structure, procedures and policies. The exit of one or more member states from the European Union, such as the United Kingdom (UK) which has announced its intention to exit, would place its currency and banking system in jeopardy. The exit by the UK or other member states will likely result in increased volatility, illiquidity and potentially lower economic growth in the affected markets, which will adversely affect the Fund’s investments. |
| ∎ | Management risk.The Fund is actively managed and depends heavily on the Adviser’s judgment about markets, interest rates or the attractiveness, relative values, liquidity, or potential appreciation of particular investments made for the Fund’s portfolio. The Fund could experience losses if these judgments prove to be incorrect. Additionally, legislative, regulatory, or tax developments may adversely affect management of the Fund and, therefore, the ability of the Fund to achieve its investment objective. |
| ∎ | Market risk.The market values of the Fund’s investments, and therefore the value of the Fund’s shares, will go up and down, sometimes rapidly or unpredictably. Market risk may affect a single issuer, industry or section of the economy, or it may affect the market as a whole. Individual stock prices tend to go up and down more dramatically than those of certain other types of investments, such as bonds. During a general downturn in the financial markets, multiple asset classes may decline in value. When markets perform well, there can be no assurance that specific investments held by the Fund will rise in value. |
| ∎ | Preferred securities risk.Preferred securities are subject to issuer-specific and market risks applicable generally to equity securities. Preferred securities also may be subordinated to bonds or other debt instruments, subjecting them to a greater risk ofnon-payment, may be less liquid than many other securities, such as common stocks, and generally offer no voting rights with respect to the issuer. |
| ∎ | Small- andmid-capitalization companies risks.Small- andmid-capitalization companies tend to be |
| | more vulnerable to changing market conditions, may have little or no operating history or track record of success, and may have more limited product lines and markets, less experienced management and fewer financial resources than larger companies. These companies’ securities may be more volatile and less liquid than those of more established companies, and their returns may vary, sometimes significantly, from the overall securities market. |
About indexes used in this report
| ∎ | TheMSCI EAFE® Indexis an unmanaged index considered representative of stocks of Europe, Australasia and the Far East. The index is computed using the net return, which withholds applicable taxes fornon-resident investors. |
| ∎ | TheLipper InternationalLarge-Cap Core Funds Indexis an unmanaged index considered representative of internationallarge-cap core funds tracked by Lipper. |
| ∎ | The Fund is not managed to track the performance of any particular index, including the index(es) described here, and consequently, the performance of the Fund may deviate significantly from the performance of the index(es). |
| ∎ | A direct investment cannot be made in an index. Unless otherwise indicated, index results include reinvested dividends, and they do not reflect sales charges. Performance of the peer group, if applicable, reflects fund expenses; performance of a market index does not. |
Other information
| ∎ | The returns shown in management’s discussion of Fund performance are based on net asset values (NAVs) calculated for shareholder transactions. Generally accepted accounting principles require adjustments to be made to the net assets of the Fund at period end for financial reporting purposes, and as such, the NAVs for shareholder transactions and the returns based on those NAVs may differ from the NAVs and returns reported in the Financial Highlights. |
| ∎ | Industry classifications used in this report are generally according to the Global Industry Classification Standard, which was developed by and is the exclusive property and a service mark of MSCI Inc. and Standard & Poor’s. |
9 Invesco International Core Equity Fund
Schedule of Investments
October 31, 2019
| | | | | | | | |
| | | Shares | | | Value | |
Common Stocks & Other Equity Interests–98.62% | |
| | |
Argentina–0.47% | | | | | | | | |
| | |
MercadoLibre, Inc.(a) | | | 609 | | | $ | 317,606 | |
| |
Australia–6.13% | | | | | |
| | |
Ansell Ltd. | | | 71,352 | | | | 1,354,679 | |
| | |
Brambles Ltd. | | | 124,661 | | | | 1,026,608 | |
| | |
Rio Tinto plc | | | 17,675 | | | | 918,295 | |
Woodside Petroleum Ltd. | | | 37,747 | | | | 832,342 | |
| | | | | | | | 4,131,924 | |
| |
Belgium–1.69% | | | | | |
| | |
Umicore S.A. | | | 27,586 | | | | 1,138,759 | |
| |
Brazil–0.54% | | | | | |
| | |
Pagseguro Digital Ltd., Class A(a) | | | 9,781 | | | | 362,679 | |
| |
Canada–1.19% | | | | | |
| | |
Suncor Energy, Inc. | | | 27,046 | | | | 804,131 | |
| |
China–1.24% | | | | | |
| | |
China International Capital Corp. Ltd.,
H Shares(b) | | | 462,000 | | | | 837,448 | |
| |
Denmark–1.33% | | | | | |
| | |
Novo Nordisk A/S, Class B | | | 16,236 | | | | 893,925 | |
| |
France–13.00% | | | | | |
| | |
Airbus S.E. | | | 7,333 | | | | 1,050,878 | |
| | |
BNP Paribas S.A. | | | 36,375 | | | | 1,900,373 | |
| | |
Cie Generale des Etablissements
Michelin SCA | | | 9,348 | | | | 1,138,153 | |
| | |
Dassault Systemes S.E. | | | 6,414 | | | | 975,680 | |
| | |
Sanofi S.A. | | | 20,157 | | | | 1,858,127 | |
Vivendi S.A. | | | 65,916 | | | | 1,837,942 | |
| | | | | | | | 8,761,153 | |
| |
Germany–9.73% | | | | | |
| | |
Infineon Technologies AG | | | 62,898 | | | | 1,226,710 | |
| | |
Muenchener Rueckversicherungs-
Gesellschaft AG | | | 3,420 | | | | 949,914 | |
| | |
SAP S.E. | | | 19,070 | | | | 2,526,019 | |
Siemens AG | | | 16,092 | | | | 1,856,188 | |
| | | | | | | | 6,558,831 | |
| |
Hong Kong–2.71% | | | | | |
| | |
AIA Group Ltd. | | | 184,200 | | | | 1,827,717 | |
| |
India–0.72% | | | | | |
| | |
Housing Development Finance Corp.
Ltd. | | | 16,165 | | | | 485,616 | |
| |
Ireland–2.10% | | | | | |
| | |
Ryanair Holdings PLC, ADR(a) | | | 18,924 | | | | 1,412,487 | |
| | | | | | | | |
| | | Shares | | | Value | |
Italy–4.09% | | | | | | | | |
| | |
Enel S.p.A. | | | 218,899 | | | $ | 1,695,078 | |
Prysmian S.p.A. | | | 45,806 | | | | 1,058,716 | |
| | | | | | | | 2,753,794 | |
| |
Japan–20.57% | | | | | |
| | |
Asahi Group Holdings, Ltd. | | | 37,700 | | | | 1,886,795 | |
| | |
FANUC Corp. | | | 6,100 | | | | 1,204,172 | |
| | |
Hitachi, Ltd. | | | 52,200 | | | | 1,946,314 | |
| | |
KDDI Corp. | | | 67,200 | | | | 1,863,478 | |
| | |
Keisei Electric Railway Co., Ltd. | | | 28,800 | | | | 1,177,723 | |
| | |
Kobe Bussan Co., Ltd. | | | 6,100 | | | | 180,788 | |
| | |
Komatsu Ltd. | | | 48,693 | | | | 1,141,136 | |
| | |
Nissan Chemical Corp. | | | 10,300 | | | | 423,102 | |
| | |
ORIX Corp. | | | 107,000 | | | | 1,677,166 | |
| | |
Shimano, Inc. | | | 6,600 | | | | 1,098,334 | |
SoftBank Group Corp. | | | 32,800 | | | | 1,267,069 | |
| | | | | | | | 13,866,077 | |
| |
Luxembourg–1.55% | | | | | |
| | |
ArcelorMittal | | | 70,914 | | | | 1,047,561 | |
| |
Netherlands–4.15% | | | | | |
| | |
Heineken N.V. | | | 9,257 | | | | 944,599 | |
ING Groep N.V. | | | 163,997 | | | | 1,852,955 | |
| | | | | | | | 2,797,554 | |
| |
Singapore–1.44% | | | | | |
| | |
DBS Group Holdings Ltd. | | | 51,060 | | | | 973,682 | |
| |
Spain–1.87% | | | | | |
| | |
CaixaBank S.A. | | | 439,888 | | | | 1,259,234 | |
| |
Sweden–0.44% | | | | | |
| | |
SSAB AB, Class B | | | 118,422 | | | | 298,498 | |
| |
Switzerland–5.98% | | | | | |
| | |
Glencore PLC | | | 333,890 | | | | 1,007,394 | |
| | |
Lonza Group AG(a) | | | 2,257 | | | | 812,571 | |
Novartis AG, ADR | | | 25,318 | | | | 2,213,806 | |
| | | | | | | | 4,033,771 | |
| |
United Kingdom–11.61% | | | | | |
| | |
Experian PLC | | | 6,646 | | | | 209,057 | |
| | |
Just Eat PLC(a) | | | 51,959 | | | | 495,380 | |
| | |
Nomad Foods Ltd.(a) | | | 87,668 | | | | 1,710,403 | |
| | |
Reckitt Benckiser Group PLC | | | 20,411 | | | | 1,577,985 | |
| | |
Royal Dutch Shell PLC, Class A, ADR | | | 40,401 | | | | 2,342,046 | |
Vodafone Group PLC, ADR | | | 72,969 | | | | 1,490,027 | |
| | | | | | | | 7,824,898 | |
| |
United States–6.07% | | | | | |
| | |
Aptiv PLC | | | 9,561 | | | | 856,187 | |
See accompanying Notes to Financial Statements which are an integral part of the financial statements.
10 Invesco International Core Equity Fund
| | | | | | | | |
| | | Shares | | | Value | |
United States–(continued) | | | | | | | | |
| | |
Carnival PLC | | | 22,742 | | | $ | 910,921 | |
| | |
Chubb Ltd. | | | 6,735 | | | | 1,026,549 | |
| | |
James Hardie Industries PLC, CDI | | | 75,784 | | | | 1,296,612 | |
| | | | | | | | 4,090,269 | |
| |
Total Common Stocks & Other Equity Interests
(Cost $66,591,381) | | | | 66,477,614 | |
| | |
Money Market Funds–0.82% | | | | | | | | |
| | |
Invesco Government & Agency Portfolio,
Institutional Class, 1.71%(c) | | | 330,611 | | | | 330,611 | |
| | | | | | | | |
| | | Shares | | | Value | |
Money Market Funds–(continued) | | | | | |
| | |
Invesco Treasury Portfolio, Institutional Class, 1.66%(c) | | | 220,408 | | | $ | 220,408 | |
| |
Total Money Market Funds (Cost $551,019) | | | | 551,019 | |
| |
TOTAL INVESTMENTS IN SECURITIES–99.44%
(Cost $67,142,400) | | | | 67,028,633 | |
| |
OTHER ASSETS LESS LIABILITIES–0.56% | | | | 380,030 | |
| | |
NET ASSETS - 100.00% | | | | | | $ | 67,408,663 | |
Investment Abbreviations:
| ADR | - American Depositary Receipt |
| CDI | - CREST Depository Interest |
Notes to Schedule of Investments:
| (a) | Non-income producing security. |
| (b) | Security purchased or received in a transaction exempt from registration under the Securities Act of 1933, as amended (the “1933 Act”). The security may be resold pursuant to an exemption from registration under the 1933 Act, typically to qualified institutional buyers. The value of this security at October 31, 2019 represented 1.24% of the Fund’s Net Assets. |
| (c) | The money market fund and the Fund are affiliated by having the same investment adviser. The rate shown is the7-day SEC standardized yield as of October 31, 2019. |
| | | | | | | | | | | | | | | | |
| Open Forward Foreign Currency Contracts | |
| | | | |
| Settlement | | | | | | Contract to | | | Unrealized | |
| Date | | Counterparty | | | | Deliver | | | Receive | | | Appreciation | |
Currency Risk | | | | | | | | | | | | | | | | |
12/17/2019 | | Citibank N.A. | | | | | USD 2,311,155 | | | | GBP 1,850,000 | | | | $88,712 | |
Abbreviations:
| GBP | - British Pound Sterling |
See accompanying Notes to Financial Statements which are an integral part of the financial statements.
11 Invesco International Core Equity Fund
Statement of Assets and Liabilities
October 31, 2019
| | | | |
Assets: | | | | |
| |
Investments in securities, at value
(Cost $66,591,381) | | $ | 66,477,614 | |
| |
| |
Investments in affiliated money market funds, at value
(Cost $551,019) | | | 551,019 | |
| |
| |
Other investments: | | | | |
Unrealized appreciation on forward foreign currency contracts outstanding | | | 88,712 | |
| |
| |
Foreign currencies, at value (Cost $6,148) | | | 5,181 | |
| |
| |
Receivable for: | | | | |
Investments sold | | | 409,039 | |
| |
Dividends | | | 190,645 | |
| |
Fund shares sold | | | 5,730 | |
| |
Investment for trustee deferred compensation and retirement plans | | | 102,941 | |
| |
Other assets | | | 22,638 | |
| |
Total assets | | | 67,853,519 | |
| |
| |
Liabilities: | | | | |
| |
Payable for: | | | | |
Investments purchased | | | 170,902 | |
| |
Fund shares reacquired | | | 41,938 | |
| |
Accrued fees to affiliates | | | 49,448 | |
| |
Accrued trustees’ and officers’ fees and benefits | | | 1,385 | |
| |
Accrued other operating expenses | | | 69,700 | |
| |
| |
Trustee deferred compensation and retirement plans | | | 111,483 | |
| |
Total liabilities | | | 444,856 | |
| |
| |
Net assets applicable to shares outstanding | | $ | 67,408,663 | |
| |
| |
Net assets consist of: | | | | |
| |
Shares of beneficial interest | | $ | 70,326,751 | |
| |
| |
Distributable earnings (loss) | | | (2,918,088 | ) |
| |
| | | $67,408,663 | |
| |
| |
Net Assets: | | | | |
| |
Class A | | $ | 27,707,336 | |
| |
| |
Class C | | $ | 2,774,505 | |
| |
| |
Class R | | $ | 1,105,086 | |
| |
| |
Class Y | | $ | 4,465,280 | |
| |
| |
Investor Class | | $ | 8,886,351 | |
| |
| |
Class R5 | | $ | 3,281,752 | |
| |
| |
Class R6 | | $ | 19,188,353 | |
| |
| | | | |
Shares outstanding, no par value, with an unlimited number of shares authorized: | |
| |
Class A | | | 2,599,101 | |
| |
| |
Class C | | | 266,871 | |
| |
| |
Class R | | | 103,373 | |
| |
| |
Class Y | | | 410,825 | |
| |
| |
Investor Class | | | 818,703 | |
| |
| |
Class R5 | | | 309,858 | |
| |
| |
Class R6 | | | 1,812,370 | |
| |
Class A: | | | | |
Net asset value per share | | $ | 10.66 | |
| |
Maximum offering price per share
(Net asset value of $10.66 ÷ 94.50%) | | $ | 11.28 | |
| |
Class C: | | | | |
Net asset value and offering price per share | | $ | 10.40 | |
| |
Class R: | | | | |
Net asset value and offering price per share | | $ | 10.69 | |
| |
Class Y: | | | | |
Net asset value and offering price per share | | $ | 10.87 | |
| |
Investor Class: | | | | |
Net asset value and offering price per share | | $ | 10.85 | |
| |
Class R5: | | | | |
Net asset value and offering price per share | | $ | 10.59 | |
| |
Class R6: | | | | |
Net asset value and offering price per share | | $ | 10.59 | |
| |
See accompanying Notes to Financial Statements which are an integral part of the financial statements.
12 Invesco International Core Equity Fund
Statement of Operations
For the year ended October 31, 2019
| | | | |
Investment income: | | | | |
Dividends (net of foreign withholding taxes of $218,201) | | $ | 2,255,817 | |
| |
Dividends from affiliated money market funds (includes securities lending income of $3,635) | | | 20,908 | |
| |
Total investment income | | | 2,276,725 | |
| |
| |
Expenses: | | | | |
Advisory fees | | | 553,428 | |
| |
Administrative services fees | | | 17,131 | |
| |
Custodian fees | | | 16,235 | |
| |
Distribution fees: | | | | |
Class A | | | 82,400 | |
| |
Class C | | | 35,563 | |
| |
Class R | | | 6,404 | |
| |
Investor Class | | | 22,218 | |
| |
Transfer agent fees – A, C, R, Y and Investor | | | 164,511 | |
| |
Transfer agent fees – R5 | | | 131 | |
| |
Transfer agent fees – R6 | | | 638 | |
| |
Trustees’ and officers’ fees and benefits | | | 20,601 | |
| |
Registration and filing fees | | | 89,658 | |
| |
Reports to shareholders | | | 27,985 | |
| |
Professional services fees | | | 67,498 | |
| |
Other | | | 12,989 | |
| |
Total expenses | | | 1,117,390 | |
| |
Less: Fees waived, expenses reimbursed and/or expense offset arrangement(s) | | | (330,246 | ) |
| |
Net expenses | | | 787,144 | |
| |
Net investment income | | | 1,489,581 | |
| |
| |
Realized and unrealized gain (loss) from: | | | | |
Net realized gain (loss) from: | | | | |
Investment securities | | | (3,870,916 | ) |
| |
Foreign currencies | | | 37,664 | |
| |
Forward foreign currency contracts | | | (87,950 | ) |
| |
| | | (3,921,202 | ) |
| |
Change in net unrealized appreciation of: | | | | |
Investment securities | | | 9,459,785 | |
| |
Foreign currencies | | | 1,575 | |
| |
Forward foreign currency contracts | | | 88,712 | |
| |
| | | 9,550,072 | |
| |
Net realized and unrealized gain | | | 5,628,870 | |
| |
Net increase in net assets resulting from operations | | $ | 7,118,451 | |
| |
See accompanying Notes to Financial Statements which are an integral part of the financial statements.
13 Invesco International Core Equity Fund
Statement of Changes in Net Assets
For the years ended October 31, 2019 and 2018
| | | | | | | | |
| | | 2019 | | | 2018 | |
| |
Operations: | | | | | | | | |
| | |
Net investment income | | $ | 1,489,581 | | | $ | 1,331,792 | |
| |
Net realized gain (loss) | | | (3,921,202 | ) | | | 4,667,581 | |
| |
Change in net unrealized appreciation (depreciation) | | | 9,550,072 | | | | (17,061,626 | ) |
| |
Net increase (decrease) in net assets resulting from operations | | | 7,118,451 | | | | (11,062,253 | ) |
| |
| | |
Distributions to shareholders from distributable earnings: | | | | | | | | |
| | |
Class A | | | (2,650,679 | ) | | | (611,127 | ) |
| |
Class B | | | - | | | | (1,757 | ) |
| |
Class C | | | (419,998 | ) | | | (65,031 | ) |
| |
Class R | | | (103,364 | ) | | | (26,544 | ) |
| |
Class Y | | | (455,264 | ) | | | (104,011 | ) |
| |
Investor Class | | | (697,637 | ) | | | (211,282 | ) |
| |
Class R5 | | | (249,749 | ) | | | (60,620 | ) |
| |
Class R6 | | | (925,766 | ) | | | (271,337 | ) |
| |
Total distributions from distributable earnings | | | (5,502,457 | ) | | | (1,351,709 | ) |
| |
| | |
Share transactions–net: | | | | | | | | |
| | |
Class A | | | (5,971,471 | ) | | | (1,063,400 | ) |
| |
Class B | | | - | | | | (270,639 | ) |
| |
Class C | | | (3,047,980 | ) | | | (1,325,937 | ) |
| |
Class R | | | (317,798 | ) | | | (568,145 | ) |
| |
Class Y | | | (1,237,710 | ) | | | 508,652 | |
| |
Investor Class | | | (268,463 | ) | | | (3,868,508 | ) |
| |
Class R5 | | | 211,702 | | | | 66,151 | |
| |
Class R6 | | | 5,840,224 | | | | (2,175,699 | ) |
| |
Net increase (decrease) in net assets resulting from share transactions | | | (4,791,496 | ) | | | (8,697,525 | ) |
| |
Net increase (decrease) in net assets | | | (3,175,502 | ) | | | (21,111,487 | ) |
| |
| | |
Net assets: | | | | | | | | |
Beginning of year | | | 70,584,165 | | | | 91,695,652 | |
| |
End of year | | $ | 67,408,663 | | | $ | 70,584,165 | |
| |
See accompanying Notes to Financial Statements which are an integral part of the financial statements.
14 Invesco International Core Equity Fund
Financial Highlights
The following schedule presents financial highlights for a share of the Fund outstanding throughout the periods indicated.
| | | | | | | | | | | | | | | | | | | | | | | | | | | | | | | | | | | | | | | | | | | | | | | | | | | | | | | | | | | | | | | | | | | | | | |
| | | Net asset
value,
beginning
of period | | Net
investment
income(a) | | Net gains
(losses) on securities
(both
realized and
unrealized) | | Total from investment operations | | Dividends
from net
investment income | | Distributions
from net
realized
gains | | Total
distributions | | Net asset
value, end
of period | | Total
return (b) | | Net assets,
end of period (000’s omitted) | | Ratio of
expenses
to average
net assets
with fee waivers
and/or
expenses
absorbed | | Ratio of
expenses
to average net
assets without
fee waivers
and/or
expenses
absorbed | | Ratio of net
investment
income
to average
net assets | | Portfolio
turnover (c) |
Class A | | | | | | | | | | | | | | | | | | | | | | | | | | | | | | | | | | | | | | | | | | | | | | | | | | | | | | | | | | | | | | | | | | | | | | |
Year ended 10/31/19 | | | $ | 10.59 | | | | $ | 0.20 | | | | $ | 0.71 | | | | $ | 0.91 | | | | $ | (0.15 | ) | | | $ | (0.69 | ) | | | $ | (0.84 | ) | | | $ | 10.66 | | | | | 9.74 | % | | | $ | 27,707 | | | | | 1.12 | %(d) | | | | 1.66 | %(d) | | | | 1.97 | %(d) | | | | 28 | % |
Year ended 10/31/18 | | | | 12.43 | | | | | 0.19 | | | | | (1.84 | ) | | | | (1.65 | ) | | | | (0.19 | ) | | | | – | | | | | (0.19 | ) | | | | 10.59 | | | | | (13.53 | ) | | | | 33,798 | | | | | 1.12 | | | | | 1.67 | | | | | 1.54 | | | | | 73 | |
Year ended 10/31/17 | | | | 10.48 | | | | | 0.15 | | | | | 1.97 | | | | | 2.12 | | | | | (0.17 | ) | | | | – | | | | | (0.17 | ) | | | | 12.43 | | | | | 20.54 | | | | | 40,865 | | | | | 1.15 | | | | | 1.70 | | | | | 1.38 | | | | | 61 | |
Year ended 10/31/16 | | | | 10.73 | | | | | 0.12 | | | | | (0.26 | ) | | | | (0.14 | ) | | | | (0.11 | ) | | | | – | | | | | (0.11 | ) | | | | 10.48 | | | | | (1.26 | ) | | | | 35,406 | | | | | 1.41 | | | | | 1.61 | | | | | 1.18 | | | | | 37 | |
Year ended 10/31/15 | | | | 11.37 | | | | | 0.13 | | | | | (0.17 | ) | | | | (0.04 | ) | | | | (0.10 | ) | | | | (0.50 | ) | | | | (0.60 | ) | | | | 10.73 | | | | | (0.19 | ) | | | | 40,161 | | | | | 1.61 | | | | | 1.61 | | | | | 1.19 | | | | | 63 | |
Class C | | | | | | | | | | | | | | | | | | | | | | | | | | | | | | | | | | | | | | | | | | | | | | | | | | | | | | | | | | | | | | | | | | | | | | |
Year ended 10/31/19 | | | | 10.31 | | | | | 0.12 | | | | | 0.71 | | | | | 0.83 | | | | | (0.05 | ) | | | | (0.69 | ) | | | | (0.74 | ) | | | | 10.40 | | | | | 8.98 | | | | | 2,775 | | | | | 1.87 | (d) | | | | 2.41 | (d) | | | | 1.22 | (d) | | | | 28 | |
Year ended 10/31/18 | | | | 12.10 | | | | | 0.09 | | | | | (1.79 | ) | | | | (1.70 | ) | | | | (0.09 | ) | | | | – | | | | | (0.09 | ) | | | | 10.31 | | | | | (14.14 | ) | | | | 6,022 | | | | | 1.87 | | | | | 2.42 | | | | | 0.79 | | | | | 73 | |
Year ended 10/31/17 | | | | 10.20 | | | | | 0.07 | | | | | 1.92 | | | | | 1.99 | | | | | (0.09 | ) | | | | – | | | | | (0.09 | ) | | | | 12.10 | | | | | 19.64 | | | | | 8,476 | | | | | 1.90 | | | | | 2.45 | | | | | 0.63 | | | | | 61 | |
Year ended 10/31/16 | | | | 10.44 | | | | | 0.04 | | | | | (0.26 | ) | | | | (0.22 | ) | | | | (0.02 | ) | | | | – | | | | | (0.02 | ) | | | | 10.20 | | | | | (2.06 | ) | | | | 8,581 | | | | | 2.16 | | | | | 2.36 | | | | | 0.43 | | | | | 37 | |
Year ended 10/31/15 | | | | 11.08 | | | | | 0.05 | | | | | (0.17 | ) | | | | (0.12 | ) | | | | (0.02 | ) | | | | (0.50 | ) | | | | (0.52 | ) | | | | 10.44 | | | | | (0.97 | ) | | | | 10,067 | | | | | 2.36 | | | | | 2.36 | | | | | 0.44 | | | | | 63 | |
Class R | | | | | | | | | | | | | | | | | | | | | | | | | | | | | | | | | | | | | | | | | | | | | | | | | | | | | | | | | | | | | | | | | | | | | | |
Year ended 10/31/19 | | | | 10.60 | | | | | 0.17 | | | | | 0.73 | | | | | 0.90 | | | | | (0.12 | ) | | | | (0.69 | ) | | | | (0.81 | ) | | | | 10.69 | | | | | 9.52 | | | | | 1,105 | | | | | 1.37 | (d) | | | | 1.91 | (d) | | | | 1.72 | (d) | | | | 28 | |
Year ended 10/31/18 | | | | 12.44 | | | | | 0.16 | | | | | (1.84 | ) | | | | (1.68 | ) | | | | (0.16 | ) | | | | – | | | | | (0.16 | ) | | | | 10.60 | | | | | (13.73 | ) | | | | 1,414 | | | | | 1.37 | | | | | 1.92 | | | | | 1.29 | | | | | 73 | |
Year ended 10/31/17 | | | | 10.49 | | | | | 0.12 | | | | | 1.97 | | | | | 2.09 | | | | | (0.14 | ) | | | | – | | | | | (0.14 | ) | | | | 12.44 | | | | | 20.21 | | | | | 2,201 | | | | | 1.40 | | | | | 1.95 | | | | | 1.13 | | | | | 61 | |
Year ended 10/31/16 | | | | 10.74 | | | | | 0.09 | | | | | (0.26 | ) | | | | (0.17 | ) | | | | (0.08 | ) | | | | – | | | | | (0.08 | ) | | | | 10.49 | | | | | (1.54 | ) | | | | 2,180 | | | | | 1.66 | | | | | 1.86 | | | | | 0.93 | | | | | 37 | |
Year ended 10/31/15 | | | | 11.38 | | | | | 0.10 | | | | | (0.17 | ) | | | | (0.07 | ) | | | | (0.07 | ) | | | | (0.50 | ) | | | | (0.57 | ) | | | | 10.74 | | | | | (0.45 | ) | | | | 1,799 | | | | | 1.86 | | | | | 1.86 | | | | | 0.94 | | | | | 63 | |
Class Y | | | | | | | | | | | | | | | | | | | | | | | | | | | | | | | | | | | | | | | | | | | | | | | | | | | | | | | | | | | | | | | | | | | | | | |
Year ended 10/31/19 | | | | 10.78 | | | | | 0.23 | | | | | 0.73 | | | | | 0.96 | | | | | (0.18 | ) | | | | (0.69 | ) | | | | (0.87 | ) | | | | 10.87 | | | | | 10.09 | | | | | 4,465 | | | | | 0.87 | (d) | | | | 1.41 | (d) | | | | 2.22 | (d) | | | | 28 | |
Year ended 10/31/18 | | | | 12.65 | | | | | 0.22 | | | | | (1.87 | ) | | | | (1.65 | ) | | | | (0.22 | ) | | | | – | | | | | (0.22 | ) | | | | 10.78 | | | | | (13.33 | ) | | | | 5,738 | | | | | 0.87 | | | | | 1.42 | | | | | 1.79 | | | | | 73 | |
Year ended 10/31/17 | | | | 10.66 | | | | | 0.19 | | | | | 2.00 | | | | | 2.19 | | | | | (0.20 | ) | | | | – | | | | | (0.20 | ) | | | | 12.65 | | | | | 20.88 | | | | | 6,226 | | | | | 0.90 | | | | | 1.45 | | | | | 1.63 | | | | | 61 | |
Year ended 10/31/16 | | | | 10.92 | | | | | 0.15 | | | | | (0.27 | ) | | | | (0.12 | ) | | | | (0.14 | ) | | | | – | | | | | (0.14 | ) | | | | 10.66 | | | | | (1.06 | ) | | | | 3,431 | | | | | 1.16 | | | | | 1.36 | | | | | 1.43 | | | | | 37 | |
Year ended 10/31/15 | | | | 11.56 | | | | | 0.16 | | | | | (0.17 | ) | | | | (0.01 | ) | | | | (0.13 | ) | | | | (0.50 | ) | | | | (0.63 | ) | | | | 10.92 | | | | | 0.05 | | | | | 3,017 | | | | | 1.36 | | | | | 1.36 | | | | | 1.44 | | | | | 63 | |
Investor Class | | | | | | | | | | | | | | | | | | | | | | | | | | | | | | | | | | | | | | | | | | | | | | | | | | | | | | | | | | | | | | | | | | |
Year ended 10/31/19 | | | | 10.76 | | | | | 0.20 | | | | | 0.73 | | | | | 0.93 | | | | | (0.15 | ) | | | | (0.69 | ) | | | | (0.84 | ) | | | | 10.85 | | | | | 9.77 | | | | | 8,886 | | | | | 1.12 | (d) | | | | 1.66 | (d) | | | | 1.97 | (d) | | | | 28 | |
Year ended 10/31/18 | | | | 12.63 | | | | | 0.19 | | | | | (1.87 | ) | | | | (1.68 | ) | | | | (0.19 | ) | | | | – | | | | | (0.19 | ) | | | | 10.76 | | | | | (13.55 | ) | | | | 9,037 | | | | | 1.12 | | | | | 1.67 | | | | | 1.54 | | | | | 73 | |
Year ended 10/31/17 | | | | 10.65 | | | | | 0.16 | | | | | 1.99 | | | | | 2.15 | | | | | (0.17 | ) | | | | – | | | | | (0.17 | ) | | | | 12.63 | | | | | 20.50 | | | | | 14,503 | | | | | 1.15 | | | | | 1.70 | | | | | 1.38 | | | | | 61 | |
Year ended 10/31/16 | | | | 10.90 | | | | | 0.12 | | | | | (0.26 | ) | | | | (0.14 | ) | | | | (0.11 | ) | | | | – | | | | | (0.11 | ) | | | | 10.65 | | | | | (1.24 | ) | | | | 10,280 | | | | | 1.41 | | | | | 1.61 | | | | | 1.18 | | | | | 37 | |
Year ended 10/31/15 | | | | 11.54 | | | | | 0.13 | | | | | (0.17 | ) | | | | (0.04 | ) | | | | (0.10 | ) | | | | (0.50 | ) | | | | (0.60 | ) | | | | 10.90 | | | | | (0.19 | ) | | | | 11,707 | | | | | 1.61 | | | | | 1.61 | | | | | 1.19 | | | | | 63 | |
Class R5 | | | | | | | | | | | | | | | | | | | | | | | | | | | | | | | | | | | | | | | | | | | | | | | | | | | | | | | | | | | | | | | | | | | | | | |
Year ended 10/31/19 | | | | 10.53 | | | | | 0.22 | | | | | 0.71 | | | | | 0.93 | | | | | (0.18 | ) | | | | (0.69 | ) | | | | (0.87 | ) | | | | 10.59 | | | | | 10.04 | | | | | 3,282 | | | | | 0.87 | (d) | | | | 1.10 | (d) | | | | 2.22 | (d) | | | | 28 | |
Year ended 10/31/18 | | | | 12.36 | | | | | 0.22 | | | | | (1.83 | ) | | | | (1.61 | ) | | | | (0.22 | ) | | | | – | | | | | (0.22 | ) | | | | 10.53 | | | | | (13.32 | ) | | | | 3,017 | | | | | 0.87 | | | | | 1.15 | | | | | 1.79 | | | | | 73 | |
Year ended 10/31/17 | | | | 10.44 | | | | | 0.18 | | | | | 1.95 | | | | | 2.13 | | | | | (0.21 | ) | | | | – | | | | | (0.21 | ) | | | | 12.36 | | | | | 20.82 | | | | | 3,474 | | | | | 0.90 | | | | | 1.15 | | | | | 1.63 | | | | | 61 | |
Year ended 10/31/16 | | | | 10.71 | | | | | 0.16 | | | | | (0.26 | ) | | | | (0.10 | ) | | | | (0.17 | ) | | | | – | | | | | (0.17 | ) | | | | 10.44 | | | | | (0.83 | ) | | | | 2,832 | | | | | 1.03 | | | | | 1.04 | | | | | 1.56 | | | | | 37 | |
Year ended 10/31/15 | | | | 11.35 | | | | | 0.19 | | | | | (0.17 | ) | | | | 0.02 | | | | | (0.16 | ) | | | | (0.50 | ) | | | | (0.66 | ) | | | | 10.71 | | | | | 0.37 | | | | | 2,830 | | | | | 1.03 | | | | | 1.03 | | | | | 1.77 | | | | | 63 | |
Class R6 | | | | | | | | | | | | | | | | | | | | | | | | | | | | | | | | | | | | | | | | | | | | | | | | | | | | | | | | | | | | | | | | | | | | | | |
Year ended 10/31/19 | | | | 10.53 | | | | | 0.22 | | | | | 0.71 | | | | | 0.93 | | | | | (0.18 | ) | | | | (0.69 | ) | | | | (0.87 | ) | | | | 10.59 | | | | | 10.04 | | | | | 19,188 | | | | | 0.87 | (d) | | | | 1.10 | (d) | | | | 2.22 | (d) | | | | 28 | |
Year ended 10/31/18 | | | | 12.35 | | | | | 0.22 | | | | | (1.82 | ) | | | | (1.60 | ) | | | | (0.22 | ) | | | | – | | | | | (0.22 | ) | | | | 10.53 | | | | | (13.25 | ) | | | | 11,560 | | | | | 0.87 | | | | | 1.15 | | | | | 1.79 | | | | | 73 | |
Year ended 10/31/17 | | | | 10.43 | | | | | 0.18 | | | | | 1.96 | | | | | 2.14 | | | | | (0.22 | ) | | | | – | | | | | (0.22 | ) | | | | 12.35 | | | | | 20.85 | | | | | 15,702 | | | | | 0.90 | | | | | 1.15 | | | | | 1.63 | | | | | 61 | |
Year ended 10/31/16 | | | | 10.71 | | | | | 0.16 | | | | | (0.27 | ) | | | | (0.11 | ) | | | | (0.17 | ) | | | | – | | | | | (0.17 | ) | | | | 10.43 | | | | | (0.91 | ) | | | | 26,480 | | | | | 1.02 | | | | | 1.03 | | | | | 1.57 | | | | | 37 | |
Year ended 10/31/15 | | | | 11.35 | | | | | 0.20 | | | | | (0.17 | ) | | | | 0.03 | | | | | (0.17 | ) | | | | (0.50 | ) | | | | (0.67 | ) | | | | 10.71 | | | | | 0.38 | | | | | 50,857 | | | | | 1.02 | | | | | 1.02 | | | | | 1.78 | | | | | 63 | |
| (a) | Calculated using average shares outstanding. |
| (b) | Includes adjustments in accordance with accounting principles generally accepted in the United States of America and as such, the net asset value for financial reporting purposes and the returns based upon those net asset values may differ from the net asset value and returns for shareholder transactions. Does not include sales charges and is not annualized for periods less than one year, if applicable. |
| (c) | Portfolio turnover is calculated at the fund level and is not annualized for periods less than one year, if applicable. |
| (d) | Ratios are based on average daily net assets (000’s omitted) of $32,960, $3,556, $1,281, $4,969, $8,887, $3,109 and $19,028 for Class A, Class C, Class R, Class Y, Investor Class, Class R5 and Class R6 shares, respectively. |
See accompanying Notes to Financial Statements which are an integral part of the financial statements.
15 Invesco International Core Equity Fund
Notes to Financial Statements
October 31, 2019
NOTE 1–Significant Accounting Policies
Invesco International Core Equity Fund (the “Fund”) is a series portfolio of AIM International Mutual Funds (Invesco International Mutual Funds) (the “Trust”). The Trust is a Delaware statutory trust registered under the Investment Company Act of 1940, as amended (the “1940 Act”), as anopen-end series management investment company authorized to issue an unlimited number of shares of beneficial interest. Information presented in these financial statements pertains only to the Fund. Matters affecting the Fund or each class will be voted on exclusively by the shareholders of the Fund or each class.
The Fund’s investment objective is long-term growth of capital.
The Fund currently consists of seven different classes of shares: Class A, Class C, Class R, Class Y, Investor Class, Class R5 and Class R6. Class Y and Investor Class shares are available only to certain investors. Class A shares are sold with afront-end sales charge unless certain waiver criteria are met. Under certain circumstances, load waived shares may be subject to contingent deferred sales charges (“CDSC”). Class C shares are sold with a CDSC. Class R, Class Y, Investor Class, Class R5 and Class R6 shares are sold at net asset value. Class C shares held for ten years after purchase are eligible for automatic conversion into Class A shares of the same Fund (the “Conversion Feature”). The automatic conversion pursuant to the Conversion Feature will generally occur at the end of the month following the tenth anniversary after a purchase of Class C shares.
The Fund is an investment company and accordingly follows the investment company accounting and reporting guidance in accordance with Financial Accounting Standards Board Accounting Standards Codification Topic 946,Financial Services – Investment Companies.
The following is a summary of the significant accounting policies followed by the Fund in the preparation of its financial statements.
| A. | Security Valuations –Securities, including restricted securities, are valued according to the following policy. |
A security listed or traded on an exchange (except convertible securities) is valued at its last sales price or official closing price as of the close of the customary trading session on the exchange where the security is principally traded, or lacking any sales or official closing price on a particular day, the security may be valued at the closing bid price on that day. Securities traded in theover-the-counter market are valued based on prices furnished by independent pricing services or market makers. When such securities are valued by an independent pricing service they may be considered fair valued. Futures contracts are valued at the final settlement price set by an exchange on which they are principally traded. Listed options are valued at the mean between the last bid and asked prices from the exchange on which they are principally traded. Options not listed on an exchange are valued by an independent source at the mean between the last bid and asked prices. For purposes of determining net asset value (“NAV”) per share, futures and option contracts generally are valued 15 minutes after the close of the customary trading session of the New York Stock Exchange (“NYSE”).
Investments inopen-end andclosed-end registered investment companies that do not trade on an exchange are valued at theend-of-day net asset value per share. Investments inopen-end andclosed-end registered investment companies that trade on an exchange are valued at the last sales price or official closing price as of the close of the customary trading session on the exchange where the security is principally traded.
Debt obligations (including convertible securities) and unlisted equities are fair valued using an evaluated quote provided by an independent pricing service. Evaluated quotes provided by the pricing service may be determined without exclusive reliance on quoted prices, and may reflect appropriate factors such asinstitution-size trading in similar groups of securities, developments related to specific securities, dividend rate (for unlisted equities), yield (for debt obligations), quality, type of issue, coupon rate (for debt obligations), maturity (for debt obligations), individual trading characteristics and other market data. Pricing services generally value debt obligations assuming orderly transactions of institutional round lot size, but a fund may hold or transact in the same securities in smaller, odd lot sizes. Odd lots often trade at lower prices than institutional round lots. Debt obligations are subject to interest rate and credit risks. In addition, all debt obligations involve some risk of default with respect to interest and/or principal payments.
Foreign securities��� (including foreign exchange contracts) prices are converted into U.S. dollar amounts using the applicable exchange rates as of the close of the NYSE. If market quotations are available and reliable for foreign exchange-traded equity securities, the securities will be valued at the market quotations. Because trading hours for certain foreign securities end before the close of the NYSE, closing market quotations may become unreliable. If between the time trading ends on a particular security and the close of the customary trading session on the NYSE, events occur that the investment adviser determines are significant and make the closing price unreliable, the Fund may fair value the security. If the event is likely to have affected the closing price of the security, the security will be valued at fair value in good faith using procedures approved by the Board of Trustees. Adjustments to closing prices to reflect fair value may also be based on a screening process of an independent pricing service to indicate the degree of certainty, based on historical data, that the closing price in the principal market where a foreign security trades is not the current value as of the close of the NYSE. Foreign securities’ prices meeting the approved degree of certainty that the price is not reflective of current value will be priced at the indication of fair value from the independent pricing service. Multiple factors may be considered by the independent pricing service in determining adjustments to reflect fair value and may include information relating to sector indices, American Depositary Receipts and domestic and foreign index futures. Foreign securities may have additional risks including exchange rate changes, potential for sharply devalued currencies and high inflation, political and economic upheaval, the relative lack of issuer information, relatively low market liquidity and the potential lack of strict financial and accounting controls and standards.
Securities for which market prices are not provided by any of the above methods may be valued based upon quotes furnished by independent sources. The last bid price may be used to value equity securities. The mean between the last bid and asked prices is used to value debt obligations, including corporate loans.
Securities for which market quotations are not readily available or became unreliable are valued at fair value as determined in good faith by or under the supervision of the Trust’s officers following procedures approved by the Board of Trustees. Issuer specific events, market trends, bid/asked quotes of brokers and information providers and other market data may be reviewed in the course of making a good faith determination of a security’s fair value.
The Fund may invest in securities that are subject to interest rate risk, meaning the risk that the prices will generally fall as interest rates rise and, conversely, the prices will generally rise as interest rates fall. Specific securities differ in their sensitivity to changes in interest rates
16 Invesco International Core Equity Fund
depending on their individual characteristics. Changes in interest rates may result in increased market volatility, which may affect the value and/or liquidity of certain Fund investments.
Valuations change in response to many factors including the historical and prospective earnings of the issuer, the value of the issuer’s assets, general economic conditions, interest rates, investor perceptions and market liquidity. Because of the inherent uncertainties of valuation, the values reflected in the financial statements may materially differ from the value received upon actual sale of those investments.
| B. | Securities Transactions and Investment Income –Securities transactions are accounted for on a trade date basis. Realized gains or losses on sales are computed on the basis of specific identification of the securities sold. Interest income (net of withholding tax, if any) is recorded on the accrual basis from settlement date. Dividend income (net of withholding tax, if any) is recorded on theex-dividend date. |
The Fund may periodically participate in litigation related to Fund investments. As such, the Fund may receive proceeds from litigation settlements. Any proceeds received are included in the Statement of Operations as realized gain (loss) for investments no longer held and as unrealized gain (loss) for investments still held.
Brokerage commissions and mark ups are considered transaction costs and are recorded as an increase to the cost basis of securities purchased and/or a reduction of proceeds on a sale of securities. Such transaction costs are included in the determination of net realized and unrealized gain (loss) from investment securities reported in the Statement of Operations and the Statement of Changes in Net Assets and the net realized and unrealized gains (losses) on securities per share in the Financial Highlights. Transaction costs are included in the calculation of the Fund’s net asset value and, accordingly, they reduce the Fund’s total returns. These transaction costs are not considered operating expenses and are not reflected in net investment income reported in the Statement of Operations and the Statement of Changes in Net Assets, or the net investment income per share and the ratios of expenses and net investment income reported in the Financial Highlights, nor are they limited by any expense limitation arrangements between the Fund and the investment adviser.
The Fund allocates income and realized and unrealized capital gains and losses to a class based on the relative net assets of each class.
| C. | Country Determination– For the purposes of making investment selection decisions and presentation in the Schedule of Investments, the investment adviser may determine the country in which an issuer is located and/or credit risk exposure based on various factors. These factors include the laws of the country under which the issuer is organized, where the issuer maintains a principal office, the country in which the issuer derives 50% or more of its total revenues and the country that has the primary market for the issuer’s securities, as well as other criteria. Among the other criteria that may be evaluated for making this determination are the country in which the issuer maintains 50% or more of its assets, the type of security, financial guarantees and enhancements, the nature of the collateral and the sponsor organization. Country of issuer and/or credit risk exposure has been determined to be the United States of America, unless otherwise noted. |
| D. | Distributions– Distributions from net investment income and net realized capital gain, if any, are generally declared and paid annually and recorded on theex-dividend date. The Fund may elect to treat a portion of the proceeds from redemptions as distributions for federal income tax purposes. |
| E. | Federal Income Taxes –The Fund intends to comply with the requirements of Subchapter M of the Internal Revenue Code of 1986, as amended (the “Internal Revenue Code”), necessary to qualify as a regulated investment company and to distribute substantially all of the Fund’s taxable earnings to shareholders. As such, the Fund will not be subject to federal income taxes on otherwise taxable income (including net realized capital gain) that is distributed to shareholders. Therefore, no provision for federal income taxes is recorded in the financial statements. |
The Fund recognizes the tax benefits of uncertain tax positions only when the position is more likely than not to be sustained. Management has analyzed the Fund’s uncertain tax positions and concluded that no liability for unrecognized tax benefits should be recorded related to uncertain tax positions. Management is not aware of any tax positions for which it is reasonably possible that the total amounts of unrecognized tax benefits will change materially in the next 12 months.
The Fund files tax returns in the U.S. Federal jurisdiction and certain other jurisdictions. Generally, the Fund is subject to examinations by such taxing authorities for up to three years after the filing of the return for the tax period.
| F. | Expenses –Fees provided for under the Rule12b-1 plan of a particular class of the Fund are charged to the operations of such class. Transfer agency fees and expenses and other shareholder recordkeeping fees and expenses attributable to Class R5 and Class R6 are allocated to each share class based on relative net assets.Sub-accounting fees attributable to Class R5 are charged to the operations of the class. Transfer agency fees and expenses and other shareholder recordkeeping fees and expenses relating to all other classes are allocated among those classes based on relative net assets. All other expenses are allocated among the classes based on relative net assets. |
| G. | Accounting Estimates –The preparation of financial statements in conformity with accounting principles generally accepted in the United States of America (“GAAP”) requires management to make estimates and assumptions that affect the reported amounts of assets and liabilities at the date of the financial statements and the reported amounts of revenues and expenses during the reporting period including estimates and assumptions related to taxation. Actual results could differ from those estimates by a significant amount. In addition, the Fund monitors for material events or transactions that may occur or become known after theperiod-end date and before the date the financial statements are released to print. |
| H. | Indemnifications– Under the Trust’s organizational documents, each Trustee, officer, employee or other agent of the Trust is indemnified against certain liabilities that may arise out of the performance of their duties to the Fund. Additionally, in the normal course of business, the Fund enters into contracts, including the Fund’s servicing agreements, that contain a variety of indemnification clauses. The Fund’s maximum exposure under these arrangements is unknown as this would involve future claims that may be made against the Fund that have not yet occurred. The risk of material loss as a result of such indemnification claims is considered remote. |
| I. | Securities Lending– The Fund may lend portfolio securities having a market value up toone-third of the Fund’s total assets. Such loans are secured by collateral equal to no less than the market value of the loaned securities determined daily by the securities lending provider. Such collateral will be cash or debt securities issued or guaranteed by the U.S. Government or any of its sponsored agencies. Cash collateral received in connection with these loans is invested in short-term money market instruments or affiliated money market funds and is shown as such on the Schedule of Investments. The Fund bears the risk of loss with respect to the investment of collateral. It is the Fund’s policy to obtain additional collateral from or return excess collateral to the borrower by the end of the next business day, following the valuation date of the securities loaned. Therefore, the value of the collateral held may be temporarily less than the value of the securities on loan. When loaning securities, the Fund retains certain benefits of owning the securities, including the economic equivalent of dividends or interest generated by the security. Lending securities entails a risk of loss to the Fund if, and to the extent that, the market value of the securities loaned were to increase and the |
17 Invesco International Core Equity Fund
borrower did not increase the collateral accordingly, and the borrower failed to return the securities. The securities loaned are subject to termination at the option of the borrower or the Fund. Upon termination, the borrower will return to the Fund the securities loaned and the Fund will return the collateral. Upon the failure of the borrower to return the securities, collateral may be liquidated and the securities may be purchased on the open market to replace the loaned securities. The Fund could experience delays and costs in gaining access to the collateral and the securities may lose value during the delay which could result in potential losses to the Fund. Some of these losses may be indemnified by the lending agent. The Fund bears the risk of any deficiency in the amount of the collateral available for return to the borrower due to any loss on the collateral invested. Dividends received on cash collateral investments for securities lending transactions, which are net of compensation to counterparties, are included inDividends from affiliated money market funds on the Statement of Operations. The aggregate value of securities out on loan, if any, is shown as a footnote on the Statement of Assets and Liabilities.
| J. | Foreign Currency Translations– Foreign currency is valued at the close of the NYSE based on quotations posted by banks and major currency dealers. Portfolio securities and other assets and liabilities denominated in foreign currencies are translated into U.S. dollar amounts at the date of valuation. Purchases and sales of portfolio securities (net of foreign taxes withheld on disposition) and income items denominated in foreign currencies are translated into U.S. dollar amounts on the respective dates of such transactions. The Fund does not separately account for the portion of the results of operations resulting from changes in foreign exchange rates on investments and the fluctuations arising from changes in market prices of securities held. The combined results of changes in foreign exchange rates and the fluctuation of market prices on investments (net of estimated foreign tax withholding) are included with the net realized and unrealized gain or loss from investments in the Statement of Operations. Reported net realized foreign currency gains or losses arise from (1) sales of foreign currencies, (2) currency gains or losses realized between the trade and settlement dates on securities transactions, and (3) the difference between the amounts of dividends, interest, and foreign withholding taxes recorded on the Fund’s books and the U.S. dollar equivalent of the amounts actually received or paid. Net unrealized foreign currency gains and losses arise from changes in the fair values of assets and liabilities, other than investments in securities at fiscal period end, resulting from changes in exchange rates. |
The Fund may invest in foreign securities, which may be subject to foreign taxes on income, gains on investments or currency repatriation, a portion of which may be recoverable. Foreign taxes, if any, are recorded based on the tax regulations and rates that exist in the foreign markets in which the Fund invests and are shown in the Statement of Operations.
| K. | Forward Foreign Currency Contracts– The Fund may engage in foreign currency transactions either on a spot (i.e. for prompt delivery and settlement) basis, or through forward foreign currency contracts, to manage or minimize currency or exchange rate risk. |
The Fund may also enter into forward foreign currency contracts for the purchase or sale of a security denominated in a foreign currency in order to “lock in” the U.S. dollar price of that security, or the Fund may also enter into forward foreign currency contracts that do not provide for physical settlement of the two currencies, but instead are settled by a single cash payment calculated as the difference between the agreed upon exchange rate and the spot rate at settlement based upon an agreed upon notional amount(non-deliverable forwards). The Fund will set aside liquid assets in an amount equal to the dailymark-to-market obligation for forward foreign currency contracts.
A forward foreign currency contract is an obligation between two parties (“Counterparties”) to purchase or sell a specific currency for an agreed-upon price at a future date. The use of forward foreign currency contracts does not eliminate fluctuations in the price of the underlying securities the Fund owns or intends to acquire but establishes a rate of exchange in advance. Fluctuations in the value of these contracts are measured by the difference in the contract date and reporting date exchange rates and are recorded as unrealized appreciation (depreciation) until the contracts are closed. When the contracts are closed, realized gains (losses) are recorded. Realized and unrealized gains (losses) on the contracts are included in the Statement of Operations. The primary risks associated with forward foreign currency contracts include failure of the Counterparty to meet the terms of the contract and the value of the foreign currency changing unfavorably. These risks may be in excess of the amounts reflected in the Statement of Assets and Liabilities.
NOTE 2–Advisory Fees and Other Fees Paid to Affiliates
The Trust has entered into a master investment advisory agreement with Invesco Advisers, Inc. (the “Adviser” or “Invesco”). Under the terms of the investment advisory agreement, the Fund accrues daily and pays monthly an advisory fee to the Adviser based on the annual rate of the Fund’s average daily net assets as follows:
| | | | |
| Average Daily Net Assets | | Rate | |
First $500 million | | | 0.750% | |
Next $500 million | | | 0.650% | |
From $1 billion | | | 0.550% | |
From $2 billion | | | 0.450% | |
From $4 billion | | | 0.400% | |
From $6 billion | | | 0.375% | |
Over $8 billion | | | 0.350% | |
For the year ended October 31, 2019, the effective advisory fee rate incurred by the Fund was 0.75%.
Under the terms of a mastersub-advisory agreement between the Adviser and each of Invesco Asset Management Deutschland GmbH, Invesco Asset Management Limited, Invesco Asset Management (Japan) Limited, Invesco Hong Kong Limited, Invesco Senior Secured Management, Inc. and Invesco Canada Ltd. and separatesub-advisory agreements with Invesco Capital Management LLC and Invesco Asset Management (India) Private Limited (collectively, the “AffiliatedSub-Advisers”) the Adviser, not the Fund, will pay 40% of the fees paid to the Adviser to any such AffiliatedSub-Adviser(s) that provide(s) discretionary investment management services to the Fund based on the percentage of assets allocated to such AffiliatedSub-Adviser(s).
The Adviser has contractually agreed, through February 28, 2021, to waive advisory fees and/or reimburse expenses of all shares to the extent necessary to limit total annual fund operating expenses after fee waiver and/or expense reimbursement (excluding certain items discussed below) of Class A, Class C, Class R, Class Y, Investor Class, Class R5 and Class R6 shares to 1.12%, 1.87%, 1.37%, 0.87%, 1.12%, 0.87% and 0.87%,
18 Invesco International Core Equity Fund
respectively, of average daily net assets (the “expense limits”). In determining the Adviser’s obligation to waive advisory fees and/or reimburse expenses, the following expenses are not taken into account, and could cause the total annual fund operating expenses after fee waiver and/or expense reimbursement to exceed the numbers reflected above: (1) interest; (2) taxes; (3) dividend expense on short sales; (4) extraordinary ornon-routine items, including litigation expenses; and (5) expenses that the Fund has incurred but did not actually pay because of an expense offset arrangement. Unless Invesco continues the fee waiver agreement, it will terminate on February 28, 2021. During its term, the fee waiver agreement cannot be terminated or amended to increase the expense limits or reduce the advisory fee waiver without approval of the Board of Trustees.
Further, the Adviser has contractually agreed, through at least June 30, 2021, to waive the advisory fee payable by the Fund in an amount equal to 100% of the net advisory fees the Adviser receives from the affiliated money market funds on investments by the Fund of uninvested cash (excluding investments of cash collateral from securities lending) in such affiliated money market funds.
For the year ended October 31, 2019, the Adviser waived advisory fees of $164,965 and reimbursed class level expenses of $103,391, $11,156, $4,018, $15,588, $27,877, $131 and $638 of Class A, Class C, Class R, Class Y, Investor Class, Class R5 and Class R6 shares, respectively.
The Trust has entered into a master administrative services agreement with Invesco pursuant to which the Fund has agreed to pay Invesco for certain administrative costs incurred in providing accounting services to the Fund. For the year ended October 31, 2019, expenses incurred under the agreement are shown in the Statement of Operations asAdministrative services fees. Invesco has entered into asub-administration agreement whereby State Street Bank and Trust Company (“SSB”) serves as fund accountant and provides certain administrative services to the Fund. Pursuant to a custody agreement with the Trust on behalf of the Fund, SSB also serves as the Fund’s custodian.
The Trust has entered into a transfer agency and service agreement with Invesco Investment Services, Inc. (“IIS”) pursuant to which the Fund has agreed to pay IIS a fee for providing transfer agency and shareholder services to the Fund and reimburse IIS for certain expenses incurred by IIS in the course of providing such services. IIS may make payments to intermediaries that provide omnibus account services,sub-accounting services and/or networking services. All fees payable by IIS to intermediaries that provide omnibus account services orsub-accounting services are charged back to the Fund, subject to certain limitations approved by the Trust’s Board of Trustees. For the year ended October 31, 2019, expenses incurred under the agreement are shown in the Statement of Operations asTransfer agent fees.
The Trust has entered into master distribution agreements with Invesco Distributors, Inc. (“IDI”) to serve as the distributor for the Class A, Class C, Class R, Class Y, Investor Class, Class R5 and Class R6 shares of the Fund. The Trust has adopted plans pursuant to Rule12b-1 under the 1940 Act with respect to the Fund’s Class A, Class C, Class R and Investor Class shares (collectively, the “Plans”). The Fund, pursuant to the Plans, pays IDI compensation at the annual rate of 0.25% of the Fund’s average daily net assets of Class A shares, 1.00% of the average daily net assets of Class C shares, 0.50% of the average daily net assets of Class R shares and 0.25% of the average daily net assets of Investor Class shares. The fees are accrued daily and paid monthly. Of the Plan payments, up to 0.25% of the average daily net assets of each class of shares may be paid to furnish continuing personal shareholder services to customers who purchase and own shares of such classes. Any amounts not paid as a service fee under the Plans would constitute an asset-based sales charge. Rules of the Financial Industry Regulatory Authority (“FINRA”) impose a cap on the total sales charges, including asset-based sales charges, that may be paid by any class of shares of the Fund. For the year ended October 31, 2019, expenses incurred under the Plans are shown in the Statement of Operations asDistribution fees.
Front-end sales commissions and CDSC (collectively, the “sales charges”) are not recorded as expenses of the Fund.Front-end sales commissions are deducted from proceeds from the sales of Fund shares prior to investment in Class A shares of the Fund. CDSC are deducted from redemption proceeds prior to remittance to the shareholder. During the year ended October 31, 2019, IDI advised the Fund that IDI retained $3,620 infront-end sales commissions from the sale of Class A shares and $82 and $117 from Class A and Class C shares, respectively, for CDSC imposed upon redemptions by shareholders.
Certain officers and trustees of the Trust are officers and directors of the Adviser, IIS and/or IDI.
NOTE 3–Additional Valuation Information
GAAP defines fair value as the price that would be received to sell an asset or paid to transfer a liability in an orderly transaction between market participants at the measurement date, under current market conditions. GAAP establishes a hierarchy that prioritizes the inputs to valuation methods, giving the highest priority to readily available unadjusted quoted prices in an active market for identical assets (Level 1) and the lowest priority to significant unobservable inputs (Level 3), generally when market prices are not readily available or are unreliable. Based on the valuation inputs, the securities or other investments are tiered into one of three levels. Changes in valuation methods may result in transfers in or out of an investment’s assigned level:
| | | | |
| | Level 1 - | | Prices are determined using quoted prices in an active market for identical assets. |
| | Level 2 - | | Prices are determined using other significant observable inputs. Observable inputs are inputs that other market participants may use in pricing a security. These may include quoted prices for similar securities, interest rates, prepayment speeds, credit risk, yield curves, loss severities, default rates, discount rates, volatilities and others. |
| | Level 3 - | | Prices are determined using significant unobservable inputs. In situations where quoted prices or observable inputs are unavailable (for example, when there is little or no market activity for an investment at the end of the period), unobservable inputs may be used. Unobservable inputs reflect the Fund’s own assumptions about the factors market participants would use in determining fair value of the securities or instruments and would be based on the best available information. |
The following is a summary of the tiered valuation input levels, as of October 31, 2019. The level assigned to the securities valuations may not be an indication of the risk or liquidity associated with investing in those securities. Because of the inherent uncertainties of valuation, the values reflected in the financial statements may materially differ from the value received upon actual sale of those investments.
19 Invesco International Core Equity Fund
| | | | | | | | | | | | | | |
| | | Level 1 | | | Level 2 | | | Level 3 | | | Total |
Investments in Securities | | | | | | | | | | | | | | |
Argentina | | $ | 317,606 | | | $ | – | | | | $– | | | $ 317,606 |
Australia | | | – | | | | 4,131,924 | | | | – | | | 4,131,924 |
Belgium | | | – | | | | 1,138,759 | | | | – | | | 1,138,759 |
Brazil | | | 362,679 | | | | – | | | | – | | | 362,679 |
Canada | | | 804,131 | | | | – | | | | – | | | 804,131 |
China | | | – | | | | 837,448 | | | | – | | | 837,448 |
Denmark | | | – | | | | 893,925 | | | | – | | | 893,925 |
France | | | – | | | | 8,761,153 | | | | – | | | 8,761,153 |
Germany | | | – | | | | 6,558,831 | | | | – | | | 6,558,831 |
Hong Kong | | | – | | | | 1,827,717 | | | | – | | | 1,827,717 |
India | | | – | | | | 485,616 | | | | – | | | 485,616 |
Ireland | | | 1,412,487 | | | | – | | | | – | | | 1,412,487 |
Italy | | | – | | | | 2,753,794 | | | | – | | | 2,753,794 |
Japan | | | – | | | | 13,866,077 | | | | – | | | 13,866,077 |
Luxembourg | | | – | | | | 1,047,561 | | | | – | | | 1,047,561 |
Netherlands | | | – | | | | 2,797,554 | | | | – | | | 2,797,554 |
Singapore | | | – | | | | 973,682 | | | | – | | | 973,682 |
Spain | | | – | | | | 1,259,234 | | | | – | | | 1,259,234 |
Sweden | | | – | | | | 298,498 | | | | – | | | 298,498 |
Switzerland | | | 2,213,806 | | | | 1,819,965 | | | | – | | | 4,033,771 |
United Kingdom | | | 5,542,476 | | | | 2,282,422 | | | | – | | | 7,824,898 |
United States | | | 1,882,736 | | | | 2,207,533 | | | | – | | | 4,090,269 |
Money Market Funds | | | 551,019 | | | | – | | | | – | | | 551,019 |
Total Investments in Securities | | | 13,086,940 | | | | 53,941,693 | | | | – | | | 67,028,633 |
| | | | |
Other Investments - Assets* | | | | | | | | | | | | | | |
Forward Foreign Currency Contracts | | | – | | | | 88,712 | | | | – | | | 88,712 |
Total Investments | | $ | 13,086,940 | | | $ | 54,030,405 | | | | $– | | | $67,117,345 |
| * | Unrealized appreciation. |
NOTE 4–Derivative Investments
The Fund may enter into an International Swaps and Derivatives Association Master Agreement (“ISDA Master Agreement”) under which a fund may trade OTC derivatives. An OTC transaction entered into under an ISDA Master Agreement typically involves a collateral posting arrangement, payment netting provisions andclose-out netting provisions. These netting provisions allow for reduction of credit risk through netting of contractual obligations. The enforceability of the netting provisions of the ISDA Master Agreement depends on the governing law of the ISDA Master Agreement, among other factors.
For financial reporting purposes, the Fund does not offset OTC derivative assets or liabilities that are subject to ISDA Master Agreements in the Statement of Assets and Liabilities.
Effect of Derivative Investments for the year ended October 31, 2019
The table below summarizes the gains (losses) on derivative investments, detailed by primary risk exposure, recognized in earnings during the period:
| | | | |
| | | Value | |
| Derivative Assets | | Currency
Risk | |
Unrealized appreciation on forward foreign currency contracts outstanding | | $ | 88,712 | |
Derivatives not subject to master netting agreements | | | - | |
Total Derivative Assets subject to master netting agreements | | $ | 88,712 | |
20 Invesco International Core Equity Fund
Offsetting Assets and Liabilities
The table below reflects the Fund’s exposure to Counterparties subject to either an ISDA Master Agreement or other agreement for OTC derivative transactions as of October 31, 2019.
| | | | | | | | | | | | |
| | | Financial
Derivative
Assets | | Financial
Derivative
Liabilities | | | | Collateral
(Received)/Pledged | | |
| Counterparty | | Forward Foreign
Currency Contracts | | Forward Foreign
Currency Contracts | | Net Value of
Derivatives | | Non-Cash | | Cash | | Net
Amount |
|
Citibank N.A. | | $88,712 | | $– | | $88,712 | | $– | | $– | | $88,712 |
|
Effect of Derivative Investments for the year ended October 31, 2019
The table below summarizes the gains (losses) on derivative investments, detailed by primary risk exposure, recognized in earnings during the period:
| | | | | |
| | | Location of Gain (Loss) on
Statement of Operations |
| | | Currency Risk |
Realized Gain (Loss): | | | | | |
Forward foreign currency contracts | | | $ | (87,950 | ) |
Change in Net Unrealized Appreciation: | | | | | |
Forward foreign currency contracts | | | | 88,712 | |
Total | | | $ | 762 | |
The table below summarizes the average notional value of derivatives held during the period.
| | |
| | | Forward
Foreign Currency
Contracts |
Average notional value | | $2,360,501 |
NOTE 5–Expense Offset Arrangement(s)
The expense offset arrangement is comprised of transfer agency credits which result from balances in demand deposit accounts used by the transfer agent for clearing shareholder transactions. For the year ended October 31, 2019, the Fund received credits from this arrangement, which resulted in the reduction of the Fund’s total expenses of $2,482.
NOTE 6–Trustees’ and Officers’ Fees and Benefits
Trustees’ and Officers’ Fees and Benefits include amounts accrued by the Fund to pay remuneration to certain Trustees and Officers of the Fund. Trustees have the option to defer compensation payable by the Fund,and Trustees’ and Officers’ Fees and Benefits also include amounts accrued by the Fund to fund such deferred compensation amounts. Those Trustees who defer compensation have the option to select various Invesco Funds in which their deferral accounts shall be deemed to be invested. Finally, certain current Trustees were eligible to participate in a retirement plan that provided for benefits to be paid upon retirement to Trustees over a period of time based on the number of years of service. The Fund may have certain former Trustees who also participate in a retirement plan and receive benefits under such plan.Trustees’ and Officers’ Fees and Benefits include amounts accrued by the Fund to fund such retirement benefits. Obligations under the deferred compensation and retirement plans represent unsecured claims against the general assets of the Fund.
NOTE 7–Cash Balances
The Fund is permitted to temporarily carry a negative or overdrawn balance in its account with State Street Bank and Trust Company, the custodian bank. Such balances, if any atperiod-end, are shown in the Statement of Assets and Liabilities under the payable caption Amount due custodian. To compensate the custodian bank for such overdrafts, the overdrawn Fund may either (1) leave funds as a compensating balance in the account so the custodian bank can be compensated by earning the additional interest; or (2) compensate by paying the custodian bank at a rate agreed upon by the custodian bank and Invesco, not to exceed the contractually agreed upon rate.
NOTE 8–Distributions to Shareholders and Tax Components of Net Assets
Tax Character of Distributions to Shareholders Paid During the Fiscal Years Ended October 31, 2019 and 2018
| | | | | | | | |
| | | 2019 | | | 2018 | |
| | |
Ordinary income | | $ | 2,171,112 | | | $ | 1,351,709 | |
| | |
Long-term capital gain | | | 3,331,345 | | | | - | |
| | |
Total distributions | | $ | 5,502,457 | | | $ | 1,351,709 | |
21 Invesco International Core Equity Fund
Tax Components of Net Assets atPeriod-End:
| | | | |
| | | 2019 | |
| |
Undistributed ordinary income | | $ | 1,240,097 | |
| |
Net unrealized appreciation (depreciation) – investments | | | (440,566 | ) |
| |
Net unrealized appreciation – foreign currencies | | | 88,168 | |
| |
Temporary book/tax differences | | | (92,565 | ) |
| |
Capital loss carryforward | | | (3,713,222 | ) |
| |
Shares of beneficial interest | | | 70,326,751 | |
| |
Total net assets | | $ | 67,408,663 | |
| |
The difference between book-basis andtax-basis unrealized appreciation (depreciation) is due to differences in the timing of recognition of gains and losses on investments for tax and book purposes. The Fund’s net unrealized appreciation (depreciation) difference is attributable primarily to wash sales, forward contracts and passive foreign investment companies.
The temporary book/tax differences are a result of timing differences between book and tax recognition of income and/or expenses. The Fund’s temporary book/tax differences are the result of the trustee deferral of compensation and retirement plan benefits.
Capital loss carryforward is calculated and reported as of a specific date. Results of transactions and other activity after that date may affect the amount of capital loss carryforward actually available for the Fund to utilize. Capital losses generated in years beginning after December 22, 2010 can be carried forward for an unlimited period, whereas previous losses expire in eight tax years. Capital losses with an expiration period may not be used to offset capital gains until all net capital losses without an expiration date have been utilized. Capital loss carryforwards with no expiration date will retain their character as either short-term or long-term capital losses instead of as short-term capital losses as under prior law. The ability to utilize capital loss carryforwards in the future may be limited under the Internal Revenue Code and related regulations based on the results of future transactions.
The Fund has a capital loss carryforward as of October 31, 2019, as follows:
| | | | | | | | | | |
| Capital Loss Carryforward* | | | | | | | | |
| |
| Expiration | | Short-Term | | Long-Term | | | Total | |
| |
Not subject to expiration | | $ – | | $ | 3,713,222 | | | $ | 3,713,222 | |
| |
| * | Capital loss carryforwards as of the date listed above are reduced for limitations, if any, to the extent required by the Internal Revenue Code and may be further limited depending upon a variety of factors, including the realization of net unrealized gains or losses as of the date of any reorganization. |
NOTE 9–Investment Transactions
The aggregate amount of investment securities (other than short-term securities, U.S. Treasury obligations and money market funds, if any) purchased and sold by the Fund during the year ended October 31, 2019 was $20,366,369 and $39,961,770, respectively. Cost of investments, including any derivatives, on a tax basis includes the adjustments for financial reporting purposes as of the most recently completed federal income tax reportingperiod-end.
Unrealized Appreciation (Depreciation) of Investments on a Tax Basis
| | | | |
| |
Aggregate unrealized appreciation of investments | | $ | 5,601,872 | |
| |
Aggregate unrealized (depreciation) of investments | | | (6,042,438 | ) |
| |
Net unrealized appreciation (depreciation) of investments | | $ | (440,566 | ) |
| |
Cost of investments for tax purposes is $67,469,199.
NOTE 10–Reclassification of Permanent Differences
Primarily as a result of differing book/tax treatment of passive foreign investment companies, foreign currency transactions and distributions, on October 31, 2019, undistributed net investment income was decreased by $118,292 and undistributed net realized gain (loss) was increased by $118,292. This reclassification had no effect on the net assets or the distributable earnings (loss) of the Fund.
22 Invesco International Core Equity Fund
NOTE 11–Share Information
| | | | | | | | | | | | | | | | |
| | | Summary of Share Activity | |
| |
| | | Years ended October 31, | |
| | | | |
| | | 2019(a) | | | 2018 | |
| | | | | | | | |
| | | Shares | | | Amount | | | Shares | | | Amount | |
| |
Sold: | | | | | | | | | | | | | | | | |
| | | | |
Class A | | | 306,173 | | | $ | 3,076,911 | | | | 571,471 | | | $ | 7,099,250 | |
| |
Class C | | | 52,968 | | | | 521,114 | | | | 105,413 | | | | 1,300,207 | |
| |
Class R | | | 18,524 | | | | 186,914 | | | | 26,537 | | | | 325,628 | |
| |
Class Y | | | 173,396 | | | | 1,805,335 | | | | 209,064 | | | | 2,601,565 | |
| |
Investor Class | | | 16,692 | | | | 172,492 | | | | 63,451 | | | | 814,809 | |
| |
Class R5 | | | 568 | | | | 5,658 | | | | 500 | | | | 6,031 | |
| |
Class R6 | | | 1,176,175 | | | | 10,713,294 | | | | 35,587 | | | | 429,535 | |
| |
| | | | |
Issued as reinvestment of dividends: | | | | | | | | | | | | | | | | |
| | | | |
Class A | | | 271,803 | | | | 2,538,646 | | | | 46,778 | | | | 583,327 | |
| |
Class B(b) | | | - | | | | - | | | | 135 | | | | 1,692 | |
| |
Class C | | | 44,357 | | | | 406,750 | | | | 5,016 | | | | 61,301 | |
| |
Class R | | | 10,994 | | | | 103,237 | | | | 2,122 | | | | 26,544 | |
| |
Class Y | | | 36,283 | | | | 344,688 | | | | 5,843 | | | | 74,031 | |
| |
Investor Class | | | 71,398 | | | | 678,992 | | | | 16,305 | | | | 206,747 | |
| |
Class R5 | | | 26,966 | | | | 249,706 | | | | 4,900 | | | | 60,610 | |
| |
Class R6 | | | 99,975 | | | | 925,766 | | | | 21,935 | | | | 271,337 | |
| |
| | | | |
Conversion of Class B shares to Class A shares: | | | | | | | | | | | | | | | | |
| | | | |
Class A | | | - | | | | - | | | | 17,783 | | | | 242,732 | |
| |
Class B | | | - | | | | - | | | | (17,784 | ) | | | (242,732 | ) |
| |
| | | | |
Automatic conversion of Class C shares to Class A shares: | | | | | | | | | | | | | | | | |
| | | | |
Class A | | | 278,763 | | | | 2,716,128 | | | | - | | | | - | |
| |
Class C | | | (284,411 | ) | | | (2,716,128 | ) | | | - | | | | - | |
| |
| | | | |
Reacquired: | | | | | | | | | | | | | | | | |
| | | | |
Class A | | | (1,450,002 | ) | | | (14,303,156 | ) | | | (732,468 | ) | | | (8,988,709 | ) |
| |
Class B(c) | | | - | | | | - | | | | (2,252 | ) | | | (29,599 | ) |
| |
Class C | | | (130,254 | ) | | | (1,259,716 | ) | | | (226,718 | ) | | | (2,687,445 | ) |
| |
Class R | | | (59,518 | ) | | | (607,949 | ) | | | (72,216 | ) | | | (920,317 | ) |
| |
Class Y | | | (331,060 | ) | | | (3,387,733 | ) | | | (174,990 | ) | | | (2,166,944 | ) |
| |
Investor Class | | | (108,998 | ) | | | (1,119,947 | ) | | | (388,505 | ) | | | (4,890,064 | ) |
| |
Class R5 | | | (4,181 | ) | | | (43,662 | ) | | | (40 | ) | | | (490 | ) |
| |
Class R6 | | | (561,933 | ) | | | (5,798,836 | ) | | | (230,466 | ) | | | (2,876,571 | ) |
| |
Net increase (decrease) in share activity | | | (345,322 | ) | | $ | (4,791,496 | ) | | | (712,599 | ) | | $ | (8,697,525 | ) |
| |
| (a) | There are entities that are record owners of more than 5% of the outstanding shares of the Fund and in the aggregate own 26% of the outstanding shares of the Fund. IDI has an agreement with these entities to sell Fund shares. The Fund, Invesco and/or Invesco affiliates may make payments to these entities, which are considered to be related to the Fund, for providing services to the Fund, Invesco and/or Invesco affiliates including but not limited to services such as securities brokerage, distribution, third party record keeping and account servicing. The Fund has no knowledge as to whether all or any portion of the shares owned of record by these entities are also owned beneficially. |
| | In addition, 15% of the outstanding shares of the Fund are owned by the Adviser or an affiliate of the Adviser. |
| (b) | Class B shares activity for the period November 1, 2017 through January 26, 2018 (date of conversion). |
| (c) | Effective as of the close of business January 26, 2018, all outstanding Class B shares were converted to Class A shares. |
23 Invesco International Core Equity Fund
Report of Independent Registered Public Accounting Firm
To the Board of Trustees of AIM International Mutual Funds (Invesco International Mutual Funds) and Shareholders of Invesco International Core Equity Fund
Opinion on the Financial Statements
We have audited the accompanying statement of assets and liabilities, including the schedule of investments, of Invesco International Core Equity Fund (one of the funds constituting AIM International Mutual Funds (Invesco International Mutual Funds), referred to hereafter as the “Fund”) as of October 31, 2019, the related statement of operations for the year ended October 31, 2019, the statement of changes in net assets for each of the two years in the period ended October 31, 2019, including the related notes, and the financial highlights for each of the five years in the period ended October 31, 2019 (collectively referred to as the “financial statements”). In our opinion, the financial statements present fairly, in all material respects, the financial position of the Fund as of October 31, 2019, the results of its operations for the year then ended, the changes in its net assets for each of the two years in the period ended October 31, 2019 and the financial highlights for each of the five years in the period ended October 31, 2019 in conformity with accounting principles generally accepted in the United States of America.
Basis for Opinion
These financial statements are the responsibility of the Fund’s management. Our responsibility is to express an opinion on the Fund’s financial statements based on our audits. We are a public accounting firm registered with the Public Company Accounting Oversight Board (United States) (PCAOB) and are required to be independent with respect to the Fund in accordance with the U.S. federal securities laws and the applicable rules and regulations of the Securities and Exchange Commission and the PCAOB.
We conducted our audits of these financial statements in accordance with the standards of the PCAOB. Those standards require that we plan and perform the audit to obtain reasonable assurance about whether the financial statements are free of material misstatement, whether due to error or fraud.
Our audits included performing procedures to assess the risks of material misstatement of the financial statements, whether due to error or fraud, and performing procedures that respond to those risks. Such procedures included examining, on a test basis, evidence regarding the amounts and disclosures in the financial statements. Our audits also included evaluating the accounting principles used and significant estimates made by management, as well as evaluating the overall presentation of the financial statements. Our procedures included confirmation of securities owned as of October 31, 2019 by correspondence with the custodian, transfer agent and brokers; when replies were not received from brokers, we performed other auditing procedures. We believe that our audits provide a reasonable basis for our opinion.
/s/PricewaterhouseCoopers LLP
Houston, Texas
December 23, 2019
We have served as the auditor of one or more of the investment companies in the Invesco group of investment companies since at least 1995. We have not been able to determine the specific year we began serving as auditor.
24 Invesco International Core Equity Fund
Calculating your ongoing Fund expenses
Example
As a shareholder of the Fund, you incur two types of costs: (1) transaction costs, which may include sales charges (loads) on purchase payments or contingent deferred sales charges on redemptions, if any; and (2) ongoing costs, including management fees, distribution and/or service(12b-1) fees, and other Fund expenses. This example is intended to help you understand your ongoing costs (in dollars) of investing in the Fund and to compare these costs with ongoing costs of investing in other mutual funds. The example is based on an investment of $1,000 invested at the beginning of the period and held for the entire period May 1, 2019 through October 31, 2019.
Actual expenses
The table below provides information about actual account values and actual expenses. You may use the information in this table, together with the amount you invested, to estimate the expenses that you paid over the period. Simply divide your account value by $1,000 (for example, an $8,600 account value divided by $1,000 = 8.6), then multiply the result by the number in the table under the heading entitled “Actual Expenses Paid During Period” to estimate the expenses you paid on your account during this period.
Hypothetical example for comparison purposes
The table below also provides information about hypothetical account values and hypothetical expenses based on the Fund’s actual expense ratio and an assumed rate of return of 5% per year before expenses, which is not the Fund’s actual return.
The hypothetical account values and expenses may not be used to estimate the actual ending account balance or expenses you paid for the period. You may use this information to compare the ongoing costs of investing in the Fund and other funds. To do so, compare this 5% hypothetical example with the 5% hypothetical examples that appear in the shareholder reports of the other funds.
Please note that the expenses shown in the table are meant to highlight your ongoing costs only and do not reflect any transaction costs, such as sales charges (loads) on purchase payments or contingent deferred sales charges on redemptions, if any. Therefore, the hypothetical information is useful in comparing ongoing costs only, and will not help you determine the relative total costs of owning different funds. In addition, if these transaction costs were included, your costs would have been higher.
| | | | | | | | | | | | | | | | | | | | | | | | |
| | | Beginning
Account Value
(05/01/19) | | ACTUAL | | HYPOTHETICAL (5% annual return before
expenses) | | Annualized
Expense
Ratio | |
| | Ending
Account Value
(10/31/19)1 | | Expenses
Paid During
Period2 | | | Ending
Account Value
(10/31/19) | | Expenses
Paid During
Period2 |
Class A | | | $1,000.00 | | | | $1,012.30 | | | | $5.68 | | | | $1,019.56 | | | | $5.70 | | | | 1.12% | |
Class C | | | 1,000.00 | | | | 1,008.70 | | | | 9.47 | | | | 1,015.78 | | | | 9.50 | | | | 1.87 | |
Class R | | | 1,000.00 | | | | 1,011.30 | | | | 6.95 | | | | 1,018.30 | | | | 6.97 | | | | 1.37 | |
Class Y | | | 1,000.00 | | | | 1,014.00 | | | | 4.42 | | | | 1,020.82 | | | | 4.43 | | | | 0.87 | |
Investor Class | | | 1,000.00 | | | | 1,012.10 | | | | 5.68 | | | | 1,019.56 | | | | 5.70 | | | | 1.12 | |
Class R5 | | | 1,000.00 | | | | 1,013.40 | | | | 4.42 | | | | 1,020.82 | | | | 4.43 | | | | 0.87 | |
Class R6 | | | 1,000.00 | | | | 1,014.40 | | | | 4.42 | | | | 1,020.82 | | | | 4.43 | | | | 0.87 | |
| 1 | The actual ending account value is based on the actual total return of the Fund for the period May 1, 2019 through October 31, 2019, after actual expenses and will differ from the hypothetical ending account value which is based on the Fund’s expense ratio and a hypothetical annual return of 5% before expenses. |
| 2 | Expenses are equal to the Fund’s annualized expense ratio as indicated above multiplied by the average account value over the period, multiplied by 184/365 to reflect the most recent fiscal half year. |
25 Invesco International Core Equity Fund
Approval of Investment Advisory andSub-Advisory Contracts
meetings held on June 10, 2019, the Board of Trustees (the Board or the Trustees) of AIM International Mutual Funds (Invesco International Mutual Funds) as a whole, and the independent Trustees, who comprise over 75% of the Board, voting separately, approved the continuance of the Invesco International Core Equity Fund’s (the Fund) Master Investment Advisory Agreement with Invesco Advisers, Inc. (Invesco Advisers and the investment advisory agreement) and the Master IntergroupSub-Advisory Contract for Mutual Funds with Invesco Asset Management Deutschland GmbH, Invesco Asset Management Limited, Invesco Asset Management (Japan) Limited, Invesco Hong Kong Limited, Invesco Senior Secured Management, Inc. and Invesco Canada Ltd. and separatesub-advisory contracts with Invesco Capital Management LLC and Invesco Asset Management (India) Private Limited (collectively, the AffiliatedSub-Advisers and thesub-advisory contracts) for another year, effective July 1, 2019. After evaluating the factors discussed below, among others, the Board approved the renewal of the Fund’s investment advisory agreement and thesub-advisory contracts and determined that the compensation payable by the Fund to Invesco Advisers and by Invesco Advisers to the AffiliatedSub-Advisers is fair and reasonable.
The Board’s Evaluation Process
The Board’s Investments Committee has established threeSub-Committees, which meet throughout the year to review the performance of funds advised by Invesco Advisers (the Invesco Funds). As part of a regularly scheduled basis ofin-person Board meetings, theSub-Committees meet with portfolio managers for their assigned Invesco Funds and other members of management to review detailed information about investment performance and portfolio attributes of these funds. The Board took into account evaluations and reports that it received from the Investments Committee andSub-Committees, as well as the information provided to such committees and the Board throughout the year, in considering whether to approve each Invesco Fund’s investment advisory agreement andsub-advisory contracts.
As part of the contract renewal process, the Board reviews and considers information provided in response to detailed requests for information submitted to management by the independent Trustees with assistance from legal counsel to the independent Trustees. The Board receives comparative investment performance and fee data regarding the Invesco Funds prepared by Invesco Advisers and Broadridge Financial Solutions, Inc. (Broadridge), an independent mutual fund data provider. The Board also receives an independent written
evaluation from the Senior Officer, an officer of the Invesco Funds who reports directly to the independent Trustees. The Senior Officer’s evaluation is prepared as part of his responsibility to manage the process by which the Invesco Funds’ proposed management fees are negotiated during the annual contract renewal process to ensure they are negotiated in a manner that is at arms’ length and reasonable. In addition to meetings with Invesco Advisers and fund counsel throughout the year, the independent Trustees also discuss the continuance of the investment advisory agreement andsub-advisory contracts in separate sessions with the Senior Officer and with independent legal counsel.
The discussion below is a summary of the Senior Officer’s independent written evaluation with respect to the Fund’s investment advisory agreement, as well as a discussion of the material factors and related conclusions that formed the basis for the Board’s approval of the Fund’s investment advisory agreement andsub-advisory contracts. The Trustees’ review and conclusions are based on the comprehensive consideration of all information presented to them during the course of the year and in prior years and are not the result of any single determinative factor. Moreover, one Trustee may have weighed a particular piece of information or factor differently than another Trustee. This information is current as of June 10, 2019.
Factors and Conclusions and Summary of Independent Written Fee Evaluation
| A. | Nature, Extent and Quality of Services Provided by Invesco Advisers and the AffiliatedSub-Advisers |
The Board reviewed the nature, extent and quality of the advisory services provided to the Fund by Invesco Advisers under the Fund’s investment advisory agreement, and the credentials and experience of the officers and employees of Invesco Advisers who provide these services, including the Fund’s portfolio manager(s). The Board’s review included consideration of Invesco Advisers’ investment process oversight and structure, credit analysis and investment risk management. The Board also considerednon-advisory services that Invesco Advisers and its affiliates provide to the Invesco Funds such as various back office support functions, third party oversight, internal audit, valuation, portfolio trading and legal and compliance. The Board also received and reviewed information about Invesco Advisers’ role as administrator of the Invesco Funds’ liquidity risk management program. The Board also reviewed and considered the benefits to shareholders of investing in a fund that is part of the Invesco family of funds under the
umbrella of Invesco Ltd., Invesco Advisers’ parent company, and noted Invesco Ltd.’s depth and experience in conducting an investment management business, as well as its commitment of financial and other resources to such business. The Board reviewed and considered information about the resources that Invesco Advisers intends to continue to commit to managing the Invesco family of funds following Invesco Ltd.’s acquisition of OppenheimerFunds, Inc. and its subsidiaries. The Board concluded that the nature, extent and quality of the services provided to the Fund by Invesco Advisers are appropriate and satisfactory.
The Board reviewed the services that may be provided by the AffiliatedSub-Advisers under thesub-advisory contracts and the credentials and experience of the officers and employees of the AffiliatedSub-Advisers who provide these services. The Board noted the AffiliatedSub-Advisers’ expertise with respect to certain asset classes and that the AffiliatedSub-Advisers have offices and personnel that are located in financial centers around the world. As a result, the Board noted that the AffiliatedSub-Advisers can provide research and investment analysis on the markets and economies of various countries in which the Fund may invest, make recommendations regarding securities and assist with security trades. The Board concluded that thesub-advisory contracts may benefit the Fund and its shareholders by permitting Invesco Advisers to use the resources and talents of the AffiliatedSub-Advisers in managing the Fund. The Board concluded that the nature, extent and quality of the services that may be provided by the AffiliatedSub-Advisers are appropriate and satisfactory.
| B. | Fund Investment Performance |
The Board considered Fund investment performance as a relevant factor in considering whether to approve the investment advisory agreement as well as thesub-advisory contracts for the Fund, as Invesco Asset Management Limited currently manages assets of the Fund.
The Board compared the Fund’s investment performance over multiple time periods ending December 31, 2018 to the performance of funds in the Broadridge performance universe and against the Lipper InternationalLarge-Cap Core Funds Index. The Board noted that performance of Class A shares of the Fund was in the fifth quintile of its performance universe for the one and three year periods and the fourth quintile for the five year period (the first quintile being the best performing funds and the fifth quintile being the worst performing funds). The Board noted that performance of Class A shares of the Fund was below the performance
26 Invesco International Core Equity Fund
of the Index for the one, three and five year periods. The Board noted that the Fund’s security selection in certain regions negatively impacted performance. The Trustees also reviewed more recent Fund performance and this review did not change their conclusions.
| C. | Advisory andSub-Advisory Fees and Fund Expenses |
The Board compared the Fund’s contractual management fee rate to the contractual management fee rates of funds in the Fund’s Broadridge expense group. The Board noted that the contractual management fee rate for Class A shares of the Fund was below the median contractual management fee rate of funds in its expense group. The Board noted that the term “contractual management fee” for funds in the expense group may include both advisory and certainnon-portfolio management administrative services fees, but that Broadridge does not provide information on a fund by fund basis as to what is included. The Board also reviewed the methodology used by Broadridge in providing expense group information, which includes using each fund’s contractual management fee schedule (including any applicable breakpoints) as reported in the most recent prospectus or statement of additional information for each fund in the expense group. The Board also considered comparative information regarding the Fund’s total expense ratio and its various components. The Board noted that there were only four funds (including the Fund) in the expense group.
The Board noted that Invesco Advisers has contractually agreed to waive fees and/or limit expenses of the Fund for the term disclosed in the Fund’s registration statement in an amount necessary to limit total annual operating expenses to a specified percentage of average daily net assets for each class of the Fund.
The Board also considered the fees charged by Invesco Advisers and the AffiliatedSub-Advisers to other similarly managed client accounts. The Board noted that Invesco Advisers or the AffiliatedSub-Advisers may charge lower fees to large institutional clients. Invesco Advisers reviewed with the Board differences in the scope of services it provides to the Invesco Funds relative to certain other types of client accounts, including management of cash flows as a result of redemptions and purchases, necessary infrastructure such as officers, office space, technology, legal and distribution, oversight of service providers, costs and business risks associated with launching new funds and sponsoring and maintaining the product line, preparation of annual registration statement updates and financial information and compliance with federal and state laws and regulations.
The Board also considered the services that may be provided by the AffiliatedSub-Advisers pursuant to thesub-advisory contracts, as well
as the fees payable by Invesco Advisers to the AffiliatedSub-Advisers pursuant to thesub-advisory contracts. The Board noted that Invesco Advisers retains overall responsibility for, and provides services to,sub-advised Invesco Funds, including oversight of the AffiliatedSub-Advisers as well as the additional services described herein other thanday-to-day portfolio management.
| D. | Economies of Scale and Breakpoints |
The Board considered the extent to which there may be economies of scale in the provision of advisory services to the Fund. The Board considered Invesco’s reinvestment in its business, including investments in business infrastructure and cybersecurity. The Board also considered that the Fund may benefit from economies of scale through contractual breakpoints in the Fund’s advisory fee schedule, which generally operate to reduce the Fund’s expense ratio as it grows in size. The Board noted that the Fund shares directly in economies of scale through lower fees charged by third party service providers based on the combined size of the Invesco Funds. The Board noted that the Fund may also benefit from economies of scale through initial fee setting, fee waivers and expense reimbursements.
| E. | Profitability and Financial Resources |
The Board reviewed information from Invesco Advisers concerning the costs of the advisory and other services that Invesco Advisers and its affiliates provide to the Fund and the Invesco Funds and the profitability of Invesco Advisers and its affiliates in providing these services. The Board considered the methodology used for calculating profitability and noted the periodic review of such methodology by an independent consultant. The Board noted that Invesco Advisers continues to operate at a net profit from services Invesco Advisers and its affiliates provide to the Invesco Funds. The Board received information from Invesco Advisers demonstrating that Invesco Advisers and the AffiliatedSub-Advisers are financially sound and have the resources necessary to perform their obligations under the investment advisory agreement andsub-advisory contracts.
| F. | Collateral Benefits to Invesco Advisers and its Affiliates |
The Board considered various other benefits received by Invesco Advisers and its affiliates from the relationship with the Fund, including the fees received for providing administrative, transfer agency and distribution services to the Fund. The Board considered comparative information regarding fees charged for these services, including information provided by Broadridge and other independent sources. The Board considered the performance of Invesco Advisers and its affiliates in providing these services and the organizational structure employed to provide these services. The Board also considered that these services are provided to the Fund pursuant to written contracts that are reviewed and approved on an annual basis
by the Board; and that the services are required for the operation of the Fund.
The Board considered the benefits realized by Invesco Advisers and the AffiliatedSub-Advisers as a result of portfolio brokerage transactions executed through “soft dollar” arrangements. The Board noted that soft dollar arrangements may result in the Fund bearing costs to purchase research that may be used by Invesco Advisers or the AffiliatedSub-Advisers with other clients and may reduce Invesco Advisers’ or the AffiliatedSub-Advisers’ expenses. The Board also considered that it receives periodic reports from Invesco representing that these arrangements are consistent with regulatory requirements. The Board did not deem the soft dollar arrangements to be inappropriate.
The Board considered that the Fund’s uninvested cash and cash collateral from any securities lending arrangements may be invested in money market funds advised by Invesco Advisers pursuant to procedures approved by the Board. The Board considered information regarding the returns of the affiliated money market funds relative to comparable overnight investments, as well as the costs to the Fund of such investments. The Board noted that Invesco Advisers receives advisory fees from these affiliated money market funds attributable to such investments, although Invesco Advisers has contractually agreed to waive through varying periods the advisory fees payable by the Invesco Funds with respect to certain investments in the affiliated money market funds. The waiver is in an amount equal to 100% of the net advisory fee Invesco Advisers receives from the affiliated money market funds with respect to the Fund’s investment in the affiliated money market funds of uninvested cash, but not cash collateral. The Board concluded that the amount of advisory fees received by Invesco Advisers from the Fund’s investment of cash collateral from any securities lending arrangements in the affiliated money market funds is fair and reasonable.
The Board also considered that an affiliated broker may receive commissions for executing certain trades for the Fund. Invesco Advisers and the AffiliatedSub-Advisers may use the affiliated broker to, among other things, control order routing and minimize information leakage, and the Board was advised that such trades are executed in compliance with rules under the federal securities laws and consistent with best execution obligations.
27 Invesco International Core Equity Fund
Tax Information
Form1099-DIV, Form1042-S and otheryear-end tax information provide shareholders with actual calendar year amounts that should be included in their tax returns. Shareholders should consult their tax advisors.
The following distribution information is being provided as required by the Internal Revenue Code or to meet a specific state’s requirement.
The Fund designates the following amounts or, if subsequently determined to be different, the maximum amount allowable for its fiscal year ended October 31, 2019:
| | | | | | |
| | Federal and State Income Tax | | | | |
| | Long-Term Capital Gain Distributions | | $ | 3,331,345 | |
| | Qualified Dividend Income* | | | 93.15 | % |
| | Corporate Dividends Received Deduction* | | | 0.02 | % |
| | Qualified Business Income (199A)* | | | 0.00 | % |
| | U.S. Treasury Obligations* | | | 0.00 | % |
| | * | The above percentages are based on ordinary income dividends paid to shareholders during the Fund’s fiscal year. |
28 Invesco International Core Equity Fund
Trustees and Officers
The address of each trustee and officer is AIM International Mutual Funds (Invesco International Mutual Funds) (the “Trust”), 11 Greenway Plaza, Suite 1000, Houston, Texas 77046-1173. The trustees serve for the life of the Trust, subject to their earlier death, incapacitation, resignation, retirement or removal as more specifically provided in the Trust’s organizational documents. Each officer serves for a one year term or until their successors are elected and qualified. Column two below includes length of time served with predecessor entities, if any.
| | | | | | | | |
Name, Year of Birth and Position(s) Held with the Trust | | Trustee and/or Officer Since | | Principal Occupation(s) During Past 5 Years | | Number of
Funds in
Fund Complex
Overseen by
Trustee | | Other
Directorship(s)
Held by Trustee
During Past 5 Years |
| Interested Persons | | | | | | | | |
| | | | | |
Martin L. Flanagan1 – 1960 Trustee and Vice Chair | | 2007 | | Executive Director, Chief Executive Officer and President, Invesco Ltd. (ultimate parent of Invesco and a global investment management firm); Trustee and Vice Chair, The Invesco Funds; Vice Chair, Investment Company Institute; and Member of Executive Board, SMU Cox School of Business Formerly: Advisor to the Board, Invesco Advisers, Inc. (formerly known as Invesco Institutional (N.A.), Inc.); Chairman and Chief Executive Officer, Invesco Advisers, Inc. (registered investment adviser); Director, Chairman, Chief Executive Officer and President, Invesco Holding Company (US), Inc. (formerly IVZ Inc.) (holding company), Invesco Group Services, Inc. (service provider) and Invesco North American Holdings, Inc. (holding company); Director, Chief Executive Officer and President, Invesco Holding Company Limited (parent of Invesco and a global investment management firm); Director, Invesco Ltd.; Chairman, Investment Company Institute and President,Co-Chief Executive Officer,Co-President, Chief Operating Officer and Chief Financial Officer, Franklin Resources, Inc. (global investment management organization) | | 229 | | None |
| | | | | |
Philip A. Taylor2– 1954 Trustee | | 2006 | | Vice Chair, Invesco Ltd.; Trustee, The Invesco Funds Formerly: Director, Invesco Canada Ltd. (formerly known as Invesco Trimark Ltd./Invesco Trimark Ltèe) (registered investment adviser and registered transfer agent); Head of the Americas and Senior Managing Director, Invesco Ltd.; Director, Invesco Advisers, Inc. (formerly known as Invesco Institutional (N.A.), Inc.) (registered investment adviser); Director and Chairman, Invesco Investment Services, Inc. (formerly known as Invesco AIM Investment Services, Inc.) (registered transfer agent); Chief Executive Officer, Invesco Corporate Class Inc. (corporate mutual fund company); Chairman and Chief Executive Officer, Invesco Canada Ltd. (formerly known as Invesco Trimark Ltd./Invesco Trimark Ltèe) (registered investment adviser and registered transfer agent); Senior Vice President, The Invesco Funds; Director, Invesco Investment Advisers LLC (formerly known as Van Kampen Asset Management); Director, Chairman, Chief Executive Officer and President, Invesco Management Group, Inc. (formerly known as Invesco AIM Management Group, Inc.) (financial services holding company);Co-Chairman,Co-President andCo-Chief Executive Officer, Invesco Advisers, Inc. (formerly known as Invesco Institutional (N.A.), Inc.) (registered investment adviser); Director, Chief Executive Officer and President, Van Kampen Exchange Corp; President and Principal Executive Officer, The Invesco Funds (other than AIM Treasurer’s Series Trust (Invesco Treasurer’s Series Trust), Short-Term Investments Trust and Invesco Management Trust); Executive Vice President, The Invesco Funds (AIM Treasurer’s Series Trust (Invesco Treasurer’s Series Trust), Short-Term Investments Trust and Invesco Management Trust only); Director and President, INVESCO Funds Group, Inc. (registered investment adviser and registered transfer agent); Director and Chairman, IVZ Distributors, Inc. (formerly known as INVESCO Distributors, Inc.) (registered broker dealer); Director, President and Chairman, Invesco Inc. (holding company), Invesco Canada Holdings Inc. (holding company), Trimark Investments Ltd./Placements Trimark Ltèe and Invesco Financial Services Ltd/Services Financiers Invesco Ltèe; Chief Executive Officer, Invesco Canada Fund Inc. (corporate mutual fund company); Director and Chairman, Van Kampen Investor Services Inc.; Director, Chief Executive Officer and President, 1371 Preferred Inc. (holding company) and Van Kampen Investments Inc.; Director and President, AIM GP Canada Inc. (general partner for limited partnerships) and Van Kampen Advisors, Inc.; Director and Chief Executive Officer, Invesco Trimark Dealer Inc. (registered broker dealer); Director, Invesco Distributors, Inc. (formerly known as Invesco AIM Distributors, Inc.) (registered broker dealer); Manager, Invesco Capital Management LLC; Director, Chief Executive Officer and President, Invesco Advisers, Inc.; Director, Chairman, Chief Executive Officer and President, Invesco AIM Capital Management, Inc.; President, Invesco Trimark Dealer Inc. and Invesco Trimark Ltd./Invesco Trimark Ltèe; Director and President, AIM Trimark Corporate Class Inc. and AIM Trimark Canada Fund Inc.; Senior Managing Director, Invesco Holding Company Limited; Director and Chairman, Fund Management Company (former registered broker dealer); President and Principal Executive Officer, The Invesco Funds (AIM Treasurer’s Series Trust (Invesco Treasurer’s Series Trust), and Short-Term Investments Trust only); President, AIM Trimark Global Fund Inc. and AIM Trimark Canada Fund Inc. | | 229 | | None |
| 1 | Mr. Flanagan is considered an interested person (within the meaning of Section 2(a)(19) of the 1940 Act) of the Trust because he is an officer of the Adviser to the Trust, and an officer and a director of Invesco Ltd., ultimate parent of the Adviser. |
| 2 | Mr. Taylor is considered an interested person (within the meaning of Section 2(a)(19) of the 1940 Act) of the Trust because he is an officer and a director of the Adviser. |
T-1 Invesco International Core Equity Fund
Trustees and Officers–(continued)
| | | | | | | | |
Name, Year of Birth and Position(s) Held with the Trust | | Trustee and/or Officer Since | | Principal Occupation(s) During Past 5 Years | | Number of
Funds in
Fund Complex
Overseen by
Trustee | | Other
Directorship(s)
Held by Trustee
During Past 5 Years |
| Independent Trustees | | | | | | | | |
| | | | | |
Bruce L. Crockett – 1944 Trustee and Chair | | 1992 | | Chairman, Crockett Technologies Associates (technology consulting company) Formerly: Director, Captaris (unified messaging provider); Director, President and Chief Executive Officer, COMSAT Corporation; Chairman, Board of Governors of INTELSAT (international communications company); ACE Limited (insurance company); Independent Directors Council and Investment Company Institute: Member of the Audit Committee, Investment Company Institute; Member of the Executive Committee and Chair of the Governance Committee, Independent Directors Council | | 229 | | Director and Chairman of the Audit Committee, ALPS (Attorneys Liability Protection Society) (insurance company); Director and Member of the Audit Committee and Compensation Committee, Ferroglobe PLC (metallurgical company) |
| | | | | |
David C. Arch – 1945 Trustee | | 2010 | | Chairman of Blistex Inc. (consumer health care products manufacturer); Member, World Presidents’ Organization | | 229 | | Board member of the Illinois Manufacturers’ Association |
| | | | | |
Beth Ann Brown – 1968 Trustee | | 2019 | | Independent Consultant Formerly: Head of Intermediary Distribution, Managing Director, Strategic Relations, Managing Director, Head of National Accounts, Senior Vice President, National Account Manager and Senior Vice President, Key Account Manager, Columbia Management Investment Advisers LLC; Vice President, Key Account Manager, Liberty Funds Distributor, Inc.; and Trustee of certain Oppenheimer Funds | | 229 | | Director, Board of Directors of Caron Engineering Inc.; President and Director, Acton Shapleigh Youth Conservation Corps (non - profit); and Vice President and Director of Grahamtastic Connection (non-profit) |
| | | | | |
Jack M. Fields – 1952 Trustee | | 1997 | | Chief Executive Officer, Twenty First Century Group, Inc. (government affairs company); and Chairman, Discovery Learning Alliance(non-profit) Formerly: Owner and Chief Executive Officer, Dos Angeles Ranch L.P. (cattle, hunting, corporate entertainment); Director, Insperity, Inc. (formerly known as Administaff) (human resources provider); Chief Executive Officer, Texana Timber LP (sustainable forestry company); Director of Cross Timbers Quail Research Ranch(non-profit); and member of the U.S. House of Representatives | | 229 | | None |
| | | | | |
Cynthia Hostetler –1962 Trustee | | 2017 | | Non-Executive Director and Trustee of a number of public and private business corporations Formerly: Director, Aberdeen Investment Funds (4 portfolios); Head of Investment Funds and Private Equity, Overseas Private Investment Corporation; President, First Manhattan Bancorporation, Inc.; Attorney, Simpson Thacher & Bartlett LLP | | 229 | | Vulcan Materials Company (construction materials company); Trilinc Global Impact Fund; Genesee & Wyoming, Inc. (railroads); Artio Global Investment LLC (mutual fund complex); Edgen Group, Inc. (specialized energy and infrastructure products distributor); Investment Company Institute (professional organization); Independent Directors Council (professional organization) |
T-2 Invesco International Core Equity Fund
Trustees and Officers–(continued)
| | | | | | | | |
Name, Year of Birth and
Position(s) Held with the Trust | | Trustee and/or Officer Since | | Principal Occupation(s) During Past 5 Years | | Number of
Funds in
Fund Complex
Overseen
by Trustee | | Other
Directorship(s)
Held by Trustee
During Past 5
Years |
| Independent Trustees–(continued) | | | | | | |
| | | | | |
Eli Jones – 1961 Trustee | | 2016 | | Professor and Dean, Mays Business School - Texas A&M University Formerly: Professor and Dean, Walton College of Business, University of Arkansas and E.J. Ourso College of Business, Louisiana State University; Director, Arvest Bank | | 229 | | Insperity, Inc. (formerly known as Administaff) (human resources provider) |
| | | | | |
Elizabeth Krentzman – 1959 Trustee | | 2019 | | Formerly: Principal and Chief Regulatory Advisor for Asset Management Services and U.S. Mutual Fund Leader of Deloitte & Touche LLP; General Counsel of the Investment Company Institute (trade association); National Director of the Investment Management Regulatory Consulting Practice, Principal, Director and Senior Manager of Deloitte & Touche LLP; Assistant Director of the Division of Investment Management - Office of Disclosure and Investment Adviser Regulation of the U.S. Securities and Exchange Commission and various positions with the Division of Investment Management – Office of Regulatory Policy of the U.S. Securities and Exchange Commission; Associate at Ropes & Gray LLP; Advisory Board Member of the Securities and Exchange Commission Historical Society; and Trustee of certain Oppenheimer Funds | | 229 | | Trustee of the University of Florida National Board Foundation and Audit Committee Member; Member of the Cartica Funds Board of Directors (private investment funds); Member of the University of Florida Law Center Association, Inc. Board of Trustees and Audit Committee Member |
| | | | | |
Anthony J. LaCava, Jr. – 1956 Trustee | | 2019 | | Formerly: Director and Member of the Audit Committee, Blue Hills Bank (publicly traded financial institution) and Managing Partner, KPMG LLP | | 229 | | Blue Hills Bank; Chairman, Bentley University; Member, Business School Advisory Council; and Nominating Committee KPMG LLP |
| | | | | |
Prema Mathai-Davis – 1950 Trustee | | 1998 | | Retired Co-Owner & Partner of Quantalytics Research, LLC, (a FinTech Investment Research Platform for the Self-Directed Investor) | | 229 | | None |
| | | | | |
Joel W. Motley – 1952 Trustee | | 2019 | | Director of Office of Finance, Federal Home Loan Bank; Member of the Vestry of Trinity Wall Street; Managing Director of Carmona Motley Inc. (privately held financial advisor); Member of the Finance and Budget Committee of the Council on Foreign Relations, Member of the Investment Committee and Board of Human Rights Watch and Member of the Investment Committee and Board of Historic Hudson Valley(non-profit cultural organization) Formerly: Managing Director of Public Capital Advisors, LLC (privately held financial advisor); Managing Director of Carmona Motley Hoffman, Inc. (privately held financial advisor); Trustee of certain Oppenheimer Funds; and Director of Columbia Equity Financial Corp. (privately held financial advisor) | | 229 | | Director of Greenwall Foundation (bioethics research foundation); Member of Board and Investment Committee of The Greenwall Foundation; Director of Southern Africa Legal Services Foundation; Board Member and Investment Committee Member of Pulizer Center for Crisis Reporting(non-profit journalism) |
| | | | | |
Teresa M. Ressel – 1962 Trustee | | 2017 | | Non-executive director and trustee of a number of public and private business corporations Formerly: Chief Financial Officer, Olayan America, The Olayan Group (international investor/commercial/industrial); Chief Executive Officer, UBS Securities LLC; Group Chief Operating Officer, Americas, UBS AG; Assistant Secretary for Management & Budget and CFO, US Department of the Treasury | | 229 | | Atlantic Power Corporation (power generation company); ON Semiconductor Corp. (semiconductor supplier) |
T-3 Invesco International Core Equity Fund
Trustees and Officers–(continued)
| | | | | | | | |
Name, Year of Birth and
Position(s) Held with the Trust | | Trustee and/or Officer Since | | Principal Occupation(s) During Past 5 Years | | Number of
Funds
in
Fund Complex
Overseen
by Trustee | | Other Directorship(s) Held by Trustee During Past 5 Years |
| Independent Trustees–(continued) | | | | | | |
| | | | | |
Ann Barnett Stern – 1957 Trustee | | 2017 | | President and Chief Executive Officer, Houston Endowment Inc. (private philanthropic institution) Formerly: Executive Vice President and General Counsel, Texas Children’s Hospital; Attorney, Beck, Redden and Secrest, LLP; Business Law Instructor, University of St. Thomas; Attorney, Andrews & Kurth LLP | | 229 | | Federal Reserve Bank of Dallas |
| | | | | |
Raymond Stickel, Jr. – 1944 Trustee | | 2005 | | Retired Formerly: Director, Mainstay VP Series Funds, Inc. (25 portfolios); Partner, Deloitte & Touche | | 229 | | None |
| | | | | |
Robert C. Troccoli – 1949 Trustee | | 2016 | | Retired Formerly: Adjunct Professor, University of Denver – Daniels College of Business; Senior Partner, KPMG LLP | | 229 | | None |
| | | | | |
Daniel S. Vandivort –1954 Trustee | | 2019 | | Treasurer, Chairman of the Audit and Finance Committee, and Trustee, Board of Trustees, Huntington Disease Foundation of America; and President, Flyway Advisory Services LLC (consulting and property management) Formerly: Trustee and Governance Chair, of certain Oppenheimer Funds | | 229 | | Chairman and Lead Independent Director, Chairman of the Audit Committee, and Director, Board of Directors, Value Line Funds |
| | | | | |
James D. Vaughn – 1945 Trustee | | 2019 | | Retired Formerly: Managing Partner, Deloitte & Touche LLP; Trustee and Chairman of the Audit Committee, Schroder Funds; Board Member, Mile High United Way, Boys and Girls Clubs, Boy Scouts, Colorado Business Committee for the Arts, Economic Club of Colorado and Metro Denver Network (economic development corporation); and Trustee of certain Oppenheimer Funds | | 229 | | Board member and Chairman ofAudit Committeeof AMG National Trust Bank; Trustee and Investment Committee member, University of South Dakota Foundation; Board member, Audit Committee Member and past Board Chair, Junior Achievement(non-profit) |
| | | | | |
Christopher L. WIlson – 1957 Trustee, Vice Chair and Chair Designate | | 2017 | | Reitred Formerly: Director, TD Asset Management USA Inc. (mutual fund complex) (22 portfolios); Managing Partner, CT2, LLC (investing and consulting firm); President/Chief Executive Officer, Columbia Funds, Bank of America Corporation; President/Chief Executive Officer, CDC IXIS Asset Management Services, Inc.; Principal & Director of Operations, Scudder Funds, Scudder, Stevens & Clark, Inc.; Assistant Vice President, Fidelity Investments | | 229 | | ISO New England, Inc.(non-profit organization managing regional electricity market) |
T-4 Invesco International Core Equity Fund
Trustees and Officers–(continued)
| | | | | | | | |
Name, Year of Birth and Position(s) Held with the Trust | | Trustee and/or Officer Since | | Principal Occupation(s) During Past 5 Years | | Number of
Funds in
Fund Complex
Overseen by
Trustee | | Other Directorship(s) Held by Trustee During Past 5 Years |
| Other Officers | | | | | | | | |
| Sheri Morris – 1964 President, Principal Executive Officer and Treasurer | | 1999 | | Head of Global Fund Services, Invesco Ltd.; President, Principal Executive Officer and Treasurer, The Invesco Funds; Vice President, Invesco Advisers, Inc. (formerly known as Invesco Institutional (N.A.), Inc.) (registered investment adviser); and Vice President, Invesco Exchange-Traded Fund Trust, Invesco Exchange-Traded Fund Trust II, Invesco India Exchange-Traded Fund Trust, Invesco Actively Managed Exchange-Traded Fund Trust, Invesco Actively Managed Exchange-Traded Commodity Fund Trust and Invesco Exchange-Traded Self-Indexed Fund Trust; and Vice President, OppenheimerFunds, Inc. Formerly: Vice President and Principal Financial Officer, The Invesco Funds; Vice President, Invesco AIM Advisers, Inc., Invesco AIM Capital Management, Inc. and Invesco AIM Private Asset Management, Inc.; Assistant Vice President and Assistant Treasurer, The Invesco Funds and Assistant Vice President, Invesco Advisers, Inc., Invesco AIM Capital Management, Inc. and Invesco AIM Private Asset Management, Inc.; and Treasurer, Invesco Exchange-Traded FundTrust, Invesco Exchange-Traded Fund Trust II, Invesco India Exchange-Traded Fund Trust and Invesco Actively Managed Exchange-Traded Fund Trust | | N/A | | N/A |
| Russell C. Burk – 1958 Senior Vice President and Senior Officer | | 2005 | | Senior Vice President and Senior Officer, The Invesco Funds | | N/A | | N/A |
| Jeffrey H. Kupor – 1968 Senior Vice President, Chief Legal Officer and Secretary | | 2018 | | Head of Legal of the Americas, Invesco Ltd.; Senior Vice President and Secretary, Invesco Advisers, Inc. (formerly known as Invesco Institutional (N.A.), Inc.) (registered investment adviser); Senior Vice President and Secretary, Invesco Distributors, Inc. (formerly known as Invesco AIM Distributors, Inc.); Vice President and Secretary, Invesco Investment Services, Inc. (formerly known as Invesco AIM Investment Services, Inc.) Senior Vice President, Chief Legal Officer and Secretary, The Invesco Funds; Secretary and General Counsel, Invesco Investment Advisers LLC (formerly known as Van Kampen Asset Management); Secretary and General Counsel, Invesco Capital Markets, Inc. (formerly known as Van Kampen Funds Inc.) and Chief Legal Officer, Invesco Exchange-Traded Fund Trust, Invesco Exchange-Traded Fund Trust II, Invesco India Exchange-Traded Fund Trust, Invesco Actively Managed Exchange-Traded Fund Trust, Invesco Actively Managed Exchange-Traded Commodity Fund Trust and Invesco Exchange-Traded Self-Indexed Fund Trust; Secretary, Invesco Indexing LLC; Secretary, W.L. Ross & Co., LLC Formerly: Secretary and Vice President, Jemstep, Inc.; Head of Legal, Worldwide Institutional, Invesco Ltd.; Secretary and General Counsel, INVESCO Private Capital Investments, Inc.; Senior Vice President, Secretary and General Counsel, Invesco Management Group, Inc. (formerly known as Invesco AIM Management Group, Inc.); Assistant Secretary, INVESCO Asset Management (Bermuda) Ltd.; Secretary and General Counsel, Invesco Private Capital, Inc.; Assistant Secretary and General Counsel, INVESCO Realty, Inc.; Secretary and General Counsel, Invesco Senior Secured Management, Inc.; and Secretary, Sovereign G./P. Holdings Inc. | | N/A | | N/A |
| Andrew R. Schlossberg –1974 Senior Vice President | | 2019 | | Head of the Americas and Senior Managing Director, Invesco Ltd.; Director and Senior Vice President, Invesco Advisers, Inc. (formerly known as Invesco Institutional (N.A.), Inc.) (registered investment adviser); Director and Chairman, Invesco Investment Services, Inc. (formerly known as Invesco AIM Investment Services, Inc.) (registered transfer agent); Senior Vice President, The Invesco Funds; Director, Invesco Investment Advisers LLC (formerly known as Van Kampen Asset Management); Director, President and Chairman, Invesco Insurance Agency, Inc. Formerly: Director, Invesco UK Limited; Director and Chief Executive, Invesco Asset Management Limited and Invesco Fund Managers Limited; Assistant Vice President, The Invesco Funds; Senior Vice President, Invesco Advisers, Inc. (formerly known as Invesco Institutional (N.A.), Inc.) (registered investment adviser); Director and Chief Executive, Invesco Administration Services Limited and Invesco Global Investment Funds Limited; Director, Invesco Distributors, Inc.; Head of EMEA, Invesco Ltd.; President, Invesco Actively Managed Exchange-Traded Commodity Fund Trust, Invesco Actively Managed Exchange-Traded Fund Trust, Invesco Exchange-Traded Fund Trust, Invesco Exchange-Traded Fund Trust II and Invesco India Exchange-Traded Fund Trust; Managing Director and Principal Executive Officer, Invesco Capital Management LLC | | N/A | | N/A |
T-5 Invesco International Core Equity Fund
Trustees and Officers–(continued)
| | | | | | | | |
Name, Year of Birth and
Position(s) Held with the Trust | | Trustee
and/or Officer
Since | | Principal Occupation(s) During Past 5 Years | | Number of
Funds in
Fund Complex
Overseen by
Trustee | | Other Directorship(s) Held by Trustee During Past 5 Years |
| Other Officers—(continued) | | | | | | | | |
| | | | | |
John M. Zerr - 1962 Senior Vice President | | 2006 | | Chief Operating Officer of the Americas; Senior Vice President, Invesco Advisers, Inc. (formerly known as Invesco Institutional (N.A.), Inc.) (registered investment adviser); Senior Vice President, Invesco Distributors, Inc. (formerly known as Invesco AIM Distributors, Inc.); Director and Vice President, Invesco Investment Services, Inc. (formerly known as Invesco AIM Investment Services, Inc.) Senior Vice President, The Invesco Funds; Managing Director, Invesco Capital Management LLC; Director, Invesco Investment Advisers LLC (formerly known as Van Kampen Asset Management); Senior Vice President, Invesco Capital Markets, Inc. (formerly known as Van Kampen Funds Inc.); Manager, Invesco Indexing LLC; Manager, Invesco Specialized Products, LLC; Director and Senior Vice President, Invesco Insurance Agency, Inc.; Member, Invesco Canada Funds Advisory Board; Director, President and Chief Executive Officer, Invesco Corporate Class Inc. (corporate mutual fund company); and Director, Chairman, President and Chief Executive Officer, Invesco Canada Ltd. (formerly known as Invesco Trimark Ltd./Invesco Trimark Ltèe) (registered investment adviser and registered transfer agent) Formerly: Director and Senior Vice President, Invesco Management Group, Inc. (formerly known as Invesco AIM Management Group, Inc.); Secretary and General Counsel, Invesco Management Group, Inc. (formerly known as Invesco AIM Management Group, Inc.); Secretary, Invesco Investment Services, Inc. (formerly known as Invesco AIM Investment Services, Inc.); Chief Legal Officer and Secretary, The Invesco Funds; Secretary and General Counsel, Invesco Investment Advisers LLC (formerly known as Van Kampen Asset Management); Secretary and General Counsel, Invesco Capital Markets, Inc. (formerly known as Van Kampen Funds Inc.); Chief Legal Officer, Invesco Exchange-Traded Fund Trust, Invesco Exchange-Traded Fund Trust II, Invesco India Exchange-Traded Fund Trust, Invesco Actively Managed Exchange-Traded Fund Trust, Invesco Actively Managed Exchange-Traded Commodity Fund Trust and Invesco Exchange-Traded Self-Indexed Fund Trust; Secretary, Invesco Indexing LLC; Director, Secretary, General Counsel and Senior Vice President, Van Kampen Exchange Corp.; Director, Vice President and Secretary, IVZ Distributors, Inc. (formerly known as INVESCO Distributors, Inc.); Director and Vice President, INVESCO Funds Group, Inc.; Director and Vice President, Van Kampen Advisors Inc.; Director, Vice President, Secretary and General Counsel, Van Kampen Investor Services Inc.;Director and Secretary, Invesco Distributors, Inc. (formerly known as Invesco AIM Distributors, Inc.); Director, Senior Vice President, General Counsel and Secretary, Invesco AIM Advisers, Inc. and Van Kampen Investments Inc.; Director, Vice President and Secretary, Fund Management Company; Director, Senior Vice President, Secretary, General Counsel and Vice President, Invesco AIM Capital Management, Inc.; Chief Operating Officer and General Counsel, Liberty Ridge Capital, Inc. (an investment adviser) | | N/A | | N/A |
| | | | | |
| Gregory G. McGreevey -1962 Senior Vice President | | 2012 | | Senior Managing Director, Invesco Ltd.; Director, Chairman, President, and Chief Executive Officer, Invesco Advisers, Inc. (formerly known as Invesco Institutional (N.A.), Inc.) (registered investment adviser); Director, Invesco Mortgage Capital, Inc. and Invesco Senior Secured Management, Inc.; and Senior Vice President, The Invesco Funds; and President, SNW Asset Management Corporation Formerly: Senior Vice President, Invesco Management Group, Inc. and Invesco Advisers, Inc.; Assistant Vice President, The Invesco Funds | | N/A | | N/A |
| | | | | |
Kelli Gallegos - 1970 Vice President, Principal Financial Officer and Assistant Treasurer | | 2008 | | Principal Financial and Accounting Officer - Investments Pool, Invesco Specialized Products, LLC; Vice President, Principal Financial Officer and Assistant Treasurer, The Invesco Funds; Principal Financial and Accounting Officer – Pooled Investments, Invesco Capital Management LLC; Vice President and Treasurer, Invesco Exchange-Traded Fund Trust, Invesco Exchange-Traded Fund Trust II, Invesco India Exchange-Traded Fund Trust, Invesco Actively Managed Exchange-Traded Fund Trust, Invesco Actively Managed Exchange-Traded Commodity Fund Trust and Invesco Exchange-Traded Self-Indexed Fund Trust Formerly: Assistant Treasurer, Invesco Specialized Products, LLC; Assistant Treasurer, Invesco Exchange-Traded Fund Trust, Invesco Exchange-Traded Fund Trust II, Invesco India Exchange-Traded Fund Trust, Invesco Actively Managed Exchange-Traded Fund Trust, Invesco Actively Managed Exchange-Traded Commodity Fund Trust and Invesco Exchange-Traded Self-Indexed Fund Trust; Assistant Treasurer, Invesco Capital Management LLC; Assistant Vice President, The Invesco Funds | | N/A | | N/A |
T-6 Invesco International Core Equity Fund
Trustees and Officers–(continued)
| | | | | | | | |
Name, Year of Birth and
Position(s) Held with the Trust | | Trustee
and/or
Officer
Since | | Principal Occupation(s) During Past 5 Years | | Number of
Funds in
Fund Complex
Overseen by
Trustee | | Other Directorship(s) Held by Trustee During Past 5 Years |
| Other Officers—(continued) | | | | | | |
| Crissie M. Wisdom – 1969 Anti-Money Laundering Compliance Officer | | 2013 | | Anti-Money Laundering Compliance Officer, Invesco Advisers, Inc. (formerly known as Invesco Institutional (N.A.), Inc.) (registered investment adviser), Invesco Capital Markets, Inc. (formerly known as Van Kampen Funds Inc.), Invesco Distributors, Inc., Invesco Investment Services, Inc., The Invesco Funds, and Invesco Exchange-Traded Fund Trust, Invesco Exchange-Traded Fund Trust II, Invesco India Exchange-Traded Fund Trust, Invesco Actively Managed Exchange-Traded Fund Trust, Invesco Actively Managed Exchange-Traded Commodity Fund Trust and Invesco Exchange-Traded Self-Indexed Fund Trust; Anti-Money Laundering Compliance Officer and Bank Secrecy Act Officer, INVESCO National Trust Company and Invesco Trust Company; and Fraud Prevention Manager and Controls and Risk Analysis Manager for Invesco Investment Services, Inc. Formerly: Anti-Money Laundering Compliance Officer, Van Kampen Exchange Corp. and Invesco Management Group, Inc. | | N/A | | N/A |
| Robert R. Leveille – 1969 Chief Compliance Officer | | 2016 | | Chief Compliance Officer, Invesco Advisers, Inc. (registered investment adviser); and Chief Compliance Officer, The Invesco Funds Formerly: Chief Compliance Officer, Putnam Investments and the Putnam Funds | | N/A | | N/A |
The Statement of Additional Information of the Trust includes additional information about the Fund’s Trustees and is available upon request, without charge, by calling 1.800.959.4246. Please refer to the Fund’s Statement of Additional Information for information on the Fund’ssub-advisers.
| | | | | | |
Office of the Fund 11 Greenway Plaza, Suite 1000 Houston, TX 77046-1173 | | Investment Adviser Invesco Advisers, Inc. 1555 Peachtree Street, N.E. Atlanta, GA 30309 | | Distributor Invesco Distributors, Inc. 11 Greenway Plaza, Suite 1000 Houston, TX 77046-1173 | | Auditors PricewaterhouseCoopers LLP 1000 Louisiana Street, Suite 5800 Houston, TX 77002-5678 |
| | | |
| | | | | | |
Counsel to the Fund Stradley Ronon Stevens & Young, LLP 2005 Market Street, Suite 2600 Philadelphia, PA 19103-7018 | | Counsel to the Independent Trustees Goodwin Procter LLP 901 New York Avenue, N.W.
Washington, D.C. 20001 | | Transfer Agent Invesco Investment Services, Inc. 11 Greenway Plaza, Suite 1000 Houston, TX 77046-1173 | | Custodian State Street Bank and Trust Company 225 Franklin Street Boston, MA 02110-2801 |
T-7 Invesco International Core Equity Fund

Go paperless with eDelivery
Visit invesco.com/edelivery to enjoy the convenience and security of anytime electronic access to your investment documents.
With eDelivery, you can elect to have any or all of the following materials delivered straight to your inbox to download, save and print from your own computer:
| ∎ | Fund reports and prospectuses |
Invesco mailing information
Send general correspondence to Invesco Investment Services, Inc., P.O. Box 219078, Kansas City, MO 64121-9078.
Important notice regarding delivery of security holder documents
To reduce Fund expenses, only one copy of most shareholder documents may be mailed to shareholders with multiple accounts at the same address (Householding). Mailing of your shareholder documents may be householded indefinitely unless you instruct us otherwise. If you do not want the mailing of these documents to be combined with those for other members of your household, please contact Invesco Investment Services, Inc. at 800 959 4246 or contact your financial institution. We will begin sending you individual copies for each account within 30 days after receiving your request.
Fund holdings and proxy voting information
The Fund provides a complete list of its holdings four times in each fiscal year, at the quarter-ends. For the second and fourth quarters, the list appears in the Fund’s semiannual and annual reports to shareholders. For the first and third quarters, the Fund files the lists with the Securities and Exchange Commission (SEC) as an exhibit to its reports on FormN-PORT. The most recent list of portfolio holdings is available at invesco.com/completeqtrholdings. Shareholders can also look up the Fund’s FormN-PORT filings on the SEC website, sec.gov. The SEC file numbers for the Fund are shown below.
A description of the policies and procedures that the Fund uses to determine how to vote proxies relating to portfolio securities is available without charge, upon request, from our Client Services department at 800 959 4246, or at invesco.com/ proxyguidelines. The information is also available on the SEC website, sec.gov.
| | |
| Information regarding how the Fund voted proxies related to its portfolio securities during the most recent12-month period ended June 30 is available at invesco.com/proxysearch. This information is also available on the SEC website, sec.gov. | |  |
| Invesco Advisers, Inc. is an investment adviser; it provides investment advisory services to individual and institutional clients and does not sell securities. Invesco Distributors, Inc. is the US distributor for Invesco Ltd.’s retail mutual funds, exchange-traded funds and institutional money market funds. Both are wholly owned, indirect subsidiaries of Invesco Ltd. |
| | | | |
| SEC file numbers:811-06463 and033-44611 | | Invesco Distributors, Inc. | | I-ICE-AR-1 |
| | | | |
| | |
 | | Annual Report to Shareholders | | October 31, 2019 |
| | Invesco International Growth Fund |
| | Nasdaq: A: AIIEX∎ C: AIECX∎ R: AIERX∎ Y: AIIYX∎ R5: AIEVX∎ R6: IGFRX |

Letters to Shareholders
| | |

Andrew Schlossberg | | Dear Shareholders: This annual report includes information about your Fund, including performance data and a complete list of its investments as of the close of the reporting period. Inside is a discussion of how your Fund was managed and the factors that affected its performance during the reporting period. Despite marked market volatility along the way, most global equity markets produced solid gains for the reporting period. As the reporting period unfolded in the final months of 2018, global equities were reeling from a sharpsell-off. The catalyst for thesell-off was a combination of ongoing trade concerns between the US and China, fears of a global economic slowdown and lower oil prices from a supply glut. Gains posted earlier in 2018 for global equities were erased, while US Treasury bonds, along with government and municipal bonds, rallied as investors fled to “safe haven” assets. |
At the start of 2019, global equity markets rebounded strongly buoyed by more policy from central banks and optimism about a potentialUS-China trade deal. In May,US-China trade concerns and slowing global growth led to a global equitysell-off and rally in US Treasuries. Despite the Maysell-off, domestic equity markets rallied in June in anticipation of a US Federal Reserve (the Fed) interest rate cut and closed the second quarter with modest gains. ContinuedUS-China trade worries and signs of slowing global economic growth left global equity markets largely flat for the third quarter. As the reporting period came to a close in October 2019, a raft of upbeat positive corporate earnings results and a US interest rate cut buoyed domestic equity results with some domestic indices recording record highs.
The Fed, in fact, both raised and lowered the federal funds rate during the reporting period. Given signs of a strong economy, the Fed raised rates in December 2018. In 2019, however, the Fed altered its outlook on further rate hikes leaving rates unchanged for the first half of the year. In July, the Fed lowered interest rates for the first time in 11 years. It again lowered rates in September and once again in October. As the year continues to unfold, we’ll see how the interplay of interest rates, economic data, geopolitics and a host of other factors affect US and overseas equity and fixed income markets.
Investor uncertainty and market volatility, such as we witnessed during the reporting period, are unfortunate facts of life when it comes to investing. That’s why Invesco encourages investors to work with a professional financial adviser who can stress the importance of starting to save and invest early and the importance of adhering to a disciplined investment plan. A financial adviser who knows your unique financial situation, investment goals and risk tolerance can be an invaluable partner as you seek to achieve your financial goals. He or she can offer a long-term perspective when markets are volatile and time-tested advice and guidance when your financial situation or investment goals change.
Visit our website for more information on your investments
Our website, invesco.com/us, offers a wide range of market insights and investment perspectives. On the website, you’ll find detailed information about our funds, including performance, holdings and portfolio manager commentaries. You can access information about your account by completing a simple, secure online registration. To do so, select “Log In” on the right side of the homepage, and then select “Register for Individual Account Access.”
In addition to the resources accessible on our website and through our mobile app, you can obtain timely updates to help you stay informed about the markets and the economy by connecting with Invesco on Twitter, LinkedIn or Facebook. You can access our blog at blog.invesco.us.com. Our goal is to provide you the information you want, when and where you want it.
Finally, I’m pleased to share with you Invesco’s commitment to both the Principles for Responsible Investment and to considering environmental, social and governance issues in our robust investment process. I invite you to learn more at invesco.com/esg.
Have questions?
For questions about your account, contact an Invesco client services representative at 800 959 4246.
All of us at Invesco look forward to serving your investment management needs. Thank you for investing with us.
Sincerely,

Andrew Schlossberg
Head of the Americas,
Senior Managing Director, Invesco Ltd.
2 Invesco International Growth Fund
| | |

Bruce Crockett | | Dear Shareholders: Among the many important lessons I’ve learned in more than 40 years in a variety of business endeavors is the value of a trusted advocate. As independent chair of the Invesco Funds Board, I can assure you that the members of the Board are strong advocates for the interests of investors in Invesco’s mutual funds. We work hard to represent your interests through oversight of the quality of the investment management services your funds receive and other matters important to your investment, including but not limited to: ∎ Ensuring that Invesco offers a diverse lineup of mutual funds that your financial adviser can use to strive to meet your financial needs as your investment goals change over time. ∎ Monitoring how the portfolio management teams of the Invesco funds are performing in light |
| | of changing economic and market conditions. |
| ∎ | Assessing each portfolio management team’s investment performance within the context of the investment strategy described in the fund’s prospectus. |
| ∎ | Monitoring for potential conflicts of interests that may impact the nature of the services that your funds receive. |
We believe one of the most important services we provide our fund shareholders is the annual review of the funds’ advisory andsub-advisory contracts with Invesco Advisers and its affiliates. This review is required by the Investment Company Act of 1940 and focuses on the nature and quality of the services Invesco provides as the adviser to the Invesco funds and the reasonableness of the fees that it charges for those services. Each year, we spend months carefully reviewing information received from Invesco and a variety of independent sources, such as performance and fee data prepared by Lipper, Inc. (a subsidiary of Broadridge Financial Solutions, Inc.), an independent, third-party firm widely recognized as a leader in its field. We also meet with our independent legal counsel and other independent advisers to review and help us assess the information that we have received. Our goal is to assure that you receive quality investment management services for a reasonable fee.
I trust the measures outlined above provide assurance that you have a worthy advocate when it comes to choosing the Invesco Funds.
On behalf of the Board, we look forward to continuing to represent your interests and serving your needs.
Sincerely,

Bruce L. Crockett
Independent Chair
Invesco Funds Board of Trustees
3 Invesco International Growth Fund
Management’s Discussion of Fund Performance
| | | | |
Performance summary For the fiscal year ended October 31, 2019, Class A shares of Invesco International Growth Fund (the Fund), at net asset value (NAV), outperformed the Custom Invesco International Growth Index, the Fund’s style-specific benchmark. Your Fund’s long-term performance appears later in this report. | |
| |
Fund vs. Indexes | |
Total returns, October 31, 2018 to October 31, 2019, at net asset value (NAV). Performance shown does not include applicable contingent deferred sales charges (CDSC) orfront-end sales charges, which would have reduced performance. | |
| |
Class A Shares | | | 17.23 | % |
Class C Shares | | | 16.37 | |
Class R Shares | | | 16.99 | |
Class Y Shares | | | 17.55 | |
Class R5 Shares | | | 17.66 | |
Class R6 Shares | | | 17.74 | |
MSCI All Country Worldex-USA Indexq(Broad Market Index) | | | 11.27 | |
Custom Invesco International Growth Index⬛(Style-Specific Index) | | | 16.66 | |
Lipper InternationalLarge-Cap Growth Funds Index◆(Peer Group Index) | | | 15.79 | |
Source(s):qRIMES Technologies Corp.;⬛Invesco, RIMES Technologies Corp.;◆Lipper Inc. | | | | |
Market conditions and your Fund
The fiscal year began with global equity markets, particularly the US, declining sharply at the end of 2018 amid rising interest rates, a flattening US Treasury yield curve, signaling a possible recession, and concerns that higher inflation could result in a more restrictive monetary policy. Investors also had concerns over the Brexit negotiations, ongoing trade tensions between the US and China, declining oil prices and fears of slowing economic growth, particularly in the eurozone.
After a relatively calm start at the beginning of 2019, global equity markets faced greater volatility in the second quarter, hampered by ongoing US and China trade issues, potential for new tariffs and slowing global economic growth. Global equity markets, particularly China, declined sharply in May 2019, ending a four-month rally. Trade and tariff issues, which were not limited to the US and China, clouded the outlook for many
global economies. Disagreement within the UK about its withdrawal from the European Union increased uncertainty for the UK and eurozone economies. Following better performance in June, most global equity markets managed modest positive returns for the second quarter of 2019, with developed markets generally outperforming emerging markets. China was an exception, declining during the second quarter.
Weakening global economic data and the ongoing US and China trade conflict contributed to higher market volatility in the third quarter of 2019. During the third quarter, data released showed slowing manufacturing activity and declining business investment, which was evidence that trade tensions were stifling economic growth across both developed and emerging markets. Global recession concerns caused a sharp equitysell-off in August 2019 as investors crowded into asset classes perceived as safe havens, including US Treasuries and gold. In September 2019, both the US Federal
Reserve and European Central Bank cut interest rates, providing a measure of support for risk assets. Growing optimism about a potential trade deal between the US and China also boosted equities in September. However, except for the US and Japan, performance in most regions declined during the third quarter. Uncertainty about the UK’s withdrawal from the European Union continued to weigh on UK and European equities, while political and trade issues affected areas of Latin America and Asia.
Global equity markets gained in October 2019 amid several positive catalysts, including a US interest rate cut, optimism surrounding US and China trade negotiations, and a raft of upbeat corporate results. The UK equity market provided a flat return during October and while domestic politics continued to dominate the region, European markets made modest gains. October was also a positive month for emerging equity markets with all regions recording gains. Despite increased market volatility, global equity indexes, in both developed and emerging markets, ended the fiscal year in positive territory.
Regardless of the macroeconomic environment, we remain focused on ourbottom-up investment approach of identifying attractive companies that fit our earnings, quality and valuation (EQV) process.
During the fiscal year, relative outperformance versus the Fund’s style-specific index was primarily driven by stock selection to the consumer staples sector. Within the sector, China-based spirits producersKweichow MoutaiandWuliangye Yibincontributed favorably to both the Fund’s absolute and relative performance. The companies benefited from the consumption upgrade cycle in China with the popularity of its premium Baiju brands. Overweight exposure to the consumer staples sector added to the Fund’s relative performance as well. The
| | | | |
| |
Portfolio Composition | |
By sector | | | % of total net assets | |
| | | | |
| |
Industrials | | | 17.50 | % |
Financials | | | 17.47 | |
Consumer Staples | | | 16.77 | |
Information Technology | | | 16.04 | |
Consumer Discretionary | | | 12.14 | |
Health Care | | | 6.67 | |
Communication Services | | | 4.38 | |
Energy | | | 3.01 | |
Materials | | | 2.66 | |
Money Market Funds Plus Other | | | | |
Assets Less Liabilities | | | 3.36 | |
| | | | |
| |
Top 10 Equity Holdings* | |
% of total net assets | |
1. CGI, Inc. | | | 3.65 | % |
2. SAP S.E. | | | 2.97 | |
3. Wolters Kluwer N.V. | | | 2.78 | |
4. Investor AB, Class B | | | 2.75 | |
5. Allianz S.E. | | | 2.65 | |
6. Taiwan Semiconductor Manufacturing Co., Ltd. | | | 2.56 | |
7. Philip Morris International, Inc. | | | 2.50 | |
8. Deutsche Boerse AG | | | 2.39 | |
9. Hoya Corp. | | | 2.21 | |
10. RELX PLC | | | 2.21 | |
| | | | |
| | |
Total Net Assets | | $ | 5.0 billion | |
Total Number of Holdings* | | | 62 | |
The Fund’s holdings are subject to change, and there is no assurance that the Fund will continue to hold any particular security.
*Excluding money market fund holdings, if any. Data presented here are as of October 31, 2019.
4 Invesco International Growth Fund
Fund’s holdings in the industrials and health care sectors also contributed to relative performance. In the industrials sector, Netherlands-basedWolters KluwerandUK-basedRELXcontributed to both the Fund’s absolute and relative performance during the fiscal year. Within health care, Japanese global medtech companyHoyawas a key contributor to the Fund’s absolute and relative return. On a geographic basis, strong stock selection in China and Japan contributed to the Fund’s absolute and relative performance. Underweight exposure to both countries relative to the style-specific index added to relative results during the fiscal year, as well.
The Fund’s holdings in the energy sector, however, underperformed those of the style-specific benchmark and were the most significant detractors from both the Fund’s absolute and relative performance during the fiscal year. Weakness was seen in Canada-based companiesPrairieSky RoyaltyandSuncor EnergyandUK-basedTechnipFMC. The Fund’s overweight exposure to a weakened energy sector also detracted from relative return during the fiscal year. Stock selection in the materials sector also detracted from the Fund’s relative performance. Lack of exposure to strong index performers, including metals and mining company BHP Group and industrial gases and services supplier Air Liquide, hampered relative results. Geographically, the Fund’s holdings in the UK and Canada underperformed those of the style-specific index and were among the largest detractors from relative performance. In a rising market environment, the Fund’s cash exposure (which averaged around 4% during the fiscal year) detracted from the Fund’s performance relative to the style-specific index. It is important to note that cash is a residual of ourbottom-up investment process and not the result of anytop-down tactical asset allocation or risk-management allocation decision.
During the fiscal year, we continued to look for opportunities to improve the growth potential and quality of the Fund’s portfolio by adding companies based on our EQV outlook for each company. We added several new holdings, including France-based testing, inspection and certification services companyBureau Veritas,Brazil-based beer and soft drink distributorAmbevand Ireland-based contract research organization companyICON. We sold several holdings, including China-based consumer staples companyHenan Shuanghui
Investment & Development, Australia-based industrials companyBramblesandUK-based consumer staples companyUnilever. After owning consumer products maker Unilever for over a decade, we exited our position in early 2019 driven by concerns about rising valuation levels, higher risks to the business, as well as turnover in management.
As always, regardless of the macroeconomic environment, we remain focused on abottom-up investment approach of identifying attractive companies that fit ourEQV-focused investment process. We continue to look for high-quality companies that exhibit the following characteristics: strong organic growth; high returns on capital; pricing power; strong balance sheets; cash generation; and reasonable valuations. In addition, we continue to favor companies that are able to consistently generate cash during weak economic environments. Our balancedEQV-focused approach aligns with our goal of delivering attractive returns over the long term.
We thank you for your continued investment in Invesco International Growth Fund.
Portfolio managers:
Brent Bates
Matthew Dennis
Mark Jason
Richard Nield
Clas Olsson
The views and opinions expressed in management’s discussion of Fund performance are those of Invesco Advisers, Inc. These views and opinions are subject to change at any time based on factors such as market and economic conditions. These views and opinions may not be relied upon as investment advice or recommendations, or as an offer for a particular security. The information is not a complete analysis of every aspect of any market, country, industry, security or the Fund. Statements of fact are from sources considered reliable, but Invesco Advisers, Inc. makes no representation or warranty as to their completeness or accuracy. Although historical performance is no guarantee of future results, these insights may help you understand our investment management philosophy.
See important Fund and, if applicable, index disclosures later in this report.
5 Invesco International Growth Fund
Your Fund’s Long-Term Performance
Results of a $10,000 Investment — Oldest Share Class(es)
Fund and index data from 10/31/09
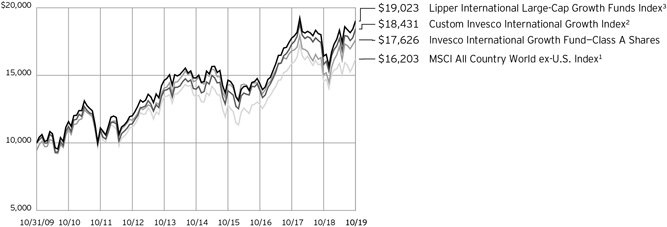
| 1 | Source: RIMES Technologies Corp. |
| 2 | Source(s): Invesco, RIMES Technologies Corp. |
Past performance cannot guarantee comparable future results.
The data shown in the chart include reinvested distributions, applicable sales charges and Fund expenses including
management fees. Index results include reinvested dividends, but they do not reflect sales charges. Performance of the peer group, if applicable, reflects fund expenses and management fees;
performance of a market index does not. Performance shown in the chart does not reflect deduction of taxes a shareholder would pay on Fund distributions or sale of Fund shares.
6 Invesco International Growth Fund
| | | | |
Average Annual Total Returns | |
As of 10/31/19, including maximum applicable sales charges | |
Class A Shares | | | | |
Inception (4/7/92) | | | 7.08 | % |
10 Years | | | 5.83 | |
5 Years | | | 2.65 | |
1 Year | | | 10.78 | |
| |
Class C Shares | | | | |
Inception (8/4/97) | | | 4.82 | % |
10 Years | | | 5.64 | |
5 Years | | | 3.04 | |
1 Year | | | 15.37 | |
| |
Class R Shares | | | | |
Inception (6/3/02) | | | 6.57 | % |
10 Years | | | 6.17 | |
5 Years | | | 3.57 | |
1 Year | | | 16.99 | |
| |
Class Y Shares | | | | |
Inception (10/3/08) | | | 6.71 | % |
10 Years | | | 6.70 | |
5 Years | | | 4.08 | |
1 Year | | | 17.55 | |
| |
Class R5 Shares | | | | |
Inception (3/15/02) | | | 7.28 | % |
10 Years | | | 6.81 | |
5 Years | | | 4.17 | |
1 Year | | | 17.66 | |
| |
Class R6 Shares | | | | |
10 Years | | | 6.75 | % |
5 Years | | | 4.26 | |
1 Year | | | 17.74 | |
Class R6 shares incepted on September 24, 2012. Performance shown prior to that date is that of Class A shares and includes the12b-1 fees applicable to Class A shares.
The performance data quoted represent past performance and cannot guarantee comparable future results; current performance may be lower or higher. Please visit invesco.com/performance for the most recentmonth-end performance. Performance figures reflect reinvested distributions, changes in net asset value and the effect of the maximum sales charge unless otherwise stated. Performance figures do not reflect deduction of taxes a shareholder would pay on Fund distributions or sale of Fund shares. Investment return and principal value will fluctuate so that you may have a gain or loss when you sell shares.
The net annual Fund operating expense ratio set forth in the most recent Fund prospectus as of the date of this report for Class A, Class C,
| | | | |
Average Annual Total Returns | |
As of 9/30/19, the most recent calendar quarter end, including maximum applicable sales charges | |
Class A Shares | | | | |
Inception (4/7/92) | | | 7.02 | % |
10 Years | | | 5.51 | |
5 Years | �� | | 2.35 | |
1 Year | | | 0.06 | |
| |
Class C Shares | | | | |
Inception (8/4/97) | | | 4.74 | % |
10 Years | | | 5.31 | |
5 Years | | | 2.74 | |
1 Year | | | 4.12 | |
| |
Class R Shares | | | | |
Inception (6/3/02) | | | 6.47 | % |
10 Years | | | 5.84 | |
5 Years | | | 3.25 | |
1 Year | | | 5.60 | |
| |
Class Y Shares | | | | |
Inception (10/3/08) | | | 6.55 | % |
10 Years | | | 6.37 | |
5 Years | | | 3.76 | |
1 Year | | | 6.13 | |
| |
Class R5 Shares | | | | |
Inception (3/15/02) | | | 7.19 | % |
10 Years | | | 6.49 | |
5 Years | | | 3.85 | |
1 Year | | | 6.26 | |
| |
Class R6 Shares | | | | |
10 Years | | | 6.42 | % |
5 Years | | | 3.95 | |
1 Year | | | 6.33 | |
Class R, Class Y, Class R5 and Class R6 shares was 1.31%, 2.06%, 1.56%, 1.06%, 0.98% and 0.90%, respectively.1 The total annual Fund operating expense ratio set forth in the most recent Fund prospectus as of the date of this report for Class A, Class C, Class R, Class Y, Class R5 and Class R6 shares was 1.32%, 2.07%, 1.57%, 1.07%, 0.99% and 0.91%,respectively. The expense ratios presented above may vary from the expense ratios presented in other sections of this report that are based on expenses incurred during the period covered by this report.
Class A share performance reflects the maximum 5.50% sales charge, and Class C share performance reflects the applicable contingent deferred sales charge (CDSC) for the period involved. The CDSC on Class C shares is 1% for the first year after purchase. Class R, Class Y, Class R5 and Class R6 shares do not have afront-end sales charge or
a CDSC; therefore, performance is at net asset value.
The performance of the Fund’s share classes will differ primarily due to different sales charge structures and class expenses.
Fund performance reflects any applicable fee waivers and/or expense reimbursements. Had the adviser not waived fees and/or reimbursed expenses currently or in the past, returns would have been lower. See current prospectus for more information.
| 1 | Total annual Fund operating expenses after any contractual fee waivers and/or expense reimbursements by the adviser in effect through at least June 30, 2021. See current prospectus for more information. |
7 Invesco International Growth Fund
Invesco International Growth Fund’s investment objective is long-term growth of capital.
∎ Unless otherwise stated, information presented in this report is as of October 31, 2019, and is based on total net assets.
∎ Unless otherwise noted, all data provided by Invesco.
∎ To access your Fund’s reports/prospectus, visit invesco.com/fundreports.
About share classes
| ∎ | Class R sharesare generally available only to employer sponsored retirement and benefit plans. Please see the prospectus for more information. |
| ∎ | Class Y sharesare available only to certain investors. Please see the prospectus for more information. |
| ∎ | Class R5 sharesandClass R6 sharesare available for use by retirement plans that meet certain standards and for institutional investors. Class R6 shares are also available through intermediaries that have established an agreement with Invesco Distributors, Inc. to make such shares available for use in retail omnibus accounts. Please see the prospectus for more information. |
Principal risks of investing in the Fund
| ∎ | Depositary receipts risk.Investing in depositary receipts involves the same risks as direct investments in foreign securities. In addition, the underlying issuers of certain depositary receipts are under no obligation to distribute shareholder communications or pass through any voting rights with respect to the deposited securities to the holders of such receipts. The Fund may therefore receive less timely information or have less control than if it invested directly in the foreign issuer. |
| ∎ | Derivatives risk. The value of a derivative instrument depends largely on (and is derived from) the value of an underlying security, currency, commodity, interest rate, index or other asset (each referred to as an underlying asset). In addition to risks relating to the underlying assets, the use of derivatives may include other, possibly greater, risks, including counterparty, leverage and liquidity risks. Counterparty risk is the risk that the counterparty to the derivative contract will default on its obligation to pay the Fund the amount owed or otherwise perform under the derivative |
| | contract. Derivatives create leverage risk because they do not require payment up front equal to the economic exposure created by holding a position in the derivative. As a result, an adverse change in the value of the underlying asset could result in the Fund sustaining a loss that is substantially greater than the amount invested in the derivative or the anticipated value of the underlying asset, which may make the Fund’s returns more volatile and increase the risk of loss. Derivative instruments may also be less liquid than more traditional investments and the Fund may be unable to sell or close out its derivative positions at a desirable time or price. This risk may be more acute under adverse market conditions, during which the Fund may be most in need of liquidating its derivative positions. Derivatives may also be harder to value, less tax efficient and subject to changing government regulation that could impact the Fund’s ability to use certain derivatives or their cost. Derivatives strategies may not always be successful. For example, derivatives used for hedging or to gain or limit exposure to a particular market segment may not provide the expected benefits, particularly during adverse market conditions. |
| ∎ | Emerging markets securities risk. Emerging markets (also referred to as developing markets) are generally subject to greater market volatility, political, social and economic instability, uncertain trading markets and more governmental limitations on foreign investment than more developed markets. In addition, companies operating in emerging markets may be subject to lower trading volume and greater price fluctuations than companies in more developed markets. Securities law and the enforcement of systems of taxation in many emerging market countries may change quickly and unpredictably. The Fund’s investments in ChinaA-shares are subject to trading restrictions, quota limitations |
| | and clearing and settlement risks. In addition, investments in emerging markets securities may be subject to additional transaction costs, delays in settlement procedures, and lack of timely information. |
| ∎ | Foreign securities risk. The Fund’s foreign investments may be adversely affected by political and social instability, changes in economic or taxation policies, difficulty in enforcing obligations, decreased liquidity or increased volatility. Foreign investments also involve the risk of the possible seizure, nationalization or expropriation of the issuer or foreign deposits (in which the Fund could lose its entire investments in a certain market) and the possible adoption of foreign governmental restrictions such as exchange controls. Unless the Fund has hedged its foreign securities risk, foreign securities risk also involves the risk of negative foreign currency rate fluctuations, which may cause the value of securities denominated in such foreign currency (or other instruments through which the Fund has exposure to foreign currencies) to decline in value. Currency exchange rates may fluctuate significantly over short periods of time. Currency hedging strategies, if used, are not always successful. |
| ∎ | Geographic focus risk. The Fund may from time to time invest a substantial amount of its assets in securities of issuers located in a single country or a limited number of countries. Adverse economic, political or social conditions in those countries may therefore have a significant negative impact on the Fund’s investment performance. |
| ∎ | Growth investing risk. Growth stocks tend to be more expensive relative to the issuing company’s earnings or assets compared with other types of stock. As a result, they tend to be more sensitive to changes in, or investors’ expectations of, the issuing company’s earnings and can be more volatile. |
| | |
| This report must be accompanied or preceded by a currently effective Fund prospectus, which contains more complete information, including sales charges and expenses. Investors should read it carefully before investing. | | |
NOT FDIC INSURED | MAY LOSE VALUE | NO BANK GUARANTEE | | |
8 Invesco International Growth Fund
| ∎ | Investing in the European Union risk. Investments in certain countries in the European Union are susceptible to high economic risks associated with high levels of debt, such as investments in sovereign debt of Greece, Italy and Spain. Efforts of the member states to further unify their economic and monetary policies may increase the potential for the downward movement of one member state’s market to cause a similar effect on other member states’ markets. Separately, the European Union faces issues involving its membership, structure, procedures and policies. The exit of one or more member states from the European Union, such as the United Kingdom (UK) which has announced its intention to exit, would place its currency and banking system in jeopardy. The exit by the UK or other member states will likely result in increased volatility, illiquidity and potentially lower economic growth in the affected markets, which will adversely affect the Fund’s investments. |
| ∎ | Management risk. The Fund is actively managed and depends heavily on the Adviser’s judgment about markets, interest rates or the attractiveness, relative values, liquidity, or potential appreciation of particular investments made for the Fund’s portfolio. The Fund could experience losses if these judgments prove to be incorrect. Additionally, legislative, regulatory, or tax developments may adversely affect management of the Fund and, therefore, the ability of the Fund to achieve its investment objective. |
| ∎ | Market risk. The market values of the Fund’s investments, and therefore the value of the Fund’s shares, will go up and down, sometimes rapidly or unpredictably. Market risk may affect a single issuer, industry or section of the economy, or it may affect the market as a whole. Individual stock prices tend to go up and down more dramatically than those of certain other types of investments, such as bonds. During a general downturn in the financial markets, multiple asset classes may decline in value. When markets perform well, there can be no assurance that specific investments held by the Fund will rise in value. |
| ∎ | Mid-Capitalization companies Risk.Mid-capitalization companies tend to be more vulnerable to changing market conditions and may have more limited product lines and markets, less experienced management and fewer |
| | financial resources than larger companies. These companies’ securities may be more volatile and less liquid than those of more established companies, and their returns may vary, sometimes significantly, from the overall securities market. |
| ∎ | Preferred securities risk. Preferred securities are subject to issuer-specific and market risks applicable generally to equity securities. Preferred securities also may be subordinated to bonds or other debt instruments, subjecting them to a greater risk ofnon-payment, may be less liquid than many other securities, such as common stocks, and generally offer no voting rights with respect to the issuer. |
| ∎ | Sector focus risk.The Fund may from time to time invest a significant amount of its assets (i.e. over 25%) in one market sector or group of related industries. In this event, the Fund’s performance will depend to a greater extent on the overall condition of the sector or group of industries and there is increased risk that the Fund will lose significant value if conditions adversely affect that sector or group of industries. |
About indexes used in this report
| ∎ | TheMSCI All Country Worldex-USA Indexis an index considered representative of developed and emerging stock markets, excluding the US. The index is computed using the net return, which withholds applicable taxes fornon-resident investors. |
| ∎ | TheCustom Invesco International Growth Indexis composed of the MSCI EAFE Growth Index through February 28, 2013, and the MSCI All Country Worldex-U.S. Growth Index thereafter. |
| ∎ | TheLipper InternationalLarge-Cap Growth Funds Indexis an unmanaged index considered representative of internationallarge-cap growth funds tracked by Lipper. |
| ∎ | TheMSCI EAFE® Growth Indexis an unmanaged index considered representative of growth stocks of Europe, Australasia and the Far East. The index is computed using the net return, which withholds applicable taxes fornon-resident investors. |
| ∎ | TheMSCI All Country Worldex-U.S. Growth Indexis a market capitalization weighted index that includes growth companies in developed and emerging markets throughout the world, excluding the US. The index is |
| | computed using the net return, which withholds applicable taxes for nonresident investors. |
| ∎ | The Fund is not managed to track the performance of any particular index, including the index(es) described here, and consequently, the performance of the Fund may deviate significantly from the performance of the index(es). |
| ∎ | A direct investment cannot be made in an index. Unless otherwise indicated, index results include reinvested dividends, and they do not reflect sales charges. Performance of the peer group, if applicable, reflects fund expenses; performance of a market index does not. |
Other information
| ∎ | The returns shown in management’s discussion of Fund performance are based on net asset values (NAVs) calculated for shareholder transactions. Generally accepted accounting principles require adjustments to be made to the net assets of the Fund at period end for financial reporting purposes, and as such, the NAVs for shareholder transactions and the returns based on those NAVs may differ from the NAVs and returns reported in the Financial Highlights. |
| ∎ | Industry classifications used in this report are generally according to the Global Industry Classification Standard, which was developed by and is the exclusive property and a service mark of MSCI Inc. and Standard & Poor’s. |
9 Invesco International Growth Fund
Schedule of Investments
October 31, 2019
| | | | | | | | |
| | | Shares | | | Value | |
Common Stocks & Other Equity Interests–96.64% | |
| Australia–0.78% | |
CSL Ltd. | | | 222,661 | | | $ | 39,190,791 | |
| |
|
| Brazil–4.08% | |
Ambev S.A., ADR | | | 16,662,003 | | | | 71,813,233 | |
| |
B3 S.A.-Brasil, Bolsa, Balcao | | | 5,745,202 | | | | 69,306,289 | |
| |
Banco Bradesco S.A., ADR | | | 7,176,875 | | | | 62,869,425 | |
| |
| | | | | | | 203,988,947 | |
| |
|
| Canada–8.75% | |
Canadian National Railway Co. | | | 1,015,830 | | | | 90,854,737 | |
| |
CGI, Inc.(a) | | | 2,347,686 | | | | 182,488,871 | |
| |
Nutrien Ltd. | | | 1,518,739 | | | | 72,656,400 | |
| |
PrairieSky Royalty Ltd. | | | 3,406,972 | | | | 33,265,249 | |
| |
Suncor Energy, Inc. | | | 1,966,264 | | | | 58,460,936 | |
| |
| | | | | | | 437,726,193 | |
| |
|
| China–6.53% | |
Alibaba Group Holding Ltd., ADR(a) | | | 469,858 | | | | 83,009,813 | |
| |
Kweichow Moutai Co., Ltd., A Shares | | | 244,374 | | | | 40,932,087 | |
| |
New Oriental Education & Technology Group, Inc.,
ADR(a) | | | 447,665 | | | | 54,641,990 | |
| |
Wuliangye Yibin Co., Ltd., A Shares | | | 3,180,976 | | | | 59,469,561 | |
| |
Yum China Holdings, Inc. | | | 2,087,798 | | | | 88,731,415 | |
| |
| | | | | | | 326,784,866 | |
| |
|
| Denmark–1.51% | |
Carlsberg A/S, Class B | | | 535,689 | | | | 75,358,513 | |
| |
|
| France–9.78% | |
Bureau Veritas S.A. | | | 3,745,373 | | | | 95,662,308 | |
| |
EssilorLuxottica S.A. | | | 372,494 | | | | 56,853,269 | |
| |
Pernod Ricard S.A. | | | 308,344 | | | | 56,932,938 | |
| |
Schneider Electric S.E. | | | 992,225 | | | | 92,436,576 | |
| |
Vinci S.A. | | | 954,071 | | | | 107,084,382 | |
| |
Vivendi S.A. | | | 2,889,242 | | | | 80,560,991 | |
| |
| | | | | | | 489,530,464 | |
| |
|
| Germany–8.62% | |
Allianz S.E. | | | 543,198 | | | | 132,571,507 | |
| |
Beiersdorf AG | | | 255,864 | | | | 30,317,186 | |
| |
Deutsche Boerse AG | | | 772,710 | | | | 119,711,153 | |
| |
SAP S.E. | | | 1,123,476 | | | | 148,816,047 | |
| |
| | | | | | | 431,415,893 | |
| |
|
| Hong Kong–1.02% | |
AIA Group Ltd. | | | 5,135,800 | | | | 50,959,752 | |
| |
|
| Ireland–0.92% | |
ICON PLC(a) | | | 313,798 | | | | 46,096,926 | |
| |
|
| Italy–2.37% | |
FinecoBank Banca Fineco S.p.A. | | | 6,496,778 | | | | 73,262,313 | |
| |
| | | | | | | | |
| | | Shares | | | Value | |
|
| Italy–(continued) | |
Mediobanca Banca di Credito Finanziario S.p.A. | | | 3,783,642 | | | $ | 45,081,017 | |
| |
| | | | | | | 118,343,330 | |
| |
|
| Japan–10.94% | |
Asahi Group Holdings, Ltd. | | | 2,060,100 | | | | 103,103,091 | |
| |
FANUC Corp. | | | 307,412 | | | | 60,684,751 | |
| |
Hoya Corp. | | | 1,248,100 | | | | 110,740,666 | |
| |
Kao Corp. | | | 753,000 | | | | 60,572,130 | |
| |
Keyence Corp. | | | 119,400 | | | | 75,390,045 | |
| |
Koito Manufacturing Co. Ltd. | | | 762,000 | | | | 39,744,670 | |
| |
Komatsu Ltd. | | | 1,737,600 | | | | 40,721,198 | |
| |
SMC Corp. | | | 130,600 | | | | 56,380,021 | |
| |
| | | | | | | 547,336,572 | |
| |
|
| Macau–1.70% | |
Galaxy Entertainment Group Ltd. | | | 12,454,090 | | | | 85,026,138 | |
| |
|
| Mexico–1.53% | |
Fomento Economico Mexicano, S.A.B. de C.V., ADR | | | 862,339 | | | | 76,765,418 | |
| |
|
| Netherlands–4.11% | |
ING Groep N.V. | | | 5,906,021 | | | | 66,730,443 | |
| |
Wolters Kluwer N.V. | | | 1,884,923 | | | | 138,821,482 | |
| |
| | | | | | | 205,551,925 | |
| |
|
| Singapore–1.52% | |
United Overseas Bank Ltd. | | | 3,861,666 | | | | 76,023,026 | |
| |
|
| South Korea–3.02% | |
NAVER Corp. | | | 356,648 | | | | 50,202,948 | |
| |
Samsung Electronics Co., Ltd. | | | 2,330,180 | | | | 100,712,949 | |
| |
| | | | | | | 150,915,897 | |
| |
|
| Spain–1.46% | |
Amadeus IT Group S.A. | | | 985,684 | | | | 72,968,626 | |
| |
|
| Sweden–2.75% | |
Investor AB, Class B | | | 2,684,843 | | | | 137,775,559 | |
| |
|
| Switzerland–6.35% | |
Alcon, Inc.(a) | | | 814,465 | | | | 48,118,648 | |
| |
Cie Financiere Richemont S.A. | | | 736,739 | | | | 58,001,243 | |
| |
Julius Baer Group Ltd.(a) | | | 900,217 | | | | 39,736,372 | |
| |
Kuehne + Nagel International AG | | | 508,539 | | | | 82,173,804 | |
| |
Novartis AG | | | 1,024,033 | | | | 89,457,123 | |
| |
| | | | | | | 317,487,190 | |
| |
|
| Taiwan–2.56% | |
Taiwan Semiconductor Manufacturing Co., Ltd. | | | 13,183,887 | | | | 128,085,153 | |
| |
See accompanying Notes to Financial Statements which are an integral part of the financial statements.
10 Invesco International Growth Fund
| | | | | | | | |
| | | Shares | | | Value | |
United Kingdom–9.70% | |
British American Tobacco PLC | | | 2,062,985 | | | $ | 72,104,713 | |
| |
Compass Group PLC | | | 3,334,521 | | | | 88,882,846 | |
| |
Informa PLC | | | 8,780,880 | | | | 88,177,737 | |
| |
Reckitt Benckiser Group PLC | | | 859,718 | | | | 66,465,264 | |
| |
RELX PLC | | | 4,590,097 | | | | 110,511,863 | |
| |
TechnipFMC PLC | | | 2,974,778 | | | | 59,074,107 | |
| |
| | | | | | | 485,216,530 | |
| |
|
United States–6.64% | |
Amcor PLC, CDI | | | 6,345,456 | | | | 60,417,788 | |
| |
Booking Holdings, Inc.(a) | | | 25,662 | | | | 52,575,536 | |
| |
Broadcom, Inc. | | | 321,422 | | | | 94,128,432 | |
| |
Philip Morris International, Inc. | | | 1,538,664 | | | | 125,308,796 | |
| |
| | | | | | | 332,430,552 | |
| |
Total Common Stocks & Other Equity Interests
(Cost $3,200,723,653) | | | | 4,834,978,261 | |
| |
| | | | | | | | |
| | | Shares | | | Value | |
Money Market Funds–1.60% | | | | | |
Invesco Government & Agency Portfolio, Institutional Class, 1.71%(b) | | | 28,006,209 | | | $ | 28,006,209 | |
| |
Invesco Liquid Assets Portfolio, Institutional Class, 1.90%(b) | | | 20,013,666 | | | | 20,021,672 | |
| |
Invesco Treasury Portfolio, Institutional Class, 1.66%(b) | | | 32,007,096 | | | | 32,007,096 | |
| |
Total Money Market Funds
(Cost $80,026,572) | | | | 80,034,977 | |
| |
TOTAL INVESTMENTS IN
SECURITIES–98.24%
(Cost $3,280,750,225) | | | | 4,915,013,238 | |
| |
OTHER ASSETS LESS LIABILITIES–1.76% | | | | 87,894,914 | |
| |
NET ASSETS–100.00% | | | $ | 5,002,908,152 | |
| |
Investment Abbreviations:
| | | | |
| ADR | | – American Depositary Receipt | | |
| CDI | | – CREST Depository Interest | | |
Notes to Schedule of Investments:
| (a) | Non-income producing security. |
| (b) | The money market fund and the Fund are affiliated by having the same investment adviser. The rate shown is the7-day SEC standardized yield as of October 31, 2019. |
See accompanying Notes to Financial Statements which are an integral part of the financial statements.
11 Invesco International Growth Fund
Statement of Assets and Liabilities
October 31, 2019
| | | | |
Assets: | | | | |
Investments in securities, at value
(Cost $3,200,723,653) | | $ | 4,834,978,261 | |
| |
Investments in affiliated money market funds, at value
(Cost $80,026,572) | | | 80,034,977 | |
| |
Foreign currencies, at value
(Cost $11,689,112) | | | 11,743,323 | |
| |
Receivable for: | | | | |
Investments sold | | | 76,574,044 | |
| |
Dividends | | | 13,877,710 | |
| |
Fund shares sold | | | 1,871,421 | |
| |
Investment for trustee deferred compensation and retirement plans | | | 823,579 | |
| |
Other assets | | | 65,512 | |
| |
Total assets | | | 5,019,968,827 | |
| |
| |
Liabilities: | | | | |
Payable for: | | | | |
Investments purchased | | | 3,364,642 | |
| |
Fund shares reacquired | | | 10,168,854 | |
| |
Accrued fees to affiliates | | | 2,056,344 | |
| |
Accrued trustees’ and officers’ fees and benefits | | | 5,096 | |
| |
Accrued other operating expenses | | | 549,453 | |
| |
Trustee deferred compensation and retirement plans | | | 916,286 | |
| |
Total liabilities | | | 17,060,675 | |
| |
Net assets applicable to shares outstanding | | $ | 5,002,908,152 | |
| |
| |
Net assets consist of: | | | | |
Shares of beneficial interest | | $ | 2,978,602,822 | |
| |
Distributable earnings | | | 2,024,305,330 | |
| |
| | $ | 5,002,908,152 | |
| |
| |
Net Assets: | | | | |
Class A | | $ | 1,534,829,745 | |
| |
Class C | | $ | 55,768,147 | |
| |
Class R | | $ | 62,044,737 | |
| |
Class Y | | $ | 1,091,696,611 | |
| |
Class R5 | | $ | 735,591,831 | |
| |
Class R6 | | $ | 1,522,977,081 | |
| |
| | | | |
|
Shares outstanding, no par value, with an unlimited number of shares authorized: | |
Class A | | | 45,004,381 | |
| |
Class C | | | 1,798,381 | |
| |
Class R | | | 1,844,626 | |
| |
Class Y | | | 31,909,769 | |
| |
Class R5 | | | 21,164,140 | |
| |
Class R6 | | | 43,878,950 | |
| |
Class A: | | | | |
Net asset value per share | | $ | 34.10 | |
| |
Maximum offering price per share
(Net asset value of $34.10 ÷ 94.50%) | | $ | 36.08 | |
| |
Class C: | | | | |
Net asset value and offering price per share | | $ | 31.01 | |
| |
Class R: | | | | |
Net asset value and offering price per share | | $ | 33.64 | |
| |
Class Y: | | | | |
Net asset value and offering price per share | | $ | 34.21 | |
| |
Class R5: | | | | |
Net asset value and offering price per share | | $ | 34.76 | |
| |
Class R6: | | | | |
Net asset value and offering price per share | | $ | 34.71 | |
| |
See accompanying Notes to Financial Statements which are an integral part of the financial statements.
12 Invesco International Growth Fund
Statement of Operations
For the year ended October 31, 2019
| | | | |
Investment income: | | | | |
Dividends (net of foreign withholding taxes of $14,239,852) | | $ | 140,349,500 | |
| |
Dividends from affiliated money market funds | | | 4,402,582 | |
| |
Total investment income | | | 144,752,082 | |
| |
| |
Expenses: | | | | |
Advisory fees | | | 48,622,308 | |
| |
Administrative services fees | | | 774,627 | |
| |
Custodian fees | | | 630,129 | |
| |
Distribution fees: | | | | |
Class A | | | 3,866,802 | |
| |
Class C | | | 713,144 | |
| |
Class R | | | 323,615 | |
| |
Transfer agent fees - A, C, R and Y | | | 5,581,936 | |
| |
Transfer agent fees - R5 | | | 852,183 | |
| |
Transfer agent fees - R6 | | | 129,342 | |
| |
Trustees’ and officers’ fees and benefits | | | 91,730 | |
| |
Registration and filing fees | | | 191,357 | |
| |
Reports to shareholders | | | 483,293 | |
| |
Professional services fees | | | 164,175 | |
| |
Other | | | 100,184 | |
| |
Total expenses | | | 62,524,825 | |
| |
Less: Fees waived and/or expense offset arrangement(s) | | | (242,197 | ) |
| |
Net expenses | | | 62,282,628 | |
| |
Net investment income | | | 82,469,454 | |
| |
| |
Realized and unrealized gain from: | | | | |
Net realized gain from: | | | | |
Investment securities (net of foreign taxes of $225,965) | | | 396,128,544 | |
| |
Foreign currencies | | | 1,673,197 | |
| |
| | | 397,801,741 | |
| |
Change in net unrealized appreciation of: | | | | |
Investment securities (net of foreign taxes of $1,160,718) | | | 428,982,852 | |
| |
Foreign currencies | | | 573,979 | |
| |
| | | 429,556,831 | |
| |
Net realized and unrealized gain | | | 827,358,572 | |
| |
Net increase in net assets resulting from operations | | $ | 909,828,026 | |
| |
See accompanying Notes to Financial Statements which are an integral part of the financial statements.
13 Invesco International Growth Fund
Statement of Changes in Net Assets
For the years ended October 31, 2019 and 2018
| | | | | | | | |
| | | 2019 | | | 2018 | |
| |
Operations: | | | | | | | | |
Net investment income | | $ | 82,469,454 | | | $ | 116,253,537 | |
| |
Net realized gain | | | 397,801,741 | | | | 455,168,961 | |
| |
Change in net unrealized appreciation (depreciation) | | | 429,556,831 | | | | (1,353,496,753 | ) |
| |
Net increase (decrease) in net assets resulting from operations | | | 909,828,026 | | | | (782,074,255 | ) |
| |
| | |
Distributions to shareholders from distributable earnings: | | | | | | | | |
Class A | | | (134,174,325 | ) | | | (57,438,581 | ) |
| |
Class B | | | - | | | | (75,400 | ) |
| |
Class C | | | (8,736,060 | ) | | | (2,838,805 | ) |
| |
Class R | | | (5,519,651 | ) | | | (2,278,543 | ) |
| |
Class Y | | | (137,588,829 | ) | | | (69,857,015 | ) |
| |
Class R5 | | | (92,022,495 | ) | | | (44,330,743 | ) |
| |
Class R6 | | | (152,009,506 | ) | | | (70,705,298 | ) |
| |
Total distributions from distributable earnings | | | (530,050,866 | ) | | | (247,524,385 | ) |
| |
| | |
Share transactions–net: | | | | | | | | |
Class A | | | (239,943,699 | ) | | | (470,514,726 | ) |
| |
Class B | | | - | | | | (4,410,208 | ) |
| |
Class C | | | (51,239,152 | ) | | | (21,998,878 | ) |
| |
Class R | | | (9,430,841 | ) | | | (22,235,047 | ) |
| |
Class Y | | | (616,287,806 | ) | | | (513,669,057 | ) |
| |
Class R5 | | | (451,501,058 | ) | | | (237,727,066 | ) |
| |
Class R6 | | | (399,726,297 | ) | | | (350,574,996 | ) |
| |
Net increase (decrease) in net assets resulting from share transactions | | | (1,768,128,853 | ) | | | (1,621,129,978 | ) |
| |
Net increase (decrease) in net assets | | | (1,388,351,693 | ) | | | (2,650,728,618 | ) |
| |
| | |
Net assets: | | | | | | | | |
Beginning of year | | | 6,391,259,845 | | | | 9,041,988,463 | |
| |
End of year | | $ | 5,002,908,152 | | | $ | 6,391,259,845 | |
| |
See accompanying Notes to Financial Statements which are an integral part of the financial statements.
14 Invesco International Growth Fund
Financial Highlights
The following schedule presents financial highlights for a share of the Fund outstanding throughout the periods indicated.
| | | | | | | | | | | | | | | | | | | | | | | | | | | | | | | | | | | | | | | | | | | | | | | | | | | | | | | | | | | | | | | | | | | | | | |
| | | Net asset
value,
beginning
of period | | Net
investment
income(a) | | Net gains
(losses)
on securities
(both
realized and
unrealized) | | Total from
investment
operations | | Dividends
from net
investment
income | | Distributions
from net
realized
gains | | Total
distributions | | Net asset
value, end
of
period (b) | | Total
return | | Net assets,
end of period
(000’s omitted) | | Ratio of
expenses
to average
net assets
with fee waivers
and/or
expenses
absorbed | | Ratio of
expenses
to average net
assets without
fee waivers
and/or
expenses
absorbed | | Ratio of net
investment
income
to average
net assets | | Portfolio
turnover (c) |
Class A | | | | | | | | | | | | | | | | | | | | | | | | | | | | | | | | | | | | | | | | | | | | | | | | | | | | | | | | | | | | | | | | | | | | | | |
Year ended 10/31/19 | | | $ | 31.92 | | | | $ | 0.38 | | | | $ | 4.55 | | | | $ | 4.93 | | | | $ | (0.29 | ) | | | $ | (2.46 | ) | | | $ | (2.75 | ) | | | $ | 34.10 | | | | | 17.23 | % | | | $ | 1,534,830 | | | | | 1.33 | %(d) | | | | 1.33 | %(d) | | | | 1.20 | %(d) | | | | 22 | % |
Year ended 10/31/18 | | | | 36.61 | | | | | 0.42 | | | | | (4.18 | ) | | | | (3.76 | ) | | | | (0.60 | ) | | | | (0.33 | ) | | | | (0.93 | ) | | | | 31.92 | | | | | (10.55 | ) | | | | 1,665,413 | | | | | 1.30 | | | | | 1.31 | | | | | 1.20 | | | | | 26 | |
Year ended 10/31/17 | | | | 30.83 | | | | | 0.30 | | | | | 5.85 | | | | | 6.15 | | | | | (0.37 | ) | | | | - | | | | | (0.37 | ) | | | | 36.61 | | | | | 20.19 | | | | | 2,396,149 | | | | | 1.31 | | | | | 1.32 | | | | | 0.89 | | | | | 25 | |
Year ended 10/31/16 | | | | 31.91 | | | | | 0.36 | | | | | (1.06 | ) | | | | (0.70 | ) | | | | (0.38 | ) | | | | - | | | | | (0.38 | ) | | | | 30.83 | | | | | (2.16 | ) | | | | 2,332,125 | | | | | 1.31 | | | | | 1.32 | | | | | 1.15 | | | | | 12 | |
Year ended 10/31/15 | | | | 34.24 | | | | | 0.37 | | | | | (1.13 | ) | | | | (0.76 | ) | | | | (0.46 | ) | | | | (1.11 | ) | | | | (1.57 | ) | | | | 31.91 | | | | | (2.19 | ) | | | | 2,725,649 | | | | | 1.30 | | | | | 1.31 | | | | | 1.11 | | | | | 20 | |
Class C | | | | | | | | | | | | | | | | | | | | | | | | | | | | | | | | | | | | | | | | | | | | | | | | | | | | | | | | | | | | | | | | | | | | | | |
Year ended 10/31/19 | | | | 29.20 | | | | | 0.13 | | | | | 4.16 | | | | | 4.29 | | | | | (0.02 | ) | | | | (2.46 | ) | | | | (2.48 | ) | | | | 31.01 | | | | | 16.37 | | | | | 55,768 | | | | | 2.08 | (d) | | | | 2.08 | (d) | | | | 0.45 | (d) | | | | 22 | |
Year ended 10/31/18 | | | | 33.55 | | | | | 0.14 | | | | | (3.83 | ) | | | | (3.69 | ) | | | | (0.33 | ) | | | | (0.33 | ) | | | | (0.66 | ) | | | | 29.20 | | | | | (11.22 | ) | | | | 105,735 | | | | | 2.05 | | | | | 2.06 | | | | | 0.45 | | | | | 26 | |
Year ended 10/31/17 | | | | 28.25 | | | | | 0.04 | | | | | 5.38 | | | | | 5.42 | | | | | (0.12 | ) | | | | - | | | | | (0.12 | ) | | | | 33.55 | | | | | 19.28 | | | | | 144,710 | | | | | 2.06 | | | | | 2.07 | | | | | 0.14 | | | | | 25 | |
Year ended 10/31/16 | | | | 29.25 | | | | | 0.11 | | | | | (0.95 | ) | | | | (0.84 | ) | | | | (0.16 | ) | | | | - | | | | | (0.16 | ) | | | | 28.25 | | | | | (2.88 | ) | | | | 160,642 | | | | | 2.06 | | | | | 2.07 | | | | | 0.40 | | | | | 12 | |
Year ended 10/31/15 | | | | 31.55 | | | | | 0.11 | | | | | (1.04 | ) | | | | (0.93 | ) | | | | (0.26 | ) | | | | (1.11 | ) | | | | (1.37 | ) | | | | 29.25 | | | | | (2.93 | ) | | | | 198,692 | | | | | 2.05 | | | | | 2.06 | | | | | 0.36 | | | | | 20 | |
Class R | | | | | | | | | | | | | | | | | | | | | | | | | | | | | | | | | | | | | | | | | | | | | | | | | | | | | | | | | | | | | | | | | | | | | | |
Year ended 10/31/19 | | | | 31.49 | | | | | 0.30 | | | | | 4.51 | | | | | 4.81 | | | | | (0.20 | ) | | | | (2.46 | ) | | | | (2.66 | ) | | | | 33.64 | | | | | 16.99 | | | | | 62,045 | | | | | 1.58 | (d) | | | | 1.58 | (d) | | | | 0.95 | (d) | | | | 22 | |
Year ended 10/31/18 | | | | 36.13 | | | | | 0.33 | | | | | (4.13 | ) | | | | (3.80 | ) | | | | (0.51 | ) | | | | (0.33 | ) | | | | (0.84 | ) | | | | 31.49 | | | | | (10.78 | ) | | | | 66,981 | | | | | 1.55 | | | | | 1.56 | | | | | 0.95 | | | | | 26 | |
Year ended 10/31/17 | | | | 30.41 | | | | | 0.21 | | | | | 5.80 | | | | | 6.01 | | | | | (0.29 | ) | | | | - | | | | | (0.29 | ) | | | | 36.13 | | | | | 19.94 | | | | | 99,556 | | | | | 1.56 | | | | | 1.57 | | | | | 0.64 | | | | | 25 | |
Year ended 10/31/16 | | | | 31.49 | | | | | 0.28 | | | | | (1.05 | ) | | | | (0.77 | ) | | | | (0.31 | ) | | | | - | | | | | (0.31 | ) | | | | 30.41 | | | | | (2.44 | ) | | | | 100,493 | | | | | 1.56 | | | | | 1.57 | | | | | 0.90 | | | | | 12 | |
Year ended 10/31/15 | | | | 33.83 | | | | | 0.28 | | | | | (1.11 | ) | | | | (0.83 | ) | | | | (0.40 | ) | | | | (1.11 | ) | | | | (1.51 | ) | | | | 31.49 | | | | | (2.45 | ) | | | | 116,738 | | | | | 1.55 | | | | | 1.56 | | | | | 0.86 | | | | | 20 | |
Class Y | | | | | | | | | | | | | | | | | | | | | | | | | | | | | | | | | | | | | | | | | | | | | | | | | | | | | | | | | | | | | | | | | | | | | | |
Year ended 10/31/19 | | | | 32.05 | | | | | 0.46 | | | | | 4.55 | | | | | 5.01 | | | | | (0.39 | ) | | | | (2.46 | ) | | | | (2.85 | ) | | | | 34.21 | | | | | 17.51 | | | | | 1,091,697 | | | | | 1.08 | (d) | | | | 1.08 | (d) | | | | 1.45 | (d) | | | | 22 | |
Year ended 10/31/18 | | | | 36.75 | | | | | 0.51 | | | | | (4.19 | ) | | | | (3.68 | ) | | | | (0.69 | ) | | | | (0.33 | ) | | | | (1.02 | ) | | | | 32.05 | | | | | (10.31 | ) | | | | 1,635,426 | | | | | 1.05 | | | | | 1.06 | | | | | 1.45 | | | | | 26 | |
Year ended 10/31/17 | | | | 30.96 | | | | | 0.38 | | | | | 5.87 | | | | | 6.25 | | | | | (0.46 | ) | | | | - | | | | | (0.46 | ) | | | | 36.75 | | | | | 20.47 | | | | | 2,427,028 | | | | | 1.06 | | | | | 1.07 | | | | | 1.14 | | | | | 25 | |
Year ended 10/31/16 | | | | 32.04 | | | | | 0.44 | | | | | (1.05 | ) | | | | (0.61 | ) | | | | (0.47 | ) | | | | - | | | | | (0.47 | ) | | | | 30.96 | | | | | (1.89 | ) | | | | 3,393,370 | | | | | 1.06 | | | | | 1.07 | | | | | 1.40 | | | | | 12 | |
Year ended 10/31/15 | | | | 34.37 | | | | | 0.45 | | | | | (1.14 | ) | | | | (0.69 | ) | | | | (0.53 | ) | | | | (1.11 | ) | | | | (1.64 | ) | | | | 32.04 | | | | | (1.96 | ) | | | | 3,449,499 | | | | | 1.05 | | | | | 1.06 | | | | | 1.36 | | | | | 20 | |
Class R5 | | | | | | | | | | | | | | | | | | | | | | | | | | | | | | | | | | | | | | | | | | | | | | | | | | | | | | | | | | | | | | | | | | | | | | |
Year ended 10/31/19 | | | | 32.48 | | | | | 0.50 | | | | | 4.63 | | | | | 5.13 | | | | | (0.39 | ) | | | | (2.46 | ) | | | | (2.85 | ) | | | | 34.76 | | | | | 17.66 | | | | | 735,592 | | | | | 0.98 | (d) | | | | 0.98 | (d) | | | | 1.55 | (d) | | | | 22 | |
Year ended 10/31/18 | | | | 37.24 | | | | | 0.55 | | | | | (4.25 | ) | | | | (3.70 | ) | | | | (0.73 | ) | | | | (0.33 | ) | | | | (1.06 | ) | | | | 32.48 | | | | | (10.25 | ) | | | | 1,124,979 | | | | | 0.97 | | | | | 0.98 | | | | | 1.53 | | | | | 26 | |
Year ended 10/31/17 | | | | 31.37 | | | | | 0.41 | | | | | 5.95 | | | | | 6.36 | | | | | (0.49 | ) | | | | - | | | | | (0.49 | ) | | | | 37.24 | | | | | 20.57 | | | | | 1,543,192 | | | | | 0.98 | | | | | 0.99 | | | | | 1.22 | | | | | 25 | |
Year ended 10/31/16 | | | | 32.47 | | | | | 0.47 | | | | | (1.08 | ) | | | | (0.61 | ) | | | | (0.49 | ) | | | | - | | | | | (0.49 | ) | | | | 31.37 | | | | | (1.85 | ) | | | | 1,471,592 | | | | | 0.97 | | | | | 0.98 | | | | | 1.49 | | | | | 12 | |
Year ended 10/31/15 | | | | 34.80 | | | | | 0.48 | | | | | (1.15 | ) | | | | (0.67 | ) | | | | (0.55 | ) | | | | (1.11 | ) | | | | (1.66 | ) | | | | 32.47 | | | | | (1.86 | ) | | | | 1,721,004 | | | | | 0.97 | | | | | 0.98 | | | | | 1.44 | | | | | 20 | |
Class R6 | | | | | | | | | | | | | | | | | | | | | | | | | | | | | | | | | | | | | | | | | | | | | | | | | | | | | | | | | | | | | | | | | | | | | | |
Year ended 10/31/19 | | | | 32.49 | | | | | 0.53 | | | | | 4.61 | | | | | 5.14 | | | | | (0.46 | ) | | | | (2.46 | ) | | | | (2.92 | ) | | | | 34.71 | | | | | 17.74 | | | | | 1,522,977 | | | | | 0.90 | (d) | | | | 0.90 | (d) | | | | 1.63 | (d) | | | | 22 | |
Year ended 10/31/18 | | | | 37.25 | | | | | 0.58 | | | | | (4.25 | ) | | | | (3.67 | ) | | | | (0.76 | ) | | | | (0.33 | ) | | | | (1.09 | ) | | | | 32.49 | | | | | (10.15 | ) | | | | 1,792,725 | | | | | 0.89 | | | | | 0.90 | | | | | 1.61 | | | | | 26 | |
Year ended 10/31/17 | | | | 31.38 | | | | | 0.45 | | | | | 5.94 | | | | | 6.39 | | | | | (0.52 | ) | | | | - | | | | | (0.52 | ) | | | | 37.25 | | | | | 20.68 | | | | | 2,427,136 | | | | | 0.89 | | | | | 0.90 | | | | | 1.31 | | | | | 25 | |
Year ended 10/31/16 | | | | 32.48 | | | | | 0.50 | | | | | (1.08 | ) | | | | (0.58 | ) | | | | (0.52 | ) | | | | - | | | | | (0.52 | ) | | | | 31.38 | | | | | (1.76 | ) | | | | 764,437 | | | | | 0.88 | | | | | 0.89 | | | | | 1.58 | | | | | 12 | |
Year ended 10/31/15 | | | | 34.80 | | | | | 0.51 | | | | | (1.14 | ) | | | | (0.63 | ) | | | | (0.58 | ) | | | | (1.11 | ) | | | | (1.69 | ) | | | | 32.48 | | | | | (1.77 | ) | | | | 769,302 | | | | | 0.89 | | | | | 0.90 | | | | | 1.52 | | | | | 20 | |
| (a) | Calculated using average shares outstanding. |
| (b) | Includes adjustments in accordance with accounting principles generally accepted in the United States of America and as such, the net asset value for financial reporting purposes and the returns based upon those net asset values may differ from the net asset value and returns for shareholder transactions. Does not include sales charges and is not annualized for periods less than one year, if applicable. |
| (c) | Portfolio turnover is calculated at the fund level and is not annualized for periods less than one year, if applicable. |
| (d) | Ratios are based on average daily net assets (000’s omitted) of $1,546,721, $71,314, $64,723, $1,309,247, $975,670 and $1,749,584 for Class A, Class C, Class R, Class Y, Class R5 and Class R6 shares, respectively. |
See accompanying Notes to Financial Statements which are an integral part of the financial statements.
15 Invesco International Growth Fund
Notes to Financial Statements
October 31, 2019
NOTE 1–Significant Accounting Policies
Invesco International Growth Fund (the “Fund”) is a series portfolio of AIM International Mutual Funds (Invesco International Mutual Funds) (the “Trust”). The Trust is a Delaware statutory trust registered under the Investment Company Act of 1940, as amended (the “1940 Act”), as anopen-end series management investment company authorized to issue an unlimited number of shares of beneficial interest. Information presented in these financial statements pertains only to the Fund. Matters affecting the Fund or each class will be voted on exclusively by the shareholders of the Fund or each class.
The Fund’s investment objective is long-term growth of capital.
The Fund currently consists of six different classes of shares: Class A, Class C, Class R, Class Y, Class R5 and Class R6. Class Y shares are available only to certain investors. Class A shares are sold with afront-end sales charge unless certain waiver criteria are met. Under certain circumstances, load waived shares may be subject to contingent deferred sales charges (“CDSC”). Class C shares are sold with a CDSC. Class R, Class Y, Class R5 and Class R6 shares are sold at net asset value. Class C shares held for ten years after purchase are eligible for automatic conversion into Class A shares of the same Fund (the “Conversion Feature”). The automatic conversion pursuant to the Conversion Feature will generally occur at the end of the month following the tenth anniversary after a purchase of Class C shares.
The Fund is an investment company and accordingly follows the investment company accounting and reporting guidance in accordance with Financial Accounting Standards Board Accounting Standards Codification Topic 946,Financial Services - Investment Companies.
The following is a summary of the significant accounting policies followed by the Fund in the preparation of its financial statements.
| A. | Security Valuations– Securities, including restricted securities, are valued according to the following policy. |
A security listed or traded on an exchange (except convertible securities) is valued at its last sales price or official closing price as of the close of the customary trading session on the exchange where the security is principally traded, or lacking any sales or official closing price on a particular day, the security may be valued at the closing bid price on that day. Securities traded in theover-the-counter market are valued based on prices furnished by independent pricing services or market makers. When such securities are valued by an independent pricing service they may be considered fair valued. Futures contracts are valued at the final settlement price set by an exchange on which they are principally traded. Listed options are valued at the mean between the last bid and asked prices from the exchange on which they are principally traded. Options not listed on an exchange are valued by an independent source at the mean between the last bid and asked prices. For purposes of determining net asset value (“NAV”) per share, futures and option contracts generally are valued 15 minutes after the close of the customary trading session of the New York Stock Exchange (“NYSE”).
Investments inopen-end andclosed-end registered investment companies that do not trade on an exchange are valued at theend-of-day net asset value per share. Investments inopen-end andclosed-end registered investment companies that trade on an exchange are valued at the last sales price or official closing price as of the close of the customary trading session on the exchange where the security is principally traded.
Debt obligations (including convertible securities) and unlisted equities are fair valued using an evaluated quote provided by an independent pricing service. Evaluated quotes provided by the pricing service may be determined without exclusive reliance on quoted prices, and may reflect appropriate factors such asinstitution-size trading in similar groups of securities, developments related to specific securities, dividend rate (for unlisted equities), yield (for debt obligations), quality, type of issue, coupon rate (for debt obligations), maturity (for debt obligations), individual trading characteristics and other market data. Pricing services generally value debt obligations assuming orderly transactions of institutional round lot size, but a fund may hold or transact in the same securities in smaller, odd lot sizes. Odd lots often trade at lower prices than institutional round lots. Debt obligations are subject to interest rate and credit risks. In addition, all debt obligations involve some risk of default with respect to interest and/or principal payments.
Foreign securities’ (including foreign exchange contracts) prices are converted into U.S. dollar amounts using the applicable exchange rates as of the close of the NYSE. If market quotations are available and reliable for foreign exchange-traded equity securities, the securities will be valued at the market quotations. Because trading hours for certain foreign securities end before the close of the NYSE, closing market quotations may become unreliable. If between the time trading ends on a particular security and the close of the customary trading session on the NYSE, events occur that the investment adviser determines are significant and make the closing price unreliable, the Fund may fair value the security. If the event is likely to have affected the closing price of the security, the security will be valued at fair value in good faith using procedures approved by the Board of Trustees. Adjustments to closing prices to reflect fair value may also be based on a screening process of an independent pricing service to indicate the degree of certainty, based on historical data, that the closing price in the principal market where a foreign security trades is not the current value as of the close of the NYSE. Foreign securities’ prices meeting the approved degree of certainty that the price is not reflective of current value will be priced at the indication of fair value from the independent pricing service. Multiple factors may be considered by the independent pricing service in determining adjustments to reflect fair value and may include information relating to sector indices, American Depositary Receipts and domestic and foreign index futures. Foreign securities may have additional risks including exchange rate changes, potential for sharply devalued currencies and high inflation, political and economic upheaval, the relative lack of issuer information, relatively low market liquidity and the potential lack of strict financial and accounting controls and standards.
Securities for which market prices are not provided by any of the above methods may be valued based upon quotes furnished by independent sources. The last bid price may be used to value equity securities. The mean between the last bid and asked prices is used to value debt obligations, including corporate loans.
Securities for which market quotations are not readily available or became unreliable are valued at fair value as determined in good faith by or under the supervision of the Trust’s officers following procedures approved by the Board of Trustees. Issuer specific events, market trends, bid/asked quotes of brokers and information providers and other market data may be reviewed in the course of making a good faith determination of a security’s fair value.
The Fund may invest in securities that are subject to interest rate risk, meaning the risk that the prices will generally fall as interest rates rise and, conversely, the prices will generally rise as interest rates fall. Specific securities differ in their sensitivity to changes in interest rates
16 Invesco International Growth Fund
depending on their individual characteristics. Changes in interest rates may result in increased market volatility, which may affect the value and/or liquidity of certain Fund investments.
Valuations change in response to many factors including the historical and prospective earnings of the issuer, the value of the issuer’s assets, general economic conditions, interest rates, investor perceptions and market liquidity. Because of the inherent uncertainties of valuation, the values reflected in the financial statements may materially differ from the value received upon actual sale of those investments.
| B. | Securities Transactions and Investment Income– Securities transactions are accounted for on a trade date basis. Realized gains or losses on sales are computed on the basis of specific identification of the securities sold. Interest income (net of withholding tax, if any) is recorded on the accrual basis from settlement date. Dividend income (net of withholding tax, if any) is recorded on theex-dividend date. |
The Fund may periodically participate in litigation related to Fund investments. As such, the Fund may receive proceeds from litigation settlements. Any proceeds received are included in the Statement of Operations as realized gain (loss) for investments no longer held and as unrealized gain (loss) for investments still held.
Brokerage commissions and mark ups are considered transaction costs and are recorded as an increase to the cost basis of securities purchased and/or a reduction of proceeds on a sale of securities. Such transaction costs are included in the determination of net realized and unrealized gain (loss) from investment securities reported in the Statement of Operations and the Statement of Changes in Net Assets and the net realized and unrealized gains (losses) on securities per share in the Financial Highlights. Transaction costs are included in the calculation of the Fund’s net asset value and, accordingly, they reduce the Fund’s total returns. These transaction costs are not considered operating expenses and are not reflected in net investment income reported in the Statement of Operations and the Statement of Changes in Net Assets, or the net investment income per share and the ratios of expenses and net investment income reported in the Financial Highlights, nor are they limited by any expense limitation arrangements between the Fund and the investment adviser.
The Fund allocates income and realized and unrealized capital gains and losses to a class based on the relative net assets of each class.
| C. | Country Determination– For the purposes of making investment selection decisions and presentation in the Schedule of Investments, the investment adviser may determine the country in which an issuer is located and/or credit risk exposure based on various factors. These factors include the laws of the country under which the issuer is organized, where the issuer maintains a principal office, the country in which the issuer derives 50% or more of its total revenues and the country that has the primary market for the issuer’s securities, as well as other criteria. Among the other criteria that may be evaluated for making this determination are the country in which the issuer maintains 50% or more of its assets, the type of security, financial guarantees and enhancements, the nature of the collateral and the sponsor organization. Country of issuer and/or credit risk exposure has been determined to be the United States of America, unless otherwise noted. |
| D. | Distributions– Distributions from net investment income and net realized capital gain, if any, are generally declared and paid annually and recorded on theex-dividend date. The Fund may elect to treat a portion of the proceeds from redemptions as distributions for federal income tax purposes. |
| E. | Federal Income Taxes –The Fund intends to comply with the requirements of Subchapter M of the Internal Revenue Code of 1986, as amended (the “Internal Revenue Code”), necessary to qualify as a regulated investment company and to distribute substantially all of the Fund’s taxable earnings to shareholders. As such, the Fund will not be subject to federal income taxes on otherwise taxable income (including net realized capital gain) that is distributed to shareholders. Therefore, no provision for federal income taxes is recorded in the financial statements. |
The Fund recognizes the tax benefits of uncertain tax positions only when the position is more likely than not to be sustained. Management has analyzed the Fund’s uncertain tax positions and concluded that no liability for unrecognized tax benefits should be recorded related to uncertain tax positions. Management is not aware of any tax positions for which it is reasonably possible that the total amounts of unrecognized tax benefits will change materially in the next 12 months.
The Fund files tax returns in the U.S. Federal jurisdiction and certain other jurisdictions. Generally, the Fund is subject to examinations by such taxing authorities for up to three years after the filing of the return for the tax period.
| F. | Expenses –Fees provided for under the Rule12b-1 plan of a particular class of the Fund are charged to the operations of such class. Transfer agency fees and expenses and other shareholder recordkeeping fees and expenses attributable to Class R5 and Class R6 are allocated to each share class based on relative net assets.Sub-accounting fees attributable to Class R5 are charged to the operations of the class. Transfer agency fees and expenses and other shareholder recordkeeping fees and expenses relating to all other classes are allocated among those classes based on relative net assets. All other expenses are allocated among the classes based on relative net assets. |
| G. | Accounting Estimates –The preparation of financial statements in conformity with accounting principles generally accepted in the United States of America (“GAAP”) requires management to make estimates and assumptions that affect the reported amounts of assets and liabilities at the date of the financial statements and the reported amounts of revenues and expenses during the reporting period including estimates and assumptions related to taxation. Actual results could differ from those estimates by a significant amount. In addition, the Fund monitors for material events or transactions that may occur or become known after theperiod-end date and before the date the financial statements are released to print. |
| H. | Indemnifications– Under the Trust’s organizational documents, each Trustee, officer, employee or other agent of the Trust is indemnified against certain liabilities that may arise out of the performance of their duties to the Fund. Additionally, in the normal course of business, the Fund enters into contracts, including the Fund’s servicing agreements, that contain a variety of indemnification clauses. The Fund’s maximum exposure under these arrangements is unknown as this would involve future claims that may be made against the Fund that have not yet occurred. The risk of material loss as a result of such indemnification claims is considered remote. |
| I. | Foreign Currency Translations– Foreign currency is valued at the close of the NYSE based on quotations posted by banks and major currency dealers. Portfolio securities and other assets and liabilities denominated in foreign currencies are translated into U.S. dollar amounts at the date of valuation. Purchases and sales of portfolio securities (net of foreign taxes withheld on disposition) and income items denominated in foreign currencies are translated into U.S. dollar amounts on the respective dates of such transactions. The Fund does not separately account for the portion of the results of operations resulting from changes in foreign exchange rates on investments and the fluctuations arising from changes in market prices of securities held. The combined results of changes in foreign exchange rates and the fluctuation of market prices on investments (net of estimated foreign tax withholding) are included with the net realized and unrealized gain or loss from investments in the Statement of Operations. Reported net realized foreign currency gains or losses arise from (1) sales of foreign currencies, (2) currency gains or losses realized between the trade and settlement dates on securities transactions, and (3) the difference between the amounts of dividends, |
17 Invesco International Growth Fund
interest, and foreign withholding taxes recorded on the Fund’s books and the U.S. dollar equivalent of the amounts actually received or paid. Net unrealized foreign currency gains and losses arise from changes in the fair values of assets and liabilities, other than investments in securities at fiscal period end, resulting from changes in exchange rates.
The Fund may invest in foreign securities, which may be subject to foreign taxes on income, gains on investments or currency repatriation, a portion of which may be recoverable. Foreign taxes, if any, are recorded based on the tax regulations and rates that exist in the foreign markets in which the Fund invests and are shown in the Statement of Operations.
| J. | Forward Foreign Currency Contracts– The Fund may engage in foreign currency transactions either on a spot (i.e. for prompt delivery and settlement) basis, or through forward foreign currency contracts, to manage or minimize currency or exchange rate risk. |
The Fund may also enter into forward foreign currency contracts for the purchase or sale of a security denominated in a foreign currency in order to “lock in” the U.S. dollar price of that security, or the Fund may also enter into forward foreign currency contracts that do not provide for physical settlement of the two currencies, but instead are settled by a single cash payment calculated as the difference between the agreed upon exchange rate and the spot rate at settlement based upon an agreed upon notional amount(non-deliverable forwards). The Fund will set aside liquid assets in an amount equal to the dailymark-to-market obligation for forward foreign currency contracts.
A forward foreign currency contract is an obligation between two parties (“Counterparties”) to purchase or sell a specific currency for an agreed-upon price at a future date. The use of forward foreign currency contracts does not eliminate fluctuations in the price of the underlying securities the Fund owns or intends to acquire but establishes a rate of exchange in advance. Fluctuations in the value of these contracts are measured by the difference in the contract date and reporting date exchange rates and are recorded as unrealized appreciation (depreciation) until the contracts are closed. When the contracts are closed, realized gains (losses) are recorded. Realized and unrealized gains (losses) on the contracts are included in the Statement of Operations. The primary risks associated with forward foreign currency contracts include failure of the Counterparty to meet the terms of the contract and the value of the foreign currency changing unfavorably. These risks may be in excess of the amounts reflected in the Statement of Assets and Liabilities.
NOTE 2–Advisory Fees and Other Fees Paid to Affiliates
The Trust has entered into a master investment advisory agreement with Invesco Advisers, Inc. (the “Adviser” or “Invesco”). Under the terms of the investment advisory agreement, the Fund accrues daily and pays monthly an advisory fee to the Adviser based on the annual rate of the Fund’s average daily net assets as follows:
| | |
| Average Daily Net Assets | | Rate |
First $ 250 million | | 0.935% |
Next $250 million | | 0.910% |
Next $500 million | | 0.885% |
Next $1.5 billion | | 0.860% |
Next $2.5 billion | | 0.835% |
Next $2.5 billion | | 0.810% |
Next $2.5 billion | | 0.785% |
Over $10 billion | | 0.760% |
For the year ended October 31, 2019, the effective advisory fee rate incurred by the Fund was 0.85%.
Under the terms of a mastersub-advisory agreement between the Adviser and each of Invesco Asset Management Deutschland GmbH, Invesco Asset Management Limited, Invesco Asset Management (Japan) Limited, Invesco Hong Kong Limited, Invesco Senior Secured Management, Inc. and Invesco Canada Ltd. and separatesub-advisory agreements with Invesco Capital Management LLC and Invesco Asset Management (India) Private Limited (collectively, the “AffiliatedSub-Advisers”) the Adviser, not the Fund, will pay 40% of the fees paid to the Adviser to any such AffiliatedSub-Adviser(s) that provide(s) discretionary investment management services to the Fund based on the percentage of assets allocated to such AffiliatedSub-Adviser(s).
The Adviser has contractually agreed, through at least June 30, 2020, to waive advisory fees and/or reimburse expenses of all shares to the extent necessary to limit total annual fund operating expenses after fee waiver and/or expense reimbursement (excluding certain items discussed below) of Class A, Class C, Class R, Class Y, Class R5 and Class R6 shares to 2.25%, 3.00%, 2.50%, 2.00%, 2.00% and 2.00%, respectively, of average daily net assets (the “expense limits”). In determining the Adviser’s obligation to waive advisory fees and/or reimburse expenses, the following expenses are not taken into account, and could cause the total annual fund operating expenses after fee waiver and/or expense reimbursement to exceed the numbers reflected above: (1) interest; (2) taxes; (3) dividend expense on short sales; (4) extraordinary ornon-routine items, including litigation expenses; and (5) expenses that the Fund has incurred but did not actually pay because of an expense offset arrangement. Unless Invesco continues the fee waiver agreement, it will terminate on June 30, 2020. During its term, the fee waiver agreement cannot be terminated or amended to increase the expense limits or reduce the advisory fee waiver without approval of the Board of Trustees. The Adviser did not waive fees and/or reimburse expenses during the period under these expense limits.
Further, the Adviser has contractually agreed, through at least June 30, 2021, to waive the advisory fee payable by the Fund in an amount equal to 100% of the net advisory fees the Adviser receives from the affiliated money market funds on investments by the Fund of uninvested cash in such affiliated money market funds.
For the year ended October 31, 2019, the Adviser waived advisory fees of $223,230.
The Trust has entered into a master administrative services agreement with Invesco pursuant to which the Fund has agreed to pay Invesco for certain administrative costs incurred in providing accounting services to the Fund. For the year ended October 31, 2019, expenses incurred under the agreement are shown in the Statement of Operations asAdministrative services fees. Invesco has entered into asub-administration agreement whereby State Street Bank and Trust Company (“SSB”) serves as fund accountant and provides certain administrative services to the Fund. Pursuant to a custody agreement with the Trust on behalf of the Fund, SSB also serves as the Fund’s custodian.
18 Invesco International Growth Fund
The Trust has entered into a transfer agency and service agreement with Invesco Investment Services, Inc. (“IIS”) pursuant to which the Fund has agreed to pay IIS a fee for providing transfer agency and shareholder services to the Fund and reimburse IIS for certain expenses incurred by IIS in the course of providing such services. IIS may make payments to intermediaries that provide omnibus account services,sub-accounting services and/or networking services. All fees payable by IIS to intermediaries that provide omnibus account services orsub-accounting services are charged back to the Fund, subject to certain limitations approved by the Trust’s Board of Trustees. For the year ended October 31, 2019, expenses incurred under the agreement are shown in the Statement of Operations asTransfer agent fees.
The Trust has entered into master distribution agreements with Invesco Distributors, Inc. (“IDI”) to serve as the distributor for the Class A, Class C, Class R, Class Y, Class R5 and Class R6 shares of the Fund. The Trust has adopted plans pursuant to Rule12b-1 under the 1940 Act with respect to the Fund’s Class A, Class C and Class R shares (collectively, the “Plans”). The Fund, pursuant to the Plans, pays IDI compensation at the annual rate of 0.25% of the Fund’s average daily net assets of Class A shares, 1.00% of the average daily net assets of Class C shares and 0.50% of the average daily net assets of Class R shares. The fees are accrued daily and paid monthly. Of the Plan payments, up to 0.25% of the average daily net assets of each class of shares may be paid to furnish continuing personal shareholder services to customers who purchase and own shares of such classes. Any amounts not paid as a service fee under the Plans would constitute an asset-based sales charge. Rules of the Financial Industry Regulatory Authority (“FINRA”) impose a cap on the total sales charges, including asset-based sales charges, that may be paid by any class of shares of the Fund. For the year ended October 31, 2019, expenses incurred under the Plans are shown in the Statement of Operations asDistribution fees.
Front-end sales commissions and CDSC (collectively, the “sales charges”) are not recorded as expenses of the Fund.Front-end sales commissions are deducted from proceeds from the sales of Fund shares prior to investment in Class A shares of the Fund. CDSC are deducted from redemption proceeds prior to remittance to the shareholder. During the year ended October 31, 2019, IDI advised the Fund that IDI retained $181,650 infront-end sales commissions from the sale of Class A shares and $22,593 and $6,724 from Class A and Class C shares, respectively, for CDSC imposed upon redemptions by shareholders.
Certain officers and trustees of the Trust are officers and directors of the Adviser, IIS and/or IDI.
NOTE 3–Additional Valuation Information
GAAP defines fair value as the price that would be received to sell an asset or paid to transfer a liability in an orderly transaction between market participants at the measurement date, under current market conditions. GAAP establishes a hierarchy that prioritizes the inputs to valuation methods, giving the highest priority to readily available unadjusted quoted prices in an active market for identical assets (Level 1) and the lowest priority to significant unobservable inputs (Level 3), generally when market prices are not readily available or are unreliable. Based on the valuation inputs, the securities or other investments are tiered into one of three levels. Changes in valuation methods may result in transfers in or out of an investment’s assigned level:
| | Level 1 - | Prices are determined using quoted prices in an active market for identical assets. |
| | Level 2 - | Prices are determined using other significant observable inputs. Observable inputs are inputs that other market participants may use in pricing a security. These may include quoted prices for similar securities, interest rates, prepayment speeds, credit risk, yield curves, loss severities, default rates, discount rates, volatilities and others. |
| | Level 3 - | Prices are determined using significant unobservable inputs. In situations where quoted prices or observable inputs are unavailable (for example, when there is little or no market activity for an investment at the end of the period), unobservable inputs may be used. Unobservable inputs reflect the Fund’s own assumptions about the factors market participants would use in determining fair value of the securities or instruments and would be based on the best available information. |
The following is a summary of the tiered valuation input levels, as of October 31, 2019. The level assigned to the securities valuations may not be an indication of the risk or liquidity associated with investing in those securities. Because of the inherent uncertainties of valuation, the values reflected in the financial statements may materially differ from the value received upon actual sale of those investments.
19 Invesco International Growth Fund
| | | | | | | | | | | | | | | | |
| | | Level 1 | | | Level 2 | | | Level 3 | | | Total | |
| |
Investments in Securities | | | | | | | | | | | | | | | | |
| |
Australia | | $ | – | | | $ | 39,190,791 | | | | $– | | | $ | 39,190,791 | |
| |
Brazil | | | 203,988,947 | | | | – | | | | – | | | | 203,988,947 | |
| |
Canada | | | 437,726,193 | | | | – | | | | – | | | | 437,726,193 | |
| |
China | | | 226,383,218 | | | | 100,401,648 | | | | – | | | | 326,784,866 | |
| |
Denmark | | | – | | | | 75,358,513 | | | | – | | | | 75,358,513 | |
| |
France | | | – | | | | 489,530,464 | | | | – | | | | 489,530,464 | |
| |
Germany | | | – | | | | 431,415,893 | | | | – | | | | 431,415,893 | |
| |
Hong Kong | | | – | | | | 50,959,752 | | | | – | | | | 50,959,752 | |
| |
Ireland | | | 46,096,926 | | | | – | | | | – | | | | 46,096,926 | |
| |
Italy | | | – | | | | 118,343,330 | | | | – | | | | 118,343,330 | |
| |
Japan | | | – | | | | 547,336,572 | | | | – | | | | 547,336,572 | |
| |
Macau | | | – | | | | 85,026,138 | | | | – | | | | 85,026,138 | |
| |
Mexico | | | 76,765,418 | | | | – | | | | – | | | | 76,765,418 | |
| |
Netherlands | | | – | | | | 205,551,925 | | | | – | | | | 205,551,925 | |
| |
Singapore | | | – | | | | 76,023,026 | | | | – | | | | 76,023,026 | |
| |
South Korea | | | – | | | | 150,915,897 | | | | – | | | | 150,915,897 | |
| |
Spain | | | – | | | | 72,968,626 | | | | – | | | | 72,968,626 | |
| |
Sweden | | | – | | | | 137,775,559 | | | | – | | | | 137,775,559 | |
| |
Switzerland | | | – | | | | 317,487,190 | | | | – | | | | 317,487,190 | |
| |
Taiwan | | | – | | | | 128,085,153 | | | | – | | | | 128,085,153 | |
| |
United Kingdom | | | – | | | | 485,216,530 | | | | – | | | | 485,216,530 | |
| |
United States | | | 272,012,764 | | | | 60,417,788 | | | | – | | | | 332,430,552 | |
| |
Money Market Funds | | | 80,034,977 | | | | – | | | | – | | | | 80,034,977 | |
| |
Total Investments | | $ | 1,343,008,443 | | | $ | 3,572,004,795 | | | | $– | | | $ | 4,915,013,238 | |
| |
NOTE 4–Expense Offset Arrangement(s)
The expense offset arrangement is comprised of transfer agency credits which result from balances in demand deposit accounts used by the transfer agent for clearing shareholder transactions. For the year ended October 31, 2019, the Fund received credits from this arrangement, which resulted in the reduction of the Fund’s total expenses of $18,967.
NOTE 5–Trustees’ and Officers’ Fees and Benefits
Trustees’ and Officers’ Fees and Benefits include amounts accrued by the Fund to pay remuneration to certain Trustees and Officers of the Fund. Trustees have the option to defer compensation payable by the Fund, andTrustees’ and Officers’ Fees and Benefits also include amounts accrued by the Fund to fund such deferred compensation amounts. Those Trustees who defer compensation have the option to select various Invesco Funds in which their deferral accounts shall be deemed to be invested. Finally, certain current Trustees were eligible to participate in a retirement plan that provided for benefits to be paid upon retirement to Trustees over a period of time based on the number of years of service. The Fund may have certain former Trustees who also participate in a retirement plan and receive benefits under such plan.Trustees’ and Officers’ Fees and Benefits include amounts accrued by the Fund to fund such retirement benefits. Obligations under the deferred compensation and retirement plans represent unsecured claims against the general assets of the Fund.
NOTE 6–Cash Balances
The Fund is permitted to temporarily carry a negative or overdrawn balance in its account with State Street Bank and Trust Company, the custodian bank. Such balances, if any atperiod-end, are shown in the Statement of Assets and Liabilities under the payable caption Amount due custodian. To compensate the custodian bank for such overdrafts, the overdrawn Fund may either (1) leave funds as a compensating balance in the account so the custodian bank can be compensated by earning the additional interest; or (2) compensate by paying the custodian bank at a rate agreed upon by the custodian bank and Invesco, not to exceed the contractually agreed upon rate.
NOTE 7–Distributions to Shareholders and Tax Components of Net Assets
Tax Character of Distributions to Shareholders Paid During the Fiscal Years Ended October 31, 2019 and 2018
| | | | | | | | |
| | | 2019 | | | 2018 | |
| |
Ordinary income | | $ | 70,036,296 | | | $ | 167,319,887 | |
| |
Long-term capital gain | | | 460,014,570 | | | | 80,204,498 | |
| |
Total distributions | | $ | 530,050,866 | | | $ | 247,524,385 | |
| |
20 Invesco International Growth Fund
Tax Components of Net Assets atPeriod-End:
| | | | |
| | | 2019 | |
| |
Undistributed ordinary income | | $ | 100,469,386 | |
| |
Undistributed long-term capital gain | | | 399,766,493 | |
| |
Net unrealized appreciation – investments | | | 1,524,760,058 | |
| |
Net unrealized appreciation – foreign currencies | | | 93,537 | |
| |
Temporary book/tax differences | | | (784,144 | ) |
| |
Shares of beneficial interest | | | 2,978,602,822 | |
| |
Total net assets | | $ | 5,002,908,152 | |
| |
The difference between book-basis andtax-basis unrealized appreciation (depreciation) is due to differences in the timing of recognition of gains and losses on investments for tax and book purposes. The Fund’s net unrealized appreciation difference is attributable primarily to passive foreign investment companies and wash sales.
The temporary book/tax differences are a result of timing differences between book and tax recognition of income and/or expenses. The Fund’s temporary book/tax differences are the result of the trustee deferral of compensation and retirement plan benefits.
Capital loss carryforward is calculated and reported as of a specific date. Results of transactions and other activity after that date may affect the amount of capital loss carryforward actually available for the Fund to utilize. Capital losses generated in years beginning after December 22, 2010 can be carried forward for an unlimited period, whereas previous losses expire in eight tax years. Capital losses with an expiration period may not be used to offset capital gains until all net capital losses without an expiration date have been utilized. Capital loss carryforwards with no expiration date will retain their character as either short-term or long-term capital losses instead of as short-term capital losses as under prior law. The ability to utilize capital loss carryforwards in the future may be limited under the Internal Revenue Code and related regulations based on the results of future transactions.
The Fund does not have a capital loss carryforward as of October 31, 2019.
NOTE 8–Investment Transactions
The aggregate amount of investment securities (other than short-term securities, U.S. Treasury obligations and money market funds, if any) purchased and sold by the Fund during the year ended October 31, 2019 was $1,194,685,183 and $3,461,240,481, respectively. Cost of investments, including any derivatives, on a tax basis includes the adjustments for financial reporting purposes as of the most recently completed federal income tax reportingperiod-end.
Unrealized Appreciation (Depreciation) of Investments on a Tax Basis
| | | | |
| |
Aggregate unrealized appreciation of investments | | $ | 1,635,689,817 | |
| |
Aggregate unrealized (depreciation) of investments | | | (110,929,759 | ) |
| |
Net unrealized appreciation of investments | | $ | 1,524,760,058 | |
| |
Cost of investments for tax purposes is $3,390,253,180.
NOTE 9–Reclassification of Permanent Differences
Primarily as a result of differing book/tax treatment of passive foreign investment companies and foreign currency transactions, on October 31, 2019, undistributed net investment income was increased by $16,786,990 and undistributed net realized gain was decreased by $16,786,990. This reclassification had no effect on the net assets or the distributable earnings of the Fund.
NOTE 10–Share Information
| | | | | | | | | | | | | | | | |
| | | Summary of Share Activity | |
| |
| | | Years ended October 31, | |
| | | | |
| | | 2019(a) | | | 2018 | |
| | | | | | | | |
| | | Shares | | | Amount | | | Shares | | | Amount | |
| |
Sold: | | | | | | | | | | | | | | | | |
| | | | |
Class A | | | 4,300,951 | | | $ | 135,409,256 | | | | 6,536,607 | | | $ | 232,612,306 | |
| |
Class B(b) | | | - | | | | - | | | | 354 | | | | 11,918 | |
| |
Class C | | | 200,758 | | | | 5,784,086 | | | | 518,779 | | | | 17,123,633 | |
| |
Class R | | | 398,443 | | | | 12,482,384 | | | | 322,912 | | | | 11,227,621 | |
| |
Class Y | | | 7,320,451 | | | | 225,503,606 | | | | 13,402,836 | | | | 482,215,559 | |
| |
Class R5 | | | 4,794,150 | | | | 154,476,861 | | | | 8,541,419 | | | | 308,793,726 | |
| |
Class R6 | | | 6,800,896 | | | | 219,346,459 | | | | 8,368,668 | | | | 301,661,663 | |
| |
21 Invesco International Growth Fund
| | | | | | | | | | | | | | | | |
| | | Summary of Share Activity | |
| |
| | | Years ended October 31, | |
| | | | |
| | | 2019(a) | | | 2018 | |
| | | | | | | | |
| | | Shares | | | Amount | | | Shares | | | Amount | |
| |
| | | | |
Issued as reinvestment of dividends: | | | | | | | | | | | | | | | | |
| | | | |
Class A | | | 4,234,112 | | | $ | 119,655,985 | | | | 1,483,086 | | | $ | 53,124,145 | |
| |
Class B(b) | | | - | | | | - | | | | 2,185 | | | | 71,993 | |
| |
Class C | | | 306,892 | | | | 7,939,305 | | | | 75,117 | | | | 2,478,116 | |
| |
Class R | | | 197,548 | | | | 5,517,505 | | | | 113,516 | | | | 4,070,678 | |
| |
Class Y | | | 2,506,936 | | | | 70,921,218 | | | | 1,172,752 | | | | 42,078,089 | |
| |
Class R5 | | | 2,665,867 | | | | 76,537,027 | | | | 939,342 | | | | 34,132,862 | |
| |
Class R6 | | | 5,243,518 | | | | 150,226,781 | | | | 1,901,530 | | | | 69,063,564 | |
| |
| | | | |
Conversion of Class B shares to Class A shares:(c) | | | | | | | | | | | | | | | | |
| | | | |
Class A | | | - | | | | - | | | | 81,236 | | | | 3,126,762 | |
| |
Class B | | | - | | | | - | | | | (88,661 | ) | | | (3,126,762 | ) |
| |
| | | | |
Automatic conversion of Class C shares to Class A shares: | | | | | | | | | | | | | | | | |
| | | | |
Class A | | | 1,379,952 | | | | 41,674,000 | | | | - | | | | - | |
| |
Class C | | | (1,509,572 | ) | | | (41,674,000 | ) | | | - | | | | - | |
| |
| | | | |
Reacquired: | | | | | | | | | | | | | | | | |
| | | | |
Class A | | | (17,080,338 | ) | | | (536,682,940 | ) | | | (21,389,639 | ) | | | (759,377,939 | ) |
| |
Class B(b) | | | - | | | | - | | | | (39,709 | ) | | | (1,367,357 | ) |
| |
Class C | | | (820,235 | ) | | | (23,288,543 | ) | | | (1,286,819 | ) | | | (41,600,627 | ) |
| |
Class R | | | (878,118 | ) | | | (27,430,730 | ) | | | (1,065,529 | ) | | | (37,533,346 | ) |
| |
Class Y | | | (28,951,577 | ) | | | (912,712,630 | ) | | | (29,592,057 | ) | | | (1,037,962,705 | ) |
| |
Class R5 | | | (20,930,076 | ) | | | (682,514,946 | ) | | | (16,288,037 | ) | | | (580,653,654 | ) |
| |
Class R6 | | | (23,344,829 | ) | | | (769,299,537 | ) | | | (20,247,708 | ) | | | (721,300,223 | ) |
| |
Net increase (decrease) in share activity | | | (53,164,271 | ) | | $ | (1,768,128,853 | ) | | | (46,537,820 | ) | | $ | (1,621,129,978 | ) |
| |
| (a) | There are entities that are record owners of more than 5% of the outstanding shares of the Fund and in the aggregate own 54% of the outstanding shares of the Fund. IDI has an agreement with these entities to sell Fund shares. The Fund, Invesco and/or Invesco affiliates may make payments to these entities, which are considered to be related to the Fund, for providing services to the Fund, Invesco and/or Invesco affiliates including but not limited to services such as securities brokerage, distribution, third party record keeping and account servicing. The Fund has no knowledge as to whether all or any portion of the shares owned of record by these entities are also owned beneficially. |
| (b) | Class B shares activity for the period November 1, 2017 through January 26, 2018 (date of conversion). |
| (c) | Effective as of the close of business January 26, 2018, all outstanding Class B shares were converted to Class A shares. |
22 Invesco International Growth Fund
Report of Independent Registered Public Accounting Firm
To the Board of Trustees of AIM International Mutual Funds (Invesco International Mutual Funds) and Shareholders of Invesco International Growth Fund
Opinion on the Financial Statements
We have audited the accompanying statement of assets and liabilities, including the schedule of investments, of Invesco International Growth Fund (one of the funds constituting AIM International Mutual Funds (Invesco International Mutual Funds), referred to hereafter as the “Fund”) as of October 31, 2019, the related statement of operations for the year ended October 31, 2019, the statement of changes in net assets for each of the two years in the period ended October 31, 2019, including the related notes, and the financial highlights for each of the five years in the period ended October 31, 2019 (collectively referred to as the “financial statements”). In our opinion, the financial statements present fairly, in all material respects, the financial position of the Fund as of October 31, 2019, the results of its operations for the year then ended, the changes in its net assets for each of the two years in the period ended October 31, 2019 and the financial highlights for each of the five years in the period ended October 31, 2019 in conformity with accounting principles generally accepted in the United States of America.
Basis for Opinion
These financial statements are the responsibility of the Fund’s management. Our responsibility is to express an opinion on the Fund’s financial statements based on our audits. We are a public accounting firm registered with the Public Company Accounting Oversight Board (United States) (PCAOB) and are required to be independent with respect to the Fund in accordance with the U.S. federal securities laws and the applicable rules and regulations of the Securities and Exchange Commission and the PCAOB.
We conducted our audits of these financial statements in accordance with the standards of the PCAOB. Those standards require that we plan and perform the audit to obtain reasonable assurance about whether the financial statements are free of material misstatement, whether due to error or fraud.
Our audits included performing procedures to assess the risks of material misstatement of the financial statements, whether due to error or fraud, and performing procedures that respond to those risks. Such procedures included examining, on a test basis, evidence regarding the amounts and disclosures in the financial statements. Our audits also included evaluating the accounting principles used and significant estimates made by management, as well as evaluating the overall presentation of the financial statements. Our procedures included confirmation of securities owned as of October 31, 2019 by correspondence with the custodian, transfer agent and brokers; when replies were not received from brokers, we performed other auditing procedures. We believe that our audits provide a reasonable basis for our opinion.
/s/PricewaterhouseCoopers LLP
Houston, Texas
December 23, 2019
We have served as the auditor of one or more of the investment companies in the Invesco group of investment companies since at least 1995. We have not been able to determine the specific year we began serving as auditor.
23 Invesco International Growth Fund
Calculating your ongoing Fund expenses
Example
As a shareholder of the Fund, you incur two types of costs: (1) transaction costs, which may include sales charges (loads) on purchase payments or contingent deferred sales charges on redemptions, if any; and (2) ongoing costs, including management fees, distribution and/or service(12b-1) fees, and other Fund expenses. This example is intended to help you understand your ongoing costs (in dollars) of investing in the Fund and to compare these costs with ongoing costs of investing in other mutual funds. The example is based on an investment of $1,000 invested at the beginning of the period and held for the entire period May 1, 2019 through October 31, 2019.
Actual expenses
The table below provides information about actual account values and actual expenses. You may use the information in this table, together with the amount you invested, to estimate the expenses that you paid over the period. Simply divide your account value by $1,000 (for example, an $8,600 account value divided by $1,000 = 8.6), then multiply the result by the number in the table under the heading entitled “Actual Expenses Paid During Period” to estimate the expenses you paid on your account during this period.
Hypothetical example for comparison purposes
The table below also provides information about hypothetical account values and hypothetical expenses based on the Fund’s actual expense ratio and an assumed rate of return of 5% per year before expenses, which is not the Fund’s actual return.
The hypothetical account values and expenses may not be used to estimate the actual ending account balance or expenses you paid for the period. You may use this information to compare the ongoing costs of investing in the Fund and other funds. To do so, compare this 5% hypothetical example with the 5% hypothetical examples that appear in the shareholder reports of the other funds.
Please note that the expenses shown in the table are meant to highlight your ongoing costs only and do not reflect any transaction costs, such as sales charges (loads) on purchase payments or contingent deferred sales charges on redemptions, if any. Therefore, the hypothetical information is useful in comparing ongoing costs only, and will not help you determine the relative total costs of owning different funds. In addition, if these transaction costs were included, your costs would have been higher.
| | | | | | | | | | | | |
| | | | | |
| | | | | ACTUAL | | HYPOTHETICAL
(5% annual return before
expenses) | | |
| | | Beginning
Account Value
(05/01/19) | | Ending
Account Value
(10/31/19)1 | | Expenses
Paid During
Period2 | | Ending
Account Value
(10/31/19) | | Expenses
Paid During
Period2 | | Annualized
Expense Ratio |
Class A | | $1,000.00 | | $1,029.00 | | $6.70 | | $1,018.60 | | $6.67 | | 1.31% |
Class C | | 1,000.00 | | 1,025.50 | | 10.52 | | 1,014.82 | | 10.46 | | 2.06 |
Class R | | 1,000.00 | | 1,028.10 | | 7.97 | | 1,017.34 | | 7.93 | | 1.56 |
Class Y | | 1,000.00 | | 1,030.40 | | 5.42 | | 1,019.86 | | 5.40 | | 1.06 |
Class R5 | | 1,000.00 | | 1,031.20 | | 4.97 | | 1,020.32 | | 4.94 | | 0.97 |
Class R6 | | 1,000.00 | | 1,031.20 | | 4.61 | | 1,020.67 | | 4.58 | | 0.90 |
| 1 | The actual ending account value is based on the actual total return of the Fund for the period May 1, 2019 through October 31, 2019, after actual expenses and will differ from the hypothetical ending account value which is based on the Fund’s expense ratio and a hypothetical annual return of 5% before expenses. |
| 2 | Expenses are equal to the Fund’s annualized expense ratio as indicated above multiplied by the average account value over the period, multiplied by 184/365 to reflect the most recent fiscal half year. |
24 Invesco International Growth Fund
Approval of Investment Advisory andSub-Advisory Agreements
At meetings held on June 10, 2019, the Board of Trustees (the Board or the Trustees) of AIM International Mutual Funds (Invesco International Mutual Funds) as a whole, and the independent Trustees, who comprise over 75% of the Board, voting separately, approved the continuance of the Invesco International Growth Fund’s (the Fund) Master Investment Advisory Agreement with Invesco Advisers, Inc. (Invesco Advisers and the investment advisory agreement) and the Master IntergroupSub-Advisory Contract for Mutual Funds with Invesco Asset Management Deutschland GmbH, Invesco Asset Management Limited, Invesco Asset Management (Japan) Limited, Invesco Hong Kong Limited, Invesco Senior Secured Management, Inc. and Invesco Canada Ltd. and separatesub-advisory contracts with Invesco Capital Management LLC and Invesco Asset Management (India) Private Limited (collectively, the AffiliatedSub-Advisers and thesub-advisory contracts) for another year, effective July 1, 2019. After evaluating the factors discussed below, among others, the Board approved the renewal of the Fund’s investment advisory agreement and thesub-advisory contracts and determined that the compensation payable by the Fund to Invesco Advisers and by Invesco Advisers to the AffiliatedSub-Advisers is fair and reasonable.
The Board’s Evaluation Process
The Board’s Investments Committee has established threeSub-Committees, which meet throughout the year to review the performance of funds advised by Invesco Advisers (the Invesco Funds). As part of a regularly scheduled basis ofin-person Board meetings, theSub-Committees meet with portfolio managers for their assigned Invesco Funds and other members of management to review detailed information about investment performance and portfolio attributes of these funds. The Board took into account evaluations and reports that it received from the Investments Committee andSub-Committees, as well as the information provided to such committees and the Board throughout the year, in considering whether to approve each Invesco Fund’s investment advisory agreement andsub-advisory contracts.
As part of the contract renewal process, the Board reviews and considers information provided in response to detailed requests for information submitted to management by the independent Trustees with assistance from legal counsel to the independent Trustees. The Board receives comparative investment performance and fee data regarding the Invesco Funds prepared by Invesco Advisers and Broadridge Financial Solutions, Inc. (Broadridge), an independent mutual fund data provider. The Board also receives an independent written evaluation from the Senior Officer, an officer of
the Invesco Funds who reports directly to the independent Trustees. The Senior Officer’s evaluation is prepared as part of his responsibility to manage the process by which the Invesco Funds’ proposed management fees are negotiated during the annual contract renewal process to ensure they are negotiated in a manner that is at arms’ length and reasonable. In addition to meetings with Invesco Advisers and fund counsel throughout the year, the independent Trustees also discuss the continuance of the investment advisory agreement andsub-advisory contracts in separate sessions with the Senior Officer and with independent legal counsel.
The discussion below is a summary of the Senior Officer’s independent written evaluation with respect to the Fund’s investment advisory agreement, as well as a discussion of the material factors and related conclusions that formed the basis for the Board’s approval of the Fund’s investment advisory agreement andsub-advisory contracts. The Trustees’ review and conclusions are based on the comprehensive consideration of all information presented to them during the course of the year and in prior years and are not the result of any single determinative factor. Moreover, one Trustee may have weighed a particular piece of information or factor differently than another Trustee. This information is current as of June 10, 2019.
Factors and Conclusions and Summary of Independent Written Fee Evaluation
| A. | Nature, Extent and Quality of Services Provided by Invesco Advisers and the AffiliatedSub-Advisers |
The Board reviewed the nature, extent and quality of the advisory services provided to the Fund by Invesco Advisers under the Fund’s investment advisory agreement, and the credentials and experience of the officers and employees of Invesco Advisers who provide these services, including the Fund’s portfolio manager(s). The Board’s review included consideration of Invesco Advisers’ investment process oversight and structure, credit analysis and investment risk management. The Board also considerednon-advisory services that Invesco Advisers and its affiliates provide to the Invesco Funds such as various back office support functions, third party oversight, internal audit, valuation, portfolio trading and legal and compliance. The Board also received and reviewed information about Invesco Advisers’ role as administrator of the Invesco Funds’ liquidity risk management program. The Board also reviewed and considered the benefits to shareholders of investing in a fund that is part of the Invesco family of funds under the umbrella of Invesco Ltd., Invesco Advisers’ parent company, and noted Invesco Ltd.’s depth and experience in conducting an investment
management business, as well as its commitment of financial and other resources to such business. The Board reviewed and considered information about the resources that Invesco Advisers intends to continue to commit to managing the Invesco family of funds following Invesco Ltd.’s acquisition of OppenheimerFunds, Inc. and its subsidiaries. The Board concluded that the nature, extent and quality of the services provided to the Fund by Invesco Advisers are appropriate and satisfactory.
The Board reviewed the services that may be provided by the AffiliatedSub-Advisers under thesub-advisory contracts and the credentials and experience of the officers and employees of the AffiliatedSub-Advisers who provide these services. The Board noted the AffiliatedSub-Advisers’ expertise with respect to certain asset classes and that the AffiliatedSub-Advisers have offices and personnel that are located in financial centers around the world. As a result, the Board noted that the AffiliatedSub-Advisers can provide research and investment analysis on the markets and economies of various countries in which the Fund may invest, make recommendations regarding securities and assist with security trades. The Board concluded that thesub-advisory contracts may benefit the Fund and its shareholders by permitting Invesco Advisers to use the resources and talents of the AffiliatedSub-Advisers in managing the Fund. The Board concluded that the nature, extent and quality of the services that may be provided by the AffiliatedSub-Advisers are appropriate and satisfactory.
| B. | Fund Investment Performance |
The Board considered Fund investment performance as a relevant factor in considering whether to approve the investment advisory agreement. The Board did not view Fund investment performance as a relevant factor in considering whether to approve thesub-advisory contracts for the Fund, as no AffiliatedSub-Adviser currently manages assets of the Fund.
The Board compared the Fund’s investment performance over multiple time periods ending December 31, 2018 to the performance of funds in the Broadridge performance universe and against the Lipper InternationalLarge-Cap Growth Funds Index. The Board noted that performance of Class A shares of the Fund was in the third quintile of its performance universe for the one and five year periods and the fourth quintile for the three year period (the first quintile being the best performing funds and the fifth quintile being the worst performing funds). The Board noted that performance of Class A shares of the Fund was below the performance of the Index for the one, three and five year periods. The Board noted that not owning
25 Invesco International Growth Fund
certain names as a result of the valuation component of the Fund’s investment process, as well as stock selection in certain sectors and regions detracted from Fund performance. The Trustees also reviewed more recent Fund performance and this review did not change their conclusions.
| C. | Advisory andSub-Advisory Fees and Fund Expenses |
The Board compared the Fund’s contractual management fee rate to the contractual management fee rates of funds in the Fund’s Broadridge expense group. The Board noted that the contractual management fee rate for Class A shares of the Fund was reasonably comparable to the median contractual management fee rate of funds in its expense group. The Board noted that the term “contractual management fee” for funds in the expense group may include both advisory and certainnon-portfolio management administrative services fees, but that Broadridge does not provide information on a fund by fund basis as to what is included. The Board also reviewed the methodology used by Broadridge in providing expense group information, which includes using each fund’s contractual management fee schedule (including any applicable breakpoints) as reported in the most recent prospectus or statement of additional information for each fund in the expense group. The Board also considered comparative information regarding the Fund’s total expense ratio and its various components. The Board noted that the Fund’s total expense ratio was in the fourth quintile of its expense group and discussed with management reasons for such relative total expenses.
The Board noted that Invesco Advisers has contractually agreed to waive fees and/or limit expenses of the Fund for the term disclosed in the Fund’s registration statement in an amount necessary to limit total annual operating expenses to a specified percentage of average daily net assets for each class of the Fund.
The Board also considered the fees charged by Invesco Advisers and the AffiliatedSub-Advisers to other similarly managed client accounts. The Board noted that Invesco Advisers or the AffiliatedSub-Advisers may charge lower fees to large institutional clients. Invesco Advisers reviewed with the Board differences in the scope of services it provides to the Invesco Funds relative to certain other types of client accounts, including management of cash flows as a result of redemptions and purchases, necessary infrastructure such as officers, office space, technology, legal and distribution, oversight of service providers, costs and business risks associated with launching new funds and sponsoring and maintaining the product line, preparation of annual registration statement updates and financial information and compliance with federal and state laws and regulations.
The Board also compared the Fund’s effective advisory fee rate (the advisory fee rate after
advisory fee waivers and before other expense limitations/waivers) to the effective advisory fee rates of other similarly managed third-party mutual funds advised orsub-advised by Invesco Advisers and its affiliates, based on asset balances as of December 31, 2018.
The Board also considered the services that may be provided by the AffiliatedSub-Advisers pursuant to thesub-advisory contracts, as well as the fees payable by Invesco Advisers to the AffiliatedSub-Advisers pursuant to thesub-advisory contracts.
| D. | Economies of Scale and Breakpoints |
The Board considered the extent to which there may be economies of scale in the provision of advisory services to the Fund. The Board considered Invesco’s reinvestment in its business, including investments in business infrastructure and cybersecurity. The Board also considered that the Fund benefits from economies of scale through contractual breakpoints in the Fund’s advisory fee schedule, which generally operate to reduce the Fund’s expense ratio as it grows in size. The Board noted that the Fund shares directly in economies of scale through lower fees charged by third party service providers based on the combined size of the Invesco Funds. The Board noted that the Fund may also benefit from economies of scale through initial fee setting, fee waivers and expense reimbursements.
| E. | Profitability and Financial Resources |
The Board reviewed information from Invesco Advisers concerning the costs of the advisory and other services that Invesco Advisers and its affiliates provide to the Fund and the Invesco Funds and the profitability of Invesco Advisers and its affiliates in providing these services. The Board considered the methodology used for calculating profitability and noted the periodic review of such methodology by an independent consultant. The Board noted that Invesco Advisers continues to operate at a net profit from services Invesco Advisers and its affiliates provide to the Invesco Funds and the Fund. The Board did not deem the level of profits realized by Invesco Advisers and its affiliates from providing services to the Fund to be excessive given the nature, extent and quality of the services provided. The Board received information from Invesco Advisers demonstrating that Invesco Advisers and the AffiliatedSub-Advisers are financially sound and have the resources necessary to perform their obligations under the investment advisory agreement andsub-advisory contracts.
| F. | Collateral Benefits to Invesco Advisers and its Affiliates |
The Board considered various other benefits received by Invesco Advisers and its affiliates from the relationship with the Fund, including the fees received for providing administrative, transfer agency and distribution services to the Fund. The Board considered comparative information regarding fees charged for these services, including information provided by Broadridge and other independent sources. The
Board considered the performance of Invesco Advisers and its affiliates in providing these services and the organizational structure employed to provide these services. The Board also considered that these services are provided to the Fund pursuant to written contracts that are reviewed and approved on an annual basis by the Board; and that the services are required for the operation of the Fund.
The Board considered the benefits realized by Invesco Advisers and the AffiliatedSub-Advisers as a result of portfolio brokerage transactions executed through “soft dollar” arrangements. The Board noted that soft dollar arrangements may result in the Fund bearing costs to purchase research that may be used by Invesco Advisers or the AffiliatedSub-Advisers with other clients and may reduce Invesco Advisers’ or the AffiliatedSub-Advisers’ expenses. The Board also considered that it receives periodic reports from Invesco representing that these arrangements are consistent with regulatory requirements. The Board did not deem the soft dollar arrangements to be inappropriate.
The Board considered that the Fund’s uninvested cash and cash collateral from any securities lending arrangements may be invested in money market funds advised by Invesco Advisers pursuant to procedures approved by the Board. The Board considered information regarding the returns of the affiliated money market funds relative to comparable overnight investments, as well as the costs to the Fund of such investments. The Board noted that Invesco Advisers receives advisory fees from these affiliated money market funds attributable to such investments, although Invesco Advisers has contractually agreed to waive through varying periods the advisory fees payable by the Invesco Funds with respect to certain investments in the affiliated money market funds. The waiver is in an amount equal to 100% of the net advisory fee Invesco Advisers receives from the affiliated money market funds with respect to the Fund’s investment in the affiliated money market funds of uninvested cash, but not cash collateral. The Board concluded that the amount of advisory fees received by Invesco Advisers from the Fund’s investment of cash collateral from any securities lending arrangements in the affiliated money market funds is fair and reasonable.
The Board also considered that an affiliated broker may receive commissions for executing certain trades for the Fund. Invesco Advisers and the AffiliatedSub-Advisers may use the affiliated broker to, among other things, control order routing and minimize information leakage, and the Board was advised that such trades are executed in compliance with rules under the federal securities laws and consistent with best execution obligations.
26 Invesco International Growth Fund
Tax Information
Form1099-DIV, Form1042-S and otheryear-end tax information provide shareholders with actual calendar year amounts that should be included in their tax returns. Shareholders should consult their tax advisors.
The following distribution information is being provided as required by the Internal Revenue Code or to meet a specific state’s requirement.
The Fund designates the following amounts or, if subsequently determined to be different, the maximum amount allowable for its fiscal year ended October 31, 2019:
| | | | | | | | |
| | Federal and State Income Tax | | | | | | |
| | Long-Term Capital Gain Distributions | | $ | 460,014,570 | | | |
| | Qualified Dividend Income* | | | 83.10 | % | | |
| | Corporate Dividends Received Deduction* | | | 9.39 | % | | |
| | U.S. Treasury Obligations* | | | 0.00 | % | | |
| | Foreign Tax | | $ | 0.0978 | | | per share |
| | Foreign Source Income | | $ | 0.9682 | | | per share |
| | * | The above percentages are based on ordinary income dividends paid to shareholders during the Fund’s fiscal year. |
27 Invesco International Growth Fund
Trustees and Officers
The address of each trustee and officer is AIM International Mutual Funds (Invesco International Mutual Funds) (the “Trust”), 11 Greenway Plaza, Suite 1000, Houston, Texas 77046-1173. The trustees serve for the life of the Trust, subject to their earlier death, incapacitation, resignation, retirement or removal as more specifically provided in the Trust’s organizational documents. Each officer serves for a one year term or until their successors are elected and qualified. Column two below includes length of time served with predecessor entities, if any.
| | | | | | | | |
Name, Year of Birth and
Position(s)
Held with the Trust
| | Trustee and/or Officer Since | | Principal Occupation(s)
During Past 5 Years | | Number of
Funds in
Fund Complex
Overseen by
Trustee | | Other Directorship(s)
Held by Trustee
During Past 5
Years |
| Interested Persons | | | | | | | | |
| Martin L. Flanagan1 - 1960 Trustee and Vice Chair | | 2007 | | Executive Director, Chief Executive Officer and President, Invesco Ltd. (ultimate parent of Invesco and a global investment management firm); Trustee and Vice Chair, The Invesco Funds; Vice Chair, Investment Company Institute; and Member of Executive Board, SMU Cox School of Business Formerly: Advisor to the Board, Invesco Advisers, Inc. (formerly known as Invesco Institutional (N.A.), Inc.); Chairman and Chief Executive Officer, Invesco Advisers, Inc. (registered investment adviser); Director, Chairman, Chief Executive Officer and President, Invesco Holding Company (US), Inc. (formerly IVZ Inc.) (holding company), Invesco Group Services, Inc. (service provider) and Invesco North American Holdings, Inc. (holding company); Director, Chief Executive Officer and President, Invesco Holding Company Limited (parent of Invesco and a global investment management firm); Director, Invesco Ltd.; Chairman, Investment Company Institute and President,Co-Chief Executive Officer,Co-President, Chief Operating Officer and Chief Financial Officer, Franklin Resources, Inc. (global investment management organization) | | 229 | | None |
Philip A. Taylor2 - 1954
Trustee | | 2006 | | Vice Chair, Invesco Ltd.; Trustee, The Invesco Funds Formerly: Director, Invesco Canada Ltd. (formerly known as Invesco Trimark Ltd./Invesco Trimark Ltèe) (registered investment adviser and registered transfer agent); Head of the Americas and Senior Managing Director, Invesco Ltd.; Director, Invesco Advisers, Inc. (formerly known as Invesco Institutional (N.A.), Inc.) (registered investment adviser); Director and Chairman, Invesco Investment Services, Inc. (formerly known as Invesco AIM Investment Services, Inc.) (registered transfer agent); Chief Executive Officer, Invesco Corporate Class Inc. (corporate mutual fund company); Chairman and Chief Executive Officer, Invesco Canada Ltd. (formerly known as Invesco Trimark Ltd./Invesco Trimark Ltèe) (registered investment adviser and registered transfer agent); Senior Vice President, The Invesco Funds; Director, Invesco Investment Advisers LLC (formerly known as Van Kampen Asset Management); Director, Chairman, Chief Executive Officer and President, Invesco Management Group, Inc. (formerly known as Invesco AIM Management Group, Inc.) (financial services holding company);Co-Chairman,Co-President andCo-Chief Executive Officer, Invesco Advisers, Inc. (formerly known | | 229 | | None |
| | | | | as Invesco Institutional (N.A.), Inc.) (registered investment adviser); Director, Chief Executive Officer and President, Van Kampen Exchange Corp; President and Principal Executive Officer, The Invesco Funds (other than AIM Treasurer’s Series Trust (Invesco Treasurer’s Series Trust), Short-Term Investments Trust and Invesco Management Trust); Executive Vice President, The Invesco Funds (AIM Treasurer’s Series Trust (Invesco Treasurer’s Series Trust), Short-Term Investments Trust and Invesco Management Trust only); Director and President, INVESCO Funds Group, Inc. (registered investment adviser and registered transfer agent); Director and Chairman, IVZ Distributors, Inc. (formerly known as INVESCO Distributors, Inc.) (registered broker dealer); Director, President and Chairman, Invesco Inc. (holding company), Invesco Canada Holdings Inc. (holding company), Trimark Investments Ltd./Placements Trimark Ltèe and Invesco Financial Services Ltd/Services Financiers Invesco Ltèe; Chief Executive Officer, Invesco Canada Fund Inc. (corporate mutual fund company); Director and Chairman, Van Kampen Investor Services Inc.; Director, Chief Executive Officer and President, 1371 Preferred Inc. (holding company) and Van Kampen Investments Inc.; Director and President, AIM GP Canada Inc. (general partner for limited partnerships) and Van Kampen Advisors, Inc.; Director and Chief Executive Officer, Invesco Trimark Dealer Inc. (registered broker dealer); Director, Invesco Distributors, Inc. (formerly known as Invesco AIM Distributors, Inc.) (registered broker dealer); Manager, Invesco Capital Management LLC; Director, Chief Executive Officer and President, Invesco Advisers, Inc.; Director, Chairman, Chief Executive Officer and President, Invesco AIM Capital Management, Inc.; President, Invesco Trimark Dealer Inc. and Invesco Trimark Ltd./Invesco Trimark Ltèe; Director and President, AIM Trimark Corporate Class Inc. and AIM Trimark Canada Fund Inc.; Senior Managing Director, Invesco Holding Company Limited; Director and Chairman, Fund Management Company (former registered broker dealer); President and Principal Executive Officer, The Invesco Funds (AIM Treasurer’s Series Trust (Invesco Treasurer’s Series Trust), and Short-Term Investments Trust only); President, AIM Trimark Global Fund Inc. and AIM Trimark Canada Fund Inc. | | | | |
| 1 | Mr. Flanagan is considered an interested person (within the meaning of Section 2(a)(19) of the 1940 Act) of the Trust because he is an officer of the Adviser to the Trust, and an officer and a director of Invesco Ltd., ultimate parent of the Adviser. |
| 2 | Mr. Taylor is considered an interested person (within the meaning of Section 2(a)(19) of the 1940 Act) of the Trust because he is an officer and a director of the Adviser. |
T-1 Invesco International Growth Fund
Trustees and Officers–(continued)
| | | | | | | | |
Name, Year of Birth and
Position(s)
Held with the Trust
| | Trustee and/or Officer Since | | Principal Occupation(s)
During Past 5 Years | | Number of
Funds
in
Fund Complex
Overseen by
Trustee | | Other Directorship(s)
Held by Trustee
During Past 5
Years |
| Independent Trustees | | | | | | | | |
| Bruce L. Crockett - 1944 Trustee and Chair | | 1992 | | Chairman, Crockett Technologies Associates (technology consulting company) Formerly: Director, Captaris (unified messaging provider); Director, President and Chief Executive Officer, COMSAT Corporation; Chairman, Board of Governors of INTELSAT (international communications company); ACE Limited (insurance company); Independent Directors Council and Investment Company Institute: Member of the Audit Committee, Investment Company Institute; Member of the Executive Committee and Chair of the Governance Committee, Independent Directors Council | | 229 | | Director and Chairman of the Audit Committee, ALPS (Attorneys Liability Protection Society) (insurance company); Director and Member of the Audit Committee and Compensation Committee, Ferroglobe PLC (metallurgical company) |
David C. Arch - 1945
Trustee | | 2010 | | Chairman of Blistex Inc. (consumer health care products manufacturer); Member, World Presidents’ Organization | | 229 | | Board member of the Illinois Manufacturers’ Association |
Beth Ann Brown - 1968
Trustee | | 2019 | | Independent Consultant Formerly: Head of Intermediary Distribution, Managing Director, Strategic Relations, Managing Director, Head of National Accounts, Senior Vice President, National Account Manager and Senior Vice President, Key Account Manager, Columbia Management Investment Advisers LLC; Vice President, Key Account Manager, Liberty Funds Distributor, Inc.; and Trustee of certain Oppenheimer Funds | | 229 | | Director, Board of Directors of Caron Engineering Inc.; President and Director, Acton Shapleigh Youth Conservation Corps (non - profit); and Vice President and Director of Grahamtastic Connection (non-profit) |
Jack M. Fields - 1952
Trustee | | 1997 | | Chief Executive Officer, Twenty First Century Group, Inc. (government affairs company); and Chairman, Discovery Learning Alliance(non-profit) Formerly: Owner and Chief Executive Officer, Dos Angeles Ranch L.P. (cattle, hunting, corporate entertainment); Director, Insperity, Inc. (formerly known as Administaff) (human resources provider); Chief Executive Officer, Texana Timber LP (sustainable forestry company); Director of Cross Timbers Quail Research Ranch(non-profit); and member of the U.S. House of Representatives | | 229 | | None |
| Cynthia Hostetler - 1962 Trustee | | 2017 | | Non-Executive Director and Trustee of a number of public and private business corporations Formerly: Director, Aberdeen Investment Funds (4 portfolios); Head of Investment Funds and Private Equity, Overseas Private Investment Corporation; President, First Manhattan Bancorporation, Inc.; Attorney, Simpson Thacher & Bartlett LLP | | 229 | | Vulcan Materials Company (construction materials company); Trilinc Global Impact Fund; Genesee & Wyoming, Inc. (railroads); Artio Global Investment LLC (mutual fund complex); Edgen Group, Inc. (specialized energy and infrastructure products distributor); Investment Company Institute (professional organization); Independent Directors Council (professional organization) |
T-2 Invesco International Growth Fund
Trustees and Officers–(continued)
| | | | | | | | |
Name, Year of Birth and
Position(s)
Held with the Trust
| | Trustee and/or Officer Since | | Principal Occupation(s)
During Past 5 Years | | Number of
Funds
in
Fund Complex
Overseen by
Trustee | | Other Directorship(s)
Held by Trustee
During Past 5
Years |
| Independent Trustees–(continued) | | | | | | |
Eli Jones - 1961
Trustee | | 2016 | | Professor and Dean, Mays Business School - Texas A&M University Formerly: Professor and Dean, Walton College of Business, University of Arkansas and E.J. Ourso College of Business, Louisiana State University; Director, Arvest Bank | | 229 | | Insperity, Inc. (formerly known as Administaff) (human resources provider) |
| Elizabeth Krentzman - 1959 Trustee | | 2019 | | Formerly: Principal and Chief Regulatory Advisor for Asset Management Services and U.S. Mutual Fund Leader of Deloitte & Touche LLP; General Counsel of the Investment Company Institute (trade association); National Director of the Investment Management Regulatory Consulting Practice, Principal, Director and Senior Manager of Deloitte & Touche LLP; Assistant Director of the Division of Investment Management - Office of Disclosure and Investment Adviser Regulation of the U.S. Securities and Exchange Commission and various positions with the Division of Investment Management - Office of Regulatory Policy of the U.S. Securities and Exchange Commission; Associate at Ropes & Gray LLP; Advisory Board Member of the Securities and Exchange Commission Historical Society; and Trustee of certain Oppenheimer Funds | | 229 | | Trustee of the University of Florida National Board Foundation and Audit Committee Member; Member of the Cartica Funds Board of Directors (private investment funds); Member of the University of Florida Law Center Association, Inc. Board of Trustees and Audit Committee Member |
Anthony J. LaCava, Jr. - 1956
Trustee | | 2019 | | Formerly: Director and Member of the Audit Committee, Blue Hills Bank (publicly traded financial institution) and Managing Partner, KPMG LLP | | 229 | | Blue Hills Bank; Chairman, Bentley University; Member, Business School Advisory Council; and Nominating Committee KPMG LLP |
| Prema Mathai-Davis - 1950 Trustee | | 1998 | | Retired Co-Owner & Partner of Quantalytics Research, LLC, (a FinTech Investment Research Platform for the Self-Directed Investor) | | 229 | | None |
Joel W. Motley - 1952
Trustee | | 2019 | | Director of Office of Finance, Federal Home Loan Bank; Member of the Vestry of Trinity Wall Street; Managing Director of Carmona Motley Inc. (privately held financial advisor); Member of the Finance and Budget Committee of the Council on Foreign Relations, Member of the Investment Committee and Board of Human Rights Watch and Member of the Investment Committee and Board of Historic Hudson Valley(non-profit cultural organization) Formerly: Managing Director of Public Capital Advisors, LLC (privately held financial advisor); Managing Director of Carmona Motley Hoffman, Inc. (privately held financial advisor); Trustee of certain Oppenheimer Funds; and Director of Columbia Equity Financial Corp. (privately held financial advisor) | | 229 | | Director of Greenwall Foundation (bioethics research foundation); Member of Board and Investment Committee of The Greenwall Foundation; Director of Southern Africa Legal Services Foundation; Board Member and Investment Committee Member of Pulizer Center for Crisis Reporting(non-profit journalism) |
| Teresa M. Ressel - 1962 Trustee | | 2017 | | Non-executive director and trustee of a number of public and private business corporations Formerly: Chief Financial Officer, Olayan America, The Olayan Group (international investor/commercial/industrial); Chief Executive Officer, UBS Securities LLC; Group Chief Operating Officer, Americas, UBS AG; Assistant Secretary for Management & Budget and CFO, US Department of the Treasury | | 229 | | Atlantic Power Corporation (power generation company); ON Semiconductor Corp. (semiconductor supplier) |
T-3 Invesco International Growth Fund
Trustees and Officers–(continued)
| | | | | | | | |
Name, Year of Birth and
Position(s)
Held with the Trust
| | Trustee and/or Officer Since | | Principal Occupation(s)
During Past 5 Years | | Number of
Funds
in
Fund Complex
Overseen by
Trustee | | Other Directorship(s)
Held by Trustee
During Past 5
Years |
| Independent Trustees–(continued) | | | | | | |
Ann Barnett Stern - 1957
Trustee | | 2017 | | President and Chief Executive Officer, Houston Endowment Inc. (private philanthropic institution) Formerly: Executive Vice President and General Counsel, Texas Children’s Hospital; Attorney, Beck, Redden and Secrest, LLP; Business Law Instructor, University of St. Thomas; Attorney, Andrews & Kurth LLP | | 229 | | Federal Reserve Bank of Dallas |
| Raymond Stickel, Jr. - 1944 Trustee | | 2005 | | Retired Formerly: Director, Mainstay VP Series Funds, Inc. (25 portfolios); Partner, Deloitte & Touche | | 229 | | None |
| Robert C. Troccoli - 1949 Trustee | | 2016 | | Retired Formerly: Adjunct Professor, University of Denver - Daniels College of Business; Senior Partner, KPMG LLP | | 229 | | None |
| Daniel S. Vandivort - 1954 Trustee | | 2019 | | Treasurer, Chairman of the Audit and Finance Committee, and Trustee, Board of Trustees, Huntington Disease Foundation of America; and President, Flyway Advisory Services LLC (consulting and property management) Formerly: Trustee and Governance Chair, of certain Oppenheimer Funds | | 229 | | Chairman and Lead Independent Director, Chairman of the Audit Committee, and Director, Board of Directors, Value Line Funds |
| James D. Vaughn - 1945 Trustee | | 2019 | | Retired Formerly: Managing Partner, Deloitte & Touche LLP; Trustee and Chairman of the Audit Committee, Schroder Funds; Board Member, Mile High United Way, Boys and Girls Clubs, Boy Scouts, Colorado Business Committee for the Arts, Economic Club of Colorado and Metro Denver Network (economic development corporation); and Trustee of certain Oppenheimer Funds | | 229 | | Board member and Chairman of Audit Committee of AMG National Trust Bank; Trustee and Investment Committee member, University of South Dakota Foundation; Board member, Audit Committee Member and past Board Chair, Junior Achievement(non-profit) |
| Christopher L. WIlson - 1957 Trustee, Vice Chair and Chair Designate | | 2017 | | Reitred Formerly: Director, TD Asset Management USA Inc. (mutual fund complex) (22 portfolios); Managing Partner, CT2, LLC (investing and consulting firm); President/Chief Executive Officer, Columbia Funds, Bank of America Corporation; President/Chief Executive Officer, CDC IXIS Asset Management Services, Inc.; Principal & Director of Operations, Scudder Funds, Scudder, Stevens & Clark, Inc.; Assistant Vice President, Fidelity Investments | | 229 | | ISO New England, Inc.(non-profit organization managing regional electricity market) |
T-4 Invesco International Growth Fund
Trustees and Officers–(continued)
| | | | | | | | |
Name, Year of Birth and
Position(s) Held with the Trust | | Trustee and/or
Officer
Since | | Principal Occupation(s) During Past 5 Years | | Number of
Funds in
Fund Complex
Overseen by
Trustee | | Other
Directorship(s) Held by Trustee
During Past 5 Years |
| Other Officers | | | | | | | | |
| | | | | |
Sheri Morris – 1964 President, Principal Executive Officer and Treasurer | | 1999 | | Head of Global Fund Services, Invesco Ltd.; President, Principal Executive Officer and Treasurer, The Invesco Funds; Vice President, Invesco Advisers, Inc. (formerly known as Invesco Institutional (N.A.), Inc.) (registered investment adviser); and Vice President, Invesco Exchange-Traded Fund Trust, Invesco Exchange-Traded Fund Trust II, Invesco India Exchange-Traded Fund Trust, Invesco Actively Managed Exchange-Traded Fund Trust, Invesco Actively Managed Exchange-Traded Commodity Fund Trust and Invesco Exchange-Traded Self-Indexed Fund Trust; and Vice President, OppenheimerFunds, Inc. Formerly: Vice President and Principal Financial Officer, The Invesco Funds; Vice President, Invesco AIM Advisers, Inc., Invesco AIM Capital Management, Inc. and Invesco AIM Private Asset Management, Inc.; Assistant Vice President and Assistant Treasurer, The Invesco Funds and Assistant Vice President, Invesco Advisers, Inc., Invesco AIM Capital Management, Inc. and Invesco AIM Private Asset Management, Inc.; and Treasurer, Invesco Exchange-Traded FundTrust, Invesco Exchange-Traded Fund Trust II, Invesco India Exchange-Traded Fund Trust and Invesco Actively Managed Exchange-Traded Fund Trust | | N/A | | N/A |
| | | | | |
Russell C. Burk – 1958 Senior Vice President and Senior Officer | | 2005 | | Senior Vice President and Senior Officer, The Invesco Funds | | N/A | | N/A |
| | | | | |
Jeffrey H. Kupor – 1968 Senior Vice President, Chief Legal Officer and Secretary | | 2018 | | Head of Legal of the Americas, Invesco Ltd.; Senior Vice President and Secretary, Invesco Advisers, Inc. (formerly known as Invesco Institutional (N.A.), Inc.) (registered investment adviser); Senior Vice President and Secretary, Invesco Distributors, Inc. (formerly known as Invesco AIM Distributors, Inc.); Vice President and Secretary, Invesco Investment Services, Inc. (formerly known as Invesco AIM Investment Services, Inc.) Senior Vice President, Chief Legal Officer and Secretary, The Invesco Funds; Secretary and General Counsel, Invesco Investment Advisers LLC (formerly known as Van Kampen Asset Management); Secretary and General Counsel, Invesco Capital Markets, Inc. (formerly known as Van Kampen Funds Inc.) and Chief Legal Officer, Invesco Exchange-Traded Fund Trust, Invesco Exchange-Traded Fund Trust II, Invesco India Exchange-Traded Fund Trust, Invesco Actively Managed Exchange-Traded Fund Trust, Invesco Actively Managed Exchange-Traded Commodity Fund Trust and Invesco Exchange-Traded Self-Indexed Fund Trust; Secretary, Invesco Indexing LLC; Secretary, W.L. Ross & Co., LLC Formerly: Secretary and Vice President, Jemstep, Inc.; Head of Legal, Worldwide Institutional, Invesco Ltd.; Secretary and General Counsel, INVESCO Private Capital Investments, Inc.; Senior Vice President, Secretary and General Counsel, Invesco Management Group, Inc. (formerly known as Invesco AIM Management Group, Inc.); Assistant Secretary, INVESCO Asset Management (Bermuda) Ltd.; Secretary and General Counsel, Invesco Private Capital, Inc.; Assistant Secretary and General Counsel, INVESCO Realty, Inc.; Secretary and General Counsel, Invesco Senior Secured Management, Inc.; and Secretary, Sovereign G./P. Holdings Inc. | | N/A | | N/A |
| | | | | |
Andrew R. Schlossberg - 1974 Senior Vice President | | 2019 | | Head of the Americas and Senior Managing Director, Invesco Ltd.; Director and Senior Vice President, Invesco Advisers, Inc. (formerly known as Invesco Institutional (N.A.), Inc.) (registered investment adviser); Director and Chairman, Invesco Investment Services, Inc. (formerly known as Invesco AIM Investment Services, Inc.) (registered transfer agent); Senior Vice President, The Invesco Funds; Director, Invesco Investment Advisers LLC (formerly known as Van Kampen Asset Management); Director, President and Chairman, Invesco Insurance Agency, Inc. Formerly: Director, Invesco UK Limited; Director and Chief Executive, Invesco Asset Management Limited and Invesco Fund Managers Limited; Assistant Vice President, The Invesco Funds; Senior Vice President, Invesco Advisers, Inc. (formerly known as Invesco Institutional (N.A.), Inc.) (registered investment adviser); Director and Chief Executive, Invesco Administration Services Limited and Invesco Global Investment Funds Limited; Director, Invesco Distributors, Inc.; Head of EMEA, Invesco Ltd.; President, Invesco Actively Managed Exchange-Traded Commodity Fund Trust, Invesco Actively Managed Exchange-Traded Fund Trust, Invesco Exchange-Traded Fund Trust, Invesco Exchange-Traded Fund Trust II and Invesco India Exchange-Traded Fund Trust; Managing Director and Principal Executive Officer, Invesco Capital Management LLC | | N/A | | N/A |
T-5 Invesco International Growth Fund
Trustees and Officers–(continued)
| | | | | | | | |
Name, Year of Birth and
Position(s) Held with the Trust | | Trustee and/or
Officer
Since | | Principal Occupation(s) During Past 5 Years | | Number of
Funds in
Fund Complex
Overseen by
Trustee | | Other
Directorship(s) Held by Trustee
During Past 5 Years |
| Other Officers–(continued) | | | | | | |
| | | | | |
John M. Zerr - 1962 Senior Vice President | | 2006 | | Chief Operating Officer of the Americas; Senior Vice President, Invesco Advisers, Inc. (formerly known as Invesco Institutional (N.A.), Inc.) (registered investment adviser); Senior Vice President, Invesco Distributors, Inc. (formerly known as Invesco AIM Distributors, Inc.); Director and Vice President, Invesco Investment Services, Inc. (formerly known as Invesco AIM Investment Services, Inc.) Senior Vice President, The Invesco Funds; Managing Director, Invesco Capital Management LLC; Director, Invesco Investment Advisers LLC (formerly known as Van Kampen Asset Management); Senior Vice President, Invesco Capital Markets, Inc. (formerly known as Van Kampen Funds Inc.); Manager, Invesco Indexing LLC; Manager, Invesco Specialized Products, LLC; Director and Senior Vice President, Invesco Insurance Agency, Inc.; Member, Invesco Canada Funds Advisory Board; Director, President and Chief Executive Officer, Invesco Corporate Class Inc. (corporate mutual fund company); and Director, Chairman, President and Chief Executive Officer, Invesco Canada Ltd. (formerly known as Invesco Trimark Ltd./Invesco Trimark Ltèe) (registered investment adviser and registered transfer agent) | | N/A | | N/A |
| | | | | |
| | | | | Formerly: Director and Senior Vice President, Invesco Management Group, Inc. (formerly known as Invesco AIM Management Group, Inc.); Secretary and General Counsel, Invesco Management Group, Inc. (formerly known as Invesco AIM Management Group, Inc.); Secretary, Invesco Investment Services, Inc. (formerly known as Invesco AIM Investment Services, Inc.); Chief Legal Officer and Secretary, The Invesco Funds; Secretary and General Counsel, Invesco Investment Advisers LLC (formerly known as Van Kampen Asset Management); Secretary and General Counsel, Invesco Capital Markets, Inc. (formerly known as Van Kampen Funds Inc.); Chief Legal Officer, Invesco Exchange-Traded Fund Trust, Invesco Exchange-Traded Fund Trust II, Invesco India Exchange-Traded Fund Trust, Invesco Actively Managed Exchange-Traded Fund Trust, Invesco Actively Managed Exchange-Traded Commodity Fund Trust and Invesco Exchange-Traded Self-Indexed Fund Trust; Secretary, Invesco Indexing LLC; Director, Secretary, General Counsel and Senior Vice President, Van Kampen Exchange Corp.; Director, Vice President and Secretary, IVZ Distributors, Inc. (formerly known as INVESCO Distributors, Inc.); Director and Vice President, INVESCO Funds Group, Inc.; Director and Vice President, Van Kampen Advisors Inc.; Director, Vice President, Secretary and General Counsel, Van Kampen Investor Services Inc.;Director and Secretary, Invesco Distributors, Inc. (formerly known as Invesco AIM Distributors, Inc.); Director, Senior Vice President, General Counsel and Secretary, Invesco AIM Advisers, Inc. and Van Kampen Investments Inc.; Director, Vice President and Secretary, Fund Management Company; Director, Senior Vice President, Secretary, General Counsel and Vice President, Invesco AIM Capital Management, Inc.; Chief Operating Officer and General Counsel, Liberty Ridge Capital, Inc. (an investment adviser) | | | | |
| | | | | |
Gregory G. McGreevey - 1962 Senior Vice President | | 2012 | | Senior Managing Director, Invesco Ltd.; Director, Chairman, President, and Chief Executive Officer, Invesco Advisers, Inc. (formerly known as Invesco Institutional (N.A.), Inc.) (registered investment adviser); Director, Invesco Mortgage Capital, Inc. and Invesco Senior Secured Management, Inc.; and Senior Vice President, The Invesco Funds; and President, SNW Asset Management Corporation Formerly: Senior Vice President, Invesco Management Group, Inc. and Invesco Advisers, Inc.; Assistant Vice President, The Invesco Funds | | N/A | | N/A |
| | | | | |
Kelli Gallegos - 1970 Vice President, Principal Financial Officer and Assistant Treasurer | | 2008 | | Principal Financial and Accounting Officer – Investments Pool, Invesco Specialized Products, LLC; Vice President, Principal Financial Officer and Assistant Treasurer, The Invesco Funds; Principal Financial and Accounting Officer – Pooled Investments, Invesco Capital Management LLC; Vice President and Treasurer, Invesco Exchange-Traded Fund Trust, Invesco Exchange-Traded Fund Trust II, Invesco India Exchange-Traded Fund Trust, Invesco Actively Managed Exchange-Traded Fund Trust, Invesco Actively Managed Exchange-Traded Commodity Fund Trust and Invesco Exchange-Traded Self-Indexed Fund Trust Formerly: Assistant Treasurer, Invesco Specialized Products, LLC; Assistant Treasurer, Invesco Exchange-Traded Fund Trust, Invesco Exchange-Traded Fund Trust II, Invesco India Exchange-Traded Fund Trust, Invesco Actively Managed Exchange-Traded Fund Trust, Invesco Actively Managed Exchange-Traded Commodity Fund Trust and Invesco Exchange-Traded Self-Indexed Fund Trust; Assistant Treasurer, Invesco Capital Management LLC; Assistant Vice President, The Invesco Funds | | N/A | | N/A |
T-6 Invesco International Growth Fund
Trustees and Officers–(continued)
| | | | | | | | |
Name, Year of Birth and Position(s)
Held with the Trust | | Trustee and/or
Officer
Since | | Principal Occupation(s) During Past 5 Years | | Number of
Funds in
Fund Complex
Overseen by
Trustee | | Other
Directorship(s) Held by Trustee
During Past 5 Years |
| Other Officers–(continued) | | | | | | |
| | | | | |
Crissie M. Wisdom - 1969 Anti-Money Laundering Compliance Officer | | 2013 | | Anti-Money Laundering Compliance Officer, Invesco Advisers, Inc. (formerly known as Invesco Institutional (N.A.), Inc.) (registered investment adviser), Invesco Capital Markets, Inc. (formerly known as Van Kampen Funds Inc.), Invesco Distributors, Inc., Invesco Investment Services, Inc., The Invesco Funds, and Invesco Exchange-Traded Fund Trust, Invesco Exchange-Traded Fund Trust II, Invesco India Exchange-Traded Fund Trust, Invesco Actively Managed Exchange-Traded Fund Trust, Invesco Actively Managed Exchange-Traded Commodity Fund Trust and Invesco Exchange-Traded Self-Indexed Fund Trust; Anti-Money Laundering Compliance Officer and Bank Secrecy Act Officer, INVESCO National Trust Company and Invesco Trust Company; and Fraud Prevention Manager and Controls and Risk Analysis Manager for Invesco Investment Services, Inc. Formerly: Anti-Money Laundering Compliance Officer, Van Kampen Exchange Corp. and Invesco Management Group, Inc. | | N/A | | N/A |
| | | | | |
Robert R. Leveille - 1969 Chief Compliance Officer | | 2016 | | Chief Compliance Officer, Invesco Advisers, Inc. (registered investment adviser); and Chief Compliance Officer, The Invesco Funds Formerly: Chief Compliance Officer, Putnam Investments and the Putnam Funds | | N/A | | N/A |
The Statement of Additional Information of the Trust includes additional information about the Fund’s Trustees and is available upon request, without charge, by calling 1.800.959.4246. Please refer to the Fund’s Statement of Additional Information for information on the Fund’ssub-advisers.
| | | | | | |
Office of the Fund 11 Greenway Plaza, Suite 1000 Houston, TX 77046-1173 | | Investment Adviser Invesco Advisers, Inc. 1555 Peachtree Street, N.E. Atlanta, GA 30309 | | Distributor Invesco Distributors, Inc. 11 Greenway Plaza, Suite 1000 Houston, TX 77046-1173 | | Auditors PricewaterhouseCoopers LLP 1000 Louisiana Street, Suite 5800 Houston, TX 77002-5678 |
| | | |
Counsel to the Fund Stradley Ronon Stevens & Young, LLP 2005 Market Street, Suite 2600 Philadelphia, PA 19103-7018 | | Counsel to the Independent Trustees Goodwin Procter LLP 901 New York Avenue, N.W.
Washington, D.C. 20001 | | Transfer Agent Invesco Investment Services, Inc.
11 Greenway Plaza, Suite 1000 Houston, TX 77046-1173 | | Custodian State Street Bank and Trust Company 225 Franklin Street
Boston, MA 02110-2801 |
T-7 Invesco International Growth Fund
(This page intentionally left blank)

Go paperless with eDelivery
Visit invesco.com/edelivery to enjoy the convenience and security of anytime electronic access to your investment documents.
With eDelivery, you can elect to have any or all of the following materials delivered straight to your inbox to download, save and print from your own computer:
∎ Fund reports and prospectuses
∎ Quarterly statements
∎ Daily confirmations
∎ Tax forms
Invesco mailing information
Send general correspondence to Invesco Investment Services, Inc., P.O. Box 219078, Kansas City, MO 64121-9078.
Important notice regarding delivery of security holder documents
To reduce Fund expenses, only one copy of most shareholder documents may be mailed to shareholders with multiple accounts at the same address (Householding). Mailing of your shareholder documents may be householded indefinitely unless you instruct us otherwise. If you do not want the mailing of these documents to be combined with those for other members of your household, please contact Invesco Investment Services, Inc. at 800 959 4246 or contact your financial institution. We will begin sending you individual copies for each account within 30 days after receiving your request.
Fund holdings and proxy voting information
The Fund provides a complete list of its holdings four times in each fiscal year, at the quarter-ends. For the second and fourth quarters, the list appears in the Fund’s semiannual and annual reports to shareholders. For the first and third quarters, the Fund files the lists with the Securities and Exchange Commission (SEC) as an exhibit to its reports on FormN-PORT. The most recent list of portfolio holdings is available at invesco.com/completeqtrholdings. Shareholders can also look up the Fund’s FormN-PORT filings on the SEC website, sec.gov. The SEC file numbers for the Fund are shown below.
A description of the policies and procedures that the Fund uses to determine how to vote proxies relating to portfolio securities is available without charge, upon request, from our Client Services department at 800 959 4246, or at invesco.com/ proxyguidelines. The information is also available on the SEC website, sec.gov.
| | |
| Information regarding how the Fund voted proxies related to its portfolio securities during the most recent12-month period ended June 30 is available at invesco.com/proxysearch. This information is also available on the SEC website, sec.gov. | |  |
| Invesco Advisers, Inc. is an investment adviser; it provides investment advisory services to individual and institutional clients and does not sell securities. Invesco Distributors, Inc. is the US distributor for Invesco Ltd.’s retail mutual funds, exchange-traded funds and institutional money market funds. Both are wholly owned, indirect subsidiaries of Invesco Ltd. |
| | | | |
| SEC file numbers:811-06463 and033-44611 | | Invesco Distributors, Inc. | | IGR-AR-1 |
| | | | |
| | |

| | Annual Report to Shareholders | | October 31, 2019 |
| | |
| | Invesco International Select Equity Fund |
| | Nasdaq: | | |
| | A: IZIAX ∎ C: IZICX ∎ R: IZIRX ∎ Y: IZIYX ∎ R5: IZIFX ∎ R6: IZISX |

Letters to Shareholders
| | | | |

Andrew Schlossberg | | | | Dear Shareholders: This annual report includes information about your Fund, including performance data and a complete list of its investments as of the close of the reporting period. Inside is a discussion of how your Fund was managed and the factors that affected its performance during the reporting period. Despite marked market volatility along the way, most global equity markets produced solid gains for the reporting period. As the reporting period unfolded in the final months of 2018, global equities were reeling from a sharpsell-off. The catalyst for thesell-off was a combination of ongoing trade concerns between the US and China, fears of a global economic slowdown and lower oil prices from a supply glut. Gains posted earlier in 2018 for global equities were erased, while US Treasury bonds, along with government and municipal bonds, rallied as investors fled to “safe haven” assets. |
At the start of 2019, global equity markets rebounded strongly buoyed by more policy from central banks and optimism about a potentialUS-China trade deal. In May,US-China trade concerns and slowing global growth led to a global equitysell-off and rally in US Treasuries. Despite the Maysell-off, domestic equity markets rallied in June in anticipation of a US Federal Reserve (the Fed) interest rate cut and closed the second quarter with modest gains. ContinuedUS-China trade worries and signs of slowing global economic growth left global equity markets largely flat for the third quarter. As the reporting period came to a close in October 2019, a raft of upbeat positive corporate earnings results and a US interest rate cut buoyed domestic equity results with some domestic indices recording record highs.
The Fed, in fact, both raised and lowered the federal funds rate during the reporting period. Given signs of a strong economy, the Fed raised rates in December 2018. In 2019, however, the Fed altered its outlook on further rate hikes leaving rates unchanged for the first half of the year. In July, the Fed lowered interest rates for the first time in 11 years. It again lowered rates in September and once again in October. As the year continues to unfold, we’ll see how the interplay of interest rates, economic data, geopolitics and a host of other factors affect US and overseas equity and fixed income markets.
Investor uncertainty and market volatility, such as we witnessed during the reporting period, are unfortunate facts of life when it comes to investing. That’s why Invesco encourages investors to work with a professional financial adviser who can stress the importance of starting to save and invest early and the importance of adhering to a disciplined investment plan. A financial adviser who knows your unique financial situation, investment goals and risk tolerance can be an invaluable partner as you seek to achieve your financial goals. He or she can offer a long-term perspective when markets are volatile and time-tested advice and guidance when your financial situation or investment goals change.
Visit our website for more information on your investments
Our website, invesco.com/us, offers a wide range of market insights and investment perspectives. On the website, you’ll find detailed information about our funds, including performance, holdings and portfolio manager commentaries. You can access information about your account by completing a simple, secure online registration. To do so, select “Log In” on the right side of the homepage, and then select “Register for Individual Account Access.”
In addition to the resources accessible on our website and through our mobile app, you can obtain timely updates to help you stay informed about the markets and the economy by connecting with Invesco on Twitter, LinkedIn or Facebook. You can access our blog at blog.invesco.us.com. Our goal is to provide you the information you want, when and where you want it.
Finally, I’m pleased to share with you Invesco’s commitment to both the Principles for Responsible Investment and to considering environmental, social and governance issues in our robust investment process. I invite you to learn more at invesco.com/esg.
Have questions?
For questions about your account, contact an Invesco client services representative at 800 959 4246.
All of us at Invesco look forward to serving your investment management needs. Thank you for investing with us.
Sincerely,

Andrew Schlossberg
Head of the Americas,
Senior Managing Director, Invesco Ltd.
2 Invesco International Select Equity Fund
| | | | | | |

Bruce Crockett | | | | Dear Shareholders: Among the many important lessons I’ve learned in more than 40 years in a variety of business endeavors is the value of a trusted advocate. As independent chair of the Invesco Funds Board, I can assure you that the members of the Board are strong advocates for the interests of investors in Invesco’s mutual funds. We work hard to represent your interests through oversight of the quality of the investment management services your funds receive and other matters important to your investment, including but not limited to: ∎ Ensuring that Invesco offers a diverse lineup of mutual funds that your financial adviser can use to strive to meet your financial needs as your investment goals change over time. ∎ Monitoring how the portfolio management teams of the Invesco funds are performing in light |
of changing economic and market conditions.
| ∎ | Assessing each portfolio management team’s investment performance within the context of the investment strategy described in the fund’s prospectus. |
| ∎ | Monitoring for potential conflicts of interests that may impact the nature of the services that your funds receive. |
We believe one of the most important services we provide our fund shareholders is the annual review of the funds’ advisory andsub-advisory contracts with Invesco Advisers and its affiliates. This review is required by the Investment Company Act of 1940 and focuses on the nature and quality of the services Invesco provides as the adviser to the Invesco funds and the reasonableness of the fees that it charges for those services. Each year, we spend months carefully reviewing information received from Invesco and a variety of independent sources, such as performance and fee data prepared by Lipper, Inc. (a subsidiary of Broadridge Financial Solutions, Inc.), an independent, third-party firm widely recognized as a leader in its field. We also meet with our independent legal counsel and other independent advisers to review and help us assess the information that we have received. Our goal is to assure that you receive quality investment management services for a reasonable fee.
I trust the measures outlined above provide assurance that you have a worthy advocate when it comes to choosing the Invesco Funds.
On behalf of the Board, we look forward to continuing to represent your interests and serving your needs.
Sincerely,

Bruce L. Crockett
Independent Chair
Invesco Funds Board of Trustees
3 Invesco International Select Equity Fund
Management’s Discussion of Fund Performance
| | | | | | |
| | Performance summary For the fiscal year ended October 31, 2019, Class A shares of Invesco International Select Equity Fund (the Fund), at net asset value (NAV), outperformed the MSCI All Country Worldex-U.S. Growth Index, the Fund’s style-specific benchmark. Your Fund’s long-term performance appears later in this report. | |
| | | Fund vs. Indexes | | | | |
| | Total returns, October 31, 2018 to October 31, 2019, at net asset value (NAV). | |
| | Performance shown does not include applicable contingent deferred sales charges (CDSC) orfront-end sales charges, which would have reduced performance. | |
| | | Class A Shares | | | 16.99% | |
| | | Class C Shares | | | 16.03 | |
| | | Class R Shares | | | 16.60 | |
| | | Class Y Shares | | | 17.24 | |
| | | Class R5 Shares | | | 17.23 | |
| | | Class R6 Shares | | | 17.24 | |
| | | MSCI All Country Worldex-USA Indexq (Broad Market Index) | | | 11.27 | |
| | | MSCI All Country Worldex-U.S. Growth Indexq (Style-Specific Index) | | | 16.66 | |
| | | Lipper InternationalMulti-Cap Growth Funds Index⬛ (Peer Group Index) | | | 12.43 | |
| | Source(s):qRIMES Technologies Corp.;⬛Lipper Inc. | | | | |
Market conditions and your Fund
The fiscal year began with global equity markets, particularly the US, declining sharply at the end of 2018 amid rising interest rates, a flattening US Treasury yield curve, signaling a possible recession, and concerns that higher inflation could result in a more restrictive monetary policy. Investors also had concerns over the Brexit negotiations, ongoing trade tensions between the US and China, declining oil prices and fears of slowing economic growth, particularly in the eurozone.
After a relatively calm start at the beginning of 2019, global equity markets faced greater volatility in the second quarter, hampered by ongoing US and China trade issues, potential for new tariffs and slowing global economic growth. Global equity markets, particularly China, declined sharply in May 2019, ending a
four-month rally. Trade and tariff issues, which were not limited to the US and China, clouded the outlook for many global economies. Disagreement within the UK about its withdrawal from the European Union increased uncertainty for the UK and eurozone economies. Following better performance in June, most global equity markets managed modest positive returns for the second quarter of 2019, with developed markets generally outperforming emerging markets. China was an exception, declining during the second quarter.
Weakening global economic data and the ongoing US and China trade conflict contributed to higher market volatility in the third quarter of 2019. During the third quarter, data released showed slowing manufacturing activity and declining business investment, which was evidence that trade tensions were stifling economic growth across both developed
and emerging markets. Global recession concerns caused a sharp equitysell-off in August 2019 as investors crowded into asset classes perceived as safe havens, including US Treasuries and gold. In September 2019, both the US Federal Reserve and European Central Bank cut interest rates, providing a measure of support for risk assets. Growing optimism about a potential trade deal between the US and China also boosted equities in September. However, except for the US and Japan, performance in most regions declined during the third quarter. Uncertainty about the UK’s withdrawal from the European Union continued to weigh on UK and European equities, while political and trade issues affected areas of Latin America and Asia.
Global equity markets gained in October 2019 amid several positive catalysts, including a US interest rate cut, optimism surrounding US and China trade negotiations, and a raft of upbeat corporate results. The UK equity market provided a flat return during October and while domestic politics continued to dominate the region, European markets made modest gains. October was also a positive month for emerging equity markets with all regions recording gains. Despite increased market volatility, global equity indexes, in both developed and emerging markets, ended the fiscal year in positive territory.
During the fiscal year, stock selection in the consumer staples, industrials and communication services sectors was the largest contributor to the Fund’s performance relative to the MSCI All Country Worldex-U.S. Growth Index. Regionally, holdings in emerging markets and Europeex-UK contributed to the Fund’s relative performance. Conversely, stock selection in the information technology sector was the largest detractor from the Fund’s
| | | | |
Portfolio Composition | |
By sector | | | % of total net assets | |
| | | | |
| |
Communication Services | | | 23.62 | % |
Consumer Discretionary | | | 23.16 | |
Industrials | | | 22.55 | |
Consumer Staples | | | 11.96 | |
Information Technology | | | 6.62 | |
Health Care | | | 5.47 | |
Financials | | | 2.93 | |
Money Market Funds Plus Other Assets Less Liabilities | | | 3.69 | |
| | | | |
Top 10 Equity Holdings* | |
| % of total net assets | |
| |
1. Liberty Global PLC, Series A | | | 6.24% | |
2. Focus Media Information Technology Co., Ltd., A Shares | | | 6.02 | |
3. Howden Joinery Group PLC | | | 5.51 | |
4. Eurofins Scientific S.E. | | | 5.47 | |
5. Alibaba Group Holding Ltd., ADR | | | 5.20 | |
6. Scout24 AG | | | 4.23 | |
7. Anheuser-Busch InBev S.A./N.V. | | | 3.90 | |
8. Prosus N.V. | | | 3.85 | |
9. Kweichow Moutai Co., Ltd., A Shares | | | 3.47 | |
10. Domino’s Pizza Group PLC | | | 3.47 | |
| | | | |
Total Net Assets | | $ | 121.5 million | |
| |
Total Number of Holdings* | | | 34 | |
The Fund’s holdings are subject to change, and there is no assurance that the Fund will continue to hold any particular security.
*Excluding money market fund holdings, if any.
Data presented here are as of October 31, 2019.
4 Invesco International Select Equity Fund
relative performance. Regionally, holdings in the UK detracted from the Fund’s relative returns.
The top contributors to the Fund’s performance relative to its style-specific benchmark over the fiscal year includedKweichow MoutaiandScout24.
Kweichow Moutai is a Chinese company that specializes in the production of Moutai liquor products. The company posted strong third quarter results that were in line with analyst expectations. Moutai’s strong revenue growth was driven by price increases of its flagship liquor products and robust sales in its direct account segments, the company’s highest margin. During the fiscal year, shares of Moutai broke through the1,000-yuan barrier due to strong reported and expected earnings, as well as supportive growth figures in Chinese consumer-related sectors.
Scout24 is a service company that specializes in real estate and automotive online listings in Europe. During the fiscal year, shares of Scout24 appreciated more than 18% when the company announced that it was exploring a potential sale.
The top detractors from Fund’s performance versus the style-specific benchmark over the fiscal year includedCieloandCorporate Travel Management.
Cielo is Brazil’s largest debit and credit card payment processor and has a dominant position in processing Visa transactions. The company is one of the leading merchant-acquiring and payment-processing firms in Brazil. Cielo’s stock price fell as its fundamentals structurally deteriorated due to changing regulations that allowed new competition to enter into the marketplace, which reset the economics of the business to much lower levels than we initially anticipated. We subsequently exited our position in Cielo before the close of the fiscal year.
Corporate Travel Management is a global leader in business travel management services, which operates on afee-for-service model. The company is the sixth-largest travel company in the world and has significant revenue coming from its UK and Hong Kong markets. During the fiscal year, company management downgraded forward guidance amid lower revenues stemming from ongoing Brexit negotiations andUS-China trade tensions. Nevertheless, the short-term volatility provided a great buying opportunity for the Fund’s portfolio.
During the fiscal year, the Fund’s new investments included Corporate Travel Management,Focus Media Information
Technology,Rightmove,Sony,Asiakastieto Group,Gree Electric AppliancesandProsus. Generally, we sell Fund holdings when they reach full valuation; if new, relatively more attractive investment opportunities exist; or if new information changes our thesis on the future of a business. As such, we sold Cielo,Housing Development Finance,Japan Tobacco,L’Occitane International,Naspers,New Oriental Education & Technology,Unilever,Sinopharm GroupandSea.
At the close of the fiscal year, relative to the style-specific benchmark, the Fund’s largest overweight positions were in the communication services and industrials sectors, and the largest underweight positions were in the financials and materials sectors. The Fund also had overweight exposures to the UK and emerging markets, and underweight exposures to Europeex-UK and Canada.
As always, the Fund’s country and sector allocations are the result of ourbottom-up, fundamental stock selection process, and are not based on the characteristics of the Fund’s style-specific index.
We thank you for your investment in Invesco International Select Equity Fund.
Portfolio managers:
Jeff Feng
Matt Peden
The views and opinions expressed in management’s discussion of Fund performance are those of Invesco Advisers, Inc. These views and opinions are subject to change at any time based on factors such as market and economic conditions. These views and opinions may not be relied upon as investment advice or recommendations, or as an offer for a particular security. The information is not a complete analysis of every aspect of any market, country, industry, security or the Fund. Statements of fact are from sources considered reliable, but Invesco Advisers, Inc. makes no representation or warranty as to their completeness or accuracy. Although historical performance is no guarantee of future results, these insights may help you understand our investment management philosophy.
See important Fund and, if applicable, index disclosures later in this report.
5 Invesco International Select Equity Fund
Your Fund’s Long-Term Performance
Results of a $10,000 Investment – Oldest Share Class(es) since Inception
Fund and index data from 12/21/15
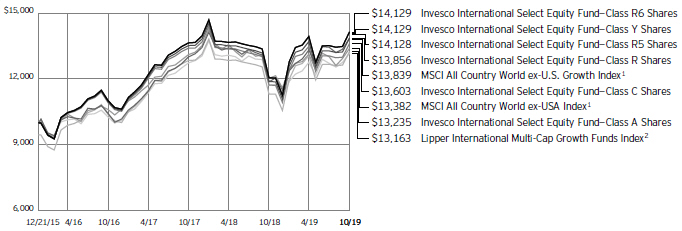
1 Source: RIMES Technologies Corp.
2 Source: Lipper Inc.
Past performance cannot guarantee comparable future results.
The data shown in the chart include reinvested distributions, applicable sales charges and Fund expenses including
management fees. Index results include reinvested dividends, but they do not reflect sales charges. Performance of the peer group, if applicable, reflects fund expenses and management fees; performance
of a market index does not. Performance shown in the chart does not reflect deduction of taxes a shareholder would pay on Fund distributions or sale of Fund shares.
6 Invesco International Select Equity Fund
| | | | |
Average Annual Total Returns | |
| As of 10/31/19, including maximum applicable sales charges | |
| |
Class A Shares | | | | |
Inception (12/21/15) | | | 7.53% | |
1 Year | | | 10.58 | |
| |
Class C Shares | | | | |
Inception (12/21/15) | | | 8.29% | |
1 Year | | | 15.03 | |
| |
Class R Shares | | | | |
Inception (12/21/15) | | | 8.81% | |
1 Year | | | 16.60 | |
| |
Class Y Shares | | | | |
Inception (12/21/15) | | | 9.36% | |
1 Year | | | 17.24 | |
| |
Class R5 Shares | | | | |
Inception (12/21/15) | | | 9.36% | |
1 Year | | | 17.23 | |
| |
Class R6 Shares | | | | |
Inception (12/21/15) | | | 9.36% | |
1 Year | | | 17.24 | |
The performance data quoted represent past performance and cannot guarantee comparable future results; current performance may be lower or higher. Please visit invesco.com/ performance for the most recentmonth-end performance. Performance figures reflect reinvested distributions, changes in net asset value and the effect of the maximum sales charge unless otherwise stated. Performance figures do not reflect deduction of taxes a shareholder would pay on Fund distributions or sale of Fund shares. Investment return and principal value will fluctuate so that you may have a gain or loss when you sell shares.
The net annual Fund operating expense ratio set forth in the most recent Fund prospectus as of the date of this report for Class A, Class C, Class R, Class Y, Class R5 and Class R6 shares was 1.12%, 1.87%, 1.37%, 0.87%, 0.87% and 0.87%, respectively.1,2 The total annual Fund operating expense ratio set forth in the most recent Fund prospectus as of the date of this report for Class A, Class C, Class R, Class Y, Class R5 and Class R6 shares was 1.63%, 2.38%, 1.88%, 1.38%, 1.20% and 1.20%,respectively. The expense ratios presented above may vary from the expense ratios presented in other sections of this report that are based
| | | | |
Average Annual Total Returns | |
| As of 9/30/19, the most recent calendar quarter end, including maximum applicable sales charges | |
| |
Class A Shares | | | | |
Inception (12/21/15) | | | 6.39% | |
1 Year | | | -4.86 | |
| |
Class C Shares | | | | |
Inception (12/21/15) | | | 7.17% | |
1 Year | | | -1.14 | |
| |
Class R Shares | | | | |
Inception (12/21/15) | | | 7.68% | |
1 Year | | | 0.35 | |
| |
Class Y Shares | | | | |
Inception (12/21/15) | | | 8.22% | |
1 Year | | | 0.86 | |
| |
Class R5 Shares | | | | |
Inception (12/21/15) | | | 8.22% | |
1 Year | | | 0.85 | |
| |
Class R6 Shares | | | | |
Inception (12/21/15) | | | 8.22% | |
1 Year | | | 0.86 | |
on expenses incurred during the period covered by this report.
Class A share performance reflects the maximum 5.50% sales charge, and Class C share performance reflects the applicable contingent deferred sales charge (CDSC) for the period involved. The CDSC on Class C shares is 1% for the first year after purchase. Class R, Class Y, Class R5 and Class R6 shares do not have afront-end sales charge or a CDSC; therefore, performance is at net asset value.
The performance of the Fund’s share classes will differ primarily due to different sales charge structures and class expenses.
Fund performance reflects any applicable fee waivers and/or expense reimbursements. Had the adviser not waived fees and/or reimbursed expenses currently or in the past, returns would have been lower. See current prospectus for more information.
| 1 | Total annual Fund operating expenses after any contractual fee waivers and/or expense reimbursements by the adviser in effect through at least February 28, 2021. See current prospectus for more information. |
| 2 | Total annual Fund operating expenses after any contractual fee waivers and/or expense reimbursements by the adviser in effect through at least June 30, 2021. See current prospectus for more information. |
7 Invesco International Select Equity Fund
Invesco International Select Equity Fund’s investment objective is long-term growth of capital.
∎ Unless otherwise stated, information presented in this report is as of October 31, 2019, and is based on total net assets.
∎ Unless otherwise noted, all data provided by Invesco.
∎ To access your Fund’s reports/prospectus, visit invesco.com/fundreports.
About share classes
| ∎ | | Class R sharesare generally available only to employer sponsored retirement and benefit plans. Please see the prospectus for more information. |
| ∎ | | Class Y sharesare available only to certain investors. Please see the prospectus for more information. |
| ∎ | | Class R5 sharesandClass R6 sharesare available for use by retirement plans that meet certain standards and for institutional investors. Class R6 shares are also available through intermediaries that have established an agreement with Invesco Distributors, Inc. to make such shares available for use in retail omnibus accounts. Please see the prospectus for more information. |
Principal risks of investing in the Fund
| ∎ | | Depositary receipts risk.Investing in depositary receipts involves the same risks as direct investments in foreign securities. In addition, the underlying issuers of certain depositary receipts are under no obligation to distribute shareholder communications or pass through any voting rights with respect to the deposited securities to the holders of such receipts. The Fund may therefore receive less timely information or have less control than if it invested directly in the foreign issuer. |
| ∎ | | Emerging markets securities risk. Emerging markets (also referred to as developing markets) are generally subject to greater market volatility, political, social and economic instability, uncertain trading markets and more governmental limitations on foreign investment than more developed markets. In addition, companies operating in emerging markets may be subject to lower trading volume and greater price fluctuations than companies in more developed markets. Securities law and the enforcement of systems of taxation in many emerging market countries may change quickly |
| | | and unpredictably. The Fund’s investments in ChinaA-shares are subject to trading restrictions, quota limitations and clearing and settlement risks. In addition, investments in emerging markets securities may be subject to additional transaction costs, delays in settlement procedures, and lack of timely information. |
| ∎ | | Foreign securities risk.The Fund’s foreign investments may be adversely affected by political and social instability, changes in economic or taxation policies, difficulty in enforcing obligations, decreased liquidity or increased volatility. Foreign investments also involve the risk of the possible seizure, nationalization or expropriation of the issuer or foreign deposits (in which the Fund could lose its entire investments in a certain market) and the possible adoption of foreign governmental restrictions such as exchange controls. Unless the Fund has hedged its foreign securities risk, foreign securities risk also involves the risk of negative foreign currency rate fluctuations, which may cause the value of securities denominated in such foreign currency (or other instruments through which the Fund has exposure to foreign currencies) to decline in value. Currency exchange rates may fluctuate significantly over short periods of time. Currency hedging strategies, if used, are not always successful. |
| ∎ | | Geographic focus risk.The Fund may from time to time invest a substantial amount of its assets in securities of issuers located in a single country or a limited number of countries. Adverse economic, political or social conditions in those countries may therefore have a significant negative impact on the Fund’s investment performance. |
| ∎ | | Growth investing risk.Growth stocks tend to be more expensive relative to the issuing company’s earnings or assets compared with other types of stock. As a result, they tend to be |
| | more sensitive to changes in, or investors’ expectations of, the issuing company’s earnings and can be more volatile. |
| ∎ | | Investing in the European Union risk. Investments in certain countries in the European Union are susceptible to high economic risks associated with high levels of debt, such as investments in sovereign debt of Greece, Italy and Spain. Efforts of the member states to further unify their economic and monetary policies may increase the potential for the downward movement of one member state’s market to cause a similar effect on other member states’ markets. Separately, the European Union faces issues involving its membership, structure, procedures and policies. The exit of one or more member states from the European Union, such as the United Kingdom (UK) which has announced its intention to exit, would place its currency and banking system in jeopardy. The exit by the UK or other member states will likely result in increased volatility, illiquidity and potentially lower economic growth in the affected markets, which will adversely affect the Fund’s investments. |
| ∎ | | Management risk.The Fund is actively managed and depends heavily on the Adviser’s judgment about markets, interest rates or the attractiveness, relative values, liquidity, or potential appreciation of particular investments made for the Fund’s portfolio. The Fund could experience losses if these judgments prove to be incorrect. Additionally, legislative, regulatory, or tax developments may adversely affect management of the Fund and, therefore, the ability of the Fund to achieve its investment objective. |
| ∎ | | Market risk.The market values of the Fund’s investments, and therefore the value of the Fund’s shares, will go up and down, sometimes rapidly or unpredictably. Market risk may affect a single issuer, industry or section of the economy, or it may affect the market as a whole. Individual stock |
|
This report must be accompanied or preceded by a currently effective Fund prospectus, which contains more complete information, including sales charges and expenses. Investors should read it carefully before investing. |
| |
|
NOT FDIC INSURED | MAY LOSE VALUE | NO BANK GUARANTEE |
8 Invesco International Select Equity Fund
| | prices tend to go up and down more dramatically than those of certain other types of investments, such as bonds. During a general downturn in the financial markets, multiple asset classes may decline in value. When markets perform well, there can be no assurance that specific investments held by the Fund will rise in value. |
| ∎ | | Preferred securities risk.Preferred securities are subject to issuer-specific and market risks applicable generally to equity securities. Preferred securities also may be subordinated to bonds or other debt instruments, subjecting them to a greater risk ofnon-payment, may be less liquid than many other securities, such as common stocks, and generally offer no voting rights with respect to the issuer. |
| ∎ | | Sector focus risk.The Fund may from time to time invest a significant amount of its assets (i.e. over 25%) in one market sector or group of related industries. In this event, the Fund’s performance will depend to a greater extent on the overall condition of the sector or group of industries and there is increased risk that the Fund will lose significant value if conditions adversely affect that sector or group of industries. |
| ∎ | | Small- andmid-capitalization companies risks.Small- andmid-capitalization companies tend to be more vulnerable to changing market conditions, may have little or no operating history or track record of success, and may have more limited product lines and markets, less experienced management and fewer financial resources than larger companies. These companies’ securities may be more volatile and less liquid than those of more established companies, and their returns may vary, sometimes significantly, from the overall securities market. |
About indexes used in this report
| ∎ | | TheMSCI All Country Worldex-USA® Indexis an index considered representative of developed and emerging market stock markets, excluding the US. The index is computed using the net return, which withholds applicable taxes fornon-resident investors. |
| ∎ | | TheMSCI All Country Worldex-U.S. Growth Indexis an unmanaged index considered representative of growth stocks across developed and emerging markets, excluding the US. |
| | The index is computed using the net return, which withholds applicable taxes fornon-resident investors. |
| ∎ | | TheLipper InternationalMulti-Cap Growth Funds Indexis an unmanaged index considered representative of internationalmulti-cap growth funds tracked by Lipper. |
| ∎ | | The Fund is not managed to track the performance of any particular index, including the index(es) described here, and consequently, the performance of the Fund may deviate significantly from the performance of the index(es). |
| ∎ | | A direct investment cannot be made in an index. Unless otherwise indicated, index results include reinvested dividends, and they do not reflect sales charges. Performance of the peer group, if applicable, reflects fund expenses; performance of a market index does not. |
Other information
| ∎ | | The returns shown in management’s discussion of Fund performance are based on net asset values (NAVs) calculated for shareholder transactions. Generally accepted accounting principles require adjustments to be made to the net assets of the Fund at period end for financial reporting purposes, and as such, the NAVs for shareholder transactions and the returns based on those NAVs may differ from the NAVs and returns reported in the Financial Highlights. |
| ∎ | | Industry classifications used in this report are generally according to the Global Industry Classification Standard, which was developed by and is the exclusive property and a service mark of MSCI Inc. and Standard & Poor’s. |
9 Invesco International Select Equity Fund
Schedule of Investments
October 31, 2019
| | | | | | | | |
| | | Shares | | | Value | |
| |
|
Common Stocks & Other Equity Interests–96.30% | |
| | |
Australia–3.40% | | | | | | | | |
| | |
Corporate Travel Management Ltd. | | | 341,328 | | | $ | 4,132,133 | |
| |
| | |
Belgium–3.90% | | | | | | | | |
| | |
Anheuser-Busch InBev S.A./N.V. | | | 58,634 | | | | 4,735,822 | |
| |
| | |
Canada–2.25% | | | | | | | | |
| | |
Ritchie Bros. Auctioneers, Inc. | | | 66,513 | | | | 2,735,015 | |
| |
| | |
Chile–2.70% | | | | | | | | |
| | |
Liberty Latin America Ltd.,
Class C(a) | | | 177,869 | | | | 3,274,568 | |
| |
| | |
China–17.59% | | | | | | | | |
| | |
Alibaba Group Holding Ltd., ADR(a) | | | 35,736 | | | | 6,313,479 | |
| |
Focus Media Information Technology Co., Ltd., A Shares | | | 8,624,447 | | | | 7,310,364 | |
| |
Gree Electric Appliances, Inc. of Zhuhai, A Shares | | | 426,068 | | | | 3,525,796 | |
| |
Kweichow Moutai Co., Ltd., A Shares | | | 25,171 | | | | 4,216,085 | |
| |
| | | | | | | 21,365,724 | |
| |
| | |
Denmark–1.55% | | | | | | | | |
| | |
DSV Panalpina A/S | | | 19,408 | | | | 1,883,130 | |
| |
| | |
Finland–0.53% | | | | | | | | |
| | |
Asiakastieto Group Oyj(b) | | | 19,967 | | | | 648,092 | |
| |
| | |
France–2.80% | | | | | | | | |
| | |
Bureau Veritas S.A. | | | 34,616 | | | | 884,143 | |
| |
Edenred | | | 47,711 | | | | 2,512,207 | |
| |
| | | | | | | 3,396,350 | |
| |
| | |
Germany–4.23% | | | | | | | | |
| | |
Scout24 AG(b) | | | 83,007 | | | | 5,137,308 | |
| |
| | |
Hong Kong–2.93% | | | | | | | | |
| | |
AIA Group Ltd. | | | 358,200 | | | | 3,554,224 | |
| |
| | |
Japan–16.45% | | | | | | | | |
| | |
FANUC Corp. | | | 15,800 | | | | 3,119,004 | |
| |
Kao Corp. | | | 34,600 | | | | 2,783,261 | |
| |
Keyence Corp. | | | 3,600 | | | | 2,273,067 | |
| |
MISUMI Group, Inc. | | | 114,400 | | | | 2,868,625 | |
| |
SMC Corp. | | | 6,400 | | | | 2,762,880 | |
| |
SoftBank Group Corp. | | | 95,800 | | | | 3,700,767 | |
| |
Sony Corp. | | | 40,600 | | | | 2,473,880 | |
| |
| | | | | | | 19,981,484 | |
| |
Investment Abbreviations:
ADR – American Depositary Receipt
| | | | | | | | |
| | | Shares | | | Value | |
| |
| | |
Luxembourg–5.47% | | | | | | | | |
| | |
Eurofins Scientific S.E. | | | 13,112 | | | $ | 6,644,672 | |
| |
| | |
Netherlands–3.85% | | | | | | | | |
| | |
Prosus N.V.(a) | | | 67,870 | | | | 4,680,246 | |
| |
| | |
Poland–1.98% | | | | | | | | |
| | |
Benefit Systems S.A. | | | 13,095 | | | | 2,399,060 | |
| |
| | |
South Korea–5.18% | | | | | | | | |
| | |
Amorepacific Corp., Preference Shares | | | 26,369 | | | | 2,180,032 | |
| |
| | |
Samsung Electronics Co., Ltd., Preference Shares | | | 117,470 | | | | 4,114,860 | |
| |
| | | | | | | 6,294,892 | |
| |
| | |
Spain–1.36% | | | | | | | | |
| | |
Amadeus IT Group S.A. | | | 22,323 | | | | 1,652,536 | |
| |
| | |
United Kingdom–20.13% | | | | | | | | |
Clarkson PLC | | | 24,292 | | | | 887,776 | |
| |
Domino’s Pizza Group PLC | | | 1,136,348 | | | | 4,215,903 | |
| |
Howden Joinery Group PLC | | | 894,137 | | | | 6,689,451 | |
| |
Just Eat PLC(a) | | | 292,312 | | | | 2,786,917 | |
| |
Liberty Global PLC, Series A(a) | | | 301,434 | | | | 7,581,065 | |
| |
Reckitt Benckiser Group PLC | | | 7,893 | | | | 610,212 | |
| |
Rightmove PLC | | | 215,581 | | | | 1,674,005 | |
| |
| | | | | | | 24,445,329 | |
| |
Total Common Stocks & Other Equity Interests (Cost $103,617,227) | | | | 116,960,585 | |
| |
| | |
Money Market Funds–3.36% | | | | | | | | |
| | |
Invesco Government & Agency Portfolio, Institutional Class, 1.71%(c) | | | 1,428,698 | | | | 1,428,698 | |
| |
Invesco Liquid Assets Portfolio, Institutional Class, 1.90%(c) | | | 1,020,807 | | | | 1,021,215 | |
| |
| | |
Invesco Treasury Portfolio, Institutional Class, 1.66%(c) | | | 1,632,797 | | | | 1,632,797 | |
| |
Total Money Market Funds
(Cost $4,082,619) | | | | 4,082,710 | |
| |
TOTAL INVESTMENTS IN SECURITIES–99.66%
(Cost $107,699,846) | | | | 121,043,295 | |
| |
OTHER ASSETS LESS LIABILITIES–0.34% | | | | 408,587 | |
| |
NET ASSETS–100.00% | | | | | | $ | 121,451,882 | |
| |
See accompanying Notes to Financial Statements which are an integral part of the financial statements.
10 Invesco International Select Equity Fund
Notes to Schedule of Investments:
| (a) | Non-income producing security. |
| (b) | Security purchased or received in a transaction exempt from registration under the Securities Act of 1933, as amended (the “1933 Act”). The security may be resold pursuant to an exemption from registration under the 1933 Act, typically to qualified institutional buyers. The aggregate value of these securities at October 31, 2019 was $5,785,400, which represented 4.76% of the Fund’s Net Assets. |
| (c) | The money market fund and the Fund are affiliated by having the same investment adviser. The rate shown is the7-day SEC standardized yield as of October 31, 2019. |
See accompanying Notes to Financial Statements which are an integral part of the financial statements.
11 Invesco International Select Equity Fund
Statement of Assets and Liabilities
October 31, 2019
| | | | |
Assets: | | | | |
| |
Investments in securities, at value
(Cost $103,617,227) | | $ | 116,960,585 | |
| |
Investments in affiliated money market funds, at value (Cost $4,082,619) | | | 4,082,710 | |
| |
Foreign currencies, at value (Cost $377,955) | | | 379,329 | |
| |
Receivable for: | | | | |
Dividends | | | 184,660 | |
| |
Fund expenses absorbed | | | 4,505 | |
| |
Fund shares sold | | | 2,078 | |
| |
Investments sold | | | 523 | |
| |
Investment for trustee deferred compensation and retirement plans | | | 10,259 | |
| |
Other assets | | | 3,815 | |
| |
Total assets | | | 121,628,464 | |
| |
| |
Liabilities: | | | | |
| |
Payable for: | | | | |
Investments purchased | | | 80,107 | |
| |
Fund shares reacquired | | | 19,886 | |
| |
Accrued fees to affiliates | | | 8,300 | |
| |
Accrued trustees’ and officers’ fees and benefits | | | 1,362 | |
| |
Accrued other operating expenses | | | 56,668 | |
| |
Trustee deferred compensation and retirement plans | | | 10,259 | |
| |
Total liabilities | | | 176,582 | |
| |
Net assets applicable to shares outstanding | | $ | 121,451,882 | |
| |
| |
Net assets consist of: | | | | |
| |
Shares of beneficial interest | | $ | 109,508,036 | |
| |
Distributable earnings | | | 11,943,846 | |
| |
| | $ | 121,451,882 | |
| |
| |
Net Assets: | | | | |
| |
Class A | | $ | 5,852,364 | |
| |
Class C | | $ | 810,540 | |
| |
Class R | | $ | 226,546 | |
| |
Class Y | | $ | 3,298,948 | |
| |
Class R5 | | $ | 11,523 | |
| |
Class R6 | | $ | 111,251,961 | |
| |
| | | | |
Shares outstanding, no par value, with an unlimited number of shares authorized: | |
| |
Class A | | | 509,332 | |
| |
Class C | | | 71,838 | |
| |
Class R | | | 19,851 | |
| |
Class Y | | | 286,680 | |
| |
Class R5 | | | 1,001 | |
| |
Class R6 | | | 9,667,421 | |
| |
Class A: | | | | |
Net asset value per share | | $ | 11.49 | |
| |
Maximum offering price per share
(Net asset value of $11.49 ÷ 94.50%) | | $ | 12.16 | |
| |
Class C: | | | | |
Net asset value and offering price per share | | $ | 11.28 | |
| |
Class R: | | | | |
Net asset value and offering price per share | | $ | 11.41 | |
| |
Class Y: | | | | |
Net asset value and offering price per share | | $ | 11.51 | |
| |
Class R5: | | | | |
Net asset value and offering price per share | | $ | 11.51 | |
| |
Class R6: | | | | |
Net asset value and offering price per share | | $ | 11.51 | |
| |
See accompanying Notes to Financial Statements which are an integral part of the financial statements.
12 Invesco International Select Equity Fund
Statement of Operations
For the year ended October 31, 2019
| | | | |
Investment income: | | | | |
| |
Dividends (net of foreign withholding taxes of $140,868) | | $ | 3,479,002 | |
| |
Dividends from affiliated money market funds | | | 162,739 | |
| |
Total investment income | | | 3,641,741 | |
| |
| |
Expenses: | | | | |
| |
Advisory fees | | | 1,074,850 | |
| |
Administrative services fees | | | 21,999 | |
| |
Custodian fees | | | 29,481 | |
| |
Distribution fees: | | | | |
Class A | | | 12,920 | |
| |
Class C | | | 8,379 | |
| |
Class R | | | 707 | |
| |
Transfer agent fees – A, C, R and Y | | | 21,295 | |
| |
Transfer agent fees – R6 | | | 734 | |
| |
Trustees’ and officers’ fees and benefits | | | 20,669 | |
| |
Registration and filing fees | | | 82,982 | |
| |
Reports to shareholders | | | 15,594 | |
| |
Professional services fees | | | 52,987 | |
| |
Other | | | 11,450 | |
| |
Total expenses | | | 1,354,047 | |
| |
Less: Fees waived, expenses reimbursed and/or expense offset arrangement(s) | | | (341,156 | ) |
| |
Net expenses | | | 1,012,891 | |
| |
Net investment income | | | 2,628,850 | |
| |
| |
Realized and unrealized gain (loss) from: | | | | |
| |
Net realized gain (loss) from: | | | | |
Investment securities | | | (3,836,930 | ) |
| |
Foreign currencies | | | 39,977 | |
| |
| | | (3,796,953 | ) |
| |
Change in net unrealized appreciation of: | | | | |
Investment securities | | | 19,494,162 | |
| |
Foreign currencies | | | 262 | |
| |
| | | 19,494,424 | |
| |
Net realized and unrealized gain | | | 15,697,471 | |
| |
Net increase in net assets resulting from operations | | $ | 18,326,321 | |
| |
See accompanying Notes to Financial Statements which are an integral part of the financial statements.
13 Invesco International Select Equity Fund
Statement of Changes in Net Assets
For the years ended October 31, 2019 and 2018
| | | | | | | | |
| | | 2019 | | | 2018 | |
| |
Operations: | | | | | | | | |
| | |
Net investment income | | $ | 2,628,850 | | | $ | 1,103,528 | |
| |
Net realized gain (loss) | | | (3,796,953 | ) | | | 6,262,445 | |
| |
Change in net unrealized appreciation (depreciation) | | | 19,494,424 | | | | (22,224,549 | ) |
| |
Net increase (decrease) in net assets resulting from operations | | | 18,326,321 | | | | (14,858,576 | ) |
| |
| | |
Distributions to shareholders from distributable earnings: | | | | | | | | |
| | |
Class A | | | (261,379 | ) | | | (471,655 | ) |
| |
Class C | | | (61,039 | ) | | | (175,667 | ) |
| |
Class R | | | (5,692 | ) | | | (4,950 | ) |
| |
Class Y | | | (233,862 | ) | | | (639,649 | ) |
| |
Class R5 | | | (710 | ) | | | (1,086 | ) |
| |
Class R6 | | | (6,889,723 | ) | | | (7,720,394 | ) |
| |
Total distributions from distributable earnings | | | (7,452,405 | ) | | | (9,013,401 | ) |
| |
| | |
Share transactions–net: | | | | | | | | |
| | |
Class A | | | 1,004,435 | | | | 171,445 | |
| |
Class C | | | (444,675 | ) | | | (603,376 | ) |
| |
Class R | | | 125,063 | | | | 46,262 | |
| |
Class Y | | | (5,416,992 | ) | | | 2,943,177 | |
| |
Class R6 | | | (2,081,185 | ) | | | 32,003,354 | |
| |
Net increase (decrease) in net assets resulting from share transactions | | | (6,813,354 | ) | | | 34,560,862 | |
| |
Net increase in net assets | | | 4,060,562 | | | | 10,688,885 | |
| |
| | |
Net assets: | | | | | | | | |
| | |
Beginning of year | | | 117,391,320 | | | | 106,702,435 | |
| |
End of year | | $ | 121,451,882 | | | $ | 117,391,320 | |
| |
See accompanying Notes to Financial Statements which are an integral part of the financial statements.
14 Invesco International Select Equity Fund
Financial Highlights
October 31, 2019
The following schedule presents financial highlights for a share of the Fund outstanding throughout the periods indicated.
| | | | | | | | | | | | | | | | | | | | | | | | | | | | | | | | | | | | | | | | | | | | | | | | | | | | | | | | | | | | | | | | | | | | | | |
| | | Net asset
value,
beginning
of period | | Net
investment
income(a) | | Net gains
(losses)
on securities
(both
realized and
unrealized) | | Total from
investment
operations | | Dividends
from net
investment
income | | Distributions
from net
realized
gains | | Total
distributions | | Net asset
value, end
of period | | Total
return (b) | | Net assets,
end of period
(000’s omitted) | | Ratio of
expenses
to average
net assets
with fee waivers
and/or
expenses
absorbed | | Ratio of
expenses
to average net
assets without
fee waivers
and/or
expenses
absorbed | | Ratio of net
investment
income
(loss)
to average
net assets | | Portfolio
turnover (c) |
Class A | | | | | | | | | | | | | | | | | | | | | | | | | | | | | | | | | | | | | | | | | | | | | | | | | | | | | | | | | | | | | | | | | | | | | | |
Year ended 10/31/19 | | | $ | 10.52 | | | | $ | 0.22 | (d) | | | $ | 1.42 | | | | $ | 1.64 | | | | $ | (0.07 | ) | | | $ | (0.60 | ) | | | $ | (0.67 | ) | | | $ | 11.49 | | | | | 16.99 | % | | | $ | 5,852 | | | | | 1.11 | %(e) | | | | 1.60 | %(e) | | | | 2.06 | %(d)(e) | | | | 35 | % |
Year ended 10/31/18 | | | | 13.01 | | | | | 0.09 | | | | | (1.51 | ) | | | | (1.42 | ) | | | | (0.10 | ) | | | | (0.97 | ) | | | | (1.07 | ) | | | | 10.52 | | | | | (11.93 | ) | | | | 4,333 | | | | | 1.11 | | | | | 1.62 | | | | | 0.72 | | | | | 46 | |
Year ended 10/31/17 | | | | 10.98 | | | | | 0.08 | | | | | 2.41 | | | | | 2.49 | | | | | (0.10 | ) | | | | (0.36 | ) | | | | (0.46 | ) | | | | 13.01 | | | | | 23.77 | | | | | 5,436 | | | | | 1.14 | | | | | 1.70 | | | | | 0.71 | | | | | 43 | |
Year ended 10/31/16(f) | | | | 10.00 | | | | | 0.07 | | | | | 0.91 | | | | | 0.98 | | | | | – | | | | | – | | | | | – | | | | | 10.98 | | | | | 9.80 | | | | | 3,378 | | | | | 1.32 | (g) | | | | 1.90 | (g) | | | | 0.81 | (g) | | | | 35 | |
Class C | | | | | | | | | | | | | | | | | | | | | | | | | | | | | | | | | | | | | | | | | | | | | | | | | | | | | | | | | | | | | | | | | | | | | | |
Year ended 10/31/19 | | | | 10.35 | | | | | 0.14 | (d) | | | | 1.39 | | | | | 1.53 | | | | | – | | | | | (0.60 | ) | | | | (0.60 | ) | | | | 11.28 | | | | | 16.03 | | | | | 811 | | | | | 1.86 | (e) | | | | 2.35 | (e) | | | | 1.31 | (d)(e) | | | | 35 | |
Year ended 10/31/18 | | | | 12.86 | | | | | (0.00 | ) | | | | (1.48 | ) | | | | (1.48 | ) | | | | (0.06 | ) | | | | (0.97 | ) | | | | (1.03 | ) | | | | 10.35 | | | | | (12.55 | ) | | | | 1,192 | | | | | 1.86 | | | | | 2.37 | | | | | (0.03 | ) | | | | 46 | |
Year ended 10/31/17 | | | | 10.91 | | | | | (0.00 | ) | | | | 2.38 | | | | | 2.38 | | | | | (0.07 | ) | | | | (0.36 | ) | | | | (0.43 | ) | | | | 12.86 | | | | | 22.88 | | | | | 2,167 | | | | | 1.89 | | | | | 2.45 | | | | | (0.04 | ) | | | | 43 | |
Year ended 10/31/16(f) | | | | 10.00 | | | | | 0.01 | | | | | 0.90 | | | | | 0.91 | | | | | – | | | | | – | | | | | – | | | | | 10.91 | | | | | 9.10 | | | | | 50 | | | | | 2.07 | (g) | | | | 2.65 | (g) | | | | 0.06 | (g) | | | | 35 | |
Class R | | | | | | | | | | | | | | | | | | | | | | | | | | | | | | | | | | | | | | | | | | | | | | | | | | | | | | | | | | | | | | | | | | | | | | |
Year ended 10/31/19 | | | | 10.46 | | | | | 0.19 | (d) | | | | 1.40 | | | | | 1.59 | | | | | (0.04 | ) | | | | (0.60 | ) | | | | (0.64 | ) | | | | 11.41 | | | | | 16.60 | | | | | 227 | | | | | 1.36 | (e) | | | | 1.85 | (e) | | | | 1.81 | (d)(e) | | | | 35 | |
Year ended 10/31/18 | | | | 12.95 | | | | | 0.06 | | | | | (1.49 | ) | | | | (1.43 | ) | | | | (0.09 | ) | | | | (0.97 | ) | | | | (1.06 | ) | | | | 10.46 | | | | | (12.09 | ) | | | | 89 | | | | | 1.36 | | | | | 1.87 | | | | | 0.47 | | | | | 46 | |
Year ended 10/31/17 | | | | 10.95 | | | | | 0.05 | | | | | 2.40 | | | | | 2.45 | | | | | (0.09 | ) | | | | (0.36 | ) | | | | (0.45 | ) | | | | 12.95 | | | | | 23.44 | | | | | 61 | | | | | 1.39 | | | | | 1.95 | | | | | 0.46 | | | | | 43 | |
Year ended 10/31/16(f) | | | | 10.00 | | | | | 0.05 | | | | | 0.90 | | | | | 0.95 | | | | | – | | | | | – | | | | | – | | | | | 10.95 | | | | | 9.50 | | | | | 15 | | | | | 1.57 | (g) | | | | 2.15 | (g) | | | | 0.56 | (g) | | | | 35 | |
Class Y | | | | | | | | | | | | | | | | | | | | | | | | | | | | | | | | | | | | | | | | | | | | | | | | | | | | | | | | | | | | | | | | | | | | | | |
Year ended 10/31/19 | | | | 10.56 | | | | | 0.25 | (d) | | | | 1.41 | | | | | 1.66 | | | | | (0.11 | ) | | | | (0.60 | ) | | | | (0.71 | ) | | | | 11.51 | | | | | 17.24 | | | | | 3,299 | | | | | 0.86 | (e) | | | | 1.35 | (e) | | | | 2.31 | (d)(e) | | | | 35 | |
Year ended 10/31/18 | | | | 13.04 | | | | | 0.12 | | | | | (1.51 | ) | | | | (1.39 | ) | | | | (0.12 | ) | | | | (0.97 | ) | | | | (1.09 | ) | | | | 10.56 | | | | | (11.68 | ) | | | | 8,594 | | | | | 0.86 | | | | | 1.37 | | | | | 0.97 | | | | | 46 | |
Year ended 10/31/17 | | | | 11.00 | | | | | 0.11 | | | | | 2.40 | | | | | 2.51 | | | | | (0.11 | ) | | | | (0.36 | ) | | | | (0.47 | ) | | | | 13.04 | | | | | 24.04 | | | | | 7,499 | | | | | 0.89 | | | | | 1.45 | | | | | 0.96 | | | | | 43 | |
Year ended 10/31/16(f) | | | | 10.00 | | | | | 0.10 | | | | | 0.90 | | | | | 1.00 | | | | | – | | | | | – | | | | | – | | | | | 11.00 | | | | | 10.00 | | | | | 2,810 | | | | | 1.07 | (g) | | | | 1.65 | (g) | | | | 1.06 | (g) | | | | 35 | |
Class R5 | | | | | | | | | | | | | | | | | | | | | | | | | | | | | | | | | | | | | | | | | | | | | | | | | | | | | | | | | | | | | | | | | | | | | | |
Year ended 10/31/19 | | | | 10.56 | | | | | 0.25 | (d) | | | | 1.41 | | | | | 1.66 | | | | | (0.11 | ) | | | | (0.60 | ) | | | | (0.71 | ) | | | | 11.51 | | | | | 17.23 | | | | | 12 | | | | | 0.86 | (e) | | | | 1.14 | (e) | | | | 2.31 | (d)(e) | | | | 35 | |
Year ended 10/31/18 | | | | 13.04 | | | | | 0.12 | | | | | (1.51 | ) | | | | (1.39 | ) | | | | (0.12 | ) | | | | (0.97 | ) | | | | (1.09 | ) | | | | 10.56 | | | | | (11.68 | ) | | | | 11 | | | | | 0.86 | | | | | 1.19 | | | | | 0.97 | | | | | 46 | |
Year ended 10/31/17 | | | | 11.00 | | | | | 0.11 | | | | | 2.40 | | | | | 2.51 | | | | | (0.11 | ) | | | | (0.36 | ) | | | | (0.47 | ) | | | | 13.04 | | | | | 24.04 | | | | | 13 | | | | | 0.89 | | | | | 1.30 | | | | | 0.96 | | | | | 43 | |
Year ended 10/31/16(f) | | | | 10.00 | | | | | 0.10 | | | | | 0.90 | | | | | 1.00 | | | | | – | | | | | – | | | | | – | | | | | 11.00 | | | | | 10.00 | | | | | 11 | | | | | 1.07 | (g) | | | | 1.61 | (g) | | | | 1.06 | (g) | | | | 35 | |
Class R6 | | | | | | | | | | | | | | | | | | | | | | | | | | | | | | | | | | | | | | | | | | | | | | | | | | | | | | | | | | | | | | | | | | | | | | |
Year ended 10/31/19 | | | | 10.56 | | | | | 0.25 | (d) | | | | 1.41 | | | | | 1.66 | | | | | (0.11 | ) | | | | (0.60 | ) | | | | (0.71 | ) | | | | 11.51 | | | | | 17.24 | | | | | 111,252 | | | | | 0.86 | (e) | | | | 1.14 | (e) | | | | 2.31 | (d)(e) | | | | 35 | |
Year ended 10/31/18 | | | | 13.03 | | | | | 0.12 | | | | | (1.50 | ) | | | | (1.38 | ) | | | | (0.12 | ) | | | | (0.97 | ) | | | | (1.09 | ) | | | | 10.56 | | | | | (11.61 | ) | | | | 103,172 | | | | | 0.86 | | | | | 1.19 | | | | | 0.97 | | | | | 46 | |
Year ended 10/31/17 | | | | 11.00 | | | | | 0.11 | | | | | 2.39 | | | | | 2.50 | | | | | (0.11 | ) | | | | (0.36 | ) | | | | (0.47 | ) | | | | 13.03 | | | | | 23.94 | | | | | 91,527 | | | | | 0.89 | | | | | 1.30 | | | | | 0.96 | | | | | 43 | |
Year ended 10/31/16(f) | | | | 10.00 | | | | | 0.10 | | | | | 0.90 | | | | | 1.00 | | | | | – | | | | | – | | | | | – | | | | | 11.00 | | | | | 10.00 | | | | | 52,208 | | | | | 1.07 | (g) | | | | 1.61 | (g) | | | | 1.06 | (g) | | | | 35 | |
| (a) | Calculated using average shares outstanding. |
| (b) | Includes adjustments in accordance with accounting principles generally accepted in the United States of America and as such, the net asset value for financial reporting purposes and the returns based upon those net asset values may differ from the net asset value and returns for shareholder transactions. Does not include sales charges and is not annualized for periods less than one year, if applicable. |
| (c) | Portfolio turnover is calculated at the fund level and is not annualized for periods less than one year, if applicable. |
| (d) | Net investment income (loss) per share and the ratio of net investment income (loss) to average net assets includes significant dividends received during year ended October 31, 2019. Net investment income (loss) per share and the ratio of net investment income (loss) to average net assets excluding the significant dividends are $0.06 and 0.57%, $(0.02) and (0.18)%, $0.03 and 0.32%, $0.09 and 0.82%, $0.09 and 0.82%, and $0.09 and 0.82% for Class A, Class C, Class R, Class Y, Class R5 and Class R6 shares, respectively. |
| (e) | Ratios are based on average daily net assets (000’s omitted) of $5,168, $838, $141, $3,817, $11 and $104,982 for Class A, Class C, Class R, Class Y, Class R5 and Class R6 shares, respectively. |
| (f) | Commencement date of December 21, 2015. |
See accompanying Notes to Financial Statements which are an integral part of the financial statements.
15 Invesco International Select Equity Fund
Notes to Financial Statements
October 31, 2019
NOTE 1–Significant Accounting Policies
Invesco International Select Equity Fund, formerly Invesco International Companies Fund, (the “Fund”) is a series portfolio of AIM International Mutual Funds (Invesco International Mutual Funds) (the “Trust”). The Trust is a Delaware statutory trust registered under the Investment Company Act of 1940, as amended (the “1940 Act”), as anopen-end series management investment company authorized to issue an unlimited number of shares of beneficial interest. Information presented in these financial statements pertains only to the Fund. Matters affecting the Fund or each class will be voted on exclusively by the shareholders of the Fund or each class.
The Fund’s investment objective is long-term growth of capital.
The Fund currently consists of six different classes of shares: Class A, Class C, Class R, Class Y, Class R5 and Class R6. Class Y shares are available only to certain investors. Class A shares are sold with afront-end sales charge unless certain waiver criteria are met. Under certain circumstances, load waived shares may be subject to contingent deferred sales charges (“CDSC”). Class C shares are sold with a CDSC. Class R, Class Y, Class R5 and Class R6 shares are sold at net asset value. Class C shares held for ten years after purchase are eligible for automatic conversion into Class A shares of the same Fund (the “Conversion Feature”). The automatic conversion pursuant to the Conversion Feature will generally occur at the end of the month following the tenth anniversary after a purchase of Class C shares.
The Fund is an investment company and accordingly follows the investment company accounting and reporting guidance in accordance with Financial Accounting Standards Board Accounting Standards Codification Topic 946,Financial Services – Investment Companies.
The following is a summary of the significant accounting policies followed by the Fund in the preparation of its financial statements.
| A. | Security Valuations– Securities, including restricted securities, are valued according to the following policy. |
A security listed or traded on an exchange (except convertible securities) is valued at its last sales price or official closing price as of the close of the customary trading session on the exchange where the security is principally traded, or lacking any sales or official closing price on a particular day, the security may be valued at the closing bid price on that day. Securities traded in theover-the-counter market are valued based on prices furnished by independent pricing services or market makers. When such securities are valued by an independent pricing service they may be considered fair valued. Futures contracts are valued at the final settlement price set by an exchange on which they are principally traded. Listed options are valued at the mean between the last bid and asked prices from the exchange on which they are principally traded. Options not listed on an exchange are valued by an independent source at the mean between the last bid and asked prices. For purposes of determining net asset value (“NAV”) per share, futures and option contracts generally are valued 15 minutes after the close of the customary trading session of the New York Stock Exchange (“NYSE”).
Investments inopen-end andclosed-end registered investment companies that do not trade on an exchange are valued at theend-of-day net asset value per share. Investments inopen-end andclosed-end registered investment companies that trade on an exchange are valued at the last sales price or official closing price as of the close of the customary trading session on the exchange where the security is principally traded.
Debt obligations (including convertible securities) and unlisted equities are fair valued using an evaluated quote provided by an independent pricing service. Evaluated quotes provided by the pricing service may be determined without exclusive reliance on quoted prices, and may reflect appropriate factors such asinstitution-size trading in similar groups of securities, developments related to specific securities, dividend rate (for unlisted equities), yield (for debt obligations), quality, type of issue, coupon rate (for debt obligations), maturity (for debt obligations), individual trading characteristics and other market data. Pricing services generally value debt obligations assuming orderly transactions of institutional round lot size, but a fund may hold or transact in the same securities in smaller, odd lot sizes. Odd lots often trade at lower prices than institutional round lots. Debt obligations are subject to interest rate and credit risks. In addition, all debt obligations involve some risk of default with respect to interest and/or principal payments.
Foreign securities’ (including foreign exchange contracts) prices are converted into U.S. dollar amounts using the applicable exchange rates as of the close of the NYSE. If market quotations are available and reliable for foreign exchange-traded equity securities, the securities will be valued at the market quotations. Because trading hours for certain foreign securities end before the close of the NYSE, closing market quotations may become unreliable. If between the time trading ends on a particular security and the close of the customary trading session on the NYSE, events occur that the investment adviser determines are significant and make the closing price unreliable, the Fund may fair value the security. If the event is likely to have affected the closing price of the security, the security will be valued at fair value in good faith using procedures approved by the Board of Trustees. Adjustments to closing prices to reflect fair value may also be based on a screening process of an independent pricing service to indicate the degree of certainty, based on historical data, that the closing price in the principal market where a foreign security trades is not the current value as of the close of the NYSE. Foreign securities’ prices meeting the approved degree of certainty that the price is not reflective of current value will be priced at the indication of fair value from the independent pricing service. Multiple factors may be considered by the independent pricing service in determining adjustments to reflect fair value and may include information relating to sector indices, American Depositary Receipts and domestic and foreign index futures. Foreign securities may have additional risks including exchange rate changes, potential for sharply devalued currencies and high inflation, political and economic upheaval, the relative lack of issuer information, relatively low market liquidity and the potential lack of strict financial and accounting controls and standards.
Securities for which market prices are not provided by any of the above methods may be valued based upon quotes furnished by independent sources. The last bid price may be used to value equity securities. The mean between the last bid and asked prices is used to value debt obligations, including corporate loans.
Securities for which market quotations are not readily available or became unreliable are valued at fair value as determined in good faith by or under the supervision of the Trust’s officers following procedures approved by the Board of Trustees. Issuer specific events, market trends, bid/asked quotes of brokers and information providers and other market data may be reviewed in the course of making a good faith determination of a security’s fair value.
The Fund may invest in securities that are subject to interest rate risk, meaning the risk that the prices will generally fall as interest rates rise and, conversely, the prices will generally rise as interest rates fall. Specific securities differ in their sensitivity to changes in interest rates
16 Invesco International Select Equity Fund
depending on their individual characteristics. Changes in interest rates may result in increased market volatility, which may affect the value and/or liquidity of certain Fund investments.
Valuations change in response to many factors including the historical and prospective earnings of the issuer, the value of the issuer’s assets, general economic conditions, interest rates, investor perceptions and market liquidity. Because of the inherent uncertainties of valuation, the values reflected in the financial statements may materially differ from the value received upon actual sale of those investments.
| B. | Securities Transactions and Investment Income– Securities transactions are accounted for on a trade date basis. Realized gains or losses on sales are computed on the basis of specific identification of the securities sold. Interest income (net of withholding tax, if any) is recorded on the accrual basis from settlement date. Dividend income (net of withholding tax, if any) is recorded on theex-dividend date. |
The Fund may periodically participate in litigation related to Fund investments. As such, the Fund may receive proceeds from litigation settlements. Any proceeds received are included in the Statement of Operations as realized gain (loss) for investments no longer held and as unrealized gain (loss) for investments still held.
Brokerage commissions and mark ups are considered transaction costs and are recorded as an increase to the cost basis of securities purchased and/or a reduction of proceeds on a sale of securities. Such transaction costs are included in the determination of net realized and unrealized gain (loss) from investment securities reported in the Statement of Operations and the Statement of Changes in Net Assets and the net realized and unrealized gains (losses) on securities per share in the Financial Highlights. Transaction costs are included in the calculation of the Fund’s net asset value and, accordingly, they reduce the Fund’s total returns. These transaction costs are not considered operating expenses and are not reflected in net investment income reported in the Statement of Operations and the Statement of Changes in Net Assets, or the net investment income per share and the ratios of expenses and net investment income reported in the Financial Highlights, nor are they limited by any expense limitation arrangements between the Fund and the investment adviser.
The Fund allocates income and realized and unrealized capital gains and losses to a class based on the relative net assets of each class.
| C. | Country Determination– For the purposes of making investment selection decisions and presentation in the Schedule of Investments, the investment adviser may determine the country in which an issuer is located and/or credit risk exposure based on various factors. These factors include the laws of the country under which the issuer is organized, where the issuer maintains a principal office, the country in which the issuer derives 50% or more of its total revenues and the country that has the primary market for the issuer’s securities, as well as other criteria. Among the other criteria that may be evaluated for making this determination are the country in which the issuer maintains 50% or more of its assets, the type of security, financial guarantees and enhancements, the nature of the collateral and the sponsor organization. Country of issuer and/or credit risk exposure has been determined to be the United States of America, unless otherwise noted. |
| D. | Distributions– Distributions from net investment income and net realized capital gain, if any, are generally declared and paid annually and recorded on theex-dividend date. The Fund may elect to treat a portion of the proceeds from redemptions as distributions for federal income tax purposes. |
| E. | Federal Income Taxes –The Fund intends to comply with the requirements of Subchapter M of the Internal Revenue Code of 1986, as amended (the “Internal Revenue Code”), necessary to qualify as a regulated investment company and to distribute substantially all of the Fund’s taxable earnings to shareholders. As such, the Fund will not be subject to federal income taxes on otherwise taxable income (including net realized capital gain) that is distributed to shareholders. Therefore, no provision for federal income taxes is recorded in the financial statements. |
The Fund recognizes the tax benefits of uncertain tax positions only when the position is more likely than not to be sustained. Management has analyzed the Fund’s uncertain tax positions and concluded that no liability for unrecognized tax benefits should be recorded related to uncertain tax positions. Management is not aware of any tax positions for which it is reasonably possible that the total amounts of unrecognized tax benefits will change materially in the next 12 months.
The Fund files tax returns in the U.S. Federal jurisdiction and certain other jurisdictions. Generally, the Fund is subject to examinations by such taxing authorities for up to three years after the filing of the return for the tax period.
| F. | Expenses –Fees provided for under the Rule12b-1 plan of a particular class of the Fund are charged to the operations of such class. Transfer agency fees and expenses and other shareholder recordkeeping fees and expenses attributable to Class R5 and Class R6 are allocated to each share class based on relative net assets.Sub-accounting fees attributable to Class R5 are charged to the operations of the class. Transfer agency fees and expenses and other shareholder recordkeeping fees and expenses relating to all other classes are allocated among those classes based on relative net assets. All other expenses are allocated among the classes based on relative net assets. |
| G. | Accounting Estimates –The preparation of financial statements in conformity with accounting principles generally accepted in the United States of America (“GAAP”) requires management to make estimates and assumptions that affect the reported amounts of assets and liabilities at the date of the financial statements and the reported amounts of revenues and expenses during the reporting period including estimates and assumptions related to taxation. Actual results could differ from those estimates by a significant amount. In addition, the Fund monitors for material events or transactions that may occur or become known after theperiod-end date and before the date the financial statements are released to print. |
| H. | Indemnifications– Under the Trust’s organizational documents, each Trustee, officer, employee or other agent of the Trust is indemnified against certain liabilities that may arise out of the performance of their duties to the Fund. Additionally, in the normal course of business, the Fund enters into contracts, including the Fund’s servicing agreements, that contain a variety of indemnification clauses. The Fund’s maximum exposure under these arrangements is unknown as this would involve future claims that may be made against the Fund that have not yet occurred. The risk of material loss as a result of such indemnification claims is considered remote. |
| I. | Foreign Currency Translations– Foreign currency is valued at the close of the NYSE based on quotations posted by banks and major currency dealers. Portfolio securities and other assets and liabilities denominated in foreign currencies are translated into U.S. dollar amounts at the date of valuation. Purchases and sales of portfolio securities (net of foreign taxes withheld on disposition) and income items denominated in foreign currencies are translated into U.S. dollar amounts on the respective dates of such transactions. The Fund does not separately account for the portion of the results of operations resulting from changes in foreign exchange rates on investments and the fluctuations arising from changes in market prices of securities held. The combined results of changes in foreign exchange rates and the fluctuation of market prices on investments (net of estimated foreign tax withholding) are included with the net realized and unrealized gain or loss from investments in the Statement of Operations. Reported net realized foreign currency gains or losses arise from (1) sales of foreign currencies, (2) currency gains or losses realized between the trade and settlement dates on securities transactions, and (3) the difference between the amounts of dividends, |
17 Invesco International Select Equity Fund
interest, and foreign withholding taxes recorded on the Fund’s books and the U.S. dollar equivalent of the amounts actually received or paid. Net unrealized foreign currency gains and losses arise from changes in the fair values of assets and liabilities, other than investments in securities at fiscal period end, resulting from changes in exchange rates.
The Fund may invest in foreign securities, which may be subject to foreign taxes on income, gains on investments or currency repatriation, a portion of which may be recoverable. Foreign taxes, if any, are recorded based on the tax regulations and rates that exist in the foreign markets in which the Fund invests and are shown in the Statement of Operations.
| J. | Forward Foreign Currency Contracts– The Fund may engage in foreign currency transactions either on a spot (i.e. for prompt delivery and settlement) basis, or through forward foreign currency contracts, to manage or minimize currency or exchange rate risk. |
The Fund may also enter into forward foreign currency contracts for the purchase or sale of a security denominated in a foreign currency in order to “lock in” the U.S. dollar price of that security, or the Fund may also enter into forward foreign currency contracts that do not provide for physical settlement of the two currencies, but instead are settled by a single cash payment calculated as the difference between the agreed upon exchange rate and the spot rate at settlement based upon an agreed upon notional amount(non-deliverable forwards). The Fund will set aside liquid assets in an amount equal to the dailymark-to-market obligation for forward foreign currency contracts.
A forward foreign currency contract is an obligation between two parties (“Counterparties”) to purchase or sell a specific currency for an agreed-upon price at a future date. The use of forward foreign currency contracts does not eliminate fluctuations in the price of the underlying securities the Fund owns or intends to acquire but establishes a rate of exchange in advance. Fluctuations in the value of these contracts are measured by the difference in the contract date and reporting date exchange rates and are recorded as unrealized appreciation (depreciation) until the contracts are closed. When the contracts are closed, realized gains (losses) are recorded. Realized and unrealized gains (losses) on the contracts are included in the Statement of Operations. The primary risks associated with forward foreign currency contracts include failure of the Counterparty to meet the terms of the contract and the value of the foreign currency changing unfavorably. These risks may be in excess of the amounts reflected in the Statement of Assets and Liabilities.
NOTE 2–Advisory Fees and Other Fees Paid to Affiliates
The Trust has entered into a master investment advisory agreement with Invesco Advisers, Inc. (the “Adviser” or “Invesco”). Under the terms of the investment advisory agreement, the Fund accrues daily and pays monthly an advisory fee to the Adviser based on the annual rate of the Fund’s average daily net assets as follows:
| | | | |
| Average Daily Net Assets | | Rate | |
First $250 million | | | 0.935% | |
Next $250 million | | | 0.910% | |
Next $500 million | | | 0.885% | |
Next $1.5 billion | | | 0.860% | |
Next $2.5 billion | | | 0.835% | |
Next $2.5 billion | | | 0.810% | |
Next $2.5 billion | | | 0.785% | |
Over $10 billion | | | 0.760% | |
For the year ended October 31, 2019, the effective advisory fee rate incurred by the Fund was 0.935%.
Under the terms of a mastersub-advisory agreement between the Adviser and each of Invesco Asset Management Deutschland GmbH, Invesco Asset Management Limited, Invesco Asset Management (Japan) Limited, Invesco Hong Kong Limited, Invesco Senior Secured Management, Inc. and Invesco Canada Ltd. and separatesub-advisory agreements with Invesco Capital Management LLC and Invesco Asset Management (India) Private Limited (collectively, the “AffiliatedSub-Advisers”) the Adviser, not the Fund, will pay 40% of the fees paid to the Adviser to any such AffiliatedSub-Adviser(s) that provide(s) discretionary investment management services to the Fund based on the percentage of assets allocated to such AffiliatedSub-Adviser(s).
The Adviser has contractually agreed, through at least February 28, 2021, to waive advisory fees and/or reimburse expenses of all shares to the extent necessary to limit total annual fund operating expenses after fee waiver and/or expense reimbursement (excluding certain items discussed below) of Class A, Class C, Class R, Class Y, Class R5 and Class R6 shares to 1.12%, 1.87%, 1.37%, 0.87%, 0.87% and 0.87%, respectively, of average daily net assets (the “expense limits”). In determining the Adviser’s obligation to waive advisory fees and/or reimburse expenses, the following expenses are not taken into account, and could cause the total annual fund operating expenses after fee waiver and/or expense reimbursement to exceed the numbers reflected above: (1) interest; (2) taxes; (3) dividend expense on short sales; (4) extraordinary ornon-routine items, including litigation expenses; and (5) expenses that the Fund has incurred but did not actually pay because of an expense offset arrangement. Unless Invesco continues the fee waiver agreement, it will terminate on February 28, 2021. During its term, the fee waiver agreement cannot be terminated or amended to increase the expense limits or reduce the advisory fee waiver without approval of the Board of Trustees.
Further, the Adviser has contractually agreed, through at least June 30, 2021, to waive the advisory fee payable by the Fund in an amount equal to 100% of the net advisory fees the Adviser receives from the affiliated money market funds on investments by the Fund of uninvested cash in such affiliated money market funds.
For the year ended October 31, 2019, the Adviser waived advisory fees of $319,127 and reimbursed class level expenses of $10,897, $1,767, $298, $8,049, $0 and $734 of Class A, Class C, Class R, Class Y, Class R5 and Class R6 shares, respectively.
The Trust has entered into a master administrative services agreement with Invesco pursuant to which the Fund has agreed to pay Invesco for certain administrative costs incurred in providing accounting services to the Fund. For the year ended October 31, 2019, expenses incurred under the agreement are shown in the Statement of Operations as Administrative services fees. Invesco has entered into asub-administration agreement whereby State Street Bank and Trust Company (“SSB”) serves as fund accountant and provides certain administrative services to the Fund. Pursuant to a custody agreement with the Trust on behalf of the Fund, SSB also serves as the Fund’s custodian.
18 Invesco International Select Equity Fund
The Trust has entered into a transfer agency and service agreement with Invesco Investment Services, Inc. (“IIS”) pursuant to which the Fund has agreed to pay IIS a fee for providing transfer agency and shareholder services to the Fund and reimburse IIS for certain expenses incurred by IIS in the course of providing such services. IIS may make payments to intermediaries that provide omnibus account services,sub-accounting services and/or networking services. All fees payable by IIS to intermediaries that provide omnibus account services orsub-accounting services are charged back to the Fund, subject to certain limitations approved by the Trust’s Board of Trustees. For the year ended October 31, 2019, expenses incurred under the agreement are shown in the Statement of Operations asTransfer agent fees.
The Trust has entered into master distribution agreements with Invesco Distributors, Inc. (“IDI”) to serve as the distributor for the Class A, Class C, Class R, Class Y, Class R5 and Class R6 shares of the Fund. The Trust has adopted plans pursuant to Rule12b-1 under the 1940 Act with respect to the Fund’s Class A, Class C and Class R shares (collectively, the “Plans”). The Fund, pursuant to the Plans, pays IDI compensation at the annual rate of 0.25% of the Fund’s average daily net assets of Class A shares, 1.00% of the average daily net assets of Class C shares and 0.50% of the average daily net assets of Class R shares. The fees are accrued daily and paid monthly. Of the Plan payments, up to 0.25% of the average daily net assets of each class of shares may be paid to furnish continuing personal shareholder services to customers who purchase and own shares of such classes. Any amounts not paid as a service fee under the Plans would constitute an asset-based sales charge. Rules of the Financial Industry Regulatory Authority (“FINRA”) impose a cap on the total sales charges, including asset-based sales charges, that may be paid by any class of shares of the Fund. For the year ended October 31, 2019, expenses incurred under the Plans are shown in the Statement of Operations asDistribution fees.
Front-end sales commissions and CDSC (collectively, the “sales charges”) are not recorded as expenses of the Fund.Front-end sales commissions are deducted from proceeds from the sales of Fund shares prior to investment in Class A shares of the Fund. CDSC are deducted from redemption proceeds prior to remittance to the shareholder. During the year ended October 31, 2019, IDI advised the Fund that IDI retained $2,225 infront-end sales commissions from the sale of Class A shares and $156 and $0 from Class A and Class C shares, respectively, for CDSC imposed upon redemptions by shareholders.
Certain officers and trustees of the Trust are officers and directors of the Adviser, IIS and/or IDI.
NOTE 3–Additional Valuation Information
GAAP defines fair value as the price that would be received to sell an asset or paid to transfer a liability in an orderly transaction between market participants at the measurement date, under current market conditions. GAAP establishes a hierarchy that prioritizes the inputs to valuation methods, giving the highest priority to readily available unadjusted quoted prices in an active market for identical assets (Level 1) and the lowest priority to significant unobservable inputs (Level 3), generally when market prices are not readily available or are unreliable. Based on the valuation inputs, the securities or other investments are tiered into one of three levels. Changes in valuation methods may result in transfers in or out of an investment’s assigned level:
| | |
| Level 1 – | | Prices are determined using quoted prices in an active market for identical assets. |
| Level 2 – | | Prices are determined using other significant observable inputs. Observable inputs are inputs that other market participants may use in pricing a security. These may include quoted prices for similar securities, interest rates, prepayment speeds, credit risk, yield curves, loss severities, default rates, discount rates, volatilities and others. |
| Level 3 – | | Prices are determined using significant unobservable inputs. In situations where quoted prices or observable inputs are unavailable (for example, when there is little or no market activity for an investment at the end of the period), unobservable inputs may be used. Unobservable inputs reflect the Fund’s own assumptions about the factors market participants would use in determining fair value of the securities or instruments and would be based on the best available information. |
The following is a summary of the tiered valuation input levels, as of October 31, 2019. The level assigned to the securities valuations may not be an indication of the risk or liquidity associated with investing in those securities. Because of the inherent uncertainties of valuation, the values reflected in the financial statements may materially differ from the value received upon actual sale of those investments.
19 Invesco International Select Equity Fund
| | | | | | | | | | | | | | | | | | | | |
| | | Level 1 | | Level 2 | | Level 3 | | Total |
Investments in Securities | | | | | | | | | | | | | | | | | | | | |
Australia | | | $ | – | | | | $ | 4,132,133 | | | | $ | – | | | | $ | 4,132,133 | |
Belgium | | | | – | | | | | 4,735,822 | | | | | – | | | | | 4,735,822 | |
Canada | | | | 2,735,015 | | | | | – | | | | | – | | | | | 2,735,015 | |
Chile | | | | 3,274,568 | | | | | – | | | | | – | | | | | 3,274,568 | |
China | | | | 6,313,479 | | | | | 15,052,245 | | | | | – | | | | | 21,365,724 | |
Denmark | | | | – | | | | | 1,883,130 | | | | | – | | | | | 1,883,130 | |
Finland | | | | – | | | | | 648,092 | | | | | – | | | | | 648,092 | |
France | | | | – | | | | | 3,396,350 | | | | | – | | | | | 3,396,350 | |
Germany | | | | – | | | | | 5,137,308 | | | | | – | | | | | 5,137,308 | |
Hong Kong | | | | – | | | | | 3,554,224 | | | | | – | | | | | 3,554,224 | |
Japan | | | | – | | | | | 19,981,484 | | | | | – | | | | | 19,981,484 | |
Luxembourg | | | | – | | | | | 6,644,672 | | | | | – | | | | | 6,644,672 | |
Netherlands | | | | 4,680,246 | | | | | – | | | | | – | | | | | 4,680,246 | |
Poland | | | | – | | | | | 2,399,060 | | | | | – | | | | | 2,399,060 | |
South Korea | | | | – | | | | | 6,294,892 | | | | | – | | | | | 6,294,892 | |
Spain | | | | – | | | | | 1,652,536 | | | | | – | | | | | 1,652,536 | |
United Kingdom | | | | 7,581,065 | | | | | 16,864,264 | | | | | – | | | | | 24,445,329 | |
Money Market Funds | | | | 4,082,710 | | | | | – | | | | | – | | | | | 4,082,710 | |
Total Investments | | | $ | 28,667,083 | | | | $ | 92,376,212 | | | | $ | – | | | | $ | 121,043,295 | |
NOTE 4–Expense Offset Arrangement(s)
The expense offset arrangement is comprised of transfer agency credits which result from balances in demand deposit accounts used by the transfer agent for clearing shareholder transactions. For the year ended October 31, 2019, the Fund received credits from this arrangement, which resulted in the reduction of the Fund’s total expenses of $284.
NOTE 5–Trustees’ and Officers’ Fees and Benefits
Trustees’ and Officers’ Fees and Benefits include amounts accrued by the Fund to pay remuneration to certain Trustees and Officers of the Fund. Trustees have the option to defer compensation payable by the Fund, andTrustees’ and Officers’ Fees and Benefits also include amounts accrued by the Fund to fund such deferred compensation amounts. Those Trustees who defer compensation have the option to select various Invesco Funds in which their deferral accounts shall be deemed to be invested. Obligations under the deferred compensation plan represent unsecured claims against the general assets of the Fund.
NOTE 6–Cash Balances
The Fund is permitted to temporarily carry a negative or overdrawn balance in its account with State Street Bank and Trust Company, the custodian bank. Such balances, if any atperiod-end, are shown in the Statement of Assets and Liabilities under the payable caption Amount due custodian. To compensate the custodian bank for such overdrafts, the overdrawn Fund may either (1) leave funds as a compensating balance in the account so the custodian bank can be compensated by earning the additional interest; or (2) compensate by paying the custodian bank at a rate agreed upon by the custodian bank and Invesco, not to exceed the contractually agreed upon rate.
NOTE 7–Distributions to Shareholders and Tax Components of Net Assets
Tax Character of Distributions to Shareholders Paid During the Fiscal Years Ended October 31, 2019 and 2018
| | | | | | | | |
| | | 2019 | | | 2018 | |
| |
Ordinary income | | $ | 1,179,076 | | | $ | 1,887,153 | |
| |
Long-term capital gain | | | 6,273,329 | | | | 7,126,248 | |
| |
Total distributions | | $ | 7,452,405 | | | $ | 9,013,401 | |
| |
20 Invesco International Select Equity Fund
Tax Components of Net Assets atPeriod-End:
| | | | |
| | | 2019 | |
| |
Undistributed ordinary income | | $ | 2,594,043 | |
| |
Net unrealized appreciation – investments | | | 12,909,188 | |
| |
Net unrealized appreciation – foreign currencies | | | 3,469 | |
| |
Temporary book/tax differences | | | (7,897 | ) |
| |
Capital loss carryforward | | | (3,554,957 | ) |
| |
Shares of beneficial interest | | | 109,508,036 | |
| |
Total net assets | | $ | 121,451,882 | |
| |
The difference between book-basis andtax-basis unrealized appreciation (depreciation) is due to differences in the timing of recognition of gains and losses on investments for tax and book purposes. The Fund’s net unrealized appreciation difference is attributable primarily to wash sales.
The temporary book/tax differences are a result of timing differences between book and tax recognition of income and/or expenses. The Fund’s temporary book/tax differences are the result of the trustee deferral of compensation and retirement plan benefits.
Capital loss carryforward is calculated and reported as of a specific date. Results of transactions and other activity after that date may affect the amount of capital loss carryforward actually available for the Fund to utilize. The ability to utilize capital loss carryforward in the future may be limited under the Internal Revenue Code and related regulations based on the results of future transactions.
The Fund does not have a capital loss carryforward as of October 31, 2019.
| | | | | | | | |
| Capital Loss Carryforward* | |
| |
| Expiration | | Short-Term | | Long-Term | | Total | |
| |
Not subject to expiration | | $– | | $3,554,957 | | $ | 3,554,957 | |
| |
| * | Capital loss carryforwards as of the date listed above are reduced for limitations, if any, to the extent required by the Internal Revenue Code and may be further limited depending upon a variety of factors, including the realization of net unrealized gains or losses as of the date of any reorganization. |
NOTE 8–Investment Transactions
The aggregate amount of investment securities (other than short-term securities, U.S. Treasury obligations and money market funds, if any) purchased and sold by the Fund during the year ended October 31, 2019 was $37,762,347 and $48,328,080, respectively. Cost of investments, including any derivatives, on a tax basis includes the adjustments for financial reporting purposes as of the most recently completed federal income tax reportingperiod-end.
| | | | |
| Unrealized Appreciation (Depreciation) of Investments on a Tax Basis | |
| |
Aggregate unrealized appreciation of investments | | $ | 19,000,235 | |
| |
Aggregate unrealized (depreciation) of investments | | | (6,091,047 | ) |
| |
Net unrealized appreciation of investments | | $ | 12,909,188 | |
| |
Cost of investments for tax purposes is $108,134,107.
NOTE 9–Reclassification of Permanent Differences
Primarily as a result of differing book/tax treatment of distributions and foreign currency transactions, on October 31, 2019, undistributed net investment income was decreased by $12,883 and undistributed net realized gain (loss) was increased by $12,883. This reclassification had no effect on the net assets or the distributable earnings of the Fund.
NOTE 10–Share Information
| | | | | | | | | | | | | | | | |
| | | Summary of Share Activity | |
| |
| | | Years ended October 31, | |
| | | 2019(a) | | | 2018 | |
| | | Shares | | | Amount | | | Shares | | | Amount | |
| |
Sold: | | | | | | | | | | | | | | | | |
| | | | |
Class A | | | 235,291 | | | $ | 2,507,996 | | | | 395,358 | | | $ | 4,946,643 | |
| |
Class C | | | 27,714 | | | | 290,309 | | | | 57,217 | | | | 694,605 | |
| |
Class R | | | 12,556 | | | | 136,256 | | | | 3,799 | | | | 45,637 | |
| |
Class Y | | | 110,292 | | | | 1,193,984 | | | | 551,062 | | | | 6,728,781 | |
| |
Class R6 | | | 1,123,421 | | | | 12,123,681 | | | | 2,914,747 | | | | 34,282,469 | |
| |
21 Invesco International Select Equity Fund
| | | | | | | | | | | | | | | | |
| |
| | | Summary of Share Activity | |
| |
| | | Years ended October 31, | |
| | | 2019(a) | | | 2018 | |
| | | Shares | | | Amount | | | Shares | | | Amount | |
| |
| | | | |
Issued as reinvestment of dividends: | | | | | | | | | | | | | | | | |
| | | | |
Class A | | | 25,834 | | | $ | 242,582 | | | | 36,805 | | | $ | 439,816 | |
| |
Class C | | | 6,448 | | | | 59,834 | | | | 13,667 | | | | 161,676 | |
| |
Class R | | | 540 | | | | 5,047 | | | | 328 | | | | 3,897 | |
| |
Class Y | | | 24,317 | | | | 228,088 | | | | 51,463 | | | | 616,011 | |
| |
Class R6 | | | 734,436 | | | | 6,889,012 | | | | 644,888 | | | | 7,719,307 | |
| |
| | | | |
Automatic conversion of Class C shares to Class A shares: | | | | | | | | | | | | | | | | |
| | | | |
Class A | | | 25,736 | | | | 265,668 | | | | - | | | | - | |
| |
Class C | | | (26,056 | ) | | | (265,668 | ) | | | - | | | | - | |
| |
| | | | |
Reacquired: | | | | | | | | | | | | | | | | |
| | | | |
Class A | | | (189,236 | ) | | | (2,011,811 | ) | | | (438,390 | ) | | | (5,215,014 | ) |
| |
Class C | | | (51,465 | ) | | | (529,150 | ) | | | (124,231 | ) | | | (1,459,657 | ) |
| |
Class R | | | (1,773 | ) | | | (16,240 | ) | | | (276 | ) | | | (3,272 | ) |
| |
Class Y | | | (661,489 | ) | | | (6,839,064 | ) | | | (364,047 | ) | | | (4,401,615 | ) |
| |
Class R6 | | | (1,960,679 | ) | | | (21,093,878 | ) | | | (811,049 | ) | | | (9,998,422 | ) |
| |
Net increase (decrease) in share activity | | | (564,113 | ) | | $ | (6,813,354 | ) | | | 2,931,341 | | | $ | 34,560,862 | |
| |
| (a) | 91% of the outstanding shares of the Fund are owned by the Adviser or an affiliate of the Adviser. |
22 Invesco International Select Equity Fund
Report of Independent Registered Public Accounting Firm
To the Board of Trustees of AIM International Mutual Funds (Invesco International Mutual Funds) and Shareholders of Invesco International Select Equity Fund
Opinion on the Financial Statements
We have audited the accompanying statement of assets and liabilities, including the schedule of investments, of Invesco International Select Equity Fund (one of the funds constituting AIM International Mutual Funds (Invesco International Mutual Funds), referred to hereafter as the “Fund”) as of October 31, 2019, the related statement of operations for the year ended October 31, 2019, the statement of changes in net assets for each of the two years in the period ended October 31, 2019, including the related notes, and the financial highlights for each of the three years in the period ended October 31, 2019 and the period December 21, 2015 (commencement of operations) through October 31, 2016 (collectively referred to as the “financial statements”). In our opinion, the financial statements present fairly, in all material respects, the financial position of the Fund as of October 31, 2019, the results of its operations for the year then ended, the changes in its net assets for each of the two years in the period ended October 31, 2019 and the financial highlights for each of the three years in the period ended October 31, 2019 and the period December 21, 2015 (commencement of operations) through October 31, 2016 in conformity with accounting principles generally accepted in the United States of America.
Basis for Opinion
These financial statements are the responsibility of the Fund’s management. Our responsibility is to express an opinion on the Fund’s financial statements based on our audits. We are a public accounting firm registered with the Public Company Accounting Oversight Board (United States) (PCAOB) and are required to be independent with respect to the Fund in accordance with the U.S. federal securities laws and the applicable rules and regulations of the Securities and Exchange Commission and the PCAOB.
We conducted our audits of these financial statements in accordance with the standards of the PCAOB. Those standards require that we plan and perform the audit to obtain reasonable assurance about whether the financial statements are free of material misstatement, whether due to error or fraud.
Our audits included performing procedures to assess the risks of material misstatement of the financial statements, whether due to error or fraud, and performing procedures that respond to those risks. Such procedures included examining, on a test basis, evidence regarding the amounts and disclosures in the financial statements. Our audits also included evaluating the accounting principles used and significant estimates made by management, as well as evaluating the overall presentation of the financial statements. Our procedures included confirmation of securities owned as of October 31, 2019 by correspondence with the custodian, transfer agent and brokers; when replies were not received from brokers, we performed other auditing procedures. We believe that our audits provide a reasonable basis for our opinion.
/s/PricewaterhouseCoopers LLP
Houston, Texas
December 23, 2019
We have served as the auditor of one or more of the investment companies in the Invesco group of investment companies since at least 1995. We have not been able to determine the specific year we began serving as auditor.
23 Invesco International Select Equity Fund
Calculating your ongoing Fund expenses
Example
As a shareholder of the Fund, you incur two types of costs: (1) transaction costs, which may include sales charges (loads) on purchase payments or contingent deferred sales charges on redemptions, if any; and (2) ongoing costs, including management fees, distribution and/or service(12b-1) fees, and other Fund expenses. This example is intended to help you understand your ongoing costs (in dollars) of investing in the Fund and to compare these costs with ongoing costs of investing in other mutual funds. The example is based on an investment of $1,000 invested at the beginning of the period and held for the entire period May 1, 2019 through October 31, 2019.
Actual expenses
The table below provides information about actual account values and actual expenses. You may use the information in this table, together with the amount you invested, to estimate the expenses that you paid over the period. Simply divide your account value by $1,000 (for example, an $8,600 account value divided by $1,000 = 8.6), then multiply the result by the number in the table under the heading entitled “Actual Expenses Paid During Period” to estimate the expenses you paid on your account during this period.
Hypothetical example for comparison purposes
The table below also provides information about hypothetical account values and hypothetical expenses based on the Fund’s actual expense ratio and an assumed rate of return of 5% per year before expenses, which is not the Fund’s actual return.
The hypothetical account values and expenses may not be used to estimate the actual ending account balance or expenses you paid for the period. You may use this information to compare the ongoing costs of investing in the Fund and other funds. To do so, compare this 5% hypothetical example with the 5% hypothetical examples that appear in the shareholder reports of the other funds.
Please note that the expenses shown in the table are meant to highlight your ongoing costs only and do not reflect any transaction costs, such as sales charges (loads) on purchase payments or contingent deferred sales charges on redemptions, if any. Therefore, the hypothetical information is useful in comparing ongoing costs only, and will not help you determine the relative total costs of owning different funds. In addition, if these transaction costs were included, your costs would have been higher.
| | | | | | | | | | | | |
| | | | | | | | | HYPOTHETICAL | | |
| | | | | | | | | (5% annual return before | | |
| | | | | ACTUAL | | expenses) | | |
| | | Beginning | | Ending | | Expenses | | Ending | | Expenses | | Annualized |
| | | Account Value | | Account Value | | Paid During | | Account Value | | Paid During | | Expense |
| | | (05/01/19) | | (10/31/19)1 | | Period2 | | (10/31/19) | | Period2 | | Ratio |
Class A | | $1,000.00 | | $1,013.20 | | $5.63 | | $1,019.61 | | $5.65 | | 1.11% |
Class C | | 1,000.00 | | 1,008.90 | | 9.42 | | 1,015.83 | | 9.45 | | 1.86 |
Class R | | 1,000.00 | | 1,011.50 | | 6.90 | | 1,018.35 | | 6.92 | | 1.36 |
Class Y | | 1,000.00 | | 1,015.00 | | 4.37 | | 1,020.87 | | 4.38 | | 0.86 |
Class R5 | | 1,000.00 | | 1,014.10 | | 4.37 | | 1,020.87 | | 4.38 | | 0.86 |
Class R6 | | 1,000.00 | | 1,014.10 | | 4.37 | | 1,020.87 | | 4.38 | | 0.86 |
| 1 | The actual ending account value is based on the actual total return of the Fund for the period May 1, 2019 through October 31, 2019, after actual expenses and will differ from the hypothetical ending account value which is based on the Fund’s expense ratio and a hypothetical annual return of 5% before expenses. |
| 2 | Expenses are equal to the Fund’s annualized expense ratio as indicated above multiplied by the average account value over the period, multiplied by 184/365 to reflect the most recent fiscal half year. |
24 Invesco International Select Equity Fund
Approval of Investment Advisory andSub-Advisory Contracts
At meetings held on June 10, 2019, the Board of Trustees (the Board or the Trustees) of AIM International Mutual Funds (Invesco International Mutual Funds) as a whole, and the independent Trustees, who comprise over 75% of the Board, voting separately, approved the continuance of the Invesco International Select Equity Fund’s (the Fund) Master Investment Advisory Agreement with Invesco Advisers, Inc. (Invesco Advisers and the investment advisory agreement) and the Master IntergroupSub-Advisory Contract for Mutual Funds with Invesco Asset Management Deutschland GmbH, Invesco Asset Management Limited, Invesco Asset Management (Japan) Limited, Invesco Hong Kong Limited, Invesco Senior Secured Management, Inc. and Invesco Canada Ltd. and separatesub-advisory contracts with Invesco Capital Management LLC and Invesco Asset Management (India) Private Limited (collectively, the AffiliatedSub-Advisers and thesub-advisory contracts) for another year, effective July 1, 2019. After evaluating the factors discussed below, among others, the Board approved the renewal of the Fund’s investment advisory agreement and thesub-advisory contracts and determined that the compensation payable by the Fund to Invesco Advisers and by Invesco Advisers to the AffiliatedSub-Advisers is fair and reasonable.
The Board’s Evaluation Process
The Board’s Investments Committee has established threeSub-Committees, which meet throughout the year to review the performance of funds advised by Invesco Advisers (the Invesco Funds). As part of a regularly scheduled basis ofin-person Board meetings, theSub-Committees meet with portfolio managers for their assigned Invesco Funds and other members of management to review detailed information about investment performance and portfolio attributes of these funds. The Board took into account evaluations and reports that it received from the Investments Committee andSub-Committees, as well as the information provided to such committees and the Board throughout the year, in considering whether to approve each Invesco Fund’s investment advisory agreement andsub-advisory contracts.
As part of the contract renewal process, the Board reviews and considers information provided in response to detailed requests for information submitted to management by the independent Trustees with assistance from legal counsel to the independent Trustees. The Board receives comparative investment performance and fee data regarding the Invesco Funds prepared by Invesco Advisers and Broadridge Financial Solutions, Inc. (Broadridge), an independent mutual fund data provider. The Board also receives an independent written evaluation from the Senior Officer, an officer of
the Invesco Funds who reports directly to the independent Trustees. The Senior Officer’s evaluation is prepared as part of his responsibility to manage the process by which the Invesco Funds’ proposed management fees are negotiated during the annual contract renewal process to ensure they are negotiated in a manner that is at arms’ length and reasonable. In addition to meetings with Invesco Advisers and fund counsel throughout the year, the independent Trustees also discuss the continuance of the investment advisory agreement andsub-advisory contracts in separate sessions with the Senior Officer and with independent legal counsel.
The discussion below is a summary of the Senior Officer’s independent written evaluation with respect to the Fund’s investment advisory agreement, as well as a discussion of the material factors and related conclusions that formed the basis for the Board’s approval of the Fund’s investment advisory agreement andsub-advisory contracts. The Trustees’ review and conclusions are based on the comprehensive consideration of all information presented to them during the course of the year and in prior years and are not the result of any single determinative factor. Moreover, one Trustee may have weighed a particular piece of information or factor differently than another Trustee. This information is current as of June 10, 2019.
Factors and Conclusions and Summary of Independent Written Fee Evaluation
| A. | Nature, Extent and Quality of Services Provided by Invesco Advisers and the AffiliatedSub-Advisers |
The Board reviewed the nature, extent and quality of the advisory services provided to the Fund by Invesco Advisers under the Fund’s investment advisory agreement, and the credentials and experience of the officers and employees of Invesco Advisers who provide these services, including the Fund’s portfolio manager(s). The Board’s review included consideration of Invesco Advisers’ investment process oversight and structure, credit analysis and investment risk management. The Board also considerednon-advisory services that Invesco Advisers and its affiliates provide to the Invesco Funds such as various back office support functions, third party oversight, internal audit, valuation, portfolio trading and legal and compliance. The Board also received and reviewed information about Invesco Advisers’ role as administrator of the Invesco Funds’ liquidity risk management program. The Board also reviewed and considered the benefits to shareholders of investing in a fund that is part of the Invesco family of funds under the umbrella of Invesco Ltd., Invesco Advisers’ parent company, and noted Invesco Ltd.’s depth and experience in conducting an investment
management business, as well as its commitment of financial and other resources to such business. The Board reviewed and considered information about the resources that Invesco Advisers intends to continue to commit to managing the Invesco family of funds following Invesco Ltd.’s acquisition of OppenheimerFunds, Inc. and its subsidiaries. The Board concluded that the nature, extent and quality of the services provided to the Fund by Invesco Advisers are appropriate and satisfactory.
The Board reviewed the services that may be provided by the AffiliatedSub-Advisers under thesub-advisory contracts and the credentials and experience of the officers and employees of the AffiliatedSub-Advisers who provide these services. The Board noted the AffiliatedSub-Advisers’ expertise with respect to certain asset classes and that the AffiliatedSub-Advisers have offices and personnel that are located in financial centers around the world. As a result, the Board noted that the AffiliatedSub-Advisers can provide research and investment analysis on the markets and economies of various countries in which the Fund may invest, make recommendations regarding securities and assist with security trades. The Board concluded that thesub-advisory contracts may benefit the Fund and its shareholders by permitting Invesco Advisers to use the resources and talents of the AffiliatedSub-Advisers in managing the Fund. The Board concluded that the nature, extent and quality of the services that may be provided by the AffiliatedSub-Advisers are appropriate and satisfactory.
| B. | Fund Investment Performance |
The Board considered Fund investment performance as a relevant factor in considering whether to approve the investment advisory agreement as well as thesub-advisory contracts for the Fund, as Invesco Hong Kong Limited currently manages assets of the Fund.
The Board noted that the Fund only had three years of performance history and compared the Fund’s investment performance during the past one and three years ending December 31, 2018 to the performance of funds in the Broadridge performance universe and against the Lipper InternationalMulti-Cap Growth Funds Index. The Board noted that performance of Class A shares of the Fund was in the fifth quintile of its performance universe for the one year period and the second quintile for the three year period (the first quintile being the best performing funds and the fifth quintile being the worst performing funds). The Board noted that performance of Class A shares of the Fund was below the performance of the Index for the one year period and above the performance of the Index for the three year period. The Board noted that the Fund’s holdings in and overweight
25 Invesco International Select Equity Fund
exposure to certain sectors and regions negatively impacted performance. The Trustees also reviewed more recent Fund performance and this review did not change their conclusions.
| C. | Advisory andSub-Advisory Fees and Fund Expenses |
The Board compared the Fund’s contractual management fee rate to the contractual management fee rates of funds in the Fund’s Broadridge expense group. The Board noted that the contractual management fee rate for Class A shares of the Fund was above the median contractual management fee rate of funds in its expense group. The Board noted that the term “contractual management fee” for funds in the expense group may include both advisory and certainnon-portfolio management administrative services fees, but that Broadridge does not provide information on a fund by fund basis as to what is included. The Board also reviewed the methodology used by Broadridge in providing expense group information, which includes using each fund’s contractual management fee schedule (including any applicable breakpoints) as reported in the most recent prospectus or statement of additional information for each fund in the expense group. The Board also considered comparative information regarding the Fund’s total expense ratio and its various components. The Board noted that the Fund’s contractual management fees were in the fourth quintile of its expense group and discussed with management reasons for such relative contractual management fees.
The Board noted that Invesco Advisers has contractually agreed to waive fees and/or limit expenses of the Fund for the term disclosed in the Fund’s registration statement in an amount necessary to limit total annual operating expenses to a specified percentage of average daily net assets for each class of the Fund.
The Board also considered the fees charged by Invesco Advisers and the AffiliatedSub-Advisers to other similarly managed client accounts. The Board noted that Invesco Advisers or the AffiliatedSub-Advisers may charge lower fees to large institutional clients. Invesco Advisers reviewed with the Board differences in the scope of services it provides to the Invesco Funds relative to certain other types of client accounts, including management of cash flows as a result of redemptions and purchases, necessary infrastructure such as officers, office space, technology, legal and distribution, oversight of service providers, costs and business risks associated with launching new funds and sponsoring and maintaining the product line, preparation of annual registration statement updates and financial information and compliance with federal and state laws and regulations.
The Board also considered the services that may be provided by the AffiliatedSub-Advisers pursuant to thesub-advisory contracts, as well as the fees payable by Invesco Advisers to the
AffiliatedSub-Advisers pursuant to thesub-advisory contracts. The Board noted that Invesco Advisers retains overall responsibility for, and provides services to,sub-advised Invesco Funds, including oversight of the AffiliatedSub-Advisers as well as the additional services described herein other thanday-to-day portfolio management.
| D. | Economies of Scale and Breakpoints |
The Board considered the extent to which there may be economies of scale in the provision of advisory services to the Fund. The Board considered Invesco’s reinvestment in its business, including investments in business infrastructure and cybersecurity. The Board also considered that the Fund may benefit from economies of scale through contractual breakpoints in the Fund’s advisory fee schedule, which generally operate to reduce the Fund’s expense ratio as it grows in size. The Board noted that the Fund shares directly in economies of scale through lower fees charged by third party service providers based on the combined size of the Invesco Funds. The Board noted that the Fund may also benefit from economies of scale through initial fee setting, fee waivers and expense reimbursements.
| E. | Profitability and Financial Resources |
The Board reviewed information from Invesco Advisers concerning the costs of the advisory and other services that Invesco Advisers and its affiliates provide to the Fund and the Invesco Funds and the profitability of Invesco Advisers and its affiliates in providing these services. The Board considered the methodology used for calculating profitability and noted the periodic review of such methodology by an independent consultant. The Board noted that Invesco Advisers continues to operate at a net profit from services Invesco Advisers and its affiliates provide to the Invesco Funds and the Fund. The Board did not deem the level of profits realized by Invesco Advisers and its affiliates from providing services to the Fund to be excessive given the nature, extent and quality of the services provided. The Board received information from Invesco Advisers demonstrating that Invesco Advisers and the AffiliatedSub-Advisers are financially sound and have the resources necessary to perform their obligations under the investment advisory agreement andsub-advisory contracts.
| F. | Collateral Benefits to Invesco Advisers and its Affiliates |
The Board considered various other benefits received by Invesco Advisers and its affiliates from the relationship with the Fund, including the fees received for providing administrative, transfer agency and distribution services to the Fund. The Board considered comparative information regarding fees charged for these services, including information provided by Broadridge and other independent sources. The Board considered the performance of Invesco Advisers and its affiliates in providing these services and the organizational structure employed to provide these services. The Board
also considered that these services are provided to the Fund pursuant to written contracts that are reviewed and approved on an annual basis by the Board; and that the services are required for the operation of the Fund.
The Board considered the benefits realized by Invesco Advisers and the AffiliatedSub-Advisers as a result of portfolio brokerage transactions executed through “soft dollar” arrangements. The Board noted that soft dollar arrangements may result in the Fund bearing costs to purchase research that may be used by Invesco Advisers or the AffiliatedSub-Advisers with other clients and may reduce Invesco Advisers’ or the AffiliatedSub-Advisers’ expenses. The Board also considered that it receives periodic reports from Invesco representing that these arrangements are consistent with regulatory requirements. The Board did not deem the soft dollar arrangements to be inappropriate.
The Board considered that the Fund’s uninvested cash and cash collateral from any securities lending arrangements may be invested in money market funds advised by Invesco Advisers pursuant to procedures approved by the Board. The Board considered information regarding the returns of the affiliated money market funds relative to comparable overnight investments, as well as the costs to the Fund of such investments. The Board noted that Invesco Advisers receives advisory fees from these affiliated money market funds attributable to such investments, although Invesco Advisers has contractually agreed to waive through varying periods the advisory fees payable by the Invesco Funds with respect to certain investments in the affiliated money market funds. The waiver is in an amount equal to 100% of the net advisory fee Invesco Advisers receives from the affiliated money market funds with respect to the Fund’s investment in the affiliated money market funds of uninvested cash, but not cash collateral. The Board concluded that the amount of advisory fees received by Invesco Advisers from the Fund’s investment of cash collateral from any securities lending arrangements in the affiliated money market funds is fair and reasonable.
The Board also considered that an affiliated broker may receive commissions for executing certain trades for the Fund. Invesco Advisers and the AffiliatedSub-Advisers may use the affiliated broker to, among other things, control order routing and minimize information leakage, and the Board was advised that such trades are executed in compliance with rules under the federal securities laws and consistent with best execution obligations.
26 Invesco International Select Equity Fund
Tax Information
Form1099-DIV, Form1042-S and otheryear-end tax information provide shareholders with actual calendar year amounts that should be included in their tax returns. Shareholders should consult their tax advisors.
The following distribution information is being provided as required by the Internal Revenue Code or to meet a specific state’s requirement.
The Fund designates the following amounts or, if subsequently determined to be different, the maximum amount allowable for its fiscal year ended October 31, 2019:
| | | | | | |
| | | | | | |
| | Federal and State Income Tax | | | | |
| | Long-Term Capital Gain Distributions | | $ | 6,273,329 | |
| | Qualified Dividend Income* | | | 96.94 | % |
| | Corporate Dividends Received Deduction* | | | 0.00 | % |
| | U.S. Treasury Obligations* | | | 0.00 | % |
| | * | The above percentages are based on ordinary income dividends paid to shareholders during the Fund’s fiscal year. |
| | | | | | |
| | | | | | |
| | Non-Resident Alien Shareholders | | | | |
| | Qualified Interest Income | | | 0.00 | % |
27 Invesco International Select Equity Fund
Trustees and Officers
The address of each trustee and officer is AIM International Mutual Funds (Invesco International Mutual Funds) (the “Trust”), 11 Greenway Plaza, Suite 1000, Houston, Texas 77046-1173. The trustees serve for the life of the Trust, subject to their earlier death, incapacitation, resignation, retirement or removal as more specifically provided in the Trust’s organizational documents. Each officer serves for a one year term or until their successors are elected and qualified. Column two below includes length of time served with predecessor entities, if any.
| | | | | | | | |
Name, Year of Birth and Position(s) Held with the Trust | | Trustee and/or Officer Since | | Principal Occupation(s) During Past 5 Years | | Number of Funds in Fund Complex Overseen by Trustee | | Other Directorship(s) Held by Trustee During Past 5 Years |
| | | |
| Interested Persons | | | | |
Martin L. Flanagan1 –1960 Trustee and Vice Chair | | 2007 | | Executive Director, Chief Executive Officer and President, Invesco Ltd. (ultimate parent of Invesco and a global investment management firm); Trustee and Vice Chair, The Invesco Funds; Vice Chair, Investment Company Institute; and Member of Executive Board, SMU Cox School of Business Formerly: Advisor to the Board, Invesco Advisers, Inc. (formerly known as Invesco Institutional (N.A.), Inc.); Chairman and Chief Executive Officer, Invesco Advisers, Inc. (registered investment adviser); Director, Chairman, Chief Executive Officer and President, Invesco Holding Company (US), Inc. (formerly IVZ Inc.) (holding company), Invesco Group Services, Inc. (service provider) and Invesco North American Holdings, Inc. (holding company); Director, Chief Executive Officer and President, Invesco Holding Company Limited (parent of Invesco and a global investment management firm); Director, Invesco Ltd.; Chairman, Investment Company Institute and President,Co-Chief Executive Officer,Co-President, Chief Operating Officer and Chief Financial Officer, Franklin Resources, Inc. (global investment management organization) | | 229 | | None |
Philip A. Taylor2 – 1954 Trustee | | 2006 | | Vice Chair, Invesco Ltd.; Trustee, The Invesco Funds Formerly: Director, Invesco Canada Ltd. (formerly known as Invesco Trimark Ltd./Invesco Trimark Ltèe) (registered investment adviser and registered transfer agent); Head of the Americas and Senior Managing Director, Invesco Ltd.; Director, Invesco Advisers, Inc. (formerly known as Invesco Institutional (N.A.), Inc.) (registered investment adviser); Director and Chairman, Invesco Investment Services, Inc. (formerly known as Invesco AIM Investment Services, Inc.) (registered transfer agent); Chief Executive Officer, Invesco Corporate Class Inc. (corporate mutual fund company); Chairman and Chief Executive Officer, Invesco Canada Ltd. (formerly known as Invesco Trimark Ltd./Invesco Trimark Ltèe) (registered investment adviser and registered transfer agent); Senior Vice President, The Invesco Funds; Director, Invesco Investment Advisers LLC (formerly known as Van Kampen Asset Management); Director, Chairman, Chief Executive Officer and President, Invesco Management Group, Inc. (formerly known as Invesco AIM Management Group, Inc.) (financial services holding company);Co-Chairman,Co-President andCo-Chief Executive Officer, Invesco Advisers, Inc. (formerly known as Invesco Institutional (N.A.), Inc.) (registered investment adviser); Director, Chief Executive Officer and President, Van Kampen Exchange Corp; President and Principal Executive Officer, The Invesco Funds (other than AIM Treasurer’s Series Trust (Invesco Treasurer’s Series Trust), Short-Term Investments Trust and Invesco Management Trust); Executive Vice President, The Invesco Funds (AIM Treasurer’s Series Trust (Invesco Treasurer’s Series Trust), Short-Term Investments Trust and Invesco Management Trust only); Director and President, INVESCO Funds Group, Inc. (registered investment adviser and registered transfer agent); Director and Chairman, IVZ Distributors, Inc. (formerly known as INVESCO Distributors, Inc.) (registered broker dealer); Director, President and Chairman, Invesco Inc. (holding company), Invesco Canada Holdings Inc. (holding company), Trimark Investments Ltd./Placements Trimark Ltèe and Invesco Financial Services Ltd/Services Financiers Invesco Ltèe; Chief Executive Officer, Invesco Canada Fund Inc. (corporate mutual fund company); Director and Chairman, Van Kampen Investor Services Inc.; Director, Chief Executive Officer and President, 1371 Preferred Inc. (holding company) and Van Kampen Investments Inc.; Director and President, AIM GP Canada Inc. (general partner for limited partnerships) and Van Kampen Advisors, Inc.; Director and Chief Executive Officer, Invesco Trimark Dealer Inc. (registered broker dealer); Director, Invesco Distributors, Inc. (formerly known as Invesco AIM Distributors, Inc.) (registered broker dealer); Manager, Invesco Capital Management LLC; Director, Chief Executive Officer and President, Invesco Advisers, Inc.; Director, Chairman, Chief Executive Officer and President, Invesco AIM Capital Management, Inc.; President, Invesco Trimark Dealer Inc. and Invesco Trimark Ltd./Invesco Trimark Ltèe; Director and President, AIM Trimark Corporate Class Inc. and AIM Trimark Canada Fund Inc.; Senior Managing Director, Invesco Holding Company Limited; Director and Chairman, Fund Management Company (former registered broker dealer); President and Principal Executive Officer, The Invesco Funds (AIM Treasurer’s Series Trust (Invesco Treasurer’s Series Trust), and Short-Term Investments Trust only); President, AIM Trimark Global Fund Inc. and AIM Trimark Canada Fund Inc. | | 229 | | None |
| 1 | Mr. Flanagan is considered an interested person (within the meaning of Section 2(a)(19) of the 1940 Act) of the Trust because he is an officer of the Adviser to the Trust, and an officer and a director of Invesco Ltd., ultimate parent of the Adviser. |
| 2 | Mr. Taylor is considered an interested person (within the meaning of Section 2(a)(19) of the 1940 Act) of the Trust because he is an officer and a director of the Adviser. |
T-1 Invesco International Select Equity Fund
Trustees and Officers–(continued)
| | | | | | | | |
Name, Year of Birth and Position(s) Held with the Trust | | Trustee and/or Officer Since | | Principal Occupation(s) During Past 5 Years | | Number of Funds in Fund Complex Overseen by Trustee | | Other Directorship(s) Held by Trustee During Past 5 Years |
| | | | | |
| Independent Trustees | | | | | | | | |
Bruce L. Crockett – 1944 Trustee and Chair | | 1992 | | Chairman, Crockett Technologies Associates (technology consulting company) Formerly: Director, Captaris (unified messaging provider); Director, President and Chief Executive Officer, COMSAT Corporation; Chairman, Board of Governors of INTELSAT (international communications company); ACE Limited (insurance company); Independent Directors Council and Investment Company Institute: Member of the Audit Committee, Investment Company Institute; Member of the Executive Committee and Chair of the Governance Committee, Independent Directors Council | | 229 | | Director and Chairman of the Audit Committee, ALPS (Attorneys Liability Protection Society) (insurance company); Director and Member of the Audit Committee and Compensation Committee, Ferroglobe PLC (metallurgical company) |
David C. Arch – 1945 Trustee | | 2010 | | Chairman of Blistex Inc. (consumer health care products manufacturer); Member, World Presidents’ Organization | | 229 | | Board member of the Illinois Manufacturers’ Association |
Beth Ann Brown – 1968 Trustee | | 2019 | | Independent Consultant Formerly: Head of Intermediary Distribution, Managing Director, Strategic Relations, Managing Director, Head of National Accounts, Senior Vice President, National Account Manager and Senior Vice President, Key Account Manager, Columbia Management Investment Advisers LLC; Vice President, Key Account Manager, Liberty Funds Distributor, Inc.; and Trustee of certain Oppenheimer Funds | | 229 | | Director, Board of Directors of Caron Engineering Inc.; President and Director, Acton Shapleigh Youth Conservation Corps (non - profit); and Vice President and Director of Grahamtastic Connection(non-profit) |
Jack M. Fields – 1952 Trustee | | 1997 | | Chief Executive Officer, Twenty First Century Group, Inc. (government affairs company); and Chairman, Discovery Learning Alliance(non-profit) Formerly: Owner and Chief Executive Officer, Dos Angeles Ranch L.P. (cattle, hunting, corporate entertainment); Director, Insperity, Inc. (formerly known as Administaff) (human resources provider); Chief Executive Officer, Texana Timber LP (sustainable forestry company); Director of Cross Timbers Quail Research Ranch(non-profit); and member of the U.S. House of Representatives | | 229 | | None |
Cynthia Hostetler – 1962 Trustee | | 2017 | | Non-Executive Director and Trustee of a number of public and private business corporations Formerly: Director, Aberdeen Investment Funds (4 portfolios); Head of Investment Funds and Private Equity, Overseas Private Investment Corporation; President, First Manhattan Bancorporation, Inc.; Attorney, Simpson Thacher & Bartlett LLP | | 229 | | Vulcan Materials Company (construction materials company); Trilinc Global Impact Fund; Genesee & Wyoming, Inc. (railroads); Artio Global Investment LLC (mutual fund complex); Edgen Group, Inc. (specialized energy and infrastructure products distributor); Investment Company Institute (professional organization); Independent Directors Council (professional organization) |
T-2 Invesco International Select Equity Fund
Trustees and Officers–(continued)
| | | | | | | | |
Name, Year of Birth and Position(s) Held with the Trust | | Trustee and/or Officer Since | | Principal Occupation(s) During Past 5 Years | | Number of Funds in Fund Complex Overseen by Trustee | | Other Directorship(s) Held by Trustee During Past 5 Years |
| | | |
| Independent Trustees–(continued) | | | | |
Eli Jones – 1961 Trustee | | 2016 | | Professor and Dean, Mays Business School - Texas A&M University Formerly: Professor and Dean, Walton College of Business, University of Arkansas and E.J. Ourso College of Business, Louisiana State University; Director, Arvest Bank | | 229 | | Insperity, Inc. (formerly known as Administaff) (human resources provider) |
Elizabeth Krentzman – 1959 Trustee | | 2019 | | Formerly: Principal and Chief Regulatory Advisor for Asset Management Services and U.S. Mutual Fund Leader of Deloitte & Touche LLP; General Counsel of the Investment Company Institute (trade association); National Director of the Investment Management Regulatory Consulting Practice, Principal, Director and Senior Manager of Deloitte & Touche LLP; Assistant Director of the Division of Investment Management - Office of Disclosure and Investment Adviser Regulation of the U.S. Securities and Exchange Commission and various positions with the Division of Investment Management - Office of Regulatory Policy of the U.S. Securities and Exchange Commission; Associate at Ropes & Gray LLP; Advisory Board Member of the Securities and Exchange Commission Historical Society; and Trustee of certain Oppenheimer Funds | | 229 | | Trustee of the University of Florida National Board Foundation and Audit Committee Member; Member of the Cartica Funds Board of Directors (private investment funds); Member of the University of Florida Law Center Association, Inc. Board of Trustees and Audit Committee Member |
Anthony J. LaCava, Jr. – 1956 Trustee | | 2019 | | Formerly: Director and Member of the Audit Committee, Blue Hills Bank (publicly traded financial institution) and Managing Partner, KPMG LLP | | 229 | | Blue Hills Bank; Chairman, Bentley University; Member, Business School Advisory Council; and Nominating Committee KPMG LLP |
Prema Mathai-Davis – 1950 Trustee | | 1998 | | Retired Co-Owner & Partner of Quantalytics Research, LLC, (a FinTech Investment Research Platform for the Self-Directed Investor) | | 229 | | None |
Joel W. Motley – 1952 Trustee | | 2019 | | Director of Office of Finance, Federal Home Loan Bank; Member of the Vestry of Trinity Wall Street; Managing Director of Carmona Motley Inc. (privately held financial advisor); Member of the Finance and Budget Committee of the Council on Foreign Relations, Member of the Investment Committee and Board of Human Rights Watch and Member of the Investment Committee and Board of Historic Hudson Valley(non-profit cultural organization) Formerly: Managing Director of Public Capital Advisors, LLC (privately held financial advisor); Managing Director of Carmona Motley Hoffman, Inc. (privately held financial advisor); Trustee of certain Oppenheimer Funds; and Director of Columbia Equity Financial Corp. (privately held financial advisor) | | 229 | | Director of Greenwall Foundation (bioethics research foundation); Member of Board and Investment Committee of The Greenwall Foundation; Director of Southern Africa Legal Services Foundation; Board Member and Investment Committee Member of Pulizer Center for Crisis Reporting(non-profit journalism) |
Teresa M. Ressel – 1962 Trustee | | 2017 | | Non-executive director and trustee of a number of public and private business corporations Formerly: Chief Financial Officer, Olayan America, The Olayan Group (international investor/commercial/industrial); Chief Executive Officer, UBS Securities LLC; Group Chief Operating Officer, Americas, UBS AG; Assistant Secretary for Management & Budget and CFO, US Department of the Treasury | | 229 | | Atlantic Power Corporation (power generation company); ON Semiconductor Corp. (semiconductor supplier) |
T-3 Invesco International Select Equity Fund
Trustees and Officers–(continued)
| | | | | | | | |
Name, Year of Birth and Position(s) Held with the Trust | | Trustee and/or Officer Since | | Principal Occupation(s) During Past 5 Years | | Number of Funds in Fund Complex Overseen by Trustee | | Other Directorship(s) Held by Trustee During Past 5 Years |
| | | |
| Independent Trustees–(continued) | | | | |
Ann Barnett Stern – 1957 Trustee | | 2017 | | President and Chief Executive Officer, Houston Endowment Inc. (private philanthropic institution) Formerly: Executive Vice President and General Counsel, Texas Children’s Hospital; Attorney, Beck, Redden and Secrest, LLP; Business Law Instructor, University of St. Thomas; Attorney, Andrews & Kurth LLP | | 229 | | Federal Reserve Bank of Dallas |
Raymond Stickel, Jr. – 1944 Trustee | | 2005 | | Retired Formerly: Director, Mainstay VP Series Funds, Inc. (25 portfolios); Partner, Deloitte & Touche | | 229 | | None |
Robert C. Troccoli – 1949 Trustee | | 2016 | | Retired Formerly: Adjunct Professor, University of Denver – Daniels College of Business; Senior Partner, KPMG LLP | | 229 | | None |
Daniel S. Vandivort – 1954 Trustee | | 2019 | | Treasurer, Chairman of the Audit and Finance Committee, and Trustee, Board of Trustees, Huntington Disease Foundation of America; and President, Flyway Advisory Services LLC (consulting and property management) Formerly: Trustee and Governance Chair, of certain Oppenheimer Funds | | 229 | | Chairman and Lead Independent Director, Chairman of the Audit Committee, and Director, Board of Directors, Value Line Funds |
| James D. Vaughn – 1945 Trustee | | 2019 | | Retired Formerly: Managing Partner, Deloitte & Touche LLP; Trustee and Chairman of the Audit Committee, Schroder Funds; Board Member, Mile High United Way, Boys and Girls Clubs, Boy Scouts, Colorado Business Committee for the Arts, Economic Club of Colorado and Metro Denver Network (economic development corporation); and Trustee of certain Oppenheimer Funds | | 229 | | Board member and Chairman of Audit Committeeof AMG National Trust Bank; Trustee and Investment Committee member, University of South Dakota Foundation; Board member, Audit Committee Member and past Board Chair, Junior Achievement(non-profit) |
Christopher L. WIlson – 1957 Trustee, Vice Chair and Chair Designate | | 2017 | | Retired Formerly: Director, TD Asset Management USA Inc. (mutual fund complex) (22 portfolios); Managing Partner, CT2, LLC (investing and consulting firm); President/Chief Executive Officer, Columbia Funds, Bank of America Corporation; President/Chief Executive Officer, CDC IXIS Asset Management Services, Inc.; Principal & Director of Operations, Scudder Funds, Scudder, Stevens & Clark, Inc.; Assistant Vice President, Fidelity Investments | | 229 | | ISO New England, Inc.(non-profit organization managing regional electricity market) |
T-4 Invesco International Select Equity Fund
Trustees and Officers–(continued)
| | | | | | | | |
Name, Year of Birth and Position(s) Held with the Trust | | Trustee and/or Officer Since | | Principal Occupation(s) During Past 5 Years | | Number of Funds in Fund Complex Overseen by Trustee | | Other Directorship(s) Held by Trustee During Past 5 Years |
| | | |
| Other Officers | | | | |
Sheri Morris – 1964 President, Principal Executive Officer and Treasurer | | 1999 | | Head of Global Fund Services, Invesco Ltd.; President, Principal Executive Officer and Treasurer, The Invesco Funds; Vice President, Invesco Advisers, Inc. (formerly known as Invesco Institutional (N.A.), Inc.) (registered investment adviser); and Vice President, Invesco Exchange-Traded Fund Trust, Invesco Exchange-Traded Fund Trust II, Invesco India Exchange-Traded Fund Trust, Invesco Actively Managed Exchange-Traded Fund Trust, Invesco Actively Managed Exchange-Traded Commodity Fund Trust and Invesco Exchange-Traded Self-Indexed Fund Trust; and Vice President, OppenheimerFunds, Inc. Formerly: Vice President and Principal Financial Officer, The Invesco Funds; Vice President, Invesco AIM Advisers, Inc., Invesco AIM Capital Management, Inc. and Invesco AIM Private Asset Management, Inc.; Assistant Vice President and Assistant Treasurer, The Invesco Funds and Assistant Vice President, Invesco Advisers, Inc., Invesco AIM Capital Management, Inc. and Invesco AIM Private Asset Management, Inc.; and Treasurer, Invesco Exchange-Traded FundTrust, Invesco Exchange-Traded Fund Trust II, Invesco India Exchange-Traded Fund Trust and Invesco Actively Managed Exchange-Traded Fund Trust | | N/A | | N/A |
Russell C. Burk – 1958 Senior Vice President and Senior Officer | | 2005 | | Senior Vice President and Senior Officer, The Invesco Funds | | N/A | | N/A |
Jeffrey H. Kupor – 1968 Senior Vice President,
Chief Legal Officer and Secretary | | 2018 | | Head of Legal of the Americas, Invesco Ltd.; Senior Vice President and Secretary, Invesco Advisers, Inc. (formerly known as Invesco Institutional (N.A.), Inc.) (registered investment adviser); Senior Vice President and Secretary, Invesco Distributors, Inc. (formerly known as Invesco AIM Distributors, Inc.); Vice President and Secretary, Invesco Investment Services, Inc. (formerly known as Invesco AIM Investment Services, Inc.) Senior Vice President, Chief Legal Officer and Secretary, The Invesco Funds; Secretary and General Counsel, Invesco Investment Advisers LLC (formerly known as Van Kampen Asset Management); Secretary and General Counsel, Invesco Capital Markets, Inc. (formerly known as Van Kampen Funds Inc.) and Chief Legal Officer, Invesco Exchange-Traded Fund Trust, Invesco Exchange-Traded Fund Trust II, Invesco India Exchange-Traded Fund Trust, Invesco Actively Managed Exchange-Traded Fund Trust, Invesco Actively Managed Exchange-Traded Commodity Fund Trust and Invesco Exchange-Traded Self-Indexed Fund Trust; Secretary, Invesco Indexing LLC; Secretary, W.L. Ross & Co., LLC Formerly: Secretary and Vice President, Jemstep, Inc.; Head of Legal, Worldwide Institutional, Invesco Ltd.; Secretary and General Counsel, INVESCO Private Capital Investments, Inc.; Senior Vice President, Secretary and General Counsel, Invesco Management Group, Inc. (formerly known as Invesco AIM Management Group, Inc.); Assistant Secretary, INVESCO Asset Management (Bermuda) Ltd.; Secretary and General Counsel, Invesco Private Capital, Inc.; Assistant Secretary and General Counsel, INVESCO Realty, Inc.; Secretary and General Counsel, Invesco Senior Secured Management, Inc.; and Secretary, Sovereign G./P. Holdings Inc. | | N/A | | N/A |
Andrew R. Schlossberg – 1974 Senior Vice President | | 2019 | | Head of the Americas and Senior Managing Director, Invesco Ltd.; Director and Senior Vice President, Invesco Advisers, Inc. (formerly known as Invesco Institutional (N.A.), Inc.) (registered investment adviser); Director and Chairman, Invesco Investment Services, Inc. (formerly known as Invesco AIM Investment Services, Inc.) (registered transfer agent); Senior Vice President, The Invesco Funds; Director, Invesco Investment Advisers LLC (formerly known as Van Kampen Asset Management); Director, President and Chairman, Invesco Insurance Agency, Inc. Formerly: Director, Invesco UK Limited; Director and Chief Executive, Invesco Asset Management Limited and Invesco Fund Managers Limited; Assistant Vice President, The Invesco Funds; Senior Vice President, Invesco Advisers, Inc. (formerly known as Invesco Institutional (N.A.), Inc.) (registered investment adviser); Director and Chief Executive, Invesco Administration Services Limited and Invesco Global Investment Funds Limited; Director, Invesco Distributors, Inc.; Head of EMEA, Invesco Ltd.; President, Invesco Actively Managed Exchange-Traded Commodity Fund Trust, Invesco Actively Managed Exchange-Traded Fund Trust, Invesco Exchange-Traded Fund Trust, Invesco Exchange-Traded Fund Trust II and Invesco India Exchange-Traded Fund Trust; Managing Director and Principal Executive Officer, Invesco Capital Management LLC | | N/A | | N/A |
T-5 Invesco International Select Equity Fund
Trustees and Officers–(continued)
| | | | | | | | |
Name, Year of Birth and Position(s) Held with the Trust | | Trustee and/or Officer Since | | Principal Occupation(s) During Past 5 Years | | Number of Funds in Fund Complex Overseen by Trustee | | Other Directorship(s) Held by Trustee During Past 5 Years |
| | | |
| Other Officers–(continued) | | | | |
John M. Zerr – 1962 Senior Vice President | | 2006 | | Chief Operating Officer of the Americas; Senior Vice President, Invesco Advisers, Inc. (formerly known as Invesco Institutional (N.A.), Inc.) (registered investment adviser); Senior Vice President, Invesco Distributors, Inc. (formerly known as Invesco AIM Distributors, Inc.); Director and Vice President, Invesco Investment Services, Inc. (formerly known as Invesco AIM Investment Services, Inc.) Senior Vice President, The Invesco Funds; Managing Director, Invesco Capital Management LLC; Director, Invesco Investment Advisers LLC (formerly known as Van Kampen Asset Management); Senior Vice President, Invesco Capital Markets, Inc. (formerly known as Van Kampen Funds Inc.); Manager, Invesco Indexing LLC; Manager, Invesco Specialized Products, LLC; Director and Senior Vice President, Invesco Insurance Agency, Inc.; Member, Invesco Canada Funds Advisory Board; Director, President and Chief Executive Officer, Invesco Corporate Class Inc. (corporate mutual fund company); and Director, Chairman, President and Chief Executive Officer, Invesco Canada Ltd. (formerly known as Invesco Trimark Ltd./Invesco Trimark Ltèe) (registered investment adviser and registered transfer agent) Formerly: Director and Senior Vice President, Invesco Management Group, Inc. (formerly known as Invesco AIM Management Group, Inc.); Secretary and General Counsel, Invesco Management Group, Inc. (formerly known as Invesco AIM Management Group, Inc.); Secretary, Invesco Investment Services, Inc. (formerly known as Invesco AIM Investment Services, Inc.); Chief Legal Officer and Secretary, The Invesco Funds; Secretary and General Counsel, Invesco Investment Advisers LLC (formerly known as Van Kampen Asset Management); Secretary and General Counsel, Invesco Capital Markets, Inc. (formerly known as Van Kampen Funds Inc.); Chief Legal Officer, Invesco Exchange-Traded Fund Trust, Invesco Exchange-Traded Fund Trust II, Invesco India Exchange-Traded Fund Trust, Invesco Actively Managed Exchange-Traded Fund Trust, Invesco Actively Managed Exchange-Traded Commodity Fund Trust and Invesco Exchange-Traded Self-Indexed Fund Trust; Secretary, Invesco Indexing LLC; Director, Secretary, General Counsel and Senior Vice President, Van Kampen Exchange Corp.; Director, Vice President and Secretary, IVZ Distributors, Inc. (formerly known as INVESCO Distributors, Inc.); Director and Vice President, INVESCO Funds Group, Inc.; Director and Vice President, Van Kampen Advisors Inc.; Director, Vice President, Secretary and General Counsel, Van Kampen Investor Services Inc.; Director and Secretary, Invesco Distributors, Inc. (formerly known as Invesco AIM Distributors, Inc.); Director, Senior Vice President, General Counsel and Secretary, Invesco AIM Advisers, Inc. and Van Kampen Investments Inc.; Director, Vice President and Secretary, Fund Management Company; Director, Senior Vice President, Secretary, General Counsel and Vice President, Invesco AIM Capital Management, Inc.; Chief Operating Officer and General Counsel, Liberty Ridge Capital, Inc. (an investment adviser) | | N/A | | N/A |
Gregory G. McGreevey – 1962 Senior Vice President | | 2012 | | Senior Managing Director, Invesco Ltd.; Director, Chairman, President, and Chief Executive Officer, Invesco Advisers, Inc. (formerly known as Invesco Institutional (N.A.), Inc.) (registered investment adviser); Director, Invesco Mortgage Capital, Inc. and Invesco Senior Secured Management, Inc.; and Senior Vice President, The Invesco Funds; and President, SNW Asset Management Corporation Formerly: Senior Vice President, Invesco Management Group, Inc. and Invesco Advisers, Inc.; Assistant Vice President, The Invesco Funds | | N/A | | N/A |
Kelli Gallegos – 1970 Vice President, Principal Financial Officer and Assistant Treasurer | | 2008 | | Principal Financial and Accounting Officer - Investments Pool, Invesco Specialized Products, LLC; Vice President, Principal Financial Officer and Assistant Treasurer, The Invesco Funds; Principal Financial and Accounting Officer – Pooled Investments, Invesco Capital Management LLC; Vice President and Treasurer, Invesco Exchange-Traded Fund Trust, Invesco Exchange-Traded Fund Trust II, Invesco India Exchange-Traded Fund Trust, Invesco Actively Managed Exchange-Traded Fund Trust, Invesco Actively Managed Exchange-Traded Commodity Fund Trust and Invesco Exchange-Traded Self-Indexed Fund Trust Formerly: Assistant Treasurer, Invesco Specialized Products, LLC; Assistant Treasurer, Invesco Exchange-Traded Fund Trust, Invesco Exchange-Traded Fund Trust II, Invesco India Exchange-Traded Fund Trust, Invesco Actively Managed Exchange-Traded Fund Trust, Invesco Actively Managed Exchange-Traded Commodity Fund Trust and Invesco Exchange-Traded Self-Indexed Fund Trust; Assistant Treasurer, Invesco Capital Management LLC; Assistant Vice President, The Invesco Funds | | N/A | | N/A |
T-6 Invesco International Select Equity Fund
Trustees and Officers–(continued)
| | | | | | | | |
Name, Year of Birth and Position(s) Held with the Trust | | Trustee and/or Officer Since | | Principal Occupation(s) During Past 5 Years | | Number of Funds in Fund Complex Overseen by Trustee | | Other Directorship(s) Held by Trustee During Past 5 Years |
| | | |
| Other Officers–(continued) | | | | |
Crissie M. Wisdom – 1969 Anti-Money Laundering Compliance Officer | | 2013 | | Anti-Money Laundering Compliance Officer, Invesco Advisers, Inc. (formerly known as Invesco Institutional (N.A.), Inc.) (registered investment adviser), Invesco Capital Markets, Inc. (formerly known as Van Kampen Funds Inc.), Invesco Distributors, Inc., Invesco Investment Services, Inc., The Invesco Funds, and Invesco Exchange-Traded Fund Trust, Invesco Exchange-Traded Fund Trust II, Invesco India Exchange-Traded Fund Trust, Invesco Actively Managed Exchange-Traded Fund Trust, Invesco Actively Managed Exchange-Traded Commodity Fund Trust and Invesco Exchange-Traded Self-Indexed Fund Trust; Anti-Money Laundering Compliance Officer and Bank Secrecy Act Officer, INVESCO National Trust Company and Invesco Trust Company; and Fraud Prevention Manager and Controls and Risk Analysis Manager for Invesco Investment Services, Inc. Formerly: Anti-Money Laundering Compliance Officer, Van Kampen Exchange Corp. and Invesco Management Group, Inc. | | N/A | | N/A |
Robert R. Leveille – 1969 Chief Compliance Officer | | 2016 | | Chief Compliance Officer, Invesco Advisers, Inc. (registered investment adviser); and Chief Compliance Officer, The Invesco Funds Formerly: Chief Compliance Officer, Putnam Investments and the Putnam Funds | | N/A | | N/A |
The Statement of Additional Information of the Trust includes additional information about the Fund’s Trustees and is available upon request, without charge, by calling 1.800.959.4246. Please refer to the Fund’s Statement of Additional Information for information on the Fund’ssub-advisers.
| | | | | | |
| Office of the Fund | | Investment Adviser | | Distributor | | Auditors |
| 11 Greenway Plaza, Suite 1000 | | Invesco Advisers, Inc. | | Invesco Distributors, Inc. | | PricewaterhouseCoopers LLP |
| Houston, TX 77046-1173 | | 1555 Peachtree Street, N.E. | | 11 Greenway Plaza, Suite 1000 | | 1000 Louisiana Street, Suite 5800 |
| | Atlanta, GA 30309 | | Houston, TX 77046-1173 | | Houston, TX 77002-5678 |
| | | |
| Counsel to the Fund | | Counsel to the Independent Trustees | | Transfer Agent | | Custodian |
| Stradley Ronon Stevens & Young, LLP | | Goodwin Procter LLP | | Invesco Investment Services, Inc. | | State Street Bank and Trust Company |
| 2005 Market Street, Suite 2600 | | 901 New York Avenue, N.W. | | 11 Greenway Plaza, Suite 1000 | | 225 Franklin Street |
| Philadelphia, PA 19103-7018 | | Washington, D.C. 20001 | | Houston, TX 77046-1173 | | Boston, MA 02110-2801 |
T-7 Invesco International Select Equity Fund
(This page intentionally left blank)

Go paperless with eDelivery
Visit invesco.com/edelivery to enjoy the convenience and security of anytime electronic access to your investment documents.
With eDelivery, you can elect to have any or all of the following materials delivered straight to your inbox to download, save and print from your own computer:
∎ Fund reports and prospectuses
∎ Quarterly statements
∎ Daily confirmations
∎ Tax forms
Invesco mailing information
Send general correspondence to Invesco Investment Services, Inc., P.O. Box 219078, Kansas City, MO 64121-9078.
Important notice regarding delivery of security holder documents
To reduce Fund expenses, only one copy of most shareholder documents may be mailed to shareholders with multiple accounts at the same address (Householding). Mailing of your shareholder documents may be householded indefinitely unless you instruct us otherwise. If you do not want the mailing of these documents to be combined with those for other members of your household, please contact Invesco Investment Services, Inc. at 800 959 4246 or contact your financial institution. We will begin sending you individual copies for each account within 30 days after receiving your request.
Fund holdings and proxy voting information
The Fund provides a complete list of its holdings four times in each fiscal year, at the quarter-ends. For the second and fourth quarters, the list appears in the Fund’s semiannual and annual reports to shareholders. For the first and third quarters, the Fund files the lists with the Securities and Exchange Commission (SEC) as an exhibit to its reports on FormN-PORT. The most recent list of portfolio holdings is available at invesco.com/completeqtrholdings. Shareholders can also look up the Fund’s FormN-PORT filings on the SEC website, sec.gov. The SEC file numbers for the Fund are shown below.
A description of the policies and procedures that the Fund uses to determine how to vote proxies relating to portfolio securities is available without charge, upon request, from our Client Services department at 800 959 4246, or at invesco.com/ proxyguidelines. The information is also available on the SEC website, sec.gov.
| | |
Information regarding how the Fund voted proxies related to its portfolio securities during the most recent12-month period ended June 30 is available at invesco.com/proxysearch. This information is also available on the SEC website, sec.gov. Invesco Advisers, Inc. is an investment adviser; it provides investment advisory services to individual and institutional clients and does not sell securities. Invesco Distributors, Inc. is the US distributor for Invesco Ltd.’s retail mutual funds, exchange-traded funds and institutional money market funds. Both are wholly owned, indirect subsidiaries of Invesco Ltd. | | |
| | | | |
| SEC file numbers:811-06463 and033-44611 | | Invesco Distributors, Inc. | | ICO-AR-1 |
| | | | | | |
| | | | |
 | | Annual Report to Shareholders | | October 31, 2019 | | |
| | | | |
| | Invesco Select Opportunities Fund | | |
| | Nasdaq: | | |
| | A: IZSAX∎ C: IZSCX∎ R: IZSRX∎ Y: IZSYX∎ R5: IZSIX∎ R6: IZFSX | | |

Beginning on January 1, 2021, as permitted by regulations adopted by the Securities and Exchange Commission, paper copies of the Fund’s shareholder reports will no longer be sent by mail, unless you specifically request paper copies of the reports from the Fund or from your financial intermediary, such as a broker-dealer or bank. Instead, the reports will be made available on the Fund’s website, and you will be notified by mail each time a report is posted and provided with a website link to access the report. If you already elected to receive shareholder reports electronically, you will not be affected by this change and you need not take any action. You may elect to receive shareholder reports and other communications from the Fund electronically by contacting your financial intermediary (such as a broker-dealer or bank) or, if you are a direct investor, by enrolling at invesco.com/edelivery. You may elect to receive all future reports in paper free of charge. If you invest through a financial intermediary, you can contact your financial intermediary to request that you continue to receive paper copies of your shareholder reports. If you invest directly with the Fund, you can call (800)959-4246 to let the Fund know you wish to continue receiving paper copies of your shareholder reports. Your election to receive reports in paper will apply to all funds held with your financial intermediary or all funds held with the fund complex if you invest directly with the Fund.
2Letters to Shareholders 4Management’s Discussion 4Performance Summary 6Long-Term Fund Performance 8Supplemental Information 10Schedule of Investments 11Financial Statements 14Financial Highlights 15Notes to Financial Statements 21Report of Independent Registered Public Accounting Firm 22Fund Expenses 23Approval of Investment Advisory andSub-Advisory Contracts 25Tax InformationT-1Trustees and Officers
| | |
Letters to Shareholders |

Andrew Schlossberg | | Dear Shareholders: This annual report includes information about your Fund, including performance data and a complete list of its investments as of the close of the reporting period. Inside is a discussion of how your Fund was managed and the factors that affected its performance during the reporting period. Despite marked market volatility along the way, most global equity markets produced solid gains for the reporting period. As the reporting period unfolded in the final months of 2018, global equities were reeling from a sharpsell-off. The catalyst for thesell-off was a combination of ongoing trade concerns between the US and China, fears of a global economic slowdown and lower oil prices from a supply glut. Gains posted earlier in 2018 for global equities were erased, while US Treasury bonds, along with government and municipal bonds, rallied as investors fled to “safe haven” assets. |
At the start of 2019, global equity markets rebounded strongly buoyed by more policy from central banks and optimism about a potentialUS-China trade deal. In May,US-China trade concerns and slowing global growth led to a global equitysell-off and rally in US Treasuries. Despite the Maysell-off, domestic equity markets rallied in June in anticipation of a US Federal Reserve (the Fed) interest rate cut and closed the second quarter with modest gains. ContinuedUS-China trade worries and signs of slowing global economic growth left global equity markets largely flat for the third quarter. As the reporting period came to a close in October 2019, a raft of upbeat positive corporate earnings results and a US interest rate cut buoyed domestic equity results with some domestic indices recording record highs.
The Fed, in fact, both raised and lowered the federal funds rate during the reporting period. Given signs of a strong economy, the Fed raised rates in December 2018. In 2019, however, the Fed altered its outlook on further rate hikes leaving rates unchanged for the first half of the year. In July, the Fed lowered interest rates for the first time in 11 years. It again lowered rates in September and once again in October. As the year continues to unfold, we’ll see how the interplay of interest rates, economic data, geopolitics and a host of other factors affect US and overseas equity and fixed income markets.
Investor uncertainty and market volatility, such as we witnessed during the reporting period, are unfortunate facts of life when it comes to investing. That’s why Invesco encourages investors to work with a professional financial adviser who can stress the importance of starting to save and invest early and the importance of adhering to a disciplined investment plan. A financial adviser who knows your unique financial situation, investment goals and risk tolerance can be an invaluable partner as you seek to achieve your financial goals. He or she can offer a long-term perspective when markets are volatile and time-tested advice and guidance when your financial situation or investment goals change.
Visit our website for more information on your investments
Our website, invesco.com/us, offers a wide range of market insights and investment perspectives. On the website, you’ll find detailed information about our funds, including performance, holdings and portfolio manager commentaries. You can access information about your account by completing a simple, secure online registration. To do so, select “Log In” on the right side of the homepage, and then select “Register for Individual Account Access.”
In addition to the resources accessible on our website and through our mobile app, you can obtain timely updates to help you stay informed about the markets and the economy by connecting with Invesco on Twitter, LinkedIn or Facebook. You can access our blog at blog.invesco.us.com. Our goal is to provide you the information you want, when and where you want it.
Finally, I’m pleased to share with you Invesco’s commitment to both the Principles for Responsible Investment and to considering environmental, social and governance issues in our robust investment process. I invite you to learn more at invesco.com/esg.
Have questions?
For questions about your account, contact an Invesco client services representative at 800 959 4246.
All of us at Invesco look forward to serving your investment management needs. Thank you for investing with us.
Sincerely,

Andrew Schlossberg
Head of the Americas,
Senior Managing Director, Invesco Ltd.
2 Invesco Select Opportunities Fund
| | |

Bruce Crockett | | Dear Shareholders: Among the many important lessons I’ve learned in more than 40 years in a variety of business endeavors is the value of a trusted advocate. As independent chair of the Invesco Funds Board, I can assure you that the members of the Board are strong advocates for the interests of investors in Invesco’s mutual funds. We work hard to represent your interests through oversight of the quality of the investment management services your funds receive and other matters important to your investment, including but not limited to: ∎ Ensuring that Invesco offers a diverse lineup of mutual funds that your financial adviser can use to strive to meet your financial needs as your investment goals change over time. ∎ Monitoring how the portfolio management teams of the Invesco funds are performing in light of changing economic and market conditions. |
| ∎ | Assessing each portfolio management team’s investment performance within the context of the investment strategy described in the fund’s prospectus. |
| ∎ | Monitoring for potential conflicts of interests that may impact the nature of the services that your funds receive. |
We believe one of the most important services we provide our fund shareholders is the annual review of the funds’ advisory and sub-advisory contracts with Invesco Advisers and its affiliates. This review is required by the Investment Company Act of 1940 and focuses on the nature and quality of the services Invesco provides as the adviser to the Invesco funds and the reasonableness of the fees that it charges for those services. Each year, we spend months carefully reviewing information received from Invesco and a variety of independent sources, such as performance and fee data prepared by Lipper, Inc. (a subsidiary of Broadridge Financial Solutions, Inc.), an independent, third-party firm widely recognized as a leader in its field. We also meet with our independent legal counsel and other independent advisers to review and help us assess the information that we have received. Our goal is to assure that you receive quality investment management services for a reasonable fee.
I trust the measures outlined above provide assurance that you have a worthy advocate when it comes to choosing the Invesco Funds.
On behalf of the Board, we look forward to continuing to represent your interests and serving your needs.
Sincerely,

Bruce L. Crockett
Independent Chair
Invesco Funds Board of Trustees
3 Invesco Select Opportunities Fund
Management’s Discussion of Fund Performance
| | |
Performance summary |
For the fiscal year ended October 31, 2019, Class A shares of Invesco Select Opportunities Fund (the Fund), at net asset value (NAV), underperformed the MSCI All Country World Small Cap Index, the Fund’s style-specific benchmark. Your Fund’s long-term performance appears later in this report. |
| | | | |
Fund vs. Indexes | |
Total returns, October 31, 2018 to October 31, 2019, at net asset value (NAV). Performance shown does not include applicable contingent deferred sales charges (CDSC) orfront-end sales charges, which would have reduced performance. | |
Class A Shares | | | -3.42 | % |
Class C Shares | | | -4.17 | |
Class R Shares | | | -3.65 | |
Class Y Shares | | | -3.22 | |
Class R5 Shares | | | -3.15 | |
Class R6 Shares | | | -3.16 | |
MSCI World Indexq(Broad Market Index) | | | 12.69 | |
MSCI All Country World Small Cap Indexq(Style-Specific Index) | | | 8.03 | |
Lipper GlobalSmall/Mid-Cap Funds Classification Average⬛(Peer Group) | | | 7.08 | |
Source(s):qRIMES Technologies Corp.;⬛Lipper Inc. | | | | |
Market conditions and your Fund
The fiscal year began with global equity markets, particularly the US, declining sharply at the end of 2018 amid rising interest rates, a flattening US Treasury yield curve, signaling a possible recession, and concerns that higher inflation could result in a more restrictive monetary policy. Investors also had concerns over the Brexit negotiations, ongoing trade tensions between the US and China, declining oil prices and fears of slowing economic growth, particularly in the eurozone.
After a relatively calm start at the beginning of 2019, global equity markets faced greater volatility in the second quarter, hampered by ongoing US and China trade issues, potential for new tariffs and slowing global economic growth. Global equity markets, particularly China, declined sharply in May 2019, ending a four-month rally. Trade and tariff issues, which were not limited to the US and China, clouded the outlook for many
global economies. Disagreement within the UK about its withdrawal from the European Union increased uncertainty for the UK and eurozone economies. Following better performance in June, most global equity markets managed modest positive returns for the second quarter of 2019, with developed markets generally outperforming emerging markets. China was an exception, declining during the second quarter.
Weakening global economic data and the ongoing US and China trade conflict contributed to higher market volatility in the third quarter of 2019. During the third quarter, data released showed slowing manufacturing activity and declining business investment, which was evidence that trade tensions were stifling economic growth across both developed and emerging markets. Global recession concerns caused a sharp equitysell-off in August 2019 as investors crowded into asset classes perceived as safe havens, including US Treasuries and gold. In September 2019, both the US Federal Re-
serve and European Central Bank cut interest rates, providing a measure of support for risk assets. Growing optimism about a potential trade deal between the US and China also boosted equities in September. However, except for the US and Japan, performance in most regions declined during the third quarter. Uncertainty about the UK’s withdrawal from the European Union continued to weigh on UK and European equities, while political and trade issues affected areas of Latin America and Asia.
Global equity markets gained in October 2019 amid several positive catalysts, including a US interest rate cut, optimism surrounding US and China trade negotiations, and a raft of upbeat corporate results. The UK equity market provided a flat return during October and while domestic politics continued to dominate the region, European markets made modest gains. October was also a positive month for emerging equity markets with all regions recording gains. Despite increased market volatility, global equity indexes, in both developed and emerging markets, ended the fiscal year in positive territory.
Before we discuss the Fund’s results during the fiscal year, it is helpful to briefly explain how we manage the Fund for shareholders. We view ourselves as business people buying businesses, and we consider the purchase of a stock as an ownership interest in a business. We strive to develop a proprietary view of a business throughin-depth, fundamental research that includes careful financial statement analysis and meetings with company management. We then seek to purchase businesses whose stock prices are below what we have calculated to be the true value of the company based on an estimate of its future free cash flows.
Our investment approach focuses on individual businesses rather than market sectors. Therefore, the Fund shares little
| | | | |
Portfolio Composition | |
By sector | | | % of total net assets | |
| | | | |
| |
Information Technology | | | 32.30 | % |
Consumer Discretionary | | | 14.54 | |
Industrials | | | 14.46 | |
Health Care | | | 7.62 | |
Energy | | | 7.52 | |
Materials | | | 7.15 | |
Communication Services | | | 5.14 | |
Financials | | | 4.78 | |
Real Estate | | | 4.50 | |
| Money Market Funds Plus Other Assets Less Liabilities | | | 1.99 | |
| | | | |
Top 10 Equity Holdings* | | | | |
% of total net assets | |
| |
1. Interface, Inc. | | | 6.41 | % |
2. National Veterinary Care Ltd. | | | 5.60 | |
3. Equiniti Group PLC | | | 5.43 | |
4. Nuance Communications, Inc. | | | 5.15 | |
5. Sabre Corp. | | | 5.07 | |
6. GasLog Ltd. | | | 4.86 | |
7. Encore Capital Group, Inc. | | | 4.78 | |
8. Colliers International Group, Inc. | | | 4.50 | |
9. Delphi Technologies PLC | | | 4.40 | |
10. Global Payments, Inc. | | | 4.26 | |
| | | | |
Total Net Assets | | $ | 48.0 million | |
| |
Total Number of Holdings* | | | 30 | |
The Fund’s holdings are subject to change, and there is no assurance that the Fund will continue to hold any particular security.
*Excluding money market fund holdings, if any.
Data presented here are as of October 31, 2019.
4 Invesco Select Opportunities Fund
in common with sector weightings of various market indexes. However, the Fund may, at times, have significant exposure to particular sectors. During the fiscal year, the Fund’s investments in the financials, communication services and consumer discretionary sectors were the largest contributors to the Fund’s absolute performance.
Security selection in the financials and communication services sectors benefited the Fund’s performance relative to the style-specific benchmark during the fiscal year. Conversely, security selection in the information technology (IT) and industrials sectors detracted from the Fund’s relative performance.
During the fiscal year, the top contributors to the Fund’s performance includedGlobal PaymentsandBooz Allen Hamilton.
Global Payments is a leading worldwide provider of payment technology and software solutions. The company serves the financial, corporate, government and merchant communities worldwide. Throughout the fiscal year, Global Payments increased growth prospects by merging with Total System Services (not a Fund holding). The new partnership has created a leading worldwide pure-play payments technology company.
Booz Allen Hamilton is a leading contractor for US government defense and intelligence departments, assisting in the fields of cyber security and intelligence operations. The company provides economic and business analysis, IT, intelligence and operations analysis, modeling and simulation, organization and other consulting services. Booz Allen Hamilton appreciated over the fiscal year by exceeding expectations consistently over several quarters. The company’s growth strategy is based on increasing the technical content of its services, expanding in the commercial and international markets, innovating on its capabilities, and establishing a broad network of external partners and alliances.
The top detractors from the Fund’s performance over the fiscal year wereCommScope andAlliance Data Systems.
CommScope provides connectivity and essential infrastructure solutions for wireless, business enterprise and residential broadband networks. The wireless segment, which accounts for approximately half its business, is CommScope’s specialty. The company provides cellphone tower antennas for wireless carriers to upgrade their wireless speeds for consumers and improve overall coverage
and quality of wireless networks. During the fiscal year, the company’s stock price fell after reporting both weak and mixed quarterly results, followed by management lowering near-term guidance. We believe the company is positioned to benefit from the trend of increasing data-traffic usage. It is a highly cash-flow generative business that is a top provider globally in the markets in which it competes.
Alliance Data Systems provides data-driven and transaction-based marketing and customer loyalty solutions. The company offers a portfolio of integratedout-sourced marketing solutions, including customer loyalty programs, database marketing, consulting, analytics and creative services, email marketing, private label andco-branded retail credit cards. The card services portfolio generates more than half of the company’s revenue. During the fiscal year, shares of Alliance Data Systems fell after it reported weaker-than-expected second quarter results and disappointing third quarter results. The company’s management team has scaled back growth expectations for its card services portfolio, but this is partly due to a desire to focus on a slightly higher credit quality. The shares have been trading at a discount to its peers, despite a long history of a higher return profile.
During the fiscal year, new investments includedInterface,a global commercial flooring company;Delphi Technologies,aUK-based
company that develops, designs and manufactures vehicle propulsion systems;Colliers International Group,a global leader in commercial real estate services; andSIG Combibloc Group,a leading system and solutions provider for aseptic packaging.
Generally, we sell Fund holdings when they reach full valuation; if new, relatively more attractive investment opportunities exist; or if new information changes our thesis on the future of a business. As such, we sold our positions inVicat, DFS Furniture, HollySys Automation TechnologiesandTivobefore the close of the fiscal year.
During the fiscal year, we continued to focus on finding quality businesses we believed were trading at attractive values relative to their long-term prospects. In contrast, the market is often driven by short-term events or outlooks in both good times and bad. Market volatility allows us to take advantage of investment opportunities we believe may benefit the Fund in the long term. While we can never predict future Fund performance,
we pledge to you that we will adhere to our discipline of being business people who buy businesses – and we will continually strive to upgrade the quality of the Fund’s portfolio.
As always, we thank you for your investment in Invesco Select Opportunities Fund and for sharing our long-term investment perspective.
Portfolio managers:
Virginia Au - Lead
Rob Mikalachki
Jason Whiting
The views and opinions expressed in management’s discussion of Fund performance are those of Invesco Advisers, Inc. These views and opinions are subject to change at any time based on factors such as market and economic conditions. These views and opinions may not be relied upon as investment advice or recommendations, or as an offer for a particular security. The information is not a complete analysis of every aspect of any market, country, industry, security or the Fund. Statements of fact are from sources considered reliable, but Invesco Advisers, Inc. makes no representation or warranty as to their completeness or accuracy. Although historical performance is no guarantee of future results, these insights may help you understand our investment management philosophy.
See important Fund and, if applicable, index disclosures later in this report.
5 Invesco Select Opportunities Fund
Your Fund’s Long-Term Performance
Results of a $10,000 Investment – Oldest Share Class(es) since Inception
Fund and index data from 8/3/12
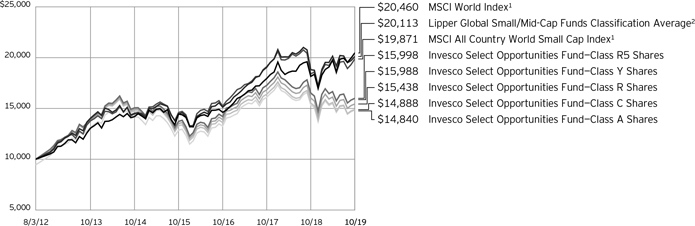
1 Source: RIMES Technologies Corp.
2 Source: Lipper Inc.
Past performance cannot guarantee comparable future results.
The data shown in the chart include reinvested distributions, applicable sales charges and Fund expenses including
management fees. Index results include reinvested dividends, but they do not reflect sales charges. Performance of the peer group, if applicable, reflects fund expenses and management fees; performance
of a market index does not. Performance shown in the chart does not reflect deduction of taxes a shareholder would pay on Fund distributions or sale of Fund shares.
6 Invesco Select Opportunities Fund
| | | | |
| |
Average Annual Total Returns | |
As of 10/31/19, including maximum applicable sales charges | |
| |
Class A Shares | | | | |
Inception (8/3/12) | | | 5.60 | % |
5 Years | | | -0.18 | |
1 Year | | | -8.74 | |
| |
Class C Shares | | | | |
Inception (8/3/12) | | | 5.65 | % |
5 Years | | | 0.21 | |
1 Year | | | -5.09 | |
| |
Class R Shares | | | | |
Inception (8/3/12) | | | 6.18 | % |
5 Years | | | 0.71 | |
1 Year | | | -3.65 | |
| |
Class Y Shares | | | | |
Inception (8/3/12) | | | 6.69 | % |
5 Years | | | 1.22 | |
1 Year | | | -3.22 | |
| |
Class R5 Shares | | | | |
Inception (8/3/12) | | | 6.70 | % |
5 Years | | | 1.21 | |
1 Year | | | -3.15 | |
| |
Class R6 Shares | | | | |
Inception | | | 6.69 | % |
5 Years | | | 1.22 | |
1 Year | | | -3.16 | |
Class R6 shares incepted on September 24, 2012. Performance shown prior to that date is that of Class A shares and includes the12b-1 fees applicable to Class A shares.
The performance data quoted represent past performance and cannot guarantee comparable future results; current performance may be lower or higher. Please visit invesco.com/performance for the most recentmonth-end performance. Performance figures reflect reinvested distributions, changes in net asset value and the effect of the maximum sales charge unless otherwise stated. Performance figures do not reflect deduction of taxes a shareholder would pay on Fund distributions or sale of Fund shares. Investment return and principal value will fluctuate so that you may have a gain or loss when you sell shares.
The net annual Fund operating expense ratio set forth in the most recent Fund prospectus as of the date of this report for Class A, Class C, Class R, Class Y, Class R5 and Class R6 shares was 1.03%, 1.78%, 1.28%, 0.78%, 0.78% and 0.78%, respectively.1 The total annual Fund operating expense ratio set forth in the
| | | | |
| |
Average Annual Total Returns | |
As of 9/30/19, the most recent calendar quarter end, including maximum applicable sales charges | |
| |
Class A Shares | | | | |
Inception (8/3/12) | | | 5.52 | % |
5 Years | | | -0.19 | |
1 Year | | | -16.27 | |
| |
Class C Shares | | | | |
Inception (8/3/12) | | | 5.58 | % |
5 Years | | | 0.19 | |
1 Year | | | -12.83 | |
| |
Class R Shares | | | | |
Inception (8/3/12) | | | 6.10 | % |
5 Years | | | 0.69 | |
1 Year | | | -11.59 | |
| |
Class Y Shares | | | | |
Inception (8/3/12) | | | 6.62 | % |
5 Years | | | 1.21 | |
1 Year | | | -11.15 | |
| |
Class R5 Shares | | | | |
Inception (8/3/12) | | | 6.62 | % |
5 Years | | | 1.19 | |
1 Year | | | -11.20 | |
| |
Class R6 Shares | | | | |
Inception | | | 6.61 | % |
5 Years | | | 1.19 | |
1 Year | | | -11.16 | |
most recent Fund prospectus as of the date of this report for Class A, Class C, Class R, Class Y, Class R5 and Class R6 shares was 1.66%, 2.41%, 1.91%, 1.41%, 1.30% and 1.30%, respectively. The expense ratios presented above may vary from the expense ratios presented in other sections of this report that are based on expenses incurred during the period covered by this report.
Class A share performance reflects the maximum 5.50% sales charge, and Class C share performance reflects the applicable contingent deferred sales charge (CDSC) for the period involved. The CDSC on Class C shares is 1% for the first year after purchase. Class R, Class Y, Class R5 and Class R6 shares do not have afront-end sales charge or a CDSC; therefore, performance is at net asset value.
The performance of the Fund’s share classes will differ primarily due to different sales charge structures and class expenses.
Fund performance reflects any applicable fee waivers and/or expense reimbursements. Had the adviser not waived fees and/or reimbursed expenses currently or in the past, returns
would have been lower. See current prospectus for more information.
| 1 | Total annual Fund operating expenses after any contractual fee waivers and/or expense reimbursements by the adviser in effect through at least February 28, 2021. See current prospectus for more information. |
7 Invesco Select Opportunities Fund
Invesco Select Opportunities Fund’s investment objective is long-term growth of capital.
| ∎ | | Unless otherwise stated, information presented in this report is as of October 31, 2019, and is based on total net assets. |
| ∎ | | Unless otherwise noted, all data provided by Invesco. |
| ∎ | | To access your Fund’s reports/prospectus, visit invesco.com/fundreports. |
About share classes
| ∎ | | Class R sharesare generally available only to employer sponsored retirement and benefit plans. Please see the prospectus for more information. |
| ∎ | | Class Y sharesare available only to certain investors. Please see the prospectus for more information. |
| ∎ | | Class R5 sharesandClass R6 sharesare available for use by retirement plans that meet certain standards and for institutional investors. Class R6 shares are also available through intermediaries that have established an agreement with Invesco Distributors, Inc. to make such shares available for use in retail omnibus accounts. Please see the prospectus for more information. |
Principal risks of investing in the Fund
| ∎ | | Cash/cash equivalents risk.In rising markets, holding cash or cash equivalents will negatively affect the Fund’s performance relative to its benchmark. |
| ∎ | | Convertible securities risk.The market values of convertible securities are affected by market interest rates, the risk of actual issuer default on interest or principal payments and the value of the underlying common stock into which the convertible security may be converted. Additionally, a convertible security is subject to the same types of market and issuer risks as apply to the underlying common stock. In addition, certain convertible securities are subject to involuntary conversions and may undergo principal write-downs upon the occurrence of certain triggering events, and, as a result, are subject to an increased risk of loss. Convertible securities may be rated below investment grade. |
| ∎ | | Debt securities risk.The prices of debt securities held by the Fund will be affected by changes in interest rates, the creditworthiness of the issuer and other factors. An increase in prevailing interest rates typically causes the |
| | value of existing debt securities to fall and often has a greater impact on longer-duration debt securities and higher quality debt securities. Falling interest rates will cause the Fund to reinvest the proceeds of debt securities that have been repaid by the issuer at lower interest rates. Falling interest rates may also reduce the Fund’s distributable income because interest payments on floating rate debt instruments held by the Fund will decline. The Fund could lose money on investments in debt securities if the issuer or borrower fails to meet its obligations to make interest payments and/or to repay principal in a timely manner. Changes in an issuer’s financial strength, the market’s perception of such strength or in the credit rating of the issuer or the security may affect the value of debt securities. The Adviser’s credit analysis may fail to anticipate such changes, which could result in buying a debt security at an inopportune time or failing to sell a debt security in advance of a price decline or other credit event. |
| ∎ | | Depositary receipts risk.Investing in depositary receipts involves the same risks as direct investments in foreign securities. In addition, the underlying issuers of certain depositary receipts are under no obligation to distribute shareholder communications or pass through any voting rights with respect to the deposited securities to the holders of such receipts. The Fund may therefore receive less timely information or have less control than if it invested directly in the foreign issuer. |
| ∎ | | Emerging markets securities risk. Emerging markets (also referred to as developing markets) are generally subject to greater market volatility, political, social and economic instability, uncertain trading markets and more governmental limitations on foreign investment than more developed markets. In addition, companies operating in emerging markets may be subject to lower trading volume and |
| | greater price fluctuations than companies in more developed markets. Securities law and the enforcement of systems of taxation in many emerging market countries may change quickly and unpredictably. In addition, investments in emerging markets securities may be subject to additional transaction costs, delays in settlement procedures, and lack of timely information. |
| ∎ | | Foreign securities risk.The Fund’s foreign investments may be adversely affected by political and social instability, changes in economic or taxation policies, difficulty in enforcing obligations, decreased liquidity or increased volatility. Foreign investments also involve the risk of the possible seizure, nationalization or expropriation of the issuer or foreign deposits (in which the Fund could lose its entire investments in a certain market) and the possible adoption of foreign governmental restrictions such as exchange controls. Unless the Fund has hedged its foreign securities risk, foreign securities risk also involves the risk of negative foreign currency rate fluctuations, which may cause the value of securities denominated in such foreign currency (or other instruments through which the Fund has exposure to foreign currencies) to decline in value. Currency exchange rates may fluctuate significantly over short periods of time. Currency hedging strategies, if used, are not always successful. |
| ∎ | | Geographic focus risk.The Fund may from time to time invest a substantial amount of its assets in securities of issuers located in a single country or a limited number of countries. Adverse economic, political or social conditions in those countries may therefore have a significant negative impact on the Fund’s investment performance. |
| ∎ | | Investing in the European Union risk. Investments in certain countries in the European Union are susceptible to high economic risks associated with high levels of debt, such as investments in sovereign debt of Greece, |
This report must be accompanied or preceded by a currently effective Fund prospectus, which contains more complete information, including sales charges and expenses. Investors should read it carefully before investing.
NOT FDIC INSURED | MAY LOSE VALUE | NO BANK GUARANTEE
8 Invesco Select Opportunities Fund
Italy and Spain. Efforts of the member states to further unify their economic and monetary policies may increase the potential for the downward movement of one member state’s market to cause a similar effect on other member states’ markets. Separately, the European Union faces issues involving its membership, structure, procedures and policies. The exit of one or more member states from the European Union, such as the United Kingdom (UK) which has announced its intention to exit, would place its currency and banking system in jeopardy. The exit by the UK or other member states will likely result in increased volatility, illiquidity and potentially lower economic growth in the affected markets, which will adversely affect the Fund’s investments.
| ∎ | | Limited number of holdings risk.The Fund holds a more limited number of securities than other funds with a similar investment strategy. As a result, each investment has a greater effect on the Fund’s overall performance and any change in the value of these securities could significantly affect the value of your investment in the Fund. |
| ∎ | | Management risk.The Fund is actively managed and depends heavily on the Adviser’s judgment about markets, interest rates or the attractiveness, relative values, liquidity, or potential appreciation of particular investments made for the Fund’s portfolio. The Fund could experience losses if these judgments prove to be incorrect. Additionally, legislative, regulatory, or tax developments may adversely affect management of the Fund and, therefore, the ability of the Fund to achieve its investment objective. |
| ∎ | | Market risk.The market values of the Fund’s investments, and therefore the value of the Fund’s shares, will go up and down, sometimes rapidly or unpredictably. Market risk may affect a single issuer, industry or section of the economy, or it may affect the market as a whole. Individual stock prices tend to go up and down more dramatically than those of certain other types of investments, such as bonds. During a general downturn in the financial markets, multiple asset classes may decline in value. When markets perform well, there can be no assurance that specific investments held by the Fund will rise in value. |
| ∎ | | Preferred securities risk.Preferred securities are subject to issuer-specific |
and market risks applicable generally to equity securities. Preferred securities also may be subordinated to bonds or other debt instruments, subjecting them to a greater risk ofnon-payment, may be less liquid than many other securities, such as common stocks, and generally offer no voting rights with respect to the issuer.
| ∎ | | Sector focus risk.The Fund may from time to time invest a significant amount of its assets (i.e. over 25%) in one market sector or group of related industries. In this event, the Fund’s performance will depend to a greater extent on the overall condition of the sector or group of industries and there is increased risk that the Fund will lose significant value if conditions adversely affect that sector or group of industries. |
| ∎ | | Small- andmid-capitalization companies risks.Small- andmid-capitalization companies tend to be more vulnerable to changing market conditions, may have little or no operating history or track record of success, and may have more limited product lines and markets, less experienced management and fewer financial resources than larger companies. These companies’ securities may be more volatile and less liquid than those of more established companies, and their returns may vary, sometimes significantly, from the overall securities market. |
| ∎ | | US government obligations risk.Obligations of US government agencies and authorities receive varying levels of support and may not be backed by the full faith and credit of the US government, which could affect the Fund’s ability to recover should they default. No assurance can be given that the US government will provide financial support to its agencies and authorities if it is not obligated by law to do so. |
| ∎ | | Value investing style risk.A value investing style subjects the Fund to the risk that the valuations never improve or that the returns on value equity securities are less than returns on other styles of investing or the overall stock market. |
| ∎ | | Warrants risk.Warrants may be significantly less valuable or worthless on their expiration date and may also be postponed or terminated early, resulting in a partial or total loss. Warrants may also be illiquid. |
About indexes used in this report
| ∎ | | TheMSCI World IndexSMis an unmanaged index considered representative of stocks of developed countries. The index is computed using the net return, which withholds applicable taxes fornon-resident investors. |
| ∎ | | TheMSCI All Country World Small Cap Indexis an unmanaged index considered representative ofsmall-cap stocks across developed and emerging market countries. The index is computed using the net return, which withholds applicable taxes fornon-resident investors. |
| ∎ | | TheLipper GlobalSmall/Mid-Cap Funds Classification Averagerepresents an average of all funds in the Lipper GlobalSmall/Mid-Cap Funds classification. |
| ∎ | | The Fund is not managed to track the performance of any particular index, including the index(es) described here, and consequently, the performance of the Fund may deviate significantly from the performance of the index(es). |
| ∎ | | A direct investment cannot be made in an index. Unless otherwise indicated, index results include reinvested dividends, and they do not reflect sales charges. Performance of the peer group, if applicable, reflects fund expenses; performance of a market index does not. |
Other information
| ∎ | | The returns shown in management’s discussion of Fund performance are based on net asset values (NAVs) calculated for shareholder transactions. Generally accepted accounting principles require adjustments to be made to the net assets of the Fund at period end for financial reporting purposes, and as such, the NAVs for shareholder transactions and the returns based on those NAVs may differ from the NAVs and returns reported in the Financial Highlights. |
| ∎ | | Industry classifications used in this report are generally according to the Global Industry Classification Standard, which was developed by and is the exclusive property and a service mark of MSCI Inc. and Standard & Poor’s. |
9 Invesco Select Opportunities Fund
Schedule of Investments
October 31, 2019
| | | | | | | | |
| | | Shares | | | Value | |
Common Stocks & Other Equity Interests-98.01% | |
| Australia-8.56% | |
Corporate Travel Management Ltd. | | | 117,188 | | | $ | 1,418,684 | |
National Veterinary Care Ltd. | | | 1,698,346 | | | | 2,690,702 | |
| | | | | | | | 4,109,386 | |
|
| Canada-4.50% | |
Colliers International Group, Inc. | | | 32,306 | | | | 2,162,887 | |
|
| France-3.88% | |
Ipsos | | | 61,927 | | | | 1,865,151 | |
|
| Germany-2.86% | |
Adesso AG | | | 26,061 | | | | 1,375,291 | |
|
| Hong Kong-3.81% | |
Clear Media Ltd. | | | 189,000 | | | | 86,595 | |
Luk Fook Holdings International Ltd. | | | 658,000 | | | | 1,745,277 | |
| | | | | | | | 1,831,872 | |
|
| Monaco-4.86% | |
GasLog Ltd. | | | 170,336 | | | | 2,335,307 | |
|
| Netherlands-2.66% | |
SBM Offshore N.V. | | | 74,216 | | | | 1,276,716 | |
|
| Poland-3.56% | |
Inter Cars S.A. | | | 33,573 | | | | 1,709,086 | |
|
| Switzerland-3.99% | |
SIG Combibloc Group AG(a) | | | 138,745 | | | | 1,917,943 | |
|
| United Kingdom-10.47% | |
Dechra Pharmaceuticals PLC | | | 28,525 | | | | 972,057 | |
Equiniti Group PLC(b) | | | 934,275 | | | | 2,606,968 | |
Howden Joinery Group PLC | | | 131,413 | | | | 983,161 | |
Inspired Energy PLC | | | 2,522,313 | | | | 465,607 | |
| | | | | | | | 5,027,793 | |
| | | | | | | | |
| | | Shares | | | Value | |
United States-48.86% | |
Alliance Data Systems Corp. | | | 13,713 | | | $ | 1,371,300 | |
Axalta Coating Systems Ltd.(a) | | | 51,389 | | | | 1,515,462 | |
Booz Allen Hamilton Holding Corp. | | | 20,765 | | | | 1,461,233 | |
Cerence, Inc.(a) | | | 17,721 | | | | 274,675 | |
CommScope Holding Co., Inc.(a) | | | 131,435 | | | | 1,472,072 | |
Delphi Technologies PLC | | | 173,119 | | | | 2,113,783 | |
Encore Capital Group, Inc.(a) | | | 69,214 | | | | 2,297,213 | |
Global Payments, Inc. | | | 12,091 | | | | 2,045,555 | |
Interface, Inc. | | | 185,047 | | | | 3,077,332 | |
Liberty Broadband Corp., Class A(a) | | | 4,366 | | | | 515,144 | |
Nuance Communications, Inc.(a) | | | 151,642 | | | | 2,474,797 | |
Performant Financial Corp.(a) | | | 494,586 | | | | 509,424 | |
Regal Beloit Corp. | | | 9,783 | | | | 724,431 | |
Sabre Corp. | | | 103,627 | | | | 2,433,162 | |
Spirit Airlines, Inc.(a) | | | 31,634 | | | | 1,188,173 | |
| | | | | | | | 23,473,756 | |
Total Common Stocks & Other Equity Interests
(Cost $49,903,242) | | | | 47,085,188 | |
Money Market Funds-1.54% | |
Invesco Government & Agency Portfolio, Institutional Class, 1.71%(c) | | | 258,854 | | | | 258,854 | |
Invesco Liquid Assets Portfolio, Institutional Class, 1.90%(c) | | | 185,042 | | | | 185,116 | |
Invesco Treasury Portfolio, Institutional Class, 1.66%(c) | | | 295,834 | | | | 295,834 | |
Total Money Market Funds (Cost $739,799) | | | | 739,804 | |
TOTAL INVESTMENTS IN SECURITIES–99.55%
(Cost $50,643,041) | | | | 47,824,992 | |
OTHER ASSETS LESS LIABILITIES-0.45% | | | | 214,430 | |
NET ASSETS-100.00% | | | $ | 48,039,422 | |
Notes to Schedule of Investments:
| (a) | Non-income producing security. |
| (b) | Security purchased or received in a transaction exempt from registration under the Securities Act of 1933, as amended (the “1933 Act”). The security may be resold pursuant to an exemption from registration under the 1933 Act, typically to qualified institutional buyers. The value of this security at October 31, 2019 represented 5.43% of the Fund’s Net Assets. |
| (c) | The money market fund and the Fund are affiliated by having the same investment adviser. The rate shown is the7-day SEC standardized yield as of October 31, 2019. |
See accompanying Notes to Financial Statements which are an integral part of the financial statements.
10 Invesco Select Opportunities Fund
Statement of Assets and Liabilities
October 31, 2019
| | | | |
Assets: | | | | |
Investments in securities, at value
(Cost $49,903,242) | | $ | 47,085,188 | |
| |
Investments in affiliated money market funds, at value (Cost $739,799) | | | 739,804 | |
| |
Foreign currencies, at value (Cost $23,921) | | | 24,107 | |
| |
Receivable for: | | | | |
Investments sold | | | 221,177 | |
| |
Dividends | | | 26,207 | |
| |
Fund shares sold | | | 6,648 | |
| |
Investment for trustee deferred compensation and retirement plans | | | 20,651 | |
| |
Other assets | | | 31,081 | |
| |
Total assets | | | 48,154,863 | |
| |
| |
Liabilities: | | | | |
Payable for: | | | | |
Fund shares reacquired | | | 15,864 | |
| |
Accrued fees to affiliates | | | 25,795 | |
| |
Accrued trustees’ and officers’ fees and benefits | | | 1,317 | |
| |
Accrued other operating expenses | | | 51,653 | |
| |
Trustee deferred compensation and retirement plans | | | 20,812 | |
| |
Total liabilities | | | 115,441 | |
| |
Net assets applicable to shares outstanding | | $ | 48,039,422 | |
| |
| |
Net assets consist of: | | | | |
Shares of beneficial interest | | $ | 48,643,133 | |
| |
Distributable earnings (loss) | | | (603,711 | ) |
| |
| | $ | 48,039,422 | |
| |
| |
Net Assets: | | | | |
Class A | | $ | 11,008,783 | |
| |
Class C | | $ | 2,590,263 | |
| |
Class R | | $ | 321,014 | |
| |
Class Y | | $ | 34,092,300 | |
| |
Class R5 | | $ | 14,063 | |
| |
Class R6 | | $ | 12,999 | |
| |
| | | | |
Shares outstanding, no par value, with an unlimited number of shares authorized: | |
Class A | | | 794,709 | |
Class C | | | 196,826 | |
Class R | | | 23,525 | |
Class Y | | | 2,427,532 | |
Class R5 | | | 1,001 | |
Class R6 | | | 926 | |
Class A: | | | | |
Net asset value per share | | $ | 13.85 | |
Maximum offering price per share | | | | |
(Net asset value of $13.85 ÷ 94.50%) | | $ | 14.66 | |
Class C: | | | | |
Net asset value and offering price per share | | $ | 13.16 | |
Class R: | | | | |
Net asset value and offering price per share | | $ | 13.65 | |
Class Y: | | | | |
Net asset value and offering price per share | | $ | 14.04 | |
Class R5: | | | | |
Net asset value and offering price per share | | $ | 14.05 | |
Class R6: | | | | |
Net asset value and offering price per share | | $ | 14.04 | |
See accompanying Notes to Financial Statements which are an integral part of the financial statements.
11 Invesco Select Opportunities Fund
Statement of Operations
For the year ended October 31, 2019
| | | | |
Investment income: | | | | |
Dividends (net of foreign withholding taxes of $31,961) | | $ | 784,308 | |
| |
Dividends from affiliated money market funds | | | 24,522 | |
| |
Total investment income | | | 808,830 | |
| |
| |
Expenses: | | | | |
Advisory fees | | | 395,764 | |
| |
Administrative services fees | | | 14,269 | |
| |
Custodian fees | | | 6,772 | |
| |
Distribution fees: | | | | |
Class A | | | 30,702 | |
| |
Class C | | | 38,691 | |
| |
Class R | | | 1,560 | |
| |
Transfer agent fees – A, C, R and Y | | | 99,064 | |
| |
Transfer agent fees – R5 | | | 11 | |
| |
Transfer agent fees – R6 | | | 10 | |
| |
Trustees’ and officers’ fees and benefits | | | 19,947 | |
| |
Registration and filing fees | | | 75,678 | |
| |
Reports to shareholders | | | 14,436 | |
| |
Professional services fees | | | 52,240 | |
| |
Other | | | 10,560 | |
| |
Total expenses | | | 759,704 | |
| |
Less: Fees waived, expenses reimbursed and/or expense offset arrangement(s) | | | (309,129 | ) |
| |
Net expenses | | | 450,575 | |
| |
Net investment income | | | 358,255 | |
| |
| |
Realized and unrealized gain (loss) from: | | | | |
Net realized gain (loss) from: | | | | |
Investment securities | | | 2,136,470 | |
| |
Foreign currencies | | | (96,850 | ) |
| |
| | | 2,039,620 | |
| |
Change in net unrealized appreciation (depreciation) of: | | | | |
Investment securities | | | (3,393,709 | ) |
| |
Foreign currencies | | | 38,605 | |
| |
| | | (3,355,104 | ) |
| |
Net realized and unrealized gain (loss) | | | (1,315,484 | ) |
| |
Net increase (decrease) in net assets resulting from operations | | $ | (957,229 | ) |
| |
See accompanying Notes to Financial Statements which are an integral part of the financial statements.
12 Invesco Select Opportunities Fund
Statement of Changes in Net Assets
For the years ended October 31, 2019 and 2018
| | | | | | | | |
| | | 2019 | | | 2018 | |
| |
Operations: | | | | | | | | |
Net investment income | | $ | 358,255 | | | $ | 171,101 | |
| |
Net realized gain | | | 2,039,620 | | | | 5,400,623 | |
| |
Change in net unrealized appreciation (depreciation) | | | (3,355,104 | ) | | | (7,880,545 | ) |
| |
Net increase (decrease) in net assets resulting from operations | | | (957,229 | ) | | | (2,308,821 | ) |
| |
| | |
Distributions to shareholders from distributable earnings: | | | | | | | | |
Class A | | | (573,902 | ) | | | – | |
| |
Class C | | | (256,083 | ) | | | – | |
| |
Class R | | | (13,600 | ) | | | – | |
| |
Class Y | | | (1,368,466 | ) | | | – | |
| |
Class R5 | | | (744 | ) | | | – | |
| |
Class R6 | | | (688 | ) | | | – | |
| |
Total distributions from distributable earnings | | | (2,213,483 | ) | | | – | |
| |
| | |
Share transactions-net: | | | | | | | | |
Class A | | | (935,804 | ) | | | (5,971,655 | ) |
| |
Class C | | | (3,680,814 | ) | | | (11,721,596 | ) |
| |
Class R | | | 36,971 | | | | (60,190 | ) |
| |
Class Y | | | 8,310,885 | | | | 14,769,027 | |
| |
Net increase (decrease) in net assets resulting from share transactions | | | 3,731,238 | | | | (2,984,414 | ) |
| |
Net increase (decrease) in net assets | | | 560,526 | | | | (5,293,235 | ) |
| |
| | |
Net assets: | | | | | | | | |
Beginning of year | | | 47,478,896 | | | | 52,772,131 | |
| |
End of year | | $ | 48,039,422 | | | $ | 47,478,896 | |
| |
See accompanying Notes to Financial Statements which are an integral part of the financial statements.
13 Invesco Select Opportunities Fund
Financial Highlights
The following schedule presents financial highlights for a share of the Fund outstanding throughout the periods indicated.
| | | | | | | | | | | | | | | | | | | | | | | | | | | | | | | | | | | | | | | | | | | | | | | | | | | | | | | | | | | | | | | | | | | | | | |
| | | Net asset
value,
beginning
of period | | Net
investment
income
(loss)(a) | | Net gains
(losses)
on securities
(both
realized and
unrealized) | | Total from
investment
operations | | Dividends
from net
investment
income | | Distributions
from net
realized
gains | | Total
distributions | | Net asset
value, end
of period | | Total
return (b) | | Net assets,
end of period
(000’s omitted) | | Ratio of
expenses
to average
net assets
with fee waivers
and/or
expenses
absorbed | | Ratio of
expenses
to average net
assets without
fee waivers
and/or
expenses
absorbed | | Ratio of net
investment
income
(loss)
to average
net assets | | Portfolio
turnover (c) |
Class A | | | | | | | | | | | | | | | | | | | | | | | | | | | | | | | | | | | | | | | | | | | | | | | | | | | | | | | | | | | | | | | | | | | | | | |
Year ended 10/31/19 | | | $ | 15.09 | | | | $ | 0.09 | | | | $ | (0.64 | ) | | | $ | (0.55 | ) | | | $ | (0.04 | ) | | | $ | (0.65 | ) | | | $ | (0.69 | ) | | | $ | 13.85 | | | | | (3.42 | )% | | | $ | 11,009 | | | | | 1.02 | %(d) | | | | 1.64 | %(d) | | | | 0.61 | %(d) | | | | 40 | % |
Year ended 10/31/18 | | | | 15.82 | | | | | 0.06 | | | | | (0.79 | ) | | | | (0.73 | ) | | | | – | | | | | – | | | | | – | | | | | 15.09 | | | | | (4.61 | ) | | | | 12,796 | | | | | 1.02 | | | | | 1.73 | | | | | 0.37 | | | | | 23 | |
Year ended 10/31/17 | | | | 13.03 | | | | | 0.05 | | | | | 2.74 | | | | | 2.79 | | | | | – | | | | | – | | | | | – | | | | | 15.82 | | | | | 21.41 | | | | | 19,351 | | | | | 1.08 | | | | | 1.73 | | | | | 0.33 | | | | | 30 | |
Year ended 10/31/16 | | | | 12.96 | | | | | (0.04 | ) | | | | 0.42 | | | | | 0.38 | | | | | – | | | | | (0.31 | ) | | | | (0.31 | ) | | | | 13.03 | | | | | 3.12 | | | | | 19,288 | | | | | 1.49 | | | | | 1.78 | | | | | (0.32 | ) | | | | 26 | |
Year ended 10/31/15 | | | | 14.55 | | | | | (0.06 | ) | | | | (1.25 | ) | | | | (1.31 | ) | | | | – | | | | | (0.28 | ) | | | | (0.28 | ) | | | | 12.96 | | | | | (9.07 | ) | | | | 19,719 | | | | | 1.48 | | | | | 1.71 | | | | | (0.40 | ) | | | | 18 | |
Class C | | | | | | | | | | | | | | | | | | | | | | | | | | | | | | | | | | | | | | | | | | | | | | | | | | | | | | | | | | | | | | | | | | | | | | |
Year ended 10/31/19 | | | | 14.44 | | | | | (0.02 | ) | | | | (0.61 | ) | | | | (0.63 | ) | | | | – | | | | | (0.65 | ) | | | | (0.65 | ) | | | | 13.16 | | | | | (4.17 | ) | | | | 2,590 | | | | | 1.77 | (d) | | | | 2.39 | (d) | | | | (0.14 | )(d) | | | | 40 | |
Year ended 10/31/18 | | | | 15.24 | | | | | (0.06 | ) | | | | (0.74 | ) | | | | (0.80 | ) | | | | – | | | | | – | | | | | – | | | | | 14.44 | | | | | (5.25 | ) | | | | 6,722 | | | | | 1.77 | | | | | 2.48 | | | | | (0.38 | ) | | | | 23 | |
Year ended 10/31/17 | | | | 12.65 | | | | | (0.06 | ) | | | | 2.65 | | | | | 2.59 | | | | | – | | | | | – | | | | | – | | | | | 15.24 | | | | | 20.47 | | | | | 18,575 | | | | | 1.83 | | | | | 2.48 | | | | | (0.42 | ) | | | | 30 | |
Year ended 10/31/16 | | | | 12.68 | | | | | (0.13 | ) | | | | 0.41 | | | | | 0.28 | | | | | – | | | | | (0.31 | ) | | | | (0.31 | ) | | | | 12.65 | | | | | 2.38 | | | | | 18,859 | | | | | 2.24 | | | | | 2.53 | | | | | (1.07 | ) | | | | 26 | |
Year ended 10/31/15 | | | | 14.35 | | | | | (0.16 | ) | | | | (1.23 | ) | | | | (1.39 | ) | | | | – | | | | | (0.28 | ) | | | | (0.28 | ) | | | | 12.68 | | | | | (9.77 | ) | | | | 14,226 | | | | | 2.23 | | | | | 2.46 | | | | | (1.15 | ) | | | | 18 | |
Class R | | | | | | | | | | | | | | | | | | | | | | | | | | | | | | | | | | | | | | | | | | | | | | | | | | | | | | | | | | | | | | | | | | | | | | |
Year ended 10/31/19 | | | | 14.88 | | | | | 0.05 | | | | | (0.62 | ) | | | | (0.57 | ) | | | | (0.01 | ) | | | | (0.65 | ) | | | | (0.66 | ) | | | | 13.65 | | | | | (3.65 | ) | | | | 321 | | | | | 1.27 | (d) | | | | 1.89 | (d) | | | | 0.36 | (d) | | | | 40 | |
Year ended 10/31/18 | | | | 15.63 | | | | | 0.02 | | | | | (0.77 | ) | | | | (0.75 | ) | | | | – | | | | | – | | | | | – | | | | | 14.88 | | | | | (4.80 | ) | | | | 309 | | | | | 1.27 | | | | | 1.98 | | | | | 0.12 | | | | | 23 | |
Year ended 10/31/17 | | | | 12.91 | | | | | 0.01 | | | | | 2.71 | | | | | 2.72 | | | | | – | | | | | – | | | | | – | | | | | 15.63 | | | | | 21.07 | | | | | 385 | | | | | 1.33 | | | | | 1.98 | | | | | 0.08 | | | | | 30 | |
Year ended 10/31/16 | | | | 12.87 | | | | | (0.07 | ) | | | | 0.42 | | | | | 0.35 | | | | | – | | | | | (0.31 | ) | | | | (0.31 | ) | | | | 12.91 | | | | | 2.90 | | | | | 283 | | | | | 1.74 | | | | | 2.03 | | | | | (0.57 | ) | | | | 26 | |
Year ended 10/31/15 | | | | 14.49 | | | | | (0.09 | ) | | | | (1.25 | ) | | | | (1.34 | ) | | | | – | | | | | (0.28 | ) | | | | (0.28 | ) | | | | 12.87 | | | | | (9.32 | ) | | | | 279 | | | | | 1.73 | | | | | 1.96 | | | | | (0.65 | ) | | | | 18 | |
Class Y | | | | | | | | | | | | | | | | | | | | | | | | | | | | | | | | | | | | | | | | | | | | | | | | | | | | | | | | | | | | | | | | | | | | | | |
Year ended 10/31/19 | | | | 15.32 | | | | | 0.12 | | | | | (0.65 | ) | | | | (0.53 | ) | | | | (0.10 | ) | | | | (0.65 | ) | | | | (0.75 | ) | | | | 14.04 | | | | | (3.22 | ) | | | | 34,092 | | | | | 0.77 | (d) | | | | 1.39 | (d) | | | | 0.86 | (d) | | | | 40 | |
Year ended 10/31/18 | | | | 16.01 | | | | | 0.10 | | | | | (0.79 | ) | | | | (0.69 | ) | | | | – | | | | | – | | | | | – | | | | | 15.32 | | | | | (4.31 | ) | | | | 27,622 | | | | | 0.77 | | | | | 1.48 | | | | | 0.62 | | | | | 23 | |
Year ended 10/31/17 | | | | 13.16 | | | | | 0.09 | | | | | 2.76 | | | | | 2.85 | | | | | – | | | | | – | | | | | – | | | | | 16.01 | | | | | 21.66 | | | | | 14,430 | | | | | 0.83 | | | | | 1.48 | | | | | 0.58 | | | | | 30 | |
Year ended 10/31/16 | | | | 13.05 | | | | | (0.01 | ) | | | | 0.43 | | | | | 0.42 | | | | | – | | | | | (0.31 | ) | | | | (0.31 | ) | | | | 13.16 | | | | | 3.41 | | | | | 7,350 | | | | | 1.24 | | | | | 1.53 | | | | | (0.07 | ) | | | | 26 | |
Year ended 10/31/15 | | | | 14.61 | | | | | (0.02 | ) | | | | (1.26 | ) | | | | (1.28 | ) | | | | – | | | | | (0.28 | ) | | | | (0.28 | ) | | | | 13.05 | | | | | (8.82 | ) | | | | 25,663 | | | | | 1.23 | | | | | 1.46 | | | | | (0.15 | ) | | | | 18 | |
Class R5 | | | | | | | | | | | | | | | | | | | | | | | | | | | | | | | | | | | | | | | | | | | | | | | | | | | | | | | | | | | | | | | | | | | | | | |
Year ended 10/31/19 | | | | 15.32 | | | | | 0.12 | | | | | (0.64 | ) | | | | (0.52 | ) | | | | (0.10 | ) | | | | (0.65 | ) | | | | (0.75 | ) | | | | 14.05 | | | | | (3.15 | ) | | | | 14 | | | | | 0.77 | (d) | | | | 1.27 | (d) | | | | 0.86 | (d) | | | | 40 | |
Year ended 10/31/18 | | | | 16.02 | | | | | 0.10 | | | | | (0.80 | ) | | | | (0.70 | ) | | | | – | | | | | – | | | | | – | | | | | 15.32 | | | | | (4.37 | ) | | | | 15 | | | | | 0.77 | | | | | 1.37 | | | | | 0.62 | | | | | 23 | |
Year ended 10/31/17 | | | | 13.17 | | | | | 0.09 | | | | | 2.76 | | | | | 2.85 | | | | | – | | | | | – | | | | | – | | | | | 16.02 | | | | | 21.64 | | | | | 16 | | | | | 0.83 | | | | | 1.38 | | | | | 0.58 | | | | | 30 | |
Year ended 10/31/16 | | | | 13.05 | | | | | (0.01 | ) | | | | 0.44 | | | | | 0.43 | | | | | – | | | | | (0.31 | ) | | | | (0.31 | ) | | | | 13.17 | | | | | 3.49 | | | | | 13 | | | | | 1.24 | | | | | 1.43 | | | | | (0.07 | ) | | | | 26 | |
Year ended 10/31/15 | | | | 14.62 | | | | | (0.02 | ) | | | | (1.27 | ) | | | | (1.29 | ) | | | | – | | | | | (0.28 | ) | | | | (0.28 | ) | | | | 13.05 | | | | | (8.89 | ) | | | | 13 | | | | | 1.23 | | | | | 1.32 | | | | | (0.15 | ) | | | | 18 | |
Class R6 | | | | | | | | | | | | | | | | | | | | | | | | | | | | | | | | | | | | | | | | | | | | | | | | | | | | | | | | | | | | | | | | | | | | | | |
Year ended 10/31/19 | | | | 15.31 | | | | | 0.12 | | | | | (0.64 | ) | | | | (0.52 | ) | | | | (0.10 | ) | | | | (0.65 | ) | | | | (0.75 | ) | | | | 14.04 | | | | | (3.16 | ) | | | | 13 | | | | | 0.77 | (d) | | | | 1.27 | (d) | | | | 0.86 | (d) | | | | 40 | |
Year ended 10/31/18 | | | | 16.01 | | | | | 0.10 | | | | | (0.80 | ) | | | | (0.70 | ) | | | | – | | | | | – | | | | | – | | | | | 15.31 | | | | | (4.37 | ) | | | | 14 | | | | | 0.77 | | | | | 1.37 | | | | | 0.62 | | | | | 23 | |
Year ended 10/31/17 | | | | 13.16 | | | | | 0.09 | | | | | 2.76 | | | | | 2.85 | | | | | – | | | | | – | | | | | – | | | | | 16.01 | | | | | 21.66 | | | | | 15 | | | | | 0.83 | | | | | 1.38 | | | | | 0.58 | | | | | 30 | |
Year ended 10/31/16 | | | | 13.05 | | | | | (0.01 | ) | | | | 0.43 | | | | | 0.42 | | | | | – | | | | | (0.31 | ) | | | | (0.31 | ) | | | | 13.16 | | | | | 3.41 | | | | | 12 | | | | | 1.24 | | | | | 1.43 | | | | | (0.07 | ) | | | | 26 | |
Year ended 10/31/15 | | | | 14.61 | | | | | (0.02 | ) | | | | (1.26 | ) | | | | (1.28 | ) | | | | – | | | | | (0.28 | ) | | | | (0.28 | ) | | | | 13.05 | | | | | (8.82 | ) | | | | 12 | | | | | 1.23 | | | | | 1.32 | | | | | (0.15 | ) | | | | 18 | |
| (a) | Calculated using average shares outstanding. |
| (b) | Includes adjustments in accordance with accounting principles generally accepted in the United States of America and as such, the net asset value for financial reporting purposes and the returns based upon those net asset values may differ from the net asset value and returns for shareholder transactions. Does not include sales charges and is not annualized for periods less than one year, if applicable. |
| (c) | Portfolio turnover is calculated at the fund level and is not annualized for periods less than one year, if applicable. |
| (d) | Ratios are based on average daily net assets (000’s omitted) of $12,281, $3,869, $312, $32,981, $14 and $13 for Class A, Class C, Class R, Class Y, Class R5 and Class R6 shares, respectively. |
See accompanying Notes to Financial Statements which are an integral part of the financial statements.
14 Invesco Select Opportunities Fund
Notes to Financial Statements
October 31, 2019
NOTE 1–Significant Accounting Policies
Invesco Select Opportunities Fund (the “Fund”) is a series portfolio of AIM International Mutual Funds (Invesco International Mutual Funds) (the “Trust”). The Trust is a Delaware statutory trust registered under the Investment Company Act of 1940, as amended (the “1940 Act”), as anopen-end series management investment company authorized to issue an unlimited number of shares of beneficial interest. Information presented in these financial statements pertains only to the Fund. Matters affecting the Fund or each class will be voted on exclusively by the shareholders of the Fund or each class.
The Fund’s investment objective is long-term growth of capital.
The Fund currently consists of six different classes of shares: Class A, Class C, Class R, Class Y, Class R5 and Class R6. Class Y shares are available only to certain investors. Class A shares are sold with afront-end sales charge unless certain waiver criteria are met. Under certain circumstances, load waived shares may be subject to contingent deferred sales charges (“CDSC”). Class C shares are sold with a CDSC. Class R, Class Y, Class R5 and Class R6 shares are sold at net asset value. Class C shares held for ten years after purchase are eligible for automatic conversion into Class A shares of the same Fund (the “Conversion Feature”). The automatic conversion pursuant to the Conversion Feature will generally occur at the end of the month following the tenth anniversary after a purchase of Class C shares.
The Fund is an investment company and accordingly follows the investment company accounting and reporting guidance in accordance with Financial Accounting Standards Board Accounting Standards Codification Topic 946,Financial Services - Investment Companies.
The following is a summary of the significant accounting policies followed by the Fund in the preparation of its financial statements.
| A. | Security Valuations– Securities, including restricted securities, are valued according to the following policy. |
A security listed or traded on an exchange (except convertible securities) is valued at its last sales price or official closing price as of the close of the customary trading session on the exchange where the security is principally traded, or lacking any sales or official closing price on a particular day, the security may be valued at the closing bid price on that day. Securities traded in theover-the-counter market are valued based on prices furnished by independent pricing services or market makers. When such securities are valued by an independent pricing service they may be considered fair valued. Futures contracts are valued at the final settlement price set by an exchange on which they are principally traded. Listed options are valued at the mean between the last bid and asked prices from the exchange on which they are principally traded. Options not listed on an exchange are valued by an independent source at the mean between the last bid and asked prices. For purposes of determining net asset value (“NAV”) per share, futures and option contracts generally are valued 15 minutes after the close of the customary trading session of the New York Stock Exchange (“NYSE”).
Investments inopen-end andclosed-end registered investment companies that do not trade on an exchange are valued at theend-of-day net asset value per share. Investments inopen-end andclosed-end registered investment companies that trade on an exchange are valued at the last sales price or official closing price as of the close of the customary trading session on the exchange where the security is principally traded.
Debt obligations (including convertible securities) and unlisted equities are fair valued using an evaluated quote provided by an independent pricing service. Evaluated quotes provided by the pricing service may be determined without exclusive reliance on quoted prices, and may reflect appropriate factors such asinstitution-size trading in similar groups of securities, developments related to specific securities, dividend rate (for unlisted equities), yield (for debt obligations), quality, type of issue, coupon rate (for debt obligations), maturity (for debt obligations), individual trading characteristics and other market data. Pricing services generally value debt obligations assuming orderly transactions of institutional round lot size, but a fund may hold or transact in the same securities in smaller, odd lot sizes. Odd lots often trade at lower prices than institutional round lots. Debt obligations are subject to interest rate and credit risks. In addition, all debt obligations involve some risk of default with respect to interest and/or principal payments.
Foreign securities’ (including foreign exchange contracts) prices are converted into U.S. dollar amounts using the applicable exchange rates as of the close of the NYSE. If market quotations are available and reliable for foreign exchange-traded equity securities, the securities will be valued at the market quotations. Because trading hours for certain foreign securities end before the close of the NYSE, closing market quotations may become unreliable. If between the time trading ends on a particular security and the close of the customary trading session on the NYSE, events occur that the investment adviser determines are significant and make the closing price unreliable, the Fund may fair value the security. If the event is likely to have affected the closing price of the security, the security will be valued at fair value in good faith using procedures approved by the Board of Trustees. Adjustments to closing prices to reflect fair value may also be based on a screening process of an independent pricing service to indicate the degree of certainty, based on historical data, that the closing price in the principal market where a foreign security trades is not the current value as of the close of the NYSE. Foreign securities’ prices meeting the approved degree of certainty that the price is not reflective of current value will be priced at the indication of fair value from the independent pricing service. Multiple factors may be considered by the independent pricing service in determining adjustments to reflect fair value and may include information relating to sector indices, American Depositary Receipts and domestic and foreign index futures. Foreign securities may have additional risks including exchange rate changes, potential for sharply devalued currencies and high inflation, political and economic upheaval, the relative lack of issuer information, relatively low market liquidity and the potential lack of strict financial and accounting controls and standards.
Securities for which market prices are not provided by any of the above methods may be valued based upon quotes furnished by independent sources. The last bid price may be used to value equity securities. The mean between the last bid and asked prices is used to value debt obligations, including corporate loans.
Securities for which market quotations are not readily available or became unreliable are valued at fair value as determined in good faith by or under the supervision of the Trust’s officers following procedures approved by the Board of Trustees. Issuer specific events, market trends, bid/asked quotes of brokers and information providers and other market data may be reviewed in the course of making a good faith determination of a security’s fair value.
The Fund may invest in securities that are subject to interest rate risk, meaning the risk that the prices will generally fall as interest rates rise and, conversely, the prices will generally rise as interest rates fall. Specific securities differ in their sensitivity to changes in interest rates
15 Invesco Select Opportunities Fund
depending on their individual characteristics. Changes in interest rates may result in increased market volatility, which may affect the value and/or liquidity of certain Fund investments.
Valuations change in response to many factors including the historical and prospective earnings of the issuer, the value of the issuer’s assets, general economic conditions, interest rates, investor perceptions and market liquidity. Because of the inherent uncertainties of valuation, the values reflected in the financial statements may materially differ from the value received upon actual sale of those investments.
| B. | Securities Transactions and Investment Income– Securities transactions are accounted for on a trade date basis. Realized gains or losses on sales are computed on the basis of specific identification of the securities sold. Interest income (net of withholding tax, if any) is recorded on the accrual basis from settlement date. Dividend income (net of withholding tax, if any) is recorded on theex-dividend date. |
The Fund may periodically participate in litigation related to Fund investments. As such, the Fund may receive proceeds from litigation settlements. Any proceeds received are included in the Statement of Operations as realized gain (loss) for investments no longer held and as unrealized gain (loss) for investments still held.
Brokerage commissions and mark ups are considered transaction costs and are recorded as an increase to the cost basis of securities purchased and/or a reduction of proceeds on a sale of securities. Such transaction costs are included in the determination of net realized and unrealized gain (loss) from investment securities reported in the Statement of Operations and the Statement of Changes in Net Assets and the net realized and unrealized gains (losses) on securities per share in the Financial Highlights. Transaction costs are included in the calculation of the Fund’s net asset value and, accordingly, they reduce the Fund’s total returns. These transaction costs are not considered operating expenses and are not reflected in net investment income reported in the Statement of Operations and the Statement of Changes in Net Assets, or the net investment income per share and the ratios of expenses and net investment income reported in the Financial Highlights, nor are they limited by any expense limitation arrangements between the Fund and the investment adviser.
The Fund allocates income and realized and unrealized capital gains and losses to a class based on the relative net assets of each class.
| C. | Country Determination– For the purposes of making investment selection decisions and presentation in the Schedule of Investments, the investment adviser may determine the country in which an issuer is located and/or credit risk exposure based on various factors. These factors include the laws of the country under which the issuer is organized, where the issuer maintains a principal office, the country in which the issuer derives 50% or more of its total revenues and the country that has the primary market for the issuer’s securities, as well as other criteria. Among the other criteria that may be evaluated for making this determination are the country in which the issuer maintains 50% or more of its assets, the type of security, financial guarantees and enhancements, the nature of the collateral and the sponsor organization. Country of issuer and/or credit risk exposure has been determined to be the United States of America, unless otherwise noted. |
| D. | Distributions– Distributions from net investment income and net realized capital gain, if any, are generally declared and paid annually and recorded on theex-dividend date. The Fund may elect to treat a portion of the proceeds from redemptions as distributions for federal income tax purposes. |
| E. | Federal Income Taxes –The Fund intends to comply with the requirements of Subchapter M of the Internal Revenue Code of 1986, as amended (the “Internal Revenue Code”), necessary to qualify as a regulated investment company and to distribute substantially all of the Fund’s taxable earnings to shareholders. As such, the Fund will not be subject to federal income taxes on otherwise taxable income (including net realized capital gain) that is distributed to shareholders. Therefore, no provision for federal income taxes is recorded in the financial statements. |
The Fund recognizes the tax benefits of uncertain tax positions only when the position is more likely than not to be sustained. Management has analyzed the Fund’s uncertain tax positions and concluded that no liability for unrecognized tax benefits should be recorded related to uncertain tax positions. Management is not aware of any tax positions for which it is reasonably possible that the total amounts of unrecognized tax benefits will change materially in the next 12 months.
The Fund files tax returns in the U.S. Federal jurisdiction and certain other jurisdictions. Generally, the Fund is subject to examinations by such taxing authorities for up to three years after the filing of the return for the tax period.
| F. | Expenses –Fees provided for under the Rule12b-1 plan of a particular class of the Fund are charged to the operations of such class. Transfer agency fees and expenses and other shareholder recordkeeping fees and expenses attributable to Class R5 and Class R6 are allocated to each share class based on relative net assets.Sub-accounting fees attributable to Class R5 are charged to the operations of the class. Transfer agency fees and expenses and other shareholder recordkeeping fees and expenses relating to all other classes are allocated among those classes based on relative net assets. All other expenses are allocated among the classes based on relative net assets. |
| G. | Accounting Estimates –The preparation of financial statements in conformity with accounting principles generally accepted in the United States of America (“GAAP”) requires management to make estimates and assumptions that affect the reported amounts of assets and liabilities at the date of the financial statements and the reported amounts of revenues and expenses during the reporting period including estimates and assumptions related to taxation. Actual results could differ from those estimates by a significant amount. In addition, the Fund monitors for material events or transactions that may occur or become known after theperiod-end date and before the date the financial statements are released to print. |
| H. | Indemnifications– Under the Trust’s organizational documents, each Trustee, officer, employee or other agent of the Trust is indemnified against certain liabilities that may arise out of the performance of their duties to the Fund. Additionally, in the normal course of business, the Fund enters into contracts, including the Fund’s servicing agreements, that contain a variety of indemnification clauses. The Fund’s maximum exposure under these arrangements is unknown as this would involve future claims that may be made against the Fund that have not yet occurred. The risk of material loss as a result of such indemnification claims is considered remote. |
| I. | Foreign Currency Translations– Foreign currency is valued at the close of the NYSE based on quotations posted by banks and major currency dealers. Portfolio securities and other assets and liabilities denominated in foreign currencies are translated into U.S. dollar amounts at the date of valuation. Purchases and sales of portfolio securities (net of foreign taxes withheld on disposition) and income items denominated in foreign currencies are translated into U.S. dollar amounts on the respective dates of such transactions. The Fund does not separately account for the portion of the results of operations resulting from changes in foreign exchange rates on investments and the fluctuations arising from changes in market prices of securities held. The combined results of changes in foreign exchange rates and the fluctuation of market prices on investments (net of estimated foreign tax withholding) are included with the net realized and unrealized gain or loss from investments in the Statement of Operations. Reported net realized foreign currency gains or losses arise from (1) sales of foreign currencies, (2) currency gains or losses realized between the trade and settlement dates on securities transactions, and (3) the difference between the amounts of dividends, |
16 Invesco Select Opportunities Fund
interest, and foreign withholding taxes recorded on the Fund’s books and the U.S. dollar equivalent of the amounts actually received or paid. Net unrealized foreign currency gains and losses arise from changes in the fair values of assets and liabilities, other than investments in securities at fiscal period end, resulting from changes in exchange rates.
The Fund may invest in foreign securities, which may be subject to foreign taxes on income, gains on investments or currency repatriation, a portion of which may be recoverable. Foreign taxes, if any, are recorded based on the tax regulations and rates that exist in the foreign markets in which the Fund invests and are shown in the Statement of Operations.
| J. | Forward Foreign Currency Contracts– The Fund may engage in foreign currency transactions either on a spot (i.e. for prompt delivery and settlement) basis, or through forward foreign currency contracts, to manage or minimize currency or exchange rate risk. |
The Fund may also enter into forward foreign currency contracts for the purchase or sale of a security denominated in a foreign currency in order to “lock in” the U.S. dollar price of that security, or the Fund may also enter into forward foreign currency contracts that do not provide for physical settlement of the two currencies, but instead are settled by a single cash payment calculated as the difference between the agreed upon exchange rate and the spot rate at settlement based upon an agreed upon notional amount(non-deliverable forwards). The Fund will set aside liquid assets in an amount equal to the dailymark-to-market obligation for forward foreign currency contracts.
A forward foreign currency contract is an obligation between two parties (“Counterparties”) to purchase or sell a specific currency for an agreed-upon price at a future date. The use of forward foreign currency contracts does not eliminate fluctuations in the price of the underlying securities the Fund owns or intends to acquire but establishes a rate of exchange in advance. Fluctuations in the value of these contracts are measured by the difference in the contract date and reporting date exchange rates and are recorded as unrealized appreciation (depreciation) until the contracts are closed. When the contracts are closed, realized gains (losses) are recorded. Realized and unrealized gains (losses) on the contracts are included in the Statement of Operations. The primary risks associated with forward foreign currency contracts include failure of the Counterparty to meet the terms of the contract and the value of the foreign currency changing unfavorably. These risks may be in excess of the amounts reflected in the Statement of Assets and Liabilities.
NOTE 2–Advisory Fees and Other Fees Paid to Affiliates
The Trust has entered into a master investment advisory agreement with Invesco Advisers, Inc. (the “Adviser” or “Invesco”). Under the terms of the investment advisory agreement, the Fund accrues daily and pays monthly an advisory fee to the Adviser based on the annual rate of the Fund’s average daily net assets as follows:
| | | | | | |
| Average Daily Net Assets | | Rate | |
| |
First $250 million | | | 0.800% | |
| |
Next $250 million | | | 0.780% | |
| |
Next $500 million | | | 0.760% | |
| |
Next $1.5 billion | | | 0.740% | |
| |
Next $2.5 billion | | | 0.720% | |
| |
Next $2.5 billion | | | 0.700% | |
| |
Next $2.5 billion | | | 0.680% | |
| |
Over $10 billion | | | 0.660% | |
| |
For the year ended October 31, 2019, the effective advisory fee rate incurred by the Fund was 0.80%.
Under the terms of a mastersub-advisory agreement between the Adviser and each of Invesco Asset Management Deutschland GmbH, Invesco Asset Management Limited, Invesco Asset Management (Japan) Limited, Invesco Hong Kong Limited, Invesco Senior Secured Management, Inc. and Invesco Canada Ltd. and a separatesub-advisory agreement with Invesco Capital Management LLC (collectively, the “AffiliatedSub-Advisers”) the Adviser, not the Fund, will pay 40% of the fees paid to the Adviser to any such AffiliatedSub-Adviser(s) that provide(s) discretionary investment management services to the Fund based on the percentage of assets allocated to such AffiliatedSub-Adviser(s).
The Adviser has contractually agreed, through February 28, 2021, to waive advisory fees and/or reimburse expenses of all shares to the extent necessary to limit total annual fund operating expenses after fee waiver and/or expense reimbursement (excluding certain items discussed below) of Class A, Class C, Class R, Class Y, Class R5 and Class R6 shares to 1.02%, 1.77%, 1.27%, 0.77%, 0.77% and 0.77%, respectively, of average daily net assets (the “expense limits”). In determining the Adviser’s obligation to waive advisory fees and/or reimburse expenses, the following expenses are not taken into account, and could cause the total annual fund operating expenses after fee waiver and/or expense reimbursement to exceed the numbers reflected above: (1) interest; (2) taxes; (3) dividend expense on short sales; (4) extraordinary ornon-routine items, litigation expenses; and (5) expenses that the Fund has incurred but did not actually pay because of an expense offset arrangement. Unless Invesco continues the fee waiver agreement, it will terminate on February 28, 2021. During its term, the fee waiver agreement cannot be terminated or amended to increase the expense limits or reduce the advisory fee waiver without approval of the Board of Trustees.
Further, the Adviser has contractually agreed, through at least June 30, 2021, to waive the advisory fee payable by the Fund in an amount equal to 100% of the net advisory fees the Adviser receives from the affiliated money market funds on investments by the Fund of uninvested cash in such affiliated money market funds.
For the year ended October 31, 2019, the Adviser waived advisory fees of $210,044 and reimbursed class level expenses of $24,421, $7,694, $621, $65,584, $11 and $10 of Class A, Class C, Class R, Class Y, Class R5 and Class R6 shares, respectively.
The Trust has entered into a master administrative services agreement with Invesco pursuant to which the Fund has agreed to pay Invesco for certain administrative costs incurred in providing accounting services to the Fund. For the year ended October 31, 2019, expenses incurred under the agreement are shown in the Statement of Operations asAdministrative services fees. Invesco has entered into asub-administration agreement whereby State Street Bank and Trust Company (“SSB”) serves as fund accountant and provides certain administrative services to the Fund. Pursuant to a custody agreement with the Trust on behalf of the Fund, SSB also serves as the Fund’s custodian.
The Trust has entered into a transfer agency and service agreement with Invesco Investment Services, Inc. (“IIS”) pursuant to which the Fund has agreed to pay IIS a fee for providing transfer agency and shareholder services to the Fund and reimburse IIS for certain expenses incurred by IIS in the
17 Invesco Select Opportunities Fund
course of providing such services. IIS may make payments to intermediaries that provide omnibus account services,sub-accounting services and/or networking services. All fees payable by IIS to intermediaries that provide omnibus account services orsub-accounting services are charged back to the Fund, subject to certain limitations approved by the Trust’s Board of Trustees. For the year ended October 31, 2019, expenses incurred under the agreement are shown in the Statement of Operations asTransfer agent fees.
The Trust has entered into master distribution agreements with Invesco Distributors, Inc. (“IDI”) to serve as the distributor for the Class A, Class C, Class R, Class Y, Class R5 and Class R6 shares of the Fund. The Trust has adopted plans pursuant to Rule12b-1 under the 1940 Act with respect to the Fund’s Class A, Class C and Class R shares (collectively, the “Plans”). The Fund, pursuant to the Plans, pays IDI compensation at the annual rate of 0.25% of the Fund’s average daily net assets of Class A shares, 1.00% of the average daily net assets of Class C shares and 0.50% of the average daily net assets of Class R shares. The fees are accrued daily and paid monthly. Of the Plan payments, up to 0.25% of the average daily net assets of each class of shares may be paid to furnish continuing personal shareholder services to customers who purchase and own shares of such classes. Any amounts not paid as a service fee under the Plans would constitute an asset-based sales charge. Rules of the Financial Industry Regulatory Authority (“FINRA”) impose a cap on the total sales charges, including asset-based sales charges, that may be paid by any class of shares of the Fund. For the year ended October 31, 2019, expenses incurred under the Plans are shown in the Statement of Operations asDistribution fees.
Front-end sales commissions and CDSC (collectively, the “sales charges”) are not recorded as expenses of the Fund.Front-end sales commissions are deducted from proceeds from the sales of Fund shares prior to investment in Class A shares of the Fund. CDSC are deducted from redemption proceeds prior to remittance to the shareholder. During the year ended October 31, 2019, IDI advised the Fund that IDI retained $1,589 infront-end sales commissions from the sale of Class A shares and $1,366 and $8 from Class A and Class C shares, respectively, for CDSC imposed upon redemptions by shareholders.
Certain officers and trustees of the Trust are officers and directors of the Adviser, IIS and/or IDI.
NOTE 3–Additional Valuation Information
GAAP defines fair value as the price that would be received to sell an asset or paid to transfer a liability in an orderly transaction between market participants at the measurement date, under current market conditions. GAAP establishes a hierarchy that prioritizes the inputs to valuation methods, giving the highest priority to readily available unadjusted quoted prices in an active market for identical assets (Level 1) and the lowest priority to significant unobservable inputs (Level 3), generally when market prices are not readily available or are unreliable. Based on the valuation inputs, the securities or other investments are tiered into one of three levels. Changes in valuation methods may result in transfers in or out of an investment’s assigned level:
| | | | |
| | Level 1 - | | Prices are determined using quoted prices in an active market for identical assets. |
| | Level 2 - | | Prices are determined using other significant observable inputs. Observable inputs are inputs that other market participants may use in pricing a security. These may include quoted prices for similar securities, interest rates, prepayment speeds, credit risk, yield curves, loss severities, default rates, discount rates, volatilities and others. |
| | Level 3 - | | Prices are determined using significant unobservable inputs. In situations where quoted prices or observable inputs are unavailable (for example, when there is little or no market activity for an investment at the end of the period), unobservable inputs may be used. Unobservable inputs reflect the Fund’s own assumptions about the factors market participants would use in determining fair value of the securities or instruments and would be based on the best available information. |
The following is a summary of the tiered valuation input levels, as of October 31, 2019. The level assigned to the securities valuations may not be an indication of the risk or liquidity associated with investing in those securities. Because of the inherent uncertainties of valuation, the values reflected in the financial statements may materially differ from the value received upon actual sale of those investments.
| | | | | | | | | | | | | | |
| | | Level 1 | | | Level 2 | | | Level 3 | | Total | |
| |
Investments in Securities | | | | | | | | | | | | | | |
| |
Australia | | $ | – | | | $ | 4,109,386 | | | $– | | $ | 4,109,386 | |
| |
Canada | | | 2,162,887 | | | | – | | | – | | | 2,162,887 | |
| |
France | | | – | | | | 1,865,151 | | | – | | | 1,865,151 | |
| |
Germany | | | – | | | | 1,375,291 | | | – | | | 1,375,291 | |
| |
Hong Kong | | | – | | | | 1,831,872 | | | – | | | 1,831,872 | |
| |
Monaco | | | 2,335,307 | | | | – | | | – | | | 2,335,307 | |
| |
Netherlands | | | – | | | | 1,276,716 | | | – | | | 1,276,716 | |
| |
Poland | | | – | | | | 1,709,086 | | | – | | | 1,709,086 | |
| |
Switzerland | | | – | | | | 1,917,943 | | | – | | | 1,917,943 | |
| |
United Kingdom | | | – | | | | 5,027,793 | | | – | | | 5,027,793 | |
| |
United States | | | 23,473,756 | | | | – | | | – | | | 23,473,756 | |
| |
Money Market Funds | | | 739,804 | | | | – | | | – | | | 739,804 | |
| |
Total Investments | | $ | 28,711,754 | | | $ | 19,113,238 | | | $– | | $ | 47,824,992 | |
| |
NOTE 4–Expense Offset Arrangement(s)
The expense offset arrangement is comprised of transfer agency credits which result from balances in demand deposit accounts used by the transfer agent for clearing shareholder transactions. For the year ended October 31, 2019, the Fund received credits from this arrangement, which resulted in the reduction of the Fund’s total expenses of $744.
18 Invesco Select Opportunities Fund
NOTE 5–Trustees’ and Officers’ Fees and Benefits
Trustees’ and Officers’ Fees and Benefitsinclude amounts accrued by the Fund to pay remuneration to certain Trustees and Officers of the Fund. Trustees have the option to defer compensation payable by the Fund, andTrustees’ and Officers’ Fees and Benefits also include amounts accrued by the Fund to fund such deferred compensation amounts. Those Trustees who defer compensation have the option to select various Invesco Funds in which their deferral accounts shall be deemed to be invested. Finally, certain current Trustees were eligible to participate in a retirement plan that provided for benefits to be paid upon retirement to Trustees over a period of time based on the number of years of service. The Fund may have certain former Trustees who also participate in a retirement plan and receive benefits under such plan.Trustees’ and Officers’ Fees and Benefits include amounts accrued by the Fund to fund such retirement benefits. Obligations under the deferred compensation and retirement plans represent unsecured claims against the general assets of the Fund.
NOTE 6–Cash Balances
The Fund is permitted to temporarily carry a negative or overdrawn balance in its account with State Street Bank and Trust Company, the custodian bank. Such balances, if any atperiod-end, are shown in the Statement of Assets and Liabilities under the payable caption Amount due custodian. To compensate the custodian bank for such overdrafts, the overdrawn Fund may either (1) leave funds as a compensating balance in the account so the custodian bank can be compensated by earning the additional interest; or (2) compensate by paying the custodian bank at a rate agreed upon by the custodian bank and Invesco, not to exceed the contractually agreed upon rate.
NOTE 7–Distributions to Shareholders and Tax Components of Net Assets
Tax Character of Distributions to Shareholders Paid During the Fiscal Years Ended October 31, 2019 and 2018
| | | | | | | | |
| | | 2019 | | | 2018 | |
Ordinary income | | $ | 213,322 | | | $ | – | |
Long-term capital gain | | | 2,000,161 | | | | – | |
Total distributions | | $ | 2,213,483 | | | $ | – | |
| | |
Tax Components of Net Assets atPeriod-End: | | | | | | | | |
| | |
| | | | | | 2019 | |
Undistributed ordinary income | | | | | | $ | 426,854 | |
Undistributed long-term capital gain | | | | | | | 1,803,407 | |
Net unrealized appreciation (depreciation) – investments | | | | | | | (2,818,076 | ) |
Net unrealized appreciation – foreign currencies | | | | | | | 156 | |
Temporary book/tax differences | | | | | | | (16,052 | ) |
Shares of beneficial interest | | | | | | | 48,643,133 | |
Total net assets | | | $48,039,422 | |
The difference between book-basis andtax-basis unrealized appreciation (depreciation) is due to differences in the timing of recognition of gains and losses on investments for tax and book purposes. The Fund’s net unrealized appreciation (depreciation) difference is attributable primarily to wash sales.
The temporary book/tax differences are a result of timing differences between book and tax recognition of income and/or expenses. The Fund’s temporary book/tax differences are the result of the trustee deferral of compensation and retirement plan benefits.
Capital loss carryforward is calculated and reported as of a specific date. Results of transactions and other activity after that date may affect the amount of capital loss carryforward actually available for the Fund to utilize. The ability to utilize capital loss carryforward in the future may be limited under the Internal Revenue Code and related regulations based on the results of future transactions.
The Fund does not have a capital loss carryforward as of October 31, 2019.
NOTE 8–Investment Transactions
The aggregate amount of investment securities (other than short-term securities, U.S. Treasury obligations and money market funds, if any) purchased and sold by the Fund during the year ended October 31, 2019 was $22,339,450 and $18,720,942, respectively. Cost of investments, including any derivatives, on a tax basis includes the adjustments for financial reporting purposes as of the most recently completed federal income tax reportingperiod-end.
| | | | |
| Unrealized Appreciation (Depreciation) of Investments on a Tax Basis | | | |
Aggregate unrealized appreciation of investments | | $ | 5,128,473 | |
Aggregate unrealized (depreciation) of investments | | | (7,946,549 | ) |
Net unrealized appreciation (depreciation) of investments | | $ | (2,818,076 | ) |
| |
Cost of investments for tax purposes is $50,643,068. | | | | |
19 Invesco Select Opportunities Fund
NOTE 9–Reclassification of Permanent Differences
Primarily as a result of differing book/tax treatment of foreign currency transactions, on October 31, 2019, undistributed net investment income was decreased by $96,790 and undistributed net realized gain was increased by $96,790. This reclassification had no effect on the net assets or the distributable earnings (loss) of the Fund.
NOTE 10–Share Information
| | | | | | | | | | | | | | | | |
| | | Summary of Share Activity | |
| |
| | | Years ended October 31, | |
| | |
| | | 2019(a) | | | 2018 | |
| | | | |
| | | Shares | | | Amount | | | Shares | | | Amount | |
Sold: | | | | | | | | | | | | | | | | |
| | | | |
Class A | | | 197,165 | | | $ | 2,584,151 | | | | 106,586 | | | $ | 1,731,441 | |
| | | | |
Class C | | | 68,815 | | | | 850,246 | | | | 41,606 | | | | 646,569 | |
| | | | |
Class R | | | 1,863 | | | | 25,916 | | | | 1,965 | | | | 30,689 | |
| | | | |
Class Y | | | 977,303 | | | | 13,257,719 | | | | 1,248,883 | | | | 20,417,547 | |
| | | | |
Issued as reinvestment of dividends: | | | | | | | | | | | | | | | | |
| | | | |
Class A | | | 39,440 | | | | 517,055 | | | | - | | | | - | |
| | | | |
Class C | | | 19,961 | | | | 250,316 | | | | - | | | | - | |
| | | | |
Class R | | | 1,001 | | | | 12,949 | | | | - | | | | - | |
| | | | |
Class Y | | | 95,734 | | | | 1,269,431 | | | | - | | | | - | |
| | | | |
Automatic conversion of Class C shares to Class A shares: | | | | | | | | | | | | | | | | |
| | | | |
Class A | | | 31,858 | | | | 446,486 | | | | - | | | | - | |
| | | | |
Class C | | | (33,371 | ) | | | (446,486 | ) | | | - | | | | - | |
| | | | |
Reacquired: | | | | | | | | | | | | | | | | |
| | | | |
Class A | | | (321,519 | ) | | | (4,483,496 | ) | | | (482,130 | ) | | | (7,703,096 | ) |
| | | | |
Class C | | | (324,194 | ) | | | (4,334,890 | ) | | | (794,420 | ) | | | (12,368,165 | ) |
| | | | |
Class R | | | (139 | ) | | | (1,894 | ) | | | (5,802 | ) | | | (90,879 | ) |
| | | | |
Class Y | | | (448,708 | ) | | | (6,216,265 | ) | | | (346,731 | ) | | | (5,648,520 | ) |
| | | | |
Net increase (decrease) in share activity | | | 305,209 | | | $ | 3,731,238 | | | | (230,043 | ) | | $ | (2,984,414 | ) |
| (a) | There are entities that are record owners of more than 5% of the outstanding shares of the Fund and in the aggregate own 76% of the outstanding shares of the Fund. IDI has an agreement with these entities to sell Fund shares. The Fund, Invesco and/or Invesco affiliates may make payments to these entities, which are considered to be related to the Fund, for providing services to the Fund, Invesco and/or Invesco affiliates including but not limited to services such as securities brokerage, distribution, third party record keeping and account servicing. The Fund has no knowledge as to whether all or any portion of the shares owned of record by these entities are also owned beneficially. |
20 Invesco Select Opportunities Fund
Report of Independent Registered Public Accounting Firm
To the Board of Trustees of AIM International Mutual Funds (Invesco International Mutual Funds) and Shareholders of Invesco Select Opportunities Fund
Opinion on the Financial Statements
We have audited the accompanying statement of assets and liabilities, including the schedule of investments, of Invesco Select Opportunities Fund (one of the funds constituting AIM International Mutual Funds (Invesco International Mutual Funds), referred to hereafter as the “Fund”) as of October 31, 2019, the related statement of operations for the year ended October 31, 2019, the statement of changes in net assets for each of the two years in the period ended October 31, 2019, including the related notes, and the financial highlights for each of the five years in the period ended October 31, 2019 (collectively referred to as the “financial statements”). In our opinion, the financial statements present fairly, in all material respects, the financial position of the Fund as of October 31, 2019, the results of its operations for the year then ended, the changes in its net assets for each of the two years in the period ended October 31, 2019 and the financial highlights for each of the five years in the period ended October 31, 2019 in conformity with accounting principles generally accepted in the United States of America.
Basis for Opinion
These financial statements are the responsibility of the Fund’s management. Our responsibility is to express an opinion on the Fund’s financial statements based on our audits. We are a public accounting firm registered with the Public Company Accounting Oversight Board (United States) (PCAOB) and are required to be independent with respect to the Fund in accordance with the U.S. federal securities laws and the applicable rules and regulations of the Securities and Exchange Commission and the PCAOB.
We conducted our audits of these financial statements in accordance with the standards of the PCAOB. Those standards require that we plan and perform the audit to obtain reasonable assurance about whether the financial statements are free of material misstatement, whether due to error or fraud.
Our audits included performing procedures to assess the risks of material misstatement of the financial statements, whether due to error or fraud, and performing procedures that respond to those risks. Such procedures included examining, on a test basis, evidence regarding the amounts and disclosures in the financial statements. Our audits also included evaluating the accounting principles used and significant estimates made by management, as well as evaluating the overall presentation of the financial statements. Our procedures included confirmation of securities owned as of October 31, 2019 by correspondence with the custodian and transfer agent. We believe that our audits provide a reasonable basis for our opinion.
/s/PricewaterhouseCoopers LLP
Houston, Texas
December 23, 2019
We have served as the auditor of one or more of the investment companies in the Invesco group of investment companies since at least 1995. We have not been able to determine the specific year we began serving as auditor.
21 Invesco Select Opportunities Fund
Calculating your ongoing Fund expenses
Example
As a shareholder of the Fund, you incur two types of costs: (1) transaction costs, which may include sales charges (loads) on purchase payments or contingent deferred sales charges on redemptions, if any; and (2) ongoing costs, including management fees, distribution and/or service(12b-1) fees, and other Fund expenses. This example is intended to help you understand your ongoing costs (in dollars) of investing in the Fund and to compare these costs with ongoing costs of investing in other mutual funds. The example is based on an investment of $1,000 invested at the beginning of the period and held for the entire period May 1, 2019 through October 31, 2019.
Actual expenses
The table below provides information about actual account values and actual expenses. You may use the information in this table, together with the amount you invested, to estimate the expenses that you paid over the period. Simply divide your account value by $1,000 (for example, an $8,600 account value divided by $1,000 = 8.6), then multiply the result by the number in the table under the heading entitled “Actual Expenses Paid During Period” to estimate the expenses you paid on your account during this period.
Hypothetical example for comparison purposes
The table below also provides information about hypothetical account values and hypothetical expenses based on the Fund’s actual expense ratio and an assumed rate of return of 5% per year before expenses, which is not the Fund’s actual return.
The hypothetical account values and expenses may not be used to estimate the actual ending account balance or expenses you paid for the period. You may use this information to compare the ongoing costs of investing in the Fund and other funds. To do so, compare this 5% hypothetical example with the 5% hypothetical examples that appear in the shareholder reports of the other funds.
Please note that the expenses shown in the table are meant to highlight your ongoing costs only and do not reflect any transaction costs, such as sales charges (loads) on purchase payments or contingent deferred sales charges on redemptions, if any. Therefore, the hypothetical information is useful in comparing ongoing costs only, and will not help you determine the relative total costs of owning different funds. In addition, if these transaction costs were included, your costs would have been higher.
| | | | | | | | | | | | |
| | | Beginning
Account Value
(05/01/19) | | ACTUAL | | HYPOTHETICAL (5% annual return before expenses) | | Annualized
Expense Ratio |
| | Ending
Account Value
(10/31/19)1 | | Expenses
Paid During
Period2 | | Ending
Account Value
(10/31/19) | | Expenses
Paid During
Period2 |
Class A | | $1,000.00 | | $958.50 | | $5.04 | | $1,020.06 | | $5.19 | | 1.02% |
Class C | | 1,000.00 | | 955.00 | | 8.72 | | 1,016.28 | | 9.00 | | 1.77 |
Class R | | 1,000.00 | | 957.90 | | 6.27 | | 1,018.80 | | 6.46 | | 1.27 |
Class Y | | 1,000.00 | | 959.70 | | 3.80 | | 1,021.32 | | 3.92 | | 0.77 |
Class R5 | | 1,000.00 | | 960.40 | | 3.80 | | 1,021.32 | | 3.92 | | 0.77 |
Class R6 | | 1,000.00 | | 960.30 | | 3.80 | | 1,021.32 | | 3.92 | | 0.77 |
| 1 | The actual ending account value is based on the actual total return of the Fund for the period May 1, 2019 through October 31, 2019, after actual expenses and will differ from the hypothetical ending account value which is based on the Fund’s expense ratio and a hypothetical annual return of 5% before expenses. |
| 2 | Expenses are equal to the Fund’s annualized expense ratio as indicated above multiplied by the average account value over the period, multiplied by 184/365 to reflect the most recent fiscal half year. |
22 Invesco Select Opportunities Fund
Approval of Investment Advisory andSub-Advisory Contracts
At meetings held on June 10, 2019, the Board of Trustees (the Board or the Trustees) of AIM International Mutual Funds (Invesco International Mutual Funds) as a whole, and the independent Trustees, who comprise over 75% of the Board, voting separately, approved the continuance of the Invesco Select Opportunities Fund’s (the Fund) Master Investment Advisory Agreement with Invesco Advisers, Inc. (Invesco Advisers and the investment advisory agreement) and the Master IntergroupSub-Advisory Contract for Mutual Funds with Invesco Asset Management Deutschland GmbH, Invesco Asset Management Limited, Invesco Asset Management (Japan) Limited, Invesco Hong Kong Limited, Invesco Senior Secured Management, Inc. and Invesco Canada Ltd. and a separatesub-advisory contract with Invesco Capital Management LLC (collectively, the AffiliatedSub-Advisers and thesub-advisory contracts) for another year, effective July 1, 2019. After evaluating the factors discussed below, among others, the Board approved the renewal of the Fund’s investment advisory agreement and thesub-advisory contracts and determined that the compensation payable by the Fund to Invesco Advisers and by Invesco Advisers to the AffiliatedSub-Advisers is fair and reasonable.
The Board’s Evaluation Process
The Board’s Investments Committee has established threeSub-Committees, which meet throughout the year to review the performance of funds advised by Invesco Advisers (the Invesco Funds). As part of a regularly scheduled basis ofin-person Board meetings, theSub-Committees meet with portfolio managers for their assigned Invesco Funds and other members of management to review detailed information about investment performance and portfolio attributes of these funds. The Board took into account evaluations and reports that it received from the Investments
Committee andSub-Committees, as well as the information provided to such committees and the Board throughout the year, in considering whether to approve each Invesco Fund’s investment advisory agreement andsub-advisory contracts.
As part of the contract renewal process, the Board reviews and considers information provided in response to detailed requests for information submitted to management by the independent Trustees with assistance from legal counsel to the independent Trustees. The Board receives comparative investment performance and fee data regarding the Invesco Funds prepared by Invesco Advisers and Broadridge Financial Solutions, Inc. (Broadridge), an independent mutual fund data provider. The Board also receives an independent written evaluation from the Senior Officer, an officer of
the Invesco Funds who reports directly to the independent Trustees. The Senior Officer’s evaluation is prepared as part of his responsibility to manage the process by which the Invesco Funds’ proposed management fees are negotiated during the annual contract renewal process to ensure they are negotiated in a manner that is at arms’ length and reasonable. In addition to meetings with Invesco Advisers and fund counsel throughout the year, the independent Trustees also discuss the continuance of the investment advisory agreement andsub-advisory contracts in separate sessions with the Senior Officer and with independent legal counsel.
The discussion below is a summary of the Senior Officer’s independent written evaluation with respect to the Fund’s investment advisory agreement, as well as a discussion of the material factors and related conclusions that formed the basis for the Board’s approval of the Fund’s investment advisory agreement andsub-advisory contracts. The Trustees’ review and conclusions are based on the comprehensive consideration of all information presented to them during the course of the year and in prior years and are not the result of any single determinative factor. Moreover, one Trustee may have weighed a particular piece of information or factor differently than another Trustee. This information is current as of June 10, 2019.
Factors and Conclusions and Summary of Independent Written Fee Evaluation
| A. | Nature, Extent and Quality of Services Provided by Invesco Advisers and the AffiliatedSub-Advisers |
The Board reviewed the nature, extent and quality of the advisory services provided to the Fund by Invesco Advisers under the Fund’s investment advisory agreement, and the credentials and experience of the officers and employees of Invesco Advisers who provide these services, including the Fund’s portfolio manager(s). The Board’s review included consideration of Invesco Advisers’ investment process oversight and structure, credit analysis and investment risk management. The Board also considerednon-advisory services that Invesco Advisers and its affiliates provide to the Invesco Funds such as various back office support functions, third party oversight, internal audit, valuation, portfolio trading and legal and compliance. The Board also received and reviewed information about Invesco Advisers’ role as administrator of the Invesco Funds’ liquidity risk management program. The Board also reviewed and considered the benefits to shareholders of investing in a fund that is part of the Invesco family of funds under the umbrella of Invesco Ltd., Invesco Advisers’
parent company, and noted Invesco Ltd.’s depth and experience in conducting an investment management business, as well as its commitment of financial and other resources to such business. The Board reviewed and considered information about the resources that Invesco Advisers intends to continue to commit to managing the Invesco family of funds following Invesco Ltd.’s acquisition of OppenheimerFunds, Inc. and its subsidiaries. The Board concluded that the nature, extent and quality of the services provided to the Fund by Invesco Advisers are appropriate and satisfactory.
The Board reviewed the services that may be provided by the AffiliatedSub-Advisers under thesub-advisory contracts and the credentials and experience of the officers and employees of the AffiliatedSub-Advisers who provide these services. The Board noted the AffiliatedSub-Advisers’ expertise with respect to certain asset classes and that the AffiliatedSub-Advisers have offices and personnel that are located in financial centers around the world. As a result, the Board noted that the AffiliatedSub-Advisers can provide research and investment analysis on the markets and economies of various countries in which the Fund may invest, make recommendations regarding securities and assist with security trades. The Board concluded that thesub-advisory contracts may benefit the Fund and its shareholders by permitting Invesco Advisers to use the resources and talents of the AffiliatedSub-Advisers in managing the Fund. The Board concluded that the nature, extent and quality of the services that may be provided by the AffiliatedSub-Advisers are appropriate and satisfactory.
| B. | Fund Investment Performance |
The Board considered Fund investment performance as a relevant factor in considering whether to approve the investment advisory agreement as well as thesub-advisory contracts for the Fund, as Invesco Canada Ltd. currently manages assets of the Fund.
The Board compared the Fund’s investment performance over multiple time periods ending December 31, 2018 to the performance of funds in the Broadridge performance universe and against the Lipper GlobalSmall/Mid-Cap Funds Index. The Board noted that performance of Class A shares of the Fund was in the fifth quintile of its performance universe for the one and five year periods and the fourth quintile for the three year period (the first quintile being the best performing funds and the fifth quintile being the worst performing funds). The Board noted that performance of Class A shares of the Fund was below the performance of the Index for the one, three and five year periods. The
23 Invesco Select Opportunities Fund
Board noted that the Fund’s cash position and underweight and overweight exposure to and stock selection in certain sectors detracted from performance. The Trustees also reviewed more recent Fund performance and this review did not change their conclusions.
| C. | Advisory andSub-Advisory Fees and Fund Expenses |
The Board compared the Fund’s contractual management fee rate to the contractual management fee rates of funds in the Fund’s Broadridge expense group. The Board noted that the contractual management fee rate for Class A shares of the Fund was below the median contractual management fee rate of funds in its expense group. The Board noted that the term “contractual management fee” for funds in the expense group may include both advisory and certainnon-portfolio management administrative services fees, but that Broadridge does not provide information on a fund by fund basis as to what is included. The Board also reviewed the methodology used by Broadridge in providing expense group information, which includes using each fund’s contractual management fee schedule (including any applicable breakpoints) as reported in the most recent prospectus or statement of additional information for each fund in the expense group. The Board also considered comparative information regarding the Fund’s total expense ratio and its various components.
The Board noted that Invesco Advisers has contractually agreed to waive fees and/or limit expenses of the Fund for the term disclosed in the Fund’s registration statement in an amount necessary to limit total annual operating expenses to a specified percentage of average daily net assets for each class of the Fund.
The Board also considered the fees charged by Invesco Advisers and the AffiliatedSub-Advisers to other similarly managed client accounts. The Board noted that Invesco Advisers or the AffiliatedSub-Advisers may charge lower fees to large institutional clients. Invesco Advisers reviewed with the Board differences in the scope of services it provides to the Invesco Funds relative to certain other types of client accounts, including management of cash flows as a result of redemptions and purchases, necessary infrastructure such as officers, office space, technology, legal and distribution, oversight of service providers, costs and business risks associated with launching new funds and sponsoring and maintaining the product line, preparation of annual registration statement updates and financial information and compliance with federal and state laws and regulations.
The Board also considered the services that may be provided by the AffiliatedSub-Advisers pursuant to thesub-advisory contracts, as well as the fees payable by Invesco Advisers to the AffiliatedSub-Advisers pursuant to the
sub-advisory contracts. The Board noted that Invesco Advisers retains overall responsibility for, and provides services to,sub-advised Invesco Funds, including oversight of the AffiliatedSub-Advisers as well as the additional services described herein other thanday-to-day portfolio management.
| D. | Economies of Scale and Breakpoints |
The Board considered the extent to which there may be economies of scale in the provision of advisory services to the Fund. The Board considered Invesco’s reinvestment in its business, including investments in business infrastructure and cybersecurity. The Board also considered that the Fund may benefit from economies of scale through contractual breakpoints in the Fund’s advisory fee schedule, which generally operate to reduce the Fund’s expense ratio as it grows in size. The Board noted that the Fund shares directly in economies of scale through lower fees charged by third party service providers based on the combined size of the Invesco Funds. The Board noted that the Fund may also benefit from economies of scale through initial fee setting, fee waivers and expense reimbursements.
| E. | Profitability and Financial Resources |
The Board reviewed information from Invesco Advisers concerning the costs of the advisory and other services that Invesco Advisers and its affiliates provide to the Fund and the Invesco Funds and the profitability of Invesco Advisers and its affiliates in providing these services. The Board considered the methodology used for calculating profitability and noted the periodic review of such methodology by an independent consultant. The Board noted that Invesco Advisers continues to operate at a net profit from services Invesco Advisers and its affiliates provide to the Invesco Funds. The Board received information from Invesco Advisers demonstrating that Invesco Advisers and the AffiliatedSub-Advisers are financially sound and have the resources necessary to perform their obligations under the investment advisory agreement andsub-advisory contracts.
| F. | Collateral Benefits to Invesco Advisers and its Affiliates |
The Board considered various other benefits received by Invesco Advisers and its affiliates from the relationship with the Fund, including the fees received for providing administrative, transfer agency and distribution services to the Fund. The Board considered comparative information regarding fees charged for these services, including information provided by Broadridge and other independent sources. The Board considered the performance of Invesco Advisers and its affiliates in providing these services and the organizational structure employed to provide these services. The Board also considered that these services are provided to the Fund pursuant to written contracts that are reviewed and approved on an annual basis by the Board; and that the services are required for the operation of the Fund.
The Board considered the benefits realized by Invesco Advisers and the AffiliatedSub-Advisers as a result of portfolio brokerage transactions executed through “soft dollar” arrangements. The Board noted that soft dollar arrangements may result in the Fund bearing costs to purchase research that may be used by Invesco Advisers or the AffiliatedSub-Advisers with other clients and may reduce Invesco Advisers’ or the AffiliatedSub-Advisers’ expenses. The Board also considered that it receives periodic reports from Invesco representing that these arrangements are consistent with regulatory requirements. The Board did not deem the soft dollar arrangements to be inappropriate.
The Board considered that the Fund’s uninvested cash and cash collateral from any securities lending arrangements may be invested in money market funds advised by Invesco Advisers pursuant to procedures approved by the Board. The Board considered information regarding the returns of the affiliated money market funds relative to comparable overnight investments, as well as the costs to the Fund of such investments. The Board noted that Invesco Advisers receives advisory fees from these affiliated money market funds attributable to such investments, although Invesco Advisers has contractually agreed to waive through varying periods the advisory fees payable by the Invesco Funds with respect to certain investments in the affiliated money market funds. The waiver is in an amount equal to 100% of the net advisory fee Invesco Advisers receives from the affiliated money market funds with respect to the Fund’s investment in the affiliated money market funds of uninvested cash, but not cash collateral. The Board concluded that the amount of advisory fees received by Invesco Advisers from the Fund’s investment of cash collateral from any securities lending arrangements in the affiliated money market funds is fair and reasonable.
The Board also considered that an affiliated broker may receive commissions for executing certain trades for the Fund. Invesco Advisers and the AffiliatedSub-Advisers may use the affiliated broker to, among other things, control order routing and minimize information leakage, and the Board was advised that such trades are executed in compliance with rules under the federal securities laws and consistent with best execution obligations.
24 Invesco Select Opportunities Fund
Tax Information
Form1099-DIV, Form1042-S and otheryear-end tax information provide shareholders with actual calendar year amounts that should be included in their tax returns. Shareholders should consult their tax advisors.
The following distribution information is being provided as required by the Internal Revenue Code or to meet a specific state’s requirement.
The Fund designates the following amounts or, if subsequently determined to be different, the maximum amount allowable for its fiscal year ended October 31, 2019:
| | | | | | |
| | | Federal and State Income Tax | | | |
| | Long-Term Capital Gain Distributions | | $ | 2,000,161 | |
| | Qualified Dividend Income* | | | 100.00 | % |
| | Corporate Dividends Received Deduction* | | | 74.47 | % |
| | U.S. Treasury Obligations* | | | 0.00 | % |
* The above percentages are based on ordinary income dividends paid to shareholders during the Fund’s fiscal year.
25 Invesco Select Opportunities Fund
Trustees and Officers
The address of each trustee and officer is AIM International Mutual Funds (Invesco International Mutual Funds) (the “Trust”), 11 Greenway Plaza, Suite 1000, Houston, Texas 77046-1173. The trustees serve for the life of the Trust, subject to their earlier death, incapacitation, resignation, retirement or removal as more specifically provided in the Trust’s organizational documents. Each officer serves for a one year term or until their successors are elected and qualified. Column two below includes length of time served with predecessor entities, if any.
| | | | | | | | | | |
Name, Year of Birth and Position(s) Held with the Trust | | Trustee and/or Officer Since | | Principal Occupation(s) During Past 5 Years | | | | Number of
Funds in
Fund Complex
Overseen by
Trustee | | Other
Directorship(s)
Held by Trustee
During Past 5 Years |
| Interested Persons |
| | | | | | |
Martin L. Flanagan1 - 1960
Trustee and Vice Chair | | 2007 | | Executive Director, Chief Executive Officer and President, Invesco Ltd. (ultimate parent of Invesco and a global investment management firm); Trustee and Vice Chair, The Invesco Funds; Vice Chair, Investment Company Institute; and Member of Executive Board, SMU Cox School of Business Formerly: Advisor to the Board, Invesco Advisers, Inc. (formerly known as Invesco Institutional (N.A.), Inc.); Chairman and Chief Executive Officer, Invesco Advisers, Inc. (registered investment adviser); Director, Chairman, Chief Executive Officer and President, Invesco Holding Company (US), Inc. (formerly IVZ Inc.) (holding company), Invesco Group Services, Inc. (service provider) and Invesco North American Holdings, Inc. (holding company); Director, Chief Executive Officer and President, Invesco Holding Company Limited (parent of Invesco and a global investment management firm); Director, Invesco Ltd.; Chairman, Investment Company Institute and President,Co-Chief Executive Officer,Co-President, Chief Operating Officer and Chief Financial Officer, Franklin Resources, Inc. (global investment management organization) | | | | 229 | | None |
| | | | | | |
Philip A. Taylor2 - 1954
Trustee | | 2006 | | Vice Chair, Invesco Ltd.; Trustee, The Invesco Funds Formerly: Director, Invesco Canada Ltd. (formerly known as Invesco Trimark Ltd./Invesco Trimark Ltèe) (registered investment adviser and registered transfer agent); Head of the Americas and Senior Managing Director, Invesco Ltd.; Director, Invesco Advisers, Inc. (formerly known as Invesco Institutional (N.A.), Inc.) (registered investment adviser); Director and Chairman, Invesco Investment Services, Inc. (formerly known as Invesco AIM Investment Services, Inc.) (registered transfer agent); Chief Executive Officer, Invesco Corporate Class Inc. (corporate mutual fund company); Chairman and Chief Executive Officer, Invesco Canada Ltd. (formerly known as Invesco Trimark Ltd./Invesco Trimark Ltèe) (registered investment adviser and registered transfer agent); Senior Vice President, The Invesco Funds; Director, Invesco Investment Advisers LLC (formerly known as Van Kampen Asset Management); Director, Chairman, Chief Executive Officer and President, Invesco Management Group, Inc. (formerly known as Invesco AIM Management Group, Inc.) (financial services holding company);Co-Chairman,Co-President andCo-Chief Executive Officer, Invesco Advisers, Inc. (formerly known as Invesco Institutional (N.A.), Inc.) (registered investment adviser); Director, Chief Executive Officer and President, Van Kampen Exchange Corp; President and Principal Executive Officer, The Invesco Funds (other than AIM Treasurer’s Series Trust (Invesco Treasurer’s Series Trust), Short-Term Investments Trust and Invesco Management Trust); Executive Vice President, The Invesco Funds (AIM Treasurer’s Series Trust (Invesco Treasurer’s Series Trust), Short-Term Investments Trust and Invesco Management Trust only); Director and President, INVESCO Funds Group, Inc. (registered investment adviser and registered transfer agent); Director and Chairman, IVZ Distributors, Inc. (formerly known as INVESCO Distributors, Inc.) (registered broker dealer); Director, President and Chairman, Invesco Inc. (holding company), Invesco Canada Holdings Inc. (holding company), Trimark Investments Ltd./Placements Trimark Ltèe and Invesco Financial Services Ltd/Services Financiers Invesco Ltèe; Chief Executive Officer, Invesco Canada Fund Inc. (corporate mutual fund company); Director and Chairman, Van Kampen Investor Services Inc.; Director, Chief Executive Officer and President, 1371 Preferred Inc. (holding company) and Van Kampen Investments Inc.; Director and President, AIM GP Canada Inc. (general partner for limited partnerships) and Van Kampen Advisors, Inc.; Director and Chief Executive Officer, Invesco Trimark Dealer Inc. (registered broker dealer); Director, Invesco Distributors, Inc. (formerly known as Invesco AIM Distributors, Inc.) (registered broker dealer); Manager, Invesco Capital Management LLC; Director, Chief Executive Officer and President, Invesco Advisers, Inc.; Director, Chairman, Chief Executive Officer and President, Invesco AIM Capital Management, Inc.; President, Invesco Trimark Dealer Inc. and Invesco Trimark Ltd./Invesco Trimark Ltèe; Director and President, AIM Trimark Corporate Class Inc. and AIM Trimark Canada Fund Inc.; Senior Managing Director, Invesco Holding Company Limited; Director and Chairman, Fund Management Company (former registered broker dealer); President and Principal Executive Officer, The Invesco Funds (AIM Treasurer’s Series Trust (Invesco Treasurer’s Series Trust), and Short-Term Investments Trust only); President, AIM Trimark Global Fund Inc. and AIM Trimark Canada Fund Inc. | | | | 229 | | None |
| 1 | Mr. Flanagan is considered an interested person (within the meaning of Section 2(a)(19) of the 1940 Act) of the Trust because he is an officer of the Adviser to the Trust, and an officer and a director of Invesco Ltd., ultimate parent of the Adviser. |
| 2 | Mr. Taylor is considered an interested person (within the meaning of Section 2(a)(19) of the 1940 Act) of the Trust because he is an officer and a director of the Adviser. |
T-1 Invesco Select Opportunities Fund
Trustees and Officers–(continued)
| | | | | | | | |
Name, Year of Birth and
Position(s) Held with the Trust | | Trustee
and/or
Officer
Since | | Principal Occupation(s) During Past 5 Years | | Number of
Funds in Fund Complex
Overseen by
Trustee | | Other
Directorship(s) Held by Trustee
During Past 5 Years |
| Independent Trustees | | |
| | | | | |
Bruce L. Crockett - 1944
Trustee and Chair | | 1992 | | Chairman, Crockett Technologies Associates (technology consulting company) Formerly: Director, Captaris (unified messaging provider); Director, President and Chief Executive Officer, COMSAT Corporation; Chairman, Board of Governors of INTELSAT (international communications company); ACE Limited (insurance company); Independent Directors Council and Investment Company Institute: Member of the Audit Committee, Investment Company Institute; Member of the Executive Committee and Chair of the Governance Committee, Independent Directors Council | | 229 | | Director and Chairman of the Audit Committee, ALPS (Attorneys Liability Protection Society) (insurance company); Director and Member of the Audit Committee and Compensation Committee, Ferroglobe PLC (metallurgical company) |
| | | | | |
David C. Arch - 1945
Trustee | | 2010 | | Chairman of Blistex Inc. (consumer health care products manufacturer); Member, World Presidents’ Organization | | 229 | | Board member of the Illinois Manufacturers’ Association |
| | | | | |
Beth Ann Brown - 1968
Trustee | | 2019 | | Independent Consultant Formerly: Head of Intermediary Distribution, Managing Director, Strategic Relations, Managing Director, Head of National Accounts, Senior Vice President, National Account Manager and Senior Vice President, Key Account Manager, Columbia Management Investment Advisers LLC; Vice President, Key Account Manager, Liberty Funds Distributor, Inc.; and Trustee of certain Oppenheimer Funds | | 229 | | Director, Board of Directors of Caron Engineering Inc.; President and Director, Acton Shapleigh Youth Conservation Corps (non - profit); and Vice President and Director of Grahamtastic Connection (non-profit) |
| | | | | |
Jack M. Fields - 1952
Trustee | | 1997 | | Chief Executive Officer, Twenty First Century Group, Inc. (government affairs company); and Chairman, Discovery Learning Alliance(non-profit) Formerly: Owner and Chief Executive Officer, Dos Angeles Ranch L.P. (cattle, hunting, corporate entertainment); Director, Insperity, Inc. (formerly known as Administaff) (human resources provider); Chief Executive Officer, Texana Timber LP (sustainable forestry company); Director of Cross Timbers Quail Research Ranch(non-profit); and member of the U.S. House of Representatives | | 229 | | None |
| | | | | |
Cynthia Hostetler - 1962
Trustee | | 2017 | | Non-Executive Director and Trustee of a number of public and private business corporations Formerly: Director, Aberdeen Investment Funds (4 portfolios); Head of Investment Funds and Private Equity, Overseas Private Investment Corporation; President, First Manhattan Bancorporation, Inc.; Attorney, Simpson Thacher & Bartlett LLP | | 229 | | Vulcan Materials Company (construction materials company); Trilinc Global Impact Fund; Genesee & Wyoming, Inc. (railroads); Artio Global Investment LLC (mutual fund complex); Edgen Group, Inc. (specialized energy and infrastructure products distributor); Investment Company Institute (professional organization); Independent Directors Council (professional organization) |
T-2 Invesco Select Opportunities Fund
Trustees and Officers–(continued)
| | | | | | | | |
Name, Year of Birth and Position(s) Held with the Trust | | Trustee
and/or
Officer
Since | | Principal Occupation(s) During Past 5 Years | | Number of
Funds
in
Fund Complex
Overseen
by Trustee | | Other Directorship(s) Held by Trustee During Past 5 Years |
| Independent Trustees–(continued) | | |
Eli Jones - 1961 Trustee | | 2016 | | Professor and Dean, Mays Business School - Texas A&M University Formerly: Professor and Dean, Walton College of Business, University of Arkansas and E.J. Ourso College of Business, Louisiana State University; Director, Arvest Bank | | 229 | | Insperity, Inc. (formerly known as Administaff) (human resources provider) |
Elizabeth Krentzman - 1959
Trustee | | 2019 | | Formerly: Principal and Chief Regulatory Advisor for Asset Management Services and U.S. Mutual Fund Leader of Deloitte & Touche LLP; General Counsel of the Investment Company Institute (trade association); National Director of the Investment Management Regulatory Consulting Practice, Principal, Director and Senior Manager of Deloitte & Touche LLP; Assistant Director of the Division of Investment Management - Office of Disclosure and Investment Adviser Regulation of the U.S. Securities and Exchange Commission and various positions with the Division of Investment Management - Office of Regulatory Policy of the U.S. Securities and Exchange Commission; Associate at Ropes & Gray LLP; Advisory Board Member of the Securities and Exchange Commission Historical Society; and Trustee of certain Oppenheimer Funds | | 229 | | Trustee of the University of Florida National Board Foundation and Audit Committee Member; Member of the Cartica Funds Board of Directors (private investment funds); Member of the University of Florida Law Center Association, Inc. Board of Trustees and Audit Committee Member |
Anthony J. LaCava, Jr. - 1956
Trustee | | 2019 | | Formerly: Director and Member of the Audit Committee, Blue Hills Bank (publicly traded financial institution) and Managing Partner, KPMG LLP | | 229 | | Blue Hills Bank; Chairman, Bentley University; Member, Business School Advisory Council; and Nominating Committee KPMG LLP |
Prema Mathai-Davis - 1950
Trustee | | 1998 | | Retired Co-Owner & Partner of Quantalytics Research, LLC, (a FinTech Investment Research Platform for the Self-Directed Investor) | | 229 | | None |
Joel W. Motley - 1952
Trustee | | 2019 | | Director of Office of Finance, Federal Home Loan Bank; Member of the Vestry of Trinity Wall Street; Managing Director of Carmona Motley Inc. (privately held financial advisor); Member of the Finance and Budget Committee of the Council on Foreign Relations, Member of the Investment Committee and Board of Human Rights Watch and Member of the Investment Committee and Board of Historic Hudson Valley(non-profit cultural organization) Formerly: Managing Director of Public Capital Advisors, LLC (privately held financial advisor); Managing Director of Carmona Motley Hoffman, Inc. (privately held financial advisor); Trustee of certain Oppenheimer Funds; and Director of Columbia Equity Financial Corp. (privately held financial advisor) | | 229 | | Director of Greenwall Foundation (bioethics research foundation); Member of Board and Investment Committee of The Greenwall Foundation; Director of Southern Africa Legal Services Foundation; Board Member and Investment Committee Member of Pulizer Center for Crisis Reporting(non-profit journalism) |
Teresa M. Ressel - 1962
Trustee | | 2017 | | Non-executive director and trustee of a number of public and private business corporations Formerly: Chief Financial Officer, Olayan America, The Olayan Group (international investor/commercial/industrial); Chief Executive Officer, UBS Securities LLC; Group Chief Operating Officer, Americas, UBS AG; Assistant Secretary for Management & Budget and CFO, US Department of the Treasury | | 229 | | Atlantic Power Corporation (power generation company); ON Semiconductor Corp. (semiconductor supplier) |
T-3 Invesco Select Opportunities Fund
Trustees and Officers–(continued)
| | | | | | | | |
Name, Year of Birth and Position(s) Held with the Trust | | Trustee
and/or
Officer
Since | | Principal Occupation(s) During Past 5 Years | | Number of
Funds in
Fund Complex
Overseen by
Trustee | | Other Directorship(s) Held by Trustee During Past 5 Years |
| Independent Trustees–(continued) | | |
Ann Barnett Stern - 1957
Trustee | | 2017 | | President and Chief Executive Officer, Houston Endowment Inc. (private philanthropic institution) Formerly: Executive Vice President and General Counsel, Texas Children’s Hospital; Attorney, Beck, Redden and Secrest, LLP; Business Law Instructor, University of St. Thomas; Attorney, Andrews & Kurth LLP | | 229 | | Federal Reserve Bank of Dallas |
Raymond Stickel, Jr. - 1944
Trustee | | 2005 | | Retired Formerly: Director, Mainstay VP Series Funds, Inc. (25 portfolios); Partner, Deloitte & Touche | | 229 | | None |
Robert C. Troccoli - 1949
Trustee | | 2016 | | Retired Formerly: Adjunct Professor, University of Denver - Daniels College of Business; Senior Partner, KPMG LLP | | 229 | | None |
Daniel S. Vandivort - 1954
Trustee | | 2019 | | Treasurer, Chairman of the Audit and Finance Committee, and Trustee, Board of Trustees, Huntington Disease Foundation of America; and President, Flyway Advisory Services LLC (consulting and property management) Formerly: Trustee and Governance Chair, of certain Oppenheimer Funds | | 229 | | Chairman and Lead Independent Director, Chairman of the Audit Committee, and Director, Board of Directors, Value Line Funds |
James D. Vaughn - 1945
Trustee | | 2019 | | Retired Formerly: Managing Partner, Deloitte & Touche LLP; Trustee and Chairman of the Audit Committee, Schroder Funds; Board Member, Mile High United Way, Boys and Girls Clubs, Boy Scouts, Colorado Business Committee for the Arts, Economic Club of Colorado and Metro Denver Network (economic development corporation); and Trustee of certain Oppenheimer Funds | | 229 | | Board member and Chairman of Audit Committee of AMG National Trust Bank; Trustee and Investment Committee member, University of South Dakota Foundation; Board member, Audit Committee Member and past Board Chair, Junior Achievement(non-profit) |
Christopher L. WIlson - 1957
Trustee, Vice Chair and Chair Designate | | 2017 | | Reitred Formerly: Director, TD Asset Management USA Inc. (mutual fund complex) (22 portfolios); Managing Partner, CT2, LLC (investing and consulting firm); President/Chief Executive Officer, Columbia Funds, Bank of America Corporation; President/Chief Executive Officer, CDC IXIS Asset Management Services, Inc.; Principal & Director of Operations, Scudder Funds, Scudder, Stevens & Clark, Inc.; Assistant Vice President, Fidelity Investments | | 229 | | ISO New England, Inc.(non-profit organization managing regional electricity market) |
T-4 Invesco Select Opportunities Fund
Trustees and Officers–(continued)
| | | | | | | | |
Name, Year of Birth and Position(s) Held with the Trust | | Trustee and/or Officer Since | | Principal Occupation(s) During Past 5 Years | | Number of
Funds in
Fund Complex
Overseen by
Trustee | | Other
Directorship(s)
Held by Trustee
During Past 5
Years |
| Other Officers | | | | | | | | |
| | | | | |
Sheri Morris – 1964 President, Principal Executive
Officer and Treasurer | | 1999 | | Head of Global Fund Services, Invesco Ltd.; President, Principal Executive Officer and Treasurer, The Invesco Funds; Vice President, Invesco Advisers, Inc. (formerly known as Invesco Institutional (N.A.), Inc.) (registered investment adviser); and Vice President, Invesco Exchange-Traded Fund Trust, Invesco Exchange-Traded Fund Trust II, Invesco India Exchange-Traded Fund Trust, Invesco Actively Managed Exchange-Traded Fund Trust, Invesco Actively Managed Exchange-Traded Commodity Fund Trust and Invesco Exchange-Traded Self-Indexed Fund Trust; and Vice President, OppenheimerFunds, Inc. Formerly: Vice President and Principal Financial Officer, The Invesco Funds; Vice President, Invesco AIM Advisers, Inc., Invesco AIM Capital Management, Inc. and Invesco AIM Private Asset Management, Inc.; Assistant Vice President and Assistant Treasurer, The Invesco Funds and Assistant Vice President, Invesco Advisers, Inc., Invesco AIM Capital Management, Inc. and Invesco AIM Private Asset Management, Inc.; and Treasurer, Invesco Exchange-Traded FundTrust, Invesco Exchange-Traded Fund Trust II, Invesco India Exchange-Traded Fund Trust and Invesco Actively Managed Exchange-Traded Fund Trust | | N/A | | N/A |
| | | | | |
Russell C. Burk - 1958
Senior Vice President and Senior Officer | | 2005 | | Senior Vice President and Senior Officer, The Invesco Funds | | N/A | | N/A |
| | | | | |
Jeffrey H. Kupor - 1968
Senior Vice President, Chief Legal Officer and Secretary | | 2018 | | Head of Legal of the Americas, Invesco Ltd.; Senior Vice President and Secretary, Invesco Advisers, Inc. (formerly known as Invesco Institutional (N.A.), Inc.) (registered investment adviser); Senior Vice President and Secretary, Invesco Distributors, Inc. (formerly known as Invesco AIM Distributors, Inc.); Vice President and Secretary, Invesco Investment Services, Inc. (formerly known as Invesco AIM Investment Services, Inc.) Senior Vice President, Chief Legal Officer and Secretary, The Invesco Funds; Secretary and General Counsel, Invesco Investment Advisers LLC (formerly known as Van Kampen Asset Management); Secretary and General Counsel, Invesco Capital Markets, Inc. (formerly known as Van Kampen Funds Inc.) and Chief Legal Officer, Invesco Exchange-Traded Fund Trust, Invesco Exchange-Traded Fund Trust II, Invesco India Exchange-Traded Fund Trust, Invesco Actively Managed Exchange-Traded Fund Trust, Invesco Actively Managed Exchange-Traded Commodity Fund Trust and Invesco Exchange-Traded Self-Indexed Fund Trust; Secretary, Invesco Indexing LLC; Secretary, W.L. Ross & Co., LLC | | N/A | | N/A |
| | | | | |
| | | | | Formerly: Secretary and Vice President, Jemstep, Inc.; Head of Legal, Worldwide Institutional, Invesco Ltd.; Secretary and General Counsel, INVESCO Private Capital Investments, Inc.; Senior Vice President, Secretary and General Counsel, Invesco Management Group, Inc. (formerly known as Invesco AIM Management Group, Inc.); Assistant Secretary, INVESCO Asset Management (Bermuda) Ltd.; Secretary and General Counsel, Invesco Private Capital, Inc.; Assistant Secretary and General Counsel, INVESCO Realty, Inc.; Secretary and General Counsel, Invesco Senior Secured Management, Inc.; and Secretary, Sovereign G./P. Holdings Inc. | | | | |
| | | | | |
Andrew R. Schlossberg - 1974
Senior Vice President | | 2019 | | Head of the Americas and Senior Managing Director, Invesco Ltd.; Director and Senior Vice President, Invesco Advisers, Inc. (formerly known as Invesco Institutional (N.A.), Inc.) (registered investment adviser); Director and Chairman, Invesco Investment Services, Inc. (formerly known as Invesco AIM Investment Services, Inc.) (registered transfer agent); Senior Vice President, The Invesco Funds; Director, Invesco Investment Advisers LLC (formerly known as Van Kampen Asset Management); Director, President and Chairman, Invesco Insurance Agency, Inc. Formerly: Director, Invesco UK Limited; Director and Chief Executive, Invesco Asset Management Limited and Invesco Fund Managers Limited; Assistant Vice President, The Invesco Funds; Senior Vice President, Invesco Advisers, Inc. (formerly known as Invesco Institutional (N.A.), Inc.) (registered investment adviser); Director and Chief Executive, Invesco Administration Services Limited and Invesco Global Investment Funds Limited; Director, Invesco Distributors, Inc.; Head of EMEA, Invesco Ltd.; President, Invesco Actively Managed Exchange-Traded Commodity Fund Trust, Invesco Actively Managed Exchange-Traded Fund Trust, Invesco Exchange-Traded Fund Trust, Invesco Exchange-Traded Fund Trust II and Invesco India Exchange-Traded Fund Trust; Managing Director and Principal Executive Officer, Invesco Capital Management LLC | | N/A | | N/A |
T-5 Invesco Select Opportunities Fund
Trustees and Officers–(continued)
| | | | | | | | |
Name, Year of Birth and
Position(s) Held with the Trust | | Trustee
and/or
Officer
Since | | Principal Occupation(s)
During Past 5 Years | | Number of
Funds in
Fund Complex
Overseen by
Trustee | | Other
Directorship(s)
Held by Trustee
During Past 5
Years |
| | | | | |
Other Officers–(continued) | | | | | | | | |
| | | | | |
John M. Zerr - 1962 Senior Vice President | | 2006 | | Chief Operating Officer of the Americas; Senior Vice President, Invesco Advisers, Inc. (formerly known as Invesco Institutional (N.A.), Inc.) (registered investment adviser); Senior Vice President, Invesco Distributors, Inc. (formerly known as Invesco AIM Distributors, Inc.); Director and Vice President, Invesco Investment Services, Inc. (formerly known as Invesco AIM Investment Services, Inc.) Senior Vice President, The Invesco Funds; Managing Director, Invesco Capital Management LLC; Director, Invesco Investment Advisers LLC (formerly known as Van Kampen Asset Management); Senior Vice President, Invesco Capital Markets, Inc. (formerly known as Van Kampen Funds Inc.); Manager, Invesco Indexing LLC; Manager, Invesco Specialized Products, LLC; Director and Senior Vice President, Invesco Insurance Agency, Inc.; Member, Invesco Canada Funds Advisory Board; Director, President and Chief Executive Officer, Invesco Corporate Class Inc. (corporate mutual fund company); and Director, Chairman, President and Chief Executive Officer, Invesco Canada Ltd. (formerly known as Invesco Trimark Ltd./Invesco Trimark Ltèe) (registered investment adviser and registered transfer agent) | | N/A | | N/A |
| | | | | |
| | | | | Formerly: Director and Senior Vice President, Invesco Management Group, Inc. (formerly known as Invesco AIM Management Group, Inc.); Secretary and General Counsel, Invesco Management Group, Inc. (formerly known as Invesco AIM Management Group, Inc.); Secretary, Invesco Investment Services, Inc. (formerly known as Invesco AIM Investment Services, Inc.); Chief Legal Officer and Secretary, The Invesco Funds; Secretary and General Counsel, Invesco Investment Advisers LLC (formerly known as Van Kampen Asset Management); Secretary and General Counsel, Invesco Capital Markets, Inc. (formerly known as Van Kampen Funds Inc.); Chief Legal Officer, Invesco Exchange-Traded Fund Trust, Invesco Exchange-Traded Fund Trust II, Invesco India Exchange-Traded Fund Trust, Invesco Actively Managed Exchange-Traded Fund Trust, Invesco Actively Managed Exchange-Traded Commodity Fund Trust and Invesco Exchange-Traded Self-Indexed Fund Trust; Secretary, Invesco Indexing LLC; Director, Secretary, General Counsel and Senior Vice President, Van Kampen Exchange Corp.; Director, Vice President and Secretary, IVZ Distributors, Inc. (formerly known as INVESCO Distributors, Inc.); Director and Vice President, INVESCO Funds Group, Inc.; Director and Vice President, Van Kampen Advisors Inc.; Director, Vice President, Secretary and General Counsel, Van Kampen Investor Services Inc.; Director and Secretary, Invesco Distributors, Inc. (formerly known as Invesco AIM Distributors, Inc.); Director, Senior Vice President, General Counsel and Secretary, Invesco AIM Advisers, Inc. and Van Kampen Investments Inc.; Director, Vice President and Secretary, Fund Management Company; Director, Senior Vice President, Secretary, General Counsel and Vice President, Invesco AIM Capital Management, Inc.; Chief Operating Officer and General Counsel, Liberty Ridge Capital, Inc. (an investment adviser) | | | | |
| | | | | |
| Gregory G. McGreevey - 1962 Senior Vice President | | 2012 | | Senior Managing Director, Invesco Ltd.; Director, Chairman, President, and Chief Executive Officer, Invesco Advisers, Inc. (formerly known as Invesco Institutional (N.A.), Inc.) (registered investment adviser); Director, Invesco Mortgage Capital, Inc. and Invesco Senior Secured Management, Inc.; and Senior Vice President, The Invesco Funds; and President, SNW Asset Management Corporation Formerly: Senior Vice President, Invesco Management Group, Inc. and Invesco Advisers, Inc.; Assistant Vice President, The Invesco Funds | | N/A | | N/A |
| | | | | |
| Kelli Gallegos – 1970 Vice President, Principal Financial Officer and Assistant Treasurer | | 2008 | | Principal Financial and Accounting Officer – Investments Pool, Invesco Specialized Products, LLC; Vice President, Principal Financial Officer and Assistant Treasurer, The Invesco Funds; Principal Financial and Accounting Officer – Pooled Investments, Invesco Capital Management LLC; Vice President and Treasurer, Invesco Exchange-Traded Fund Trust, Invesco Exchange-Traded Fund Trust II, Invesco India Exchange-Traded Fund Trust, Invesco Actively Managed Exchange-Traded Fund Trust, Invesco Actively Managed Exchange-Traded Commodity Fund Trust and Invesco Exchange-Traded Self-Indexed Fund Trust Formerly: Assistant Treasurer, Invesco Specialized Products, LLC; Assistant Treasurer, Invesco Exchange-Traded Fund Trust, Invesco Exchange-Traded Fund Trust II, Invesco India Exchange-Traded Fund Trust, Invesco Actively Managed Exchange-Traded Fund Trust, Invesco Actively Managed Exchange-Traded Commodity Fund Trust and Invesco Exchange-Traded Self-Indexed Fund Trust; Assistant Treasurer, Invesco Capital Management LLC; Assistant Vice President, The Invesco Funds | | N/A | | N/A |
T-6 Invesco Select Opportunities Fund
Trustees and Officers–(continued)
| | | | | | | | |
Name, Year of
Birth and
Position(s) Held with the
Trust | | Trustee
and/or
Officer
Since | | Principal Occupation(s) During Past 5 Years | | Number of
Funds in
Fund Complex
Overseen by
Trustee | | Other
Directorship(s)
Held by Trustee
During Past 5
Years |
| | | | |
Other Officers–(continued) | | | | | | |
| | | | | |
| Crissie M. Wisdom - 1969 Anti-Money Laundering Compliance Officer | | 2013 | | Anti-Money Laundering Compliance Officer, Invesco Advisers, Inc. (formerly known as Invesco Institutional (N.A.), Inc.) (registered investment adviser), Invesco Capital Markets, Inc. (formerly known as Van Kampen Funds Inc.), Invesco Distributors, Inc., Invesco Investment Services, Inc., The Invesco Funds, and Invesco Exchange-Traded Fund Trust, Invesco Exchange-Traded Fund Trust II, Invesco India Exchange-Traded Fund Trust, Invesco Actively Managed Exchange-Traded Fund Trust, Invesco Actively Managed Exchange-Traded Commodity Fund Trust and Invesco Exchange-Traded Self-Indexed Fund Trust; Anti-Money Laundering Compliance Officer and Bank Secrecy Act Officer, INVESCO National Trust Company and Invesco Trust Company; and Fraud Prevention Manager and Controls and Risk Analysis Manager for Invesco Investment Services, Inc. Formerly: Anti-Money Laundering Compliance Officer, Van Kampen Exchange Corp. and Invesco Management Group, Inc. | | N/A | | N/A |
| | | | | |
| Robert R. Leveille – 1969 Chief Compliance Officer | | 2016 | | Chief Compliance Officer, Invesco Advisers, Inc. (registered investment adviser); and Chief Compliance Officer, The Invesco Funds Formerly: Chief Compliance Officer, Putnam Investments and the Putnam Funds | | N/A | | N/A |
The Statement of Additional Information of the Trust includes additional information about the Fund’s Trustees and is available upon request, without charge, by calling 1.800.959.4246. Please refer to the Fund’s Statement of Additional Information for information on the Fund’ssub-advisers.
| | | | | | |
| Office of the Fund | | Investment Adviser | | Distributor | | Auditors |
11 Greenway Plaza, Suite 1000
Houston, TX 77046-1173 | | Invesco Advisers, Inc.
1555 Peachtree Street, N.E.
Atlanta, GA 30309 | | Invesco Distributors, Inc.
11 Greenway Plaza, Suite 1000
Houston, TX 77046-1173 | | PricewaterhouseCoopers LLP 1000 Louisiana Street, Suite 5800 Houston, TX 77002-5678 |
| | | |
| Counsel to the Fund | | Counsel to the Independent Trustees | | Transfer Agent | | Custodian |
Stradley Ronon Stevens & Young, LLP
2005 Market Street, Suite 2600
Philadelphia, PA 19103-7018 | | Goodwin Procter LLP
901 New York Avenue, N.W.
Washington, D.C. 20001 | | Invesco Investment Services, Inc.
11 Greenway Plaza, Suite 1000
Houston, TX 77046-1173 | | State Street Bank and Trust Company 225 Franklin Street
Boston, MA 02110-2801 |
T-7 Invesco Select Opportunities Fund
(This page intentionally left blank)
(This page intentionally left blank)
(This page intentionally left blank)

Go paperless with eDelivery
Visit invesco.com/edelivery to enjoy the convenience and security of anytime electronic access to your investment documents.
With eDelivery, you can elect to have any or all of the following materials delivered straight to your inbox to download, save and print from your own computer:
| ∎ | | Fund reports and prospectuses |
Invesco mailing information
Send general correspondence to Invesco Investment Services, Inc., P.O. Box 219078, Kansas City, MO 64121-9078.
Important notice regarding delivery of security holder documents
To reduce Fund expenses, only one copy of most shareholder documents may be mailed to shareholders with multiple accounts at the same address (Householding). Mailing of your shareholder documents may be householded indefinitely unless you instruct us otherwise. If you do not want the mailing of these documents to be combined with those for other members of your household, please contact Invesco Investment Services, Inc. at 800 959 4246 or contact your financial institution. We will begin sending you individual copies for each account within 30 days after receiving your request.
Fund holdings and proxy voting information
The Fund provides a complete list of its holdings four times in each fiscal year, at the quarter-ends. For the second and fourth quarters, the list appears in the Fund’s semiannual and annual reports to shareholders. For the first and third quarters, the Fund files the lists with the Securities and Exchange Commission (SEC) as an exhibit to its reports on FormN-PORT. The most recent list of portfolio holdings is available at invesco.com/completeqtrholdings. Shareholders can also look up the Fund’s FormN-PORT filings on the SEC website, sec.gov. The SEC file numbers for the Fund are shown below.
A description of the policies and procedures that the Fund uses to determine how to vote proxies relating to portfolio securities is available without charge, upon request, from our Client Services department at 800 959 4246, or at invesco.com/ proxyguidelines. The information is also available on the SEC website, sec.gov.
| | |
| Information regarding how the Fund voted proxies related to its portfolio securities during the most recent12-month period ended June 30 is available at invesco.com/proxysearch. This information is also available on the SEC website, sec.gov. | | |
| Invesco Advisers, Inc. is an investment adviser; it provides investment advisory services to individual and institutional clients and does not sell securities. Invesco Distributors, Inc. is the US distributor for Invesco Ltd.’s retail mutual funds, exchange-traded funds and institutional money market funds. Both are wholly owned, indirect subsidiaries of Invesco Ltd. | |  |
SEC file numbers:811-06463 and033-44611 Invesco Distributors,Inc. SOPP-AR-1
| | | | |
 | | Annual Report | | 10/31/2019 |
| | | | |
| | |
| | | | |
| | | | |
| | | | |
| | | | |
| | | | |
| | | | |
| | | | |
| | | | |
| | | | |
| | Invesco Oppenheimer Global Multi-Asset Growth Fund* |
| | | | |
| | | | |
| | | | |
| | | | |
| | Beginning on January 1, 2021, as permitted by regulations adopted by the Securities and Exchange Commission, paper copies of the Fund’s shareholder reports will no longer be sent by mail, unless you specifically request paper copies of the reports from the Fund or from your financial intermediary, such as a broker-dealer or bank. Instead, the reports will be made available on the Fund’s website, and you will be notified by mail each time a report is posted and provided with a website link to access the report. If you already elected to receive shareholder reports electronically, you will not be affected by this change and you need not take any action. You may elect to receive shareholder reports and other communications from the Fund electronically by contacting your financial intermediary (such as a broker-dealer or bank) or, if you are a direct investor, by enrolling at invesco. com/edelivery. You may elect to receive all future reports in paper free of charge. If you invest through a financial intermediary, you can contact your financial intermediary to request that you continue to receive paper copies of your shareholder reports. If you invest directly with the Fund, you can call 800 959 4246 to let the Fund know you wish to continue receiving paper copies of your shareholder reports. Your election to receive reports in paper will apply to all funds held with your financial intermediary or all funds held with the fund complex if you invest directly with the Fund. *Prior to the close of business on May 24, 2019, the Fund’s name was Oppenheimer Global Multi-Asset Growth Fund. See Important Update on the following page for more information. |
Important Update
On October 18, 2018, Massachusetts Mutual Life Insurance Company, an indirect corporate parent of OppenheimerFunds, Inc. and its subsidiaries OFI Global Asset Management, Inc., OFI SteelPath, Inc. and OFI Advisors, LLC, announced that it had entered into an agreement whereby Invesco Ltd., a global investment management company would acquire OppenheimerFunds and its subsidiaries (together, “OppenheimerFunds”). After the close of business on May 24, 2019 Invesco Ltd. completed the acquisition of OppenheimerFunds. This Fund was included in that acquisition and as of that date, became part of the Invesco family of funds. Please visit invesco.com for more information or call Invesco’s Client Services team at800-959-4246.
Table of Contents
Class A Shares
AVERAGE ANNUAL TOTAL RETURNS AT 10/31/19
| | | | | | |
| | | Class A Shares of the Fund | | |
| | | Without Sales Charge | | With Sales Charge | | MSCI All Country World Index |
| 1-Year | | 9.61% | | 3.54% | | 12.59% |
| Since Inception (8/27/15) | | 5.57 | | 4.16 | | 9.50 |
Performance quoted is past performance and cannot guarantee comparablefuture results; current performance may be lower or higher.Visit invesco.com for the most recentmonth-end performance. Performance figures reflect reinvested distributions and changes in net asset value (NAV). Investment return and principal value will vary so that you may have a gain or a loss when you sell shares. Fund returns include changes in share price, reinvested distributions and a 5.50% maximum applicable sales charge except where “without sales charge” is indicated. Returns for periods of less than one year are cumulative and not annualized. As the result of a reorganization after the close of business on May 24, 2019, the returns of the Fund for periods on or prior to May 24, 2019 reflect performance of the Oppenheimer predecessor fund. Share class returns will differ from those of the predecessor fund because they have different expenses. Returns do not consider capital gains or income taxes on an individual’s investment. See Fund prospectus and summary prospectus for more information on share classes, sales charges and new fee agreements, if any. Fund literature is available at invesco.com.
|
| 3 INVESCO OPPENHEIMER GLOBAL MULTI-ASSET GROWTH FUND |
Fund Performance Discussion
The Fund’s Class A shares (without sales charge) generated a total return of 9.61% during theone-year period ending October 31, 2019. On a relative basis, the Fund underperformed its benchmark index, the MSCI All Country World Index (the “MSCI ACWI Index”).
FUND REVIEW
During the eight-month period ending June 30, 2019, the Fund experienced underperformance versus its benchmark index due to itsbottom-up managers’ security selection component, while thetop-down asset allocation contribution was flat. From atop-down perspective, the primary contributors to the Fund’s relative performance came from the Fund’s tactical risk premia strategies across equity, bond, and oil futures. In addition, the Fund benefited from positive contributions from its factor rotation strategies in US equities and its
growth bias in international markets. In the first half of the reporting period, the Fund benefited from a defensive factor exposure in US equities via tilts toward low volatility and quality factors and tilts away from momentum and value factors. These gains were offset by performance drags within the Fund’s allocations to alternative sectors and alternative strategies. The allocation to MLPs, at the expense of US large cap core equities was a drag, given the underperformance of the sector compared to the broader equity market. The Fund’s allocation to alternative
COMPARISON OF CHANGE IN VALUE OF $10,000 HYPOTHETICAL INVESTMENTS IN:
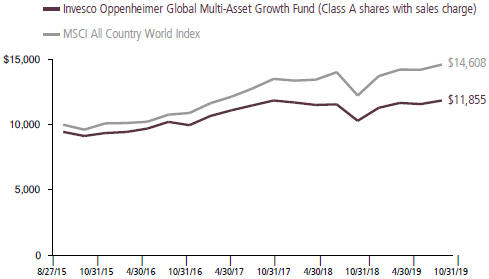
|
| 4 INVESCO OPPENHEIMER GLOBAL MULTI-ASSET GROWTH FUND |
fixed income assets, such as event-linked bonds and insurance-linked securities, was also a drag given the stronger performance of growth assets such as equities.
During the four-month ending October 31, 2019, the Fund experienced underperformance versus its benchmark index. The beginning of July 2019 saw an extension of global market conditions defined by relatively low volatility and rising prices. The generally favorable environment for global stocks took a short pause in August as heightened trade tensions, weak manufacturing data and yield curve inversions across several developed markets sent equity prices lower. Volatile conditions in developed markets faded toward the end of August and equities rallied through September and October. The 2.8% rise in the MSCI ACWI Index since June has been a tailwind for the strategy since current portfolio management took over responsibility, as the Fund has been positioned to capture global equity upside while maintaining defensive short-term U.S. treasury bill and option positions.
We believe the current landscape includes a number of catalysts for potential market volatility, including the upcoming deadline for the UK’s exit from the European Union, geopolitical tensions in the Middle East, Hong Kong turmoil and lack of resolution to the US/ China trade dispute. Meanwhile, the recent shift toward easier monetary policy will, in our view, inevitably lead to expansion in the total amount of central bank assets. The question that arises is whether these actions
will achieve the intended effect of stimulating inflation, and, if not, whether fiscal stimulus will be deployed.
Please note that our strategy utilizes derivative instruments that include futures, options, and total return swaps. Therefore, some of the performance of the strategy, both positive and negative, can be attributed to these instruments. Derivatives can be a cost-effective way to gain exposure to asset classes. However, derivatives may amplify traditional investment risks through the creation of leverage and may be less liquid than traditional securities.
Thank you for your continued investment in Invesco Oppenheimer Global Multi-Asset Growth Fund.
Mark Ahnrud, Portfolio Manager
John Burello, Portfolio Manager
Chris Devine, Portfolio Manager
Scott Hixon, Portfolio Manager
Christian Ulrich, Portfolio Manager
Scott Wolle, Portfolio Manager
|
| 5 INVESCO OPPENHEIMER GLOBAL MULTI-ASSET GROWTH FUND |
Top Holdings and Allocations
TOP TEN COMMON STOCK HOLDINGS
| | | | |
| Airbus SE | | | 1.1 | % |
| Alibaba Group Holding Ltd., Sponsored ADR | | | 1.0 | |
| SAP SE | | | 1.0 | |
| Alphabet, Inc., Cl. A | | | 1.0 | |
| LVMH Moet Hennessy Louis Vuitton SE | | | 0.9 | |
| Kering SA | | | 0.8 | |
| TDK Corp. | | | 0.5 | |
| Nidec Corp. | | | 0.5 | |
| S&P Global, Inc. | | | 0.5 | |
| Prudential plc | | | 0.5 | |
Holdings and allocations are subject to change and are not buy/sell recommendations. Percentages are as of October 31, 2019, and are based on net assets.
TOP TEN GEOGRAPHICAL HOLDINGS
| | | | |
| United States | | | 62.7 | % |
| Japan | | | 6.4 | |
| France | | | 5.7 | |
| Supranational | | | 4.6 | |
| China | | | 3.4 | |
| Germany | | | 2.5 | |
| United Kingdom | | | 1.9 | |
| Switzerland | | | 1.8 | |
| India | | | 1.5 | |
| Canada | | | 1.1 | |
Holdings and allocations are subject to change and are not buy/sell recommendations. Percentages are as of October 31, 2019, and are based on total market value of investments.
PORTFOLIO ALLOCATION
| | | | |
| Investment Companies | | | 50.1 | % |
| Common Stocks | | | 45.3 | |
| Preferred Stocks | | | 2.8 | |
| Event-Linked Bonds | | | 1.8 | |
Holdings and allocations are subject to change and are not buy/sell recommendations. Percentages are as of October 31, 2019, and are based on the total market value of investments.
REGIONAL ALLOCATION
| | | | |
| U.S./Canada | | | 63.8 | % |
| Europe | | | 14.8 | |
| Asia | | | 14.5 | |
| Supranational | | | 4.6 | |
| Latin & South America | | | 1.1 | |
| Emerging Europe | | | 0.6 | |
| Middle East/Africa | | | 0.6 | |
Holdings and allocations are subject to change and are not buy/sell recommendations. Percentages are as of October 31, 2019, and are based on total market value of investments.
For more current Fund holdings, please visit invesco.com.
|
| 6 INVESCO OPPENHEIMER GLOBAL MULTI-ASSET GROWTH FUND |
Share Class Performance
AVERAGE ANNUAL TOTAL RETURNS WITHOUT SALES CHARGE AS OF 10/31/19
| | | | | | |
| | | Inception Date | | 1-Year | | Since Inception |
| Class A (QMGAX) | | 8/27/15 | | 9.61% | | 5.57% |
| Class C (QMGCX) | | 8/27/15 | | 8.84 | | 4.78 |
| Class R (QMGRX) | | 8/27/15 | | 9.35 | | 5.30 |
| Class Y (QMGYX) | | 8/27/15 | | 9.77 | | 5.73 |
| Class R5 (GMAGX)1 | | 5/24/19 | | 9.71 | | 5.60 |
| Class R6 (QMGIX)2 | | 8/27/15 | | 9.88 | | 5.82 |
AVERAGE ANNUAL TOTAL RETURNS WITH SALES CHARGE AS OF 10/31/19
| | | | | | |
| | | Inception Date | | 1-Year | | Since Inception |
| Class A (QMGAX) | | 8/27/15 | | 3.54% | | 4.16% |
| Class C (QMGCX) | | 8/27/15 | | 7.84 | | 4.78 |
| Class R (QMGRX) | | 8/27/15 | | 9.35 | | 5.30 |
| Class Y (QMGYX) | | 8/27/15 | | 9.77 | | 5.73 |
| Class R5 (GMAGX)1 | | 5/24/19 | | 9.71 | | 5.60 |
| Class R6 (QMGIX)2 | | 8/27/15 | | 9.88 | | 5.82 |
1. Class R5 shares’ performance shown prior to the inception date (after the close of business on May 24, 2019) is that of the predecessor fund’s Class A shares at net asset value (NAV) and includes the12b-1 fees applicable to Class A shares. Class A shares’ performance reflects any applicable fee waivers and/or expense reimbursements.
2. Pursuant to the closing of the transaction described in the Notes to Consolidated Financial Statements, after the close of business on May 24, 2019, Class I shares were reorganized as Class R6 shares.
Performance quoted is past performance and cannot guarantee comparable future results; current performance may be lower or higher.Visit invesco.com for the most recentmonth-end performance. Performance figures reflect reinvested distributions and changes in net asset value (NAV). Investment return and principal value will vary so that you may have a gain or a loss when you sell shares. Performance shown at NAV does not include the applicablefront-end sales charge, which would have reduced the performance. The current maximum initial sales charge for Class A shares is 5.50%, and the contingent deferred sales charge for Class C shares is 1% for the1-year period. Class R, Class Y, Class R5 and Class R6 shares have no sales charge; therefore, performance is at NAV. Effective after the close of business on May 24, 2019, Class A, Class C, Class R, Class Y, and Class I shares of the predecessor fund were reorganized into Class A, Class C, Class R, Class Y, and Class R6 shares, respectively, of the Fund. Class R5 shares’ performance shown prior to the inception date is that of the predecessor fund’s Class A shares at NAV and includes the12b-1 fees applicable to Class A shares. Class A shares’ performance reflects any applicable fee waivers and/or expense reimbursements. Returns shown for Class A, Class C, Class R, Class Y, Class R5, and Class R6 shares are blended returns of the predecessor fund and the Fund. Share class returns will differ from those of the predecessor fund because of different expenses. Returns for periods of less than one year are cumulative and not annualized. See Fund prospectuses and summary prospectuses for more information on share classes, sales charges and new fee agreements, if any. Fund literature is available at invesco.com.
|
| 7 INVESCO OPPENHEIMER GLOBAL MULTI-ASSET GROWTH FUND |
The Fund’s performance is compared to the performance of the MSCI All Country World Index. The MSCI All Country World Index is a free float-adjusted market capitalization weighted index that is designed to measure the equity market performance of developed and emerging markets. The Index isunmanaged and cannot be purchased directly by investors. While index comparisons may be useful to provide a benchmark for the Fund’s performance, it must be noted that the Fund’s investments are not limited to the investments comprising theIndex. Index performance includes reinvestment of income, but does not reflect transaction costs, fees, expenses or taxes. Index performance is shown for illustrative purposes only as a benchmark for the Fund’s performance, and does not predict or depict performance of the Fund. The Fund’s performance reflects the effects of the Fund’s business and operating expenses.
The views and opinions expressed in management’s discussion of Fund performance are those of Invesco Advisers, Inc. These views and opinions are subject to change at any time based on factors such as market and economic conditions. These views and opinions may not be relied upon as investment advice or recommendations, or as an offer for a particular security. The information is not a complete analysis of every aspect of any market, country, industry, security or the Fund. Statements of fact are from sources considered reliable, but Invesco Advisers, Inc. makes no representation or warranty as to their completeness or accuracy. Although historical performance is no guarantee of future results, these insights may help you understand our investment management philosophy.
Before investing, investors should carefully read the prospectus and/or summary prospectus and carefully consider the investment objectives, risks, charges and expenses. For this and more complete information about the fund(s), investors should ask their advisors for a prospectus/summary prospectus or visit invesco. com/fundprospectus.
Shares of Invesco funds are not deposits or obligations of any bank, are not guaranteed by any bank, are not insured by the FDIC or any other agency, and involve investment risks, including the possible loss of the principal amount invested.
|
| 8 INVESCO OPPENHEIMER GLOBAL MULTI-ASSET GROWTH FUND |
Fund Expenses
Fund Expenses. As a shareholder of the Fund, you incur two types of costs: (1) transaction costs, which may include sales charges (loads) on purchase payments and/or contingent deferred sales charges on redemptions; and (2) ongoing costs, including management fees; distribution and service fees; and other Fund expenses. These examples are intended to help you understand your ongoing costs (in dollars) of investing in the Fund and to compare these costs with the ongoing costs of investing in other mutual funds.
The examples are based on an investment of $1,000.00 invested at the beginning of the period and held for the entire6-month period ended October 31, 2019.
Actual Expenses. The first section of the table provides information about actual account values and actual expenses. You may use the information in this section for the class of shares you hold, together with the amount you invested, to estimate the expense that you paid over the period. Simply divide your account value by $1,000.00 (for example, an $8,600.00 account value divided by $1,000.00 = 8.60), then multiply the result by the number in the first section under the heading entitled “Expenses Paid During 6 Months Ended October 31, 2019” to estimate the expenses you paid on your account during this period.
Hypothetical Example for Comparison Purposes.The second section of the table provides information about hypothetical account values and hypothetical expenses based on the Fund’s actual expense ratio for each class of shares, and an assumed rate of return of 5% per year for each class before expenses, which is not the Fund’s actual return. The hypothetical account values and expenses may not be used to estimate the actual ending account balance or expenses you paid for the period. You may use this information to compare the ongoing costs of investing in the Fund and other funds. To do so, compare this 5% hypothetical example for the class of shares you hold with the 5% hypothetical examples that appear in the shareholder reports of the other funds.
Please note that the expenses shown in the table are meant to highlight your ongoing costs only and do not reflect any transactional costs, such asfront-end or contingent deferred sales charges (loads). Therefore, the “hypothetical” section of the table is useful in comparing ongoing costs only, and will not help you determine the relative total costs of owning different funds. In addition, if these transactional costs were included, your costs would have been higher.
|
| 9 INVESCO OPPENHEIMER GLOBAL MULTI-ASSET GROWTH FUND |
| | | | | | |
| Actual | | Beginning Account Value May 1, 2019 | | Ending Account Value October 31, 2019 | | Expenses Paid During 6 Months Ended October 31, 20191,2 |
| Class A | | $ 1,000.00 | | $ 1,028.30 | | $ 5.69 |
| Class C | | 1,000.00 | | 1,024.00 | | 9.53 |
| Class R | | 1,000.00 | | 1,026.50 | | 6.97 |
| Class Y | | 1,000.00 | | 1,029.10 | | 5.02 |
| Class R5 | | 1,000.00 | | 1,029.20 | | 4.19 |
| Class R6 | | 1,000.00 | | 1,029.10 | | 4.46 |
| | | |
Hypothetical (5% return before expenses) | | | | | | |
| Class A | | 1,000.00 | | 1,019.61 | | 5.67 |
| Class C | | 1,000.00 | | 1,015.83 | | 9.49 |
| Class R | | 1,000.00 | | 1,018.35 | | 6.94 |
| Class Y | | 1,000.00 | | 1,020.27 | | 5.00 |
| Class R5 | | 1,000.00 | | 1,020.47 | | 4.80 |
| Class R6 | | 1,000.00 | | 1,020.82 | | 4.44 |
1. Actual expenses paid for Class A, C, R, Y, and R6are equal to the Fund’s annualized expense ratio for that class, multiplied by the average account value over the period, multiplied by 184/365(to reflect theone-half year period). Actual expenses paid for Class R5 are equal to the Fund’s annualized expense ratio for that class, multiplied by the average account value over the period, multiplied by 160/365to reflect the period from after the close of business on May 24, 2019 (inception of offering) to October 31, 2019.
2.Hypothetical expenses paid for all classes are equal to the Fund’s annualized expense ratio for that class, multiplied by the average account value over the period, multiplied by 184/365(to reflect theone-half year period).
Those annualized expense ratios, excluding indirect expenses from affiliated funds, based on the6-month period ended October 31, 2019 for Classes A, C, R, Y and R6and for the period from after the close of business on May 24, 2019 (inception of offering) to October 31, 2019 for Class R5 are as follows:
| | | | |
| Class | | Expense Ratios | |
| Class A | | | 1.11 | % |
| Class C | | | 1.86 | |
| Class R | | | 1.36 | |
| Class Y | | | 0.98 | |
| Class R5 | | | 0.94 | |
| Class R6 | | | 0.87 | |
The expense ratios reflect voluntary and/or contractual waivers and/or reimbursements of expenses by the Fund’s Manager. Some of these undertakings may be modified or terminated at any time, as indicated in the Fund’s prospectus. The “Consolidated Financial Highlights” tables in the Fund’s financial statements, included in this report, also show the gross expense ratios, without such waivers or reimbursements and reduction to custodian expenses, if applicable.
|
| 10 INVESCO OPPENHEIMER GLOBAL MULTI-ASSET GROWTH FUND |
CONSOLIDATED SCHEDULE OF INVESTMENTSOctober 31, 2019
| | | | | | | | |
| | | Shares | | | Value | |
| Common Stocks—44.1% | | | | | | | | |
| Consumer Discretionary—11.3% | | | | | | | | |
| Auto Components—0.4% | | | | | | | | |
| Bridgestone Corp. | | | 2,900 | | | $ | 120,467 | |
| Continental AG | | | 176 | | | | 23,527 | |
| Koito Manufacturing Co. Ltd. | | | 1,000 | | | | 52,158 | |
| Valeo SA | | | 3,391 | | | | 126,201 | |
| | | | | | | 322,353 | |
| | | | | | | | | |
| Automobiles—0.4% | | | | | | | | |
| Bayerische Motoren Werke AG | | | 867 | | | | 53,412 | |
| Suzuki Motor Corp. | | | 1,800 | | | | 84,570 | |
| Volkswagen AG | | | 841 | | | | 160,113 | |
| | | | | | | 298,095 | |
| | | | | | | | | |
| Distributors—0.1% | | | | | | | | |
| Pool Corp. | | | 265 | | | | 54,961 | |
| | | | | | | | | |
| Diversified Consumer Services—0.1% | | | | | | | | |
| Bright Horizons Family Solutions, Inc.1 | | | 333 | | | | 49,457 | |
| | | | | | | | | |
| Entertainment—1.2% | | | | | | | | |
| Capcom Co. Ltd. | | | 2,700 | | | | 64,129 | |
| Electronic Arts, Inc.1 | | | 717 | | | | 69,119 | |
| Live Nation Entertainment, Inc.1 | | | 798 | | | | 56,259 | |
| NCSoft Corp. | | | 66 | | | | 29,263 | |
| Nexon Co. Ltd.1 | | | 6,000 | | | | 69,753 | |
| Nintendo Co. Ltd. | | | 900 | | | | 321,011 | |
| Tencent Music Entertainment Group, ADR1 | | | 1 | | | | 14 | |
| Ubisoft Entertainment SA1 | | | 922 | | | | 54,445 | |
| Walt Disney Co. (The) | | | 1,310 | | | | 170,195 | |
| | | | | | | 834,188 | |
| | | | | | | | | |
| Hotels, Restaurants & Leisure—1.0% | | | | | | | | |
| Accor SA | | | 2,422 | | | | 104,104 | |
| Alsea SAB de CV1 | | | 8,431 | | | | 22,493 | |
| Carnival Corp. | | | 516 | | | | 22,131 | |
| Chipotle Mexican Grill, Inc., Cl. A1 | | | 59 | | | | 45,911 | |
| Flutter Entertainment plc | | | 274 | | | | 28,250 | |
| Hilton Worldwide Holdings, Inc. | | | 274 | | | | 26,567 | |
| Huazhu Group Ltd., ADR | | | 3,452 | | | | 130,693 | |
| International Game Technology plc | | | 3,110 | | | | 41,176 | |
| Kangwon Land, Inc. | | | 870 | | | | 23,373 | |
| Planet Fitness, Inc., Cl. A1 | | | 340 | | | | 21,644 | |
| Yum China Holdings, Inc. | | | 6,117 | | | | 259,973 | |
| | | | | | | 726,315 | |
| | | | | | | | | |
| Household Durables—0.5% | | | | | | | | |
| SEB SA3 | | | 80 | | | | 12,147 | |
| SEB SA1,3 | | | 130 | | | | 19,739 | |
|
| 11 INVESCO OPPENHEIMER GLOBAL MULTI-ASSET GROWTH FUND |
CONSOLIDATED SCHEDULE OF INVESTMENTSContinued
| | | | | | | | |
| | | Shares | | | Value | |
| Household Durables (Continued) | | | | | | | | |
| SEB SA, Prime1 | | | 392 | | | $ | 59,521 | |
| Sony Corp. | | | 4,400 | | | | 268,106 | |
| Steinhoff International Holdings NV1 | | | 13,351 | | | | 866 | |
| Taylor Wimpey plc | | | 16,863 | | | | 36,336 | |
| | | | | | | 396,715 | |
| | | | | | | | | |
| Interactive Media & Services—2.0% | | | | | | | | |
| Alphabet, Inc., Cl. A1 | | | 560 | | | | 704,928 | |
| Facebook, Inc., Cl. A1 | | | 1,740 | | | | 333,471 | |
| IAC/InterActiveCorp1 | | | 192 | | | | 43,632 | |
| Tencent Holdings Ltd. | | | 7,700 | | | | 313,988 | |
| Yandex NV, Cl. A1 | | | 1,373 | | | | 45,844 | |
| | | | | | | 1,441,863 | |
| | | | | | | | | |
| Internet & Catalog Retail—1.6% | | | | | | | | |
| Alibaba Group Holding Ltd., Sponsored ADR1 | | | 4,180 | | | | 738,481 | |
| Amazon.com, Inc.1 | | | 49 | | | | 87,056 | |
| Baozun, Inc., Sponsored ADR1 | | | 654 | | | | 28,462 | |
| Farfetch Ltd., Cl. A1 | | | 2,950 | | | | 26,343 | |
| JD.com, Inc., ADR1 | | | 5,277 | | | | 164,379 | |
| Meituan Dianping, Cl. B1 | | | 6,100 | | | | 72,882 | |
| MercadoLibre, Inc.1 | | | 25 | | | | 13,038 | |
| | | | | | | 1,130,641 | |
| | | | | | | | | |
| Leisure Products—0.2% | | | | | | | | |
| Bandai Namco Holdings, Inc. | | | 2,500 | | | | 153,991 | |
| | | | | | | | | |
| Media—0.2% | | | | | | | | |
| Altice USA, Inc., Cl. A1 | | | 689 | | | | 21,325 | |
| Cable One, Inc. | | | 23 | | | | 30,483 | |
| CyberAgent, Inc. | | | 1,500 | | | | 48,538 | |
| Zee Entertainment Enterprises Ltd. | | | 8,714 | | | | 32,018 | |
| | | | | | | 132,364 | |
| | | | | | | | | |
| Multiline Retail—0.3% | | | | | | | | |
| Dollarama, Inc. | | | 1,838 | | | | 61,834 | |
| Lojas Americanas SA | | | 12,760 | | | | 63,601 | |
| Next plc | | | 385 | | | | 32,947 | |
| SACI Falabella | | | 8,722 | | | | 44,295 | |
| | | | | | | 202,677 | |
| | | | | | | | | |
| Specialty Retail—1.0% | | | | | | | | |
| Burlington Stores, Inc.1 | | | 59 | | | | 11,338 | |
| CarMax, Inc.1 | | | 242 | | | | 22,547 | |
| Dufry AG1 | | | 580 | | | | 50,488 | |
| Industria de Diseno Textil SA | | | 8,921 | | | | 278,889 | |
| Nitori Holdings Co. Ltd. | | | 600 | | | | 91,616 | |
| O’Reilly Automotive, Inc.1 | | | 165 | | | | 71,859 | |
| Tiffany & Co. | | | 1,240 | | | | 154,392 | |
|
| 12 INVESCO OPPENHEIMER GLOBAL MULTI-ASSET GROWTH FUND |
| | | | | | | | |
| | | Shares | | | Value | |
| Specialty Retail (Continued) | | | | | | | | |
| Tractor Supply Co. | | | 355 | | | $ | 33,732 | |
| | | | | | | 714,861 | |
| | | | | | | | | |
| Textiles, Apparel & Luxury Goods—2.3% | | | | | | | | |
| Brunello Cucinelli SpA | | | 703 | | | | 22,047 | |
| Cie Financiere Richemont SA | | | 752 | | | | 59,203 | |
| Fila Korea Ltd. | | | 1,146 | | | | 56,627 | |
| Hermes International | | | 205 | | | | 147,535 | |
| Kering SA | | | 1,004 | | | | 571,805 | |
| lululemon athletica, Inc.1 | | | 307 | | | | 62,711 | |
| LVMH Moet Hennessy Louis Vuitton SE | | | 1,489 | | | | 635,685 | |
| Moncler SpA | | | 823 | | | | 31,792 | |
| PRADA SpA | | | 14,000 | | | | 48,093 | |
| VF Corp. | | | 85 | | | | 6,995 | |
| | | | | | | 1,642,493 | |
| | | | | | | | | |
| Consumer Staples—4.0% | | | | | | | | |
| Beverages—1.2% | | | | | | | | |
| Anadolu Efes Biracilik Ve Malt Sanayii AS | | | 4,472 | | | | 14,997 | |
| Britvic plc | | | 2,469 | | | | 31,576 | |
| Budweiser Brewing Co. APAC Ltd.1,2 | | | 23,900 | | | | 87,384 | |
| Coca-Cola European Partners plc | | | 1,983 | | | | 106,110 | |
| Diageo plc | | | 4,659 | | | | 190,739 | |
| Fomento Economico Mexicano SAB de CV | | | 13,543 | | | | 120,177 | |
| Fomento Economico Mexicano SAB de CV, Sponsored ADR | | | 370 | | | | 32,938 | |
| Heineken NV | | | 558 | | | | 56,939 | |
| Pernod Ricard SA | | | 1,203 | | | | 222,123 | |
| | | | | | | 862,983 | |
| | | | | | | | | |
| Food & Staples Retailing—0.3% | | | | | | | | |
| Alimentation Couche-Tard, Inc., Cl. B | | | 3,384 | | | | 101,486 | |
| Atacadao SA | | | 8,000 | | | | 38,120 | |
| BIM Birlesik Magazalar AS | | | 1,546 | | | | 12,792 | |
| CP ALL PCL | | | 22,834 | | | | 58,980 | |
| Shoprite Holdings Ltd. | | | 2,895 | | | | 25,935 | |
| Wal-Mart de Mexico SAB de CV | | | 2,773 | | | | 8,322 | |
| | | | | | | 245,635 | |
| | | | | | | | | |
| Food Products—1.0% | | | | | | | | |
| Barry Callebaut AG | | | 40 | | | | 84,507 | |
| Danone SA | | | 2,534 | | | | 210,442 | |
| Kikkoman Corp. | | | 1,500 | | | | 71,954 | |
| McCormick & Co., Inc. | | | 238 | | | | 38,244 | |
| Nestle SA | | | 335 | | | | 35,770 | |
| Saputo, Inc. | | | 1,782 | | | | 51,684 | |
| Simply Good Foods Co. (The)1 | | | 284 | | | | 6,970 | |
| Vietnam Dairy Products JSC | | | 2,372 | | | | 13,254 | |
|
| 13 INVESCO OPPENHEIMER GLOBAL MULTI-ASSET GROWTH FUND |
CONSOLIDATED SCHEDULE OF INVESTMENTSContinued
| | | | | | | | |
| | | Shares | | | Value | |
| Food Products (Continued) | | | | | | | | |
| WH Group Ltd. | | | 212,500 | | | $ | 222,844 | |
| | | | | | | 735,669 | |
| | | | | | | | | |
| Household Products—0.3% | | | | | | | | |
| Church & Dwight Co., Inc. | | | 506 | | | | 35,390 | |
| Colgate-Palmolive Co. | | | 2,760 | | | | 189,336 | |
| | | | | | | 224,726 | |
| | | | | | | | | |
| Personal Products—0.8% | | | | | | | | |
| Amorepacific Corp. | | | 736 | | | | 121,106 | |
| AMOREPACIFIC Group | | | 175 | | | | 12,698 | |
| Hengan International Group Co. Ltd. | | | 10,000 | | | | 69,818 | |
| LG Household & Health Care Ltd. | | | 108 | | | | 116,588 | |
| Natura Cosmeticos SA | | | 2,377 | | | | 18,468 | |
| Unilever plc | | | 3,700 | | | | 222,004 | |
| | | | | | | 560,682 | |
| | | | | | | | | |
| Tobacco—0.4% | | | | | | | | |
| Philip Morris International, Inc. | | | 1,301 | | | | 105,953 | |
| Swedish Match AB | | | 3,176 | | | | 149,158 | |
| | | | | | | 255,111 | |
| | | | | | | | | |
| Energy—0.9% | | | | | | | | |
| Energy Equipment & Services—0.1% | | | | | | | | |
| TechnipFMC plc | | | 2,739 | | | | 54,392 | |
| | | | | | | | | |
| Oil, Gas & Consumable Fuels—0.8% | | | | | | | | |
| BP plc | | | 8,493 | | | | 53,966 | |
| Cheniere Energy, Inc.1 | | | 270 | | | | 16,618 | |
| Diamondback Energy, Inc. | | | 181 | | | | 15,523 | |
| LUKOIL PJSC, ADR | | | 407 | | | | 37,485 | |
| Novatek PJSC, Sponsored GDR3 | | | 1,055 | | | | 225,970 | |
| Novatek PJSC, Sponsored GDR3 | | | 97 | | | | 20,564 | |
| TOTAL SA | | | 3,813 | | | | 200,979 | |
| | | | | | | 571,105 | |
| | | | | | | | | |
| Financials—5.3% | | | | | | | | |
| Capital Markets—1.2% | | | | | | | | |
| B3SA-Brasil Bolsa Balcao | | | 4,400 | | | | 53,079 | |
| China International Capital Corp. Ltd., Cl. H2 | | | 11,200 | | | | 20,302 | |
| Credit Suisse Group AG1 | | | 9,394 | | | | 116,545 | |
| Goldman Sachs Group, Inc. (The) | | | 244 | | | | 52,065 | |
| Hong Kong Exchanges & Clearing Ltd. | | | 2,282 | | | | 70,661 | |
| KKR & Co., Inc., Cl. A | | | 697 | | | | 20,094 | |
| LPL Financial Holdings, Inc. | | | 96 | | | | 7,761 | |
| MarketAxess Holdings, Inc. | | | 76 | | | | 28,013 | |
| MSCI, Inc., Cl. A | | | 228 | | | | 53,480 | |
| S&P Global, Inc. | | | 1,380 | | | | 356,026 | |
| Tradeweb Markets, Inc., Cl. A | | | 388 | | | | 16,199 | |
|
| 14 INVESCO OPPENHEIMER GLOBAL MULTI-ASSET GROWTH FUND |
| | | | | | | | |
| | | Shares | | | Value | |
| Capital Markets (Continued) | | | | | | | | |
| UBS Group AG1 | | | 3,558 | | | $ | 42,008 | |
| | | | | | | 836,233 | |
| | | | | | | | | |
| Commercial Banks—1.8% | | | | | | | | |
| Akbank TAS1 | | | 27,697 | | | | 33,459 | |
| Bandhan Bank Ltd.2 | | | 1,060 | | | | 9,144 | |
| Bank Central Asia Tbk PT | | | 9,900 | | | | 22,135 | |
| BNP Paribas SA | | | 1,595 | | | | 83,329 | |
| BOC Hong Kong Holdings Ltd. | | | 9,500 | | | | 32,652 | |
| Citigroup, Inc. | | | 3,410 | | | | 245,043 | |
| Commercial International Bank Egypt SAE | | | 5,333 | | | | 26,764 | |
| Credicorp Ltd. | | | 430 | | | | 92,037 | |
| First Republic Bank | | | 196 | | | | 20,847 | |
| Grupo Aval Acciones y Valores SA, ADR | | | 3,160 | | | | 25,754 | |
| Grupo Financiero Banorte SAB de CV, Cl. O | | | 3,386 | | | | 18,482 | |
| Grupo Financiero Inbursa SAB de CV, Cl. O | | | 23,759 | | | | 29,519 | |
| ICICI Bank Ltd., Sponsored ADR | | | 21,879 | | | | 285,083 | |
| ING Groep NV | | | 8,553 | | | | 96,638 | |
| Itau Unibanco Holding SA, ADR | | | 2,405 | | | | 21,717 | |
| Kotak Mahindra Bank Ltd. | | | 6,793 | | | | 150,794 | |
| Sberbank of Russia PJSC | | | 13,985 | | | | 51,256 | |
| Siam Commercial Bank PCL (The) | | | 5,100 | | | | 18,879 | |
| Societe Generale SA | | | 2,480 | | | | 70,483 | |
| | | | | | | 1,334,015 | |
| | | | | | | | | |
| Consumer Finance—0.0% | | | | | | | | |
| Cholamandalam Investment & Finance Co. Ltd. | | | 4,040 | | | | 17,369 | |
| | | | | | | | | |
| Diversified Financial Services—0.1% | | | | | | | | |
| FirstRand Ltd. | | | 24,401 | | | | 105,417 | |
| | | | | | | | | |
| Insurance—1.3% | | | | | | | | |
| AIA Group Ltd. | | | 17,200 | | | | 170,666 | |
| Allianz SE | | | 829 | | | | 202,324 | |
| Arthur J. Gallagher & Co. | | | 481 | | | | 43,877 | |
| Legal & General Group plc | | | 17,089 | | | | 58,515 | |
| Ping An Insurance Group Co. of China Ltd., Cl. A | | | 6,733 | | | | 83,528 | |
| Prudential plc | | | 19,750 | | | | 346,035 | |
| | | | | | | 904,945 | |
| | | | | | | | | |
| Real Estate Investment Trusts (REITs)—0.1% | | | | | | | | |
| Alexandria Real Estate Equities, Inc. | | | 183 | | | | 29,051 | |
| Americold Realty Trust | | | 437 | | | | 17,519 | |
| SBA Communications Corp., Cl. A | | | 196 | | | | 47,168 | |
| | | | | | | 93,738 | |
| | | | | | | | | |
| Real Estate Management & Development—0.5% | | | | | | | | |
| Ayala Land, Inc. | | | 37,000 | | | | 35,343 | |
| CBRE Group, Inc., Cl. A1 | | | 657 | | | | 35,182 | |
|
| 15 INVESCO OPPENHEIMER GLOBAL MULTI-ASSET GROWTH FUND |
CONSOLIDATED SCHEDULE OF INVESTMENTSContinued
| | | | | | | | |
| | | Shares | | | Value | |
| Real Estate Management & Development (Continued) | | | | | | | | |
| DLF Ltd. | | | 82,293 | | | $ | 212,539 | |
| Emaar Properties PJSC | | | 12,260 | | | | 14,249 | |
| Hang Lung Properties Ltd. | | | 2,000 | | | | 4,394 | |
| Oberoi Realty Ltd. | | | 1,725 | | | | 12,341 | |
| SM Prime Holdings, Inc. | | | 17,661 | | | | 13,558 | |
| | | | | | | 327,606 | |
| | | | | | | | | |
| Thrifts & Mortgage Finance—0.3% | | | | | | | | |
| Housing Development Finance Corp. Ltd. | | | 6,907 | | | | 207,494 | |
| | | | | | | | | |
| Health Care—4.9% | | | | | | | | |
| Biotechnology—1.2% | | | | | | | | |
| ACADIA Pharmaceuticals, Inc.1 | | | 1,262 | | | | 53,521 | |
| Ascendis Pharma AS, ADR1 | | | 150 | | | | 16,587 | |
| Bluebird Bio, Inc.1 | | | 187 | | | | 15,147 | |
| Blueprint Medicines Corp.1 | | | 750 | | | | 51,630 | |
| CSL Ltd. | | | 609 | | | | 107,191 | |
| Exact Sciences Corp.1 | | | 192 | | | | 16,704 | |
| Galapagos NV1 | | | 183 | | | | 33,707 | |
| GlycoMimetics, Inc.1 | | | 2,327 | | | | 12,287 | |
| Grifols SA | | | 4,059 | | | | 130,804 | |
| Incyte Corp.1 | | | 850 | | | | 71,332 | |
| Innovent Biologics, Inc.1,2 | | | 8,000 | | | | 24,381 | |
| Ionis Pharmaceuticals, Inc.1 | | | 1,190 | | | | 66,307 | |
| MacroGenics, Inc.1 | | | 2,180 | | | | 18,530 | |
| Mirati Therapeutics, Inc.1 | | | 407 | | | | 38,331 | |
| Sage Therapeutics, Inc.1 | | | 638 | | | | 86,545 | |
| Sarepta Therapeutics, Inc.1 | | | 476 | | | | 39,536 | |
| Shanghai Junshi Biosciences Co. Ltd., Cl. H1,2 | | | 1,800 | | | | 6,421 | |
| uniQure NV1 | | | 935 | | | | 46,787 | |
| Veracyte, Inc.1 | | | 1,240 | | | | 28,433 | |
| | | | | | | 864,181 | |
| | | | | | | | | |
| Health Care Equipment & Supplies—1.1% | | | | | | | | |
| Cooper Cos., Inc. (The) | | | 102 | | | | 29,682 | |
| DexCom, Inc.1 | | | 335 | | | | 51,670 | |
| Edwards Lifesciences Corp.1 | | | 176 | | | | 41,955 | |
| Hoya Corp. | | | 1,600 | | | | 141,964 | |
| IDEXX Laboratories, Inc.1 | | | 176 | | | | 50,162 | |
| LivaNova plc1 | | | 360 | | | | 25,463 | |
| Masimo Corp.1 | | | 215 | | | | 31,345 | |
| Medtronic plc | | | 1,260 | | | | 137,214 | |
| Novocure Ltd.1 | | | 140 | | | | 10,030 | |
| ResMed, Inc. | | | 460 | | | | 68,043 | |
| Siemens Healthineers AG2 | | | 1,469 | | | | 62,372 | |
| STERIS plc | | | 229 | | | | 32,419 | |
| West Pharmaceutical Services, Inc. | | | 220 | | | | 31,645 | |
|
| 16 INVESCO OPPENHEIMER GLOBAL MULTI-ASSET GROWTH FUND |
| | | | | | | | |
| | | Shares | | | Value | |
| Health Care Equipment & Supplies (Continued) | | | | | | | | |
| Zimmer Biomet Holdings, Inc. | | | 787 | | | $ | 108,787 | |
| | | | | | | 822,751 | |
| | | | | | | | | |
| Health Care Providers & Services—0.7% | | | | | | | | |
| Anthem, Inc. | | | 950 | | | | 255,626 | |
| Centene Corp.1 | | | 1,510 | | | | 80,150 | |
| Fresenius Medical Care AG & Co. KGaA | | | 2,003 | | | | 144,930 | |
| Sinopharm Group Co. Ltd., Cl. H | | | 9,224 | | | | 32,932 | |
| | | | | | | 513,638 | |
| | | | | | | | | |
| Health Care Technology—0.1% | | | | | | | | |
| Ping An Healthcare & Technology Co. Ltd.1,2 | | | 315 | | | | 2,153 | |
| Veeva Systems, Inc., Cl. A1 | | | 209 | | | | 29,643 | |
| | | | | | | 31,796 | |
| | | | | | | | | |
| Life Sciences Tools & Services—0.7% | | | | | | | | |
| Agilent Technologies, Inc. | | | 1,690 | | | | 128,018 | |
| Bio-Rad Laboratories, Inc., Cl. A1 | | | 86 | | | | 28,519 | |
| Bio-Techne Corp. | | | 117 | | | | 24,356 | |
| ICON plc1 | | | 259 | | | | 38,047 | |
| IQVIA Holdings, Inc.1 | | | 359 | | | | 51,847 | |
| Lonza Group AG1 | | | 281 | | | | 101,166 | |
| Samsung Biologics Co. Ltd.1,2 | | | 184 | | | | 62,629 | |
| Wuxi Biologics Cayman, Inc.1,2 | | | 3,000 | | | | 35,293 | |
| | | | | | | 469,875 | |
| | | | | | | | | |
| Pharmaceuticals—1.1% | | | | | | | | |
| Bayer AG | | | 2,494 | | | | 193,496 | |
| Hansoh Pharmaceutical Group Co. Ltd.1,2 | | | 4,000 | | | | 12,179 | |
| Hutchison China MediTech Ltd., ADR1 | | | 380 | | | | 7,182 | |
| Jiangsu Hengrui Medicine Co. Ltd., Cl. A | | | 9,598 | | | | 123,017 | |
| Novo Nordisk AS, Cl. B | | | 2,796 | | | | 153,943 | |
| Phathom Pharmaceuticals, Inc.1 | | | 998 | | | | 23,573 | |
| resTORbio, Inc.1 | | | 2,070 | | | | 15,007 | |
| Roche Holding AG | | | 288 | | | | 86,864 | |
| Takeda Pharmaceutical Co. Ltd. | | | 5,638 | | | | 203,956 | |
| | | | | | | 819,217 | |
| | | | | | | | | |
| Industrials—6.3% | | | | | | | | |
| Aerospace & Defense—1.4% | | | | | | | | |
| Airbus SE | | | 5,705 | | | | 817,572 | |
| HEICO Corp. | | | 365 | | | | 45,019 | |
| MTU Aero Engines AG | | | 269 | | | | 71,852 | |
| TransDigm Group, Inc. | | | 118 | | | | 62,101 | |
| | | | | | | 996,544 | |
| | | | | | | | | |
| Air Freight & Couriers—0.3% | | | | | | | | |
| United Parcel Service, Inc., Cl. B | | | 1,150 | | | | 132,445 | |
|
| 17 INVESCO OPPENHEIMER GLOBAL MULTI-ASSET GROWTH FUND |
CONSOLIDATED SCHEDULE OF INVESTMENTSContinued
| | | | | | | | |
| | | Shares | | | Value | |
| Air Freight & Couriers (Continued) | | | | | | | | |
| ZTO Express Cayman, Inc., ADR | | | 3,269 | | | $ | 71,918 | |
| | | | | | | 204,363 | |
| | | | | | | | | |
| Building Products—0.3% | | | | | | | | |
| Assa Abloy AB, Cl. B | | | 5,823 | | | | 138,149 | |
| Daikin Industries Ltd. | | | 100 | | | | 14,058 | |
| Masco Corp. | | | 695 | | | | 32,144 | |
| | | | | | | 184,351 | |
| | | | | | | | | |
| Commercial Services & Supplies—0.5% | | | | | | | | |
| Cintas Corp. | | | 204 | | | | 54,809 | |
| Copart, Inc.1 | | | 469 | | | | 38,758 | |
| Edenred | | | 2,439 | | | | 128,425 | |
| Prosegur Cash SA2 | | | 15,346 | | | | 23,973 | |
| Prosegur Cia de Seguridad SA | | | 9,720 | | | | 37,731 | |
| Republic Services, Inc., Cl. A | | | 566 | | | | 49,531 | |
| Waste Connections, Inc. | | | 380 | | | | 35,112 | |
| | | | | | | 368,339 | |
| | | | | | | | | |
| Construction & Engineering—0.0% | | | | | | | | |
| Boskalis Westminster | | | 906 | | | | 19,893 | |
| | | | | | | | | |
| Electrical Equipment—0.9% | | | | | | | | |
| AMETEK, Inc. | | | 351 | | | | 32,169 | |
| Legrand SA | | | 1,005 | | | | 78,467 | |
| Melrose Industries plc | | | 21,314 | | | | 58,866 | |
| Mitsubishi Electric Corp. | | | 8,400 | | | | 119,505 | |
| Nidec Corp. | | | 2,460 | | | | 361,750 | |
| | | | | | | 650,757 | |
| | | | | | | | | |
| Industrial Conglomerates—0.3% | | | | | | | | |
| 3M Co. | | | 316 | | | | 52,137 | |
| Ayala Corp. | | | 341 | | | | 5,768 | |
| Carlisle Cos., Inc. | | | 96 | | | | 14,618 | |
| Jardine Strategic Holdings Ltd. | | | 1,504 | | | | 48,546 | |
| Roper Technologies, Inc. | | | 164 | | | | 55,261 | |
| SM Investments Corp. | | | 3,120 | | | | 63,178 | |
| | | | | | | 239,508 | |
| | | | | | | | | |
| Machinery—1.2% | | | | | | | | |
| Aalberts NV | | | 1,505 | | | | 60,559 | |
| Atlas Copco AB, Cl. A | | | 5,626 | | | | 198,863 | |
| Epiroc AB, Cl. A | | | 5,123 | | | | 57,733 | |
| FANUC Corp. | | | 500 | | | | 98,703 | |
| IDEX Corp. | | | 256 | | | | 39,816 | |
| Komatsu Ltd. | | | 3,300 | | | | 77,336 | |
| Kubota Corp. | | | 1,600 | | | | 25,389 | |
| Minebea Mitsumi, Inc. | | | 2,300 | | | | 43,621 | |
| SMC Corp. | | | 250 | | | | 107,925 | |
|
| 18 INVESCO OPPENHEIMER GLOBAL MULTI-ASSET GROWTH FUND |
| | | | | | | | |
| | | Shares | | | Value | |
| Machinery (Continued) | | | | | | | | |
| VAT Group AG1,2 | | | 652 | | | $ | 95,654 | |
| Weir Group plc (The) | | | 2,369 | | | | 41,344 | |
| Woodward, Inc. | | | 148 | | | | 15,786 | |
| | | | | | | 862,729 | |
| | | | | | | | | |
| Professional Services—0.9% | | | | | | | | |
| Bureau Veritas SA | | | 1,324 | | | | 33,817 | |
| CoStar Group, Inc.1 | | | 118 | | | | 64,843 | |
| Equifax, Inc. | | | 967 | | | | 132,199 | |
| IHS Markit Ltd.1 | | | 434 | | | | 30,389 | |
| Intertek Group plc | | | 800 | | | | 55,599 | |
| Recruit Holdings Co. Ltd. | | | 9,900 | | | | 328,238 | |
| TransUnion | | | 441 | | | | 36,435 | |
| | | | | | | 681,520 | |
| | | | | | | | | |
| Road & Rail—0.2% | | | | | | | | |
| Kansas City Southern | | | 209 | | | | 29,423 | |
| Old Dominion Freight Line, Inc. | | | 160 | | | | 29,133 | |
| Seibu Holdings, Inc. | | | 5,200 | | | | 91,621 | |
| | | | | | | 150,177 | |
| | | | | | | | | |
| Trading Companies & Distributors—0.3% | | | | | | | | |
| Bunzl plc | | | 1,061 | | | | 27,607 | |
| Ferguson plc | | | 604 | | | | 51,536 | |
| ITOCHU Corp. | | | 4,900 | | | | 102,274 | |
| | | | | | | 181,417 | |
| | | | | | | | | |
| Transportation Infrastructure—0.0% | | | | | | | | |
| Grupo Aeroportuario del Sureste SAB de CV, Cl. B | | | 1,408 | | | | 23,088 | |
| | | | | | | | | |
| Information Technology—8.6% | | | | | | | | |
| Communications Equipment—0.1% | | | | | | | | |
| Motorola Solutions, Inc. | | | 301 | | | | 50,062 | |
| Nokia OYJ | | | 14,695 | | | | 54,113 | |
| | | | | | | 104,175 | |
| | | | | | | | | |
| Electronic Equipment, Instruments, & Components—2.1% | | | | | | | | |
| CDW Corp. | | | 425 | | | | 54,362 | |
| Hitachi Ltd. | | | 3,200 | | | | 119,314 | |
| Keyence Corp. | | | 455 | | | | 287,290 | |
| Keysight Technologies, Inc.1 | | | 591 | | | | 59,638 | |
| Murata Manufacturing Co. Ltd. | | | 5,800 | | | | 310,787 | |
| Omron Corp. | | | 2,000 | | | | 116,925 | |
| Samsung Electro-Mechanics Co. Ltd. | | | 840 | | | | 81,380 | |
| TDK Corp. | | | 3,700 | | | | 365,538 | |
| TE Connectivity Ltd. | | | 1,159 | | | | 103,731 | |
| | | | | | | 1,498,965 | |
|
| 19 INVESCO OPPENHEIMER GLOBAL MULTI-ASSET GROWTH FUND |
CONSOLIDATED SCHEDULE OF INVESTMENTSContinued
| | | | | | | | |
| | | Shares | | | Value | |
| IT Services—1.2% | | | | | | | | |
| Amadeus IT Group SA | | | 872 | | | $ | 64,553 | |
| Black Knight, Inc.1 | | | 295 | | | | 18,939 | |
| Booz Allen Hamilton Holding Corp., Cl. A | | | 482 | | | | 33,918 | |
| EPAM Systems, Inc.1 | | | 587 | | | | 103,289 | |
| Euronet Worldwide, Inc.1 | | | 211 | | | | 29,555 | |
| Fidelity National Information Services, Inc. | | | 345 | | | | 45,457 | |
| Global Payments, Inc. | | | 240 | | | | 40,603 | |
| PayPal Holdings, Inc.1 | | | 2,150 | | | | 223,815 | |
| StoneCo Ltd., Cl. A1 | | | 2,040 | | | | 75,052 | |
| Tata Consultancy Services Ltd. | | | 2,568 | | | | 82,198 | |
| Twilio, Inc., Cl. A1 | | | 209 | | | | 20,181 | |
| WEX, Inc.1 | | | 188 | | | | 35,566 | |
| Worldline SA1,2 | | | 1,175 | | | | 72,179 | |
| | | | | | | 845,305 | |
| | | | | | | | | |
| Semiconductors & Semiconductor Equipment—2.2% | | | | | | | | |
| Advanced Micro Devices, Inc.1 | | | 1,179 | | | | 40,003 | |
| ASML Holding NV | | | 551 | | | | 144,554 | |
| Infineon Technologies AG | | | 4,633 | | | | 90,358 | |
| KLA Corp. | | | 389 | | | | 65,757 | |
| Lam Research Corp. | | | 216 | | | | 58,545 | |
| Marvell Technology Group Ltd. | | | 1,057 | | | | 25,780 | |
| Maxim Integrated Products, Inc. | | | 3,840 | | | | 225,254 | |
| Monolithic Power Systems, Inc. | | | 155 | | | | 23,238 | |
| QUALCOMM, Inc. | | | 1,263 | | | | 101,596 | |
| Wuxi Biologics Cayman, Inc. | | | 10,221 | | | | 231,812 | |
| STMicroelectronics NV | | | 5,500 | | | | 124,907 | |
| Taiwan Semiconductor Manufacturing Co. Ltd. | | | 32,000 | | | | 310,889 | |
| Taiwan Semiconductor Manufacturing Co. Ltd., Sponsored ADR | | | 2,754 | | | | 142,189 | |
| | | | | | | 1,584,882 | |
| | | | | | | | | |
| Software—3.0% | | | | | | | | |
| Adobe, Inc.1 | | | 1,110 | | | | 308,502 | |
| ANSYS, Inc.1 | | | 130 | | | | 28,620 | |
| Aspen Technology, Inc.1 | | | 189 | | | | 21,756 | |
| Atlassian Corp. plc, Cl. A1 | | | 461 | | | | 55,684 | |
| Blue Prism Group plc1 | | | 740 | | | | 7,933 | |
| Coupa Software, Inc.1 | | | 196 | | | | 26,948 | |
| Dassault Systemes SE | | | 440 | | | | 66,932 | |
| Fair Isaac Corp.1 | | | 21 | | | | 6,385 | |
| Intuit, Inc. | | | 1,260 | | | | 324,450 | |
| Microsoft Corp. | | | 520 | | | | 74,553 | |
| Oracle Corp. Japan | | | 1,100 | | | | 96,713 | |
| Paycom Software, Inc.1 | | | 112 | | | | 23,691 | |
| RingCentral, Inc., Cl. A1 | | | 370 | | | | 59,762 | |
| SAP SE | | | 5,397 | | | | 714,889 | |
| Splunk, Inc.1 | | | 197 | | | | 23,632 | |
| Synopsys, Inc.1 | | | 455 | | | | 61,766 | |
| Temenos AG1 | | | 687 | | | | 98,101 | |
|
| 20 INVESCO OPPENHEIMER GLOBAL MULTI-ASSET GROWTH FUND |
| | | | | | | | |
| | | Shares | | | Value | |
| Software (Continued) | | | | | | | | |
| Trade Desk, Inc. (The), Cl. A1 | | | 103 | | | $ | 20,682 | |
| Weimob, Inc.1,2 | | | 106,000 | | | | 47,060 | |
| Xero Ltd.1 | | | 1,803 | | | | 85,459 | |
| | | | | | | 2,153,518 | |
| | | | | | | | | |
| Technology Hardware, Storage & Peripherals—0.0% | | | | | | | | |
| Samsung Electronics Co. Ltd. | | | 278 | | | | 12,015 | |
| | | | | | | | | |
| Materials—2.2% | | | | | | | | |
| Chemicals—0.7% | | | | | | | | |
| Air Liquide SA | | | 1,826 | | | | 242,675 | |
| Akzo Nobel NV | | | 1,521 | | | | 140,087 | |
| Huntsman Corp. | | | 318 | | | | 7,037 | |
| Sika AG | | | 578 | | | | 99,391 | |
| | | | | | | 489,190 | |
| | | | | | | | | |
| Construction Materials—0.2% | | | | | | | | |
| Dalmia Bharat Ltd. | | | 366 | | | | 4,180 | |
| Indocement Tunggal Prakarsa Tbk PT | | | 13,000 | | | | 18,409 | |
| James Hardie Industries plc | | | 3,130 | | | | 53,552 | |
| Martin Marietta Materials, Inc. | | | 111 | | | | 29,072 | |
| Semen Indonesia Persero Tbk PT | | | 11,500 | | | | 10,320 | |
| | | | | | | 115,533 | |
| | | | | | | | | |
| Containers & Packaging—0.2% | | | | | | | | |
| Avery Dennison Corp. | | | 129 | | | | 16,494 | |
| Ball Corp. | | | 591 | | | | 41,352 | |
| CCL Industries, Inc., Cl. B | | | 2,058 | | | | 84,704 | |
| | | | | | | 142,550 | |
| | | | | | | | | |
| Metals & Mining—1.1% | | | | | | | | |
| Agnico Eagle Mines Ltd. | | | 2,322 | | | | 142,733 | |
| Anglo American plc | | | 7,568 | | | | 194,549 | |
| Glencore plc1 | | | 22,460 | | | | 67,765 | |
| Grupo Mexico SAB de CV | | | 27,265 | | | | 71,818 | |
| MMC Norilsk Nickel PJSC | | | 36 | | | | 10,050 | |
| MMC Norilsk Nickel PJSC, ADR | | | 846 | | | | 23,470 | |
| Polyus PJSC, GDR2 | | | 200 | | | | 11,657 | |
| Vale SA, Cl. B, Sponsored ADR1 | | | 3,520 | | | | 41,325 | |
| Wheaton Precious Metals Corp. | | | 9,170 | | | | 257,402 | |
| | | | | | | 820,769 | |
| | | | | | | | | |
| Telecommunication Services—0.6% | | | | | | | | |
| Diversified Telecommunication Services—0.4% | | | | | | | | |
| Nippon Telegraph & Telephone Corp. | | | 2,800 | | | | 138,744 | |
| Spark New Zealand Ltd. | | | 50,793 | | | | 145,767 | |
| | | | | | | 284,511 | |
|
| 21 INVESCO OPPENHEIMER GLOBAL MULTI-ASSET GROWTH FUND |
CONSOLIDATED SCHEDULE OF INVESTMENTSContinued
| | | | | | | | |
| | | Shares | | | Value | |
| Wireless Telecommunication Services—0.2% | | | | | | | | |
| Rogers Communications, Inc., Cl. B | | | 1,175 | | | $ | 55,320 | |
| SK Telecom Co. Ltd. | | | 401 | | | | 82,095 | |
| | | | | | | 137,415 | |
| Total Common Stocks (Cost $26,407,066) | | | | | | | 31,711,066 | |
| | | | | | | | | |
| Preferred Stocks—2.7% | | | | | | | | |
| Grab Holdings, Inc., H Shares, Preference1,4 | | | 11,374 | | | | 70,097 | |
| Harambee Re Ltd. ,2019-11,4 | | | 250,000 | | | | 269,035 | |
| Lion Rock Re Ltd.,2019-11,4 | | | 2,500 | | | | 268,274 | |
| Mt. Logan Re Ltd.,2019-11,4 | | | 250 | | | | 221,340 | |
| NCM Re Ltd.,2019-11,4 | | | 250,000 | | | | 246,279 | |
| Thopas Re Ltd.,2019-11,4 | | | 2,500 | | | | 217,919 | |
| Torricelli Re,2019-11,4 | | | 2,500 | | | | 243,365 | |
| Turing Re,2019-1 (Cost $250,000, Acquisition Date 3/26/19)1,2,4 | | | 2,500 | | | | 191,889 | |
| Viribus Re Ltd.,2019-11,4 | | | 243,842 | | | | 231,149 | |
| Zee Entertainment Enterprises Ltd., 6% Cum.Non-Cv. | | | 32,510 | | | | 2,315 | |
| Total Preferred Stocks (Cost $2,072,411) | | | | | | | 1,961,662 | |
| | |
| | | Principal Amount | | | | |
| Event-Linked Bonds—1.8% | | | | | | | | |
| Alturas Re Segregated Account2019-1 Catastrophe Linked Nts., 0.00%, 3/10/232,4,5 | | $ | 250,000 | | | | 257,745 | |
| Eden Re II Ltd. Catastrophe Linked Nts., 0.00%, 3/22/23 (Cost $250,000, Acquisition Date 12/14/18)2,4,5 | | | 250,000 | | | | 268,220 | |
| Limestone Re Ltd. Catastrophe Linked Nts., 0.00%, 9/9/222,4,5 | | | 250,000 | | | | 282,501 | |
| Sector Re V Ltd. Catastrophe Linked Nts., 0.00%, 3/1/24 (Cost $300,000, Acquisition Date 4/23/19)2,4,5 | | | 300,000 | | | | 263,288 | |
| Versutus Ltd.,2019-1, Cl. B Catastrophe Linked Nts., 0.00%, 12/31/194,5 | | | 250,000 | | | | 227,042 | |
| Total Event-Linked Bonds (Cost $1,300,000) | | | | | | | 1,298,796 | |
| | |
| | | Shares | | | | |
| Investment Companies—48.8% | | | | | | | | |
| Invesco Government & Agency Portfolio, Institutional Class, 1.71%6 | | | 30,485,214 | | | | 30,485,214 | |
| Invesco Russell 1000 Dynamic Multifactor Exchange Traded Fund7 | | | 147,782 | | | | 4,615,232 | |
| Total Investment Companies (Cost $34,501,110) | | | | | | | 35,100,446 | |
| Total Investments, at Value (Cost $64,280,587) | | | 97.4 | % | | | 70,071,970 | |
| Net Other Assets (Liabilities) | | | 2.6 | | | | 1,821,584 | |
| Net Assets | | | 100.0 | % | | $ | 71,893,554 | |
| | | | | | | | |
Footnotes to Consolidated Schedule of Investments
1.Non-income producing security.
2. Security purchased or received in a transaction exempt from registration under the Securities Act of 1933, as amended (the “1933 Act”). The security may be resold pursuant to an exemption from registration under the 1933 Act, typically to qualified institutional buyers. The aggregate value of these securities at October 31, 2019 was $1,836,424, which represented 2.55% of the Fund’s Net Assets.
3. The Fund holds securities which have been issued by the same entity and that trade on separate exchanges.
4. The value of this security was determined using significant unobservable inputs. See Note 3 of the accompanying Consolidated Notes.
5. Zero coupon bond reflects effective yield on the original acquisition date.
|
| 22 INVESCO OPPENHEIMER GLOBAL MULTI-ASSET GROWTH FUND |
Footnotes to Consolidated Schedule of Investments (continued)
6. The money market fund and the Fund are affiliated by having the same investment adviser. The rate shown is the7-day SEC standardized yield as of October 31, 2019.
7. Is or was an affiliate, as defined in the Investment Company Act of 1940, as amended, at or during the reporting period, by virtue of the Fund owning at least 5% of the voting securities of the issuer or as a result of the Fund and the issuer having the same investment adviser. Transactions during the reporting period in which the issuer was an affiliate are as follows:
| | | | | | | | | | | | | | | | |
| | | Shares | | | Gross | | | Gross | | | Shares | |
| | | October 31, 2018 | | | Additions | | | Reductions | | | October 31, 2019 | |
| |
Investment Company | | | | | | | | | | | | | | | | |
Invesco Oppenheimer Fundamental Alternatives Fund | | | 357,038 | | | | 7,604 | | | | 364,642 | | | | — | |
Invesco Oppenheimer Master Event-Linked Bond Fund | | | 423,283 | | | | — | | | | 423,283 | | | | — | |
Invesco Russell 1000 Dynamic Multifactor Exchange Traded Fund | | | 280,058 | | | | — | | | | 132,276 | | | | 147,782 | |
| | | | |
| | | | | | | | | | | | Change in | |
| | | | | | | | | Realized | | | Unrealized | |
| | | Value | | | Income | | | Gain (Loss) | | | Gain (Loss) | |
| |
Investment Company | | | | | | | | | | | | | | | | |
Invesco Oppenheimer Fundamental Alternatives Fund | | $ | — | | | $ | 205,075 | | | $ | 18,813 | | | $ | (162,533) | |
Invesco Oppenheimer Master Event-Linked Bond Fund | | | — | | | | 168,310 | a,b | | | (430,199 | )a | | | 92,892a | |
Invesco Russell 1000 Dynamic Multifactor Exchange Traded Fund | | | 4,615,232 | | | | 68,534 | | | | (384,531 | ) | | | 525,671 | |
| | | | |
Total | | $ | 4,615,232 | | | $ | 441,919 | | | $ | (795,917 | ) | | $ | 456,030 | |
| | | | |
a.Represents the amount allocated to the Fund from Invesco Oppenheimer Master Event-Linked Bond Fund.
b.Net of expenses allocated to the Fund from Invesco Oppenheimer Master Event-Linked Bond Fund.
Distribution of investments representing geographic holdings, as a percentage of total investments at value, is as follows:
| | | | | | | | |
| Geographic Holdings | | Value | | | Percent | |
United States | | $ | 43,953,042 | | | | 62.7% | |
Japan | | | 4,497,944 | | | | 6.4 | |
France | | | 3,958,607 | | | | 5.7 | |
Supranational | | | 3,188,046 | | | | 4.6 | |
China | | | 2,357,908 | | | | 3.4 | |
Germany | | | 1,717,273 | | | | 2.5 | |
United Kingdom | | | 1,350,313 | | | | 1.9 | |
Switzerland | | | 1,294,181 | | | | 1.8 | |
India | | | 1,015,475 | | | | 1.5 | |
Canada | | | 755,164 | | | | 1.1 | |
South Korea | | | 597,774 | | | | 0.9 | |
Netherlands | | | 565,457 | | | | 0.8 | |
Sweden | | | 543,904 | | | | 0.8 | |
Spain | | | 535,950 | | | | 0.8 | |
Hong Kong | | | 524,293 | | | | 0.7 | |
Taiwan | | | 453,078 | | | | 0.6 | |
|
| 23 INVESCO OPPENHEIMER GLOBAL MULTI-ASSET GROWTH FUND |
CONSOLIDATED SCHEDULE OF INVESTMENTSContinued
| | | | | | | | |
| Geographic Holding (Continued) | | Value | | | Percent | |
Russia | | $ | 426,297 | | | | 0.6% | |
Mexico | | | 326,836 | | | | 0.5 | |
South Africa | | | 326,766 | | | | 0.5 | |
Brazil | | | 311,362 | | | | 0.4 | |
New Zealand | | | 231,226 | | | | 0.3 | |
Denmark | | | 170,530 | | | | 0.2 | |
Philippines | | | 117,846 | | | | 0.2 | |
Australia | | | 107,191 | | | | 0.2 | |
Italy | | | 101,932 | | | | 0.1 | |
Peru | | | 92,037 | | | | 0.1 | |
Thailand | | | 77,859 | | | | 0.1 | |
Singapore | | | 70,097 | | | | 0.1 | |
Ireland | | | 66,297 | | | | 0.1 | |
Turkey | | | 61,248 | | | | 0.1 | |
Finland | | | 54,112 | | | | 0.1 | |
Indonesia | | | 50,864 | | | | 0.1 | |
Chile | | | 44,295 | | | | 0.1 | |
Belgium | | | 33,707 | | | | 0.0 | |
Egypt | | | 26,764 | | | | 0.0 | |
Colombia | | | 25,754 | | | | 0.0 | |
United Arab Emirates | | | 14,249 | | | | 0.0 | |
Vietnam | | | 13,254 | | | | 0.0 | |
Argentina | | | 13,038 | | | | 0.0 | |
Total | | $ | 70,071,970 | | | | 100.0% | |
| | | | | | | | |
| | | | | | | | | | | | | | | | | | | | | | |
| Futures Contracts as of October 31, 2019 | | | | | | | | | | | |
| | | | | | |
| | | | | | | | | | | | | | | | | | Unrealized |
| | | | | | |
| | | | | | Expiration | | | Number | | | Notional Amount | | | | | | Appreciation/ |
| | | | | | |
| Description | | Buy/Sell | | | Date | | | of Contracts | | | (000’s) | | | Value | | | (Depreciation) |
Canadian Dollar Index | | | Buy | | | | 12/17/19 | | | | 8 | | | | USD 605 | | | $ | 607,800 | | | $ 3,200 |
MSCI EAFE Index | | | Buy | | | | 12/20/19 | | | | 66 | | | | USD 6,292 | | | | 6,458,760 | | | 166,516 |
MSCI Emerging Market Index | | | Buy | | | | 12/20/19 | | | | 48 | | | | USD 2,450 | | | | 2,499,360 | | | 49,823 |
S&P 500E-Mini Index | | | Buy | | | | 12/20/19 | | | | 80 | | | | USD 12,015 | | | | 12,143,000 | | | 127,600 |
S&P/TSX 60 Index | | | Buy | | | | 12/19/19 | | | | 4 | | | | CAD 606 | | | | 598,223 | | | (8,097) |
| | | | | | | | | | | | | | | | | | | | | | |
| | | | | | | | | | | | | | | | | | | | | | $ 339,042 |
| | | | | | | | | | | | | | | | | | | | | | |
| | | | | | | | | | | | | | | | | | | | | | |
| Exchange-Traded Options Written at October 31, 2019 | | | | | | | | | | | |
| | | | | | |
| | | | | | | | | Number of | | | Notional | | | | | | |
| | | Exercise | | | Expiration | | | Contracts | | | Amount | | | Premiums | | | |
| Description | | Price | | | Date | | | (000’s) | | | (000’s) | | | Received | | | Value |
|
MSCI EAFE Index Call Call | | | USD 1,030.000 | | | | 11/15/19 | | | | USD (0) | 1 | | | USD 2,575 | | | $ | 24,674 | | | $ (44,375) |
|
MSCI EAFE Index Call Call | | | USD 1,930.000 | | | | 11/15/19 | | | | USD (0) | 1 | | | USD 6,369 | | | | 36,365 | | | (106,590) |
|
S&P 500 Mini Index Call Call | | | USD 304.000 | | | | 11/15/19 | | | | USD (0) | 1 | | | USD 12,221 | | | | 79,178 | | | (91,656) |
| | | | | | | | | | | | | | | | | | | |
Total Exchange-Traded Options Written | | | | | | | | | | | | | | | $ | 140,217 | | | $ (242,621) |
| | | | | | | | | | | | | | | | | | | |
| | | | | | | | | | | | | | | | | | | |
|
| 24 INVESCO OPPENHEIMER GLOBAL MULTI-ASSET GROWTH FUND |
1. Number of contracts less than 500.
| | |
| Glossary: | | |
|
| Currency abbreviations indicate amounts reporting in currencies |
| CAD | | Canadian Dollar |
| |
| Definitions | | |
| ADR | | American Depositary Receipt |
| GDR | | Global Depositary Receipts |
| MSCI | | Morgan Stanley Capital International |
| S&P | | Standard & Poor’s |
| TSX 60 | | 60 largest companies on the Toronto Stock Exchange |
See accompanying Notes to Consolidated Financial Statements.
|
| 25 INVESCO OPPENHEIMER GLOBAL MULTI-ASSET GROWTH FUND |
CONSOLIDATED STATEMENT OF
ASSETS AND LIABILITIESOctober 31, 2019
| | | | |
|
| |
| Assets | | | | |
Investments, at value—see accompanying consolidated schedule of investments: | | | | |
Unaffiliated companies (cost $29,779,477) | | $ | 34,971,524 | |
Affiliated companies (cost $34,501,110) | | | 35,100,446 | |
| | | | |
| | | 70,071,970 | |
| |
Cash | | | 129,784 | |
| |
Cash—foreign currencies (cost $4,445) | | | 4,275 | |
| |
Receivables and other assets: | | | | |
Variation margin receivable - futures contracts | | | 1,962,933 | |
Dividends | | | 133,608 | |
Investments sold | | | 100,626 | |
Shares of beneficial interest sold | | | 13,514 | |
Other | | | 4,134 | |
| | | | |
Total assets | | | 72,420,844 | |
|
| |
| Liabilities | | | | |
Options written, at value (premiums received $140,217) | | | 242,621 | |
| |
Payables and other liabilities: | | | | |
Due to advisor | | | 43,098 | |
Shares of beneficial interest redeemed | | | 38,128 | |
Shareholder communications | | | 31,500 | |
Investments purchased | | | 23,049 | |
Distribution and service plan fees | | | 17,438 | |
Transfer and shareholder servicing agent fees | | | 15,135 | |
Foreign capital gains tax | | | 7,365 | |
Trustees’ compensation | | | 2,001 | |
Advisory fees | | | 1,477 | |
Administration fees | | | 12 | |
Other | | | 105,466 | |
| | | | |
Total liabilities | | | 527,290 | |
|
| |
Net Assets | | $ | 71,893,554 | |
| | | | |
|
| |
| Composition of Net Assets | | | | |
| |
Shares of beneficial interest | | $ | 67,374,539 | |
| |
Total distributable earnings | | | 4,519,015 | |
| | | | |
Net Assets | | $ | 71,893,554 | |
| | | | |
|
| 26 INVESCO OPPENHEIMER GLOBAL MULTI-ASSET GROWTH FUND |
| | | | |
|
| |
| Net Asset Value Per Share | | | | |
| Class A Shares: | | | | |
| |
| Net asset value and redemption price per share (based on net assets of $63,878,456 and 5,860,701 shares of beneficial interest outstanding) | | $ | 10.90 | |
| Maximum offering price per share (net asset value plus sales charge of 5.50% of offering price) | | $ | 11.53 | |
| |
| |
| Class C Shares: | | | | |
| |
| Net asset value, redemption price (excludes applicable contingent deferred sales charge) and offering price per share (based on net assets of $3,294,480 and 308,992 shares of beneficial interest outstanding) | | $ | 10.66 | |
| |
| |
| Class R Shares: | | | | |
| |
| Net asset value, redemption price and offering price per share (based on net assets of $3,266,482 and 301,734 shares of beneficial interest outstanding) | | $ | 10.83 | |
| |
| |
| Class Y Shares: | | | | |
| |
| Net asset value, redemption price and offering price per share (based on net assets of $1,432,553 and 130,779 shares of beneficial interest outstanding) | | $ | 10.95 | |
| |
| |
| Class R5 Shares: | | | | |
| |
| Net asset value, redemption price and offering price per share (based on net assets of $10,624 and 974 shares of beneficial interest outstanding) | | $ | 10.91 | |
| |
| |
| Class R6 Shares: | | | | |
| |
| Net asset value, redemption price and offering price per share (based on net assets of $10,959 and 1,000 shares of beneficial interest outstanding) | | $ | 10.96 | |
| |
| See accompanying Notes to Consolidated Financial Statements. | | | | |
|
| 27 INVESCO OPPENHEIMER GLOBAL MULTI-ASSET GROWTH FUND |
CONSOLIDATED STATEMENT OF
OPERATIONSFor the Year Ended October 31, 2019
| | | | |
| Investment Income | | | | |
Interest: | | | | |
Unaffiliated companies | | $ | 110,117 | |
| Affiliated companies | | | 167,381 | |
Dividends: | | | | |
Unaffiliated companies (net of foreign withholding taxes of $55,154) | | | 636,160 | |
Affiliated companies | | | 490,193 | |
Total investment income | | | 1,403,851 | |
| Expenses | | | | |
| Advisory fees | | | 513,598 | |
| Administration fees | | | 4,283 | |
Distribution and service plan fees: | | | | |
Class A | | | 99,330 | |
Class C | | | 36,331 | |
| Class R | | | 14,364 | |
Transfer and shareholder servicing agent fees: | | | | |
Class A | | | 96,496 | |
Class C | | | 5,858 | |
Class R | | | 4,550 | |
Class Y | | | 1,796 | |
Class R5 | | | 1 | |
| Class R6 | | | 2 | |
Shareholder communications: | | | | |
Class A | | | 33,281 | |
Class C | | | 4,274 | |
Class R | | | 3,908 | |
Class Y | | | 726 | |
Class R5 | | | 4 | |
| Class R6 | | | 4 | |
| Legal, auditing and other professional fees | | | 109,456 | |
| Registration fees | | | 80,146 | |
| Custodian fees and expenses | | | 54,029 | |
| Trustees’ compensation | | | 19,527 | |
| Borrowing fees | | | 1,145 | |
Other | | | 7,028 | |
Total expenses | | | 1,090,137 | |
Less waivers, reimbursement of expenses and offset arrangement(s) | | | (276,503 | ) |
Net expenses | | | 813,634 | |
Net Investment Income | | | 590,217 | |
|
| 28 INVESCO OPPENHEIMER GLOBAL MULTI-ASSET GROWTH FUND |
| | | | |
| Realized and Unrealized Gain (Loss) | | | | |
| Net realized gain (loss) on: | | | | |
| Investment transactions in: | | | | |
Unaffiliated companies(net of foreign capital gains tax of $1,251) | | $ | (1,019,712 | ) |
Affiliated companies | | | (795,917 | ) |
| Option contracts written | | | 651,169 | |
| Futures contracts | | | 2,753,349 | |
| Foreign currency transactions | | | (8,896 | ) |
| Forward currency exchange contracts | | | (469,144 | ) |
| Swap contracts | | | (1,704,288 | ) |
| Net realized loss | | | (593,439 | ) |
| Net change in unrealized appreciation/(depreciation) on: | | | | |
| Investment transactions in: | | | | |
Unaffiliated companies (net of foreign capital gains tax of $5,745) | | | 5,440,019 | |
Affiliated companies | | | 456,030 | |
| Translation of assets and liabilities denominated in foreign currencies | | | (12,801 | ) |
| Forward currency exchange contracts | | | 202,992 | |
| Futures contracts | | | 161,930 | |
| Option contracts written | | | (106,159 | ) |
| Swap contracts | | | (8,367 | ) |
Net change in unrealized appreciation/(depreciation) | | | 6,133,644 | |
| Net Increase in Net Assets Resulting from Operations | | $ | 6,130,422 | |
| | | | |
See accompanying Notes to Consolidated Financial Statements.
|
| 29 INVESCO OPPENHEIMER GLOBAL MULTI-ASSET GROWTH FUND |
CONSOLIDATED STATEMENT OF CHANGES IN NET ASSETS
| | | | | | | | |
| | | Year Ended | | | Year Ended | |
| | | October 31, 2019 | | | October 31, 2018 | |
| Operations | | | | | | | | |
Net investment income | | $ | 590,217 | | | $ | 1,043,564 | |
| |
Net realized gain (loss) | | | (593,439 | ) | | | 1,729,522 | |
| |
Net change in unrealized appreciation/(depreciation) | | | 6,133,644 | | | | (8,084,417) | |
| | | | |
Net increase (decrease) in net assets resulting from operations | | | 6,130,422 | | | | (5,311,331) | |
| | | | | | | | |
| Dividends and/or Distributions to Shareholders | | | | | | | | |
Distributions to shareholders from distributable earnings: | | | | | | | | |
Class A | | | (3,362,080 | ) | | | (1,450,006) | |
Class C | | | (212,542 | ) | | | (34,914) | |
Class R | | | (141,361 | ) | | | (53,409) | |
Class Y | | | (24,701 | ) | | | (6,002) | |
Class R5 | | | — | | | | — | |
Class R6 | | | (583 | ) | | | (287) | |
| | | | |
Total distributions from distributable earnings | | | (3,741,267 | ) | | | (1,544,618) | |
| | | | | | | | |
| Beneficial Interest Transactions | | | | | | | | |
Net increase (decrease) in net assets resulting from beneficial interest transactions: | | | | | | | | |
Class A | | | 934,186 | | | | 2,729,359 | |
Class C | | | (455,722 | ) | | | 2,343,816 | |
Class R | | | 616,194 | | | | 254,146 | |
Class Y | | | 861,682 | | | | 226,217 | |
Class R5 | | | 10,001 | | | | — | |
Class R6 | | | — | | | | — | |
| | | | |
Total beneficial interest transactions | | | 1,966,341 | | | | 5,553,538 | |
| | | | | | | | |
| Net Assets | | | | | | | | |
Total increase (decrease) | | | 4,355,496 | | | | (1,302,411) | |
| |
Beginning of period | | | 67,538,058 | | | | 68,840,469 | |
| | | | |
End of period | | $ | 71,893,554 | | | $ | 67,538,058 | |
| | | | |
See accompanying Notes to Consolidated Financial Statements.
|
| 30 INVESCO OPPENHEIMER GLOBAL MULTI-ASSET GROWTH FUND |
CONSOLIDATED FINANCIAL HIGHLIGHTS
| | | | | | | | | | | | | | | | | | | | |
| | | | | | | | | | | | | | | Period | |
| | | Year Ended | | | Year Ended | | | Year Ended | | | Year Ended | | | Ended | |
| Class A | | October 31, | | | October 31, | | | October 31, | | | October 31, | | | October 30, | |
| | 2019 | | | 2018 | | | 2017 | | | 2016 | | | 20151,2 | |
Per Share Operating Data | | | | | | | | | | | | | | | | | | | | |
| Net asset value, beginning of period | | | $10.57 | | | | $11.62 | | | | $10.49 | | | | $10.30 | | | | $10.00 | |
| Income (loss) from investment operations: | | | | | | | | | | | | | | | | | | | | |
| Net investment income3 | | | 0.09 | | | | 0.17 | | | | 0.15 | | | | 0.14 | | | | 0.02 | |
| Net realized and unrealized gain (loss) | | | 0.82 | | | | (0.96) | | | | 1.48 | | | | 0.14 | | | | 0.28 | |
| Total from investment operations | | | 0.91 | | | | (0.79) | | | | 1.63 | | | | 0.28 | | | | 0.30 | |
| Dividends and/or distributions to shareholders: | | | | | | | | | | | | | | | | | | | | |
| Dividends from net investment income | | | 0.00 | | | | (0.05) | | | | (0.50) | | | | (0.09) | | | | 0.00 | |
| Distributions from net realized gain | | | (0.58) | | | | (0.21) | | | | 0.00 | | | | (0.00)4 | | | | 0.00 | |
| Total dividends and/or distributions to shareholders | | | (0.58) | | | | (0.26) | | | | (0.50) | | | | (0.09) | | | | 0.00 | |
| Net asset value, end of period | | | $10.90 | | | | $10.57 | | | | $11.62 | | | | $10.49 | | | | $10.30 | |
| | | | | | | | | | | | | | | | | | | | |
| | | | | | | | | | | | | | | | | | | | |
| Total Return, at Net Asset Value5 | | | 9.51% | | | | (6.98)% | | | | 16.26% | | | | 2.73% | | | | 3.00% | |
| | | | | | | | | | | | | | | | | | | | |
| Ratios/Supplemental Data | | | | | | | | | | | | | | | | | | | | |
| Net assets, end of period (in thousands) | | | $63,878 | | | | $60,916 | | | | $64,323 | | | | $53,579 | | | | $51,525 | |
| Average net assets (in thousands) | | | $60,766 | | | | $65,968 | | | | $57,577 | | | | $50,502 | | | | $49,048 | |
| Ratios to average net assets:6 | | | | | | | | | | | | | | | | | | | | |
| Net investment income | | | 0.91%7 | | | | 1.48%7 | | | | 1.41%7 | | | | 1.38%7 | | | | 1.07% | |
| Expenses excluding specific expenses listed below | | | 1.53% | | | | 1.49%8 | | | | 1.47%8 | | | | 1.42%8 | | | | 1.61% | |
| Interest and fees from borrowings | | | 0.00%9 | | | | 0.00%9 | | | | 0.00% | | | | 0.00% | | | | 0.00% | |
| Total expenses10 | | | 1.53% | | | | 1.49%8 | | | | 1.47%8 | | | | 1.42%8 | | | | 1.61% | |
| Expenses after payments, waivers and/or reimbursements and reduction to custodian expenses | | | 1.14% | | | | 1.17%8 | | | | 1.10%8 | | | | 1.10%8 | | | | 1.05% | |
Portfolio turnover rate11 | | | 43% | | | | 126% | | | | 54% | | | | 61% | | | | 8% | |
|
| 31 INVESCO OPPENHEIMER GLOBAL MULTI-ASSET GROWTH FUND |
CONSOLIDATED FINANCIAL HIGHLIGHTSContinued
1. Represents the last business day of the Fund’s reporting period.
2. For the period from August 27, 2015 (commencement of operations) to October 30, 2015.
3. Per share amounts calculated based on the average shares outstanding during the period.
4. Less than $0.005 per share.
5. Includes adjustments in accordance with accounting principles generally accepted in the United States of America and as such, the net asset value for financial reporting purposes and the returns based upon those net asset values may differ from the net asset value and returns for shareholder transactions. Does not include sales charges and is not annualized for periods less than one year, if applicable.
6. Annualized for periods less than one full year.
7. Includes the Fund’s share of the allocated net investment income from Invesco Oppenheimer Master Event-Linked Bond Fund.
8. Includes the Fund’s share of the allocated expenses from Invesco Oppenheimer Master Event-Linked Bond Fund.
9. Less than 0.005%.
10. Total expenses including indirect expenses from affiliated fund fees and expenses were as follows:
| | | | | | |
| | | | | | |
Year Ended October 31, 2019 | | | 1.67% | |
Year Ended October 31, 2018 | | | 1.66% | |
Year Ended October 31, 2017 | | | 1.62% | |
Year Ended October 31, 2016 | | | 1.53% | |
Period Ended October 30, 2015 | | | 1.72% | |
11. Portfolio turnover is calculated at the fund level and is not annualized for periods less than one year, if applicable.
See accompanying Notes to Consolidated Financial Statements.
|
| 32 INVESCO OPPENHEIMER GLOBAL MULTI-ASSET GROWTH FUND |
| | | | | | | | | | | | | | | | | | | | |
| | | | | | | | | | | | | | | Period | |
| | | Year Ended | | | Year Ended | | | Year Ended | | | Year Ended | | | Ended | |
| Class C | | October 31, | | | October 31, | | | October 31, | | | October 31, | | | October 30, | |
| | 2019 | | | 2018 | | | 2017 | | | 2016 | | | 20151,2 | |
Per Share Operating Data | | | | | | | | | | | | | | | | | | | | |
| Net asset value, beginning of period | | | $10.42 | | | | $11.50 | | | | $10.41 | | | | $10.29 | | | | $10.00 | |
| Income (loss) from investment operations: | | | | | | | | | | | | | | | | | | | | |
| Net investment income3 | | | 0.02 | | | | 0.08 | | | | 0.07 | | | | 0.04 | | | | 0.01 | |
| Net realized and unrealized gain (loss) | | | 0.80 | | | | (0.95) | | | | 1.47 | | | | 0.15 | | | | 0.28 | |
| Total from investment operations | | | 0.82 | | | | (0.87) | | | | 1.54 | | | | 0.19 | | | | 0.29 | |
| Dividends and/or distributions to shareholders: | | | | | | | | | | | | | | | | | | | | |
| Dividends from net investment income | | | 0.00 | | | | 0.00 | | | | (0.45) | | | | (0.07) | | | | 0.00 | |
| Distributions from net realized gain | | | (0.58) | | | | (0.21) | | | | 0.00 | | | | (0.00)4 | | | | 0.00 | |
| Total dividends and/or distributions to shareholders | | | (0.58) | | | | (0.21) | | | | (0.45) | | | | (0.07) | | | | 0.00 | |
| Net asset value, end of period | | | $10.66 | | | | $10.42 | | | | $11.50 | | | | $10.41 | | | | $10.29 | |
| | | | | | | | | | | | | | | | | | | | |
| | | | | | | | | | | | | | | | | | | | |
| Total Return, at Net Asset Value5 | | | 8.73% | | | | (7.72)% | | | | 15.42% | | | | 1.88% | | | | 2.90% | |
| | | | | | | | | | | | | | | | | | | | |
| Ratios/Supplemental Data | | | | | | | | | | | | | | | | | | | | |
| Net assets, end of period (in thousands) | | | $3,294 | | | | $3,649 | | | | $1,701 | | | | $522 | | | | $45 | |
| Average net assets (in thousands) | | | $3,637 | | | | $3,483 | | | | $997 | | | | $308 | | | | $28 | |
| Ratios to average net assets:6 | | | | | | | | | | | | | | | | | | | | |
| Net investment income | | | 0.16%7 | | | | 0.73%7 | | | | 0.67%7 | | | | 0.36%7 | | | | 0.42% | |
| Expenses excluding specific expenses listed below | | | 2.43% | | | | 2.62%8 | | | | 2.98%8 | | | | 3.05%8 | | | | 2.34% | |
| Interest and fees from borrowings | | | 0.00%9 | | | | 0.00%9 | | | | 0.00% | | | | 0.00% | | | | 0.00% | |
| Total expenses10 | | | 2.43% | | | | 2.62%8 | | | | 2.98%8 | | | | 3.05%8 | | | | 2.34% | |
| Expenses after payments, waivers and/or reimbursements and reduction to custodian expenses | | | 1.89% | | | | 1.92%8 | | | | 1.85%8 | | | | 1.85%8 | | | | 1.81% | |
Portfolio turnover rate11 | | | 43% | | | | 126% | | | | 54% | | | | 61% | | | | 8% | |
|
| 33 INVESCO OPPENHEIMER GLOBAL MULTI-ASSET GROWTH FUND |
CONSOLIDATED FINANCIAL HIGHLIGHTSContinued
1. Represents the last business day of the Fund’s reporting period.
2. For the period from August 27, 2015 (commencement of operations) to October 30, 2015.
3. Per share amounts calculated based on the average shares outstanding during the period.
4. Less than $0.005 per share.
5. Includes adjustments in accordance with accounting principles generally accepted in the United States of America and as such, the net asset value for financial reporting purposes and the returns based upon those net asset values may differ from the net asset value and returns for shareholder transactions. Does not include sales charges and is not annualized for periods less than one year, if applicable.
6. Annualized for periods less than one full year.
7. Includes the Fund’s share of the allocated net investment income from Invesco Oppenheimer Master Event-Linked Bond Fund.
8. Includes the Fund’s share of the allocated expenses from Invesco Oppenheimer Master Event-Linked Bond Fund.
9. Less than 0.005%.
10. Total expenses including indirect expenses from affiliated fund fees and expenses were as follows:
| | | | | | |
| | | | | | |
Year Ended October 31, 2019 | | | 2.57% | |
Year Ended October 31, 2018 | | | 2.79% | |
Year Ended October 31, 2017 | | | 3.13% | |
Year Ended October 31, 2016 | | | 3.16% | |
Period Ended October 30, 2015 | | | 2.45% | |
11. Portfolio turnover is calculated at the fund level and is not annualized for periods less than one year, if applicable.
See accompanying Notes to Consolidated Financial Statements.
|
| 34 INVESCO OPPENHEIMER GLOBAL MULTI-ASSET GROWTH FUND |
| | | | | | | | | | | | | | | | | | | | |
| | | | | | | | | | | | | | | Period | |
| | | Year Ended | | | Year Ended | | | Year Ended | | | Year Ended | | | Ended | |
| Class R | | October 31, | | | October 31, | | | October 31, | | | October 31, | | | October 30, | |
| | 2019 | | | 2018 | | | 2017 | | | 2016 | | | 20151,2 | |
Per Share Operating Data | | | | | | | | | | | | | | | | | | | | |
| Net asset value, beginning of period | | | $10.52 | | | | $11.58 | | | | $10.47 | | | | $10.30 | | | | $10.00 | |
| Income (loss) from investment operations: | | | | | | | | | | | | | | | | | | | | |
| Net investment income3 | | | 0.07 | | | | 0.14 | | | | 0.13 | | | | 0.04 | | | | 0.01 | |
| Net realized and unrealized gain (loss) | | | 0.82 | | | | (0.96) | | | | 1.47 | | | | 0.21 | | | | 0.29 | |
| Total from investment operations | | | 0.89 | | | | (0.82) | | | | 1.60 | | | | 0.25 | | | | 0.30 | |
| Dividends and/or distributions to shareholders: | | | | | | | | | | | | | | | | | | | | |
| Dividends from net investment income | | | 0.00 | | | | (0.03) | | | | (0.49) | | | | (0.08) | | | | 0.00 | |
| Distributions from net realized gain | | | (0.58) | | | | (0.21) | | | | 0.00 | | | | (0.00)4 | | | | 0.00 | |
| Total dividends and/or distributions to shareholders | | | (0.58) | | | | (0.24) | | | | (0.49) | | | | (0.08) | | | | 0.00 | |
| Net asset value, end of period | | | $10.83 | | | | $10.52 | | | | $11.58 | | | | $10.47 | | | | $10.30 | |
| | | | | | | | | | | | | | | | | | | | |
| | | | | | | | | | | | | | | | | | | | |
| Total Return, at Net Asset Value5 | | | 9.35% | | | | (7.29)% | | | | 16.03% | | | | 2.43% | | | | 3.00% | |
| | | | | | | | | | | | | | | | | | | | |
| Ratios/Supplemental Data | | | | | | | | | | | | | | | | | | | | |
| Net assets, end of period (in thousands) | | | $3,266 | | | | $2,513 | | | | $2,533 | | | | $1,204 | | | | $10 | |
| Average net assets (in thousands) | | | $2,886 | | | | $2,904 | | | | $1,995 | | | | $226 | | | | $10 | |
| Ratios to average net assets:6 | | | | | | | | | | | | | | | | | | | | |
| Net investment income | | | 0.66%7 | | | | 1.23%7 | | | | 1.17%7 | | | | 0.43%7 | | | | 0.77% | |
| Expenses excluding specific expenses listed below | | | 1.94% | | | | 2.15%8 | | | | 2.57%8 | | | | 2.07%8 | | | | 1.48% | |
| Interest and fees from borrowings | | | 0.00%9 | | | | 0.00%9 | | | | 0.00% | | | | 0.00% | | | | 0.00% | |
| Total expenses10 | | | 1.94% | | | | 2.15%8 | | | | 2.57%8 | | | | 2.07%8 | | | | 1.48% | |
| Expenses after payments, waivers and/or reimbursements and reduction to custodian expenses | | | 1.39% | | | | 1.42%8 | | | | 1.35%8 | | | | 1.33%8 | | | | 1.33% | |
Portfolio turnover rate11 | | | 43% | | | | 126% | | | | 54% | | | | 61% | | | | 8% | |
|
| 35 INVESCO OPPENHEIMER GLOBAL MULTI-ASSET GROWTH FUND |
CONSOLIDATED FINANCIAL HIGHLIGHTSContinued
1. Represents the last business day of the Fund’s reporting period.
2. For the period from August 27, 2015 (commencement of operations) to October 30, 2015.
3. Per share amounts calculated based on the average shares outstanding during the period.
4. Less than $0.005 per share.
5. Includes adjustments in accordance with accounting principles generally accepted in the United States of America and as such, the net asset value for financial reporting purposes and the returns based upon those net asset values may differ from the net asset value and returns for shareholder transactions. Does not include sales charges and is not annualized for periods less than one year, if applicable.
6. Annualized for periods less than one full year.
7. Includes the Fund’s share of the allocated net investment income from Invesco Oppenheimer Master Event-Linked Bond Fund.
8. Includes the Fund’s share of the allocated expenses from Invesco Oppenheimer Master Event-Linked Bond Fund.
9. Less than 0.005%.
10. Total expenses including indirect expenses from affiliated fund fees and expenses were as follows:
| | | | | | |
| | | | | | |
Year Ended October 31, 2019 | | | 2.08% | |
Year Ended October 31, 2018 | | | 2.32% | |
Year Ended October 31, 2017 | | | 2.72% | |
Year Ended October 31, 2016 | | | 2.18% | |
Period Ended October 30, 2015 | | | 1.59% | |
11. Portfolio turnover is calculated at the fund level and is not annualized for periods less than one year, if applicable.
See accompanying Notes to Consolidated Financial Statements.
|
| 36 INVESCO OPPENHEIMER GLOBAL MULTI-ASSET GROWTH FUND |
| | | | | | | | | | | | | | | | | | | | |
| | | | | | | | | | | | | | | Period | |
| | | Year Ended | | | Year Ended | | | Year Ended | | | Year Ended | | | Ended | |
| Class Y | | October 31, | | | October 31, | | | October 31, | | | October 31, | | | October 30, | |
| | 2019 | | | 2018 | | | 2017 | | | 2016 | | | 20151,2 | |
Per Share Operating Data | | | | | | | | | | | | | | | | | | | | |
| Net asset value, beginning of period | | | $10.60 | | | | $11.65 | | | | $10.51 | | | | $10.31 | | | | $10.00 | |
| Income (loss) from investment operations: | | | | | | | | | | | | | | | | | | | | |
| Net investment income3 | | | 0.11 | | | | 0.19 | | | | 0.17 | | | | 0.12 | | | | 0.02 | |
| Net realized and unrealized gain (loss) | | | 0.82 | | | | (0.97) | | | | 1.47 | | | | 0.17 | | | | 0.29 | |
| Total from investment operations | | | 0.93 | | | | (0.78) | | | | 1.64 | | | | 0.29 | | | | 0.31 | |
| Dividends and/or distributions to shareholders: | | | | | | | | | | | | | | | | | | | | |
| Dividends from net investment income | | | 0.00 | | | | (0.06) | | | | (0.50) | | | | (0.09) | | | | 0.00 | |
| Distributions from net realized gain | | | (0.58) | | | | (0.21) | | | | 0.00 | | | | (0.00)4 | | | | 0.00 | |
| Total dividends and/or distributions to shareholders | | | (0.58) | | | | (0.27) | | | | (0.50) | | | | (0.09) | | | | 0.00 | |
| Net asset value, end of period | | | $10.95 | | | | $10.60 | | | | $11.65 | | | | $10.51 | | | | $10.31 | |
| | | | | | | | | | | | | | | | | | | | |
| | | | | | | | | | | | | | | | | | | | |
| Total Return, at Net Asset Value5 | | | 9.67% | | | | (6.86)% | | | | 16.41% | | | | 2.86% | | | | 3.10% | |
| | | | | | | | | | | | | | | | | | | | |
| Ratios/Supplemental Data | | | | | | | | | | | | | | | | | | | | |
| Net assets, end of period (in thousands) | | | $1,433 | | | | $450 | | | | $271 | | | | $89 | | | | $10 | |
| Average net assets (in thousands) | | | $1,195 | | | | $401 | | | | $165 | | | | $23 | | | | $10 | |
| Ratios to average net assets:6 | | | | | | | | | | | | | | | | | | | | |
| Net investment income | | | 1.06%7 | | | | 1.63%7 | | | | 1.57%7 | | | | 1.13%7 | | | | 1.17% | |
| Expenses excluding specific expenses listed below | | | 1.36% | | | | 1.63%8 | | | | 2.65%8 | | | | 1.52%8 | | | | 1.48% | |
| Interest and fees from borrowings | | | 0.00%9 | | | | 0.00%9 | | | | 0.00% | | | | 0.00% | | | | 0.00% | |
| Total expenses10 | | | 1.36% | | | | 1.63%8 | | | | 2.65%8 | | | | 1.52%8 | | | | 1.48% | |
| Expenses after payments, waivers and/or reimbursements and reduction to custodian expenses | | | 0.99% | | | | 1.02%8 | | | | 0.95%8 | | | | 0.94%8 | | | | 0.94% | |
Portfolio turnover rate11 | | | 43% | | | | 126% | | | | 54% | | | | 61% | | | | 8% | |
|
| 37 INVESCO OPPENHEIMER GLOBAL MULTI-ASSET GROWTH FUND |
CONSOLIDATED FINANCIAL HIGHLIGHTSContinued
1. Represents the last business day of the Fund’s reporting period.
2. For the period from August 27, 2015 (commencement of operations) to October 30, 2015.
3. Per share amounts calculated based on the average shares outstanding during the period.
4. Less than $0.005 per share.
5. Includes adjustments in accordance with accounting principles generally accepted in the United States of America and as such, the net asset value for financial reporting purposes and the returns based upon those net asset values may differ from the net asset value and returns for shareholder transactions. Does not include sales charges and is not annualized for periods less than one year, if applicable.
6. Annualized for periods less than one full year.
7. Includes the Fund’s share of the allocated net investment income from Invesco Oppenheimer Master Event-Linked Bond Fund.
8. Includes the Fund’s share of the allocated expenses from Invesco Oppenheimer Master Event-Linked Bond Fund.
9. Less than 0.005%.
10. Total expenses including indirect expenses from affiliated fund fees and expenses were as follows:
| | | | | | |
| | | | | | |
Year Ended October 31, 2019 | | | 1.50% | |
Year Ended October 31, 2018 | | | 1.80% | |
Year Ended October 31, 2017 | | | 2.80% | |
Year Ended October 31, 2016 | | | 1.63% | |
Period Ended October 30, 2015 | | | 1.59% | |
11. Portfolio turnover is calculated at the fund level and is not annualized for periods less than one year, if applicable.
See accompanying Notes to Consolidated Financial Statements.
|
| 38 INVESCO OPPENHEIMER GLOBAL MULTI-ASSET GROWTH FUND |
| | | | |
| | | Period | |
| | | Ended | |
| Class R5 | | October 31, | |
| | 20191 | |
Per Share Operating Data | | | | |
| Net asset value, beginning of period | | | $10.27 | |
| Income (loss) from investment operations: | | | | |
| Net investment income2 | | | 0.05 | |
| Net realized and unrealized gain | | | 0.59 | |
| Total from investment operations | | | 0.64 | |
| Dividends and/or distributions to shareholders: | | | | |
| Dividends from net investment income | | | 0.00 | |
| Distributions from net realized gain | | | 0.00 | |
| Total dividends and/or distributions to shareholders | | | 0.00 | |
| Net asset value, end of period | | | $10.91 | |
| | | | |
| | | | |
| Total Return, at Net Asset Value3 | | | 6.23% | |
| | | | |
| Ratios/Supplemental Data | | | | |
| Net assets, end of period (in thousands) | | | $11 | |
| Average net assets (in thousands) | | | $10 | |
| Ratios to average net assets:4 | | | | |
| Net investment income | | | 1.11%5 | |
| Expenses excluding specific expenses listed below | | | 1.26% | |
| Interest and fees from borrowings | | | 0.00% | |
| Total expenses6 | | | 1.26% | |
| Expenses after payments, waivers and/or reimbursements and reduction to custodian expenses | | | 0.94% | |
Portfolio turnover rate7 | | | 43% | |
1. For the period from after the close of business on May 24, 2019 (inception of offering) to October 31, 2019.
2. Per share amounts calculated based on the average shares outstanding during the period.
3. Includes adjustments in accordance with accounting principles generally accepted in the United States of America and as such, the net asset value for financial reporting purposes and the returns based upon those net asset values may differ from the net asset value and returns for shareholder transactions. Does not include sales charges and is not annualized for periods less than one year, if applicable.
4. Annualized for periods less than one full year.
5. Includes the Fund’s share of the allocated net investment income from Invesco Oppenheimer Master Event-Linked Bond Fund.
6. Total expenses including indirect expenses from affiliated fund fees and expenses were as follows:
| | | | | | |
| | | | | | |
Period Ended October 31, 2019 | | | 1.40% | |
7. Portfolio turnover is calculated at the fund level and is not annualized for periods less than one year, if applicable.
See accompanying Notes to Consolidated Financial Statements.
|
| 39 INVESCO OPPENHEIMER GLOBAL MULTI-ASSET GROWTH FUND |
CONSOLIDATED FINANCIAL HIGHLIGHTSContinued
| | | | | | | | | | | | | | | | | | | | |
| | | | | | | | | | | | | | | Period | |
| | | Year Ended | | | Year Ended | | | Year Ended | | | Year Ended | | | Ended | |
| Class R6 | | October 31, | | | October 31, | | | October 31, | | | October 31, | | | October 30, | |
| | 2019 | | | 2018 | | | 2017 | | | 2016 | | | 20151,2 | |
Per Share Operating Data | | | | | | | | | | | | | | | | | | | | |
| Net asset value, beginning of period | | | $10.59 | | | | $11.65 | | | | $10.51 | | | | $10.31 | | | | $10.00 | |
| Income (loss) from investment operations: | | | | | | | | | | | | | | | | | | | | |
| Net investment income3 | | | 0.12 | | | | 0.20 | | | | 0.18 | | | | 0.16 | | | | 0.02 | |
| Net realized and unrealized gain (loss) | | | 0.83 | | | | (0.97) | | | | 1.48 | | | | 0.13 | | | | 0.29 | |
| Total from investment operations | | | 0.95 | | | | (0.77) | | | | 1.66 | | | | 0.29 | | | | 0.31 | |
| Dividends and/or distributions to shareholders: | | | | | | | | | | | | | | | | | | | | |
| Dividends from net investment income | | | 0.00 | | | | (0.08) | | | | (0.52) | | | | (0.09) | | | | 0.00 | |
| Distributions from net realized gain | | | (0.58) | | | | (0.21) | | | | 0.00 | | | | (0.00)4 | | | | 0.00 | |
| Total dividends and/or distributions to shareholders | | | (0.58) | | | | (0.29) | | | | (0.52) | | | | (0.09) | | | | 0.00 | |
| Net asset value, end of period | | | $10.96 | | | | $10.59 | | | | $11.65 | | | | $10.51 | | | | $10.31 | |
| | | | | | | | | | | | | | | | | | | | |
| | | | | | | | | | | | | | | | | | | | |
| Total Return, at Net Asset Value5 | | | 9.88% | | | | (6.84)% | | | | 16.60% | | | | 2.91% | | | | 3.10% | |
| | | | | | | | | | | | | | | | | | | | |
| Ratios/Supplemental Data | | | | | | | | | | | | | | | | | | | | |
| Net assets, end of period (in thousands) | | | $11 | | | | $10 | | | | $12 | | | | $11 | | | | $10 | |
| Average net assets (in thousands) | | | $10 | | | | $12 | | | | $11 | | | | $10 | | | | $10 | |
| Ratios to average net assets:6 | | | | | | | | | | | | | | | | | | | | |
| Net investment income | | | 1.16%7 | | | | 1.74%7 | | | | 1.66%7 | | | | 1.61%7 | | | | 1.27% | |
| Expenses excluding specific expenses listed below | | | 1.21% | | | | 1.24%8 | | | | 1.21%8 | | | | 1.19%8 | | | | 1.30% | |
| Interest and fees from borrowings | | | 0.00%9 | | | | 0.00%9 | | | | 0.00% | | | | 0.00% | | | | 0.00% | |
| Total expenses10 | | | 1.21% | | | | 1.24%8 | | | | 1.21%8 | | | | 1.19%8 | | | | 1.30% | |
| Expenses after payments, waivers and/or reimbursements and reduction to custodian expenses | | | 0.89% | | | | 0.92%8 | | | | 0.85%8 | | | | 0.85%8 | | | | 0.84% | |
Portfolio turnover rate11 | | | 43% | | | | 126% | | | | 54% | | | | 61% | | | | 8% | |
|
| 40 INVESCO OPPENHEIMER GLOBAL MULTI-ASSET GROWTH FUND |
1. Represents the last business day of the Fund’s reporting period.
2. For the period from August 27, 2015 (commencement of operations) to October 30, 2015.
3. Per share amounts calculated based on the average shares outstanding during the period.
4. Less than $0.005 per share.
5. Includes adjustments in accordance with accounting principles generally accepted in the United States of America and as such, the net asset value for financial reporting purposes and the returns based upon those net asset values may differ from the net asset value and returns for shareholder transactions. Does not include sales charges and is not annualized for periods less than one year, if applicable.
6. Annualized for periods less than one full year.
7. Includes the Fund’s share of the allocated net investment income from Invesco Oppenheimer Master Event-Linked Bond Fund.
8. Includes the Fund’s share of the allocated expenses from Invesco Oppenheimer Master Event-Linked Bond Fund.
9. Less than 0.005%.
10. Total expenses including indirect expenses from affiliated fund fees and expenses were as follows:
| | | | | | |
| | | | | | |
Year Ended October 31, 2019 | | | 1.35% | |
Year Ended October 31, 2018 | | | 1.41% | |
Year Ended October 31, 2017 | | | 1.36% | |
Year Ended October 31, 2016 | | | 1.30% | |
Period Ended October 30, 2015 | | | 1.41% | |
11. Portfolio turnover is calculated at the fund level and is not annualized for periods less than one year, if applicable.
See accompanying Notes to Consolidated Financial Statements.
|
| 41 INVESCO OPPENHEIMER GLOBAL MULTI-ASSET GROWTH FUND |
NOTES TO CONSOLIDATED
FINANCIAL STATEMENTSOctober 31, 2019
Note 1 - Significant Accounting Policies
Invesco Oppenheimer Global Multi-Asset Growth Fund (the “Fund”) is a series portfolio of AIM International Mutual Funds (Invesco International Mutual Funds) (the “Trust”). The Trust is a Delaware statutory trust registered under the Investment Company Act of 1940, as amended (the “1940 Act”), as anopen-end series management investment company authorized to issue an unlimited number of shares of beneficial interest. Information presented in these consolidated financial statements pertains only to the Fund. Matters affecting the Fund or each class will be voted on exclusively by the shareholders of such Fund or each class.
Prior to the close of business on May 24, 2019, the Fund operated as Oppenheimer Global Multi-Asset Growth Fund (the “Acquired Fund” or “Predecessor Fund”). The Acquired Fund was reorganized after the close of business on May 24, 2019 (the “Reorganization Date”) through the transfer of all of its assets and liabilities to the Fund (the “Reorganization”).
Upon closing of the Reorganization, holders of the Acquired Fund’s Class A, Class C, Class R, and Class Y shares received the corresponding class of shares of the Fund and holders of the Acquired Fund’s Class I shares received Class R6 shares of the Fund at an equal net asset value of the Acquired Fund’s shares on the Reorganization Date. The net asset value on Reorganization Date for Class A, Class C, Class R, Class Y and Class I was $10.31, $10.12, $10.25, $10.35 and $10.35, respectively. Information for the Acquired Fund’s Class I shares prior to the Reorganization is included with Class R6 shares throughout this report. Class R5 shares commenced operations on the Reorganization Date.
The Fund will seek to gain exposure to commodities market returns within the limitations of the federal tax requirements that apply to the Fund primarily through investments in the Invesco Oppenheimer Global Multi-Asset Growth Fund (Cayman) Ltd. (the “Subsidiary”), a wholly-owned and controlled subsidiary by the Fund organized under the laws of the Cayman Islands. The Subsidiary was organized by the Fund to invest in commodity-linked derivatives (including commodity futures, financial futures, options and swap contracts) and exchange traded funds and other exchange-traded products related to gold or other special minerals (Gold ETFs). The Subsidiary may also invest in certain fixed-income securities and other investments that may serve as margin or collateral for its derivatives positions. The Fund may invest up to 25% of its total assets in the Subsidiary.
The Fund’s investment objective is to seek capital appreciation.
The Fund currently consists of six different classes of shares: Class A, Class C, Class R, Class Y, Class R5 and Class R6. Class Y shares are available only to certain investors. Class A shares are sold with afront-end sales charge unless certain waiver criteria are met and under certain circumstances load waived shares may be subject to contingent deferred sales charges (“CDSC”). Class C shares are sold with a CDSC. Class R, Class Y, Class R5 and Class R6 shares are sold at net asset value. Class C shares held for ten years after purchase are eligible for automatic conversion into Class A shares of the same Fund (the “Conversion Feature”). The automatic conversion pursuant to the Conversion Feature will generally occur at the end of the month following the tenth anniversary after a purchase of Class C shares. Class C shares held for ten years after purchase are eligible for automatic conversion into Class A shares of the same Fund (the “Conversion Feature”). The automatic conversion pursuant to the Conversion
|
| 42 INVESCO OPPENHEIMER GLOBAL MULTI-ASSET GROWTH FUND |
Feature will generally occur at the end of the month following the tenth anniversary after a purchase of Class C shares.
The Fund is an investment company and accordingly follows the investment company accounting and reporting guidance in accordance with Financial Accounting Standards Board Accounting Standards Codification Topic 946, Financial Services – Investment Companies.
The following is a summary of the significant accounting policies followed by the Fund in the preparation of its consolidated financial statements.
| A. | Security Valuations - Securities, including restricted securities, are valued according to the following policy. |
Debt obligations (including convertible securities) and unlisted equities are fair valued using an evaluated quote provided by an independent pricing service. Evaluated quotes provided by the pricing service may be determined without exclusive reliance on quoted prices, and may reflect appropriate factors such asinstitution-size trading in similar groups of securities, developments related to specific securities, dividend rate (for unlisted equities), yield (for debt obligations), quality, type of issue, coupon rate (for debt obligations), maturity (for debt obligations), individual trading characteristics and other market data. Pricing services generally value debt obligations assuming orderly transactions of institutional round lot size, but a fund may hold or transact in the same securities in smaller, odd lot sizes. Odd lots often trade at lower prices than institutional round lots. Debt obligations are subject to interest rate and credit risks. In addition, all debt obligations involve some risk of default with respect to interest and/or principal payments.
A security listed or traded on an exchange (except convertible securities) is valued at its last sales price or official closing price as of the close of the customary trading session on the exchange where the security is principally traded, or lacking any sales or official closing price on a particular day, the security may be valued at the closing bid price on that day. Securities traded in theover-the-counter market are valued based on prices furnished by independent pricing services or market makers. When such securities are valued by an independent pricing service they may be considered fair valued. Futures contracts are valued at the final settlement price set by an exchange on which they are principally traded. Listed options are valued at the mean between the last bid and asked prices from the exchange on which they are principally traded. Options not listed on an exchange are valued by an independent source at the mean between the last bid and asked prices. For purposes of determining net asset value (“NAV”) per share, futures and option contracts generally are valued 15 minutes after the close of the customary trading session of the New York Stock Exchange (“NYSE”).
Investments inopen-end andclosed-end registered investment companies that do not trade on an exchange are valued at theend-of-day net asset value per share. Investments inopen-end andclosed-end registered investment companies that trade on an exchange are valued at the last sales price or official closing price as of the close of the customary trading session on the exchange where the security is principally traded.
Swap agreements are fair valued using an evaluated quote, if available, provided by an independent pricing service. Evaluated quotes provided by the pricing service are valued based on a model which may includeend-of-day net present values, spreads, ratings,
|
| 43 INVESCO OPPENHEIMER GLOBAL MULTI-ASSET GROWTH FUND |
NOTES TO CONSOLIDATED
FINANCIAL STATEMENTSContinued
industry, company performance and returns of referenced assets. Centrally cleared swap agreements are valued at the daily settlement price determined by the relevant exchange or clearinghouse.
Foreign securities’ (including foreign exchange contracts) prices are converted into U.S. dollar amounts using the applicable exchange rates as of the close of the NYSE. If market quotations are available and reliable for foreign exchange-traded equity securities, the securities will be valued at the market quotations. Because trading hours for certain foreign securities end before the close of the NYSE, closing market quotations may become unreliable. If between the time trading ends on a particular security and the close of the customary trading session on the NYSE, events occur that the investment adviser determines are significant and make the closing price unreliable, the Fund may fair value the security. If the event is likely to have affected the closing price of the security, the security will be valued at fair value in good faith using procedures approved by the Board of Trustees. Adjustments to closing prices to reflect fair value may also be based on a screening process of an independent pricing service to indicate the degree of certainty, based on historical data, that the closing price in the principal market where a foreign security trades is not the current value as of the close of the NYSE. Foreign securities’ prices meeting the approved degree of certainty that the price is not reflective of current value will be priced at the indication of fair value from the independent pricing service. Multiple factors may be considered by the independent pricing service in determining adjustments to reflect fair value and may include information relating to sector indices, American Depositary Receipts and domestic and foreign index futures. Foreign securities may have additional risks including exchange rate changes, potential for sharply devalued currencies and high inflation, political and economic upheaval, the relative lack of issuer information, relatively low market liquidity and the potential lack of strict financial and accounting controls and standards.
Securities for which market prices are not provided by any of the above methods may be valued based upon quotes furnished by independent sources. The last bid price may be used to value equity securities. The mean between the last bid and asked prices is used to value debt obligations, including corporate loans.
Securities for which market quotations are not readily available or became unreliable are valued at fair value as determined in good faith by or under the supervision of the Trust’s officers following procedures approved by the Board of Trustees. Issuer specific events, market trends, bid/asked quotes of brokers and information providers and other market data may be reviewed in the course of making a good faith determination of a security’s fair value.
The Fund may invest in securities that are subject to interest rate risk, meaning the risk that the prices will generally fall as interest rates rise and, conversely, the prices will generally rise as interest rates fall. Specific securities differ in their sensitivity to changes in interest rates depending on their individual characteristics. Changes in interest rates may result in increased market volatility, which may affect the value and/or liquidity of certain Fund investments.
Valuations change in response to many factors including the historical and prospective
|
| 44 INVESCO OPPENHEIMER GLOBAL MULTI-ASSET GROWTH FUND |
earnings of the issuer, the value of the issuer’s assets, general economic conditions, interest rates, investor perceptions and market liquidity. Because of the inherent uncertainties of valuation, the values reflected in the financial statements may materially differ from the value received upon actual sale of those investments.
| B. | Securities Transactions and Investment Income -Securities transactions are accounted for on a trade date basis. Realized gains or losses on sales are computed on the basis of specific identification of the securities sold. Interest income (net of withholding tax, if any) is recorded on the accrual basis from settlement date. Bond premiums and discounts are amortized and/or accreted over the lives of the respective securities.Pay-in-kind interest income andnon-cash dividend income received in the form of securitiesin-lieu of cash are recorded at the fair value of the securities received. Paydown gains and losses on mortgage and asset-backed securities are recorded as adjustments to interest income. Dividend income (net of withholding tax, if any) is recorded on theex-dividend date. |
The Fund may periodically participate in litigation related to Fund investments. As such, the Fund may receive proceeds from litigation settlements. Any proceeds received are included in the Consolidated Statement of Operations as realized gain (loss) for investments no longer held and as unrealized gain (loss) for investments still held.
Brokerage commissions and mark ups are considered transaction costs and are recorded as an increase to the cost basis of securities purchased and/or a reduction of proceeds on a sale of securities. Such transaction costs are included in the determination of net realized and unrealized gain (loss) from investment transactions reported in the Consolidated Statement of Operations and the Consolidated Statement of Changes in Net Assets and the net realized and unrealized gains (losses) on securities per share in the Consolidated Financial Highlights. Transaction costs are included in the calculation of the Fund’s net asset value and, accordingly, they reduce the Fund’s total returns. These transaction costs are not considered operating expenses and are not reflected in net investment income reported in the Consolidated Statement of Operations and the Consolidated Statement of Changes in Net Assets, or the net investment income per share and the ratios of expenses and net investment income reported in the Consolidated Financial Highlights, nor are they limited by any expense limitation arrangements between the Fund and the investment adviser.
The Fund allocates income and realized and unrealized capital gains and losses to a class based on the relative net assets of each class.
| C. | Country Determination- For the purposes of making investment selection decisions and presentation in the Consolidated Schedule of Investments, the investment adviser may determine the country in which an issuer is located and/or credit risk exposure based on various factors. These factors include the laws of the country under which the issuer is organized, where the issuer maintains a principal office, the country in which the issuer derives 50% or more of its total revenues and the country that has the primary market for the issuer’s securities, as well as other criteria. Among the other criteria that may be evaluated for making this determination are the country in which the issuer maintains 50% or more of its assets, the type of security, financial guarantees and enhancements, the nature of the collateral and the sponsor organization. |
| D. | Distributions -Dividends and distributions to shareholders, which are determined in |
|
| 45 INVESCO OPPENHEIMER GLOBAL MULTI-ASSET GROWTH FUND |
NOTES TO CONSOLIDATED
FINANCIAL STATEMENTSContinued
| | accordance with income tax regulations and may differ from accounting principles generally accepted in the United States of America (“GAAP”), are recorded on theex-dividend date. Income distributions, if any, are declared daily and paid monthly. Capital gain distributions, if any, are declared and paid annually or at other times as determined necessary by the Adviser. |
| E. | Federal Income Taxes -The Fund intends to comply with provisions of the Internal Revenue Code applicable to regulated investment companies and to distribute substantially all of its investment company taxable income, including any net realized gain on investments not offset by capital loss carryforwards, if any, to shareholders. Therefore, no federal income or excise tax provision is required. The Fund files income tax returns in U.S. federal and applicable state jurisdictions. The statute of limitations on the Fund’s tax return filings generally remains open for the three preceding fiscal reporting period ends. The Fund has analyzed its tax positions for the fiscal year ended October 31, 2019, including open tax years, and does not believe there are any uncertain tax positions requiring recognition in the Fund’s financial statements. |
Subchapter M requires, among other things, that at least 90% of the Fund’s gross income be derived from securities or derived with respect to its business of investing in securities (typically referred to as “qualifying income”). Income from commodity-linked derivatives may not be treated as “qualifying income” for purposes of the 90% gross income requirement. The Internal Revenue Service (IRS) has previously issued a number of private letter rulings which conclude that income derived from commodity index-linked notes and investments in a wholly-owned subsidiary will be “qualifying income.” As a result, the Fund will gain exposure to commodities through commodity-linked notes and its wholly-owned subsidiary.
The IRS has suspended the granting of private letter rulings pending further review. As a result, there can be no assurance that the IRS will not change its position with respect to commodity-linked notes and wholly-owned subsidiaries. In addition, future legislation and guidance from the Treasury and the IRS may adversely affect the Fund’s ability to gain exposure to commodities through commodity-linked notes and its wholly-owned subsidiary.
The Fund is required to include in income for federal income tax purposes all of the subsidiary’s net income and gains whether or not such income is distributed by the subsidiary. Net income and gains from the subsidiary are generally treated as ordinary income by the Fund, regardless of the character of the subsidiary’s underlying income. Net losses from the subsidiary do not pass through to the Fund for federal income tax purposes.
The tax components of capital shown in the following table represent distribution requirements the Fund must satisfy under the income tax regulations, losses the Fund may be able to offset against income and gains realized in future years and unrealized appreciation or depreciation of securities and other investments for federal income tax purposes.
|
| 46 INVESCO OPPENHEIMER GLOBAL MULTI-ASSET GROWTH FUND |
| | | | | | | | | | | | |
Undistributed Net Investment Income1 | | Undistributed
Long-Term
Gain | | | Accumulated
Loss
Carryforward2,3 | | | Net Unrealized
Appreciation
Based on cost of
Securities and
Other Investments
for Federal Income
Tax Purposes | |
| |
| $— | | | $370,027 | | | | $— | | | | $5,500,616 | |
1.At period end, the Fund elected to defer $1,350,781 of late year ordinary losses.
2. During the reporting period, the Fund did not utilize any capital loss carryforward.
3.During the previous reporting period, the Fund did not utilize any capital loss carryforward.
Net investment income (loss) and net realized gain (loss) may differ for financial statement and tax purposes. The character of dividends and distributions made during the fiscal year from net investment income or net realized gains are determined in accordance with federal income tax requirements, which may differ from the character of net investment income or net realized gains presented in those financial statements in accordance with U.S. GAAP. Also, due to timing of dividends and distributions, the fiscal year in which amounts are distributed may differ from the fiscal year in which the income or net realized gain was recorded by the Fund.
Accordingly, the following amounts have been reclassified for the reporting period. Net assets of the Fund were unaffected by the reclassifications.
| | | | |
Reduction toPaid-in Capital | | Reduction
to Accumulated Net
Loss | |
| |
| $311,899 | | | $311,899 | |
The tax character of distributions paid during the reporting periods:
| | | | | | | | |
| | | Year Ended
October 31, 2019 | | | Year Ended
October 31, 2018 | |
| |
| Distributions paid from: | | | | | | | | |
| Ordinary income | | $ | — | | | $ | 282,442 | |
| Long-term capital gain | | | 3,741,267 | | | | 1,262,176 | |
| | | | |
| Total | | $ | 3,741,267 | | | $ | 1,544,618 | |
| | | | |
The aggregate cost of securities and other investments and the composition of unrealized appreciation and depreciation of securities and other investments for federal income tax purposes at period end are noted in the following table. The primary difference between book and tax appreciation or depreciation of securities and other investments, if applicable, is attributable to the tax deferral of losses or tax realization of financial statement unrealized gain or loss.
|
47 INVESCO OPPENHEIMER GLOBAL MULTI-ASSET GROWTH FUND |
NOTES TO CONSOLIDATED
FINANCIAL STATEMENTSContinued
| | | | |
| Federal tax cost of securities | | $ | 64,561,647 | |
| Federal tax cost of other investments | | | 22,077,065 | |
| | | | |
| Total federal tax cost | | $ | 86,638,712 | |
| | | | |
| Gross unrealized appreciation | | $ | 6,997,294 | |
| Gross unrealized depreciation | | | (1,496,678 | ) |
| | | | |
| Net unrealized appreciation | | $ | 5,500,616 | |
| | | | |
Certain foreign countries impose a tax on capital gains which is accrued by the Fund based on unrealized appreciation, if any, on affected securities. The tax is paid when the gain is realized.
| F. | Expenses -Fees provided for under the Rule12b-1 plan of a particular class of the Fund are charged to the operations of such class. Transfer agency fees and expenses and other shareholder recordkeeping fees and expenses attributable to Class R5 and Class R6 are allocated to each share class based on relative net assets.Sub-accounting fees attributable to Class R5 are charged to the operations of the class. Transfer agency fees and expenses and other shareholder recordkeeping fees and expenses relating to all other classes are allocated among those classes based on relative net assets. All other expenses are allocated among the classes based on relative net assets. |
| G. | Accounting Estimates -The financial statements are prepared on a consolidated basis in conformity with GAAP, which requires management to make estimates and assumptions that affect the reported amounts of assets and liabilities at the date of the financial statements and the reported amounts of revenues and expenses during the reporting period including estimates and assumptions related to taxation. Actual results could differ from those estimates by a significant amount. The accompanying financial statements reflect the financial position of the Fund and its Subsidiary and the results of operations on a consolidated basis. All inter-company accounts and transactions have been eliminated in consolidation. In addition, the Fund monitors for material events or transactions that may occur or become known after theperiod-end date and before the date the consolidated financial statements are released to print. |
| H. | Indemnifications -Under the Trust’s organizational documents, each Trustee, officer, employee or other agent of the Trust, and under the Subsidiary’s organizational documents, the directors and officers of the Subsidiary, are indemnified against certain liabilities that may arise out of the performance of their duties to the Fund and/or the Subsidiary, respectively. Additionally, in the normal course of business, the Fund enters into contracts, including the Fund’s servicing agreements, that contain a variety of indemnification clauses. The Fund’s maximum exposure under these arrangements is unknown as this would involve future claims that may be made against the Fund that have not yet occurred. The risk of material loss as a result of such indemnification claims is considered remote. |
| I. | Foreign Currency Translations -Foreign currency is valued at the close of the NYSE based on quotations posted by banks and major currency dealers. Portfolio securities and other assets and liabilities denominated in foreign currencies are translated into U.S. dollar amounts at the date of valuation. Purchases and sales of portfolio securities (net of foreign taxes withheld on disposition) and income items denominated in foreign currencies |
|
| 48 INVESCO OPPENHEIMER GLOBAL MULTI-ASSET GROWTH FUND |
| | are translated into U.S. dollar amounts on the respective dates of such transactions. The Fund does not separately account for the portion of the results of operations resulting from changes in foreign exchange rates on investments and the fluctuations arising from changes in market prices of securities held. The combined results of changes in foreign exchange rates and the fluctuation of market prices on investments (net of estimated foreign tax withholding) are included with the net realized and unrealized gain or loss from investments in the Consolidated Statement of Operations. Reported net realized foreign currency gains or losses arise from (1) sales of foreign currencies, (2) currency gains or losses realized between the trade and settlement dates on securities transactions, and (3) the difference between the amounts of dividends, interest, and foreign withholding taxes recorded on the Fund’s books and the U.S. dollar equivalent of the amounts actually received or paid. Net unrealized foreign currency gains and losses arise from changes in the fair values of assets and liabilities, other than investments in securities at fiscal period end, resulting from changes in exchange rates. The Fund may invest in foreign securities, which may be subject to foreign taxes on income, gains on investments or currency repatriation, a portion of which may be recoverable. Foreign taxes, if any, are recorded based on the tax regulations and rates that exist in the foreign markets in which the Fund invests and are shown in the Consolidated Statement of Operations. |
| J. | Forward Foreign Currency Contracts - The Fund may engage in foreign currency transactions either on a spot (i.e. for prompt delivery and settlement) basis, or through forward foreign currency contracts, to manage or minimize currency or exchange rate risk. |
The Fund may also enter into forward foreign currency contracts for the purchase or sale of a security denominated in a foreign currency in order to “lock in” the U.S. dollar price of that security, or the Fund may also enter into forward foreign currency contracts that do not provide for physical settlement of the two currencies, but instead are settled by a single cash payment calculated as the difference between the agreed upon exchange rate and the spot rate at settlement based upon an agreed upon notional amount(non-deliverable forwards). The Fund will set aside liquid assets in an amount equal to the dailymark-to-market obligation for forward foreign currency contracts.
A forward foreign currency contract is an obligation between two parties (“Counterparties”) to purchase or sell a specific currency for an agreed-upon price at a future date. The use of forward foreign currency contracts does not eliminate fluctuations in the price of the underlying securities the Fund owns or intends to acquire but establishes a rate of exchange in advance. Fluctuations in the value of these contracts are measured by the difference in the contract date and reporting date exchange rates and are recorded as unrealized appreciation (depreciation) until the contracts are closed. When the contracts are closed, realized gains (losses) are recorded. Realized and unrealized gains (losses) on the contracts are included in the Consolidated Statement of Operations. The primary risks associated with forward foreign currency contracts include failure of the Counterparty to meet the terms of the contract and the value of the foreign currency changing unfavorably. These risks may be in excess of the amounts reflected in the Consolidated Statement of Assets and Liabilities.
| K. | Futures Contracts- The Fund may enter into futures contracts to manage exposure to |
|
| 49 INVESCO OPPENHEIMER GLOBAL MULTI-ASSET GROWTH FUND |
NOTES TO CONSOLIDATED
FINANCIAL STATEMENTSContinued
| | interest rate, equity and market price movements and/or currency risks. A futures contract is an agreement between Counterparties to purchase or sell a specified underlying security, currency or commodity (or delivery of a cash settlement price, in the case of an index future) for a fixed price at a future date. The Fund currently invests only in exchange-traded futures and they are standardized as to maturity date and underlying financial instrument. Initial margin deposits required upon entering into futures contracts are satisfied by the segregation of specific securities or cash as collateral at the futures commission merchant (broker). During the period the futures contracts are open, changes in the value of the contracts are recognized as unrealized gains or losses by recalculating the value of the contracts on a daily basis. Subsequent or variation margin payments are received or made depending upon whether unrealized gains or losses are incurred. These amounts are reflected as receivables or payables on the Consolidated Statement of Assets and Liabilities. When the contracts are closed or expire, the Fund recognizes a realized gain or loss equal to the difference between the proceeds from, or cost of, the closing transaction and the Fund’s basis in the contract. The net realized gain (loss) and the change in unrealized gain (loss) on futures contracts held during the period is included on the Consolidated Statement of Operations. The primary risks associated with futures contracts are market risk and the absence of a liquid secondary market. If the Fund were unable to liquidate a futures contract and/or enter into an offsetting closing transaction, the Fund would continue to be subject to market risk with respect to the value of the contracts and continue to be required to maintain the margin deposits on the futures contracts. Futures contracts have minimal Counterparty risk since the exchange’s clearinghouse, as Counterparty to all exchange-traded futures, guarantees the futures against default. Risks may exceed amounts recognized in the Consolidated Statement of Assets and Liabilities. |
| L. | Swap Agreements - The Fund may enter into various swap transactions, including interest rate, total return, index, currency and credit default swap contracts (“CDS”) for investment purposes or to manage interest rate, currency or credit risk. Such transactions are agreements between Counterparties. A swap agreement may be negotiated bilaterally and tradedover-the-counter (“OTC”) between two parties (“uncleared/OTC”) or, in some instances, must be transacted through a future commission merchant (“FCM”) and cleared through a clearinghouse that serves as a central Counterparty (“centrally cleared swap”). These agreements may contain among other conditions, events of default and termination events, and various covenants and representations such as provisions that require the Fund to maintain apre-determined level of net assets, and/or provide limits regarding the decline of the Fund’s NAV over specific periods of time. If the Fund were to trigger such provisions and have open derivative positions at that time, the Counterparty may be able to terminate such agreement and request immediate payment in an amount equal to the net liability positions, if any. |
Interest rate, total return, index, and currency swap agreements aretwo-party contracts entered into primarily to exchange the returns (or differentials in rates of returns) earned or realized on particular predetermined investments or instruments. The gross returns to be exchanged or “swapped” between the parties are calculated with respect to a notional amount, i.e., the return on or increase in value of a particular dollar amount invested at a
|
| 50 INVESCO OPPENHEIMER GLOBAL MULTI-ASSET GROWTH FUND |
particular interest rate or return of an underlying asset, in a particular foreign currency, or in a “basket” of securities representing a particular index.
In a centrally cleared swap, the Fund’s ultimate Counterparty is a central clearinghouse. The Fund initially will enter into centrally cleared swaps through an executing broker. When a fund enters into a centrally cleared swap, it must deliver to the central Counterparty (via the FCM) an amount referred to as “initial margin.” Initial margin requirements are determined by the central Counterparty, but an FCM may require additional initial margin above the amount required by the central Counterparty. Initial margin deposits required upon entering into centrally cleared swaps are satisfied by cash or securities as collateral at the FCM. Securities deposited as initial margin are designated on the Consolidated Schedule of Investments and cash deposited is recorded on the Consolidated Statement of Assets and Liabilities. During the term of a cleared swap agreement, a “variation margin” amount may be required to be paid by the Fund or may be received by the Fund, based on the daily change in price of the underlying reference instrument subject to the swap agreement and is recorded as a receivable or payable for variation margin in the Consolidated Statement of Assets and Liabilities until the centrally cleared swap is terminated at which time a realized gain or loss is recorded.
A CDS is an agreement between Counterparties to exchange the credit risk of an issuer. A buyer of a CDS is said to buy protection by paying a fixed payment over the life of the agreement and in some situations an upfront payment to the seller of the CDS. If a defined credit event occurs (such as payment default or bankruptcy), the Fund as a protection buyer would cease paying its fixed payment, the Fund would deliver eligible bonds issued by the reference entity to the seller, and the seller would pay the full notional value, or the “par value”, of the referenced obligation to the Fund. A seller of a CDS is said to sell protection and thus would receive a fixed payment over the life of the agreement and an upfront payment, if applicable. If a credit event occurs, the Fund as a protection seller would cease to receive the fixed payment stream, the Fund would pay the buyer “par value” or the full notional value of the referenced obligation, and the Fund would receive the eligible bonds issued by the reference entity. In turn, these bonds may be sold in order to realize a recovery value. Alternatively, the seller of the CDS and its Counterparty may agree to net the notional amount and the market value of the bonds and make a cash payment equal to the difference to the buyer of protection. If no credit event occurs, the Fund receives the fixed payment over the life of the agreement. As the seller, the Fund would effectively add leverage to its portfolio because, in addition to its total net assets, the Fund would be subject to investment exposure on the notional amount of the CDS. In connection with these agreements, cash and securities may be identified as collateral in accordance with the terms of the respective swap agreements to provide assets of value and recourse in the event of default under the swap agreement or bankruptcy/insolvency of a party to the swap agreement. If a Counterparty becomes bankrupt or otherwise fails to perform its obligations due to financial difficulties, the Fund may experience significant delays in obtaining any recovery in a bankruptcy or other reorganization proceeding. The Fund may obtain only limited recovery or may obtain no recovery in such circumstances. The Fund’s maximum risk of loss from Counterparty risk, either as the protection seller or as the protection buyer, is
|
| 51 INVESCO OPPENHEIMER GLOBAL MULTI-ASSET GROWTH FUND |
NOTES TO CONSOLIDATED
FINANCIAL STATEMENTSContinued
the value of the contract. The risk may be mitigated by having a master netting arrangement between the Fund and the Counterparty and by the designation of collateral by the Counterparty to cover the Fund’s exposure to the Counterparty.
Implied credit spreads represent the current level at which protection could be bought or sold given the terms of the existing CDS contract and serve as an indicator of the current status of the payment/performance risk of the CDS. An implied spread that has widened or increased since entry into the initial contract may indicate a deteriorating credit profile and increased risk of default for the reference entity. A declining or narrowing spread may indicate an improving credit profile or decreased risk of default for the reference entity. Alternatively, credit spreads may increase or decrease reflecting the general tolerance for risk in the credit markets.
An interest rate swap is an agreement between Counterparties pursuant to which the parties exchange a floating rate payment for a fixed rate payment based on a specified notional amount.
Changes in the value of centrally cleared and OTC swap agreements are recognized as unrealized gains (losses) in the Consolidated Statement of Operations by “marking to market” on a daily basis to reflect the value of the swap agreement at the end of each trading day. Payments received or paid at the beginning of the agreement are reflected as such on the Consolidated Statement of Assets and Liabilities and may be referred to as upfront payments. The Fund accrues for the fixed payment stream and amortizes upfront payments, if any, on swap agreements on a daily basis with the net amount, recorded as a component of realized gain (loss) on the Consolidated Statement of Operations. A liquidation payment received or made at the termination of a swap agreement is recorded as realized gain (loss) on the Consolidated Statement of Operations. The Fund segregates cash or liquid securities having a value at least equal to the amount of the potential obligation of a Fund under any swap transaction. Cash held as collateral is recorded as deposits with brokers on the Consolidated Statement of Assets and Liabilities. Entering into these agreements involves, to varying degrees, lack of liquidity and elements of credit, market, and Counterparty risk in excess of amounts recognized on the Consolidated Statement of Assets and Liabilities. Such risks involve the possibility that a swap is difficult to sell or liquidate; the Counterparty does not honor its obligations under the agreement and unfavorable interest rates and market fluctuations. It is possible that developments in the swaps market, including potential government regulation, could adversely affect the Fund’s ability to terminate existing swap agreements or to realize amounts to be received under such agreements. A short position in a security poses more risk than holding the same security long. As there is no limit on how much the price of the security can increase, the Fund’s exposure is unlimited.
| M. | Call Options Purchased and Written - The Fund may write call options and/or buy call options. A covered call option gives the purchaser of such option the right to buy, and the writer the obligation to sell, the underlying security or foreign currency at the stated exercise price during the option period. An uncovered call option exists without the ownership of the underlying security. Options written by the Fund normally will have expiration dates between three and nine months from the date written. The exercise price |
|
| 52 INVESCO OPPENHEIMER GLOBAL MULTI-ASSET GROWTH FUND |
| | of a call option may be below, equal to, or above the current market value of the underlying security at the time the option is written. |
Additionally, the Fund may enter into an option on a swap agreement, also called a “swaption”. A swaption is an option that gives the buyer the right, but not the obligation, to enter into a swap on a future date in exchange for paying a market-based premium. A receiver swaption gives the owner the right to receive the total return of a specified asset, reference rate or index. Swaptions also include options that allow an existing swap to be terminated or extended by one of the Counterparties.
When the Fund writes a covered call option, an amount equal to the premium received by the Fund is recorded as an asset and an equivalent liability in the Consolidated Statement of Assets and Liabilities. The amount of the liability is subsequently“marked-to-market” to reflect the current market value of the option written. If a written covered call option expires on the stipulated expiration date, or if the Fund enters into a closing purchase transaction, the Fund realizes a gain (or a loss if the closing purchase transaction exceeds the premium received when the option was written) without regard to any unrealized gain or loss on the underlying security, and the liability related to such option is extinguished. If a written covered call option is exercised, the Fund realizes a gain or a loss from the sale of the underlying security and the proceeds of the sale are increased by the premium originally received. Realized and unrealized gains and losses on call options written are included in the Consolidated Statement of Operations as Net realized gain (loss) from and Change in net unrealized appreciation (depreciation) of Option contracts written. A risk in writing a covered call option is that the Fund gives up the opportunity for profit if the market price of the security increases and the option is exercised. The risk in writing an uncovered call option is that the Fund may incur significant losses if the value of the written security exceeds the exercise price of the option.
When the Fund buys a call option, an amount equal to the premium paid by the Fund is recorded as an investment on the Consolidated Statement of Assets and Liabilities. The amount of the investment is subsequently“marked-to-market” to reflect the current value of the option purchased. Realized and unrealized gains and losses on call options purchased are included in the Consolidated Statement of Operations as Net realized gain (loss) from and Change in net unrealized appreciation (depreciation) of Investment securities. A risk in buying an option is that the Fund pays a premium whether or not the option is exercised. In addition, there can be no assurance that a liquid secondary market will exist for any option purchased.
| N. | Leverage Risk- Leverage exists when the Fund can lose more than it originally invests because it purchases or sells an instrument or enters into a transaction without investing an amount equal to the full economic exposure of the instrument or transaction. |
Note 2 – Advisory Fees and Other Fees Paid to Affiliates
The Trust has entered into a master investment advisory agreement with Invesco Advisers, Inc. (the “Adviser” or “Invesco”). Under the terms of the investment advisory agreement, the Fund accrues daily and pays monthly an advisory fee to the Adviser based on the annual rate
|
| 53 INVESCO OPPENHEIMER GLOBAL MULTI-ASSET GROWTH FUND |
NOTES TO CONSOLIDATED
FINANCIAL STATEMENTSContinued
of the Fund’s average daily net assets as follows:
| | | | |
| Fee Schedule* | | | |
| |
| Up to $500 million | | | 0.75% | |
| Next $500 million | | | 0.70 | |
| Next $4.0 billion | | | 0.65 | |
| Over $5.0 billion | | | 0.60 | |
*The advisory fee paid by the Fund shall be reduced by any amounts paid by the Fund under the administrative services agreement with the Adviser.
For the year ended October 31, 2019, the effective advisory fee incurred by the Fund was 0.75% annualized.
The Subsidiary has entered into a separate contract with the Adviser whereby the Adviser provides investment advisory and other services to the Subsidiary. In consideration of these services, the Subsidiary pays an advisory fee to the Adviser based on the annual rate of the Subsidiary’s average daily net assets as set forth in the table above.
From the beginning of the fiscal period until the date of the Reorganization, the Acquired Fund paid $282,572 in advisory fees to OFI Global Asset Management, Inc. based on the annual rates above of the Acquired Fund’s average daily net assets.
Under the terms of a mastersub-advisory agreement between the Adviser and each of Invesco Asset Management Deutschland GmbH, Invesco Asset Management Limited, Invesco Asset Management (Japan) Limited, Invesco Hong Kong Limited, Invesco Senior Secured Management, Inc. and Invesco Canada Ltd. and separatesub-advisory agreements with Invesco Capital Management LLC, and Invesco Asset Management (India) Private Limited (collectively, the “AffiliatedSub-Advisers”) the Adviser, not the Fund, will pay 40% of the fees paid to the Adviser to any such AffiliatedSub-Adviser(s) that provide(s) discretionary investment management services to the Fund based on the percentage of assets allocated to such AffiliatedSub-Adviser(s). Invesco has also entered into aSub-Advisory Agreement with OppenheimerFunds, Inc. to provide discretionary management services to the Funds.
Effective on the Reorganization Date, the Adviser has contractually agreed, through at least May 31, 2021, to waive advisory fees and/or reimburse expenses of all shares to the extent necessary to limit the total annual fund operating expenses after fee waiver and/or expense reimbursement (excluding certain items discussed below) of Class A, Class C, Class R, Class Y, Class R5 and Class R6 shares to 1.10%, 1.85%, 1.35%, 0.95%, 0.90% and 0.85%, respectively, of the Fund’s average daily net assets (the “expense limits”). In determining the Adviser’s obligation to waive advisory fees and/or reimburse expenses, the following expenses are not taken into account, and could cause total annual fund operating expenses after fee waivers and/or expense reimbursement to exceed the numbers reflected above: (1) interest; (2) taxes; (3) dividend expenses on short sales; (4) extraordinary ornon-routine items, including litigation expenses; and (5) expenses that the Fund has incurred but did not actually pay because of an expense offset arrangement. Acquired Fund Fees and Expenses are not operating expenses of the Fund directly, but are fees and expenses, including management fees of the investment companies in which the Fund invests. As a result, the total annual fund operating expenses after expense reimbursement may exceed the expense limits above. Unless Invesco continues the fee waiver agreement, it will terminate May 31, 2021. During its term,
|
| 54 INVESCO OPPENHEIMER GLOBAL MULTI-ASSET GROWTH FUND |
the fee waiver agreement cannot be terminated or amended to increase the expense limits or reduce the advisory fee waiver without approval of the Board of Trustees.
Further, the Adviser has contractually agreed, through at least June 30, 2021, to waive the advisory fee payable by the Fund in an amount equal to 100% of the net advisory fees the Adviser receives from the affiliated money market funds on investments by the Fund of uninvested cash in such affiliated money market funds.
For the year ended October 31, 2019, the Adviser waived advisory fees of $97,134 and reimbursed fund expenses of $148,974, $14,280, $11,860, $2,856, $10, and $19 for Class A, Class C, Class R, Class Y, Class R5, and Class R6, respectively.
The Trust has entered into a master administrative services agreement with Invesco pursuant to which the Fund has agreed to pay Invesco for certain administrative costs incurred in providing accounting services to the Fund. For the year ended October 31, 2019, expenses incurred under the agreement are shown in the Consolidated Statement of Operations as Administration fees. Additionally, Invesco has entered into service agreements whereby JPMorgan Chase Bank serves as custodian to the Fund. Prior to the Reorganization, the Acquired Fund paid administrative fees to OFI Global Asset Management, Inc.
The Trust has entered into a transfer agency and service agreement with Invesco Investment Services, Inc. (“IIS”) pursuant to which the Fund has agreed to pay IIS a fee for providing transfer agency and shareholder services to the Fund and reimburse IIS for certain expenses incurred by IIS in the course of providing such services. IIS may make payments to intermediaries that provide omnibus account services,sub-accounting services and/or networking services. All fees payable by IIS to intermediaries that provide omnibus account services orsub-accounting services are charged back to the Fund, subject to certain limitations approved by the Trust’s Board of Trustees. Prior to the Reorganization, the Acquired Fund paid transfer agent fees to OFI Global Asset Management, Inc. and Shareholder Services, Inc. For the year ended October 31, 2019, expenses incurred under these agreements are shown in the Consolidated Statement of Operations as Transfer and shareholder servicing agent fees.
The Trust has entered into master distribution agreements with Invesco Distributors, Inc. (“IDI”) to serve as the distributor for the Class A, Class C, Class R, Class Y, Class R5 and Class R6 shares of the Fund. The Trust has adopted plans pursuant to Rule12b-1 under the 1940 Act with respect to the Fund’s Class A, Class C and Class R shares (collectively the “Plan”). The Fund, pursuant to the Class A Plan, reimburses IDI in an amount up to an annual rate of 0.25% of the average daily net assets of Class A shares. The Fund pursuant to the Class C and Class R Plan, pays IDI compensation at the annual rate of 1.00% of the average daily net assets of Class C shares and 0.50% of the average daily net assets of Class R shares. The fees are accrued daily and paid monthly. Of the Plan payments, up to 0.25% of the average daily net assets of each class of shares may be paid to furnish continuing personal shareholder services to customers who purchase and own shares of such classes. Any amounts not paid as a service fee under the Plan would constitute an asset-based sales charge. Rules of the Financial Industry Regulatory Authority (“FINRA”) impose a cap on the total sales charges, including asset-based sales charges, that may be paid by any class of shares of the Fund plans. Prior to the Reorganization, the Acquired Fund paid distribution fees to OppenheimerFunds Distributor, Inc. For the year ended October 31, 2019, expenses incurred under the plans are
|
| 55 INVESCO OPPENHEIMER GLOBAL MULTI-ASSET GROWTH FUND |
NOTES TO CONSOLIDATED
FINANCIAL STATEMENTSContinued
shown in the Consolidated Statement of Operations as Distribution and service plan fees.
Front-end sales commissions and CDSC (collectively, the “sales charges”) are not recorded as expenses of the Fund.Front-end sales commissions are deducted from proceeds from the sales of Fund shares prior to investment in Class A shares of the Fund. CDSC are deducted from redemption proceeds prior to remittance to the shareholder. During the year ended October 31, 2019, IDI advised the Fund that IDI retained $6,941 infront-end sales commissions from the sale of Class A shares and $284 from Class C shares, for CDSC imposed on redemptions by shareholders. From the beginning of the fiscal year to the date of the Reorganization, OppenheimerFunds Distributor, Inc. retained $12,738 in front–end sales commissions from the sale of Class A shares and $49 and $242 from Class A and Class C shares, respectively, for CDSC imposed on redemption by shareholders.
Certain officers and trustees of the Trust are officers and directors of the Adviser, IIS and/or IDI.
Note 3 – Additional Valuation Information
GAAP defines fair value as the price that would be received to sell an asset or paid to transfer a liability in an orderly transaction between market participants at the measurement date, under current market conditions. GAAP establishes a hierarchy that prioritizes the inputs to valuation methods, giving the highest priority to readily available unadjusted quoted prices in an active market for identical assets (Level 1) and the lowest priority to significant unobservable inputs (Level 3), generally when market prices are not readily available or are unreliable. Based on the valuation inputs, the securities or other investments are tiered into one of three levels. Changes in valuation methods may result in transfers in or out of an investment’s assigned level:
Level 1 — Prices are determined using quoted prices in an active market for identical assets.
Level 2 — Prices are determined using other significant observable inputs. Observable inputs are inputs that other market participants may use in pricing a security. These may include quoted prices for similar securities, interest rates, prepayment speeds, credit risk, yield curves, loss severities, default rates, discount rates, volatilities and others.
Level 3 — Prices are determined using significant unobservable inputs. In situations where quoted prices or observable inputs are unavailable (for example, when there is little or no market activity for an investment at the end of the period), unobservable inputs may be used. Unobservable inputs reflect the Fund’s own assumptions about the factors market participants would use in determining fair value of the securities or instruments and would be based on the best available information.
The following is a summary of the tiered valuation input levels, as of October 31, 2019. The level assigned to the securities valuations may not be an indication of the risk or liquidity associated with investing in those securities. Because of the inherent uncertainties of valuation, the values reflected in the financial statements may materially differ from the value received upon actual sale of those investments.
|
| 56 INVESCO OPPENHEIMER GLOBAL MULTI-ASSET GROWTH FUND |
| | | | | | | | | | | | | | | | |
| | | Level 1— Unadjusted Quoted Prices | | | Level 2— Other Significant Observable Inputs | | | Level 3— Significant Unobservable Inputs | | | Value | |
| |
Assets Table | | | | | | | | | | | | | | | | |
Investments, at Value: | | | | | | | | | | | | | | | | |
Common Stocks | | | | | | | | | | | | | | | | |
Consumer Discretionary | | $ | 3,697,044 | | | $ | 4,403,930 | | | $ | — | | | $ | 8,100,974 | |
Consumer Staples | | | 903,856 | | | | 1,980,950 | | | | — | | | | 2,884,806 | |
Energy | | | 52,705 | | | | 572,792 | | | | — | | | | 625,497 | |
Financials | | | 1,515,052 | | | | 2,311,765 | | | | — | | | | 3,826,817 | |
Health Care | | | 1,862,060 | | | | 1,659,398 | | | | — | | | | 3,521,458 | |
Industrials | | | 1,077,134 | | | | 3,485,552 | | | | — | | | | 4,562,686 | |
Information Technology | | | 2,844,773 | | | | 3,354,087 | | | | — | | | | 6,198,860 | |
Materials | | | 713,644 | | | | 854,398 | | | | — | | | | 1,568,042 | |
Telecommunication Services | | | 55,320 | | | | 366,606 | | | | — | | | | 421,926 | |
Preferred Stocks | | | 2,315 | | | | — | | | | 1,959,347 | | | | 1,961,662 | |
Event-Linked Bonds | | | — | | | | — | | | | 1,298,796 | | | | 1,298,796 | |
Investment Companies | | | 35,100,446 | | | | — | | | | — | | | | 35,100,446 | |
| | | | |
Total Investments, at Value | | | 47,824,349 | | | | 18,989,478 | | | | 3,258,143 | | | | 70,071,970 | |
Other Financial Instruments: | | | | | | | | | | | | | | | | |
Futures contracts | | | 347,139 | | | | — | | | | — | | | | 347,139 | |
| | | | |
Total Assets | | $ | 48,171,488 | | | $ | 18,989,478 | | | $ | 3,258,143 | | | $ | 70,419,109 | |
| | | | |
| | | | |
Liabilities Table | | | | | | | | | | | | | | | | |
Other Financial Instruments: | | | | | | | | | | | | | | | | |
Futures contracts | | $ | (8,097 | ) | | $ | — | | | $ | — | | | $ | (8,097) | |
Options written, at value | | | (242,621 | ) | | | — | | | | — | | | | (242,621) | |
| | | | |
Total Liabilities | | $ | (250,718 | ) | | $ | — | | | $ | — | | | $ | (250,718) | |
| | | | |
Forward currency exchange contracts and futures contracts, if any, are reported at their unrealized appreciation/depreciation at measurement date, which represents the change in the contract’s value from trade date. All additional assets and liabilities included in the above table are reported at their market value at measurement date.
The following is a reconciliation of assets in which significant unobservable inputs (level 3) were used in determining fair value:
| | | | | | | | | | | | | | | | |
| | | Value as of
October 31,
2018 | | | Realized gain
(loss) | | | Change in
unrealized
appreciation/
depreciation | | | Accretion/
(amortization)
of premium/
discounta | |
| |
Assets Table | | | | | | | | | | | | | | | | |
Investments, at Value: | | | | | | | | | | | | | | | | |
Preferred Stocks | | $ | — | | | $ | — | | | $ | (110,750 | ) | | $ | — | |
Event-Linked Bonds | | | — | | | | — | | | | (1,204 | ) | | | — | |
| | | | |
Total Assets | | $ | — | | | $ | — | | | $ | (111,954 | ) | | $ | — | |
| | | | |
a. Included in net investment income.
|
| 57 INVESCO OPPENHEIMER GLOBAL MULTI-ASSET GROWTH FUND |
NOTES TO CONSOLIDATED
FINANCIAL STATEMENTSContinued
| | | | | | | | | | | | | | | | | | | | |
| | | Purchases | | | Sales | | | Transfers into
Level 3 | | | Transfers out
of Level 3 | | | Value as of
October 31,
2019 | |
| |
Assets Table | | | | | | | | | | | | | | | | | | | | |
Investments, at Value: | | | | | | | | | | | | | | | | | | | | |
Preferred Stocks | | $ | 2,070,097 | | | $ | — | | | $ | — | | | $ | — | | | $ | 1,959,347 | |
Event-Linked Bonds | | | 1,300,000 | | | | — | | | | — | | | | — | | | | 1,298,796 | |
| | | | |
Total Assets | | $ | 3,370,097 | | | $ | — | | | $ | — | | | $ | — | | | $ | 3,258,143 | |
| | | | |
The total change in unrealized appreciation/depreciation included in the Consolidated Statement of Operations attributable to Level 3 investments still held at period end:
| | | | |
| | | Change in unrealized
appreciation/
depreciation | |
| |
Assets Table | | | | |
Investments, at Value: | | | | |
Preferred Stocks | | $ | (110,750) | |
Event-Linked Bonds | | | (1,204) | |
| | | | |
Total Assets | | $ | (111,954) | |
| | | | |
The following table summarizes the valuation techniques and significant unobservable inputs used in determining fair value measurements for those investments classified as Level 3 as of October 31, 2019:
| | | | | | | | | | | | | | | | | | | | |
| | | Value as of
October 31,
2019 | | | Valuation
Technique | | | Unobservable
Input | | | Range of
Unobservable
Inputs | | | Unobservable
Input Used | |
| |
Assets Table | | | | | | | | | | | | | | | | | | | | |
Investments, at Value: | | | | | | | | | | | | | | | | | | | | |
Preferred Stocks | | | $1,889,250 | | | | Pricing Service | | | | N/A | | | | N/A | | | | N/A (a) | |
Preferred Stocks | | | 70,097 | | |
| Recent
Transaction
Price |
| |
| Recent
Transaction
Price |
| | | N/A | | |
| $6.1629/share
(b) |
|
Event-Linked Bonds | | | 1,298,796 | | | | Pricing Service | | | | N/A | | | | N/A | | | | N/A (a) | |
| | | | | | | | | | | | | | | | | | | | |
Total | | | $3,258,143 | | | | | | | | | | | | | | | | | |
| | | | | | | | | | | | | | | | | | | | |
(a) Securities classified as Level 3 whose unadjusted values were provided by a pricing service and for which such inputs are unobservable. The Adviser periodically reviews pricing vendor methodologies and inputs to confirm they are determined using unobservable inputs and have been appropriately classified. Such securities’ fair valuations could change significantly based on changes in unobservable inputs used by the pricing service.
(b) The Fund fair values certain preferred stocks at the most recent transaction price occurring within the past five months. The Adviser periodically reviews the financial statements and monitors such investments for additional market information or the occurrence of a significant event which would warrant are-evaluation of the security’s fair valuation.
Note 4 - Derivative Investments
The Fund may enter into an International Swaps and Derivatives Association Master Agreement (“ISDA Master Agreement”) under which a fund may trade OTC derivatives. An OTC transaction entered into under an ISDA Master Agreement typically involves a collateral posting arrangement, payment netting provisions andclose-out netting provisions. These
|
| 58 INVESCO OPPENHEIMER GLOBAL MULTI-ASSET GROWTH FUND |
netting provisions allow for reduction of credit risk through netting of contractual obligations. The enforceability of the netting provisions of the ISDA Master Agreement depends on the governing law of the ISDA Master Agreement, among other factors. For financial reporting purposes, the Fund does not offset OTC derivative assets or liabilities that are subject to ISDA Master Agreements in the Consolidated Statement of Assets and Liabilities.
Value of Derivative Instruments atPeriod-End
The table below reflects the Fund’s exposure to Counterparties subject to either an ISDA Master Agreement or other agreement for OTC derivative liability transactions as of October 31, 2019:
| | | | | | | | | | | | |
| | | Asset Derivatives | | | Liability Derivatives | |
Derivatives Not Accounted for as Hedging Instruments | | Consolidated Statement of Assets and Liabilities Location | | Value | | | Consolidated Statement of Assets and Liabilities Location | | Value | |
|
| |
Currency contracts | | Futures contracts | | $ | 3,200* | | | | | | | |
Equity contracts | | Futures contracts | | | 343,939* | | | Futures contracts | | $ | 8,097* | |
Equity contracts | | | | | | | | Options written at value | | | 242,621 | |
| | | | | | | | | | | | |
Total | | | | $ | 347,139 | | | | | $ | 250,718 | |
| | | | | | | | | | | | |
*Includes only the current day’s variation margin. Prior variation margin movements have been reflected in cash on the Consolidated Statement of Assets and Liabilities upon receipt or payment.
Effect of Derivative Investments for the Year Ended October 31, 2019
The tables below summarize the gains (losses) on derivative investments, detailed by primary risk exposure, recognized in earnings during the period:
| | | | | | | | | | | | | | | | |
Amount of Realized Gain or (Loss) Recognized on Derivatives | |
Derivatives Not Accounted for as Hedging Instruments | | Investment
transactions
in unaffiliated
companies* | | | Option
contracts
written | | | Futures
contracts | | | Forward
currency
exchange
contracts | |
| |
Commodity contracts | | $ | — | | | $ | — | | | $ | 208,560 | | | $ | — | |
Credit contracts | | | — | | | | — | | | | — | | | | — | |
Currency contracts | | | (3,229 | ) | | | 514,484 | | | | (6,561 | ) | | | — | |
Equity contracts | | | — | | | | 136,685 | | | | 1,407,280 | | | | — | |
Forward currency exchange contracts | | | — | | | | — | | | | — | | | | (469,144) | |
Interest rate contracts | | | — | | | | — | | | | 1,227,050 | | | | — | |
Volatility contracts | | | — | | | | — | | | | (82,980 | ) | | | — | |
| | | | |
Total | | $ | (3,229 | ) | | $ | 651,169 | | | $ | 2,753,349 | | | $ | (469,144) | |
| | | | |
|
| 59 INVESCO OPPENHEIMER GLOBAL MULTI-ASSET GROWTH FUND |
NOTES TO CONSOLIDATED
FINANCIAL STATEMENTSContinued
| | | | | | | | |
Amount of Realized Gain or (Loss) Recognized on Derivatives | |
Derivatives Not Accounted for as Hedging Instruments | | Swap contracts | | | Total | |
| |
Commodity contracts | | $ | — | | | $ | 208,560 | |
Credit contracts | | | 117,087 | | | | 117,087 | |
Currency contracts | | | — | | | | 504,694 | |
Equity contracts | | | (1,643,180 | ) | | | (99,215) | |
Forward currency exchange contracts | | | — | | | | (469,144) | |
Interest rate contracts | | | (178,195 | ) | | | 1,048,855 | |
Volatility contracts | | | — | | | | (82,980) | |
| | | | |
Total | | $ | (1,704,288 | ) | | $ | 1,227,857 | |
| | | | |
*Purchased option contracts and purchased swaption contracts, if any, are included in the realized gain (loss) from investment transactions in unaffiliated companies.
| | | | | | | | | | | | | | | | |
Amount of Change in Unrealized Gain or (Loss) Recognized on Derivatives | |
Derivatives Not Accounted for as Hedging Instruments | | Investment
transactions in unaffiliated
companies* | | | Option
contracts
written | | | Futures
contracts | | | Forward
currency
exchange
contracts | |
| |
Credit contracts | | $ | — | | | $ | — | | | $ | — | | | $ | — | |
Currency contracts | | | (36,803 | ) | | | (3,755 | ) | | | 3,200 | | | | — | |
Equity currency | | | — | | | | (102,404 | ) | | | 133,058 | | | | — | |
Forward currency exchange contracts | | | — | | | | — | | | | — | | | | 202,992 | |
Interest rate contracts | | | — | | | | — | | | | 25,672 | | | | — | |
| | | | |
Total | | $ | (36,803 | ) | | $ | (106,159 | ) | | $ | 161,930 | | | $ | 202,992 | |
| | | | |
| | | | | | | | |
Amount of Change in Unrealized Gain or (Loss) Recognized on Derivatives | |
Derivatives Not Accounted for as Hedging Instruments | | Swap contracts | | | Total | |
| |
Credit contracts | | $ | (33,954 | ) | | $ | (33,954) | |
Currency contracts | | | — | | | | (37,358) | |
Equity currency | | | 25,587 | | | | 56,241 | |
Forward currency exchange contracts | | | — | | | | 202,992 | |
Interest rate contracts | | | — | | | | 25,672 | |
| | | | |
Total | | $ | (8,367 | ) | | $ | 213,593 | |
| | | | |
*Purchased option contracts and purchased swaption contracts, if any, are included in the change in unrealized gain (loss) from investment transactions in unaffiliated companies.
The table below summarizes the year ended average notional value of forward foreign
|
| 60 INVESCO OPPENHEIMER GLOBAL MULTI-ASSET GROWTH FUND |
currency contracts, futures contracts, swap agreements, and options purchasedduring the period.
| | | | | | | | | | | | | | | | | | | | |
| | | Futures contracts | | | Written index
options* | | | Written FX
options* | | | Swap agreements | | | Forward foreign currency contracts | |
| |
Average notional amount | | $ | 42,866,651 | | | $ | 20,976,900 | | | $ | 20,070,000 | | | $ | 44,741,559 | | | $ | 24,228,602 | |
Average contracts | | | | | | | 460 | | | | 20,070,000 | | | | | | | | | |
*Summarizes the 2 month average notional value of written index options and the 5 month average notional value of written currency options.
Note 5 – Expense Offset Arrangement
The expense offset arrangement is comprised of custodian credits which result from periodic overnight cash balances at the custodian. For the yearended October 31, 2019, the Fund received credits from this arrangement, which resulted in the reduction of the Fund’s total expenses of $1,370.
Note 6 – Trustee and Officer Fees and Benefits
Certain Trustees have executed a Deferred Compensation Agreement pursuant to which they have the option to elect to defer receipt of all or a portion of the annual compensation they are entitled to receive from the Fund. For purposes of determining the amount owed to the Trustees under the plan, deferred amounts are treated as though equal dollar amounts had been invested in shares of the Fund or in other Invesco and/or Invesco Oppenheimer funds selected by the Trustees. The Fund purchases shares of the funds selected for deferral by the Trustees in amounts equal to his or her deemed investment, resulting in a Fund asset equal to the deferred compensation liability. Such assets are included as a component of “Other” within the asset section of the Consolidated Statement of Assets and Liabilities. Deferral of Trustees’ fees under the plan will not affect the net assets of the Fund and will not materially affect the Fund’s assets, liabilities or net investment income per share. Amounts will be deferred until distributed in accordance with the compensation deferral plan.
Note 7 – Cash Balances
The Fund is permitted to temporarily carry a negative or overdrawn balance in its account with JPMorgan Chase Bank, the custodian bank. Such balances, if any atperiod-end, are shown in the Consolidated Statement of Assets and Liabilities under the payable caption Amount due to custodian. To compensate the custodian bank for such overdrafts, the overdrawn Fund may either (1) leave funds as a compensating balance in the account so the custodian bank can be compensated by earning the additional interest; or (2) compensate by paying the custodian bank at a rate agreed upon by the custodian bank and Invesco, not to exceed the contractually agreed upon rate.
|
| 61 INVESCO OPPENHEIMER GLOBAL MULTI-ASSET GROWTH FUND |
NOTES TO CONSOLIDATED
FINANCIAL STATEMENTSContinued
Note 8 – Investment Transactions
The aggregate amount of investment securities (other than short-term securities, U.S. Treasury obligations and money market funds, if any) purchased and sold by the Fund during the yearended October 31, 2019 was $23,347,449 and 53,279,765, respectively.
Note 9 – Share Information
Transactions in shares of beneficial interest were as follows:
| | | | | | | | | | | | | | | | |
| | | Year Ended October 31, 20191 | | | Year Ended October 31, 2018 | |
| | | Shares | | | Amount | | | Shares | | | Amount |
|
| |
Class A | | | | | | | | | | | | | | | | |
Sold | | | 265,160 | | | $ | 2,735,421 | | | | 546,221 | | | $ | 6,329,434 | |
Automatic conversion Class C to Class A Shares | | | 23,594 | | | | 250,921 | | | | — | | | | — | |
Dividends and/or distributions reinvested | | | 47,840 | | | | 450,172 | | | | 12,796 | | | | 147,665 | |
Redeemed | | | (241,099 | ) | | | (2,502,328 | ) | | | (329,070 | ) | | | (3,747,740) | |
| | | | |
Net increase (decrease) | | | 95,495 | | | $ | 934,186 | | | | 229,947 | | | $ | 2,729,359 | |
| | | | |
|
| |
Class C | | | | | | | | | | | | | | | | |
Sold | | | 111,161 | | | $ | 1,133,228 | | | | 315,021 | | | $ | 3,604,071 | |
Dividends and/or distributions reinvested | | | 22,865 | | | | 211,959 | | | | 3,028 | | | | 34,703 | |
Automatic conversion Class C to Class A Shares | | | (24,048 | ) | | | (250,921 | ) | | | — | | | | — | |
Redeemed | | | (151,038 | ) | | | (1,549,988 | ) | | | (115,836 | ) | | | (1,294,958) | |
| | | | |
Net increase (decrease) | | | (41,060 | ) | | $ | (455,722 | ) | | | 202,213 | | | $ | 2,343,816 | |
| | | | |
|
| |
Class R | | | | | | | | | | | | | | | | |
Sold | | | 143,056 | | | $ | 1,463,383 | | | | 104,789 | | | $ | 1,202,086 | |
Dividends and/or distributions reinvested | | | 15,024 | | | | 140,779 | | | | 4,616 | | | | 53,172 | |
Redeemed | | | (95,106 | ) | | | (987,968 | ) | | | (89,415 | ) | | | (1,001,112) | |
| | | | |
Net increase (decrease) | | | 62,974 | | | $ | 616,194 | | | | 19,990 | | | $ | 254,146 | |
| | | | |
|
| |
Class Y | | | | | | | | | | | | | | | | |
Sold | | | 109,572 | | | $ | 1,079,142 | | | | 30,090 | | | $ | 354,226 | |
Dividends and/or distributions reinvested | | | 2,552 | | | | 24,118 | | | | 433 | | | | 4,999 | |
Redeemed | | | (23,788 | ) | | | (241,578 | ) | | | (11,390 | ) | | | (133,008) | |
| | | | |
Net increase (decrease) | | | 88,336 | | | $ | 861,682 | | | | 19,133 | | | $ | 226,217 | |
| | | | |
|
| |
Class R52 | | | | | | | | | | | | | | | | |
Sold | | | 974 | | | $ | 10,001 | | | | — | | | $ | — | |
Dividends and/or distributions reinvested | | | — | | | | — | | | | — | | | | — | |
Redeemed | | | — | | | | — | | | | — | | | | — | |
| | | | |
Net increase (decrease) | | | 974 | | | $ | 10,001 | | | | — | | | $ | — | |
| | | | |
|
| 62 INVESCO OPPENHEIMER GLOBAL MULTI-ASSET GROWTH FUND |
| | | | | | | | | | | | | | | | |
| | | Year Ended October 31, 20191 | | | Year Ended October 31, 2018 | |
| | | Shares | | | Amount | | | Shares | | | Amount | |
| |
Class R6 | | | | | | | | | | | | | | | | |
Sold | | | — | | | $ | — | | | | — | | | $ | — | |
Dividends and/or distributions reinvested | | | — | | | | — | | | | — | | | | — | |
Redeemed | | | — | | | | — | | | | — | | | | — | |
| | | | |
Net increase (decrease) | | | — | | | $ | — | | | | — | | | $ | — | |
| | | | |
1. There are entities that are record owners of more than 5% of the outstanding shares of the Fund and own 76% of the outstanding shares of the Fund. IDI has an agreement with these entities to sell Fund shares. The Fund, Invesco and/or Invesco affiliates may make payments to these entities, which are considered to be related to the Fund, for providing services to the Fund, Invesco and/or Invesco affiliates, including but not limited to services such as securities brokerage, distribution, third party record keeping and account servicing. The Fund has no knowledge as to whether all or any portion of the shares owned of record by these entities are also owned beneficially.
2. Commencement date after the close of business on May 24, 2019.
Note 10 – Borrowings
Joint Credit Facility.A number of mutual funds managed by the Adviser participate in a $1.95 billion revolving credit facility (the “Facility”) intended to provide short-term financing, if necessary, subject to certain restrictions in connection with atypical redemption activity. Expenses and fees related to the Facility are paid by the participating funds and are disclosed separately or as other expenses on the Consolidated Statement of Operations. The Fund did not utilize the Facility during the reporting period. The Facility terminated May 24, 2019.
|
| 63 INVESCO OPPENHEIMER GLOBAL MULTI-ASSET GROWTH FUND |
REPORT OF INDEPENDENT REGISTERED PUBLIC ACCOUNTING FIRM
To the Board of Trustees of AIM International Mutual Funds (Invesco International Mutual Funds) and Shareholders of Invesco Oppenheimer Global Multi-Asset Growth Fund
Opinion on the Financial Statements
We have audited the accompanying consolidated statement of assets and liabilities, including the consolidated schedule of investments, of Invesco Oppenheimer Global Multi-Asset Growth Fund and its subsidiary (one of the funds constituting AIM International Mutual Funds (Invesco International Mutual Funds), referred to hereafter as the “Fund”) as of October 31, 2019, the related consolidated statements of operations and of changes in net assets for the year ended October 31, 2019, including the related notes, and the consolidated financial highlights for each of the periods ended October 31, 2019 (collectively referred to as the “consolidated financial statements”). In our opinion, the consolidated financial statements present fairly, in all material respects, the financial position of the Fund as of October 31, 2019, the results of its operations and changes in its net assets for the year ended October 31, 2019 and the financial highlights for each of the periods ended October 31, 2019 in conformity with accounting principles generally accepted in the United States of America.
The consolidated financial statements of Invesco Oppenheimer Global Multi-Asset Growth Fund (formerly known as Oppenheimer Global Multi-Asset Growth Fund) as of and for the year ended October 31, 2018 and the consolidated financial highlights for each of the periods ended on or prior to October 31, 2018 (not presented herein, other than the consolidated statement of changes in net assets and the consolidated financial highlights) were audited by other auditors whose report dated December 21, 2018 expressed an unqualified opinion on those consolidated financial statements and consolidated financial highlights.
Basis for Opinion
These consolidated financial statements are the responsibility of the Fund’s management. Our responsibility is to express an opinion on the Fund’s consolidated financial statements based on our audit. We are a public accounting firm registered with the Public Company Accounting Oversight Board (United States) (PCAOB) and are required to be independent with respect to the Fund in accordance with the U.S. federal securities laws and the applicable rules and regulations of the Securities and Exchange Commission and the PCAOB.
We conducted our audit of these consolidated financial statements in accordance with the standards of the PCAOB. Those standards require that we plan and perform the audit to obtain reasonable assurance about whether the consolidated financial statements are free of material misstatement, whether due to error or fraud.
Our audit included performing procedures to assess the risks of material misstatement of the consolidated financial statements, whether due to error or fraud, and performing procedures that respond to those risks. Such procedures included examining, on a test basis, evidence regarding the amounts and disclosures in the consolidated financial statements. Our audit also included evaluating the accounting principles used and significant estimates made by management, as well as evaluating the overall presentation of the consolidated financial statements. Our procedures included confirmation of securities owned as of October 31, 2019 by correspondence with the custodian, transfer agent and brokers; when replies were not received from brokers, we performed other auditing procedures. We believe that our audit provides a reasonable basis for our opinion.
|
| 64 INVESCO OPPENHEIMER GLOBAL MULTI-ASSET GROWTH FUND |
/s/PricewaterhouseCoopers LLP
Houston, Texas
December 27, 2019
We have served as the auditor of one or more of the investment companies in the Invesco group of investment companies since at least 1995. We have not been able to determine the specific year we began serving as auditor.
|
| 65 INVESCO OPPENHEIMER GLOBAL MULTI-ASSET GROWTH FUND |
INDEPENDENT REGISTERED PUBLIC ACCOUNTING FIRM
The Audit Committee of the Board of Trustees appointed, and the Board of Trustees ratified and approved, PricewaterhouseCoopers LLP (“PwC”) as the independent registered public accounting firm of the Fund for the fiscal periods ending after May 24, 2019. Prior to the close of business on May 24, 2019, the Predecessor Fund was a separate series of an unaffiliated investment company and its financial statements were audited by a different independent registered public accounting firm (the “Prior Auditor”).
Effective after the close of business on May 24, 2019, the Prior Auditor resigned as the independent registered public accounting firm of the Fund. The Prior Auditor’s report on the financial statements of the Predecessor Fund for the past two fiscal years did not contain an adverse or disclaimer of opinion, and was not qualified or modified as to uncertainty, audit scope or accounting principles. During the Predecessor Fund’s two most recent fiscal years and through the close of business on May 24, 2019, there were no (1) disagreements with the Prior Auditor on any matter of accounting principles or practices, financial statement disclosure, or auditing scope or procedure, which disagreements, if not resolved to the Prior Auditor’s satisfaction, would have caused it to make reference to that matter in connection with its report; or (2) “reportable events,” as that term is defined in Item 304(a)(1)(v) of RegulationS-K under the Securities Exchange Act of 1934.
|
| 66 INVESCO OPPENHEIMER GLOBAL MULTI-ASSET GROWTH FUND |
FEDERAL INCOME TAX INFORMATION
In early 2019, if applicable, shareholders of record received information regarding all dividends and distributions paid to them by the Fund during calendar year 2018.
Capital gain distributions of $0.58270 per share were paid to Class A, Class C, Class R, Class Y and Class R6 shareholders, respectively, on December 19, 2018. Whether received in stock or in cash, the capital gain distribution should be treated by shareholders as a gain from the sale of the capital assets held for more than one year (long-term capital gains).
None of the dividends paid by the Fund during the reporting period are eligible for the corporate dividend-received deduction.
A portion, if any, of the dividends paid by the Fund during the reporting period which are not designated as capital gain distributions are eligible for lower individual income tax rates to the extent that the Fund has received qualified dividend income as stipulated by recent tax legislation. The maximum amount allowable but not less than $816,992 of the Fund’s fiscal year taxable income may be eligible for the lower individual income tax rates. In early 2019, shareholders of record received information regarding the percentage of distributions that are eligible for lower individual income tax rates.
The foregoing information is presented to assist shareholders in reporting distributions received from the Fund to the Internal Revenue Service. Because of the complexity of the federal regulations which may affect your individual tax return and the many variations in state and local tax regulations, we recommend that you consult your tax advisor for specific guidance.
|
| 67 INVESCO OPPENHEIMER GLOBAL MULTI-ASSET GROWTH FUND |
APPROVAL OF INVESTMENT ADVISORY ANDSUB-ADVISORY
CONTRACTS
At meetings held on December 14, 2018, the Board of Trustees (the Board or the Trustees) of AIM International Mutual Funds (Invesco International Mutual Funds) (the Trust) as a whole, and the independent Trustees, who comprise over 75% of the Board, voting separately, approved (i) an amendment to the Trust’s Master Investment Advisory Agreement with Invesco Advisers, Inc. (Invesco Advisers and the investment advisory agreement) to add Invesco Oppenheimer Global Multi-Asset Growth Fund (the Fund), (ii) an amendment to the Master IntergroupSub-Advisory Contract for Mutual Funds with Invesco Asset Management Deutschland GmbH, Invesco Asset Management Limited, Invesco Asset Management (Japan) Limited, Invesco Hong Kong Limited, Invesco Senior Secured Management, Inc. and Invesco Canada Ltd. to add the Fund, (iii) an amendment to the separatesub-advisory contract with Invesco Capital Management LLC to add the Fund, (iv) an amendment to the separatesub-advisory contract with Invesco Asset Management (India) Private Limited to add the Fund, (v) an initialsub-advisory contract with OppenheimerFunds, Inc. (collectively, the Affiliated Sub- Advisers), and (vi) an initialsub-advisory contract with Barings LLC (Barings) (collectively, thesub-advisory contracts). Additionally, on March 26, 2019, the Boardre-approved an initialsub-advisory contract with OppenheimerFunds, Inc. following its change of control as a result of the acquisition of OppenheimerFunds, Inc. and its subsidiaries, including the Oppenheimer mutual funds (each, an Oppenheimer Fund), by Invesco Ltd. (the OFI Transaction). After evaluating the factors discussed below, among others, the Board approved the Fund’s investment advisory agreement and thesub-advisory contracts and determined that the compensation payable by the Fund to Invesco Advisers and by Invesco Advisers to the AffiliatedSub-Advisers and Barings is fair and reasonable.
The Board’s Evaluation Process
The Board noted that it had previously approved establishing the Fund at the Board meeting held on October 23, 2018 and that the Fund was formed to acquire the assets and liabilities of an Oppenheimer Fund (the Acquired Fund) with the same investment objective and substantially similar principal investment strategies and risks. At the time of approval, the Fund had no assets and no performance history and the portfolio managers were not employed by Invesco Advisers or any of the AffiliatedSub-Advisers except OppenheimerFunds, Inc., which was not affiliated with Invesco at that time.
In approving the investment advisory agreement andsub-advisory contracts, the Board followed a process similar to the process that it follows in annually reviewing and approving investment advisory agreements andsub-advisory contracts for the series portfolios of funds advised by Invesco Advisers and considered the information provided in the most recent annual review process for those funds as well as the information provided with respect to the Fund. With respect to Barings, the Board considered the information provided to the Board of Trustees of the Acquired Fund in connection with its most recent annual review process for the Acquired Fund, as well as a representation from Barings that there had been no material changes to that information that would be relevant to the Board’s consideration
|
| 68 INVESCO OPPENHEIMER GLOBAL MULTI-ASSET GROWTH FUND |
of thesub-advisory contract with respect to the Fund. As part of the approval process, the Board reviewed and considered information provided in response to detailed requests for information submitted to management by the independent Trustees with assistance from legal counsel to the independent Trustees. The Board reviewed comparative investment performance and fee data prepared by Invesco Advisers and an independent mutual fund data provider. The Board was assisted in its review by the Senior Officer, an officer of the Invesco Funds who reports directly to the independent Trustees, and by independent legal counsel.
The discussion below serves as a summary of the material factors and related conclusions that formed the basis for the Board’s approval of the Fund’s investment advisory agreement andsub-advisory contracts. The Trustees’ review and conclusions are based on the comprehensive consideration of all information presented to them and are not the result of any single determinative factor. Moreover, one Trustee may have weighed a particular piece of information or factor differently than another Trustee. This information is current as of December 14, 2018 and March 26, 2019 for thesub-advisory contract with OppenheimerFunds, Inc.
Factors and Conclusions and Summary of Independent Written Fee Evaluation
A. Nature, Extent and Quality of Services Provided by Invesco Advisers, the Affiliated Sub-Advisers and Barings
The Board reviewed the nature, extent and quality of the advisory services to be provided to the Fund by Invesco Advisers under the Fund’s investment advisory agreement, and the credentials and experience of the officers and employees of Invesco Advisers who will provide these services. The Board’s review included consideration of the investment process oversight and structure, credit analysis and investment risk management to be employed in providing advisory services to the Fund. The Board also considerednon-advisory services that Invesco Advisers and its affiliates provide to the Invesco Funds and will provide to the Fund, such as various back office support functions, third party oversight, internal audit, valuation, portfolio trading and legal and compliance. The Board also received and reviewed information about Invesco Advisers’ role as administrator of the Invesco Funds’ liquidity risk management program. The Board also reviewed and considered the benefits to shareholders of investing in a fund that is part of the Invesco family of funds under the umbrella of Invesco Ltd., Invesco Advisers’ parent company, and noted Invesco Ltd.’s depth and experience in conducting an investment management business, as well as its commitment of financial and other resources to such business. The Board reviewed and considered information about the resources that Invesco Advisers intends to continue to commit to managing the Invesco family of funds, including the Fund, following the OFI Transaction. The Board concluded that the nature, extent and quality of the services to be provided to the Fund by Invesco Advisers are appropriate and satisfactory.
|
| 69 INVESCO OPPENHEIMER GLOBAL MULTI-ASSET GROWTH FUND |
APPROVAL OF INVESTMENT ADVISORY ANDSUB-ADVISORY
CONTRACTSContinued
The Board reviewed the services that may be provided by the AffiliatedSub-Advisers and Barings under thesub-advisory contracts and the credentials and experience of the officers and employees of the AffiliatedSub-Advisers and Barings who provide these services. The Board noted the AffiliatedSub-Advisers’ and Barings’ expertise with respect to certain asset classes and that the AffiliatedSub-Advisers and Barings have offices and personnel that are located in financial centers around the world. As a result, the Board noted that the AffiliatedSub-Advisers can provide research and investment analysis on the markets and economies of various countries in which the Fund may invest, make recommendations regarding securities and assist with security trades. The Board noted that Barings can provide research, security selection and portfolio management services specific to real estate securities, but does not currently provide certain trading and oversight services to the Fund. The Board concluded that thesub-advisory contracts may benefit the Fund and its shareholders by permitting Invesco Advisers to use the resources and talents of the AffiliatedSub-Advisers and Barings in managing the Fund. The Board concluded that the nature, extent and quality of the services that may be provided by the AffiliatedSub-Advisers and Barings are appropriate and satisfactory.
B. Fund Investment Performance
The Board noted that the Fund would continue the historical performance information of the Acquired Fund following the consummation of the OFI Transaction. The Board considered the performance of the Acquired Fund and the fact that, at the closing of the OFI Transaction, management anticipates that the Fund will be managed pursuant to substantially similar investment strategies and by substantially the same portfolio management team as managed the Acquired Fund.
The Board compared the Fund’s investment performance over the one year period ending December 31, 2017 to the performance of funds in the Morningstar performance universe and against the Fund’s benchmark index. The Trustees also reviewed more recent Fund performance and this review did not change their conclusions.
C. Advisory andSub-Advisory Fees and Fund Expenses
The Board compared the Fund’s contractual management fee rate to the contractual management fee rates of funds in the Fund’s Morningstar expense group. The Board also considered comparative information regarding the Fund’s total expense ratio and its various components.
The Board noted that Invesco Advisers has contractually agreed to waive fees and/or limit expenses of the Fund for at least two years from the closing date of the OFI Transaction in an amount necessary to limit total annual operating expenses to a specified percentage of
|
| 70 INVESCO OPPENHEIMER GLOBAL MULTI-ASSET GROWTH FUND |
average daily net assets for each class of the Fund.
The Board also compared the Fund’s effective advisory fee rate (the advisory fee rate after advisory fee waivers and before other expense limitations/waivers) to the effective advisory fee rates of other mutual funds in the Fund’s Lipper category advised orsub-advised by Invesco Advisers and its affiliates, based on asset balances as of December 31, 2017.
The Board also considered the services that may be provided by the AffiliatedSub-Advisers and Barings pursuant to thesub-advisory contracts, as well as the fees payable by Invesco Advisers to the AffiliatedSub-Advisers and Barings pursuant to thesub-advisory contracts. The Board noted that Invesco Advisers retains overall responsibility for, and provides services to,sub-advised Invesco Funds, including oversight of the AffiliatedSub-Advisers and Barings as well as the additional services described herein other thanday-to-day portfolio management.
D. Economies of Scale and Breakpoints
The Board considered the extent to which there may be economies of scale in the provision of advisory services to the Fund. The Board considered Invesco’s reinvestment in its business, including investments in business infrastructure and cybersecurity. The Board also considered that the Fund may benefit from economies of scale through contractual breakpoints in the Fund’s advisory fee schedule, which generally operate to reduce the Fund’s expense ratio as it grows in size. The Board noted that the Fund will share directly in economies of scale through lower fees charged by third party service providers based on the combined size of the Invesco Funds. The Board noted that the Fund may also benefit from economies of scale through initial fee setting, fee waivers and expense reimbursements.
E. Profitability and Financial Resources
The Board reviewed information from the 2018 contract renewal process provided by Invesco Advisers concerning the costs of the advisory and other services that Invesco Advisers and its affiliates provide to the Invesco Funds and the profitability of Invesco Advisers and its affiliates in providing these services. The Board considered the methodology used for calculating profitability and noted the periodic review of such methodology by an independent consultant. The Board noted that Invesco Advisers will continue to operate at a net profit from services Invesco Advisers and its affiliates provide to the Invesco Funds. The Board did not deem the level of profits realized by Invesco Advisers and its affiliates from providing services to the Invesco Funds, and the profits estimated to be realized by the Fund, to be excessive given the nature, extent and quality of the services provided. The Board also considered information provided regarding the profitability of Barings in providing portfolio management and other services to the Fund. The Board received information from Invesco Advisers demonstrating that Invesco Advisers, the AffiliatedSub-Advisers and Barings are
|
| 71 INVESCO OPPENHEIMER GLOBAL MULTI-ASSET GROWTH FUND |
APPROVAL OF INVESTMENT ADVISORY ANDSUB-ADVISORY
CONTRACTSContinued
financially sound and have the resources necessary to perform their obligations under the investment advisory agreement andsub-advisory contracts.
F. Collateral Benefits to Invesco Advisers and its Affiliates
The Board considered various other benefits to be received by Invesco Advisers and its affiliates from the relationship with the Fund, including the fees to be received for providing administrative, transfer agency and distribution services to the Fund. The Board considered the performance of Invesco Advisers and its affiliates in providing these services to other Invesco Funds and the organizational structure employed to provide these services. The Board also considered that these services will be provided to the Fund pursuant to written contracts that are reviewed and approved on an annual basis by the Board; and that the services are required for the operation of the Fund.
The Board considered the benefits realized by Invesco Advisers and the Affiliated Sub- Advisers as a result of portfolio brokerage transactions executed through “soft dollar” arrangements. The Board noted that Barings does not currently participate in soft dollar arrangements for the Fund.
The Board considered that the Fund’s uninvested cash and cash collateral from any securities lending arrangements may be invested in money market funds advised by Invesco Advisers pursuant to procedures approved by the Board. The Board considered that Invesco Advisers will receive advisory fees from these affiliated money market funds attributable to such investments, although Invesco Advisers has contractually agreed to waive through varying periods the advisory fees payable by the Invesco Funds with respect to certain investments in the affiliated money market funds. The waiver is in an amount equal to 100% of the net advisory fee Invesco Advisers will receive from the affiliated money market funds with respect to the Fund’s investment in the affiliated money market funds of uninvested cash, but not cash collateral. The Board concluded that the amount of advisory fees to be received by Invesco Advisers from the Fund’s investment of cash collateral from any securities lending arrangements in the affiliated money market funds is fair and reasonable.
The Board also considered that an affiliated broker may receive commissions for executing certain trades for the Fund. Invesco Advisers and the AffiliatedSub-Advisers may use the affiliated broker to, among other things, control order routing and minimize information leakage, and the Board was advised that such trades will be executed in compliance with rules under the federal securities laws and consistent with best execution obligations.
|
| 72 INVESCO OPPENHEIMER GLOBAL MULTI-ASSET GROWTH FUND |
PORTFOLIO PROXY VOTING POLICIES AND GUIDELINES;
UPDATES TO SCHEDULE OF INVESTMENTS
Go paperless with eDelivery
Visit invesco.com/edelivery to enjoy the convenience and security of anytime electronic access to your investment documents.
With eDelivery, you can elect to have any or all of the following materials delivered straight to your inbox to download, save and print from your own computer:
● Fund reports and prospectuses
● Quarterly statements
● Daily confirmations
● Tax forms
Invesco mailing information
Send general correspondence to Invesco Investment Services, Inc., P.O. Box 219078, Kansas City, MO 64121-9078.
Important notice regarding delivery of security holder documents
To reduce Fund expenses, only one copy of most shareholder documents may be mailed to shareholders with multiple accounts at the same address (Householding). Mailing of your shareholder documents may be householded indefinitely unless you instruct us otherwise. If you do not want the mailing of these documents to be combined with those for other members of your household, please contact Invesco Investment Services, Inc. at 800 959 4246 or contact your financial institution. We will begin sending you individual copies for each account within 30 days after receiving your request.
Fund holdings and proxy voting information
The Fund provides a complete list of its holdings four times in each fiscal year, at the quarter ends. For the second and fourth quarters, the lists appear in the Fund’s semiannual and annual reports to shareholders. For the first and third quarters, the Fund files the lists with the Securities and Exchange Commission (SEC) as an exhibit to its reports on FormN-PORT. The most recent list of portfolio holdings is available at invesco.com/completeqtrholdings. Shareholders can also look up the Fund’s FormsN-PORT on the SEC website at sec.gov.
A description of the policies and procedures that the Fund uses to determine how to vote proxies relating to portfolio securities is available without charge, upon request, from our Client Services department at 800 959 4246 or at invesco.com/proxyguidelines. The information is also available on the SEC website, sec.gov.
Information regarding how the Fund voted proxies related to its portfolio securities during the most recent12-month period ended June 30 is available at invesco.com/proxysearch. The information is also available on the SEC website, sec.gov.
Invesco Advisers, Inc. is an investment adviser; it provides investment advisory services to individual and institutional clients and does not sell securities. Invesco Distributors, Inc. is the US distributor for Invesco Ltd.’s retail mutual funds, exchange-traded funds and institutional money market funds. Both are wholly owned, indirect subsidiaries of Invesco Ltd.
|
| 73 INVESCO OPPENHEIMER GLOBAL MULTI-ASSET GROWTH FUND |
TRUSTEES AND OFFICERS
The address of each trustee and officer is AIM International Mutual Funds (Invesco International Mutual Funds) (the “Trust”), 11 Greenway Plaza, Suite 1000, Houston, Texas 77046-1173. The trustees serve for the life of the Trust, subject to their earlier death, incapacitation, resignation, retirement or removal as more specifically provided in the Trust’s organizational documents. Each officer serves for a one year term or until their successors are elected and qualified. Column two below includes length of time served with predecessor entities, if any.
| | | | | | | | |
| | | | | |
Name, Year of Birth and Position(s) Held with the Trust | | Trustee
and/or
Officer
Since | | Principal Occupation(s) During Past 5 Years | | Number of Funds in Fund Complex Overseen by Trustee | | Other Directorship(s) Held by Trustee During Past 5 Years |
INTERESTED PERSONS | | | | | | | | |
| | | | | |
| Martin L. Flanagan1— 1960 Trustee and Vice Chair | | 2007 | | Executive Director, Chief Executive Officer and President, Invesco Ltd. (ultimate parent of Invesco and a global investment management firm); Trustee and Vice Chair, The Invesco Funds; Vice Chair, Investment Company Institute; and Member of Executive Board, SMU Cox School of Business | | 229 | | None |
| | | | | Formerly: Advisor to the Board, Invesco Advisers, Inc. (formerly known as Invesco Institutional (N.A.), Inc.); Chairman and Chief Executive Officer, Invesco Advisers, Inc. (registered investment adviser); Director, Chairman, Chief Executive Officer and President, Invesco Holding Company (US), Inc. (formerly IVZ Inc.) (holding company), Invesco Group Services, Inc. (service provider) and Invesco North American Holdings, Inc. (holding company); Director, Chief Executive Officer and President, Invesco Holding Company Limited (parent of Invesco and a global investment management firm); Director, Invesco Ltd.; Chairman, Investment Company Institute and President,Co-Chief Executive Officer,Co-President, Chief Operating Officer and Chief Financial Officer, Franklin Resources, Inc. (global investment management organization) | | | | |
| | | | | |
| Philip A. Taylor2— 1954 Trustee | | 2006 | | Vice Chair, Invesco Ltd.; Trustee, The Invesco Funds | | 229 | | None |
| | | | | |
| | | | | Formerly: Director, Invesco Canada Ltd. (formerly known as Invesco Trimark Ltd./ Invesco Trimark Ltèe) (registered investment adviser and registered transfer agent); Head of the Americas and Senior Managing Director, Invesco Ltd.; Director, Invesco Advisers, Inc. (formerly known as Invesco Institutional (N.A.), Inc.) (registered investment adviser); | | | | |
| |
| 1 Mr. Flanagan is considered an interested person (within the meaning of Section 2(a)(19) of the 1940 Act) of the Trust because he is an officer of the Adviser to the Trust, and an officer and a director of Invesco Ltd., ultimate parent of the Adviser. |
| |
| 2 Mr. Taylor is considered an interested person (within the meaning of Section 2(a)(19) of the 1940 Act) of the Trust because he is an officer of Invesco Ltd., ultimate parent of the Adviser. |
|
| 74 INVESCO OPPENHEIMER GLOBAL MULTI-ASSET GROWTH FUND |
| | | | | | | | |
| | | | | |
Name, Year of Birth and Position(s) Held with the Trust | | Trustee
and/or
Officer
Since | | Principal Occupation(s) During Past 5 Years | | Number of Funds in Fund Complex Overseen by Trustee | | Other Directorship(s) Held by Trustee During Past 5 Years |
| | | | | |
| INTERESTED PERSONS (CONTINUED) | | | | | | | | |
| | | | | |
| Philip A. Taylor (Continued) | | | | Director and Chairman, Invesco Investment Services, Inc. (formerly known as Invesco AIM Investment Services, Inc.) (registered transfer agent); Chief Executive Officer, Invesco Corporate Class Inc. (corporate mutual fund company); Chairman and Chief Executive Officer, Invesco Canada Ltd. (formerly known as Invesco Trimark Ltd./Invesco Trimark Ltèe) (registered investment adviser and registered transfer agent); Senior Vice President, The Invesco Funds; Director, Invesco Investment Advisers LLC (formerly known as Van Kampen Asset Management); Director, Chairman, Chief Executive Officer and President, Invesco Management Group, Inc. (formerly known as Invesco AIM Management Group, Inc.) (financial services holding company);Co-Chairman,Co-President andCo-Chief Executive Officer, Invesco Advisers, Inc. (formerly known as Invesco Institutional (N.A.), Inc.) (registered investment adviser); Director, Chief Executive Officer and President, Van Kampen Exchange Corp; President and Principal Executive Officer, The Invesco Funds (other than AIM Treasurer’s Series Trust (Invesco Treasurer’s Series Trust), Short-Term Investments Trust and Invesco Management Trust); Executive Vice President, The Invesco Funds (AIM Treasurer’s Series Trust (Invesco Treasurer’s Series Trust), Short-Term Investments Trust and Invesco Management Trust only); Director and President, INVESCO Funds Group, Inc. (registered investment adviser and registered transfer agent); Director and Chairman, IVZ Distributors, Inc. (formerly known as INVESCO Distributors, Inc.) (registered broker dealer); Director, President and Chairman, Invesco Inc. (holding company), Invesco Canada Holdings Inc. (holding company), Trimark Investments Ltd./ Placements Trimark Ltèe and Invesco Financial Services Ltd/Services Financiers Invesco Ltèe; Chief Executive Officer, Invesco Canada Fund Inc. (corporate mutual fund company); Director and Chairman, Van Kampen Investor Services Inc.; Director, Chief Executive Officer and President, 1371 Preferred Inc. (holding | | | | |
|
| 75 INVESCO OPPENHEIMER GLOBAL MULTI-ASSET GROWTH FUND |
TRUSTEES AND OFFICERSContinued
| | | | | | | | |
| | | | | |
Name, Year of Birth and Position(s) Held with the Trust | | Trustee
and/or
Officer
Since | | Principal Occupation(s) During Past 5 Years | | Number of Funds in Fund Complex Overseen by Trustee | | Other Directorship(s) Held by Trustee During Past 5 Years |
| | | | | |
| INTERESTED PERSONS (CONTINUED) | | | | | | | | |
| | | | | |
| Philip A. Taylor (Continued) | | | | company) and Van Kampen Investments Inc.; Director and President, AIM GP Canada Inc. (general partner for limited partnerships) and Van Kampen Advisors, Inc.; Director and Chief Executive Officer, Invesco Trimark Dealer Inc. (registered broker dealer); Director, Invesco Distributors, Inc. (formerly known as Invesco AIM Distributors, Inc.) (registered broker dealer); Manager, Invesco Capital Management LLC; Director, Chief Executive Officer and President, Invesco Advisers, Inc.; Director, Chairman, Chief Executive Officer and President, Invesco AIM Capital Management, Inc.; President, Invesco Trimark Dealer Inc. and Invesco Trimark Ltd./Invesco Trimark Ltèe; Director and President, AIM Trimark Corporate Class Inc. and AIM Trimark Canada Fund Inc.; Senior Managing Director, Invesco Holding Company Limited; Director and Chairman, Fund Management Company (former registered broker dealer); President and Principal Executive Officer, The Invesco Funds (AIM Treasurer’s Series Trust (Invesco Treasurer’s Series Trust), and Short-Term Investments Trust only); President, AIM Trimark Global Fund Inc. and AIM Trimark Canada Fund Inc. | | | | |
|
| 76 INVESCO OPPENHEIMER GLOBAL MULTI-ASSET GROWTH FUND |
| | | | | | | | |
| | | | | |
Name, Year of Birth and Position(s) Held with the Trust | | Trustee
and/or
Officer
Since | | Principal Occupation(s) During Past 5 Years | | Number of Funds in Fund Complex Overseen by Trustee | | Other Directorship(s) Held by Trustee During Past 5 Years |
| | | | | |
| INDEPENDENT TRUSTEES | | | | | | | | |
| | | | | |
Bruce L. Crockett – 1944 Trustee and Chair | | 2003 | | Chairman, Crockett Technologies Associates (technology consulting company) Formerly: Director, Captaris (unified messaging provider); Director, President and Chief Executive Officer, COMSAT Corporation; Chairman, Board of Governors of INTELSAT (international communications company); ACE Limited (insurance company); Independent Directors Council and Investment Company Institute: Member of the Audit Committee, Investment Company Institute; Member of the Executive Committee and Chair of the Governance Committee, Independent Directors Council | | 229 | | Director and Chairman of the Audit Committee, ALPS (Attorneys Liability Protection Society) (insurance company); Director and Member of the Audit Committee and Compensation Committee, Ferroglobe PLC (metallurgical company) |
| | | | | |
David C. Arch – 1945 Trustee | | 2010 | | Chairman of Blistex Inc. (consumer health care products manufacturer); Member, World Presidents’ Organization | | 229 | | Board member of the Illinois Manufacturers’ Association |
| | | | | |
Beth Ann Brown – 1968 Trustee | | 2019 | | Independent Consultant Formerly: Head of Intermediary Distribution, Managing Director, Strategic Relations, Managing Director, Head of National Accounts, Senior Vice President, National Account Manager and Senior Vice President, Key Account Manager, Columbia Management Investment Advisers LLC; Vice President, Key Account Manager, Liberty Funds Distributor, Inc.; and Trustee of certain Oppenheimer Funds | | 229 | | Director, Board of Directors of Caron Engineering Inc.; Advisor, Board of Advisors of Caron Engineering Inc.; President and Director, of Acton Shapleigh Youth Conservation Corps (non -profit); and Vice President and Director of Grahamtastic Connection (non-profit) |
| | | | | |
Jack M. Fields – 1952 Trustee | | 2003 | | Chief Executive Officer, Twenty First Century Group, Inc. (government affairs company); and Chairman, Discovery Learning Alliance(non-profit) Formerly: Owner and Chief Executive Officer, Dos Angeles Ranch L.P. (cattle, hunting, corporate entertainment); Director, Insperity, Inc. (formerly known as Administaff) (human resources provider); Chief Executive Officer, Texana Timber LP (sustainable forestry company); Director of Cross Timbers Quail Research Ranch(non-profit); and member of the U.S. House of Representatives | | 229 | | None |
|
| 77 INVESCO OPPENHEIMER GLOBAL MULTI-ASSET GROWTH FUND |
TRUSTEES AND OFFICERSContinued
| | | | | | | | |
| | | | | |
Name, Year of Birth and Position(s) Held with the Trust | | Trustee
and/or
Officer
Since | | Principal Occupation(s) During Past 5 Years | | Number of Funds in Fund Complex Overseen by Trustee | | Other Directorship(s) Held by Trustee During Past 5 Years |
| | | | | |
| INDEPENDENT TRUSTEES (CONTINUED) | | | | | | | | |
| | | | | |
| Cynthia Hostetler —1962 Trustee | | 2017 | | Non-Executive Director and Trustee of a number of public and private business corporations Formerly: Director, Aberdeen Investment Funds (4 portfolios); Head of Investment Funds and Private Equity, Overseas Private Investment Corporation; President, First Manhattan Bancorporation, Inc.; Attorney, Simpson Thacher & Bartlett LLP | | 229 | | Vulcan Materials Company (construction materials company); Trilinc Global Impact Fund; Genesee & Wyoming, Inc. (railroads); Artio Global Investment LLC (mutual fund complex); Edgen Group, Inc. (specialized energy and infrastructure products distributor); Investment Company Institute (professional organization); Independent Directors Council (professional organization) |
| | | | | |
Eli Jones – 1961 Trustee | | 2016 | | Professor and Dean, Mays Business School - Texas A&M University Formerly: Professor and Dean, Walton College of Business, University of Arkansas and E.J. Ourso College of Business, Louisiana State University; Director, Arvest Bank | | 229 | | Insperity, Inc. (formerly known as Administaff) (human resources provider) |
| | | | | |
| Elizabeth Krentzman – 1959 Trustee | | 2019 | | Formerly: Principal and Chief Regulatory Advisor for Asset Management Services and U.S. Mutual Fund Leader of Deloitte & Touche LLP; General Counsel of the Investment Company Institute (trade association); National Director of the Investment Management Regulatory Consulting Practice, Principal, Director and Senior Manager of Deloitte & Touche LLP; Assistant Director of the Division of Investment Management - Office of Disclosure and Investment Adviser Regulation of the U.S. Securities and Exchange Commission and various positions with the Division of Investment Management – Office of Regulatory Policy of the U.S. Securities and Exchange Commission; Associate at Ropes & Gray LLP.; Advisory Board Member of the Securities and Exchange Commission Historical Society; and Trustee of certain Oppenheimer Funds | | 229 | | Trustee of the University of Florida National Board Foundation and Audit Committee Member; Member of the Cartica Funds Board of Directors (private investment funds); Member of the University of Florida Law Center Association, Inc. Board of Trustees and Audit Committee Member |
|
| 78 INVESCO OPPENHEIMER GLOBAL MULTI-ASSET GROWTH FUND |
| | | | | | | | |
| | | | | |
Name, Year of Birth and Position(s) Held with the Trust | | Trustee
and/or
Officer
Since | | Principal Occupation(s) During Past 5 Years | | Number of Funds in Fund Complex Overseen by Trustee | | Other Directorship(s) Held by Trustee During Past 5 Years |
| | | | | |
| INDEPENDENT TRUSTEES (CONTINUED) | | | | | | | | |
| | | | | |
| Anthony J. LaCava, Jr. – 1956 Trustee | | 2019 | | Formerly: Director and Member of the Audit Committee, Blue Hills Bank (publicly traded financial institution) and Managing Partner, KPMG LLP | | 229 | | Blue Hills Bank; Chairman of Bentley University; Member, Business School Advisory Council; and Nominating Committee, KPMG LLP |
| | | | | |
| Prema Mathai-Davis – 1950 Trustee | | 2003 | | Retired Co-Owner & Partner of Quantalytics Research, LLC, (a FinTech Investment Research Platform for the Self-Directed Investor) | | 229 | | None |
| | | | | |
Joel W. Motley – 1952 Trustee | | 2019 | | Director of Office of Finance, Federal Home Loan Bank; Member of the Vestry of Trinity Wall Street; Managing Director of Carmona Motley Hoffman, Inc. (privately held financial advisor); Member of the Finance and Budget Committee of the Council on Foreign Relations, Member of the Investment Committee and Board of Human Rights Watch and Member of the Investment Committee and Board of Historic Hudson Valley (non-profit cultural organization). Formerly: Managing Director of Public Capital Advisors, LLC (privately held financial advisor); Managing Director of Carmona Motley Hoffman, Inc. (privately held financial advisor); Trustee of certain Oppenheimer Funds; and Director of Columbia Equity Financial Corp. (privately held financial advisor) | | 229 | | Director of Greenwall Foundation (bioethics research foundation); Member of Board and Investment Committee of The Greenwall Foundation; Director of Southern Africa Legal Services Foundation; Board Member and Investment Committee Member of Pulitzer Center for Crisis Reporting(non-profit journalism) |
| | | | | |
Teresa M. Ressel — 1962 Trustee | | 2017 | | Non-executive director and trustee of a number of public and private business corporations Formerly: Chief Financial Officer, Olayan America, The Olayan Group (international investor/commercial/industrial); Chief Executive Officer, UBS Securities LLC; Group Chief Operating Officer, Americas, UBS AG; Assistant Secretary for Management & Budget and CFO, US Department of the Treasury | | 229 | | Atlantic Power Corporation (power generation company); ON Semiconductor Corp. (semiconductor supplier) |
| | | | | |
| Ann Barnett Stern – 1957 Trustee | | 2017 | | President and Chief Executive Officer, Houston Endowment Inc. (private philanthropic institution) Formerly: Executive Vice President and General Counsel, Texas Children’s Hospital; | | 229 | | Federal Reserve Bank of Dallas |
|
| 79 INVESCO OPPENHEIMER GLOBAL MULTI-ASSET GROWTH FUND |
TRUSTEES AND OFFICERSContinued
| | | | | | | | |
| | | | | |
Name, Year of Birth and Position(s) Held with the Trust | | Trustee
and/or
Officer
Since | | Principal Occupation(s) During Past 5 Years | | Number of Funds in Fund Complex Overseen by Trustee | | Other Directorship(s) Held by Trustee During Past 5 Years |
| | | | | |
| INDEPENDENT TRUSTEES (CONTINUED) | | | | | | | | |
| | | | | |
| Ann Barnett Stern (Continued) | | | | Attorney, Beck, Redden and Secrest, LLP; Business Law Instructor, University of St. Thomas; Attorney, Andrews & Kurth LLP | | | | |
| | | | | |
| Raymond Stickel, Jr. – 1944 Trustee | | 2005 | | Retired Formerly: Director, Mainstay VP Series Funds, Inc. (25 portfolios); Partner, Deloitte & Touche | | 229 | | None |
| | | | | |
| Robert C. Troccoli – 1949 Trustee | | 2016 | | Retired Formerly: Adjunct Professor, University of Denver – Daniels College of Business, Senior Partner, KPMG LLP | | 229 | | None |
| | | | | |
| Daniel S. Vandivort –1954 Trustee | | 2019 | | Treasurer, Chairman of the Audit and Finance Committee, and Trustee, Board of Trustees, Huntington Disease Foundation of America; and President, Flyway Advisory Services LLC (consulting and property management). Formerly: Trustee and Governance Chair, of certain Oppenheimer Funds | | 229 | | Chairman and Lead Independent Director, Chairman of the Audit Committee, and Director, Board of Directors, Value Line Funds |
| | | | | |
| James D. Vaughn – 1945 Trustee | | 2019 | | Retired Formerly: Managing Partner, Deloitte & Touche LLP; Trustee and Chairman of the Audit Committee, Schroder Funds; Board Member, Mile High United Way, Boys and Girls Clubs, Boy Scouts, Colorado Business Committee for the Arts, Economic Club of Colorado and Metro Denver Network (economic development corporation); and Trustee of certain Oppenheimer Funds | | 229 | | Board member and Chairman of Audit Committee of AMG National Trust Bank; Trustee and Investment Committee member, University of South Dakota Foundation; Board member, Audit Committee Member and past Board Chair, Junior Achievement(non-profit) |
| | | | | |
| Christopher L. Wilson – 1957 Trustee, Vice Chair and Chair Designate | | 2017 | | Retired Formerly: Director, TD Asset Management USA Inc. (mutual fund complex) (22 portfolios); Managing Partner, CT2, LLC (investing and consulting firm); President/Chief Executive Officer, Columbia Funds, Bank of America Corporation; President/Chief Executive Officer, CDC IXIS Asset Management Services, Inc.; Principal & Director of Operations, Scudder Funds, Scudder, Stevens & Clark, Inc.; Assistant Vice President, Fidelity Investments | | 229 | | ISO New England, Inc.(non-profit organization managing regional electricity market) |
|
| 80 INVESCO OPPENHEIMER GLOBAL MULTI-ASSET GROWTH FUND |
| | | | | | | | |
| | | | | |
Name, Year of Birth and Position(s) Held with the Trust | | Trustee
and/or
Officer
Since | | Principal Occupation(s) During Past 5 Years | | Number of Funds in Fund Complex Overseen by Trustee | | Other Directorship(s) Held by Trustee During Past 5 Years |
| | | | | |
| OTHER OFFICERS | | | | | | | | |
| | | | | |
| Sheri Morris — 1964 President, Principal Executive Officer and Treasurer | | 2003 | | Head of Global Fund Services, Invesco Ltd.; President, Principal Executive Officer and Treasurer, The Invesco Funds; Vice President, Invesco Advisers, Inc. (formerly known as Invesco Institutional (N.A.), Inc.) (registered investment adviser); and Vice President, Invesco Exchange-Traded Fund Trust, Invesco Exchange-Traded Fund Trust II, Invesco India Exchange-Traded Fund Trust, Invesco Actively Managed Exchange-Traded Fund Trust, Invesco Actively Managed Exchange-Traded Commodity Fund Trust and Invesco Exchange- Traded Self-Indexed Fund Trust, and Vice President, OppenheimerFunds, Inc. Formerly: Vice President and Principal Financial Officer, The Invesco Funds; Vice President, Invesco AIM Advisers, Inc., Invesco AIM Capital Management, Inc. and Invesco AIM Private Asset Management, Inc.; Assistant Vice President and Assistant Treasurer, The Invesco Funds and Assistant Vice President, Invesco Advisers, Inc., Invesco AIM Capital Management, Inc. and Invesco AIM Private Asset Management, Inc.; and Treasurer, Invesco Exchange-Traded Fund Trust, Invesco Exchange-Traded Fund Trust II, Invesco India Exchange-Traded Fund Trust and Invesco Actively Managed Exchange-Traded Fund Trust | | N/A | | N/A |
| | | | | |
Russell C. Burk — 1958 Senior Vice President and Senior Officer | | 2005 | | Senior Vice President and Senior Officer, The Invesco Funds | | N/A | | N/A |
| | | | | |
Jeffrey H. Kupor – 1968 Senior Vice President, Chief Legal Officer and Secretary | | 2018 | | Head of Legal of the Americas, Invesco Ltd.; Senior Vice President and Secretary, Invesco Advisers, Inc. (formerly known as Invesco Institutional (N.A.), Inc.) (registered investment adviser); Senior Vice President and Secretary, Invesco Distributors, Inc. (formerly known as Invesco AIM Distributors, Inc.); Vice President and Secretary, Invesco Investment Services, Inc. (formerly known as Invesco AIM Investment Services, Inc.) Senior Vice President, Chief Legal Officer and Secretary, The Invesco Funds; Secretary and General Counsel, Invesco Investment Advisers LLC (formerly known as Van Kampen Asset Management); Secretary and General Counsel, Invesco Capital Markets, Inc. (formerly known as Van Kampen Funds Inc.) and Chief Legal | | N/A | | N/A |
|
| 81 INVESCO OPPENHEIMER GLOBAL MULTI-ASSET GROWTH FUND |
TRUSTEES AND OFFICERSContinued
| | | | | | | | |
| | | | | |
Name, Year of Birth and Position(s) Held with the Trust | | Trustee
and/or
Officer
Since | | Principal Occupation(s) During Past 5 Years | | Number of Funds in Fund Complex Overseen by Trustee | | Other Directorship(s) Held by Trustee During Past 5 Years |
| | | | | |
| OTHER OFFICERS (CONTINUED) | | | | | | | | |
| | | | | |
| Jeffrey H. Kupor (Continued) | | | | Officer, Invesco Exchange-Traded Fund Trust, Invesco Exchange-Traded Fund Trust II, Invesco India Exchange-Traded Fund Trust, Invesco Actively Managed Exchange-Traded Fund Trust, Invesco Actively Managed Exchange- Traded Commodity Fund Trust and Invesco Exchange-Traded Self-Indexed Fund Trust; Secretary, Invesco Indexing LLC; Secretary, W.L. Ross & Co., LLC Formerly: Secretary and Vice President, Jemstep, Inc.; Head of Legal, Worldwide Institutional, Invesco Ltd.; Secretary and General Counsel, INVESCO Private Capital Investments, Inc.; Senior Vice President, Secretary and General Counsel, Invesco Management Group, Inc. (formerly known as Invesco AIM Management Group, Inc.); Assistant Secretary, INVESCO Asset Management (Bermuda) Ltd.; Secretary and General Counsel, Invesco Private Capital, Inc.; Assistant Secretary and General Counsel, INVESCO Realty, Inc.; Secretary and General Counsel, Invesco Senior Secured Management, Inc.; and Secretary, Sovereign G./P. Holdings Inc. | | | | |
| | | | | |
Andrew R. Schlossberg – 1974 Senior Vice President | | 2019 | | Head of the Americas and Senior Managing Director, Invesco Ltd.; Director and Senior Vice President, Invesco Advisers, Inc. (formerly known as Invesco Institutional (N.A.), Inc.) (registered investment adviser); Director and Chairman, Invesco Investment Services, Inc. (formerly known as Invesco AIM Investment Services, Inc.) (registered transfer agent); Senior Vice President, The Invesco Funds; Director, Invesco Investment Advisers LLC (formerly known as Van Kampen Asset Management); Director, President and Chairman, Invesco Insurance Agency, Inc. Formerly: Director, Invesco UK Limited; Director and Chief Executive, Invesco Asset Management Limited and Invesco Fund Managers Limited; Assistant Vice President, The Invesco Funds; Senior Vice President, Invesco Advisers, Inc. (formerly known as Invesco Institutional (N.A.), Inc.) (registered investment adviser); Director and Chief Executive, Invesco Administration Services | | N/A | | N/A |
|
| 82 INVESCO OPPENHEIMER GLOBAL MULTI-ASSET GROWTH FUND |
| | | | | | | | |
| | | | | |
Name, Year of Birth and Position(s) Held with the Trust | | Trustee
and/or
Officer
Since | | Principal Occupation(s) During Past 5 Years | | Number of Funds in Fund Complex Overseen by Trustee | | Other Directorship(s) Held by Trustee During Past 5 Years |
| | | | | |
| OTHER OFFICERS (CONTINUED) | | | | | | | | |
| | | | | |
| Andrew R. Schlossberg (Continued) | | | | Limited and Invesco Global Investment Funds Limited; Director, Invesco Distributors, Inc.; Head of EMEA, Invesco Ltd.; President, Invesco Actively Managed Exchange-Traded Commodity Fund Trust, Invesco Actively Managed Exchange-Traded Fund Trust, Invesco Exchange-Traded Fund Trust, Invesco Exchange-Traded Fund Trust II and Invesco India Exchange-Traded Fund Trust; Managing Director and Principal Executive Officer, Invesco Capital Management LLC | | | | |
| | | | | |
| John M. Zerr — 1962 Senior Vice President | | 2006 | | Chief Operating Officer of the Americas; Senior Vice President, Invesco Advisers, Inc. (formerly known as Invesco Institutional (N.A.), Inc.) (registered investment adviser); Senior Vice President, Invesco Distributors, Inc. (formerly known as Invesco AIM Distributors, Inc.); Director and Vice President, Invesco Investment Services, Inc. (formerly known as Invesco AIM Investment Services, Inc.) Senior Vice President, The Invesco Funds; Managing Director, Invesco Capital Management LLC; Director, Invesco Investment Advisers LLC (formerly known as Van Kampen Asset Management); Senior Vice President, Invesco Capital Markets, Inc. (formerly known as Van Kampen Funds Inc.); Manager, Invesco Indexing LLC; Manager, Invesco Specialized Products, LLC; Director and Senior Vice President, Invesco Insurance Agency, Inc.; Member, Invesco Canada Funds Advisory Board; Director, President and Chief Executive Officer, Invesco Corporate Class Inc. (corporate mutual fund company); and Director, Chairman, President and Chief Executive Officer, Invesco Canada Ltd. (formerly known as Invesco Trimark Ltd./Invesco Trimark Ltèe) (registered investment adviser and registered transfer agent) | | N/A | | N/A |
| | | | | |
| | | | | Formerly: Director and Senior Vice President, Invesco Management Group, Inc. (formerly known as Invesco AIM Management Group, Inc.); Secretary and General Counsel, Invesco Management Group, Inc. (formerly known as Invesco AIM Management Group, Inc.); Secretary, Invesco Investment Services, Inc. (formerly known as Invesco AIM Investment Services, Inc.); Chief Legal Officer and | | | | |
|
| 83 INVESCO OPPENHEIMER GLOBAL MULTI-ASSET GROWTH FUND |
TRUSTEES AND OFFICERSContinued
| | | | | | | | |
| | | | | |
Name, Year of Birth and Position(s) Held with the Trust | | Trustee
and/or
Officer
Since | | Principal Occupation(s) During Past 5 Years | | Number of Funds in Fund Complex Overseen by Trustee | | Other Directorship(s) Held by Trustee During Past 5 Years |
| | | | | |
| OTHER OFFICERS (CONTINUED) | | | | | | | | |
| | | | | |
| John M. Zerr (Continued) | | | | Secretary, The Invesco Funds; Secretary and General Counsel, Invesco Investment Advisers LLC (formerly known as Van Kampen Asset Management); Secretary and General Counsel, Invesco Capital Markets, Inc. (formerly known as Van Kampen Funds Inc.); Chief Legal Officer, Invesco Exchange-Traded Fund Trust, Invesco Exchange-Traded Fund Trust II, Invesco India Exchange-Traded Fund Trust, Invesco Actively Managed Exchange-Traded Fund Trust, Invesco Actively Managed Exchange- Traded Commodity Fund Trust and Invesco Exchange-Traded Self-Indexed Fund Trust; Secretary, Invesco Indexing LLC; Director, Secretary, General Counsel and Senior Vice President, Van Kampen Exchange Corp.; Director, Vice President and Secretary, IVZ Distributors, Inc. (formerly known as INVESCO Distributors, Inc.); Director and Vice President, INVESCO Funds Group, Inc.; Director and Vice President, Van Kampen Advisors Inc.; Director, Vice President, Secretary and General Counsel, Van Kampen Investor Services Inc.; Director and Secretary, Invesco Distributors, Inc. (formerly known as Invesco AIM Distributors, Inc.); Director, Senior Vice President, General Counsel and Secretary, Invesco AIM Advisers, Inc. and Van Kampen Investments Inc.; Director, Vice President and Secretary, Fund Management Company; Director, Senior Vice President, Secretary, General Counsel and Vice President, Invesco AIM Capital Management, Inc.; Chief Operating Officer and General Counsel, Liberty Ridge Capital, Inc. (an investment adviser) | | | | |
| | | | | |
Gregory G. McGreevey - 1962 Senior Vice President | | 2012 | | Senior Managing Director, Invesco Ltd.; Director, Chairman, President, and Chief Executive Officer, Invesco Advisers, Inc. (formerly known as Invesco Institutional (N.A.), Inc.) (registered investment adviser); Director, Invesco Mortgage Capital, Inc. and Invesco Senior Secured Management, Inc.; and Senior Vice President, The Invesco Funds; and President, SNW Asset Management Corporation Formerly: Senior Vice President, Invesco | | N/A | | N/A |
|
| 84 INVESCO OPPENHEIMER GLOBAL MULTI-ASSET GROWTH FUND |
��
| | | | | | | | |
| | | | | |
Name, Year of Birth and Position(s) Held with the Trust | | Trustee
and/or
Officer
Since | | Principal Occupation(s) During Past 5 Years | | Number of Funds in Fund Complex Overseen by Trustee | | Other Directorship(s) Held by Trustee During Past 5 Years |
| | | | | |
| OTHER OFFICERS (CONTINUED) | | | | | | | | |
| | | | | |
| Gregory G. McGreevey (Continued) | | | | Management Group, Inc. and Invesco Advisers, Inc.; Assistant Vice President, The Invesco Funds | | | | |
| | | | | |
Kelli Gallegos – 1970 Vice President, Principal Financial Officer and Assistant Treasurer | | 2008 | | Principal Financial and Accounting Officer – Investments Pool, Invesco Specialized Products, LLC; Vice President, Principal Financial Officer and Assistant Treasurer, The Invesco Funds; Principal Financial and Accounting Officer – Pooled Investments, Invesco Capital Management LLC; Vice President and Treasurer, Invesco Exchange- Traded Fund Trust, Invesco Exchange-Traded Fund Trust II, Invesco India Exchange-Traded Fund Trust, Invesco Actively Managed Exchange-Traded Fund Trust, Invesco Actively Managed Exchange-Traded Commodity Fund Trust and Invesco Exchange-Traded Self- Indexed Fund Trust Formerly: Assistant Treasurer, Invesco Specialized Products, LLC; Assistant Treasurer, Invesco Exchange-Traded Fund Trust, Invesco Exchange-Traded Fund Trust II, Invesco India Exchange-Traded Fund Trust, Invesco Actively Managed Exchange-Traded Fund Trust, Invesco Actively Managed Exchange-Traded Commodity Fund Trust and Invesco Exchange- Traded Self-Indexed Fund Trust; Assistant Treasurer, Invesco Capital Management LLC; Assistant Vice President, The Invesco Funds | | N/A | | N/A |
| | | | | |
| Crissie M. Wisdom – 1969 Anti-Money Laundering Compliance Officer | | 2013 | | Anti-Money Laundering Compliance Officer, Invesco Advisers, Inc. (formerly known as Invesco Institutional (N.A.), Inc.) (registered investment adviser), Invesco Capital Markets, Inc. (formerly known as Van Kampen Funds Inc.), Invesco Distributors, Inc., Invesco Investment Services, Inc., The Invesco Funds, and Invesco Exchange-Traded Fund Trust, Invesco Exchange-Traded Fund Trust II, Invesco India Exchange-Traded Fund Trust, Invesco Actively Managed Exchange-Traded Fund Trust, Invesco Actively Managed Exchange- Traded Commodity Fund Trust and Invesco Exchange-Traded Self-Indexed Fund Trust; Anti-Money Laundering Compliance Officer and Bank Secrecy Act Officer, INVESCO National Trust Company and Invesco Trust Company; and Fraud Prevention Manager and | | N/A | | N/A |
|
| 85 INVESCO OPPENHEIMER GLOBAL MULTI-ASSET GROWTH FUND |
TRUSTEES AND OFFICERSContinued
| | | | | | | | |
| | | | | |
Name, Year of Birth and Position(s) Held with the Trust | | Trustee
and/or
Officer
Since | | Principal Occupation(s) During Past 5 Years | | Number of Funds in Fund Complex Overseen by Trustee | | Other Directorship(s) Held by Trustee During Past 5 Years |
| | | | | |
| OTHER OFFICERS (CONTINUED) | | | | | | | | |
| | | | | |
| Crissie M. Wisdom (Continued) | | | | Controls and Risk Analysis Manager for Invesco Investment Services, Inc. Formerly: Anti-Money Laundering Compliance Officer, Van Kampen Exchange Corp. and Invesco Management Group, Inc. | | | | |
| | | | | |
| Robert R. Leveille – 1969 Chief Compliance Officer | | 2016 | | Chief Compliance Officer, Invesco Advisers, Inc. (registered investment adviser); and Chief Compliance Officer, The Invesco Funds Formerly: Chief Compliance Officer, Putnam Investments and the Putnam Funds | | N/A | | N/A |
The Statement of Additional Information of the Trust includes additional information about the Fund’s Trustees and is available upon request, without charge, by calling 1.800.959.4246. Please refer to the Fund’s Statement of Additional Information for information on the Fund’ssub-advisers.
| | | | | | |
| Office of the Fund | | Investment Adviser | | Distributor | | Auditors |
| 11 Greenway Plaza, | | Invesco Advisers, Inc. | | Invesco Distributors, Inc. | | PricewaterhouseCoopers |
| Suite 1000 | | 1555 Peachtree Street, N.E. | | 11 Greenway Plaza, | | LLP |
| Houston, TX 77046-1173 | | Atlanta, GA 30309 | | Suite 1000 | | 1000 Louisiana Street, |
| | | | Houston, TX | | Suite 5800 |
| | | | 77046-1173 | | Houston, TX 77002-5021 |
| Counsel to the Fund | | Counsel to the | | Transfer Agent | | Custodian |
| Stradley Ronon Stevens & Young, | | Independent Trustees | | Invesco Investment | | JPMorgan Chase Bank |
| LLP | | Goodwin Procter LLP | | Services, Inc. | | 4 Chase Metro Tech |
| 2005 Market Street, | | 901 New York Avenue, N.W. | | 11 Greenway Plaza, | | Center |
| Suite 2600 | | Washington, D.C. 20001 | | Suite 1000 | | Brooklyn, NY 11245 |
| Philadelphia, PA 19103-7018 | | | | Houston, TX | | |
| | | | 77046-1173 | | |
|
| 86 INVESCO OPPENHEIMER GLOBAL MULTI-ASSET GROWTH FUND |
Invesco recognizes the importance of protecting your personal and financial information when you visit our website located atwww.invesco.com (the “Website”). The following information is designed to help you understand the information collection practices at this Website. We will not sell, share or rent your personally identifiable information to others in contravention of this Privacy Policy. When we refer to ourselves as “we” or “Invesco” in this Privacy Policy, we mean our entire company including our affiliates, such as subsidiaries.
By visiting this Website, you are accepting the practices described in this Privacy Policy. If you do not agree to this policy, you may not use this Website. This Privacy Policy is subject to change without notice, from time to time in our sole discretion. You acknowledge that by accessing the Website after we have posted changes to this Privacy Policy, you are agreeing to this Privacy Policy as modified. Please review the Terms of Use1 to learn of other terms and conditions applicable to your use of the Website.
Please note that this Privacy Policy is not an exclusive statement of our privacy principles across all products and services. Other privacy principles or policies may apply depending on the products or services you obtain from Invesco, or the jurisdiction in which you transact with Invesco.
This Privacy Policy was last updated on May 6, 2018.
Information We Collect and Use
We collect personal information you choose to submit to the Website in order to process transactions requested by you and meet our contractual obligations. For example, you can choose to provide your name, contact information, social security number, or tax identification number in connection with accessing your account, or you can choose to provide your personal information when you fill out a secure account question form. Any information collected about you from the Website can, from time to time, be associated with other identifying information we have about you.
In addition, we may gather information about you automatically through your use of the Website, e.g. your IP address, how you navigate the Website, the organization from which you are accessing the Website, and the websites that you access before and after you visit the Website.
When you access the Website, we may also collect information such as unique device identifiers, your screen resolution and other device settings, information about your location, and analytical information about how you use the device from which you are viewing the Website. Where applicable, we may ask your permission before collecting certain information, such as precise geolocation information.
From time to time, we use or augment the personal information we have about you with information obtained from third parties. For example, we use third party information to confirm contact or financial information or to better understand your interests by associating demographic information from third parties with the information you have provided.
How We Use Personal Information
We use your personal information to respond to your inquiries and provide the products and services you request. We also use your information from time to time to deliver the content and services we believe
1NTD
|
| 87 INVESCO OPPENHEIMER GLOBAL MULTI-ASSET GROWTH FUND |
| | | | |
| | | INVESCO PRIVACY POLICYContinued |
you will find the most relevant and to provide customer service and support.
We also use the information you provide to further develop and improve our products and services. We aggregate and/orde-identify data about visitors to the Website for various business purposes including product and service development and improvement activities.
How We Share Personal Information
We collaborate with other companies and individuals to perform services for us and on our behalf and we collaborate with our affiliates, other companies and individuals with respect to particular products or services (“Providers”). Examples of Providers include data analysis firms, customer service and support providers, email and SMS vendors, andweb-hosting and development companies. Some Providers collect information for us or on our behalf on our Website. These Providers can be provided with access to personal information needed to perform their functions.
We reserve the right to disclose your personal information as required by law, when we believe disclosure is necessary to comply with a regulatory requirement, judicial proceeding, court order or legal process served on us, to protect the safety, rights or property of our customers, the public or Invesco or to enforce the Terms of Use.
If we sell or transfer a business unit (such as a subsidiary) or an asset (such as a website) to another company, we will share your personal information with such company. You will receive notice of such an event and the new entity will inform you of any changes to the practices in this Privacy Policy. If the new entity wishes to make additional use of your information, you have the right to decline such use at that time.
We occasionally disclose aggregate orde-identified data that is not personally identifiable with third parties.
Cookies and Other Tools
Invesco and its Providers collect information about you by using cookies, tracking pixels and other technologies. We use this information to better understand, customize and improve user experience with our websites, services and offerings as well as to manage our advertising. For example, we use web analytics services that use these technologies to gather information to help us understand how visitors engage with and navigate our Website, e.g., how and when pages in a site are visited and by how many visitors. We are also able to offer our visitors a more customized, relevant experience on our sites using these technologies by delivering content and functionality based on your preferences and interests.
Depending on their purpose, some cookies will only operate for the length of a single browsing session, while others have a longer life span to ensure that they fulfill their longer-term purposes. Your web browser can be set to allow you to control whether you will accept cookies or reject cookies, to notify you each time a cookie is sent to your browser, or to delete cookies that have already been set. If your browser is set to reject cookies, certain aspects of the Website that are cookie-enabled will not recognize you when you return to the website, and some Website functionality may be lost. The “Help” section of your browser may tell you how to prevent your browser from accepting cookies. To find out more about cookies, visitwww.aboutcookies.org.
|
| 88 INVESCO OPPENHEIMER GLOBAL MULTI-ASSET GROWTH FUND |
Security
No data transmission over the internet can be 100% secure, so Invesco cannot ensure or warrant the security of any information you submit to us on this Website. However, Invesco seeks to protect your personal information from unauthorized access or use when you transact business on our Website using technical, administrative and procedural measures. Invesco makes no representation as to the reasonableness, efficacy, or appropriateness of the measures we use to safeguard such information.
Users are responsible for maintaining the secrecy of their own passwords. If you have reason to believe that your interaction with us is no longer secure (for example, if you feel that the security of any account you might have with us has been compromised), please immediately notify us by contacting us as specified below.
Transfer of Data to Other Countries
Any information you provide to Invesco through use of the Website may be stored and processed, transferred between and accessed from the United States, Canada and other countries which do not guarantee the same level of protection of personal information as the one in which you reside. However, Invesco will handle your personal information in accordance with this Privacy Policy regardless of where your personal information is stored/accessed.
Children’s Privacy
We are committed to protecting the privacy of children. We do not knowingly collect personal information from children under the age of 18. If you are under the age of 18, do not provide us with any personal information.
Contact Us
Please contact us if you have any questions or concerns about your personal information or require assistance in managing your choices.
Invesco Ltd.
1555 Peachtree St. NE
Atlanta, GA 30309
By phone:
(404)439-3236
By fax:
(404)962-8288
By email:
Anne.Gerry@invesco.com
Please update your account information by logging in or contact us by email or telephone as specified above to update your account information whenever such information ceases to be complete or accurate.
You may also contact us to:
|
| 89 INVESCO OPPENHEIMER GLOBAL MULTI-ASSET GROWTH FUND |
| | | | |
| | | INVESCO PRIVACY POLICYContinued |
| | • | | Request that we amend, rectify, delete or update the personal data we hold about you; |
| | • | | Where possible (e.g. in relation to marketing) amend or update your choices around processing; |
| | • | | Request a copy of personal data held by us. |
Disclaimer
Where the Website contains links to third-party websites/content/services that are not owned or controlled by Invesco, Invesco is not responsible for how these properties operate or treat your personal information so we recommend that you read the privacy policies and terms associated with these third party properties carefully.
|
| 90 INVESCO OPPENHEIMER GLOBAL MULTI-ASSET GROWTH FUND |
THIS PAGE INTENTIONALLY LEFT BLANK.
THIS PAGE INTENTIONALLY LEFT BLANK.
THIS PAGE INTENTIONALLY LEFT BLANK.
THIS PAGE INTENTIONALLY LEFT BLANK.
THIS PAGE INTENTIONALLY LEFT BLANK.
Explore High-Conviction Investing with Invesco

Go paperless with eDelivery
Visit invesco.com/edelivery to enjoy the convenience and security of anytime electronic access to your investment documents.
With eDelivery, you can elect to have any or all of the following materials delivered straight to your inbox to download, save and print from your own computer:
| ◾ | | Fund reports and prospectuses |
Invesco mailing information
Send general correspondence to Invesco Investment Services, Inc., P.O. Box 219078, Kansas City, MO 64121-9078.
| | | | | | | | |
| | |  | |
Invesco Distributors, Inc. | | | O-GLMAG-AR-1 | | | | 12272019 | |
| | |
 | | Shareholder Report for the Eleven Months Ended 10/31/2019 |
| |
| | Invesco Oppenheimer International Equity Fund* |
| |
| | Beginning on January 1, 2021, as permitted by regulations adopted by the Securities and Exchange Commission, paper copies of the Fund’s shareholder reports will no longer be sent by mail, unless you specifically request paper copies of the reports from the Fund or from your financial intermediary, such as a broker-dealer or bank. Instead, the reports will be made available on the Fund’s website, and you will be notified by mail each time a report is posted and provided with a website link to access the report. |
| |
| | If you already elected to receive shareholder reports electronically, you will not be affected by this change and you need not take any action. You may elect to receive shareholder reports and other communications from the Fund electronically by contacting your financial intermediary (such as a broker-dealer or bank) or, if you are a direct investor, by enrolling at invesco. com/edelivery. |
| |
| | You may elect to receive all future reports in paper free of charge. If you invest through a financial intermediary, you can contact your financial intermediary to request that you continue to receive paper copies of your shareholder reports. If you invest directly with the Fund, you can call 800 959 4246 to let the Fund know you wish to continue receiving paper copies of your shareholder reports. Your election to receive reports in paper will apply to all funds held with your financial intermediary or all funds held with the fund complex if you invest directly with the Fund. |
| |
| | *Prior to the close of business on May 24, 2019, the Fund’s name was Oppenheimer International Equity Fund. See Important Update on the following page for more information. |
Important Update
On October 18, 2018, Massachusetts Mutual Life Insurance Company, an indirect corporate parent of OppenheimerFunds, Inc. and its subsidiaries OFI Global Asset Management, Inc., OFI SteelPath, Inc. and OFI Advisors, LLC, announced that it had entered into an agreement whereby Invesco Ltd., a global investment management company would acquire OppenheimerFunds and its subsidiaries (together, “OppenheimerFunds”). After the close of business on May 24, 2019 Invesco Ltd. completed the acquisition of OppenheimerFunds. This Fund was included in that acquisition and as of that date, became part of the Invesco family of funds. Please visit invesco.com for more information or call Invesco’s Client Services team at800-959-4246.
Class A Shares
AVERAGE ANNUAL TOTAL RETURNS AT 10/31/19
| | | | | | | | | | | | |
| | | Class A Shares of the Fund | | | | |
| | | Without Sales Charge | | | With Sales Charge | | | MSCI AC World ex-U.S. Index | |
1-Year | | | 8.77% | | | | 2.77% | | | | 11.27% | |
5-Year | | | 4.20 | | | | 3.02 | | | | 3.82 | |
10-Year | | | 5.06 | | | | 4.47 | | | | 4.94 | |
Performance quoted is past performance and cannot guarantee comparable future results; current performance may be lower or higher.Visit invesco.com for the most recentmonth-end performance. Performance figures reflect reinvested distributions and changes in net asset value (NAV). Investment return and principal value will vary so that you may have a gain or a loss when you sell shares. Fund returns include changes in share price, reinvested distributions and a 5.50% maximum applicable sales charge except where “without sales charge” is indicated. Returns for periods of less than one year are cumulative and not annualized. As the result of a reorganization after the close of business on May 24, 2019, the returns of the Fund for periods on or prior to May 24, 2019 reflect performance of the Oppenheimer predecessor fund. Share class returns will differ from those of the predecessor fund because they have different expenses. Returns do not consider capital gains or income taxes on an individual’s investment. See Fund
3 INVESCO OPPENHEIMER INTERNATIONAL EQUITY FUND
prospectus and summary prospectus for more information on share classes, sales charges and new fee agreements, if any. Fund literature is available at invesco.com.
4 INVESCO OPPENHEIMER INTERNATIONAL EQUITY FUND
Fund Performance Discussion
The Fund returned 8.38% during the11-month reporting period ended October 31, 2019. In comparison, the MSCI All Country (“AC”) World ex USA Index (the “Index”) returned 10.22% over the same period. The Fund outperformed the Index most in the Materials, Industrials and Information Technology sectors due to stock selection. The Fund underperformed the Index in the Communication s Services, Consumer Staples and Financials sectors on the back of stock selection as well.
MARKET OVERVIEW
After their sharp selloff in December 2018, equity markets responded favorably to the Federal Reserve’s pivot away from tighter monetary policy. The European Central Bank and the People’s Bank of China provided additional monetary stimulus, and the Chinese government has implemented fiscal stimulus in order to boost economic activity there. The old adage “don’t fight the Fed” can also be applied to investors the world over. In addition to supportive central bank
policies and improving liquidity conditions, the prospect of continuingUS-China trade negotiations boosted investor sentiment globally.
FUND REVIEW
Top performing holdings of the Fund this reporting period included Wheaton Precious Metals Corp, Airbus SE and Bandai Namco Holdings Inc.
COMPARISON OF CHANGE IN VALUE OF $10,000 HYPOTHETICAL INVESTMENTS IN:
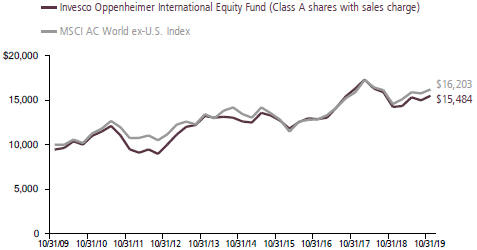
5 INVESCO OPPENHEIMER INTERNATIONAL EQUITY FUND
Wheaton Precious Metals was the top contributor to the Fund, benefiting from the settlement of a tax dispute with the Canadian Revenue Agency (CRA) related to foreign income. The resolution of this long legal battle has clearly reduced both the financial burden on the company as well as investor apprehension towards the stock. Wheaton is a leading, well diversified precious metals streaming company with around 20 long-term agreements on both operating and development assets. Many of its royalty streams are from mines outside of Canada. With the settlement, investors can refocus on the positive fundamentals of the company. Its royalty streams are on high quality, long lived mines in favorable jurisdictions, and the shares trade at an attractive discount to other royalty companies.
Airbus was another top contributor during the period. The tight supply of narrow-body jets continues to be a favorable dynamic for Airbus. Central to our investment case for Airbus are the A320neo and A350 programs’ successes. The A320neo program is effectively sold out until 2023. The A350 ramp up is also progressing with a host of solid commercial results. The tragic and unfortunate events with Boeing’s 737 Max airplanes highlight our long-held belief that the 737 is an outdated and inferior platform. We continue to view Airbus’ competitive position, and the long-term sustainability of demand, favorably.
Bandai Namco also contributed favorably. The group primarily manufactures toys and publishes video games such as Dark Souls
II and Dragon Ball and has benefited from strong performances in key titles. In August, management upwardly revised its operating profit guidance for this fiscal year ending March 2020. The shares were also included into the Nikkei 225 Index. Bandai Namco has been a holding in the fund for several years and we remain confident in management’s long-term strategy to monetize their extensive toy characters and animation content.
Top detractors from performance included SK Telecom Co., Ltd., Japan Post Insurance Co., Ltd. and Baidu, Inc.
SK Telecom was one of the largest detractors during the period. The stock has been the subject of some controversy as the Regulator in South Korea has been hinting at 5G pricing for data transmission that will favor the consumer over the telecom companies. We still see the introduction of 5G as beneficial for SK Telecom, but are watching the regulatory developments carefully.
Japan Post Insurance is, as the name suggests, the insurance company established by the postal service company in Japan. Early in 2019 it looked as though the company would benefit from corporate restructuring, as the parent postal company sold down most of its stake, a higher return investment policy, and new product offerings. However, misbehavior was uncovered at Japan Post, involving double-charging premiums to clients, inappropriate policy cancellations and offerings and so forth. We have sold our shares.
6 INVESCO OPPENHEIMER INTERNATIONAL EQUITY FUND
Baidu Inc., the Chinese internet search leader, reported weak financial results during the reporting period that showed surprising deterioration in its core search business. Worse yet, management didn’t seem to have a good handle on what they were going to do about it. We decided that we have more confidence in other ideas and sold out of this position.
STRATEGY & OUTLOOK
After the sharpsell-off in December 2018, and the strong rally in the first four months of 2019, international equity markets were range bound, essentially trading sideways and continuing to underperform US equities. This changed somewhat in October 2019 on the news of a potential trade deal between the US and China, which propelled European equities particularly.
While corporate profit growth has slowed, support for global equities has come from the ECB and Federal Reserve Bank, which have reiterated the need for more accommodative monetary policy to combat the weaker macro conditions and the prevailing, low inflation expectations. We continue to find investment opportunities from a bottom up perspective.
James Ayer, Portfolio Manager
7 INVESCO OPPENHEIMER INTERNATIONAL EQUITY FUND
Top Holdings and Allocations
TOP TEN COMMON STOCK HOLDINGS
| | | | |
Alibaba Group Holding Ltd., Sponsored ADR | | | 3.3% | |
Recruit Holdings Co. Ltd. | | | 3.3 | |
Airbus SE | | | 3.3 | |
Sony Corp. | | | 3.0 | |
Wheaton Precious Metals Corp. | | | 2.9 | |
SAP SE | | | 2.7 | |
Air Liquide SA | | | 2.5 | |
STMicroelectronics NV | | | 2.5 | |
Danone SA | | | 2.3 | |
Anglo American plc | | | 2.3 | |
Holdings and allocations are subject to change and are not buy/sell recommendations. Percentages are as of October 31, 2019 and are based on net assets.
TOP TEN GEOGRAPHICAL HOLDINGS
| | | | |
Japan | | | 26.9% | |
France | | | 17.6 | |
China | | | 8.3 | |
United States | | | 7.9 | |
Germany | | | 7.3 | |
United Kingdom | | | 5.7 | |
Canada | | | 5.3 | |
South Korea | | | 5.0 | |
Switzerland | | | 3.4 | |
Netherlands | | | 2.5 | |
Holdings and allocations are subject to change and are not buy/sell recommendations. Percentages are as of October 31, 2019 and are based on net assets.
SECTOR ALLOCATION
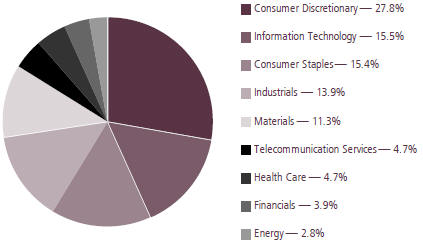
Holdings and allocations are subject to change and are not buy/sell recommendations. Percentages are as of October 31, 2019 and are based on total market value of common stocks.
For more current Fund holdings, please visit invesco.com.
8 INVESCO OPPENHEIMER INTERNATIONAL EQUITY FUND
Share Class Performance
AVERAGE ANNUAL TOTAL RETURNS WITHOUT SALES CHARGE AS OF 10/31/19
| | | | | | | | | | | | | | | | | | | | |
| | | Inception | | | | | | | | | | | | | |
| | | Date | | | 1-Year | | | 5-Year | | | 10-Year | | | | |
Class A (QIVAX) | | | 7/2/90 | | | | 8.77 | % | | | 4.20 | % | | | 5.06 | % | | | | |
Class C (QIVCX) | | | 9/1/93 | | | | 7.96 | | | | 3.42 | | | | 4.25 | | | | | |
Class R (QIVNX) | | | 3/1/01 | | | | 8.50 | | | | 3.94 | | | | 4.78 | | | | | |
Class Y (QIVYX) | | | 11/13/08 | | | | 9.18 | | | | 4.52 | | | | 5.44 | | | | | |
Class R5 (INEQX)1 | | | 5/24/19 | | | | 8.98 | | | | 4.24 | | | | 5.08 | | | | | |
Class R6 (QIVIX)2 | | | 3/28/13 | | | | 9.23 | | | | 4.65 | | | | 5.11 | 3 | | | | |
| |
AVERAGE ANNUAL TOTAL RETURNS WITH SALES CHARGE AS OF 10/31/19 | | | | | |
| | | Inception | | | | | | | | | | | | | |
| | | Date | | | 1-Year | | | 5-Year | | | 10-Year | | | | |
Class A (QIVAX) | | | 7/2/90 | | | | 2.77 | % | | | 3.02 | % | | | 4.47 | % | | | | |
Class C (QIVCX) | | | 9/1/93 | | | | 6.96 | | | | 3.42 | | | | 4.25 | | | | | |
Class R (QIVNX) | | | 3/1/01 �� | | | | 8.50 | | | | 3.94 | | | | 4.78 | | | | | |
Class Y (QIVYX) | | | 11/13/08 | | | | 9.18 | | | | 4.52 | | | | 5.44 | | | | | |
Class R5 (INEQX)1 | | | 5/24/19 | | | | 8.98 | | | | 4.24 | | | | 5.08 | | | | | |
Class R6 (QIVIX)2 | | | 3/28/13 | | | | 9.23 | | | | 4.65 | | | | 5.11 | 3 | | | | |
1. Class R5 shares’ performance shown prior to the inception date (after the close of business on May 24, 2019) is that of the predecessor fund’s Class A shares at net asset value (NAV) and includes the12b-1 fees applicable to Class A shares. Class A shares’ performance reflects any applicable fee waivers and/or expense reimbursements.
2. Pursuant to the closing of the transaction described in the Notes to Financial Statements, after the close of business on May 24, 2019, Class I shares were reorganized as Class R6 shares.
3. Shows performance since inception.
Performance quoted is past performance and cannot guarantee comparable future results; current performance may be lower or higher.Visit invesco.com for the most recentmonth-end performance. Performance figures reflect reinvested distributions and changes in net asset value (NAV). Investment return and principal value will vary so that you may have a gain or a loss when you sell shares. Performance shown at NAV does not include the applicablefront-end sales charge, which would have reduced the performance. The current maximum initial sales charge for Class A shares is 5.50%, and the contingent deferred sales charge for Class C shares is 1% for the1-year period. Class R, Class Y, Class R5 and Class R6 shares have no sales charge; therefore, performance is at NAV. Effective after the close of business on May 24, 2019, Class A, Class C, Class R, Class Y, and Class I shares of the predecessor fund were reorganized into Class A, Class C, Class R, Class Y, and Class R6 shares, respectively, of the Fund. Class R5 shares’ performance shown prior to the inception date is that of the predecessor fund’s Class A shares at NAV and includes the12b-1 fees applicable to Class A shares. Class A shares’ performance reflects any applicable fee waivers and/or expense reimbursements. Returns shown for Class A, Class C, Class R, Class Y, Class R5, and Class R6 shares are blended returns of the predecessor fund and the Fund. Share class returns will differ from those of the predecessor fund because of different
9 INVESCO OPPENHEIMER INTERNATIONAL EQUITY FUND
expenses. See Fund prospectuses and summary prospectuses for more information on share classes, sales charges and new fee agreements, if any. Fund literature is available at invesco.com.
The Fund’s performance is compared to the performance of the MSCI AC Worldex-U.S. Index. The MSCI AC Worldex-U.S. Index is designed to measure the equity market performance of developed and emerging markets and excludes the U.S. The Index is unmanaged and cannot be purchased directly by investors. While index comparisons may be useful to provide a benchmark for the Fund’s performance, it must be noted that the Fund’s investments are not limited to the investments comprising the Index. Index performance includes reinvestment of income, but does not reflect transaction costs, fees, expenses or taxes. Index performance is shown for illustrative purposes only as a benchmark for the Fund’s performance, and does not predict or depict performance of the Fund. The Fund’s performance reflects the effects of the Fund’s business and operating expenses.
The views and opinions expressed in management’s discussion of Fund performance are those of Invesco Advisers, Inc. These views and opinions are subject to change at any time based on factors such as market and economic conditions. These views and opinions may not be relied upon as investment advice or recommendations, or as an offer for a particular security. The information is not a complete analysis of every aspect of any market, country, industry, security or the Fund. Statements of fact are from sources considered reliable, but Invesco Advisers, Inc. makes no representation or warranty as to their completeness or accuracy. Although historical performance is no guarantee of future results, these insights may help you understand our investment management philosophy.
Before investing, investors should carefully read the prospectus and/or summary prospectus and carefully consider the investment objectives, risks, charges and expenses. For this and more complete information about the fund(s), investors should ask their advisors for a prospectus/summary prospectus or visit invesco. com/fundprospectus.
Shares of Invesco funds are not deposits or obligations of any bank, are not guaranteed by any bank, are not insured by the FDIC or any other agency, and involve investment risks, including the possible loss of the principal amount invested.
10 INVESCO OPPENHEIMER INTERNATIONAL EQUITY FUND
Fund Expenses
Fund Expenses. As a shareholder of the Fund, you incur two types of costs: (1) transaction costs, which may include sales charges (loads) on purchase payments and/or contingent deferred sales charges on redemptions; and (2) ongoing costs, including management fees; distribution and service fees; and other Fund expenses. These examples are intended to help you understand your ongoing costs (in dollars) of investing in the Fund and to compare these costs with the ongoing costs of investing in other mutual funds.
The examples are based on an investment of $1,000.00 invested at the beginning of the period and held for the entire6-month period ended October 31, 2019.
Actual Expenses. The first section of the table provides information about actual account values and actual expenses. You may use the information in this section for the class of shares you hold, together with the amount you invested, to estimate the expense that you paid over the period. Simply divide your account value by $1,000.00 (for example, an $8,600.00 account value divided by $1,000.00 = 8.60), then multiply the result by the number in the first section under the heading entitled “Expenses Paid During 6 Months Ended October 31, 2019” to estimate the expenses you paid on your account during this period.
Hypothetical Example for Comparison Purposes.The second section of the table provides information about hypothetical account values and hypothetical expenses based on the Fund’s actual expense ratio for each class of shares, and an assumed rate of return of 5% per year for each class before expenses, which is not the Fund’s actual return. The hypothetical account values and expenses may not be used to estimate the actual ending account balance or expenses you paid for the period. You may use this information to compare the ongoing costs of investing in the Fund and other funds. To do so, compare this 5% hypothetical example for the class of shares you hold with the 5% hypothetical examples that appear in the shareholder reports of the other funds.
Please note that the expenses shown in the table are meant to highlight your ongoing costs only and do not reflect any transactional costs, such asfront-end or contingent deferred sales charges (loads). Therefore, the “hypothetical” section of the table is useful in comparing ongoing costs only, and will not help you determine the relative total costs of owning different funds. In addition, if these transactional costs were included, your costs would have been higher.
11 INVESCO OPPENHEIMER INTERNATIONAL EQUITY FUND
| | | | | | | | | | | | | | |
| | | Beginning | | | Ending | | | Expenses | | | |
| | | Account | | | Account | | | Paid During | | | |
| | | Value | | | Value | | | 6 Months Ended | | | |
| Actual | | May 1, 2019 | | | October 31, 2019 | | | October 31, 20191,2 | | | |
| |
Class A | | $ | 1,000.00 | | | $ | 1,011.20 | | | $ 6.20 | | | | |
| |
Class C | | | 1,000.00 | | | | 1,007.10 | | | 10.07 | | | | |
| |
Class R | | | 1,000.00 | | | | 1,009.90 | | | 7.47 | | | | |
| |
Class Y | | | 1,000.00 | | | | 1,013.50 | | | 4.27 | | | | |
| |
Class R5 | | | 1,000.00 | | | | 1,013.10 | | | 3.62 | | | | |
| |
Class R6 | | | 1,000.00 | | | | 1,013.20 | | | 4.02 | | | | |
| | | | |
| Hypothetical | | | | | | | | | | | |
(5% return before expenses) | | | | | | | | | | | | | | |
| |
Class A | | | 1,000.00 | | | | 1,019.06 | | | 6.23 | | | | |
| |
Class C | | | 1,000.00 | | | | 1,015.22 | | | 10.11 | | | | |
| |
Class R | | | 1,000.00 | | | | 1,017.80 | | | 7.50 | | | | |
| |
Class Y | | | 1,000.00 | | | | 1,020.97 | | | 4.29 | | | | |
| |
Class R5 | | | 1,000.00 | | | | 1,021.07 | | | 4.19 | | | | |
| |
Class R6 | | | 1,000.00 | | | | 1,021.22 | | | 4.03 | | | | |
1. Actual expenses paid for Class A, C, R, Y, and R6are equal to the Fund’s annualized expense ratio for that class, multiplied by the average account value over the period, multiplied by 184/365(to reflect theone-half year period). Actual expenses paid for Class R5 are equal to the Fund’s annualized expense ratio for that class, multiplied by the average account value over the period, multiplied by 160/365to reflect the period from after the close of business on May 24, 2019 (inception of offering) to October 31, 2019.
2.Hypothetical expenses paid for all classes are equal to the Fund’s annualized expense ratio for that class, multiplied by the average account value over the period, multiplied by 184/365(to reflect theone-half year period).
Those annualized expense ratios, excluding indirect expenses from affiliated funds, based on the6-month period ended October 31, 2019 for Classes A, C, R, Y and R6and for the period from after the close of business on May 24, 2019 (inception of offering) to October 31, 2019 for Class R5 are as follows:
| | | | | | | | |
| Class | | | Expense Ratios | | | | | |
| |
Class A | | | 1.22 | % | | | | |
| |
Class C | | | 1.98 | | | | | |
| |
Class R | | | 1.47 | | | | | |
| |
Class Y | | | 0.84 | | | | | |
| |
Class R5 | | | 0.82 | | | | | |
| |
Class R6 | | | 0.79 | | | | | |
| |
The expense ratios reflect voluntary and/or contractual waivers and/or reimbursements of expenses by the Fund’s Manager. Some of these undertakings may be modified or terminated at any time, as indicated in the Fund’s prospectus. The “Financial Highlights” tables in the
12 INVESCO OPPENHEIMER INTERNATIONAL EQUITY FUND
Fund’s financial statements, included in this report, also show the gross expense ratios, without such waivers or reimbursements and reduction to custodian expenses, if applicable.
13 INVESCO OPPENHEIMER INTERNATIONAL EQUITY FUND
SCHEDULE OF INVESTMENTSOctober 31, 2019
| | | | | | | | |
| | | Shares | | | Value | |
| |
| Common Stocks—95.5% | | | | | |
| |
| Consumer Discretionary—26.6% | |
| |
| Auto Components—2.3% | |
| Bridgestone Corp. | | | 553,600 | | | $ | 22,996,649 | |
| |
| Valeo SA | | | 502,400 | | | | 18,697,508 | |
| | | | | | | | |
| | | | 41,694,157 | |
|
| |
| Automobiles—2.7% | |
| Suzuki Motor Corp. | | | 359,000 | | | | 16,867,025 | |
| |
| Volkswagen AG | | | 165,458 | | | | 31,500,523 | |
| | | | | | | | |
| | | | 48,367,548 | |
|
| |
| Entertainment—3.3% | |
| NCSoft Corp. | | | 12,678 | | | | 5,621,227 | |
| |
| Nexon Co. Ltd.1 | | | 1,174,400 | | | | 13,653,003 | |
| |
| Nintendo Co. Ltd. | | | 112,300 | | | | 40,055,060 | |
| | | | | | | | |
| | | | 59,329,290 | |
|
| |
| Hotels, Restaurants & Leisure—2.9% | |
| Accor SA | | | 481,460 | | | | 20,694,454 | |
| |
| Kangwon Land, Inc. | | | 162,870 | | | | 4,375,563 | |
| |
| Yum China Holdings, Inc. | | | 655,300 | | | | 27,850,250 | |
| | | | | | | | |
| | | | 52,920,267 | |
|
| |
| Household Durables—3.4% | |
| Sony Corp. | | | 896,500 | | | | 54,626,441 | |
| |
| Taylor Wimpey plc | | | 3,366,385 | | | | 7,253,844 | |
| | | | | | | | |
| | | | 61,880,285 | |
|
| |
| Interactive Media & Services—1.7% | |
| Tencent Holdings Ltd. | | | 775,400 | | | | 31,618,951 | |
|
| |
| Internet & Catalog Retail—3.3% | |
| Alibaba Group Holding Ltd., Sponsored ADR1 | | | 343,451 | | | | 60,677,488 | |
|
| |
| Leisure Products—1.8% | |
| Bandai Namco Holdings, Inc. | | | 514,200 | | | | 31,672,844 | |
|
| |
| Media—0.5% | |
| CyberAgent, Inc. | | | 298,200 | | | | 9,649,349 | |
|
| |
| Specialty Retail—1.9% | |
| Dufry AG1 | | | 110,977 | | | | 9,660,278 | |
| |
| Industria de Diseno Textil SA | | | 770,689 | | | | 24,093,309 | |
| | | | | | | | |
| | | | 33,753,587 | |
|
| |
| Textiles, Apparel & Luxury Goods—2.8% | |
| China Hongxing Sports Ltd.1,2 | | | 36,005,000 | | | | — | |
| |
| Fila Korea Ltd. | | | 224,282 | | | | 11,082,318 | |
| | | | | | | | |
| | | Shares | | | Value | |
| |
| Textiles, Apparel & Luxury Goods (Continued) | |
| |
| Kering SA | | | 37,928 | | | $ | 21,601,034 | |
| |
| LVMH Moet Hennessy Louis Vuitton SE | | | 40,890 | | | | 17,456,797 | |
| | | | | | | | |
| | | | 50,140,149 | |
|
| |
| Consumer Staples—14.7% | |
| |
| Beverages—4.6% | | | | | |
| Coca-Cola European Partners plc | | | 407,283 | | | | 21,793,713 | |
| |
| Diageo plc | | | 889,240 | | | | 36,405,365 | |
| |
| Pernod Ricard SA | | | 135,240 | | | | 24,970,853 | |
| | | | | | | | |
| | | | 83,169,931 | |
|
| |
| Food Products—5.3% | |
| Danone SA | | | 497,358 | | | | 41,304,335 | |
| |
| Kikkoman Corp. | | | 283,000 | | | | 13,575,382 | |
| |
| Nestle SA | | | 66,628 | | | | 7,114,336 | |
| |
| WH Group Ltd. | | | 31,719,500 | | | | 33,263,544 | |
| | | | | | | | |
| | | | 95,257,597 | |
|
| |
| Personal Products—2.7% | |
| Amorepacific Corp. | | | 111,060 | | | | 18,274,483 | |
| |
| Hengan International Group Co. Ltd. | | | 1,984,500 | | | | 13,855,340 | |
| |
| LG Household & Health Care Ltd. | | | 16,431 | | | | 17,737,519 | |
| | | | | | | | |
| | | | 49,867,342 | |
|
| |
| Tobacco—2.1% | |
| Philip Morris International, Inc. | | | 235,530 | | | | 19,181,563 | |
| |
| Swedish Match AB | | | 417,140 | | | | 19,590,614 | |
| | | | | | | | |
| | | | 38,772,177 | |
|
| |
| Energy—2.7% | | | | | |
| |
| Oil, Gas & Consumable Fuels—2.7% | |
| BP plc | | | 1,642,185 | | | | 10,434,764 | |
| |
| TOTAL SA | | | 727,710 | | | | 38,356,771 | |
| | | | | | | | |
| | | | 48,791,535 | |
|
| |
| Financials—3.7% | | | | | |
| |
| Commercial Banks—2.3% | |
| BNP Paribas SA | | | 313,973 | | | | 16,403,188 | |
| |
| BOC Hong Kong Holdings Ltd. | | | 1,856,500 | | | | 6,380,884 | |
| |
| ING Groep NV | | | 1,652,583 | | | | 18,672,070 | |
| | | | | | | | |
| | | | 41,456,142 | |
|
| |
| Insurance—1.4% | |
| Prudential plc | | | 1,477,312 | | | | 25,883,625 | |
14 INVESCO OPPENHEIMER INTERNATIONAL EQUITY FUND
| | | | | | | | |
| | | Shares | | | Value | |
| |
| Health Care—4.4% | |
| |
| Health Care Equipment & Supplies—0.7% | |
| Medtronic plc | | | 128,140 | | | $ | 13,954,446 | |
| |
| Health Care Providers & Services—0.9% | |
| Fresenius Medical Care AG & Co. KGaA | | | 219,763 | | | | 15,901,290 | |
|
| |
| Pharmaceuticals—2.8% | |
| Bayer AG | | | 270,273 | | | | 20,969,014 | |
| |
| Novo Nordisk AS, Cl. B | | | 134,555 | | | | 7,408,359 | |
| |
| Takeda Pharmaceutical Co. Ltd. | | | 621,800 | | | | 22,493,723 | |
| | | | | | | | |
| | | | 50,871,096 | |
|
| |
| Industrials—13.3% | |
| |
| Aerospace & Defense—4.1% | |
| Airbus SE | | | 416,225 | | | | 59,648,386 | |
| |
| MTU Aero Engines AG | | | 52,303 | | | | 13,970,509 | |
| | | | | | | | |
| | | | 73,618,895 | |
|
| |
| Electrical Equipment—1.3% | |
| Mitsubishi Electric Corp. | | | 1,713,100 | | | | 24,371,791 | |
| |
| Machinery—2.2% | |
| Komatsu Ltd. | | | 583,100 | | | | 13,665,130 | |
| |
| SMC Corp. | | | 58,500 | | | | 25,254,451 | |
| | | | | | | | |
| | | | 38,919,581 | |
|
| |
| Professional Services—3.6% | |
| Bureau Veritas SA | | | 239,450 | | | | 6,115,905 | |
| |
| Recruit Holdings Co. Ltd. | | | 1,799,700 | | | | 59,669,642 | |
| | | | | | | | |
| | | | 65,785,547 | |
|
| |
| Road & Rail—1.0% | |
| Seibu Holdings, Inc. | | | 1,029,500 | | | | 18,139,214 | |
|
| |
| Trading Companies & Distributors—1.1% | |
| ITOCHU Corp. | | | 951,000 | | | | 19,849,534 | |
|
| |
| Information Technology—14.8% | |
| |
| Electronic Equipment, Instruments, & | |
| Components—5.0% | |
| Murata Manufacturing Co. Ltd. | | | 377,500 | | | | 20,227,955 | |
| |
| Samsung Electro-Mechanics Co. Ltd. | | | 179,313 | | | | 17,371,979 | |
| |
| TDK Corp. | | | 311,400 | | | | 30,764,511 | |
| | | | | | | | |
| | | Shares | | | Value | |
| |
| Electronic Equipment, Instruments, & Components (Continued) | |
|
| |
| TE Connectivity Ltd. | | | 236,622 | | | $ | 21,177,669 | |
| | | | | | | | |
| | | | 89,542,114 | |
|
| |
| IT Services—0.3% | |
| Worldline SA1,3 | | | 93,335 | | | | 5,670,737 | |
|
| |
| Semiconductors & Semiconductor | |
| Equipment—5.2% | |
| QUALCOMM, Inc. | | | 258,277 | | | | 20,775,802 | |
| |
| STMicroelectronics NV | | | 1,995,457 | | | | 45,256,965 | |
| |
| Taiwan Semiconductor Manufacturing Co. Ltd., Sponsored ADR | | | 547,750 | | | | 28,280,332 | |
| | | | | | | | |
| | | | 94,313,099 | |
| |
| Software—4.3% | |
| Oracle Corp. Japan | | | 225,100 | | | | 19,790,989 | |
| |
| SAP SE | | | 375,858 | | | | 49,786,304 | |
| |
| Weimob, Inc.1,3 | | | 20,426,000 | | | | 9,068,323 | |
| | | | | | | | |
| | | | 78,645,616 | |
|
| |
| Materials—10.8% | |
| |
| Chemicals—4.0% | |
| Air Liquide SA | | | 340,694 | | | | 45,278,269 | |
|
| |
| Akzo Nobel NV | | | 289,904 | | | | 26,700,654 | |
| | | | | | | | |
| | | | 71,978,923 | |
|
| |
| Metals & Mining—6.8% | |
| Agnico Eagle Mines Ltd. | | | 494,886 | | | | 30,420,642 | |
| |
| Anglo American plc | | | 1,602,788 | | | | 41,202,466 | |
|
| |
| Wheaton Precious Metals Corp. | | | 1,872,100 | | | | 52,549,847 | |
| | | | | | | | |
| | | | 124,172,955 | |
|
| |
| Telecommunication Services—4.5% | |
| |
| Diversified Telecommunication Services—3.0% | |
| Nippon Telegraph & Telephone Corp. | | | 534,900 | | | | 26,505,122 | |
| |
| Spark New Zealand Ltd. | | | 9,865,990 | | | | 28,313,600 | |
| | | | | | | | |
| | | | 54,818,722 | |
|
| |
| Wireless Telecommunication Services—1.5% | |
| Rogers Communications, Inc., Cl. B | | | 252,178 | | | | 11,872,719 | |
15 INVESCO OPPENHEIMER INTERNATIONAL EQUITY FUND
SCHEDULE OF INVESTMENTSContinued
| | | | | | | | |
| | | Shares | | | Value | |
| |
| Wireless Telecommunication Services (Continued) | |
| |
| SK Telecom Co. Ltd. | | | 73,386 | | | $ | 15,023,953 | |
| | | | | | | | |
| | | | 26,896,672 | |
| | | | | | | | |
Total Common Stocks
(Cost $1,491,011,034) | | | | 1,732,352,496 | |
| | | | | | | | |
| | | Shares | | | Value | |
| |
| Investment Company—3.7% | |
| |
Invesco Government & Agency Portfolio, Institutional Class, 1.71%4
(Cost $66,249,700) | | | 66,249,700 | | | $ | 66,249,700 | |
|
| |
Total Investments, at Value
(Cost $1,557,260,734) | | | 99.2% | | | | 1,798,602,196 | |
|
| |
| Net Other Assets (Liabilities) | | | 0.8 | | | | 14,191,170 | |
| | | | |
| Net Assets | | | 100.0% | | | $ | 1,812,793,366 | |
| | | | |
Footnotes to Schedule of Investments
1.Non-income producing security.
2. The value of this security was determined using significant unobservable inputs. See Note 3 of the accompanying Notes.
3. Security purchased or received in a transaction exempt from registration under the Securities Act of 1933, as amended (the “1933 Act”). The security may be resold pursuant to an exemption from registration under the 1933 Act, typically to qualified institutional buyers. The aggregate value of these securities at October 31, 2019 was $14,739,060, which represented 0.81% of the Fund’s Net Assets.
4. The money market fund and the Fund are affiliated by having the same investment adviser. The rate shown is the7-day SEC standardized yield as of October 31, 2019.
Distribution of investments representing geographic holdings, as a percentage of total investments at value, is as follows:
| | | | | | | | |
| Geographic Holdings | | Value | | | Percent | |
| |
| Japan | | $ | 483,827,814 | | | | 26.9% | |
| France | | | 316,198,237 | | | | 17.6 | |
| China | | | 149,451,236 | | | | 8.3 | |
| United States | | | 141,339,181 | | | | 7.9 | |
| Germany | | �� | 132,127,640 | | | | 7.3 | |
| United Kingdom | | | 101,771,311 | | | | 5.7 | |
| Canada | | | 94,843,208 | | | | 5.3 | |
| South Korea | | | 89,487,042 | | | | 5.0 | |
| Switzerland | | | 62,031,579 | | | | 3.4 | |
| Netherlands | | | 45,372,724 | | | | 2.5 | |
| South Africa | | | 41,202,466 | | | | 2.3 | |
| Hong Kong | | | 33,263,544 | | | | 1.8 | |
| New Zealand | | | 28,313,600 | | | | 1.6 | |
| Taiwan | | | 28,280,332 | | | | 1.6 | |
| Spain | | | 24,093,309 | | | | 1.3 | |
| Sweden | | | 19,590,614 | | | | 1.1 | |
| Denmark | | | 7,408,359 | | | | 0.4 | |
| | | | |
| Total | | $ | 1,798,602,196 | | | | 100.0% | |
| | | | |
16 INVESCO OPPENHEIMER INTERNATIONAL EQUITY FUND
| | |
| Glossary: | | |
| |
| Definitions | | |
| ADR | | American Depositary Receipt |
|
| See accompanying Notes to Financial Statements. |
17 INVESCO OPPENHEIMER INTERNATIONAL EQUITY FUND
STATEMENT OF ASSETS AND LIABILITIESOctober 31, 2019
| | | | |
| |
| Assets | | | | |
| Investments, at value—see accompanying schedule of investments: | | | | |
| Unaffiliated companies (cost $1,491,011,034) | | $ | 1,732,352,496 | |
| Affiliated companies (cost $66,249,700) | | | 66,249,700 | |
| | | | |
| | | 1,798,602,196 | |
| |
| Cash | | | 7,277,529 | |
| |
| Receivables and other assets: | | | | |
| Investments sold | | | 13,685,591 | |
| Dividends | | | 5,656,625 | |
| Shares of beneficial interest sold | | | 124,435 | |
| Other | | | 565,303 | |
| | | | |
| Total assets | | | 1,825,911,679 | |
| |
| Liabilities | | | | |
| Amount due to custodian-foreign (cost $4,419,710) | | | 4,419,542 | |
| |
| Payables and other liabilities: | | | | |
| Investments purchased | | | 7,395,420 | |
| Shares of beneficial interest redeemed | | | 692,512 | |
| Transfer and shareholder servicing agent fees | | | 151,082 | |
| Trustees’ compensation | | | 139,560 | |
| Shareholder communications | | | 63,000 | |
| Distribution and service plan fees | | | 62,992 | |
| Advisory fees | | | 37,282 | |
| Administration fees | | | 325 | |
| Other | | | 156,598 | |
| | | | |
| Total liabilities | | | 13,118,313 | |
|
| |
Net Assets | | $ | 1,812,793,366 | |
| | | | |
|
| |
| Composition of Net Assets | | | | |
| Shares of beneficial interest | | $ | 1,792,323,326 | |
| |
| Distributable Earnings | | | 20,470,040 | |
| | | | |
Net Assets | | $ | 1,812,793,366 | |
| | | | |
18 INVESCO OPPENHEIMER INTERNATIONAL EQUITY FUND
| | | | |
| |
| Net Asset Value Per Share | | | | |
| Class A Shares: | | | | |
| |
| Net asset value and redemption price per share (based on net assets of $181,695,354 and 8,726,884 shares of beneficial interest outstanding) | | | $20.82 | |
| |
| Maximum offering price per share (net asset value plus sales charge of 5.50% of offering price) | | | $22.03 | |
| |
| |
| Class C Shares: | | | | |
| |
| Net asset value, redemption price (excludes applicable contingent deferred sales charge) and offering price per share (based on net assets of $20,057,384 and 1,086,890 shares of beneficial interest outstanding) | | | $18.45 | |
| |
| |
| Class R Shares: | | | | |
| |
| Net asset value, redemption price and offering price per share (based on net assets of $20,043,908 and 976,768 shares of beneficial interest outstanding) | | | $20.52 | |
| |
| |
| Class Y Shares: | | | | |
| |
| Net asset value, redemption price and offering price per share (based on net assets of $74,540,096 and 3,543,602 shares of beneficial interest outstanding) | | | $21.04 | |
| |
| |
| Class R5 Shares: | | | | |
| |
| Net asset value, redemption price and offering price per share (based on net assets of $10,804 and 518 shares of beneficial interest outstanding) | | | $20.86 | |
| |
| |
| Class R6 Shares: | | | | |
| |
| Net asset value, redemption price and offering price per share (based on net assets of $1,516,445,820 and 73,068,608 shares of beneficial interest outstanding) | | | $20.75 | |
See accompanying Notes to Financial Statements.
19 INVESCO OPPENHEIMER INTERNATIONAL EQUITY FUND
STATEMENT OF
OPERATIONS
| | | | | | | | |
| | | Eleven Months Ended
October 31, 2019 | | | Year Ended
November 30, 2018 | |
| |
| Investment Income | | | | | | | | |
| Dividends: | | | | | | | | |
| Unaffiliated companies (net of foreign withholding taxes of $4,786,111 and $4,706,902, respectively) | | $ | 46,280,530 | | | $ | 46,979,465 | |
| Affiliated companies | | | 2,624,646 | | | | 3,398,456 | |
| |
| Interest | | | 28,346 | | | | 306,589 | |
| | | | |
| Total investment income | | | 48,933,522 | | | | 50,684,510 | |
|
| |
| Expenses | | | | | | | | |
| Advisory fees | | | 12,593,314 | | | | 15,381,545 | |
| |
| Administration fees | | | 109,693 | | | | — | |
| |
| Distribution and service plan fees: | | | | | | | | |
| Class A | | | 421,774 | | | | 509,613 | |
| Class B | | | — | | | | 1,407 | |
| Class C | | | 265,266 | | | | 411,808 | |
| Class R | | | 86,086 | | | | 81,064 | |
| |
| Transfer and shareholder servicing agent fees: | | | | | | | | |
| Class A | | | 351,338 | | | | 419,832 | |
| Class B | | | — | | | | 293 | |
| Class C | | | 53,735 | | | | 81,524 | |
| Class R | | | 35,246 | | | | 32,136 | |
| Class Y | | | 180,966 | | | | 271,192 | |
| Class R5 | | | 2 | | | | — | |
| Class R6 | | | 227,200 | | | | 494,643 | |
| |
| Shareholder communications: | | | | | | | | |
| Class A | | | 12,872 | | | | 16,776 | |
| Class B | | | — | | | | 113 | |
| Class C | | | 2,141 | | | | 3,529 | |
| Class R | | | 1,100 | | | | 998 | |
| Class Y | | | 6,398 | | | | 12,778 | |
| Class R6 | | | 45,562 | | | | 919 | |
| |
| Custodian fees and expenses | | | 119,370 | | | | 573,942 | |
| |
| Trustees’ compensation | | | 30,783 | | | | 32,542 | |
| |
| Borrowing fees | | | 28,485 | | | | 61,456 | |
| |
| Other | | | 245,657 | | | | 288,578 | |
| | | | |
| Total expenses | | | 14,816,988 | | | | 18,676,688 | |
| Less waivers and reimbursements of expenses | | | (264,877) | | | | (410,663) | |
| | | | |
| Net expenses | | | 14,552,111 | | | | 18,266,025 | |
|
| |
Net Investment Income | | | 34,381,411 | | | | 32,418,485 | |
20 INVESCO OPPENHEIMER INTERNATIONAL EQUITY FUND
| | | | | | | | |
| | | Eleven Months Ended
October 31, 2019 | | | Year Ended
November 30, 2018 | |
| |
| Realized and Unrealized Gain (Loss) | | | | | | | | |
| Net realized gain (loss) on: | | | | | | | | |
| Investment transactions in unaffiliated companies (includes net gains from securities sold to affiliates of $116,908 and $—, respectively) | | $ | (154,833,214) | | | $ | (97,528,669) | |
| Foreign currency transactions | | | (465,838) | | | | (1,184,639) | |
| Forward currency exchange contracts | | | — | | | | (3,895,038) | |
| | | | |
| Net realized loss | | | (155,299,052) | | | | (102,608,346) | |
| |
| Net change in unrealized appreciation/(depreciation) on: | | | | | | | | |
| Investment transactions in unaffiliated companies | | | 273,710,882 | | | | (210,943,910) | |
| Translation of assets and liabilities denominated in foreign currencies | | | 10,379 | | | | 4,094 | |
| Forward currency exchange contracts | | | — | | | | 2,731,722 | |
| | | | |
| Net change in unrealized appreciation/(depreciation) | | | 273,721,261 | | | | (208,208,094) | |
|
| |
| Net Increase (Decrease) in Net Assets Resulting from Operations | | $ | 152,803,620 | | | $ | (278,397,955) | |
| | | | |
See accompanying Notes to Financial Statements.
21 INVESCO OPPENHEIMER INTERNATIONAL EQUITY FUND
STATEMENT OF CHANGES IN NET ASSETS
| | | | | | | | | | | | |
| | | Eleven Months
Ended
October 31, 2019 | | | Year Ended
November 30, 2018 | | | Year Ended
November 30, 2017 | |
| |
| Operations | | | | | | | | | | | | |
| Net investment income | | $ | 34,381,411 | | | $ | 32,418,485 | | | $ | 14,210,959 | |
| |
| Net realized gain (loss) | | | (155,299,052 | ) | | | (102,608,346 | ) | | | 138,776,432 | |
| |
| Net change in unrealized appreciation/(depreciation) | | | 273,721,261 | | | | (208,208,094 | ) | | | 172,288,964 | |
| | | | |
| Net increase (decrease) in net assets resulting from operations | | | 152,803,620 | | | | (278,397,955 | ) | | | 325,276,355 | |
|
| |
| Dividends and/or Distributions to Shareholders | | | | | | | | | | | | |
| Distributions to shareholders from distributable earnings: | | | | | | | | | | | | |
| Class A | | | (2,117,061 | ) | | | (12,105 | ) | | | (3,312,784) | |
| Class B1 | | | — | | | | — | | | | (13,310) | |
| Class C | | | (159,566 | ) | | | — | | | | (444,226) | |
| Class R | | | (172,591 | ) | | | — | | | | (148,883) | |
| Class Y | | | (2,162,116 | ) | | | (174,428 | ) | | | (362,669) | |
| Class R5 | | | — | | | | — | | | | — | |
| Class R6 | | | (25,558,438 | ) | | | (5,822,882 | ) | | | (16,958,208) | |
| | | | |
| Total distributions from distributable earnings | | | (30,169,772 | ) | | | (6,009,415 | ) | | | (21,240,080) | |
|
| |
| Beneficial Interest Transactions | | | | | | | | | | | | |
| Net increase (decrease) in net assets resulting from beneficial interest transactions: | | | | | | | | | | | | |
| Class A | | | (20,130,272 | ) | | | (5,403,575 | ) | | | 9,532,057 | |
| Class B1 | | | — | | | | (599,517 | ) | | | (1,456,778) | |
| Class C | | | (16,653,799 | ) | | | 175,780 | | | | 926,308 | |
| Class R | | | 1,570,884 | | | | 6,304,881 | | | | 2,315,192 | |
| Class Y | | | (69,713,314 | ) | | | 104,397,177 | | | | 34,097,732 | |
| Class R5 | | | 10,000 | | | | — | | | | — | |
| Class R6 | | | (151,142,043 | ) | | | 286,648,395 | | | | 576,704,545 | |
| | | | |
| Total beneficial interest transactions | | | (256,058,544 | ) | | | 391,523,141 | | | | 622,119,056 | |
|
| |
| Net Assets | | | | | | | | | | | | |
| Total increase (decrease) | | | (133,424,696 | ) | | | 107,115,771 | | | | 926,155,331 | |
| |
| Beginning of period | | | 1,946,218,062 | | | | 1,839,102,291 | | | | 912,946,960 | |
| | | | |
| End of period | | $ | 1,812,793,366 | | | $ | 1,946,218,062 | | | $ | 1,839,102,291 | |
| | | | |
1. Effective June 1, 2018, all Class B shares converted to Class A shares.
See accompanying Notes to Financial Statements.
22 INVESCO OPPENHEIMER INTERNATIONAL EQUITY FUND
FINANCIAL HIGHLIGHTS
| | | | | | | | | | | | | | | | | | | | | | | | |
| Class A | | Eleven Months
Ended
October 31,
2019 | | | Year Ended
November
30, 2018 | | | Year Ended
November
30, 2017 | | | Year Ended
November
30, 2016 | | | Year Ended
November
30, 2015 | | | Year Ended
November
28, 20141 | |
| |
| Per Share Operating Data | | | | | | | | | | | | | | | | | | | | | | | | |
| Net asset value, beginning of period | | | $19.44 | | | | $22.23 | | | | $17.40 | | | | $17.56 | | | | $18.39 | | | | $19.53 | |
| |
| Income (loss) from investment operations: | | | | | | | | | | | | | | | | | | | | | | | | |
| Net investment income2 | | | 0.31 | | | | 0.27 | | | | 0.18 | | | | 0.25 | | | | 0.11 | | | | 0.15 | |
| Net realized and unrealized gain (loss) | | | 1.29 | | | | (3.06) | | | | 5.00 | | | | (0.31) | | | | (0.60) | | | | (0.96) | |
| | | | |
| Total from investment operations | | | 1.60 | | | | (2.79) | | | | 5.18 | | | | (0.06) | | | | (0.49) | | | | (0.81) | |
| |
| Dividends and/or distributions to shareholders: | | | | | | | | | | | | | | | | | | | | | | | | |
| Dividends from net investment income | | | (0.22) | | | | (0.00)3 | | | | (0.35) | | | | (0.10) | | | | (0.34) | | | | (0.33) | |
| |
| Net asset value, end of period | | | $20.82 | | | | $19.44 | | | | $22.23 | | | | $17.40 | | | | $17.56 | | | | $18.39 | |
| | | | |
|
| |
| Total Return, at Net Asset Value4 | | | 8.38% | | | | (12.55)% | | | | 30.33% | | | | (0.31)% | | | | (2.60)% | | | | (4.20)% | |
|
| |
| Ratios/Supplemental Data | | | | | | | | | | | | | | | | | | | | | | | | |
| Net assets, end of period (in thousands) | | | $181,695 | | | | $189,130 | | | | $222,358 | | | | $166,493 | | | | $169,107 | | | | $185,609 | |
| |
| Average net assets (in thousands) | | | $187,765 | | | | $212,674 | | | | $190,874 | | | | $171,492 | | | | $178,517 | | | | $199,282 | |
| |
| Ratios to average net assets:5 | | | | | | | | | | | | | | | | | | | | | | | | |
| Net investment income | | | 1.69% | | | | 1.23% | | | | 0.92% | | | | 1.43% | | | | 0.59% | | | | 0.80% | |
| Expenses excluding specific expenses listed below | | | 1.24% | | | | 1.24% | | | | 1.28% | | | | 1.32% | | | | 1.30% | | | | 1.30% | |
| Interest and fees from borrowings | | | 0.00%6 | | | | 0.00%6 | | | | 0.00%6 | | | | 0.00%6 | | | | 0.00%6 | | | | 0.00% | |
| | | | |
| Total expenses7 | | | 1.24% | | | | 1.24% | | | | 1.28% | | | | 1.32% | | | | 1.30% | | | | 1.30% | |
| Expenses after payments, waivers and/or reimbursements and reduction to custodian expenses | | | 1.22% | | | | 1.23% | | | | 1.27% | | | | 1.31% | | | | 1.30%8 | | | | 1.30%8 | |
| |
| Portfolio turnover rate9 | | | 54% | | | | 85% | | | | 83% | | | | 79% | | | | 79% | | | | 68% | |
23 INVESCO OPPENHEIMER INTERNATIONAL EQUITY FUND
FINANCIAL HIGHLIGHTSContinued
1. Represents the last business day of the Fund’s reporting period.
2. Per share amounts calculated based on the average shares outstanding during the period.
3. Less than $0.005 per share.
4. Includes adjustments in accordance with accounting principles generally accepted in the United States of America and as such, the net asset value for financial reporting purposes and the returns based upon those net asset values may differ from the net asset value and returns for shareholder transactions. Does not include sales charges and is not annualized for periods less than one year, if applicable.
5. Annualized for periods less than one full year.
6. Less than 0.005%.
7. Total expenses including indirect expenses from affiliated fund fees and expenses were as follows:
| | | | | | |
| | | | | | |
Eleven Months Ended October 31, 2019 | | | 1.25 | % |
Year Ended November 30, 2018 | | | 1.25 | % |
Year Ended November 30, 2017 | | | 1.28 | % |
Year Ended November 30, 2016 | | | 1.33 | % |
Year Ended November 30, 2015 | | | 1.31 | % |
Year Ended November 28, 2014 | | | 1.30 | % |
8. Waiver was less than 0.005%.
9. Portfolio turnover is calculated at the fund level and is not annualized for periods less than one year, if applicable.
See accompanying Notes to Financial Statements.
24 INVESCO OPPENHEIMER INTERNATIONAL EQUITY FUND
| | | | | | | | | | | | | | | | | | | | | | | | |
| Class C | | Eleven Months
Ended
October 31,
2019 | | | Year Ended
November
30, 2018 | | | Year Ended
November
30, 2017 | | | Year Ended
November
30, 2016 | | | Year Ended
November
30, 2015 | | | Year Ended
November
28, 20141 | |
| |
| Per Share Operating Data | | | | | | | | | | | | | | | | | | | | | | | | |
| Net asset value, beginning of period | | | $17.23 | | | | $19.84 | | | | $15.56 | | | | $15.73 | | | | $16.51 | | | | $17.59 | |
| |
| Income (loss) from investment operations: | | | | | | | | | | | | | | | | | | | | | | | | |
| Net investment income (loss)2 | | | 0.15 | | | | 0.09 | | | | 0.03 | | | | 0.10 | | | | (0.03) | | | | 0.01 | |
| Net realized and unrealized gain (loss) | | | 1.15 | | | | (2.70) | | | | 4.47 | | | | (0.27) | | | | (0.53) | | | | (0.87) | |
| | | | |
| Total from investment operations | | | 1.30 | | | | (2.61) | | | | 4.50 | | | | (0.17) | | | | (0.56) | | | | (0.86) | |
| |
| Dividends and/or distributions to shareholders: | | | | | | | | | | | | | | | | | | | | | | | | |
| Dividends from net investment income | | | (0.08) | | | | 0.00 | | | | (0.22) | | | | 0.00 | | | | (0.22) | | | | (0.22) | |
| |
| Net asset value, end of period | | | $18.45 | | | | $17.23 | | | | $19.84 | | | | $15.56 | | | | $15.73 | | | | $16.51 | |
| | | | |
|
| |
| Total Return, at Net Asset Value3 | | | 7.59% | | | | (13.20)% | | | | 29.42% | | | | (1.08)% | | | | (3.34)% | | | | (4.93)% | |
|
| |
| Ratios/Supplemental Data | | | | | | | | | | | | | | | | | | | | | | | | |
| Net assets, end of period (in thousands) | | | $20,057 | | | | $34,738 | | | | $40,178 | | | | $30,895 | | | | $35,938 | | | | $38,418 | |
| |
| Average net assets (in thousands) | | | $28,921 | | | | $41,349 | | | | $34,616 | | | | $33,619 | | | | $37,983 | | | | $40,117 | |
| |
| Ratios to average net assets:4 | | | | | | | | | | | | | | | | | | | | | | | | |
| Net investment income (loss) | | | 0.93% | | | | 0.48% | | | | 0.19% | | | | 0.66% | | | | (0.17)% | | | | 0.06% | |
| Expenses excluding specific expenses listed below | | | 1.99% | | | | 1.99% | | | | 2.04% | | | | 2.08% | | | | 2.06% | | | | 2.05% | |
| Interest and fees from borrowings | | | 0.00%5 | | | | 0.00%5 | | | | 0.00%5 | | | | 0.00%5 | | | | 0.00%5 | | | | 0.00% | |
| | | | |
| Total expenses6 | | | 1.99% | | | | 1.99% | | | | 2.04% | | | | 2.08% | | | | 2.06% | | | | 2.05% | |
| Expenses after payments, waivers and/or reimbursements and reduction to custodian expenses | | | 1.98% | | | | 1.98% | | | | 2.03% | | | | 2.07% | | | | 2.06%7 | | | | 2.05%7 | |
| |
| Portfolio turnover rate8 | | | 54% | | | | 85% | | | | 83% | | | | 79% | | | | 79% | | | | 68% | |
25 INVESCO OPPENHEIMER INTERNATIONAL EQUITY FUND
FINANCIAL HIGHLIGHTSContinued
1. Represents the last business day of the Fund’s reporting period.
2. Per share amounts calculated based on the average shares outstanding during the period.
3. Includes adjustments in accordance with accounting principles generally accepted in the United States of America and as such, the net asset value for financial reporting purposes and the returns based upon those net asset values may differ from the net asset value and returns for shareholder transactions. Does not include sales charges and is not annualized for periods less than one year, if applicable.
4. Annualized for periods less than one full year.
5. Less than 0.005%.
6. Total expenses including indirect expenses from affiliated fund fees and expenses were as follows:
| | | | | | |
| | | | | | |
Eleven Months Ended October 31, 2019 | | | 2.00 | % |
Year Ended November 30, 2018 | | | 2.00 | % |
Year Ended November 30, 2017 | | | 2.04 | % |
Year Ended November 30, 2016 | | | 2.09 | % |
Year Ended November 30, 2015 | | | 2.07 | % |
Year Ended November 28, 2014 | | | 2.05 | % |
7. Waiver was less than 0.005%.
8. Portfolio turnover is calculated at the fund level and is not annualized for periods less than one year, if applicable.
See accompanying Notes to Financial Statements.
26 INVESCO OPPENHEIMER INTERNATIONAL EQUITY FUND
| | | | | | | | | | | | | | | | | | | | | | | | |
| Class R | | Eleven Months
Ended
October 31,
2019 | | | Year Ended
November
30, 2018 | | | Year Ended
November
30, 2017 | | | Year Ended
November
30, 2016 | | | Year Ended
November
30, 2015 | | | Year Ended
November
28, 20141 | |
| |
| Per Share Operating Data | | | | | | | | | | | | | | | | | | | | | | | | |
| Net asset value, beginning of period | | | $19.18 | | | | $21.98 | | | | $17.21 | | | | $17.37 | | | | $18.20 | | | | $19.33 | |
| |
| Income (loss) from investment operations: | | | | | | | | | | | | | | | | | | | | | | | | |
| Net investment income2 | | | 0.26 | | | | 0.21 | | | | 0.13 | | | | 0.20 | | | | 0.06 | | | | 0.10 | |
| Net realized and unrealized gain (loss) | | | 1.27 | | | | (3.01) | | | | 4.94 | | | | (0.30) | | | | (0.59) | | | | (0.94) | |
| | | | |
| Total from investment operations | | | 1.53 | | | | (2.80) | | | | 5.07 | | | | (0.10) | | | | (0.53) | | | | (0.84) | |
| |
| Dividends and/or distributions to shareholders: | | | | | | | | | | | | | | | | | | | | | | | | |
| Dividends from net investment income | | | (0.19) | | | | 0.00 | | | | (0.30) | | | | (0.06) | | | | (0.30) | | | | (0.29) | |
| |
| Net asset value, end of period | | | $20.52 | | | | $19.18 | | | | $21.98 | | | | $17.21 | | | | $17.37 | | | | $18.20 | |
| | | | |
|
| |
| Total Return, at Net Asset Value3 | | | 8.10% | | | | (12.74)% | | | | 29.99% | | | | (0.55)% | | | | (2.89)% | | | | (4.42)% | |
|
| |
| Ratios/Supplemental Data | | | | | | | | | | | | | | | | | | | | | | | | |
| Net assets, end of period (in thousands) | | | $20,044 | | | | $17,112 | | | | $13,223 | | | | $8,410 | | | | $8,098 | | | | $8,641 | |
| |
| Average net assets (in thousands) | | | $18,820 | | | | $16,352 | | | | $10,332 | | | | $8,654 | | | | $8,342 | | | | $8,944 | |
| |
| Ratios to average net assets:4 | | | | | | | | | | | | | | | | | | | | | | | | |
| Net investment income | | | 1.44% | | | | 0.98% | | | | 0.65% | | | | 1.18% | | | | 0.33% | | | | 0.55% | |
| Expenses excluding specific expenses listed below | | | 1.49% | | | | 1.49% | | | | 1.53% | | | | 1.57% | | | | 1.56% | | | | 1.56% | |
| Interest and fees from borrowings | | | 0.00%5 | | | | 0.00%5 | | | | 0.00%5 | | | | 0.00%5 | | | | 0.00%5 | | | | 0.00% | |
| Total expenses6 | | | 1.49% | | | | 1.49% | | | | 1.53% | | | | 1.57% | | | | 1.56% | | | | 1.56% | |
| | | | |
| Expenses after payments, waivers and/or reimbursements and reduction to custodian expenses | | | 1.47% | | | | 1.48% | | | | 1.52% | | | | 1.56% | | | | 1.56%7 | | | | 1.56%7 | |
| |
| Portfolio turnover rate8 | | | 54% | | | | 85% | | | | 83% | | | | 79% | | | | 79% | | | | 68% | |
27 INVESCO OPPENHEIMER INTERNATIONAL EQUITY FUND
FINANCIAL HIGHLIGHTSContinued
1. Represents the last business day of the Fund’s reporting period.
2. Per share amounts calculated based on the average shares outstanding during the period.
3. Includes adjustments in accordance with accounting principles generally accepted in the United States of America and as such, the net asset value for financial reporting purposes and the returns based upon those net asset values may differ from the net asset value and returns for shareholder transactions. Does not include sales charges and is not annualized for periods less than one year, if applicable.
4. Annualized for periods less than one full year.
5. Less than 0.005%.
6. Total expenses including indirect expenses from affiliated fund fees and expenses were as follows:
| | | | | | |
| | | | | | |
Eleven Months Ended October 31, 2019 | | | 1.50 | % |
Year Ended November 30, 2018 | | | 1.50 | % |
Year Ended November 30, 2017 | | | 1.53 | % |
Year Ended November 30, 2016 | | | 1.58 | % |
Year Ended November 30, 2015 | | | 1.57 | % |
Year Ended November 28, 2014 | | | 1.56 | % |
7. Waiver was less than 0.005%.
8. Portfolio turnover is calculated at the fund level and is not annualized for periods less than one year, if applicable.
See accompanying Notes to Financial Statements.
28 INVESCO OPPENHEIMER INTERNATIONAL EQUITY FUND
| | | | | | | | | | | | | | | | | | | | | | | | |
| Class Y | | Eleven Months
Ended
October 31,
2019 | | | Year Ended
November
30, 2018 | | | Year Ended
November
30, 2017 | | | Year Ended
November
30, 2016 | | | Year Ended
November
30, 2015 | | | Year Ended
November
28, 20141 | |
| |
| Per Share Operating Data | | | | | | | | | | | | | | | | | | | | | | | | |
| Net asset value, beginning of period | | | $19.67 | | | | $22.46 | | | | $17.59 | | | | $17.75 | | | | $18.59 | | | | $19.44 | |
| |
| Income (loss) from investment operations: | | | | | | | | | | | | | | | | | | | | | | | | |
| Net investment income2 | | | 0.38 | | | | 0.35 | | | | 0.21 | | | | 0.27 | | | | 0.15 | | | | 0.17 | |
| Net realized and unrealized gain (loss) | | | 1.30 | | | | (3.07) | | | | 5.06 | | | | (0.28) | | | | (0.60) | | | | (0.94) | |
| | | | |
| Total from investment operations | | | 1.68 | | | | (2.72) | | | | 5.27 | | | | (0.01) | | | | (0.45) | | | | (0.77) | |
| |
| Dividends and/or distributions to shareholders: | | | | | | | | | | | | | | | | | | | | | | | | |
| Dividends from net investment income | | | (0.31) | | | | (0.07) | | | | (0.40) | | | | (0.15) | | | | (0.39) | | | | (0.08) | |
| |
| Net asset value, end of period | | | $21.04 | | | | $19.67 | | | | $22.46 | | | | $17.59 | | | | $17.75 | | | | $18.59 | |
| | | | |
|
| |
| Total Return, at Net Asset Value3 | | | 8.73% | | | | (12.16)% | | | | 30.63% | | | | (0.03)% | | | | (2.37)% | | | | (3.98)% | |
|
| |
| Ratios/Supplemental Data | | | | | | | | | | | | | | | | | | | | | | | | |
| Net assets, end of period (in thousands) | | | $74,540 | | | | $138,750 | | | | $57,166 | | | | $15,965 | | | | $10,789 | | | | $10,065 | |
| |
| Average net assets (in thousands) | | | $97,294 | | | | $138,863 | | | | $30,119 | | | | $12,715 | | | | $10,542 | | | | $11,451 | |
| |
| Ratios to average net assets:4 | | | | | | | | | | | | | | | | | | | | | | | | |
| Net investment income | | | 2.06% | | | | 1.63% | | | | 1.01% | | | | 1.54% | | | | 0.84% | | | | 0.91% | |
| Expenses excluding specific expenses listed below | | | 0.99% | | | | 1.00% | | | | 1.03% | | | | 1.07% | | | | 1.06% | | | | 1.06% | |
| Interest and fees from borrowings | | | 0.00%5 | | | | 0.00%5 | | | | 0.00%5 | | | | 0.00%5 | | | | 0.00%5 | | | | 0.00% | |
| | | | |
| Total expenses6 | | | 0.99% | | | | 1.00% | | | | 1.03% | | | | 1.07% | | | | 1.06% | | | | 1.06% | |
| Expenses after payments, waivers and/or reimbursements and reduction to custodian expenses | | | 0.84% | | | | 0.85% | | | | 1.02% | | | | 1.06% | | | | 1.06%7 | | | | 1.06%7 | |
| |
| Portfolio turnover rate8 | | | 54% | | | | 85% | | | | 83% | | | | 79% | | | | 79% | | | | 68% | |
29 INVESCO OPPENHEIMER INTERNATIONAL EQUITY FUND
FINANCIAL HIGHLIGHTSContinued
1. Represents the last business day of the Fund’s reporting period.
2. Per share amounts calculated based on the average shares outstanding during the period.
3. Includes adjustments in accordance with accounting principles generally accepted in the United States of America and as such, the net asset value for financial reporting purposes and the returns based upon those net asset values may differ from the net asset value and returns for shareholder transactions. Does not include sales charges and is not annualized for periods less than one year, if applicable.
4. Annualized for periods less than one full year.
5. Less than 0.005%.
6. Total expenses including indirect expenses from affiliated fund fees and expenses were as follows:
| | | | | | |
| | | | | | |
Eleven Months Ended October 31, 2019 | | | 1.00 | % |
Year Ended November 30, 2018 | | | 1.01 | % |
Year Ended November 30, 2017 | | | 1.03 | % |
Year Ended November 30, 2016 | | | 1.08 | % |
Year Ended November 30, 2015 | | | 1.07 | % |
Year Ended November 28, 2014 | | | 1.06 | % |
7. Waiver was less than 0.005%.
8. Portfolio turnover is calculated at the fund level and is not annualized for periods less than one year, if applicable.
See accompanying Notes to Financial Statements.
30 INVESCO OPPENHEIMER INTERNATIONAL EQUITY FUND
| | | | |
| Class R5 | | Period
Ended
October 31,
20191 | |
| |
| Per Share Operating Data | | | | |
| Net asset value, beginning of period | | | $19.31 | |
| |
| Income (loss) from investment operations: | | | | |
| Net investment income2 | | | 0.18 | |
| Net realized and unrealized gain | | | 1.37 | |
| | | | |
| Total from investment operations | | | 1.55 | |
| |
| Dividends and/or distributions to shareholders: | | | | |
| Dividends from net investment income | | | 0.00 | |
| |
| Net asset value, end of period | | | $20.86 | |
| | | | |
|
| |
| Total Return, at Net Asset Value3 | | | 8.03% | |
|
| |
| Ratios/Supplemental Data | | | | |
| Net assets, end of period (in thousands) | | | $11 | |
| |
| Average net assets (in thousands) | | | $10 | |
| |
| Ratios to average net assets:4 | | | | |
| Net investment income | | | 2.09% | |
| Expenses excluding specific expenses listed below | | | 0.82% | |
| Interest and fees from borrowings | | | 0.00% | |
| | | | |
| Total expenses5 | | | 0.82% | |
| Expenses after payments, waivers and/or reimbursements and reduction to custodian expenses | | | 0.82%6 | |
| |
| Portfolio turnover rate7 | | | 54% | |
1. For the period from after the close of business on May 24, 2019 (inception of offering) to October 31, 2019.
2. Per share amounts calculated based on the average shares outstanding during the period.
3. Includes adjustments in accordance with accounting principles generally accepted in the United States of America and as such, the net asset value for financial reporting purposes and the returns based upon those net asset values may differ from the net asset value and returns for shareholder transactions. Does not include sales charges and is not annualized for periods less than one year, if applicable.
4. Annualized for periods less than one full year.
5. Total expenses including indirect expenses from affiliated fund fees and expenses were as follows:
| | | | | | |
| | | | | | |
| Period Ended October 31, 2019 | | | 0.83 | % |
6. Waiver was less than 0.005%.
7. Portfolio turnover is calculated at the fund level and is not annualized for periods less than one year, if applicable.
See accompanying Notes to Financial Statements.
31 INVESCO OPPENHEIMER INTERNATIONAL EQUITY FUND
FINANCIAL HIGHLIGHTSContinued
| | | | | | | | | | | | | | | | | | | | | | | | |
| Class R6 | | Eleven Months
Ended
October 31,
2019 | | | Year Ended
November
30, 2018 | | | Year Ended
November
30, 2017 | | | Year Ended
November
30, 2016 | | | Year Ended
November
30, 2015 | | | Year Ended
November
28, 20141 | |
| |
| Per Share Operating Data | | | | | | | | | | | | | | | | | | | | | | | | |
| Net asset value, beginning of period | | | $19.40 | | | | $22.17 | | | | $17.36 | | | | $17.53 | | | | $18.37 | | | | $19.51 | |
| |
| Income (loss) from investment operations: | | | | | | | | | | | | | | | | | | | | | | | | |
| Net investment income2 | | | 0.38 | | | | 0.35 | | | | 0.23 | | | | 0.32 | | | | 0.19 | | | | 0.23 | |
| Net realized and unrealized gain (loss) | | | 1.29 | | | | (3.03) | | | | 5.01 | | | | (0.30) | | | | (0.60) | | | | (0.95) | |
| | | | |
| Total from investment operations | | | 1.67 | | | | (2.68) | | | | 5.24 | | | | 0.02 | | | | (0.41) | | | | (0.72) | |
| |
| Dividends and/or distributions to shareholders: | | | | | | | | | | | | | | | | | | | | | | | | |
| Dividends from net investment income | | | (0.32) | | | | (0.09) | | | | (0.43) | | | | (0.19) | | | | (0.43) | | | | (0.42) | |
| |
| Net asset value, end of period | | | $20.75 | | | | $19.40 | | | | $22.17 | | | | $17.36 | | | | $17.53 | | | | $18.37 | |
| | | | |
|
| |
| Total Return, at Net Asset Value3 | | | 8.77% | | | | (12.20)% | | | | 30.96% | | | | 0.11% | | | | (2.16)% | | | | (3.78)% | |
|
| |
| Ratios/Supplemental Data | | | | | | | | | | | | | | | | | | | | | | | | |
| Net assets, end of period (in thousands) | | | $1,516,446 | | | | $1,566,488 | | | | $1,505,578 | | | | $689,409 | | | | $716,793 | | | | $737,126 | |
| |
| Average net assets (in thousands) | | | $1,501,713 | | | | $1,649,211 | | | | $1,030,833 | | | | $700,889 | | | | $738,381 | | | | $763,119 | |
| |
| Ratios to average net assets:4 | | | | | | | | | | | | | | | | | | | | | | | | |
| Net investment income | | | 2.11% | | | | 1.65% | | | | 1.17% | | | | 1.85% | | | | 1.03% | | | | 1.24% | |
| Expenses excluding specific expenses listed below | | | 0.80% | | | | 0.82% | | | | 0.83% | | | | 0.87% | | | | 0.86% | | | | 0.86% | |
| Interest and fees from borrowings | | | 0.00%5 | | | | 0.00%5 | | | | 0.00%5 | | | | 0.00%5 | | | | 0.00%5 | | | | 0.00% | |
| | | | |
| Total expenses6 | | | 0.80% | | | | 0.82% | | | | 0.83% | | | | 0.87% | | | | 0.86% | | | | 0.86% | |
| Expenses after payments, waivers and/or reimbursements and reduction to custodian expenses | | | 0.79% | | | | 0.81% | | | | 0.83%7 | | | | 0.86% | | | | 0.86%7 | | | | 0.86%7 | |
| |
| Portfolio turnover rate8 | | | 54% | | | | 85% | | | | 83% | | | | 79% | | | | 79% | | | | 68% | |
32 INVESCO OPPENHEIMER INTERNATIONAL EQUITY FUND
1. Represents the last business day of the Fund’s reporting period.
2. Per share amounts calculated based on the average shares outstanding during the period.
3. Includes adjustments in accordance with accounting principles generally accepted in the United States of America and as such, the net asset value for financial reporting purposes and the returns based upon those net asset values may differ from the net asset value and returns for shareholder transactions. Does not include sales charges and is not annualized for periods less than one year, if applicable.
4. Annualized for periods less than one full year.
5. Less than 0.005%.
6. Total expenses including indirect expenses from affiliated fund fees and expenses were as follows:
| | | | | | |
| | | | | | |
Eleven Months Ended October 31, 2019 | | | 0.81 | % |
Year Ended November 30, 2018 | | | 0.83 | % |
Year Ended November 30, 2017 | | | 0.83 | % |
Year Ended November 30, 2016 | | | 0.88 | % |
Year Ended November 30, 2015 | | | 0.87 | % |
Year Ended November 28, 2014 | | | 0.86 | % |
7. Waiver was less than 0.005%.
8. Portfolio turnover is calculated at the fund level and is not annualized for periods less than one year, if applicable.
See accompanying Notes to Financial Statements.
33 INVESCO OPPENHEIMER INTERNATIONAL EQUITY FUND
NOTES TO FINANCIAL STATEMENTSOctober 31, 2019
Note 1 – Significant Accounting Policies
Invesco Oppenheimer International Equity Fund (the “Fund”) is a series portfolio of AIM International Mutual Funds (Invesco International Mutual Funds) (the “Trust”). The Trust is a Delaware statutory trust registered under the Investment Company Act of 1940, as amended (the “1940 Act”), as anopen-end series management investment company authorized to issue an unlimited number of shares of beneficial interest. Information presented in these financial statements pertains only to the Fund. Matters affecting the Fund or each class will be voted on exclusively by the shareholders of such Fund or each class.
Prior to the close of business on May 24, 2019, the Fund operated as Oppenheimer International Equity Fund (the “Acquired Fund” or “Predecessor Fund”). The Acquired Fund was reorganized after the close of business on May 24, 2019 (the “Reorganization Date”) through the transfer of all of its assets and liabilities to the Fund (the “Reorganization”).
Upon closing of the Reorganization, holders of the Acquired Fund’s Class A, Class C, Class R, and Class Y shares received the corresponding class of shares of the Fund and holders of the Acquired Fund’s Class I shares received Class R6 shares of the Fund. Information for the Acquired Fund’s Class I shares prior to the Reorganization is included with Class R6 shares throughout this report. Class R5 shares commenced operations on the Reorganization Date.
Effective July 31, 2019, the Fund’s fiscal year end changed from November 30 to October 31.
The Fund’s investment objective is to seek capital appreciation.
The Fund currently consists of six different classes of shares: Class A, Class C, Class R, Class Y, Class R5 and Class R6. Class Y shares are available only to certain investors. Class A shares are sold with afront-end sales charge unless certain waiver criteria are met and under certain circumstances load waived shares may be subject to contingent deferred sales charges (“CDSC”). Class C shares are sold with a CDSC. Class R, Class Y, Class R5 and Class R6 shares are sold at net asset value. Class C shares held for ten years after purchase are eligible for automatic conversion into Class A shares of the same Fund (the “Conversion Feature”). The automatic conversion pursuant to the Conversion Feature will generally occur at the end of the month following the tenth anniversary after a purchase of Class C shares.
The Fund is an investment company and accordingly follows the investment company accounting and reporting guidance in accordance with Financial Accounting Standards Board Accounting Standards Codification Topic 946, Financial Services – Investment Companies.
The following is a summary of the significant accounting policies followed by the Fund in the preparation of its financial statements.
A. Security Valuations– Securities, including restricted securities, are valued according to the following policy.
A security listed or traded on an exchange (except convertible securities) is valued at its last sales price or official closing price as of the close of the customary trading session on the exchange where the security is principally traded, or lacking any sales or official closing price on a particular day, the security may be valued at the closing bid price on that day. Securities traded in theover-the-counter market are valued based on prices furnished by independent pricing services or market makers. When such securities are valued by an
34 INVESCO OPPENHEIMER INTERNATIONAL EQUITY FUND
independent pricing service they may be considered fair valued. Futures contracts are valued at the final settlement price set by an exchange on which they are principally traded. Listed options are valued at the mean between the last bid and asked prices from the exchange on which they are principally traded. Options not listed on an exchange are valued by an independent source at the mean between the last bid and asked prices. For purposes of determining net asset value (“NAV”) per share, futures and option contracts generally are valued 15 minutes after the close of the customary trading session of the New York Stock Exchange (“NYSE”).
Investments inopen-end andclosed-end registered investment companies that do not trade on an exchange are valued at theend-of-day net asset value per share. Investments inopen-end andclosed-end registered investment companies that trade on an exchange are valued at the last sales price or official closing price as of the close of the customary trading session on the exchange where the security is principally traded.
Debt obligations (including convertible securities) and unlisted equities are fair valued using an evaluated quote provided by an independent pricing service. Evaluated quotes provided by the pricing service may be determined without exclusive reliance on quoted prices, and may reflect appropriate factors such asinstitution-size trading in similar groups of securities, developments related to specific securities, dividend rate (for unlisted equities), yield (for debt obligations), quality, type of issue, coupon rate (for debt obligations), maturity (for debt obligations), individual trading characteristics and other market data. Pricing services generally value debt obligations assuming orderly transactions of institutional round lot size, but a fund may hold or transact in the same securities in smaller, odd lot sizes. Odd lots often trade at lower prices than institutional round lots. Debt obligations are subject to interest rate and credit risks. In addition, all debt obligations involve some risk of default with respect to interest and/or principal payments.
Foreign securities’ (including foreign exchange contracts) prices are converted into U.S. dollar amounts using the applicable exchange rates as of the close of the NYSE. If market quotations are available and reliable for foreign exchange-traded equity securities, the securities will be valued at the market quotations. Because trading hours for certain foreign securities end before the close of the NYSE, closing market quotations may become unreliable. If between the time trading ends on a particular security and the close of the customary trading session on the NYSE, events occur that the investment adviser determines are significant and make the closing price unreliable, the Fund may fair value the security. If the event is likely to have affected the closing price of the security, the security will be valued at fair value in good faith using procedures approved by the Board of Trustees. Adjustments to closing prices to reflect fair value may also be based on a screening process of an independent pricing service to indicate the degree of certainty, based on historical data, that the closing price in the principal market where a foreign security trades is not the current value as of the close of the NYSE. Foreign securities’ prices meeting the approved degree of certainty that the price is not reflective of current value will be priced at the indication of fair value from the independent pricing service. Multiple factors may be considered by the independent pricing service in determining adjustments to reflect fair value and may include information relating to sector indices, American
35 INVESCO OPPENHEIMER INTERNATIONAL EQUITY FUND
NOTES TO FINANCIAL STATEMENTSContinued
Depositary Receipts and domestic and foreign index futures. Foreign securities may have additional risks including exchange rate changes, potential for sharply devalued currencies and high inflation, political and economic upheaval, the relative lack of issuer information, relatively low market liquidity and the potential lack of strict financial and accounting controls and standards.
Securities for which market prices are not provided by any of the above methods may be valued based upon quotes furnished by independent sources. The last bid price may be used to value equity securities. The mean between the last bid and asked prices is used to value debt obligations, including corporate loans.
Securities for which market quotations are not readily available or became unreliable are valued at fair value as determined in good faith by or under the supervision of the Trust’s officers following procedures approved by the Board of Trustees. Issuer specific events, market trends, bid/asked quotes of brokers and information providers and other market data may be reviewed in the course of making a good faith determination of a security’s fair value.
The Fund may invest in securities that are subject to interest rate risk, meaning the risk that the prices will generally fall as interest rates rise and, conversely, the prices will generally rise as interest rates fall. Specific securities differ in their sensitivity to changes in interest rates depending on their individual characteristics. Changes in interest rates may result in increased market volatility, which may affect the value and/or liquidity of certain Fund investments.
Valuations change in response to many factors including the historical and prospective earnings of the issuer, the value of the issuer’s assets, general economic conditions, interest rates, investor perceptions and market liquidity. Because of the inherent uncertainties of valuation, the values reflected in the financial statements may materially differ from the value received upon actual sale of those investments.
B. Securities Transactions and Investment Income -Securities transactions are accounted for on a trade date basis. Realized gains or losses on sales are computed on the basis of specific identification of the securities sold. Interest income (net of withholding tax, if any) is recorded on the accrual basis from settlement date. Dividend income (net of withholding tax, if any) is recorded on theex-dividend date.
The Fund may periodically participate in litigation related to Fund investments. As such, the Fund may receive proceeds from litigation settlements. Any proceeds received are included in the Statement of Operations as realized gain (loss) for investments no longer held and as unrealized gain (loss) for investments still held.
Brokerage commissions and mark ups are considered transaction costs and are recorded as an increase to the cost basis of securities purchased and/or a reduction of proceeds on a sale of securities. Such transaction costs are included in the determination of net realized and unrealized gain (loss) from investment transactions reported in the Statement of Operations and the Statement of Changes in Net Assets and the net realized and unrealized gains (losses) on securities per share in the Financial Highlights. Transaction costs are included in the calculation of the Fund’s net asset value and, accordingly, they reduce the Fund’s total returns. These transaction costs are not considered operating expenses and
36 INVESCO OPPENHEIMER INTERNATIONAL EQUITY FUND
are not reflected in net investment income reported in the Statement of Operations and the Statement of Changes in Net Assets, or the net investment income per share and the ratios of expenses and net investment income reported in the Financial Highlights, nor are they limited by any expense limitation arrangements between the Fund and the investment adviser.
The Fund allocates income and realized and unrealized capital gains and losses to a class based on the relative net assets of each class.
C. Country Determination- For the purposes of making investment selection decisions and presentation in the Schedule of Investments, the investment adviser may determine the country in which an issuer is located and/or credit risk exposure based on various factors. These factors include the laws of the country under which the issuer is organized, where the issuer maintains a principal office, the country in which the issuer derives 50% or more of its total revenues and the country that has the primary market for the issuer’s securities, as well as other criteria. Among the other criteria that may be evaluated for making this determination are the country in which the issuer maintains 50% or more of its assets, the type of security, financial guarantees and enhancements, the nature of the collateral and the sponsor organization.
D. Distributions -Dividends and distributions to shareholders, which are determined in accordance with income tax regulations and may differ from accounting principles generally accepted in the United States of America (“GAAP”), are recorded on theex-dividend date. Income and capital gain distributions, if any, are declared and paid annually or at other times as determined necessary by the Adviser.
E. Federal Income Taxes -The Fund intends to comply with provisions of the Internal Revenue Code applicable to regulated investment companies and to distribute substantially all of its investment company taxable income, including any net realized gain on investments not offset by capital loss carryforwards, if any, to shareholders. Therefore, no federal income or excise tax provision is required. The Fund files income tax returns in U.S. federal and applicable state jurisdictions. The statute of limitations on the Fund’s tax return filings generally remains open for the three preceding fiscal reporting period ends. The Fund has analyzed its tax positions for the fiscal year ended October 31, 2019, including open tax years, and does not believe there are any uncertain tax positions requiring recognition in the Fund’s financial statements.
The tax components of capital shown in the following table represent distribution requirements the Fund must satisfy under the income tax regulations, losses the Fund may be able to offset against income and gains realized in future years and unrealized appreciation or depreciation of securities and other investments for federal income tax purposes.
37 INVESCO OPPENHEIMER INTERNATIONAL EQUITY FUND
NOTES TO FINANCIAL STATEMENTSContinued
| | | | | | | | | | | | |
Undistributed Net Investment Income | | Undistributed
Long-Term
Gain | | | Accumulated
Loss
Carryforward1,2,3 | | | Net Unrealized
Appreciation
Based on cost of
Securities and
Other Investments
for Federal Income
Tax Purposes | |
| |
| $33,496,124 | | | $— | | | | $250,038,108 | | | | $237,149,271 | |
1. During the reporting period, the Fund did not utilize any capital loss carryforward.
2.During the previous reporting period, the Fund did not utilize any capital loss carryforward.
3.During the reporting period, $29,804,087 of unused capital loss carryforward expired.
Net investment income (loss) and net realized gain (loss) may differ for financial statement and tax purposes. The character of dividends and distributions made during the fiscal year from net investment income or net realized gains are determined in accordance with federal income tax requirements, which may differ from the character of net investment income or net realized gains presented in those financial statements in accordance with U.S. GAAP. Also, due to timing of dividends and distributions, the fiscal year in which amounts are distributed may differ from the fiscal year in which the income or net realized gain was recorded by the Fund.
Accordingly, the following amounts have been reclassified for the reporting period. Net assets of the Fund were unaffected by the reclassifications.
| | | | |
Reduction toPaid-in Capital | | Reduction to Accumulated Net
Realized Loss on Investments | |
| |
| $29,802,051 | | | $29,802,051 | |
The tax character of distributions paid during the reporting periods:
| | | | | | | | | | | | |
| | | Eleven Months Ended October 31,
2019 | | | Year Ended November 30, 2018 | | | Year Ended November 30, 2017 | |
| |
| Distributions paid from: | | | | | | | | | | | | |
| Ordinary income | | $ | 30,169,772 | | | $ | 6,009,415 | | | $ | 21,240,080 | |
The aggregate cost of securities and other investments and the composition of unrealized appreciation and depreciation of securities and other investments for federal income tax purposes at period end are noted in the following table. The primary difference between book and tax appreciation or depreciation of securities and other investments, if applicable, is attributable to the tax deferral of losses or tax realization of financial statement unrealized gain or loss.
38 INVESCO OPPENHEIMER INTERNATIONAL EQUITY FUND
| | | | |
| Federal tax cost of securities | | $ | 1,561,408,603 | |
| | | | |
| Gross unrealized appreciation | | $ | 287,075,469 | |
Gross unrealized depreciation | | | (49,926,198) | |
| | | | |
| Net unrealized appreciation | | $ | 237,149,271 | |
| | | | |
F. Expenses -Fees provided for under the Rule12b-1 plan of a particular class of the Fund are charged to the operations of such class. Transfer agency fees and expenses and other shareholder recordkeeping fees and expenses attributable to Class R5 and Class R6 are allocated to each share class based on relative net assets.Sub-accounting fees attributable to Class R5 are charged to the operations of the class. Transfer agency fees and expenses and other shareholder recordkeeping fees and expenses relating to all other classes are allocated among those classes based on relative net assets. All other expenses are allocated among the classes based on relative net assets.
G. Accounting Estimates -The financial statements are prepared on a basis in conformity with GAAP, which requires management to make estimates and assumptions that affect the reported amounts of assets and liabilities at the date of the financial statements and the reported amounts of revenues and expenses during the reporting period including estimates and assumptions related to taxation. Actual results could differ from those estimates by a significant amount. In addition, the Fund monitors for material events or transactions that may occur or become known after theperiod-end date and before the date the financial statements are released to print.
H. Indemnifications -Under the Trust’s organizational documents, each Trustee, officer, employee or other agent of the Trust is indemnified against certain liabilities that may arise out of the performance of their duties to the Fund. Additionally, in the normal course of business, the Fund enters into contracts, including the Fund’s servicing agreements, that contain a variety of indemnification clauses. The Fund’s maximum exposure under these arrangements is unknown as this would involve future claims that may be made against the Fund that have not yet occurred. The risk of material loss as a result of such indemnification claims is considered remote.
I. Foreign Currency Translations -Foreign currency is valued at the close of the NYSE based on quotations posted by banks and major currency dealers. Portfolio securities and other assets and liabilities denominated in foreign currencies are translated into U.S. dollar amounts at the date of valuation. Purchases and sales of portfolio securities (net of foreign taxes withheld on disposition) and income items denominated in foreign currencies are translated into U.S. dollar amounts on the respective dates of such transactions. The Fund does not separately account for the portion of the results of operations resulting from changes in foreign exchange rates on investments and the fluctuations arising from changes in market prices of securities held. The combined results of changes in foreign exchange rates and the fluctuation of market prices on investments (net of estimated foreign tax withholding) are included with the net realized and unrealized gain or loss from investments in the Statement of Operations. Reported net realized foreign currency gains or losses arise from (1) sales of foreign currencies, (2) currency gains or losses realized between the trade and settlement dates on securities transactions, and (3) the difference
39 INVESCO OPPENHEIMER INTERNATIONAL EQUITY FUND
NOTES TO FINANCIAL STATEMENTSContinued
between the amounts of dividends, interest, and foreign withholding taxes recorded on the Fund’s books and the U.S. dollar equivalent of the amounts actually received or paid. Net unrealized foreign currency gains and losses arise from changes in the fair values of assets and liabilities, other than investments in securities at fiscal period end, resulting from changes in exchange rates. The Fund may invest in foreign securities, which may be subject to foreign taxes on income, gains on investments or currency repatriation, a portion of which may be recoverable. Foreign taxes, if any, are recorded based on the tax regulations and rates that exist in the foreign markets in which the Fund invests and are shown in the Statement of Operations.
J. Forward Foreign Currency Contracts - The Fund may engage in foreign currency transactions either on a spot (i.e. for prompt delivery and settlement) basis, or through forward foreign currency contracts, to manage or minimize currency or exchange rate risk.
The Fund may also enter into forward foreign currency contracts for the purchase or sale of a security denominated in a foreign currency in order to “lock in” the U.S. dollar price of that security, or the Fund may also enter into forward foreign currency contracts that do not provide for physical settlement of the two currencies, but instead are settled by a single cash payment calculated as the difference between the agreed upon exchange rate and the spot rate at settlement based upon an agreed upon notional amount(non-deliverable forwards). The Fund will set aside liquid assets in an amount equal to the dailymark-to-market obligation for forward foreign currency contracts.
A forward foreign currency contract is an obligation between two parties (“Counterparties”) to purchase or sell a specific currency for an agreed-upon price at a future date. The use of forward foreign currency contracts does not eliminate fluctuations in the price of the underlying securities the Fund owns or intends to acquire but establishes a rate of exchange in advance. Fluctuations in the value of these contracts are measured by the difference in the contract date and reporting date exchange rates and are recorded as unrealized appreciation (depreciation) until the contracts are closed. When the contracts are closed, realized gains (losses) are recorded. Realized and unrealized gains (losses) on the contracts are included in the Statement of Operations. The primary risks associated with forward foreign currency contracts include failure of the Counterparty to meet the terms of the contract and the value of the foreign currency changing unfavorably. These risks may be in excess of the amounts reflected in the Statement of Assets and Liabilities.
Note 2 – Advisory Fees and Other Fees Paid to Affiliates
The Trust has entered into a master investment advisory agreement with Invesco Advisers, Inc. (the “Adviser” or “Invesco”). Under the terms of the investment advisory agreement, the Fund accrues daily and pays monthly an advisory fee to the Adviser based on the annual rate of the Fund’s average daily net assets as follows:
40 INVESCO OPPENHEIMER INTERNATIONAL EQUITY FUND
| | | | |
| Fee Schedule* | |
| |
| Up to $500 million | | | 0.85% | |
| Next $500 million | | | 0.75 | |
| Next $1 billion | | | 0.70 | |
| Next $3 billion | | | 0.67 | |
| Over $5 billion | | | 0.65 | |
*The advisory fee paid by the Fund shall be reduced by any amounts paid by the Fund under the administrative services agreement with the Adviser.
For the period ended October 31, 2019, the effective advisory fee incurred by the Fund was 0.75% annualized.
From the beginning of the fiscal period until the date of the Reorganization, the Acquired Fund paid $6,737,123in advisory fees to OFI Global Asset Management, Inc. based on the annual rates above of the Acquired Fund’s average daily net assets.
Under the terms of a mastersub-advisory agreement between the Adviser and each of Invesco Asset Management Deutschland GmbH, Invesco Asset Management Limited, Invesco Asset Management (Japan) Limited, Invesco Hong Kong Limited, Invesco Senior Secured Management, Inc. and Invesco Canada Ltd. and separatesub-advisory agreements with Invesco Capital Management LLC, and Invesco Asset Management (India) Private Limited (collectively, the “AffiliatedSub-Advisers”) the Adviser, not the Fund, will pay 40% of the fees paid to the Adviser to any such AffiliatedSub-Adviser(s) that provide(s) discretionary investment management services to the Fund based on the percentage of assets allocated to such AffiliatedSub-Adviser(s). Invesco has also entered into a AffiliatedSub-Advisory Agreement with OppenheimerFunds, Inc. to provide discretionary management services to the Funds.
Effective on the Reorganization Date, the Adviser has contractually agreed, through at least May 31, 2021, to waive advisory fees and/or reimburse expenses of all shares to the extent necessary to limit the total annual fund operating expenses after fee waiver and/or expense reimbursement (excluding certain items discussed below) ofClass A, Class C, Class R, Class Y, Class R5 and Class R6 shares to 1.23%, 1.98%, 1.48%, 0.85%, 0.85% and 0.80%, respectively, of the Fund’s average daily net assets (the “expense limits”). In determining the Adviser’s obligation to waive advisory fees and/or reimburse expenses, the following expenses are not taken into account, and could cause total annual fund operating expenses after fee waivers and/or expense reimbursement to exceed the numbers reflected above: (1) interest; (2) taxes; (3) dividend expenses on short sales; (4) extraordinary ornon-routine items, including litigation expenses; and (5) expenses that the Fund has incurred but did not actually pay because of an expense offset arrangement. Unless Invesco continues the fee waiver agreement, it will terminate May 31, 2021. During its term, the fee waiver agreement cannot be terminated or amended to increase the expense limits or reduce the advisory fee waiver without approval of the Board of Trustees.
Further, the Adviser has contractually agreed, through at least June 30, 2021, to waive the advisory fee payable by the Fund in an amount equal to 100% of the net advisory fees the Adviser receives from the affiliated money market funds on investments by the Fund of uninvested cash in such affiliated money market funds.
41 INVESCO OPPENHEIMER INTERNATIONAL EQUITY FUND
NOTES TO FINANCIAL STATEMENTSContinued
For the periodended October 31, 2019, the Adviser waived advisory fees of $118,100 and reimbursed fund expenses of $18,905, $1,907, $2,093, and $123,872 for Class A, Class C, Class R, and Class Y, respectively.
The Trust has entered into a master administrative services agreement with Invesco pursuant to which the Fund has agreed to pay Invesco for certain administrative costs incurred in providing accounting services to the Fund. For the periodended October 31, 2019, expenses incurred under the agreement are shown in the Statement of Operations as Administration fees. Additionally, Invesco has entered into service agreements whereby Citibank, N.A. serves as custodian to the Fund. Prior to the Reorganization, the Acquired Fund paid administrative fees to OFI Global Asset Management, Inc.
The Trust has entered into a transfer agency and service agreement with Invesco Investment Services, Inc. (“IIS”) pursuant to which the Fund has agreed to pay IIS a fee for providing transfer agency and shareholder services to the Fund and reimburse IIS for certain expenses incurred by IIS in the course of providing such services. IIS may make payments to intermediaries that provide omnibus account services,sub-accounting services and/or networking services. All fees payable by IIS to intermediaries that provide omnibus account services orsub-accounting services are charged back to the Fund, subject to certain limitations approved by the Trust’s Board of Trustees. Prior to the Reorganization, the Acquired Fund paid transfer agent fees to OFI Global Asset Management, Inc. and Shareholder Services, Inc. For the periodended October 31, 2019, expenses incurred under these agreements are shown in the Statement of Operations as Transfer and shareholder servicing agent fees.
The Trust has entered into master distribution agreements with Invesco Distributors, Inc. (“IDI”) to serve as the distributor for the Class A, Class C, Class R, Class Y, Class R5 and Class R6 shares of the Fund. The Trust has adopted plans pursuant to Rule12b-1 under the 1940 Act with respect to the Fund’s Class A, Class C and Class R shares (collectively the “Plan”). The Fund, pursuant to the Class A Plan, reimburses IDI in an amount up to an annual rate of 0.25% of the average daily net assets of Class A shares. The Fund pursuant to the Class C and Class R Plan, pays IDI compensation at the annual rate of 1.00% of the average daily net assets of Class C shares and 0.50% of the average daily net assets of Class R shares. The fees are accrued daily and paid monthly. Of the Plan payments, up to 0.25% of the average daily net assets of each class of shares may be paid to furnish continuing personal shareholder services to customers who purchase and own shares of such classes. Any amounts not paid as a service fee under the Plan would constitute an asset-based sales charge. Rules of the Financial Industry Regulatory Authority (“FINRA”) impose a cap on the total sales charges, including asset-based sales charges, that may be paid by any class of shares of the Fund plans. Prior to the Reorganization, the Acquired Fund paid distribution fees to OppenheimerFunds Distributor, Inc. For the periodended October 31, 2019, expenses incurred under the plans are shown in the Statement of Operations as Distribution and service plan fees.
Front-end sales commissions and CDSC (collectively, the “sales charges”) are not recorded as expenses of the Fund.Front-end sales commissions are deducted from proceeds from the sales of Fund shares prior to investment in Class A shares of the Fund. CDSC are deducted from redemption proceeds prior to remittance to the shareholder. During theperiod ended October 31, 2019, IDI advised the Fund that IDI retained $7,399 infront-end sales
42 INVESCO OPPENHEIMER INTERNATIONAL EQUITY FUND
commissions from the sale of $481 from Class A and Class C shares, respectively, for CDSC imposed on redemptions by shareholders. From the beginning of the fiscal year to the date of the Reorganization, OppenheimerFunds Distributor, Inc. retained $12,054 in front–end sales commissions from the sale of $1,012 from Class A and Class C shares, respectively, for CDSC imposed on redemption by shareholders.
Certain officers and trustees of the Trust are officers and directors of the Adviser, IIS and/or IDI.
Note 3 – Additional Valuation Information
GAAP defines fair value as the price that would be received to sell an asset or paid to transfer a liability in an orderly transaction between market participants at the measurement date, under current market conditions. GAAP establishes a hierarchy that prioritizes the inputs to valuation methods, giving the highest priority to readily available unadjusted quoted prices in an active market for identical assets (Level 1) and the lowest priority to significant unobservable inputs (Level 3), generally when market prices are not readily available or are unreliable. Based on the valuation inputs, the securities or other investments are tiered into one of three levels. Changes in valuation methods may result in transfers in or out of an investment’s assigned level:
Level 1 — Prices are determined using quoted prices in an active market for identical assets.
Level 2 — Prices are determined using other significant observable inputs. Observable inputs are inputs that other market participants may use in pricing a security. These may include quoted prices for similar securities, interest rates, prepayment speeds, credit risk, yield curves, loss severities, default rates, discount rates, volatilities and others.
Level 3 — Prices are determined using significant unobservable inputs. In situations where quoted prices or observable inputs are unavailable (for example, when there is little or no market activity for an investment at the end of the period), unobservable inputs may be used. Unobservable inputs reflect the Fund’s own assumptions about the factors market participants would use in determining fair value of the securities or instruments and would be based on the best available information.
The following is a summary of the tiered valuation input levels, as of October 31, 2019. The level assigned to the securities valuations may not be an indication of the risk or liquidity associated with investing in those securities. Because of the inherent uncertainties of valuation, the values reflected in the financial statements may materially differ from the value received upon actual sale of those investments.
43 INVESCO OPPENHEIMER INTERNATIONAL EQUITY FUND
NOTES TO FINANCIAL STATEMENTSContinued
| | | | | | | | | | | | | | | | |
| | | Level 1—
Unadjusted
Quoted Prices | | | Level 2—
Other Significant
Observable Inputs | | | Level 3— Significant
Unobservable Inputs | | | Value | |
| |
Assets Table | | | | | | | | | | | | | | | | |
Investments, at Value: | | | | | | | | | | | | | | | | |
Common Stocks | | | | | | | | | | | | | | | | |
Consumer Discretionary | | $ | 88,527,738 | | | $ | 393,176,177 | | | $ | — | | | $ | 481,703,915 | |
Consumer Staples | | | 40,975,276 | | | | 226,091,771 | | | | — | | | | 267,067,047 | |
Energy | | | — | | | | 48,791,535 | | | | — | | | | 48,791,535 | |
Financials | | | — | | | | 67,339,767 | | | | — | | | | 67,339,767 | |
Health Care | | | 13,954,446 | | | | 66,772,386 | | | | — | | | | 80,726,832 | |
Industrials | | | — | | | | 240,684,562 | | | | — | | | | 240,684,562 | |
Information Technology | | | 115,490,768 | | | | 152,680,798 | | | | — | | | | 268,171,566 | |
Materials | | | 82,970,489 | | | | 113,181,389 | | | | — | | | | 196,151,878 | |
Telecommunication Services | | | 11,872,719 | | | | 69,842,675 | | | | — | | | | 81,715,394 | |
Investment Company | | | 66,249,700 | | | | — | | | | — | | | | 66,249,700 | |
| | | | |
Total Assets | | $ | 420,041,136 | | | $ | 1,378,561,060 | | | $ | — | | | $ | 1,798,602,196 | |
| | | | |
Note 4 - Security Transactions with Affiliated Funds
The Fund is permitted to purchase or sell securities from or to certain other Invesco Funds under specified conditions outlined in procedures adopted by the Board of Trustees of the Trust. The procedures have been designed to ensure that any purchase or sale of securities by the Fund from or to another fund or portfolio that is or could be considered an affiliate by virtue of having a common investment adviser (or affiliated investment advisers), common Trustees and/or common officers complies with Rule17a-7 of the 1940 Act. Further, as defined under the procedures, each transaction is effected at the current market price. Pursuant to these procedures for the period December 1, 2018 to May 24, 2019,the Predecessor Fund engaged in transactions with affiliates as listed: Securities sales of $4,664,897, which resulted in net realized gainsof $116,908. For the period May 25, 2019 to October 31, 2019, the Fund did not engage in transactions with affiliates.
Note 5 – Trustee and Officer Fees and Benefits
The Fund has adopted an unfunded retirement plan (the “Plan”) for the Fund’s Independent Trustees. Benefits are based on years of service and fees paid to each Trustee during their period of service. The Plan was frozen with respect to adding new participants effective December 31, 2006 (the “Freeze Date”) and existing Plan Participants as of the Freeze Date will continue to receive accrued benefits under the Plan. Active Independent Trustees as of the Freeze Date have each elected a distribution method with respect to their benefits under the Plan.
During the reporting period, the Fund’s projected benefit obligations, payments to retired Trustees and accumulated liability were as follows:
44 INVESCO OPPENHEIMER INTERNATIONAL EQUITY FUND
| | | | |
Projected Benefit Obligations Increased | | $ | 4,894 | |
Payments Made to Retired Trustees | | | 7,751 | |
Accumulated Liability as of October 31, 2019 | | | 67,164 | |
Certain trustees have executed a Deferred Compensation Agreement pursuant to which they have the option to elect to defer receipt of all or a portion of the annual compensation they are entitled to receive from the Fund. For purposes of determining the amount owed to the Trustee under the plan, deferred amounts are treated as though equal dollar amounts had been invested in shares of the Fund or in other Invesco and/or Invesco Oppenheimer funds selected by the Trustee. The Fund purchases shares of the funds selected for deferral by the Trustee in amounts equal to his or her deemed investment, resulting in a Fund asset equal to the deferred compensation liability. Such assets are included as a component of “Other” within the asset section of the Statement of Assets and Liabilities. Deferral of Trustees’ fees under the plan will not affect the net assets of the Fund and will not materially affect the Fund’s assets, liabilities or net investment income per share. Amounts will be deferred until distributed in accordance with the compensation deferral plan.
Note 6 – Cash Balances
The Fund is permitted to temporarily carry a negative or overdrawn balance in its account with Citibank, N.A., the custodian bank. Such balances, if any atperiod-end, are shown in the Statement of Assets and Liabilities under the payable caption Amount due to custodian. To compensate the custodian bank for such overdrafts, the overdrawn Fund may either (1) leave funds as a compensating balance in the account so the custodian bank can be compensated by earning the additional interest; or (2) compensate by paying the custodian bank at a rate agreed upon by the custodian bank and Invesco, not to exceed the contractually agreed upon rate.
Note 7 – Investment Transactions
The aggregate amount of investment securities (other than short-term securities, U.S. Treasury obligations and money market funds, if any) purchased and sold by the Fund during theperiodended October 31, 2019 was $908,200,420 and $927,666,080, respectively. Cost of investments, including any derivatives, on a tax basis includes the adjustments for financial reporting purposes as of the most recently completed federal income tax reportingperiod-end.
45 INVESCO OPPENHEIMER INTERNATIONAL EQUITY FUND
NOTES TO FINANCIAL STATEMENTSContinued
Note8- Share Information
Transactions in shares of beneficial interest were as follows:
| | | | | | | | | | | | | | | | | | | | | | | | |
| | | Eleven Months Ended October 31, 20191 | | | Year Ended November 30, 2018 | | | Year Ended November 30, 2017 | |
| | | Shares | | | Amount | | | Shares | | | Amount | | | Shares | | | Amount | |
| |
Class A | | | | | | | | | | | | | | | | | | | | | | | | |
Sold | | | 1,640,929 | | | $ | 31,165,329 | | | | 3,048,686 | | | $ | 66,743,236 | | | | 2,018,084 | | | $ | 40,685,453 | |
Automatic conversion Class C to Class A Shares | | | 542,209 | | | | 10,941,224 | | | | — | | | | — | | | | — | | | | — | |
Dividends and/or distributions reinvested | | | 109,652 | | | | 2,061,465 | | | | 529 | | | | 11,736 | | | | 186,379 | | | | 3,203,858 | |
Redeemed | | | (3,293,850 | ) | | | (64,298,290 | ) | | | (3,324,106 | ) | | | (72,158,547 | ) | | | (1,769,788 | ) | | | (34,357,254) | |
| | | | |
Net increase (decrease) | | | (1,001,060 | ) | | $ | (20,130,272 | ) | | | (274,891 | ) | | $ | (5,403,575 | ) | | | 434,675 | | | $ | 9,532,057 | |
| | | | |
|
| |
Class B | |
Sold | | | — | | | $ | — | | | | 435 | | | $ | 9,083 | | | | 6,477 | | | $ | 114,408 | |
Dividends and/or distributions reinvested | | | — | | | | — | | | | — | | | | — | | | | 821 | | | | 12,979 | |
Redeemed2 | | | — | | | | — | | | | (29,993 | ) | | | (608,600 | ) | | | (89,946 | ) | | | (1,584,165) | |
| | | | |
Net decrease | | | — | | | $ | — | | | | (29,558 | ) | | $ | (599,517 | ) | | | (82,648 | ) | | $ | (1,456,778) | |
| | | | |
|
| |
Class C | | | | | | | | | | | | | | | | | | | | | | | | |
Sold | | | 249,928 | | | $ | 4,250,853 | | | | 457,323 | | | $ | 9,033,495 | | | | 427,766 | | | $ | 7,813,902 | |
Dividends and/or distributions reinvested | | | 9,476 | | | | 158,911 | | | | — | | | | — | | | | 28,026 | | | | 433,008 | |
Automatic conversion Class C to Class A Shares | | | (610,311 | ) | | | (10,941,224 | ) | | | — | | | | — | | | | — | | | | — | |
Redeemed | | | (578,794 | ) | | | (10,122,339 | ) | | | (465,394 | ) | | | (8,857,715 | ) | | | (416,178 | ) | | | (7,320,602) | |
| | | | |
Net increase (decrease) | | | (929,701 | ) | | $ | (16,653,799 | ) | | | (8,071 | ) | | $ | 175,780 | | | | 39,614 | | | $ | 926,308 | |
| | | | |
46 INVESCO OPPENHEIMER INTERNATIONAL EQUITY FUND
| | | | | | | | | | | | | | | | | | | | | | | | |
| | | Eleven Months Ended
October 31, 20191 | | | Year Ended November 30, 2018 | | | Year Ended November 30, 2017 | |
| | | Shares | | | Amount | | | Shares | | | Amount | | | Shares | | | Amount | |
| |
Class R | | | | | | | | | | | | | | | | | | | | | | | | |
Sold | | | 339,596 | | | $ | 6,581,641 | | | | 498,228 | | | $ | 10,740,591 | | | | 279,930 | | | $ | 5,626,095 | |
Dividends and/or distributions reinvested | | | 8,865 | | | | 164,617 | | | | — | | | | — | | | | 7,754 | | | | 132,128 | |
Redeemed | | | (264,043 | ) | | | (5,175,374 | ) | | | (207,447 | ) | | | (4,435,710 | ) | | | (174,828 | ) | | | (3,443,031) | |
| | | | |
Net increase | | | 84,418 | | | $ | 1,570,884 | | | | 290,781 | | | $ | 6,304,881 | | | | 112,856 | | | $ | 2,315,192 | |
| | | | |
|
| |
Class Y | | | | | | | | | | | | | | | | | | | | | | | | |
Sold | | | 1,828,775 | | | $ | 36,331,191 | | | | 7,787,432 | | | $ | 173,301,233 | | | | 2,336,888 | | | $ | 48,762,517 | |
Dividends and/or distributions reinvested | | | 114,130 | | | | 2,160,492 | | | | 7,669 | | | | 171,486 | | | | 20,223 | | | | 350,469 | |
Redeemed | | | (5,454,878 | ) | | | (108,204,997 | ) | | | (3,284,612 | ) | | | (69,075,542 | ) | | | (719,707 | ) | | | (15,015,254) | |
| | | | |
Net increase (decrease) | | | (3,511,973 | ) | | $ | (69,713,314 | ) | | | 4,510,489 | | | $ | 104,397,177 | | | | 1,637,404 | | | $ | 34,097,732 | |
| | | | |
|
| |
Class R53 | | | | | | | | | | | | | | | | | | | | | | | | |
Sold | | | 518 | | | $ | 10,000 | | | | — | | | $ | — | | | | — | | | $ | — | |
Dividends and/or distributions reinvested | | | — | | | | — | | | | — | | | | — | | | | — | | | | — | |
Redeemed | | | — | | | | — | | | | — | | | | — | | | | — | | | | — | |
| | | | |
Net increase | | | 518 | | | $ | 10,000 | | | | — | | | $ | — | | | | — | | | $ | — | |
| | | | |
|
| |
Class R6 | | | | | | | | | | | | | | | | | | | | | | | | |
Sold | | | 6,784,562 | | | $ | 130,936,421 | | | | 21,215,246 | | | $ | 461,196,633 | | | | 37,545,680 | | | $ | 774,461,762 | |
Dividends and/or distributions reinvested | | | 1,365,818 | | | | 25,499,813 | | | | 264,076 | | | | 5,822,882 | | | | 993,436 | | | | 16,957,951 | |
Redeemed | | | (15,831,394 | ) | | | (307,578,277 | ) | | | (8,630,768 | ) | | | (180,371,120 | ) | | | (10,341,874 | ) | | | (214,715,168) | |
| | | | |
Net increase (decrease) | | | (7,681,014 | ) | | $ | (151,142,043 | ) | | | 12,848,554 | | | $ | 286,648,395 | | | | 28,197,242 | | | $ | 576,704,545 | |
| | | | |
1. 80% of the outstanding shares of the Fund are owned by the Adviser or an affiliate of the Adviser.
2. All outstanding Class B shares converted to Class A shares on June 1, 2018.
3. Commencement date after the close of business on May 24, 2019.
47 INVESCO OPPENHEIMER INTERNATIONAL EQUITY FUND
NOTES TO FINANCIAL STATEMENTSContinued
Note 9 - Borrowings
Joint Credit Facility.A number of mutual funds managed by the Adviser participate in a $1.95 billion revolving credit facility (the “Facility”) intended to provide short-term financing, if necessary, subject to certain restrictions in connection with atypical redemption activity. Expenses and fees related to the Facility are paid by the participating funds and are disclosed separately or as other expenses on the Statement of Operations. The Fund did not utilize the Facility during the reporting period. The Facility terminated May 24, 2019.
48 INVESCO OPPENHEIMER INTERNATIONAL EQUITY FUND
REPORT OF INDEPENDENT REGISTERED PUBLIC ACCOUNTING FIRM
To the Board of Trustees of AIM International Mutual Funds (Invesco International Mutual Funds) and Shareholders of Invesco Oppenheimer International Equity Fund
Opinion on the Financial Statements
We have audited the accompanying statement of assets and liabilities, including the schedule of investments, of Invesco Oppenheimer International Equity Fund (one of the funds constituting AIM International Mutual Funds (Invesco International Mutual Funds), referred to hereafter as the “Fund”) as of October 31, 2019, the related statements of operations and of changes in net assets for the period from December 1, 2019 through October 31, 2019, including the related notes, and the financial highlights for each of the periods ended October 31, 2019 (collectively referred to as the “financial statements”). In our opinion, the financial statements present fairly, in all material respects, the financial position of the Fund as of October 31, 2019, and the results of its operations and changes in its net assets for the period December 1, 2019 through October 31, 2019 and the financial highlights for the periods ended as of October 31, 2019 in conformity with accounting principles generally accepted in the United States of America.
The financial statements of Invesco Oppenheimer International Equity Fund (formerly known as Oppenheimer International Equity Fund) as of and for the year ended November 30, 2018 and the financial highlights for each of the periods ended on or prior to November 30, 2018 (not presented herein, other than the statements of operations and of changes in net assets and the financial highlights) were audited by other auditors whose report dated January 22, 2019 expressed an unqualified opinion on those financial statements and financial highlights.
Basis for Opinion
These financial statements are the responsibility of the Fund’s management. Our responsibility is to express an opinion on the Fund’s financial statements based on our audit. We are a public accounting firm registered with the Public Company Accounting Oversight Board (United States) (PCAOB) and are required to be independent with respect to the Fund in accordance with the U.S. federal securities laws and the applicable rules and regulations of the Securities and Exchange Commission and the PCAOB.
We conducted our audit of these financial statements in accordance with the standards of the PCAOB. Those standards require that we plan and perform the audit to obtain reasonable assurance about whether the financial statements are free of material misstatement, whether due to error or fraud.
Our audit included performing procedures to assess the risks of material misstatement of the financial statements, whether due to error or fraud, and performing procedures that respond to those risks. Such procedures included examining, on a test basis, evidence regarding the amounts and disclosures in the financial statements. Our audit also included evaluating the accounting principles used and significant estimates made by management, as well as evaluating the overall presentation of the financial statements. Our procedures included confirmation of securities owned as of October 31, 2019 by correspondence with the custodian, transfer agent and brokers; when replies were not received from brokers, we performed other auditing procedures. We believe that our audit provides a reasonable basis for our opinion.
49 INVESCO OPPENHEIMER INTERNATIONAL EQUITY FUND
REPORT OF INDEPENDENT REGISTERED PUBLIC ACCOUNTING FIRM
/s/PricewaterhouseCoopers LLP
Houston, Texas
December 23, 2019
We have served as the auditor of one or more of the investment companies in the Invesco group of investment companies since at least 1995. We have not been able to determine the specific year we began serving as auditor.
50 INVESCO OPPENHEIMER INTERNATIONAL EQUITY FUND
INDEPENDENT REGISTERED PUBLIC ACCOUNTING FIRM
The Audit Committee of the Board of Trustees appointed, and the Board of Trustees ratified and approved, PricewaterhouseCoopers LLP (“PwC”) as the independent registered public accounting firm of the Fund for the fiscal periods ending after May 24, 2019. Prior to the close of business on May 24, 2019, the Predecessor Fund was a separate series of an unaffiliated investment company and its financial statements were audited by a different independent registered public accounting firm (the “Prior Auditor”).
Effective after the close of business on May 24, 2019, the Prior Auditor resigned as the independent registered public accounting firm of the Fund. The Prior Auditor’s report on the financial statements of the Predecessor Fund for the past two fiscal years did not contain an adverse or disclaimer of opinion, and was not qualified or modified as to uncertainty, audit scope or accounting principles. During the Predecessor Fund’s two most recent fiscal years and through the close of business on May 24, 2019, there were no (1) disagreements with the Prior Auditor on any matter of accounting principles or practices, financial statement disclosure, or auditing scope or procedure, which disagreements, if not resolved to the Prior Auditor’s satisfaction, would have caused it to make reference to that matter in connection with its report; or (2) “reportable events,” as that term is defined in Item 304(a)(1)(v) of RegulationS-K under the Securities Exchange Act of 1934.
51 INVESCO OPPENHEIMER INTERNATIONAL EQUITY FUND
FEDERAL INCOME TAX INFORMATION
In early 2019, if applicable, shareholders of record received information regarding all dividends and distributions paid to them by the Fund during calendar year 2018.
Dividends, if any, paid by the Fund during the reporting period which are not designated as capital gain distributions should be multiplied by the maximum amount allowable but not less than 4.32% to arrive at the amount eligible for the corporate dividend-received deduction.
A portion, if any, of the dividends paid by the Fund during the reporting period which are not designated as capital gain distributions are eligible for lower individual income tax rates to the extent that the Fund has received qualified dividend income as stipulated by recent tax legislation. The maximum amount allowable but not less than $43,150,956 of the Fund’s fiscal year taxable income may be eligible for the lower individual income tax rates. In early
2019, shareholders of record received information regarding the percentage of distributions that are eligible for lower individual income tax rates.
Recent tax legislation allows a regulated investment company to designate distributions not designated as capital gain distributions, as either interest related dividends or short-term capital gain dividends, both of which are exempt from the U.S. withholding tax applicable to non U.S. taxpayers. For the reporting period, the maximum amount allowable but not less than $1,918,393 of the ordinary distributions to be paid by the Fund qualifies as an interest related dividend.
The Fund has elected the application of Section 853 of the Internal Revenue Code to permit shareholders to take a federal income tax credit or deduction, at their option, on a per share basis. The maximum amount allowable but not less than $4,450,524 of foreign income taxes were paid by the Fund during the reporting period. A separate notice will be mailed to each shareholder, which will reflect the proportionate share of such foreign taxes which must be treated by shareholders as gross income for federal income tax purposes.
Gross income of the maximum amount allowable but not less than $35,511,773 was derived from sources within foreign countries or possessions of the United States.
The foregoing information is presented to assist shareholders in reporting distributions received from the Fund to the Internal Revenue Service. Because of the complexity of the federal regulations which may affect your individual tax return and the many variations in state and local tax regulations, we recommend that you consult your tax advisor for specific guidance.
52 INVESCO OPPENHEIMER INTERNATIONAL EQUITY FUND
PORTFOLIO PROXY VOTING POLICIES AND PROCEDURES;
UPDATES TO SCHEDULE OF INVESTMENTS
Go paperless with eDelivery
Visit invesco.com/edelivery to enjoy the convenience and security of anytime electronic access to your investment documents.
With eDelivery, you can elect to have any or all of the following materials delivered straight to your inbox to download, save and print from your own computer:
● Fund reports and prospectuses
● Quarterly statements
● Daily confirmations
● Tax forms
Invesco mailing information
Send general correspondence to Invesco Investment Services, Inc., P.O. Box 219078, Kansas City, MO 64121-9078.
Important notice regarding delivery of security holder documents
To reduce Fund expenses, only one copy of most shareholder documents may be mailed to shareholders with multiple accounts at the same address (Householding). Mailing of your shareholder documents may be householded indefinitely unless you instruct us otherwise. If you do not want the mailing of these documents to be combined with those for other members of your household, please contact Invesco Investment Services, Inc. at 800 959 4246 or contact your financial institution. We will begin sending you individual copies for each account within 30 days after receiving your request.
Fund holdings and proxy voting information
The Fund provides a complete list of its holdings four times in each fiscal year, at the quarter ends.
For the second and fourth quarters, the lists appear in the Fund’s semiannual and annual reports to shareholders. For the first and third quarters, the Fund files the lists with the Securities and Exchange Commission (SEC) as an exhibit to its reports on FormN-PORT. The most recent list of portfolio holdings is available at invesco.com/completeqtrholdings. Shareholders can also look up the Fund’s FormsN-PORT on the SEC website at sec.gov.
A description of the policies and procedures that the Fund uses to determine how to vote proxies relating to portfolio securities is available without charge, upon request, from our Client Services department at 800 959 4246 or at invesco.com/proxyguidelines. The information is also available on the SEC website, sec.gov.
Information regarding how the Fund voted proxies related to its portfolio securities during the most recent12-month period ended June 30 is available at invesco.com/proxysearch. The information is also available on the SEC website, sec.gov.
Invesco Advisers, Inc. is an investment adviser; it provides investment advisory services to individual and institutional clients and does not sell securities. Invesco Distributors, Inc. is the US distributor for Invesco Ltd.’s retail mutual funds, exchange-traded funds and institutional money market funds. Both are wholly owned, indirect subsidiaries of Invesco Ltd.
53 INVESCO OPPENHEIMER INTERNATIONAL EQUITY FUND
TRUSTEES AND OFFICERS
The address of each trustee and officer is AIM International Mutual Funds (Invesco International Mutual Funds) (the “Trust”), 11 Greenway Plaza, Suite 1000, Houston, Texas 77046-1173. The trustees serve for the life of the Trust, subject to their earlier death, incapacitation, resignation, retirement or removal as more specifically provided in the Trust’s organizational documents. Each officer serves for a one year term or until their successors are elected and qualified. Column two below includes length of time served with predecessor entities, if any.
| | | | | | | | |
| | | | | |
Name, Year of Birth and Position(s) Held with the Trust | | Trustee
and/or
Officer
Since | | Principal Occupation(s) During Past 5 Years | | Number of Funds in Fund Complex
Overseen by Trustee | | Other Directorship(s)
Held by Trustee During Past 5 Years |
INTERESTED PERSONS | | | | | | | | |
| | | | | |
Martin L. Flanagan1— 1960 Trustee and Vice Chair | | 2007 | | Executive Director, Chief Executive Officer and President, Invesco Ltd. (ultimate parent of Invesco and a global investment management firm); Trustee and Vice Chair, The Invesco Funds; Vice Chair, Investment Company Institute; and Member of Executive Board, SMU Cox School of Business Formerly: Advisor to the Board, Invesco Advisers, Inc. (formerly known as Invesco Institutional (N.A.), Inc.); Chairman and Chief Executive Officer, Invesco Advisers, Inc. (registered investment adviser); Director, Chairman, Chief Executive Officer and President, Invesco Holding Company (US), Inc. (formerly IVZ Inc.) (holding company), Invesco Group Services, Inc. (service provider) and Invesco North American Holdings, Inc. (holding company); Director, Chief Executive Officer and President, Invesco Holding Company Limited (parent of Invesco and a global investment management firm); Director, Invesco Ltd.; Chairman, Investment Company Institute and President,Co-Chief Executive Officer,Co-President, Chief Operating Officer and Chief Financial Officer, Franklin Resources, Inc. (global investment management organization) | | 229 | | None |
| | | | | |
Philip A. Taylor2— 1954 Trustee | | 2006 | | Vice Chair, Invesco Ltd.; Trustee, The Invesco Funds Formerly: Director, Invesco Canada Ltd. (formerly known as Invesco Trimark Ltd./Invesco Trimark Ltèe) (registered investment adviser and registered transfer agent); Head of the Americas and Senior Managing Director, Invesco Ltd.; Director, Invesco Advisers, Inc. (formerly known as Invesco Institutional (N.A.), Inc.) (registered investment adviser); | | 229 | | None |
| |
1 Mr. Flanagan is considered an interested person (within the meaning of Section 2(a)(19) of the 1940 Act) of the Trust because he is an officer of the Adviser to the Trust, and an officer and a director of Invesco Ltd., ultimate parent of the Adviser. |
| |
2 Mr. Taylor is considered an interested person (within the meaning of Section 2(a)(19) of the 1940 Act) of the Trust because he is an officer of Invesco Ltd., ultimate parent of the Adviser. |
54 INVESCO OPPENHEIMER INTERNATIONAL EQUITY FUND
| | | | | | | | |
| | | | | |
Name, Year of Birth and Position(s) Held with the Trust | | Trustee
and/or
Officer
Since | | Principal Occupation(s) During Past 5 Years | | Number of Funds in Fund Complex
Overseen by Trustee | | Other Directorship(s)
Held by Trustee During Past 5 Years |
| | | | | |
| INTERESTED PERSONS (CONTINUED) | | | | | | | | |
| | | | | |
| Philip A. Taylor (Continued) | | | | Director and Chairman, Invesco Investment Services, Inc. (formerly known as Invesco AIM Investment Services, Inc.) (registered transfer agent); Chief Executive Officer, Invesco Corporate Class Inc. (corporate mutual fund company); Chairman and Chief Executive Officer, Invesco Canada Ltd. (formerly known as Invesco Trimark Ltd./Invesco Trimark Ltèe) (registered investment adviser and registered transfer agent); Senior Vice President, The Invesco Funds; Director, Invesco Investment Advisers LLC (formerly known as Van Kampen Asset Management); Director, Chairman, Chief Executive Officer and President, Invesco Management Group, Inc. (formerly known as Invesco AIM Management Group, Inc.) (financial services holding company);Co-Chairman,Co-President andCo-Chief Executive Officer, Invesco Advisers, Inc. (formerly known as Invesco Institutional (N.A.), Inc.) (registered investment adviser); Director, Chief Executive Officer and President, Van Kampen Exchange Corp; President and Principal Executive Officer, The Invesco Funds (other than AIM Treasurer’s Series Trust (Invesco Treasurer’s Series Trust), Short-Term Investments Trust and Invesco Management Trust); Executive Vice President, The Invesco Funds (AIM Treasurer’s Series Trust (Invesco Treasurer’s Series Trust), Short-Term Investments Trust and Invesco Management Trust only); Director and President, INVESCO Funds Group, Inc. (registered investment adviser and registered transfer agent); Director and Chairman, IVZ Distributors, Inc. (formerly known as INVESCO Distributors, Inc.) (registered broker dealer); Director, President and Chairman, Invesco Inc. (holding company), Invesco Canada Holdings Inc. (holding company), Trimark Investments Ltd./Placements Trimark Ltèe and Invesco Financial Services Ltd/Services Financiers Invesco Ltèe; Chief Executive Officer, Invesco Canada Fund Inc. (corporate mutual fund company); Director and Chairman, Van Kampen Investor Services Inc.; Director, Chief Executive Officer and President, 1371 Preferred Inc. (holding | | | | |
55 INVESCO OPPENHEIMER INTERNATIONAL EQUITY FUND
TRUSTEES AND OFFICERSContinued
| | | | | | | | |
| | | | | |
Name, Year of Birth and Position(s) Held with the Trust | | Trustee
and/or
Officer
Since | | Principal Occupation(s) During Past 5 Years | | Number of Funds in Fund Complex
Overseen by Trustee | | Other Directorship(s)
Held by Trustee During Past 5 Years |
| | | | | |
| INTERESTED PERSONS (CONTINUED) | | | | | | | | |
| | | | | |
| Philip A. Taylor (Continued) | | | | company) and Van Kampen Investments Inc.; Director and President, AIM GP Canada Inc. (general partner for limited partnerships) and Van Kampen Advisors, Inc.; Director and Chief Executive Officer, Invesco Trimark Dealer Inc. (registered broker dealer); Director, Invesco Distributors, Inc. (formerly known as Invesco AIM Distributors, Inc.) (registered broker dealer); Manager, Invesco Capital Management LLC; Director, Chief Executive Officer and President, Invesco Advisers, Inc.; Director, Chairman, Chief Executive Officer and President, Invesco AIM Capital Management, Inc.; President, Invesco Trimark Dealer Inc. and Invesco Trimark Ltd./Invesco Trimark Ltèe; Director and President, AIM Trimark Corporate Class Inc. and AIM Trimark Canada Fund Inc.; Senior Managing Director, Invesco Holding Company Limited; Director and Chairman, Fund Management Company (former registered broker dealer); President and Principal Executive Officer, The Invesco Funds (AIM Treasurer’s Series Trust (Invesco Treasurer’s Series Trust), and Short-Term Investments Trust only); President, AIM Trimark Global Fund Inc. and AIM Trimark Canada Fund Inc. | | | | |
56 INVESCO OPPENHEIMER INTERNATIONAL EQUITY FUND
| | | | | | | | |
| | | | | |
Name, Year of Birth and Position(s) Held with the Trust | | Trustee
and/or
Officer
Since | | Principal Occupation(s) During Past 5 Years | | Number of Funds in Fund Complex
Overseen by Trustee | | Other Directorship(s)
Held by Trustee During Past 5 Years |
| | | | | |
| INDEPENDENT TRUSTEES | | | | | | | | |
| | | | | |
Bruce L. Crockett – 1944 Trustee and Chair | | 2003 | | Chairman, Crockett Technologies Associates (technology consulting company) Formerly: Director, Captaris (unified messaging provider); Director, President and Chief Executive Officer, COMSAT Corporation; Chairman, Board of Governors of INTELSAT (international communications company); ACE Limited (insurance company); Independent Directors Council and Investment Company Institute: Member of the Audit Committee, Investment Company Institute; Member of the Executive Committee and Chair of the Governance Committee, Independent Directors Council | | 229 | | Director and Chairman of the Audit Committee, ALPS (Attorneys Liability Protection Society) (insurance company); Director and Member of the Audit Committee and Compensation Committee, Ferroglobe PLC (metallurgical company) |
| | | | | |
David C. Arch – 1945 Trustee | | 2010 | | Chairman of Blistex Inc. (consumer health care products manufacturer); Member, World Presidents’ Organization | | 229 | | Board member of the Illinois Manufacturers’ Association |
| | | | | |
Beth Ann Brown – 1968 Trustee | | 2019 | | Independent Consultant Formerly: Head of Intermediary Distribution, Managing Director, Strategic Relations, Managing Director, Head of National Accounts, Senior Vice President, National Account Manager and Senior Vice President, Key Account Manager, Columbia Management Investment Advisers LLC; Vice President, Key Account Manager, Liberty Funds Distributor, Inc.; and Trustee of certain Oppenheimer Funds | | 229 | | Director, Board of Directors of Caron Engineering Inc.; Advisor, Board of Advisors of Caron Engineering Inc.; President and Director, of Acton Shapleigh Youth Conservation Corps (non-profit); and Vice President and Director of Grahamtastic Connection (non-profit) |
| | | | | |
Jack M. Fields – 1952 Trustee | | 2003 | | Chief Executive Officer, Twenty First Century Group, Inc. (government affairs company); and Chairman, Discovery Learning Alliance(non-profit) Formerly: Owner and Chief Executive Officer, Dos Angeles Ranch L.P. (cattle, hunting, corporate entertainment); Director, Insperity, Inc. (formerly known as Administaff) (human resources provider); Chief Executive Officer, Texana Timber LP (sustainable forestry company); Director of Cross Timbers Quail Research Ranch(non-profit); and member of the U.S. House of Representatives | | 229 | | None |
57 INVESCO OPPENHEIMER INTERNATIONAL EQUITY FUND
TRUSTEES AND OFFICERSContinued
| | | | | | | | |
| | | | | |
Name, Year of Birth and Position(s) Held with the Trust | | Trustee
and/or
Officer
Since | | Principal Occupation(s) During Past 5 Years | | Number of Funds in Fund Complex
Overseen by Trustee | | Other Directorship(s)
Held by Trustee During Past 5 Years |
| | | | | |
| INDEPENDENT TRUSTEES (CONTINUED) | | | | | | | | |
| | | | | |
Cynthia Hostetler — 1962 Trustee | | 2017 | | Non-Executive Director and Trustee of a number of public and private business corporations Formerly: Director, Aberdeen Investment Funds (4 portfolios); Head of Investment Funds and Private Equity, Overseas Private Investment Corporation; President, First Manhattan Bancorporation, Inc.; Attorney, Simpson Thacher & Bartlett LLP | | 229 | | Vulcan Materials Company (construction materials company); Trilinc Global Impact Fund; Genesee & Wyoming, Inc. (railroads); Artio Global Investment LLC (mutual fund complex); Edgen Group, Inc. (specialized energy and infrastructure products distributor); Investment Company Institute (professional organization); Independent Directors Council (professional organization) |
| | | | | |
Eli Jones – 1961 Trustee | | 2016 | | Professor and Dean, Mays Business School - Texas A&M University Formerly: Professor and Dean, Walton College of Business, University of Arkansas and E.J. Ourso College of Business, Louisiana State University; Director, Arvest Bank | | 229 | | Insperity, Inc. (formerly known as Administaff) (human resources provider) |
| | | | | |
Elizabeth Krentzman – 1959 Trustee | | 2019 | | Formerly: Principal and Chief Regulatory Advisor for Asset Management Services and U.S. Mutual Fund Leader of Deloitte & Touche LLP; General Counsel of the Investment Company Institute (trade association); National Director of the Investment Management Regulatory Consulting Practice, Principal, Director and Senior Manager of Deloitte & Touche LLP; Assistant Director of the Division of Investment Management - Office of Disclosure and Investment Adviser Regulation of the U.S. Securities and Exchange Commission and various positions with the Division of Investment Management – Office of Regulatory Policy of the U.S. Securities and Exchange Commission; Associate at Ropes & Gray LLP.; Advisory Board Member of the Securities and Exchange Commission Historical Society; and Trustee of certain Oppenheimer Funds | | 229 | | Trustee of the University of Florida National Board Foundation and Audit Committee Member; Member of the Cartica Funds Board of Directors (private investment funds); Member of the University of Florida Law Center Association, Inc. Board of Trustees and Audit Committee Member |
58 INVESCO OPPENHEIMER INTERNATIONAL EQUITY FUND
| | | | | | | | |
| | | | | |
Name, Year of Birth and Position(s) Held with the Trust | | Trustee
and/or
Officer
Since | | Principal Occupation(s) During Past 5 Years | | Number of Funds in Fund Complex
Overseen by Trustee | | Other Directorship(s)
Held by Trustee During Past 5 Years |
| | | | | |
| INDEPENDENT TRUSTEES (CONTINUED) | | | | | | | | |
| | | | | |
Anthony J. LaCava, Jr. – 1956 Trustee | | 2019 | | Formerly: Director and Member of the Audit Committee, Blue Hills Bank (publicly traded financial institution) and Managing Partner, KPMG LLP | | 229 | | Blue Hills Bank; Chairman of Bentley University; Member, Business School Advisory Council; and Nominating Committee, KPMG LLP |
| | | | | |
Prema Mathai-Davis – 1950 Trustee | | 2003 | | Retired Co-Owner & Partner of Quantalytics Research, LLC, (a FinTech Investment Research Platform for the Self-Directed Investor) | | 229 | | None |
| | | | | |
Joel W. Motley – 1952 Trustee | | 2019 | | Director of Office of Finance, Federal Home Loan Bank; Member of the Vestry of Trinity Wall Street; Managing Director of Carmona Motley Hoffman, Inc. (privately held financial advisor); Member of the Finance and Budget Committee of the Council on Foreign Relations, Member of the Investment Committee and Board of Human Rights Watch and Member of the Investment Committee and Board of Historic Hudson Valley (non-profit cultural organization). Formerly: Managing Director of Public Capital Advisors, LLC (privately held financial advisor); Managing Director of Carmona Motley Hoffman, Inc. (privately held financial advisor); Trustee of certain Oppenheimer Funds; and Director of Columbia Equity Financial Corp. (privately held financial advisor) | | 229 | | Director of Greenwall Foundation (bioethics research foundation); Member of Board and Investment Committee of The Greenwall Foundation; Director of Southern Africa Legal Services Foundation; Board Member and Investment Committee Member of Pulitzer Center for Crisis Reporting(non-profit journalism) |
| | | | | |
Teresa M. Ressel — 1962 Trustee | | 2017 | | Non-executive director and trustee of a number of public and private business corporations Formerly: Chief Financial Officer, Olayan America, The Olayan Group (international investor/commercial/industrial); Chief Executive Officer, UBS Securities LLC; Group Chief Operating Officer, Americas, UBS AG; Assistant Secretary for Management & Budget and CFO, US Department of the Treasury | | 229 | | Atlantic Power Corporation (power generation company); ON Semiconductor Corp. (semiconductor supplier) |
| | | | | |
Ann Barnett Stern – 1957 Trustee | | 2017 | | President and Chief Executive Officer, Houston Endowment Inc. (private philanthropic institution) Formerly: Executive Vice President and General Counsel, Texas Children’s Hospital; | | 229 | | Federal Reserve Bank of Dallas |
59 INVESCO OPPENHEIMER INTERNATIONAL EQUITY FUND
TRUSTEES AND OFFICERSContinued
| | | | | | | | |
| | | | | |
Name, Year of Birth and Position(s) Held with the Trust | | Trustee
and/or
Officer
Since | | Principal Occupation(s) During Past 5 Years | | Number of Funds in Fund Complex
Overseen by Trustee | | Other Directorship(s)
Held by Trustee During Past 5 Years |
| | | | | |
| INDEPENDENT TRUSTEES (CONTINUED) | | | | | | | | |
| | | | | |
| Ann Barnett Stern (Continued) | | | | Attorney, Beck, Redden and Secrest, LLP; Business Law Instructor, University of St. Thomas; Attorney, Andrews & Kurth LLP | | | | |
| | | | | |
Raymond Stickel, Jr. – 1944 Trustee | | 2005 | | Retired Formerly: Director, Mainstay VP Series Funds, Inc. (25 portfolios); Partner, Deloitte & Touche | | 229 | | None |
| | | | | |
Robert C. Troccoli – 1949 Trustee | | 2016 | | Retired Formerly: Adjunct Professor, University of Denver – Daniels College of Business, Senior Partner, KPMG LLP | | 229 | | None |
| | | | | |
Daniel S. Vandivort – 1954 Trustee | | 2019 | | Treasurer, Chairman of the Audit and Finance Committee, and Trustee, Board of Trustees, Huntington Disease Foundation of America; and President, Flyway Advisory Services LLC (consulting and property management). Formerly: Trustee and Governance Chair, of certain Oppenheimer Funds | | 229 | | Chairman and Lead Independent Director, Chairman of the Audit Committee, and Director, Board of Directors, Value Line Funds |
| | | | | |
James D. Vaughn – 1945 Trustee | | 2019 | | Retired Formerly: Managing Partner, Deloitte & Touche LLP; Trustee and Chairman of the Audit Committee, Schroder Funds; Board Member, Mile High United Way, Boys and Girls Clubs, Boy Scouts, Colorado Business Committee for the Arts, Economic Club of Colorado and Metro Denver Network (economic development corporation); and Trustee of certain Oppenheimer Funds | | 229 | | Board member and Chairman of Audit Committee of AMG National Trust Bank; Trustee and Investment Committee member, University of South Dakota Foundation; Board member, Audit Committee Member and past Board Chair, Junior Achievement(non-profit) |
| | | | | |
Christopher L. Wilson – 1957 Trustee, Vice Chair and Chair Designate | | 2017 | | Retired Formerly: Director, TD Asset Management USA Inc. (mutual fund complex) (22 portfolios); Managing Partner, CT2, LLC (investing and consulting firm); President/Chief Executive Officer, Columbia Funds, Bank of America Corporation; President/Chief Executive Officer, CDC IXIS Asset Management Services, Inc.; Principal & Director of Operations, Scudder Funds, Scudder, Stevens & Clark, Inc.; Assistant Vice President, Fidelity Investments | | 229 | | ISO New England, Inc.(non-profit organization managing regional electricity market) |
60 INVESCO OPPENHEIMER INTERNATIONAL EQUITY FUND
| | | | | | | | |
| | | | | |
Name, Year of Birth and Position(s) Held with the Trust | | Trustee
and/or
Officer
Since | | Principal Occupation(s) During Past 5 Years | | Number of Funds in Fund Complex
Overseen by Trustee | | Other Directorship(s)
Held by Trustee During Past 5 Years |
| | | | | |
| OTHER OFFICERS | | | | | | | | |
| | | | | |
Sheri Morris — 1964 President, Principal Executive Officer and Treasurer | | 2003 | | Head of Global Fund Services, Invesco Ltd.; President, Principal Executive Officer and Treasurer, The Invesco Funds; Vice President, Invesco Advisers, Inc. (formerly known as Invesco Institutional (N.A.), Inc.) (registered investment adviser); and Vice President, Invesco Exchange-Traded Fund Trust, Invesco Exchange-Traded Fund Trust II, Invesco India Exchange-Traded Fund Trust, Invesco Actively Managed Exchange-Traded Fund Trust, Invesco Actively Managed Exchange-Traded Commodity Fund Trust and Invesco Exchange-Traded Self-Indexed Fund Trust, and Vice President, OppenheimerFunds, Inc. Formerly: Vice President and Principal Financial Officer, The Invesco Funds; Vice President, Invesco AIM Advisers, Inc., Invesco AIM Capital Management, Inc. and Invesco AIM Private Asset Management, Inc.; Assistant Vice President and Assistant Treasurer, The Invesco Funds and Assistant Vice President, Invesco Advisers, Inc., Invesco AIM Capital Management, Inc. and Invesco AIM Private Asset Management, Inc.; and Treasurer, Invesco Exchange-Traded Fund Trust, Invesco Exchange-Traded Fund Trust II, Invesco India Exchange-Traded Fund Trust and Invesco Actively Managed Exchange-Traded Fund Trust | | N/A | | N/A |
| | | | | |
Russell C. Burk — 1958 Senior Vice President and Senior Officer | | 2005 | | Senior Vice President and Senior Officer, The Invesco Funds | | N/A | | N/A |
| | | | | |
Jeffrey H. Kupor – 1968 Senior Vice President, Chief Legal Officer and Secretary | | 2018 | | Head of Legal of the Americas, Invesco Ltd.; Senior Vice President and Secretary, Invesco Advisers, Inc. (formerly known as Invesco Institutional (N.A.), Inc.) (registered investment adviser); Senior Vice President and Secretary, Invesco Distributors, Inc. (formerly known as Invesco AIM Distributors, Inc.); Vice President and Secretary, Invesco Investment Services, Inc. (formerly known as Invesco AIM Investment Services, Inc.) Senior Vice President, Chief Legal Officer and Secretary, The Invesco Funds; Secretary and General Counsel, Invesco Investment Advisers LLC (formerly known as Van Kampen Asset Management); Secretary and General Counsel, Invesco Capital Markets, Inc. (formerly known as Van Kampen Funds Inc.) and Chief Legal | | N/A | | N/A |
61 INVESCO OPPENHEIMER INTERNATIONAL EQUITY FUND
TRUSTEES AND OFFICERSContinued
| | | | | | | | |
| | | | | |
Name, Year of Birth and Position(s) Held with the Trust | | Trustee
and/or
Officer
Since | | Principal Occupation(s) During Past 5 Years | | Number of Funds in Fund Complex
Overseen by Trustee | | Other Directorship(s)
Held by Trustee During Past 5 Years |
| | | | | |
| OTHER OFFICERS (CONTINUED) | | | | | | | | |
| | | | | |
| Jeffrey H. Kupor (Continued) | | | | Officer, Invesco Exchange-Traded Fund Trust, Invesco Exchange-Traded Fund Trust II, Invesco India Exchange-Traded Fund Trust, Invesco Actively Managed Exchange-Traded Fund Trust, Invesco Actively Managed Exchange-Traded Commodity Fund Trust and Invesco Exchange-Traded Self-Indexed Fund Trust; Secretary, Invesco Indexing LLC; Secretary, W.L. Ross & Co., LLC Formerly: Secretary and Vice President, Jemstep, Inc.; Head of Legal, Worldwide Institutional, Invesco Ltd.; Secretary and General Counsel, INVESCO Private Capital Investments, Inc.; Senior Vice President, Secretary and General Counsel, Invesco Management Group, Inc. (formerly known as Invesco AIM Management Group, Inc.); Assistant Secretary, INVESCO Asset Management (Bermuda) Ltd.; Secretary and General Counsel, Invesco Private Capital, Inc.; Assistant Secretary and General Counsel, INVESCO Realty, Inc.; Secretary and General Counsel, Invesco Senior Secured Management, Inc.; and Secretary, Sovereign G./P. Holdings Inc. | | | | |
| | | | | |
Andrew R. Schlossberg – 1974 Senior Vice President | | 2019 | | Head of the Americas and Senior Managing Director, Invesco Ltd.; Director and Senior Vice President, Invesco Advisers, Inc. (formerly known as Invesco Institutional (N.A.), Inc.) (registered investment adviser); Director and Chairman, Invesco Investment Services, Inc. (formerly known as Invesco AIM Investment Services, Inc.) (registered transfer agent); Senior Vice President, The Invesco Funds; Director, Invesco Investment Advisers LLC (formerly known as Van Kampen Asset Management); Director, President and Chairman, Invesco Insurance Agency, Inc. Formerly: Director, Invesco UK Limited; Director and Chief Executive, Invesco Asset Management Limited and Invesco Fund Managers Limited; Assistant Vice President, The Invesco Funds; Senior Vice President, Invesco Advisers, Inc. (formerly known as Invesco Institutional (N.A.), Inc.) (registered investment adviser); Director and Chief Executive, Invesco Administration Services | | N/A | | N/A |
62 INVESCO OPPENHEIMER INTERNATIONAL EQUITY FUND
| | | | | | | | |
| | | | | |
Name, Year of Birth and Position(s) Held with the Trust | | Trustee
and/or
Officer
Since | | Principal Occupation(s) During Past 5 Years | | Number of Funds in Fund Complex
Overseen by Trustee | | Other Directorship(s)
Held by Trustee During Past 5 Years |
| | | | | |
| OTHER OFFICERS (CONTINUED) | | | | | | | | |
| | | | | |
| Andrew R. Schlossberg (Continued) | | | | Limited and Invesco Global Investment Funds Limited; Director, Invesco Distributors, Inc.; Head of EMEA, Invesco Ltd.; President, Invesco Actively Managed Exchange-Traded Commodity Fund Trust, Invesco Actively Managed Exchange-Traded Fund Trust, Invesco Exchange-Traded Fund Trust, Invesco Exchange-Traded Fund Trust II and Invesco India Exchange-Traded Fund Trust; Managing Director and Principal Executive Officer, Invesco Capital Management LLC | | | | |
| | | | | |
John M. Zerr — 1962 Senior Vice President | | 2006 | | Chief Operating Officer of the Americas; Senior Vice President, Invesco Advisers, Inc. (formerly known as Invesco Institutional (N.A.), Inc.) (registered investment adviser); Senior Vice President, Invesco Distributors, Inc. (formerly known as Invesco AIM Distributors, Inc.); Director and Vice President, Invesco Investment Services, Inc. (formerly known as Invesco AIM Investment Services, Inc.) Senior Vice President, The Invesco Funds; Managing Director, Invesco Capital Management LLC; Director, Invesco Investment Advisers LLC (formerly known as Van Kampen Asset Management); Senior Vice President, Invesco Capital Markets, Inc. (formerly known as Van Kampen Funds Inc.); Manager, Invesco Indexing LLC; Manager, Invesco Specialized Products, LLC; Director and Senior Vice President, Invesco Insurance Agency, Inc.; Member, Invesco Canada Funds Advisory Board; Director, President and Chief Executive Officer, Invesco Corporate Class Inc. (corporate mutual fund company); and Director, Chairman, President and Chief Executive Officer, Invesco Canada Ltd. (formerly known as Invesco Trimark Ltd./Invesco Trimark Ltèe) (registered investment adviser and registered transfer agent) Formerly: Director and Senior Vice President, Invesco Management Group, Inc. (formerly known as Invesco AIM Management Group, Inc.); Secretary and General Counsel, Invesco Management Group, Inc. (formerly known as Invesco AIM Management Group, Inc.); Secretary, Invesco Investment Services, Inc. (formerly known as Invesco AIM Investment Services, Inc.); Chief Legal Officer and | | N/A | | N/A |
63 INVESCO OPPENHEIMER INTERNATIONAL EQUITY FUND
TRUSTEES AND OFFICERSContinued
| | | | | | | | |
| | | | | |
Name, Year of Birth and Position(s) Held with the Trust | | Trustee
and/or
Officer
Since | | Principal Occupation(s) During Past 5 Years | | Number of Funds in Fund Complex
Overseen by Trustee | | Other Directorship(s)
Held by Trustee During Past 5 Years |
| | | | | |
| OTHER OFFICERS (CONTINUED) | | | | | | | | |
| | | | | |
| John M. Zerr (Continued) | | | | Secretary, The Invesco Funds; Secretary and General Counsel, Invesco Investment Advisers LLC (formerly known as Van Kampen Asset Management); Secretary and General Counsel, Invesco Capital Markets, Inc. (formerly known as Van Kampen Funds Inc.); Chief Legal Officer, Invesco Exchange-Traded Fund Trust, Invesco Exchange-Traded Fund Trust II, Invesco India Exchange-Traded Fund Trust, Invesco Actively Managed Exchange-Traded Fund Trust, Invesco Actively Managed Exchange-Traded Commodity Fund Trust and Invesco Exchange-Traded Self-Indexed Fund Trust; Secretary, Invesco Indexing LLC; Director, Secretary, General Counsel and Senior Vice President, Van Kampen Exchange Corp.; Director, Vice President and Secretary, IVZ Distributors, Inc. (formerly known as INVESCO Distributors, Inc.); Director and Vice President, INVESCO Funds Group, Inc.; Director and Vice President, Van Kampen Advisors Inc.; Director, Vice President, Secretary and General Counsel, Van Kampen Investor Services Inc.; Director and Secretary, Invesco Distributors, Inc. (formerly known as Invesco AIM Distributors, Inc.); Director, Senior Vice President, General Counsel and Secretary, Invesco AIM Advisers, Inc. and Van Kampen Investments Inc.; Director, Vice President and Secretary, Fund Management Company; Director, Senior Vice President, Secretary, General Counsel and Vice President, Invesco AIM Capital Management, Inc.; Chief Operating Officer and General Counsel, Liberty Ridge Capital, Inc. (an investment adviser) | | | | |
| | | | | |
Gregory G. McGreevey - 1962 Senior Vice President | | 2012 | | Senior Managing Director, Invesco Ltd.; Director, Chairman, President, and Chief Executive Officer, Invesco Advisers, Inc. (formerly known as Invesco Institutional (N.A.), Inc.) (registered investment adviser); Director, Invesco Mortgage Capital, Inc. and Invesco Senior Secured Management, Inc.; and Senior Vice President, The Invesco Funds; and President, SNW Asset Management Corporation Formerly: Senior Vice President, Invesco | | N/A | | N/A |
64 INVESCO OPPENHEIMER INTERNATIONAL EQUITY FUND
| | | | | | | | |
| | | | | |
Name, Year of Birth and Position(s) Held with the Trust | | Trustee
and/or
Officer
Since | | Principal Occupation(s) During Past 5 Years | | Number of Funds in Fund Complex
Overseen by Trustee | | Other Directorship(s)
Held by Trustee During Past 5 Years |
| | | | | |
| OTHER OFFICERS (CONTINUED) | | | | | | | | |
| | | | | |
| Gregory G. McGreevey (Continued) | | | | Management Group, Inc. and Invesco Advisers, Inc.; Assistant Vice President, The Invesco Funds | | | | |
| | | | | |
Kelli Gallegos – 1970 Vice President, Principal Financial Officer and Assistant Treasurer | | 2008 | | Principal Financial and Accounting Officer – Investments Pool, Invesco Specialized Products, LLC; Vice President, Principal Financial Officer and Assistant Treasurer, The Invesco Funds; Principal Financial and Accounting Officer – Pooled Investments, Invesco Capital Management LLC; Vice President and Treasurer, Invesco Exchange-Traded Fund Trust, Invesco Exchange-Traded Fund Trust II, Invesco India Exchange-Traded Fund Trust, Invesco Actively Managed Exchange-Traded Fund Trust, Invesco Actively Managed Exchange-Traded Commodity Fund Trust and Invesco Exchange-Traded Self-Indexed Fund Trust Formerly: Assistant Treasurer, Invesco Specialized Products, LLC; Assistant Treasurer, Invesco Exchange-Traded Fund Trust, Invesco Exchange-Traded Fund Trust II, Invesco India Exchange-Traded Fund Trust, Invesco Actively Managed Exchange-Traded Fund Trust, Invesco Actively Managed Exchange-Traded Commodity Fund Trust and Invesco Exchange-Traded Self-Indexed Fund Trust; Assistant Treasurer, Invesco Capital Management LLC; Assistant Vice President, The Invesco Funds | | N/A | | N/A |
| | | | | |
Crissie M. Wisdom – 1969 Anti-Money Laundering Compliance Officer | | 2013 | | Anti-Money Laundering Compliance Officer, Invesco Advisers, Inc. (formerly known as Invesco Institutional (N.A.), Inc.) (registered investment adviser), Invesco Capital Markets, Inc. (formerly known as Van Kampen Funds Inc.), Invesco Distributors, Inc., Invesco Investment Services, Inc., The Invesco Funds, and Invesco Exchange-Traded Fund Trust, Invesco Exchange-Traded Fund Trust II, Invesco India Exchange-Traded Fund Trust, Invesco Actively Managed Exchange-Traded Fund Trust, Invesco Actively Managed Exchange-Traded Commodity Fund Trust and Invesco Exchange-Traded Self-Indexed Fund Trust; Anti-Money Laundering Compliance Officer and Bank Secrecy Act Officer, INVESCO National Trust Company and Invesco Trust Company; and Fraud Prevention Manager and | | N/A | | N/A |
65 INVESCO OPPENHEIMER INTERNATIONAL EQUITY FUND
TRUSTEES AND OFFICERSContinued
| | | | | | | | |
| | | | | |
Name, Year of Birth and Position(s) Held with the Trust | | Trustee
and/or
Officer
Since | | Principal Occupation(s) During Past 5 Years | | Number of Funds in Fund Complex
Overseen by Trustee | | Other Directorship(s)
Held by Trustee During Past 5 Years |
| | | | | |
| OTHER OFFICERS (CONTINUED) | | | | | | | | |
| | | | | |
Crissie M. Wisdom (Continued) | | | | Controls and Risk Analysis Manager for Invesco Investment Services, Inc. Formerly: Anti-Money Laundering Compliance Officer, Van Kampen Exchange Corp. and Invesco Management Group, Inc. | | | | |
| | | | | |
| Robert R. Leveille – 1969 Chief Compliance Officer | | 2016 | | Chief Compliance Officer, Invesco Advisers, Inc. (registered investment adviser); and Chief Compliance Officer, The Invesco Funds Formerly: Chief Compliance Officer, Putnam Investments and the Putnam Funds | | N/A | | N/A |
The Statement of Additional Information of the Trust includes additional information about the Fund’s Trustees and is available upon request, without charge, by calling 1.800.959.4246. Please refer to the Fund’s Statement of Additional Information for information on the Fund’ssub-advisers.
| | | | | | |
| Office of the Fund | | Investment Adviser | | Distributor | | Auditors |
| 11 Greenway Plaza, | | Invesco Advisers, Inc. | | Invesco Distributors, Inc. | | PricewaterhouseCoopers |
| Suite 1000 | | 1555 Peachtree Street, N.E. | | 11 Greenway Plaza, | | LLP |
| Houston, TX 77046-1173 | | Atlanta, GA 30309 | | Suite 1000 | | 1000 Louisiana Street, |
| | | | Houston, TX | | Suite 5800 |
| | | | 77046-1173 | | Houston, TX 77002-5021 |
| | | |
| Counsel to the Fund | | Counsel to the | | Transfer Agent | | Custodian |
| Stradley Ronon Stevens & Young, | | Independent Trustees | | Invesco Investment | | Citibank, N.A. |
| LLP | | Goodwin Procter LLP | | Services, Inc. | | 111 Wall Street |
| 2005 Market Street, | | 901 New York Avenue, N.W. | | 11 Greenway Plaza, | | New York, NY 10005 |
| Suite 2600 | | Washington, D.C. 20001 | | Suite 1000 | | |
| Philadelphia, PA 19103-7018 | | | | Houston, TX | | |
| | | | 77046-1173 | | |
66 INVESCO OPPENHEIMER INTERNATIONAL EQUITY FUND
Invesco recognizes the importance of protecting your personal and financial information when you visit our website located atwww.invesco.com (the “Website”). The following information is designed to help you understand the information collection practices at this Website. We will not sell, share or rent your personally identifiable information to others in contravention of this Privacy Policy. When we refer to ourselves as “we” or “Invesco” in this Privacy Policy, we mean our entire company including our affiliates, such as subsidiaries.
By visiting this Website, you are accepting the practices described in this Privacy Policy. If you do not agree to this policy, you may not use this Website. This Privacy Policy is subject to change without notice, from time to time in our sole discretion. You acknowledge that by accessing the Website after we have posted changes to this Privacy Policy, you are agreeing to this Privacy Policy as modified. Please review the Terms of Use1 to learn of other terms and conditions applicable to your use of the Website.
Please note that this Privacy Policy is not an exclusive statement of our privacy principles across all products and services. Other privacy principles or policies may apply depending on the products or services you obtain from Invesco, or the jurisdiction in which you transact with Invesco.
This Privacy Policy was last updated on May 6, 2018.
Information We Collect and Use
We collect personal information you choose to submit to the Website in order to process transactions requested by you and meet our contractual obligations. For example, you can choose to provide your name, contact information, social security number, or tax identification number in connection with accessing your account, or you can choose to provide your personal information when you fill out a secure account question form. Any information collected about you from the Website can, from time to time, be associated with other identifying information we have about you.
In addition, we may gather information about you automatically through your use of the Website, e.g. your IP address, how you navigate the Website, the organization from which you are accessing the Website, and the websites that you access before and after you visit the Website.
When you access the Website, we may also collect information such as unique device identifiers, your screen resolution and other device settings, information about your location, and analytical information about how you use the device from which you are viewing the Website. Where applicable, we may ask your permission before collecting certain information, such as precise geolocation information.
From time to time, we use or augment the personal information we have about you with information obtained from third parties. For example, we use third party information to confirm contact or financial information or to better understand your interests by associating demographic information from third parties with the information you have provided.
How We Use Personal Information
We use your personal information to respond to your inquiries and provide the products and services you request. We also use your information from time to time to deliver the content and services we believe
1NTD
67 INVESCO OPPENHEIMER INTERNATIONAL EQUITY FUND
| | |
| | INVESCO’S PRIVACY NOTICEContinued |
you will find the most relevant and to provide customer service and support.
We also use the information you provide to further develop and improve our products and services. We aggregate and/orde-identify data about visitors to the Website for various business purposes including product and service development and improvement activities.
How We Share Personal Information
We collaborate with other companies and individuals to perform services for us and on our behalf and we collaborate with our affiliates, other companies and individuals with respect to particular products or services (“Providers”). Examples of Providers include data analysis firms, customer service and support providers, email and SMS vendors, andweb-hosting and development companies. Some Providers collect information for us or on our behalf on our Website. These Providers can be provided with access to personal information needed to perform their functions.
We reserve the right to disclose your personal information as required by law, when we believe disclosure is necessary to comply with a regulatory requirement, judicial proceeding, court order or legal process served on us, to protect the safety, rights or property of our customers, the public or Invesco or to enforce the Terms of Use.
If we sell or transfer a business unit (such as a subsidiary) or an asset (such as a website) to another company, we will share your personal information with such company. You will receive notice of such an event and the new entity will inform you of any changes to the practices in this Privacy Policy. If the new entity wishes to make additional use of your information, you have the right to decline such use at that time.
We occasionally disclose aggregate orde-identified data that is not personally identifiable with third parties.
Cookies and Other Tools
Invesco and its Providers collect information about you by using cookies, tracking pixels and other technologies. We use this information to better understand, customize and improve user experience with our websites, services and offerings as well as to manage our advertising. For example, we use web analytics services that use these technologies to gather information to help us understand how visitors engage with and navigate our Website, e.g., how and when pages in a site are visited and by how many visitors. We are also able to offer our visitors a more customized, relevant experience on our sites using these technologies by delivering content and functionality based on your preferences and interests.
Depending on their purpose, some cookies will only operate for the length of a single browsing session, while others have a longer life span to ensure that they fulfill their longer-term purposes. Your web browser can be set to allow you to control whether you will accept cookies or reject cookies, to notify you each time a cookie is sent to your browser, or to delete cookies that have already been set. If your browser is set to reject cookies, certain aspects of the Website that are cookie-enabled will not recognize you when you return to the website, and some Website functionality may be lost. The “Help” section of your browser may tell you how to prevent your browser from accepting cookies. To find out more about cookies, visitwww.aboutcookies.org.
68 INVESCO OPPENHEIMER INTERNATIONAL EQUITY FUND
Security
No data transmission over the internet can be 100% secure, so Invesco cannot ensure or warrant the security of any information you submit to us on this Website. However, Invesco seeks to protect your personal information from unauthorized access or use when you transact business on our Website using technical, administrative and procedural measures. Invesco makes no representation as to the reasonableness, efficacy, or appropriateness of the measures we use to safeguard such information.
Users are responsible for maintaining the secrecy of their own passwords. If you have reason to believe that your interaction with us is no longer secure (for example, if you feel that the security of any account you might have with us has been compromised), please immediately notify us by contacting us as specified below.
Transfer of Data to Other Countries
Any information you provide to Invesco through use of the Website may be stored and processed, transferred between and accessed from the United States, Canada and other countries which do not guarantee the same level of protection of personal information as the one in which you reside. However, Invesco will handle your personal information in accordance with this Privacy Policy regardless of where your personal information is stored/accessed.
Children’s Privacy
We are committed to protecting the privacy of children. We do not knowingly collect personal information from children under the age of 18. If you are under the age of 18, do not provide us with any personal information.
Contact Us
Please contact us if you have any questions or concerns about your personal information or require assistance in managing your choices.
Invesco Ltd.
1555 Peachtree St. NE
Atlanta, GA 30309
By phone:
(404)439-3236
By fax:
(404)962-8288
By email:
Anne.Gerry@invesco.com
Please update your account information by logging in or contact us by email or telephone as specified above to update your account information whenever such information ceases to be complete or accurate.
You may also contact us to:
69 INVESCO OPPENHEIMER INTERNATIONAL EQUITY FUND
| | |
| | INVESCO’S PRIVACY NOTICEContinued |
● Request that we amend, rectify, delete or update the personal data we hold about you;
● Where possible (e.g. in relation to marketing) amend or update your choices around processing;
● Request a copy of personal data held by us.
Disclaimer
Where the Website contains links to third-party websites/content/services that are not owned or controlled by Invesco, Invesco is not responsible for how these properties operate or treat your personal information so we recommend that you read the privacy policies and terms associated with these third party properties carefully.
70 INVESCO OPPENHEIMER INTERNATIONAL EQUITY FUND
THIS PAGE INTENTIONALLY LEFT BLANK.
| | |
Explore High-Conviction Investing with Invesco | | |
| |
 | | |
| |
Go paperless with eDelivery Visit invesco.com/edelivery to enjoy the convenience and security of anytime electronic access to your investment documents. With eDelivery, you can elect to have any or all of the following materials delivered straight to your inbox to download, save and print from your own computer: | | |
| |
∎ Fund reports and prospectuses ∎ Quarterly statements ∎ Daily confirmations ∎ Tax forms | | |
| |
Invesco mailing information Send general correspondence to Invesco Investment Services, Inc., P.O. Box 219078, Kansas City, MO64121-9078. | | |
| |
| |  |
| |
Invesco Distributors, Inc. | | O-IEQ-AR-1 12272019 |
| | |
| | | | |
 | | | | Shareholder Report for the Eleven Months Ended 10/31/2019 |
| | | | |
| | | | Invesco Oppenheimer International Growth Fund* Beginning on January 1, 2021, as permitted by regulations adopted by the Securities and Exchange Commission, paper copies of the Fund’s shareholder reports will no longer be sent by mail, unless you specifically request paper copies of the reports from the Fund or from your financial intermediary, such as a broker-dealer or bank. Instead, the reports will be made available on the Fund’s website, and you will be notified by mail each time a report is posted and provided with a website link to access the report. If you already elected to receive shareholder reports electronically, you will not be affected by this change and you need not take any action. You may elect to receive shareholder reports and other communications from the Fund electronically by contacting your financial intermediary (such as a broker-dealer or bank) or, if you are a direct investor, by enrolling at invesco. com/edelivery. You may elect to receive all future reports in paper free of charge. If you invest through a financial intermediary, you can contact your financial intermediary to request that you continue to receive paper copies of your shareholder reports. If you invest directly with the Fund, you can call 800 959 4246 to let the Fund know you wish to continue receiving paper copies of your shareholder reports. Your election to receive reports in paper will apply to all funds held with your financial intermediary or all funds held with the fund complex if you invest directly with the Fund. * Prior to the close of business on May 24, 2019, the Fund’s name was Oppenheimer International Growth Fund. See Important Update on the following page for more information. |
Important Update
On October 18, 2018, Massachusetts Mutual Life Insurance Company, an indirect corporate parent of OppenheimerFunds, Inc. and its subsidiaries OFI Global Asset Management, Inc., OFI SteelPath, Inc. and OFI Advisors, LLC, announced that it had entered into an agreement whereby Invesco Ltd., a global investment management company would acquire OppenheimerFunds and its subsidiaries (together, “OppenheimerFunds”). After the close of business on May 24, 2019 Invesco Ltd. completed the acquisition of OppenheimerFunds. This Fund was included in that acquisition and as of that date, became part of the Invesco family of funds. Please visit invesco.com for more information or call Invesco’s Client Services team at800-959-4246.
Table of Contents
Class A Shares
AVERAGE ANNUAL TOTAL RETURNS AT10/31/19
| | | | | | |
| | | Class A Shares of the Fund | | MSCI AC World ex-U.S.
Index |
| | | Without Sales Charge | | With Sales Charge |
| | | |
| 1-Year | | 12.86% | | 6.67% | | 11.27% |
| | | |
| 5-Year | | 4.09 | | 2.91 | | 3.82 |
| | | |
| 10-Year | | 6.73 | | 6.13 | | 4.94 |
Performance quoted is past performance and cannot guarantee comparable future results; current performance may be lower or higher. Visit invesco.com for the most recentmonth-end performance. Performance figures reflect reinvested distributions and changes in net asset value (NAV). Investment return and principal value will vary so that you may have a gain or a loss when you sell shares. Fund returns include changes in share price, reinvested distributions and a 5.50% maximum applicable sales charge except where “without sales charge” is indicated. Returns for periods of less than one year are cumulative and not annualized. As the result of a reorganization after the close of business on May 24, 2019, the returns of the Fund for periods on or prior to May 24, 2019 reflect performance of the Oppenheimer predecessor fund. Share class returns will differ from those of the predecessor fund because they have different expenses. Returns do not consider capital gains or income taxes on an individual’s investment. See Fund
3 INVESCO OPPENHEIMER INTERNATIONAL GROWTH FUND
prospectus and summary prospectus for more information on share classes, sales charges and new fee agreements, if any. Fund literature is available at invesco.com.
4 INVESCO OPPENHEIMER INTERNATIONAL GROWTH FUND
Fund Performance Discussion
The Fund’s Class A shares (without sales charge) returned 13.75% during the11-month period ended October 31, outperforming the MSCI All Country Worldex-US Index’s (the “Index”) return of 10.22%. The Fund outperformed the Index was largely the result of our usual underweight positions in the Materials and Financials sectors, and to our stock selection in the Health Care and Consumer Discretionary sectors. The Fund underperformed the Index in the Communication Services and Consumer Discretionary sectors due to stock selection and in the Utilities sector due to our usualnon-investment in it.
MARKET OVERVIEW
The past 11 months were mixed for global equities. After a difficult 4Q18, markets in total have done extremely well this year so far in the calendar year of 2019. The S & P Index in the US is up over 20% on the year, across Europe most bourses have posted high-teens returns, and emerging markets, which have certainly lagged developed markets recently, are up nearly 10%. Interest rates are, in our view, an important reason why this is occurring. Though investing
in a negative yielding bond is purely a speculation, investors are nonetheless doing so, and that makes dividends and cash flow all the more valuable. France, Germany, Sweden, the Netherlands, Switzerland, and Japan all have negative long-term bond yields. We would prefer to own a stock, especially one that is growing, than paying for the privilege of loaning money to a sovereign.
COMPARISON OF CHANGE IN VALUE OF $10,000 HYPOTHETICAL INVESTMENTS IN:
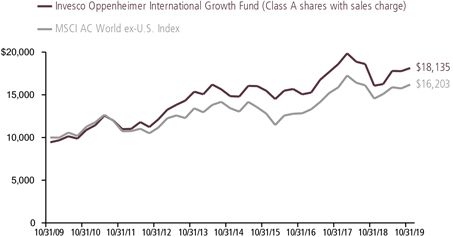
5 INVESCO OPPENHEIMER INTERNATIONAL GROWTH FUND
FUND REVIEW
We invest in companies that we think have the ability to can monetize long term structural trends in the economy and then hold them for a long period of time to benefit from the compounding of the returns they produce. With this approach, we can experience short term periods of underperformance compared to the broader market as investor sentiment and risk appetite fluctuates. We experienced such a period in the latter half of calendar 2018 when companies we own in the semiconductor value chain and in the automobile value chain experienced sharp corrections. Our semiconductor companies have rebounded sharply, contributing to our performance this fiscal year. The fundamentals in the automobile sector have deteriorated and, although our thesis that the car is becoming a computer on wheels remains intact, the medium-term profitability outlook for the industry is cloudy and we have reduced our exposure. Our scaled healthcare theme, which we added to the portfolio last year, is developing nicely. So are our investments in what we call deflationary software: software firms that lower the cost of business, particularly for small and medium sized businesses who can now afford these tools, thanks to the “Software as a Service” subscription model. This “SaaS” model makes software less expensive for first time buyers and is cheaper for software companies to deliver. As a result, the market is growing rapidly and profitably.
The three major positive contributors to performance for the reporting period were ASML Holding NV, SAP SE and STMicroelectronics NV.
ASML Holding NV, a Dutch company, makes the equipment needed for producing semiconductors. ASML is the only supplier of the extreme ultraviolet lithography equipment that is required to produce the next generation of semiconductor chips. In our opinion, the stock is reacting favorably to a growing appreciation of the company’s growth potential.
SAP SE is the German-based global enterprise software company that we have owned for many years. The company is at the forefront of real-time information technology in manufacturing and supply chain management, among other areas, and is benefitting from the corporate world’s drive to digitization. SAP is also moving successfully into providing its services through “cloud subscriptions.
STMicroelectronics NV – ST Micro is a listed, global semiconductor chip designer and manufacturer focused on the fast growing automotive, sensor and security segments. The company has consistently displayed admirable margin and capital discipline through various market conditions. In our opinion, ST Micro is well-positioned to benefit from the secular growth trends in its areas of expertise.
The three major negative contributors to performance for the reporting period were
6 INVESCO OPPENHEIMER INTERNATIONAL GROWTH FUND
Nokia Oyj, Carnival Corporation and Baidu, Inc.
Nokia Oyj has successfully transformed itself from a flailing handset manufacturer to one of the few telecom equipment providers left in the world. In our opinion, it is the leader in the integrated software and equipment solutions that 5G networks most require.Build-out of 5G networks has begun in earnest this year. Nokia’s margins are going through a period of compression as they compete hard for the “first position” in these networks that leads to the profitable parts and service business.
Baidu Inc., the Chinese internet search leader, reported weak financial results during the reporting period that showed surprising deterioration in its core search business. Worse yet, management didn’t seem to have a good handle on what they were going to do about it. We decided that we have more confidence in other ideas and sold out of this position.
Carnival Corp. - Carnival Corp. is the world’s largest cruise line with over half of a highly concentrated market, 90% of which is held by the top four companies. Furthermore, the market is still relatively small, with fewer than 500,000 berths. Carnival is riding the rising tide of demand for cruising from an aging and increasingly affluent world population. The company has experienced profit taking recently but we are confident of the long term outlook.
STRATEGY & OUTLOOK
Equity prices are reflecting a tug of war. Monetary easing, led by the Federal Reserve in the US and followed by most monetary authorities throughout the world, is supportive. Trade tensions, on the other hand, rattle sentiment as investors contemplate the potential cost to companies: more flexible supply chains, more redundancy within them, less “just in time” and more “just in case” inventory, and so forth. Hence the tight correlation betweenUS-Chinese trade news andday-to-day equity market performance. In our opinion, this will likely continue. We also expect more focus on the “will they or won’t they” Brexit issue. We do not know what will happen, nor – do we believe – does anyone else. But we are ready if we see investment opportunities there as the story unfolds.
None of the issues producing volatility that we have discussed alter the direction of technological and behavioral change we see in the world economy, and in which we are invested. We continue to digitize more of our activities, using more software, more semiconductor chips, more data analysis, in new and more complex ways. The internet of things continues to become a reality. The world’s population continues to age, shifting our spending patterns toward healthcare and travel. Emerging market consumers continue to raise the demand for luxury goods and branded products. We are invested in all of these long-term trends.
7 INVESCO OPPENHEIMER INTERNATIONAL GROWTH FUND
We thank you for your continued investment alongside us in our portfolio.
George Evans, Portfolio Manager
8 INVESCO OPPENHEIMER INTERNATIONAL GROWTH FUND
Top Holdings and Allocations
TOP TEN COMMON STOCK HOLDINGS
| | | | |
| SAP SE | | | 2.9 | % |
| Hermes International | | | 2.7 | |
| Hitachi Ltd. | | | 2.6 | |
| ASML Holding NV | | | 2.6 | |
| Hoya Corp. | | | 2.5 | |
| Edenred | | | 2.5 | |
| Grifols SA | | | 2.3 | |
| Novo Nordisk AS, Cl. B | | | 2.1 | |
| STMicroelectronics NV | | | 2.1 | |
| ICICI Bank Ltd., Sponsored ADR | | | 2.1 | |
Holdings and allocations are subject to change and are not buy/sell recommendations. Percentages are as of October 31, 2019, and are based on net assets.
TOP TEN GEOGRAPHICAL HOLDINGS
| | | | |
| France | | | 16.7 | % |
| Switzerland | | | 13.5 | |
| Japan | | | 12.6 | |
| United States | | | 8.1 | |
| United Kingdom | | | 8.0 | |
| Germany | | | 7.2 | |
| Canada | | | 5.6 | |
| Netherlands | | | 5.1 | |
| Spain | | | 4.7 | |
| Sweden | | | 4.0 | |
Holdings and allocations are subject to change and are not buy/sell recommendations. Percentages are as of October 31, 2019, and are based on total market value of investments.
SECTOR ALLOCATION
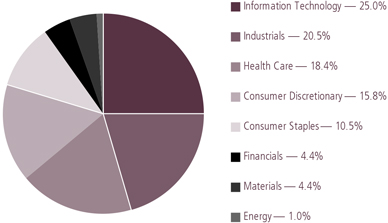
Holdings and allocations are subject to change and are not buy/sell recommendations. Percentages are as of October 31, 2019, and are based on total market value of common stocks.
For more current Fund holdings, please visit invesco.com.
9 INVESCO OPPENHEIMER INTERNATIONAL GROWTH FUND
Share Class Performance
AVERAGE ANNUAL TOTAL RETURNS WITHOUT SALES CHARGE AS OF 10/31/19
| | | | | | | | | | | | | | | | |
| | | Inception
Date | | | 1-Year | | | 5-Year | | | 10-Year | |
| Class A (OIGAX) | | | 3/25/96 | | | | 12.86 | % | | | 4.09 | % | | | 6.73 | % |
| Class C (OIGCX) | | | 3/25/96 | | | | 11.99 | | | | 3.30 | | | | 5.94 | |
| Class R (OIGNX) | | | 3/1/01 | | | | 12.57 | | | | 3.82 | | | | 6.47 | |
| Class Y (OIGYX) | | | 9/7/05 | | | | 13.12 | | | | 4.34 | | | | 7.08 | |
| Class R5 (INGFX)1 | | | 5/24/19 | | | | 13.02 | | | | 4.12 | | | | 6.75 | |
| Class R6 (OIGIX)2 | | | 3/29/12 | | | | 13.32 | | | | 4.52 | | | | 6.32 | 3 |
AVERAGE ANNUAL TOTAL RETURNS WITH SALES CHARGE AS OF 10/31/19
| | | | | | | | | | | | | | | | |
| | | Inception
Date | | | 1-Year | | | 5-Year | | | 10-Year | |
| Class A (OIGAX) | | | 3/25/96 | | | | 6.67 | % | | | 2.91 | % | | | 6.13 | % |
| Class C (OIGCX) | | | 3/25/96 | | | | 10.99 | | | | 3.30 | | | | 5.94 | |
| Class R (OIGNX) | | | 3/1/01 | | | | 12.57 | | | | 3.82 | | | | 6.47 | |
| Class Y (OIGYX) | | | 9/7/05 | | | | 13.12 | | | | 4.34 | | | | 7.08 | |
| Class R5 (INGFX)1 | | | 5/24/19 | | | | 13.02 | | | | 4.12 | | | | 6.75 | |
| Class R6 (OIGIX)2 | | | 3/29/12 | | | | 13.32 | | | | 4.52 | | | | 6.32 | 3 |
1. Class R5 shares’ performance shown prior to the inception date (after the close of business on May 24, 2019) is that of the predecessor fund’s Class A shares at net asset value (NAV) and includes the12b-1 fees applicable to Class A shares. Class A shares’ performance reflects any applicable fee waivers and/or expense reimbursements.
2. Pursuant to the closing of the transaction described in the Notes to Financial Statements, after the close of business on May 24, 2019, Class I shares were reorganized as Class R6 shares.
3. Shows performance since inception.
Performance quoted is past performance and cannot guarantee comparable future results; current performance may be lower or higher. Visit invesco.com for the most recentmonth-end performance. Performance figures reflect reinvested distributions and changes in net asset value (NAV). Investment return and principal value will vary so that you may have a gain or a loss when you sell shares. Performance shown at NAV does not include the applicablefront-end sales charge, which would have reduced the performance. The current maximum initial sales charge for Class A shares is 5.50%, and the contingent deferred sales charge for Class C shares is 1% for the1-year period. Class R, Class Y, Class R5 and Class R6 shares have no sales charge; therefore, performance is at NAV. Effective after the close of business on May 24, 2019, Class A, Class C, Class R, Class Y, and Class I shares of the predecessor fund were reorganized into Class A, Class C, Class R, Class Y, and Class R6 shares, respectively, of the Fund. Class R5 shares’ performance shown prior to the inception date is that of the predecessor fund’s Class A shares at NAV and includes the12b-1 fees applicable to Class A shares. Class A shares’ performance reflects any applicable fee waivers and/or expense reimbursements. Returns shown for Class A, Class C, Class R, Class Y, Class R5, and Class R6 shares are blended returns of the predecessor fund and the Fund. Share class returns will differ from those of the predecessor fund because of different
10 INVESCO OPPENHEIMER INTERNATIONAL GROWTH FUND
expenses. See Fund prospectuses and summary prospectuses for more information on share classes, sales charges and new fee agreements, if any. Fund literature is available at invesco.com.
The Fund’s performance is compared to the performance of the MSCI AC Worldex-U.S. Index. The MSCI AC Worldex-U.S. Index is designed to measure the equity market performance of developed and emerging markets and excludes the U.S. The Index isunmanaged and cannot be purchased directly by investors. While index comparisons may be useful to provide a benchmark for the Fund’s performance, it must be noted that the Fund’s investments are not limited to the investments comprising theIndex. Index performance includes reinvestment of income, but does not reflect transaction costs, fees, expenses or taxes. Index performance is shown for illustrative purposes only as a benchmark for the Fund’s performance, and does not predict or depict performance of the Fund. The Fund’s performance reflects the effects of the Fund’s business and operating expenses.
The views and opinions expressed in management’s discussion of Fund performance are those of Invesco Advisers, Inc. These views and opinions are subject to change at any time based on factors such as market and economic conditions. These views and opinions may not be relied upon as investment advice or recommendations, or as an offer for a particular security. The information is not a complete analysis of every aspect of any market, country, industry, security or the Fund. Statements of fact are from sources considered reliable, but Invesco Advisers, Inc. makes no representation or warranty as to their completeness or accuracy. Although historical performance is no guarantee of future results, these insights may help you understand our investment management philosophy.
Before investing, investors should carefully read the prospectus and/or summary prospectus and carefully consider the investment objectives, risks, charges and expenses. For this and more complete information about the fund(s), investors should ask their advisors for a prospectus/summary prospectus or visit invesco.com/fundprospectus.
Shares of Invesco funds are not deposits or obligations of any bank, are not guaranteed by any bank, are not insured by the FDIC or any other agency, and involve investment risks, including the possible loss of the principal amount invested.
11 INVESCO OPPENHEIMER INTERNATIONAL GROWTH FUND
Fund Expenses
Fund Expenses. As a shareholder of the Fund, you incur two types of costs: (1) transaction costs, which may include sales charges (loads) on purchase payments and/or contingent deferred sales charges on redemptions; and (2) ongoing costs, including management fees; distribution and service fees; and other Fund expenses. These examples are intended to help you understand your ongoing costs (in dollars) of investing in the Fund and to compare these costs with the ongoing costs of investing in other mutual funds.
The examples are based on an investment of $1,000.00 invested at the beginning of the period and held for the entire6-month period ended October 31, 2019.
Actual Expenses. The first section of the table provides information about actual account values and actual expenses. You may use the information in this section for the class of shares you hold, together with the amount you invested, to estimate the expense that you paid over the period. Simply divide your account value by $1,000.00 (for example, an $8,600.00 account value divided by $1,000.00 = 8.60), then multiply the result by the number in the first section under the heading entitled “Expenses Paid During 6 Months Ended October 31, 2019” to estimate the expenses you paid on your account during this period.
Hypothetical Example for Comparison Purposes.The second section of the table provides information about hypothetical account values and hypothetical expenses based on the Fund’s actual expense ratio for each class of shares, and an assumed rate of return of 5% per year for each class before expenses, which is not the Fund’s actual return. The hypothetical account values and expenses may not be used to estimate the actual ending account balance or expenses you paid for the period. You may use this information to compare the ongoing costs of investing in the Fund and other funds. To do so, compare this 5% hypothetical example for the class of shares you hold with the 5% hypothetical examples that appear in the shareholder reports of the other funds.
Please note that the expenses shown in the table are meant to highlight your ongoing costs only and do not reflect any transactional costs, such asfront-end or contingent deferred sales charges (loads). Therefore, the “hypothetical” section of the table is useful in comparing ongoing costs only, and will not help you determine the relative total costs of owning different funds. In addition, if these transactional costs were included, your costs would have been higher.
12 INVESCO OPPENHEIMER INTERNATIONAL GROWTH FUND
| | | | | | | | | | | | |
| Actual | | Beginning
Account Value
May 1, 2019 | | | Ending Account Value
October 31, 2019 | | | Expenses
Paid During 6 Months Ended
October 31, 20191,2 | |
Class A | | | $ 1,000.00 | | | | $ 1,018.50 | | | | $ 5.61 | |
Class C | | | 1,000.00 | | | | 1,014.40 | | | | 9.44 | |
Class R | | | 1,000.00 | | | | 1,017.20 | | | | 6.89 | |
Class Y | | | 1,000.00 | | | | 1,019.70 | | | | 4.34 | |
Class R5 | | | 1,000.00 | | | | 1,020.00 | | | | 3.28 | |
Class R6 | | | 1,000.00 | | | | 1,020.60 | | | | 3.52 | |
| |
Hypothetical (5% return before expenses) | | | | | |
Class A | | | 1,000.00 | | | | 1,019.66 | | | | 5.62 | |
Class C | | | 1,000.00 | | | | 1,015.88 | | | | 9.44 | |
Class R | | | 1,000.00 | | | | 1,018.40 | | | | 6.89 | |
Class Y | | | 1,000.00 | | | | 1,020.92 | | | | 4.34 | |
Class R5 | | | 1,000.00 | | | | 1,021.48 | | | | 3.78 | |
Class R6 | | | 1,000.00 | | | | 1,021.73 | | | | 3.52 | |
1. Actual expenses paid for Class A, C, R, Y, and R6 are equal to the Fund’s annualized expense ratio for that class, multiplied by the average account value over the period, multiplied by 184/365 (to reflect theone-half year period). Actual expenses paid for Class R5 are equal to the Fund’s annualized expense ratio for that class, multiplied by the average account value over the period, multiplied by 160/365 to reflect the period from after the close of business on May 24, 2019 (inception of offering) to October 31, 2019.
2.Hypothetical expenses paid for all classes are equal to the Fund’s annualized expense ratio for that class, multiplied by the average account value over the period, multiplied by 184/365 (to reflect theone-half year period).
Those annualized expense ratios, excluding indirect expenses from affiliated funds, based on the6-month period ended October 31, 2019 for Classes A, C, R, Y and R6 and for the period from after the close of business on May 24, 2019 (inception of offering) to October 31, 2019 for Class R5 are as follows:
| | | | |
| Class | | Expense Ratios | |
Class A | | | 1.10% | |
Class C | | | 1.85 | |
Class R | | | 1.35 | |
Class Y | | | 0.85 | |
Class R5 | | | 0.74 | |
Class R6 | | | 0.69 | |
The expense ratios reflect voluntary and/or contractual waivers and/or reimbursements of expenses by the Fund’s Manager. Some of these undertakings may be modified or terminated at any time, as indicated in the Fund’s prospectus. The “Financial Highlights” tables in the
13 INVESCO OPPENHEIMER INTERNATIONAL GROWTH FUND
Fund’s financial statements, included in this report, also show the gross expense ratios, without such waivers or reimbursements and reduction to custodian expenses, if applicable.
14 INVESCO OPPENHEIMER INTERNATIONAL GROWTH FUND
SCHEDULE OF INVESTMENTSOctober 31, 2019
| | | | | | | | |
| | | Shares | | | Value | |
| Common Stocks—98.5% | | | | | | | | |
| Consumer Discretionary—15.5% | | | | | |
| Auto Components—1.8% | | | | | |
| Continental AG | | | 464,626 | | | $ | 62,109,574 | |
| Koito Manufacturing Co. Ltd. | | | 2,752,900 | | | | 143,586,748 | |
| Valeo SA | | | 2,182,868 | | | | 81,238,439 | |
| | | | | | | | 286,934,761 | |
| Entertainment—1.0% | | | | | | | | |
Ubisoft Entertainment SA1 | | | 2,653,458 | | | | 156,688,742 | |
| Hotels, Restaurants & Leisure—0.9% | | | | | |
| Carnival Corp. | | | 1,475,935 | | | | 63,302,852 | |
| Flutter Entertainment plc | | | 782,989 | | | | 80,727,885 | |
| | | | | | | | 144,030,737 | |
| Household Durables—1.7% | | | | | |
| SEB SA, Prime1 | | | 1,763,577 | | | | 267,780,713 | |
| Internet & Catalog Retail—1.3% | | | | | |
| Alibaba Group | | | | | | | | |
Holding Ltd., Sponsored ADR1 | | | 1,171,249 | | | | 206,924,561 | |
| Multiline Retail—1.8% | | | | | |
| Dollarama, Inc. | | | 5,392,866 | | | | 181,427,297 | |
| Next plc | | | 1,087,920 | | | | 93,099,648 | |
| | | | | | | | 274,526,945 | |
| Specialty Retail—1.6% | | | | | |
Nitori Holdings Co. Ltd. | | | 1,676,500 | | | | 255,989,751 | |
| Textiles, Apparel & Luxury Goods—5.4% | |
| Cie Financiere Richemont SA | | | 2,142,894 | | | | 168,703,593 | |
| Hermes International | | | 591,362 | | | | 425,594,796 | |
| LVMH Moet Hennessy Louis Vuitton SE | | | 593,960 | | | | 253,573,949 | |
| | | | | | | | 847,872,338 | |
| Consumer Staples—10.4% | | | | | | | | |
| Beverages—3.2% | | | | | | | | |
| Britvic plc | | | 6,980,980 | | | | 89,279,955 | |
| Heineken NV | | | 1,544,852 | | | | 157,639,091 | |
| Pernod Ricard SA | | | 1,339,892 | | | | 247,399,040 | |
| | | | | | | 494,318,086 | |
| | | | | | | | |
| | | Shares | | | Value | |
| Food & Staples Retailing—2.8% | | | | | |
| Alimentation Couche-Tard, Inc., Cl. B | | | 9,930,114 | | | $ | 297,805,408 | |
| CP ALL PCL | | | 56,648,600 | | | | 146,322,450 | |
| | | | | | | | 444,127,858 | |
| Food Products—3.4% | | | | | |
| Barry Callebaut AG | | | 115,008 | | | | 242,972,814 | |
| Saputo, Inc. | | | 5,100,882 | | | | 147,941,457 | |
| WH Group Ltd. | | | 135,888,000 | | | | 142,502,767 | |
| | | | | | | | 533,417,038 | |
| Tobacco—1.0% | | | | | | | | |
| Swedish Match AB | | | 3,337,257 | | | | 156,731,343 | |
| Energy—1.0% | | | | | | | | |
| Energy Equipment & Services—1.0% | | | | | |
| TechnipFMC plc | | | 7,831,664 | | | | 155,523,778 | |
| Financials—4.3% | | | | | | | | |
| Commercial Banks—2.1% | | | | | |
ICICI Bank Ltd., Sponsored ADR | | | 24,934,273 | | | | 324,893,577 | |
| Insurance—2.2% | | | | | | | | |
| Legal & General Group plc | | | 48,148,213 | | | | 164,867,456 | |
| Prudential plc | | | 10,700,023 | | | | 187,472,504 | |
| | | | | | | | 352,339,960 | |
| Health Care—18.1% | | | | | | | | |
| Biotechnology—5.1% | | | | | |
| Ascendis Pharma AS, ADR1 | | | 441,150 | | | | 48,782,367 | |
| CSL Ltd. | | | 1,670,907 | | | | 294,098,064 | |
| Galapagos NV1 | | | 482,281 | | | | 88,831,069 | |
| Grifols SA | | | 11,385,611 | | | | 366,909,410 | |
| | | | | | | | 798,620,910 | |
| Health Care Equipment & Supplies—6.2% | |
| Hoya Corp. | | | 4,444,410 | | | | 394,340,936 | |
| LivaNova plc1 | | | 975,940 | | | | 69,028,236 | |
| Medtronic plc | | | 1,479,760 | | | | 161,145,864 | |
| ResMed, Inc. | | | 1,200,570 | | | | 177,588,314 | |
| Siemens Healthineers AG2 | | | 4,161,481 | | | | 176,692,206 | |
| | | | | | | | 978,795,556 | |
| Health Care Providers & Services—1.2% | |
| Fresenius Medical Care AG & Co. KGaA | | | 2,638,466 | | | | 190,910,268 | |
15 INVESCO OPPENHEIMER INTERNATIONAL GROWTH FUND
SCHEDULE OF INVESTMENTSContinued
| | | | | | | | |
| | | Shares | | | Value | |
| Life Sciences Tools & Services—1.8% | | | | | |
| Lonza Group AG1 | | | 795,851 | | | $ | 286,524,298 | |
| Pharmaceuticals—3.8% | | | | | |
| Novo Nordisk AS, | | | | | | | | |
| Cl. B | | | 6,039,291 | | | | 332,512,604 | |
| Roche Holding AG | | | 849,603 | | | | 256,248,910 | |
| | | | | | | | 588,761,514 | |
| Industrials—20.2% | | | | | | | | |
| Aerospace & Defense—1.7% | | | | | |
| Airbus SE | | | 1,804,893 | | | | 258,655,668 | |
| Building Products—0.3% | | | | | |
| Daikin Industries | | | | | | | | |
| Ltd. | | | 385,100 | | | | 54,138,442 | |
| Commercial Services & Supplies—3.7% | |
| Edenred | | | 7,354,230 | | | | 387,234,692 | |
| Prosegur Cash SA2 | | | 50,298,553 | | | | 78,576,379 | |
| Prosegur Cia de | | | | | | | | |
| Seguridad SA3 | | | 28,908,518 | | | | 112,217,841 | |
| | | | | | | | 578,028,912 | |
| Construction & Engineering—0.4% | | | | | |
| Boskalis | | | | | | | | |
| Westminster3 | | | 2,565,846 | | | | 56,337,674 | |
| Electrical Equipment—4.5% | | | | | |
| Legrand SA | | | 2,844,774 | | | | 222,109,937 | |
| Melrose Industries plc | | | 64,097,000 | | | | 177,027,418 | |
| Nidec Corp. | | | 2,081,570 | | | | 306,100,504 | |
| | | | | | | | 705,237,859 | |
| Machinery—7.1% | | | | | | | | |
| Aalberts NV | | | 4,434,338 | | | | 178,430,977 | |
| Atlas Copco AB, | | | | | | | | |
| Cl. A | | | 8,510,013 | | | | 300,805,107 | |
| Epiroc AB, Cl. A | | | 15,034,743 | | | | 169,432,527 | |
| Kubota Corp. | | | 4,700,700 | | | | 74,592,067 | |
| VAT Group AG1,2,3 | | | 1,857,607 | | | | 272,526,250 | |
| Weir Group plc | | | | | | | | |
| (The) | | | 6,765,127 | | | | 118,064,426 | |
| | | | | | | | 1,113,851,354 | |
| Professional Services—1.0% | | | | | |
| Intertek Group plc | | | 2,363,020 | | | | 164,226,524 | |
| Trading Companies & Distributors—1.5% | |
| Bunzl plc | | | 3,047,721 | | | | 79,301,195 | |
| Ferguson plc | | | 1,765,669 | | | | 150,653,698 | |
| | | | | | | 229,954,893 | |
| | | | | | | | |
| | | Shares | | | Value | |
| Information Technology—24.6% | | | | | |
| Communications Equipment—1.0% | | | | | |
| Nokia OYJ | | | 42,047,274 | | | $ | 154,833,870 | |
| Electronic Equipment, Instruments, & | |
| Components—4.7% | | | | | | | | |
| Hitachi Ltd. | | | 11,039,400 | | | | 411,611,785 | |
| Keyence Corp. | | | 513,542 | | | | 324,254,223 | |
| | | | | | | | 735,866,008 | |
| IT Services—3.5% | | | | | | | | |
| Amadeus IT Group | | | | | | | | |
| SA | | | 2,423,534 | | | | 179,410,435 | |
| EPAM Systems, Inc.1 | | | 1,342,850 | | | | 236,287,886 | |
| Worldline SA1,2 | | | 2,062,213 | | | | 125,293,481 | |
| | | | | | | | 540,991,802 | |
| Semiconductors & Semiconductor | | | | | |
| Equipment—7.6% | | | | | | | | |
| ASML Holding NV | | | 1,557,571 | | | | 408,627,516 | |
| Infineon | | | | | | | | |
| Technologies AG | | | 12,111,614 | | | | 236,214,834 | |
| STMicroelectronics | | | | | | | | |
| NV | | | 14,382,150 | | | | 326,623,478 | |
| Taiwan | | | | | | | | |
| Semiconductor | | | | | | | | |
| Manufacturing Co. | | | | | | | | |
| Ltd. | | | 23,257,000 | | | | 225,948,266 | |
| | | | | | | | 1,197,414,094 | |
| Software—7.8% | | | | | | | | |
| Atlassian Corp. plc, | | | | | | | | |
| Cl. A1 | | | 458,750 | | | | 55,412,413 | |
| Blue Prism Group plc1 | | | 2,075,800 | | | | 22,252,622 | |
| Dassault Systemes | | | | | | | | |
| SE | | | 1,220,490 | | | | 185,657,607 | |
| SAP SE | | | 3,460,349 | | | | 458,359,237 | |
| Temenos AG1 | | | 1,886,635 | | | | 269,404,962 | |
| Xero Ltd.1 | | | 5,052,825 | | | | 239,495,877 | |
| | | | | | | | 1,230,582,718 | |
| Materials—4.4% | | | | | | | | |
| Chemicals—1.8% | | | | | | | | |
| Sika AG | | | 1,649,885 | | | | 283,707,891 | |
| Construction Materials—1.0% | | | | | |
| James Hardie | | | | | | | | |
| Industries plc | | | 9,032,471 | | | | 154,539,401 | |
16 INVESCO OPPENHEIMER INTERNATIONAL GROWTH FUND
| | | | | | | | |
| | | Shares | | | Value | |
| Containers & Packaging—1.6% | | | | | |
| CCL Industries, Inc., | | | | | | | | |
| Cl. B | | | 6,038,348 | | | $ | 248,529,986 | |
| Total Common Stocks | | | | | | | | |
| (Cost $9,744,799,506) | | | | | | | 15,452,609,830 | |
| Preferred Stock—0.0% | | | | | |
| Zee Entertainment | | | | | | | | |
| Enterprises Ltd., 6% | | | | | | | | |
| Cum.Non-Cv. (Cost | | | | | | | | |
| $—) | | | 17,213,928 | | | | 1,225,600 | |
| | | | | | | | |
| | | Shares | | | Value | |
| Investment Company—1.3% | | | | | |
| Invesco Government | | | | | | | | |
| & Agency Portfolio, | | | | | | | | |
Institutional Class,
1.71%4(Cost | | | | | | | | |
| $196,446,145) | | | 196,446,145 | | | $ | 196,446,145 | |
| Total | | | | | | | | |
| Investments, | | | | | | | | |
| at Value (Cost | | | | | | | | |
| $9,941,245,651) | | | 99.8% | | | | 15,650,281,575 | |
| Net Other Assets | | | | | | | | |
| (Liabilities) | | | 0.2 | | | | 34,197,148 | |
| | | | |
| Net Assets | | | 100.0% | | | $ | 15,684,478,723 | |
| | | | |
Footnotes to Schedule of Investments
1.Non-income producing security.
2. Security purchased or received in a transaction exempt from registration under the Securities Act of 1933, as amended (the “1933 Act”). The security may be resold pursuant to an exemption from registration under the 1933 Act, typically to qualified institutional buyers. The aggregate value of these securities at October 31, 2019 was $653,245,312, which represented 4.16% of the Fund’s Net Assets.
3. Is or was an affiliate, as defined in the Investment Company Act of 1940, as amended, at or during the reporting period, by virtue of the Fund owning at least 5% of the voting securities of the issuer or as a result of the Fund and the issuer having the same investment adviser. Transactions during the reporting period in which the issuer was an affiliate are as follows:
| | | | | | | | | | | | | | | | |
| | | Shares
November 30,
2018 | | | Gross
Additions | | | Gross
Reductions | | | Shares
October 31, 2019 | |
| Common Stock | | | | | | | | | | | | | | | | |
| Commercial Services & | | | | | | | | | | | | | | | | |
| Supplies | | | | | | | | | | | | | | | | |
| Prosegur Cia de Seguridad SA | | | 33,680,042 | | | | 172,669 | | | | 4,944,193 | | | | 28,908,518 | |
| Construction & Engineering | | | | | | | | | | | | | | | | |
| Boskalis Westminstera | | | 9,911,736 | | | | 37,615 | | | | 7,383,505 | | | | 2,565,846 | |
| Hotels, Restaurants & Leisure | | | | | | | | | | | | | | | | |
| Domino’s Pizza Group plca | | | 42,691,271 | | | | — | | | | 42,691,271 | | | | — | |
| Scout24 AGa | | | 6,062,080 | | | | — | | | | 6,062,080 | | | | — | |
| Machinery | | | | | | | | | | | | | | | | |
| VAT Group AG | | | 2,197,849 | | | | 11,268 | | | | 351,510 | | | | 1,857,607 | |
| Semiconductors & | | | | | | | | | | | | | | | | |
| Semiconductor Equipment | | | | | | | | | | | | | | | | |
| ams AGa | | | 4,793,798 | | | | — | | | | 4,793,798 | | | | — | |
| | | | |
| | | Value | | | Income | | | Realized Gain
(Loss) | | | Change in
Unrealized Gain (Loss) | |
| Common Stock | | | | | | | | | | | | | | | | |
| Commercial Services & | | | | | | | | | | | | | | | | |
| Supplies | | | | | | | | | | | | | | | | |
| Prosegur Cia de Seguridad SA | | $ | 112,217,841 | | | $ | 3,904,918 | | | $ | (10,381,883 | ) | | $ | (34,717,975 | ) |
| Construction & Engineering | | | | | | | | | | | | | | | | |
| Boskalis Westminstera | | | — | a | | | 3,380,259 | | | | (102,408,461 | ) | | | 60,049,699 | |
17 INVESCO OPPENHEIMER INTERNATIONAL GROWTH FUND
SCHEDULE OF INVESTMENTSContinued
| | | | | | | | | | | | | | | | |
| | | Value | | | Income | | | Realized Gain
(Loss) | | | Change in
Unrealized
Gain (Loss) | |
| Hotels, Restaurants & Leisure | | | | | | | | | | | | | | | | |
| Domino’s Pizza Group plca | | $ | — | a | | $ | 2,227,151 | | | $ | 26,683,395 | | | $ | (31,680,380 | ) |
| Scout24 AGa | | | — | a | | | — | | | | 73,040,032 | | | | (22,133,334 | ) |
| Machinery | | | | | | | | | | | | | | | | |
| VAT Group AG | | | 272,526,250 | | | | 8,761,557 | | | | (11,936,535 | ) | | | 98,583,893 | |
| Semiconductors & | | | | | | | | | | | | | | | | |
| Semiconductor Equipment | | | | | | | | | | | | | | | | |
| ams AGa | | | — | a | | | — | | | | (291,639,093 | ) | | | 331,809,160 | |
| | | | |
| Total | | $ | 384,744,091 | | | $ | 18,273,885 | | | $ | (316,642,545 | ) | | $ | 401,911,063 | |
| | | | |
a.The security is no longer an affiliate. Therefore, the value has been excluded from this table.
4. The money market fund and the Fund are affiliated by having the same investment adviser. The rate shown is the7-day SEC standardized yield as of October 31, 2019.
Distribution of investments representing geographic holdings, as a percentage of total investments at value, is as follows:
| | | | | | |
| Geographic Holdings | | Value | | | Percent |
| France | | $ | 2,611,227,065 | | | 16.7% |
| Switzerland | | | 2,106,712,196 | | | 13.5 |
| Japan | | | 1,964,614,456 | | | 12.6 |
| United States | | | 1,264,404,808 | | | 8.1 |
| United Kingdom | | | 1,251,115,526 | | | 8.0 |
| Germany | | | 1,124,286,118 | | | 7.2 |
| Canada | | | 875,704,148 | | | 5.6 |
| Netherlands | | | 801,035,258 | | | 5.1 |
| Spain | | | 737,114,065 | | | 4.7 |
| Sweden | | | 626,968,977 | | | 4.0 |
| Denmark | | | 381,294,971 | | | 2.4 |
| India | | | 326,119,178 | | | 2.1 |
| Australia | | | 294,098,064 | | | 1.9 |
| New Zealand | | | 239,495,877 | | | 1.5 |
| Taiwan | | | 225,948,266 | | | 1.4 |
| China | | | 206,924,561 | | | 1.3 |
| Finland | | | 154,833,870 | | | 1.0 |
| Thailand | | | 146,322,450 | | | 0.9 |
| Hong Kong | | | 142,502,767 | | | 0.9 |
| Belgium | | | 88,831,069 | | | 0.6 |
| Ireland | | | 80,727,885 | | | 0.5 |
| Total | | $ | 15,650,281,575 | | | 100.0% |
| | | | | | |
Glossary:
Definitions
ADR American Depositary Receipt
See accompanying Notes to Financial Statements.
18 INVESCO OPPENHEIMER INTERNATIONAL GROWTH FUND
STATEMENT OF ASSETS AND LIABILITIESOctober 31, 2019
| | | | |
| Assets | | | | |
| Investments, at value—see accompanying schedule of investments: | | | | |
| Unaffiliated companies (cost $9,343,533,286) | | $ | 15,069,091,339 | |
| Affiliated companies (cost $597,712,365) | | | 581,190,236 | |
| | | | |
| | | | 15,650,281,575 | |
| Cash | | | 11,621,796 | |
| Cash—foreign currencies (cost $1,908,651) | | | 1,928,314 | |
| Receivables and other assets: | | | | |
| Dividends | | | 74,012,580 | |
| Investments sold | | | 65,725,207 | |
| Shares of beneficial interest sold | | | 5,015,918 | |
| Other | | | 628,735 | |
| | | | |
Total assets | | | 15,809,214,125 | |
| Liabilities | | | | |
| Payables and other liabilities: | | | | |
| Shares of beneficial interest redeemed | | | 81,956,342 | |
| Investments purchased | | | 21,984,931 | |
| Foreign capital gains tax | | | 10,698,513 | |
| Transfer and shareholder servicing agent fees | | | 3,628,429 | |
| Shareholder communications | | | 1,550,000 | |
| Trustees’ compensation | | | 728,678 | |
| Distribution and service plan fees | | | 677,982 | |
| Advisory fees | | | 281,832 | |
| Administration fees | | | 2,664 | |
| Other | | | 3,226,031 | |
| | | | |
Total liabilities | | | 124,735,402 | |
| Net Assets | | $ | 15,684,478,723 | |
| | | | |
| | | | |
| Composition of Net Assets | | | | |
| Shares of beneficial interest | | $ | 10,158,492,215 | |
| Total distributable earnings | | | 5,525,986,508 | |
| Net Assets | | $ | 15,684,478,723 | |
| | | | |
19 INVESCO OPPENHEIMER INTERNATIONAL GROWTH FUND
STATEMENT OF ASSETS AND LIABILITIESContinued
| | | | |
| Net Asset Value Per Share | | | | |
Class A Shares: | | | | |
| Net asset value and redemption price per share (based on net assets of $1,746,482,795 and 41,846,036 shares of beneficial interest outstanding) | | $ | 41.74 | |
Maximum offering price per share (net asset value plus sales charge of 5.50% of offering price) | | $ | 44.17 | |
Class C Shares: | | | | |
Net asset value, redemption price (excludes applicable contingent deferred sales charge)
and offering price per share (based on net assets of $241,806,861 and 6,133,460 shares of
beneficial interest outstanding) | | $ | 39.42 | |
Class R Shares: | | | | |
Net asset value, redemption price and offering price per share (based on net assets of | | | | |
| $313,080,980 and 7,658,388 shares of beneficial interest outstanding) | | $ | 40.88 | |
Class Y Shares: | | | | |
Net asset value, redemption price and offering price per share (based on net assets of | | | | |
| $5,993,233,605 and 144,385,729 shares of beneficial interest outstanding) | | $ | 41.51 | |
Class R5 Shares: | | | | |
Net asset value, redemption price and offering price per share (based on net assets of $10,776
and 257.80 shares of beneficial interest outstanding) | | $ | 41.80 | |
Class R6 Shares: | | | | |
Net asset value, redemption price and offering price per share (based on net assets of | | | | |
| $7,389,863,706 and 177,857,729 shares of beneficial interest outstanding) | | $ | 41.55 | |
See accompanying Notes to Financial Statements.
20 INVESCO OPPENHEIMER INTERNATIONAL GROWTH FUND
STATEMENT OF
OPERATIONS
| | | | | | | | |
| | | Eleven Months Ended
October 31, 2019 | | | Year Ended
November 30, 2018 | |
| Investment Income | | | | | | | | |
| Dividends: | | | | | | | | |
| Unaffiliated companies (net of foreign withholding taxes of | | | | | | | | |
| $32,995,575 and $49,880,060, respectively) | | $ | 309,979,447 | | | $ | 404,593,108 | |
Affiliated companies (net of foreign withholding taxes of $1,319,469
and $8,104,310, respectively) | | | 25,882,094 | | | | 93,114,200 | |
| Interest | | | 13,887 | | | | 20,427 | |
| | | | |
Total investment income | | | 335,875,428 | | | | 497,727,735 | |
Expenses | | | | | | | | |
| Advisory fees | | | 106,816,090 | | | | 168,688,820 | |
| Administration fees | | | 1,009,533 | | | | — | |
| Distribution and service plan fees: | | | | | | | | |
| Class A | | | 4,389,480 | | | | 7,093,924 | |
| Class B | | | — | | | | 7,738 | |
| Class C | | | 2,746,147 | | | | 4,403,242 | |
| Class R | | | 1,589,330 | | | | 2,336,829 | |
| Transfer and shareholder servicing agent fees: | | | | | | | | |
| Class A | | | 3,414,663 | | | | 5,663,462 | |
| Class B | | | — | | | | 1,576 | |
| Class C | | | 527,880 | | | | 869,720 | |
| Class R | | | 610,833 | | | | 923,746 | |
| Class Y | | | 13,042,550 | | | | 23,393,656 | |
| Class R5 | | | 3 | | | | — | |
| Class R6 | | | 1,372,714 | | | | 3,202,231 | |
| Shareholder communications: | | | | | | | | |
| Class A | | | 169,499 | | | | 19,054 | |
| Class B | | | — | | | | 70 | |
| Class C | | | 25,862 | | | | 3,962 | |
| Class R | | | 30,065 | | | | 1,122 | |
| Class Y | | | 632,506 | | | | 112,489 | |
| Class R5 | | | 1 | | | | — | |
| Class R6 | | | 738,075 | | | | 60,913 | |
| Custodian fees and expenses | | | 1,598,495 | | | | 2,773,520 | |
| Borrowing fees | | | 315,429 | | | | 853,129 | |
| Trustees’ compensation | | | 210,283 | | | | 361,533 | |
| Other | | | 398,824 | | | | 916,950 | |
| Total expenses | | | 139,638,262 | | | | 221,687,686 | |
Less waivers, reimbursements of expenses, and expense offset
arrangement(s) | | | (1,440,475 | ) | | | (938,527 | ) |
| | | | |
| Net expenses | | | 138,197,787 | | | | 220,749,159 | |
| Net Investment Income | | | 197,677,641 | | | | 276,978,576 | |
21 INVESCO OPPENHEIMER INTERNATIONAL GROWTH FUND
STATEMENT OF
OPERATIONSContinued
| | | | | | | | |
| | | Eleven Months Ended October 31, 2019 | | | Year Ended
November 30, 2018 | |
| Realized and Unrealized Gain (Loss) | | | | | | | | |
| Net realized gain (loss) on: | | | | | | | | |
| Investment transactions in: | | | | | | | | |
Unaffiliated companies (net of foreign capital gains tax of
$7,169,731 and $6,646,200, respectively) (includes net gains
(losses) from securities sold to affiliates of $2,969,333 and $—,
respectively)) | | $ | 319,260,949 | | | $ | 476,078,426 | |
Affiliated companies | | | (316,642,545 | ) | | | (112,533,757 | ) |
| Foreign currency transactions | | | (433,639 | ) | | | (1,089,816 | ) |
| | | | |
| Net realized gain | | | 2,184,765 | | | | 362,454,853 | |
| Net change in unrealized appreciation/(depreciation) on: | | | | | | | | |
| Investment transactions in: | | | | | | | | |
Unaffiliated companies | | | 1,722,914,864 | | | | (3,490,297,535 | ) |
Affiliated companies | | | 401,911,063 | | | | (831,773,945 | ) |
| Translation of assets and liabilities denominated in foreign currencies | | | 84,469 | | | | (1,936,732 | ) |
| | | | |
Net change in unrealized appreciation/(depreciation) | | | 2,124,910,396 | | | | (4,324,008,212 | ) |
Net Increase (Decrease) in Net Assets Resulting from
Operations | | $ | 2,324,772,802 | | | $ | (3,684,574,783 | ) |
| | | | | | | | |
See accompanying Notes to Financial Statements.
22 INVESCO OPPENHEIMER INTERNATIONAL GROWTH FUND
STATEMENT OF CHANGES IN NET ASSETS
| | | | | | | | | | | | |
| | | Eleven Months Ended October 31, 2019 | | | Year Ended
November 30, 2018 | | | Year Ended
November 30, 2017 | |
| Operations | | | | | | | | | | | | |
| Net investment income | | $ | 197,677,641 | | | $ | 276,978,576 | | | $ | 255,686,768 | |
| Net realized gain (loss) | | | 2,184,765 | | | | 362,454,853 | | | | (59,445,386 | ) |
| Net change in unrealized appreciation/(depreciation) | | | 2,124,910,396 | | | | (4,324,008,212 | ) | | | 5,999,060,268 | |
Net increase (decrease) in net assets resulting from
operations | | | 2,324,772,802 | | | | (3,684,574,783 | ) | | | 6,195,301,650 | |
Dividends and/or Distributions to
Shareholders1 | | | | | | | | | | | | |
Distributions to shareholders from distributable
earnings: | | | | | | | | | | | | |
| Class A | | | (21,472,225 | ) | | | (19,117,217 | ) | | | (43,789,345 | ) |
| Class B2 | | | — | | | | — | | | | — | |
| Class C | | | (664,356 | ) | | | — | | | | (1,277,824 | ) |
| Class R | | | (2,973,185 | ) | | | (2,152,886 | ) | | | (3,455,954 | ) |
| Class Y | | | (124,261,284 | ) | | | (110,353,712 | ) | | | (133,413,496 | ) |
| Class R5 | | | — | | | | — | | | | — | |
| Class R6 | | | (135,457,439 | ) | | | (111,069,812 | ) | | | (102,142,501 | ) |
| | | | | | | | | | | | |
Total distributions from distributable earnings | | | (284,828,489 | ) | | | (242,693,627 | ) | | | (284,079,120 | ) |
| Beneficial Interest Transactions | | | | | | | | | | | | |
Net increase (decrease) in net assets resulting from
beneficial interest transactions: | | | | | | | | | | | | |
| Class A | | | (625,772,217 | ) | | | (703,314,792 | ) | | | (1,875,348,412 | ) |
| Class B2 | | | — | | | | (3,096,841 | ) | | | (5,909,021 | ) |
| Class C | | | (140,057,632 | ) | | | (58,174,703 | ) | | | (94,689,305 | ) |
| Class R | | | (107,203,986 | ) | | | (37,402,650 | ) | | | (9,193,664 | ) |
| Class Y | | | (4,174,878,050 | ) | | | (1,480,027,724 | ) | | | (269,714,228 | ) |
| Class R5 | | | 10,000 | | | | — | | | | — | |
| Class R6 | | | (2,189,411,468 | ) | | | (203,189,913 | ) | | | 2,166,999,692 | |
Total beneficial interest transactions | | | (7,237,313,353 | ) | | | (2,485,206,623 | ) | | | (87,854,938 | ) |
| Net Assets | | | | | | | | | | | | |
| Total increase (decrease) | | | (5,197,369,040 | ) | | | (6,412,475,033 | ) | | | 5,823,367,592 | |
| Beginning of period | | | 20,881,847,763 | | | | 27,294,322,796 | | | | 21,470,955,204 | |
| End of period | | $ | 15,684,478,723 | | | $ | 20,881,847,763 | | | $ | 27,294,322,796 | |
| | | | | | | | | | | | |
1. The Securities Exchange Commission eliminated the requirement to disclose the distribution components separately, except for tax return of capital. For the year ended November 30, 2017, distributions to shareholders from distributable earnings consisted of distributions from net investment income.
2. Effective June 1, 2018, all Class B shares converted to Class A shares.
See accompanying Notes to Financial Statements.
23 INVESCO OPPENHEIMER INTERNATIONAL GROWTH FUND
FINANCIAL HIGHLIGHTS
| | | | | | | | | | | | | | | | | | | | | | | | |
| Class A | | Eleven Months
Ended
October 31,
2019 | | | Year Ended
November 30,
2018 | | | Year Ended
November 30,
2017 | | | Year Ended
November 30,
2016 | | | Year Ended
November 30,
2015 | | | Year Ended
November 28,
20141 | |
| Per Share Operating Data | | | | | | | | | | | | | | | | | | | | | | | | |
| Net asset value, beginning of period | | | $37.08 | | | | $43.71 | | | | $34.34 | | | | $37.14 | | | | $36.45 | | | | $37.45 | |
| Income (loss) from investment operations: | | | | | | | | | | | | | | | | | | | | | | | | |
| Net investment income2 | | | 0.33 | | | | 0.34 | | | | 0.35 | | | | 0.38 | | | | 0.31 | | | | 0.38 | |
| Net realized and unrealized gain (loss) | | | 4.71 | | | | (6.71) | | | | 9.38 | | | | (2.87) | | | | 0.68 | | | | (1.11) | |
| | | | | | | | | | | | | | | | | | | | | | | | |
| Total from investment operations | | | 5.04 | | | | (6.37) | | | | 9.73 | | | | (2.49) | | | | 0.99 | | | | (0.73) | |
| Dividends and/or distributions to shareholders: | | | | | | | | | | | | | | | | | | | | | | | | |
| Dividends from net investment income | | | (0.38) | | | | (0.26) | | | | (0.36) | | | | (0.31) | | | | (0.30) | | | | (0.27) | |
| Net asset value, end of period | | | $41.74 | | | | $37.08 | | | | $43.71 | | | | $34.34 | | | | $37.14 | | | | $36.45 | |
| | | | | | | | | | | | | | | | | | | | | | | | |
| | | | | | | | | | | | | | | | | | | | | | | | |
| Total Return, at Net Asset Value3 | | | 13.75% | | | | (14.66)% | | | | 28.61% | | | | (6.73)% | | | | 2.76% | | | | (1.95)% | |
| | | | | | | | | | | | | | | | | | | | | | | | |
| Ratios/Supplemental Data | | | | | | | | | | | | | | | | | | | | | | | | |
| Net assets, end of period (in thousands) | | | $1,746,483 | | | | $2,146,246 | | | | $3,249,744 | | | | $4,253,937 | | | | $5,394,512 | | | | $4,726,302 | |
| Average net assets (in thousands) | | | $1,938,158 | | | | $2,865,404 | | | | $3,550,263 | | | | $5,062,192 | | | | $4,848,329 | | | | $4,897,214 | |
| Ratios to average net assets:4 | | | | | | | | | | | | | | | | | | | | | | | | |
| Net investment income | | | 0.93% | | | | 0.79% | | | | 0.89% | | | | 1.08% | | | | 0.85% | | | | 1.02% | |
| Expenses excluding specific expenses listed below | | | 1.10% | | | | 1.11% | | | | 1.13% | | | | 1.14% | | | | 1.14% | | | | 1.14% | |
| Interest and fees from borrowings | | | 0.00%5 | | | | 0.00%5 | | | | 0.00%5 | | | | 0.00%5 | | | | 0.00%5 | | | | 0.00% | |
| | | | | | | | | | | | | | | | | | | | | | | | |
| Total expenses6 | | | 1.10% | | | | 1.11% | | | | 1.13% | | | | 1.14% | | | | 1.14% | | | | 1.14% | |
| Expenses after payments, waivers and/or reimbursements and reduction to custodian expenses | | | 1.10%7 | | | | 1.11%7 | | | | 1.11% | | | | 1.14%7 | | | | 1.14%7 | | | | 1.14%7 | |
| Portfolio turnover rate8 | | | 10% | | | | 18% | | | | 22% | | | | 9% | | | | 10% | | | | 12% | |
24 INVESCO OPPENHEIMER INTERNATIONAL GROWTH FUND
1. Represents the last business day of the Fund’s reporting period.
2. Per share amounts calculated based on the average shares outstanding during the period.
3. Includes adjustments in accordance with accounting principles generally accepted in the United States of America and as such, the net asset value for financial reporting purposes and the returns based upon those net asset values may differ from the net asset value and returns for shareholder transactions. Does not include sales charges and is not annualized for periods less than one year, if applicable.
4. Annualized for periods less than one full year.
5. Less than 0.005%.
6. Total expenses including indirect expenses from affiliated fund fees and expenses were as follows:
| | | | | | |
| Eleven Months Ended October 31, 2019 | | | 1.10 | % | | |
| Year Ended November 30, 2018 | | | 1.11 | % | | |
| Year Ended November 30, 2017 | | | 1.13 | % | | |
| Year Ended November 30, 2016 | | | 1.14 | % | | |
| Year Ended November 30, 2015 | | | 1.14 | % | | |
| Year Ended November 28, 2014 | | | 1.14 | % | | |
7. Waiver was less than 0.005%.
8. Portfolio turnover is calculated at the fund level and is not annualized for periods less than one year, if applicable.
See accompanying Notes to Financial Statements.
25 INVESCO OPPENHEIMER INTERNATIONAL GROWTH FUND
FINANCIAL HIGHLIGHTSContinued
| | | | | | | | | | | | | | | | | | | | | | | | |
| | | Eleven Months
Ended | | | Year Ended | | | Year Ended | | | Year Ended | | | Year Ended | | | Year Ended | |
| Class C | | October 31,
2019 | | | November 30,
2018 | | | November 30,
2017 | | | November 30,
2016 | | | November 30,
2015 | | | November 28,
20141 | |
| Per Share Operating Data | | | | | | | | | | | | | | | | | | | | | | | | |
| Net asset value, beginning of period | | | $34.97 | | | | $41.29 | | | | $32.44 | | | | $35.10 | | | | $34.49 | | | | $35.54 | |
| Income (loss) from investment operations: | | | | | | | | | | | | | | | | | | | | | | | | |
| Net investment income2 | | | 0.06 | | | | 0.02 | | | | 0.03 | | | | 0.10 | | | | 0.05 | | | | 0.09 | |
| Net realized and unrealized gain (loss) | | | 4.46 | | | | (6.34) | | | | 8.91 | | | | (2.70) | | | | 0.63 | | | | (1.04) | |
| Total from investment operations | | | 4.52 | | | | (6.32) | | | | 8.94 | | | | (2.60) | | | | 0.68 | | | | (0.95) | |
| Dividends and/or distributions to shareholders: | | | | | | | | | | | | | | | | | | | | | | | | |
| Dividends from net investment income | | | (0.07) | | | | 0.00 | | | | (0.09) | | | | (0.06) | | | | (0.07) | | | | (0.10) | |
| Net asset value, end of period | | | $39.42 | | | | $34.97 | | | | $41.29 | | | | $32.44 | | | | $35.10 | | | | $34.49 | |
| | | | |
| | | | | | | | | | | | | | | | | | | | | | | | |
| Total Return, at Net Asset Value3 | | | 12.95% | | | | (15.31)% | | | | 27.64% | | | | (7.42)% | | | | 1.99% | | | | (2.68)% | |
| | | | | | | | | | | | | | | | | | | | | | | | |
| Ratios/Supplemental Data | | | | | | | | | | | | | | | | | | | | | | | | |
| Net assets, end of period (in thousands) | | | $241,807 | | | | $345,228 | | | | $468,753 | | | | $453,990 | | | | $543,536 | | | | $498,041 | |
| Average net assets (in thousands) | | | $299,061 | | | | $440,539 | | | | $455,969 | | | | $519,037 | | | | $525,184 | | | | $471,895 | |
| Ratios to average net assets:4 | | | | | | | | | | | | | | | | | | | | | | | | |
| Net investment income | | | 0.18% | | | | 0.04% | | | | 0.09% | | | | 0.30% | | | | 0.14% | | | | 0.25% | |
| Expenses excluding specific expenses listed below | | | 1.85% | | | | 1.86% | | | | 1.88% | | | | 1.89% | | | | 1.89% | | | | 1.89% | |
| Interest and fees from borrowings | | | 0.00%5 | | | | 0.00%5 | | | | 0.00%5 | | | | 0.00%5 | | | | 0.00%5 | | | | 0.00% | |
| Total expenses6 | | | 1.85% | | | | 1.86% | | | | 1.88% | | | | 1.89% | | | | 1.89% | | | | 1.89% | |
| Expenses after payments, waivers and/or reimbursements and reduction to custodian expenses | | | 1.85%7 | | | | 1.86%7 | | | | 1.86% | | | | 1.89%7 | | | | 1.89%7 | | | | 1.89%7 | |
| Portfolio turnover rate8 | | | 10% | | | | 18% | | | | 22% | | | | 9% | | | | 10% | | | | 12% | |
26 INVESCO OPPENHEIMER INTERNATIONAL GROWTH FUND
1. Represents the last business day of the Fund’s reporting period.
2. Per share amounts calculated based on the average shares outstanding during the period.
3. Includes adjustments in accordance with accounting principles generally accepted in the United States of America and as such, the net asset value for financial reporting purposes and the returns based upon those net asset values may differ from the net asset value and returns for shareholder transactions. Does not include sales charges and is not annualized for periods less than one year, if applicable.
4. Annualized for periods less than one full year.
5. Less than 0.005%.
6. Total expenses including indirect expenses from affiliated fund fees and expenses were as follows:
| | | | | | |
| Eleven Months Ended October 31, 2019 | | | 1.85 | % | | |
| Year Ended November 30, 2018 | | | 1.86 | % | | |
| Year Ended November 30, 2017 | | | 1.88 | % | | |
| Year Ended November 30, 2016 | | | 1.89 | % | | |
| Year Ended November 30, 2015 | | | 1.89 | % | | |
| Year Ended November 28, 2014 | | | 1.89 | % | | |
7. Waiver was less than 0.005%.
8. Portfolio turnover is calculated at the fund level and is not annualized for periods less than one year, if applicable.
See accompanying Notes to Financial Statements.
27 INVESCO OPPENHEIMER INTERNATIONAL GROWTH FUND
FINANCIAL HIGHLIGHTSContinued
| | | | | | | | | | | | | | | | | | | | | | | | |
| | | Eleven Months
Ended | | | Year Ended | | | Year Ended | | | Year Ended | | | Year Ended | | | Year Ended | |
| Class R | | October 31,
2019 | | | November 30,
2018 | | | November 30,
2017 | | | November 30,
2016 | | | November 30,
2015 | | | November 28,
20141 | |
| Per Share Operating Data | | | | | | | | | | | | | | | | | | | | | | | | |
| Net asset value, beginning of period | | | $36.32 | | | | $42.86 | | | | $33.70 | | | | $36.44 | | | | $35.80 | | | | $36.81 | |
| Income (loss) from investment operations: | | | | | | | | | | | | | | | | | | | | | | | | |
| Net investment income2 | | | 0.24 | | | | 0.23 | | | | 0.21 | | | | 0.27 | | | | 0.23 | | | | 0.28 | |
| Net realized and unrealized gain (loss) | | | 4.61 | | | | (6.58) | | | | 9.25 | | | | (2.79) | | | | 0.65 | | | | (1.09) | |
| Total from investment operations | | | 4.85 | | | | (6.35) | | | | 9.46 | | | | (2.52) | | | | 0.88 | | | | (0.81) | |
| Dividends and/or distributions to shareholders: | | | | | | | | | | | | | | | | | | | | | | | | |
| Dividends from net investment income | | | (0.29) | | | | (0.19) | | | | (0.30) | | | | (0.22) | | | | (0.24) | | | | (0.20) | |
| Net asset value, end of period | | | $40.88 | | | | $36.32 | | | | $42.86 | | | | $33.70 | | | | $36.44 | | | | $35.80 | |
| | | | |
| | | | | | | | | | | | | | | | | | | | | | | | |
| Total Return, at Net Asset Value3 | | | 13.47% | | | | (14.88)% | | | | 28.31% | | | | (6.96)% | | | | 2.50% | | | | (2.19)% | |
| | | | | | | | | | | | | | | | | | | | | | | | |
| Ratios/Supplemental Data | | | | | | | | | | | | | | | | | | | | | | | | |
| Net assets, end of period (in thousands) | | | $313,081 | | | | $377,926 | | | | $486,089 | | | | $390,589 | | | | $400,622 | | | | $369,630 | |
| Average net assets (in thousands) | | | $346,551 | | | | $468,066 | | | | $443,397 | | | | $399,345 | | | | $390,160 | | | | $341,419 | |
| Ratios to average net assets:4 | | | | | | | | | | | | | | | | | | | | | | | | |
| Net investment income | | | 0.68% | | | | 0.54% | | | | 0.55% | | | | 0.78% | | | | 0.64% | | | | 0.74% | |
| Expenses excluding specific expenses listed below | | | 1.35% | | | | 1.36% | | | | 1.38% | | | | 1.38% | | | | 1.39% | | | | 1.39% | |
| Interest and fees from borrowings | | | 0.00%5 | | | | 0.00%5 | | | | 0.00%5 | | | | 0.00%5 | | | | 0.00%5 | | | | 0.00% | |
| Total expenses6 | | | 1.35% | | | | 1.36% | | | | 1.38% | | | | 1.38% | | | | 1.39% | | | | 1.39% | |
| Expenses after payments, waivers and/or reimbursements and reduction to custodian expenses | | | 1.35%7 | | | | 1.36%7 | | | | 1.36% | | | | 1.38%7 | | | | 1.39%7 | | | | 1.39%7 | |
| Portfolio turnover rate8 | | | 10% | | | | 18% | | | | 22% | | | | 9% | | | | 10% | | | | 12% | |
28 INVESCO OPPENHEIMER INTERNATIONAL GROWTH FUND
1. Represents the last business day of the Fund’s reporting period.
2. Per share amounts calculated based on the average shares outstanding during the period.
3. Includes adjustments in accordance with accounting principles generally accepted in the United States of America and as such, the net asset value for financial reporting purposes and the returns based upon those net asset values may differ from the net asset value and returns for shareholder transactions. Does not include sales charges and is not annualized for periods less than one year, if applicable.
4. Annualized for periods less than one full year.
5. Less than 0.005%.
6. Total expenses including indirect expenses from affiliated fund fees and expenses were as follows:
| | | | | | |
| Eleven Months Ended October 31, 2019 | | | 1.35 | % | | |
| Year Ended November 30, 2018 | | | 1.36 | % | | |
| Year Ended November 30, 2017 | | | 1.38 | % | | |
| Year Ended November 30, 2016 | | | 1.38 | % | | |
| Year Ended November 30, 2015 | | | 1.39 | % | | |
| Year Ended November 28, 2014 | | | 1.39 | % | | |
7. Waiver was less than 0.005%.
8. Portfolio turnover is calculated at the fund level and is not annualized for periods less than one year, if applicable.
See accompanying Notes to Financial Statements.
29 INVESCO OPPENHEIMER INTERNATIONAL GROWTH FUND
FINANCIAL HIGHLIGHTSContinued
| | | | | | | | | | | | | | | | | | | | | | | | |
| | | Eleven Months
Ended | | | Year Ended | | | Year Ended | | | Year Ended | | | Year Ended | | | Year Ended | |
| Class Y | | October 31,
2019 | | | November 30,
2018 | | | November 30,
2017 | | | November 30,
2016 | | | November 30,
2015 | | | November 28,
20141 | |
| Per Share Operating Data | | | | | | | | | | | | | | | | | | | | | | | | |
| Net asset value, beginning of period | | | $36.92 | | | | $43.55 | | | | $34.23 | | | | $37.01 | | | | $36.36 | | | | $37.35 | |
| Income (loss) from investment operations: | | | | | | | | | | | | | | | | | | | | | | | | |
| Net investment income2 | | | 0.42 | | | | 0.44 | | | | 0.41 | | | | 0.47 | | | | 0.42 | | | | 0.46 | |
| Net realized and unrealized gain (loss) | | | 4.67 | | | | (6.69) | | | | 9.37 | | | | (2.85) | | | | 0.64 | | | | (1.10) | |
| Total from investment operations | | | 5.09 | | | | (6.25) | | | | 9.78 | | | | (2.38) | | | | 1.06 | | | | (0.64) | |
| Dividends and/or distributions to shareholders: | | | | | | | | | | | | | | | | | | | | | | | | |
| Dividends from net investment income | | | (0.50) | | | | (0.38) | | | | (0.46) | | | | (0.40) | | | | (0.41) | | | | (0.35) | |
| Net asset value, end of period | | | $41.51 | | | | $36.92 | | | | $43.55 | | | | $34.23 | | | | $37.01 | | | | $36.36 | |
| | | | |
| | | | | | | | | | | | | | | | | | | | | | | | |
| Total Return, at Net Asset Value3 | | | 14.01% | | | | (14.47)% | | | | 28.96% | | | | (6.49)% | | | | 2.99% | | | | (1.71)% | |
| | | | | | | | | | | | | | | | | | | | | | | | |
| Ratios/Supplemental Data | | | | | | | | | | | | | | | | | | | | | | | | |
| Net assets, end of period (in thousands) | | | $5,993,234 | | | | $9,329,538 | | | | $12,543,811 | | | | $9,929,295 | | | | $10,782,234 | | | | $8,774,567 | |
| Average net assets (in thousands) | | | $7,384,817 | | | | $11,850,274 | | | | $12,176,817 | | | | $10,731,785 | | | | $10,135,130 | | | | $8,185,239 | |
| Ratios to average net assets:4 | | | | | | | | | | | | | | | | | | | | | | | | |
| Net investment income | | | 1.18% | | | | 1.04% | | | | 1.04% | | | | 1.33% | | | | 1.13% | | | | 1.23% | |
| Expenses excluding specific expenses listed below | | | 0.85% | | | | 0.86% | | | | 0.88% | | | | 0.89% | | | | 0.89% | | | | 0.89% | |
| Interest and fees from borrowings | | | 0.00%5 | | | | 0.00%5 | | | | 0.00%5 | | | | 0.00%5 | | | | 0.00%5 | | | | 0.00% | |
| Total expenses6 | | | 0.85% | | | | 0.86% | | | | 0.88% | | | | 0.89% | | | | 0.89% | | | | 0.89% | |
| Expenses after payments, waivers and/or reimbursements and reduction to custodian expenses | | | 0.85%7 | | | | 0.86%7 | | | | 0.86% | | | | 0.89%7 | | | | 0.89%7 | | | | 0.89%7 | |
| Portfolio turnover rate8 | | | 10% | | | | 18% | | | | 22% | | | | 9% | | | | 10% | | | | 12% | |
30 INVESCO OPPENHEIMER INTERNATIONAL GROWTH FUND
1.Represents the last business day of the Fund’s reporting period.
2.Per share amounts calculated based on the average shares outstanding during the period.
3.Includes adjustments in accordance with accounting principles generally accepted in the United States of America and as such, the net asset value for financial reporting purposes and the returns based upon those net asset values may differ from the net asset value and returns for shareholder transactions. Does not include sales charges and is not annualized for periods less than one year, if applicable.
4.Annualized for periods less than one full year.
5.Less than 0.005%.
6.Total expenses including indirect expenses from affiliated fund fees and expenses were as follows:
| | | | | | |
| Eleven Months Ended October 31, 2019 | | | 0.85 | % | | |
| Year Ended November 30, 2018 | | | 0.86 | % | | |
| Year Ended November 30, 2017 | | | 0.88 | % | | |
| Year Ended November 30, 2016 | | | 0.89 | % | | |
| Year Ended November 30, 2015 | | | 0.89 | % | | |
| Year Ended November 28, 2014 | | | 0.89 | % | | |
7.Waiver was less than 0.005%.
8.Portfolio turnover is calculated at the fund level and is not annualized for periods less than one year, if applicable.
See accompanying Notes to Financial Statements.
31 INVESCO OPPENHEIMER INTERNATIONAL GROWTH FUND
FINANCIAL HIGHLIGHTSContinued
| | | | |
| Class R5 | | Period
Ended
October 31,
20191 | |
| Per Share Operating Data | | | | |
| Net asset value, beginning of period | | | $38.79 | |
| Income (loss) from investment operations: | | | | |
| Net investment income2 | | | 0.23 | |
| Net realized and unrealized gain | | | 2.78 | |
| Total from investment operations | | | 3.01 | |
| Dividends and/or distributions to shareholders: | | | | |
| Dividends from net investment income | | | 0.00 | |
| Net asset value, end of period | | | $41.80 | |
| | | | |
| | | | |
| Total Return, at Net Asset Value3 | | | 7.76% | |
| | | | |
| Ratios/Supplemental Data | | | | |
| Net assets, end of period (in thousands) | | | $11 | |
| Average net assets (in thousands) | | | $10 | |
| Ratios to average net assets:4 | | | | |
| Net investment income | | | 1.29% | |
| Expenses excluding specific expenses listed below | | | 0.74% | |
| Interest and fees from borrowings | | | 0.00% | |
| Total expenses5 | | | 0.74% | |
| Expenses after payments, waivers and/or reimbursements and reduction to custodian expenses | | | 0.74%6 | |
| Portfolio turnover rate7 | | | 10% | |
1. For the period after the close of business on May 24, 2019 (inception of offering) to October 31, 2019.
2. Per share amounts calculated based on the average shares outstanding during the period.
3. Includes adjustments in accordance with accounting principles generally accepted in the United States of America and as such, the net asset value for financial reporting purposes and the returns based upon those net asset values may differ from the net asset value and returns for shareholder transactions. Does not include sales charges and is not annualized for periods less than one year, if applicable.
4. Annualized for periods less than one full year.
5. Total expenses including indirect expenses from affiliated fund fees and expenses were as follows:
| | | | | | |
| Period Ended October 31, 2019 | | | 0.74 | % | | |
6. Waiver was less than 0.005%.
7. Portfolio turnover is calculated at the fund level and is not annualized for periods less than one year, if applicable.
See accompanying Notes to Financial Statements.
32 INVESCO OPPENHEIMER INTERNATIONAL GROWTH FUND
| | | | | | | | | | | | | | | | | | | | | | | | |
| Class R6 | | Eleven Months
Ended
October 31,
2019 | | | Year Ended
November 30,
2018 | | | Year Ended
November 30,
2017 | | | Year Ended
November 30,
2016 | | | Year Ended
November 30,
2015 | | | Year Ended
November 28,
20141 | |
| Per Share Operating Data | | | | | | | | | | | | | | | | | | | | | | | | |
| Net asset value, beginning of period | | | $36.98 | | | | $43.62 | | | | $34.31 | | | | $37.09 | | | | $36.43 | | | | $37.41 | |
| Income (loss) from investment operations: | | | | | | | | | | | | | | | | | | | | | | | | |
| Net investment income2 | | | 0.48 | | | | 0.51 | | | | 0.45 | | | | 0.49 | | | | 0.48 | | | | 0.55 | |
| Net realized and unrealized gain (loss) | | | 4.67 | | | | (6.69) | | | | 9.40 | | | | (2.81) | | | | 0.65 | | | | (1.11) | |
| Total from investment operations | | | 5.15 | | | | (6.18) | | | | 9.85 | | | | (2.32) | | | | 1.13 | | | | (0.56) | |
| Dividends and/or distributions to shareholders: | | | | | | | | | | | | | | | | | | | | | | | | |
| Dividends from net investment income | | | (0.58) | | | | (0.46) | | | | (0.54) | | | | (0.46) | | | | (0.47) | | | | (0.42) | |
| Net asset value, end of period | | | $41.55 | | | | $36.98 | | | | $43.62 | | | | $34.31 | | | | $37.09 | | | | $36.43 | |
| | | | |
| | | | | | | | | | | | | | | | | | | | | | | | |
| Total Return, at Net Asset Value3 | | | 14.18% | | | | (14.32)% | | | | 29.14% | | | | (6.31)% | | | | 3.19% | | | | (1.51)% | |
| | | | | | | | | | | | | | | | | | | | | | | | |
| Ratios/Supplemental Data | | | | | | | | | | | | | | | | | | | | | | | | |
| Net assets, end of period (in thousands) | | | $7,389,864 | | | | $8,682,910 | | | | $10,542,873 | | | | $6,435,502 | | | | $4,381,328 | | | | $3,763,546 | |
| Average net assets (in thousands) | | | $8,002,324 | | | | $10,670,434 | | | | $8,241,107 | | | | $5,488,355 | | | | $4,091,145 | | | | $3,030,734 | |
| Ratios to average net assets:4 | | | | | | | | | | | | | | | | | | | | | | | | |
| Net investment income | | | 1.34% | | | | 1.20% | | | | 1.15% | | | | 1.38% | | | | 1.31% | | | | 1.47% | |
| Expenses excluding specific expenses listed below | | | 0.69% | | | | 0.69% | | | | 0.69% | | | | 0.70% | | | | 0.70% | | | | 0.70% | |
| Interest and fees from borrowings | | | 0.00%5 | | | | 0.00%5 | | | | 0.00%5 | | | | 0.00%5 | | | | 0.00%5 | | | | 0.00% | |
| Total expenses6 | | | 0.69% | | | | 0.69% | | | | 0.69% | | | | 0.70% | | | | 0.70% | | | | 0.70% | |
| Expenses after payments, waivers and/or reimbursements and reduction to custodian expenses | | | 0.69%7 | | | | 0.69%7 | | | | 0.69%7 | | | | 0.70%7 | | | | 0.70%7 | | | | 0.70%7 | |
| Portfolio turnover rate8 | | | 10% | | | | 18% | | | | 22% | | | | 9% | | | | 10% | | | | 12% | |
33 INVESCO OPPENHEIMER INTERNATIONAL GROWTH FUND
FINANCIAL HIGHLIGHTSContinued
1. Represents the last business day of the Fund’s reporting period.
2. Per share amounts calculated based on the average shares outstanding during the period.
3. Includes adjustments in accordance with accounting principles generally accepted in the United States of America and as such, the net asset value for financial reporting purposes and the returns based upon those net asset values may differ from the net asset value and returns for shareholder transactions. Does not include sales charges and is not annualized for periods less than one year, if applicable.
4. Annualized for periods less than one full year.
5. Less than 0.005%.
6. Total expenses including indirect expenses from affiliated fund fees and expenses were as follows:
| | | | | | |
| Eleven Months Ended October 31, 2019 | | | 0.69 | % | | |
| Year Ended November 30, 2018 | | | 0.69 | % | | |
| Year Ended November 30, 2017 | | | 0.69 | % | | |
| Year Ended November 30, 2016 | | | 0.70 | % | | |
| Year Ended November 30, 2015 | | | 0.70 | % | | |
| Year Ended November 28, 2014 | | | 0.70 | % | | |
7. Waiver was less than 0.005%.
8. Portfolio turnover is calculated at the fund level and is not annualized for periods less than one year, if applicable.
See accompanying Notes to Financial Statements.
34 INVESCO OPPENHEIMER INTERNATIONAL GROWTH FUND
NOTES TO FINANCIAL STATEMENTSOctober 31, 2019
Note 1 – Significant Accounting Policies
Invesco Oppenheimer International Growth Fund (the “Fund”) is a series portfolio of AIM International Mutual Funds (Invesco International Mutual Funds) (the “Trust”). The Trust is a Delaware statutory trust registered under the Investment Company Act of 1940, as amended (the “1940 Act”), as anopen-end series management investment company authorized to issue an unlimited number of shares of beneficial interest. Information presented in these financial statements pertains only to the Fund. Matters affecting the Fund or each class will be voted on exclusively by the shareholders of such Fund or each class.
Prior to the close of business on May 24, 2019, the Fund operated as Oppenheimer International Growth Fund(the “Acquired Fund” or “Predecessor Fund”). The Acquired Fund was reorganized after the close of business on May 24, 2019 (the “Reorganization Date”) through the transfer of all of its assets and liabilities to the Fund (the “Reorganization”).
Upon closing of the Reorganization, holders of the Acquired Fund’s Class A, Class C, Class R, and Class Y shares received the corresponding class of shares of the Fund and holders of the Acquired Fund’s Class I shares received Class R6 shares of the Fund. Information for the Acquired Fund’s Class I shares prior to the Reorganization is included with Class R6 shares throughout this report. Class R5 shares commenced operations on the Reorganization Date.
Effective July 31, 2019, the Fund’s fiscal year end changed from November 30 to October 31.
The Fund’s investment objective is to seek capital appreciation.
The Fund currently consists of six different classes of shares: Class A, Class C, Class R, Class Y, Class R5 and Class R6. Class Y shares are available only to certain investors. Class A shares are sold with afront-end sales charge unless certain waiver criteria are met and under certain circumstances load waived shares may be subject to contingent deferred sales charges (“CDSC”). Class C shares are sold with a CDSC. Class R, Class Y, Class R5 and Class R6 shares are sold at net asset value. Class C shares held for ten years after purchase are eligible for automatic conversion into Class A shares of the same Fund (the “Conversion Feature”). The automatic conversion pursuant to the Conversion Feature will generally occur at the end of the month following the tenth anniversary after a purchase of Class C shares.
The Fund is an investment company and accordingly follows the investment company accounting and reporting guidance in accordance with Financial Accounting Standards Board Accounting Standards Codification Topic 946, Financial Services – Investment Companies.
The following is a summary of the significant accounting policies followed by the Fund in the preparation of its financial statements.
A. Security Valuations– Securities, including restricted securities, are valued according to the following policy.
A security listed or traded on an exchange (except convertible securities) is valued at its last sales price or official closing price as of the close of the customary trading session on the exchange where the security is principally traded, or lacking any sales or official closing price on a particular day, the security may be valued at the closing bid price on that day. Securities traded in theover-the-counter market are valued based on prices furnished by independent pricing services or market makers. When such securities are valued by an
35 INVESCO OPPENHEIMER INTERNATIONAL GROWTH FUND
NOTES TO FINANCIAL STATEMENTSContinued
independent pricing service they may be considered fair valued. Futures contracts are valued at the final settlement price set by an exchange on which they are principally traded. Listed options are valued at the mean between the last bid and asked prices from the exchange on which they are principally traded. Options not listed on an exchange are valued by an independent source at the mean between the last bid and asked prices. For purposes of determining net asset value (“NAV”) per share, futures and option contracts generally are valued 15 minutes after the close of the customary trading session of the New York Stock Exchange (“NYSE”).
Investments inopen-end andclosed-end registered investment companies that do not trade on an exchange are valued at theend-of-day net asset value per share. Investments inopen-end andclosed-end registered investment companies that trade on an exchange are valued at the last sales price or official closing price as of the close of the customary trading session on the exchange where the security is principally traded.
Debt obligations (including convertible securities) and unlisted equities are fair valued using an evaluated quote provided by an independent pricing service. Evaluated quotes provided by the pricing service may be determined without exclusive reliance on quoted prices, and may reflect appropriate factors such asinstitution-size trading in similar groups of securities, developments related to specific securities, dividend rate (for unlisted equities), yield (for debt obligations), quality, type of issue, coupon rate (for debt obligations), maturity (for debt obligations), individual trading characteristics and other market data. Pricing services generally value debt obligations assuming orderly transactions of institutional round lot size, but a fund may hold or transact in the same securities in smaller, odd lot sizes. Odd lots often trade at lower prices than institutional round lots. Debt obligations are subject to interest rate and credit risks. In addition, all debt obligations involve some risk of default with respect to interest and/or principal payments.
Foreign securities’ (including foreign exchange contracts) prices are converted into U.S. dollar amounts using the applicable exchange rates as of the close of the NYSE. If market quotations are available and reliable for foreign exchange-traded equity securities, the securities will be valued at the market quotations. Because trading hours for certain foreign securities end before the close of the NYSE, closing market quotations may become unreliable. If between the time trading ends on a particular security and the close of the customary trading session on the NYSE, events occur that the investment adviser determines are significant and make the closing price unreliable, the Fund may fair value the security. If the event is likely to have affected the closing price of the security, the security will be valued at fair value in good faith using procedures approved by the Board of Trustees. Adjustments to closing prices to reflect fair value may also be based on a screening process of an independent pricing service to indicate the degree of certainty, based on historical data, that the closing price in the principal market where a foreign security trades is not the current value as of the close of the NYSE. Foreign securities’ prices meeting the approved degree of certainty that the price is not reflective of current value will be priced at the indication of fair value from the independent pricing service. Multiple factors may be considered by the independent pricing service in determining adjustments to reflect fair value and may include information relating to sector indices, American
36 INVESCO OPPENHEIMER INTERNATIONAL GROWTH FUND
Depositary Receipts and domestic and foreign index futures. Foreign securities may have additional risks including exchange rate changes, potential for sharply devalued currencies and high inflation, political and economic upheaval, the relative lack of issuer information, relatively low market liquidity and the potential lack of strict financial and accounting controls and standards.
Securities for which market prices are not provided by any of the above methods may be valued based upon quotes furnished by independent sources. The last bid price may be used to value equity securities. The mean between the last bid and asked prices is used to value debt obligations, including corporate loans.
Securities for which market quotations are not readily available or became unreliable are valued at fair value as determined in good faith by or under the supervision of the Trust’s officers following procedures approved by the Board of Trustees. Issuer specific events, market trends, bid/asked quotes of brokers and information providers and other market data may be reviewed in the course of making a good faith determination of a security’s fair value.
The Fund may invest in securities that are subject to interest rate risk, meaning the risk that the prices will generally fall as interest rates rise and, conversely, the prices will generally rise as interest rates fall. Specific securities differ in their sensitivity to changes in interest rates depending on their individual characteristics. Changes in interest rates may result in increased market volatility, which may affect the value and/or liquidity of certain Fund investments.
Valuations change in response to many factors including the historical and prospective earnings of the issuer, the value of the issuer’s assets, general economic conditions, interest rates, investor perceptions and market liquidity. Because of the inherent uncertainties of valuation, the values reflected in the financial statements may materially differ from the value received upon actual sale of those investments.
B. Securities Transactions and Investment Income - Securities transactions are accounted for on a trade date basis. Realized gains or losses on sales are computed on the basis of specific identification of the securities sold. Interest income (net of withholding tax, if any) is recorded on the accrual basis from settlement date. Dividend income (net of withholding tax, if any) is recorded on theex-dividend date.
The Fund may periodically participate in litigation related to Fund investments. As such, the Fund may receive proceeds from litigation settlements. Any proceeds received are included in the Statement of Operations as realized gain (loss) for investments no longer held and as unrealized gain (loss) for investments still held.
Brokerage commissions and mark ups are considered transaction costs and are recorded as an increase to the cost basis of securities purchased and/or a reduction of proceeds on a sale of securities. Such transaction costs are included in the determination of net realized and unrealized gain (loss) from investment transactions reported in the Statement of Operations and the Statement of Changes in Net Assets and the net realized and unrealized gains (losses) on securities per share in the Financial Highlights. Transaction costs are included in the calculation of the Fund’s net asset value and, accordingly, they reduce the Fund’s total returns. These transaction costs are not considered operating expenses and
37 INVESCO OPPENHEIMER INTERNATIONAL GROWTH FUND
NOTES TO FINANCIAL STATEMENTSContinued
are not reflected in net investment income reported in the Statement of Operations and the Statement of Changes in Net Assets, or the net investment income per share and the ratios of expenses and net investment income reported in the Financial Highlights, nor are they limited by any expense limitation arrangements between the Fund and the investment adviser.
The Fund allocates income and realized and unrealized capital gains and losses to a class based on the relative net assets of each class.
C. Country Determination- For the purposes of making investment selection decisions and presentation in the Schedule of Investments, the investment adviser may determine the country in which an issuer is located and/or credit risk exposure based on various factors. These factors include the laws of the country under which the issuer is organized, where the issuer maintains a principal office, the country in which the issuer derives 50% or more of its total revenues and the country that has the primary market for the issuer’s securities, as well as other criteria. Among the other criteria that may be evaluated for making this determination are the country in which the issuer maintains 50% or more of its assets, the type of security, financial guarantees and enhancements, the nature of the collateral and the sponsor organization.
D. Distributions - Dividends and distributions to shareholders, which are determined in accordance with income tax regulations and may differ from accounting principles generally accepted in the United States of America (“GAAP”), are recorded on theex-dividend date. Income and capital gain distributions, if any, are declared and paid annually or at other times as determined necessary by the Adviser.
E. Federal Income Taxes - The Fund intends to comply with provisions of the Internal Revenue Code applicable to regulated investment companies and to distribute substantially all of its investment company taxable income, including any net realized gain on investments not offset by capital loss carryforwards, if any, to shareholders. Therefore, no federal income or excise tax provision is required. The Fund files income tax returns in U.S. federal and applicable state jurisdictions. The statute of limitations on the Fund’s tax return filings generally remains open for the three preceding fiscal reporting period ends. The Fund has analyzed its tax positions for the fiscal year ended October 31, 2019, including open tax years, and does not believe there are any uncertain tax positions requiring recognition in the Fund’s financial statements.
The tax components of capital shown in the following table represent distribution requirements the Fund must satisfy under the income tax regulations, losses the Fund may be able to offset against income and gains realized in future years and unrealized appreciation or depreciation of securities and other investments for federal income tax purposes.
38 INVESCO OPPENHEIMER INTERNATIONAL GROWTH FUND
| | | | | | | | | | | | |
Undistributed Net Investment Income | | Undistributed
Long-Term
Gain | | | Accumulated
Loss
Carryforward1,2 | | | Net Unrealized
Appreciation
Based on cost of
Securities and
Other Investments
for Federal Income
Tax Purposes | |
| $173,762,744 | | | $— | | | | $320,622,754 | | | | $5,673,557,592 | |
1. During the reporting period, the Fund did not utilize any capital loss carryforward.
2.During the previous reporting period, the Fund utilized $350,775,131 of capital loss carryforward to offset capital gains realized in that fiscal year.
Net investment income (loss) and net realized gain (loss) may differ for financial statement and tax purposes. The character of dividends and distributions made during the fiscal year from net investment income or net realized gains are determined in accordance with federal income tax requirements, which may differ from the character of net investment income or net realized gains presented in those financial statements in accordance with U.S. GAAP. Also, due to timing of dividends and distributions, the fiscal year in which amounts are distributed may differ from the fiscal year in which the income or net realized gain was recorded by the Fund.
Accordingly, the following amounts have been reclassified for the reporting period. Net assets of the Fund were unaffected by the reclassifications.
| | | | |
Reduction toPaid-in Capital | | Reduction
to Accumulated Net
Realized Loss on Investments | |
| $9,952,569 | | | $9,952,569 | |
The tax character of distributions paid during the reporting periods:
| | | | | | | | | | | | |
| | | Eleven Months
Ended
October 31, 2019 | | | Year Ended
November 30, 2018 | | | Year Ended
November 30, 2017 | |
| Distributions paid from: | | | | | | | | | | | | |
| Ordinary income | | $ | 284,828,489 | | | $ | 242,693,627 | | | $ | 284,079,120 | |
The aggregate cost of securities and other investments and the composition of unrealized appreciation and depreciation of securities and other investments for federal income tax purposes at period end are noted in the following table. The primary difference between book and tax appreciation or depreciation of securities and other investments, if applicable, is attributable to the tax deferral of losses or tax realization of financial statement unrealized gain or loss.
39 INVESCO OPPENHEIMER INTERNATIONAL GROWTH FUND
NOTES TO FINANCIAL STATEMENTSContinued
| | | | |
| Federal tax cost of securities | | $ | 9,965,310,057 | |
| Federal tax cost of other investments | | | 2,782,826 | |
| | | | |
| Total federal tax cost | | $ | 9,968,092,883 | |
| | | | |
| Gross unrealized appreciation | | $ | 6,580,987,376 | |
| Gross unrealized depreciation | | | (907,429,784 | ) |
| | | | |
| Net unrealized appreciation | | $ | 5,673,557,592 | |
| | | | |
| F. | Expenses - Fees provided for under the Rule12b-1 plan of a particular class of the Fund are charged to the operations of such class. Transfer agency fees and expenses and other shareholder recordkeeping fees and expenses attributable to Class R5 and Class R6 are allocated to each share class based on relative net assets.Sub-accounting fees attributable to Class R5 are charged to the operations of the class. Transfer agency fees and expenses and other shareholder recordkeeping fees and expenses relating to all other classes are allocated among those classes based on relative net assets. All other expenses are allocated among the classes based on relative net assets. |
| G. | Accounting Estimates - The financial statements are prepared on a basis in conformity with GAAP, which requires management to make estimates and assumptions that affect the reported amounts of assets and liabilities at the date of the financial statements and the reported amounts of revenues and expenses during the reporting period including estimates and assumptions related to taxation. Actual results could differ from those estimates by a significant amount. In addition, the Fund monitors for material events or transactions that may occur or become known after theperiod-end date and before the date the financial statements are released to print. |
| H. | Indemnifications - Under the Trust’s organizational documents, each Trustee, officer, employee or other agent of the Trust is indemnified against certain liabilities that may arise out of the performance of their duties to the Fund. Additionally, in the normal course of business, the Fund enters into contracts, including the Fund’s servicing agreements, that contain a variety of indemnification clauses. The Fund’s maximum exposure under these arrangements is unknown as this would involve future claims that may be made against the Fund that have not yet occurred. The risk of material loss as a result of such indemnification claims is considered remote. |
| I. | Foreign Currency Translations - Foreign currency is valued at the close of the NYSE based on quotations posted by banks and major currency dealers. Portfolio securities and other assets and liabilities denominated in foreign currencies are translated into U.S. dollar amounts at the date of valuation. Purchases and sales of portfolio securities (net of foreign taxes withheld on disposition) and income items denominated in foreign currencies are translated into U.S. dollar amounts on the respective dates of such transactions. The Fund does not separately account for the portion of the results of operations resulting from changes in foreign exchange rates on investments and the fluctuations arising from changes in market prices of securities held. The combined results of changes in foreign exchange rates and the fluctuation of market prices on investments (net of estimated foreign tax withholding) are included with the net realized and unrealized gain or loss from investments in the Statement of Operations. Reported net realized foreign currency gains |
40 INVESCO OPPENHEIMER INTERNATIONAL GROWTH FUND
| | or losses arise from (1) sales of foreign currencies, (2) currency gains or losses realized between the trade and settlement dates on securities transactions, and (3) the difference between the amounts of dividends, interest, and foreign withholding taxes recorded on the Fund’s books and the U.S. dollar equivalent of the amounts actually received or paid. Net unrealized foreign currency gains and losses arise from changes in the fair values of assets and liabilities, other than investments in securities at fiscal period end, resulting from changes in exchange rates. The Fund may invest in foreign securities, which may be subject to foreign taxes on income, gains on investments or currency repatriation, a portion of which may be recoverable. Foreign taxes, if any, are recorded based on the tax regulations and rates that exist in the foreign markets in which the Fund invests and are shown in the Statement of Operations. |
Note 2 – Advisory Fees and Other Fees Paid to Affiliates
The Trust has entered into a master investment advisory agreement with Invesco Advisers, Inc. (the “Adviser” or “Invesco”). Under the terms of the investment advisory agreement, the Fund accrues daily and pays monthly an advisory fee to the Adviser based on the annual rate of the Fund’s average daily net assets as follows:
| | | | |
| Fee Schedule* | | | | |
| First $250 million | | | 0.80 | % |
| Next $250 million | | | 0.77 | |
| Next $500 million | | | 0.75 | |
| Next $1 billion | | | 0.69 | |
| Next $3 billion | | | 0.67 | |
| Next $5 billion | | | 0.65 | |
| Next $10 billion | | | 0.63 | |
| Next $10 billion | | | 0.61 | |
| Over $30 billion | | | 0.59 | |
*The advisory fee paid by the Fund shall be reduced by any amounts paid by the Fund under the administrative services agreement with the Adviser.
For the period ended October 31, 2019, the effective advisory fee incurred by the Fund was 0.65% annualized.
From the beginning of the fiscal period until the date of the Reorganization, the Acquired Fund paid $60,100,355 in advisory fees to OFI Global Asset Management, Inc. based on the annual rates above of the Acquired Fund’s average daily net assets.
Under the terms of a mastersub-advisory agreement between the Adviser and each of Invesco Asset Management Deutschland GmbH, Invesco Asset Management Limited, Invesco Asset Management (Japan) Limited, Invesco Hong Kong Limited, Invesco Senior Secured Management, Inc. and Invesco Canada Ltd. and separatesub-advisory agreements with Invesco Capital Management LLC, and Invesco Asset Management (India) Private Limited (collectively, the “AffiliatedSub-Advisers”) the Adviser, not the Fund, will pay 40% of the fees paid to the Adviser to any such AffiliatedSub-Adviser(s) that provide(s) discretionary investment management services to the Fund based on the percentage of assets allocated to such AffiliatedSub-Adviser(s). Invesco has also entered into aSub-Advisory Agreement with
41 INVESCO OPPENHEIMER INTERNATIONAL GROWTH FUND
NOTES TO FINANCIAL STATEMENTSContinued
OppenheimerFunds, Inc. to provide discretionary management services to the Funds.
Effective on the Reorganization Date, the Adviser has contractually agreed, through at least May 31, 2021, to waive advisory fees and/or reimburse expenses of all shares to the extent necessary to limit the total annual fund operating expenses after fee waiver and/or expense reimbursement (excluding certain items discussed below) of Class A, Class C, Class R, Class Y, Class R5 and Class R6 shares to 1.10%, 1.85%, 1.35%, 0.85%, 0.74% and 0.69%, respectively, of the Fund’s average daily net assets (the “expense limits”). In determining the Adviser’s obligation to waive advisory fees and/or reimburse expenses, the following expenses are not taken into account, and could cause total annual fund operating expenses after fee waivers and/or expense reimbursement to exceed the numbers reflected above: (1) interest; (2) taxes; (3) dividend expenses on short sales; (4) extraordinary ornon-routine items, including litigation expenses; and (5) expenses that the Fund has incurred but did not actually pay because of an expense offset arrangement. Unless Invesco continues the fee waiver agreement, it will terminate May 31, 2021. During its term, the fee waiver agreement cannot be terminated or amended to increase the expense limits or reduce the advisory fee waiver without approval of the Board of Trustees.
Further, the Adviser has contractually agreed, through at least June 30, 2021, to waive the advisory fee payable by the Fund in an amount equal to 100% of the net advisory fees the Adviser receives from the affiliated money market funds on investments by the Fund of uninvested cash in such affiliated money market funds.
For the period ended October 31, 2019, the Adviser waived advisory fees of $342,746 and reimbursed fund expenses of $159,486, $24,475, $32,419, $626,564, $1, and $101,918 for Class A, Class C, Class R, Class Y, Class R5, and Class R6, respectively.
The Trust has entered into a master administrative services agreement with Invesco pursuant to which the Fund has agreed to pay Invesco for certain administrative costs incurred in providing accounting services to the Fund. For the periodended October 31, 2019, expenses incurred under the agreement are shown in the Statement of Operations as Administration fees. Additionally, Invesco has entered into service agreements whereby Citibankserves as custodian to the Fund. Prior to the Reorganization, the Acquired Fund paid administrative fees to OFI Global Asset Management, Inc.
The Trust has entered into a transfer agency and service agreement with Invesco Investment Services, Inc. (“IIS”) pursuant to which the Fund has agreed to pay IIS a fee for providing transfer agency and shareholder services to the Fund and reimburse IIS for certain expenses incurred by IIS in the course of providing such services. IIS may make payments to intermediaries that provide omnibus account services,sub-accounting services and/or networking services. All fees payable by IIS to intermediaries that provide omnibus account services orsub-accounting services are charged back to the Fund, subject to certain limitations approved by the Trust’s Board of Trustees. Prior to the Reorganization, the Acquired Fund paid transfer agent fees to OFI Global Asset Management, Inc. and Shareholder Services, Inc. For the periodended October 31, 2019, expenses incurred under these agreements are shown in the Statement of Operations as Transfer and shareholder servicing agent fees.
The Trust has entered into master distribution agreements with Invesco Distributors, Inc. (“IDI”) to serve as the distributor for the Class A, Class C, Class R, Class Y, Class R5 and Class
42 INVESCO OPPENHEIMER INTERNATIONAL GROWTH FUND
R6 shares of the Fund. The Trust has adopted plans pursuant to Rule12b-1 under the 1940 Act with respect to the Fund’s Class A, Class C and Class R shares (collectively the “Plan”). The Fund, pursuant to the Class A Plan, reimburses IDI in an amount up to an annual rate of 0.25% of the average daily net assets of Class A shares. The Fund pursuant to the Class C and Class R Plan, pays IDI compensation at the annual rate of 1.00% of the average daily net assets of Class C shares and 0.50% of the average daily net assets of Class R shares. The fees are accrued daily and paid monthly. Of the Plan payments, up to 0.25% of the average daily net assets of each class of shares may be paid to furnish continuing personal shareholder services to customers who purchase and own shares of such classes. Any amounts not paid as a service fee under the Plan would constitute an asset-based sales charge. Rules of the Financial Industry Regulatory Authority (“FINRA”) impose a cap on the total sales charges, including asset-based sales charges, that may be paid by any class of shares of the Fund plans. Prior to the Reorganization, the Acquired Fund paid distribution fees to OppenheimerFunds Distributor, Inc. For the period ended October 31, 2019, expenses incurred under the plans are shown in the Statement of Operations as Distribution and service plan fees.
Front-end sales commissions and CDSC (collectively, the “sales charges”) are not recorded as expenses of the Fund.Front-end sales commissions are deducted from proceeds from the sales of Fund shares prior to investment in Class A shares of the Fund. CDSC are deducted from redemption proceeds prior to remittance to the shareholder. During the period ended October 31, 2019, IDI advised the Fund that IDI retained $40,116 infront-end sales commissions from the sale of Class A shares and $806 and $7,788 from Class A and Class C shares, respectively, for CDSC imposed on redemptions by shareholders. From the beginning of the fiscal year to the date of the Reorganization, OppenheimerFunds Distributor, Inc. retained $73,837 in front–end sales commissions from the sale of Class A shares and $6,315 and $19,510 from Class A and Class C shares, respectively, for CDSC imposed on redemption by shareholders.
Certain officers and trustees of the Trust are officers and directors of the Adviser, IIS and/or IDI.
Note 3 – Additional Valuation Information
GAAP defines fair value as the price that would be received to sell an asset or paid to transfer a liability in an orderly transaction between market participants at the measurement date, under current market conditions. GAAP establishes a hierarchy that prioritizes the inputs to valuation methods, giving the highest priority to readily available unadjusted quoted prices in an active market for identical assets (Level 1) and the lowest priority to significant unobservable inputs (Level 3), generally when market prices are not readily available or are unreliable. Based on the valuation inputs, the securities or other investments are tiered into one of three levels. Changes in valuation methods may result in transfers in or out of an investment’s assigned level:
Level 1 — Prices are determined using quoted prices in an active market for identical assets.
Level 2 — Prices are determined using other significant observable inputs. Observable
43 INVESCO OPPENHEIMER INTERNATIONAL GROWTH FUND
NOTES TO FINANCIAL STATEMENTSContinued
inputs are inputs that other market participants may use in pricing a security. These may include quoted prices for similar securities, interest rates, prepayment speeds, credit risk, yield curves, loss severities, default rates, discount rates, volatilities and others.
Level 3 — Prices are determined using significant unobservable inputs. In situations where quoted prices or observable inputs are unavailable (for example, when there is little or no market activity for an investment at the end of the period), unobservable inputs may be used. Unobservable inputs reflect the Fund’s own assumptions about the factors market participants would use in determining fair value of the securities or instruments and would be based on the best available information.
The following is a summary of the tiered valuation input levels, as of October 31, 2019. The level assigned to the securities valuations may not be an indication of the risk or liquidity associated with investing in those securities. Because of the inherent uncertainties of valuation, the values reflected in the financial statements may materially differ from the value received upon actual sale of those investments.
| | | | | | | | | | | | | | | | |
| | | Level 1—
Unadjusted
Quoted Prices | | | Level 2— Other Significant
Observable Inputs | | | Level 3—
Significant
Unobservable
Inputs | | | Value | |
| Assets Table | | | | | | | | | | | | | | | | |
| Investments, at Value: | | | | | | | | | | | | | | | | |
| Common Stocks | | | | | | | | | | | | | | | | |
Consumer Discretionary | | $ | 451,654,710 | | | $ | 1,989,093,838 | | | $ | — | | | $ | 2,440,748,548 | |
Consumer Staples | | | 592,069,315 | | | | 1,036,525,010 | | | | — | | | | 1,628,594,325 | |
Energy | | | — | | | | 155,523,778 | | | | — | | | | 155,523,778 | |
Financials | | | 324,893,577 | | | | 352,339,960 | | | | — | | | | 677,233,537 | |
Health Care | | | 456,544,781 | | | | 2,387,067,765 | | | | — | | | | 2,843,612,546 | |
Industrials | | | — | | | | 3,160,431,326 | | | | — | | | | 3,160,431,326 | |
Information Technology | | | 291,700,299 | | | | 3,567,988,193 | | | | — | | | | 3,859,688,492 | |
Materials | | | 248,529,986 | | | | 438,247,292 | | | | — | | | | 686,777,278 | |
| Preferred Stock | | | 1,225,600 | | | | — | | | | — | | | | 1,225,600 | |
| Investment Company | | | 196,446,145 | | | | — | | | | — | | | | 196,446,145 | |
| | | | |
| Total Assets | | $ | 2,563,064,413 | | | $ | 13,087,217,162 | | | $ | — | | | $ | 15,650,281,575 | |
| | | | |
Forward currency exchange contracts and futures contracts, if any, are reported at their unrealized appreciation/depreciation at measurement date, which represents the change in the contract’s value from trade date. All additional assets and liabilities included in the above table are reported at their market value at measurement date.
Note 4 - Security Transactions with Affiliated Funds
The Fund is permitted to purchase or sell securities from or to certain other Invesco Funds under specified conditions outlined in procedures adopted by the Board of Trustees of the Trust. The procedures have been designed to ensure that any purchase or sale of securities by the Fund from or to another fund or portfolio that is or could be considered an affiliate by virtue of having a common investment adviser (or affiliated investment advisers), common Trustees and/or common officers complies with Rule17a-7 of the 1940 Act. Further, as defined
44 INVESCO OPPENHEIMER INTERNATIONAL GROWTH FUND
under the procedures, each transaction is effected at the current market price. Pursuant to these procedures for the period December 1, 2018 to May 24, 2019, the Predecessor Fund engaged in transactions with affiliates as listed: Securities purchases of $90,078,348 and securities sales of $17,518,399, which resulted in net realized gains (losses) of $2,969,333. For the period May 25, 2019 to October 31, 2019, the Fund did not engage in transactions with affiliates.
Note 5 – Expense Offset Arrangement
The expense offset arrangement is comprised of custodian credits which result from periodic overnight cash balances at the custodian. For the period ended October 31, 2019, the Fund received credits from this arrangement, which resulted in the reduction of the Fund’s total expenses of $152,866.
Note 6 – Trustee and Officer Fees and Benefits
The Fund has adopted an unfunded retirement plan (the “Plan”) for the Fund’s Independent Trustees. Benefits are based on years of service and fees paid to each Trustee during their period of service. The Plan was frozen with respect to adding new participants effective December 31, 2006 (the “Freeze Date”) and existing Plan Participants as of the Freeze Date will continue to receive accrued benefits under the Plan. Active Independent Trustees as of the Freeze Date have each elected a distribution method with respect to their benefits under the Plan.
During the reporting period, the Fund’s projected benefit obligations, payments to retired Trustees and accumulated liability were as follows:
| | | | |
| Projected Benefit Obligations Increased | | | $ — | |
| Payments Made to Retired Trustees | | | 5,846 | |
| Accumulated Liability as of October 31, 2019 | | | 102,758 | |
Certain trustees have executed a Deferred Compensation Agreement pursuant to which they have the option to elect to defer receipt of all or a portion of the annual compensation they are entitled to receive from the Fund. For purposes of determining the amount owed to the Trustee under the plan, deferred amounts are treated as though equal dollar amounts had been invested in shares of the Fund or in other Invesco and/or Invesco Oppenheimer funds selected by the Trustee. The Fund purchases shares of the funds selected for deferral by the Trustee in amounts equal to his or her deemed investment, resulting in a Fund asset equal to the deferred compensation liability. Such assets are included as a component of “Other” within the asset section of the Statement of Assets and Liabilities. Deferral of Trustees’ fees under the plan will not affect the net assets of the Fund and will not materially affect the Fund’s assets, liabilities or net investment income per share. Amounts will be deferred until distributed in accordance with the compensation deferral plan.
45 INVESCO OPPENHEIMER INTERNATIONAL GROWTH FUND
NOTES TO FINANCIAL STATEMENTSContinued
Note 7 – Cash Balances
The Fund is permitted to temporarily carry a negative or overdrawn balance in its account with Citibank, N.A., the custodian bank. Such balances, if any atperiod-end, are shown in the Statement of Assets and Liabilities under the payable caption Amount due to custodian. To compensate the custodian bank for such overdrafts, the overdrawn Fund may either (1) leave funds as a compensating balance in the account so the custodian bank can be compensated by earning the additional interest; or (2) compensate by paying the custodian bank at a rate agreed upon by the custodian bank and Invesco, not to exceed the contractually agreed upon rate.
Note 8 – Investment Transactions
The aggregate amount of investment securities (other than short-term securities, U.S. Treasury obligations and money market funds, if any) purchased and sold by the Fund during theperiod ended October 31, 2019 was $1,692,570,327 and $7,872,380,245, respectively. Cost of investments, including any derivatives, on a tax basis includes the adjustments for financial reporting purposes as of the most recently completed federal income tax reportingperiod-end.
Note 9 – Share Information
Transactions in shares of beneficial interest were as follows:
| | | | | | | | | | | | | | | | | | | | | | | | |
| | | Eleven Months Ended
October 31, 20191 | | | Year Ended November 30, 2018 | | | Year Ended November 30, 2017 | |
| | | Shares | | | Amount | | | Shares | | | Amount | | | Shares | | | Amount | |
| Class A | | | | | | | | | | | | | | | | | | | | | | | | |
| Sold | | | 6,871,447 | | | $ | 264,050,494 | | | | 13,042,124 | | | $ | 560,127,026 | | | | 23,384,713 | | | $ | 891,969,392 | |
| Automatic Conversion Class C to Class A | | | 1,171,497 | | | | 47,493,837 | | | | — | | | | — | | | | — | | | | — | |
| Dividends and/or distributions reinvested | | | 502,245 | | | | 18,060,735 | | | | 368,768 | | | | 15,982,424 | | | | 1,102,537 | | | | 37,916,263 | |
| Redeemed | | | (24,582,143 | ) | | | (955,377,283 | ) | | | (29,869,620 | ) | | | (1,279,424,242 | ) | | | (74,019,607 | ) | | | (2,805,234,067 | ) |
| Net increase (decrease) | | | (16,036,954 | ) | | $ | (625,772,217 | ) | | | (16,458,728 | ) | | $ | (703,314,792 | ) | | | (49,532,357 | ) | | $ | (1,875,348,412 | ) |
| | | | | | | | | | | | | | | | | | | | | | | | |
| | | | | | | | | | | | | | | | | | | | | | | | |
| Class B | | | | | | | | | | | | | | | | | | | | | | | | |
| Sold | | | — | | | $ | — | | | | 991 | | | $ | 42,173 | | | | 7,036 | | | $ | 258,875 | |
| Dividends and/or distributions reinvested | | | — | | | | — | | | | — | | | | — | | | | — | | | | — | |
| Redeemed2 | | | — | | | | — | | | | (74,086 | ) | | | (3,139,014 | ) | | | (167,466 | ) | | | (6,167,896 | ) |
| Net increase (decrease) | | | — | | | $ | — | | | | (73,095 | ) | | $ | (3,096,841 | ) | | | (160,430 | ) | | $ | (5,909,021 | ) |
| | | | | | | | | | | | | | | | | | | | | | | | |
46 INVESCO OPPENHEIMER INTERNATIONAL GROWTH FUND
| | | | | | | | | | | | | | | | | | | | | | | | |
| | | Eleven Months Ended October 31, 20191 | | | Year Ended November 30, 2018 | | | Year Ended November 30, 2017 | |
| | | Shares | | | Amount | | | Shares | | | Amount | | | Shares | | | Amount | |
| Class C | | | | | | | | | | | | | | | | | | | | | | | | |
| Sold | | | 553,040 | | | $ | 19,733,822 | | | | 1,363,260 | | | $ | 56,199,892 | | | | 1,734,397 | | | $ | 65,069,982 | |
| Dividends and/or distributions reinvested | | | 17,797 | | | | 608,658 | | | | — | | | | — | | | | 33,508 | | | | 1,096,381 | |
| Automatic Conversion | | | (1,237,300 | ) | | | (47,493,837 | ) | | | — | | | | — | | | | — | | | | — | |
| Class C to Class A Redeemed | | | (3,071,796 | ) | | | (112,906,275 | ) | | | (2,843,103 | ) | | | (114,374,595 | ) | | | (4,410,945 | ) | | | (160,855,668) | |
| | | | |
| Net increase (decrease) | | | (3,738,259 | ) | | $ | (140,057,632 | ) | | | (1,479,843 | ) | | $ | (58,174,703 | ) | | | (2,643,040 | ) | | $ | (94,689,305) | |
| | | | |
| | | | | | | | | | | | | | | | | | | | | | | | |
| Class R | | | | | | | | | | | | | | | | | | | | | | | | |
| Sold | | | 1,426,463 | | | $ | 53,719,770 | | | | 2,704,918 | | | $ | 114,658,142 | | | | 2,931,234 | | | $ | 112,559,356 | |
| Dividends and/or distributions reinvested | | | 78,761 | | | | 2,781,038 | | | | 45,886 | | | | 1,952,456 | | | | 92,861 | | | | 3,138,702 | |
| Redeemed | | | (4,253,256 | ) | | | (163,704,794 | ) | | | (3,685,874 | ) | | | (154,013,248 | ) | | | (3,272,073 | ) | | | (124,891,722) | |
| | | | |
| Net increase (decrease) | | | (2,748,032 | ) | | $ | (107,203,986 | ) | | | (935,070 | ) | | $ | (37,402,650 | ) | | | (247,978 | ) | | $ | (9,193,664) | |
| | | | |
| | | | | | | | | | | | | | | | | | | | | | | | |
| Class Y | | | | | | | | | | | | | | | | | | | | | | | | |
| Sold | | | 38,196,649 | | | $ | 1,438,608,285 | | | | 75,558,580 | | | $ | 3,241,532,895 | | | | 150,941,870 | | | $ | 5,785,785,346 | |
| Dividends and/or distributions reinvested | | | 2,617,559 | | | | 93,420,675 | | | | 2,017,447 | | | | 86,851,078 | | | | 2,702,975 | | | | 92,387,703 | |
| Redeemed | | | (149,109,574 | ) | | | (5,706,907,010 | ) | | | (112,942,542 | ) | | | (4,808,411,697 | ) | | | (155,637,371 | ) | | | (6,147,887,277) | |
| | | | |
| Net increase (decrease) | | | (108,295,366 | ) | | $ | (4,174,878,050 | ) | | | (35,366,515 | ) | | $ | (1,480,027,724 | ) | | | (1,992,526 | ) | | $ | (269,714,228) | |
| | | | |
| | | | | | | | | | | | | | | | | | | | | | | | |
| Class R53 | | | | | | | | | | | | | | | | | | | | | | | | |
| Sold | | | 258 | | | $ | 10,000 | | | | — | | | $ | — | | | | — | | | $ | — | |
| Dividends and/or distributions reinvested | | | — | | | | — | | | | — | | | | — | | | | — | | | | — | |
| Redeemed | | | — | | | | — | | | | — | | | | — | | | | — | | | | — | |
| | | | |
| Net increase (decrease) | | | 258 | | | $ | 10,000 | | | | — | | | $ | — | | | | — | | | $ | — | |
| | | | |
| | | | | | | | | | | | | | | | | | | | | | | | |
| Class R6 | | | | | | | | | | | | | | | | | | | | | | | | |
| Sold | | | 48,275,973 | | | $ | 1,845,003,663 | | | | 72,450,594 | | | $ | 3,098,489,284 | | | | 112,679,234 | | | $ | 4,474,908,956 | |
| Dividends and/or distributions reinvested | | | 3,293,319 | | | | 117,472,702 | | | | 2,213,095 | | | | 95,273,724 | | | | 2,802,712 | | | | 95,796,703 | |
| Redeemed | | | (108,498,191 | ) | | | (4,151,887,833 | ) | | | (81,556,482 | ) | | | (3,396,952,921 | ) | | | (61,395,521 | ) | | | (2,403,705,967) | |
| | | | |
| Net increase (decrease) | | | (56,928,899 | ) | | $ | (2,189,411,468 | ) | | | (6,892,793 | ) | | $ | (203,189,913 | ) | | | 54,086,425 | | | $ | 2,166,999,692 | |
| | | | |
47 INVESCO OPPENHEIMER INTERNATIONAL GROWTH FUND
NOTES TO FINANCIAL STATEMENTSContinued
1.There are entities that are record owners of more than 5% of the outstanding shares of the Fund and own 39% of the outstanding shares of the Fund. IDI has an agreement with these entities to sell Fund shares. The Fund, Invesco and/or Invesco affiliates may make payments to these entities, which are considered to be related to the Fund, for providing services to the Fund, Invesco and/or Invesco affiliates, including but not limited to services such as securities brokerage, distribution, third party record keeping and account servicing. The Fund has no knowledge as to whether all or any portion of the shares owned of record by these entities are also owned beneficially.
In addition, 8% of the outstanding shares of the Fund are owned by the Adviser or an affiliate of the Adviser.
2. All outstanding Class B shares converted to Class A shares on June 1, 2018.
3. Commencement date after the close of business on May 24, 2019.
Note 10 – Borrowings
Joint Credit Facility.A number of mutual funds managed by the Adviser participate in a $1.95 billion revolving credit facility (the “Facility”) intended to provide short-term financing, if necessary, subject to certain restrictions in connection with atypical redemption activity. Expenses and fees related to the Facility are paid by the participating funds and are disclosed separately or as other expenses on the Statement of Operations. The Fund did not utilize the Facility during the reporting period. The Facility terminated May 24, 2019.
48 INVESCO OPPENHEIMER INTERNATIONAL GROWTH FUND
REPORT OF INDEPENDENT REGISTERED PUBLIC ACCOUNTING FIRM
To the Board of Trustees of AIM International Mutual Funds (Invesco International Mutual Funds) and Shareholders of Invesco Oppenheimer International Growth Fund
Opinion on the Financial Statements
We have audited the accompanying statement of assets and liabilities, including the schedule of investments, of Invesco Oppenheimer International Growth Fund (one of the funds constituting AIM International Mutual Funds (Invesco International Mutual Funds), referred to hereafter as the “Fund”) as of October 31, 2019, the related statements of operations and of changes in net assets for the period from December 1, 2018 through October 31, 2019, including the related notes, and the financial highlights for each of the periods ended October 31, 2019 (collectively referred to as the “financial statements”). In our opinion, the financial statements present fairly, in all material respects, the financial position of the Fund as of October 31, 2019, the results of its operations and changes in its net assets for the period from December 1, 2018 through October 31, 2019 and the financial highlights for each of the periods ended October 31, 2019 in conformity with accounting principles generally accepted in the United States of America.
The financial statements of Invesco Oppenheimer International Growth Fund (formerly known as Oppenheimer International Growth Fund) as of and for the year ended November 30, 2018 and the financial highlights for each of the periods ended on or prior to November 30, 2018 (not presented herein, other than the statements of operations and of changes in net assets and the financial highlights) were audited by other auditors whose report dated January 22, 2019 expressed an unqualified opinion on those financial statements and financial highlights.
Basis for Opinion
These financial statements are the responsibility of the Fund’s management. Our responsibility is to express an opinion on the Fund’s financial statements based on our audit. We are a public accounting firm registered with the Public Company Accounting Oversight Board (United States) (PCAOB) and are required to be independent with respect to the Fund in accordance with the U.S. federal securities laws and the applicable rules and regulations of the Securities and Exchange Commission and the PCAOB.
We conducted our audit of these financial statements in accordance with the standards of the PCAOB. Those standards require that we plan and perform the audit to obtain reasonable assurance about whether the financial statements are free of material misstatement, whether due to error or fraud.
Our audit included performing procedures to assess the risks of material misstatement of the financial statements, whether due to error or fraud, and performing procedures that respond to those risks. Such procedures included examining, on a test basis, evidence regarding the amounts and disclosures in the financial statements. Our audit also included evaluating the accounting principles used and significant estimates made by management, as well as evaluating the overall presentation of the financial statements. Our procedures included confirmation of securities owned as of October 31, 2019 by correspondence with the custodian, transfer agent and brokers; when replies were not received from brokers, we performed other auditing procedures. We believe that our audit provides a reasonable basis for our opinion.
49 INVESCO OPPENHEIMER INTERNATIONAL GROWTH FUND
REPORT OF INDEPENDENT REGISTERED PUBLIC ACCOUNTING FIRM
/s/PricewaterhouseCoopers LLP
Houston, Texas
December 27, 2019
We have served as the auditor of one or more of the investment companies in the Invesco group of investment companies since at least 1995. We have not been able to determine the specific year we began serving as auditor.
50 INVESCO OPPENHEIMER INTERNATIONAL GROWTH FUND
INDEPENDENT REGISTERED PUBLIC ACCOUNTING FIRM
The Audit Committee of the Board of Trustees appointed, and the Board of Trustees ratified and approved, PricewaterhouseCoopers LLP (“PwC”) as the independent registered public accounting firm of the Fund for the fiscal periods ending after May 24, 2019. Prior to the close of business on May 24, 2019, the Predecessor Fund was a separate series of an unaffiliated investment company and its financial statements were audited by a different independent registered public accounting firm (the “Prior Auditor”).
Effective after the close of business on May 24, 2019, the Prior Auditor resigned as the independent registered public accounting firm of the Fund. The Prior Auditor’s report on the financial statements of the Predecessor Fund for the past two fiscal years did not contain an adverse or disclaimer of opinion, and was not qualified or modified as to uncertainty, audit scope or accounting principles. During the Predecessor Fund’s two most recent fiscal years and through the close of business on May 24, 2019, there were no (1) disagreements with the Prior Auditor on any matter of accounting principles or practices, financial statement disclosure, or auditing scope or procedure, which disagreements, if not resolved to the Prior Auditor’s satisfaction, would have caused it to make reference to that matter in connection with its report; or (2) “reportable events,” as that term is defined in Item 304(a)(1)(v) of RegulationS-K under the Securities Exchange Act of 1934.
51 INVESCO OPPENHEIMER INTERNATIONAL GROWTH FUND
FEDERAL INCOME TAX INFORMATION
In early 2019, if applicable, shareholders of record received information regarding all dividends and distributions paid to them by the Fund during calendar year 2018.
Dividends, if any, paid by the Fund during the reporting period which are not designated as capital gain distributions should be multiplied by the maximum amount allowable but not less than 0.39% to arrive at the amount eligible for the corporate dividend-received deduction.
A portion, if any, of the dividends paid by the Fund during the reporting period which are not designated as capital gain distributions are eligible for lower individual income tax rates to the extent that the Fund has received qualified dividend income as stipulated by recent tax legislation. The maximum amount allowable but not less than $297,413,849 of the Fund’s fiscal year taxable income may be eligible for the lower individual income tax rates. In early 2019, shareholders of record received information regarding the percentage of distributions that are eligible for lower individual income tax rates.
Recent tax legislation allows a regulated investment company to designate distributions not designated as capital gain distributions, as either interest related dividends or short-term capital gain dividends, both of which are exempt from the U.S. withholding tax applicable to non U.S. taxpayers. For the reporting period, the maximum amount allowable but not less than $4,724,337 of the ordinary distributions to be paid by the Fund qualifies as an interest related dividend.
The Fund has elected the application of Section 853 of the Internal Revenue Code to permit shareholders to take a federal income tax credit or deduction, at their option, on a per share basis. The maximum amount allowable but not less than $34,790,420 of foreign income taxes were paid by the Fund during the reporting period. A separate notice will be mailed to each shareholder, which will reflect the proportionate share of such foreign taxes which must be treated by shareholders as gross income for federal income tax purposes.
Gross income of the maximum amount allowable but not less than $219,844,260 was derived from sources within foreign countries or possessions of the United States.
The foregoing information is presented to assist shareholders in reporting distributions received from the Fund to the Internal Revenue Service. Because of the complexity of the federal regulations which may affect your individual tax return and the many variations in state and local tax regulations, we recommend that you consult your tax advisor for specific guidance.
52 INVESCO OPPENHEIMER INTERNATIONAL GROWTH FUND
PORTFOLIO PROXY VOTING POLICIES AND GUIDELINES;
UPDATES TO SCHEDULE OF INVESTMENTS
Go paperless with eDelivery
Visit invesco.com/edelivery to enjoy the convenience and security of anytime electronic access to your investment documents.
With eDelivery, you can elect to have any or all of the following materials delivered straight to your inbox to download, save and print from your own computer:
● Fund reports and prospectuses
● Quarterly statements
● Daily confirmations
● Tax forms
Invesco mailing information
Send general correspondence to Invesco Investment Services, Inc., P.O. Box 219078, Kansas City, MO 64121-9078.
Important notice regarding delivery of security holder documents
To reduce Fund expenses, only one copy of most shareholder documents may be mailed to shareholders with multiple accounts at the same address (Householding). Mailing of your shareholder documents may be householded indefinitely unless you instruct us otherwise. If you do not want the mailing of these documents to be combined with those for other members of your household, please contact Invesco Investment Services, Inc. at 800 959 4246 or contact your financial institution. We will begin sending you individual copies for each account within 30 days after receiving your request.
Fund holdings and proxy voting information
The Fund provides a complete list of its holdings four times in each fiscal year, at the quarter ends. For the second and fourth quarters, the lists appear in the Fund’s semiannual and annual reports to shareholders. For the first and third quarters, the Fund files the lists with the Securities and Exchange Commission (SEC) as an exhibit to its reports on FormN-PORT. The most recent list of portfolio holdings is available at invesco.com/completeqtrholdings. Shareholders can also look up the Fund’s FormsN-PORT on the SEC website at sec.gov.
A description of the policies and procedures that the Fund uses to determine how to vote proxies relating to portfolio securities is available without charge, upon request, from our Client Services department at 800 959 4246 or at invesco.com/proxyguidelines. The information is also available on the SEC website, sec.gov.
Information regarding how the Fund voted proxies related to its portfolio securities during the most recent12-month period ended June 30 is available at invesco.com/proxysearch. The information is also available on the SEC website, sec.gov.
Invesco Advisers, Inc. is an investment adviser; it provides investment advisory services to individual and institutional clients and does not sell securities. Invesco Distributors, Inc. is the US distributor for Invesco Ltd.’s retail mutual funds, exchange-traded funds and institutional money market funds. Both are wholly owned, indirect subsidiaries of Invesco Ltd.
53 INVESCO OPPENHEIMER INTERNATIONAL GROWTH FUND
TRUSTEES AND OFFICERS
The address of each trustee and officer is AIM International Mutual Funds (Invesco International Mutual Funds) (the “Trust”), 11 Greenway Plaza, Suite 1000, Houston, Texas 77046-1173. The trustees serve for the life of the Trust, subject to their earlier death, incapacitation, resignation, retirement or removal as more specifically provided in the Trust’s organizational documents. Each officer serves for a one year term or until their successors are elected and qualified. Column two below includes length of time served with predecessor entities, if any.
| | | | | | | | |
Name, Year of Birth and Position(s) Held with the Trust | | Trustee
and/or
Officer
Since | | Principal Occupation(s) During Past 5 Years | | Number of Funds in Fund Complex
Overseen by Trustee | | Other Directorship(s)
Held by Trustee During
Past 5 Years |
INTERESTED PERSONS | | | | | | | | |
| | | | | |
Martin L. Flanagan1— 1960 Trustee and Vice Chair | | 2007 | | Executive Director, Chief Executive Officer and President, Invesco Ltd. (ultimate parent of Invesco and a global investment management firm); Trustee and Vice Chair, The Invesco Funds; Vice Chair, Investment Company Institute; and Member of Executive Board, SMU Cox School of Business Formerly: Advisor to the Board, Invesco Advisers, Inc. (formerly known as Invesco Institutional (N.A.), Inc.); Chairman and Chief Executive Officer, Invesco Advisers, Inc. (registered investment adviser); Director, Chairman, Chief Executive Officer and President, Invesco Holding Company (US), Inc. (formerly IVZ Inc.) (holding company), Invesco Group Services, Inc. (service provider) and Invesco North American Holdings, Inc. (holding company); Director, Chief Executive Officer and President, Invesco Holding Company Limited (parent of Invesco and a global investment management firm); Director, Invesco Ltd.; Chairman, Investment Company Institute and President,Co-Chief Executive Officer,Co-President, Chief Operating Officer and Chief Financial Officer, Franklin Resources, Inc. (global investment management organization) | | 229 | | None |
Philip A. Taylor2— 1954 Trustee | | 2006 | | Vice Chair, Invesco Ltd.; Trustee, The Invesco Funds Formerly: Director, Invesco Canada Ltd. (formerly known as Invesco Trimark Ltd./ Invesco Trimark Ltèe) (registered investment adviser and registered transfer agent); Head of the Americas and Senior Managing Director, Invesco Ltd.; Director, Invesco Advisers, Inc. (formerly known as Invesco Institutional (N.A.), Inc.) (registered investment adviser); | | 229 | | None |
1 Mr. Flanagan is considered an interested person (within the meaning of Section 2(a)(19) of the 1940 Act) of the Trust because he is an officer of the Adviser to the Trust, and an officer and a director of Invesco Ltd., ultimate parent of the Adviser. |
2 Mr. Taylor is considered an interested person (within the meaning of Section 2(a)(19) of the 1940 Act) of the Trust because he is an officer of Invesco Ltd., ultimate parent of the Adviser. |
54 INVESCO OPPENHEIMER INTERNATIONAL GROWTH FUND
| | | | | | | | |
Name, Year of Birth and Position(s) Held with the Trust | | Trustee
and/or
Officer
Since | | Principal Occupation(s) During Past 5 Years | | Number of Funds in Fund Complex
Overseen by Trustee | | Other Directorship(s)
Held by Trustee During
Past 5 Years |
INTERESTED PERSONS (CONTINUED) | | | | | | | | |
Philip A. Taylor (Continued) | | | | Director and Chairman, Invesco Investment Services, Inc. (formerly known as Invesco AIM Investment Services, Inc.) (registered transfer agent); Chief Executive Officer, Invesco Corporate Class Inc. (corporate mutual fund company); Chairman and Chief Executive Officer, Invesco Canada Ltd. (formerly known as Invesco Trimark Ltd./Invesco Trimark Ltèe) (registered investment adviser and registered transfer agent); Senior Vice President, The Invesco Funds; Director, Invesco Investment Advisers LLC (formerly known as Van Kampen Asset Management); Director, Chairman, Chief Executive Officer and President, Invesco Management Group, Inc. (formerly known as Invesco AIM Management Group, Inc.) (financial services holding company);Co-Chairman,Co-President andCo-Chief Executive Officer, Invesco Advisers, Inc. (formerly known as Invesco Institutional (N.A.), Inc.) (registered investment adviser); Director, Chief Executive Officer and President, Van Kampen Exchange Corp; President and Principal Executive Officer, The Invesco Funds (other than AIM Treasurer’s Series Trust (Invesco Treasurer’s Series Trust), Short-Term Investments Trust and Invesco Management Trust); Executive Vice President, The Invesco Funds (AIM Treasurer’s Series Trust (Invesco Treasurer’s Series Trust), Short-Term Investments Trust and Invesco Management Trust only); Director and President, INVESCO Funds Group, Inc. (registered investment adviser and registered transfer agent); Director and Chairman, IVZ Distributors, Inc. (formerly known as INVESCO Distributors, Inc.) (registered broker dealer); Director, President and Chairman, Invesco Inc. (holding company), Invesco Canada Holdings Inc. (holding company), Trimark Investments Ltd./ Placements Trimark Ltèe and Invesco Financial Services Ltd/Services Financiers Invesco Ltèe; Chief Executive Officer, Invesco Canada Fund Inc. (corporate mutual fund company); Director and Chairman, Van Kampen Investor Services Inc.; Director, Chief Executive Officer and President, 1371 Preferred Inc. (holding | | | | |
55 INVESCO OPPENHEIMER INTERNATIONAL GROWTH FUND
TRUSTEES AND OFFICERSContinued
| | | | | | | | |
Name, Year of Birth and Position(s) Held with the Trust | | Trustee
and/or
Officer
Since | | Principal Occupation(s) During Past 5 Years | | Number of Funds in Fund Complex
Overseen by Trustee | | Other Directorship(s)
Held by Trustee During
Past 5 Years |
INTERESTED PERSONS (CONTINUED) | | | | | | | | |
Philip A. Taylor (Continued) | | | | company) and Van Kampen Investments Inc.; Director and President, AIM GP Canada Inc. (general partner for limited partnerships) and Van Kampen Advisors, Inc.; Director and Chief Executive Officer, Invesco Trimark Dealer Inc. (registered broker dealer); Director, Invesco Distributors, Inc. (formerly known as Invesco AIM Distributors, Inc.) (registered broker dealer); Manager, Invesco Capital Management LLC; Director, Chief Executive Officer and President, Invesco Advisers, Inc.; Director, Chairman, Chief Executive Officer and President, Invesco AIM Capital Management, Inc.; President, Invesco Trimark Dealer Inc. and Invesco Trimark Ltd./Invesco Trimark Ltèe; Director and President, AIM Trimark Corporate Class Inc. and AIM Trimark Canada Fund Inc.; Senior Managing Director, Invesco Holding Company Limited; Director and Chairman, Fund Management Company (former registered broker dealer); President and Principal Executive Officer, The Invesco Funds (AIM Treasurer’s Series Trust (Invesco Treasurer’s Series Trust), and Short-Term Investments Trust only); President, AIM Trimark Global Fund Inc. and AIM Trimark Canada Fund Inc. | | | | |
56 INVESCO OPPENHEIMER INTERNATIONAL GROWTH FUND
| | | | | | | | |
Name, Year of Birth and Position(s) Held with the Trust | | Trustee
and/or
Officer
Since | | Principal Occupation(s) During Past 5 Years | | Number of Funds in Fund Complex
Overseen by Trustee | | Other Directorship(s)
Held by Trustee During
Past 5 Years |
INDEPENDENT TRUSTEES | | | | | | | | |
| | | | | |
Bruce L. Crockett – 1944 Trustee and Chair | | 2003 | | Chairman, Crockett Technologies Associates (technology consulting company) Formerly: Director, Captaris (unified messaging provider); Director, President and Chief Executive Officer, COMSAT Corporation; Chairman, Board of Governors of INTELSAT (international communications company); ACE Limited (insurance company); Independent Directors Council and Investment Company Institute: Member of the Audit Committee, Investment Company Institute; Member of the Executive Committee and Chair of the Governance Committee, Independent Directors Council | | 229 | | Director and Chairman of the Audit Committee, ALPS (Attorneys Liability Protection Society) (insurance company); Director and Member of the Audit Committee and Compensation Committee, Ferroglobe PLC (metallurgical company) |
| | | | | |
David C. Arch – 1945 Trustee | | 2010 | | Chairman of Blistex Inc. (consumer health care products manufacturer); Member, World Presidents’ Organization | | 229 | | Board member of the Illinois Manufacturers’ Association |
| | | | | |
Beth Ann Brown – 1968 Trustee | | 2019 | | Independent Consultant Formerly: Head of Intermediary Distribution, Managing Director, Strategic Relations, Managing Director, Head of National Accounts, Senior Vice President, National Account Manager and Senior Vice President, Key Account Manager, Columbia Management Investment Advisers LLC; Vice President, Key Account Manager, Liberty Funds Distributor, Inc.; and Trustee of certain Oppenheimer Funds | | 229 | | Director, Board of Directors of Caron Engineering Inc.; Advisor, Board of Advisors of Caron Engineering Inc.; President and Director, of Acton Shapleigh Youth Conservation Corps (non -profit); and Vice President and Director of Grahamtastic Connection (non- profit) |
| | | | | |
Jack M. Fields – 1952 Trustee | | 2003 | | Chief Executive Officer, Twenty First Century Group, Inc. (government affairs company); and Chairman, Discovery Learning Alliance(non-profit) Formerly: Owner and Chief Executive Officer, Dos Angeles Ranch L.P. (cattle, hunting, corporate entertainment); Director, Insperity, Inc. (formerly known as Administaff) (human resources provider); Chief Executive Officer, Texana Timber LP (sustainable forestry company); Director of Cross Timbers Quail Research Ranch(non-profit); and member of the U.S. House of Representatives | | 229 | | None |
57 INVESCO OPPENHEIMER INTERNATIONAL GROWTH FUND
TRUSTEES AND OFFICERSContinued
| | | | | | | | |
Name, Year of Birth and Position(s) Held with the Trust | | Trustee
and/or
Officer
Since | | Principal Occupation(s) During Past 5 Years | | Number of Funds in Fund Complex
Overseen by Trustee | | Other Directorship(s)
Held by Trustee During
Past 5 Years |
INDEPENDENT TRUSTEES (CONTINUED) | | | | | | | | |
| | | | | |
Cynthia Hostetler —1962 Trustee | | 2017 | | Non-Executive Director and Trustee of a number of public and private business corporations Formerly: Director, Aberdeen Investment Funds (4 portfolios); Head of Investment Funds and Private Equity, Overseas Private Investment Corporation; President, First Manhattan Bancorporation, Inc.; Attorney, Simpson Thacher & Bartlett LLP | | 229 | | Vulcan Materials Company (construction materials company); Trilinc Global Impact Fund; Genesee & Wyoming, Inc. (railroads); Artio Global Investment LLC (mutual fund complex); Edgen Group, Inc. (specialized energy and infrastructure products distributor); Investment Company Institute (professional organization); Independent Directors Council (professional organization) |
| | | | | |
Eli Jones – 1961 Trustee | | 2016 | | Professor and Dean, Mays Business School - Texas A&M University Formerly: Professor and Dean, Walton College of Business, University of Arkansas and E.J. Ourso College of Business, Louisiana State University; Director, Arvest Bank | | 229 | | Insperity, Inc. (formerly known as Administaff) (human resources provider) |
| | | | | |
Elizabeth Krentzman – 1959 Trustee | | 2019 | | Formerly: Principal and Chief Regulatory Advisor for Asset Management Services and U.S. Mutual Fund Leader of Deloitte & Touche LLP; General Counsel of the Investment Company Institute (trade association); National Director of the Investment Management Regulatory Consulting Practice, Principal, Director and Senior Manager of Deloitte & Touche LLP; Assistant Director of the Division of Investment Management - Office of Disclosure and Investment Adviser Regulation of the U.S. Securities and Exchange Commission and various positions with the Division of Investment Management – Office of Regulatory Policy of the U.S. Securities and Exchange Commission; Associate at Ropes & Gray LLP.; Advisory Board Member of the Securities and Exchange Commission Historical Society; and Trustee of certain Oppenheimer Funds | | 229 | | Trustee of the University of Florida National Board Foundation and Audit Committee Member; Member of the Cartica Funds Board of Directors (private investment funds); Member of the University of Florida Law Center Association, Inc. Board of Trustees and Audit Committee Member |
58 INVESCO OPPENHEIMER INTERNATIONAL GROWTH FUND
| | | | | | | | |
Name, Year of Birth and Position(s) Held with the Trust | | Trustee
and/or
Officer
Since | | Principal Occupation(s) During Past 5 Years | | Number of Funds in Fund Complex
Overseen by Trustee | | Other Directorship(s)
Held by Trustee During
Past 5 Years |
INDEPENDENT TRUSTEES (CONTINUED) | | | | | | | | |
| | | | | |
Anthony J. LaCava, Jr. – 1956 Trustee | | 2019 | | Formerly: Director and Member of the Audit Committee, Blue Hills Bank (publicly traded financial institution) and Managing Partner, KPMG LLP | | 229 | | Blue Hills Bank; Chairman of Bentley University; Member, Business School Advisory Council; and Nominating Committee, KPMG LLP |
| | | | | |
Prema Mathai-Davis – 1950 Trustee | | 2003 | | Retired Co-Owner & Partner of Quantalytics Research, LLC, (a FinTech Investment Research Platform for the Self-Directed Investor) | | 229 | | None |
| | | | | |
Joel W. Motley – 1952 Trustee | | 2019 | | Director of Office of Finance, Federal Home Loan Bank; Member of the Vestry of Trinity Wall Street; Managing Director of Carmona Motley Hoffman, Inc. (privately held financial advisor); Member of the Finance and Budget Committee of the Council on Foreign Relations, Member of the Investment Committee and Board of Human Rights Watch and Member of the Investment Committee and Board of Historic Hudson Valley (non-profit cultural organization). Formerly: Managing Director of Public Capital Advisors, LLC (privately held financial advisor); Managing Director of Carmona Motley Hoffman, Inc. (privately held financial advisor); Trustee of certain Oppenheimer Funds; and Director of Columbia Equity Financial Corp. (privately held financial advisor) | | 229 | | Director of Greenwall Foundation (bioethics research foundation); Member of Board and Investment Committee of The Greenwall Foundation; Director of Southern Africa Legal Services Foundation; Board Member and Investment Committee Member of Pulitzer Center for Crisis Reporting(non-profit journalism) |
| | | | | |
Teresa M. Ressel — 1962 Trustee | | 2017 | | Non-executive director and trustee of a number of public and private business corporations Formerly: Chief Financial Officer, Olayan America, The Olayan Group (international investor/commercial/industrial); Chief Executive Officer, UBS Securities LLC; Group Chief Operating Officer, Americas, UBS AG; Assistant Secretary for Management & Budget and CFO, US Department of the Treasury | | 229 | | Atlantic Power Corporation (power generation company); ON Semiconductor Corp. (semiconductor supplier) |
| | | | | |
Ann Barnett Stern – 1957 Trustee | | 2017 | | President and Chief Executive Officer, Houston Endowment Inc. (private philanthropic institution) Formerly: Executive Vice President and General Counsel, Texas Children’s Hospital; | | 229 | | Federal Reserve Bank of Dallas |
59 INVESCO OPPENHEIMER INTERNATIONAL GROWTH FUND
TRUSTEES AND OFFICERSContinued
| | | | | | | | |
Name, Year of Birth and Position(s) Held with the Trust | | Trustee
and/or
Officer
Since | | Principal Occupation(s) During Past 5 Years | | Number of Funds in Fund Complex
Overseen by Trustee | | Other Directorship(s)
Held by Trustee During
Past 5 Years |
INDEPENDENT TRUSTEES (CONTINUED) | | | | | | | | |
| | | | | |
| Ann Barnett Stern (Continued) | | | | Attorney, Beck, Redden and Secrest, LLP; Business Law Instructor, University of St. Thomas; Attorney, Andrews & Kurth LLP | | | | |
| | | | | |
Raymond Stickel, Jr. – 1944 Trustee | | 2005 | | Retired Formerly: Director, Mainstay VP Series Funds, Inc. (25 portfolios); Partner, Deloitte & Touche | | 229 | | None |
| | | | | |
Robert C. Troccoli – 1949 Trustee | | 2016 | | Retired Formerly: Adjunct Professor, University of Denver – Daniels College of Business, Senior Partner, KPMG LLP | | 229 | | None |
| | | | | |
Daniel S. Vandivort – 1954 Trustee | | 2019 | | Treasurer, Chairman of the Audit and Finance Committee, and Trustee, Board of Trustees, Huntington Disease Foundation of America; and President, Flyway Advisory Services LLC (consulting and property management). Formerly: Trustee and Governance Chair, of certain Oppenheimer Funds | | 229 | | Chairman and Lead Independent Director, Chairman of the Audit Committee, and Director, Board of Directors, Value Line Funds |
| | | | | |
James D. Vaughn – 1945 Trustee | | 2019 | | Retired Formerly: Managing Partner, Deloitte & Touche LLP; Trustee and Chairman of the Audit Committee, Schroder Funds; Board Member, Mile High United Way, Boys and Girls Clubs, Boy Scouts, Colorado Business Committee for the Arts, Economic Club of Colorado and Metro Denver Network (economic development corporation); and Trustee of certain Oppenheimer Funds | | 229 | | Board member and Chairman of Audit Committee of AMG National Trust Bank; Trustee and Investment Committee member, University of South Dakota Foundation; Board member, Audit Committee Member and past Board Chair, Junior Achievement(non-profit) |
| | | | | |
Christopher L. Wilson – 1957 Trustee, Vice Chair and Chair Designate | | 2017 | | Retired Formerly: Director, TD Asset Management USA Inc. (mutual fund complex) (22 portfolios); Managing Partner, CT2, LLC (investing and consulting firm); President/Chief Executive Officer, Columbia Funds, Bank of America Corporation; President/Chief Executive Officer, CDC IXIS Asset Management Services, Inc.; Principal & Director of Operations, Scudder Funds, Scudder, Stevens & Clark, Inc.; Assistant Vice President, Fidelity Investments | | 229 | | ISO New England, Inc.(non-profit organization managing regional electricity market) |
60 INVESCO OPPENHEIMER INTERNATIONAL GROWTH FUND
| | | | | | | | |
Name, Year of Birth and Position(s) Held with the Trust | | Trustee
and/or
Officer
Since | | Principal Occupation(s) During Past 5 Years | | Number of Funds in Fund Complex
Overseen by Trustee | | Other Directorship(s)
Held by Trustee During
Past 5 Years |
OTHER OFFICERS | | | | | | | | |
| | | | | |
Sheri Morris — 1964 President, Principal Executive Officer and Treasurer | | 2003 | | Head of Global Fund Services, Invesco Ltd.; President, Principal Executive Officer and Treasurer, The Invesco Funds; Vice President, Invesco Advisers, Inc. (formerly known as Invesco Institutional (N.A.), Inc.) (registered investment adviser); and Vice President, Invesco Exchange-Traded Fund Trust, Invesco Exchange-Traded Fund Trust II, Invesco India Exchange-Traded Fund Trust, Invesco Actively Managed Exchange-Traded Fund Trust, Invesco Actively Managed Exchange-Traded Commodity Fund Trust and Invesco Exchange- Traded Self-Indexed Fund Trust, and Vice President, OppenheimerFunds, Inc. Formerly: Vice President and Principal Financial Officer, The Invesco Funds; Vice President, Invesco AIM Advisers, Inc., Invesco AIM Capital Management, Inc. and Invesco AIM Private Asset Management, Inc.; Assistant Vice President and Assistant Treasurer, The Invesco Funds and Assistant Vice President, Invesco Advisers, Inc., Invesco AIM Capital Management, Inc. and Invesco AIM Private Asset Management, Inc.; and Treasurer, Invesco Exchange-Traded Fund Trust, Invesco Exchange-Traded Fund Trust II, Invesco India Exchange-Traded Fund Trust and Invesco Actively Managed Exchange-Traded Fund Trust | | N/A | | N/A |
| | | | | |
Russell C. Burk — 1958 Senior Vice President and Senior Officer | | 2005 | | Senior Vice President and Senior Officer, The Invesco Funds | | N/A | | N/A |
| | | | | |
Jeffrey H. Kupor – 1968 Senior Vice President, Chief Legal Officer and Secretary | | 2018 | | Head of Legal of the Americas, Invesco Ltd.; Senior Vice President and Secretary, Invesco Advisers, Inc. (formerly known as Invesco Institutional (N.A.), Inc.) (registered investment adviser); Senior Vice President and Secretary, Invesco Distributors, Inc. (formerly known as Invesco AIM Distributors, Inc.); Vice President and Secretary, Invesco Investment Services, Inc. (formerly known as Invesco AIM Investment Services, Inc.) Senior Vice President, Chief Legal Officer and Secretary, The Invesco Funds; Secretary and General Counsel, Invesco Investment Advisers LLC (formerly known as Van Kampen Asset Management); Secretary and General Counsel, Invesco Capital Markets, Inc. (formerly known as Van Kampen Funds Inc.) and Chief Legal | | N/A | | N/A |
61 INVESCO OPPENHEIMER INTERNATIONAL GROWTH FUND
TRUSTEES AND OFFICERSContinued
| | | | | | | | |
Name, Year of Birth and Position(s) Held with the Trust | | Trustee
and/or
Officer
Since | | Principal Occupation(s) During Past 5 Years | | Number of Funds in Fund Complex
Overseen by Trustee | | Other Directorship(s)
Held by Trustee During
Past 5 Years |
OTHER OFFICERS (CONTINUED) | | | | | | | | |
| | | | | |
| Jeffrey H. Kupor (Continued) | | | | Officer, Invesco Exchange-Traded Fund Trust, Invesco Exchange-Traded Fund Trust II, Invesco India Exchange-Traded Fund Trust, Invesco Actively Managed Exchange-Traded Fund Trust, Invesco Actively Managed Exchange- Traded Commodity Fund Trust and Invesco Exchange-Traded Self-Indexed Fund Trust; Secretary, Invesco Indexing LLC; Secretary, W.L. Ross & Co., LLC Formerly: Secretary and Vice President, Jemstep, Inc.; Head of Legal, Worldwide Institutional, Invesco Ltd.; Secretary and General Counsel, INVESCO Private Capital Investments, Inc.; Senior Vice President, Secretary and General Counsel, Invesco Management Group, Inc. (formerly known as Invesco AIM Management Group, Inc.); Assistant Secretary, INVESCO Asset Management (Bermuda) Ltd.; Secretary and General Counsel, Invesco Private Capital, Inc.; Assistant Secretary and General Counsel, INVESCO Realty, Inc.; Secretary and General Counsel, Invesco Senior Secured Management, Inc.; and Secretary, Sovereign G./P. Holdings Inc. | | | | |
| | | | | |
Andrew R. Schlossberg – 1974 Senior Vice President | | 2019 | | Head of the Americas and Senior Managing Director, Invesco Ltd.; Director and Senior Vice President, Invesco Advisers, Inc. (formerly known as Invesco Institutional (N.A.), Inc.) (registered investment adviser); Director and Chairman, Invesco Investment Services, Inc. (formerly known as Invesco AIM Investment Services, Inc.) (registered transfer agent); Senior Vice President, The Invesco Funds; Director, Invesco Investment Advisers LLC (formerly known as Van Kampen Asset Management); Director, President and Chairman, Invesco Insurance Agency, Inc. Formerly: Director, Invesco UK Limited; Director and Chief Executive, Invesco Asset Management Limited and Invesco Fund Managers Limited; Assistant Vice President, The Invesco Funds; Senior Vice President, Invesco Advisers, Inc. (formerly known as Invesco Institutional (N.A.), Inc.) (registered investment adviser); Director and Chief Executive, Invesco Administration Services | | N/A | | N/A |
62 INVESCO OPPENHEIMER INTERNATIONAL GROWTH FUND
| | | | | | | | |
Name, Year of Birth and Position(s) Held with the Trust | | Trustee
and/or
Officer
Since | | Principal Occupation(s) During Past 5 Years | | Number of Funds in Fund Complex
Overseen by Trustee | | Other Directorship(s)
Held by Trustee During
Past 5 Years |
OTHER OFFICERS (CONTINUED) | | | | | | | | |
| | | | | |
| Andrew R. Schlossberg (Continued) | | | | Limited and Invesco Global Investment Funds Limited; Director, Invesco Distributors, Inc.; Head of EMEA, Invesco Ltd.; President, Invesco Actively Managed Exchange-Traded Commodity Fund Trust, Invesco Actively Managed Exchange-Traded Fund Trust, Invesco Exchange-Traded Fund Trust, Invesco Exchange-Traded Fund Trust II and Invesco India Exchange-Traded Fund Trust; Managing Director and Principal Executive Officer, Invesco Capital Management LLC | | | | |
| | | | | |
John M. Zerr — 1962 Senior Vice President | | 2006 | | Chief Operating Officer of the Americas; Senior Vice President, Invesco Advisers, Inc. (formerly known as Invesco Institutional (N.A.), Inc.) (registered investment adviser); Senior Vice President, Invesco Distributors, Inc. (formerly known as Invesco AIM Distributors, Inc.); Director and Vice President, Invesco Investment Services, Inc. (formerly known as Invesco AIM Investment Services, Inc.) Senior Vice President, The Invesco Funds; Managing Director, Invesco Capital Management LLC; Director, Invesco Investment Advisers LLC (formerly known as Van Kampen Asset Management); Senior Vice President, Invesco Capital Markets, Inc. (formerly known as Van Kampen Funds Inc.); Manager, Invesco Indexing LLC; Manager, Invesco Specialized Products, LLC; Director and Senior Vice President, Invesco Insurance Agency, Inc.; Member, Invesco Canada Funds Advisory Board; Director, President and Chief Executive Officer, Invesco Corporate Class Inc. (corporate mutual fund company); and Director, Chairman, President and Chief Executive Officer, Invesco Canada Ltd. (formerly known as Invesco Trimark Ltd./Invesco Trimark Ltèe) (registered investment adviser and registered transfer agent) Formerly: Director and Senior Vice President, Invesco Management Group, Inc. (formerly known as Invesco AIM Management Group, Inc.); Secretary and General Counsel, Invesco Management Group, Inc. (formerly known as Invesco AIM Management Group, Inc.); Secretary, Invesco Investment Services, Inc. (formerly known as Invesco AIM Investment Services, Inc.); Chief Legal Officer and | | N/A | | N/A |
63 INVESCO OPPENHEIMER INTERNATIONAL GROWTH FUND
TRUSTEES AND OFFICERSContinued
| | | | | | | | |
Name, Year of Birth and Position(s) Held with the Trust | | Trustee
and/or
Officer
Since | | Principal Occupation(s) During Past 5 Years | | Number of Funds in Fund Complex
Overseen by Trustee | | Other Directorship(s)
Held by Trustee During
Past 5 Years |
OTHER OFFICERS (CONTINUED) | | | | | | | | |
| | | | | |
| John M. Zerr (Continued) | | | | Secretary, The Invesco Funds; Secretary and General Counsel, Invesco Investment Advisers LLC (formerly known as Van Kampen Asset Management); Secretary and General Counsel, Invesco Capital Markets, Inc. (formerly known as Van Kampen Funds Inc.); Chief Legal Officer, Invesco Exchange-Traded Fund Trust, Invesco Exchange-Traded Fund Trust II, Invesco India Exchange-Traded Fund Trust, Invesco Actively Managed Exchange-Traded Fund Trust, Invesco Actively Managed Exchange- Traded Commodity Fund Trust and Invesco Exchange-Traded Self-Indexed Fund Trust; Secretary, Invesco Indexing LLC; Director, Secretary, General Counsel and Senior Vice President, Van Kampen Exchange Corp.; Director, Vice President and Secretary, IVZ Distributors, Inc. (formerly known as INVESCO Distributors, Inc.); Director and Vice President, INVESCO Funds Group, Inc.; Director and Vice President, Van Kampen Advisors Inc.; Director, Vice President, Secretary and General Counsel, Van Kampen Investor Services Inc.; Director and Secretary, Invesco Distributors, Inc. (formerly known as Invesco AIM Distributors, Inc.); Director, Senior Vice President, General Counsel and Secretary, Invesco AIM Advisers, Inc. and Van Kampen Investments Inc.; Director, Vice President and Secretary, Fund Management Company; Director, Senior Vice President, Secretary, General Counsel and Vice President, Invesco AIM Capital Management, Inc.; Chief Operating Officer and General Counsel, Liberty Ridge Capital, Inc. (an investment adviser) | | | | |
| | | | | |
Gregory G. McGreevey - 1962 Senior Vice President | | 2012 | | Senior Managing Director, Invesco Ltd.; Director, Chairman, President, and Chief Executive Officer, Invesco Advisers, Inc. (formerly known as Invesco Institutional (N.A.), Inc.) (registered investment adviser); Director, Invesco Mortgage Capital, Inc. and Invesco Senior Secured Management, Inc.; and Senior Vice President, The Invesco Funds; and President, SNW Asset Management Corporation Formerly: Senior Vice President, Invesco | | N/A | | N/A |
64 INVESCO OPPENHEIMER INTERNATIONAL GROWTH FUND
| | | | | | | | |
Name, Year of Birth and Position(s) Held with the Trust | | Trustee
and/or
Officer
Since | | Principal Occupation(s) During Past 5 Years | | Number of Funds in Fund Complex
Overseen by Trustee | | Other Directorship(s)
Held by Trustee During
Past 5 Years |
OTHER OFFICERS (CONTINUED) | | | | | | | | |
| | | | | |
Gregory G. McGreevey (Continued) | | | | Management Group, Inc. and Invesco Advisers, Inc.; Assistant Vice President, The Invesco Funds | | | | |
| | | | | |
Kelli Gallegos – 1970 Vice President, Principal Financial Officer and Assistant Treasurer | | 2008 | | Principal Financial and Accounting Officer – Investments Pool, Invesco Specialized Products, LLC; Vice President, Principal Financial Officer and Assistant Treasurer, The Invesco Funds; Principal Financial and Accounting Officer – Pooled Investments, Invesco Capital Management LLC; Vice President and Treasurer, Invesco Exchange- Traded Fund Trust, Invesco Exchange-Traded Fund Trust II, Invesco India Exchange-Traded Fund Trust, Invesco Actively Managed Exchange-Traded Fund Trust, Invesco Actively Managed Exchange-Traded Commodity Fund Trust and Invesco Exchange-Traded Self-Indexed Fund Trust Formerly: Assistant Treasurer, Invesco Specialized Products, LLC; Assistant Treasurer, Invesco Exchange-Traded Fund Trust, Invesco Exchange-Traded Fund Trust II, Invesco India Exchange-Traded Fund Trust, Invesco Actively Managed Exchange-Traded Fund Trust, Invesco Actively Managed Exchange-Traded Commodity Fund Trust and Invesco Exchange- Traded Self-Indexed Fund Trust; Assistant Treasurer, Invesco Capital Management LLC; Assistant Vice President, The Invesco Funds | | N/A | | N/A |
| | | | | |
Crissie M. Wisdom – 1969 Anti-Money Laundering Compliance Officer | | 2013 | | Anti-Money Laundering Compliance Officer, Invesco Advisers, Inc. (formerly known as Invesco Institutional (N.A.), Inc.) (registered investment adviser), Invesco Capital Markets, Inc. (formerly known as Van Kampen Funds Inc.), Invesco Distributors, Inc., Invesco Investment Services, Inc., The Invesco Funds, and Invesco Exchange-Traded Fund Trust, Invesco Exchange-Traded Fund Trust II, Invesco India Exchange-Traded Fund Trust, Invesco Actively Managed Exchange-Traded Fund Trust, Invesco Actively Managed Exchange- Traded Commodity Fund Trust and Invesco Exchange-Traded Self-Indexed Fund Trust; Anti-Money Laundering Compliance Officer and Bank Secrecy Act Officer, INVESCO National Trust Company and Invesco Trust Company; and Fraud Prevention Manager and | | N/A | | N/A |
65 INVESCO OPPENHEIMER INTERNATIONAL GROWTH FUND
TRUSTEES AND OFFICERSContinued
| | | | | | | | |
Name, Year of Birth and Position(s) Held with the Trust | | Trustee
and/or
Officer
Since | | Principal Occupation(s) During Past 5 Years | | Number of Funds in Fund Complex
Overseen by Trustee | | Other Directorship(s)
Held by Trustee During
Past 5 Years |
OTHER OFFICERS (CONTINUED) | | | | | | | | |
| | | | | |
Crissie M. Wisdom (Continued) | | | | Controls and Risk Analysis Manager for Invesco Investment Services, Inc. Formerly: Anti-Money Laundering Compliance Officer, Van Kampen Exchange Corp. and Invesco Management Group, Inc. | | | | |
| | | | | |
Robert R. Leveille – 1969 Chief Compliance Officer | | 2016 | | Chief Compliance Officer, Invesco Advisers, Inc. (registered investment adviser); and Chief Compliance Officer, The Invesco Funds Formerly: Chief Compliance Officer, Putnam Investments and the Putnam Funds | | N/A | | N/A |
The Statement of Additional Information of the Trust includes additional information about the Fund’s Trustees and is available upon request, without charge, by calling 1.800.959.4246. Please refer to the Fund’s Statement of Additional Information for information on the Fund’ssub-advisers.
Office of the Fund
11 Greenway Plaza,
Suite 1000
Houston, TX 77046-1173
Counsel to the Fund
Stradley Ronon Stevens & Young,
LLP
2005 Market Street,
Suite 2600
Philadelphia, PA 19103-7018
Investment Adviser
Invesco Advisers, Inc.
1555 Peachtree Street, N.E.
Atlanta, GA 30309
Counsel to the
Independent Trustees
Goodwin Procter LLP
901 New York Avenue, N.W.
Washington, D.C. 20001
Distributor
Invesco Distributors, Inc.
11 Greenway Plaza,
Suite 1000
Houston, TX
77046-1173
Transfer Agent
Invesco Investment
Services, Inc.
11 Greenway Plaza,
Suite 1000
Houston, TX
77046-1173
Auditors
PricewaterhouseCoopers
LLP
1000 Louisiana Street,
Suite 5800
Houston, TX 77002-5021
Custodian
Citibank, N.A.
111 Wall Street
New York, NY 10005
66 INVESCO OPPENHEIMER INTERNATIONAL GROWTH FUND
Invesco recognizes the importance of protecting your personal and financial information when you visit our website located atwww.invesco.com (the “Website”). The following information is designed to help you understand the information collection practices at this Website. We will not sell, share or rent your personally identifiable information to others in contravention of this Privacy Policy. When we refer to ourselves as “we” or “Invesco” in this Privacy Policy, we mean our entire company including our affiliates, such as subsidiaries.
By visiting this Website, you are accepting the practices described in this Privacy Policy. If you do not agree to this policy, you may not use this Website. This Privacy Policy is subject to change without notice, from time to time in our sole discretion. You acknowledge that by accessing the Website after we have posted changes to this Privacy Policy, you are agreeing to this Privacy Policy as modified. Please review the Terms of Use1 to learn of other terms and conditions applicable to your use of the Website.
Please note that this Privacy Policy is not an exclusive statement of our privacy principles across all products and services. Other privacy principles or policies may apply depending on the products or services you obtain from Invesco, or the jurisdiction in which you transact with Invesco.
This Privacy Policy was last updated on May 6, 2018.
Information We Collect and Use
We collect personal information you choose to submit to the Website in order to process transactions requested by you and meet our contractual obligations. For example, you can choose to provide your name, contact information, social security number, or tax identification number in connection with accessing your account, or you can choose to provide your personal information when you fill out a secure account question form. Any information collected about you from the Website can, from time to time, be associated with other identifying information we have about you.
In addition, we may gather information about you automatically through your use of the Website, e.g. your IP address, how you navigate the Website, the organization from which you are accessing the Website, and the websites that you access before and after you visit the Website.
When you access the Website, we may also collect information such as unique device identifiers, your screen resolution and other device settings, information about your location, and analytical information about how you use the device from which you are viewing the Website. Where applicable, we may ask your permission before collecting certain information, such as precise geolocation information.
From time to time, we use or augment the personal information we have about you with information obtained from third parties. For example, we use third party information to confirm contact or financial information or to better understand your interests by associating demographic information from third parties with the information you have provided.
How We Use Personal Information
We use your personal information to respond to your inquiries and provide the products and services you request. We also use your information from time to time to deliver the content and services we believe
1NTD
67 INVESCO OPPENHEIMER INTERNATIONAL GROWTH FUND
| | | | |
| | INVESCO’S PRIVACY NOTICEContinued |
| | |
you will find the most relevant and to provide customer service and support.
We also use the information you provide to further develop and improve our products and services. We aggregate and/orde-identify data about visitors to the Website for various business purposes including product and service development and improvement activities.
How We Share Personal Information
We collaborate with other companies and individuals to perform services for us and on our behalf and we collaborate with our affiliates, other companies and individuals with respect to particular products or services (“Providers”). Examples of Providers include data analysis firms, customer service and support providers, email and SMS vendors, andweb-hosting and development companies. Some Providers collect information for us or on our behalf on our Website. These Providers can be provided with access to personal information needed to perform their functions.
We reserve the right to disclose your personal information as required by law, when we believe disclosure is necessary to comply with a regulatory requirement, judicial proceeding, court order or legal process served on us, to protect the safety, rights or property of our customers, the public or Invesco or to enforce the Terms of Use.
If we sell or transfer a business unit (such as a subsidiary) or an asset (such as a website) to another company, we will share your personal information with such company. You will receive notice of such an event and the new entity will inform you of any changes to the practices in this Privacy Policy. If the new entity wishes to make additional use of your information, you have the right to decline such use at that time.
We occasionally disclose aggregate orde-identified data that is not personally identifiable with third parties.
Cookies and Other Tools
Invesco and its Providers collect information about you by using cookies, tracking pixels and other technologies. We use this information to better understand, customize and improve user experience with our websites, services and offerings as well as to manage our advertising. For example, we use web analytics services that use these technologies to gather information to help us understand how visitors engage with and navigate our Website, e.g., how and when pages in a site are visited and by how many visitors. We are also able to offer our visitors a more customized, relevant experience on our sites using these technologies by delivering content and functionality based on your preferences and interests.
Depending on their purpose, some cookies will only operate for the length of a single browsing session, while others have a longer life span to ensure that they fulfill their longer-term purposes. Your web browser can be set to allow you to control whether you will accept cookies or reject cookies, to notify you each time a cookie is sent to your browser, or to delete cookies that have already been set. If your browser is set to reject cookies, certain aspects of the Website that are cookie-enabled will not recognize you when you return to the website, and some Website functionality may be lost. The “Help” section of your browser may tell you how to prevent your browser from accepting cookies. To find out more about cookies, visitwww.aboutcookies.org.
68 INVESCO OPPENHEIMER INTERNATIONAL GROWTH FUND
Security
No data transmission over the internet can be 100% secure, so Invesco cannot ensure or warrant the security of any information you submit to us on this Website. However, Invesco seeks to protect your personal information from unauthorized access or use when you transact business on our Website using technical, administrative and procedural measures. Invesco makes no representation as to the reasonableness, efficacy, or appropriateness of the measures we use to safeguard such information.
Users are responsible for maintaining the secrecy of their own passwords. If you have reason to believe that your interaction with us is no longer secure (for example, if you feel that the security of any account you might have with us has been compromised), please immediately notify us by contacting us as specified below.
Transfer of Data to Other Countries
Any information you provide to Invesco through use of the Website may be stored and processed, transferred between and accessed from the United States, Canada and other countries which do not guarantee the same level of protection of personal information as the one in which you reside. However, Invesco will handle your personal information in accordance with this Privacy Policy regardless of where your personal information is stored/accessed.
Children’s Privacy
We are committed to protecting the privacy of children. We do not knowingly collect personal information from children under the age of 18. If you are under the age of 18, do not provide us with any personal information.
Contact Us
Please contact us if you have any questions or concerns about your personal information or require assistance in managing your choices.
Invesco Ltd.
1555 Peachtree St. NE
Atlanta, GA 30309
By phone:
(404)439-3236
By fax:
(404)962-8288
By email:
Anne.Gerry@invesco.com
Please update your account information by logging in or contact us by email or telephone as specified above to update your account information whenever such information ceases to be complete or accurate.
You may also contact us to:
69 INVESCO OPPENHEIMER INTERNATIONAL GROWTH FUND
| | | | |
| | INVESCO’S PRIVACY NOTICEContinued |
| | |
● Request that we amend, rectify, delete or update the personal data we hold about you;
● Where possible (e.g. in relation to marketing) amend or update your choices around processing;
● Request a copy of personal data held by us.
Disclaimer
Where the Website contains links to third-party websites/content/services that are not owned or controlled by Invesco, Invesco is not responsible for how these properties operate or treat your personal information so we recommend that you read the privacy policies and terms associated with these third party properties carefully.
70 INVESCO OPPENHEIMER INTERNATIONAL GROWTH FUND
THIS PAGE INTENTIONALLY LEFT BLANK.
Explore High-Conviction Investing with Invesco

Go paperless with eDelivery
Visit invesco.com/edelivery to enjoy the convenience and security of anytime electronic access to your investment documents.
With eDelivery, you can elect to have any or all of the following materials delivered straight to your inbox to download, save and print from your own computer:
| ◾ | Fund reports and prospectuses |
Invesco mailing information
Send general correspondence to Invesco Investment Services, Inc., P.O. Box 219078, Kansas City, MO 64121-9078.
| | | | |
| | | |  |
| | Invesco Distributors, Inc. | | O-IGR-AR-1 12272019 |
| | |
 | | Shareholder Report for the Six Months Ended 10/31/2019 |
| | |
| | Invesco Oppenheimer |
| | Global Focus Fund* |
| |
| | Beginning on January 1, 2021, as permitted by regulations adopted by the Securities and Exchange Commission, paper copies of the Fund’s shareholder reports will no longer be sent by mail, unless you specifically request paper copies of the reports from the Fund or from your financial intermediary, such as a broker-dealer or bank. Instead, the reports will be made available on the Fund’s website, and you will be notified by mail each time a report is posted and provided with a website link to access the report. |
| |
| | If you already elected to receive shareholder reports electronically, you will not be affected by this change and you need not take any action. You may elect to receive shareholder reports and other communications from the Fund electronically by contacting your financial intermediary (such as a broker-dealer or bank) or, if you are a direct investor, by enrolling at invesco.com/edelivery. |
| |
| | You may elect to receive all future reports in paper free of charge. If you invest through a financial intermediary, you can contact your financial intermediary to request that you continue to receive paper copies of your shareholder reports. If you invest directly with the Fund, you can call 800 959 4246 to let the Fund know you wish to continue receiving paper copies of your shareholder reports. Your election to receive reports in paper will apply to all funds held with your financial intermediary or all funds held with the fund complex if you invest directly with the Fund. |
| |
| | *Prior to the close of business on May 24, 2019, the Fund’s name was Oppenheimer Global Focus Fund. See Important Update on the following page for more information. |
Important Update
On October 18, 2018, Massachusetts Mutual Life Insurance Company, an indirect corporate parent of OppenheimerFunds, Inc. and its subsidiaries OFI Global Asset Management, Inc., OFI SteelPath, Inc. and OFI Advisors, LLC, announced that it had entered into an agreement whereby Invesco Ltd., a global investment management company would acquire OppenheimerFunds and its subsidiaries (together, “OppenheimerFunds”). After the close of business on May 24, 2019 Invesco Ltd. completed the acquisition of OppenheimerFunds. This Fund was included in that acquisition and as of that date, became part of the Invesco family of funds. Please visit invesco.com for more information or call Invesco’s Client Services team at800-959-4246.
Table of Contents
Class A Shares
AVERAGE ANNUAL TOTAL RETURNS AT 10/31/19
| | | | | | |
| | | Class A Shares of the Fund | | |
| | | Without Sales Charge | | With Sales Charge | | MSCI All Country
World Index |
| 1-Year | | 13.87% | | 7.61% | | 12.59% |
| 5-Year | | 6.72 | | 5.52 | | 7.08 |
| 10-Year | | 10.93 | | 10.31 | | 8.81 |
Performance quoted is past performance and cannot guarantee comparable future results; current performance may be lower or higher. Visit invesco.com for the most recentmonth-end performance. Performance figures reflect reinvested distributions and changes in net asset value (NAV). Investment return and principal value will vary so that you may have a gain or a loss when you sell shares. Fund returns include changes in share price, reinvested distributions and a 5.50% maximum applicable sales charge except where “without sales charge” is indicated. Returns for periods of less than one year are cumulative and not annualized. As the result of a reorganization after the close of business on May 24, 2019, the returns of the Fund for periods on or prior to May 24, 2019 reflect performance of the Oppenheimer predecessor fund. Share class returns will differ from those of the predecessor fund because they have different expenses. Returns do not consider capital gains or income taxes on an individual’s investment. See Fund
3 INVESCO OPPENHEIMER GLOBAL FOCUS FUND
prospectus and summary prospectus for more information on share classes, sales charges and new fee agreements, if any. Fund literature is available at invesco.com.
4 INVESCO OPPENHEIMER GLOBAL FOCUS FUND
Fund Performance Discussion
The Fund’s Class A shares (without sales charge) produced a total return of 13.87% during the year ended October 31, 2019, outperforming the MSCI All Country Worldex-US Index (the “Index”) which returned 12.59%. The Fund outperformed the Index most in the Health Care sector due to stock selection, in the Financials sector where we are underweight, and in the Industrials sector due to stock selection. The Fund underperformed the Index in the Information Technology, Communication Services and Consumer Discretionary sectors due to stock selection.
MARKET OVERVIEW
The six month period that ended October 31, was largely flat for global equities, with volatility. Market movement was highly correlated with news flow on trade tensions between the US and China. Growth stocks were particularly affected by this and some of our Information Technology names experienced sharp corrections in late summer.
FUND REVIEW
The correction of growth stock in August and September affected some of our companies, who suffered profit taking. We remain satisfied with their longer term outlook.
The three major positive contributors to performance for the reporting period were Bristol-Myers Squibb Company, Genmab A/S and IHS Markit Ltd.
COMPARISON OF CHANGE IN VALUE OF $10,000 HYPOTHETICAL INVESTMENTS IN:
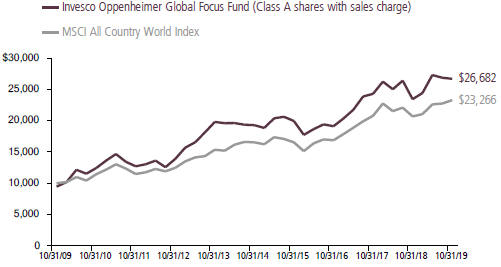
5 INVESCO OPPENHEIMER GLOBAL FOCUS FUND
Bristol-Myers Squibb Company has a big opportunity in oncology, with OPDIVO, a drug which utilizes the human immune system to attack cancer cells. It’s pending acquisition of Celgene Inc. will improve its early stage pipeline, as well as capture merger synergies. It rose in a period that was sideways and choppy.
Genmab developed Darzalex, a drug that treats myeloma, and licensed it for sale through Johnson & Johnson. The launch has been successful and sales are above expectations. Genmab stock has reacted favorably.
IHS Market is the result of a merger between two suppliers of derivative financial market data and solutions. The integration is going well, with revenues and cost savings running above expectations and the share price is reacting favorably.
The three major negative contributors to performance for the reporting period were Baidu, Inc. Twilio, Inc. and Tencent Holdings Ltd.
Baidu Inc., the Chinese internet search leader, reported weak financial results during the reporting period that showed surprising deterioration in its core search business. Worse yet, management didn’t seem to have a good handle on what they were going to do about it. We decided that we have more confidence in other ideas and reduced our position.
Twilio Inc. is the leading company that provides development tools that allow businesses to communicate with customers in a contemporary fashion. When you send for an Uber, get a text from an airline on a delay or gate change, or communicate with a company via a chat box, you are seeing evidence of the tools that Twilio provides developers. The stock has been undergoing a correction after going up more than 500% in less than 18 months. Nonetheless its future looks compelling to us.
Tencent Holdings Ltd. is a company we have admired for some time. It is the largest social media company in China, as well as the largest online gaming company. However, its share price has been under pressure, we believe on a combination of a big valuation and a more involved Chinese regulator. We view the company as attractively valued and its regulatory risks overblown.
STRATEGY & OUTLOOK
We think making market predictions is a great way to sound intelligent but know nothing. We are not in the prediction business. Analyzing businesses and figuring out what they are worth is possible even if market predictions aren’t, and we believe we have an advantage in doing this. Time tends to work out the rest. We currently see lots of structural change… Picking the winners in that change and owning them at the right price has been our goal since inception. Our focus remains on the following: identifying good businesses that have a meaningful
6 INVESCO OPPENHEIMER GLOBAL FOCUS FUND
advantage, are priced in such a way that a good return is achievable, and are run by people in which we trust and have confidence. That is theso-called signal, the rest is noise.
Randall Dishmon, Portfolio Manager
7 INVESCO OPPENHEIMER GLOBAL FOCUS FUND
Top Holdings and Allocations
TOP TEN COMMON STOCK HOLDINGS
| | | | |
| Facebook, Inc., Cl. A | | | 7.0 | % |
Alibaba Group Holding Ltd., Sponsored ADR | | | 5.5 | |
| salesforce.com, Inc. | | | 5.0 | |
| PayPal Holdings, Inc. | | | 4.9 | |
| Amazon.com, Inc. | | | 4.7 | |
| Alphabet, Inc., Cl. A | | | 4.6 | |
| Mastercard, Inc., Cl. A | | | 4.4 | |
| ServiceNow, Inc. | | | 4.4 | |
| Bristol-Myers Squibb Co. | | | 4.1 | |
| Wells Fargo & Co. | | | 3.9 | |
Holdings and allocations are subject to change and are not buy/sell recommendations. Percentages are as of October 31, 2019, and are based on net assets.
REGIONAL ALLOCATION
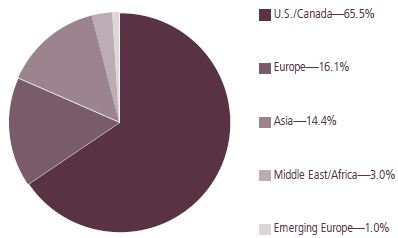
Holdings and allocations are subject to change and are not buy/sell recommendations. Percentages are as of October 31, 2019, and are based on total market value of investments.
For more current Fund holdings, please visit invesco.com.
8 INVESCO OPPENHEIMER GLOBAL FOCUS FUND
Share Class Performance
AVERAGE ANNUAL TOTAL RETURNS WITHOUT SALES CHARGE AS OF 10/31/19
| | | | | | | | | | | | | | | | |
| | | Inception
Date | | | 1-Year | | | 5-Year | | | 10-Year |
| Class A (GLVAX) | | | 10/1/07 | | | | 13.87 | % | | | 6.72 | % | | | 10.93 | % |
| Class C (GLVCX) | | | 10/1/07 | | | | 13.02 | | | | 5.91 | | | | 10.09 | |
| Class R (GLVNX) | | | 10/1/07 | | | | 13.59 | | | | 6.45 | | | | 10.65 | |
| Class Y (GLVYX) | | | 10/1/07 | | | | 14.14 | | | | 6.98 | | | | 11.25 | |
| Class R5 (GFFDX)1 | | | 5/24/19 | | | | 14.06 | | | | 6.75 | | | | 10.95 | |
| Class R6 (GLVIX)2 | | | 8/28/12 | | | | 14.36 | | | | 7.18 | | | | 10.66 | 3 |
AVERAGE ANNUAL TOTAL RETURNS WITH SALES CHARGE AS OF 10/31/19
| | | | | | | | | | | | | | | | |
| | | Inception
Date | | | 1-Year | | | 5-Year | | | 10-Year |
| Class A (GLVAX) | | | 10/1/07 | | | | 7.61 | % | | | 5.52 | % | | | 10.31 | % |
| Class C (GLVCX) | | | 10/1/07 | | | | 12.02 | | | | 5.91 | | | | 10.09 | |
| Class R (GLVNX) | | | 10/1/07 | | | | 13.59 | | | | 6.45 | | | | 10.65 | |
| Class Y (GLVYX) | | | 10/1/07 | | | | 14.14 | | | | 6.98 | | | | 11.25 | |
| Class R5 (GFFDX)1 | | | 5/24/19 | | | | 14.06 | | | | 6.75 | | | | 10.95 | |
| Class R6 (GLVIX)2 | | | 8/28/12 | | | | 14.36 | | | | 7.18 | | | | 10.66 | 3 |
1. Class R5 shares’ performance shown prior to the inception date (after the close of business on May 24, 2019) is that of the predecessor fund’s Class A shares at net asset value (NAV) and includes the12b-1 fees applicable to Class A shares. Class A shares’ performance reflects any applicable fee waivers and/or expense reimbursements.
2. Pursuant to the closing of the transaction described in the Notes to Financial Statements, after the close of business on May 24, 2019, Class I shares were reorganized as Class R6 shares.
3. Shows performance since inception.
Performance quoted is past performance and cannot guarantee comparable future results; current performance may be lower or higher. Visit invesco.com for the most recentmonth-end performance. Performance figures reflect reinvested distributions and changes in net asset value (NAV). Investment return and principal value will vary so that you may have a gain or a loss when you sell shares. Performance shown at NAV does not include the applicablefront-end sales charge, which would have reduced the performance. The current maximum initial sales charge for Class A shares is 5.50%, and the contingent deferred sales charge for Class C shares is 1% for the1-year period. Class R, Class Y, Class R5 and Class R6 shares have no sales charge; therefore, performance is at NAV. Effective after the close of business on May 24, 2019, Class A, Class C, Class R, Class Y, and Class I shares of the predecessor fund were reorganized into Class A, Class C, Class R, Class Y, and Class R6 shares, respectively, of the Fund. Class R5 shares’ performance shown prior to the inception date is that of the predecessor fund’s Class A shares at NAV and includes the12b-1 fees applicable to Class A shares. Class A shares’ performance reflects any applicable fee waivers and/or expense reimbursements. Returns shown for Class A, Class C, Class R, Class Y, Class R5, and Class R6 shares are blended returns of the predecessor fund and the Fund. Share class returns will differ from those of the predecessor fund because of different
9 INVESCO OPPENHEIMER GLOBAL FOCUS FUND
expenses. See Fund prospectuses and summary prospectuses for more information on share classes, sales charges and new fee agreements, if any. Fund literature is available at invesco.com.
The Fund’s performance is compared to the performance of the MSCI All Country World Index. The MSCI All Country World Index is a free float-adjusted market capitalization weighted index that is designed to measure the equity market performance of developed and emerging markets. The Index is unmanaged and cannot be purchased directly by investors. While index comparisons may be useful to provide a benchmark for the Fund’s performance, it must be noted that the Fund’s investments are not limited to the investments comprising theIndex. Index performance includes reinvestment of income, but does not reflect transaction costs, fees, expenses or taxes. Index performance is shown for illustrative purposes only as a benchmark for the Fund’s performance, and does not predict or depict performance of the Fund. The Fund’s performance reflects the effects of the Fund’s business and operating expenses.
The views and opinions expressed in management’s discussion of Fund performance are those of Invesco Advisers, Inc. These views and opinions are subject to change at any time based on factors such as market and economic conditions. These views and opinions may not be relied upon as investment advice or recommendations, or as an offer for a particular security. The information is not a complete analysis of every aspect of any market, country, industry, security or the Fund. Statements of fact are from sources considered reliable, but Invesco Advisers, Inc. makes no representation or warranty as to their completeness or accuracy. Although historical performance is no guarantee of future results, these insights may help you understand our investment management philosophy.
Before investing, investors should carefully read the prospectus and/or summary prospectus and carefully consider the investment objectives, risks, charges and expenses. For this and more complete information about the fund(s), investors should ask their advisors for a prospectus/summary prospectus or visit invesco. com/fundprospectus.
Shares of Invesco funds are not deposits or obligations of any bank, are not guaranteed by any bank, are not insured by the FDIC or any other agency, and involve investment risks, including the possible loss of the principal amount invested.
10 INVESCO OPPENHEIMER GLOBAL FOCUS FUND
Fund Expenses
Fund Expenses. As a shareholder of the Fund, you incur two types of costs: (1) transaction costs, which may include sales charges (loads) on purchase payments and/or contingent deferred sales charges on redemptions; and (2) ongoing costs, including management fees; distribution and service fees; and other Fund expenses. These examples are intended to help you understand your ongoing costs (in dollars) of investing in the Fund and to compare these costs with the ongoing costs of investing in other mutual funds.
The examples are based on an investment of $1,000.00 invested at the beginning of the period and held for the entire6-month period ended October 31, 2019.
Actual Expenses. The first section of the table provides information about actual account values and actual expenses. You may use the information in this section for the class of shares you hold, together with the amount you invested, to estimate the expense that you paid over the period. Simply divide your account value by $1,000.00 (for example, an $8,600.00 account value divided by $1,000.00 = 8.60), then multiply the result by the number in the first section under the heading entitled “Expenses Paid During 6 Months Ended October 31, 2019” to estimate the expenses you paid on your account during this period.
Hypothetical Example for Comparison Purposes.The second section of the table provides information about hypothetical account values and hypothetical expenses based on the Fund’s actual expense ratio for each class of shares, and an assumed rate of return of 5% per year for each class before expenses, which is not the Fund’s actual return. The hypothetical account values and expenses may not be used to estimate the actual ending account balance or expenses you paid for the period. You may use this information to compare the ongoing costs of investing in the Fund and other funds. To do so, compare this 5% hypothetical example for the class of shares you hold with the 5% hypothetical examples that appear in the shareholder reports of the other funds.
Please note that the expenses shown in the table are meant to highlight your ongoing costs only and do not reflect any transactional costs, such asfront-end or contingent deferred sales charges (loads). Therefore, the “hypothetical” section of the table is useful in comparing ongoing costs only, and will not help you determine the relative total costs of owning different funds. In addition, if these transactional costs were included, your costs would have been higher.
11 INVESCO OPPENHEIMER GLOBAL FOCUS FUND
| | | | | | | | | | | | |
| Actual | | Beginning Account Value May 1, 2019 | | Ending Account Value October 31, 2019 | | Expenses Paid During 6 Months Ended October 31, 20191,2 |
| Class A | | $ | 1,000.00 | | | $ | 977.50 | | | $ | 6.35 | |
| Class C | | | 1,000.00 | | | | 974.00 | | | | 10.05 | |
| Class R | | | 1,000.00 | | | | 976.30 | | | | 7.60 | |
| Class Y | | | 1,000.00 | | | | 978.70 | | | | 5.10 | |
| Class R5 | | | 1,000.00 | | | | 979.20 | | | | 3.91 | |
| Class R6 | | | 1,000.00 | | | | 979.70 | | | | 4.25 | |
| | | |
| Hypothetical | | | | | | | | | | | | |
| (5% return before expenses) | | | | | | | | | | | | |
| Class A | | | 1,000.00 | | | | 1,018.80 | | | | 6.48 | |
| Class C | | | 1,000.00 | | | | 1,015.07 | | | | 10.26 | |
| Class R | | | 1,000.00 | | | | 1,017.54 | | | | 7.76 | |
| Class Y | | | 1,000.00 | | | | 1,020.06 | | | | 5.21 | |
| Class R5 | | | 1,000.00 | | | | 1,020.67 | | | | 4.59 | |
| Class R6 | | | 1,000.00 | | | | 1,020.92 | | | | 4.34 | |
1. Actual expenses paid for Class A, C, R, Y, and R6are equal to the Fund’s annualized expense ratio for that class, multiplied by the average account value over the period, multiplied by 184/365(to reflect theone-half year period). Actual expenses paid for Class R5 are equal to the Fund’s annualized expense ratio for that class, multiplied by the average account value over the period, multiplied by 160/365to reflect the period from after the close of business on May 24, 2019 (inception of offering) to October 31, 2019.
2.Hypothetical expenses paid for all classes are equal to the Fund’s annualized expense ratio for that class, multiplied by the average account value over the period, multiplied by 184/365(to reflect theone-half year period).
Those annualized expense ratios, excluding indirect expenses from affiliated funds, based on the6-month period ended October 31, 2019 for Classes A, C, R, Y and R6and for the period from after the close of business on May 24, 2019 (inception of offering) to October 31, 2019 for Class R5 are as follows:
| | | | |
| Class | | Expense Ratios |
| Class A | | | 1.27 | % |
| Class C | | | 2.01 | |
| Class R | | | 1.52 | |
| Class Y | | | 1.02 | |
| Class R5 | | | 0.90 | |
| Class R6 | | | 0.85 | |
The expense ratios reflect voluntary and/or contractual waivers and/or reimbursements of expenses by the Fund’s Manager. Some of these undertakings may be modified or terminated at any time, as indicated in the Fund’s prospectus. The “Financial Highlights” tables in the
12 INVESCO OPPENHEIMER GLOBAL FOCUS FUND
Fund’s financial statements, included in this report, also show the gross expense ratios, without such waivers or reimbursements and reduction to custodian expenses, if applicable.
13 INVESCO OPPENHEIMER GLOBAL FOCUS FUND
SCHEDULE OF INVESTMENTSOctober 31, 2019
| | | | | | | | |
| | | Shares | | | Value | |
| Common Stocks—100.1% | |
| Consumer Discretionary—33.4% | |
| Entertainment—5.0% | | | | | | | | |
| Electronic Arts, Inc.1 | | | 121,641 | | | $ | 11,726,193 | |
| Nintendo Co. Ltd. | | | 31,100 | | | | 11,092,719 | |
| | | | | | | 22,818,912 | |
| Interactive Media & Services—16.8% | | | | | |
| Alphabet, Inc., Cl. A1 | | | 16,537 | | | | 20,816,776 | |
| Baidu, Inc., | | | | | | | | |
| Sponsored ADR1 | | | 58,122 | | | | 5,919,726 | |
| Facebook, Inc., Cl. A1 | | | 165,782 | | | | 31,772,120 | |
| Tencent Holdings Ltd. | | | 314,400 | | | | 12,820,477 | |
| Yandex NV, Cl. A1 | | | 133,881 | | | | 4,470,287 | |
| | | | | | | 75,799,386 | |
| Internet & Catalog Retail—11.6% | | | | | |
| Alibaba Group Holding Ltd., Sponsored ADR1 | | | 139,422 | | | | 24,631,685 | |
| Amazon.com, Inc.1 | | | 12,020 | | | | 21,355,453 | |
| ASOS plc1 | | | 134,848 | | | | 6,183,958 | |
| | | | | | | 52,171,096 | |
| Financials—3.9% | | | | | | | | |
| Commercial Banks—3.9% | | | | | |
| Wells Fargo & Co. | | | 338,696 | | | | 17,486,875 | |
| Health Care—24.2% | | | | | | | | |
| Biotechnology—4.7% | | | | | | | | |
| BeiGene Ltd., ADR1 | | | 53,474 | | | | 7,397,593 | |
| Genmab AS1 | | | 61,986 | | | | 13,509,141 | |
| | | | | | | 20,906,734 | |
| Health Care Equipment & Supplies—3.5% | |
| Abbott Laboratories | | | 107,912 | | | | 9,022,522 | |
| Coloplast AS, Cl. B | | | 57,086 | | | | 6,878,570 | |
| | | | | | | 15,901,092 | |
| Life Sciences Tools & Services—4.5% | | | | | |
| Lonza Group AG1 | | | 28,960 | | | | 10,426,253 | |
| Thermo Fisher Scientific, Inc. | | | 22,131 | | | | 6,683,119 | |
| Wuxi Biologics Cayman, Inc.1,2 | | | 271,000 | | | | 3,188,123 | |
| | | | | | | 20,297,495 | |
| Pharmaceuticals—11.5% | | | | | | | | |
| Bayer AG | | | 142,670 | | | | 11,068,990 | |
| Bristol-Myers Squibb Co. | | | 319,513 | | | | 18,330,461 | |
| Elanco Animal Health, Inc.1 | | | 315,549 | | | | 8,526,134 | |
| | | | | | | | |
| | | Shares | | | Value | |
| Pharmaceuticals (Continued) | |
| Novo Nordisk AS, Cl. B | | | 252,835 | | | $ | 13,920,645 | |
| | | | | | | 51,846,230 | |
| Industrials—3.5% | | | | | | | | |
| Professional Services—3.5% | | | | | |
IHS Markit Ltd.1 | | | 226,919 | | | | 15,888,868 | |
| Information Technology—32.8% | | | | | |
| IT Services—13.0% | | | | | | | | |
| Mastercard, Inc., Cl. A | | | 71,334 | | | | 19,745,965 | |
| Okta, Inc., Cl. A1 | | | 33,041 | | | | 3,603,782 | |
| PayPal Holdings, Inc.1 | | | 210,691 | | | | 21,932,933 | |
| Twilio, Inc., Cl. A1 | | | 139,129 | | | | 13,434,296 | |
| | | | | | | 58,716,976 | |
| Semiconductors & Semiconductor Equipment—2.3% | |
QUALCOMM, Inc. | | | 125,964 | | | | 10,132,544 | |
| Software—17.5% | | | | | | | | |
| Alteryx, Inc., Cl. A1 | | | 71,266 | | | | 6,520,839 | |
| Anaplan, Inc.1 | | | 123,051 | | | | 5,808,007 | |
| Nice Ltd., Sponsored ADR1 | | | 86,675 | | | | 13,676,448 | |
| salesforce.com, Inc.1 | | | 142,747 | | | | 22,338,478 | |
| ServiceNow, Inc.1 | | | 79,698 | | | | 19,706,127 | |
| Splunk, Inc.1 | | | 90,762 | | | | 10,887,810 | |
| | | | | | | 78,937,709 | |
| Materials—2.3% | | | | | | | | |
| Chemicals—2.3% | | | | | | | | |
| Chr. Hansen Holding AS | | | 138,049 | | | | 10,596,283 | |
| Total Investments, at Value (Cost $323,621,405) | | | 100.1 | % | | | 451,500,200 | |
| Net Other Assets (Liabilities) | | | (0.1 | ) | | | (654,772 | ) |
| Net Assets | | | 100.0% | | | $ | 450,845,428 | |
| | | | |
14 INVESCO OPPENHEIMER GLOBAL FOCUS FUND
Footnotes to Schedule of Investments
1.Non-income producing security.
2. Security purchased or received in a transaction exempt from registration under the Securities Act of 1933, as amended (the “1933 Act”). The security may be resold pursuant to an exemption from registration under the 1933 Act, typically to qualified institutional buyers. The aggregate value of these securities at October 31, 2019 was $3,188,123, which represented 0.71% of the Fund’s Net Assets.
Distribution of investments representing geographic holdings, as a percentage of total investments at value, is as follows:
| | | | | | | | |
| Geographic Holdings | | Value | | | Percent |
| United States | | $ | 295,719,302 | | | | 65.5 | % |
| China | | | 53,957,604 | | | | 11.9 | |
| Denmark | | | 44,904,639 | | | | 9.9 | |
| Israel | | | 13,676,448 | | | | 3.0 | |
| Japan | | | 11,092,719 | | | | 2.5 | |
| Germany | | | 11,068,990 | | | | 2.5 | |
| Switzerland | | | 10,426,253 | | | | 2.3 | |
| United Kingdom | | | 6,183,958 | | | | 1.4 | |
| Russia | | | 4,470,287 | | | | 1.0 | |
| Total | | $ | 451,500,200 | | | | 100.0 | % |
| | | | |
| | |
Glossary: | | |
| Definitions | | |
| ADR | | American Depositary Receipt |
See accompanying Notes to Financial Statements.
15 INVESCO OPPENHEIMER GLOBAL FOCUS FUND
STATEMENT OF ASSETS AND LIABILITIESOctober 31, 2019
| | | | |
| Assets | | | | |
| Investments, at value—unaffiliated companies (cost $ 323,621,405)—see accompanying schedule of investments | | $ | 451,500,200 | |
| Receivables and other assets: | | | | |
| Investments sold | | | 3,298,561 | |
| Dividends | | | 679,579 | |
| Shares of beneficial interest sold | | | 173,822 | |
| Other | | | 13,241 | |
| | | | |
| Total assets | | | 455,665,403 | |
| Liabilities | | | | |
| Amount due to custodian | | | 2,383,239 | |
| Payables and other liabilities: | | | | |
| Investments purchased | | | 1,641,042 | |
| Shares of beneficial interest redeemed | | | 321,582 | |
| Transfer and shareholder servicing agent fees | | | 258,348 | |
| Shareholder communications | | | 71,571 | |
| Distribution and service plan fees | | | 67,538 | |
| Trustees’ compensation | | | 13,721 | |
| Advisory fees | | | 9,808 | |
| Administration fees | | | 147 | |
| Other | | | 52,979 | |
| | | | |
| Total liabilities | | | 4,819,975 | |
| Net Assets | | $ | 450,845,428 | |
| | | | |
| | | |
| Composition of Net Assets | | | | |
| Shares of beneficial interest | | $ | 291,078,997 | |
| Total distributable earnings | | | 159,766,431 | |
| | | | |
| Net Assets | | $ | 450,845,428 | |
| | | | |
16 INVESCO OPPENHEIMER GLOBAL FOCUS FUND
| | |
| Net Asset Value Per Share | | |
| |
| Class A Shares: | | |
| |
| Net asset value and redemption price per share (based on net assets of $145,331,591 and 2,742,452 shares of beneficial interest outstanding) | | $52.99 |
| |
Maximum offering price per share (net asset value plus sales charge of 5.50% of offering price) | | $56.07 |
| |
| Class C Shares: | | |
| |
Net asset value, redemption price (excludes applicable contingent deferred sales charge) and offering price per share (based on net assets of $43,574,110 and 890,103 shares of beneficial interest outstanding) | | $48.95 |
| |
| Class R Shares: | | |
| |
Net asset value, redemption price and offering price per share (based on net assets of $9,692,026 and 188,044 shares of beneficial interest outstanding) | | $51.54 |
| |
| Class Y Shares: | | |
| |
Net asset value, redemption price and offering price per share (based on net assets of $138,469,562 and 2,554,148 shares of beneficial interest outstanding) | | $54.21 |
| |
| Class R5 Shares: | | |
| |
Net asset value, redemption price and offering price per share (based on net assets of $10,396 and 195.85 shares of beneficial interest outstanding) | | $53.08 |
| |
| Class R6 Shares: | | |
| |
| Net asset value, redemption price and offering price per share (based on net assets of $113,767,743 and 2,072,631 shares of beneficial interest outstanding) | | $54.89 |
See accompanying Notes to Financial Statements.
17 INVESCO OPPENHEIMER GLOBAL FOCUS FUND
STATEMENT
OF OPERATIONS
| | | | | | |
| | | Six Months Ended
October 31, 2019 | | Year Ended
April 30, 2019 |
| Investment Income | | | | | | |
| Dividends: | | | | | | |
| Unaffiliated companies (net of foreign withholding taxes of $45,956 and $285,328, respectively) | | $ | 1,815,311 | | | $ 5,743,570 |
| Affiliated companies | | | 7,112 | | | 156,145 |
| Interest | | | 832 | | | 1,863 |
| | | |
| Total investment income | | | 1,823,255 | | | 5,901,578 |
| | | | | | |
| Expenses | | | | | | |
| Advisory fees | | | 2,140,132 | | | 4,723,358 |
| Administration fees | | | 32,055 | | | — |
| Distribution and service plan fees: | | | | | | |
| Class A | | | 181,749 | | | 355,133 |
| Class C | | | 238,513 | | | 561,438 |
| Class R | | | 24,483 | | | 42,123 |
| Transfer and shareholder servicing agent fees: | | | | | | |
| Class A | | | 163,049 | | | 286,543 |
| Class C | | | 51,887 | | | 109,600 |
| Class R | | | 10,693 | | | 16,629 |
| Class Y | | | 239,148 | | | 543,280 |
| Class R5 | | | 3 | | | — |
| Class R6 | | | 10,862 | | | 31,852 |
| Shareholder communications: | | | | | | |
| Class A | | | 20,565 | | | 1,566 |
| Class C | | | 6,223 | | | 1,036 |
| Class R | | | 1,381 | | | 340 |
| Class Y | | | 25,489 | | | 24,118 |
| Class R5 | | | 1 | | | — |
| Class R6 | | | 15,988 | | | 211 |
| Custodian fees and expenses | | | 12,932 | | | 35,699 |
| Trustees’ compensation | | | 8,735 | | | 8,837 |
| Borrowing fees | | | 1,932 | | | 17,342 |
| Other | | | 64,643 | | | 78,366 |
| | | |
| Total expenses | | | 3,250,463 | | | 6,837,471 |
| Less waivers, reimbursements of expenses, and expense offset arrangement(s) | | | (112,867 | ) | | (7,886) |
| | | |
| Net expenses | | | 3,137,596 | | | 6,829,585 |
| | | | | | |
| Net Investment Income (Loss) | | | (1,314,341 | ) | | (928,007) |
18 INVESCO OPPENHEIMER GLOBAL FOCUS FUND
| | | | | | | | |
| | | Six Months Ended
October 31, 2019 | | Year Ended
April 30, 2019 | |
| Realized and Unrealized Gain (Loss) | | | | | | | | |
| Net realized gain (loss) on: | | | | | | | | |
| Investment transactions in unaffiliated companies | | $ | 40,582,454 | | | $ | 674,966 | |
| Foreign currency transactions | | | (11,265 | ) | | | (12,924) | |
| | | | |
| Net realized gain | | | 40,571,189 | | | | 662,042 | |
| Net change in unrealized appreciation/(depreciation) on: | | | | | | | | |
| Investment transactions in unaffiliated companies | | | (58,588,369 | ) | | | 57,598,113 | |
| Translation of assets and liabilities denominated in foreign currencies | | | 1,803 | | | | 12,977 | |
| | | | |
| Net change in unrealized appreciation/(depreciation) | | | (58,586,566 | ) | | | 57,611,090 | |
| | | | | | | | |
| Net Increase (Decrease) in Net Assets Resulting from Operations | | $ | (19,329,718 | ) | | $ | 57,345,125 | |
| | | | |
See accompanying Notes to Financial Statements.
19 INVESCO OPPENHEIMER GLOBAL FOCUS FUND
STATEMENT OF CHANGES IN NET ASSETS
| | | | | | | | | | | | |
| | | Six Months Ended
October 31, 2019 | | | Year Ended
April 30, 2019 | | | Year Ended
April 30, 2018 | |
| Operations | | | | | | | | | | | | |
| Net investment loss | | $ | (1,314,341) | | | $ | (928,007) | | | $ | (2,128,792) | |
| |
| Net realized gain (loss) | | | 40,571,189 | | | | 662,042 | | | | 51,681,617 | |
| |
| Net change in unrealized appreciation/(depreciation) | | | (58,586,566) | | | | 57,611,090 | | | | 30,249,994 | |
| | | | |
| Net increase (decrease) in net assets resulting from operations | | | (19,329,718) | | | | 57,345,125 | | | | 79,802,819 | |
| | | | | | | | | | | | |
| |
| Dividends and/or Distributions to Shareholders | | | | | | | | | | | | |
| Distributions to shareholders from distributable earnings: | | | | | | | | | | | | |
| Class A | | | — | | | | (5,161,344) | | | | (2,594,170) | |
| Class C | | | — | | | | (2,126,031) | | | | (1,074,244) | |
| Class R | | | — | | | | (316,929) | | | | (154,768) | |
| Class Y | | | — | | | | (9,705,305) | | | | (4,644,076) | |
| Class R5 | | | — | | | | — | | | | — | |
| Class R6 | | | — | | | | (3,303,642) | | | | (1,639,598) | |
| | | | |
| Total distributions from distributable earnings | | | — | | | | (20,613,251) | | | | (10,106,856) | |
| | | | | | | | | | | | |
| |
| Beneficial Interest Transactions | | | | | | | | | | | | |
| Net increase (decrease) in net assets resulting from beneficial interest transactions: | | | | | | | | | | | | |
| Class A | | | (6,448,556) | | | | (919,943) | | | | (14,112,784) | |
| Class C | | | (10,762,438) | | | | (4,647,399) | | | | (1,812,804) | |
| Class R | | | 29,511 | | | | 1,584,945 | | | | (2,300) | |
| Class Y | | | (152,166,902) | | | | 20,840,692 | | | | (19,053,832) | |
| Class R5 | | | 10,000 | | | | — | | | | — | |
| Class R6 | | | (14,516,075) | | | | 20,421,920 | | | | 13,566,182 | |
| | | | |
| Total beneficial interest transactions | | | (183,854,460) | | | | 37,280,215 | | | | (21,415,538) | |
| | | | | | | | | | | | |
| |
| Net Assets | | | | | | | | | | | | |
| Total increase (decrease) | | | (203,184,178) | | | | 74,012,089 | | | | 48,280,425 | |
| |
| Beginning of period | | | 654,029,606 | | | | 580,017,517 | | | | 531,737,092 | |
| | | | |
| End of period | | $ | 450,845,428 | | | $ | 654,029,606 | | | $ | 580,017,517 | |
| | | | |
See accompanying Notes to Financial Statements.
20 INVESCO OPPENHEIMER GLOBAL FOCUS FUND
FINANCIAL HIGHLIGHTS
| | | | | | | | | | | | | | | | | | | | | | | | |
| Class A | | Six Months
Ended
October 31,
2019 | | | Year Ended
April 30,
2019 | | | Year Ended
April 30,
2018 | | | Year Ended
April 30,
2017 | | | Year Ended
April 29,
20161 | | | Year Ended
April 30, 2015 | |
| Per Share Operating Data | | | | | | | | | | | | | | | | | | | | | | | | |
| Net asset value, beginning of period | | | $54.20 | | | | $51.71 | | | | $45.73 | | | | $39.26 | | | | $42.91 | | | | $42.01 | |
| Income (loss) from investment operations: | | | | | | | | | | | | | | | | | | | | | | | | |
| Net investment income (loss)2 | | | (0.16) | | | | (0.13) | | | | (0.24) | | | | (0.12) | | | | (0.08) | | | | 0.02 | |
| Net realized and unrealized gain (loss) | | | (1.05) | | | | 4.48 | | | | 7.15 | | | | 6.59 | | | | (3.57) | | | | 1.63 | |
| Total from investment operations | | | (1.21) | | | | 4.35 | | | | 6.91 | | | | 6.47 | | | | (3.65) | | | | 1.65 | |
| Dividends and/or distributions to shareholders: | | | | | | | | | | | | | | | | | | | | | | | | |
| Distributions from net realized gain | | | 0.00 | | | | (1.86) | | | | (0.93) | | | | 0.00 | | | | 0.00 | | | | (0.75) | |
| Net asset value, end of period | | | $52.99 | | | | $54.20 | | | | $51.71 | | | | $45.73 | | | | $39.26 | | | | $42.91 | |
| | | | |
| | | | | | | | | | | | | | | | | | | | | | | | |
| Total Return, at Net Asset Value3 | | | (2.23)% | | | | 9.11% | | | | 15.17% | | | | 16.51% | | | | (8.53)% | | | | 3.94% | |
| | | | | | | | | | | | | | | | | | | | | | | | |
| Ratios/Supplemental Data | | | | | | | | | | | | | | | | | | | | | | | | |
| Net assets, end of period (in thousands) | | | $145,332 | | | | $155,251 | | | | $148,492 | | | | $145,248 | | | | $176,181 | | | | $231,060 | |
| Average net assets (in thousands) | | | $148,605 | | | | $146,939 | | | | $145,310 | | | | $151,991 | | | | $204,746 | | | | $266,375 | |
| Ratios to average net assets:4 | | | | | | | | | | | | | | | | | | | | | | | | |
| Net investment income (loss) | | | (0.60)% | | | | (0.26)% | | | | (0.47)% | | | | (0.29)% | | | | (0.20)% | | | | 0.04% | |
| Expenses excluding specific expenses listed below | | | 1.31% | | | | 1.25% | | | | 1.28% | | | | 1.30% | | | | 1.30% | | | | 1.31% | |
| Interest and fees from borrowings | | | 0.00%5 | | | | 0.00%5 | | | | 0.00%5 | | | | 0.00%5 | | | | 0.00%5 | | | | 0.00% | |
| | | | |
| Total expenses6 | | | 1.31% | | | | 1.25% | | | | 1.28% | | | | 1.30% | | | | 1.30% | | | | 1.31% | |
| Expenses after payments, waivers and/or reimbursements and reduction to custodian expenses | | | 1.27% | | | | 1.25%7 | | | | 1.27% | | | | 1.30%7 | | | | 1.30%7 | | | | 1.31%7 | |
| Portfolio turnover rate8 | | | 20% | | | | 46% | | | | 63% | | | | 59% | | | | 89% | | | | 102% | |
21 INVESCO OPPENHEIMER GLOBAL FOCUS FUND
FINANCIAL HIGHLIGHTSContinued
1. Represents the last business day of the Fund’s reporting period.
2. Per share amounts calculated based on the average shares outstanding during the period.
3. Includes adjustments in accordance with accounting principles generally accepted in the United States of America and as such, the net asset value for financial reporting purposes and the returns based upon those net asset values may differ from the net asset value and returns for shareholder transactions. Does not include sales charges and is not annualized for periods less than one year, if applicable.
4. Annualized for periods less than one full year.
5. Less than 0.005%.
6. Total expenses including indirect expenses from affiliated fund fees and expenses were as follows:
| | | | | | |
| Six Months Ended October 31, 2019 | | | 1.31 | % | | |
| Year Ended April 30, 2019 | | | 1.25 | % | | |
| Year Ended April 30, 2018 | | | 1.28 | % | | |
| Year Ended April 30, 2017 | | | 1.30 | % | | |
| Year Ended April 29, 2016 | | | 1.30 | % | | |
| Year Ended April 30, 2015 | | | 1.31 | % | | |
7. Waiver was less than 0.005%.
8. Portfolio turnover is calculated at the fund level and is not annualized for periods less than one year, if applicable.
See accompanying Notes to Financial Statements.
22 INVESCO OPPENHEIMER GLOBAL FOCUS FUND
| | | | | | | | | | | | | | | | | | | | | | |
| Class C | | Six Months
Ended
October 31,
2019 | | | Year Ended
April 30,
2019 | | | Year Ended
April 30,
2018 | | | Year Ended
April 30,
2017 | | | Year Ended
April 29,
20161 | | | Year Ended
April 30,
2015 |
Per Share Operating Data | | | | | | | | | | | | | | | | | | | | | | |
| Net asset value, beginning of period | | | $50.26 | | | | $48.45 | | | | $43.23 | | | | $37.39 | | | | $41.18 | | | $40.65 |
| Income (loss) from investment operations: | | | | | | | | | | | | | | | | | | | | | | |
| Net investment loss2 | | | (0.33) | | | | (0.49) | | | | (0.59) | | | | (0.42) | | | | (0.37) | | | (0.30) |
| Net realized and unrealized gain (loss) | | | (0.98) | | | | 4.16 | | | | 6.74 | | | | 6.26 | | | | (3.42) | | | 1.58 |
| Total from investment operations | | | (1.31) | | | | 3.67 | | | | 6.15 | | | | 5.84 | | | | (3.79) | | | 1.28 |
| Dividends and/or distributions to shareholders: | | | | | | | | | | | | | | | | | | | | | | |
| Distributions from net realized gain | | | 0.00 | | | | (1.86) | | | | (0.93) | | | | 0.00 | | | | 0.00 | | | (0.75) |
| Net asset value, end of period | | | $48.95 | | | | $50.26 | | | | $48.45 | | | | $43.23 | | | | $37.39 | | | $41.18 |
| | | | | | | | | | | | | | | | | | | | | | |
| | | | | | | | | | | | | | | | | | | | | | |
| Total Return, at Net Asset Value3 | | | (2.60)% | | | | 8.28% | | | | 14.29% | | | | 15.62% | | | | (9.20)% | | | 3.16% |
| | | | | | | | | | | | | | | | | | | | | | |
Ratios/Supplemental Data | | | | | | | | | | | | | | | | | | | | | | |
| Net assets, end of period (in thousands) | | | $43,574 | | | | $55,891 | | | | $58,385 | | | | $54,019 | | | | $70,795 | | | $89,540 |
| Average net assets (in thousands) | | | $47,338 | | | | $56,182 | | | | $56,515 | | | | $59,990 | | | | $79,329 | | | $92,759 |
| Ratios to average net assets:4 | | | | | | | | | | | | | | | | | | | | | | |
| Net investment loss | | | (1.34)% | | | | (1.02)% | | | | (1.23)% | | | | (1.06)% | | | | (0.96)% | | | (0.75)% |
| Expenses excluding specific expenses listed below | | | 2.07% | | | | 2.01% | | | | 2.03% | | | | 2.06% | | | | 2.06% | | | 2.07% |
| Interest and fees from borrowings | | | 0.00%5 | | | | 0.00%5 | | | | 0.00%5 | | | | 0.00%5 | | | | 0.00%5 | | | 0.00% |
| Total expenses6 | | | 2.07% | | | | 2.01% | | | | 2.03% | | | | 2.06% | | | | 2.06% | | | 2.07% |
| Expenses after payments, waivers and/or reimbursements and reduction to custodian expenses | | | 2.01% | | | | 2.01%7 | | | | 2.02% | | | | 2.06%7 | | | | 2.06%7 | | | 2.07%7 |
| Portfolio turnover rate8 | | | 20% | | | | 46% | | | | 63% | | | | 59% | | | | 89% | | | 102% |
23 INVESCO OPPENHEIMER GLOBAL FOCUS FUND
FINANCIAL HIGHLIGHTSContinued
1. Represents the last business day of the Fund’s reporting period.
2. Per share amounts calculated based on the average shares outstanding during the period.
3. Includes adjustments in accordance with accounting principles generally accepted in the United States of America and as such, the net asset value for financial reporting purposes and the returns based upon those net asset values may differ from the net asset value and returns for shareholder transactions. Does not include sales charges and is not annualized for periods less than one year, if applicable.
4. Annualized for periods less than one full year.
5. Less than 0.005%.
6. Total expenses including indirect expenses from affiliated fund fees and expenses were as follows:
| | | | | | |
| Six Months Ended October 31, 2019 | | | 2.07 | % | | |
| Year Ended April 30, 2019 | | | 2.01 | % | | |
| Year Ended April 30, 2018 | | | 2.03 | % | | |
| Year Ended April 30, 2017 | | | 2.06 | % | | |
| Year Ended April 29, 2016 | | | 2.06 | % | | |
| Year Ended April 30, 2015 | | | 2.07 | % | | |
7. Waiver was less than 0.005%.
8. Portfolio turnover is calculated at the fund level and is not annualized for periods less than one year, if applicable.
See accompanying Notes to Financial Statements.
24 INVESCO OPPENHEIMER GLOBAL FOCUS FUND
| | | | | | | | | | | | | | | | | | | | | | | | |
| Class R | | Six Months
Ended
October 31,
2019 | | | Year Ended
April 30,
2019 | | | Year Ended
April 30,
2018 | | | Year Ended
April 30,
2017 | | | Year Ended
April 29,
20161 | | | Year Ended
April 30,
2015 | |
Per Share Operating Data | | | | | | | | | | | | | | | | | | | | | | | | |
| Net asset value, beginning of period | | | $52.79 | | | | $50.53 | | | | $44.82 | | | | $38.57 | | | | $42.27 | | | | $41.50 | |
| Income (loss) from investment operations: | | | | | | | | | | | | | | | | | | | | | | | | |
| Net investment loss2 | | | (0.22) | | | | (0.26) | | | | (0.36) | | | | (0.23) | | | | (0.18) | | | | (0.12) | |
| Net realized and unrealized gain (loss) | | | (1.03) | | | | 4.38 | | | | 7.00 | | | | 6.48 | | | | (3.52) | | | | 1.64 | |
| Total from investment operations | | | (1.25) | | | | 4.12 | | | | 6.64 | | | | 6.25 | | | | (3.70) | | | | 1.52 | |
| Dividends and/or distributions to shareholders: | | | | | | | | | | | | | | | | | | | | | | | | |
| Distributions from net realized gain | | | 0.00 | | | | (1.86) | | | | (0.93) | | | | 0.00 | | | | 0.00 | | | | (0.75) | |
| Net asset value, end of period | | | $51.54 | | | | $52.79 | | | | $50.53 | | | | $44.82 | | | | $38.57 | | | | $42.27 | |
| | | | | | | | | | | | | | | | | | | | | | | | |
| | | | | | | | | | | | | | | | | | | | | | | | |
| Total Return, at Net Asset Value3 | | | (2.37)% | | | | 8.84% | | | | 14.88% | | | | 16.21% | | | | (8.76)% | | | | 3.70% | |
| | | | | | | | | | | | | | | | | | | | | | | | |
Ratios/Supplemental Data | | | | | | | | | | | | | | | | | | | | | | | | |
| Net assets, end of period (in thousands) | | | $9,692 | | | | $9,895 | | | | $7,812 | | | | $6,898 | | | | $7,709 | | | | $8,113 | |
| Average net assets (in thousands) | | | $9,747 | | | | $8,530 | | | | $8,228 | | | | $7,066 | | | | $7,813 | | | | $6,980 | |
| Ratios to average net assets:4 | | | | | | | | | | | | | | | | | | | | | | | | |
| Net investment loss | | | (0.85)% | | | | (0.52)% | | | | (0.73)% | | | | (0.56)% | | | | (0.46)% | | | | (0.30)% | |
| Expenses excluding specific expenses listed below | | | 1.57% | | | | 1.51% | | | | 1.53% | | | | 1.56% | | | | 1.55% | | | | 1.53% | |
| Interest and fees from borrowings | | | 0.00%5 | | | | 0.00%5 | | | | 0.00%5 | | | | 0.00%5 | | | | 0.00%5 | | | | 0.00% | |
| Total expenses6 | | | 1.57% | | | | 1.51% | | | | 1.53% | | | | 1.56% | | | | 1.55% | | | | 1.53% | |
| Expenses after payments, waivers and/or reimbursements and reduction to custodian expenses | | | 1.52% | | | | 1.51%7 | | | | 1.52% | | | | 1.56%7 | | | | 1.55%7 | | | | 1.53%7 | |
| Portfolio turnover rate8 | | | 20% | | | | 46% | | | | 63% | | | | 59% | | | | 89% | | | | 102% | |
25 INVESCO OPPENHEIMER GLOBAL FOCUS FUND
FINANCIAL HIGHLIGHTSContinued
1. Represents the last business day of the Fund’s reporting period.
2. Per share amounts calculated based on the average shares outstanding during the period.
3. Includes adjustments in accordance with accounting principles generally accepted in the United States of America and as such, the net asset value for financial reporting purposes and the returns based upon those net asset values may differ from the net asset value and returns for shareholder transactions. Does not include sales charges and is not annualized for periods less than one year, if applicable.
4. Annualized for periods less than one full year.
5. Less than 0.005%.
6. Total expenses including indirect expenses from affiliated fund fees and expenses were as follows:
| | | | | | |
| Six Months Ended October 31, 2019 | | | 1.57 | % | | |
| Year Ended April 30, 2019 | | | 1.51 | % | | |
| Year Ended April 30, 2018 | | | 1.53 | % | | |
| Year Ended April 30, 2017 | | | 1.56 | % | | |
| Year Ended April 29, 2016 | | | 1.55 | % | | |
| Year Ended April 30, 2015 | | | 1.53 | % | | |
7. Waiver was less than 0.005%.
8. Portfolio turnover is calculated at the fund level and is not annualized for periods less than one year, if applicable.
See accompanying Notes to Financial Statements.
26 INVESCO OPPENHEIMER GLOBAL FOCUS FUND
| | | | | | | | | | | | | | | | | | | | | | | | |
| Class Y | | Six Months
Ended
October 31,
2019 | | | Year Ended
April 30,
2019 | | | Year Ended
April 30,
2018 | | | Year Ended
April 30,
2017 | | | Year Ended
April 29,
20161 | | | Year Ended
April 30,
2015 | |
| Per Share Operating Data | | | | | | | | | | | | | | | | | | | | | | | | |
| Net asset value, beginning of period | | | $55.39 | | | | $52.67 | | | | $46.46 | | | | $39.78 | | | | $43.38 | | | | $42.35 | |
| Income (loss) from investment operations: | | | | | | | | | | | | | | | | | | | | | | | | |
| Net investment income (loss)2 | | | (0.10) | | | | (0.01) | | | | (0.12) | | | | (0.00)3 | | | | 0.02 | | | | 0.08 | |
| Net realized and unrealized gain (loss) | | | (1.08) | | | | 4.59 | | | | 7.26 | | | | 6.68 | | | | (3.62) | | | | 1.70 | |
| Total from investment operations | | | (1.18) | | | | 4.58 | | | | 7.14 | | | | 6.68 | | | | (3.60) | | | | 1.78 | |
| Dividends and/or distributions to shareholders: | | | | | | | | | | | | | | | | | | | | | | | | |
| Distributions from net realized gain | | | 0.00 | | | | (1.86) | | | | (0.93) | | | | 0.00 | | | | 0.00 | | | | (0.75) | |
| Net asset value, end of period | | | $54.21 | | | | $55.39 | | | | $52.67 | | | | $46.46 | | | | $39.78 | | | | $43.38 | |
| | | | |
| | | | | | | | | | | | | | | | | | | | | | | | |
| Total Return, at Net Asset Value4 | | | (2.13)% | | | | 9.36% | | | | 15.44% | | | | 16.79% | | | | (8.28)% | | | | 4.22% | |
| | | | | | | | | | | | | | | | | | | | | | | | |
| Ratios/Supplemental Data | | | | | | | | | | | | | | | | | | | | | | | | |
| Net assets, end of period (in thousands) | | | $138,470 | | | | $301,919 | | | | $266,886 | | | | $250,427 | | | | $109,761 | | | | $132,678 | |
| Average net assets (in thousands) | | | $218,521 | | | | $278,695 | | | | $271,461 | | | | $127,129 | | | | $119,119 | | | | $135,104 | |
| Ratios to average net assets:5 | | | | | | | | | | | | | | | | | | | | | | | | |
| Net investment income (loss) | | | (0.36)% | | | | (0.03)% | | | | (0.24)% | | | | (0.01)% | | | | 0.04% | | | | 0.20% | |
| Expenses excluding specific expenses listed below | | | 1.07% | | | | 1.02% | | | | 1.04% | | | | 1.05% | | | | 1.05% | | | | 1.07% | |
| Interest and fees from borrowings | | | 0.00%6 | | | | 0.00%6 | | | | 0.00%6 | | | | 0.00%6 | | | | 0.00%6 | | | | 0.00% | |
| Total expenses7 | | | 1.07% | | | | 1.02% | | | | 1.04% | | | | 1.05% | | | | 1.05% | | | | 1.07% | |
| Expenses after payments, waivers and/or reimbursements and reduction to custodian expenses | | | 1.02% | | | | 1.02%8 | | | | 1.03% | | | | 1.05%8 | | | | 1.05%8 | | | | 1.05% | |
| Portfolio turnover rate9 | | | 20% | | | | 46% | | | | 63% | | | | 59% | | | | 89% | | | | 102% | |
27 INVESCO OPPENHEIMER GLOBAL FOCUS FUND
FINANCIAL HIGHLIGHTSContinued
1. Represents the last business day of the Fund’s reporting period.
2. Per share amounts calculated based on the average shares outstanding during the period.
3. Less than $0.005 per share.
4. Includes adjustments in accordance with accounting principles generally accepted in the United States of America and as such, the net asset value for financial reporting purposes and the returns based upon those net asset values may differ from the net asset value and returns for shareholder transactions. Does not include sales charges and is not annualized for periods less than one year, if applicable.
5. Annualized for periods less than one full year.
6. Less than 0.005%.
7. Total expenses including indirect expenses from affiliated fund fees and expenses were as follows:
| | | | | | |
| Six Months Ended October 31, 2019 | | | 1.07 | % | | |
| Year Ended April 30, 2019 | | | 1.02 | % | | |
| Year Ended April 30, 2018 | | | 1.04 | % | | |
| Year Ended April 30, 2017 | | | 1.05 | % | | |
| Year Ended April 29, 2016 | | | 1.05 | % | | |
| Year Ended April 30, 2015 | | | 1.07 | % | | |
8. Waiver was less than 0.005%.
9. Portfolio turnover is calculated at the fund level and is not annualized for periods less than one year, if applicable.
See accompanying Notes to Financial Statements.
28 INVESCO OPPENHEIMER GLOBAL FOCUS FUND
| | | | |
| Class R5 | | Period Ended October 31, 20191 |
| | |
| Per Share Operating Data | | | | |
| Net asset value, beginning of period | | | $51.06 | |
| Income (loss) from investment operations: | | | | |
| Net investment loss2 | | | (0.05) | |
| Net realized and unrealized gain | | | 2.07 | |
| Total from investment operations | | | 2.02 | |
| Dividends and/or distributions to shareholders: | | | | |
| Distributions from net realized gain | | | 0.00 | |
| Net asset value, end of period | | | $53.08 | |
| | | | |
| | | | |
| Total Return, at Net Asset Value3 | | | 3.96% | |
| | | | |
| | |
| Ratios/Supplemental Data | | | | |
| Net assets, end of period (in thousands) | | | $10 | |
| Average net assets (in thousands) | | | $10 | |
| Ratios to average net assets:4 | | | | |
| Net investment loss | | | (0.23)% | |
| Expenses excluding specific expenses listed below | | | 0.92% | |
| Interest and fees from borrowings | | | 0.00% | |
| Total expenses5 | | | 0.92% | |
| Expenses after payments, waivers and/or reimbursements and reduction to custodian expenses | | | 0.90% | |
| Portfolio turnover rate6 | | | 20% | |
1. For the period from after the close of business on May 24, 2019 (inception of offering) to October 31, 2019.
2. Per share amounts calculated based on the average shares outstanding during the period.
3. Includes adjustments in accordance with accounting principles generally accepted in the United States of America and as such, the net asset value for financial reporting purposes and the returns based upon those net asset values may differ from the net asset value and returns for shareholder transactions. Does not include sales charges and is not annualized for periods less than one year, if applicable.
4. Annualized for periods less than one full year.
5. Total expenses including indirect expenses from affiliated fund fees and expenses were as follows:
| | | | | | |
| Period Ended October 31, 2019 | | | 0.92 | % | | |
6. Portfolio turnover is calculated at the fund level and is not annualized for periods less than one year, if applicable.
See accompanying Notes to Financial Statements.
29 INVESCO OPPENHEIMER GLOBAL FOCUS FUND
FINANCIAL HIGHLIGHTSContinued
| | | | | | | | | | | | | | | | | | | | | | | | |
| Class R6 | | Six Months
Ended
October 31,
2019 | | | Year Ended
April 30,
2019 | | | Year Ended
April 30,
2018 | | | Year Ended
April 30,
2017 | | | Year Ended
April 29,
20161 | | | Year Ended
April 30,
2015 | |
Per Share Operating Data | | | | | | | | | | | | | | | | | | | | | | | | |
| Net asset value, beginning of period | | | $56.03 | | | | $53.16 | | | | $46.80 | | | | $40.00 | | | | $43.53 | | | | $42.42 | |
| Income (loss) from investment operations: | | | | | | | | | | | | | | | | | | | | | | | | |
| Net investment income (loss)2 | | | (0.05) | | | | 0.08 | | | | (0.02) | | | | 0.05 | | | | 0.08 | | | | 0.18 | |
| Net realized and unrealized gain (loss) | | | (1.09) | | | | 4.65 | | | | 7.31 | | | | 6.75 | | | | (3.61) | | | | 1.68 | |
| Total from investment operations | | | (1.14) | | | | 4.73 | | | | 7.29 | | | | 6.80 | | | | (3.53) | | | | 1.86 | |
| Dividends and/or distributions to shareholders: | | | | | | | | | | | | | | | | | | | | | | | | |
| Distributions from net realized gain | | | 0.00 | | | | (1.86) | | | | (0.93) | | | | 0.00 | | | | 0.00 | | | | (0.75) | |
| Net asset value, end of period | | | $54.89 | | | | $56.03 | | | | $53.16 | | | | $46.80 | | | | $40.00 | | | | $43.53 | |
| | | | | | | | | | | | | | | | | | | | | | | | |
| | | | | | | | | | | | | | | | | | | | | | | | |
| Total Return, at Net Asset Value3 | | | (2.03)% | | | | 9.56% | | | | 15.65% | | | | 17.00% | | | | (8.11)% | | | | 4.40% | |
| | | | | | | | | | | | | | | | | | | |
Ratios/Supplemental Data | | | | | | | | | | | | | | | | | | | | | | | | |
| Net assets, end of period (in thousands) | | | $113,768 | | | | $131,074 | | | | $98,443 | | | | $75,145 | | | | $72,137 | | | | $18,703 | |
| Average net assets (in thousands) | | | $118,481 | | | | $106,260 | | | | $86,389 | | | | $72,417 | | | | $54,326 | | | | $15,286 | |
| Ratios to average net assets:4 | | | | | | | | | | | | | | | | | | | | | | | | |
| Net investment income (loss) | | | (0.18)% | | | | 0.15% | | | | (0.05)% | | | | 0.13% | | | | 0.20% | | | | 0.43% | |
| Expenses excluding specific expenses listed below | | | 0.87% | | | | 0.85% | | | | 0.85% | | | | 0.86% | | | | 0.86% | | | | 0.87% | |
| Interest and fees from borrowings | | | 0.00%5 | | | | 0.00%5 | | | | 0.00%5 | | | | 0.00%5 | | | | 0.00%5 | | | | 0.00% | |
| Total expenses6 | | | 0.87% | | | | 0.85% | | | | 0.85% | | | | 0.86% | | | | 0.86% | | | | 0.87% | |
| Expenses after payments, waivers and/or reimbursements and reduction to custodian expenses | | | 0.85% | | | | 0.85%7 | | | | 0.85%7 | | | | 0.86%7 | | | | 0.86%7 | | | | 0.87%7 | |
| Portfolio turnover rate8 | | | 20% | | | | 46% | | | | 63% | | | | 59% | | | | 89% | | | | 102% | |
30 INVESCO OPPENHEIMER GLOBAL FOCUS FUND
1. Represents the last business day of the Fund’s reporting period.
2. Per share amounts calculated based on the average shares outstanding during the period.
3. Includes adjustments in accordance with accounting principles generally accepted in the United States of America and as such, the net asset value for financial reporting purposes and the returns based upon those net asset values may differ from the net asset value and returns for shareholder transactions. Does not include sales charges and is not annualized for periods less than one year, if applicable.
4. Annualized for periods less than one full year.
5. Less than 0.005%.
6. Total expenses including indirect expenses from affiliated fund fees and expenses were as follows:
| | | | | | |
Six Months Ended October 31, 2019 | | | 0.87 | % | | |
Year Ended April 30, 2019 | | | 0.85 | % | | |
Year Ended April 30, 2018 | | | 0.85 | % | | |
Year Ended April 30, 2017 | | | 0.86 | % | | |
Year Ended April 29, 2016 | | | 0.86 | % | | |
Year Ended April 30, 2015 | | | 0.87 | % | | |
7. Waiver was less than 0.005%.
8. Portfolio turnover is calculated at the fund level and is not annualized for periods less than one year, if applicable.
See accompanying Notes to Financial Statements.
31 INVESCO OPPENHEIMER GLOBAL FOCUS FUND
NOTES TO FINANCIAL STATEMENTSOctober 31, 2019
Note 1 – Significant Accounting Policies
Invesco Oppenheimer Global Focus Fund (the “Fund”) is a series portfolio of AIM International Mutual Funds (Invesco International Mutual Funds) (the “Trust”). The Trust is a Delaware statutory trust registered under the Investment Company Act of 1940, as amended (the “1940 Act”), as anopen-end series management investment company authorized to issue an unlimited number of shares of beneficial interest. Information presented in these financial statements pertains only to the Fund. Matters affecting the Fund or each class will be voted on exclusively by the shareholders of such Fund or each class.
Prior to the close of business on May 24, 2019, the Fund operated as Oppenheimer Global Focus Fund (the “Acquired Fund” or “Predecessor Fund”). The Acquired Fund was reorganized after the close of business on May 24, 2019 (the “Reorganization Date”) through the transfer of all of its assets and liabilities to the Fund (the “Reorganization”).
Upon closing of the Reorganization, holders of the Acquired Fund’s Class A, Class C, Class R, and Class Y shares received the corresponding class of shares of the Fund and holders of the Acquired Fund’s Class I shares received Class R6 shares of the Fund. Information for the Acquired Fund’s Class I shares prior to the Reorganization is included with Class R6 shares throughout this report. Class R5 shares commenced operations on the Reorganization Date.
Effective October 31, 2019, the Fund’s fiscal year end changed from April 30 to October 31.
The Fund’s investment objective is to seek capital appreciation.
The Fund currently consists of six different classes of shares: Class A, Class C, Class R, Class Y, Class R5 and Class R6. Class Y shares are available only to certain investors. Class A shares are sold with afront-end sales charge unless certain waiver criteria are met and under certain circumstances load waived shares may be subject to contingent deferred sales charges (“CDSC”). Class C shares are sold with a CDSC. Class R, Class Y, Class R5 and Class R6 shares are sold at net asset value. Class C shares held for ten years after purchase are eligible for automatic conversion into Class A shares of the same Fund (the “Conversion Feature”). The automatic conversion pursuant to the Conversion Feature will generally occur at the end of the month following the tenth anniversary after a purchase of Class C shares.
The Fund is an investment company and accordingly follows the investment company accounting and reporting guidance in accordance with Financial Accounting Standards Board Accounting Standards Codification Topic 946, Financial Services – Investment Companies.
The following is a summary of the significant accounting policies followed by the Fund in the preparation of its financial statements.
A. Security Valuations– Securities, including restricted securities, are valued according to the following policy.
A security listed or traded on an exchange (except convertible securities) is valued at its last sales price or official closing price as of the close of the customary trading session on the exchange where the security is principally traded, or lacking any sales or official closing price on a particular day, the security may be valued at the closing bid price on that day. Securities traded in theover-the-counter market are valued based on prices furnished by independent pricing services or market makers. When such securities are valued by an independent pricing service they may be considered fair valued. Futures contracts are valued
32 INVESCO OPPENHEIMER GLOBAL FOCUS FUND
at the final settlement price set by an exchange on which they are principally traded. Listed options are valued at the mean between the last bid and asked prices from the exchange on which they are principally traded. Options not listed on an exchange are valued by an independent source at the mean between the last bid and asked prices. For purposes of determining net asset value (“NAV”) per share, futures and option contracts generally are valued 15 minutes after the close of the customary trading session of the New York Stock Exchange (“NYSE”).
Investments inopen-end andclosed-end registered investment companies that do not trade on an exchange are valued at theend-of-day net asset value per share. Investments inopen-end andclosed-end registered investment companies that trade on an exchange are valued at the last sales price or official closing price as of the close of the customary trading session on the exchange where the security is principally traded.
Debt obligations (including convertible securities) and unlisted equities are fair valued using an evaluated quote provided by an independent pricing service. Evaluated quotes provided by the pricing service may be determined without exclusive reliance on quoted prices, and may reflect appropriate factors such asinstitution-size trading in similar groups of securities, developments related to specific securities, dividend rate (for unlisted equities), yield (for debt obligations), quality, type of issue, coupon rate (for debt obligations), maturity (for debt obligations), individual trading characteristics and other market data. Pricing services generally value debt obligations assuming orderly transactions of institutional round lot size, but a fund may hold or transact in the same securities in smaller, odd lot sizes. Odd lots often trade at lower prices than institutional round lots. Debt obligations are subject to interest rate and credit risks. In addition, all debt obligations involve some risk of default with respect to interest and/or principal payments.
Foreign securities’ (including foreign exchange contracts) prices are converted into U.S. dollar amounts using the applicable exchange rates as of the close of the NYSE. If market quotations are available and reliable for foreign exchange-traded equity securities, the securities will be valued at the market quotations. Because trading hours for certain foreign securities end before the close of the NYSE, closing market quotations may become unreliable. If between the time trading ends on a particular security and the close of the customary trading session on the NYSE, events occur that the investment adviser determines are significant and make the closing price unreliable, the Fund may fair value the security. If the event is likely to have affected the closing price of the security, the security will be valued at fair value in good faith using procedures approved by the Board of Trustees. Adjustments to closing prices to reflect fair value may also be based on a screening process of an independent pricing service to indicate the degree of certainty, based on historical data, that the closing price in the principal market where a foreign security trades is not the current value as of the close of the NYSE. Foreign securities’ prices meeting the approved degree of certainty that the price is not reflective of current value will be priced at the indication of fair value from the independent pricing service. Multiple factors may be considered by the independent pricing service in determining adjustments to reflect fair value and may include information relating to sector indices, American Depositary Receipts and domestic and foreign index futures. Foreign securities may have
33 INVESCO OPPENHEIMER GLOBAL FOCUS FUND
NOTES TO FINANCIAL STATEMENTSContinued
additional risks including exchange rate changes, potential for sharply devalued currencies and high inflation, political and economic upheaval, the relative lack of issuer information, relatively low market liquidity and the potential lack of strict financial and accounting controls and standards.
Securities for which market prices are not provided by any of the above methods may be valued based upon quotes furnished by independent sources. The last bid price may be used to value equity securities. The mean between the last bid and asked prices is used to value debt obligations, including corporate loans.
Securities for which market quotations are not readily available or became unreliable are valued at fair value as determined in good faith by or under the supervision of the Trust’s officers following procedures approved by the Board of Trustees. Issuer specific events, market trends, bid/asked quotes of brokers and information providers and other market data may be reviewed in the course of making a good faith determination of a security’s fair value.
The Fund may invest in securities that are subject to interest rate risk, meaning the risk that the prices will generally fall as interest rates rise and, conversely, the prices will generally rise as interest rates fall. Specific securities differ in their sensitivity to changes in interest rates depending on their individual characteristics. Changes in interest rates may result in increased market volatility, which may affect the value and/or liquidity of certain Fund investments.
Valuations change in response to many factors including the historical and prospective earnings of the issuer, the value of the issuer’s assets, general economic conditions, interest rates, investor perceptions and market liquidity. Because of the inherent uncertainties of valuation, the values reflected in the financial statements may materially differ from the value received upon actual sale of those investments.
| B. | Securities Transactions and Investment Income - Securities transactions are accounted for on a trade date basis. Realized gains or losses on sales are computed on the basis of specific identification of the securities sold. Interest income (net of withholding tax, if any) is recorded on the accrual basis from settlement date. Dividend income (net of withholding tax, if any) is recorded on theex-dividend date. |
The Fund may periodically participate in litigation related to Fund investments. As such, the Fund may receive proceeds from litigation settlements. Any proceeds received are included in the Statement of Operations as realized gain (loss) for investments no longer held and as unrealized gain (loss) for investments still held.
Brokerage commissions and mark ups are considered transaction costs and are recorded as an increase to the cost basis of securities purchased and/or a reduction of proceeds on a sale of securities. Such transaction costs are included in the determination of net realized and unrealized gain (loss) from investment transactions reported in the Statement of Operations and the Statement of Changes in Net Assets and the net realized and unrealized gains (losses) on securities per share in the Financial Highlights. Transaction costs are included in the calculation of the Fund’s net asset value and, accordingly, they reduce the Fund’s total returns. These transaction costs are not considered operating expenses and are not reflected in net investment income reported in the Statement of Operations and
34 INVESCO OPPENHEIMER GLOBAL FOCUS FUND
the Statement of Changes in Net Assets, or the net investment income per share and the ratios of expenses and net investment income reported in the Financial Highlights, nor are they limited by any expense limitation arrangements between the Fund and the investment adviser.
The Fund allocates income and realized and unrealized capital gains and losses to a class based on the relative net assets of each class.
| C. | Country Determination - For the purposes of making investment selection decisions and presentation in the Schedule of Investments, the investment adviser may determine the country in which an issuer is located and/or credit risk exposure based on various factors. These factors include the laws of the country under which the issuer is organized, where the issuer maintains a principal office, the country in which the issuer derives 50% or more of its total revenues and the country that has the primary market for the issuer’s securities, as well as other criteria. Among the other criteria that may be evaluated for making this determination are the country in which the issuer maintains 50% or more of its assets, the type of security, financial guarantees and enhancements, the nature of the collateral and the sponsor organization. |
| D. | Distributions - Dividends and distributions to shareholders, which are determined in accordance with income tax regulations and may differ from accounting principles generally accepted in the United States of America (“GAAP”), are recorded on theex-dividend date. Income and capital gain distributions, if any, are declared and paid annually or at other times as determined necessary by the Adviser. |
| E. | Federal Income Taxes - The Fund intends to comply with provisions of the Internal Revenue Code applicable to regulated investment companies and to distribute substantially all of its investment company taxable income, including any net realized gain on investments not offset by capital loss carryforwards, if any, to shareholders. Therefore, no federal income or excise tax provision is required. The Fund files income tax returns in U.S. federal and applicable state jurisdictions. The statute of limitations on the Fund’s tax return filings generally remains open for the three preceding fiscal reporting period ends. The Fund has analyzed its tax positions for the fiscal year ended October 31, 2019, including open tax years, and does not believe there are any uncertain tax positions requiring recognition in the Fund’s financial statements. |
The tax components of capital shown in the following table represent distribution requirements the Fund must satisfy under the income tax regulations, losses the Fund may be able to offset against income and gains realized in future years and unrealized appreciation or depreciation of securities and other investments for federal income tax purposes.
35 INVESCO OPPENHEIMER GLOBAL FOCUS FUND
NOTES TO FINANCIAL STATEMENTSContinued
| | | | | | | | | | | | |
Undistributed Net Investment Income | | Undistributed Long-Term Gain | | | Accumulated Loss Carryforward1,2 | | | Net Unrealized Appreciation Based on cost of Securities and Other Investments for Federal Income Tax Purposes | |
| $5,751,292 | | | $30,753,726 | | | | $— | | | | $123,273,618 | |
1. During the reporting period, the Fund did not utilize any capital loss carryforward.
2. During the previous reporting period, the Fund did not utilize any capital loss carryforward.
Net investment income (loss) and net realized gain (loss) may differ for financial statement and tax purposes. The character of dividends and distributions made during the fiscal year from net investment income or net realized gains are determined in accordance with federal income tax requirements, which may differ from the character of net investment income or net realized gains presented in those financial statements in accordance with U.S. GAAP. Also, due to timing of dividends and distributions, the fiscal year in which amounts are distributed may differ from the fiscal year in which the income or net realized gain was recorded by the Fund.
Accordingly, the following amounts have been reclassified for the reporting period. Net assets of the Fund were unaffected by the reclassifications.
| | | | |
Increase toPaid-in Capital | | Reduction to Accumulated Net Realized Gain3 | |
| $5,468,422 | | | $5,468,422 | |
3. $5,468,422, all of which was long-term capital gain, was distributed in connection with Fund share redemptions.
The tax character of distributions paid during the reporting periods:
| | | | | | | | | | | | |
| | | Six Months Ended October 31, 2019 | | | Year Ended April 30, 2019 | | | Year Ended April 30, 2018 |
| Distributions paid from: | | | | | | | | | | | | |
| Ordinary income | | $ | — | | | $ | 1,807,376 | | | $ | 7,779,241 | |
| Long-term capital gain | | | — | | | | 18,805,875 | | | | 2,327,615 | |
| | | | |
| Total | | $ | — | | | $ | 20,613,251 | | | $ | 10,106,856 | |
| | | | |
The aggregate cost of securities and other investments and the composition of unrealized appreciation and depreciation of securities and other investments for federal income tax purposes at period end are noted in the following table. The primary difference between book and tax appreciation or depreciation of securities and other investments, if applicable, is attributable to the tax deferral of losses or tax realization of financial statement unrealized gain or loss.
36 INVESCO OPPENHEIMER GLOBAL FOCUS FUND
| | | | |
| Federal tax cost of securities | | $ | 328,220,980 | |
| | | | |
| Gross unrealized appreciation | | $ | 132,147,869 | |
| Gross unrealized depreciation | | | (8,874,251 | ) |
| | | | |
| Net unrealized appreciation | | $ | 123,273,618 | |
| | | | |
| F. | Expenses -Fees provided for under the Rule12b-1 plan of a particular class of the Fund are charged to the operations of such class. Transfer agency fees and expenses and other shareholder recordkeeping fees and expenses attributable to Class R5 and Class R6 are allocated to each share class based on relative net assets.Sub-accounting fees attributable to Class R5 are charged to the operations of the class. Transfer agency fees and expenses and other shareholder recordkeeping fees and expenses relating to all other classes are allocated among those classes based on relative net assets. All other expenses are allocated among the classes based on relative net assets. |
| G. | Accounting Estimates -The financial statements are prepared on a basis in conformity with GAAP, which requires management to make estimates and assumptions that affect the reported amounts of assets and liabilities at the date of the financial statements and the reported amounts of revenues and expenses during the reporting period including estimates and assumptions related to taxation. Actual results could differ from those estimates by a significant amount. In addition, the Fund monitors for material events or transactions that may occur or become known after theperiod-end date and before the date the financial statements are released to print. |
| H. | Indemnifications -Under the Trust’s organizational documents, each Trustee, officer, employee or other agent of the Trust is indemnified against certain liabilities that may arise out of the performance of their duties to the Fund. Additionally, in the normal course of business, the Fund enters into contracts, including the Fund’s servicing agreements, that contain a variety of indemnification clauses. The Fund’s maximum exposure under these arrangements is unknown as this would involve future claims that may be made against the Fund that have not yet occurred. The risk of material loss as a result of such indemnification claims is considered remote. |
| I. | Foreign Currency Translations -Foreign currency is valued at the close of the NYSE based on quotations posted by banks and major currency dealers. Portfolio securities and other assets and liabilities denominated in foreign currencies are translated into U.S. dollar amounts at the date of valuation. Purchases and sales of portfolio securities (net of foreign taxes withheld on disposition) and income items denominated in foreign currencies are translated into U.S. dollar amounts on the respective dates of such transactions. The Fund does not separately account for the portion of the results of operations resulting from changes in foreign exchange rates on investments and the fluctuations arising from changes in market prices of securities held. The combined results of changes in foreign exchange rates and the fluctuation of market prices on investments (net of estimated foreign tax withholding) are included with the net realized and unrealized gain or loss from investments in the Statement of Operations. Reported net realized foreign currency gains or losses arise from (1) sales of foreign currencies, (2) currency gains or losses realized between the trade and settlement dates on securities transactions, and (3) the difference |
37 INVESCO OPPENHEIMER GLOBAL FOCUS FUND
NOTES TO FINANCIAL STATEMENTSContinued
| | between the amounts of dividends, interest, and foreign withholding taxes recorded on the Fund’s books and the U.S. dollar equivalent of the amounts actually received or paid. Net unrealized foreign currency gains and losses arise from changes in the fair values of assets and liabilities, other than investments in securities at fiscal period end, resulting from changes in exchange rates. The Fund may invest in foreign securities, which may be subject to foreign taxes on income, gains on investments or currency repatriation, a portion of which may be recoverable. Foreign taxes, if any, are recorded based on the tax regulations and rates that exist in the foreign markets in which the Fund invests and are shown in the Statement of Operations. |
Note 2 – Advisory Fees and Other Fees Paid to Affiliates
The Trust has entered into a master investment advisory agreement with Invesco Advisers, Inc. (the “Adviser” or “Invesco”). Under the terms of the investment advisory agreement, the Fund accrues daily and pays monthly an advisory fee to the Adviser based on the annual rate of the Fund’s average daily net assets as follows:
| | | | |
| Fee Schedule* | |
| First $500 million | | | 0.80 | % |
| Next $500 million | | | 0.75 | |
| Over $1 billion | | | 0.72 | |
*The advisory fee paid by the Fund shall be reduced by any amounts paid by the Fund under the administrative services agreement with the Adviser.
For the periodended October 31, 2019, the effective advisory fee incurred by the Fund was 0.78% annualized.
From the beginning of the fiscal period until the date of the Reorganization, the Acquired Fund paid $330,695in advisory fees to OFI Global Asset Management, Inc. based on the annual rates above of the Acquired Fund’s average daily net assets.
Under the terms of a mastersub-advisory agreement between the Adviser and each of Invesco Asset Management Deutschland GmbH, Invesco Asset Management Limited, Invesco Asset Management (Japan) Limited, Invesco Hong Kong Limited, Invesco Senior Secured Management, Inc. and Invesco Canada Ltd. and separatesub-advisory agreements with Invesco Capital Management LLC, and Invesco Asset Management (India) Private Limited (collectively, the “AffiliatedSub-Advisers”) the Adviser, not the Fund, will pay 40% of the fees paid to the Adviser to any such AffiliatedSub-Adviser(s) that provide(s) discretionary investment management services to the Fund based on the percentage of assets allocated to such AffiliatedSub-Adviser(s). Invesco has also entered into aSub-Advisory Agreement with OppenheimerFunds, Inc. to provide discretionary management services to the Funds.
Effective on the Reorganization Date, the Adviser has contractually agreed, through at least May 31, 2021, to waive advisory fees and/or reimburse expenses of all shares to the extent necessary to limit the total annual fund operating expenses after fee waiver and/or expense reimbursement (excluding certain items discussed below) ofClass A, Class C, Class R, Class Y, Class R5 and Class R6 shares to 1.27%, 2.01%, 1.52%, 1.02%, 0.90% and 0.85%, respectively, of the Fund’s average daily net assets (the “expense limits”). In determining
38 INVESCO OPPENHEIMER GLOBAL FOCUS FUND
the Adviser’s obligation to waive advisory fees and/or reimburse expenses, the following expenses are not taken into account, and could cause total annual fund operating expenses after fee waivers and/or expense reimbursement to exceed the numbers reflected above: (1) interest; (2) taxes; (3) dividend expenses on short sales; (4) extraordinary ornon-routine items, including litigation expenses; and (5) expenses that the Fund has incurred but did not actually pay because of an expense offset arrangement. Unless Invesco continues the fee waiver agreement, it will terminate May 31, 2021. During its term, the fee waiver agreement cannot be terminated or amended to increase the expense limits or reduce the advisory fee waiver without approval of the Board of Trustees.
Further, the Adviser has contractually agreed, through at least June 30, 2021, to waive the advisory fee payable by the Fund in an amount equal to 100% of the net advisory fees the Adviser receives from the affiliated money market funds on investments by the Fund of uninvested cash in such affiliated money market funds.
For the periodended October 31, 2019, the Adviser waived advisory fees of $305 and reimbursed fund expenses of $36,417, $14,246, $2,697, $45,091, $1 and $13,662 for Class A, Class C, Class R, Class Y, Class R5, and Class R6, respectively.
The Trust has entered into a master administrative services agreement with Invesco pursuant to which the Fund has agreed to pay Invesco for certain administrative costs incurred in providing accounting services to the Fund. For the periodended October 31, 2019, expenses incurred under the agreement are shown in the Statement of Operations as Administration fees. Additionally, Invesco has entered into service agreements whereby JPMorgan Chase Bank,serves as custodian to the Fund. Prior to the Reorganization, the Acquired Fund paid administrative fees to OFI Global Asset Management, Inc.
The Trust has entered into a transfer agency and service agreement with Invesco Investment Services, Inc. (“IIS”) pursuant to which the Fund has agreed to pay IIS a fee for providing transfer agency and shareholder services to the Fund and reimburse IIS for certain expenses incurred by IIS in the course of providing such services. IIS may make payments to intermediaries that provide omnibus account services,sub-accounting services and/or networking services. All fees payable by IIS to intermediaries that provide omnibus account services orsub-accounting services are charged back to the Fund, subject to certain limitations approved by the Trust’s Board of Trustees. Prior to the Reorganization, the Acquired Fund paid transfer agent fees to OFI Global Asset Management, Inc. and Shareholder Services, Inc. For the period ended October 31, 2019, expenses incurred under these agreements are shown in the Statement of Operations as Transfer and shareholder servicing agent fees.
The Trust has entered into master distribution agreements with Invesco Distributors, Inc. (“IDI”) to serve as the distributor for theClass A, Class C, Class R, Class Y, Class R5 and Class R6 shares of the Fund. The Trust has adopted plans pursuant to Rule12b-1 under the 1940 Act with respect to the Fund’s Class A, Class C and Class R shares (collectively the “Plan”). The Fund, pursuant to the Class A Plan, reimburses IDI in an amount up to an annual rate of 0.25% of the average daily net assets of Class A shares. The Fund pursuant to the Class C and Class R Plan, pays IDI compensation at the annual rate of 1.00% of the average daily net assets of Class C shares and 0.50% of the average daily net assets of Class R shares. The fees are accrued daily and paid monthly. Of the Plan payments, up to 0.25% of the average
39 INVESCO OPPENHEIMER GLOBAL FOCUS FUND
NOTES TO FINANCIAL STATEMENTSContinued
daily net assets of each class of shares may be paid to furnish continuing personal shareholder services to customers who purchase and own shares of such classes. Any amounts not paid as a service fee under the Plan would constitute an asset-based sales charge. Rules of the Financial Industry Regulatory Authority (“FINRA”) impose a cap on the total sales charges, including asset-based sales charges, that may be paid by any class of shares of the Fund plans. Prior to the Reorganization, the Acquired Fund paid distribution fees to OppenheimerFunds Distributor, Inc. For the periodended October 31, 2019, expenses incurred under the plans are shown in the Statement of Operations as Distribution and service plan fees.
Front-end sales commissions and CDSC (collectively, the “sales charges”) are not recorded as expenses of the Fund.Front-end sales commissions are deducted from proceeds from the sales of Fund shares prior to investment in Class A shares of the Fund. CDSC are deducted from redemption proceeds prior to remittance to the shareholder. During theperiod ended October 31, 2019, IDI advised the Fund that IDI retained $9,769 infront-end sales commissions from the sale of Class A shares and $512 and $1,211 from Class A and Class C shares, respectively, for CDSC imposed on redemptions by shareholders. From the beginning of the fiscal year to the date of the Reorganization, OppenheimerFunds Distributor, Inc. retained $ 2,674 in front–end sales commissions from the sale of Class A shares and $2,845 and $170 from Class A and Class C shares, respectively, for CDSC imposed on redemption by shareholders.
Certain officers and trustees of the Trust are officers and directors of the Adviser, IIS and/or IDI.
Note 3 – Additional Valuation Information
GAAP defines fair value as the price that would be received to sell an asset or paid to transfer a liability in an orderly transaction between market participants at the measurement date, under current market conditions. GAAP establishes a hierarchy that prioritizes the inputs to valuation methods, giving the highest priority to readily available unadjusted quoted prices in an active market for identical assets (Level 1) and the lowest priority to significant unobservable inputs (Level 3), generally when market prices are not readily available or are unreliable. Based on the valuation inputs, the securities or other investments are tiered into one of three levels. Changes in valuation methods may result in transfers in or out of an investment’s assigned level:
Level 1 — Prices are determined using quoted prices in an active market for identical assets.
Level 2 — Prices are determined using other significant observable inputs. Observable inputs are inputs that other market participants may use in pricing a security. These may include quoted prices for similar securities, interest rates, prepayment speeds, credit risk, yield curves, loss severities, default rates, discount rates, volatilities and others.
Level 3 — Prices are determined using significant unobservable inputs. In situations where quoted prices or observable inputs are unavailable (for example, when there is little or no market activity for an investment at the end of the period), unobservable inputs may be used. Unobservable inputs reflect the Fund’s own assumptions about the factors market
40 INVESCO OPPENHEIMER GLOBAL FOCUS FUND
participants would use in determining fair value of the securities or instruments and would be based on the best available information.
The following is a summary of the tiered valuation input levels, as of October 31, 2019. The level assigned to the securities valuations may not be an indication of the risk or liquidity associated with investing in those securities. Because of the inherent uncertainties of valuation, the values reflected in the financial statements may materially differ from the value received upon actual sale of those investments.
| | | | | | | | | | | | | | | | |
| | | Level 1— Unadjusted Quoted Prices | | Level 2— Other Significant Observable Inputs | | | Level 3— Significant Unobservable Inputs | | | Value | |
| Assets Table | | | | | | | | | | | | | | | | |
| Investments, at Value: | | | | | | | | | | | | | | | | |
| Common Stocks | | | | | | | | | | | | | | | | |
Consumer Discretionary | | $ | 120,692,240 | | | $ | 30,097,154 | | | $ | — | | | $ | 150,789,394 | |
Financials | | | 17,486,875 | | | | — | | | | — | | | | 17,486,875 | |
Health Care | | | 49,959,829 | | | | 58,991,722 | | | | — | | | | 108,951,551 | |
Industrials | | | 15,888,868 | | | | — | | | | — | | | | 15,888,868 | |
Information Technology | | | 147,787,229 | | | | — | | | | — | | | | 147,787,229 | |
Materials | | | — | | | | 10,596,283 | | | | — | | | | 10,596,283 | |
| | | | |
| Total Assets | | $ | 351,815,041 | | | $ | 99,685,159 | | | $ | — | | | $ | 451,500,200 | |
| | | | |
Note 4 – Expense Offset Arrangement
The expense offset arrangement is comprised of custodian credits which result from periodic overnight cash balances at the custodian. For theperiodended October 31, 2019, the Fund received credits from this arrangement, which resulted in the reduction of the Fund’s total expenses of $448.
Note 5 – Trustee and Officer Fees and Benefits
Certain Trustees have executed a Deferred Compensation Agreement pursuant to which they have the option to elect to defer receipt of all or a portion of the annual compensation they are entitled to receive from the Fund. For purposes of determining the amount owed to the Trustees under the plan, deferred amounts are treated as though equal dollar amounts had been invested in shares of the Fund or in other Invesco and/or Invesco Oppenheimer funds selected by the Trustees. The Fund purchases shares of the funds selected for deferral by the Trustees in amounts equal to his or her deemed investment, resulting in a Fund asset equal to the deferred compensation liability. Such assets are included as a component of “Other” within the asset section of the Statement of Assets and Liabilities. Deferral of Trustees’ fees under the plan will not affect the net assets of the Fund and will not materially affect the Fund’s assets, liabilities or net investment income per share. Amounts will be deferred until distributed in accordance with the compensation deferral plan.
41 INVESCO OPPENHEIMER GLOBAL FOCUS FUND
NOTES TO FINANCIAL STATEMENTSContinued
Note 6 – Cash Balances
The Fund is permitted to temporarily carry a negative or overdrawn balance in its account with JPMorgan Chase Bank, the custodian bank. Such balances, if any atperiod-end, are shown in the Statement of Assets and Liabilities under the payable caption Amount due to custodian. To compensate the custodian bank for such overdrafts, the overdrawn Fund may either (1) leave funds as a compensating balance in the account so the custodian bank can be compensated by earning the additional interest; or (2) compensate by paying the custodian bank at a rate agreed upon by the custodian bank and Invesco, not to exceed the contractually agreed upon rate.
Note 7 – Investment Transactions
The aggregate amount of investment securities (other than short-term securities, U.S. Treasury obligations and money market funds, if any) purchased and sold by the Fund during theperiodended October 31, 2019 was $107,427,693 and $288,263,762, respectively. Cost of investments, including any derivatives, on a tax basis includes the adjustments for financial reporting purposes as of the most recently completed federal income tax reportingperiod-end.
Note8- Share Information
Transactions in shares of beneficial interest were as follows:
| | | | | | | | | | | | | | | | | | | | | | | | |
| | | Six Months Ended October 31, 20191 | | | Year Ended April 30, 2019 | | | Year Ended April 30, 2018 | |
| | | Shares | | | Amount | | | Shares | | | Amount | | | Shares | | | Amount | |
| Class A | | | | | | | | | | | | | | | | | | | | | | | | |
| Sold | | | 138,031 | | | $ | 7,261,420 | | | | 488,290 | | | $ | 25,088,454 | | | | 426,122 | | | $ | 21,860,005 | |
| Automatic Conversion Class C to Class A Shares | | | 120,423 | | | | 6,311,091 | | | | — | | | | — | | | | — | | | | — | |
| Dividends and/or distributions reinvested | | | — | | | | — | | | | 111,675 | | | | 5,092,381 | | | | 51,406 | | | | 2,566,178 | |
| Redeemed | | | (380,155 | ) | | | (20,021,067 | ) | | | (607,672 | ) | | | (31,100,778 | ) | | | (781,779 | ) | | | (38,538,967 | ) |
| Net increase (decrease) | | | (121,701 | ) | | $ | (6,448,556 | ) | | | (7,707 | ) | | $ | (919,943 | ) | | | (304,251 | ) | | $ | (14,112,784 | ) |
| | | | |
42 INVESCO OPPENHEIMER GLOBAL FOCUS FUND
| | | | | | | | | | | | | | | | | | | | | | | | |
| | | Six Months Ended October 31, 20191 | | | Year Ended April 30, 2019 | | | Year Ended April 30, 2018 | |
| | | Shares | | | Amount | | | Shares | | | Amount | | | Shares | | | Amount | |
| Class C | | | | | | | | | | | | | | | | | | | | | | | | |
| Sold | | | 35,592 | | | $ | 1,720,913 | | | | 152,895 | | | $ | 7,202,424 | | | | 201,491 | | | $ | 9,729,803 | |
| Dividends and/or distributions reinvested | | | — | | | | — | | | | 49,054 | | | | 2,079,902 | | | | 22,459 | | | | 1,053,791 | |
| Automatic conversion Class C to Class A Shares | | | (130,062 | ) | | | (6,311,091 | ) | | | — | | | | — | | | | — | | | | — | |
| Redeemed | | | (127,445 | ) | | | (6,172,260 | ) | | | (294,971 | ) | | | (13,929,725 | ) | | | (268,525 | ) | | | (12,596,398 | ) |
| Net increase (decrease) | | | (221,915 | ) | | $ | (10,762,438 | ) | | | (93,022 | ) | | $ | (4,647,399 | ) | | | (44,575 | ) | | $ | (1,812,804 | ) |
| | | | |
| | | | | | | | | | | | | | | | | | | | | | | | |
| Class R | | | | | | | | | | | | | | | | | | | | | | | | |
| Sold | | | 23,105 | | | $ | 1,176,671 | | | | 60,022 | | | $ | 3,005,653 | | | | 53,471 | | | $ | 2,638,870 | |
| Dividends and/or distributions reinvested | | | — | | | | — | | | | 7,118 | | | | 316,388 | | | | 3,132 | | | | 152,979 | |
| Redeemed | | | (22,515 | ) | | | (1,147,160 | ) | | | (34,273 | ) | | | (1,737,096 | ) | | | (55,922 | ) | | | (2,794,149 | ) |
| Net increase (decrease) | | | 590 | | | $ | 29,511 | | | | 32,867 | | | $ | 1,584,945 | | | | 681 | | | $ | (2,300 | ) |
| | | | |
| | | | | | | | | | | | | | | | | | | | | | | | |
| Class Y | | | | | | | | | | | | | | | | | | | | | | | | |
| Sold | | | 442,609 | | | $ | 23,782,088 | | | | 2,297,925 | | | $ | 118,606,099 | | | | 2,020,633 | | | $ | 103,119,701 | |
| Dividends and/or distributions reinvested | | | — | | | | — | | | | 205,504 | | | | 9,566,198 | | | | 87,921 | | | | 4,467,276 | |
| Redeemed | | | (3,339,207 | ) | | | (175,948,990 | ) | | | (2,119,769 | ) | | | (107,331,605 | ) | | | (2,431,771 | ) | | | (126,640,809 | ) |
| Net increase (decrease) | | | (2,896,598 | ) | | $ | (152,166,902 | ) | | | 383,660 | | | $ | 20,840,692 | | | | (323,217 | ) | | $ | (19,053,832 | ) |
| | | | |
| | | | | | | | | | | | | | | | | | | | | | | | |
| Class R52 | | | | | | | | | | | | | | | | | | | | | | | | |
| Sold | | | 196 | | | $ | 10,000 | | | | — | | | $ | — | | | | — | | | $ | — | |
| Dividends and/or distributions reinvested | | | — | | | | — | | | | — | | | | — | | | | — | | | | — | |
| Redeemed | | | — | | | | — | | | | — | | | | — | | | | — | | | | — | |
| Net increase (decrease) | | | 196 | | | $ | 10,000 | | | | — | | | $ | — | | | | — | | | $ | — | |
| | | | |
43 INVESCO OPPENHEIMER GLOBAL FOCUS FUND
NOTES TO FINANCIAL STATEMENTSContinued
| | | | | | | | | | | | | | | | | | | | | | | | |
| | | Six Months Ended October 31, 20191 | | | Year Ended April 30, 2019 | | | Year Ended April 30, 2018 | |
| | | Shares | | | Amount | | | Shares | | | Amount | | | Shares | | | Amount | |
| Class R6 | | | | | | | | | | | | | | | | | | | | | | | | |
| Sold | | | 92,795 | | | $ | 4,987,731 | | | | 908,696 | | | $ | 43,054,151 | | | | 1,182,169 | | | $ | 63,701,177 | |
| Dividends and/or distributions reinvested | | | — | | | | — | | | | 70,201 | | | | 3,303,642 | | | | 31,992 | | | | 1,639,274 | |
| Redeemed | | | (359,610 | ) | | | (19,503,806 | ) | | | (491,186 | ) | | | (25,935,873 | ) | | | (968,014 | ) | | | (51,774,269 | ) |
| Net increase (decrease) | | | (266,815 | ) | | $ | (14,516,075 | ) | | | 487,711 | | | $ | 20,421,920 | | | | 246,147 | | | $ | 13,566,182 | |
| | | | |
1.There are entities that are record owners of more than 5% of the outstanding shares of the Fund and own 24% of the outstanding shares of the Fund. IDI has an agreement with these entities to sell Fund shares. The Fund, Invesco and/or Invesco affiliates may make payments to these entities, which are considered to be related to the Fund, for providing services to the Fund, Invesco and/or Invesco affiliates, including but not limited to services such as securities brokerage, distribution, third party record keeping and account servicing. The Fund has no knowledge as to whether all or any portion of the shares owned of record by these entities are also owned beneficially.
2. Commencement date after the close of business on May 24, 2019.
Note 9 - Borrowings
Joint Credit Facility.A number of mutual funds managed by the Adviser participate in a $1.95 billion revolving credit facility (the “Facility”) intended to provide short-term financing, if necessary, subject to certain restrictions in connection with atypical redemption activity. Expenses and fees related to the Facility are paid by the participating funds and are disclosed separately or as other expenses on the Statement of Operations. The Fund did not utilize the Facility during the reporting period. The Facility terminated May 24, 2019.
44 INVESCO OPPENHEIMER GLOBAL FOCUS FUND
REPORT OF INDEPENDENT REGISTERED PUBLIC ACCOUNTING FIRM
To the Board of Trustees of AIM International Mutual Funds (Invesco International Mutual Funds) and Shareholders of Invesco Oppenheimer Global Focus Fund
Opinion on the Financial Statements
We have audited the accompanying statement of assets and liabilities, including the schedule of investments, of Invesco Oppenheimer Global Focus Fund (one of the funds constituting AIM International Mutual Funds (Invesco International Mutual Funds), referred to hereafter as the “Fund”) as of October 31, 2019, the related statements of operations and of changes in net assets for the period from May 1, 2019 through October 31, 2019, including the related notes, and the financial highlights for each of the periods ended October 31, 2019 (collectively referred to as the “financial statements”). In our opinion, the financial statements present fairly, in all material respects, the financial position of the Fund as of October 31, 2019, the results of its operations and the changes in its net assets for the period May 1, 2019 through October 31, 2019 and the financial highlights for each of the periods ended October 31, 2019 in conformity with accounting principles generally accepted in the United States of America.
The financial statements of Invesco Oppenheimer Global Focus Fund (formerly known as Oppenheimer Global Focus Fund) as of and for the year ended April 30, 2019 and the financial highlights for each of the periods ended on or prior to April 30, 2019 (not presented herein, other than the statement of changes in net assets and the financial highlights) were audited by other auditors whose report dated June 25, 2019 expressed an unqualified opinion on those financial statements and financial highlights.
Basis for Opinion
These financial statements are the responsibility of the Fund’s management. Our responsibility is to express an opinion on the Fund’s financial statements based on our audit. We are a public accounting firm registered with the Public Company Accounting Oversight Board (United States) (PCAOB) and are required to be independent with respect to the Fund in accordance with the U.S. federal securities laws and the applicable rules and regulations of the Securities and Exchange Commission and the PCAOB.
We conducted our audit of these financial statements in accordance with the standards of the PCAOB. Those standards require that we plan and perform the audit to obtain reasonable assurance about whether the financial statements are free of material misstatement, whether due to error or fraud.
Our audit included performing procedures to assess the risks of material misstatement of the financial statements, whether due to error or fraud, and performing procedures that respond to those risks. Such procedures included examining, on a test basis, evidence regarding the amounts and disclosures in the financial statements. Our audit also included evaluating the accounting principles used and significant estimates made by management, as well as evaluating the overall presentation of the financial statements. Our procedures included confirmation of securities owned as of October 31, 2019 by correspondence with the custodian and brokers; when replies were not received from brokers, we performed other auditing procedures. We believe that our audit provides a reasonable basis for our opinion.
/s/ PricewaterhouseCoopers LLP
Houston, Texas
December 23, 2019
45 INVESCO OPPENHEIMER GLOBAL FOCUS FUND
REPORT OF INDEPENDENT REGISTERED PUBLIC ACCOUNTING FIRM
We have served as the auditor of one or more of the investment companies in the Invesco group of investment companies since at least 1995. We have not been able to determine the specific year we began serving as auditor.
46 INVESCO OPPENHEIMER GLOBAL FOCUS FUND
INDEPENDENT REGISTERED PUBLIC ACCOUNTING FIRM
The Audit Committee of the Board of Trustees appointed, and the Board of Trustees ratified and approved, PricewaterhouseCoopers LLP (“PwC”) as the independent registered public accounting firm of the Fund for the fiscal periods ending after May 24, 2019. Prior to the close of business on May 24, 2019, the Predecessor Fund was a separate series of an unaffiliated investment company and its financial statements were audited by a different independent registered public accounting firm (the “Prior Auditor”).
Effective after the close of business on May 24, 2019, the Prior Auditor resigned as the independent registered public accounting firm of the Fund. The Prior Auditor’s report on the financial statements of the Predecessor Fund for the past two fiscal years did not contain an adverse or disclaimer of opinion, and was not qualified or modified as to uncertainty, audit scope or accounting principles. During the Predecessor Fund’s two most recent fiscal years and through the close of business on May 24, 2019, there were no (1) disagreements with the Prior Auditor on any matter of accounting principles or practices, financial statement disclosure, or auditing scope or procedure, which disagreements, if not resolved to the Prior Auditor’s satisfaction, would have caused it to make reference to that matter in connection with its report; or (2) “reportable events,” as that term is defined in Item 304(a)(1)(v) of RegulationS-K under the Securities Exchange Act of 1934.
47 INVESCO OPPENHEIMER GLOBAL FOCUS FUND
FEDERAL INCOME TAX INFORMATION
In early 2019, if applicable, shareholders of record received information regarding all dividends and distributions paid to them by the Fund during calendar year 2018.
Dividends, if any, paid by the Fund during the reporting period which are not designated as capital gain distributions should be multiplied by the maximum amount allowable but not less than 24.87% to arrive at the amount eligible for the corporate dividend-received deduction.
Dividends, if any, paid by the Fund during the reporting period which are not designated as capital gain distributions, may be eligible for lower individual income tax rates to the extent that the Fund has received qualified dividend income as stipulated by recent tax legislation. In early 2019, shareholders of record received information regarding the percentage of distributions that are eligible for lower individual income tax rates. The amount will be the maximum amount allowed.
A portion, if any, of the dividends paid by the Fund during the reporting period which are not designated as capital gain distributions are eligible for lower individual income tax rates to the extent that the Fund has received qualified dividend income as stipulated by recent tax legislation. The maximum amount allowable but not less than $1,804,361 of the Fund’s fiscal year taxable income may be eligible for the lower individual income tax rates. In early 2019, shareholders of record received information regarding the percentage of distributions that are eligible for lower individual income tax rates.
Recent tax legislation allows a regulated investment company to designate distributions not designated as capital gain distributions, as either interest related dividends or short-term capital gain dividends, both of which are exempt from the U.S. withholding tax applicable to non U.S. taxpayers. For the reporting period, the maximum amount allowable but not less than $5,751,292 of the short-term capital gain distribution to be paid by the Fund qualifies as a short-term capital gain dividend.
The foregoing information is presented to assist shareholders in reporting distributions received from the Fund to the Internal Revenue Service. Because of the complexity of the federal regulations which may affect your individual tax return and the many variations in state and local tax regulations, we recommend that you consult your tax advisor for specific guidance.
48 INVESCO OPPENHEIMER GLOBAL FOCUS FUND
PORTFOLIO PROXY VOTING POLICIES AND GUIDELINES;
UPDATES TO SCHEDULE OF INVESTMENTS
Go paperless with eDelivery
Visit invesco.com/edelivery to enjoy the convenience and security of anytime electronic access to your investment documents.
With eDelivery, you can elect to have any or all of the following materials delivered straight to your inbox to download, save and print from your own computer:
| ● | | Fund reports and prospectuses |
Invesco mailing information
Send general correspondence to Invesco Investment Services, Inc., P.O. Box 219078, Kansas City, MO 64121-9078.
Important notice regarding delivery of security holder documents
To reduce Fund expenses, only one copy of most shareholder documents may be mailed to shareholders with multiple accounts at the same address (Householding). Mailing of your shareholder documents may be householded indefinitely unless you instruct us otherwise. If you do not want the mailing of these documents to be combined with those for other members of your household, please contact Invesco Investment Services, Inc. at 800 959 4246 or contact your financial institution. We will begin sending you individual copies for each account within 30 days after receiving your request.
Fund holdings and proxy voting information
The Fund provides a complete list of its holdings four times in each fiscal year, at the quarter ends. For the second and fourth quarters, the lists appear in the Fund’s semiannual and annual reports to shareholders. For the first and third quarters, the Fund files the lists with the Securities and Exchange Commission (SEC) as an exhibit to its reports on FormN-PORT. The most recent list of portfolio holdings is available at invesco.com/completeqtrholdings. Shareholders can also look up the Fund’s FormsN-PORT on the SEC website at sec.gov.
A description of the policies and procedures that the Fund uses to determine how to vote proxies relating to portfolio securities is available without charge, upon request, from our Client Services department at 800 959 4246 or at invesco.com/proxyguidelines. The information is also available on the SEC website, sec.gov.
Information regarding how the Fund voted proxies related to its portfolio securities during the most recent12-month period ended June 30 is available at invesco.com/proxysearch. The information is also available on the SEC website, sec.gov.
Invesco Advisers, Inc. is an investment adviser; it provides investment advisory services to individual and institutional clients and does not sell securities. Invesco Distributors, Inc. is the US distributor for Invesco Ltd.’s retail mutual funds, exchange-traded funds and institutional money market funds. Both are wholly owned, indirect subsidiaries of Invesco Ltd.
49 INVESCO OPPENHEIMER GLOBAL FOCUS FUND
TRUSTEES AND OFFICERS
The address of each trustee and officer is AIM International Mutual Funds (Invesco International Mutual Funds) (the “Trust”), 11 Greenway Plaza, Suite 1000, Houston, Texas 77046-1173. The trustees serve for the life of the Trust, subject to their earlier death, incapacitation, resignation, retirement or removal as more specifically provided in the Trust’s organizational documents. Each officer serves for a one year term or until their successors are elected and qualified. Column two below includes length of time served with predecessor entities, if any.
| | | | | | | | |
| | | | | |
Name, Year of Birth and Position(s) Held with the Trust | | Trustee and/or Officer Since | | Principal Occupation(s) During Past 5 Years | | Number of Funds in Fund Complex Overseen by Trustee | | Other Directorship(s) Held by Trustee During Past 5 Years |
INTERESTED PERSONS | | | | | | | | |
Martin L. Flanagan1— 1960 Trustee and Vice Chair | | 2007 | | Executive Director, Chief Executive Officer and President, Invesco Ltd. (ultimate parent of Invesco and a global investment management firm); Trustee and Vice Chair, The Invesco Funds; Vice Chair, Investment Company Institute; and Member of Executive Board, SMU Cox School of Business | | 229 | | None |
| | | | | |
| | | | | Formerly: Advisor to the Board, Invesco Advisers, Inc. (formerly known as Invesco Institutional (N.A.), Inc.); Chairman and Chief Executive Officer, Invesco Advisers, Inc. (registered investment adviser); Director, Chairman, Chief Executive Officer and President, Invesco Holding Company (US), Inc. (formerly IVZ Inc.) (holding company), Invesco Group Services, Inc. (service provider) and Invesco North American Holdings, Inc. (holding company); Director, Chief Executive Officer and President, Invesco Holding Company Limited (parent of Invesco and a global investment management firm); Director, Invesco Ltd.; Chairman, Investment Company Institute and President,Co-Chief Executive Officer,Co-President, Chief Operating Officer and Chief Financial Officer, Franklin Resources, Inc. (global investment management organization) | | | | |
Philip A. Taylor2— 1954 Trustee | | 2006 | | Vice Chair, Invesco Ltd.; Trustee, The Invesco Funds | | 229 | | None |
| | | | | |
| | | | | Formerly: Director, Invesco Canada Ltd. (formerly known as Invesco Trimark Ltd./ Invesco Trimark Ltèe) (registered investment adviser and registered transfer agent); Head of the Americas and Senior Managing Director, Invesco Ltd.; Director, Invesco Advisers, Inc. (formerly known as Invesco Institutional (N.A.), Inc.) (registered investment adviser); | | | | |
1 Mr. Flanagan is considered an interested person (within the meaning of Section 2(a)(19) of the 1940 Act) of the Trust because he is an officer of the Adviser to the Trust, and an officer and a director of Invesco Ltd., ultimate parent of the Adviser. |
2 Mr. Taylor is considered an interested person (within the meaning of Section 2(a)(19) of the 1940 Act) of the Trust because he is an officer of Invesco Ltd., ultimate parent of the Adviser. |
50 INVESCO OPPENHEIMER GLOBAL FOCUS FUND
| | | | | | | | |
| | | | | |
Name, Year of Birth and Position(s) Held with the Trust | | Trustee and/or Officer Since | | Principal Occupation(s) During Past 5 Years | | Number of Funds in Fund Complex Overseen by Trustee | | Other Directorship(s) Held by Trustee During Past 5 Years |
INTERESTED PERSONS (CONTINUED) | | | | | | | | |
Philip A. Taylor (Continued) | | | | Director and Chairman, Invesco Investment Services, Inc. (formerly known as Invesco AIM Investment Services, Inc.) (registered transfer agent); Chief Executive Officer, Invesco Corporate Class Inc. (corporate mutual fund company); Chairman and Chief Executive Officer, Invesco Canada Ltd. (formerly known as Invesco Trimark Ltd./Invesco Trimark Ltèe) (registered investment adviser and registered transfer agent); Senior Vice President, The Invesco Funds; Director, Invesco Investment Advisers LLC (formerly known as Van Kampen Asset Management); Director, Chairman, Chief Executive Officer and President, Invesco Management Group, Inc. (formerly known as Invesco AIM Management Group, Inc.) (financial services holding company);Co-Chairman,Co-President andCo-Chief Executive Officer, Invesco Advisers, Inc. (formerly known as Invesco Institutional (N.A.), Inc.) (registered investment adviser); Director, Chief Executive Officer and President, Van Kampen Exchange Corp; President and Principal Executive Officer, The Invesco Funds (other than AIM Treasurer’s Series Trust (Invesco Treasurer’s Series Trust), Short-Term Investments Trust and Invesco Management Trust); Executive Vice President, The Invesco Funds (AIM Treasurer’s Series Trust (Invesco Treasurer’s Series Trust), Short-Term Investments Trust and Invesco Management Trust only); Director and President, INVESCO Funds Group, Inc. (registered investment adviser and registered transfer agent); Director and Chairman, IVZ Distributors, Inc. (formerly known as INVESCO Distributors, Inc.) (registered broker dealer); Director, President and Chairman, Invesco Inc. (holding company), Invesco Canada Holdings Inc. (holding company), Trimark Investments Ltd./ Placements Trimark Ltèe and Invesco Financial Services Ltd/Services Financiers Invesco Ltèe; Chief Executive Officer, Invesco Canada Fund Inc. (corporate mutual fund company); Director and Chairman, Van Kampen Investor Services Inc.; Director, Chief Executive Officer and President, 1371 Preferred Inc. (holding | | | | |
51 INVESCO OPPENHEIMER GLOBAL FOCUS FUND
TRUSTEES AND OFFICERSContinued
| | | | | | | | |
| | | | | |
Name, Year of Birth and Position(s) Held with the Trust | | Trustee and/or Officer Since | | Principal Occupation(s) During Past 5 Years | | Number of Funds in Fund Complex Overseen by Trustee | | Other Directorship(s) Held by Trustee During Past 5 Years |
INTERESTED PERSONS (CONTINUED) | | | | | | | | |
Philip A. Taylor (Continued) | | | | company) and Van Kampen Investments Inc.; Director and President, AIM GP Canada Inc. (general partner for limited partnerships) and Van Kampen Advisors, Inc.; Director and Chief Executive Officer, Invesco Trimark Dealer Inc. (registered broker dealer); Director, Invesco Distributors, Inc. (formerly known as Invesco AIM Distributors, Inc.) (registered broker dealer); Manager, Invesco Capital Management LLC; Director, Chief Executive Officer and President, Invesco Advisers, Inc.; Director, Chairman, Chief Executive Officer and President, Invesco AIM Capital Management, Inc.; President, Invesco Trimark Dealer Inc. and Invesco Trimark Ltd./Invesco Trimark Ltèe; Director and President, AIM Trimark Corporate Class Inc. and AIM Trimark Canada Fund Inc.; Senior Managing Director, Invesco Holding Company Limited; Director and Chairman, Fund Management Company (former registered broker dealer); President and Principal Executive Officer, The Invesco Funds (AIM Treasurer’s Series Trust (Invesco Treasurer’s Series Trust), and Short-Term Investments Trust only); President, AIM Trimark Global Fund Inc. and AIM Trimark Canada Fund Inc. | | | | |
52 INVESCO OPPENHEIMER GLOBAL FOCUS FUND
| | | | | | | | |
| | | | | |
Name, Year of Birth and Position(s) Held with the Trust | | Trustee and/or Officer Since | | Principal Occupation(s) During Past 5 Years | | Number of Funds in Fund Complex Overseen by Trustee | | Other Directorship(s) Held by Trustee During Past 5 Years |
| | | | | |
| INDEPENDENT TRUSTEES | | | | | | | | |
Bruce L. Crockett – 1944 Trustee and Chair | | 2003 | | Chairman, Crockett Technologies Associates (technology consulting company) Formerly: Director, Captaris (unified messaging provider); Director, President and Chief Executive Officer, COMSAT Corporation; Chairman, Board of Governors of INTELSAT (international communications company); ACE Limited (insurance company); Independent Directors Council and Investment Company Institute: Member of the Audit Committee, Investment Company Institute; Member of the Executive Committee and Chair of the Governance Committee, Independent Directors Council | | 229 | | Director and Chairman of the Audit Committee, ALPS (Attorneys Liability Protection Society) (insurance company); Director and Member of the Audit Committee and Compensation Committee, Ferroglobe PLC (metallurgical company) |
| | | | | |
David C. Arch – 1945 Trustee | | 2010 | | Chairman of Blistex Inc. (consumer health care products manufacturer); Member, World Presidents’ Organization | | 229 | | Board member of the Illinois Manufacturers’ Association |
| | | | | |
Beth Ann Brown – 1968 Trustee | | 2019 | | Independent Consultant Formerly: Head of Intermediary Distribution, Managing Director, Strategic Relations, Managing Director, Head of National Accounts, Senior Vice President, National Account Manager and Senior Vice President, Key Account Manager, Columbia Management Investment Advisers LLC; Vice President, Key Account Manager, Liberty Funds Distributor, Inc.; and Trustee of certain Oppenheimer Funds | | 229 | | Director, Board of Directors of Caron Engineering Inc.; Advisor, Board of Advisors of Caron Engineering Inc.; President and Director, of Acton Shapleigh Youth Conservation Corps (non-profit); and Vice President and Director of Grahamtastic Connection (non-profit) |
| | | | | |
Jack M. Fields – 1952 Trustee | | 2003 | | Chief Executive Officer, Twenty First Century Group, Inc. (government affairs company); and Chairman, Discovery Learning Alliance(non-profit) Formerly: Owner and Chief Executive Officer, Dos Angeles Ranch L.P. (cattle, hunting, corporate entertainment); Director, Insperity, Inc. (formerly known as Administaff) (human resources provider); Chief Executive Officer, Texana Timber LP (sustainable forestry company); Director of Cross Timbers Quail Research Ranch(non-profit); and member of the U.S. House of Representatives | | 229 | | None |
53 INVESCO OPPENHEIMER GLOBAL FOCUS FUND
TRUSTEES AND OFFICERSContinued
| | | | | | | | |
| | | | | |
Name, Year of Birth and Position(s) Held with the Trust | | Trustee and/or Officer Since | | Principal Occupation(s) During Past 5 Years | | Number of Funds in Fund Complex Overseen by Trustee | | Other Directorship(s) Held by Trustee During Past 5 Years |
| | | | | |
| INDEPENDENT TRUSTEES (CONTINUED) | | | | | | | | |
| | | | | |
Cynthia Hostetler —1962 Trustee | | 2017 | | Non-Executive Director and Trustee of a number of public and private business corporations Formerly: Director, Aberdeen Investment Funds (4 portfolios); Head of Investment Funds and Private Equity, Overseas Private Investment Corporation; President, First Manhattan Bancorporation, Inc.; Attorney, Simpson Thacher & Bartlett LLP | | 229 | | Vulcan Materials Company (construction materials company); Trilinc Global Impact Fund; Genesee & Wyoming, Inc. (railroads); Artio Global Investment LLC (mutual fund complex); Edgen Group, Inc. (specialized energy and infrastructure products distributor); Investment Company Institute (professional organization); Independent Directors Council (professional organization) |
| | | | | |
Eli Jones – 1961 Trustee | | 2016 | | Professor and Dean, Mays Business School - Texas A&M University Formerly: Professor and Dean, Walton College of Business, University of Arkansas and E.J. Ourso College of Business, Louisiana State University; Director, Arvest Bank | | 229 | | Insperity, Inc. (formerly known as Administaff) (human resources provider) |
| | | | | |
Elizabeth Krentzman – 1959 Trustee | | 2019 | | Formerly: Principal and Chief Regulatory Advisor for Asset Management Services and U.S. Mutual Fund Leader of Deloitte & Touche LLP; General Counsel of the Investment Company Institute (trade association); National Director of the Investment Management Regulatory Consulting Practice, Principal, Director and Senior Manager of Deloitte & Touche LLP; Assistant Director of the Division of Investment Management - Office of Disclosure and Investment Adviser Regulation of the U.S. Securities and Exchange Commission and various positions with the Division of Investment Management – Office of Regulatory Policy of the U.S. Securities and Exchange Commission; Associate at Ropes & Gray LLP.; Advisory Board Member of the Securities and Exchange Commission Historical Society; and Trustee of certain Oppenheimer Funds | | 229 | | Trustee of the University of Florida National Board Foundation and Audit Committee Member; Member of the Cartica Funds Board of Directors (private investment funds); Member of the University of Florida Law Center Association, Inc. Board of Trustees and Audit Committee Member |
54 INVESCO OPPENHEIMER GLOBAL FOCUS FUND
| | | | | | | | |
| | | | | |
Name, Year of Birth and Position(s) Held with the Trust | | Trustee and/or Officer Since | | Principal Occupation(s) During Past 5 Years | | Number of Funds in Fund Complex Overseen by Trustee | | Other Directorship(s) Held by Trustee During Past 5 Years |
| | | | | |
| INDEPENDENT TRUSTEES (CONTINUED) | | | | | | | | |
| | | | | |
| Anthony J. LaCava, Jr. – 1956 Trustee | | 2019 | | Formerly: Director and Member of the Audit Committee, Blue Hills Bank (publicly traded financial institution) and Managing Partner, KPMG LLP | | 229 | | Blue Hills Bank; Chairman of Bentley University; Member, Business School Advisory Council; and Nominating Committee, KPMG LLP |
| | | | | |
Prema Mathai-Davis – 1950 Trustee | | 2003 | | Retired Co-Owner & Partner of Quantalytics Research, LLC, (a FinTech Investment Research Platform for the Self-Directed Investor) | | 229 | | None |
| | | | | |
Joel W. Motley – 1952 Trustee | | 2019 | | Director of Office of Finance, Federal Home Loan Bank; Member of the Vestry of Trinity Wall Street; Managing Director of Carmona Motley Hoffman, Inc. (privately held financial advisor); Member of the Finance and Budget Committee of the Council on Foreign Relations, Member of the Investment Committee and Board of Human Rights Watch and Member of the Investment Committee and Board of Historic Hudson Valley (non-profit cultural organization). Formerly: Managing Director of Public Capital Advisors, LLC (privately held financial advisor); Managing Director of Carmona Motley Hoffman, Inc. (privately held financial advisor); Trustee of certain Oppenheimer Funds; and Director of Columbia Equity Financial Corp. (privately held financial advisor) | | 229 | | Director of Greenwall Foundation (bioethics research foundation); Member of Board and Investment Committee of The Greenwall Foundation; Director of Southern Africa Legal Services Foundation; Board Member and Investment Committee Member of Pulitzer Center for Crisis Reporting(non-profit journalism) |
| | | | | |
Teresa M. Ressel — 1962 Trustee | | 2017 | | Non-executive director and trustee of a number of public and private business corporations Formerly: Chief Financial Officer, Olayan America, The Olayan Group (international investor/commercial/industrial); Chief Executive Officer, UBS Securities LLC; Group Chief Operating Officer, Americas, UBS AG; Assistant Secretary for Management & Budget and CFO, US Department of the Treasury | | 229 | | Atlantic Power Corporation (power generation company); ON Semiconductor Corp. (semiconductor supplier) |
| | | | | |
Ann Barnett Stern – 1957 Trustee | | 2017 | | President and Chief Executive Officer, Houston Endowment Inc. (private philanthropic institution) Formerly: Executive Vice President and General Counsel, Texas Children’s Hospital; | | 229 | | Federal Reserve Bank of Dallas |
55 INVESCO OPPENHEIMER GLOBAL FOCUS FUND
TRUSTEES AND OFFICERSContinued
| | | | | | | | |
| | | | | |
Name, Year of Birth and Position(s) Held with the Trust | | Trustee and/or Officer Since | | Principal Occupation(s) During Past 5 Years | | Number of Funds in Fund Complex Overseen by Trustee | | Other Directorship(s) Held by Trustee During Past 5 Years |
| | | | | |
| INDEPENDENT TRUSTEES (CONTINUED) | | | | | | | | |
| | | | | |
| Ann Barnett Stern (Continued) | | | | Attorney, Beck, Redden and Secrest, LLP; Business Law Instructor, University of St. Thomas; Attorney, Andrews & Kurth LLP | | | | |
| | | | | |
Raymond Stickel, Jr. – 1944 Trustee | | 2005 | | Retired Formerly: Director, Mainstay VP Series Funds, Inc. (25 portfolios); Partner, Deloitte & Touche | | 229 | | None |
| | | | | |
Robert C. Troccoli – 1949 Trustee | | 2016 | | Retired Formerly: Adjunct Professor, University of Denver – Daniels College of Business, Senior Partner, KPMG LLP | | 229 | | None |
| | | | | |
Daniel S. Vandivort –1954 Trustee | | 2019 | | Treasurer, Chairman of the Audit and Finance Committee, and Trustee, Board of Trustees, Huntington Disease Foundation of America; and President, Flyway Advisory Services LLC (consulting and property management). Formerly: Trustee and Governance Chair, of certain Oppenheimer Funds | | 229 | | Chairman and Lead Independent Director, Chairman of the Audit Committee, and Director, Board of Directors, Value Line Funds |
| | | | | |
James D. Vaughn – 1945 Trustee | | 2019 | | Retired Formerly: Managing Partner, Deloitte & Touche LLP; Trustee and Chairman of the Audit Committee, Schroder Funds; Board Member, Mile High United Way, Boys and Girls Clubs, Boy Scouts, Colorado Business Committee for the Arts, Economic Club of Colorado and Metro Denver Network (economic development corporation); and Trustee of certain Oppenheimer Funds | | 229 | | Board member and Chairman of Audit Committee of AMG National Trust Bank; Trustee and Investment Committee member, University of South Dakota Foundation; Board member, Audit Committee Member and past Board Chair, Junior Achievement(non-profit) |
| | | | | |
Christopher L. Wilson – 1957 Trustee, Vice Chair and Chair Designate | | 2017 | | Retired Formerly: Director, TD Asset Management USA Inc. (mutual fund complex) (22 portfolios); Managing Partner, CT2, LLC (investing and consulting firm); President/Chief Executive Officer, Columbia Funds, Bank of America Corporation; President/Chief Executive Officer, CDC IXIS Asset Management Services, Inc.; Principal & Director of Operations, Scudder Funds, Scudder, Stevens & Clark, Inc.; Assistant Vice President, Fidelity Investments | | 229 | | ISO New England, Inc.(non-profit organization managing regional electricity market) |
56 INVESCO OPPENHEIMER GLOBAL FOCUS FUND
| | | | | | | | |
| | | | | |
Name, Year of Birth and Position(s) Held with the Trust | | Trustee and/or Officer Since | | Principal Occupation(s) During Past 5 Years | | Number of Funds in Fund Complex Overseen by Trustee | | Other Directorship(s) Held by Trustee During Past 5 Years |
| | | | | |
| OTHER OFFICERS | | | | | | | | |
| | | | | |
| Sheri Morris — 1964 President, Principal Executive Officer and Treasurer | | 2003 | | Head of Global Fund Services, Invesco Ltd.; President, Principal Executive Officer and Treasurer, The Invesco Funds; Vice President, Invesco Advisers, Inc. (formerly known as Invesco Institutional (N.A.), Inc.) (registered investment adviser); and Vice President, Invesco Exchange-Traded Fund Trust, Invesco Exchange-Traded Fund Trust II, Invesco India Exchange-Traded Fund Trust, Invesco Actively Managed Exchange-Traded Fund Trust, Invesco Actively Managed Exchange-Traded Commodity Fund Trust and Invesco Exchange- Traded Self-Indexed Fund Trust, and Vice President, OppenheimerFunds, Inc. Formerly: Vice President and Principal Financial Officer, The Invesco Funds; Vice President, Invesco AIM Advisers, Inc., Invesco AIM Capital Management, Inc. and Invesco AIM Private Asset Management, Inc.; Assistant Vice President and Assistant Treasurer, The Invesco Funds and Assistant Vice President, Invesco Advisers, Inc., Invesco AIM Capital Management, Inc. and Invesco AIM Private Asset Management, Inc.; and Treasurer, Invesco Exchange-Traded Fund Trust, Invesco Exchange-Traded Fund Trust II, Invesco India Exchange-Traded Fund Trust and Invesco Actively Managed Exchange-Traded Fund Trust | | N/A | | N/A |
| | | | | |
| Russell C. Burk — 1958 Senior Vice President and Senior Officer | | 2005 | | Senior Vice President and Senior Officer, The Invesco Funds | | N/A | | N/A |
| | | | | |
| Jeffrey H. Kupor – 1968 Senior Vice President, Chief Legal Officer and Secretary | | 2018 | | Head of Legal of the Americas, Invesco Ltd.; Senior Vice President and Secretary, Invesco Advisers, Inc. (formerly known as Invesco Institutional (N.A.), Inc.) (registered investment adviser); Senior Vice President and Secretary, Invesco Distributors, Inc. (formerly known as Invesco AIM Distributors, Inc.); Vice President and Secretary, Invesco Investment Services, Inc. (formerly known as Invesco AIM Investment Services, Inc.) Senior Vice President, Chief Legal Officer and Secretary, The Invesco Funds; Secretary and General Counsel, Invesco Investment Advisers LLC (formerly known as Van Kampen Asset Management); Secretary and General Counsel, Invesco Capital Markets, Inc. (formerly known as Van Kampen Funds Inc.) and Chief Legal | | N/A | | N/A |
57 INVESCO OPPENHEIMER GLOBAL FOCUS FUND
TRUSTEES AND OFFICERSContinued
| | | | | | | | |
| | | | | |
Name, Year of Birth and Position(s) Held with the Trust | | Trustee and/or Officer Since | | Principal Occupation(s) During Past 5 Years | | Number of Funds in Fund Complex Overseen by Trustee | | Other Directorship(s) Held by Trustee During Past 5 Years |
| | | | | |
| OTHER OFFICERS (CONTINUED) | | | | | | | | |
| | | | | |
| Jeffrey H. Kupor (Continued) | | | | Officer, Invesco Exchange-Traded Fund Trust, Invesco Exchange-Traded Fund Trust II, Invesco India Exchange-Traded Fund Trust, Invesco Actively Managed Exchange-Traded Fund Trust, Invesco Actively Managed Exchange- Traded Commodity Fund Trust and Invesco Exchange-Traded Self-Indexed Fund Trust; Secretary, Invesco Indexing LLC; Secretary, W.L. Ross & Co., LLC Formerly: Secretary and Vice President, Jemstep, Inc.; Head of Legal, Worldwide Institutional, Invesco Ltd.; Secretary and General Counsel, INVESCO Private Capital Investments, Inc.; Senior Vice President, Secretary and General Counsel, Invesco Management Group, Inc. (formerly known as Invesco AIM Management Group, Inc.); Assistant Secretary, INVESCO Asset Management (Bermuda) Ltd.; Secretary and General Counsel, Invesco Private Capital, Inc.; Assistant Secretary and General Counsel, INVESCO Realty, Inc.; Secretary and General Counsel, Invesco Senior Secured Management, Inc.; and Secretary, Sovereign G./P. Holdings Inc. | | | | |
| | | | | |
Andrew R. Schlossberg – 1974 Senior Vice President | | 2019 | | Head of the Americas and Senior Managing Director, Invesco Ltd.; Director and Senior Vice President, Invesco Advisers, Inc. (formerly known as Invesco Institutional (N.A.), Inc.) (registered investment adviser); Director and Chairman, Invesco Investment Services, Inc. (formerly known as Invesco AIM Investment Services, Inc.) (registered transfer agent); Senior Vice President, The Invesco Funds; Director, Invesco Investment Advisers LLC (formerly known as Van Kampen Asset Management); Director, President and Chairman, Invesco Insurance Agency, Inc. Formerly: Director, Invesco UK Limited; Director and Chief Executive, Invesco Asset Management Limited and Invesco Fund Managers Limited; Assistant Vice President, The Invesco Funds; Senior Vice President, Invesco Advisers, Inc. (formerly known as Invesco Institutional (N.A.), Inc.) (registered investment adviser); Director and Chief Executive, Invesco Administration Services | | N/A | | N/A |
58 INVESCO OPPENHEIMER GLOBAL FOCUS FUND
| | | | | | | | |
| | | | | |
Name, Year of Birth and Position(s) Held with the Trust | | Trustee and/or Officer Since | | Principal Occupation(s) During Past 5 Years | | Number of Funds in Fund Complex Overseen by Trustee | | Other Directorship(s) Held by Trustee During Past 5 Years |
| | | | | |
| OTHER OFFICERS (CONTINUED) | | | | | | | | |
| | | | | |
| Andrew R. Schlossberg (Continued) | | | | Limited and Invesco Global Investment Funds Limited; Director, Invesco Distributors, Inc.; Head of EMEA, Invesco Ltd.; President, Invesco Actively Managed Exchange-Traded Commodity Fund Trust, Invesco Actively Managed Exchange-Traded Fund Trust, Invesco Exchange-Traded Fund Trust, Invesco Exchange-Traded Fund Trust II and Invesco India Exchange-Traded Fund Trust; Managing Director and Principal Executive Officer, Invesco Capital Management LLC | | | | |
| | | | | |
John M. Zerr — 1962 Senior Vice President | | 2006 | | Chief Operating Officer of the Americas; Senior Vice President, Invesco Advisers, Inc. (formerly known as Invesco Institutional (N.A.), Inc.) (registered investment adviser); Senior Vice President, Invesco Distributors, Inc. (formerly known as Invesco AIM Distributors, Inc.); Director and Vice President, Invesco Investment Services, Inc. (formerly known as Invesco AIM Investment Services, Inc.) Senior Vice President, The Invesco Funds; Managing Director, Invesco Capital Management LLC; Director, Invesco Investment Advisers LLC (formerly known as Van Kampen Asset Management); Senior Vice President, Invesco Capital Markets, Inc. (formerly known as Van Kampen Funds Inc.); Manager, Invesco Indexing LLC; Manager, Invesco Specialized Products, LLC; Director and Senior Vice President, Invesco Insurance Agency, Inc.; Member, Invesco Canada Funds Advisory Board; Director, President and Chief Executive Officer, Invesco Corporate Class Inc. (corporate mutual fund company); and Director, Chairman, President and Chief Executive Officer, Invesco Canada Ltd. (formerly known as Invesco Trimark Ltd./Invesco Trimark Ltèe) (registered investment adviser and registered transfer agent) Formerly: Director and Senior Vice President, Invesco Management Group, Inc. (formerly known as Invesco AIM Management Group, Inc.); Secretary and General Counsel, Invesco Management Group, Inc. (formerly known as Invesco AIM Management Group, Inc.); Secretary, Invesco Investment Services, Inc. (formerly known as Invesco AIM Investment Services, Inc.); Chief Legal Officer and | | N/A | | N/A |
59 INVESCO OPPENHEIMER GLOBAL FOCUS FUND
TRUSTEES AND OFFICERSContinued
| | | | | | | | |
| | | | | |
Name, Year of Birth and Position(s) Held with the Trust | | Trustee and/or Officer Since | | Principal Occupation(s) During Past 5 Years | | Number of Funds in Fund Complex Overseen by Trustee | | Other Directorship(s) Held by Trustee During Past 5 Years |
| | | | | |
| OTHER OFFICERS (CONTINUED) | | | | | | | | |
| | | | | |
| John M. Zerr (Continued) | | | | Secretary, The Invesco Funds; Secretary and General Counsel, Invesco Investment Advisers LLC (formerly known as Van Kampen Asset Management); Secretary and General Counsel, Invesco Capital Markets, Inc. (formerly known as Van Kampen Funds Inc.); Chief Legal Officer, Invesco Exchange-Traded Fund Trust, Invesco Exchange-Traded Fund Trust II, Invesco India Exchange-Traded Fund Trust, Invesco Actively Managed Exchange-Traded Fund Trust, Invesco Actively Managed Exchange- Traded Commodity Fund Trust and Invesco Exchange-Traded Self-Indexed Fund Trust; Secretary, Invesco Indexing LLC; Director, Secretary, General Counsel and Senior Vice President, Van Kampen Exchange Corp.; Director, Vice President and Secretary, IVZ Distributors, Inc. (formerly known as INVESCO Distributors, Inc.); Director and Vice President, INVESCO Funds Group, Inc.; Director and Vice President, Van Kampen Advisors Inc.; Director, Vice President, Secretary and General Counsel, Van Kampen Investor Services Inc.; Director and Secretary, Invesco Distributors, Inc. (formerly known as Invesco AIM Distributors, Inc.); Director, Senior Vice President, General Counsel and Secretary, Invesco AIM Advisers, Inc. and Van Kampen Investments Inc.; Director, Vice President and Secretary, Fund Management Company; Director, Senior Vice President, Secretary, General Counsel and Vice President, Invesco AIM Capital Management, Inc.; Chief Operating Officer and General Counsel, Liberty Ridge Capital, Inc. (an investment adviser) | | | | |
| | | | | |
| Gregory G. McGreevey - 1962 Senior Vice President | | 2012 | | Senior Managing Director, Invesco Ltd.; Director, Chairman, President, and Chief Executive Officer, Invesco Advisers, Inc. (formerly known as Invesco Institutional (N.A.), Inc.) (registered investment adviser); Director, Invesco Mortgage Capital, Inc. and Invesco Senior Secured Management, Inc.; and Senior Vice President, The Invesco Funds; and President, SNW Asset Management Corporation Formerly: Senior Vice President, Invesco | | N/A | | N/A |
60 INVESCO OPPENHEIMER GLOBAL FOCUS FUND
| | | | | | | | |
| | | | | |
Name, Year of Birth and Position(s) Held with the Trust | | Trustee and/or Officer Since | | Principal Occupation(s) During Past 5 Years | | Number of Funds in Fund Complex Overseen by Trustee | | Other Directorship(s) Held by Trustee During Past 5 Years |
| | | | | |
| OTHER OFFICERS (CONTINUED) | | | | | | | | |
| | | | | |
| Gregory G. McGreevey (Continued) | | | | Management Group, Inc. and Invesco Advisers, Inc.; Assistant Vice President, The Invesco Funds | | | | |
| | | | | |
| Kelli Gallegos – 1970 Vice President, Principal Financial Officer and Assistant Treasurer | | 2008 | | Principal Financial and Accounting Officer – Investments Pool, Invesco Specialized Products, LLC; Vice President, Principal Financial Officer and Assistant Treasurer, The Invesco Funds; Principal Financial and Accounting Officer – Pooled Investments, Invesco Capital Management LLC; Vice President and Treasurer, Invesco Exchange- Traded Fund Trust, Invesco Exchange-Traded Fund Trust II, Invesco India Exchange-Traded Fund Trust, Invesco Actively Managed Exchange-Traded Fund Trust, Invesco Actively Managed Exchange-Traded Commodity Fund Trust and Invesco Exchange-Traded Self- Indexed Fund Trust Formerly: Assistant Treasurer, Invesco Specialized Products, LLC; Assistant Treasurer, Invesco Exchange-Traded Fund Trust, Invesco Exchange-Traded Fund Trust II, Invesco India Exchange-Traded Fund Trust, Invesco Actively Managed Exchange-Traded Fund Trust, Invesco Actively Managed Exchange-Traded Commodity Fund Trust and Invesco Exchange- Traded Self-Indexed Fund Trust; Assistant Treasurer, Invesco Capital Management LLC; Assistant Vice President, The Invesco Funds | | N/A | | N/A |
| | | | | |
| Crissie M. Wisdom – 1969 Anti-Money Laundering Compliance Officer | | 2013 | | Anti-Money Laundering Compliance Officer, Invesco Advisers, Inc. (formerly known as Invesco Institutional (N.A.), Inc.) (registered investment adviser), Invesco Capital Markets, Inc. (formerly known as Van Kampen Funds Inc.), Invesco Distributors, Inc., Invesco Investment Services, Inc., The Invesco Funds, and Invesco Exchange-Traded Fund Trust, Invesco Exchange-Traded Fund Trust II, Invesco India Exchange-Traded Fund Trust, Invesco Actively Managed Exchange-Traded Fund Trust, Invesco Actively Managed Exchange- Traded Commodity Fund Trust and Invesco Exchange-Traded Self-Indexed Fund Trust; Anti-Money Laundering Compliance Officer and Bank Secrecy Act Officer, INVESCO National Trust Company and Invesco Trust Company; and Fraud Prevention Manager and | | N/A | | N/A |
61 INVESCO OPPENHEIMER GLOBAL FOCUS FUND
TRUSTEES AND OFFICERSContinued
| | | | | | | | |
| | | | | |
Name, Year of Birth and Position(s) Held with the Trust | | Trustee and/or Officer Since | | Principal Occupation(s) During Past 5 Years | | Number of Funds in Fund Complex Overseen by Trustee | | Other Directorship(s) Held by Trustee During Past 5 Years |
| | | | | |
| OTHER OFFICERS (CONTINUED) | | | | | | | | |
| | | | | |
| Crissie M. Wisdom (Continued) | | | | Controls and Risk Analysis Manager for Invesco Investment Services, Inc. Formerly: Anti-Money Laundering Compliance Officer, Van Kampen Exchange Corp. and Invesco Management Group, Inc. | | | | |
| | | | | |
| Robert R. Leveille – 1969 Chief Compliance Officer | | 2016 | | Chief Compliance Officer, Invesco Advisers, Inc. (registered investment adviser); and Chief Compliance Officer, The Invesco Funds Formerly: Chief Compliance Officer, Putnam Investments and the Putnam Funds | | N/A | | N/A |
The Statement of Additional Information of the Trust includes additional information about the Fund’s Trustees and is available upon request, without charge, by calling 1.800.959.4246. Please refer to the Fund’s Statement of Additional Information for information on the Fund’ssub-advisers.
| | | | | | | | |
| | Office of the Fund 11 Greenway Plaza, Suite 1000 Houston, TX 77046-1173 | | Investment Adviser Invesco Advisers, Inc. 1555 Peachtree Street, N.E. Atlanta, GA 30309 | | Distributor Invesco Distributors, Inc. 11 Greenway Plaza, Suite 1000 Houston, TX 77046-1173 | | Auditors PricewaterhouseCoopers LLP 1000 Louisiana Street, Suite 5800 Houston, TX 77002-5021 |
| | | Counsel to the Fund Stradley Ronon Stevens & Young, LLP 2005 Market Street, Suite 2600 Philadelphia, PA 19103-7018 | | Counsel to the Independent Trustees Goodwin Procter LLP 901 New York Avenue, N.W. Washington, D.C. 20001 | | Transfer Agent Invesco Investment Services, Inc. 11 Greenway Plaza, Suite 1000 Houston, TX 77046-1173 | | Custodian JPMorgan Chase Bank 4 Chase Metro Tech Center Brooklyn, NY 11245 |
62 INVESCO OPPENHEIMER GLOBAL FOCUS FUND
Invesco recognizes the importance of protecting your personal and financial information when you visit our website located atwww.invesco.com (the “Website”). The following information is designed to help you understand the information collection practices at this Website. We will not sell, share or rent your personally identifiable information to others in contravention of this Privacy Policy. When we refer to ourselves as “we” or “Invesco” in this Privacy Policy, we mean our entire company including our affiliates, such as subsidiaries.
By visiting this Website, you are accepting the practices described in this Privacy Policy. If you do not agree to this policy, you may not use this Website. This Privacy Policy is subject to change without notice, from time to time in our sole discretion. You acknowledge that by accessing the Website after we have posted changes to this Privacy Policy, you are agreeing to this Privacy Policy as modified. Please review the Terms of Use1 to learn of other terms and conditions applicable to your use of the Website.
Please note that this Privacy Policy is not an exclusive statement of our privacy principles across all products and services. Other privacy principles or policies may apply depending on the products or services you obtain from Invesco, or the jurisdiction in which you transact with Invesco.
This Privacy Policy was last updated on May 6, 2018.
Information We Collect and Use
We collect personal information you choose to submit to the Website in order to process transactions requested by you and meet our contractual obligations. For example, you can choose to provide your name, contact information, social security number, or tax identification number in connection with accessing your account, or you can choose to provide your personal information when you fill out a secure account question form. Any information collected about you from the Website can, from time to time, be associated with other identifying information we have about you.
In addition, we may gather information about you automatically through your use of the Website, e.g. your IP address, how you navigate the Website, the organization from which you are accessing the Website, and the websites that you access before and after you visit the Website.
When you access the Website, we may also collect information such as unique device identifiers, your screen resolution and other device settings, information about your location, and analytical information about how you use the device from which you are viewing the Website. Where applicable, we may ask your permission before collecting certain information, such as precise geolocation information.
From time to time, we use or augment the personal information we have about you with information obtained from third parties. For example, we use third party information to confirm contact or financial information or to better understand your interests by associating demographic information from third parties with the information you have provided.
How We Use Personal Information
We use your personal information to respond to your inquiries and provide the products and services you request. We also use your information from time to time to deliver the content and services we believe
1NTD
63 INVESCO OPPENHEIMER GLOBAL FOCUS FUND
| | |
| | INVESCO’S PRIVACY NOTICEContinued |
you will find the most relevant and to provide customer service and support.
We also use the information you provide to further develop and improve our products and services. We aggregate and/orde-identify data about visitors to the Website for various business purposes including product and service development and improvement activities.
How We Share Personal Information
We collaborate with other companies and individuals to perform services for us and on our behalf and we collaborate with our affiliates, other companies and individuals with respect to particular products or services (“Providers”). Examples of Providers include data analysis firms, customer service and support providers, email and SMS vendors, andweb-hosting and development companies. Some Providers collect information for us or on our behalf on our Website. These Providers can be provided with access to personal information needed to perform their functions.
We reserve the right to disclose your personal information as required by law, when we believe disclosure is necessary to comply with a regulatory requirement, judicial proceeding, court order or legal process served on us, to protect the safety, rights or property of our customers, the public or Invesco or to enforce the Terms of Use.
If we sell or transfer a business unit (such as a subsidiary) or an asset (such as a website) to another company, we will share your personal information with such company. You will receive notice of such an event and the new entity will inform you of any changes to the practices in this Privacy Policy. If the new entity wishes to make additional use of your information, you have the right to decline such use at that time.
We occasionally disclose aggregate orde-identified data that is not personally identifiable with third parties.
Cookies and Other Tools
Invesco and its Providers collect information about you by using cookies, tracking pixels and other technologies. We use this information to better understand, customize and improve user experience with our websites, services and offerings as well as to manage our advertising. For example, we use web analytics services that use these technologies to gather information to help us understand how visitors engage with and navigate our Website, e.g., how and when pages in a site are visited and by how many visitors. We are also able to offer our visitors a more customized, relevant experience on our sites using these technologies by delivering content and functionality based on your preferences and interests.
Depending on their purpose, some cookies will only operate for the length of a single browsing session, while others have a longer life span to ensure that they fulfill their longer-term purposes. Your web browser can be set to allow you to control whether you will accept cookies or reject cookies, to notify you each time a cookie is sent to your browser, or to delete cookies that have already been set. If your browser is set to reject cookies, certain aspects of the Website that are cookie-enabled will not recognize you when you return to the website, and some Website functionality may be lost. The “Help” section of your browser may tell you how to prevent your browser from accepting cookies. To find out more about cookies, visitwww.aboutcookies.org.
64 INVESCO OPPENHEIMER GLOBAL FOCUS FUND
Security
No data transmission over the internet can be 100% secure, so Invesco cannot ensure or warrant the security of any information you submit to us on this Website. However, Invesco seeks to protect your personal information from unauthorized access or use when you transact business on our Website using technical, administrative and procedural measures. Invesco makes no representation as to the reasonableness, efficacy, or appropriateness of the measures we use to safeguard such information.
Users are responsible for maintaining the secrecy of their own passwords. If you have reason to believe that your interaction with us is no longer secure (for example, if you feel that the security of any account you might have with us has been compromised), please immediately notify us by contacting us as specified below.
Transfer of Data to Other Countries
Any information you provide to Invesco through use of the Website may be stored and processed, transferred between and accessed from the United States, Canada and other countries which do not guarantee the same level of protection of personal information as the one in which you reside. However, Invesco will handle your personal information in accordance with this Privacy Policy regardless of where your personal information is stored/accessed.
Children’s Privacy
We are committed to protecting the privacy of children. We do not knowingly collect personal information from children under the age of 18. If you are under the age of 18, do not provide us with any personal information.
Contact Us
Please contact us if you have any questions or concerns about your personal information or require assistance in managing your choices.
Invesco Ltd.
1555 Peachtree St. NE
Atlanta, GA 30309
By phone:
(404)439-3236
By fax:
(404)962-8288
By email:
Anne.Gerry@invesco.com
Please update your account information by logging in or contact us by email or telephone as specified above to update your account information whenever such information ceases to be complete or accurate.
You may also contact us to:
65 INVESCO OPPENHEIMER GLOBAL FOCUS FUND
| | |
| | INVESCO’S PRIVACY NOTICEContinued |
| | ● | | Request that we amend, rectify, delete or update the personal data we hold about you; |
| | ● | | Where possible (e.g. in relation to marketing) amend or update your choices around processing; |
| | ● | | Request a copy of personal data held by us. |
Disclaimer
Where the Website contains links to third-party websites/content/services that are not owned or controlled by Invesco, Invesco is not responsible for how these properties operate or treat your personal information so we recommend that you read the privacy policies and terms associated with these third party properties carefully.
66 INVESCO OPPENHEIMER GLOBAL FOCUS FUND
THIS PAGE INTENTIONALLY LEFT BLANK.
THIS PAGE INTENTIONALLY LEFT BLANK.
THIS PAGE INTENTIONALLY LEFT BLANK.
THIS PAGE INTENTIONALLY LEFT BLANK.
THIS PAGE INTENTIONALLY LEFT BLANK.
| | | | |
Explore High-Conviction Investing with Invesco | | | | |

| | | | |
Go paperless with eDelivery | | | | |
Visit invesco.com/edelivery to enjoy the convenience and security of anytime electronic access to your investment documents. | | | | |
| |
| With eDelivery, you can elect to have any or all of the following materials delivered straight to your inbox to download, save and print from your own computer: | | | | |
◾ Fund reports and prospectuses | | | | |
◾ Quarterly statements | | | | |
◾ Daily confirmations | | | | |
◾ Tax forms | | | | |
Invesco mailing information | | | | |
Send general correspondence to Invesco Investment Services, Inc., P.O. Box 219078, Kansas City, MO 64121-9078. | | | | |
| |
| | |  | |
| |
| Invesco Distributors, Inc. | | | O-GLF-AR-1 12272019 | |
ITEM 2. CODE OF ETHICS.
There were no amendments to the Code of Ethics (the “Code”) that applies to the Registrant’s Principal Executive Officer (“PEO”) and Principal Financial Officer (“PFO”) during the period covered by the report. The Registrant did not grant any waivers, including implicit waivers, from any provisions of the Code to the PEO or PFO during the period covered by this report.
ITEM 3. AUDIT COMMITTEE FINANCIAL EXPERT.
The Board of Trustees has determined that the Registrant has at least one audit committee financial expert serving on its Audit Committee. The Audit Committee financial experts are David C. Arch, Bruce L. Crockett, Cynthia Hostetler, Elizabeth Krentzman, Anthony J. LaCava, Jr., Teresa M. Ressel, Raymond Stickel, Jr. Robert C. Troccoli and James Vaughn. David C. Arch, Bruce L. Crockett, Cynthia Hostetler, Elizabeth Krentzman, Anthony J. LaCava, Jr., Teresa M. Ressel, Raymond Stickel, Jr. Robert C. Troccoli and James Vaughn are “independent” within the meaning of that term as used in FormN-CSR.
ITEM 4. PRINCIPAL ACCOUNTANT FEES AND SERVICES.
During the reporting period, PricewaterhouseCoopers LLC (“PwC”) advised the Audit Committee of the following matters for consideration under the SEC’s auditor independence rules. PwC advised the Audit Committee that a PwC Director, a PwC Manager and a PwC Senior Associate each held financial interests in investment companies within the Invesco Fund Complex that were inconsistent with the requirements of Rule2-01(c)(1) of RegulationS-X. PwC noted, among other things, that during the time of its audit, the engagement team was not aware of the investments, (or with respect to the PwC Senior Associate was not aware until after the investments were confirmed as SEC exceptions), the individuals were not in the chain of command of the audit or the audit partners of Invesco or the affiliate of the Registrant, the services each individual provided were not relied upon by the audit engagement team with respect to the audit of the Registrant or its affiliates (or with respect to the PwC Senior Associate, the services were performed by an individual who did not have decision-making responsibility for matters that materially affected the audit and were reviewed by team members at least two levels higher than the PwC Senior Associate), and the investments were not material to the net worth of each individual or their respective immediate family members which PwC considered in reaching its conclusion. PwC advised the Audit Committee that it believes its objectivity and impartiality had not been adversely affected by these matters as they related to the audit of the Registrant.
On May 24, 2019, certain investment advisor subsidiaries of Invesco Ltd. assumed management responsibility from Oppenheimer Funds, Inc. (“OFI”) for 83open-end mutual funds and 20 exchange-traded funds (collectively, the “Oppenheimer Funds”). Assumption of management responsibility for the Oppenheimer Funds was accomplished through the reorganization of each Oppenheimer Fund into a new Invesco shell fund (collectively, the “New Invesco Funds”) that did not havepre-existing assets (together, the “Reorganizations”). The Reorganizations were part of the acquisition by Invesco Ltd. (together with its subsidiaries, “Invesco”) of the asset management business of OFI (including the Oppenheimer Funds) from Massachusetts Mutual Life Insurance Company (“MassMutual”), which was also consummated on May 24, 2019 (the “Acquisition”). Subsequent to the Acquisition, MassMutual became a significant shareholder of Invesco, and the Invesco Ltd. board of directors expanded by one director with the addition of a director selected by MassMutual.
Prior to the consummation of the Acquisition and the Reorganizations on May 24, 2019, PwC completed an independence assessment to evaluate the services and relationships with OFI and its affiliates, which became affiliates of Invesco upon the closing of the Acquisition. The assessment identified the following
relationship and services that are inconsistent with the auditor independence rules under Rule2-01 of RegulationS-X (“Rule2-01”) if provided to an affiliate of an audit client. A retired PwC partner who receives a benefit from PwC that is not fully funded, served as a member of Audit Committee of the Boards of Trustees of certain Oppenheimer Funds prior to the Acquisition (the“Pre-Reorganization Relationship”). Additionally, PwC provided certainnon-audit services including, expert legal services to one Oppenheimer Fund, custody of client assets in connection with payroll services, anon-audit service performed pursuant to a success-based fee,non-audit services in which PwC acted as an advocate on behalf of a MassMutual foreign affiliate and certain employee activities undertaken in connection with the provision ofnon-audit services for MassMutual and certain MassMutual foreign affiliates (collectively, the“Pre-Reorganization Services”).
PwC and the Audit Committees of the New Invesco Funds each considered the impact that thePre-Reorganization Relationship and Services have on PwC’s independence with respect to the New Invesco Funds. On the basis of the nature of the relationship and services performed, and in particular the mitigating factors described below, PwC concluded that a reasonable investor, possessing knowledge of all the relevant facts and circumstances regarding thePre-Reorganization Relationship and Services, would conclude that thePre-Reorganization Relationship and Services do not impair PwC’s ability to exhibit the requisite objectivity and impartiality to report on the financial statements of the New Invesco Funds for the years ending May 31, 2019 – April 30, 2020 (“PwC’s Conclusion”).
The Audit Committees of the Boards of Trustees of the New Invesco Funds, based upon PwC’s Conclusion and the concurrence of Invesco, considered the relevant facts and circumstances including the mitigating factors described below and, after careful consideration, concluded that PwC is capable of exercising objective and impartial judgment in connection with its audits of the financial statements of the New Invesco Funds that the respective Boards of Trustees oversee.
Mitigating factors that PwC and the Audit Committees considered in reaching their respective conclusions included, among others, the following factors:
| • | | none of thePre-Reorganization Relationship or Services created a mutuality of interest between PwC and the New Invesco Funds; |
| • | | PwC will not act in a management or employee capacity for the New Invesco Funds or their affiliates during any portion of PwC’s professional engagement period; |
| • | | other than the expert legal services,Pre-Reorganization Services that have been provided to OFI, MassMutual and their affiliates do not have any impact on the financial statements of the New Invesco Funds; |
| • | | as it relates to the expert legal services, while the service provided by PwC related to litigation involving one Oppenheimer Fund, the impact of the litigation on the Oppenheimer Fund’s financial statements was based upon OFI’s decision, and OFI management represented that the PwC service was not considered a significant component of its decision; |
| • | | while certain employees of OFI who were involved in the financial reporting process of the Oppenheimer Funds will be employed by Invesco subsequent to the Reorganizations, existing officers of other Invesco Funds will serve as Principal Executive Officer and Principal Financial Officer or equivalent roles for the New Invesco Funds, and are ultimately responsible for the accuracy of all financial statement assertions for the entirety of the financial reporting periods for the New Invesco Funds; |
| • | | thePre-Reorganization Services giving rise to the lack of independence were provided to, or entered into with, OFI, MassMutual and their affiliates at a time when PwC had no independence restriction with respect to these entities; |
| • | | with the exception of the expert legal service provided to one Oppenheimer Fund, none of thePre-Reorganization Services affected the operations or financial reporting of the New Invesco Funds; |
| • | | thePre-Reorganization Services provided by PwC to OFI, MassMutual and their affiliates were performed by persons who were not, and will not be, part of the audit engagement team for the New Invesco Funds; and |
| • | | the fees associated with thePre-Reorganization Services were not material to MassMutual, Invesco or PwC. |
(a) to (d)
Item 4. Principal Accountant Fees and Services
Fees Billed by PwC Related to the Registrant
PwC billed the Registrant aggregate fees for services rendered to the Registrant for the last two fiscal years as shown in the following table. The Audit Committeepre-approved all audit andnon-audit services provided to the Registrant.
| | | | | | | | | | | | | | | | | | | | | | | | |
| | | Fees Billed by PwC for Services
Rendered to the Registrant for
fiscal year end 2019 | | | Fees Billed by PwC for Services
Rendered to the Registrant for fiscal
year end 2018 | |
| | | | | | |
Audit Fees | | | | | | $ | 501,973 | | | | | | | | | | | $ | 379,675 | | | | | |
Audit-Related Fees | | | | | | $ | 0 | | | | | | | | | | | $ | 0 | | | | | |
Tax Fees(1) | | | | | | $ | 284,418 | | | | | | | | | | | $ | 82,550 | | | | | |
All Other Fees | | | | | | $ | 0 | | | | | | | | | | | $ | 0 | | | | | |
| | | | | | | | | | | | | | | | | | | | | | | | |
Total Fees | | | | | | $ | 786,391 | | | | | | | | | | | $ | 462,225 | | | | | |
| (g) PwC | billed the Registrant aggregatenon-audit fees of $284,418 for the fiscal year ended 2019, and $82,550 for the fiscal year ended 2018, fornon-audit services rendered to the Registrant. |
| | (1) | Tax Fees for the fiscal year end October 31, 2019 include fees billed for preparation of U.S. Tax Returns and Taxable Income calculations, including excise tax andyear-to-date estimates for variousbook-to-tax differences. Tax Fees for fiscal year end October 31, 2018 include fees billed for reviewing tax returns and/or services related to tax compliance. |
Fees Billed by PwC Related to Invesco and Invesco Affiliates
PwC billed Invesco Advisers, Inc. (“Invesco”), the Registrant’s investment adviser, and any entity controlling, controlled by or under common control with Invesco that provides ongoing services to the Registrant (“Invesco Affiliates”) aggregate fees forpre-approvednon-audit services rendered to Invesco and Invesco Affiliates for the last two fiscal years as shown in the following table. The Audit Committeepre-approved allnon-audit services provided to Invesco and Invesco Affiliates that were required to bepre-approved.
| | | | | | | | | | |
| | | Fees Billed for Non-Audit Services Rendered to
Invesco and Invesco Affiliates for fiscal year end
2019 That Were Required to be Pre-Approved by the Registrant’s Audit Committee | | Fees Billed forNon-Audit Services Rendered to Invesco and Invesco Affiliates for fiscal year end 2018 That Were Required to be Pre-Approved by the Registrant’s Audit Committee |
Audit-Related Fees(1) | | | $ | 690,000 | | | | $ | 662,000 | |
Tax Fees | | | $ | 0 | | | | $ | 0 | |
All Other Fees | | | $ | 0 | | | | $ | 0 | |
| | | | | | | | | | |
Total Fees | | | $ | 690,000 | | | | $ | 662,000 | |
| (1) | Audit-Related Fees for the fiscal years ended 2019 and 2018 include fees billed related to reviewing controls at a service organization. |
(e)(2) There were no amounts that werepre-approved by the Audit Committee pursuant to the de minimis exception under Rule2-01 of RegulationS-X.
(f) Not applicable.
(g) Including the fees for services not required to bepre-approved by the registrant’s audit committee, PwC billed Invesco and Invesco Affiliates aggregatenon-audit fees of $3,984,000 for the fiscal year ended October 31, 2019, and $3,639,000 for the fiscal year ended October 31, 2018, fornon-audit services rendered to Invesco and Invesco Affiliates.
PwC provided audit services to the Investment Company complex of approximately $34 million.
(h) The Audit Committee also has considered whether the provision ofnon-audit services that were rendered to Invesco and Invesco Affiliates that were not required to bepre-approved pursuant to SEC regulations, if any, is compatible with maintaining PwC’s independence.
(e)(1)
PRE-APPROVAL OF AUDIT ANDNON-AUDIT SERVICES
POLICIES AND PROCEDURES
As adopted by the Audit Committees
of the Invesco Funds (the “Funds”)
Last Amended March 29, 2017
| | I. | Statement of Principles |
The Audit Committees (the “Audit Committee”) of the Boards of Trustees of the Funds (the “Board”) have adopted these policies and procedures (the “Procedures”) with respect to thepre-approval of audit andnon-audit services to be provided by the Funds’ independent auditor (the “Auditor”) to the Funds, and to the Funds’ investment adviser(s) and any entity controlling, controlled by, or under common control with the investment adviser(s) that provides ongoing services to the Funds (collectively, “Service Affiliates”).
Under Section 202 of the Sarbanes-Oxley Act of 2002, all audit andnon-audit services provided to the Funds by the Auditor must be preapproved by the Audit Committee. Rule2-01 of RegulationS-X requires that the Audit Committee alsopre-approve a Service Affiliate’s engagement of the Auditor fornon-audit services if the engagement relates directly to the operations and financial reporting of the Funds (a “Service Affiliate’s Covered Engagement”).
These Procedures set forth the procedures and the conditions pursuant to which the Audit Committee maypre-approve audit andnon-audit services for the Funds and a Service Affiliate’s Covered Engagement pursuant to rules and regulations of the Securities and Exchange Commission (“SEC”) and other organizations and regulatory bodies applicable to the Funds (“Applicable Rules”).1 They address both generalpre-approvals without consideration of specificcase-by-case services (“general pre-approvals”) and pre-approvals on acase-by-case basis
1 Applicable Rules include, for example, New York Stock Exchange (“NYSE”) rules applicable to closed-end funds managed by Invesco and listed on NYSE.
(“specific pre-approvals”). Any services requiringpre-approval that are not within the scope of generalpre-approvals hereunder are subject to specificpre-approval. These Procedures also address the delegation by the Audit Committee ofpre-approval authority to the Audit Committee Chair or Vice Chair.
| | II. | Pre-Approval of Fund Audit Services |
The annual Fund audit services engagement, including terms and fees, is subject to specificpre-approval by the Audit Committee. Audit services include the annual financial statement audit and other procedures required to be performed by an independent auditor to be able to form an opinion on the Funds’ financial statements. The Audit Committee will receive, review and consider sufficient information concerning a proposed Fund audit engagement to make a reasonable evaluation of the Auditor’s qualifications and independence. The Audit Committee will oversee the Fund audit services engagement as necessary, including approving any changes in terms, audit scope, conditions and fees.
In addition to approving the Fund audit services engagement at least annually and specifically approving any changes, the Audit Committee may generally or specificallypre-approve engagements for other audit services, which are those services that only an independent auditor reasonably can provide. Other audit services may include services associated with SEC registration statements, periodic reports and other documents filed with the SEC.
| | III. | General and SpecificPre-Approval ofNon-Audit Fund Services |
The Audit Committee will consider, at least annually, the list of GeneralPre-ApprovedNon-Audit Services which list may be terminated or modified at any time by the Audit Committee. To inform the Audit Committee’s review and approval of GeneralPre-ApprovedNon-Audit Services, the Funds’ Treasurer (or his or her designee) and Auditor shall provide such information regarding independence or other matters as the Audit Committee may request.
Any services or fee ranges that are not within the scope of GeneralPre-ApprovedNon-Audit Services have not received generalpre-approval and require specificpre-approval. Each request for specificpre-approval by the Audit Committee for services to be provided by the Auditor to the Funds must be submitted to the Audit Committee by the Funds’ Treasurer (or his or her designee)and must include detailed information about the services to be provided, the fees or fee ranges to be charged, and other relevant information sufficient to allow the Audit Committee to consider whether topre-approve such engagement, including evaluating whether the provision of such services will impair the independence of the Auditor and is otherwise consistent with Applicable Rules.
| | IV. | Non-Audit Service Types |
The Audit Committee may provide either general or specificpre-approval of audit-related, tax or other services, each as described in more detail below.
“Audit-related services” are assurance and related services that are reasonably related to the performance of the audit or review of the Fund’s financial statements or that are traditionally performed by an independent auditor. Audit-related services include, among others, accounting consultations related to accounting, financial reporting or disclosure matters not classified as
“Audit services”; assistance with understanding and implementing new accounting and financial reporting guidance from rulemaking authorities; services related to mergers, acquisitions or dispositions; compliance with ratings agency requirements and interfund lending activities; and assistance with internal control reporting requirements.
“Tax services” include, but are not limited to, the review and signing of the Funds’ federal tax returns, the review of required distributions by the Funds and consultations regarding tax matters such as the tax treatment of new investments or the impact of new regulations. The Audit Committee will not approve proposed services of the Auditor which the Audit Committee believes are to be provided in connection with a service or transaction initially recommended by the Auditor, the sole business purpose of which may be tax avoidance and the tax treatment of which may not be supported in the Internal Revenue Code and related regulations. The Audit Committee will consult with the Funds’ Treasurer (or his or her designee) and may consult with outside counsel or advisers as necessary to ensure the consistency of tax services rendered by the Auditor with the foregoing policy. The Auditor shall not represent any Fund or any Service Affiliate before a tax court, district court or federal court of claims.
Each request to provide tax services under either the general or specificpre-approval of the Audit Committee will include a description from the Auditor in writing of (i) the scope of the service, the fee structure for the engagement, and any side letter or other amendment to the engagement letter, or any other agreement (whether oral, written, or otherwise) between the Auditor and the Funds, relating to the service; and (ii) any compensation arrangement or other agreement, such as a referral agreement, a referral fee orfee-sharing arrangement, between the Auditor (or an affiliate of the Auditor) and any person (other than the Funds or Service Affiliates receiving the services) with respect to the promoting, marketing, or recommending of a transaction covered by the service. The Auditor will also discuss with the Audit Committee the potential effects of the services on the independence of the Auditor, and document the substance of its discussion with the Audit Committee.
The Audit Committee maypre-approve other non-audit services so long as the Audit Committee believes that the service will not impair the independence of the Auditor.Appendix I includes a list of services that the Auditor is prohibited from performing by the SEC rules.Appendix I also includes a list of services that would impair the Auditor’s independence unless the Audit Committee reasonably concludes that the results of the services will not be subject to audit procedures during an audit of the Funds’ financial statements.
| | V. | Pre-Approval of Service Affiliate’s Covered Engagements |
Rule2-01 of RegulationS-X requires that the Audit Committeepre-approve a Service Affiliate’s engagement of the Auditor fornon-audit services if the engagement relates directly to the operations and financial reporting of the Funds, defined above as a “Service Affiliate’s Covered Engagement”.
The Audit Committee may provide either general or specificpre-approval of any Service Affiliate’s Covered Engagement, including for audit-related, tax or other services, as described above, if the Audit Committee believes that the provision of the services to a Service Affiliate will not impair the independence of the Auditor with respect to the Funds. Any Service Affiliate’s Covered Engagements that are not within the scope of GeneralPre-ApprovedNon-Audit Services have not received generalpre-approval and require specificpre-approval.
Each request for specificpre-approval by the Audit Committee of a Service Affiliate’s Covered Engagement must be submitted to the Audit Committee by the Funds’ Treasurer (or his or her designee)and must include detailed information about the services to be provided, the fees or fee ranges to be charged, a description of the current status of thepre-approval process involving other audit committees in the Invesco investment company complex (as defined in Rule2-201 of RegulationS-X) with respect to the proposed engagement, and other relevant information sufficient to allow the Audit Committee to consider whether the provision of such services will impair the independence of the Auditor from the Funds. Additionally, the Funds’ Treasurer (or his or her designee) and the Auditor will provide the Audit Committee with a statement that the proposed engagement requirespre-approval by the Audit Committee, the proposed engagement, in their view, will not impair the independence of the Auditor and is consistent with Applicable Rules, and the description of the proposed engagement provided to the Audit Committee is consistent with that presented to or approved by the Invesco audit committee.
Information about all Service Affiliate engagements of the Auditor fornon-audit services, whether or not subject topre-approval by the Audit Committee, shall be provided to the Audit Committee at least quarterly, to allow the Audit Committee to consider whether the provision of such services is compatible with maintaining the Auditor’s independence from the Funds. The Funds’ Treasurer and Auditor shall provide the Audit Committee with sufficiently detailed information about the scope of services provided and the fees for such services, to ensure that the Audit Committee can adequately consider whether the provision of such services is compatible with maintaining the Auditor’s independence from the Funds.
| | VI. | Pre-Approved Fee Levels or Established Amounts |
Pre-approved fee levels or ranges for audit andnon-audit services to be provided by the Auditor to the Funds, and for a Service Affiliate’s Covered Engagement, under generalpre-approval or specificpre-approval will be set periodically by the Audit Committee. Any proposed fees exceeding 110% of the maximumpre-approved fee levels or ranges for such services or engagements will be promptly presented to the Audit Committee and will require specificpre-approval by the Audit Committee before payment of any additional fees is made.
The Audit Committee hereby delegates, subject to the dollar limitations set forth below, specific authority to its Chair, or in his or her absence, Vice Chair, topre-approve audit andnon-audit services proposed to be provided by the Auditor to the Funds and/or a Service Affiliate’s Covered Engagement, between Audit Committee meetings. Such delegation does not preclude the Chair or Vice Chair from declining, on a case by case basis, to exercise his or her delegated authority
and instead convening the Audit Committee to consider andpre-approve any proposed services or engagements.
Notwithstanding the foregoing, the Audit Committee mustpre-approve: (a) anynon-audit services to be provided to the Funds for which the fees are estimated to exceed $500,000; (b) any Service Affiliate’s Covered Engagement for which the fees are estimated to exceed $500,000; or (c) any cost increase to any previously approved service or engagement that exceeds the greater of $250,000 or 50% of the previously approved fees up to a maximum increase of $500,000.
| | VIII. | Compliance with Procedures |
Notwithstanding anything herein to the contrary, failure topre-approve any services or engagements that are not required to bepre-approved pursuant to the de minimis exception provided for in Rule2-01(c)(7)(i)(C) of RegulationS-X shall not constitute a violation of these Procedures. The Audit Committee has designated the Funds’ Treasurer to ensure services and engagements arepre-approved in compliance with these Procedures. The Funds’ Treasurer will immediately report to the Chair of the Audit Committee, or the Vice Chair in his or her absence, any breach of these Procedures that comes to the attention of the Funds’ Treasurer or any services or engagements that are not required to bepre-approved pursuant to the de minimis exception provided for in Rule2-01(c)(7)(i)(C) of RegulationS-X.
On at least an annual basis, the Auditor will provide the Audit Committee with a summary of allnon-audit services provided to any entity in the investment company complex (as defined in section2-01(f)(14) of RegulationS-X, including the Funds and Service Affiliates) that were notpre-approved, including the nature of services provided and the associated fees.
| | IX. | Amendments to Procedures |
All material amendments to these Procedures must be approved in advance by the Audit Committee.Non-material amendments to these Procedures may be made by the Legal and Compliance Departments and will be reported to the Audit Committee at the next regularly scheduled meeting of the Audit Committee.
Appendix I
Non-Audit Services That May Impair the Auditor’s Independence
The Auditor is not independent if, at any point during the audit and professional engagement, the Auditor provides the followingnon-audit services:
| | • | | Broker-dealer, investment adviser, or investment banking services ; |
| | • | | Expert services unrelated to the audit; |
| | • | | Any service or product provided for a contingent fee or a commission; |
| | • | | Services related to marketing, planning, or opining in favor of the tax treatment of confidential transactions or aggressive tax position transactions, a significant purpose of which is tax avoidance; |
| | • | | Tax services for persons in financial reporting oversight roles at the Fund; and |
| | • | | Any other service that the Public Company Oversight Board determines by regulation is impermissible. |
An Auditor is not independent if, at any point during the audit and professional engagement, the Auditor provides the followingnon-audit services unless it is reasonable to conclude that the results of the services will not be subject to audit procedures during an audit of the Funds’ financial statements:
| | • | | Bookkeeping or other services related to the accounting records or financial statements of the audit client; |
| | • | | Financial information systems design and implementation; |
| | • | | Appraisal or valuation services, fairness opinions, orcontribution-in-kind reports; |
| | • | | Actuarial services; and |
| | • | | Internal audit outsourcing services. |
| ITEM 5. | AUDIT COMMITTEE OF LISTED REGISTRANTS. |
Not applicable.
| ITEM 6. | SCHEDULE OF INVESTMENTS. |
Investments in securities of unaffiliated issuers is included as part of the reports to stockholders filed under Item 1 of this Form.
| ITEM 7. | DISCLOSURE OF PROXY VOTING POLICIES AND PROCEDURES FORCLOSED-END MANAGEMENT INVESTMENT COMPANIES. |
Not applicable.
| ITEM 8. | PORTFOLIO MANAGERS OFCLOSED-END MANAGEMENT COMPANIES. |
Not applicable.
| ITEM 9. | PURCHASES OF EQUITY SECURITIES BYCLOSED-END MANAGEMENT INVESTMENT COMPANY AND AFFILIATED PURCHASERS. |
Not applicable.
| ITEM 10. | SUBMISSION OF MATTERS TO A VOTE OF SECURITY HOLDERS. |
None
| ITEM 11. | CONTROLS AND PROCEDURES. |
| | (a) | As of December 18, 2019, an evaluation was performed under the supervision and with the participation of the officers of the Registrant, including the Principal Executive Officer (“PEO”) and Principal Financial Officer (“PFO”), to assess the effectiveness of the Registrant’s disclosure controls and procedures, as that term is defined in Rule30a-3(c) under the Investment Company Act of 1940 (“Act”), as amended. Based on that evaluation, the Registrant’s officers, including the PEO and PFO, concluded that, as of December 18, 2019, the Registrant’s disclosure controls and procedures were reasonably designed so as to ensure: (1) that information required to be disclosed by the Registrant on FormN-CSR is recorded, processed, summarized and reported within the time periods specified by the rules and forms of the Securities and Exchange Commission; and (2) that material information relating to the Registrant is made known to the PEO and PFO as appropriate to allow timely decisions regarding required disclosure. |
| | (b) | There have been no changes in the Registrant’s internal control over financial reporting (as defined in Rule30a-3(d) under the Act) that occurred during the period covered by this report that have materially affected, or are reasonably likely to materially affect, the Registrant’s internal control over financial reporting. |
| ITEM 12. | DISCLOSURE OF SECURITIES LENDING ACTIVITIES FORCLOSED-END MANAGEMENT INVESTMENT COMPANIES. |
Not applicable.
| | 13(a) (2) | Certifications of principal executive officer and principal financial officer as required by Rule30a-2(a) under the Investment Company Act of 1940. |
| | 13(a) (4) | Registrant’s Independent Public Accountant, attached as Exhibit 99.ACCT |
| | 13(b) | Certifications of principal executive officer and principal financial officer as required by Rule30a-2(b) under the Investment Company Act of 1940. |
SIGNATURES
Pursuant to the requirements of the Securities Exchange Act of 1934 and the Investment Company Act of 1940, the Registrant has duly caused this report to be signed on its behalf by the undersigned, thereunto duly authorized.
Registrant: AIM International Mutual Funds (Invesco International Mutual Funds)
| | |
By: | | /s/ Sheri Morris |
| | Sheri Morris |
| | Principal Executive Officer |
| |
Date: | | January 3, 2020 |
Pursuant to the requirements of the Securities and Exchange Act of 1934 and the Investment Company Act of 1940, this report has been signed below by the following persons on behalf of the Registrant and in the capacities and on the dates indicated.
| | |
By: | | /s/ Sheri Morris |
| | Sheri Morris |
| | Principal Executive Officer |
| |
Date: | | January 3, 2020 |
| | |
By: | | /s/ Kelli Gallegos |
| | Kelli Gallegos |
| | Principal Financial Officer |
| |
Date: | | January 3, 2020 |