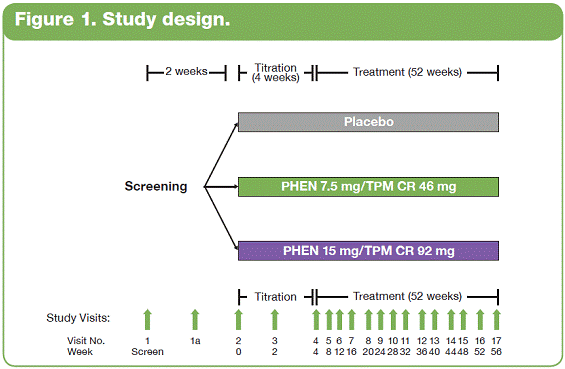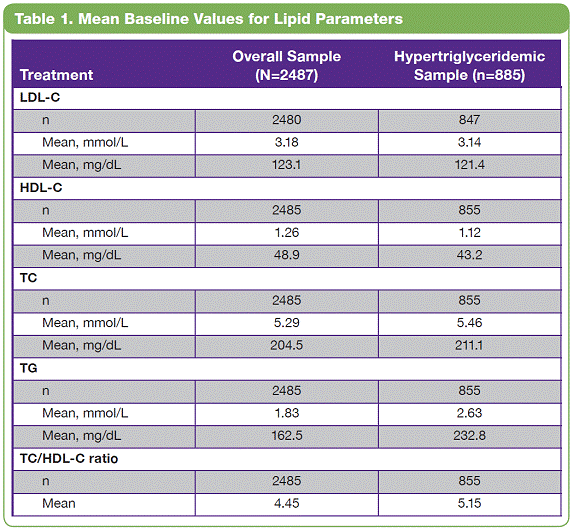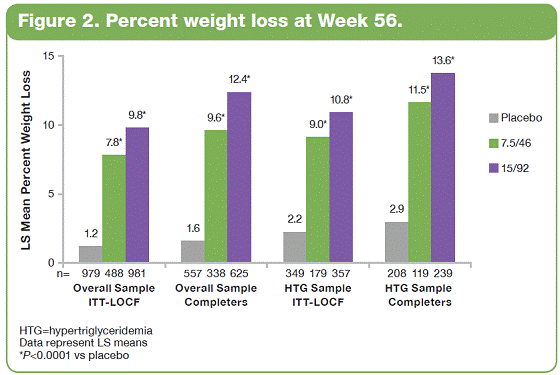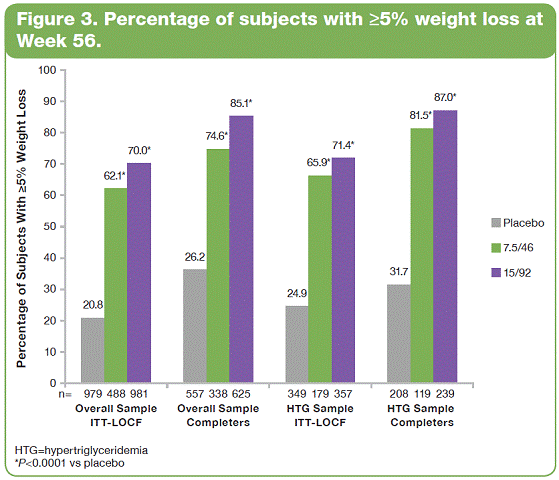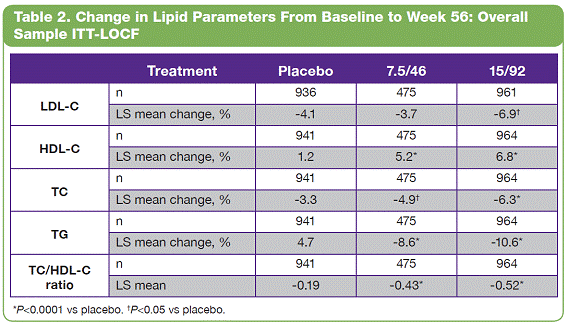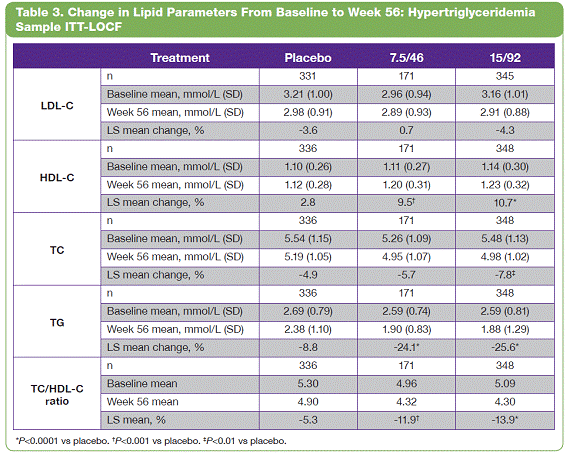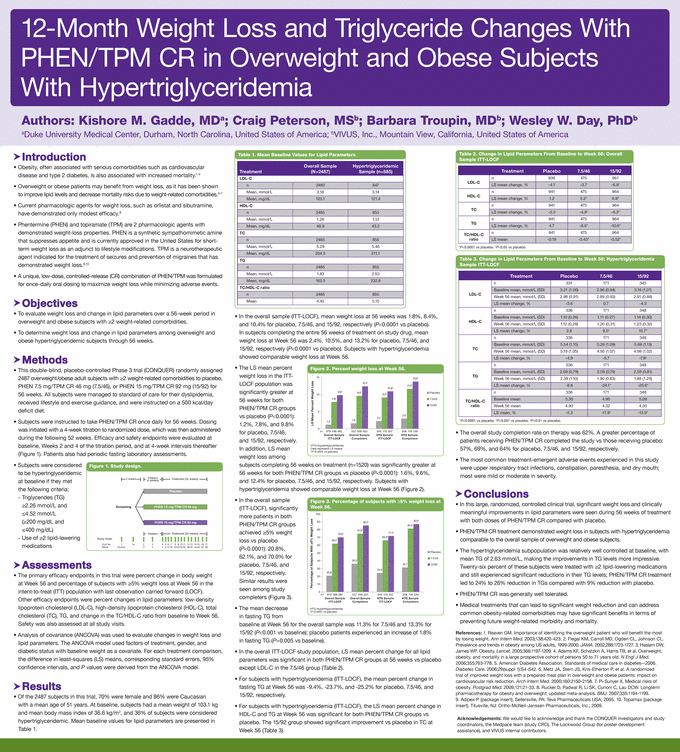
| The overall study completion rate on therapy was 62%. A greater percentage of patients receiving PHEN/TPM CR completed the study vs those receiving placebo: 57%, 69%, and 64% for placebo, 7.5/46, and 15/92, respectively. • The most common treatment-emergent adverse events experienced in this study were upper respiratory tract infections, constipation, paresthesia, and dry mouth; most were mild or moderate in severity. Conclusions • In this large, randomized, controlled clinical trial, significant weight loss and clinically meaningful improvements in lipid parameters were seen during 56 weeks of treatment with both doses of PHEN/TPM CR compared with placebo. • PHEN/TPM CR treatment demonstrated weight loss in subjects with hypertriglyceridemia comparable to the overall sample of overweight and obese subjects. • The hypertriglyceridemia subpopulation was relatively well controlled at baseline, with mean TG of 2.63 mmol/L, making the improvements in TG levels more impressive. Twenty-six percent of these subjects were treated with >2 lipid-lowering medications and still experienced significant reductions in their TG levels; PHEN/TPM CR treatment led to 24% to 26% reduction in TGs compared with 9% reduction with placebo. • PHEN/TPM CR was generally well tolerated. • Medical treatments that can lead to significant weight reduction and can address common obesity-related comorbidities may have significant benefits in terms of preventing future weight-related morbidity and mortality. Introduction • Obesity, often associated with serious comorbidities such as cardiovascular disease and type 2 diabetes, is also associated with increased mortality.1-4 • Overweight or obese patients may benefit from weight loss, as it has been shown to improve lipid levels and decrease mortality risks due to weight-related comorbidities.5-7 • Current pharmacologic agents for weight loss, such as orlistat and sibutramine, have demonstrated only modest efficacy.8 • Phentermine (PHEN) and topiramate (TPM) are 2 pharmacologic agents with demonstrated weight-loss properties. PHEN is a synthetic sympathomimetic amine that suppresses appetite and is currently approved in the United States for short-term weight loss as an adjunct to lifestyle modifications. TPM is a neurotherapeutic agent indicated for the treatment of seizures and prevention of migraines that has demonstrated weight loss.9,10 • A unique, low-dose, controlled-release (CR) combination of PHEN/TPM was formulated for once-daily oral dosing to maximize weight loss while minimizing adverse events. Objectives • To evaluate weight loss and change in lipid parameters over a 56-week period in overweight and obese subjects with >2 weight-related comorbidities. • To determine weight loss and change in lipid parameters among overweight and obese hypertriglyceridemic subjects through 56 weeks. Methods • This double-blind, placebo-controlled Phase 3 trial (CONQUER) randomly assigned 2487 overweight/obese adult subjects with >2 weight-related comorbidities to placebo, PHEN 7.5 mg/TPM CR 46 mg (7.5/46), or PHEN 15 mg/TPM CR 92 mg (15/92) for 56 weeks. All subjects were managed to standard of care for their dyslipidemia, received lifestyle and exercise guidance, and were instructed on a 500 kcal/day deficit diet. • Subjects were instructed to take PHEN/TPM CR once daily for 56 weeks. Dosing was initiated with a 4-week titration to randomized dose, which was then administered during the following 52 weeks. Efficacy and safety endpoints were evaluated at baseline, Weeks 2 and 4 of the titration period, and at 4-week intervals thereafter (Figure 1). Patients also had periodic fasting laboratory assessments. • Subjects were considered to be hypertriglyceridemic at baseline if they met the following criteria: - Triglycerides (TG) >2.26 mmol/L and <4.52 mmol/L (>200 mg/dL and >400 mg/dL) - Use of >2 lipid-lowering medications Assessments • The primary efficacy endpoints in this trial were percent change in body weight at Week 56 and percentage of subjects with =5% weight loss at Week 56 in the intent-to-treat (ITT) population with last observation carried forward (LOCF). Other efficacy endpoints were percent changes in lipid parameters: low-density lipoprotein cholesterol (LDL-C), high-density lipoprotein cholesterol (HDL-C), total cholesterol (TC), TG, and change in the TC/HDL-C ratio from baseline to Week 56. Safety was also assessed at all study visits. • Analysis of covariance (ANCOVA) was used to evaluate changes in weight loss and lipid parameters. The ANCOVA model used factors of treatment, gender, and diabetic status with baseline weight as a covariate. For each treatment comparison, the difference in least-squares (LS) means, corresponding standard errors, 95% confidence intervals, and P values were derived from the ANCOVA model. Results • Of the 2487 subjects in this trial, 70% were female and 86% were Caucasian with a mean age of 51 years. At baseline, subjects had a mean weight of 103.1 kg and mean body mass index of 36.6 kg/m2, and 36% of subjects were considered hypertriglyceridemic. Mean baseline values for lipid parameters are presented in Table 1. 12-Month Weight Loss and Triglyceride Changes With PHEN/TPM CR in Overweight and Obese Subjects With Hypertriglyceridemia Authors: Kishore M. Gadde, MDa; Craig Peterson, MSb; Barbara Troupin, MDb; Wesley W. Day, PhDb aDuke University Medical Center, Durham, North Carolina, United States of America; bVIVUS, Inc., Mountain View, California, United States of America • In the overall sample (ITT-LOCF), mean weight loss at 56 weeks was 1.8%, 8.4%, and 10.4% for placebo, 7.5/46, and 15/92, respectively (P<0.0001 vs placebo). In subjects completing the entire 56 weeks of treatment on study drug, mean weight loss at Week 56 was 2.4%, 10.5%, and 13.2% for placebo, 7.5/46, and 15/92, respectively (P<0.0001 vs placebo). Subjects with hypertriglyceridemia showed comparable weight loss at Week 56. • The LS mean percent weight loss in the ITT-LOCF population was significantly greater at 56 weeks for both PHEN/TPM CR groups vs placebo (P<0.0001): 1.2%, 7.8%, and 9.8% for placebo, 7.5/46, and 15/92, respectively. In addition, LS mean weight loss among subjects completing 56 weeks on treatment (n=1520) was significantly greater at 56 weeks for both PHEN/TPM CR groups vs placebo (P<0.0001): 1.6%, 9.6%, and 12.4% for placebo, 7.5/46, and 15/92, respectively. Subjects with hypertriglyceridemia showed comparable weight loss at Week 56 (Figure 2). • In the overall sample (ITT-LOCF), significantly more patients in both PHEN/TPM CR groups achieved >5% weight loss vs placebo (P<0.0001): 20.8%, 62.1%, and 70.0% for placebo, 7.5/46, and 15/92, respectively. Similar results were seen among study completers (Figure 3). • The mean decrease in fasting TG from baseline at Week 56 for the overall sample was 11.3% for 7.5/46 and 13.3% for 15/92 (P<0.001 vs baseline); placebo patients experienced an increase of 1.8% in fasting TG (P=0.005 vs baseline). • In the overall ITT-LOCF study population, LS mean percent change for all lipid parameters was significant in both PHEN/TPM CR groups at 56 weeks vs placebo except LDL-C in the 7.5/46 group (Table 2). • For subjects with hypertriglyceridemia (ITT-LOCF), the mean percent change in fasting TG at Week 56 was -9.4%, -23.7%, and -25.2% for placebo, 7.5/46, and 15/92, respectively. • For subjects with hypertriglyceridemia (ITT-LOCF), the LS mean percent change in HDL-C and TG at Week 56 was significant for both PHEN/TPM CR groups vs placebo. The 15/92 group showed significant improvement vs placebo in TC at Week 56 (Table 3). References: 1. Reaven GM. Importance of identifying the overweight patient who will benefit the most by losing weight. Ann Intern Med. 2003;138:420-423. 2. Flegal KM, Carroll MD, Ogden CL, Johnson CL. Prevalence and trends in obesity among US adults, 1999-2000. JAMA. 2002;288:1723-1727. 3. Haslam DW, James WP. Obesity. Lancet. 2005;366:1197-1209. 4. Adams KF, Schatzkin A, Harris TB, et al. Overweight, obesity, and mortality in a large prospective cohort of persons 50 to 71 years old. N Engl J Med. 2006;355:763-778. 5. American Diabetes Association. Standards of medical care in diabetes—2006. Diabetes Care. 2006;29(suppl 1):S4-S42. 6. Metz JA, Stern JS, Kris-Etherton P, et al. A randomized trial of improved weight loss with a prepared meal plan in overweight and obese patients: impact on cardiovascular risk reduction. Arch Intern Med. 2000;160:2150-2158. 7. Pi-Sunyer X. Medical risks of obesity. Postgrad Med. 2009;121:21-33. 8. Rucker D, Padwal R, Li SK, Curioni C, Lau DCW. Longterm pharmacotherapy for obesity and overweight: updated meta-analysis. BMJ. 2007;335:1194-1199. 9. Adipex-P [package insert]. Sellersville, PA: Teva Pharmaceuticals USA; 2005. 10. Topamax [package insert]. Titusville, NJ: Ortho-McNeil-Janssen Pharmaceuticals, Inc.; 2009. Acknowledgements: We would like to acknowledge and thank the CONQUER investigators and study coordinators, the Medpace team (study CRO), The Lockwood Group (for poster development assistance), and VIVUS internal contributors. 15 Overall Sample ITT-LOCF Overall Sample Completers HTG Sample ITT-LOCF HTG Sample Completers LS Mean Percent Weight Loss 10 5 0 n=979 1.2 7.8* 9.8* HTG=hypertriglyceridemia Data represent LS means *P<0.0001 vs placebo Placebo 488 981 557 1.6 9.6* 12.4* 338 625 349 2.2 9.0* 10.8* 179 357 208 2.9 13.6* 119 239 7.5/46 15/92 11.5* Figure 2. Percent weight loss at Week 56. 100 Overall Sample ITT-LOCF Overall Sample Completers HTG Sample ITT-LOCF HTG Sample Completers Percentage of Subjects With >5% Weight Loss 50 60 70 80 90 20 30 40 10 0 n=979 20.8 62.1* 70.0* HTG=hypertriglyceridemia *P<0.0001 vs placebo Placebo 488 981 557 26.2 74.6* 85.1* 338 625 349 24.9 65.9* 71.4* 179 357 208 31.7 87.0* 119 239 7.5/46 15/92 81.5* Figure 3. Percentage of subjects with >5% weight loss at Week 56. 2 weeks Titration (4 weeks) Treatment (52 weeks) Screening PHEN 15 mg/TPM CR 92 mg Placebo PHEN 7.5 mg/TPM CR 46 mg Study Visits: Visit No. Week 1 Screen 1a 2 0 3 2 4 4 Titration Treatment (52 weeks) 58 6 12 7 16 8 20 9 24 10 28 11 32 12 36 13 40 14 44 15 48 16 52 17 56 Figure 1. Study design. Table 1. Mean Baseline Values for Lipid Parameters Treatment Overall Sample (N=2487) Hypertriglyceridemic Sample (n=885) LDL-C n 2480 847 Mean, mmol/L 3.18 3.14 Mean, mg/dL 123.1 121.4 HDL-C n 2485 855 Mean, mmol/L 1.26 1.12 Mean, mg/dL 48.9 43.2 TC n 2485 855 Mean, mmol/L 5.29 5.46 Mean, mg/dL 204.5 211.1 TG n 2485 855 Mean, mmol/L 1.83 2.63 Mean, mg/dL 162.5 232.8 TC/HDL-C ratio n 2485 855 Mean 4.45 5.15 *P<0.0001 vs placebo. †P<0.001 vs placebo. ‡P<0.01 vs placebo. Treatment Placebo 7.5/46 15/92 LDL-C n 331 171 345 Baseline mean, mmol/L (SD) 3.21 (1.00) 2.96 (0.94) 3.16 (1.01) Week 56 mean, mmol/L (SD) 2.98 (0.91) 2.89 (0.93) 2.91 (0.88) LS mean change, % -3.6 0.7 -4.3 HDL-C n 336 171 348 Baseline mean, mmol/L (SD) 1.10 (0.26) 1.11 (0.27) 1.14 (0.30) Week 56 mean, mmol/L (SD) 1.12 (0.28) 1.20 (0.31) 1.23 (0.32) LS mean change, % 2.8 9.5† 10.7* TC n 336 171 348 Baseline mean, mmol/L (SD) 5.54 (1.15) 5.26 (1.09) 5.48 (1.13) Week 56 mean, mmol/L (SD) 5.19 (1.05) 4.95 (1.07) 4.98 (1.02) LS mean change, % -4.9 -5.7 -7.8‡ TG n 336 171 348 Baseline mean, mmol/L (SD) 2.69 (0.79) 2.59 (0.74) 2.59 (0.81) Week 56 mean, mmol/L (SD) 2.38 (1.10) 1.90 (0.83) 1.88 (1.29) LS mean change, % -8.8 -24.1* -25.6* TC/HDL-C ratio n 336 171 348 Baseline mean 5.30 4.96 5.09 Week 56 mean 4.90 4.32 4.30 LS mean, % -5.3 -11.9† -13.9* Table 3. Change in Lipid Parameters From Baseline to Week 56: Hypertriglyceridemia Sample ITT-LOCF Table 2. Change in Lipid Parameters From Baseline to Week 56: Overall Sample ITT-LOCF Treatment Placebo 7.5/46 15/92 LDL-C n 936 475 961 LS mean change, % -4.1 -3.7 -6.9† HDL-C n 941 475 964 LS mean change, % 1.2 5.2* 6.8* TC n 941 475 964 LS mean change, % -3.3 -4.9† -6.3* TG n 941 475 964 LS mean change, % 4.7 -8.6* -10.6* TC/HDL-C ratio n 941 475 964 LS mean -0.19 -0.43* -0.52* *P<0.0001 vs placebo. †P<0.05 vs placebo. |

