UNITED STATES
SECURITIES AND EXCHANGE COMMISSION
Washington, D.C. 20549
FORM N-CSR
CERTIFIED SHAREHOLDER REPORT OF REGISTERED MANAGEMENT
INVESTMENT COMPANIES
Investment Company Act file number | 811-06490 | |||||
|
| |||||
| Dreyfus Premier Investment Funds, Inc. |
| ||||
| (Exact name of Registrant as specified in charter) |
| ||||
|
|
| ||||
|
c/o The Dreyfus Corporation 200 Park Avenue New York, New York 10166 |
| ||||
| (Address of principal executive offices) (Zip code) |
| ||||
|
|
| ||||
| Bennett A. MacDougall, Esq. 200 Park Avenue New York, New York 10166 |
| ||||
| (Name and address of agent for service) |
| ||||
| ||||||
Registrant's telephone number, including area code: | (212) 922-6400 | |||||
|
| |||||
Date of fiscal year end:
| 10/31 |
| ||||
Date of reporting period: | 10/31/17
|
| ||||
The following N-CSR relates only to the Registrant's series listed below and does not relate to any series of the Registrant with a different fiscal year end and, therefore, different N-CSR reporting requirements. A separate N-CSR will be filed for any series with a different fiscal year end, as appropriate.
Dreyfus Diversified International Fund
Dreyfus Global Infrastructure Fund
Dreyfus Global Real Estate Securities Fund
FORM N-CSR
Item 1. Reports to Stockholders.
Dreyfus Diversified International Fund
| ANNUAL REPORT October 31, 2017 |

|

Save time. Save paper. View your next shareholder report online as soon as it’s available. Log into www.dreyfus.com and sign up for Dreyfus eCommunications. It’s simple and only takes a few minutes. |
The views expressed in this report reflect those of the portfolio manager(s) only through the end of the period covered and do not necessarily represent the views of Dreyfus or any other person in the Dreyfus organization. Any such views are subject to change at any time based upon market or other conditions and Dreyfus disclaims any responsibility to update such views. These views may not be relied on as investment advice and, because investment decisions for a Dreyfus fund are based on numerous factors, may not be relied on as an indication of trading intent on behalf of any Dreyfus fund. |
Not FDIC-Insured • Not Bank-Guaranteed • May Lose Value |
Contents
THE FUND
With Those of Other Funds | |
in Affiliated Issuers | |
Public Accounting Firm | |
FOR MORE INFORMATION
Back Cover
| The Fund |
A LETTER FROM THE CEO OF DREYFUS
Dear Shareholder:
We are pleased to present this annual report for Dreyfus Diversified International Fund, covering the 12-month period from November 1, 2016 through October 31, 2017. For information about how the fund performed during the reporting period, as well as general market perspectives, we provide a Discussion of Fund Performance on the pages that follow.
Stocks set a series of new record highs and bonds produced mixed results over the past year in response to changing economic and political conditions. Financial markets at the start of the reporting period were dominated by the election of a new U.S. presidential administration. Equities and corporate-backed bonds surged higher in anticipation of more business-friendly regulatory, tax, and fiscal policies, but high-quality bonds generally lost value due to expectations of rising interest rates and accelerating inflation in a stronger economy. Despite a series of short-term interest-rate hikes, bonds recovered their previous losses over the first 10 months of 2017 when it became clearer that pro-growth legislation would take time and political capital to enact. U.S. and international stocks continued to rally as corporate earnings grew and global economic conditions improved.
The markets’ recent strong performance has been supported by solid underlying fundamentals. While we currently expect these favorable conditions to persist, we remain watchful for economic and political developments that could derail the markets. As always, we encourage you to discuss the risks and opportunities of today’s investment environment with your financial advisor.
Thank you for your continued confidence and support.
Sincerely,

Mark D. Santero
Chief Executive Officer
The Dreyfus Corporation
November 15, 2017
2
DISCUSSION OF FUND PERFORMANCE
For the period from November 1, 2016 through October 31, 2017, as provided by Jeffrey M. Mortimer, CFA, and Keith L. Stransky, CFA, Portfolio Managers
Market and Fund Performance Overview
For the 12-month period ended October 31, 2017, Dreyfus Diversified International Fund’s Class A shares produced a total return of 22.70%, Class C shares returned 21.73%, Class I shares returned 23.11%, and Class Y shares returned 23.12%.1 In comparison, the fund’s benchmark, the MSCI EAFE Index (the “Index”), produced a total return of 23.44% for the same period.2
International equities produced robust gains during the reporting period in response to rising corporate earnings, favorable political developments, and improving global economic fundamentals in developed and emerging markets. The fund modestly lagged its benchmark during the reporting period, primarily due to the impact of heightened market volatility early in the reporting period on some of the fund’s underlying strategies.
The Fund’s Investment Approach
The fund seeks long-term capital appreciation. To pursue its goal, the fund normally allocates its assets among other mutual funds advised by The Dreyfus Corporation or its affiliates, referred to as underlying funds, that invest primarily in stocks issued by foreign companies. The fund is designed to provide diversification within the international asset class by investing the majority of its assets in the underlying funds. The underlying funds are selected by the portfolio managers based on their investment objectives and management policies, portfolio holdings, risk/reward profiles, historical performance, and other factors. The fund’s portfolio managers determine the underlying funds. As of October 31, 2017, the fund’s market value was allocated as follows:
Underlying Funds %
International Stock Fund 23.1
Dreyfus/Newton International Equity Fund 25.3
Dreyfus International Equity Fund 39.2
Dreyfus Emerging Markets Fund 5.0
Dreyfus International Small Cap Fund 7.4
Improving Economic Trends Boosted International Equities
After a weak start to the reporting period due to uncertainty in the immediate aftermath of the U.S. presidential election, international equities turned broadly positive in December 2016, bolstered by signs of continued economic growth in Europe and Asia, softening U.S. dollar strength, and expectations for accelerating U.S. demand for foreign exports. A brief pause for profit taking in late January 2017 was followed by further equity market gains during the spring as economic data continued to surprise on the upside.
International equity markets continued to advance during the second half of the reporting period. Successive strong corporate earnings reporting seasons bolstered investor confidence in an environment of stronger economic growth and low rates of inflation. Eurozone equities were further supported by reassuringly mainstream election results in the Netherlands and France. British stocks benefited from a wave of heightened mergers-and-acquisitions activity and robust export activity stemming from a weaker British pound. In Japan, investors responded positively to an upbeat assessment from the Bank of Japan and a pro-business prime minister’s reelection, while Chinese and other Asian emerging markets were buoyed by positive economic news, rebounding commodity prices, and strengthening currency exchange rates.
3
DISCUSSION OF FUND PERFORMANCE (continued)
Post-Election Turmoil Undermined Early Results
Although the fund participated to a substantial degree in the Index’s gains for the reporting period overall, market turmoil in the wake of the November 2016 U.S. presidential election weighed mildly on relative performance. Better results over the first 10 months of 2017 were not enough to completely offset earlier weakness.
Relatively defensive positioning by two of the fund’s underlying strategies prevented the fund from participating more fully in the Index’s gains. International Stock Fund and Dreyfus/Newton International Equity Fund held underweighted exposure to the strong-performing financials sector and overweighted positions in some of the reporting period’s weaker market sectors.
In contrast, Dreyfus International Small Cap Fund produced impressive relative results, in part due to strong stock selections in Canada, Australia, and France. Dreyfus International Equity Fund also fared better than market averages as a result of its overweighted allocation to the financials and information technology sectors, as well as a relatively light position in the lagging health care sector. Dreyfus Emerging Markets Fund produced returns that were roughly in line with the Index.
In February 2017, due to a withdrawal, we modestly reduced the fund’s exposure to International Stock Fund and Dreyfus/Newton International Equity Fund. In May 2017, we shifted some assets from Dreyfus/Newton International Equity Fund to Dreyfus Emerging Markets Fund in order to increase the fund’s exposure to rallying emerging-market equities.
A More Cautious Allocation Strategy
In the wake of the robust 2017 rally among international equities, we expect the market to produce more modest results over the months ahead. Indeed, in our judgment, any unexpected economic or political disappointments could spark heightened volatility. Therefore, we have continued to keep a somewhat more defensive posture; the fund’s overall allocation to countries and market sectors currently approximate those of the Index.
November 15, 2017
1 Total return includes reinvestment of dividends and any capital gains paid, and does not take into consideration the maximum initial sales charge in the case of Class A shares, or the applicable contingent deferred sales charge imposed on redemptions in the case of Class C shares. Share price and investment return fluctuate such that upon redemption, fund shares may be worth more or less than their original cost. Return figures provided reflect the absorption of certain fund expenses pursuant to an agreement by The Dreyfus Corporation through March 1, 2018, at which time it may be extended, terminated, or modified. Had these expenses not been absorbed, the fund’s returns would have been lower. Past performance is no guarantee of future results.
2 Source: Lipper Inc. — Reflects reinvestment of net dividends and, where applicable, capital gain distributions. The MSCI EAFE Index (Europe, Australasia, Far East) is a free float-adjusted market capitalization-weighted index that is designed to measure the equity market performance of developed markets, excluding the U.S. and Canada. Investors cannot invest directly in any index.
Equities are subject generally to market, market sector, market liquidity, issuer, and investment style risks, among other factors, to varying degrees, all of which are more fully described in the prospectus of the fund and that of each underlying fund.
Small and midsized companies carry additional risks because their earnings and revenues tend to be less predictable, and their share prices more volatile, than those of larger, more established companies.
The shares of smaller companies tend to trade less frequently than those of larger, more established companies.
The ability of the fund to achieve its investment goal depends, in part, on the ability of the portfolio managers to allocate effectively the fund’s assets among the underlying funds. There can be no assurance that the actual allocations will be effective in achieving the fund’s investment goal.
Each underlying fund’s performance will be influenced by political, social, and economic factors affecting investments in foreign companies. Special risks associated with such companies include exposure to currency fluctuations, less liquidity, less developed or less efficient trading markets, lack of comprehensive company information, political instability, and differing auditing and legal standards. These risks are higher in emerging market countries.
4
FUND PERFORMANCE
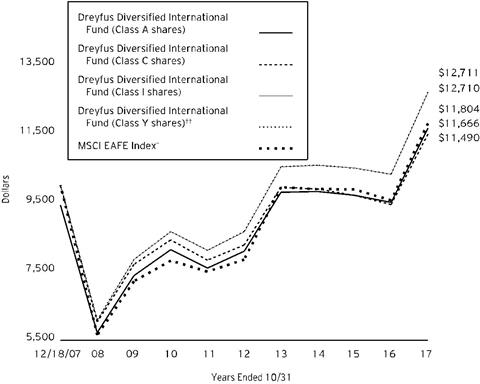
Comparison of change in value of $10,000 investment in Dreyfus Diversified International Fund Class A shares, Class C shares, Class I shares and Class Y shares and the MSCI EAFE (the “Index”)
† Source: Lipper Inc.
†† The total return figures presented for Class Y shares of the fund reflect the performance of the fund’s Class I shares for the period prior to 10/1/15 (the inception date for Class Y shares).
Past performance is not predictive of future performance.
The above graph compares a $10,000 investment made in each of the Class A, Class C, Class I and Class Y shares of Dreyfus Diversified International Fund on 12/18/07 (inception date) to a $10,000 investment made in the Index on that date. All dividends and capital gain distributions are reinvested.
The fund’s performance shown in the line graph above takes into account the maximum initial sales charge on Class A shares and all other applicable fees and expenses on all classes. The Index is a free float adjusted market capitalization-weighted index that is designed to measure the equity market performance of developed markets, excluding the U.S. and Canada. Unlike a mutual fund, the Index is not subject to charges, fees and other expenses. Investors cannot invest directly in any index. Further information relating to fund performance, including expense reimbursements, if applicable, is contained in the Financial Highlights section of the prospectus and elsewhere in this report.
5
FUND PERFORMANCE (continued)
Average Annual Total Returns as of 10/31/17
|
|
| |||||
| Inception | 1 Year | 5 Years | From | |||
Date | Inception | ||||||
Class A shares | |||||||
with maximum sales charge (5.75%) | 12/18/07 | 15.60% | 6.34% | 1.57% | |||
without sales charge | 12/18/07 | 22.70% | 7.62% | 2.18% | |||
Class C shares | |||||||
with applicable redemption charge † | 12/18/07 | 20.73% | 6.81% | 1.42% | |||
without redemption | 12/18/07 | 21.73% | 6.81% | 1.42% | |||
Class I shares | 12/18/07 | 23.11% | 7.97% | 2.46% | |||
Class Y shares | 10/1/15 | 23.12% | 7.97% | †† | 2.46% | †† | |
MSCI EAFE Index | 12/31/07 | 23.44% | 8.53% | 1.70% | ††† | ||
† The maximum contingent deferred sales charge for Class C shares is 1% for shares redeemed within one year of the date of purchase.
†† The total return figures presented for Class Y shares of the fund reflect the performance of the fund’s Class I shares for the period prior to 10/1/15 (the inception date for Class Y shares).
††† For comparative purposes, the value of the Index as of 12/31/07 is used as the beginning value on 12/18/07.
The performance data quoted represents past performance, which is no guarantee of future results. Share price and investment return fluctuate and an investor’s shares may be worth more or less than original cost upon redemption. Current performance may be lower or higher than the performance quoted. Go to Dreyfus.com for the fund’s most recent month-end returns.
The fund’s performance shown in the graph and table does not reflect the deduction of taxes that a shareholder would pay on fund distributions or the redemption of fund shares. In addition to the performance of Class A shares shown with and without a maximum sales charge, the fund’s performance shown in the table takes into account all other applicable fees and expenses on all classes.
6
UNDERSTANDING YOUR FUND’S EXPENSES (Unaudited)
As a mutual fund investor, you pay ongoing expenses, such as management fees and other expenses. Using the information below, you can estimate how these expenses affect your investment and compare them with the expenses of other funds. You also may pay one-time transaction expenses, including sales charges (loads) and redemption fees, which are not shown in this section and would have resulted in higher total expenses. For more information, see your fund’s prospectus or talk to your financial adviser.
Review your fund’s expenses
The table below shows the expenses you would have paid on a $1,000 investment in Dreyfus Diversified International Fund from May 1, 2017 to October 31, 2017. It also shows how much a $1,000 investment would be worth at the close of the period, assuming actual returns and expenses.
Expenses and Value of a $1,000 Investment | ||||||||||||
assuming actual returns for the six months ended October 31, 2017 | ||||||||||||
|
|
|
| Class A | Class C | Class I | Class Y | |||||
Expenses paid per $1,000† | $2.08 | $6.07 | $.43 | $.21 | ||||||||
Ending value (after expenses) | $1,115.30 | $1,110.90 | $1,117.80 | $1,117.90 | ||||||||
COMPARING YOUR FUND’S EXPENSES
WITH THOSE OF OTHER FUNDS (Unaudited)
Using the SEC’s method to compare expenses
The Securities and Exchange Commission (“SEC”) has established guidelines to help investors assess fund expenses. Per these guidelines, the table below shows your fund’s expenses based on a $1,000 investment, assuming a hypothetical 5% annualized return. You can use this information to compare the ongoing expenses (but not transaction expenses or total cost) of investing in the fund with those of other funds. All mutual fund shareholder reports will provide this information to help you make this comparison. Please note that you cannot use this information to estimate your actual ending account balance and expenses paid during the period.
Expenses and Value of a $1,000 Investment | |||||||||||
assuming a hypothetical 5% annualized return for the six months ended October 31, 2017 | |||||||||||
|
|
|
| Class A | Class C | Class I | Class Y | ||||
Expenses paid per $1,000† | $1.99 | $5.80 | $.41 | $.20 | |||||||
Ending value (after expenses) | $1,023.24 | $1,019.46 | $1,024.80 | $1,025.00 | |||||||
† Expenses are equal to the fund’s annualized expense ratio of .39% for Class A, 1.14% for Class C, .08% for Class I and .04% for Class Y, multiplied by the average account value over the period, multiplied by 184/365 (to reflect the one-half year period).
7
STATEMENT OF INVESTMENTS
October 31, 2017
Description | Shares | Value ($) | |||||
Registered Investment Companies - 98.7% | |||||||
Foreign Equity - 98.7% | |||||||
Dreyfus Emerging Markets Fund, Cl. Y | 3,873,369 | a | 43,807,801 | ||||
Dreyfus International Equity Fund, Cl. Y | 8,420,185 | a,b | 342,533,132 | ||||
Dreyfus International Small Cap Fund, Cl. Y | 3,896,033 | a | 64,557,265 | ||||
Dreyfus/Newton International Equity Fund, Cl. Y | 10,147,510 | a | 220,403,924 | ||||
International Stock Fund, Cl. Y | 10,984,996 | a | 201,574,671 | ||||
Total Investments (cost $624,269,213) | 98.7% | 872,876,793 | |||||
Cash and Receivables (Net) | 1.3% | 11,937,911 | |||||
Net Assets | 100.0% | 884,814,704 | |||||
a Investment in affiliated mutual fund.
b The fund's investment in the Dreyfus International Equity Fund represents 38.7% of the fund's total investments. The Dreyfus International Equity Fund seeks to provide long-term capital appreciation.
8
STATEMENT OF INVESTMENTS IN AFFILIATED ISSUERS
Registered Investment Companies | Value | Purchases ($)† | Sales ($) | Net Realized |
Dreyfus Emerging Markets | 23,706,377 | 16,575,030 | 2,894,284 | 360 |
Dreyfus International Equity | 249,591,479 | 57,235,212 | 30,211,728 | (1,974,035) |
Dreyfus International Small Cap | 54,185,388 | 3,208,145 | 6,122,078 | 374,454 |
Dreyfus/Newton International Equity | 241,954,844 | 12,712,188 | 73,281,519 | (3,583,885) |
International Stock Fund, CI. Y | 253,828,476 | 10,570,615 | 95,446,139 | 878,811 |
Total | 823,266,564 | 100,301,190 | 207,955,748 | (4,304,295) |
Registered Investment Companies | Change in Net | Value | Net | Dividends/ | |
Dreyfus Emerging Markets | 6,420,318 | 43,807,801 | 5.0 | 266,444 | |
Dreyfus International Equity | 67,892,204 | 342,533,132 | 38.7 | 5,070,742 | |
Dreyfus International Small Cap | 12,911,356 | 64,557,265 | 7.3 | 922,399 | |
Dreyfus/Newton International Equity | 42,602,296 | 220,403,924 | 24.9 | 3,403,872 | |
International Stock Fund, CI. Y | 31,742,908 | 201,574,671 | 22.8 | 2,486,739 | |
Total | 161,569,082 | 872,876,793 | 98.7 | 12,150,196 | |
† Includes reinvested dividends/distributions.
See notes to financial statements.
9
STATEMENT OF ASSETS AND LIABILITIES
October 31, 2017
|
|
|
|
|
|
|
|
|
| Cost |
| Value |
|
Assets ($): |
|
|
|
| ||
Investments in affiliated issuers—See Statement of Investments | 624,269,213 |
| 872,876,793 |
| ||
Cash |
|
|
|
| 12,009,698 |
|
Receivable for investment securities sold |
|
|
|
| 177,538 |
|
Receivable for shares of Common Stock subscribed |
|
|
|
| 103,750 |
|
Due from The Dreyfus Corporation and affiliates—Note 3(c) |
|
|
|
| 4,923 |
|
Prepaid expenses |
|
|
|
| 43,452 |
|
|
|
|
|
| 885,216,154 |
|
Liabilities ($): |
|
|
|
| ||
Payable for shares of Common Stock redeemed |
|
|
|
| 262,128 |
|
Accrued expenses |
|
|
|
| 139,322 |
|
|
|
|
|
| 401,450 |
|
Net Assets ($) |
|
| 884,814,704 |
| ||
Composition of Net Assets ($): |
|
|
|
| ||
Paid-in capital |
|
|
|
| 663,300,174 |
|
Accumulated distributions in excess of investment income—net |
| (120,909) |
| |||
Accumulated net realized gain (loss) on investments |
|
|
|
| (26,972,141) |
|
Accumulated net unrealized appreciation (depreciation) |
|
|
| 248,607,580 |
| |
Net Assets ($) |
|
| 884,814,704 |
| ||
Net Asset Value Per Share | Class A | Class C | Class I | Class Y |
|
Net Assets ($) | 7,222,547 | 361,231 | 25,310,098 | 851,920,828 |
|
Shares Outstanding | 545,128 | 27,315 | 1,906,181 | 64,218,015 |
|
Net Asset Value Per Share ($) | 13.25 | 13.22 | 13.28 | 13.27 |
|
See notes to financial statements. |
10
STATEMENT OF OPERATIONS
Year Ended October 31, 2017
|
|
|
|
|
|
|
|
|
|
|
|
|
|
Investment Income ($): |
|
|
|
| ||
Income: |
|
|
|
| ||
Cash dividends from affiliated issuers |
|
| 12,150,196 |
| ||
Interest |
|
| 1,049 |
| ||
Total Income |
|
| 12,151,245 |
| ||
Expenses: |
|
|
|
| ||
Shareholder servicing costs—Note 3(c) |
|
| 209,670 |
| ||
Professional fees |
|
| 128,440 |
| ||
Directors’ fees and expenses—Note 3(d) |
|
| 74,969 |
| ||
Registration fees |
|
| 66,925 |
| ||
Loan commitment fees—Note 2 |
|
| 19,641 |
| ||
Prospectus and shareholders’ reports |
|
| 12,153 |
| ||
Distribution fees—Note 3(b) |
|
| 1,178 |
| ||
Miscellaneous |
|
| 21,647 |
| ||
Total Expenses |
|
| 534,623 |
| ||
Less—reduction in expenses due to undertaking—Note 3(a) |
|
| (173,645) |
| ||
Less—reduction in fees due to earnings credits—Note 3(c) |
|
| (281) |
| ||
Net Expenses |
|
| 360,697 |
| ||
Investment Income—Net |
|
| 11,790,548 |
| ||
Realized and Unrealized Gain (Loss) on Investments—Note 4 ($): |
|
| ||||
Net realized gain (loss) on investments: |
|
| ||||
Affiliated issuers |
|
|
| (4,304,295) |
| |
Net unrealized appreciation (depreciation) on investments: |
|
|
|
| ||
Affiliated issuers |
|
|
| 161,569,082 |
| |
Net Realized and Unrealized Gain (Loss) on Investments |
|
| 157,264,787 |
| ||
Net Increase in Net Assets Resulting from Operations |
| 169,055,335 |
| |||
See notes to financial statements. | ||||||
11
STATEMENT OF CHANGES IN NET ASSETS
|
|
|
| Year Ended October 31, | |||||
|
|
|
| 2017 |
| 2016 |
| ||
Operations ($): |
|
|
|
|
|
|
|
| |
Investment income—net |
|
| 11,790,548 |
|
|
| 8,399,650 |
| |
Net realized gain (loss) on investments |
| (4,304,295) |
|
|
| (8,123,192) |
| ||
Net unrealized appreciation (depreciation) |
| 161,569,082 |
|
|
| (1,478,478) |
| ||
Net Increase (Decrease) in Net Assets | 169,055,335 |
|
|
| (1,202,020) |
| |||
Distributions to Shareholders from ($): |
| ||||||||
Investment income—net: |
|
|
|
|
|
|
|
| |
Class A |
|
| (106,348) |
|
|
| (84,254) |
| |
Class I |
|
| (170,352) |
|
|
| (8,417,162) |
| |
Class Y |
|
| (11,503,602) |
|
|
| (12) |
| |
Total Distributions |
|
| (11,780,302) |
|
|
| (8,501,428) |
| |
Capital Stock Transactions ($): |
| ||||||||
Net proceeds from shares sold: |
|
|
|
|
|
|
|
| |
Class A |
|
| 1,646,387 |
|
|
| 2,668,791 |
| |
Class C |
|
| 278,212 |
|
|
| 39,000 |
| |
Class I |
|
| 19,316,304 |
|
|
| 205,878,714 |
| |
Class Y |
|
| 90,450,835 |
|
|
| 860,410,664 |
| |
Distributions reinvested: |
|
|
|
|
|
|
|
| |
Class A |
|
| 105,901 |
|
|
| 83,750 |
| |
Class I |
|
| 142,752 |
|
|
| 1,335,589 |
| |
Class Y |
|
| 1,402,013 |
|
|
| - |
| |
Cost of shares redeemed: |
|
|
|
|
|
|
|
| |
Class A |
|
| (6,541,646) |
|
|
| (2,882,025) |
| |
Class C |
|
| (76,186) |
|
|
| (46,832) |
| |
Class I |
|
| (10,966,791) |
|
|
| (822,911,508) |
| |
Class Y |
|
| (203,426,797) |
|
|
| (126,246,476) |
| |
Increase (Decrease) in Net Assets | (107,669,016) |
|
|
| 118,329,667 |
| |||
Total Increase (Decrease) in Net Assets | 49,606,017 |
|
|
| 108,626,219 |
| |||
Net Assets ($): |
| ||||||||
Beginning of Period |
|
| 835,208,687 |
|
|
| 726,582,468 |
| |
End of Period |
|
| 884,814,704 |
|
|
| 835,208,687 |
| |
Distributions in excess of investment income—net | (120,909) |
|
|
| (131,155) |
| |||
12
|
|
|
| Year Ended October 31, | |||||
|
|
|
| 2017 |
| 2016 |
| ||
Capital Share Transactions (Shares): |
| ||||||||
Class A |
|
|
|
|
|
|
|
| |
Shares sold |
|
| 136,986 |
|
|
| 250,229 |
| |
Shares issued for distributions reinvested |
|
| 9,916 |
|
|
| 7,719 |
| |
Shares redeemed |
|
| (589,485) |
|
|
| (270,329) |
| |
Net Increase (Decrease) in Shares Outstanding | (442,583) |
|
|
| (12,381) |
| |||
Class C |
|
|
|
|
|
|
|
| |
Shares sold |
|
| 22,061 |
|
|
| 3,914 |
| |
Shares redeemed |
|
| (6,750) |
|
|
| (4,317) |
| |
Net Increase (Decrease) in Shares Outstanding | 15,311 |
|
|
| (403) |
| |||
Class Ia |
|
|
|
|
|
|
|
| |
Shares sold |
|
| 1,661,906 |
|
|
| 19,964,744 |
| |
Shares issued for distributions reinvested |
|
| 13,366 |
|
|
| 123,096 |
| |
Shares redeemed |
|
| (939,240) |
|
|
| (82,395,681) |
| |
Net Increase (Decrease) in Shares Outstanding | 736,032 |
|
|
| (62,307,841) |
| |||
Class Ya |
|
|
|
|
|
|
|
| |
Shares sold |
|
| 7,779,009 |
|
|
| 85,980,379 |
| |
Shares issued for distributions reinvested |
|
| 131,521 |
|
|
| - |
| |
Shares redeemed |
|
| (17,898,242) |
|
|
| (11,774,747) |
| |
Net Increase (Decrease) in Shares Outstanding | (9,987,712) |
|
|
| 74,205,632 |
| |||
a During the period ended October 31, 2017, 6,547 Class A shares representing $71,947 were exchanged for 6,553 Class Y shares and 759,957 Class Y shares representing $9,061,199 were exchanged for 759,151 Class I shares. During the period ended October 31, 2016, 75,872,879 Class I shares representing $753,669,788 were exchanged for 75,950,002 Class Y shares. | |||||||||
See notes to financial statements. | |||||||||
13
FINANCIAL HIGHLIGHTS
The following tables describe the performance for each share class for the fiscal periods indicated. All information (except portfolio turnover rate) reflects financial results for a single fund share. Total return shows how much your investment in the fund would have increased (or decreased) during each period, assuming you had reinvested all dividends and distributions. These figures have been derived from the fund’s financial statements.
Year Ended October 31, | ||||||
Class A Shares | 2017 | 2016 | 2015 | 2014 | 2013 | |
Per Share Data ($): | ||||||
Net asset value, beginning of period | 10.91 | 11.23 | 11.57 | 11.69 | 9.78 | |
Investment Operations: | ||||||
Investment income—neta | .20 | .09 | .19 | .11 | .17 | |
Net realized and unrealized | 2.25 | (.32) | (.33) | (.09) | 1.89 | |
Total from Investment Operations | 2.45 | (.23) | (.14) | .02 | 2.06 | |
Distributions: | ||||||
Dividends from investment | (.11) | (.09) | (.20) | (.14) | (.15) | |
Net asset value, end of period | 13.25 | 10.91 | 11.23 | 11.57 | 11.69 | |
Total Return (%)b | 22.70 | (2.08) | (1.15) | .20 | 21.29 | |
Ratios/Supplemental Data (%): | ||||||
Ratio of total expenses to | 2.73 | 1.78 | 1.57 | .97 | .40 | |
Ratio of net expenses to | .39 | .39 | .40 | .34 | .34 | |
Ratio of net investment income to | 1.74 | .84 | 1.64 | .95 | 1.64 | |
Portfolio Turnover Rate | 12.41 | 11.12 | 18.00 | 9.48 | 10.28 | |
Net Assets, end of period ($ x 1,000) | 7,223 | 10,778 | 11,228 | 11,418 | 8,702 | |
a Based on average shares outstanding.
b Exclusive of sales charge.
c Amounts do not include the expenses of the underlying funds.
See notes to financial statements.
14
Year Ended October 31, | ||||||
Class C Shares | 2017 | 2016 | 2015 | 2014 | 2013 | |
Per Share Data ($): | ||||||
Net asset value, beginning of period | 10.86 | 11.17 | 11.51 | 11.65 | 9.69 | |
Investment Operations: | ||||||
Investment income (loss)—neta | (.03) | (.01) | .12 | .05 | .05 | |
Net realized and unrealized | 2.39 | (.30) | (.34) | (.11) | 1.92 | |
Total from Investment Operations | 2.36 | (.31) | (.22) | (.06) | 1.97 | |
Distributions: | ||||||
Dividends from investment | - | - | (.12) | (.08) | (.01) | |
Net asset value, end of period | 13.22 | 10.86 | 11.17 | 11.51 | 11.65 | |
Total Return (%)b | 21.73 | (2.78) | (1.87) | (.54) | 20.33 | |
Ratios/Supplemental Data (%): | ||||||
Ratio of total expenses to | 1.54 | 1.59 | 1.48 | 1.45 | 1.63 | |
Ratio of net expenses to | 1.14 | 1.14 | 1.15 | 1.09 | 1.10 | |
Ratio of net investment income (loss) to | (.26) | (.05) | 1.02 | .46 | .47 | |
Portfolio Turnover Rate | 12.41 | 11.12 | 18.00 | 9.48 | 10.28 | |
Net Assets, end of period ($ x 1,000) | 361 | 130 | 139 | 212 | 186 | |
a Based on average shares outstanding.
b Exclusive of sales charge.
c Amounts do not include the expenses of the underlying funds.
See notes to financial statements.
15
FINANCIAL HIGHLIGHTS (continued)
Year Ended October 31, | ||||||
Class I Shares | 2017 | 2016 | 2015 | 2014 | 2013 | |
Per Share Data ($): | ||||||
Net asset value, beginning of period | 10.94 | 11.27 | 11.60 | 11.72 | 9.81 | |
Investment Operations: | ||||||
Investment income—neta | .11 | .41 | .22 | .15 | .21 | |
Net realized and unrealized | 2.38 | (.61) | (.31) | (.09) | 1.89 | |
Total from Investment Operations | 2.49 | (.20) | (.09) | .06 | 2.10 | |
Distributions: | ||||||
Dividends from investment | (.15) | (.13) | (.24) | (.18) | (.19) | |
Net asset value, end of period | 13.28 | 10.94 | 11.27 | 11.60 | 11.72 | |
Total Return (%) | 23.11 | (1.77) | (.75) | .46 | 21.69 | |
Ratios/Supplemental Data (%): | ||||||
Ratio of total expenses to | .09 | .05 | .03 | .04 | .04 | |
Ratio of net expenses to | .09 | .04 | .03 | .04 | .04 | |
Ratio of net investment income to | .88 | 3.76 | 1.96 | 1.24 | 1.94 | |
Portfolio Turnover Rate | 12.41 | 11.12 | 18.00 | 9.48 | 10.28 | |
Net Assets, end of period ($ x 1,000) | 25,310 | 12,802 | 715,214 | 661,931 | 470,634 | |
a Based on average shares outstanding.
b Amounts do not include the expenses of the underlying funds.
See notes to financial statements.
16
Year Ended October 31, | |||||||
Class Y Shares | 2017 | 2016 | 2015a | ||||
Per Share Data ($): | |||||||
Net asset value, beginning of period | 10.94 | 11.26 | 10.53 | ||||
Investment Operations: | |||||||
Investment income (loss)—netb | .17 | (.00)c | (.00)c | ||||
Net realized and unrealized | 2.32 | (.19) | .73 | ||||
Total from Investment Operations | 2.49 | (.19) | .73 | ||||
Distributions: | |||||||
Dividends from investment | (.16) | (.13) | - | ||||
Net asset value, end of period | 13.27 | 10.94 | 11.26 | ||||
Total Return (%) | 23.12 | (1.71) | 6.93d | ||||
Ratios/Supplemental Data (%): | |||||||
Ratio of total expenses to | .04 | .03 | 2.42f | ||||
Ratio of net expenses to | .04 | .03 | .21f | ||||
Ratio of net investment income (loss) to | 1.45 | (.03) | (.21)f | ||||
Portfolio Turnover Rate | 12.41 | 11.12 | 18.00 | ||||
Net Assets, end of period ($ x 1,000) | 851,921 | 811,498 | 1 | ||||
a From October 1, 2015 (commencement of initial offering) to October 31, 2015.
b Based on average shares outstanding.
c Amount represents less than $.01 per share.
d Not annualized.
e Amounts do not include the expenses of the underlying fund.
f Annualized.
See notes to financial statements.
17
NOTES TO FINANCIAL STATEMENTS
NOTE 1—Significant Accounting Policies:
Dreyfus Diversified International Fund (the “fund”) is a separate diversified series of Dreyfus Premier Investment Funds, Inc. (the “Company”), which is registered under the Investment Company Act of 1940, as amended (the “Act”), as an open-end management investment company and operates as a series company currently offering five series, including the fund. The fund’s investment objective is to seek long-term capital appreciation. The Dreyfus Corporation (the “Manager” or “Dreyfus”), a wholly-owned subsidiary of The Bank of New York Mellon Corporation (“BNY Mellon”), serves as the fund’s investment adviser.
Effective March 31, 2017, the fund authorized the issuance of Class T shares, but, as of the date of this report, the fund did not offer Class T shares for purchase. The fund authorized 100 million Class T shares which resulted in the fund’s total authorized shares increasing from 500 million to 600 million.
MBSC Securities Corporation (the “Distributor”), a wholly-owned subsidiary of Dreyfus, is the distributor of the fund’s shares. The fund is authorized to issue 600 million shares of $.001 par value Common Stock. The fund currently has authorized five classes of shares: Class A (150 million shares authorized), Class C (75 million shares authorized), Class I (75 million shares authorized), Class T (100 million shares authorized) and Class Y (200 million shares authorized). Class A and Class T shares generally are subject to a sales charge imposed at the time of purchase. Class C shares are subject to a contingent deferred sales charge (“CDSC”) imposed on Class C shares redeemed within one year of purchase. Class I and Class Y shares are sold at net asset value per share generally to institutional investors. Other differences between the classes include the services offered to and the expenses borne by each class, the allocation of certain transfer agency costs, and certain voting rights. Income, expenses (other than expenses attributable to a specific class), and realized and unrealized gains or losses on investments are allocated to each class of shares based on its relative net assets.
The Company accounts separately for the assets, liabilities and operations of each series. Expenses directly attributable to each series are charged to that series’ operations; expenses which are applicable to all series are allocated among them on a pro rata basis.
The Financial Accounting Standards Board (“FASB”) Accounting Standards Codification is the exclusive reference of authoritative U.S. generally accepted accounting principles (“GAAP”) recognized by the FASB to be applied by nongovernmental entities. Rules and interpretive
18
releases of the Securities and Exchange Commission (“SEC”) under authority of federal laws are also sources of authoritative GAAP for SEC registrants. The fund’s financial statements are prepared in accordance with GAAP, which may require the use of management estimates and assumptions. Actual results could differ from those estimates.
The Company enters into contracts that contain a variety of indemnifications. The fund’s maximum exposure under these arrangements is unknown. The fund does not anticipate recognizing any loss related to these arrangements.
(a) Portfolio valuation: The fair value of a financial instrument is the amount that would be received to sell an asset or paid to transfer a liability in an orderly transaction between market participants at the measurement date (i.e., the exit price). GAAP establishes a fair value hierarchy that prioritizes the inputs of valuation techniques used to measure fair value. This hierarchy gives the highest priority to unadjusted quoted prices in active markets for identical assets or liabilities (Level 1 measurements) and the lowest priority to unobservable inputs (Level 3 measurements).
Additionally, GAAP provides guidance on determining whether the volume and activity in a market has decreased significantly and whether such a decrease in activity results in transactions that are not orderly. GAAP requires enhanced disclosures around valuation inputs and techniques used during annual and interim periods.
Various inputs are used in determining the value of the fund’s investments relating to fair value measurements. These inputs are summarized in the three broad levels listed below:
Level 1—unadjusted quoted prices in active markets for identical investments.
Level 2—other significant observable inputs (including quoted prices for similar investments, interest rates, prepayment speeds, credit risk, etc.).
Level 3—significant unobservable inputs (including the fund’s own assumptions in determining the fair value of investments).
The inputs or methodology used for valuing securities are not necessarily an indication of the risk associated with investing in those securities.
Investments are valued at the net asset value of each underlying fund determined as of the close of the New York Stock Exchange (generally 4 p.m., Eastern time) on the valuation date and are generally categorized within Level 1 of the fair value hierarchy.
19
NOTES TO FINANCIAL STATEMENTS (continued)
The following is a summary of the inputs used as of October 31, 2017 in valuing the fund’s investments:
Level 1 - Unadjusted Quoted Prices | Level 2 - Other Significant Observable Inputs |
| Level 3 -Significant Unobservable Inputs | Total | |
Assets ($) | |||||
Investments in Securities: | |||||
Registered Investment Companies† | 872,876,793 | - | - | 872,876,793 | |
† See Statement of Investments for additional detailed categorizations.
At October 31, 2017, there were no transfers between levels of the fair value hierarchy. It is the fund’s policy to recognize transfers between levels at the end of the reporting period.
(b) Securities transactions and investment income: Securities transactions are recorded on a trade date basis. Realized gains and losses from securities transactions are recorded on the identified cost basis. Dividend income is recognized on the ex-dividend date and interest income, including, where applicable, accretion of discount and amortization of premium on investments, is recognized on the accrual basis.
(c) Affiliated issuers: Investments in other investment companies advised by Dreyfus are defined as “affiliated” under the Act.
(d) Dividends and distributions to shareholders: Dividends and distributions are recorded on the ex-dividend date. Dividends from investment income-net and dividends from net realized capital gains, if any, are normally declared and paid annually, but the fund may make distributions on a more frequent basis to comply with the distribution requirements of the Internal Revenue Code of 1986, as amended (the “Code”). To the extent that net realized capital gains can be offset by capital loss carryovers, it is the policy of the fund not to distribute such gains. Income and capital gain distributions are determined in accordance with income tax regulations, which may differ from GAAP.
(e) Federal income taxes: It is the policy of the fund to continue to qualify as a regulated investment company, if such qualification is in the best interests of its shareholders, by complying with the applicable provisions of the Code, and to make distributions of taxable income sufficient to relieve it from substantially all federal income and excise taxes.
As of and during the period ended October 31, 2017, the fund did not have any liabilities for any uncertain tax positions. The fund recognizes
20
interest and penalties, if any, related to uncertain tax positions as income tax expense in the Statement of Operations. During the period ended October 31, 2017, the fund did not incur any interest or penalties.
Each tax year in the four-year period ended October 31, 2017 remains subject to examination by the Internal Revenue Service and state taxing authorities.
At October 31, 2017, the components of accumulated earnings on a tax basis were as follows: accumulated capital losses $6,976,426 and unrealized appreciation $228,611,865. In addition, the fund deferred for tax purposes late year ordinary losses of $120,909 to the first day of the following fiscal year.
Under the Regulated Investment Company Modernization Act of 2010 (the “2010 Act”), the fund is permitted to carry forward capital losses incurred in taxable years beginning after December 22, 2010 (“post-enactment losses”) for an unlimited period. Furthermore, post-enactment capital loss carryovers retain their character as either short-term or long-term capital losses rather than short-term as they were under previous statute. The 2010 Act requires post-enactment losses to be utilized before the utilization of losses incurred in taxable years prior to the effective date of the 2010 Act (“pre-enactment losses”). As a result of this ordering rule, pre-enactment losses may be more likely to expire unused.
The accumulated capital loss carryover is available for federal income tax purposes to be applied against future net realized capital gains, if any, realized subsequent to October 31, 2017. If not applied, $415,833 of the carryover expires in fiscal year 2018 and $943,756 expires in fiscal 2019. The fund has $5,616,426 of post-enactment long-term capital losses which can be carried forward for an unlimited period.
The tax character of distributions paid to shareholders during the fiscal periods ended October 31, 2017 and October 31, 2016 were as follows: ordinary income $11,780,302 and $8,501,428, respectively.
NOTE 2—Bank Lines of Credit:
The fund participates with other Dreyfus-managed funds in an $830 million unsecured credit facility led by Citibank, N.A. and a $300 million unsecured credit facility provided by The Bank of New York Mellon, a subsidiary of BNY Mellon and an affiliate of Dreyfus (each, a “Facility”), each to be utilized primarily for temporary or emergency purposes, including the financing of redemptions. Prior to October 4, 2017, the unsecured credit facility with Citibank, N.A. was $810 million. In connection therewith, the fund has agreed to pay its pro rata portion of
21
NOTES TO FINANCIAL STATEMENTS (continued)
commitment fees for each Facility. Interest is charged to the fund based on rates determined pursuant to the terms of the respective Facility at the time of borrowing. During the period ended October 31, 2017, the fund did not borrow under the Facilities.
NOTE 3—Management Fee and Other Transactions with Affiliates:
(a) Pursuant to a management agreement with Dreyfus, there is no management fee paid to Dreyfus. The fund invests in other affiliated mutual funds advised by Dreyfus. All fees and expenses of the underlying funds are reflected in the underlying fund’s net asset value. Dreyfus has contractually agreed, from November 1, 2016 through March 1, 2018, to assume the expenses of the fund, so that the total annual fund and underlying fund (acquired funds) operating expenses of the classes (excluding Rule 12b-1 Distribution Plan fees, Shareholder Services Plan fees, taxes, interest expense, brokerage commissions, commitment fees on borrowings and extraordinary expenses) do not exceed 1.05% of the value of the fund’s average daily net assets. The reduction in expenses, pursuant to the undertaking, amounted to $173,645 during the period ended October 31, 2017.
During the period ended October 31, 2017, the Distributor retained $275 from commissions earned on sales of the fund’s Class A shares.
(b) Under the Distribution Plan adopted pursuant to Rule 12b-1 under the Act, Class C shares pay the Distributor for distributing its shares at an annual rate of .75% of the value of its average daily net assets. During the period ended October 31, 2017, Class C shares were charged $1,178 pursuant to the Distribution Plan.
(c) Under the Shareholder Services Plan, Class A and Class C shares pay the Distributor at an annual rate of .25% of the value of their average daily net assets for the provision of certain services. The services provided may include personal services relating to shareholder accounts, such as answering shareholder inquiries regarding the fund and providing reports and other information, and services related to the maintenance of shareholder accounts. The Distributor may make payments to Service Agents (securities dealers, financial institutions or other industry professionals) with respect to these services. The Distributor determines the amounts to be paid to Service Agents. During the period ended October 31, 2017, Class A and Class C shares were charged $18,468 and $393, respectively, pursuant to the Shareholder Services Plan.
The fund has arrangements with the transfer agent and the custodian whereby the fund may receive earnings credits when positive cash balances
22
are maintained, which are used to offset transfer agency and custody fees. For financial reporting purposes, the fund includes net earnings credits as an expense offset in the Statement of Operations.
The fund compensates Dreyfus Transfer, Inc., a wholly-owned subsidiary of Dreyfus, under a transfer agency agreement for providing transfer agency and cash management services for the fund. The majority of transfer agency fees are comprised of amounts paid on a per account basis, while cash management fees are related to fund subscriptions and redemptions. During the period ended October 31, 2017, the fund was charged $5,646 for transfer agency services and $281 for cash management services. These fees are included in Shareholder servicing costs in the Statement of Operations. Cash management fees were offset by earnings credits of $281.
The fund compensates The Bank of New York Mellon under a custody agreement for providing custodial services for the fund. These fees are determined based on net assets, geographic region and transaction activity. During the period ended October 31, 2017, the fund was charged $0 pursuant to the custody agreement.
During the period ended October 31, 2017, the fund was charged $8,979 for services performed by the Chief Compliance Officer and his staff.
The components of “Due from The Dreyfus Corporation and affiliates” in the Statement of Assets and Liabilities consist of: Distribution Plan fees $226, Shareholder Services Plan fees $1,602, custodian fees $457, Chief Compliance Officer fees $5,231 and transfer agency fees $1,688, which are offset against an expense reimbursement currently in effect in the amount of $14,127.
(d) Each Board member also serves as a Board member of other funds within the Dreyfus complex. Annual retainer fees and attendance fees are allocated to each fund based on net assets.
NOTE 4—Securities Transactions:
The aggregate amount of purchases and sales of investment securities, excluding short-term securities, during the period ended October 31, 2017, amounted to $100,301,190 and $207,955,748, respectively.
At October 31, 2017, the cost of investments for federal income tax purposes was $644,264,928; accordingly, accumulated net unrealized appreciation on investments was $228,611,865, consisting of gross unrealized appreciation.
23
REPORT OF INDEPENDENT REGISTERED
PUBLIC ACCOUNTING FIRM
Shareholders and Board of Directors
Dreyfus Diversified International Fund
We have audited the accompanying statement of assets and liabilities, including the statements of investments and investments in affiliated issuers, of Dreyfus Diversified International Fund (one of the series comprising Dreyfus Premier Investment Funds, Inc.) (the Fund) as of October 31, 2017, and the related statement of operations for the year then ended, the statement of changes in net assets for each of the two years in the period then ended, and the financial highlights for each of the periods indicated therein. These financial statements and financial highlights are the responsibility of the Fund’s management. Our responsibility is to express an opinion on these financial statements and financial highlights based on our audits.
We conducted our audits in accordance with the standards of the Public Company Accounting Oversight Board (United States). Those standards require that we plan and perform the audit to obtain reasonable assurance about whether the financial statements and financial highlights are free of material misstatement. We were not engaged to perform an audit of the Fund’s internal control over financial reporting. Our audits included consideration of internal control over financial reporting as a basis for designing audit procedures that are appropriate in the circumstances, but not for the purpose of expressing an opinion on the effectiveness of the Fund’s internal control over financial reporting. Accordingly, we express no such opinion. An audit also includes examining, on a test basis, evidence supporting the amounts and disclosures in the financial statements and financial highlights, assessing the accounting principles used and significant estimates made by management, and evaluating the overall financial statement presentation. Our procedures included confirmation of securities owned as of October 31, 2017 by correspondence with the custodian and others or by other appropriate auditing procedures where replies were not received. We believe that our audits provide a reasonable basis for our opinion.
In our opinion, the financial statements and financial highlights referred to above present fairly, in all material respects, the financial position of Dreyfus Diversified International Fund at October 31, 2017, the results of its operations for the year then ended, the changes in its net assets for each of the two years in the period then ended, and the financial highlights for each of the indicated periods in conformity with U.S. generally accepted accounting principles.

New York, New York
December 28, 2017
24
IMPORTANT TAX INFORMATION (Unaudited)
In accordance with federal tax law, the fund elects to provide each shareholder with their portion of the fund’s foreign taxes paid and the income sourced from foreign countries. Accordingly, the fund hereby reports the following information regarding its fiscal year ended October 31, 2017:
- the total amount of taxes paid to foreign countries was $1,910,990
- the total amount of income sourced from foreign countries was $12,150,196.
Where required by federal tax law rules, shareholders will receive notification of their proportionate share of foreign taxes paid and foreign sourced income for the 2017 calendar year with Form 1099-DIV which will be mailed in early 2018. For the fiscal year ended October 31, 2017, certain dividends paid by the fund may be subject to a maximum tax rate of 15%, as provided for by the Jobs and Growth Tax Relief Reconciliation Act of 2003. Of the distributions paid during the fiscal year, $11,780,302 represents the maximum amount that may be considered qualified dividend income. Also the fund hereby reports 100% of the ordinary dividends paid during the fiscal year ended October 31, 2017 as qualifying for the corporate dividends received deduction.
25
BOARD MEMBERS INFORMATION (Unaudited)
INDEPENDENT BOARD MEMBERS
Chairman of the Board (1995)
Principal Occupation During Past 5 Years:
· Corporate Director and Trustee (1995-present)
Other Public Company Board Memberships During Past 5 Years:
· CBIZ (formerly, Century Business Services, Inc.), a provider of outsourcing functions for small and medium size companies, Director (1997-present)
No. of Portfolios for which Board Member Serves: 126
———————
Peggy C. Davis (74)
Board Member (2012)
Principal Occupation During Past 5 Years:
· Shad Professor of Law, New York University School of Law (1983-present)
No. of Portfolios for which Board Member Serves: 45
———————
David P. Feldman (77)
Board Member (1991)
Principal Occupation During Past 5 Years:
· Corporate Director and Trustee (1985-present)
Other Public Company Board Memberships During Past 5 Years:
· BBH Mutual Funds Group (5 registered mutual funds), Director (1992-2014)
No. of Portfolios for which Board Member Serves: 31
———————
Joan Gulley (70)
Board Member (2017)
Principal Occupation During Past 5 Years:
· PNC Financial Services Group, Inc.(1993-2014)
· Executive Vice President and Chief Human Resources Officer and Executive Committee Member (2008-2014)
No. of Portfolios for which Board Member Serves: 52
———————
26
Ehud Houminer (77)
Board Member (2012)
Principal Occupation During Past 5 Years:
· Board of Overseers at the Columbia Business School, Columbia University (1992-present)
· Trustee, Ben Gurion University
Other Public Company Board Memberships During Past 5 Years:
· Avnet, Inc., an electronics distributor, Director (1993-2012)
No. of Portfolios for which Board Member Serves: 52
———————
Lynn Martin (77)
Board Member (1993)
Principal Occupation During Past 5 Years:
· President of The Martin Hall Group LLC, a human resources consulting firm (2005-2012)
Other Public Company Board Memberships During Past 5 Years:
· AT&T, Inc., a telecommunications company, Director (1999-2012)
· Ryder System, Inc., a supply chain and transportation management company, Director (1993-2012)
No. of Portfolios for which Board Member Serves: 31
———————
Robin A. Melvin (54)
Board Member (2011)
Principal Occupation During Past 5 Years:
· Co-chairman, Illinois Mentoring Partnership, non-profit organization dedicated to increasing the quantity and quality of mentoring services in Illinois; (2014-present; board member since 2013)
· Director, Boisi Family Foundation, a private family foundation that supports youth-serving organizations that promote the self sufficiency of youth from disadvantaged circumstances (1995-2012)
No. of Portfolios for which Board Member Serves: 98
———————
27
BOARD MEMBERS INFORMATION (Unaudited) (continued)
INDEPENDENT BOARD MEMBERS (continued)
Dr. Martin Peretz (78)
Board Member (2012)
Principal Occupation During Past 5 Years:
· Editor-in-Chief Emeritus of The New Republic Magazine (2011-2012) (previously,
Editor-in-Chief, 1974-2011)
· Lecturer at Harvard University (1969-2012)
No. of Portfolios for which Board Member Serves: 31
———————
Once elected all Board Members serve for an indefinite term, but achieve Emeritus status upon reaching age 80. The address of the Board Members and Officers is c/o The Dreyfus Corporation, 200 Park Avenue, New York, New York 10166. Additional information about the Board Members is available in the fund’s Statement of Additional Information which can be obtained from Dreyfus free of charge by calling this toll free number: 1-800-DREYFUS.
Daniel Rose, Emeritus Board Member
Philip L. Toia, Emeritus Board Member
Sander Vanocur, Emeritus Board Member
28
OFFICERS OF THE FUND (Unaudited)
BRADLEY J. SKAPYAK, President since January 2010.
Chief Operating Officer and a director of the Manager since June 2009, Chairman of Dreyfus Transfer, Inc., an affiliate of the Manager and the transfer agent of the funds, since May 2011 and Chief Executive Officer of MBSC Securities Corporation since August 2016. He is an officer of 62 investment companies (comprised of 126 portfolios) managed by the Manager. He is 58 years old and has been an employee of the Manager since February 1988.
BENNETT A. MACDOUGALL, Chief Legal Officer since October 2015.
Chief Legal Officer of the Manager and Associate General Counsel and Managing Director of BNY Mellon since June 2015; from June 2005 to June 2015, he served in various capacities with Deutsche Bank – Asset & Wealth Management Division, including as Director and Associate General Counsel, and Chief Legal Officer of Deutsche Investment Management Americas Inc. from June 2012 to May 2015. He is an officer of 63 investment companies (comprised of 151 portfolios) managed by the Manager. He is 46 years old and has been an employee of the Manager since June 2015.
JANETTE E. FARRAGHER, Vice President and Secretary since December 2011.
Associate General Counsel of BNY Mellon, and an officer of 63 investment companies (comprised of 151 portfolios) managed by the Manager. She is 54 years old and has been an employee of the Manager since February 1984.
JAMES BITETTO, Vice President and Assistant Secretary since August 2005.
Managing Counsel of BNY Mellon and Secretary of the Manager, and an officer of 63 investment companies (comprised of 151 portfolios) managed by the Manager. He is 51 years old and has been an employee of the Manager since December 1996.
JOSEPH M. CHIOFFI, Vice President and Assistant Secretary since August 2005.
Managing Counsel of BNY Mellon, and an officer of 63 investment companies (comprised of 151 portfolios) managed by the Manager. He is 55 years old and has been an employee of the Manager since June 2000.
MAUREEN E. KANE, Vice President and Assistant Secretary since April 2015.
Managing Counsel of BNY Mellon since July 2014; from October 2004 until July 2014, General Counsel, and from May 2009 until July 2014, Chief Compliance Officer of Century Capital Management. She is an officer of 63 investment companies (comprised of 151 portfolios) managed by the Manager. She is 55 years old and has been an employee of the Manager since July 2014.
SARAH S. KELLEHER, Vice President and Assistant Secretary since April 2014.
Senior Counsel of BNY Mellon since March 2013, from August 2005 to March 2013, Associate General Counsel of Third Avenue Management. She is an officer of 63 investment companies (comprised of 151 portfolios) managed by the Manager. She is 42 years old and has been an employee of the Manager since March 2013.
JEFF PRUSNOFSKY, Vice President and Assistant Secretary since August 2005.
Senior Managing Counsel of BNY Mellon, and an officer of 63 investment companies (comprised of 151 portfolios) managed by the Manager. He is 52 years old and has been an employee of the Manager since October 1990.
NATALYA ZELENSKY, Vice President and Assistant Secretary since March 2017.
Counsel and Vice President of BNY Mellon since May 2016; Attorney at Wildermuth Endowment Strategy Fund/Wildermuth Advisory, LLC from November 2015 until May 2016; Assistant General Counsel at RCS Advisory Services from July 2014 until November 2015; Associate at Sutherland, Asbill & Brennan from January 2013 until January 2014; Associate at K&L Gates from October 2011 until January 2013. She is an officer of 63 investment companies (comprised of 151 portfolios) managed by Dreyfus. She is 32 years old and has been an employee of the Manager since May 2016.
JAMES WINDELS, Treasurer since November 2001.
Director – Mutual Fund Accounting of the Manager, and an officer of 63 investment companies (comprised of 151 portfolios) managed by the Manager. He is 59 years old and has been an employee of the Manager since April 1985.
29
OFFICERS OF THE FUND (Unaudited) (continued)
RICHARD CASSARO, Assistant Treasurer since January 2008.
Senior Accounting Manager – Money Market and Municipal Bond Funds of the Manager, and an officer of 63 investment companies (comprised of 151 portfolios) managed by the Manager. He is 58 years old and has been an employee of the Manager since September 1982.
GAVIN C. REILLY, Assistant Treasurer since December 2005.
Tax Manager of the Investment Accounting and Support Department of the Manager, and an officer of 63 investment companies (comprised of 151 portfolios) managed by the Manager. He is 49 years old and has been an employee of the Manager since April 1991.
ROBERT S. ROBOL, Assistant Treasurer since August 2005.
Senior Accounting Manager – Dreyfus Financial Reporting of the Manager, and an officer of 63 investment companies (comprised of 151 portfolios) managed by the Manager. He is 53 years old and has been an employee of the Manager since October 1988.
ROBERT SALVIOLO, Assistant Treasurer since July 2007.
Senior Accounting Manager – Equity Funds of the Manager, and an officer of 63 investment companies (comprised of 151 portfolios) managed by the Manager. He is 50 years old and has been an employee of the Manager since June 1989.
ROBERT SVAGNA, Assistant Treasurer since December 2002.
Senior Accounting Manager – Fixed Income and Equity Funds of the Manager, and an officer of 63 investment companies (comprised of 151 portfolios) managed by the Manager. He is 50 years old and has been an employee of the Manager since November 1990.
JOSEPH W. CONNOLLY, Chief Compliance Officer since October 2004.
Chief Compliance Officer of the Manager and The Dreyfus Family of Funds (63 investment companies, comprised of 151 portfolios). He is 60 years old and has served in various capacities with the Manager since 1980, including manager of the firm’s Fund Accounting Department from 1997 through October 2001.
CARIDAD M. CAROSELLA, Anti-Money Laundering Compliance Officer since January 2016.
Anti-Money Laundering Compliance Officer of the Dreyfus Family of Funds and BNY Mellon Funds Trust since January 2016; from May 2015 to December 2015, Interim Anti-Money Laundering Compliance Officer of the Dreyfus Family of Funds and BNY Mellon Funds Trust and the Distributor; from January 2012 to May 2015, AML Surveillance Officer of the Distributor and from 2007 to December 2011, Financial Processing Manager of the Distributor. She is an officer of 57 investment companies (comprised of 145 portfolios) managed by the Manager. She is 49 years old and has been an employee of the Distributor since 1997.
30
NOTES
31
NOTES
32
NOTES
33
Dreyfus Diversified International Fund
200 Park Avenue
New York, NY 10166
Manager
The Dreyfus Corporation
200 Park Avenue
New York, NY 10166
Custodian
The Bank of New York Mellon
225 Liberty Street
New York, NY 10286
Transfer Agent &
Dividend Disbursing Agent
Dreyfus Transfer, Inc.
200 Park Avenue
New York, NY 10166
Distributor
MBSC Securities Corporation
200 Park Avenue
New York, NY 10166
Ticker Symbol: | Class A: DFPAX Class C: DFPCX Class I: DFPIX Class Y: DDIFX |
Telephone Call your financial representative or 1-800-DREYFUS
Mail The Dreyfus Family of Funds, 144 Glenn Curtiss Boulevard, Uniondale, NY 11556-0144
E-mail Send your request to info@dreyfus.com
Internet Information can be viewed online or downloaded at www.dreyfus.com
The fund files its complete schedule of portfolio holdings with the Securities and Exchange Commission (“SEC”) for the first and third quarters of each fiscal year on Form N-Q. The fund’s Forms N-Q are available on the SEC’s website at www.sec.gov and may be reviewed and copied at the SEC’s Public Reference Room in Washington, D.C. (phone 1-800-SEC-0330 for information).
A description of the policies and procedures that the fund uses to determine how to vote proxies relating to portfolio securities and information regarding how the fund voted these proxies for the most recent 12-month period ended June 30 is available at www.dreyfus.com and on the SEC’s website at www.sec.gov and without charge, upon request, by calling 1-800-DREYFUS.
© 2017 MBSC Securities Corporation |
|

Dreyfus Global Infrastructure Fund
| ANNUAL REPORT October 31, 2017 |

|

Save time. Save paper. View your next shareholder report online as soon as it’s available. Log into www.dreyfus.com and sign up for Dreyfus eCommunications. It’s simple and only takes a few minutes. |
The views expressed in this report reflect those of the portfolio manager(s) only through the end of the period covered and do not necessarily represent the views of Dreyfus or any other person in the Dreyfus organization. Any such views are subject to change at any time based upon market or other conditions and Dreyfus disclaims any responsibility to update such views. These views may not be relied on as investment advice and, because investment decisions for a Dreyfus fund are based on numerous factors, may not be relied on as an indication of trading intent on behalf of any Dreyfus fund. |
Not FDIC-Insured • Not Bank-Guaranteed • May Lose Value |
Contents
THE FUND
With Those of Other Funds | |
in Affiliated Issuers | |
Currency Exchange Contracts | |
Public Accounting Firm | |
of the Fund’s Sub-Investment Advisory | |
Agreement | |
FOR MORE INFORMATION
Back Cover
| The Fund |
A LETTER FROM THE CEO OF DREYFUS
Dear Shareholder:
We are pleased to present this annual report for Dreyfus Global Infrastructure Fund, covering the 12-month period from November 1, 2016 through October 31, 2017. For information about how the fund performed during the reporting period, as well as general market perspectives, we provide a Discussion of Fund Performance on the pages that follow.
Stocks set a series of new record highs and bonds produced mixed results over the past year in response to changing economic and political conditions. Financial markets at the start of the reporting period were dominated by the election of a new U.S. presidential administration. Equities and corporate-backed bonds surged higher in anticipation of more business-friendly regulatory, tax, and fiscal policies, but high-quality bonds generally lost value due to expectations of rising interest rates and accelerating inflation in a stronger economy. Despite a series of short-term interest-rate hikes, bonds recovered their previous losses over the first 10 months of 2017 when it became clearer that pro-growth legislation would take time and political capital to enact. U.S. and international stocks continued to rally as corporate earnings grew and global economic conditions improved.
The markets’ recent strong performance has been supported by solid underlying fundamentals. While we currently expect these favorable conditions to persist, we remain watchful for economic and political developments that could derail the markets. As always, we encourage you to discuss the risks and opportunities of today’s investment environment with your financial advisor.
Thank you for your continued confidence and support.
Sincerely,

Mark D. Santero
Chief Executive Officer
The Dreyfus Corporation
November 15, 2017
2
DISCUSSION OF FUND PERFORMANCE
For the period from November 1, 2016 through October 31, 2017, as provided by the fund’s primary portfolio manager, Theodore W. Brooks III, CFA, of CenterSquare Investment Management, Inc., Sub-Investment Adviser
Market and Fund Performance Overview
For the 12-month period ended October 31, 2017, Dreyfus Global Infrastructure Fund’s Class A shares produced a total return of 15.18%, Class C shares returned 14.26%, Class I shares returned 15.54%, and Class Y shares returned 15.54%.1 In comparison, the fund’s benchmark, the FTSE Developed Core Infrastructure 50/50 Index (the “Index”), produced a total return of 15.96% for the same period. The fund’s secondary benchmark, the MSCI World Index (net), produced a total return of 22.77% for the same period.2,3
Global stocks gained ground amid rising corporate earnings, improving economic conditions, and the potential for more stimulative government policies. The fund’s returns were roughly in line with those of the Index.
The Fund’s Investment Approach
The fund seeks to maximize total return consisting of capital appreciation and current income. To pursue its goal, the fund normally invests at least 80% of its net assets, plus any borrowings for investment purposes, in equity securities issued by companies located throughout the world that are engaged in infrastructure businesses.
In selecting investments, we combine top-down macroeconomic and sector research with a bottom-up process incorporating qualitative analysis and a proprietary relative valuation process. Our bottom-up research employs an active analysis process that includes regular and direct contact with the companies in the fund’s investable universe. Moreover, our proprietary relative valuation model seeks to identify undervalued securities relative to their peers. Our risk management process seeks to minimize unintended portfolio concentrations and ensure consistency of portfolio management style over time.
Moderate Growth Supported Infrastructure Stocks
Global equity markets were energized in late 2016 when investors began to anticipate lower U.S. corporate taxes, reduced regulatory constraints on business, and more stimulative fiscal policies from a new presidential administration. In 2017, better-than-expected corporate earnings, stabilizing commodity prices, and encouraging global economic developments drove broad measures of global stock market performance to new highs.
Infrastructure-related stocks benefited in this environment of economic and political change, which many investors expected to spur infrastructure investment in
3
DISCUSSION OF FUND PERFORMANCE (continued)
developed and emerging markets. Although the Federal Reserve Board began to back away from its aggressively accommodative monetary policy, and other central banks are expected to follow suit, gradual and well-telegraphed policy changes helped contain the rise in interest rates, lending further support to infrastructure stocks.
Australia and Japan Buoyed Fund Performance
The reporting period got off to a rocky start, as the fund was positioned for a continuation of a status-quo political climate in the United States. The widely unexpected election results changed the investment landscape, and some holdings lost value over the final two months of 2016.
We reconfigured the portfolio to reflect new political and economic realities, and the fund achieved better results in 2017. The fund fared especially well through favorable timing in purchases and sales of Australian/New Zealand infrastructure stocks, most notably toll roads operator Macquarie Atlas Roads Group and Auckland International Airport Limited. Results in Japan were bolstered by positions in a variety of transportation companies and utilities, including Kansai Electric Power.
From a market sector perspective, the fund achieved strong results in the telecommunication services sector, where cellphone tower company American Tower benefited from increased investment in mobile communications. The fund held underweighted exposure to Luxembourg-based satellite-company SES, which reported disappointing growth, and Australia’s Vocus Group, where profits declined. In the energy sector, U.S. pipeline developer Williams and Canada’s Pembina Pipeline advanced when oil and gas prices and production volumes recovered and stabilized. Among transportation-related companies, Fraport AG Frankfurt Airport Services Worldwide in Germany saw rapid traffic growth from low-cost airlines.
Disappointments during the reporting period included providers of renewable energy, such as wind and solar power company NextEra Energy, which fell out of favor after the 2016 U.S. election. In addition, the fund held overweighted exposure to electric utility PG&E, which struggled with devastating wildfires in Northern California later in the reporting period.
A More Selective Investment Posture
In the wake of the robust 2017 market rally, investors currently appear to be anticipating a continuation of upbeat economic conditions over the foreseeable future. However, tighter monetary policies in the United States and United Kingdom, and expectations of less accommodative monetary policies in Europe and Canada, could dampen economic growth in some markets. Therefore, we have adopted a more selective investment posture. We have emphasized North American midstream energy companies that appear likely to prosper amid more stable oil
4
prices, and we have identified opportunities among U.S. railroads that could benefit from tax reform legislation. In overseas markets, we have trimmed the fund’s holdings of European airports in favor of toll roads in countries with robust transportation-related construction activity.
November 15, 2017
1 Total return includes reinvestment of dividends and any capital gains paid, and does not take into consideration the maximum initial sales charge in the case of Class A shares, or the applicable contingent deferred sales charge imposed on redemptions in the case of Class C shares. Had these charges been reflected, returns would have been lower. Share price and investment return fluctuate such that upon redemption, fund shares may be worth more or less than their original cost. Return figures provided reflect the absorption of certain fund expenses by The Dreyfus Corporation pursuant to an undertaking in effect through March 1, 2018, at which time it may be extended, terminated, or modified. Had these expenses not been absorbed, the fund’s returns would have been lower. Past performance is no guarantee of future results.
2 Source: FactSet — Reflects reinvestment of net dividends and, where applicable, capital gain distributions. The FTSE Developed Core Infrastructure 50/50 Index is comprised of market capitalization-weighted infrastructure equities in developed and emerging markets. Companies are screened from the FTSE Global All Cap Index. Investors cannot invest directly in any index.
3 Source: Lipper Inc. — Reflects reinvestment of net dividends and, where applicable, capital gain distributions. The MSCI World Index is a free float-adjusted market capitalization-weighted index that is designed to measure the equity market performance of developed markets. Investors cannot invest directly in any index.
Please note: the position in any security highlighted with italicized typeface was sold during the reporting period.
Equities are subject generally to market, market sector, market liquidity, issuer, and investment style risks, among other factors, to varying degrees, all of which are more fully described in the fund’s prospectus.
The fund’s performance will be influenced by political, social, and economic factors affecting investments in foreign companies. Special risks associated with investments in foreign companies include exposure to currency fluctuations, less liquidity, less developed or less efficient trading markets, lack of comprehensive company information, political instability, and differing auditing and legal standards.
These risks are enhanced in emerging market countries. Investments in foreign currencies are subject to the risk that those currencies will decline in value relative to the U.S. dollar, or, in the case of hedged positions, that the U.S. dollar will decline relative to the currency being hedged. Each of these risks could increase the fund’s volatility.
Infrastructure investments will have greater exposure to adverse economic, regulatory, political, legal, and other changes affecting these companies. Companies engaged in infrastructure-related businesses are subject to a variety of factors that may adversely affect their business or operations, including: high amounts of leverage and high interest costs in connection with capital construction and improvement programs; difficulty in raising capital in adequate amounts on reasonable terms in periods of high inflation and unsettled capital markets; inexperience with and potential losses resulting from the deregulation of a particular industry or sector; costs associated with compliance with and changes in environmental and other regulations; regulation or intervention by various government authorities, including government regulation of rates charged to customers; the imposition of special tariffs and changes in tax laws, regulatory policies and accounting standards; service interruption and/or legal challenges due to environmental, operational or other accidents; susceptibility to terrorist attacks; surplus capacity; increased competition; technological innovations that may render existing plants, equipment or products obsolete; and general changes in market sentiment towards infrastructure assets. There is also the risk that corruption may negatively affect publicly funded infrastructure projects, especially in emerging markets, resulting in delays and cost overruns.
Emerging markets tend to be more volatile than the markets of more mature economies and generally have less diverse and less mature economic structures and less stable political systems than those of developed countries. The securities of companies located in emerging markets are often subject to rapid and large changes in price. An investment in this fund should be considered only as a supplement to a complete investment program for those investors willing to accept the greater risks associated with investing in emerging market countries.
In addition to the risks which are linked to the real estate sector in general, REITs are subject to additional risks. Equity REITs may be affected by changes in the value of the underlying property owned by the trust, while mortgage REITs may be affected by the quality of any credit extended. Further, REITs are highly dependent upon management skill and often are not diversified. REITs also are subject to heavy cash flow dependency and to defaults by borrowers or lessees.
Master Limited Partnerships (MLPs) are subject to certain risks, such as supply and demand risk, depletion and exploration risk, commodity pricing risk, acquisition risk, and the risk associated with the hazards inherent in midstream energy industry activities.
5
FUND PERFORMANCE
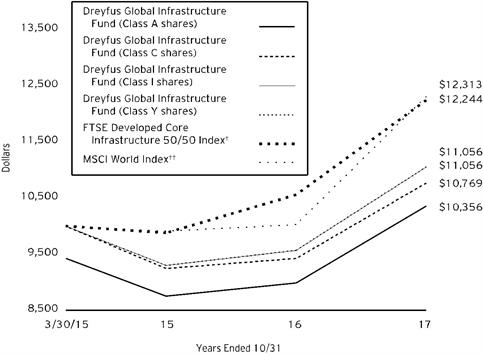
Comparison of change in value of $10,000 investment in Dreyfus Global Infrastructure Fund Class A shares, Class C shares, Class I shares and Class Y shares and the FTSE Developed Core Infrastructure 50/50 Index and MSCI World Index.
† Source: FactSet
†† Source: Lipper
Past performance is not predictive of future performance.
The above graph compares a $10,000 investment made in each of the Class A, Class C, Class I and Class Y shares of Dreyfus Global Infrastructure Fund on 3/30/15 (inception date) to a $10,000 investment made in the FTSE Developed Core Infrastructure 50/50 Index and MSCI World Index on that date. All dividends and capital gain distributions are reinvested.
The fund’s performance shown in the line graph above takes into account the maximum initial sales charge on Class A shares and all other applicable fees and expenses on all classes. The FTSE Developed Core Infrastructure 50/50 Index is comprised of market capitalization-weighted infrastructure equities in developed and emerging markets. Companies are screened from the FTSE Global All Cap Index. The MSCI World Index is a free float-adjusted market capitalization-weighted index that is designed to measure the equity market performance of developed markets. Unlike a mutual fund, the indices are not subject to charges, fees and other expenses. Investors cannot invest directly in any index. Further information relating to fund performance, including expense reimbursements, if applicable, is contained in the Financial Highlights section of the prospectus and elsewhere in this report.
6
Average Annual Total Returns as of 10/31/17 | ||||
| Inception | 1 Year | From | |
Class A shares | ||||
with maximum sales charge (5.75%) | 3/30/15 | 8.55% | 1.36% | |
without sales charge | 3/30/15 | 15.18% | 3.70% | |
Class C shares | ||||
with applicable redemption charge† | 3/30/15 | 13.26% | 2.90% | |
without redemption | 3/30/15 | 14.26% | 2.90% | |
Class I shares | 3/30/15 | 15.54% | 3.95% | |
Class Y shares | 3/30/15 | 15.54% | 3.95% | |
FTSE Developed Core | 3/31/15 | 15.96% | 8.15%†† | |
MSCI World Index | 3/31/15 | 22.77% | 7.98%†† | |
† The maximum contingent deferred sales charge for Class C shares is 1% for shares redeemed within one year of the date of purchase.
†† For comparative purposes, the value of the indices as of 3/31/15 is used as the beginning value on 3/30/15.
The performance data quoted represents past performance, which is no guarantee of future results. Share price and investment return fluctuate and an investor’s shares may be worth more or less than original cost upon redemption. Current performance may be lower or higher than the performance quoted. Go to Dreyfus.com for the fund’s most recent month-end returns.
The fund’s performance shown in the graph and table does not reflect the deduction of taxes that a shareholder would pay on fund distributions or the redemption of fund shares. In addition to the performance of Class A shares shown with and without a maximum sales charge, the fund’s performance shown in the table takes into account all other applicable fees and expenses on all classes.
7
UNDERSTANDING YOUR FUND’S EXPENSES (Unaudited)
As a mutual fund investor, you pay ongoing expenses, such as management fees and other expenses. Using the information below, you can estimate how these expenses affect your investment and compare them with the expenses of other funds. You also may pay one-time transaction expenses, including sales charges (loads) and redemption fees, which are not shown in this section and would have resulted in higher total expenses. For more information, see your fund’s prospectus or talk to your financial adviser.
Review your fund’s expenses
The table below shows the expenses you would have paid on a $1,000 investment in Dreyfus Global Infrastructure Fund from May 1, 2017 to October 31, 2017. It also shows how much a $1,000 investment would be worth at the close of the period, assuming actual returns and expenses.
Expenses and Value of a $1,000 Investment | ||||||||
assuming actual returns for the six months ended October 31, 2017 | ||||||||
Class A | Class C | Class I | Class Y | |||||
Expenses paid per $1,000† | $6.77 | $10.66 | $5.47 | $5.47 | ||||
Ending value (after expenses) | $1,066.10 | $1,062.10 | $1,067.70 | $1,067.70 | ||||
COMPARING YOUR FUND’S EXPENSES
WITH THOSE OF OTHER FUNDS (Unaudited)
Using the SEC’s method to compare expenses
The Securities and Exchange Commission (“SEC”) has established guidelines to help investors assess fund expenses. Per these guidelines, the table below shows your fund’s expenses based on a $1,000 investment, assuming a hypothetical 5% annualized return. You can use this information to compare the ongoing expenses (but not transaction expenses or total cost) of investing in the fund with those of other funds. All mutual fund shareholder reports will provide this information to help you make this comparison. Please note that you cannot use this information to estimate your actual ending account balance and expenses paid during the period.
Expenses and Value of a $1,000 Investment | ||||||||
assuming a hypothetical 5% annualized return for the six months ended October 31, 2017 | ||||||||
Class A | Class C | Class I | Class Y | |||||
Expenses paid per $1,000† | $6.61 | $10.41 | $5.35 | $5.35 | ||||
Ending value (after expenses) | $1,018.65 | $1,014.87 | $1,019.91 | $1,019.91 | ||||
† Expenses are equal to the fund’s annualized expense ratio of 1.30% for Class A, 2.05% for Class C, 1.05% for Class I and 1.05% for Class Y, multiplied by the average account value over the period, multiplied by 184/365 (to reflect the one-half year period).
8
STATEMENT OF INVESTMENTS
October 31, 2017
Description | Shares | Value ($) | |||||
Common Stocks - 98.7% | |||||||
Australia - 7.7% | |||||||
APA Group | 26,940 | 176,495 | |||||
Macquarie Atlas Roads Group | 78,642 | 358,725 | |||||
Sydney Airport | 97,350 | 529,744 | |||||
Transurban Group | 108,650 | 1,008,675 | |||||
2,073,639 | |||||||
Canada - 10.3% | |||||||
Canadian National Railway | 4,180 | 336,350 | |||||
Canadian Pacific Railway | 410 | 71,087 | |||||
Enbridge | 16,610 | 638,341 | |||||
Fortis | 8,110 | 298,664 | |||||
Inter Pipeline | 12,280 | 249,769 | |||||
Pembina Pipeline | 11,900 | 393,408 | |||||
TransCanada | 16,638 | 789,921 | |||||
2,777,540 | |||||||
France - 1.6% | |||||||
Aeroports de Paris | 1,760 | 296,449 | |||||
Eiffage | 1,290 | 134,773 | |||||
431,222 | |||||||
Germany - .5% | |||||||
Fraport Frankfurt Airport Services Worldwide | 1,520 | 144,231 | |||||
Hong Kong - 2.3% | |||||||
CK Infrastructure Holdings | 8,017 | 69,777 | |||||
CLP Holdings | 19,401 | 197,332 | |||||
Hong Kong & China Gas | 70,679 | 133,904 | |||||
Hopewell Highway Infrastructure | 72,018 | 44,680 | |||||
MTR | 8,160 | 47,278 | |||||
Power Assets Holdings | 16,701 | 144,716 | |||||
637,687 | |||||||
Italy - 7.3% | |||||||
Atlantia | 36,980 | 1,206,132 | |||||
Enel | 26,860 | 166,608 | |||||
Infrastrutture Wireless Italiane | 18,250 | a | 124,681 | ||||
Italgas | 38,038 | 222,207 | |||||
Snam | 31,070 | 158,738 | |||||
Terna Rete Elettrica Nazionale | 13,910 | 83,932 | |||||
1,962,298 | |||||||
Japan - 4.6% | |||||||
Chubu Electric Power | 9,300 | 119,169 | |||||
East Japan Railway | 3,400 | 328,024 | |||||
Kansai Electric Power | 7,300 | 99,351 | |||||
9
STATEMENT OF INVESTMENTS (continued)
Description | Shares | Value ($) | |||||
Common Stocks - 98.7% (continued) | |||||||
Japan - 4.6% (continued) | |||||||
Kyushu Electric Power | 17,700 | 200,809 | |||||
Okinawa Electric Power | 2,300 | 52,289 | |||||
Osaka Gas | 3,500 | 67,365 | |||||
Tokyo Electric Power Co. Holdings | 15,800 | b | 64,476 | ||||
Tokyo Gas | 6,800 | 168,677 | |||||
West Japan Railway | 2,000 | 140,240 | |||||
1,240,400 | |||||||
New Zealand - .4% | |||||||
Auckland International Airport | 28,540 | 121,671 | |||||
Singapore - .6% | |||||||
Hutchison Port Holdings Trust | 370,657 | 159,382 | |||||
South Korea - .5% | |||||||
Korea Electric Power | 2,930 | 102,518 | |||||
Korea Gas | 918 | b | 33,472 | ||||
135,990 | |||||||
Spain - 6.6% | |||||||
Abertis Infraestructuras | 41,680 | 901,591 | |||||
Aena SME | 3,620 | a | 664,139 | ||||
Cellnex Telecom | 4,030 | a | 100,060 | ||||
Red Electrica | 5,403 | 119,643 | |||||
1,785,433 | |||||||
Switzerland - .9% | |||||||
Flughafen Zurich | 1,160 | 252,313 | |||||
United Kingdom - 3.8% | |||||||
Centrica | 65,634 | 148,017 | |||||
Inmarsat | 14,040 | 115,799 | |||||
National Grid | 49,442 | 594,935 | |||||
Severn Trent | 5,758 | 161,438 | |||||
1,020,189 | |||||||
United States - 51.6% | |||||||
Alliant Energy | 5,014 | 216,906 | |||||
American Electric Power | 7,920 | 589,327 | |||||
American Tower | 10,330 | c | 1,484,111 | ||||
American Water Works | 3,251 | 285,308 | |||||
Aqua America | 2,330 | 82,668 | |||||
Atmos Energy | 2,850 | 248,634 | |||||
CMS Energy | 6,460 | 312,470 | |||||
Crown Castle International | 3,310 | c | 354,435 | ||||
CSX | 3,630 | 183,061 | |||||
Dominion Energy | 8,300 | 673,462 | |||||
DTE Energy | 3,547 | 391,802 | |||||
Duke Energy | 6,110 | 539,574 | |||||
Edison International | 2,380 | 190,281 | |||||
10
Description | Shares | Value ($) | |||||
Common Stocks - 98.7% (continued) | |||||||
United States - 51.6% (continued) | |||||||
Entergy | 5,020 | 433,025 | |||||
Exelon | 3,570 | 143,550 | |||||
Great Plains Energy | 6,889 | 226,166 | |||||
Kinder Morgan | 7,900 | 143,069 | |||||
Macquarie Infrastructure | 2,750 | 191,262 | |||||
NextEra Energy | 7,820 | 1,212,647 | |||||
NiSource | 4,252 | 112,125 | |||||
Norfolk Southern | 2,630 | 345,635 | |||||
ONEOK | 6,580 | 357,097 | |||||
PG&E | 8,239 | 475,967 | |||||
Pinnacle West Capital | 1,550 | 135,950 | |||||
PPL | 11,760 | 441,706 | |||||
Public Service Enterprise Group | 6,586 | 324,031 | |||||
SCANA | 834 | 35,979 | |||||
Sempra Energy | 6,170 | 724,975 | |||||
Southern | 16,103 | 840,577 | |||||
Union Pacific | 5,080 | 588,213 | |||||
Vectren | 1,110 | 75,635 | |||||
WEC Energy Group | 4,120 | 277,647 | |||||
Williams Cos. | 24,500 | 698,250 | |||||
Xcel Energy | 12,170 | 602,658 | |||||
13,938,203 | |||||||
Total Common Stocks (cost $23,847,439) | 26,680,198 | ||||||
Master Limited Partnerships - .5% | |||||||
United States - .5% | |||||||
Noble Midstream Partners LP | 2,700 | 140,022 | |||||
Other Investment - .7% | |||||||
Registered Investment Company; | |||||||
Dreyfus Institutional Preferred Government Plus Money Market Fund | 172,130 | d | 172,130 | ||||
Total Investments (cost $24,157,074) | 99.9% | 26,992,350 | |||||
Cash and Receivables (Net) | .1% | 35,092 | |||||
Net Assets | 100.0% | 27,027,442 | |||||
LP—Limited Partnership
a Security exempt from registration pursuant to Rule 144A under the Securities Act of 1933. These securities may be resold in transactions exempt from registration, normally to qualified institutional buyers. At October 31, 2017, these securities were valued at $888,880 or 3.29% of net assets.
b Non-income producing security.
c Investment in real estate investment trust.
d Investment in affiliated money market mutual fund.
11
STATEMENT OF INVESTMENTS (continued)
Portfolio Summary (Unaudited) † | Value (%) |
Transportation | 32.4 |
Electric | 28.6 |
Energy | 27.4 |
Specialty | 6.8 |
Infrastructure | 2.7 |
Telecommunications Services | 1.3 |
Money Market Investment | .7 |
99.9 |
† Based on net assets.
See notes to financial statements.
12
STATEMENT OF INVESTMENTS IN AFFILIATED ISSUERS
Registered Investment Company | Value | Purchases ($) | Sales ($) | Value | Net | Dividends/ |
Dreyfus Institutional Preferred Government Plus Money Market Fund | 190,059 | 7,339,818 | 7,357,747 | 172,130 | .7 | 1,382 |
See notes to financial statements.
13
STATEMENT OF FORWARD FOREIGN CURRENCY EXCHANGE CONTRACTS October 31, 2017
Counterparty/ Purchased | Purchased Currency | Currency | Sold | Settlement Date | Unrealized Appreciation ($) |
Northern Trust Bank | |||||
United States Dollar | 69,415 | Canadian Dollar | 89,500 | 11/1/17 | 40 |
United States Dollar | 3,016 | Swiss Franc | 3,000 | 11/1/17 | 9 |
United States Dollar | 2,444 | New Zealand Dollar | 3,564 | 11/1/17 | 5 |
Gross Unrealized Appreciation | 54 | ||||
See notes to financial statements.
14
STATEMENT OF ASSETS AND LIABILITIES
October 31, 2017
|
|
|
|
|
|
|
|
|
| Cost |
| Value |
|
Assets ($): |
|
|
|
| ||
Investments in securities—See Statement of Investments: |
|
|
| |||
Unaffiliated issuers | 23,984,944 |
| 26,820,220 |
| ||
Affiliated issuers |
| 172,130 |
| 172,130 |
| |
Cash denominated in foreign currency |
|
| 19,644 |
| 19,451 |
|
Receivable for investment securities sold |
| 106,225 |
| |||
Dividends receivable |
| 41,783 |
| |||
Unrealized appreciation on forward foreign |
| 54 |
| |||
Due from The Dreyfus Corporation and affiliates—Note 3(c) |
|
|
|
| 20,633 |
|
Prepaid expenses |
|
|
|
| 11,331 |
|
|
|
|
|
| 27,191,827 |
|
Liabilities ($): |
|
|
|
| ||
Payable for investment securities purchased |
| 109,875 |
| |||
Accrued expenses |
|
|
|
| 54,510 |
|
|
|
|
|
| 164,385 |
|
Net Assets ($) |
|
| 27,027,442 |
| ||
Composition of Net Assets ($): |
|
|
|
| ||
Paid-in capital |
|
|
|
| 25,598,739 |
|
Accumulated undistributed investment income—net |
| 221,983 |
| |||
Accumulated net realized gain (loss) on investments |
|
|
|
| (1,628,009) |
|
Accumulated net unrealized appreciation (depreciation) |
|
|
| 2,834,729 |
| |
Net Assets ($) |
|
| 27,027,442 |
| ||
Net Asset Value Per Share | Class A | Class C | Class I | Class Y |
|
Net Assets ($) | 4,639,910 | 1,056,435 | 10,703,034 | 10,628,063 |
|
Shares Outstanding | 351,871 | 80,324 | 812,274 | 806,602 |
|
Net Asset Value Per Share ($) | 13.19 | 13.15 | 13.18 | 13.18 |
|
See notes to financial statements. |
15
STATEMENT OF OPERATIONS
Year Ended October 31, 2017
|
|
|
|
|
|
|
|
|
|
|
|
|
|
Investment Income ($): |
|
|
|
| ||
Income: |
|
|
|
| ||
Cash dividends (net of $47,162 foreign taxes withheld at source): |
| |||||
Unaffiliated issuers |
|
| 876,889 |
| ||
Affiliated issuers |
|
| 1,382 |
| ||
Total Income |
|
| 878,271 |
| ||
Expenses: |
|
|
|
| ||
Management fee—Note 3(a) |
|
| 227,998 |
| ||
Professional fees |
|
| 71,951 |
| ||
Registration fees |
|
| 55,079 |
| ||
Directors’ fees and expenses—Note 3(d) |
|
| 51,305 |
| ||
Custodian fees—Note 3(c) |
|
| 17,464 |
| ||
Shareholder servicing costs—Note 3(c) |
|
| 14,608 |
| ||
Distribution fees—Note 3(b) |
|
| 7,389 |
| ||
Prospectus and shareholders’ reports |
|
| 6,591 |
| ||
Loan commitment fees—Note 2 |
|
| 567 |
| ||
Miscellaneous |
|
| 28,355 |
| ||
Total Expenses |
|
| 481,307 |
| ||
Less—reduction in expenses due to undertaking—Note 3(a) |
|
| (195,141) |
| ||
Less—reduction in fees due to earnings credits—Note 3(c) |
|
| (29) |
| ||
Net Expenses |
|
| 286,137 |
| ||
Investment Income—Net |
|
| 592,134 |
| ||
Realized and Unrealized Gain (Loss) on Investments—Note 4 ($): |
|
| ||||
Net realized gain (loss) on investments and foreign currency transactions | 675,490 |
| ||||
Net realized gain (loss) on forward foreign currency exchange contracts | (7,132) |
| ||||
Net Realized Gain (Loss) |
|
| 668,358 |
| ||
Net unrealized appreciation (depreciation) on investments |
|
| 2,388,979 |
| ||
Net unrealized appreciation (depreciation) on |
|
| 54 |
| ||
Net Unrealized Appreciation (Depreciation) |
|
| 2,389,033 |
| ||
Net Realized and Unrealized Gain (Loss) on Investments |
|
| 3,057,391 |
| ||
Net Increase in Net Assets Resulting from Operations |
| 3,649,525 |
| |||
See notes to financial statements. | ||||||
16
STATEMENT OF CHANGES IN NET ASSETS
|
|
|
| Year Ended October 31, | |||||
|
|
|
| 2017 |
| 2016 |
| ||
Operations ($): |
|
|
|
|
|
|
|
| |
Investment income—net |
|
| 592,134 |
|
|
| 409,546 |
| |
Net realized gain (loss) on investments |
| 668,358 |
|
|
| (1,529,946) |
| ||
Net unrealized appreciation (depreciation) |
| 2,389,033 |
|
|
| 1,767,721 |
| ||
Net Increase (Decrease) in Net Assets | 3,649,525 |
|
|
| 647,321 |
| |||
Distributions to Shareholders from ($): |
| ||||||||
Investment income—net: |
|
|
|
|
|
|
|
| |
Class A |
|
| (66,648) |
|
|
| (77,972) |
| |
Class C |
|
| (6,320) |
|
|
| (12,352) |
| |
Class I |
|
| (200,103) |
|
|
| (186,796) |
| |
Class Y |
|
| (197,214) |
|
|
| (185,624) |
| |
Total Distributions |
|
| (470,285) |
|
|
| (462,744) |
| |
Capital Stock Transactions ($): |
| ||||||||
Net proceeds from shares sold: |
|
|
|
|
|
|
|
| |
Class A |
|
| 111,085 |
|
|
| 133,161 |
| |
Class C |
|
| 4,297 |
|
|
| - |
| |
Class I |
|
| 434,496 |
|
|
| - |
| |
Class Y |
|
| - |
|
|
| 75,000 |
| |
Distributions reinvested: |
|
|
|
|
|
|
|
| |
Class A |
|
| 6,104 |
|
|
| 10,101 |
| |
Class I |
|
| 4,503 |
|
|
| 1,436 |
| |
Cost of shares redeemed: |
|
|
|
|
|
|
|
| |
Class A |
|
| (91,752) |
|
|
| (351,722) |
| |
Class I |
|
| (330,697) |
|
|
| (55,700) |
| |
Increase (Decrease) in Net Assets | 138,036 |
|
|
| (187,724) |
| |||
Total Increase (Decrease) in Net Assets | 3,317,276 |
|
|
| (3,147) |
| |||
Net Assets ($): |
| ||||||||
Beginning of Period |
|
| 23,710,166 |
|
|
| 23,713,313 |
| |
End of Period |
|
| 27,027,442 |
|
|
| 23,710,166 |
| |
Undistributed investment income—net | 221,983 |
|
|
| 76,168 |
| |||
Capital Share Transactions (Shares): |
| ||||||||
Class A |
|
|
|
|
|
|
|
| |
Shares sold |
|
| 9,288 |
|
|
| 11,825 |
| |
Shares issued for distributions reinvested |
|
| 497 |
|
|
| 920 |
| |
Shares redeemed |
|
| (7,097) |
|
|
| (30,841) |
| |
Net Increase (Decrease) in Shares Outstanding | 2,688 |
|
|
| (18,096) |
| |||
Class C |
|
|
|
|
|
|
|
| |
Shares sold |
|
| 324 |
|
|
| - |
| |
Net Increase (Decrease) in Shares Outstanding | 324 |
|
|
| - |
| |||
Class I |
|
|
|
|
|
|
|
| |
Shares sold |
|
| 35,572 |
|
|
| - |
| |
Shares issued for distributions reinvested |
|
| 355 |
|
|
| 130 |
| |
Shares redeemed |
|
| (25,154) |
|
|
| (4,799) |
| |
Net Increase (Decrease) in Shares Outstanding | 10,773 |
|
|
| (4,669) |
| |||
Class Y |
|
|
|
|
|
|
|
| |
Shares sold |
|
| - |
|
|
| 6,602 |
| |
Net Increase (Decrease) in Shares Outstanding | - |
|
|
| 6,602 |
| |||
See notes to financial statements. | |||||||||
17
FINANCIAL HIGHLIGHTS
The following tables describe the performance for each share class for the fiscal periods indicated. All information (except portfolio turnover rate) reflects financial results for a single fund share. Total return shows how much your investment in the fund would have increased (or decreased) during each period, assuming you had reinvested all dividends and distributions. These figures have been derived from the fund’s financial statements.
Class A Shares | Year Ended October 31, | |||||
2017 | 2016 | 2015 | a | |||
Per Share Data ($): | ||||||
Net asset value, beginning of period | 11.63 | 11.54 | 12.50 | |||
Investment Operations: | ||||||
Investment income—netb | .27 | .18 | .11 | |||
Net realized and unrealized | 1.48 | .12 | (1.00) | |||
Total from Investment Operations | 1.75 | .30 | (.89) | |||
Distributions: | ||||||
Dividends from | (.19) | (.21) | (.07) | |||
Net asset value, end of period | 13.19 | 11.63 | 11.54 | |||
Total Return (%)c | 15.18 | 2.73 | (7.16) | d | ||
Ratios/Supplemental Data (%): | ||||||
Ratio of total expenses | 2.08 | 2.08 | 2.33 | e | ||
Ratio of net expenses | 1.30 | 1.30 | 1.30 | e | ||
Ratio of net investment income | 2.17 | 1.60 | 1.58 | e | ||
Portfolio Turnover Rate | 152.70 | 90.93 | 29.07 | d | ||
Net Assets, end of period ($ x 1,000) | 4,640 | 4,060 | 4,240 | |||
a From March 30, 2015 (commencement of operations) to October 31, 2015.
b Based on average shares outstanding.
c Exclusive of sales charge.
d Not annualized.
e Annualized.
See notes to financial statements.
18
Class C Shares | Year Ended October 31, | |||||
2017 | 2016 | 2015 | a | |||
Per Share Data ($): | ||||||
Net asset value, beginning of period | 11.58 | 11.52 | 12.50 | |||
Investment Operations: | ||||||
Investment income—netb | .17 | .10 | .06 | |||
Net realized and unrealized | 1.48 | .11 | (1.00) | |||
Total from Investment Operations | 1.65 | .21 | (.94) | |||
Distributions: | ||||||
Dividends from | (.08) | (.15) | (.04) | |||
Net asset value, end of period | 13.15 | 11.58 | 11.52 | |||
Total Return (%)c | 14.26 | 1.96 | (7.56) | d | ||
Ratios/Supplemental Data (%): | ||||||
Ratio of total expenses | 2.82 | 2.81 | 3.09 | e | ||
Ratio of net expenses | 2.05 | 2.05 | 2.05 | e | ||
Ratio of net investment income | 1.42 | .85 | .82 | e | ||
Portfolio Turnover Rate | 152.70 | 90.93 | 29.07 | d | ||
Net Assets, end of period ($ x 1,000) | 1,056 | 926 | 922 | |||
a From March 30, 2015 (commencement of operations) to October 31, 2015.
b Based on average shares outstanding.
c Exclusive of sales charge.
d Not annualized.
e Annualized.
See notes to financial statements.
19
FINANCIAL HIGHLIGHTS (continued)
Class I Shares | Year Ended October 31, | |||||
2017 | 2016 | 2015 | a | |||
Per Share Data ($): | ||||||
Net asset value, beginning of period | 11.64 | 11.55 | 12.50 | |||
Investment Operations: | ||||||
Investment income—netb | .30 | .21 | .13 | |||
Net realized and unrealized | 1.48 | .11 | (1.00) | |||
Total from Investment Operations | 1.78 | .32 | (.87) | |||
Distributions: | ||||||
Dividends from | (.24) | (.23) | (.08) | |||
Net asset value, end of period | 13.18 | 11.64 | 11.55 | |||
Total Return (%) | 15.54 | 2.90 | (7.00) | c | ||
Ratios/Supplemental Data (%): | ||||||
Ratio of total expenses | 1.82 | 1.81 | 2.08 | d | ||
Ratio of net expenses | 1.05 | 1.05 | 1.05 | d | ||
Ratio of net investment income | 2.42 | 1.85 | 1.82 | d | ||
Portfolio Turnover Rate | 152.70 | 90.93 | 29.07 | c | ||
Net Assets, end of period ($ x 1,000) | 10,703 | 9,332 | 9,312 | |||
a From March 30, 2015 (commencement of operations) to October 31, 2015.
b Based on average shares outstanding.
c Not annualized.
d Annualized.
See notes to financial statements.
20
Class Y Shares | Year Ended October 31, | |||||
2017 | 2016 | 2015 | a | |||
Per Share Data ($): | ||||||
Net asset value, beginning of period | 11.64 | 11.55 | 12.50 | |||
Investment Operations: | ||||||
Investment income—netb | .30 | .21 | .13 | |||
Net realized and unrealized | 1.48 | .11 | (1.00) | |||
Total from Investment Operations | 1.78 | .32 | (.87) | |||
Distributions: | ||||||
Dividends from | (.24) | (.23) | (.08) | |||
Net asset value, end of period | 13.18 | 11.64 | 11.55 | |||
Total Return (%) | 15.54 | 2.90 | (7.00) | c | ||
Ratios/Supplemental Data (%): | ||||||
Ratio of total expenses | 1.81 | 1.81 | 2.08 | d | ||
Ratio of net expenses | 1.05 | 1.05 | 1.05 | d | ||
Ratio of net investment income | 2.42 | 1.85 | 1.82 | d | ||
Portfolio Turnover Rate | 152.70 | 90.93 | 29.07 | c | ||
Net Assets, end of period ($ x 1,000) | 10,628 | 9,392 | 9,240 | |||
a From March 30, 2015 (commencement of operations) to October 31, 2015.
b Based on average shares outstanding.
c Not annualized.
d Annualized.
See notes to financial statements.
21
NOTES TO FINANCIAL STATEMENTS
NOTE 1—Significant Accounting Policies:
Dreyfus Global Infrastructure Fund (the “fund”) is a separate diversified series of Dreyfus Premier Investment Funds, Inc. (the “Company”), which is registered under the Investment Company Act of 1940, as amended (the “Act”), as an open-end management investment company and operates as a series company currently offering five series, including the fund. The fund’s investment objective is to seek to maximize total return consisting of capital appreciation and current income. The Dreyfus Corporation (the “Manager” or “Dreyfus”), a wholly-owned subsidiary of The Bank of New York Mellon Corporation (“BNY Mellon”), serves as the fund’s investment adviser. CenterSquare Investment Management, Inc. (“CenterSquare”), a wholly-owned subsidiary of BNY Mellon and an affiliate of Dreyfus, serves as the fund’s sub-investment adviser.
Effective March 31, 2017, the fund authorized the issuance of Class T shares, but, as of the date of this report, the fund did not offer Class T shares for purchase. The fund authorized 100 million Class T shares which resulted in the fund’s total authorized shares increasing from 400 million to 500 million.
MBSC Securities Corporation (the “Distributor”), a wholly-owned subsidiary of Dreyfus, is the distributor of the fund’s shares. The fund is authorized to issue 100 million shares of $.001 par value Common Stock in each of the following classes of shares: Class A, Class C, Class I, Class T and Class Y. Class A and Class T shares generally are subject to a sales charge imposed at the time of purchase. Class C shares are subject to a contingent deferred sales charge (“CDSC”) imposed on Class C shares redeemed within one year of purchase. Class I and Class Y shares are sold at net asset value per share generally to institutional investors. Other differences between the classes include the services offered to and the expenses borne by each class, the allocation of certain transfer agency costs, and certain voting rights. Income, expenses (other than expenses attributable to a specific class), and realized and unrealized gains or losses on investments are allocated to each class of shares based on its relative net assets.
As of October 31, 2017, MBC Investments Corp., an indirect subsidiary of BNY Mellon, held 320,000 Class A, 80,000 Class C, 800,000 Class I and 800,000 Class Y shares of the fund.
The Company accounts separately for the assets, liabilities and operations of each series. Expenses directly attributable to each series are charged to
22
that series’ operations; expenses which are applicable to all series are allocated among them on a pro rata basis.
The Financial Accounting Standards Board (“FASB”) Accounting Standards Codification (“ASC”) is the exclusive reference of authoritative U.S. generally accepted accounting principles (“GAAP”) recognized by the FASB to be applied by nongovernmental entities. Rules and interpretive releases of the Securities and Exchange Commission (“SEC”) under authority of federal laws are also sources of authoritative GAAP for SEC registrants. The fund’s financial statements are prepared in accordance with GAAP, which may require the use of management estimates and assumptions. Actual results could differ from those estimates.
The Company enters into contracts that contain a variety of indemnifications. The fund’s maximum exposure under these arrangements is unknown. The fund does not anticipate recognizing any loss related to these arrangements.
(a) Portfolio valuation: The fair value of a financial instrument is the amount that would be received to sell an asset or paid to transfer a liability in an orderly transaction between market participants at the measurement date (i.e., the exit price). GAAP establishes a fair value hierarchy that prioritizes the inputs of valuation techniques used to measure fair value. This hierarchy gives the highest priority to unadjusted quoted prices in active markets for identical assets or liabilities (Level 1 measurements) and the lowest priority to unobservable inputs (Level 3 measurements).
Additionally, GAAP provides guidance on determining whether the volume and activity in a market has decreased significantly and whether such a decrease in activity results in transactions that are not orderly. GAAP requires enhanced disclosures around valuation inputs and techniques used during annual and interim periods.
Various inputs are used in determining the value of the fund’s investments relating to fair value measurements. These inputs are summarized in the three broad levels listed below:
Level 1—unadjusted quoted prices in active markets for identical investments.
Level 2—other significant observable inputs (including quoted prices for similar investments, interest rates, prepayment speeds, credit risk, etc.).
Level 3—significant unobservable inputs (including the fund’s own assumptions in determining the fair value of investments).
23
NOTES TO FINANCIAL STATEMENTS (continued)
The inputs or methodology used for valuing securities are not necessarily an indication of the risk associated with investing in those securities.
Changes in valuation techniques may result in transfers in or out of an assigned level within the disclosure hierarchy. Valuation techniques used to value the fund’s investments are as follows:
Investments in securities are valued at the last sales price on the securities exchange or national securities market on which such securities are primarily traded. Securities listed on the National Market System for which market quotations are available are valued at the official closing price or, if there is no official closing price that day, at the last sales price. For open short positions, asked prices are used for valuation purposes. Bid price is used when no asked price is available. Registered investment companies that are not traded on an exchange are valued at their net asset value. All of the preceding securities are generally categorized within Level 1 of the fair value hierarchy.
Securities not listed on an exchange or the national securities market, or securities for which there were no transactions, are valued at the average of the most recent bid and asked prices. These securities are generally categorized within Level 2 of the fair value hierarchy.
Fair valuing of securities may be determined with the assistance of a pricing service using calculations based on indices of domestic securities and other appropriate indicators, such as prices of relevant American Depository Receipts and futures. Utilizing these techniques may result in transfers between Level 1 and Level 2 of the fair value hierarchy.
When market quotations or official closing prices are not readily available, or are determined to not accurately reflect fair value, such as when the value of a security has been significantly affected by events after the close of the exchange or market on which the security is principally traded (for example, a foreign exchange or market), but before the fund calculates its net asset value, the fund may value these investments at fair value as determined in accordance with the procedures approved by the Company’s Board of Directors (the “Board”). Certain factors may be considered when fair valuing investments such as: fundamental analytical data, the nature and duration of restrictions on disposition, an evaluation of the forces that influence the market in which the securities are purchased and sold, and public trading in similar securities of the issuer or comparable issuers. These securities are either categorized within Level 2 or 3 of the fair value hierarchy depending on the relevant inputs used.
24
For restricted securities where observable inputs are limited, assumptions about market activity and risk are used and are generally categorized within Level 3 of the fair value hierarchy.
Investments denominated in foreign currencies are translated to U.S. dollars at the prevailing rates of exchange.
Forward foreign currency exchange contracts (“forward contracts”) are valued at the forward rate and are generally categorized within Level 2 of the fair value hierarchy.
The following is a summary of the inputs used as of October 31, 2017 in valuing the fund’s investments:
Level 1 - Unadjusted Quoted Prices | Level 2 - Other Significant Observable Inputs | Level 3 - Significant Unobservable Inputs | Total | ||
Assets ($) | |||||
Investments in Securities: | |||||
Equity Securities - Domestic Common Stocks | 13,938,203 | - | - | 13,938,203 | |
Equity Securities - Foreign Common Stocks | 12,741,995 | - | - | 12,741,995 | |
Master Limited Partnerships | 140,022 | - | - | 140,022 | |
Registered Investment Company | 172,130 | - | - | 172,130 | |
Other Financial Instruments: | |||||
Forward Foreign Currency | - | 54 | - | 54 | |
† Amount shown represents unrealized appreciation at period end.
At October 31, 2017, there were no transfers between levels of the fair value hierarchy. It is the fund’s policy to recognize transfers between levels at the end of the reporting period.
(b) Foreign currency transactions: The fund does not isolate that portion of the results of operations resulting from changes in foreign exchange rates on investments from the fluctuations arising from changes in the market prices of securities held. Such fluctuations are included with the net realized and unrealized gain or loss on investments.
Net realized foreign exchange gains or losses arise from sales of foreign currencies, currency gains or losses realized on securities transactions between trade and settlement date, and the difference between the amounts of dividends, interest and foreign withholding taxes recorded on the fund’s books and the U.S. dollar equivalent of the amounts actually received or paid. Net unrealized foreign exchange gains and losses arise
25
NOTES TO FINANCIAL STATEMENTS (continued)
from changes in the value of assets and liabilities other than investments resulting from changes in exchange rates. Foreign currency gains and losses on foreign currency transactions are also included with net realized and unrealized gain or loss on investments.
(c) Securities transactions and investment income: Securities transactions are recorded on a trade date basis. Realized gains and losses from securities transactions are recorded on the identified cost basis. Dividend income is recognized on the ex-dividend date and interest income, including, where applicable, accretion of discount and amortization of premium on investments, is recognized on the accrual basis.
(d) Affiliated issuers: Investments in other investment companies advised by Dreyfus are defined as “affiliated” under the Act.
(e) Risk: Investing in foreign markets may involve special risks and considerations not typically associated with investing in the U.S. These risks include revaluation of currencies, high rates of inflation, repatriation restrictions on income and capital, and adverse political and economic developments. Moreover, securities issued in these markets may be less liquid, subject to government ownership controls and delayed settlements, and their prices may be more volatile than those of comparable securities in the U.S.
(f) Dividends and distributions to shareholders: Dividends and distributions are recorded on the ex-dividend date. Dividends from investment income-net are normally declared and paid quarterly. Dividends from net realized capital gains, if any, are normally declared and paid annually, but the fund may make distributions on a more frequent basis to comply with the distribution requirements of the Internal Revenue Code of 1986, as amended (the “Code”). To the extent that net realized capital gains can be offset by capital loss carryovers, it is the policy of the fund not to distribute such gains. Income and capital gain distributions are determined in accordance with income tax regulations, which may differ from GAAP.
On October 31, 2017, the Board declared a cash dividend of $.046, $.021, $.054 and $.054 per share from undistributed investment income-net for Class A, Class C, Class I and Class Y shares, respectively, payable on November 1, 2017 (ex-dividend date), to shareholders of record as of the close of business on October 31, 2017.
(g) Federal income taxes: It is the policy of the fund to continue to qualify as a regulated investment company, if such qualification is in the best interests of its shareholders, by complying with the applicable
26
provisions of the Code, and to make distributions of taxable income sufficient to relieve it from substantially all federal income and excise taxes.
As of and during the period ended October 31, 2017, the fund did not have any liabilities for any uncertain tax positions. The fund recognizes interest and penalties, if any, related to uncertain tax positions as income tax expense in the Statement of Operations. During the period ended October 31, 2017, the fund did not incur any interest or penalties.
Each tax year in the three-year period ended October 31, 2017 remains subject to examination by the Internal Revenue Service and state taxing authorities.
At October 31, 2017, the components of accumulated earnings on a tax basis were as follows: undistributed ordinary income $221,983, accumulated capital losses $1,223,975 and unrealized appreciation $2,430,695.
Under the Regulated Investment Company Modernization Act of 2010, the fund is permitted to carry forward capital losses for an unlimited period. Furthermore, capital loss carryovers retain their character as either short-term or long-term capital losses.
The accumulated capital loss carryover is available for federal income tax purposes to be applied against future net realized capital gains, if any, realized subsequent to October 31, 2017. The fund has $1,037,154 of short-term capital losses and $186,821 of long-term capital losses which can be carried forward for an unlimited period.
The tax character of distributions paid to shareholders during the fiscal period ended October 31, 2017 and October 31, 2016 were as follows: ordinary income $470,285 and $462,744, respectively.
During the period ended October 31, 2017, as a result of permanent book to tax differences, primarily due to the tax treatment for limited partnerships and foreign currency gains and losses, the fund increased accumulated undistributed investment income-net by $23,966 and decreased accumulated net realized gain (loss) on investments by the same amount. Net assets and net asset value per share were not affected by this reclassification.
NOTE 2—Bank Lines of Credit:
The fund participates with other Dreyfus-managed funds in an $830 million unsecured credit facility led by Citibank, N.A. and a $300 million unsecured credit facility provided by The Bank of New York Mellon, a subsidiary of BNY Mellon and an affiliate of Dreyfus (each, a “Facility”),
27
NOTES TO FINANCIAL STATEMENTS (continued)
each to be utilized primarily for temporary or emergency purposes, including the financing of redemptions. Prior to October 4, 2017, the unsecured credit facility with Citibank, N.A. was $810 million. In connection therewith, the fund has agreed to pay its pro rata portion of commitment fees for each Facility. Interest is charged to the fund based on rates determined pursuant to the terms of the respective Facility at the time of borrowing. During the period ended October 31, 2017, the fund did not borrow under the Facilities.
NOTE 3—Management Fee, Sub-Investment Advisory Fee and Other Transactions with Affiliates:
(a) Pursuant to a management agreement with Dreyfus, the management fee is computed at the annual rate of .90% of the value of the fund’s average daily net assets and is payable monthly. Dreyfus has contractually agreed, from November 1, 2016 through March 1, 2018, to waive receipt of its fees and/or assume the expenses of the fund, so that the direct expenses of Class A, C, I and Y shares of the fund (excluding Rule 12b-1 Distribution Plan fees, Shareholder Services Plan fees, taxes, interest expense, brokerage commissions, commitment fees on borrowings and extraordinary expenses) do not exceed 1.05% of the value of the fund’s average daily net assets. The reduction in expenses, pursuant to the undertaking, amounted to $195,141 during the period ended October 31, 2017.
Pursuant to a sub-investment advisory agreement between Dreyfus and CenterSquare, CenterSquare serves as the fund’s sub-investment adviser responsible for the day-to-day management of the fund’s portfolio. Dreyfus pays the sub-investment adviser a monthly fee at an annual percentage of the value of the fund’s average daily net assets. Dreyfus has obtained an exemptive order from the SEC (the “Order”), upon which the fund may rely, to use a manager of managers approach that permits Dreyfus, subject to certain conditions and approval by the Board, to enter into and materially amend sub-investment advisory agreements with one or more sub-investment advisers who are either unaffiliated with Dreyfus or are wholly-owned subsidiaries (as defined under the Act) of Dreyfus’ ultimate parent company, BNY Mellon, without obtaining shareholder approval. The Order also allows the fund to disclose the sub-investment advisory fee paid by Dreyfus to any unaffiliated sub-investment adviser in the aggregate with other unaffiliated sub-investment advisers in documents filed with the SEC and provided to shareholders. In addition, pursuant to the Order, it is not necessary to disclose the sub-investment advisory fee payable by Dreyfus separately to a sub-investment adviser that is a wholly-owned subsidiary of BNY Mellon in documents filed with the SEC and
28
provided to shareholders; such fees are to be aggregated with fees payable to Dreyfus. Dreyfus has ultimate responsibility (subject to oversight by the Board) to supervise any sub-investment adviser and recommend the hiring, termination, and replacement of any sub-investment adviser to the Board.
(b) Under the Distribution Plan adopted pursuant to Rule 12b-1 under the Act, Class C shares pay the Distributor for distributing its shares at an annual rate of .75% of the value of its average daily net assets. During the period ended October 31, 2017, Class C shares were charged $7,389 pursuant to the Distribution Plan.
(c) Under the Shareholder Services Plan, Class A and Class C shares pay the Distributor at an annual rate of .25% of the value of their average daily net assets for the provision of certain services. The services provided may include personal services relating to shareholder accounts, such as answering shareholder inquiries regarding the fund and providing reports and other information, and services related to the maintenance of shareholder accounts. The Distributor may make payments to Service Agents (securities dealers, financial institutions or other industry professionals) with respect to these services. The Distributor determines the amounts to be paid to Service Agents. During the period ended October 31, 2017, Class A and Class C shares were charged $10,900 and $2,463, respectively, pursuant to the Shareholder Services Plan.
The fund has arrangements with the transfer agent and the custodian whereby the fund may receive earnings credits when positive cash balances are maintained, which are used to offset transfer agency and custody fees. For financial reporting purposes, the fund includes net earnings credits as an expense offset in the Statement of Operations.
The fund compensates Dreyfus Transfer, Inc., a wholly-owned subsidiary of Dreyfus, under a transfer agency agreement for providing transfer agency and cash management services for the fund. The majority of transfer agency fees are comprised of amounts paid on a per account basis, while cash management fees are related to fund subscriptions and redemptions. During the period ended October 31, 2017, the fund was charged $611 for transfer agency services and $29 for cash management services. These fees are included in Shareholder servicing costs in the Statement of Operations. Cash management fees were offset by earnings credits of $29.
The fund compensates The Bank of New York Mellon under a custody agreement for providing custodial services for the fund. These fees are determined based on net assets, geographic region and transaction activity.
29
NOTES TO FINANCIAL STATEMENTS (continued)
During the period ended October 31, 2017, the fund was charged $17,464 pursuant to the custody agreement.
During the period ended October 31, 2017, the fund was charged $11,224 for services performed by the Chief Compliance Officer and his staff.
The components of “Due from The Dreyfus Corporation and affiliates” in the Statement of Assets and Liabilities consist of: management fees $20,547, Distribution Plan fees $670, Shareholder Services Plan fees $1,204, custodian fees $4,200, Chief Compliance Officer fees $6,538 and transfer agency fees $119, which are offset against an expense reimbursement currently in effect in the amount of $53,911.
(d) Each Board member also serves as a Board member of other funds within the Dreyfus complex. Annual retainer fees and attendance fees are allocated to each fund based on net assets.
NOTE 4—Securities Transactions:
The aggregate amount of purchases and sales of investment securities, excluding short-term securities and forward contracts, during the period ended October 31, 2017, amounted to $38,520,123 and $38,259,938, respectively.
Derivatives: A derivative is a financial instrument whose performance is derived from the performance of another asset. The fund enters into International Swaps and Derivatives Association, Inc. Master Agreements or similar agreements (collectively, “Master Agreements”) with its over-the-counter (“OTC”) derivative contract counterparties in order to, among other things, reduce its credit risk to counterparties. Master Agreements include provisions for general obligations, representations, collateral and events of default or termination. Under a Master Agreement, the fund may offset with the counterparty certain derivative financial instrument’s payables and/or receivables with collateral held and/or posted and create one single net payment in the event of default or termination.
Each type of derivative instrument that was held by the fund during the period ended October 31, 2017 is discussed below.
Forward Foreign Currency Exchange Contracts: The fund enters into forward contracts in order to hedge its exposure to changes in foreign currency exchange rates on its foreign portfolio holdings, to settle foreign currency transactions or as a part of its investment strategy. When executing forward contracts, the fund is obligated to buy or sell a foreign currency at a specified rate on a certain date in the future. With respect to sales of forward contracts, the fund incurs a loss if the value of the contract increases between the date the forward contract is opened and the
30
date the forward contract is closed. The fund realizes a gain if the value of the contract decreases between those dates. With respect to purchases of forward contracts, the fund incurs a loss if the value of the contract decreases between the date the forward contract is opened and the date the forward contract is closed. The fund realizes a gain if the value of the contract increases between those dates. Any realized or unrealized gains or losses which occurred during the period are reflected in the Statement of Operations. The fund is exposed to foreign currency risk as a result of changes in value of underlying financial instruments. The fund is also exposed to credit risk associated with counterparty nonperformance on these forward contracts, which is generally limited to the unrealized gain on each open contract. This risk may be mitigated by Master Agreements, if any, between the fund and the counterparty and the posting of collateral, if any, by the counterparty to the fund to cover the fund’s exposure to the counterparty. Forward contracts open at October 31, 2017 are set forth in the Statement of Forward Foreign Currency Exchange Contracts.
The provisions of ASC Topic 210 “Disclosures about Offsetting Assets and Liabilities” require disclosure on the offsetting of financial assets and liabilities. These disclosures are required for certain investments, including derivative financial instruments subject to Master Agreements which are eligible for offsetting in the Statement of Assets and Liabilities and require the fund to disclose both gross and net information with respect to such investments. For financial reporting purposes, the fund does not offset derivative assets and derivative liabilities that are subject to Master Agreements in the Statement of Assets and Liabilities.
At October 31, 2017, derivative assets and liabilities (by type) on a gross basis are as follows:
Derivative Financial Instruments: |
| Assets ($) |
| Liabilities ($) |
|
Forward contracts | 54 | - | |||
Total gross amount of derivative | |||||
assets and liabilities in the | |||||
Statement of Assets and Liabilities | 54 | - | |||
Derivatives not subject to | |||||
Master Agreements | - | - | |||
Total gross amount of assets | |||||
and liabilities subject to | |||||
Master Agreements | 54 | - |
The following table presents derivative assets net of amounts available for offsetting under Master Agreements and net of related collateral received or pledged, if any, as of October 31, 2017:
31
NOTES TO FINANCIAL STATEMENTS (continued)
Financial | ||||||
Instruments | ||||||
and Derivatives | ||||||
Gross Amount of | Available | Collateral | Net Amount of | |||
Counterparty | Assets ($) | 1 | for Offset ($) | Received ($) |
| Assets ($) |
Northern | 54 | - | - | 54 | ||
1 Absent a default event or early termination, OTC derivative assets and liabilities are presented at gross amounts and are not offset in the Statement of Assets and Liabilities. | ||||||
The following summarizes the average market value of derivatives outstanding during the period ended October 31, 2017:
|
| Average Market Value ($) |
Forward contracts | 93,691 | |
At October 31, 2017, the cost of investments for federal income tax purposes was $24,561,108; accordingly, accumulated net unrealized appreciation on investments inclusive of derivative contracts was $2,431,296, consisting of $3,173,632 gross unrealized appreciation and $742,336 gross unrealized depreciation.
32
REPORT OF INDEPENDENT REGISTERED
PUBLIC ACCOUNTING FIRM
Shareholders and Board of Trustees
Dreyfus Global Infrastructure Fund
We have audited the accompanying statement of assets and liabilities, including the statements of investments, investments in affiliated issuers and forward foreign currency exchange contracts, of Dreyfus Global Infrastructure Fund (one of the series comprising Dreyfus Premier Investment Funds, Inc.) (the Fund) as of October 31, 2017, and the related statement of operations for the year then ended, the statement of changes in net assets for each of the two years in the period then ended, and the financial highlights for each of the periods indicated therein. These financial statements and financial highlights are the responsibility of the Fund’s management. Our responsibility is to express an opinion on these financial statements and financial highlights based on our audits.
We conducted our audits in accordance with the standards of the Public Company Accounting Oversight Board (United States). Those standards require that we plan and perform the audit to obtain reasonable assurance about whether the financial statements and financial highlights are free of material misstatement. We were not engaged to perform an audit of the Fund’s internal control over financial reporting. Our audits included consideration of internal control over financial reporting as a basis for designing audit procedures that are appropriate in the circumstances, but not for the purpose of expressing an opinion on the effectiveness of the Fund’s internal control over financial reporting. Accordingly, we express no such opinion. An audit also includes examining, on a test basis, evidence supporting the amounts and disclosures in the financial statements and financial highlights, assessing the accounting principles used and significant estimates made by management, and evaluating the overall financial statement presentation. Our procedures included confirmation of securities owned as of October 31, 2017 by correspondence with the custodian and others or by other appropriate procedures where replies were not received. We believe that our audits provide a reasonable basis for our opinion.
In our opinion, the financial statements and financial highlights referred to above present fairly, in all material respects, the financial position of Dreyfus Global Infrastructure Fund at October 31, 2017, the results of its operations for the year then ended, the changes in its net assets for each of the two years in the period then ended, and the financial highlights for each of the indicated periods in conformity with U.S. generally accepted accounting principles.

New York, New York
December 28, 2017
33
IMPORTANT TAX INFORMATION (Unaudited)
For federal tax purposes, the fund hereby reports 67.85% of the ordinary dividends paid during the fiscal year ended October 31, 2017 as qualifying for the corporate dividends received deduction. Also, certain dividends paid by the fund may be subject to a maximum tax rate of 15%, as provided for by the Jobs and Growth Tax Relief Reconciliation Act of 2003. Of the distributions paid during the fiscal year, $470,285 represents the maximum amount that may be considered qualified dividend income. Shareholders will receive notification in early 2018 of the percentage applicable to the preparation of their 2017 income tax returns.
34
INFORMATION ABOUT THE RENEWAL OF THE FUND’S SUB–INVESTMENT ADVISORY AGREEMENT (Unaudited)
At an in-person meeting of the fund’s Board of Directors (the “Board”) held on October 13, 2017 (the “October Meeting”), the Board, including the Independent Directors, discussed and approved a new sub-investment advisory agreement (the “New Sub-Advisory Agreement”) between Dreyfus, on behalf of the fund, and CSIM Investment Management LLC (“CSIM”), pursuant to which CSIM would continue to provide day-to-day management of the fund’s portfolio. The Board, including the Independent Directors, concluded that approval of the New Sub-Advisory Agreement was in the best interests of the fund and its shareholders.
CSIM is a newly-formed entity owned by members of the existing management team (“Existing Management”) of CenterSquare Investment Management, Inc. (“CenterSquare”), the fund’s current sub-adviser, private funds sponsored by Lovell Minnick Partners LLC (“Lovell Minnick”), a private equity firm, and certain co-investors.
CenterSquare is currently an indirect, wholly-owned subsidiary of The Bank of New York Mellon Corporation (“BNY Mellon”), the parent company of Dreyfus. CSIM has entered into a definitive agreement with BNY Mellon to acquire substantially all of the assets of the CenterSquare Investment Management business (the “Transaction”) on or about January 2, 2018 (the “Effective Date”).
The current sub-investment advisory agreement (the “Current Sub-Advisory Agreement”) between Dreyfus, on behalf of the fund, and CenterSquare was most recently reapproved by the Board at a meeting held on March 9-10, 2017 (the “March Meeting”). At the March Meeting, the Independent Directors requested and received information from Dreyfus and CenterSquare they deemed reasonably necessary for their review of the Current Sub-Advisory Agreement and the performance and services provided by CenterSquare. The information received by the Board included information related to the fees paid by the fund to Dreyfus and by Dreyfus to CenterSquare and the profitability of Dreyfus with respect to the fund, among other items, in accordance with Section 15(c) of the Investment Company Act of 1940, as amended (the “1940 Act”). Management believed that there were no material changes to the information presented at the March Meeting relevant to the Board’s consideration of the New Sub-Advisory Agreement, other than the information about CSIM and the Transaction. Based on management’s representations that the Transaction was not expected to have a material impact on the nature, extent or quality of the investment advisory services that CenterSquare currently provides to the fund, the persons responsible for portfolio management of the fund under CSIM were anticipated to remain the same and that the terms of the New Sub-Advisory Agreement were substantially similar in material respects to the Current Sub-Advisory Agreement, the Board considered information presented to them as part of the annual agreement review process at the March Meeting, as well as information about CenterSquare, CSIM and the Transaction received at the October Meeting.
35
INFORMATION ABOUT THE RENEWAL OF THE FUND’S SUB–INVESTMENT ADVISORY AGREEMENT (Unaudited) (continued)
In connection with the October Meeting and in accordance with Section 15(c) of the 1940 Act, the Board requested, and Dreyfus, CenterSquare and CSIM provided, materials relating to the Transaction, CenterSquare, CSIM and Lovell Minnick in connection with the Board’s consideration of whether to approve the New Sub-Advisory Agreement. This included a description of the Transaction and its anticipated effects on CenterSquare and CSIM as well as information regarding Lovell Minnick and its business activities, personnel and affiliates. The Board noted that the services provided under the New Sub-Advisory Agreement will be substantially identical to those provided under the Current Sub-Advisory Agreement. In addition, the sub-advisory fee under the New Sub-Advisory Agreement will remain the same as the sub-advisory fee under the Current Sub-Advisory Agreement. Existing Management represented that under the New Sub-Advisory Agreement there would be no diminution in services provided by CSIM to the fund or changes in the fee payable by Dreyfus to CSIM as a result of the Transaction. The Board also considered the substance of discussions with representatives of Dreyfus and CenterSquare at the March Meeting and representatives of CSIM and Lovell Minnick at the October Meeting. Additionally, the Board reviewed materials supplied by counsel that were prepared for use by the Board in fulfilling its duties under state law and the 1940 Act. It was noted that the Transaction would comply with Section 15(f) of the 1940 Act in that 75% or more of the fund’s Board was comprised of Independent Directors and would remain so for three years following the Effective Date, and that no “unfair burden” (as defined in the 1940 Act) would be imposed on the fund by CSIM during the two-year period following the Effective Date.
In voting to approve the New Sub-Advisory Agreement, the Board considered whether the approval of the New Sub-Advisory Agreement would be in the best interests of the fund and its shareholders, an evaluation based on several factors including those discussed below. The Independent Directors were represented by legal counsel that is independent of CenterSquare and CSIM in connection with their consideration of approval of the New Sub-Advisory Agreement. The factors discussed below were also considered by the Independent Directors in executive sessions during which such independent legal counsel provided guidance and a written description to the Independent Directors of their statutory responsibilities and the legal standards that are applicable to the approval of investment advisory and sub-investment advisory agreements. Based on their discussions and considerations, including those described below, the Board, including the Independent Directors, approved the New Sub-Advisory Agreement to be effective as of the Effective Date. It is currently anticipated that the New Sub-Advisory Agreement will be reviewed by the Board as part of its annual review of advisory arrangements for the fund in the first quarter of 2018.
Nature, Extent and Quality of Services to be Provided under the New Sub-Advisory Agreement. At the March Meeting, the Board received and considered information regarding the nature, extent and quality of services provided to the fund by CenterSquare under the Current Sub-Advisory Agreement. The Board noted information received at regular meetings throughout the year related to the services rendered by CenterSquare to the fund, including the scope and quality of the investment management and other capabilities of CenterSquare.
36
At the October Meeting, the Board received and considered information regarding the fact that the nature, extent and quality of services to be provided to the fund by CSIM under the New Sub-Advisory Agreement would not change as a result of the Transaction. The Board members discussed with management the portfolio management strategies of the fund’s portfolio managers and noted that there were currently no long-term or short-term plans to make changes to the management or investment policies, strategies or objective of the fund as a result of the Transaction. The Board members considered the specific responsibilities in all aspects of the day-to-day management of the fund by CenterSquare, and the fact that the persons responsible for portfolio management under CSIM were anticipated to remain the same. The Board also considered that the division of responsibilities between Dreyfus and CSIM would remain the same as it is currently with CenterSquare. The Board members also considered the financial resources that will be available to CSIM. The fund’s Chief Compliance Officer discussed the compliance infrastructure of the fund following the Transaction. The Board also discussed the acceptability of the terms of the New Sub-Advisory Agreement.
The Board concluded that the fund will continue to benefit from the quality and experience of CenterSquare’s investment professionals that will continue to provide services to the fund after the Transaction as employees of CSIM. Based on its consideration and review of the foregoing information, the Board concluded that it was satisfied with the nature, extent and quality of the sub-investment advisory services expected to be provided by CSIM.
Fund Investment Performance. The Board members considered the investment performance of CenterSquare in managing the fund’s portfolio as a factor in evaluating the New Sub-Advisory Agreement during the October Meeting. At the March Meeting, the Board reviewed reports prepared by Broadridge Financial Solutions, Inc. (“Broadridge”), an independent provider of investment company data, which included information comparing the fund’s performance with the performance of a group of comparable funds (the “Performance Group”) and with a broader group of funds (the “Performance Universe”), all for various periods ended January 31, 2017. The Board discussed with representatives of Dreyfus and CenterSquare the results of the comparisons and considered that the fund’s total return performance was below the Performance Group and Performance Universe medians for the one-year period shown. Dreyfus had also provided a comparison of the fund’s calendar year total return for 2016 to the return of the fund’s benchmark index. At the October Meeting, the Board referred to additional information on fund performance for various periods ended September 30, 2017, which showed that the fund’s total return performance had improved relative to the other funds in the Performance Group for the periods reviewed. Based on its review, the Board noted the fund’s short period of operations and improving performance.
The Board members discussed with representatives of Dreyfus and CSIM that the investment strategies to be employed by CSIM in the management of the fund’s assets are currently expected to remain the same after the Transaction and under the New Sub-
37
INFORMATION ABOUT THE RENEWAL OF THE FUND’S SUB–INVESTMENT ADVISORY AGREEMENT (Unaudited) (continued)
Advisory Agreement. The Board also considered the fact that the persons responsible for portfolio management of the fund at CenterSquare would remain the same following the Transaction as employees of CSIM. Based on its consideration and review of the foregoing, the Board concluded that these factors supported a decision to approve the New Sub-Advisory Agreement.
Sub-Advisory Fee and Expense Ratio. The Board considered the proposed fee payable under the New Sub-Advisory Agreement, noting that the proposed fee would be paid by Dreyfus and, thus, would not impact the fees paid by the fund. At the March Meeting, the Board reviewed and considered the contractual management fee payable by the fund to Dreyfus pursuant to the fund’s Management Agreement, pursuant to which Dreyfus provides the fund with investment advisory and administrative services (the “Management Agreement”), and the contractual sub-investment advisory fee payable by Dreyfus to CenterSquare pursuant to the Current Sub-Advisory Agreement, which is identical to that payable under the New Sub-Advisory Agreement, and the sub-investment advisory services provided by CenterSquare. In addition, because of Dreyfus’ fee waiver and/or expense reimbursement arrangement that was in effect for the fund, which reduced the management fee paid to Dreyfus, the Board also reviewed and considered the actual management fee rate (after taking into account waivers and reimbursements). The Board considered the fee to CenterSquare in relation to the fee paid to Dreyfus by the fund and the respective services provided by CenterSquare and Dreyfus.
At the March Meeting, the Board reviewed reports prepared by Broadridge which included information comparing the fund’s actual and contractual management fees and total expenses with those of a group of comparable funds (the “Expense Group”) and with a broader group of funds (the “Expense Universe”), the information for which was derived in part from fund financial statements available to Broadridge as of the date of its analysis. The Board also reviewed the range of actual and contractual management fees and total expenses of the Expense Group and Expense Universe funds and discussed the results of the comparisons. The Board noted that the fund’s contractual management fee was at the Expense Group median, the fund’s actual management fee was the lowest in the Expense Group and Expense Universe and the fund’s total expenses were below the Expense Group and Expense Universe medians.
At the October Meeting, the Board noted that the contractual management fee will remain the same, that Dreyfus had committed to continue the current fee waiver and/or expense reimbursement arrangement until at least March 1, 2018, and that the terms of the current fee waiver and expense reimbursement arrangement will not change as a result of the Transaction.
Profitability. The Board recognized that, because CSIM’s fee would be paid by Dreyfus, and not the fund, an analysis of profitability was more appropriate in the context of the Board’s consideration of the Management Agreement. Accordingly, at the March Meeting, the Board received and considered a profitability analysis of Dreyfus and its affiliates in providing services to the fund. Dreyfus representatives reviewed the expenses allocated and profit received by Dreyfus and its affiliates and the resulting
38
profitability percentage for managing the fund and the aggregate profitability percentage to Dreyfus and its affiliates for managing the funds in the Dreyfus fund complex, and the method used to determine the expenses and profit. The Board concluded that the profitability results were not unreasonable, given the services rendered and service levels provided by Dreyfus. The Board also considered the expense limitation arrangement and its effect on the profitability of Dreyfus and its affiliates.
At the October Meeting, the Board noted that the fee payable to CenterSquare by Dreyfus under the Current Sub-Advisory Agreement was the same as that payable under the New Sub-Advisory Agreement and, thus, no material impact to Dreyfus’ profitability with respect to the fund is expected as a result of the Transaction. Therefore, the Board determined that Dreyfus’ expected profitability should not be excessive in light of the nature, extent and quality of the services to be provided to the fund after the Transaction. Consideration of profitability with respect to CSIM was not relevant to the Board’s determination to approve the New Sub-Advisory Agreement.
Economies of Scale. The Board recognized that, as is the case with CenterSquare, because CSIM’s fee would be paid by Dreyfus, and not the fund, an analysis of economies of scale was more appropriate in the context of the Board’s consideration of the Management Agreement. Accordingly, at the March Meeting, the Board discussed any economies of scale or other efficiencies that may result from increases in the fund’s assets. The Board noted that there are various ways to share potential economies of scale with fund shareholders and that it appeared that the benefits of any economies of scale would be appropriately shared with shareholders.
At the October Meeting, the Board noted that no material impact to the analysis of economies of scale is expected as a result of the Transaction. Therefore, consideration of economies of scale was not relevant to the Board’s determination to approve the New Sub-Advisory Agreement.
Other Benefits to CenterSquare and CSIM. At the March Meeting, the Board considered potential benefits to Dreyfus and CenterSquare from acting as investment adviser and sub-investment adviser, respectively, and took into consideration the soft dollar arrangements in effect for trading the fund’s investments. The Board noted that CSIM would be required to select brokers who met the fund’s requirements for seeking best execution, and that Dreyfus would monitor and evaluate CSIM’s trade execution with respect to fund brokerage transactions on a quarterly basis and would provide reports to the Board on these matters. In light of the costs of providing investment management and other services to the fund and CenterSquare’s commitment to the fund, any other ancillary benefits that CenterSquare received were considered reasonable.
At the October Meeting, the Board considered the benefits to be received by BNY Mellon, CenterSquare and CSIM as a result of the Transaction, as well as the benefits to be received by CSIM as a result of the relationship with the fund, and determined that any such ancillary benefits were reasonable.
39
INFORMATION ABOUT THE RENEWAL OF THE FUND’S SUB–INVESTMENT ADVISORY AGREEMENT (Unaudited) (continued)
After full consideration of the factors discussed above, with no single factor identified as being of paramount importance, the Board, including a majority of the Independent Directors, approved the New Sub-Advisory Agreement for the fund.
40
BOARD MEMBERS INFORMATION (Unaudited)
INDEPENDENT BOARD MEMBERS
Chairman of the Board (1995)
Principal Occupation During Past 5 Years:
· Corporate Director and Trustee (1995-present)
Other Public Company Board Memberships During Past 5 Years:
· CBIZ (formerly, Century Business Services, Inc.), a provider of outsourcing functions for small and medium size companies, Director (1997-present)
No. of Portfolios for which Board Member Serves: 126
———————
Peggy C. Davis (74)
Board Member (2012)
Principal Occupation During Past 5 Years:
· Shad Professor of Law, New York University School of Law (1983-present)
No. of Portfolios for which Board Member Serves: 45
———————
David P. Feldman (77)
Board Member (1991)
Principal Occupation During Past 5 Years:
· Corporate Director and Trustee (1985-present)
Other Public Company Board Memberships During Past 5 Years:
· BBH Mutual Funds Group (5 registered mutual funds), Director (1992-2014)
No. of Portfolios for which Board Member Serves: 31
———————
Joan Gulley (70)
Board Member (2017)
Principal Occupation During Past 5 Years:
· PNC Financial Services Group, Inc.(1993-2014)
· Executive Vice President and Chief Human Resources Officer and Executive Committee Member (2008-2014)
No. of Portfolios for which Board Member Serves: 52
———————
41
BOARD MEMBERS INFORMATION (Unaudited) (continued)
INDEPENDENT BOARD MEMBERS (continued)
Ehud Houminer (77)
Board Member (2012)
Principal Occupation During Past 5 Years:
· Board of Overseers at the Columbia Business School, Columbia University (1992-present)
· Trustee, Ben Gurion University
Other Public Company Board Memberships During Past 5 Years:
· Avnet, Inc., an electronics distributor, Director (1993-2012)
No. of Portfolios for which Board Member Serves: 52
———————
Lynn Martin (77)
Board Member (1994)
Principal Occupation During Past 5 Years:
· President of The Martin Hall Group LLC, a human resources consulting firm (2005-2012)
Other Public Company Board Memberships During Past 5 Years:
· AT&T, Inc., a telecommunications company, Director (1999-2012)
· Ryder System, Inc., a supply chain and transportation management company, Director (1993-2012)
No. of Portfolios for which Board Member Serves: 31
———————
Robin A. Melvin (54)
Board Member (2011)
Principal Occupation During Past 5 Years:
· Co-chairman, Illinois Mentoring Partnership, non-profit organization dedicated to increasing the quantity and quality of mentoring services in Illinois; (2014-present; board member since 2013)
· Director, Boisi Family Foundation, a private family foundation that supports youth-serving organizations that promote the self sufficiency of youth from disadvantaged circumstances (1995-2012)
No. of Portfolios for which Board Member Serves: 98
———————
42
Dr. Martin Peretz (78)
Board Member (2012)
Principal Occupation During Past 5 Years:
· Editor-in-Chief Emeritus of The New Republic Magazine (2011-2012) (previously,
Editor-in-Chief, 1974-2011)
· Lecturer at Harvard University (1969-2012)
No. of Portfolios for which Board Member Serves: 31
———————
Once elected all Board Members serve for an indefinite term, but achieve Emeritus status upon reaching age 80. The address of the Board Members and Officers is c/o The Dreyfus Corporation, 200 Park Avenue, New York, New York 10166. Additional information about the Board Members is available in the fund’s Statement of Additional Information which can be obtained from Dreyfus free of charge by calling this toll free number: 1-800-DREYFUS.
Daniel Rose, Emeritus Board Member
Philip L. Toia, Emeritus Board Member
Sander Vanocur, Emeritus Board Member
43
OFFICERS OF THE FUND (Unaudited)
BRADLEY J. SKAPYAK, President since January 2010.
Chief Operating Officer and a director of the Manager since June 2009, Chairman of Dreyfus Transfer, Inc., an affiliate of the Manager and the transfer agent of the funds, since May 2011 and Chief Executive Officer of MBSC Securities Corporation since August 2016. He is an officer of 62 investment companies (comprised of 126 portfolios) managed by the Manager. He is 58 years old and has been an employee of the Manager since February 1988.
BENNETT A. MACDOUGALL, Chief Legal Officer since October 2015.
Chief Legal Officer of the Manager and Associate General Counsel and Managing Director of BNY Mellon since June 2015; from June 2005 to June 2015, he served in various capacities with Deutsche Bank – Asset & Wealth Management Division, including as Director and Associate General Counsel, and Chief Legal Officer of Deutsche Investment Management Americas Inc. from June 2012 to May 2015. He is an officer of 63 investment companies (comprised of 151 portfolios) managed by the Manager. He is 46 years old and has been an employee of the Manager since June 2015.
JANETTE E. FARRAGHER, Vice President and Secretary since December 2011.
Associate General Counsel of BNY Mellon, and an officer of 63 investment companies (comprised of 151 portfolios) managed by the Manager. She is 54 years old and has been an employee of the Manager since February 1984.
JAMES BITETTO, Vice President and Assistant Secretary since August 2005.
Managing Counsel of BNY Mellon and Secretary of the Manager, and an officer of 63 investment companies (comprised of 151 portfolios) managed by the Manager. He is 51 years old and has been an employee of the Manager since December 1996.
JOSEPH M. CHIOFFI, Vice President and Assistant Secretary since August 2005.
Managing Counsel of BNY Mellon, and an officer of 63 investment companies (comprised of 151 portfolios) managed by the Manager. He is 55 years old and has been an employee of the Manager since June 2000.
MAUREEN E. KANE, Vice President and Assistant Secretary since April 2015.
Managing Counsel of BNY Mellon since July 2014; from October 2004 until July 2014, General Counsel, and from May 2009 until July 2014, Chief Compliance Officer of Century Capital Management. She is an officer of 63 investment companies (comprised of 151 portfolios) managed by the Manager. She is 55 years old and has been an employee of the Manager since July 2014.
SARAH S. KELLEHER, Vice President and Assistant Secretary since April 2014.
Senior Counsel of BNY Mellon since March 2013, from August 2005 to March 2013, Associate General Counsel of Third Avenue Management. She is an officer of 63 investment companies (comprised of 151 portfolios) managed by the Manager. She is 42 years old and has been an employee of the Manager since March 2013.
JEFF PRUSNOFSKY, Vice President and Assistant Secretary since August 2005.
Senior Managing Counsel of BNY Mellon, and an officer of 63 investment companies (comprised of 151 portfolios) managed by the Manager. He is 52 years old and has been an employee of the Manager since October 1990.
NATALYA ZELENSKY, Vice President and Assistant Secretary since March 2017.
Counsel and Vice President of BNY Mellon since May 2016; Attorney at Wildermuth Endowment Strategy Fund/Wildermuth Advisory, LLC from November 2015 until May 2016; Assistant General Counsel at RCS Advisory Services from July 2014 until November 2015; Associate at Sutherland, Asbill & Brennan from January 2013 until January 2014; Associate at K&L Gates from October 2011 until January 2013. She is an officer of 63 investment companies (comprised of 151 portfolios) managed by Dreyfus. She is 32 years old and has been an employee of the Manager since May 2016.
JAMES WINDELS, Treasurer since November 2001.
Director – Mutual Fund Accounting of the Manager, and an officer of 63 investment companies (comprised of 151 portfolios) managed by the Manager. He is 59 years old and has been an employee of the Manager since April 1985.
44
RICHARD CASSARO, Assistant Treasurer since January 2008.
Senior Accounting Manager – Money Market and Municipal Bond Funds of the Manager, and an officer of 63 investment companies (comprised of 151 portfolios) managed by the Manager. He is 58 years old and has been an employee of the Manager since September 1982.
GAVIN C. REILLY, Assistant Treasurer since December 2005.
Tax Manager of the Investment Accounting and Support Department of the Manager, and an officer of 63 investment companies (comprised of 151 portfolios) managed by the Manager. He is 49 years old and has been an employee of the Manager since April 1991.
ROBERT S. ROBOL, Assistant Treasurer since August 2005.
Senior Accounting Manager – Dreyfus Financial Reporting of the Manager, and an officer of 63 investment companies (comprised of 151 portfolios) managed by the Manager. He is 53 years old and has been an employee of the Manager since October 1988.
ROBERT SALVIOLO, Assistant Treasurer since July 2007.
Senior Accounting Manager – Equity Funds of the Manager, and an officer of 63 investment companies (comprised of 151 portfolios) managed by the Manager. He is 50 years old and has been an employee of the Manager since June 1989.
ROBERT SVAGNA, Assistant Treasurer since December 2002.
Senior Accounting Manager – Fixed Income and Equity Funds of the Manager, and an officer of 63 investment companies (comprised of 151 portfolios) managed by the Manager. He is 50 years old and has been an employee of the Manager since November 1990.
JOSEPH W. CONNOLLY, Chief Compliance Officer since October 2004.
Chief Compliance Officer of the Manager and The Dreyfus Family of Funds (63 investment companies, comprised of 151 portfolios). He is 60 years old and has served in various capacities with the Manager since 1980, including manager of the firm’s Fund Accounting Department from 1997 through October 2001.
CARIDAD M. CAROSELLA, Anti-Money Laundering Compliance Officer since January 2016.
Anti-Money Laundering Compliance Officer of the Dreyfus Family of Funds and BNY Mellon Funds Trust since January 2016; from May 2015 to December 2015, Interim Anti-Money Laundering Compliance Officer of the Dreyfus Family of Funds and BNY Mellon Funds Trust and the Distributor; from January 2012 to May 2015, AML Surveillance Officer of the Distributor and from 2007 to December 2011, Financial Processing Manager of the Distributor. She is an officer of 57 investment companies (comprised of 145 portfolios) managed by the Manager. She is 49 years old and has been an employee of the Distributor since 1997.
45
Dreyfus Global Infrastructure Fund
200 Park Avenue
New York, NY 10166
Manager
The Dreyfus Corporation
200 Park Avenue
New York, NY 10166
Sub-Investment Adviser
CenterSquare Investment
Management Inc.
630 West Germantown Pike
Suite 300
Plymouth Meeting, PA 19462
Custodian
The Bank of New York Mellon
225 Liberty Street
New York, NY 10286
Transfer Agent &
Dividend Disbursing Agent
Dreyfus Transfer, Inc.
200 Park Avenue
New York, NY 10166
Distributor
MBSC Securities Corporation
200 Park Avenue
New York, NY 10166
Ticker Symbols: | Class A: DGANX Class C: DGCNX Class I: DIGNX Class Y: DYGNX |
Telephone Call your financial representative or 1-800-DREYFUS
Mail The Dreyfus Family of Funds, 144 Glenn Curtiss Boulevard, Uniondale, NY 11556-0144
E-mail Send your request to info@dreyfus.com
Internet Information can be viewed online or downloaded at www.dreyfus.com
The fund files its complete schedule of portfolio holdings with the Securities and Exchange Commission (“SEC”) for the first and third quarters of each fiscal year on Form N-Q. The fund’s Forms N-Q are available on the SEC’s website at www.sec.gov and may be reviewed and copied at the SEC’s Public Reference Room in Washington, D.C. (phone 1-800-SEC-0330 for information).
A description of the policies and procedures that the fund uses to determine how to vote proxies relating to portfolio securities and information regarding how the fund voted these proxies for the most recent 12-month period ended June 30 is available at www.dreyfus.com and on the SEC’s website at www.sec.gov and without charge, upon request, by calling 1-800-DREYFUS.
© 2017 MBSC Securities Corporation |
|

Dreyfus Global Real Estate Securities Fund
| ANNUAL REPORT October 31, 2017 |

|

Save time. Save paper. View your next shareholder report online as soon as it’s available. Log into www.dreyfus.com and sign up for Dreyfus eCommunications. It’s simple and only takes a few minutes. |
The views expressed in this report reflect those of the portfolio manager(s) only through the end of the period covered and do not necessarily represent the views of Dreyfus or any other person in the Dreyfus organization. Any such views are subject to change at any time based upon market or other conditions and Dreyfus disclaims any responsibility to update such views. These views may not be relied on as investment advice and, because investment decisions for a Dreyfus fund are based on numerous factors, may not be relied on as an indication of trading intent on behalf of any Dreyfus fund. |
Not FDIC-Insured • Not Bank-Guaranteed • May Lose Value |
Contents
THE FUND
With Those of Other Funds | |
in Affiliated Issuers | |
Currency Exchange Contracts | |
Public Accounting Firm | |
the Fund’s Sub-Investment Advisory | |
Agreement | |
FOR MORE INFORMATION
Back Cover
| The Fund |
A LETTER FROM THE CEO OF DREYFUS
Dear Shareholder:
We are pleased to present this annual report for Dreyfus Global Real Estate Securities Fund, covering the 12-month period from November 1, 2016 through October 31, 2017. For information about how the fund performed during the reporting period, as well as general market perspectives, we provide a Discussion of Fund Performance on the pages that follow.
Stocks set a series of new record highs and bonds produced mixed results over the past year in response to changing economic and political conditions. Financial markets at the start of the reporting period were dominated by the election of a new U.S. presidential administration. Equities and corporate-backed bonds surged higher in anticipation of more business-friendly regulatory, tax, and fiscal policies, but high-quality bonds generally lost value due to expectations of rising interest rates and accelerating inflation in a stronger economy. Despite a series of short-term interest-rate hikes, bonds recovered their previous losses over the first 10 months of 2017 when it became clearer that pro-growth legislation would take time and political capital to enact. U.S. and international stocks continued to rally as corporate earnings grew and global economic conditions improved.
The markets’ recent strong performance has been supported by solid underlying fundamentals. While we currently expect these favorable conditions to persist, we remain watchful for economic and political developments that could derail the markets. As always, we encourage you to discuss the risks and opportunities of today’s investment environment with your financial advisor.
Thank you for your continued confidence and support.
Sincerely,

Mark D. Santero
Chief Executive Officer
The Dreyfus Corporation
November 15, 2017
2
DISCUSSION OF FUND PERFORMANCE
For the period from November 1, 2016 through October 31, 2017, as provided by the fund’s portfolio managers,
E. Todd Briddell and Dean Frankel of CenterSquare Investment Management, Inc., Sub-Investment Adviser
Market and Fund Performance Overview
For the 12-month period ended October 31, 2017, Dreyfus Global Real Estate Securities Fund’s Class A shares produced a total return of 7.05%, Class C shares returned 6.17%, Class I shares returned 7.24%, and Class Y shares returned 7.26%.1 In comparison, the FTSE EPRA/NAREIT Developed Index (Net) (the “Index”), the fund’s benchmark, achieved a total return of 6.12% for the same period. The fund’s former benchmark the FTSE EPRA/NAREIT Developed Index (Total Return) (the “Total Return Index”) achieved a total return of 7.13% for the same period.2
Global real estate markets advanced over the reporting period, supported by improving global economic conditions. The fund outperformed the Index, largely due to strong individual security selections in Australia, the United States, Hong Kong, and Europe.
Effective July 25, 2017, the FTSE EPRA/NAREIT Developed Index (Net) became the benchmark replacing that of FISE EPRA/NAREIT Developed Index (Total Return). Fund management believes that the Index provides a more appropriate comparison of fund performance than the Total Return Index as the Index reflects the effect of foreign dividend tax withholding requirements mandated individually by the various governments of the countries in which that index’s constituents are domiciled. The Total Return Index does not reflect the effect of these requirements. Performance for the Total Return Index will not be shown in future fund annual reports.
The Fund’s Investment Approach
The fund seeks to maximize total return, consisting of capital appreciation and current income, by investing at least 80% of its net assets in companies principally engaged in the real estate sector. Under normal market conditions, the fund expects to invest at least 40% of its assets in companies located outside the United States and to invest in at least 10 different countries. The fund also may invest in companies located in emerging markets and in companies of any market capitalization. Our proprietary approach quantifies investment opportunity both from a real estate and stock perspective.
Political Stability and Improving Economy Buoyed Markets
In the weeks prior to the start of the reporting period, developed international markets generally lost ground due to political uncertainties and global economic growth concerns. However, the U.S. presidential election in November 2016 marked a turning point as investors responded positively to expectations of more business-friendly policies from the new U.S. administration. By early 2017, most broad global stock indices and individual country stock indices had climbed into positive territory.
The remainder of the reporting period saw steady gains across most global markets, supported by improving economic data in Europe and Asia. In the European Union (EU), political worries receded when anti-EU candidates for national office were rejected by voters in favor of more centrist, pro-EU figures in France and the Netherlands. The U.K. market shrugged off concerns regarding the Brexit referendum amid robust corporate earnings and improving economic forecasts. In Japan, the central bank revised its growth estimate upwards in light of unexpectedly strong corporate earnings.
Real estate markets benefited from these improving economic conditions. Hong Kong and Singapore fared especially well as they rebounded from previous weakness. Eurozone real estate companies posted double-digit increases, on average, when economic data and investor sentiment improved. U.S. real estate developers and operators achieved more modest gains as a result of a relatively heavy supply of available properties. Japan eked out a mildly positive return due, in part, to relatively rich valuations.
Security Selections Bolstered Relative Results in Most Markets
The fund achieved better performance than the Index in most global real estate markets. Security selections in Australia proved especially favorable, as Mirvac Group posted strong results from its office-and-industrial
3
DISCUSSION OF FUND PERFORMANCE (continued)
segment. The fund also benefited from underweight exposure to shopping centers specialist Westfield Group, which struggled in a challenging environment for brick-and-mortar retailers. While the fund held underweight exposure to Hong Kong, the fund’s opportunistic strategy of short-term trading helped it participate more fully than the Index in a sharply rising market. Top performers in Europe included German residential property manager Deutsche Wohnen-BR, which was supported by strong regional economic growth, and Norwegian office developer Entra, which rebounded from a low valuation as oil prices recovered.
In the United States, residential rental company Starwood Waypoint Homes (formerly Colony Starwood Homes) benefited from solid rental growth, greater operating cost efficiencies and a recent merger, while data center operator CyrusOne prospered in the midst of greater adoption of cloud computing. Among hotel operators, a platform expansion by Hilton Worldwide Holdings helped it fare better than most of its peers in an industry struggling with low growth. The fund further benefited from lack of exposure to U.S. mall operators such as Tanger Factory Outlet Centers.
Canada represented the only market where the fund lagged the Index’s respective country component. In addition, the fund’s weaker holdings included Swedish office and retail investor Hufvudstaden as well as U.S. office property companies SL Green Realty and Vornado Realty Trust.
Positioned for Continued Economic Growth
We believe the environment for global real estate securities remains supported by widespread economic growth. In addition, supply-and-demand dynamics for most property markets have remained in balance, industry leverage has stayed at manageable levels, and gradual increases in interest rates seem unlikely to derail business conditions for real estate companies. In this environment, we have continued to identify opportunities meeting our investment criteria across all regional markets, and we have retained our emphasis on companies in the residential, office, and data center areas over those with exposure to malls and retail stores.
November 15, 2017
1 Total return includes reinvestment of dividends and any capital gains paid, and does not take into consideration the maximum initial sales charge in the case of Class A shares, or the applicable contingent deferred sales charge imposed on redemptions in the case of Class C shares. Had these charges been reflected, returns would have been lower. Share price and investment return fluctuate such that upon redemption, fund shares may be worth more or less than their original cost. Return figures provided reflect the absorption of certain fund expenses by The Dreyfus Corporation pursuant to an undertaking in effect through March 1, 2018, at which time it may be extended, terminated, or modified. Past performance is no guarantee of future results.
2 Source: Lipper Inc. — Reflects reinvestment of net dividends and, where applicable, capital gain distributions. The FTSE EPRA/NAREIT Developed Index is designed to track the performance of listed real estate companies and REITs worldwide. Investors cannot invest directly in any index.
Please note: the position in any security highlighted with italicized typeface was sold during the reporting period.
Equities are subject generally to market, market sector, market liquidity, issuer, and investment style risks, among other factors, to varying degrees, all of which are more fully described in the fund’s prospectus.
The fund’s performance will be influenced by political, social, and economic factors affecting investments in foreign companies. Special risks associated with investments in foreign companies include exposure to currency fluctuations, less liquidity, less developed or less efficient trading markets, lack of comprehensive company information, political instability, and differing auditing and legal standards.
These risks are enhanced in emerging market countries.
Because the fund’s investments are concentrated in the securities of companies principally engaged in the real estate sector, the value of the fund’s shares will be affected by factors particular to the real estate sector and may fluctuate more widely than that of a fund which invests in a broader range of industries. The securities of issuers that are principally engaged in the real estate sector may be subject to risks similar to those associated with the direct ownership of real estate. These include declines in real estate values and defaults by mortgagors or other borrowers.
In addition to the risks which are linked to the real estate sector in general, REITs are subject to additional risks. Equity REITs may be affected by changes in the value of the underlying property owned by the trust, while mortgage REITs may be affected by the quality of any credit extended. Further, REITs are highly dependent upon management skill and often are not diversified. REITs also are subject to heavy cash flow dependency and to defaults by borrowers or lessees.
4
FUND PERFORMANCE
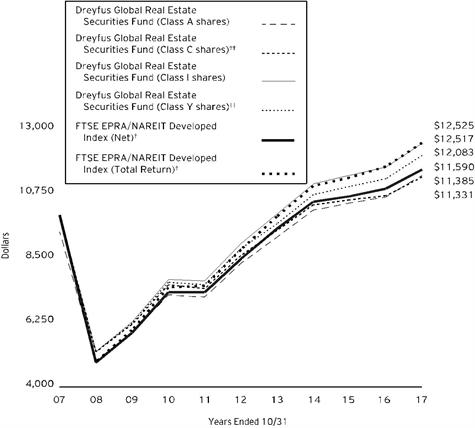
Comparison of change in value of $10,000 investment in Dreyfus Global Real Estate Securities Fund Class A shares, Class C shares, Class I shares and Class Y shares with: (1) the fund’s benchmark as of July 25, 2017, the FTSE EPRA/NAREIT Developed Index (Net) (the “Index”); and (2) the fund’s benchmark prior to July 25, 2017, FTSE EPRA/NAREIT Developed Index (Total Return).
† Source: Lipper Inc.
†† The total return figures presented for Class C shares of the fund reflect the performance of the fund’s Class A shares for the period prior to 9/13/08 (the inception date for Class C shares), not reflecting the applicable sales charges for Class A shares.
The total return figures presented for Class Y shares of the fund reflect the performance of the fund’s Class A shares for the period prior to 7/1/13 (the inception date for Class Y shares), not reflecting the applicable sales charges for Class A shares.
Past performance is not predictive of future performance.
The above graph compares a $10,000 investment made in each of the Class A, Class C, Class I and Class Y shares of Dreyfus Global Real Estate Securities Fund on 10/31/07 to a $10,000 investment made in the Index on that date. All dividends and capital gain distributions are reinvested.
The fund’s performance shown in the line graph above takes into account the maximum initial sales charge on Class A shares and all other applicable fees and expenses on all classes. The Index is designed to track the performance of listed real estate companies and REITs worldwide. The fund’s benchmark prior to July 25, 2017 was FTSE EPRA/NAREIT Developed Index (Total Return). Unlike a mutual fund, the Index is not subject to charges, fees and other expenses. Investors cannot invest directly in any index. Further information relating to fund performance, including expense reimbursements, if applicable, is contained in the Financial Highlights section of the prospectus and elsewhere in this report.
5
FUND PERFORMANCE (continued)
Average Annual Total Returns as of 10/31/17
|
|
| ||||
| Inception | 1 Year | 5 Years | |||
Date | 10 Years | |||||
Class A shares | ||||||
with maximum sales charge (5.75%) | 12/29/06 | 0.93% | 5.25% | 1.31% | ||
without sales charge | 12/29/06 | 7.05% | 6.50% | 1.91% | ||
Class C shares | ||||||
with applicable redemption charge † | 9/13/08 | 5.17% | 5.70% | 1.26% | †† | |
without redemption | 9/13/08 | 6.17% | 5.70% | 1.26% | †† | |
Class I shares | 12/29/06 | 7.24% | 6.78% | 2.27% | ||
Class Y shares | 7/1/13 | 7.26% | 6.50% | †† | 1.91% | †† |
FTSE EPRA/NAREIT Developed | 7.13% | 7.32% | 2.28% | |||
FTSE EPRA/NAREIT Developed | 6.12% | 6.45% | 1.49% | |||
† The maximum contingent deferred sales charge for Class C shares is 1% for shares redeemed within one year of the date of purchase.
†† The total return performance figures presented for Class C shares of the fund reflect the performance of the fund’s Class A shares for the period prior to 9/13/08 (the inception date for Class C shares), not reflecting the applicable sales charges for Class A shares. The total return figures presented for Class Y shares of the fund reflect the performance of the fund’s Class A shares for the period prior to 7/1/13 (the inception date for Class Y shares), not reflecting the applicable sales charges for Class A shares.
The performance data quoted represents past performance, which is no guarantee of future results. Share price and investment return fluctuate and an investor’s shares may be worth more or less than original cost upon redemption. Current performance may be lower or higher than the performance quoted. Go to Dreyfus.com for the fund’s most recent month-end returns.
The fund’s performance shown in the graph and table does not reflect the deduction of taxes that a shareholder would pay on fund distributions or the redemption of fund shares. In addition to the performance of Class A shares shown with and without a maximum sales charge, the fund’s performance shown in the table takes into account all other applicable fees and expenses on all classes.
6
UNDERSTANDING YOUR FUND’S EXPENSES (Unaudited)
As a mutual fund investor, you pay ongoing expenses, such as management fees and other expenses. Using the information below, you can estimate how these expenses affect your investment and compare them with the expenses of other funds. You also may pay one-time transaction expenses, including sales charges (loads) and redemption fees, which are not shown in this section and would have resulted in higher total expenses. For more information, see your fund’s prospectus or talk to your financial adviser.
Review your fund’s expenses
The table below shows the expenses you would have paid on a $1,000 investment in Dreyfus Global Real Estate Securities Fund from May 1, 2017 to October 31, 2017. It also shows how much a $1,000 investment would be worth at the close of the period, assuming actual returns and expenses.
Expenses and Value of a $1,000 Investment | |||||||||||
assuming actual returns for the six months ended October 31, 2017 | |||||||||||
|
|
|
| Class A | Class C | Class I | Class Y | ||||
Expenses paid per $1,000† | $6.67 | $10.49 | $5.39 | $5.28 | |||||||
Ending value (after expenses) | $1,035.10 | $1,030.00 | $1,036.70 | $1,035.60 | |||||||
COMPARING YOUR FUND’S EXPENSES
WITH THOSE OF OTHER FUNDS (Unaudited)
Using the SEC’s method to compare expenses
The Securities and Exchange Commission (“SEC”) has established guidelines to help investors assess fund expenses. Per these guidelines, the table below shows your fund’s expenses based on a $1,000 investment, assuming a hypothetical 5% annualized return. You can use this information to compare the ongoing expenses (but not transaction expenses or total cost) of investing in the fund with those of other funds. All mutual fund shareholder reports will provide this information to help you make this comparison. Please note that you cannot use this information to estimate your actual ending account balance and expenses paid during the period.
Expenses and Value of a $1,000 Investment | |||||||||||
assuming a hypothetical 5% annualized return for the six months ended October 31, 2017 | |||||||||||
|
|
|
| Class A | Class C | Class I | Class Y | ||||
Expenses paid per $1,000† | $6.61 | $10.41 | $5.35 | $5.24 | |||||||
Ending value (after expenses) | $1,018.65 | $1,014.87 | $1,019.91 | $1,020.01 | |||||||
† Expenses are equal to the fund’s annualized expense ratio of 1.30% for Class A, 2.05% for Class C, 1.05% for Class I and 1.03% for Class Y, multiplied by the average account value over the period, multiplied by 184/365 (to reflect the one-half year period).
7
STATEMENT OF INVESTMENTS
October 31, 2017
Description | Shares | Value ($) | |||||
Common Stocks - 100.0% | |||||||
Australia - 5.9% | |||||||
Dexus | 1,067,640 | 7,983,256 | |||||
Goodman Group | 755,231 | 4,832,221 | |||||
GPT Group | 2,209,200 | 8,606,241 | |||||
Mirvac Group | 1,738,200 | 3,206,103 | |||||
National Storage REIT | 1,249,450 | 1,410,495 | |||||
Scentre Group | 5,023,680 | 15,456,412 | |||||
Stockland | 893,090 | 3,089,544 | |||||
44,584,272 | |||||||
Belgium - .3% | |||||||
Aedifica | 20,530 | 1,956,195 | |||||
Canada - 2.3% | |||||||
Allied Properties Real Estate Investment Trust | 83,460 | 2,674,395 | |||||
Boardwalk Real Estate Investment Trust | 183,090 | 5,649,805 | |||||
RioCan Real Estate Investment Trust | 155,700 | 2,953,243 | |||||
SmartCentres Real Estate Investment Trust | 277,362 | 6,230,487 | |||||
17,507,930 | |||||||
France - 3.2% | |||||||
Gecina | 59,430 | 9,643,322 | |||||
Unibail-Rodamco | 57,520 | 14,395,410 | |||||
24,038,732 | |||||||
Germany - 4.9% | |||||||
Aroundtown | 765,910 | 5,407,442 | |||||
Deutsche Wohnen | 593,150 | 25,263,873 | |||||
Vonovia | 152,090 | 6,689,636 | |||||
37,360,951 | |||||||
Hong Kong - 8.0% | |||||||
CK Asset Holdings | 1,172,500 | 9,641,330 | |||||
Hang Lung Properties | 1,327,600 | 3,049,529 | |||||
Henderson Land Development | 771,370 | 5,027,837 | |||||
Hongkong Land Holdings | 843,500 | 6,115,375 | |||||
Link REIT | 1,477,500 | 12,414,454 | |||||
New World Development | 3,887,000 | 5,789,594 | |||||
Sun Hung Kai Properties | 735,000 | 12,021,688 | |||||
Wharf Holdings | 720,000 | 6,548,055 | |||||
60,607,862 | |||||||
Ireland - .7% | |||||||
Green REIT | 3,178,380 | 5,590,525 | |||||
Japan - 9.6% | |||||||
Activia Properties | 1,287 | 5,036,850 | |||||
8
Description | Shares | Value ($) | |||||
Common Stocks - 100.0% (continued) | |||||||
Japan - 9.6% (continued) | |||||||
Advance Residence Investment | 494 | 1,161,305 | |||||
GLP J-REIT | 3,007 | 3,017,446 | |||||
Hulic Reit | 2,094 | 2,918,948 | |||||
Japan Rental Housing Investments | 1,132 | 782,509 | |||||
Japan Retail Fund Investment | 1,816 | 3,216,590 | |||||
Kenedix Office Investment | 780 | 4,184,513 | |||||
Kenedix Retail REIT | 1,598 | 3,153,698 | |||||
Mitsubishi Estate | 688,100 | 12,378,599 | |||||
Mitsui Fudosan | 649,700 | 15,004,724 | |||||
Mori Hills REIT Investment | 2,421 | 2,823,311 | |||||
Nippon Prologis REIT | 793 | 1,665,436 | |||||
Orix JREIT | 3,513 | 4,822,825 | |||||
Sumitomo Realty & Development | 229,000 | 7,582,648 | |||||
Tokyo Tatemono | 171,300 | 2,381,824 | |||||
United Urban Investment | 2,100 | 3,015,962 | |||||
73,147,188 | |||||||
Norway - .6% | |||||||
Entra | 303,980 | a | 4,186,796 | ||||
Singapore - 2.1% | |||||||
CapitaLand | 2,199,200 | 5,921,109 | |||||
CapitaLand Commercial Trust | 1,402,985 | 1,785,767 | |||||
CapitaLand Mall Trust | 1,827,700 | 2,708,498 | |||||
CDL Hospitality Trusts | 1,342,795 | 1,610,645 | |||||
Mapletree Logistics Trust | 4,128,916 | 3,846,910 | |||||
15,872,929 | |||||||
Spain - .8% | |||||||
Inmobiliaria Colonial Socimi | 674,584 | 6,419,109 | |||||
Sweden - 1.6% | |||||||
Fabege | 207,870 | 4,389,985 | |||||
Hufvudstaden, Cl. A | 279,560 | 4,601,646 | |||||
Wihlborgs Fastigheter | 138,310 | 3,284,422 | |||||
12,276,053 | |||||||
Switzerland - .8% | |||||||
PSP Swiss Property | 67,650 | 5,953,661 | |||||
United Kingdom - 5.5% | |||||||
Assura | 4,171,250 | 3,346,174 | |||||
Empiric Student Property | 1,591,400 | 2,055,485 | |||||
Great Portland Estates | 658,360 | 5,434,379 | |||||
Land Securities Group | 868,410 | 11,141,594 | |||||
Safestore Holdings | 262,340 | 1,551,190 | |||||
Segro | 796,940 | 5,747,392 | |||||
Shaftesbury | 369,460 | 4,857,894 | |||||
Tritax Big Box REIT | 2,348,880 | 4,595,248 | |||||
9
STATEMENT OF INVESTMENTS (continued)
Description | Shares | Value ($) | |||||
Common Stocks - 100.0% (continued) | |||||||
United Kingdom - 5.5% (continued) | |||||||
UNITE Group | 345,430 | 3,225,231 | |||||
41,954,587 | |||||||
United States - 53.7% | |||||||
Alexandria Real Estate Equities | 102,510 | b | 12,707,140 | ||||
American Homes 4 Rent, Cl. A | 317,283 | b | 6,751,782 | ||||
AvalonBay Communities | 141,240 | b | 25,611,049 | ||||
Boston Properties | 136,420 | b | 16,531,376 | ||||
Camden Property Trust | 66,700 | b | 6,085,708 | ||||
Columbia Property Trust | 247,020 | b | 5,454,202 | ||||
CubeSmart | 714,344 | b | 19,444,444 | ||||
CyrusOne | 128,270 | b | 7,874,495 | ||||
DDR | 479,300 | b | 3,676,231 | ||||
Douglas Emmett | 262,303 | b | 10,437,036 | ||||
Duke Realty | 359,850 | b | 10,248,528 | ||||
Equinix | 25,650 | b | 11,888,775 | ||||
Essex Property Trust | 49,970 | b | 13,113,627 | ||||
Federal Realty Investment Trust | 33,280 | b | 4,010,906 | ||||
GGP | 360,480 | b | 7,014,941 | ||||
HCP | 598,140 | b | 15,455,938 | ||||
Healthcare Trust of America, Cl. A | 521,350 | b | 15,666,567 | ||||
Highwoods Properties | 100,320 | b | 5,121,336 | ||||
Hilton Worldwide Holdings | 167,128 | 12,080,012 | |||||
Host Hotels & Resorts | 279,760 | b | 5,472,106 | ||||
JBG SMITH Properties | 194,360 | b,c | 6,065,976 | ||||
Kilroy Realty | 111,693 | b | 7,955,892 | ||||
Kimco Realty | 235,282 | b | 4,272,721 | ||||
LaSalle Hotel Properties | 219,490 | b | 6,191,813 | ||||
Macerich | 56,550 | b | 3,087,630 | ||||
Mack-Cali Realty | 289,930 | b | 6,601,706 | ||||
Medical Properties Trust | 381,270 | b | 5,044,202 | ||||
Prologis | 387,300 | b | 25,011,834 | ||||
Public Storage | 15,010 | b | 3,110,822 | ||||
Regency Centers | 145,350 | b | 8,946,292 | ||||
Simon Property Group | 215,304 | b | 33,443,170 | ||||
STAG Industrial | 233,181 | b | 6,365,841 | ||||
Starwood Waypoint Homes | 421,890 | 15,318,826 | |||||
STORE Capital | 329,870 | b | 8,144,490 | ||||
Sun Communities | 100,680 | b | 9,087,377 | ||||
Sunstone Hotel Investors | 348,710 | b | 5,690,947 | ||||
UDR | 319,510 | b | 12,393,793 | ||||
Urban Edge Properties | 219,550 | b | 5,150,643 | ||||
VEREIT | 861,737 | b | 6,799,105 | ||||
Vornado Realty Trust | 73,180 | b | 5,478,255 | ||||
10
Description | Shares | Value ($) | |||||
Common Stocks - 100.0% (continued) | |||||||
United States - 53.7% (continued) | |||||||
Welltower | 142,310 | b | 9,529,078 | ||||
408,336,612 | |||||||
Total Common Stocks (cost $671,635,863) | 759,793,402 | ||||||
Other Investment - .0% | |||||||
Registered Investment Company; | |||||||
Dreyfus Institutional Preferred Government Plus Money Market Fund | 102,408 | d | 102,408 | ||||
Total Investments (cost $671,738,271) | 100.0% | 759,895,810 | |||||
Cash and Receivables (Net) | .0% | 343,523 | |||||
Net Assets | 100.0% | 760,239,333 | |||||
REIT—Real Estate Investment Trust
a Security exempt from registration pursuant to Rule 144A under the Securities Act of 1933. These securities may be resold in transactions exempt from registration, normally to qualified institutional buyers. At October 31, 2017, these securities were valued at $4,186,796 or .55% of net assets.
b Investment in real estate investment trust.
c Non-income producing security.
d Investment in affiliated money market mutual fund.
Portfolio Summary (Unaudited) † | Value (%) |
Diversified | 22.6 |
Multifamily | 9.2 |
Industrial | 7.8 |
Retail | 7.1 |
Office Infill | 6.6 |
Health Care | 6.5 |
Regional Malls | 5.7 |
Shopping Centers | 5.0 |
Residential | 4.5 |
Alternate Housing | 4.4 |
Hotel | 4.1 |
Office | 3.7 |
Real Estate Services | 3.4 |
Self-Storage | 3.4 |
Data Center | 2.6 |
Office Suburban | 2.3 |
Freestanding | 1.1 |
Money Market Investment | .0 |
100.0 |
† Based on net assets.
See notes to financial statements.
11
STATEMENT OF INVESTMENTS IN AFFILIATED ISSUERS
Registered Investment Company | Value | Purchases ($) | Sales ($) | Value | Net | Dividends/ |
Dreyfus Institutional Preferred Government Plus Money Market Fund | 5,563,413 | 149,640,972 | 155,101,977 | 102,408 | .0 | 24,547 |
See notes to financial statements.
12
STATEMENT OF FORWARD FOREIGN CURRENCY EXCHANGE CONTRACTS October 31, 2017
Counterparty/ Purchased | Purchased Currency | Currency | Sold | Settlement Date | Unrealized Appreciation (Depreciation)($) |
Deutsche Bank | |||||
Singapore Dollar | 49,700 | United States Dollar | 36,480 | 11/1/17 | (19) |
United States Dollar | 175,708 | Euro | 151,000 | 11/1/17 | (184) |
United States Dollar | 186,344 | Euro | 160,000 | 11/2/17 | (32) |
United States Dollar | 33,201 | Hong Kong Dollars | 259,000 | 11/1/17 | 2 |
United States Dollar | 25,426 | Norwegian Krone | 208,000 | 11/2/17 | (39) |
Northern Trust Bank | |||||
United States Dollar | 132,645 | Australian Dollar | 173,000 | 11/1/17 | 239 |
United States Dollar | 447,274 | Australian Dollar | 585,000 | 11/2/17 | (457) |
United States Dollar | 34,106 | Swiss Franc | 34,000 | 11/2/17 | 26 |
United States Dollar | 27,731 | British Pound | 21,000 | 11/1/17 | (160) |
United States Dollar | 185,770 | British Pound | 140,000 | 11/2/17 | (170) |
United States Dollar | 273,743 | Hong Kong Dollars | 2,135,000 | 11/2/17 | 74 |
United States Dollar | 149,826 | Japanese Yen | 17,000,000 | 11/2/17 | 316 |
United States Dollar | 49,672 | Norwegian Krone | 406,550 | 11/1/17 | (102) |
United States Dollar | 78,480 | Singapore Dollar | 107,000 | 11/1/17 | (18) |
Gross Unrealized Appreciation | 657 | ||||
Gross Unrealized Depreciation | (1,181) | ||||
See notes to financial statements.
13
STATEMENT OF ASSETS AND LIABILITIES
October 31, 2017
|
|
|
|
|
|
|
|
|
| Cost |
| Value |
|
Assets ($): |
|
|
|
| ||
Investments in securities—See Statement of Investments: |
|
|
| |||
Unaffiliated issuers | 671,635,863 |
| 759,793,402 |
| ||
Affiliated issuers |
| 102,408 |
| 102,408 |
| |
Cash |
|
|
|
| 291,954 |
|
Cash denominated in foreign currency |
|
| 821,849 |
| 820,135 |
|
Receivable for investment securities sold |
| 9,581,298 |
| |||
Dividends receivable |
| 1,135,934 |
| |||
Receivable for shares of Common Stock subscribed |
| 738,193 |
| |||
Unrealized appreciation on forward foreign |
| 657 |
| |||
Prepaid expenses |
|
|
|
| 21,627 |
|
|
|
|
|
| 772,485,608 |
|
Liabilities ($): |
|
|
|
| ||
Due to The Dreyfus Corporation and affiliates—Note 3(c) |
|
|
|
| 677,222 |
|
Payable for investment securities purchased |
| 5,824,378 |
| |||
Note payable—Note 2 |
| 4,100,000 |
| |||
Payable for shares of Common Stock redeemed |
| 1,505,674 |
| |||
Unrealized depreciation on forward foreign |
| 1,181 |
| |||
Interest payable—Note 2 |
| 238 |
| |||
Accrued expenses |
|
|
|
| 137,582 |
|
|
|
|
|
| 12,246,275 |
|
Net Assets ($) |
|
| 760,239,333 |
| ||
Composition of Net Assets ($): |
|
|
|
| ||
Paid-in capital |
|
|
|
| 674,601,513 |
|
Accumulated distributions in excess of investment income—net |
| (8,404,849) |
| |||
Accumulated net realized gain (loss) on investments |
|
|
|
| 5,900,564 |
|
Accumulated net unrealized appreciation (depreciation) |
|
|
| 88,142,105 |
| |
Net Assets ($) |
|
| 760,239,333 |
| ||
Net Asset Value Per Share | Class A | Class C | Class I | Class Y |
|
Net Assets ($) | 12,510,279 | 917,549 | 144,780,557 | 602,030,948 |
|
Shares Outstanding | 1,367,981 | 102,710 | 16,037,098 | 66,643,077 |
|
Net Asset Value Per Share ($) | 9.15 | 8.93 | 9.03 | 9.03 |
|
See notes to financial statements. |
14
STATEMENT OF OPERATIONS
Year Ended October 31, 2017
|
|
|
|
|
|
|
|
|
|
|
|
|
|
Investment Income ($): |
|
|
|
| ||
Income: |
|
|
|
| ||
Cash dividends (net of $1,130,639 foreign taxes withheld at source): |
| |||||
Unaffiliated issuers |
|
| 18,942,384 |
| ||
Affiliated issuers |
|
| 24,547 |
| ||
Total Income |
|
| 18,966,931 |
| ||
Expenses: |
|
|
|
| ||
Management fee—Note 3(a) |
|
| 7,267,084 |
| ||
Custodian fees—Note 3(c) |
|
| 210,925 |
| ||
Shareholder servicing costs—Note 3(c) |
|
| 172,458 |
| ||
Professional fees |
|
| 117,629 |
| ||
Directors’ fees and expenses—Note 3(d) |
|
| 115,427 |
| ||
Registration fees |
|
| 71,610 |
| ||
Loan commitment fees—Note 2 |
|
| 17,231 |
| ||
Prospectus and shareholders’ reports |
|
| 11,251 |
| ||
Distribution fees—Note 3(b) |
|
| 7,375 |
| ||
Interest expense—Note 2 |
|
| 1,745 |
| ||
Miscellaneous |
|
| 45,203 |
| ||
Total Expenses |
|
| 8,037,938 |
| ||
Less—reduction in expenses due to undertaking—Note 3(a) |
|
| (100,955) |
| ||
Less—reduction in fees due to earnings credits—Note 3(c) |
|
| (377) |
| ||
Net Expenses |
|
| 7,936,606 |
| ||
Investment Income—Net |
|
| 11,030,325 |
| ||
Realized and Unrealized Gain (Loss) on Investments—Note 4 ($): |
|
| ||||
Net realized gain (loss) on investments and foreign currency transactions | 23,430,061 |
| ||||
Net realized gain (loss) on forward foreign currency exchange contracts | 29,308 |
| ||||
Net Realized Gain (Loss) |
|
| 23,459,369 |
| ||
Net unrealized appreciation (depreciation) on investments |
|
| 18,005,084 |
| ||
Net unrealized appreciation (depreciation) on |
|
| (429) |
| ||
Net Unrealized Appreciation (Depreciation) |
|
| 18,004,655 |
| ||
Net Realized and Unrealized Gain (Loss) on Investments |
|
| 41,464,024 |
| ||
Net Increase in Net Assets Resulting from Operations |
| 52,494,349 |
| |||
See notes to financial statements. | ||||||
15
STATEMENT OF CHANGES IN NET ASSETS
|
|
|
| Year Ended October 31, | |||||
|
|
|
| 2017 |
| 2016 |
| ||
Operations ($): |
|
|
|
|
|
|
|
| |
Investment income—net |
|
| 11,030,325 |
|
|
| 16,769,446 |
| |
Net realized gain (loss) on investments |
| 23,459,369 |
|
|
| 22,430,434 |
| ||
Net unrealized appreciation (depreciation) |
| 18,004,655 |
|
|
| (22,041,815) |
| ||
Net Increase (Decrease) in Net Assets | 52,494,349 |
|
|
| 17,158,065 |
| |||
Distributions to Shareholders from ($): |
| ||||||||
Investment income—net: |
|
|
|
|
|
|
|
| |
Class A |
|
| (316,108) |
|
|
| (168,780) |
| |
Class C |
|
| (31,345) |
|
|
| (12,796) |
| |
Class I |
|
| (6,873,038) |
|
|
| (3,493,080) |
| |
Class Y |
|
| (26,380,907) |
|
|
| (13,430,322) |
| |
Net realized gain on investments: |
|
|
|
|
|
|
|
| |
Class A |
|
| (112,661) |
|
|
| (250,341) |
| |
Class C |
|
| (14,579) |
|
|
| (29,056) |
| |
Class I |
|
| (2,450,489) |
|
|
| (4,330,069) |
| |
Class Y |
|
| (9,163,442) |
|
|
| (16,536,567) |
| |
Total Distributions |
|
| (45,342,569) |
|
|
| (38,251,011) |
| |
Capital Stock Transactions ($): |
| ||||||||
Net proceeds from shares sold: |
|
|
|
|
|
|
|
| |
Class A |
|
| 7,729,917 |
|
|
| 1,951,366 |
| |
Class C |
|
| 212,649 |
|
|
| 100,560 |
| |
Class I |
|
| 46,629,898 |
|
|
| 42,880,851 |
| |
Class Y |
|
| 80,901,499 |
|
|
| 88,657,982 |
| |
Distributions reinvested: |
|
|
|
|
|
|
|
| |
Class A |
|
| 409,737 |
|
|
| 396,895 |
| |
Class C |
|
| 33,402 |
|
|
| 30,741 |
| |
Class I |
|
| 9,042,082 |
|
|
| 7,496,538 |
| |
Class Y |
|
| 12,149,390 |
|
|
| 12,947,399 |
| |
Cost of shares redeemed: |
|
|
|
|
|
|
|
| |
Class A |
|
| (3,962,110) |
|
|
| (6,098,124) |
| |
Class C |
|
| (358,503) |
|
|
| (120,720) |
| |
Class I |
|
| (70,124,253) |
|
|
| (40,508,172) |
| |
Class Y |
|
| (106,223,880) |
|
|
| (71,920,955) |
| |
Increase (Decrease) in Net Assets | (23,560,172) |
|
|
| 35,814,361 |
| |||
Total Increase (Decrease) in Net Assets | (16,408,392) |
|
|
| 14,721,415 |
| |||
Net Assets ($): |
| ||||||||
Beginning of Period |
|
| 776,647,725 |
|
|
| 761,926,310 |
| |
End of Period |
|
| 760,239,333 |
|
|
| 776,647,725 |
| |
Undistributed (distributions in excess of) | (8,404,849) |
|
|
| 5,980,235 |
| |||
16
|
|
|
| Year Ended October 31, | |||||
|
|
|
| 2017 |
| 2016 |
| ||
Capital Share Transactions (Shares): |
| ||||||||
Class A |
|
|
|
|
|
|
|
| |
Shares sold |
|
| 872,093 |
|
|
| 209,346 |
| |
Shares issued for distributions reinvested |
|
| 48,225 |
|
|
| 45,412 |
| |
Shares redeemed |
|
| (444,490) |
|
|
| (669,568) |
| |
Net Increase (Decrease) in Shares Outstanding | 475,828 |
|
|
| (414,810) |
| |||
Class C |
|
|
|
|
|
|
|
| |
Shares sold |
|
| 24,719 |
|
|
| 11,048 |
| |
Shares issued for distributions reinvested |
|
| 3,995 |
|
|
| 3,579 |
| |
Shares redeemed |
|
| (40,746) |
|
|
| (13,261) |
| |
Net Increase (Decrease) in Shares Outstanding | (12,032) |
|
|
| 1,366 |
| |||
Class Ia |
|
|
|
|
|
|
|
| |
Shares sold |
|
| 5,330,811 |
|
|
| 4,766,592 |
| |
Shares issued for distributions reinvested |
|
| 1,080,171 |
|
|
| 869,668 |
| |
Shares redeemed |
|
| (7,917,888) |
|
|
| (4,531,707) |
| |
Net Increase (Decrease) in Shares Outstanding | (1,506,906) |
|
|
| 1,104,553 |
| |||
Class Ya |
|
|
|
|
|
|
|
| |
Shares sold |
|
| 9,193,788 |
|
|
| 9,806,843 |
| |
Shares issued for distributions reinvested |
|
| 1,448,346 |
|
|
| 1,502,018 |
| |
Shares redeemed |
|
| (12,097,207) |
|
|
| (7,966,147) |
| |
Net Increase (Decrease) in Shares Outstanding | (1,455,073) |
|
|
| 3,342,714 |
| |||
a During the period ended October 31, 2017, 1,009,016 Class Y shares representing $8,911,834 were exchanged for 1,009,559 Class I shares and during the period ended October 31, 2016, 356,930 Class Y shares representing $3,268,326 were exchanged for 357,267 Class I shares. | |||||||||
See notes to financial statements. | |||||||||
17
FINANCIAL HIGHLIGHTS
The following tables describe the performance for each share class for the fiscal periods indicated. All information (except portfolio turnover rate) reflects financial results for a single fund share. Total return shows how much your investment in the fund would have increased (or decreased) during each period, assuming you had reinvested all dividends and distributions. These figures have been derived from the fund’s financial statements.
Ten Months | |||||||||
Year Ended October 31, | Year Ended | ||||||||
Class A Shares | 2017 | 2016 | 2015 | 2014 | 2013a | 2012 | |||
Per Share Data ($): | |||||||||
Net asset value, | 9.06 | 9.31 | 9.34 | 8.71 | 8.23 | 6.84 | |||
Investment Operations: | |||||||||
Investment income—netb | .10 | .17 | .13 | .12 | .09 | .09 | |||
Net realized and unrealized | .50 | .01 | .09 | .73 | .41 | 1.72 | |||
Total from Investment | .60 | .18 | .22 | .85 | .50 | 1.81 | |||
Distributions: | |||||||||
Dividends from investment | (.37) | (.17) | (.21) | (.22) | (.02) | (.42) | |||
Dividends from net realized | (.14) | (.26) | (.04) | - | - | - | |||
Total Distributions | (.51) | (.43) | (.25) | (.22) | (.02) | (.42) | |||
Net asset value, end of period | 9.15 | 9.06 | 9.31 | 9.34 | 8.71 | 8.23 | |||
Total Return (%)c | 7.05 | 2.10 | 2.41 | 10.15 | 6.07d | 26.50 | |||
Ratios/Supplemental Data (%): | |||||||||
Ratio of total expenses to | 2.30 | 1.78 | 1.64 | 1.45 | 1.51e | 1.55 | |||
Ratio of net expenses to | 1.30 | 1.30 | 1.30 | 1.30 | 1.34e | 1.43 | |||
Ratio of net investment income to | 1.15 | 1.90 | 1.37 | 1.37 | 1.23e | 1.13 | |||
Portfolio Turnover Rate | 75.07 | 60.90 | 55.84 | 50.46 | 44.80d | 46.17 | |||
Net Assets, end of period | 12,510 | 8,086 | 12,169 | 12,957 | 9,812 | 9,478 | |||
a The fund has changed its fiscal year end from December 31 to October 31.
b Based on average shares outstanding.
c Exclusive of sales charge.
d Not annualized.
e Annualized.
See notes to financial statements.
18
Ten Months | |||||||||
Year Ended October 31, | Year Ended | ||||||||
Class C Shares | 2017 | 2016 | 2015 | 2014 | 2013a | 2012 | |||
Per Share Data ($): | |||||||||
Net asset value, | 8.85 | 9.11 | 9.13 | 8.55 | 8.11 | 6.76 | |||
Investment Operations: | |||||||||
Investment income—netb | .04 | .10 | .06 | .07 | .04 | .06 | |||
Net realized and unrealized | .48 | .01 | .10 | .70 | .40 | 1.66 | |||
Total from Investment | .52 | .11 | .16 | .77 | .44 | 1.72 | |||
Distributions: | |||||||||
Dividends from investment | (.30) | (.11) | (.14) | (.19) | - | (.37) | |||
Dividends from net realized | (.14) | (.26) | (.04) | - | - | - | |||
Total Distributions | (.44) | (.37) | (.18) | (.19) | - | (.37) | |||
Net asset value, end of period | 8.93 | 8.85 | 9.11 | 9.13 | 8.55 | 8.11 | |||
Total Return (%)c | 6.17 | 1.33 | 1.71 | 9.37 | 5.30d | 25.61 | |||
Ratios/Supplemental Data (%): | |||||||||
Ratio of total expenses to | 2.25 | 2.24 | 2.25 | 2.24 | 2.21e | 2.29 | |||
Ratio of net expenses to | 2.05 | 2.05 | 2.05 | 2.05 | 2.09e | 2.19 | |||
Ratio of net investment income to | .43 | 1.15 | .61 | .79 | .57e | .72 | |||
Portfolio Turnover Rate | 75.07 | 60.90 | 55.84 | 50.46 | 44.80d | 46.17 | |||
Net Assets, end of period | 918 | 1,016 | 1,033 | 1,035 | 1,304 | 1,134 | |||
a The fund has changed its fiscal year end from December 31 to October 31.
b Based on average shares outstanding.
c Exclusive of sales charge.
d Not annualized.
e Annualized.
See notes to financial statements.
19
FINANCIAL HIGHLIGHTS (continued)
Ten Months | |||||||||
Year Ended October 31, | Year Ended | ||||||||
Class I Shares | 2017 | 2016 | 2015 | 2014 | 2013a | 2012 | |||
Per Share Data ($): | |||||||||
Net asset value, | 8.96 | 9.22 | 9.25 | 8.62 | 8.13 | 6.75 | |||
Investment Operations: | |||||||||
Investment income—netb | .13 | .20 | .15 | .22 | .10 | .15 | |||
Net realized and unrealized | .48 | .01 | .10 | .65 | .42 | 1.66 | |||
Total from Investment | .61 | .21 | .25 | .87 | .52 | 1.81 | |||
Distributions: | |||||||||
Dividends from investment | (.40) | (.21) | (.24) | (.24) | (.03) | (.43) | |||
Dividends from net realized | (.14) | (.26) | (.04) | - | - | - | |||
Total Distributions | (.54) | (.47) | (.28) | (.24) | (.03) | (.43) | |||
Net asset value, end of period | 9.03 | 8.96 | 9.22 | 9.25 | 8.62 | 8.13 | |||
Total Return (%) | 7.24 | 2.41 | 2.69 | 10.46 | 6.41c | 26.92 | |||
Ratios/Supplemental Data (%): | |||||||||
Ratio of total expenses to | 1.05 | 1.03 | 1.03 | 1.02 | 1.04d | 1.07 | |||
Ratio of net expenses to | 1.05 | 1.03 | 1.03 | 1.02 | 1.04d | 1.07 | |||
Ratio of net investment income to | 1.45 | 2.18 | 1.63 | 2.59 | 1.43d | 1.90 | |||
Portfolio Turnover Rate | 75.07 | 60.90 | 55.84 | 50.46 | 44.80c | 46.17 | |||
Net Assets, end of period | 144,781 | 157,168 | 151,538 | 151,475 | 662,525 | 461,583 | |||
a The fund has changed its fiscal year end from December 31 to October 31.
b Based on average shares outstanding.
c Not annualized.
d Annualized.
See notes to financial statements.
20
Year Ended October 31, | |||||||||
Class Y Shares | 2017 | 2016 | 2015 | 2014 | 2013a | ||||
Per Share Data ($): | |||||||||
Net asset value, | 8.96 | 9.22 | 9.25 | 8.62 | 8.16 | ||||
Investment Operations: | |||||||||
Investment income (loss)—netb | .13 | .20 | .15 | (.06) | .01 | ||||
Net realized and unrealized | .48 | .01 | .10 | .93 | .45 | ||||
Total from Investment | .61 | .21 | .25 | .87 | .46 | ||||
Distributions: | |||||||||
Dividends from investment | (.40) | (.21) | (.24) | (.24) | - | ||||
Dividends from net realized | (.14) | (.26) | (.04) | - | - | ||||
Total Distributions | (.54) | (.47) | (.28) | (.24) | - | ||||
Net asset value, end of period | 9.03 | 8.96 | 9.22 | 9.25 | 8.62 | ||||
Total Return (%) | 7.26 | 2.42 | 2.70 | 10.45 | 5.64c | ||||
Ratios/Supplemental Data (%): | |||||||||
Ratio of total expenses to | 1.03 | 1.01 | 1.01 | 1.02 | 1.06d | ||||
Ratio of net expenses to | 1.03 | 1.01 | 1.01 | 1.02 | 1.05d | ||||
Ratio of net investment income (loss) to | 1.45 | 2.19 | 1.63 | (.70) | .23d | ||||
Portfolio Turnover Rate | 75.07 | 60.90 | 55.84 | 50.46 | 44.80c | ||||
Net Assets, end of period | 602,031 | 610,377 | 597,186 | 586,538 | 1 | ||||
a From July 1, 2013 (commencement of initial offering) to October 31, 2013.
b Based on average shares outstanding.
c Not annualized.
d Annualized.
See notes to financial statements.
21
NOTES TO FINANCIAL STATEMENTS
NOTE 1—Significant Accounting Policies:
Dreyfus Global Real Estate Securities Fund (the “fund”) is a separate diversified series of Dreyfus Premier Investment Funds, Inc. (the “Company”), which is registered under the Investment Company Act of 1940, as amended (the “Act”), as an open-end management investment company and operates as a series company currently offering five series, including the fund. The fund’s investment objective is to seek to maximize total return consisting of capital appreciation and current income. The Dreyfus Corporation (the “Manager” or “Dreyfus”), a wholly-owned subsidiary of The Bank of New York Mellon Corporation (“BNY Mellon”), serves as the fund’s investment adviser. CenterSquare Investment Management, Inc. (“CenterSquare”), a wholly-owned subsidiary of BNY Mellon and an affiliate of Dreyfus, serves as the fund’s sub-investment adviser.
Effective March 31, 2017, the fund authorized the issuance of Class T shares, but, as of the date of this report, the fund did not offer Class T shares for purchase. The fund authorized 100 million Class T shares which resulted in the fund’s total authorized shares increasing from 650 million to 750 million.
MBSC Securities Corporation (the “Distributor”), a wholly-owned subsidiary of Dreyfus, is the distributor of the fund’s shares. The fund is authorized to issue 750 million shares of $.001 par value Common Stock. The fund currently has authorized five classes of shares: Class A (100 million shares authorized), Class C (50 million shares authorized), Class I (400 million shares authorized), Class T (100 million shares authorized) and Class Y (100 million shares authorized). Class A and Class T shares generally are subject to a sales charge imposed at the time of purchase. Class C shares are subject to a contingent deferred sales charge (“CDSC”) imposed on Class C shares redeemed within one year of purchase. Class I and Class Y shares are sold at net asset value per share generally to institutional investors. Other differences between the classes include the services offered to and the expenses borne by each class, the allocation of certain transfer agency costs, and certain voting rights. Income, expenses (other than expenses attributable to a specific class), and realized and unrealized gains or losses on investments are allocated to each class of shares based on its relative net assets.
The Company accounts separately for the assets, liabilities and operations of each series. Expenses directly attributable to each series are charged to
22
that series’ operations; expenses which are applicable to all series are allocated among them on a pro rata basis.
The Financial Accounting Standards Board (“FASB”) Accounting Standards Codification (“ASC”) is the exclusive reference of authoritative U.S. generally accepted accounting principles (“GAAP”) recognized by the FASB to be applied by nongovernmental entities. Rules and interpretive releases of the Securities and Exchange Commission (“SEC”) under authority of federal laws are also sources of authoritative GAAP for SEC registrants. The fund’s financial statements are prepared in accordance with GAAP, which may require the use of management estimates and assumptions. Actual results could differ from those estimates.
The Company enters into contracts that contain a variety of indemnifications. The fund’s maximum exposure under these arrangements is unknown. The fund does not anticipate recognizing any loss related to these arrangements.
(a) Portfolio valuation: The fair value of a financial instrument is the amount that would be received to sell an asset or paid to transfer a liability in an orderly transaction between market participants at the measurement date (i.e., the exit price). GAAP establishes a fair value hierarchy that prioritizes the inputs of valuation techniques used to measure fair value. This hierarchy gives the highest priority to unadjusted quoted prices in active markets for identical assets or liabilities (Level 1 measurements) and the lowest priority to unobservable inputs (Level 3 measurements).
Additionally, GAAP provides guidance on determining whether the volume and activity in a market has decreased significantly and whether such a decrease in activity results in transactions that are not orderly. GAAP requires enhanced disclosures around valuation inputs and techniques used during annual and interim periods.
Various inputs are used in determining the value of the fund’s investments relating to fair value measurements. These inputs are summarized in the three broad levels listed below:
Level 1—unadjusted quoted prices in active markets for identical investments.
Level 2—other significant observable inputs (including quoted prices for similar investments, interest rates, prepayment speeds, credit risk, etc.).
Level 3—significant unobservable inputs (including the fund’s own assumptions in determining the fair value of investments).
23
NOTES TO FINANCIAL STATEMENTS (continued)
The inputs or methodology used for valuing securities are not necessarily an indication of the risk associated with investing in those securities.
Changes in valuation techniques may result in transfers in or out of an assigned level within the disclosure hierarchy. Valuation techniques used to value the fund’s investments are as follows:
Investments in securities are valued at the last sales price on the securities exchange or national securities market on which such securities are primarily traded. Securities listed on the National Market System for which market quotations are available are valued at the official closing price or, if there is no official closing price that day, at the last sales price. For open short positions, asked prices are used for valuation purposes. Bid price is used when no asked price is available. Registered investment companies that are not traded on an exchange are valued at their net asset value. All of the preceding securities are generally categorized within Level 1 of the fair value hierarchy.
Securities not listed on an exchange or the national securities market, or securities for which there were no transactions, are valued at the average of the most recent bid and asked prices. These securities are generally categorized within Level 2 of the fair value hierarchy.
Fair valuing of securities may be determined with the assistance of a pricing service using calculations based on indices of domestic securities and other appropriate indicators, such as prices of relevant American Depository Receipts and futures. Utilizing these techniques may result in transfers between Level 1 and Level 2 of the fair value hierarchy.
When market quotations or official closing prices are not readily available, or are determined to not accurately reflect fair value, such as when the value of a security has been significantly affected by events after the close of the exchange or market on which the security is principally traded (for example, a foreign exchange or market), but before the fund calculates its net asset value, the fund may value these investments at fair value as determined in accordance with the procedures approved by the Company’s Board of Directors (the “Board”). Certain factors may be considered when fair valuing investments such as: fundamental analytical data, the nature and duration of restrictions on disposition, an evaluation of the forces that influence the market in which the securities are purchased and sold, and public trading in similar securities of the issuer or comparable issuers. These securities are either categorized within Level 2 or 3 of the fair value hierarchy depending on the relevant inputs used.
24
For restricted securities where observable inputs are limited, assumptions about market activity and risk are used and are generally categorized within Level 3 of the fair value hierarchy.
Investments denominated in foreign currencies are translated to U.S. dollars at the prevailing rates of exchange.
Forward foreign currency exchange contracts (“forward contracts”) are valued at the forward rate and are generally categorized within Level 2 of the fair value hierarchy.
The following is a summary of the inputs used as of October 31, 2017 in valuing the fund’s investments:
Level 1 - Unadjusted Quoted Prices | Level 2 - Other Significant Observable Inputs |
| Level 3 -Significant Unobservable Inputs | Total | |
Assets ($) | |||||
Investments in Securities: | |||||
Equity Securities - Domestic Common Stocks | 408,336,612 | - | - | 408,336,612 | |
Equity Securities - Foreign Common Stocks | 351,456,790 | - | - | 351,456,790 | |
Registered Investment Company | 102,408 | - | - | 102,408 | |
Other Financial Instruments: | |||||
Forward Foreign Currency Exchange Contracts† | - | 657 | - | 657 | |
Liabilities ($) | |||||
Other Financial Instruments: | |||||
Forward Foreign Currency Exchange Contracts† | - | (1,181) | - | (1,181) | |
† Amount shown represents unrealized appreciation (depreciation) at period end.
At October 31, 2017, there were no transfers between levels of the fair value hierarchy. It is the fund’s policy to recognize transfers between levels at the end of the reporting period.
(b) Foreign currency transactions: The fund does not isolate that portion of the results of operations resulting from changes in foreign
25
NOTES TO FINANCIAL STATEMENTS (continued)
exchange rates on investments from the fluctuations arising from changes in the market prices of securities held. Such fluctuations are included with the net realized and unrealized gain or loss on investments.
Net realized foreign exchange gains or losses arise from sales of foreign currencies, currency gains or losses realized on securities transactions between trade and settlement date, and the difference between the amounts of dividends, interest and foreign withholding taxes recorded on the fund’s books and the U.S. dollar equivalent of the amounts actually received or paid. Net unrealized foreign exchange gains and losses arise from changes in the value of assets and liabilities other than investments resulting from changes in exchange rates. Foreign currency gains and losses on foreign currency transactions are also included with net realized and unrealized gain or loss on investments.
(c) Securities transactions and investment income: Securities transactions are recorded on a trade date basis. Realized gains and losses from securities transactions are recorded on the identified cost basis. Dividend income is recognized on the ex-dividend date and interest income, including, where applicable, accretion of discount and amortization of premium on investments, is recognized on the accrual basis.
(d) Affiliated issuers: Investments in other investment companies advised by Dreyfus are defined as “affiliated” under the Act.
(e) Risk: Investing in foreign markets may involve special risks and considerations not typically associated with investing in the U.S. These risks include revaluation of currencies, high rates of inflation, repatriation restrictions on income and capital, and adverse political and economic developments. Moreover, securities issued in these markets may be less liquid, subject to government ownership controls and delayed settlements, and their prices may be more volatile than those of comparable securities in the U.S.
(f) Dividends and distributions to shareholders: Dividends and distributions are recorded on the ex-dividend date. Dividends from investment income-net and dividends from net realized capital gains, if any, are normally declared and paid annually, but the fund may make distributions on a more frequent basis to comply with the distribution requirements of the Internal Revenue Code of 1986, as amended (the “Code”). To the extent that net realized capital gains can be offset by capital loss carryovers, it is the policy of the fund not to distribute such gains. Income and capital gain distributions are determined in accordance with income tax regulations, which may differ from GAAP.
26
(g) Federal income taxes: It is the policy of the fund to continue to qualify as a regulated investment company, if such qualification is in the best interests of its shareholders, by complying with the applicable provisions of the Code, and to make distributions of taxable income sufficient to relieve it from substantially all federal income and excise taxes.
As of and during the period ended October 31, 2017, the fund did not have any liabilities for any uncertain tax positions. The fund recognizes interest and penalties, if any, related to uncertain tax positions as income tax expense in the Statement of Operations. During the period ended October 31, 2017, the fund did not incur any interest or penalties.
Each tax year in the four-year period ended October 31, 2017 remains subject to examination by the Internal Revenue Service and state taxing authorities.
At October 31, 2017, the components of accumulated earnings on a tax basis were as follows: undistributed ordinary income $11,244,960, undistributed capital gains $13,535,122 and unrealized appreciation $60,857,738.
The tax character of distributions paid to shareholders during the fiscal periods ended October 31, 2017 and October 31, 2016 were as follows: ordinary income $39,001,604 and $17,945,545, and long term capital gains $6,340,965 and $20,305,466, respectively.
During the period ended October 31, 2017, as a result of permanent book to tax differences, primarily due to the tax treatment for foreign currency gains and losses and passive foreign investment companies, the fund increased accumulated undistributed investment income-net by $8,185,989 and decreased accumulated net realized gain (loss) on investments by the same amount. Net assets and net asset value per share were not affected by this reclassification.
NOTE 2—Bank Lines of Credit:
The fund participates with other Dreyfus-managed funds in an $830 million unsecured credit facility led by Citibank, N.A. and a $300 million unsecured credit facility provided by The Bank of New York Mellon, a subsidiary of BNY Mellon and an affiliate of Dreyfus (each, a “Facility”), each to be utilized primarily for temporary or emergency purposes, including the financing of redemptions. Prior to October 4, 2017, the unsecured credit facility with Citibank, N.A. was $810 million. In connection therewith, the fund has agreed to pay its pro rata portion of commitment fees for each Facility. Interest is charged to the fund based on
27
NOTES TO FINANCIAL STATEMENTS (continued)
rates determined pursuant to the terms of the respective Facility at the time of borrowing.
The average amount of borrowings outstanding under the Facilities during the period ended October 31, 2017 was approximately $98,400 with a related weighted average annualized interest rate of 1.77%.
NOTE 3—Management Fee, Sub-Investment Advisory Fee and Other Transactions with Affiliates:
(a) Pursuant to a management agreement with Dreyfus, the management fee is computed at an annual rate of .95% of the value of the fund’s average daily net assets and is payable monthly. Dreyfus has contractually agreed, from November 1, 2016 through March 1, 2018, for Class A, Class C and Class I shares and from March 1, 2017 through March 1, 2018 for Class Y shares, to waive receipt of its fees and/or assume the expenses of the fund, so that the direct expenses of Class A, C, I and Y shares (excluding Rule 12b-1 Distribution Plan fees, Shareholder Services Plan fees, taxes, interest expense, brokerage commissions, commitment fees on borrowings and extraordinary expenses) do not exceed 1.05% of the value of the fund’s average daily net assets. Dreyfus had contractually agreed, from November 1, 2016 through February 28, 2017, for Class Y shares to waive receipt of its fees and/or assume the direct expenses of Class Y shares so that the expenses of Class Y shares (excluding taxes, interest expense, brokerage commissions, commitment fees on borrowings and extraordinary expenses) did not exceed 1.03% of the value of Class Y shares average daily net assets. The reduction in expenses, pursuant to the undertaking, amounted to $100,955 during the period ended October 31, 2017.
Pursuant to a sub-investment advisory agreement between Dreyfus and CenterSquare, Dreyfus pays CenterSquare a monthly fee at an annual rate of .46% of the value of the fund’s average daily net assets.
During the period ended October 31, 2017, the Distributor retained $606 from commissions earned on sales of the fund’s Class A shares and $45 from CDSCs on redemptions of the fund’s Class C shares.
(b) Under the Distribution Plan adopted pursuant to Rule 12b-1 under the Act, Class C shares pay the Distributor for distributing its shares at an annual rate of .75% of the value of its average daily net assets. During the period ended October 31, 2017, Class C shares were charged $7,375 pursuant to the Distribution Plan.
(c) Under the Shareholder Services Plan, Class A and Class C shares pay the Distributor at an annual rate of .25% of the value of their average daily
28
net assets for the provision of certain services. The services provided may include personal services relating to shareholder accounts, such as answering shareholder inquiries regarding the fund and providing reports and other information, and services related to the maintenance of shareholder accounts. The Distributor may make payments to Service Agents (securities dealers, financial institutions or other industry professionals) with respect to these services. The Distributor determines the amounts to be paid to Service Agents. During the period ended October 31, 2017, Class A and Class C shares were charged $24,820 and $2,458, respectively, pursuant to the Shareholder Services Plan.
The fund has arrangements with the transfer agent and the custodian whereby the fund may receive earnings credits when positive cash balances are maintained, which are used to offset transfer agency and custody fees. For financial reporting purposes, the fund includes net earnings credits as an expense offset in the Statement of Operations.
The fund compensates Dreyfus Transfer, Inc., a wholly-owned subsidiary of Dreyfus, under a transfer agency agreement for providing transfer agency and cash management services for the fund. The majority of transfer agency fees are comprised of amounts paid on a per account basis, while cash management fees are related to fund subscriptions and redemptions. During the period ended October 31, 2017, the fund was charged $7,522 for transfer agency services and $377 for cash management services. These fees are included in Shareholder servicing costs in the Statement of Operations. Cash management fees were offset by earnings credits of $377.
The fund compensates The Bank of New York Mellon under a custody agreement for providing custodial services for the fund. These fees are determined based on net assets, geographic region and transaction activity. During the period ended October 31, 2017, the fund was charged $210,925 pursuant to the custody agreement.
During the period ended October 31, 2017, the fund was charged $11,224 for services performed by the Chief Compliance Officer and his staff.
The components of “Due to The Dreyfus Corporation and affiliates” in the Statement of Assets and Liabilities consist of: management fees $627,854, Distribution Plan fees $615, Shareholder Services Plan fees $2,898, custodian fees $48,535, Chief Compliance Officer fees $6,538 and transfer agency fees $3,893, which are offset against an expense reimbursement currently in effect in the amount of $13,111.
29
NOTES TO FINANCIAL STATEMENTS (continued)
(d) Each Board member also serves as a Board member of other funds within the Dreyfus complex. Annual retainer fees and attendance fees are allocated to each fund based on net assets.
NOTE 4—Securities Transactions:
The aggregate amount of purchases and sales of investment securities, excluding short-term securities and forward contracts, during the period ended October 31, 2017, amounted to $569,318,278 and $612,263,439, respectively.
Derivatives: A derivative is a financial instrument whose performance is derived from the performance of another asset. The fund enters into International Swaps and Derivatives Association, Inc. Master Agreements or similar agreements (collectively, “Master Agreements”) with its over-the-counter (“OTC”) derivative contract counterparties in order to, among other things, reduce its credit risk to counterparties. Master Agreements include provisions for general obligations, representations, collateral and events of default or termination. Under a Master Agreement, the fund may offset with the counterparty certain derivative financial instrument’s payables and/or receivables with collateral held and/or posted and create one single net payment in the event of default or termination.
Each type of derivative instrument that was held by the fund during the period ended October 31, 2017 is discussed below.
Forward Foreign Currency Exchange Contracts: The fund enters into forward contracts in order to hedge its exposure to changes in foreign currency exchange rates on its foreign portfolio holdings, to settle foreign currency transactions or as a part of its investment strategy. When executing forward contracts, the fund is obligated to buy or sell a foreign currency at a specified rate on a certain date in the future. With respect to sales of forward contracts, the fund incurs a loss if the value of the contract increases between the date the forward contract is opened and the date the forward contract is closed. The fund realizes a gain if the value of the contract decreases between those dates. With respect to purchases of forward contracts, the fund incurs a loss if the value of the contract decreases between the date the forward contract is opened and the date the forward contract is closed. The fund realizes a gain if the value of the contract increases between those dates. Any realized or unrealized gains or losses which occurred during the period are reflected in the Statement of Operations. The fund is exposed to foreign currency risk as a result of changes in value of underlying financial instruments. The fund is also exposed to credit risk associated with counterparty nonperformance on
30
these forward contracts, which is generally limited to the unrealized gain on each open contract. This risk may be mitigated by Master Agreements, if any, between the fund and the counterparty and the posting of collateral, if any, by the counterparty to the fund to cover the fund’s exposure to the counterparty. Forward contracts open at October 31, 2017 are set forth in the Statement of Forward Foreign Currency Exchange Contracts.
The provisions of ASC Topic 210 “Disclosures about Offsetting Assets and Liabilities” require disclosure on the offsetting of financial assets and liabilities. These disclosures are required for certain investments, including derivative financial instruments subject to Master Agreements which are eligible for offsetting in the Statement of Assets and Liabilities and require the fund to disclose both gross and net information with respect to such investments. For financial reporting purposes, the fund does not offset derivative assets and derivative liabilities that are subject to Master Agreements in the Statement of Assets and Liabilities.
At October 31, 2017, derivative assets and liabilities (by type) on a gross basis are as follows:
Derivative Financial Instruments: |
| Assets ($) |
| Liabilities ($) |
|
Forward contracts | 657 | (1,181) | |||
Total gross amount of derivative | |||||
assets and liabilities in the | |||||
Statement of Assets and Liabilities | 657 | (1,181) | |||
Derivatives not subject to | |||||
Master Agreements | - | - | |||
Total gross amount of assets | |||||
and liabilities subject to | |||||
Master Agreements | 657 | (1,181) |
The following tables present derivative assets and liabilities net of amounts available for offsetting under Master Agreements and net of related collateral received or pledged, if any, as of October 31, 2017:
Financial | ||||||
Instruments | ||||||
and Derivatives | ||||||
Gross Amount of | Available | Collateral | Net Amount of | |||
Counterparty | Assets ($) | 1 | for Offset ($) | Received ($) |
| Assets ($) |
Deutsche Bank | 2 | (2) | - | - | ||
Northern | 655 | (655) | - | - | ||
Total | 657 | (657) | - | - | ||
31
NOTES TO FINANCIAL STATEMENTS (continued)
Financial | ||||||
Instruments | ||||||
and Derivatives | ||||||
Gross Amount of | Available | Collateral | Net Amount of | |||
Counterparty | Liabilities ($) | 1 | for Offset ($) | Pledged ($) |
| Liabilities ($) |
Deutsche Bank | (274) | 2 | - | (272) | ||
Northern | (907) | 655 | - | (252) | ||
Total | (1,181) | 657 | - | (524) | ||
1 Absent a default event or early termination, OTC derivative assets and liabilities are presented at gross amounts | ||||||
The following summarizes the average market value of derivatives outstanding during the period ended October 31, 2017:
|
| Average Market Value ($) |
Forward contracts | 695,707 | |
At October 31, 2017, the cost of investments for federal income tax purposes was $699,022,638; accordingly, accumulated net unrealized appreciation on investments inclusive of derivative contracts was $60,872,648, consisting of $102,322,346 gross unrealized appreciation and $41,449,698 gross unrealized depreciation.
NOTE 5—Subsequent Event:
At a meeting held on October 13, 2017 (the “October Meeting”), the Board of Directors of Dreyfus Premier Investment Funds, Inc. (the “Company”), on behalf of Dreyfus Global Real Estate Securities Fund (the “Fund”), approved, subject to shareholder approval, a new Sub-Investment Advisory Agreement (the “New Sub-Advisory Agreement”) between Dreyfus and CSIM Investment Management LLC (“CSIM”) as a result of the anticipated sale of all of the assets of CenterSquare Investment Management, Inc. (“CenterSquare”), the Fund’s sub-investment adviser, to CSIM on or about January 2, 2018 (the “Effective Date”). Shareholders of the Fund will be asked to approve the New Sub-Advisory Agreement at a meeting scheduled to be held on December 20, 2017. If approved, the new Sub-Investment Advisory Agreement will become effective on the Effective Date or such other date as the Company’s officers, acting with the advice of counsel, determine. At the October Meeting, the Board also approved an interim Sub-Investment Advisory Agreement between Dreyfus and CSIM, which will become
32
effective only if shareholder approval of the New Sub-Advisory Agreement is not obtained prior to the Effective Date.
33
REPORT OF INDEPENDENT REGISTERED
PUBLIC ACCOUNTING FIRM
Shareholders and Board of Directors
Dreyfus Global Real Estate Securities Fund
We have audited the accompanying statement of assets and liabilities, including the statements of investments, investments in affiliated issuers and forward foreign currency exchange contracts, of Dreyfus Global Real Estate Securities Fund (one of the series comprising Dreyfus Premier Investment Funds, Inc.) (the Fund) as of October 31, 2017, and the related statement of operations for the year then ended, the statement of changes in net assets for each of the two years in the period then ended, and the financial highlights for each of the periods indicated therein. These financial statements and financial highlights are the responsibility of the Fund’s management. Our responsibility is to express an opinion on these financial statements and financial highlights based on our audits.
We conducted our audits in accordance with the standards of the Public Company Accounting Oversight Board (United States). Those standards require that we plan and perform the audit to obtain reasonable assurance about whether the financial statements and financial highlights are free of material misstatement. We were not engaged to perform an audit of the Fund’s internal control over financial reporting. Our audits included consideration of internal control over financial reporting as a basis for designing audit procedures that are appropriate in the circumstances, but not for the purpose of expressing an opinion on the effectiveness of the Fund’s internal control over financial reporting. Accordingly, we express no such opinion. An audit also includes examining, on a test basis, evidence supporting the amounts and disclosures in the financial statements and financial highlights, assessing the accounting principles used and significant estimates made by management, and evaluating the overall financial statement presentation. Our procedures included confirmation of securities owned as of October 31, 2017 by correspondence with the custodian and others or by other appropriate auditing procedures where replies were not received. We believe that our audits provide a reasonable basis for our opinion.
In our opinion, the financial statements and financial highlights referred to above present fairly, in all material respects, the financial position of Dreyfus Global Real Estate Securities Fund at October 31, 2017, the results of its operations for the year then ended, the changes in its net assets for each of the two years in the period then ended, and the financial highlights for each of the indicated periods, in conformity with U.S. generally accepted accounting principles.

New York, New York
December 28, 2017
34
IMPORTANT TAX INFORMATION (Unaudited)
For federal tax purposes, the fund hereby reports 56.26% of the ordinary dividends paid during the fiscal year ended October 31, 2017 as qualifying for the corporate dividends received deduction. Also, certain dividends paid by the fund may be subject to a maximum tax rate of 15%, as provided for by the Jobs and Growth Tax Relief Reconciliation Act of 2003. Of the distributions paid during the fiscal year, $2,731,444 represents the maximum amount that may be considered qualified dividend income. Shareholders will receive notification in early 2018 of the percentage applicable to the preparation of their 2017 income tax returns. The fund also hereby reports $.0025 per share as a short-term capital gain distribution and $.0452 per share as a long-term capital gain distribution paid on March 21, 2017 and also $.0613 per share as a short-term capital gain distribution and $.0284 per share as a long-term capital gain distribution paid on December 27, 2016.
35
INFORMATION ABOUT THE RENEWAL OF THE FUND’S SUB-INVESTMENT ADVISORY AGREEMENT (Unaudited)
At an in-person meeting of the fund’s Board of Directors (the “Board”) held on October 13, 2017 (the “October Meeting”), the Board, including the Independent Directors, discussed and approved a new sub-investment advisory agreement (the “New Sub-Advisory Agreement”) between Dreyfus, on behalf of the fund, and CSIM Investment Management LLC (“CSIM”), pursuant to which CSIM would continue to provide day-to-day management of the fund’s portfolio, and agreed to recommend that shareholders of the fund approve the New Sub-Advisory Agreement at a shareholder meeting to be held on December 20, 2017. CSIM is a newly-formed entity owned by members of the existing management team (“Existing Management”) of CenterSquare Investment Management, Inc. (“CenterSquare”), the fund’s current sub-adviser, private funds sponsored by Lovell Minnick Partners LLC (“Lovell Minnick”), a private equity firm, and certain co-investors.
CenterSquare is currently an indirect, wholly-owned subsidiary of The Bank of New York Mellon Corporation (“BNY Mellon”), the parent company of Dreyfus. CSIM has entered into a definitive agreement with BNY Mellon to acquire substantially all of the assets of the CenterSquare Investment Management business (the “Transaction”) on or about January 2, 2018 (the “Effective Date”).
The Board, including the Independent Directors, also discussed and approved an interim sub-investment advisory agreement (the “Interim Sub-Advisory Agreement” and, together with the New Sub-Advisory Agreement, the “Agreements”) between Dreyfus, on behalf of the fund, and CSIM that would go into effect for a limited period of time if the New Sub-Advisory Agreement was not approved by shareholders prior to the closing of the Transaction. The Board, including the Independent Directors, concluded that approval of these Agreements was in the best interests of the fund and its shareholders.
The current sub-investment advisory agreement (the “Current Sub-Advisory Agreement”) between Dreyfus, on behalf of the fund, and CenterSquare was most recently reapproved by the Board at a meeting held on March 9-10, 2017 (the “March Meeting”). At the March Meeting, the Independent Directors requested and received information from Dreyfus and CenterSquare they deemed reasonably necessary for their review of the Current Sub-Advisory Agreement and the performance and services provided by CenterSquare. The information received by the Board included information related to the fees paid by the fund to Dreyfus and by Dreyfus to CenterSquare and the profitability of Dreyfus with respect to the fund, among other items, in accordance with Section 15(c) of the Investment Company Act of 1940, as amended (the “1940 Act”). Management believed that there were no material changes to the information presented at the March Meeting relevant to the Board’s consideration of the New Sub-Advisory Agreement, other than the information about CSIM and the Transaction. Based on management’s representations that the Transaction was not expected to have a material impact on the nature, extent or quality of the investment advisory services that CenterSquare currently provides to the fund, the persons responsible for portfolio management of the fund under CSIM were anticipated to remain the same and that the
36
terms of the New Sub-Advisory Agreement were substantially similar in material respects to the Current Sub-Advisory Agreement, the Board considered information presented to them as part of the annual agreement review process at the March Meeting, as well as information about CenterSquare, CSIM and the Transaction received at the October Meeting.
In connection with the October Meeting and in accordance with Section 15(c) of the 1940 Act, the Board requested, and Dreyfus, CenterSquare and CSIM provided, materials relating to the Transaction, CenterSquare, CSIM and Lovell Minnick in connection with the Board’s consideration of whether to approve the New Sub-Advisory Agreement. This included a description of the Transaction and its anticipated effects on CenterSquare and CSIM as well as information regarding Lovell Minnick and its business activities, personnel and affiliates. The Board noted that the services provided under the New Sub-Advisory Agreement will be substantially identical to those provided under the Current Sub-Advisory Agreement. In addition, the sub-advisory fee under the New Sub-Advisory Agreement will remain the same as the sub-advisory fee under the Current Sub-Advisory Agreement. Existing Management represented that under the New Sub-Advisory Agreement there would be no diminution in services provided by CSIM to the fund or changes in the fee payable by Dreyfus to CSIM as a result of the Transaction. The Board also considered the substance of discussions with representatives of Dreyfus and CenterSquare at the March Meeting and representatives of CSIM and Lovell Minnick at the October Meeting. Additionally, the Board reviewed materials supplied by counsel that were prepared for use by the Board in fulfilling its duties under state law and the 1940 Act. It was noted that the Transaction would comply with Section 15(f) of the 1940 Act in that 75% or more of the fund’s Board was comprised of Independent Directors and would remain so for three years following the Effective Date, and that no “unfair burden” (as defined in the 1940 Act) would be imposed on the fund by CSIM during the two-year period following the Effective Date.
In voting to approve the New Sub-Advisory Agreement, the Board considered whether the approval of the New Sub-Advisory Agreement would be in the best interests of the fund and its shareholders, an evaluation based on several factors including those discussed below. The Independent Directors were represented by legal counsel that is independent of CenterSquare and CSIM in connection with their consideration of approval of the New Sub-Advisory Agreement and the Interim Sub-Advisory Agreement. The factors discussed below were also considered by the Independent Directors in executive sessions during which such independent legal counsel provided guidance and a written description to the Independent Directors of their statutory responsibilities and the legal standards that are applicable to the approval of investment advisory and sub-investment advisory agreements. Based on their discussions and considerations, including those described below, the Board, including the Independent Directors, approved the Interim Sub-Advisory Agreement for the fund that would go into effect for a limited period of time if the New Sub-Advisory Agreement was not approved by shareholders prior to the closing of the Transaction and the New Sub-Advisory Agreement to be effective as of the Effective Date. It is currently anticipated that the New Sub-Advisory Agreement, if approved by shareholders, will be reviewed by
37
INFORMATION ABOUT THE RENEWAL OF THE FUND’S SUB-INVESTMENT ADVISORY AGREEMENT (Unaudited) (continued)
the Board as part of its annual review of advisory arrangements for the fund in the first quarter of 2018.
Nature, Extent and Quality of Services to be Provided under the New Sub-Advisory Agreement. At the March Meeting, the Board received and considered information regarding the nature, extent and quality of services provided to the fund by CenterSquare under the Current Sub-Advisory Agreement. The Board noted information received at regular meetings throughout the year related to the services rendered by CenterSquare to the fund, including the scope and quality of the investment management and other capabilities of CenterSquare.
At the October Meeting, the Board received and considered information regarding the fact that the nature, extent and quality of services to be provided to the fund by CSIM under the New Sub-Advisory Agreement would not change as a result of the Transaction. The Board members discussed with management the portfolio management strategies of the fund’s portfolio managers and noted that there were currently no long-term or short-term plans to make changes to the management or investment policies, strategies or objective of the fund as a result of the Transaction. The Board members considered the specific responsibilities in all aspects of the day-to-day management of the fund by CenterSquare, and the fact that the persons responsible for portfolio management under CSIM were anticipated to remain the same. The Board also considered that the division of responsibilities between Dreyfus and CSIM would remain the same as it is currently with CenterSquare. The Board members also considered the financial resources that will be available to CSIM. The fund’s Chief Compliance Officer discussed the compliance infrastructure of the fund following the Transaction. The Board also discussed the acceptability of the terms of the Interim Sub-Advisory Agreement and the New Sub-Advisory Agreement.
The Board concluded that the fund will continue to benefit from the quality and experience of CenterSquare’s investment professionals that will continue to provide services to the fund after the Transaction as employees of CSIM. Based on its consideration and review of the foregoing information, the Board concluded that it was satisfied with the nature, extent and quality of the sub-investment advisory services expected to be provided by CSIM.
Fund Investment Performance. The Board members considered the investment performance of CenterSquare in managing the fund’s portfolio as a factor in evaluating the Interim Sub-Advisory Agreement and the New Sub-Advisory Agreement during the October Meeting. At the March Meeting, the Board reviewed reports prepared by Broadridge Financial Solutions, Inc. (“Broadridge”), an independent provider of investment company data, which included information comparing the fund’s performance with the performance of a group of comparable funds (the “Performance Group”) and with a broader group of funds (the “Performance Universe”), all for various periods ended January 31, 2017. The Board discussed with representatives of Dreyfus and CenterSquare the results of the comparisons and considered that the fund’s total return performance was above the Performance Group median for all periods except for the two- and five-year periods when it was below the median, and the fund’s performance
38
was above the Performance Universe median for all periods except for the five-year period when it was slightly below the median. Dreyfus had also provided a comparison of the fund’s calendar year total returns to the returns of the fund’s benchmark index. At the October Meeting, the Board referred to additional information on fund performance for various periods ended September 30, 2017, which showed that the fund’s total return performance continued to be competitive for the periods reviewed. Based on its review, the Board concluded that it was generally satisfied with the fund’s historical performance under CenterSquare’s management.
The Board members discussed with representatives of Dreyfus and CSIM that the investment strategies to be employed by CSIM in the management of the fund’s assets are currently expected to remain the same after the Transaction and under the New Sub-Advisory Agreement. The Board also considered the fact that the persons responsible for portfolio management of the fund at CenterSquare would remain the same following the Transaction as employees of CSIM. Based on its consideration and review of the foregoing, the Board concluded that these factors supported a decision to approve the Interim Sub-Advisory Agreement and the New Sub-Advisory Agreement.
Sub-Advisory Fee and Expense Ratio. The Board considered the proposed fee payable under the New Sub-Advisory Agreement, noting that the proposed fee would be paid by Dreyfus and, thus, would not impact the fees paid by the fund. At the March Meeting, the Board reviewed and considered the contractual management fee payable by the fund to Dreyfus pursuant to the fund’s Management Agreement, pursuant to which Dreyfus provides the fund with investment advisory and administrative services (the “Management Agreement”), and the contractual sub-investment advisory fee payable by Dreyfus to CenterSquare pursuant to the Current Sub-Advisory Agreement, which is identical to that payable under the New Sub-Advisory Agreement, and the sub-investment advisory services provided by CenterSquare. In addition, because of Dreyfus’ fee waiver and/or expense reimbursement arrangement that was in effect for the fund, which reduced the management fee paid to Dreyfus, the Board also reviewed and considered the actual management fee rate (after taking into account waivers and reimbursements). The Board considered the fee to CenterSquare in relation to the fee paid to Dreyfus by the fund and the respective services provided by CenterSquare and Dreyfus.
At the March Meeting, the Board reviewed reports prepared by Broadridge which included information comparing the fund’s actual and contractual management fees and total expenses with those of a group of comparable funds (the “Expense Group”) and with a broader group of funds (the “Expense Universe”), the information for which was derived in part from fund financial statements available to Broadridge as of the date of its analysis. The Board also reviewed the range of actual and contractual management fees and total expenses of the Expense Group and Expense Universe funds and discussed the results of the comparisons. The Board noted that the fund’s contractual management fee was above the Expense Group median, the fund’s actual management fee was the lowest in the Expense Group and Expense Universe and the fund’s total expenses were below the Expense Group and Expense Universe medians.
39
INFORMATION ABOUT THE RENEWAL OF THE FUND’S SUB-INVESTMENT ADVISORY AGREEMENT (Unaudited) (continued)
At the October Meeting, the Board noted that the contractual management fee will remain the same, that Dreyfus had committed to continue the current fee waiver and/or expense reimbursement arrangement until at least March 1, 2018, and that the terms of the current fee waiver and expense reimbursement arrangement will not change as a result of the Transaction.
Profitability. The Board recognized that, because CSIM’s fee would be paid by Dreyfus, and not the fund, an analysis of profitability was more appropriate in the context of the Board’s consideration of the Management Agreement. Accordingly, at the March Meeting, the Board received and considered a profitability analysis of Dreyfus and its affiliates in providing services to the fund. Dreyfus representatives reviewed the expenses allocated and profit received by Dreyfus and its affiliates and the resulting profitability percentage for managing the fund and the aggregate profitability percentage to Dreyfus and its affiliates for managing the funds in the Dreyfus fund complex, and the method used to determine the expenses and profit. The Board concluded that the profitability results were not unreasonable, given the services rendered and service levels provided by Dreyfus. The Board also considered the expense limitation arrangement and its effect on the profitability of Dreyfus and its affiliates.
At the October Meeting, the Board noted that the fee payable to CenterSquare by Dreyfus under the Current Sub-Advisory Agreement was the same as that payable under the New Sub-Advisory Agreement and, thus, no material impact to Dreyfus’ profitability with respect to the fund is expected as a result of the Transaction. Therefore, the Board determined that Dreyfus’ expected profitability should not be excessive in light of the nature, extent and quality of the services to be provided to the fund after the Transaction. Consideration of profitability with respect to CSIM was not relevant to the Board’s determination to approve the Interim Sub-Advisory Agreement and the New Sub-Advisory Agreement.
Economies of Scale. The Board recognized that, as is the case with CenterSquare, because CSIM’s fee would be paid by Dreyfus, and not the fund, an analysis of economies of scale was more appropriate in the context of the Board’s consideration of the Management Agreement. Accordingly, at the March Meeting, the Board discussed any economies of scale or other efficiencies that may result from increases in the fund’s assets. The Board noted that there are various ways to share potential economies of scale with fund shareholders and that it appeared that the benefits of any economies of scale would be appropriately shared with shareholders.
At the October Meeting, the Board noted that no material impact to the analysis of economies of scale is expected as a result of the Transaction. Therefore, consideration of economies of scale was not relevant to the Board’s determination to approve the Interim Sub-Advisory Agreement and the New Sub-Advisory Agreement.
Other Benefits to CenterSquare and CSIM. At the March Meeting, the Board considered potential benefits to Dreyfus and CenterSquare from acting as investment adviser and sub-investment adviser, respectively, and took into consideration the soft dollar arrangements in effect for trading the fund’s investments. The Board noted that CSIM
40
would be required to select brokers who met the fund’s requirements for seeking best execution, and that Dreyfus would monitor and evaluate CSIM’s trade execution with respect to fund brokerage transactions on a quarterly basis and would provide reports to the Board on these matters. In light of the costs of providing investment management and other services to the fund and CenterSquare’s commitment to the fund, any other ancillary benefits that CenterSquare received were considered reasonable.
At the October Meeting, the Board considered the benefits to be received by BNY Mellon, CenterSquare and CSIM as a result of the Transaction, as well as the benefits to be received by CSIM as a result of the relationship with the fund, and determined that any such ancillary benefits were reasonable.
After full consideration of the factors discussed above, with no single factor identified as being of paramount importance, the Board, including a majority of the Independent Directors, approved, and recommends that shareholders of the fund approve, the New Sub-Advisory Agreement for the fund.
41
BOARD MEMBERS INFORMATION (Unaudited)
INDEPENDENT BOARD MEMBERS
Chairman of the Board (1995)
Principal Occupation During Past 5 Years:
· Corporate Director and Trustee (1995-present)
Other Public Company Board Memberships During Past 5 Years:
· CBIZ (formerly, Century Business Services, Inc.), a provider of outsourcing functions for small and medium size companies, Director (1997-present)
No. of Portfolios for which Board Member Serves: 126
———————
Peggy C. Davis (74)
Board Member (2012)
Principal Occupation During Past 5 Years:
· Shad Professor of Law, New York University School of Law (1983-present)
No. of Portfolios for which Board Member Serves: 45
———————
David P. Feldman (77)
Board Member (1991)
Principal Occupation During Past 5 Years:
· Corporate Director and Trustee (1985-present)
Other Public Company Board Memberships During Past 5 Years:
· BBH Mutual Funds Group (5 registered mutual funds), Director (1992-2014)
No. of Portfolios for which Board Member Serves: 31
———————
Joan Gulley (70)
Board Member (2017)
Principal Occupation During Past 5 Years:
· PNC Financial Services Group, Inc.(1993-2014)
· Executive Vice President and Chief Human Resources Officer and Executive Committee Member (2008-2014)
No. of Portfolios for which Board Member Serves: 52
———————
42
Ehud Houminer (77)
Board Member (2012)
Principal Occupation During Past 5 Years:
· Board of Overseers at the Columbia Business School, Columbia University (1992-present)
· Trustee, Ben Gurion University
Other Public Company Board Memberships During Past 5 Years:
· Avnet, Inc., an electronics distributor, Director (1993-2012)
No. of Portfolios for which Board Member Serves: 52
———————
Lynn Martin (77)
Board Member (1994)
Principal Occupation During Past 5 Years:
· President of The Martin Hall Group LLC, a human resources consulting firm (2005-2012)
Other Public Company Board Memberships During Past 5 Years:
· AT&T, Inc., a telecommunications company, Director (1999-2012)
· Ryder System, Inc., a supply chain and transportation management company, Director (1993-2012)
No. of Portfolios for which Board Member Serves: 31
———————
Robin A. Melvin (54)
Board Member (2011)
Principal Occupation During Past 5 Years:
· Co-chairman, Illinois Mentoring Partnership, non-profit organization dedicated to increasing the quantity and quality of mentoring services in Illinois; (2014-present; board member since 2013)
· Director, Boisi Family Foundation, a private family foundation that supports youth-serving organizations that promote the self sufficiency of youth from disadvantaged circumstances (1995-2012)
No. of Portfolios for which Board Member Serves: 98
———————
43
BOARD MEMBERS INFORMATION (Unaudited) (continued)
INDEPENDENT BOARD MEMBERS (continued)
Dr. Martin Peretz (78)
Board Member (2012)
Principal Occupation During Past 5 Years:
· Editor-in-Chief Emeritus of The New Republic Magazine (2011-2012) (previously,
Editor-in-Chief, 1974-2011)
· Lecturer at Harvard University (1969-2012)
No. of Portfolios for which Board Member Serves: 31
———————
Once elected all Board Members serve for an indefinite term, but achieve Emeritus status upon reaching age 80. The address of the Board Members and Officers is c/o The Dreyfus Corporation, 200 Park Avenue, New York, New York 10166. Additional information about the Board Members is available in the fund’s Statement of Additional Information which can be obtained from Dreyfus free of charge by calling this toll free number: 1-800-DREYFUS.
Daniel Rose, Emeritus Board Member
Philip L. Toia, Emeritus Board Member
Sander Vanocur, Emeritus Board Member
44
OFFICERS OF THE FUND (Unaudited)
BRADLEY J. SKAPYAK, President since January 2010.
Chief Operating Officer and a director of the Manager since June 2009, Chairman of Dreyfus Transfer, Inc., an affiliate of the Manager and the transfer agent of the funds, since May 2011 and Chief Executive Officer of MBSC Securities Corporation since August 2016. He is an officer of 62 investment companies (comprised of 126 portfolios) managed by the Manager. He is 58 years old and has been an employee of the Manager since February 1988.
BENNETT A. MACDOUGALL, Chief Legal Officer since October 2015.
Chief Legal Officer of the Manager and Associate General Counsel and Managing Director of BNY Mellon since June 2015; from June 2005 to June 2015, he served in various capacities with Deutsche Bank – Asset & Wealth Management Division, including as Director and Associate General Counsel, and Chief Legal Officer of Deutsche Investment Management Americas Inc. from June 2012 to May 2015. He is an officer of 63 investment companies (comprised of 151 portfolios) managed by the Manager. He is 46 years old and has been an employee of the Manager since June 2015.
JANETTE E. FARRAGHER, Vice President and Secretary since December 2011.
Associate General Counsel of BNY Mellon, and an officer of 63 investment companies (comprised of 151 portfolios) managed by the Manager. She is 54 years old and has been an employee of the Manager since February 1984.
JAMES BITETTO, Vice President and Assistant Secretary since August 2005.
Managing Counsel of BNY Mellon and Secretary of the Manager, and an officer of 63 investment companies (comprised of 151 portfolios) managed by the Manager. He is 51 years old and has been an employee of the Manager since December 1996.
JOSEPH M. CHIOFFI, Vice President and Assistant Secretary since August 2005.
Managing Counsel of BNY Mellon, and an officer of 63 investment companies (comprised of 151 portfolios) managed by the Manager. He is 55 years old and has been an employee of the Manager since June 2000.
MAUREEN E. KANE, Vice President and Assistant Secretary since April 2015.
Managing Counsel of BNY Mellon since July 2014; from October 2004 until July 2014, General Counsel, and from May 2009 until July 2014, Chief Compliance Officer of Century Capital Management. She is an officer of 63 investment companies (comprised of 151 portfolios) managed by the Manager. She is 55 years old and has been an employee of the Manager since July 2014.
SARAH S. KELLEHER, Vice President and Assistant Secretary since April 2014.
Senior Counsel of BNY Mellon since March 2013, from August 2005 to March 2013, Associate General Counsel of Third Avenue Management. She is an officer of 63 investment companies (comprised of 151 portfolios) managed by the Manager. She is 42 years old and has been an employee of the Manager since March 2013.
JEFF PRUSNOFSKY, Vice President and Assistant Secretary since August 2005.
Senior Managing Counsel of BNY Mellon, and an officer of 63 investment companies (comprised of 151 portfolios) managed by the Manager. He is 52 years old and has been an employee of the Manager since October 1990.
NATALYA ZELENSKY, Vice President and Assistant Secretary since March 2017.
Counsel and Vice President of BNY Mellon since May 2016; Attorney at Wildermuth Endowment Strategy Fund/Wildermuth Advisory, LLC from November 2015 until May 2016; Assistant General Counsel at RCS Advisory Services from July 2014 until November 2015; Associate at Sutherland, Asbill & Brennan from January 2013 until January 2014; Associate at K&L Gates from October 2011 until January 2013. She is an officer of 63 investment companies (comprised of 151 portfolios) managed by Dreyfus. She is 32 years old and has been an employee of the Manager since May 2016.
JAMES WINDELS, Treasurer since November 2001.
Director – Mutual Fund Accounting of the Manager, and an officer of 63 investment companies (comprised of 151 portfolios) managed by the Manager. He is 59 years old and has been an employee of the Manager since April 1985.
45
OFFICERS OF THE FUND (Unaudited) (continued)
RICHARD CASSARO, Assistant Treasurer since January 2008.
Senior Accounting Manager – Money Market and Municipal Bond Funds of the Manager, and an officer of 63 investment companies (comprised of 151 portfolios) managed by the Manager. He is 58 years old and has been an employee of the Manager since September 1982.
GAVIN C. REILLY, Assistant Treasurer since December 2005.
Tax Manager of the Investment Accounting and Support Department of the Manager, and an officer of 63 investment companies (comprised of 151 portfolios) managed by the Manager. He is 49 years old and has been an employee of the Manager since April 1991.
ROBERT S. ROBOL, Assistant Treasurer since August 2005.
Senior Accounting Manager – Dreyfus Financial Reporting of the Manager, and an officer of 63 investment companies (comprised of 151 portfolios) managed by the Manager. He is 53 years old and has been an employee of the Manager since October 1988.
ROBERT SALVIOLO, Assistant Treasurer since July 2007.
Senior Accounting Manager – Equity Funds of the Manager, and an officer of 63 investment companies (comprised of 151 portfolios) managed by the Manager. He is 50 years old and has been an employee of the Manager since June 1989.
ROBERT SVAGNA, Assistant Treasurer since December 2002.
Senior Accounting Manager – Fixed Income and Equity Funds of the Manager, and an officer of 63 investment companies (comprised of 151 portfolios) managed by the Manager. He is 50 years old and has been an employee of the Manager since November 1990.
JOSEPH W. CONNOLLY, Chief Compliance Officer since October 2004.
Chief Compliance Officer of the Manager and The Dreyfus Family of Funds (63 investment companies, comprised of 151 portfolios). He is 60 years old and has served in various capacities with the Manager since 1980, including manager of the firm’s Fund Accounting Department from 1997 through October 2001.
CARIDAD M. CAROSELLA, Anti-Money Laundering Compliance Officer since January 2016.
Anti-Money Laundering Compliance Officer of the Dreyfus Family of Funds and BNY Mellon Funds Trust since January 2016; from May 2015 to December 2015, Interim Anti-Money Laundering Compliance Officer of the Dreyfus Family of Funds and BNY Mellon Funds Trust and the Distributor; from January 2012 to May 2015, AML Surveillance Officer of the Distributor and from 2007 to December 2011, Financial Processing Manager of the Distributor. She is an officer of 57 investment companies (comprised of 145 portfolios) managed by the Manager. She is 49 years old and has been an employee of the Distributor since 1997.
46
NOTES
47
NOTES
48
NOTES
49
Dreyfus Global Real Estate Securities Fund
200 Park Avenue
New York, NY 10166
Manager
The Dreyfus Corporation
200 Park Avenue
New York, NY 10166
Sub-Investment Adviser
CenterSquare Investment Management
630 West Germantown Pike, Suite 300
Plymouth Meeting, PA 19462
Custodian
The Bank of New York Mellon
225 Liberty Street
New York, NY 10286
Transfer Agent &
Dividend Disbursing Agent
Dreyfus Transfer, Inc.
200 Park Avenue
New York, NY 10166
Distributor
MBSC Securities Corporation
200 Park Avenue
New York, NY 10166
Ticker Symbol: | Class A: DRLAX Class C: DGBCX Class I: DRLIX Class Y: DRLYX |
Telephone Call your financial representative or 1-800-DREYFUS
Mail The Dreyfus Family of Funds, 144 Glenn Curtiss Boulevard, Uniondale, NY 11556-0144
E-mail Send your request to info@dreyfus.com
Internet Information can be viewed online or downloaded at www.dreyfus.com
The fund files its complete schedule of portfolio holdings with the Securities and Exchange Commission (“SEC”) for the first and third quarters of each fiscal year on Form N-Q. The fund’s Forms N-Q are available on the SEC’s website at www.sec.gov and may be reviewed and copied at the SEC’s Public Reference Room in Washington, D.C. (phone 1-800-SEC-0330 for information).
A description of the policies and procedures that the fund uses to determine how to vote proxies relating to portfolio securities and information regarding how the fund voted these proxies for the most recent 12-month period ended June 30 is available at www.dreyfus.com and on the SEC’s website at www.sec.gov and without charge, upon request, by calling 1-800-DREYFUS.
© 2017 MBSC Securities Corporation |
|

Item 2. Code of Ethics.
The Registrant has adopted a code of ethics that applies to the Registrant's principal executive officer, principal financial officer, principal accounting officer or controller, or persons performing similar functions. There have been no amendments to, or waivers in connection with, the Code of Ethics during the period covered by this Report.
Item 3. Audit Committee Financial Expert.
The Registrant's Board has determined that David P. Feldman, a member of the Audit Committee of the Board, is an audit committee financial expert as defined by the Securities and Exchange Commission (the "SEC"). Mr. Feldman is "independent" as defined by the SEC for purposes of audit committee financial expert determinations.
Item 4. Principal Accountant Fees and Services.
(a) Audit Fees. The aggregate fees billed for each of the last two fiscal years (the "Reporting Periods") for professional services rendered by the Registrant's principal accountant (the "Auditor") for the audit of the Registrant's annual financial statements or services that are normally provided by the Auditor in connection with the statutory and regulatory filings or engagements for the Reporting Periods, were $125,106 in 2016 and $128,234 in 2017.
(b) Audit-Related Fees. The aggregate fees billed in the Reporting Periods for assurance and related services by the Auditor that are reasonably related to the performance of the audit of the Registrant's financial statements and are not reported under paragraph (a) of this Item 4 were $19,290 in 2016 and $32,877 in 2017. These services consisted of one or more of the following: (i) agreed upon procedures related to compliance with Internal Revenue Code section 817(h), (ii) security counts required by Rule 17f-2 under the Investment Company Act of 1940, as amended, (iii) advisory services as to the accounting or disclosure treatment of Registrant transactions or events and (iv) advisory services to the accounting or disclosure treatment of the actual or potential impact to the Registrant of final or proposed rules, standards or interpretations by the Securities and Exchange Commission, the Financial Accounting Standards Boards or other regulatory or standard-setting bodies.
The aggregate fees billed in the Reporting Periods for non-audit assurance and related services by the Auditor to the Registrant's investment adviser (not including any sub-investment adviser whose role is primarily portfolio management and is subcontracted with or overseen by another investment adviser), and any entity controlling, controlled by or under common control with the investment adviser that provides ongoing services to the Registrant ("Service Affiliates"), that were reasonably related to the performance of the annual audit of the Service Affiliate, which required pre-approval by the Audit Committee were $0 in 2016 and $0 in 2017.
(c) Tax Fees. The aggregate fees billed in the Reporting Periods for professional services rendered by the Auditor for tax compliance, tax advice, and tax planning ("Tax Services") were $13,884 in 2016 and $11,984 in 2017. These services consisted of: (i) review or preparation of U.S. federal, state, local and excise tax returns; (ii) U.S. federal, state and local tax planning, advice and assistance regarding statutory, regulatory or administrative developments; (iii) tax advice regarding tax qualification matters and/or treatment of various financial instruments held or proposed to be acquired or held, and (iv) determination of Passive Foreign Investment Companies. The aggregate fees billed in the Reporting Periods for Tax Services by the Auditor to Service Affiliates, which required pre-approval by the Audit Committee were $0 in 2016 and $0 in 2017.
(d) All Other Fees. The aggregate fees billed in the Reporting Periods for products and services provided by the Auditor, other than the services reported in paragraphs (a) through (c) of this Item, were $108 in 2016 and $125 in 2017. These services consisted of a review of the Registrant's anti-money laundering program.
The aggregate fees billed in the Reporting Periods for Non-Audit Services by the Auditor to Service Affiliates, other than the services reported in paragraphs (b) through (c) of this Item, which required pre-approval by the Audit Committee, were $0 in 2017 and $0 in 2017.
(e)(1) Audit Committee Pre-Approval Policies and Procedures. The Registrant's Audit Committee has established policies and procedures (the "Policy") for pre-approval (within specified fee limits) of the Auditor's engagements for non-audit services to the Registrant and Service Affiliates without specific case-by-case consideration. The pre-approved services in the Policy can include pre-approved audit services, pre-approved audit-related services, pre-approved tax services and pre-approved all other services. Pre-approval considerations include whether the proposed services are compatible with maintaining the Auditor's independence. Pre-approvals pursuant to the Policy are considered annually.
(e)(2) Note. None of the services described in paragraphs (b) through (d) of this Item 4 were approved by the Audit Committee pursuant to paragraph (c)(7)(i)(C) of Rule 2-01 of Regulation S-X.
(f) None of the hours expended on the principal accountant's engagement to audit the registrant's financial statements for the most recent fiscal year were attributed to work performed by persons other than the principal account's full-time, permanent employees.
Non-Audit Fees. The aggregate non-audit fees billed by the Auditor for services rendered to the Registrant, and rendered to Service Affiliates, for the Reporting Periods were $20,423,084 in 2016 and $32,905,415 in 2017.
Auditor Independence. The Registrant's Audit Committee has considered whether the provision of non-audit services that were rendered to Service Affiliates, which were not pre-approved (not requiring pre-approval), is compatible with maintaining the Auditor's independence.
Item 5. Audit Committee of Listed Registrants.
Not applicable.
Item 6. Investments.
(a) Not applicable.
Item 7. Disclosure of Proxy Voting Policies and Procedures for Closed-End Management Investment Companies.
Not applicable.
Item 8. Portfolio Managers of Closed-End Management Investment Companies.
Not applicable.
Item 9. Purchases of Equity Securities by Closed-End Management Investment Companies and Affiliated Purchasers.
Not applicable.
Item 10. Submission of Matters to a Vote of Security Holders.
There have been no material changes to the procedures applicable to Item 10.
Item 11. Controls and Procedures.
(a) The Registrant's principal executive and principal financial officers have concluded, based on their evaluation of the Registrant's disclosure controls and procedures as of a date within 90 days of the filing date of this report, that the Registrant's disclosure controls and procedures are reasonably designed to ensure that information required to be disclosed by the Registrant on Form N-CSR is recorded, processed, summarized and reported within the required time periods and that information required to be disclosed by the Registrant in the reports that it files or submits on Form N-CSR is accumulated and communicated to the Registrant's management, including its principal executive and principal financial officers, as appropriate to allow timely decisions regarding required disclosure.
(b) There were no changes to the Registrant's internal control over financial reporting that occurred during the second fiscal quarter of the period covered by this report that have materially affected, or are reasonably likely to materially affect, the Registrant's internal control over financial reporting.
Item 12. Exhibits.
(a)(1) Code of ethics referred to in Item 2.
(a)(2) Certifications of principal executive and principal financial officers as required by Rule 30a-2(a) under the Investment Company Act of 1940.
(a)(3) Not applicable.
(b) Certification of principal executive and principal financial officers as required by Rule 30a-2(b) under the Investment Company Act of 1940.
SIGNATURES
Pursuant to the requirements of the Securities Exchange Act of 1934 and the Investment Company Act of 1940, the Registrant has duly caused this Report to be signed on its behalf by the undersigned, thereunto duly authorized.
Dreyfus Premier Investment Funds, Inc.
By: /s/ Bradley J. Skapyak
Bradley J. Skapyak
President
Date: December 21, 2017
Pursuant to the requirements of the Securities Exchange Act of 1934 and the Investment Company Act of 1940, this Report has been signed below by the following persons on behalf of the Registrant and in the capacities and on the dates indicated.
By: /s/ Bradley J. Skapyak
Bradley J. Skapyak
President
Date: December 21, 2017
By: /s/ James Windels
James Windels
Treasurer
Date: December 21, 2017
EXHIBIT INDEX
(a)(1) Code of ethics referred to in Item 2.
(a)(2) Certifications of principal executive and principal financial officers as required by Rule 30a-2(a) under the Investment Company Act of 1940. (EX-99.CERT)
(b) Certification of principal executive and principal financial officers as required by Rule 30a-2(b) under the Investment Company Act of 1940. (EX-99.906CERT)