UNITED STATES
SECURITIES AND EXCHANGE COMMISSION
Washington, D.C. 20549
FORM N-CSR
CERTIFIED SHAREHOLDER REPORT OF REGISTERED MANAGEMENT
INVESTMENT COMPANIES
| Investment Company Act file number | 811-06490 | |||||
| BNY Mellon Investment Funds V, Inc. | ||||||
| (Exact name of Registrant as specified in charter) | ||||||
c/o BNY Mellon Investment Adviser, Inc. 240 Greenwich Street New York, New York 10286 | ||||||
| (Address of principal executive offices) (Zip code) | ||||||
Deirdre Cunnane, Esq. 240 Greenwich Street New York, New York 10286 | ||||||
| (Name and address of agent for service) | ||||||
| Registrant's telephone number, including area code: | (212) 922-6400 | |||||
Date of fiscal year end:
| 10/31 | |||||
| Date of reporting period: | 10/31/23
| |||||
The following N-CSR relates only to the Registrant's series listed below and does not relate to any series of the Registrant with a different fiscal year end and, therefore, different N-CSR reporting requirements. A separate N-CSR will be filed for any series with a different fiscal year end, as appropriate.
BNY Mellon Developed Markets Real Estate Securities Fund
BNY Mellon Diversified International Fund
FORM N-CSR
Item 1. Reports to Stockholders.
BNY Mellon Developed Markets Real Estate Securities Fund
ANNUAL REPORT October 31, 2023 |
|

Save time. Save paper. View your next shareholder report online as soon as it’s available. Log into www.im.bnymellon.com and sign up for eCommunications. It’s simple and only takes a few minutes. |
The views expressed in this report reflect those of the portfolio manager(s) only through the end of the period covered and do not necessarily represent the views of BNY Mellon Investment Adviser, Inc. or any other person in the BNY Mellon Investment Adviser, Inc. organization. Any such views are subject to change at any time based upon market or other conditions and BNY Mellon Investment Adviser, Inc. disclaims any responsibility to update such views. These views may not be relied on as investment advice and, because investment decisions for a fund in the BNY Mellon Family of Funds are based on numerous factors, may not be relied on as an indication of trading intent on behalf of any fund in the BNY Mellon Family of Funds. |
Not FDIC-Insured • Not Bank-Guaranteed • May Lose Value |
Contents
THE FUND
FOR MORE INFORMATION
Back Cover
DISCUSSION OF FUND PERFORMANCE (Unaudited)
For the period from November 1, 2022, through October 31, 2023, as provided by the fund’s portfolio managers, E. Todd Briddell and Dean Frankel of CenterSquare Investment Management LLC, sub-adviser.
Market and Fund Performance Overview
For the 12-month period ended October 31, 2023, BNY Mellon Developed Markets Real Estate Securities Fund (the “fund”) (formerly the BNY Mellon Global Real Estate Securities Fund) produced a total return of −3.39% for Class A shares, −4.04% for Class C shares, −3.00% for Class I shares and −3.00% for Class Y shares.1 In comparison, the FTSE EPRA/NAREIT Developed Index (Net) (the “Index”), the fund’s benchmark, achieved a total return of −6.03% for the same period.2
Real estate-related securities posted losses over the reporting period, driven by rising interest rates. The fund outperformed the Index due largely to positive stock selections in, Canada, Singapore, Hong Kong, the U.K. and the U.S.
The Fund’s Investment Approach
The fund seeks to maximize total return, consisting of capital appreciation and current income, by normally investing at least 80% of its net assets, plus any borrowings for investment purposes, in publicly traded equity securities of companies principally engaged in the real estate sector. The fund normally invests in a global portfolio of equity securities of real estate companies, including REITs and real estate operating companies, with principal places of business located in, but not limited to, the developed markets of Europe, Australia, Asia and North America (including the United States).Although the fund invests primarily in developed markets, it also may invest in equity securities of companies located in emerging-markets countries and may invest in equity securities of companies of any market capitalization, including smaller companies.
REITs Hindered by “Higher-for-Longer” Rates
After declining for most of 2022, real estate-related securities showed signs of life late in the year as investors began to anticipate the end of the monetary tightening policy of the Federal Reserve (the “Fed”) and other central banks. The yield curve was inverted, indicating that a recession was likely in the coming months, which would likely have resulted in rate cuts by the Fed.
But the economy and job creation remained relatively robust through the rest of the reporting period, and inflation and rising interest rates weighed on real estate markets, especially in Europe and the U.S. The strong economy and an inflation rate that remained above the Fed’s 2% target, allowed the Fed to raise the federal funds rate six times during the reporting period, bringing the target rate to 5.25%–5.50%. As a result, the real estate sector underperformed the broader equities market.
Toward the end of the period, the central bank opted to pause its rate hikes twice, which provided support to the market. The European Central Bank (ECB) also continued to hike short-term rates during the period before pausing in October 2023.
2
While higher interest rates hindered returns in the U.S. and Europe, fundamentals in the U.S. market generally remained strong. As a result, in many cases, share prices of public REITs fell well below their net asset value. Markets in Europe were especially hampered because many operators are heavily leveraged, and rising rates increased their debt servicing costs.
In contrast to the U.S. and Europe, the performance of Asian markets during the reporting period benefited from relatively easy monetary policy. Markets in Asia also gained from the late lifting of COVID-19 restrictions relative to the rest of the world. Opening up their economies resulted in strong operating and financial results that compared favorably with periods during the pandemic shutdown.
The real estate sector experienced a further sell-off late in the reporting period. Despite pausing rate hikes late in the period, the Fed emphasized that it could keep rates “higher for longer,” which further pressured the real estate sector.
Security Selection Benefited Fund Performance
The fund’s performance versus the Index benefited from favorable stock selections. Positions in segments with exposure to secular growth trends, including industrial, affordable housing and data centers, were a leading contributor. In addition, the fund’s relatively small exposure to segments facing secular headwinds, including office and malls, was also beneficial. Being overweight defensively positioned shopping centers was advantageous as well. Anchored by tenants such as grocery stores, this segment has seen little new supply in recent years, resulting in higher rents. Within the U.S. residential segment, less exposure to the Sunbelt apartments market contributed to relative returns, as this market has seen rents weaken due to increases in supply. The fund’s exposure to senior housing was also beneficial. This segment has benefited from lagging supply, from occupancy levels that have risen since the pandemic and from easing labor costs. Regionally, stock selection was most beneficial in Canada, Singapore, Hong Kong, the U.K. and the U.S.
On a less positive note, the fund’s performance was hampered by positioning in certain markets, including Japan. Among market segments, health care was the leading detractor.
Positioned for Economic Weakness and the End of the Tightening Cycle
With inflation having declined substantially, and with an economic slump now increasingly likely, we believe the monetary hiking cycle may be near an end. In fact, we believe rates could be lower six to 12 months from now, offering the potential for upside in the real estate sector.
Nevertheless, given the risks of an economic downturn, we have positioned the fund defensively. We have focused on companies that have relatively low levels of debt and have debt maturities that are well staggered into the future. In addition, certain segments of the market continue to face challenges. We remain cautious on market segments that are more cyclical, especially in Europe and the U.S., and we have an underweight in segments with exposure to discretionary consumer spending, such as leisure and
3
DISCUSSION OF FUND PERFORMANCE (Unaudited) (continued)
hospitality. On the other hand, the industrial segment appears attractive, in part because global supply has lagged demand due to a slowdown in construction during the pandemic. We also remain cautious on the Asian market, where the prevalence of variable rate mortgages is taking a toll on consumers as rates have risen.
November 15, 2023
1 Total return includes reinvestment of dividends and any capital gains paid and does not take into consideration the maximum initial sales charge in the case of Class A shares, or the applicable contingent deferred sales charge imposed on redemptions in the case of Class C shares. Had these charges been reflected, returns would have been lower. Share price and investment return fluctuate such that upon redemption, fund shares may be worth more or less than their original cost. Return figures provided reflect the absorption of certain fund expenses by BNY Mellon Investment Adviser, Inc. pursuant to an undertaking in effect through March 1, 2024, at which time it may be extended, terminated or modified. Past performance is no guarantee of future results.
2 Source: Lipper Inc. — Reflects reinvestment of net dividends and, where applicable, capital gain distributions. The FTSE EPRA/NAREIT Developed Index (Net) is designed to track the performance of listed real estate companies and REITs worldwide. Investors cannot invest directly in any index.
Equities are subject generally to market, market sector, market liquidity, issuer and investment style risks, among other factors, to varying degrees, all of which are more fully described in the fund’s prospectus.
The fund’s performance will be influenced by political, social and economic factors affecting investments in foreign companies. Special risks associated with investments in foreign companies include exposure to currency fluctuations, less liquidity, less developed or less efficient trading markets, lack of comprehensive company information, political instability and differing auditing and legal standards. These risks are enhanced in emerging-markets countries.
Because the fund’s investments are concentrated in the securities of companies principally engaged in the real estate sector, the value of the fund’s shares will be affected by factors particular to the real estate sector and may fluctuate more widely than that of a fund which invests in a broader range of industries. The securities of issuers that are principally engaged in the real estate sector may be subject to risks similar to those associated with the direct ownership of real estate. These include declines in real estate values and defaults by mortgagors or other borrowers.
In addition to the risks which are linked to the real estate sector in general, REITs are subject to additional risks. Equity REITs may be affected by changes in the value of the underlying property owned by the trust, while mortgage REITs may be affected by the quality of any credit extended. Further, REITs are highly dependent upon management skill and often are not diversified. REITs also are subject to heavy cash-flow dependency and to defaults by borrowers or lessees.
The fund may, but is not required to, use derivative instruments. A small investment in derivatives could have a potentially large impact on the fund’s performance. The use of derivatives involves risks different from, or possibly greater than, the risks associated with investing directly in the underlying assets.
4
FUND PERFORMANCE (Unaudited)
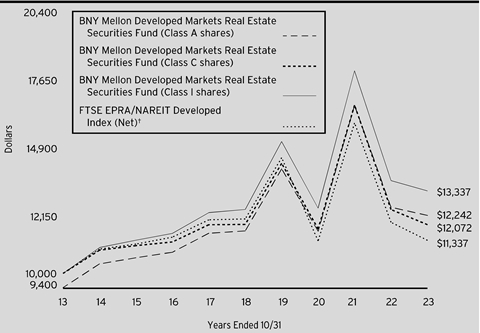
Comparison of change in value of a $10,000 investment in Class A shares, Class C shares and Class I shares of BNY Mellon Developed Markets Real Estate Securities Fund with a hypothetical investment of $10,000 in the FTSE EPRA/NAREIT Developed Index (Net) (the “Index”).
† Source: Lipper Inc.
Past performance is not predictive of future performance.
The above graph compares a hypothetical $10,000 investment made in Class A shares, Class C shares and Class I shares of BNY Mellon Developed Markets Real Estate Securities Fund on 10/31/13 to a hypothetical investment of $10,000 made in the Index on that date. All dividends and capital gain distributions are reinvested.
The fund’s performance shown in the line graph above takes into account the maximum initial sales charge on Class A shares and all other applicable fees and expenses on all classes. The Index is designed to track the performance of listed real estate companies and REITs worldwide. Unlike a mutual fund, the Index is not subject to charges, fees and other expenses. Investors cannot invest directly in any index. Further information relating to fund performance, including expense reimbursements, if applicable, is contained in the Financial Highlights section of the prospectus and elsewhere in this report.
5
FUND PERFORMANCE (Unaudited) (continued)
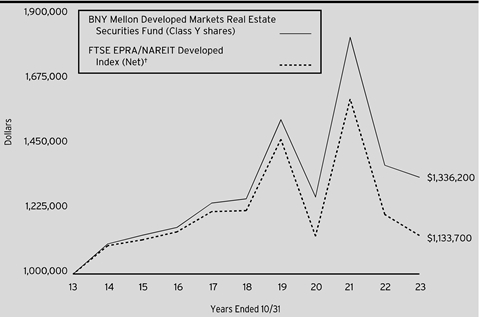
Comparison of change in value of a $1,000,000 investment in Class Y shares of BNY Mellon Developed Markets Real Estate Securities Fund with a hypothetical investment of $1,000,000 in the FTSE EPRA/NAREIT Developed Index (Net) (the “Index”).
† Source: Lipper Inc.
Past performance is not predictive of future performance.
The above graph compares a hypothetical $1,000,000 investment made in Class Y shares of BNY Mellon Developed Markets Real Estate Securities Fund on 10/31/13 to a hypothetical investment of $1,000,000 made in the Index on that date. All dividends and capital gain distributions are reinvested.
The fund’s performance shown in the line graph above takes into account all applicable fees and expenses of the fund’s Class Y shares. The Index is designed to track the performance of listed real estate companies and REITs worldwide. Unlike a mutual fund, the Index is not subject to charges, fees and other expenses. Investors cannot invest directly in any index. Further information relating to fund performance, including expense reimbursements, if applicable, is contained in the Financial Highlights section of the prospectus and elsewhere in this report.
6
Average Annual Total Returns as of 10/31/2023
|
|
| ||||
| 1 Year | 5 Years | ||||
10 Years | ||||||
Class A shares | ||||||
with maximum sales charge (5.75%) | -8.92% | -.31% | 2.04% | |||
without sales charge | -3.39% | .88% | 2.65% | |||
Class C shares | ||||||
with applicable redemption charge † | -4.95% | .15% | 1.90% | |||
without redemption | -4.04% | .15% | 1.90% | |||
Class I shares | -3.00% | 1.17% | 2.92% | |||
Class Y shares | -3.00% | 1.17% | 2.94% | |||
FTSE EPRA/NAREIT Developed Index (Net) | -6.03% | -1.46% | 1.26% | |||
† The maximum contingent deferred sales charge for Class C shares is 1% for shares redeemed within one year of the date of purchase.
The performance data quoted represents past performance, which is no guarantee of future results. Share price and investment return fluctuate and an investor’s shares may be worth more or less than original cost upon redemption. Current performance may be lower or higher than the performance quoted. Go to www.im.bnymellon.com for the fund’s most recent month-end returns.
The fund’s performance shown in the graphs and table does not reflect the deduction of taxes that a shareholder would pay on fund distributions or the redemption of fund shares. In addition to the performance of Class A shares shown with and without a maximum sales charge, the fund’s performance shown in the table takes into account all other applicable fees and expenses on all classes.
7
UNDERSTANDING YOUR FUND’S EXPENSES (Unaudited)
As a mutual fund investor, you pay ongoing expenses, such as management fees and other expenses. Using the information below, you can estimate how these expenses affect your investment and compare them with the expenses of other funds. You also may pay one-time transaction expenses, including sales charges (loads) and redemption fees, which are not shown in this section and would have resulted in higher total expenses. For more information, see your fund’s prospectus or talk to your financial adviser.
Review your fund’s expenses
The table below shows the expenses you would have paid on a $1,000 investment in BNY Mellon Developed Markets Real Estate Securities Fund from May 1, 2023 to October 31, 2023. It also shows how much a $1,000 investment would be worth at the close of the period, assuming actual returns and expenses.
Expenses and Value of a $1,000 Investment |
| |||||
Assume actual returns for the six months ended October 31, 2023 |
| |||||
|
|
|
|
|
|
|
|
| Class A | Class C | Class I | Class Y |
|
Expenses paid per $1,000† | $6.18 | $9.73 | $5.00 | $5.00 |
| |
Ending value (after expenses) | $885.90 | $883.10 | $887.60 | $887.60 |
| |
COMPARING YOUR FUND’S EXPENSES WITH THOSE OF OTHER FUNDS (Unaudited)
Using the SEC’s method to compare expenses
The Securities and Exchange Commission (“SEC”) has established guidelines to help investors assess fund expenses. Per these guidelines, the table below shows your fund’s expenses based on a $1,000 investment, assuming a hypothetical 5% annualized return. You can use this information to compare the ongoing expenses (but not transaction expenses or total cost) of investing in the fund with those of other funds. All mutual fund shareholder reports will provide this information to help you make this comparison. Please note that you cannot use this information to estimate your actual ending account balance and expenses paid during the period.
Expenses and Value of a $1,000 Investment |
| |||||
Assuming a hypothetical 5% annualized return for the six months ended October 31, 2023 |
| |||||
|
|
|
|
|
|
|
|
| Class A | Class C | Class I | Class Y |
|
Expenses paid per $1,000† | $6.61 | $10.41 | $5.35 | $5.35 |
| |
Ending value (after expenses) | $1,018.65 | $1,014.87 | $1,019.91 | $1,019.91 |
| |
† | Expenses are equal to the fund’s annualized expense ratio of 1.30% for Class A, 2.05% for Class C, 1.05% for Class I and 1.05% for Class Y, multiplied by the average account value over the period, multiplied by 184/365 (to reflect the one-half year period). | |||||
8
STATEMENT OF INVESTMENTS
October 31, 2023
Description | Shares | Value ($) | |||||
Common Stocks - 99.5% | |||||||
Australia - 3.7% | |||||||
Abacus Storage King | 1,219,520 | a | 771,845 | ||||
Dexus | 429,850 | 1,785,961 | |||||
Goodman Group | 92,260 | 1,225,544 | |||||
Mirvac Group | 2,322,860 | 2,716,948 | |||||
Region RE Ltd. | 980,540 | 1,233,401 | |||||
Scentre Group | 1,232,757 | 1,924,909 | |||||
9,658,608 | |||||||
Belgium - 1.8% | |||||||
Aedifica SA | 25,732 | 1,403,754 | |||||
Cofinimmo SA | 16,766 | 1,041,323 | |||||
Warehouses De Pauw, CVA | 88,604 | 2,198,192 | |||||
4,643,269 | |||||||
Canada - 3.2% | |||||||
Allied Properties Real Estate Investment Trust | 32,240 | 368,490 | |||||
Canadian Apartment Properties REIT | 16,170 | 475,976 | |||||
Chartwell Retirement Residences | 166,040 | 1,216,489 | |||||
First Capital Real Estate Investment Trust | 167,280 | 1,572,981 | |||||
Granite Real Estate Investment Trust | 17,300 | 787,810 | |||||
H&R Real Estate Investment Trust | 157,980 | 971,746 | |||||
Tricon Residential, Inc. | 417,800 | 2,768,763 | |||||
8,162,255 | |||||||
France - .5% | |||||||
Klepierre SA | 32,300 | 786,025 | |||||
Unibail-Rodamco-Westfield | 11,680 | a | 578,485 | ||||
1,364,510 | |||||||
Germany - 2.4% | |||||||
LEG Immobilien SE | 37,010 | a | 2,304,156 | ||||
Vonovia SE | 168,180 | 3,860,847 | |||||
6,165,003 | |||||||
Hong Kong - 4.1% | |||||||
CK Asset Holdings Ltd. | 97,000 | 484,501 | |||||
Link REIT | 879,102 | 4,031,301 | |||||
Sun Hung Kai Properties Ltd. | 432,600 | 4,440,134 | |||||
Swire Properties Ltd. | 548,000 | 1,067,558 | |||||
Wharf Real Estate Investment Co. Ltd. | 192,000 | 674,141 | |||||
10,697,635 | |||||||
Japan - 9.8% | |||||||
Activia Properties, Inc. | 428 | 1,156,030 | |||||
Advance Residence Investment Corp. | 951 | 2,066,443 | |||||
9
STATEMENT OF INVESTMENTS (continued)
Description | Shares | Value ($) | |||||
Common Stocks - 99.5% (continued) | |||||||
Japan - 9.8% (continued) | |||||||
Japan Hotel REIT Investment Corp. | 2,522 | 1,146,458 | |||||
Japan Prime Realty Investment Corp. | 524 | 1,228,318 | |||||
KDX Realty Investment Corp. | 1,006 | b | 1,049,938 | ||||
Mitsubishi Estate Co. Ltd. | 258,600 | 3,302,613 | |||||
Mitsui Fudosan Co. Ltd. | 224,600 | 4,866,989 | |||||
Mitsui Fudosan Logistics Park, Inc. | 174 | 526,235 | |||||
Nippon Building Fund, Inc. | 413 | 1,659,408 | |||||
Nippon Prologis REIT, Inc. | 1,121 | 1,993,471 | |||||
Nomura Real Estate Master Fund, Inc. | 1,454 | 1,603,913 | |||||
Orix JREIT, Inc. | 1,832 | 2,105,820 | |||||
SOSiLA Logistics REIT, Inc. | 1,110 | 878,319 | |||||
Sumitomo Realty & Development Co. Ltd. | 74,600 | 1,873,552 | |||||
25,457,507 | |||||||
Mexico - .3% | |||||||
Corp Inmobiliaria Vesta SAB de CV, ADR | 26,370 | b | 829,073 | ||||
Norway - .2% | |||||||
Entra ASA | 59,308 | b,c | 462,832 | ||||
Singapore - 3.1% | |||||||
CapitaLand Integrated Commercial Trust | 2,204,900 | 2,842,465 | |||||
Capitaland Investment Ltd. | 608,300 | 1,309,910 | |||||
Digital Core REIT Management Pte. Ltd. | 1,095,535 | 553,401 | |||||
Mapletree Logistics Trust | 1,491,200 | 1,601,765 | |||||
Mapletree Pan Asia Commercial Trust | 1,730,271 | 1,683,614 | |||||
7,991,155 | |||||||
Spain - 1.4% | |||||||
Cellnex Telecom SA | 36,660 | c | 1,080,568 | ||||
Merlin Properties Socimi SA | 286,670 | 2,395,287 | |||||
3,475,855 | |||||||
Sweden - 1.0% | |||||||
Castellum AB | 152,815 | b | 1,460,892 | ||||
Fabege AB | 147,310 | 1,101,410 | |||||
2,562,302 | |||||||
United Kingdom - 4.2% | |||||||
Empiric Student Property PLC | 1,186,808 | 1,222,346 | |||||
Grainger PLC | 543,596 | 1,512,922 | |||||
Land Securities Group PLC | 198,600 | 1,382,044 | |||||
Safestore Holdings PLC | 142,778 | 1,187,239 | |||||
Segro PLC | 127,823 | 1,114,032 | |||||
Supermarket Income REIT PLC | 710,668 | 627,085 | |||||
The British Land Company PLC | 562,050 | 2,042,724 | |||||
Tritax Big Box REIT PLC | 1,104,585 | 1,838,029 | |||||
10,926,421 | |||||||
10
Description | Shares | Value ($) | |||||
Common Stocks - 99.5% (continued) | |||||||
United States - 63.8% | |||||||
Agree Realty Corp. | 112,160 | d | 6,274,230 | ||||
Alexandria Real Estate Equities, Inc. | 35,480 | d | 3,304,252 | ||||
American Homes 4 Rent, Cl. A | 92,596 | d | 3,031,593 | ||||
American Tower Corp. | 13,910 | d | 2,478,623 | ||||
Americold Realty Trust, Inc. | 22,700 | d | 595,194 | ||||
AvalonBay Communities, Inc. | 35,060 | d | 5,810,844 | ||||
Boston Properties, Inc. | 43,750 | d | 2,343,688 | ||||
Brixmor Property Group, Inc. | 110,770 | d | 2,302,908 | ||||
Broadstone Net Lease, Inc. | 152,059 | d | 2,151,635 | ||||
CareTrust REIT, Inc. | 90,700 | d | 1,951,864 | ||||
Cousins Properties, Inc. | 133,180 | d | 2,379,927 | ||||
CubeSmart | 18,348 | d | 625,483 | ||||
Digital Realty Trust, Inc. | 60,320 | d | 7,501,395 | ||||
Douglas Emmett, Inc. | 89,070 | b,d | 998,475 | ||||
Equinix, Inc. | 19,787 | d | 14,437,387 | ||||
Equity Residential | 73,600 | d | 4,072,288 | ||||
Extra Space Storage, Inc. | 75,010 | d | 7,770,286 | ||||
First Industrial Realty Trust, Inc. | 90,830 | d | 3,842,109 | ||||
Healthpeak Properties, Inc. | 222,600 | d | 3,461,430 | ||||
Host Hotels & Resorts, Inc. | 212,469 | d | 3,289,020 | ||||
Invitation Homes, Inc. | 146,290 | d | 4,343,350 | ||||
Kilroy Realty Corp. | 54,556 | d | 1,559,210 | ||||
Kimco Realty Corp. | 314,770 | d | 5,646,974 | ||||
Medical Properties Trust, Inc. | 333,820 | b,d | 1,595,660 | ||||
NNN REIT, Inc. | 29,100 | d | 1,057,203 | ||||
Omega Healthcare Investors, Inc. | 59,920 | d | 1,983,352 | ||||
Prologis, Inc. | 135,760 | d | 13,677,820 | ||||
Public Storage | 15,663 | d | 3,738,915 | ||||
Realty Income Corp. | 152,420 | d | 7,221,660 | ||||
Retail Opportunity Investments Corp. | 200,739 | d | 2,356,676 | ||||
Rexford Industrial Realty, Inc. | 99,430 | d | 4,299,353 | ||||
RPT Realty | 174,278 | d | 1,880,460 | ||||
SBA Communications Corp. | 2,760 | d | 575,819 | ||||
Simon Property Group, Inc. | 40,590 | d | 4,460,435 | ||||
Sun Communities, Inc. | 55,250 | d | 6,146,010 | ||||
UDR, Inc. | 178,880 | d | 5,690,173 | ||||
Ventas, Inc. | 150,750 | d | 6,400,845 | ||||
VICI Properties, Inc. | 101,200 | d | 2,823,480 | ||||
Welltower, Inc. | 101,170 | d | 8,458,824 | ||||
WP Carey, Inc. | 12,580 | d | 674,917 | ||||
Xenia Hotels & Resorts, Inc. | 165,000 | d | 1,918,950 | ||||
165,132,717 | |||||||
Total Common Stocks (cost $288,405,639) | 257,529,142 | ||||||
11
STATEMENT OF INVESTMENTS (continued)
Description | 1-Day | Shares | Value ($) | ||||
Investment Companies - .4% | |||||||
Registered Investment Companies - .4% | |||||||
Dreyfus Institutional Preferred Government Plus Money Market Fund, Institutional Shares | 5.40 | 1,076,995 | e | 1,076,995 | |||
Investment of Cash Collateral for Securities Loaned - .6% | |||||||
Registered Investment Companies - .6% | |||||||
Dreyfus Institutional Preferred Government Plus Money Market Fund, Institutional Shares | 5.40 | 1,633,384 | e | 1,633,384 | |||
Total Investments (cost $291,116,018) | 100.5% | 260,239,521 | |||||
Liabilities, Less Cash and Receivables | (.5%) | (1,264,371) | |||||
Net Assets | 100.0% | 258,975,150 | |||||
ADR—American Depositary Receipt
CVA—Company Voluntary Arrangement
REIT—Real Estate Investment Trust
a Non-income producing security.
b Security, or portion thereof, on loan. At October 31, 2023, the value of the fund’s securities on loan was $2,661,140 and the value of the collateral was $3,319,750, consisting of cash collateral of $1,633,384 and U.S. Government & Agency securities valued at $1,686,366. In addition, the value of collateral may include pending sales that are also on loan.
c Security exempt from registration pursuant to Rule 144A under the Securities Act of 1933. These securities may be resold in transactions exempt from registration, normally to qualified institutional buyers. At October 31, 2023, these securities were valued at $1,543,400 or .6% of net assets.
d Investment in real estate investment trust within the United States.
e Investment in affiliated issuer. The investment objective of this investment company is publicly available and can be found within the investment company’s prospectus.
Portfolio Summary (Unaudited) † | Value (%) |
Equity Real Estate Investment | 86.1 |
Real Estate Management & Development | 12.5 |
Investment Companies | 1.0 |
Health Care Equipment & Services | .5 |
Telecommunication Services | .4 |
100.5 |
† Based on net assets.
See notes to financial statements.
12
Affiliated Issuers | ||||||
Description | Value ($) 10/31/2022 | Purchases ($)† | Sales ($) | Value ($) 10/31/2023 | Dividends/ | |
Registered Investment Companies - .4% | ||||||
Dreyfus Institutional Preferred Government Plus Money Market Fund, Institutional Shares - .4% | - | 52,464,707 | (51,387,712) | 1,076,995 | 47,167 | |
Investment of Cash Collateral for Securities Loaned - .6%†† | ||||||
Dreyfus Institutional Preferred Government Plus Money Market Fund, Institutional Shares - .6% | - | 12,382,699 | (10,749,315) | 1,633,384 | 3,840 | ††† |
Dreyfus Institutional Preferred Government Plus Money Market Fund, SL Shares - .0% | 5,156,756 | 29,896,612 | (35,053,368) | - | 10,001 | ††† |
Total - 1.0% | 5,156,756 | 94,744,018 | (97,190,395) | 2,710,379 | 61,008 | |
† Includes reinvested dividends/distributions.
†† Effective July 3, 2023, cash collateral for securities lending was transferred from Dreyfus Institutional Preferred Government Plus Money Market Fund, SL Shares to Dreyfus Institutional Preferred Government Plus Money Market Fund, Institutional Shares.
††† Represents securities lending income earned from the reinvestment of cash collateral from loaned securities, net of fees and collateral investment expenses, and other payments to and from borrowers of securities.
See notes to financial statements.
13
STATEMENT OF ASSETS AND LIABILITIES
October 31, 2023
|
|
|
|
|
|
|
|
|
| Cost |
| Value |
|
Assets ($): |
|
|
|
| ||
Investments in securities—See Statement of Investments |
|
|
| |||
Unaffiliated issuers | 288,405,639 |
| 257,529,142 |
| ||
Affiliated issuers |
| 2,710,379 |
| 2,710,379 |
| |
Cash denominated in foreign currency |
|
| 9,161 |
| 9,166 |
|
Receivable for investment securities sold |
| 1,881,547 |
| |||
Receivable for shares of Common Stock subscribed |
| 401,008 |
| |||
Dividends and securities lending income receivable |
| 398,019 |
| |||
Tax reclaim receivable—Note 1(b) |
| 346,466 |
| |||
Prepaid expenses |
|
|
|
| 57,923 |
|
|
|
|
|
| 263,333,650 |
|
Liabilities ($): |
|
|
|
| ||
Due to BNY Mellon Investment Adviser, Inc. and affiliates—Note 3(c) |
| 258,139 |
| |||
Liability for securities on loan—Note 1(c) |
| 1,633,384 |
| |||
Payable for investment securities purchased |
| 1,605,334 |
| |||
Payable for shares of Common Stock redeemed |
| 760,675 |
| |||
Directors’ fees and expenses payable |
| 3,666 |
| |||
Interest payable—Note 2 |
| 941 |
| |||
Other accrued expenses |
|
|
|
| 96,361 |
|
|
|
|
|
| 4,358,500 |
|
Net Assets ($) |
|
| 258,975,150 |
| ||
Composition of Net Assets ($): |
|
|
|
| ||
Paid-in capital |
|
|
|
| 320,913,369 |
|
Total distributable earnings (loss) |
|
|
|
| (61,938,219) |
|
Net Assets ($) |
|
| 258,975,150 |
| ||
Net Asset Value Per Share | Class A | Class C | Class I | Class Y |
|
Net Assets ($) | 8,944,422 | 265,658 | 32,744,696 | 217,020,374 |
|
Shares Outstanding | 1,309,081 | 39,955 | 4,880,911 | 32,335,490 |
|
Net Asset Value Per Share ($) | 6.83 | 6.65 | 6.71 | 6.71 |
|
|
|
|
|
|
|
See notes to financial statements. |
|
|
|
|
|
14
STATEMENT OF OPERATIONS
Year Ended October 31, 2023
|
|
|
|
|
|
|
|
|
|
|
|
|
|
Investment Income ($): |
|
|
|
| ||
Income: |
|
|
|
| ||
Cash dividends (net of $511,965 foreign taxes withheld at source): |
| |||||
Unaffiliated issuers |
|
| 10,796,305 |
| ||
Affiliated issuers |
|
| 47,167 |
| ||
Income from securities lending—Note 1(c) |
|
| 13,841 |
| ||
Total Income |
|
| 10,857,313 |
| ||
Expenses: |
|
|
|
| ||
Management fee—Note 3(a) |
|
| 2,971,047 |
| ||
Professional fees |
|
| 110,738 |
| ||
Shareholder servicing costs—Note 3(c) |
|
| 110,703 |
| ||
Custodian fees—Note 3(c) |
|
| 75,119 |
| ||
Prospectus and shareholders’ reports |
|
| 53,328 |
| ||
Registration fees |
|
| 42,464 |
| ||
Directors’ fees and expenses—Note 3(d) |
|
| 25,629 |
| ||
Chief Compliance Officer fees—Note 3(c) |
|
| 22,009 |
| ||
Interest expense—Note 2 |
|
| 18,223 |
| ||
Loan commitment fees—Note 2 |
|
| 6,069 |
| ||
Distribution fees—Note 3(b) |
|
| 3,004 |
| ||
Miscellaneous |
|
| 35,296 |
| ||
Total Expenses |
|
| 3,473,629 |
| ||
Less—reduction in expenses due to undertaking—Note 3(a) |
|
| (126,140) |
| ||
Less—reduction in fees due to earnings credits—Note 3(c) |
|
| (3,985) |
| ||
Net Expenses |
|
| 3,343,504 |
| ||
Net Investment Income |
|
| 7,513,809 |
| ||
Realized and Unrealized Gain (Loss) on Investments—Note 4 ($): |
|
| ||||
Net realized gain (loss) on investments and foreign currency transactions | (19,752,466) |
| ||||
Net realized gain (loss) on forward foreign currency exchange contracts | (11,149) |
| ||||
Net Realized Gain (Loss) |
|
| (19,763,615) |
| ||
Net change in unrealized appreciation (depreciation) on investments | 9,317,734 |
| ||||
Net Realized and Unrealized Gain (Loss) on Investments |
|
| (10,445,881) |
| ||
Net (Decrease) in Net Assets Resulting from Operations |
| (2,932,072) |
| |||
|
|
|
|
|
|
|
See notes to financial statements. | ||||||
15
STATEMENT OF CHANGES IN NET ASSETS
|
|
|
| Year Ended October 31, | |||||
|
|
|
| 2023 |
| 2022 |
| ||
Operations ($): |
|
|
|
|
|
|
|
| |
Net investment income |
|
| 7,513,809 |
|
|
| 8,554,723 |
| |
Net realized gain (loss) on investments |
| (19,763,615) |
|
|
| 19,690,657 |
| ||
Net change in unrealized appreciation |
| 9,317,734 |
|
|
| (151,454,525) |
| ||
Net Increase (Decrease) in Net Assets | (2,932,072) |
|
|
| (123,209,145) |
| |||
Distributions ($): |
| ||||||||
Distributions to shareholders: |
|
|
|
|
|
|
|
| |
Class A |
|
| (1,154,341) |
|
|
| (1,719,290) |
| |
Class C |
|
| (28,813) |
|
|
| (45,247) |
| |
Class I |
|
| (2,377,205) |
|
|
| (4,414,488) |
| |
Class Y |
|
| (19,662,242) |
|
|
| (35,174,344) |
| |
Total Distributions |
|
| (23,222,601) |
|
|
| (41,353,369) |
| |
Capital Stock Transactions ($): |
| ||||||||
Net proceeds from shares sold: |
|
|
|
|
|
|
|
| |
Class A |
|
| 2,503,435 |
|
|
| 6,610,536 |
| |
Class C |
|
| 11 |
|
|
| 108,531 |
| |
Class I |
|
| 16,419,672 |
|
|
| 18,537,396 |
| |
Class Y |
|
| 65,012,621 |
|
|
| 72,088,418 |
| |
Distributions reinvested: |
|
|
|
|
|
|
|
| |
Class A |
|
| 1,119,440 |
|
|
| 1,667,799 |
| |
Class C |
|
| 25,654 |
|
|
| 44,008 |
| |
Class I |
|
| 2,303,868 |
|
|
| 4,244,270 |
| |
Class Y |
|
| 7,848,579 |
|
|
| 12,460,618 |
| |
Cost of shares redeemed: |
|
|
|
|
|
|
|
| |
Class A |
|
| (10,770,755) |
|
|
| (6,388,895) |
| |
Class C |
|
| (187,594) |
|
|
| (185,706) |
| |
Class I |
|
| (19,993,618) |
|
|
| (24,243,125) |
| |
Class Y |
|
| (138,581,655) |
|
|
| (91,324,012) |
| |
Increase (Decrease) in Net Assets | (74,300,342) |
|
|
| (6,380,162) |
| |||
Total Increase (Decrease) in Net Assets | (100,455,015) |
|
|
| (170,942,676) |
| |||
Net Assets ($): |
| ||||||||
Beginning of Period |
|
| 359,430,165 |
|
|
| 530,372,841 |
| |
End of Period |
|
| 258,975,150 |
|
|
| 359,430,165 |
| |
16
|
|
|
| Year Ended October 31, | |||||
|
|
|
| 2023 |
| 2022 |
| ||
Capital Share Transactions (Shares): |
| ||||||||
Class Aa |
|
|
|
|
|
|
|
| |
Shares sold |
|
| 331,042 |
|
|
| 696,756 |
| |
Shares issued for distributions reinvested |
|
| 151,275 |
|
|
| 162,712 |
| |
Shares redeemed |
|
| (1,417,940) |
|
|
| (714,100) |
| |
Net Increase (Decrease) in Shares Outstanding | (935,623) |
|
|
| 145,368 |
| |||
Class C |
|
|
|
|
|
|
|
| |
Shares sold |
|
| 2 |
|
|
| 11,540 |
| |
Shares issued for distributions reinvested |
|
| 3,543 |
|
|
| 4,383 |
| |
Shares redeemed |
|
| (24,955) |
|
|
| (19,274) |
| |
Net Increase (Decrease) in Shares Outstanding | (21,410) |
|
|
| (3,351) |
| |||
Class Ia |
|
|
|
|
|
|
|
| |
Shares sold |
|
| 2,236,420 |
|
|
| 1,988,899 |
| |
Shares issued for distributions reinvested |
|
| 317,775 |
|
|
| 421,896 |
| |
Shares redeemed |
|
| (2,613,358) |
|
|
| (2,650,690) |
| |
Net Increase (Decrease) in Shares Outstanding | (59,163) |
|
|
| (239,895) |
| |||
Class Ya |
|
|
|
|
|
|
|
| |
Shares sold |
|
| 8,755,701 |
|
|
| 7,711,261 |
| |
Shares issued for distributions reinvested |
|
| 1,082,563 |
|
|
| 1,238,630 |
| |
Shares redeemed |
|
| (18,443,084) |
|
|
| (10,278,202) |
| |
Net Increase (Decrease) in Shares Outstanding | (8,604,820) |
|
|
| (1,328,311) |
| |||
|
|
|
|
|
|
|
|
|
|
a | During the period ended October 31, 2023, 572,878 Class Y shares representing $4,268,559 were exchanged for 573,182 Class I shares. During the period ended October 31, 2022, 620,062 Class Y shares representing $5,759,676 were exchanged for 620,394 Class I shares and 741 Class Y shares representing $7,458 were exchanged for 728 Class A shares. | ||||||||
See notes to financial statements. | |||||||||
17
FINANCIAL HIGHLIGHTS
The following tables describe the performance for each share class for the fiscal periods indicated. All information (except portfolio turnover rate) reflects financial results for a single fund share. Net asset value total return is calculated assuming an initial investment made at the net asset value at the beginning of the period, reinvestment of all dividends and distributions at net asset value during the period, and redemption at net asset value on the last day of the period. Net asset value total return includes adjustments in accordance with accounting principles generally accepted in the United States of America and as such, the net asset value for financial reporting purposes and the returns based upon those net asset values may differ from the net asset value and returns for shareholder transactions. These figures have been derived from the fund’s financial statements.
Year Ended October 31, | ||||||
Class A Shares | 2023 | 2022 | 2021 | 2020 | 2019 | |
Per Share Data ($): | ||||||
Net asset value, beginning of period | 7.58 | 10.84 | 7.62 | 10.29 | 8.84 | |
Investment Operations: | ||||||
Net investment incomea | .18 | .15 | .14 | .11 | .15 | |
Net realized and unrealized | (.39) | (2.60) | 3.15 | (1.79) | 1.66 | |
Total from Investment Operations | (.21) | (2.45) | 3.29 | (1.68) | 1.81 | |
Distributions: | ||||||
Dividends from | (.12) | (.30) | (.07) | (.37) | (.20) | |
Dividends from net realized | (.42) | (.51) | - | (.62) | (.16) | |
Total Distributions | (.54) | (.81) | (.07) | (.99) | (.36) | |
Net asset value, end of period | 6.83 | 7.58 | 10.84 | 7.62 | 10.29 | |
Total Return (%)b | (3.39) | (24.52) | 43.44 | (17.72) | 21.39 | |
Ratios/Supplemental Data (%): | ||||||
Ratio of total expenses to | 1.61 | 2.55 | 2.10 | 2.44 | 2.45 | |
Ratio of net expenses to | 1.31 | 1.30 | 1.30 | 1.30 | 1.30 | |
Ratio of net investment income to | 2.32 | 1.58 | 1.38 | 1.29 | 1.63 | |
Portfolio Turnover Rate | 54.85 | 74.59 | 84.48 | 116.78 | 79.34 | |
Net Assets, end of period ($ x 1,000) | 8,944 | 17,007 | 22,767 | 17,764 | 20,861 | |
a Based on average shares outstanding.
b Exclusive of sales charge.
See notes to financial statements.
18
Year Ended October 31, | ||||||
Class C Shares | 2023 | 2022 | 2021 | 2020 | 2019 | |
Per Share Data ($): | ||||||
Net asset value, beginning of period | 7.38 | 10.58 | 7.43 | 10.06 | 8.64 | |
Investment Operations: | ||||||
Net investment incomea | .12 | .07 | .06 | .06 | .09 | |
Net realized and unrealized | (.38) | (2.53) | 3.09 | (1.77) | 1.62 | |
Total from Investment Operations | (.26) | (2.46) | 3.15 | (1.71) | 1.71 | |
Distributions: | ||||||
Dividends from | (.05) | (.23) | (.00)b | (.30) | (.13) | |
Dividends from net realized | (.42) | (.51) | - | (.62) | (.16) | |
Total Distributions | (.47) | (.74) | (.00)b | (.92) | (.29) | |
Net asset value, end of period | 6.65 | 7.38 | 10.58 | 7.43 | 10.06 | |
Total Return (%)c | (4.04) | (25.11) | 42.42 | (18.37) | 20.61 | |
Ratios/Supplemental Data (%): | ||||||
Ratio of total expenses to | 2.38 | 2.27 | 2.23 | 2.24 | 2.23 | |
Ratio of net expenses to | 2.06 | 2.05 | 2.05 | 2.05 | 2.05 | |
Ratio of net investment income to | 1.56 | .80 | .61 | .68 | .93 | |
Portfolio Turnover Rate | 54.85 | 74.59 | 84.48 | 116.78 | 79.34 | |
Net Assets, end of period ($ x 1,000) | 266 | 453 | 685 | 630 | 960 | |
a Based on average shares outstanding.
b Amount represents less than $.01 per share.
c Exclusive of sales charge.
See notes to financial statements.
19
FINANCIAL HIGHLIGHTS (continued)
Year Ended October 31, | ||||||
Class I Shares | 2023 | 2022 | 2021 | 2020 | 2019 | |
Per Share Data ($): | ||||||
Net asset value, beginning of period | 7.45 | 10.68 | 7.51 | 10.15 | 8.72 | |
Investment Operations: | ||||||
Net investment incomea | .18 | .17 | .15 | .15 | .18 | |
Net realized and unrealized | (.36) | (2.56) | 3.11 | (1.77) | 1.63 | |
Total from Investment | (.18) | (2.39) | 3.26 | (1.62) | 1.81 | |
Distributions: | ||||||
Dividends from | (.14) | (.33) | (.09) | (.40) | (.22) | |
Dividends from net realized | (.42) | (.51) | - | (.62) | (.16) | |
Total Distributions | (.56) | (.84) | (.09) | (1.02) | (.38) | |
Net asset value, end of period | 6.71 | 7.45 | 10.68 | 7.51 | 10.15 | |
Total Return (%) | (3.00) | (24.41) | 43.93 | (17.56) | 21.79 | |
Ratios/Supplemental Data (%): | ||||||
Ratio of total expenses to | 1.15 | 1.11 | 1.08 | 1.09 | 1.06 | |
Ratio of net expenses to | 1.06 | 1.05 | 1.05 | 1.05 | 1.05 | |
Ratio of net investment income to | 2.38 | 1.85 | 1.53 | 1.84 | 1.92 | |
Portfolio Turnover Rate | 54.85 | 74.59 | 84.48 | 116.78 | 79.34 | |
Net Assets, end of period ($ x 1,000) | 32,745 | 36,804 | 55,310 | 32,044 | 84,925 | |
a Based on average shares outstanding.
See notes to financial statements.
20
Year Ended October 31, | ||||||
Class Y Shares | 2023 | 2022 | 2021 | 2020 | 2019 | |
Per Share Data ($): | ||||||
Net asset value, beginning of period | 7.45 | 10.68 | 7.51 | 10.16 | 8.73 | |
Investment Operations: | ||||||
Net investment incomea | .18 | .17 | .16 | .14 | .18 | |
Net realized and unrealized | (.36) | (2.56) | 3.11 | (1.77) | 1.63 | |
Total from Investment Operations | (.18) | (2.39) | 3.27 | (1.63) | 1.81 | |
Distributions: | ||||||
Dividends from | (.14) | (.33) | (.10) | (.40) | (.22) | |
Dividends from net realized | (.42) | (.51) | - | (.62) | (.16) | |
Total Distributions | (.56) | (.84) | (.10) | (1.02) | (.38) | |
Net asset value, end of period | 6.71 | 7.45 | 10.68 | 7.51 | 10.16 | |
Total Return (%) | (3.00) | (24.39) | 43.77 | (17.50) | 21.81 | |
Ratios/Supplemental Data (%): | ||||||
Ratio of total expenses to | 1.08 | 1.04 | 1.03 | 1.03 | 1.01 | |
Ratio of net expenses to | 1.06 | 1.04 | 1.03 | 1.03 | 1.01 | |
Ratio of net investment income to | 2.41 | 1.85 | 1.63 | 1.74 | 1.95 | |
Portfolio Turnover Rate | 54.85 | 74.59 | 84.48 | 116.78 | 79.34 | |
Net Assets, end of period ($ x 1,000) | 217,020 | 305,166 | 451,611 | 353,495 | 641,390 | |
a Based on average shares outstanding.
See notes to financial statements.
21
NOTES TO FINANCIAL STATEMENTS
NOTE 1—Significant Accounting Policies:
BNY Mellon Developed Markets Real Estate Securities Fund (the “fund”) is a separate diversified series of BNY Mellon Investment Funds V, Inc. (the “Company”), which is registered under the Investment Company Act of 1940, as amended (the “Act”), as an open-end management investment company and operates as a series company currently offering three series, including the fund. The fund’s investment objective is to seek to maximize total return consisting of capital appreciation and current income. BNY Mellon Investment Adviser, Inc. (the “Adviser”), a wholly-owned subsidiary of The Bank of New York Mellon Corporation (“BNY Mellon”), serves as the fund’s investment adviser. CenterSquare Investment Management LLC (“the Sub-Adviser”), serves as the fund’s sub-adviser.
The Company’s Board of Directors (the “Board”) approved, effective April 17, 2023, a change in the fund’s name from “BNY Mellon Global Real Estate Securities Fund” to “BNY Mellon Developed Markets Real Estate Securities Fund”.
BNY Mellon Securities Corporation (the “Distributor”), a wholly-owned subsidiary of the Adviser, is the distributor of the fund’s shares. The fund is authorized to issue 750 million shares of $.001 par value Common Stock. The fund currently has authorized four classes of shares: Class A (100 million shares authorized), Class C (50 million shares authorized), Class I (400 million shares authorized), and Class Y (200 million shares authorized). Class A and Class C shares are sold primarily to retail investors through financial intermediaries and bear Distribution and/or Shareholder Services Plan fees. Class A shares generally are subject to a sales charge imposed at the time of purchase. Class A shares bought without an initial sales charge as part of an investment of $1 million or more may be charged a contingent deferred sales charge (“CDSC”) of 1.00% if redeemed within one year. Class C shares are subject to a CDSC imposed on Class C shares redeemed within one year of purchase. Class C shares automatically convert to Class A shares eight years after the date of purchase, without the imposition of a sales charge. Class I shares are sold primarily to bank trust departments and other financial service providers (including BNY Mellon and its affiliates), acting on behalf of customers having a qualified trust or an investment account or relationship at such institution, and bear no Distribution or Shareholder Services Plan fees. Class Y shares are sold at net asset value per share generally to institutional investors, and bear no Distribution or Shareholder Services Plan fees. Class
22
I and Class Y shares are offered without a front-end sales charge or CDSC. Other differences between the classes include the services offered to and the expenses borne by each class, the allocation of certain transfer agency costs and certain voting rights. Income, expenses (other than expenses attributable to a specific class), and realized and unrealized gains or losses on investments are allocated to each class of shares based on its relative net assets.
The Company accounts separately for the assets, liabilities and operations of each series. Expenses directly attributable to each series are charged to that series’ operations; expenses which are applicable to all series are allocated among them on a pro rata basis.
The Financial Accounting Standards Board (“FASB”) Accounting Standards Codification (“ASC”) is the exclusive reference of authoritative U.S. generally accepted accounting principles (“GAAP”) recognized by the FASB to be applied by nongovernmental entities. Rules and interpretive releases of the SEC under authority of federal laws are also sources of authoritative GAAP for SEC registrants. The fund is an investment company and applies the accounting and reporting guidance of the FASB ASC Topic 946 Financial Services-Investment Companies. The fund’s financial statements are prepared in accordance with GAAP, which may require the use of management estimates and assumptions. Actual results could differ from those estimates.
The Company enters into contracts that contain a variety of indemnifications. The fund’s maximum exposure under these arrangements is unknown. The fund does not anticipate recognizing any loss related to these arrangements.
(a) Portfolio valuation: The fair value of a financial instrument is the amount that would be received to sell an asset or paid to transfer a liability in an orderly transaction between market participants at the measurement date (i.e., the exit price). GAAP establishes a fair value hierarchy that prioritizes the inputs of valuation techniques used to measure fair value. This hierarchy gives the highest priority to unadjusted quoted prices in active markets for identical assets or liabilities (Level 1 measurements) and the lowest priority to unobservable inputs (Level 3 measurements).
Additionally, GAAP provides guidance on determining whether the volume and activity in a market has decreased significantly and whether such a decrease in activity results in transactions that are not orderly. GAAP requires enhanced disclosures around valuation inputs and techniques used during annual and interim periods.
23
NOTES TO FINANCIAL STATEMENTS (continued)
Various inputs are used in determining the value of the fund’s investments relating to fair value measurements. These inputs are summarized in the three broad levels listed below:
Level 1—unadjusted quoted prices in active markets for identical investments.
Level 2—other significant observable inputs (including quoted prices for similar investments, interest rates, prepayment speeds, credit risk, etc.).
Level 3—significant unobservable inputs (including the fund’s own assumptions in determining the fair value of investments).
The inputs or methodology used for valuing securities are not necessarily an indication of the risk associated with investing in those securities.
Changes in valuation techniques may result in transfers in or out of an assigned level within the disclosure hierarchy. Valuation techniques used to value the fund’s investments are as follows:
The Board has designated the Adviser as the fund’s valuation designee to make all fair value determinations with respect to the fund’s portfolio investments, subject to the Board’s oversight and pursuant to Rule 2a-5 under the Act.
Investments in equity securities are valued at the last sales price on the securities exchange or national securities market on which such securities are primarily traded. Securities listed on the National Market System for which market quotations are available are valued at the official closing price or, if there is no official closing price that day, at the last sales price. For open short positions, asked prices are used for valuation purposes. Bid price is used when no asked price is available. Registered investment companies that are not traded on an exchange are valued at their net asset value. All of the preceding securities are generally categorized within Level 1 of the fair value hierarchy.
Securities not listed on an exchange or the national securities market, or securities for which there were no transactions, are valued at the average of the most recent bid and asked prices. These securities are generally categorized within Level 2 of the fair value hierarchy.
Fair valuing of securities may be determined with the assistance of a pricing service using calculations based on indices of domestic securities and other appropriate indicators, such as prices of relevant American Depositary Receipts and futures. Utilizing these techniques may result in transfers between Level 1 and Level 2 of the fair value hierarchy.
24
When market quotations or official closing prices are not readily available, or are determined not to accurately reflect fair value, such as when the value of a security has been significantly affected by events after the close of the exchange or market on which the security is principally traded (for example, a foreign exchange or market), but before the fund calculates its net asset value, the fund may value these investments at fair value as determined in accordance with the procedures approved by the Board. Certain factors may be considered when fair valuing investments such as: fundamental analytical data, the nature and duration of restrictions on disposition, an evaluation of the forces that influence the market in which the securities are purchased and sold, and public trading in similar securities of the issuer or comparable issuers. These securities are either categorized within Level 2 or 3 of the fair value hierarchy depending on the relevant inputs used.
For securities where observable inputs are limited, assumptions about market activity and risk are used and such securities are generally categorized within Level 3 of the fair value hierarchy.
Investments denominated in foreign currencies are translated to U.S. dollars at the prevailing rates of exchange.
The following is a summary of the inputs used as of October 31, 2023 in valuing the fund’s investments:
Level 1-Unadjusted Quoted Prices | Level 2- Other Significant Observable Inputs | Level 3-Significant Unobservable Inputs | Total | |||
Assets ($) | ||||||
Investments in Securities:† | ||||||
Equity Securities - Common Stocks | 174,124,045 | 83,405,097 | †† | - | 257,529,142 | |
Investment Companies | 2,710,379 | - | - | 2,710,379 | ||
† See Statement of Investments for additional detailed categorizations, if any.
†† Securities classified within Level 2 at period end as the values were determined pursuant to the fund’s fair valuation procedures.
(b) Foreign currency transactions: The fund does not isolate that portion of the results of operations resulting from changes in foreign exchange rates on investments from the fluctuations arising from changes in the market prices of securities held. Such fluctuations are included with the net realized and unrealized gain or loss on investments.
Net realized foreign exchange gains or losses arise from sales of foreign currencies, currency gains or losses realized on securities transactions between trade and settlement date, and the difference between the
25
NOTES TO FINANCIAL STATEMENTS (continued)
amounts of dividends, interest and foreign withholding taxes recorded on the fund’s books and the U.S. dollar equivalent of the amounts actually received or paid. Net unrealized foreign exchange gains and losses arise from changes in the value of assets and liabilities other than investments resulting from changes in exchange rates. Foreign currency gains and losses on foreign currency transactions are also included with net realized and unrealized gain or loss on investments.
Foreign taxes: The fund may be subject to foreign taxes (a portion of which may be reclaimable) on income, stock dividends, realized and unrealized capital gains on investments or certain foreign currency transactions. Foreign taxes are recorded in accordance with the applicable foreign tax regulations and rates that exist in the foreign jurisdictions in which the fund invests. These foreign taxes, if any, are paid by the fund and are reflected in the Statement of Operations, if applicable. Foreign taxes payable or deferred or those subject to reclaims as of October 31, 2023, if any, are disclosed in the fund’s Statement of Assets and Liabilities.
(c) Securities transactions and investment income: Securities transactions are recorded on a trade date basis. Realized gains and losses from securities transactions are recorded on the identified cost basis. Dividend income is recognized on the ex-dividend date and interest income, including, where applicable, accretion of discount and amortization of premium on investments, is recognized on the accrual basis.
Pursuant to a securities lending agreement with BNY Mellon, the fund may lend securities to qualified institutions. It is the fund’s policy that, at origination, all loans are secured by collateral of at least 102% of the value of U.S. securities loaned and 105% of the value of foreign securities loaned. Collateral equivalent to at least 100% of the market value of securities on loan is maintained at all times. Collateral is either in the form of cash, which can be invested in certain money market mutual funds managed by the Adviser, or U.S. Government and Agency securities. Any non-cash collateral received cannot be sold or re-pledged by the fund, except in the event of borrower default. The securities on loan, if any, are also disclosed in the fund’s Statement of Investments. The fund is entitled to receive all dividends, interest and distributions on securities loaned, in addition to income earned as a result of the lending transaction. Should a borrower fail to return the securities in a timely manner, BNY Mellon is required to replace the securities for the benefit of the fund or credit the fund with the market value of the unreturned securities and is subrogated to the fund’s rights against the borrower and the collateral. Additionally, the contractual maturity of security lending transactions are on an
26
overnight and continuous basis. During the period ended October 31, 2023, BNY Mellon earned $1,886 from the lending of the fund’s portfolio securities, pursuant to the securities lending agreement.
For financial reporting purposes, the fund elects not to offset assets and liabilities subject to a securities lending agreement, if any, in the Statement of Assets and Liabilities. Therefore, all qualifying transactions are presented on a gross basis in the Statement of Assets and Liabilities. As of October 31, 2023, the fund had securities on loan and the value of the related collateral received by the fund exceeded the value of the securities loaned by the fund. The value of the securities loaned by the fund, if any, are also disclosed in the Statement of Assets and Liabilities and in the Statement of Investments. The total amount of cash and non-cash securities lending collateral received is disclosed in the footnotes to the Statement of Investments.
(d) Affiliated issuers: Investments in other investment companies advised by the Adviser are considered “affiliated” under the Act.
(e) Market Risk: The value of the securities in which the fund invests may be affected by political, regulatory, economic and social developments, and developments that impact specific economic sectors, industries or segments of the market. In addition, turbulence in financial markets and reduced liquidity in equity, credit and/or fixed-income markets may negatively affect many issuers, which could adversely affect the fund. Global economies and financial markets are becoming increasingly interconnected, and conditions and events in one country, region or financial market may adversely impact issuers in a different country, region or financial market. These risks may be magnified if certain events or developments adversely interrupt the global supply chain; in these and other circumstances, such risks might affect companies world-wide.
Foreign Investment Risk: To the extent the fund invests in foreign securities, the fund’s performance will be influenced by political, social and economic factors affecting investments in foreign issuers. Special risks associated with investments in foreign issuers include exposure to currency fluctuations, less liquidity, less developed or less efficient trading markets, lack of comprehensive company information, political and economic instability and differing auditing and legal standards.
Real Estate Sector Risk: The securities of issuers that are principally engaged in the real estate sector may be subject to risks similar to those associated with the direct ownership of real estate. These include: declines in real estate values; defaults by mortgagors or other borrowers and tenants; increases in property taxes and operating expenses; overbuilding;
27
NOTES TO FINANCIAL STATEMENTS (continued)
fluctuations in rental income; changes in interest rates; possible lack of availability of mortgage funds or financing; extended vacancies of properties; changes in tax and regulatory requirements (including zoning laws and environmental restrictions); losses due to costs resulting from the clean-up of environmental problems; liability to third parties for damages resulting from environmental problems; and casualty or condemnation losses. In addition, the performance of the economy in each of the regions and countries in which the real estate owned by a portfolio company is located affects occupancy, market rental rates and expenses and, consequently, has an impact on the income from such properties and their underlying values.
(f) Dividends and distributions to shareholders: Dividends and distributions are recorded on the ex-dividend date. Dividends from net investment income and dividends from net realized capital gains, if any, are normally declared and paid annually, but the fund may make distributions on a more frequent basis to comply with the distribution requirements of the Internal Revenue Code of 1986, as amended (the “Code”). To the extent that net realized capital gains can be offset by capital loss carryovers, it is the policy of the fund not to distribute such gains. Income and capital gain distributions are determined in accordance with income tax regulations, which may differ from GAAP.
(g) Federal income taxes: It is the policy of the fund to continue to qualify as a regulated investment company, if such qualification is in the best interests of its shareholders, by complying with the applicable provisions of the Code, and to make distributions of taxable income and net realized capital gain sufficient to relieve it from substantially all federal income and excise taxes.
As of and during the period ended October 31, 2023, the fund did not have any liabilities for any uncertain tax positions. The fund recognizes interest and penalties, if any, related to uncertain tax positions as income tax expense in the Statement of Operations. During the period ended October 31, 2023, the fund did not incur any interest or penalties.
Each tax year in the four-year period ended October 31, 2023 remains subject to examination by the Internal Revenue Service and state taxing authorities.
At October 31, 2023, the components of accumulated earnings on a tax basis were as follows: undistributed ordinary income $5,895,460, accumulated capital losses $22,271,865 and unrealized depreciation $45,561,814.
28
The fund is permitted to carry forward capital losses for an unlimited period. Furthermore, capital loss carryovers retain their character as either short-term or long-term capital losses.
The accumulated capital loss carryover is available for federal income tax purposes to be applied against future net realized capital gains, if any, realized subsequent to October 31, 2023. The fund has $14,380,609 of short-term capital losses and $7,891,256 of long-term capital losses which can be carried forward for an unlimited period.
The tax character of distributions paid to shareholders during the fiscal years ended October 31, 2023 and October 31, 2022 were as follows: ordinary income $5,904,450 and $18,621,281, and long term capital gains $17,318,151 and $22,732,088, respectively.
NOTE 2—Bank Lines of Credit:
The fund participates with other long-term open-end funds managed by the Adviser in a $738 million unsecured credit facility led by Citibank, N.A. (the “Citibank Credit Facility”) and a $300 million unsecured credit facility provided by BNY Mellon (the “BNYM Credit Facility”), each to be utilized primarily for temporary or emergency purposes, including the financing of redemptions (each, a “Facility”). The Citibank Credit Facility is available in two tranches: (i) Tranche A is in an amount equal to $618 million and is available to all long-term open-ended funds, including the fund, and (ii) Tranche B is an amount equal to $120 million and is available only to BNY Mellon Floating Rate Income Fund, a series of BNY Mellon Investment Funds IV, Inc. Prior to September 27, 2023, the Citibank Credit Facility was $823.5 million with Tranche A available in an amount equal to $688.5 million and Tranche B available in an amount equal to $135 million. In connection therewith, the fund has agreed to pay its pro rata portion of commitment fees for Tranche A of the Citibank Credit Facility and the BNYM Credit Facility. Interest is charged to the fund based on rates determined pursuant to the terms of the respective Facility at the time of borrowing.
During the period ended October 31, 2023, the fund was charged $18,223 for interest expense. These fees are included in Interest expense in the Statement of Operations. The average amount of borrowings outstanding under the Facilities during the period ended October 31, 2023 was approximately $330,959 with a related weighted average annualized interest rate of 5.51%.
29
NOTES TO FINANCIAL STATEMENTS (continued)
NOTE 3—Management Fee, Sub-Advisory Fee and Other Transactions with Affiliates:
(a) Pursuant to a management agreement with the Adviser, the management fee is computed at an annual rate of .95% of the value of the fund’s average daily net assets and is payable monthly. The Adviser has contractually agreed, from November 1, 2022 through March 1, 2024, to waive receipt of its fees and/or assume the direct expenses of the fund so that the direct expenses of none of the fund’s share classes (excluding Rule 12b-1 Distribution Plan fees, Shareholder Services Plan fees, taxes, interest expense, brokerage commissions, commitment fees on borrowings and extraordinary expenses) exceed 1.05% of the value of the fund’s average daily net assets. On or after March 1, 2024, the Adviser may terminate this expense limitation at any time. The reduction in expenses, pursuant to the undertaking, amounted to $126,140 during the period ended October 31, 2023.
Pursuant to a sub-investment advisory agreement between the Adviser and the Sub-Adviser, the Adviser pays the Sub-Adviser a monthly fee at an annual rate of .46% of the value of the fund’s average daily net assets.
During the period ended October 31, 2023, the Distributor retained $15 from commissions earned on sales of the fund’s Class A shares and $6 from CDSC fees on redemptions of the fund’s Class C shares.
(b) Under the Distribution Plan adopted pursuant to Rule 12b-1 under the Act, Class C shares pay the Distributor for distributing its shares at an annual rate of .75% of the value of its average daily net assets. The Distributor may pay one or more Service Agents in respect of advertising, marketing and other distribution services, and determines the amounts, if any, to be paid to Service Agents and the basis on which such payments are made. During the period ended October 31, 2023, Class C shares were charged $3,004 pursuant to the Distribution Plan.
(c) Under the Shareholder Services Plan, Class A and Class C shares pay the Distributor at an annual rate of .25% of the value of their average daily net assets for the provision of certain services. The services provided may include personal services relating to shareholder accounts, such as answering shareholder inquiries regarding the fund, and services related to the maintenance of shareholder accounts. The Distributor may make payments to Service Agents (securities dealers, financial institutions or other industry professionals) with respect to these services. The Distributor determines the amounts to be paid to Service Agents. During the period ended October 31, 2023, Class A and Class C shares were
30
charged $36,964 and $1,001, respectively, pursuant to the Shareholder Services Plan.
The fund has an arrangement with BNY Mellon Transfer, Inc., (the “Transfer Agent”), a subsidiary of BNY Mellon and an affiliate of the Adviser, whereby the fund may receive earnings credits when positive cash balances are maintained, which are used to offset Transfer Agent fees. For financial reporting purposes, the fund includes transfer agent net earnings credits, if any, as an expense offset in the Statement of Operations.
The fund has an arrangement with The Bank of New York Mellon (the “Custodian”), a subsidiary of BNY Mellon and an affiliate of the Adviser, whereby the fund will receive interest income or be charged overdraft fees when cash balances are maintained. For financial reporting purposes, the fund includes this interest income and overdraft fees, if any, as interest income in the Statement of Operations.
The fund compensates the Transfer Agent, under a transfer agency agreement, for providing transfer agency and cash management services for the fund. The majority of Transfer Agent fees are comprised of amounts paid on a per account basis, while cash management fees are related to fund subscriptions and redemptions. During the period ended October 31, 2023, the fund was charged $7,765 for transfer agency services. These fees are included in Shareholder servicing costs in the Statement of Operations. These fees were partially offset by earnings credits of $3,985.
The fund compensates the Custodian, under a custody agreement, for providing custodial services for the fund. These fees are determined based on net assets, geographic region and transaction activity. During the period ended October 31, 2023, the fund was charged $75,119 pursuant to the custody agreement.
During the period ended October 31, 2023, the fund was charged $22,009 for services performed by the fund’s Chief Compliance Officer and his staff. These fees are included in Chief Compliance Officer fees in the Statement of Operations.
The components of “Due to BNY Mellon Investment Adviser, Inc. and affiliates” in the Statement of Assets and Liabilities consist of: management fee of $215,283, Distribution Plan fees of $172, Shareholder Services Plan fees of $1,975, Custodian fees of $42,150, Chief Compliance Officer fees of $7,005 and Transfer Agent fees of $1,235, which are offset against an expense reimbursement currently in effect in the amount of $9,681.
31
NOTES TO FINANCIAL STATEMENTS (continued)
(d) Each board member also serves as a board member of other funds in the BNY Mellon Family of Funds complex. Annual retainer fees and attendance fees are allocated to each fund based on net assets.
NOTE 4—Securities Transactions:
The aggregate amount of purchases and sales of investment securities, excluding short-term securities and forward foreign currency exchange contracts (“forward contracts”), during the period ended October 31, 2023, amounted to $170,393,764 and $258,461,430, respectively.
Derivatives: A derivative is a financial instrument whose performance is derived from the performance of another asset. The fund enters into International Swaps and Derivatives Association, Inc. Master Agreements or similar agreements (collectively, “Master Agreements”) with its over-the-counter (“OTC”) derivative contract counterparties in order to, among other things, reduce its credit risk to counterparties. Master Agreements include provisions for general obligations, representations, collateral and events of default or termination. Under a Master Agreement, the fund may offset with the counterparty certain derivative financial instruments’ payables and/or receivables with collateral held and/or posted and create one single net payment in the event of default or termination. Rule 18f-4 under the Act regulates the use of derivatives transactions for certain funds registered under the Act. The fund is deemed a “limited” derivatives user under the rule and is required to limit its derivatives exposure so that the total notional value of applicable derivatives does not exceed 10% of fund’s net assets, and is subject to certain reporting requirements.
Each type of derivative instrument that was held by the fund during the period ended October 31, 2023 is discussed below.
Forward Foreign Currency Exchange Contracts: The fund enters into forward contracts in order to hedge its exposure to changes in foreign currency exchange rates on its foreign portfolio holdings, to settle foreign currency transactions or as a part of its investment strategy. When executing forward contracts, the fund is obligated to buy or sell a foreign currency at a specified rate on a certain date in the future. With respect to sales of forward contracts, the fund incurs a loss if the value of the contract increases between the date the forward contract is opened and the date the forward contract is closed. The fund realizes a gain if the value of the contract decreases between those dates. With respect to purchases of forward contracts, the fund incurs a loss if the value of the contract decreases between the date the forward contract is opened and the date the forward contract is closed. The fund realizes a gain if the value of the
32
contract increases between those dates. Any realized or unrealized gains or losses which occurred during the period are reflected in the Statement of Operations. The fund is exposed to foreign currency risk as a result of changes in value of underlying financial instruments. The fund is also exposed to credit risk associated with counterparty non-performance on these forward contracts, which is generally limited to the unrealized gain on each open contract. This risk may be mitigated by Master Agreements, if any, between the fund and the counterparty and the posting of collateral, if any, by the counterparty to the fund to cover the fund’s exposure to the counterparty. As of October 31, 2023, there were no outstanding forward contracts.
The following table summarizes the average market value of derivatives outstanding during the period ended October 31, 2023:
|
| Average Market Value ($) |
Forward contracts |
| 67,105 |
At October 31, 2023, the cost of investments for federal income tax purposes was $305,763,219, accordingly, accumulated net unrealized depreciation on investments was $45,523,698, consisting of $17,829,866 gross unrealized appreciation and $63,353,564 gross unrealized depreciation.
33
REPORT OF INDEPENDENT REGISTERED PUBLIC ACCOUNTING FIRM
To the Shareholders and the Board of Directors of BNY Mellon Developed Markets Real Estate Securities Fund (formerly, BNY Mellon Global Real Estate Securities Fund)
Opinion on the Financial Statements
We have audited the accompanying statement of assets and liabilities of BNY Mellon Developed Markets Real Estate Securities Fund (the “Fund”) (formerly, BNY Mellon Global Real Estate Securities Fund) (one of the funds constituting BNY Mellon Investment Funds V, Inc. (the “Company”)), including the statement of investments, as of October 31, 2023, and the related statement of operations for the year then ended, the statements of changes in net assets for each of the two years in the period then ended, the financial highlights for each of the five years in the period then ended and the related notes (collectively referred to as the “financial statements”). In our opinion, the financial statements present fairly, in all material respects, the financial position of the Fund (one of the funds constituting BNY Mellon Investment Funds V, Inc.) at October 31, 2023, the results of its operations for the year then ended, the changes in its net assets for each of the two years in the period then ended and its financial highlights for each of the five years in the period then ended, in conformity with U.S. generally accepted accounting principles.
Basis for Opinion
These financial statements are the responsibility of the Company’s management. Our responsibility is to express an opinion on the Fund’s financial statements based on our audits. We are a public accounting firm registered with the Public Company Accounting Oversight Board (United States) (“PCAOB”) and are required to be independent with respect to the Company in accordance with the U.S. federal securities laws and the applicable rules and regulations of the Securities and Exchange Commission and the PCAOB.
We conducted our audits in accordance with the standards of the PCAOB. Those standards require that we plan and perform the audit to obtain reasonable assurance about whether the financial statements are free of material misstatement, whether due to error or fraud. The Company is not required to have, nor were we engaged to perform, an audit of the Company’s internal control over financial reporting. As part of our audits, we are required to obtain an understanding of internal control over financial reporting but not for the purpose of expressing an opinion on the effectiveness of the Company’s internal control over financial reporting. Accordingly, we express no such opinion.
Our audits included performing procedures to assess the risks of material misstatement of the financial statements, whether due to error or fraud, and performing procedures that respond to those risks. Such procedures included examining, on a test basis, evidence regarding the amounts and disclosures in the financial statements. Our procedures included confirmation of securities owned as of October 31, 2023, by correspondence with the custodian, brokers and others; when replies were not received from brokers and others, we performed other auditing procedures. Our audits also included evaluating the accounting principles used and significant estimates made by management, as well as evaluating the overall presentation of the financial statements. We believe that our audits provide a reasonable basis for our opinion.

We have served as the auditor of one or more investment companies in the BNY Mellon Family of Funds since at least 1957, but we are unable to determine the specific year.
New York, New York
December 22, 2023
34
IMPORTANT TAX INFORMATION (Unaudited)
For federal tax purposes, certain dividends paid by the fund may be subject to a maximum tax rate of 15%, as provided for by the Jobs and Growth Tax Relief Reconciliation Act of 2003. Of the distributions paid during the fiscal year, $4,846,386 represents the maximum amount that may be considered qualified dividend income. Shareholders will receive notification in early 2024 of the percentage applicable to the preparation of their 2023 income tax returns. The fund also hereby reports $.4153 per share as a long-term capital gain distribution paid on December 27, 2022.
35
PROXY RESULTS (Unaudited)
A special meeting of the Company’s shareholders was held on October 12, 2023. The proposal considered at the meeting and the results were as follows:
Shares | ||||
For | Authority Withheld | |||
To elect Board Members to hold office until their successors are duly elected and qualified† | ||||
Francine J. Bovich | 77,782,677 | 85,728 | ||
Michael D. DiLecce | 77,688,219 | 180,185 | ||
Gina D. France | 77,755,823 | 112,582 | ||
Joan L. Gulley | 77,756,290 | 112,115 | ||
Nathan Leventhal | 77,669,548 | 198,856 | ||
† Each Board Member’s term to commence January 1, 2024
In addition, Joseph S. DiMartino, Peggy C. Davis and Robin A. Melvin continue as Board Members of the Company. Mses. France and Gulley currently are Board Members of the Company, but have not been previously elected by shareholders.
36
LIQUIDITY RISK MANAGEMENT PROGRAM (Unaudited)
The fund adopted a liquidity risk management program (the “Liquidity Risk Management Program”) pursuant to the requirements of Rule 22e-4 under the Investment Company Act of 1940, as amended. Rule 22e-4 requires registered open-end funds, including mutual funds and exchange-traded funds but not money market funds, to establish liquidity risk management programs in order to effectively manage fund liquidity and shareholder redemptions. The rule is designed to mitigate the risk that a fund could not meet redemption requests without significantly diluting the interests of remaining investors.
The rule requires the fund to assess, manage and review their liquidity risk at least annually considering applicable factors such as investment strategy and liquidity during normal and foreseeable stressed conditions, including whether the strategy is appropriate for an open-end fund and whether the fund has a relatively concentrated portfolio or large positions in particular issuers. The fund must also assess its use of borrowings and derivatives, short-term and long-term cash flow projections in normal and stressed conditions, holdings of cash and cash equivalents, and borrowing arrangements and other funding sources.
The rule also requires the fund to classify its investments as highly liquid, moderately liquid, less liquid or illiquid based on the number of days the fund expects it would take to liquidate the investment, and to review these classifications at least monthly or more often under certain conditions. The periods range from three or fewer business days for a highly liquid investment to greater than seven calendar days for settlement of a less liquid investment. Illiquid investments are those a fund does not expect to be able to sell or dispose of within seven calendar days without significantly changing the market value. The fund is prohibited from acquiring an investment if, after the acquisition, its holdings of illiquid assets will exceed 15% of its net assets. In addition, if a fund permits redemptions in-kind, the rule requires the fund to establish redemption in-kind policies and procedures governing how and when it will engage in such redemptions.
Pursuant to the rule’s requirements, the Liquidity Risk Management Program has been reviewed and approved by the Board. Furthermore, the Board has received a written report prepared by the Program’s Administrator that addresses the operation of the Program, assesses its adequacy and effectiveness and describes any material changes made to the Program.
Assessment of Program
In the opinion of the Program Administrator, the Program approved by the Board continues to be adequate for the fund and the Program has been implemented effectively. The Program Administrator has monitored the fund’s liquidity risk and the liquidity classification of the securities held by the fund and has determined that the Program is operating effectively.
During the period from January 1, 2022 to December 31, 2022, there were no material changes to the Program and no material liquidity events that impacted the fund. During the period, the fund held sufficient highly liquid assets to meet fund redemptions.
Under normal expected foreseeable fund redemption forecasts and foreseeable stressed fund redemption forecasts, the Program Administrator believes that the fund maintains sufficient highly liquid assets to meet expected fund redemptions.
37
BOARD MEMBERS INFORMATION (Unaudited)
Independent Board Members
Chairman of the Board (1995)
Principal Occupation During Past 5 Years:
· Director or Trustee of funds in the BNY Mellon Family of Funds and certain other entities (as described in the fund’s Statement of Additional Information) (1995-Present)
Other Public Company Board Memberships During Past 5 Years:
· CBIZ, Inc., a public company providing professional business services, products and solutions, Director (1997-May 2023)
No. of Portfolios for which Board Member Serves: 86
———————
Peggy C. Davis (80)
Board Member (2012)
Principal Occupation During Past 5 Years:
· Shad Professor of Law, New York University School of Law (1983-Present)
No. of Portfolios for which Board Member Serves: 29
———————
Gina D. France (65)
Board Member (2019)
Principal Occupation During Past 5 Years:
· France Strategic Partners, a strategy and advisory firm serving corporate clients across the United States, Founder, President and Chief Executive Officer (2003-Present)
Other Public Company Board Memberships During Past 5 Years:
· Huntington Bancshares, a bank holding company headquartered in Columbus, Ohio, Director (2016-Present)
· Cedar Fair, L.P., a publicly-traded partnership that owns and operates amusement parks and hotels in the U.S. and Canada, Director (2011-May 2023)
· CBIZ, Inc., a public company providing professional business services, products and solutions, Director (2015-Present)
No. of Portfolios for which Board Member Serves: 22
———————
Joan Gulley (76)
Board Member (2017)
Principal Occupation During Past 5 Years:
· Nantucket Atheneum, public library, Chair (June 2018-June 2021) and Director (2015-June 2021)
· Orchard Island Club, golf and beach club, Governor (2016-Present) and President (February 2023-Present)
No. of Portfolios for which Board Member Serves: 39
———————
38
Robin A. Melvin (60)
Board Member (2011)
Principal Occupation During Past 5 Years:
· Westover School, a private girls’ boarding school in Middlebury, Connecticut, Trustee (2019-June 2023)
· Mentor Illinois, a non-profit organization dedicated to increasing the quantity and quality of mentoring services in Illinois, Co-Chair (2014–2020); Board Member (2013-2020)
· JDRF, a non-profit juvenile diabetes research foundation, Board Member (June 2021-June 2022)
Other Public Company Board Memberships During Past 5 Years:
· HPS Corporate Lending Fund, a closed-end management investment company regulated as a business development company, Trustee (August 2021-Present)
No. of Portfolios for which Board Member Serves: 68
———————
Michael D. DiLecce (61)
Advisory Board Member (2022)
Principal Occupation During Past 5 Years:
· Retired since July 2022. Global Asset Management Assurance Leader, Ernst & Young LLP (2015-2022)
· Americas Regional Talent Managing Partner for Ernst & Young’s Financial Service Practice (2017-2021)
· Partner, Ernst & Young LLP (1997-2022)
No. of Portfolios for which Board Member Serves: 22
———————
The address of the Board Members and Officers is c/o BNY Mellon Investment Adviser, Inc., 240 Greenwich Street, New York, New York 10286. Additional information about each Board Member is available in the fund’s Statement of Additional Information which can be obtained from the Adviser free of charge by calling this toll free number: 1-800-373-9387.
39
OFFICERS OF THE FUND (Unaudited)
DAVID DIPETRILLO, President since January 2021.
Vice President and Director of the Adviser since February 2021; Head of North America Distribution, BNY Mellon Investment Management since February 2023; and Head of North America Product, BNY Mellon Investment Management from January 2018 to February 2023. He is an officer of 53 investment companies (comprised of 102 portfolios) managed by the Adviser or an affiliate of the Adviser. He is 45 years old and has been an employee of BNY Mellon since 2005.
JAMES WINDELS, Treasurer since November 2001.
Director of the Adviser since February 2023; Vice President of the Adviser since September 2020; and Director–BNY Mellon Fund Administration. He is an officer of 54 investment companies (comprised of 121 portfolios) managed by the Adviser or an affiliate of the Adviser. He is 65 years old and has been an employee of the Adviser since April 1985.
PETER M. SULLIVAN, Chief Legal Officer since July 2021 and Vice President and Assistant Secretary since March 2019.
Chief Legal Officer of the Adviser and Associate General Counsel of BNY Mellon since July 2021; Senior Managing Counsel of BNY Mellon from December 2020 to July 2021; and Managing Counsel of BNY Mellon from March 2009 to December 2020. He is an officer of 54 investment companies (comprised of 121 portfolios) managed by the Adviser or an affiliate of the Adviser. He is 55 years old and has been an employee of BNY Mellon since April 2004.
JAMES BITETTO, Vice President since August 2005 and Secretary since February 2018.
Senior Managing Counsel of BNY Mellon since December 2019; Managing Counsel of BNY Mellon from April 2014 to December 2019; and Secretary of the Adviser. He is an officer of 54 investment companies (comprised of 121 portfolios) managed by the Adviser or an affiliate of the Adviser. He is 57 years old and has been an employee of the Adviser since December 1996.
DEIRDRE CUNNANE, Vice President and Assistant Secretary since March 2019.
Managing Counsel of BNY Mellon since December 2021; and Counsel of BNY Mellon from August 2018 to December 2021. She is an officer of 54 investment companies (comprised of 121 portfolios) managed by the Adviser or an affiliate of the Adviser. She is 33 years old and has been an employee of BNY Mellon since August 2013.
SARAH S. KELLEHER, Vice President and Assistant Secretary since April 2014.
Vice President of BNY Mellon ETF Investment Adviser; LLC since February 2020; Senior Managing Counsel of BNY Mellon since September 2021; and Managing Counsel of BNY Mellon from December 2017 to September 2021. She is an officer of 54 investment companies (comprised of 121 portfolios) managed by the Adviser or an affiliate of the Adviser. She is 48 years old and has been an employee of BNY Mellon since March 2013.
JEFF PRUSNOFSKY, Vice President and Assistant Secretary since August 2005.
Senior Managing Counsel of BNY Mellon. He is an officer of 54 investment companies (comprised of 121 portfolios) managed by the Adviser or an affiliate of the Adviser. He is 58 years old and has been an employee of the Adviser since October 1990.
AMANDA QUINN, Vice President and Assistant Secretary since March 2020.
Counsel of BNY Mellon since June 2019; Regulatory Administration Manager at BNY Mellon Investment Management Services from September 2018 to May 2019. She is an officer of 54 investment companies (comprised of 121 portfolios) managed by the Adviser or an affiliate of the Adviser. She is 38 years old and has been an employee of BNY Mellon since June 2012.
JOANNE SKERRETT, Vice President and Assistant Secretary since March 2023.
Managing Counsel of BNY Mellon since June 2022; and Senior Counsel with the Mutual Fund Directors Forum, a leading funds industry organization, from 2016 to June 2022. She is an officer of 54 investment companies (comprised of 121 portfolios) managed by the Adviser or an affiliate of the Adviser. She is 51 years old and has been an employee of the Adviser since June 2022.
40
NATALYA ZELENSKY, Vice President and Assistant Secretary since March 2017.
Chief Compliance Officer since August 2021 and Vice President since February 2020 of BNY Mellon ETF Investment Adviser, LLC; Chief Compliance Officer since August 2021 and Vice President and Assistant Secretary since February 2020 of BNY Mellon ETF Trust; Managing Counsel of BNY Mellon from December 2019 to August 2021; Counsel of BNY Mellon from May 2016 to December 2019; and Assistant Secretary of the Adviser from April 2018 to August 2021. She is an officer of 54 investment companies (comprised of 121 portfolios) managed by the Adviser or an affiliate of the Adviser. She is 38 years old and has been an employee of BNY Mellon since May 2016.
DANIEL GOLDSTEIN, Vice President since March 2022.
Head of Product Development of North America Distribution, BNY Mellon Investment Management since January 2018; Executive Vice President of North America Product, BNY Mellon Investment Management since April 2023; and Senior Vice President, Development & Oversight of North America Product, BNY Mellon Investment Management from 2010 to March 2023. He is an officer of 53 investment companies (comprised of 102 portfolios) managed by the Adviser or an affiliate of the Adviser. He is 54 years old and has been an employee of the Distributor since 1991.
JOSEPH MARTELLA, Vice President since March 2022.
Vice President of the Adviser since December 2022; Head of Product Management of North America Distribution, BNY Mellon Investment Management since January 2018; Executive Vice President of North America Product, BNY Mellon Investment Management since April 2023; and Senior Vice President of North America Product, BNY Mellon Investment Management from 2010 to March 2023. He is an officer of 53 investment companies (comprised of 102 portfolios) managed by the Adviser or an affiliate of the Adviser. He is 47 years old and has been an employee of the Distributor since 1999.
GAVIN C. REILLY, Assistant Treasurer since December 2005.
Tax Manager–BNY Mellon Fund Administration. He is an officer of 54 investment companies (comprised of 121 portfolios) managed by the Adviser or an affiliate of the Adviser. He is 55 years old and has been an employee of the Adviser since April 1991.
ROBERT SALVIOLO, Assistant Treasurer since July 2007.
Senior Accounting Manager–BNY Mellon Fund Administration. He is an officer of 54 investment companies (comprised of 121 portfolios) managed by the Adviser or an affiliate of the Adviser. He is 56 years old and has been an employee of the Adviser since June 1989.
ROBERT SVAGNA, Assistant Treasurer since December 2002.
Senior Accounting Manager–BNY Mellon Fund Administration. He is an officer of 54 investment companies (comprised of 121 portfolios) managed by the Adviser or an affiliate of the Adviser. He is 56 years old and has been an employee of the Adviser since November 1990.
JOSEPH W. CONNOLLY, Chief Compliance Officer since October 2004.
Chief Compliance Officer of the BNY Mellon Family of Funds and BNY Mellon Funds Trust since 2004; and Chief Compliance Officer of the Adviser from 2004 until June 2021. He is the Chief Compliance Officer of 53 investment companies (comprised of 105 portfolios) managed by the Adviser. He is 66 years old.
CARIDAD M. CAROSELLA, Anti-Money Laundering Compliance Officer since January 2016.
Anti-Money Laundering Compliance Officer of the BNY Mellon Family of Funds and BNY Mellon Funds Trust. She is an officer of 47 investment companies (comprised of 114 portfolios) managed by the Adviser or an affiliate of the Adviser. She is 55 years old and has been an employee of the Distributor since 1997.
41
BNY Mellon Developed Markets Real Estate Securities Fund
240 Greenwich Street
New York, NY 10286
Adviser
BNY Mellon Investment Adviser, Inc.
240 Greenwich Street
New York, NY 10286
Sub-Adviser
CenterSquare Investment Management LLC
630 West Germantown Pike, Suite 300
Plymouth Meeting, PA 19462
Custodian
The Bank of New York Mellon
240 Greenwich Street
New York, NY 10286
Transfer Agent &
Dividend Disbursing Agent
BNY Mellon Transfer, Inc.
240 Greenwich Street
New York, NY 10286
Distributor
BNY Mellon Securities Corporation
240 Greenwich Street
New York, NY 10286
Ticker Symbol: | Class A: DRLAX Class C: DGBCX Class I: DRLIX Class Y: DRLYX |
Telephone Call your financial representative or 1-800-373-9387
Mail The BNY Mellon Family of Funds, 144 Glenn Curtiss Boulevard, Uniondale, NY 11556-0144
E-mail Send your request to info@bnymellon.com
Internet Information can be viewed online or downloaded at www.im.bnymellon.com
The fund files its complete schedule of portfolio holdings with the Securities and Exchange Commission (“SEC”) for the first and third quarters of each fiscal year on Form N-PORT. The fund’s Forms N-PORT are available on the SEC’s website at www.sec.gov.
A description of the policies and procedures that the fund uses to determine how to vote proxies relating to portfolio securities and information regarding how the fund voted these proxies for the most recent 12-month period ended June 30 is available at www.im.bnymellon.com and on the SEC’s website at www.sec.gov and without charge, upon request, by calling 1-800-373-9387.
© 2023 BNY Mellon Securities Corporation |
|

BNY Mellon Diversified International Fund
ANNUAL REPORT October 31, 2023 |
|

Save time. Save paper. View your next shareholder report online as soon as it’s available. Log into www.im.bnymellon.com and sign up for eCommunications. It’s simple and only takes a few minutes. |
The views expressed in this report reflect those of the portfolio manager(s) only through the end of the period covered and do not necessarily represent the views of BNY Mellon Investment Adviser, Inc. or any other person in the BNY Mellon Investment Adviser, Inc. organization. Any such views are subject to change at any time based upon market or other conditions and BNY Mellon Investment Adviser, Inc. disclaims any responsibility to update such views. These views may not be relied on as investment advice and, because investment decisions for a fund in the BNY Mellon Family of Funds are based on numerous factors, may not be relied on as an indication of trading intent on behalf of any fund in the BNY Mellon Family of Funds. |
Not FDIC-Insured • Not Bank-Guaranteed • May Lose Value |
Contents
THE FUND
FOR MORE INFORMATION
Back Cover
DISCUSSION OF FUND PERFORMANCE (Unaudited)
For the period from November 1, 2022, through October 31, 2023, as provided by Lisa Sampson, CFA, Portfolio Manager.
Market and Fund Performance Overview
For the 12-month period ended October 31, 2023, BNY Mellon Diversified International Fund (the “fund”) produced a total return of 13.64% for Class A shares, 12.74% for Class C shares, 13.89% for Class I shares and 14.01% for Class Y shares. 1 In comparison, the fund’s benchmark, the MSCI EAFE® Index (the “Index”), produced a total return of 14.40% for the same period.2
Global stocks posted gains over the reporting period as inflation eased, and investors began to anticipate the end of central bank monetary tightening policies. The fund lagged the Index due to weak performance by one of the three underlying portfolios.
The Fund’s Investment Approach
The fund seeks long-term capital appreciation. To pursue its goal, the fund normally allocates its assets among other mutual funds advised by BNY Mellon Investment Adviser, Inc. or its affiliates, referred to as underlying funds, which invest primarily in stocks issued by foreign companies. The fund is designed to provide diversification within the international asset class by investing the majority of its assets in the underlying funds. BNY Mellon Investment Adviser, Inc. selects the underlying funds based on their investment objectives and management policies, portfolio holdings, risk/reward profiles, historical performance and other factors, including the correlation and covariance among the underlying funds. As of October 31, 2023, the fund’s market value was allocated as follows:
BNY Mellon International Equity Fund, Class Y 25.01%
BNY Mellon International Core Equity Fund, Class Y 37.37%
BNY Mellon International Stock Fund, Class Y 37.62%
Easing Inflation, Smaller Rate Hikes Support Markets
Investor sentiment was boosted during much of the reporting period by easing inflation, a slower pace of interest-rate increases, China’s loosening of its Zero-COVID-19 policy and the U.S. government’s quick response to the regional banking crisis.
The market was also supported by the launch of ChatGPT by Open AI, which drew investors’ attention to the promise of artificial intelligence and its likely enhancement of productivity and economic growth. While the most immediate beneficiaries of this news were large-cap growth stocks in the information technology sector, their performance provided support to the market as a whole.
The U.S. Federal Reserve’s (the “Fed”) monetary tightening policies aimed at curbing inflation continued to be the dominant theme. The Fed continued to raise the federal funds rate, but it reduced the size of its rate increases and paused the increases twice during the period.
Across Europe, data indicated that inflation continued to ease. The European Central Bank (“ECB”) echoed the Fed and reiterated its focus on taming inflation. Energy prices and the ongoing Russia-Ukraine war remained a concern for the continent. Investors weighed hawkish
2
comments by the Fed and ECB against data showing inflation had peaked, and economic activity was beginning to slow, which supported a narrative of a central bank pivot on rate cuts.
In China, frustration over draconian policies boiled over and forced policymakers to loosen and ultimately end the country’s restrictive Zero-COVID-19 policies. Investors cheered this development, given China’s large consumer base and its integral role in global supply chains.
Midway through the reporting period, a banking crisis emerged among U.S. regional banks as rising interest rates caused losses in the long-dated bond holdings at Silicon Valley Bank, Signature Bank and First Republic Bank. Uninsured depositors were spooked by the headlines and lost confidence, moving their money into larger money center banks. Actions by the FDIC to secure deposits and by the Fed to provide additional liquidity helped calm the situation, and markets generally recovered quickly. But the crisis of confidence spread to Europe as similar concerns at Switzerland’s Credit Suisse led to rapid depositor withdrawals and ultimately a government-facilitated sale to rival UBS.
In addition to easing inflation and investors’ growing anticipation of the end to the Fed’s tightening cycle, the possibility the economy could avoid recession provided some support as a widely anticipated recession failed to arrive. But inflation also proved to be more persistent than expected, and the Fed indicated that rates could remain “higher for longer,” hindering markets during the last three months of the reporting period.
One of Three Underlying Strategies Underperform
All underlying funds posted positive absolute returns and contributed positively to the fund’s performance. But the fund lagged the Index, largely due to underperformance by one of the three underlying portfolios. The BNY Mellon International Equity Fund’s portfolio return lagged the Index significantly, detracting 135 basis points (bps) from the fund’s returns. Both allocation and security selection were responsible for the underperformance.
In contrast, the BNY International Core Equity Fund’s portfolio and the BNY International Stock Fund’s portfolio both outperformed the Index, contributing positively to the fund’s relative return. Both underlying funds benefited from strong stock selection.
Markets Face Near-term Headwinds
A shifting global macroeconomic backdrop will likely lead to diverging performance in developed-markets equity markets. In the near term, headwinds in the form of the restrictive monetary policy and weakening demand could hinder markets, especially in Europe.
A recession in Europe remains highly likely, and troubles in China mean that global economic performance outside the U.S. continues to struggle. As European equities are more cyclical, we see a greater downside risk potential, as well as less near-term upside if developments in artificial intelligence (AI) surprise positively. In contrast, cheap valuations for UK equities on both a relative and historical average basis remain attractive and imply that minimal bad news could spur on markets to re-rate.
In Asia, Japan’s reflation process remains intact. Headwinds are cropping up from slowing in China and Europe, but domestic consumption is steady. The Bank of Japan will take more time to ease up on its yield curve control policy. Meanwhile, a stable to weakish trend in the yen will underpin foreign currency translations of Japanese corporations’ offshore earnings. Attractive valuations and structural reform keep us positive on a strategic basis.
3
DISCUSSION OF FUND PERFORMANCE (Unaudited) (continued)
On a multi-year horizon, U.S. equities are likely to benefit from corporate adoption of AI, and this will likely have positive spillover to international markets.
November 15, 2023
1 Total return includes reinvestment of dividends and any capital gains paid and does not take into consideration the maximum initial sales charge in the case of Class A shares, or the applicable contingent deferred sales charge imposed on redemptions in the case of Class C shares. Share price and investment return fluctuate such that upon redemption, fund shares may be worth more or less than their original cost. Return figures provided reflect the absorption of certain fund expenses pursuant to an agreement by BNY Mellon Investment Adviser, Inc. through March 1, 2024, at which time it may be extended, terminated or modified. Had these expenses not been absorbed, the fund’s returns would have been lower. Past performance is no guarantee of future results.
2 Source: Lipper Inc. — Reflects reinvestment of net dividends and, where applicable, capital gain distributions. The MSCI EAFE® Index (Europe, Australasia, Far East) is a free float-adjusted, market capitalization-weighted index that is designed to measure the equity market performance of developed markets, excluding the U.S. and Canada. Investors cannot invest directly in any index.
Equities are subject generally to market, market sector, market liquidity, issuer and investment style risks, among other factors, to varying degrees, all of which are more fully described in the prospectus of the fund and that of each underlying fund.
Small and midsized companies carry additional risks because their earnings and revenues tend to be less predictable, and their share prices more volatile, than those of larger, more established companies.
The shares of smaller companies tend to trade less frequently than those of larger, more established companies.
The ability of the fund to achieve its investment goal depends, in part, on the ability of the portfolio managers to allocate effectively the fund’s assets among the underlying funds. There can be no assurance that the actual allocations will be effective in achieving the fund’s investment goal.
Each underlying fund’s performance will be influenced by political, social and economic factors affecting investments in foreign companies. Special risks associated with such companies include exposure to currency fluctuations, less liquidity, less developed or less efficient trading markets, lack of comprehensive company information, political instability and differing auditing and legal standards. These risks are higher in emerging- market countries.
4
FUND PERFORMANCE (Unaudited)
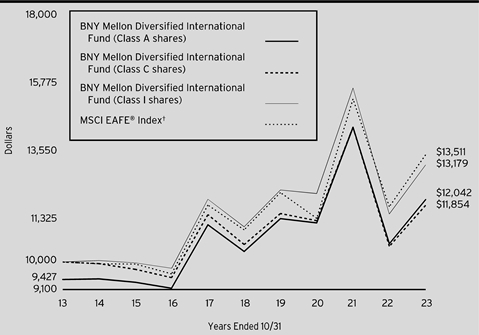
Comparison of change in value of a $10,000 investment in Class A shares, Class C shares and Class I shares of BNY Mellon Diversified International Fund with a hypothetical investment of $10,000 in the MSCI EAFE® Index (the “Index”).
† Source: Lipper Inc.
Past performance is not predictive of future performance.
The above graph compares a hypothetical investment of $10,000 made in each of the Class A shares, Class C shares and Class I shares of BNY Mellon Diversified International Fund on 10/31/13 to a hypothetical investment of $10,000 made in the Index on that date. All dividends and capital gain distributions are reinvested.
The fund’s performance shown in the line graph above takes into account the maximum initial sales charge on Class A shares and all other applicable fees and expenses on Class A shares, Class C shares and Class I shares. The Index (Europe, Australasia, Far East) is a free float-adjusted market capitalization-weighted index that is designed to measure the equity market performance of developed markets, excluding the U.S. and Canada. Unlike a mutual fund, the Index is not subject to charges, fees and other expenses. Investors cannot invest directly in any index. Further information relating to fund performance, including expense reimbursements, if applicable, is contained in the Financial Highlights section of the prospectus and elsewhere in this report.
5
FUND PERFORMANCE (Unaudited) (continued)
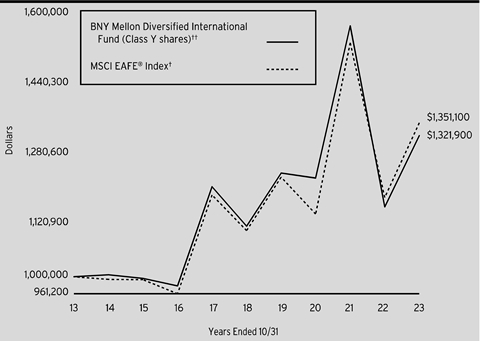
Comparison of change in value of a $1,000,000 investment in Class Y shares of BNY Mellon Diversified International Fund with a hypothetical investment of $1,000,000 in the MSCI EAFE® Index (the “Index”).
† Source: Lipper Inc.
†† The total return figures presented for Class Y shares of the fund reflect the performance of the fund’s Class I shares for the period prior to 10/1/15 (the inception date for Class Y shares).
Past performance is not predictive of future performance.
The above graph compares a hypothetical investment of $1,000,000 made in Class Y shares of BNY Mellon Diversified International Fund on 10/31/13 to a hypothetical investment of $1,000,000 made in the Index on that date. All dividends and capital gain distributions are reinvested.
The fund’s performance shown in the line graph above takes into account all applicable fees and expenses of the fund’s Class Y shares. The Index (Europe, Australasia, Far East) is a free float-adjusted market capitalization-weighted index that is designed to measure the equity market performance of developed markets, excluding the U.S. and Canada. Unlike a mutual fund, the Index is not subject to charges, fees and other expenses. Investors cannot invest directly in any index. Further information relating to fund performance, including expense reimbursements, if applicable, is contained in the Financial Highlights section of the prospectus and elsewhere in this report.
6
Average Annual Total Returns as of 10/31/2023 | ||||
Inception | 1 Year | 5 Years | 10 Years | |
Class A shares | ||||
with maximum sales charge (5.75%) | 12/18/07 | 7.07% | 1.87% | 1.88% |
without sales charge | 12/18/07 | 13.64% | 3.09% | 2.48% |
Class C shares | ||||
with applicable redemption charge† | 12/18/07 | 11.80% | 2.32% | 1.72% |
without redemption | 12/18/07 | 12.74% | 2.32% | 1.72% |
Class I shares | 12/18/07 | 13.89% | 3.40% | 2.80% |
Class Y shares | 10/1/15 | 14.01% | 3.46% | 2.83%†† |
MSCI EAFE® Index | 14.40% | 4.10% | 3.05% | |
† The maximum contingent deferred sales charge for Class C shares is 1% for shares redeemed within one year of the date of purchase.
†† The total return figures presented for Class Y shares of the fund reflect the performance of the fund’s Class I shares for the period prior to 10/1/15 (the inception date for Class Y shares).
The performance data quoted represents past performance, which is no guarantee of future results. Share price and investment return fluctuate and an investor’s shares may be worth more or less than original cost upon redemption. Current performance may be lower or higher than the performance quoted. Go to www.im.bnymellon.com for the fund’s most recent month-end returns.
The fund’s performance shown in the graphs and table does not reflect the deduction of taxes that a shareholder would pay on fund distributions or the redemption of fund shares. In addition to the performance of Class A shares shown with and without a maximum sales charge, the fund's performance shown in the table takes into account all other applicable fees and expenses on all classes.
7
UNDERSTANDING YOUR FUND’S EXPENSES (Unaudited)
As a mutual fund investor, you pay ongoing expenses, such as management fees and other expenses. Using the information below, you can estimate how these expenses affect your investment and compare them with the expenses of other funds. You also may pay one-time transaction expenses, including sales charges (loads) and redemption fees, which are not shown in this section and would have resulted in higher total expenses. For more information, see your fund’s prospectus or talk to your financial adviser.
Review your fund’s expenses
The table below shows the expenses you would have paid on a $1,000 investment in BNY Mellon Diversified International Fund from May 1, 2023 to October 31, 2023. It also shows how much a $1,000 investment would be worth at the close of the period, assuming actual returns and expenses.
Expenses and Value of a $1,000 Investment |
| |||||
Assume actual returns for the six months ended October 31, 2023 |
| |||||
|
|
|
|
|
|
|
|
| Class A | Class C | Class I | Class Y |
|
Expenses paid per $1,000† | $2.02 | $5.76 | $.82 | $.48 |
| |
Ending value (after expenses) | $907.20 | $903.70 | $908.30 | $908.20 |
| |
COMPARING YOUR FUND’S EXPENSES WITH THOSE OF OTHER FUNDS (Unaudited)
Using the SEC’s method to compare expenses
The Securities and Exchange Commission (“SEC”) has established guidelines to help investors assess fund expenses. Per these guidelines, the table below shows your fund’s expenses based on a $1,000 investment, assuming a hypothetical 5% annualized return. You can use this information to compare the ongoing expenses (but not transaction expenses or total cost) of investing in the fund with those of other funds. All mutual fund shareholder reports will provide this information to help you make this comparison. Please note that you cannot use this information to estimate your actual ending account balance and expenses paid during the period.
Expenses and Value of a $1,000 Investment |
| |||||
Assuming a hypothetical 5% annualized return for the six months ended October 31, 2023 |
| |||||
|
|
|
|
|
|
|
|
| Class A | Class C | Class I | Class Y |
|
Expenses paid per $1,000† | $2.14 | $6.11 | $.87 | $.51 |
| |
Ending value (after expenses) | $1,023.09 | $1,019.16 | $1,024.35 | $1,024.70 |
| |
† | Expenses are equal to the fund’s annualized expense ratio of .42% for Class A, 1.20% for Class C, .17% for Class I and .10% for Class Y, multiplied by the average account value over the period, multiplied by 184/365 (to reflect the one-half year period). | |||||
8
STATEMENT OF INVESTMENTS
October 31, 2023
Description | Shares | Value ($) | |||||
Investment Companies - 99.1% | |||||||
Foreign Equity - 99.1% | |||||||
BNY Mellon International Core Equity Fund, Cl. Y | 2,085,871 | a | 72,922,053 | ||||
BNY Mellon International Equity Fund, Cl. Y | 2,551,964 | a | 48,793,552 | ||||
BNY Mellon International Stock Fund, Cl. Y | 3,532,439 | a | 73,404,081 | ||||
Total Investments (cost $119,239,261) | 99.1% | 195,119,686 | |||||
Cash and Receivables (Net) | .9% | 1,683,964 | |||||
Net Assets | 100.0% | 196,803,650 | |||||
a Investment in affiliated issuer. The investment objective of this investment company is publicly available and can be found within the investment company’s prospectus.
Portfolio Summary (Unaudited) † | Value (%) |
Investment Companies | 99.1 |
99.1 |
† Based on net assets.
See notes to financial statements.
Affiliated Issuers | |||||
Description | Value ($) 10/31/2022 | Purchases ($)† | Sales ($) | Net Realized | |
Foreign Equity - 99.1% | |||||
BNY Mellon International Core Equity Fund, Cl. Y - 37.0% | 108,913,218 | 4,417,805 | (54,805,781) | 13,827,857 | |
BNY Mellon International Equity Fund, Cl. Y - 24.8% | 67,347,167 | 2,672,356 | (26,032,745) | 5,148,483 | |
BNY Mellon International Stock Fund, Cl. Y - 37.3% | 110,078,836 | 3,363,095 | (54,805,781) | 22,854,236 | |
Total - 99.1% | 286,339,221 | 10,453,256 | (135,644,307) | 41,830,576 | |
9
STATEMENT OF INVESTMENTS (continued)
Description | Net Change in | Value ($) | Dividends/ | |
Foreign Equity - 99.1% | ||||
BNY Mellon International Core Equity Fund, Cl. Y - 37.0% | 568,954 | 72,922,053 | 3,923,733 | |
BNY Mellon International Equity Fund, Cl. Y - 24.8% | (341,709) | 48,793,552 | 2,437,671 | |
BNY Mellon International Stock Fund, Cl. Y - 37.3% | (8,086,305) | 73,404,081 | 2,869,022 | |
Total - 99.1% | (7,859,060) | 195,119,686 | 9,230,426 | |
† Includes reinvested dividends/distributions.
See notes to financial statements.
10
STATEMENT OF ASSETS AND LIABILITIES
October 31, 2023
|
|
|
|
|
|
|
|
|
| Cost |
| Value |
|
Assets ($): |
|
|
|
| ||
Investments in affiliated issuers—See | 119,239,261 |
| 195,119,686 |
| ||
Cash |
|
|
|
| 1,589,319 |
|
Receivable for investment securities sold |
| 418,052 |
| |||
Receivable for shares of Common Stock subscribed |
| 55,926 |
| |||
Prepaid expenses |
|
|
|
| 56,653 |
|
|
|
|
|
| 197,239,636 |
|
Liabilities ($): |
|
|
|
| ||
Due to BNY Mellon Investment Adviser, Inc. and affiliates—Note 3(c) |
| 7,686 |
| |||
Payable for shares of Common Stock redeemed |
| 356,559 |
| |||
Directors’ fees and expenses payable |
| 3,588 |
| |||
Other accrued expenses |
|
|
|
| 68,153 |
|
|
|
|
|
| 435,986 |
|
Net Assets ($) |
|
| 196,803,650 |
| ||
Composition of Net Assets ($): |
|
|
|
| ||
Paid-in capital |
|
|
|
| 89,348,016 |
|
Total distributable earnings (loss) |
|
|
|
| 107,455,634 |
|
Net Assets ($) |
|
| 196,803,650 |
| ||
Net Asset Value Per Share | Class A | Class C | Class I | Class Y |
|
Net Assets ($) | 6,023,819 | 35,079 | 15,960,608 | 174,784,144 |
|
Shares Outstanding | 586,344 | 3,367 | 1,548,832 | 16,983,585 |
|
Net Asset Value Per Share ($) | 10.27 | 10.42 | 10.30 | 10.29 |
|
|
|
|
|
|
|
See notes to financial statements. |
|
|
|
|
|
11
STATEMENT OF OPERATIONS
Year Ended October 31, 2023
|
|
|
|
|
|
|
|
|
|
|
|
|
|
Investment Income ($): |
|
|
|
| ||
Income: |
|
|
|
| ||
Interest |
|
| 112,444 |
| ||
Cash dividends from affiliated issuers |
|
| 6,445,021 |
| ||
Total Income |
|
| 6,557,465 |
| ||
Expenses: |
|
|
|
| ||
Professional fees |
|
| 98,952 |
| ||
Shareholder servicing costs—Note 3(c) |
|
| 56,386 |
| ||
Registration fees |
|
| 51,577 |
| ||
Prospectus and shareholders’ reports |
|
| 27,790 |
| ||
Directors’ fees and expenses—Note 3(d) |
|
| 19,679 |
| ||
Chief Compliance Officer fees—Note 3(c) |
|
| 15,533 |
| ||
Loan commitment fees—Note 2 |
|
| 5,396 |
| ||
Interest expense—Note 2 |
|
| 1,413 |
| ||
Custodian fees—Note 3(c) |
|
| 1,360 |
| ||
Distribution fees—Note 3(b) |
|
| 322 |
| ||
Miscellaneous |
|
| 16,314 |
| ||
Total Expenses |
|
| 294,722 |
| ||
Less—reduction in expenses due to undertaking—Note 3(a) |
|
| (654) |
| ||
Less—reduction in fees due to earnings credits—Note 3(c) |
|
| (3,004) |
| ||
Net Expenses |
|
| 291,064 |
| ||
Net Investment Income |
|
| 6,266,401 |
| ||
Realized and Unrealized Gain (Loss) on Investments—Note 4 ($): |
|
| ||||
Net realized gain (loss) on investments from affiliated issuers | 41,830,576 |
| ||||
Capital gain distributions from affiliated issuers | 2,785,405 |
| ||||
Net Realized Gain (Loss) |
|
| 44,615,981 |
| ||
Net change in unrealized appreciation (depreciation) on investments: |
|
| ||||
Affiliated issuers |
|
|
| (7,859,060) |
| |
Net Realized and Unrealized Gain (Loss) on Investments |
|
| 36,756,921 |
| ||
Net Increase in Net Assets Resulting from Operations |
| 43,023,322 |
| |||
|
|
|
|
|
|
|
See notes to financial statements. | ||||||
12
STATEMENT OF CHANGES IN NET ASSETS
|
|
|
| Year Ended October 31, | |||||
|
|
|
| 2023 |
| 2022 |
| ||
Operations ($): |
|
|
|
|
|
|
|
| |
Net investment income |
|
| 6,266,401 |
|
|
| 10,423,697 |
| |
Net realized gain (loss) on investments |
| 44,615,981 |
|
|
| 61,626,646 |
| ||
Net change in unrealized appreciation |
| (7,859,060) |
|
|
| (195,834,688) |
| ||
Net Increase (Decrease) in Net Assets | 43,023,322 |
|
|
| (123,784,345) |
| |||
Distributions ($): |
| ||||||||
Distributions to shareholders: |
|
|
|
|
|
|
|
| |
Class A |
|
| (2,774,309) |
|
|
| (1,760,296) |
| |
Class C |
|
| (7,696) |
|
|
| (4,401) |
| |
Class I |
|
| (3,746,914) |
|
|
| (3,552,714) |
| |
Class Y |
|
| (42,662,452) |
|
|
| (38,453,592) |
| |
Total Distributions |
|
| (49,191,371) |
|
|
| (43,771,003) |
| |
Capital Stock Transactions ($): |
| ||||||||
Net proceeds from shares sold: |
|
|
|
|
|
|
|
| |
Class A |
|
| 2,432,248 |
|
|
| 3,365,175 |
| |
Class I |
|
| 4,849,138 |
|
|
| 9,877,668 |
| |
Class Y |
|
| 3,291,784 |
|
|
| 14,812,907 |
| |
Distributions reinvested: |
|
|
|
|
|
|
|
| |
Class A |
|
| 2,767,835 |
|
|
| 1,721,042 |
| |
Class C |
|
| 6,168 |
|
|
| 3,619 |
| |
Class I |
|
| 3,344,894 |
|
|
| 3,167,672 |
| |
Class Y |
|
| 16,694,069 |
|
|
| 13,666,281 |
| |
Cost of shares redeemed: |
|
|
|
|
|
|
|
| |
Class A |
|
| (15,648,779) |
|
|
| (3,277,076) |
| |
Class C |
|
| (12,974) |
|
|
| (136,454) |
| |
Class I |
|
| (13,937,268) |
|
|
| (20,047,758) |
| |
Class Y |
|
| (92,212,221) |
|
|
| (190,188,343) |
| |
Increase (Decrease) in Net Assets | (88,425,106) |
|
|
| (167,035,267) |
| |||
Total Increase (Decrease) in Net Assets | (94,593,155) |
|
|
| (334,590,615) |
| |||
Net Assets ($): |
| ||||||||
Beginning of Period |
|
| 291,396,805 |
|
|
| 625,987,420 |
| |
End of Period |
|
| 196,803,650 |
|
|
| 291,396,805 |
| |
13
STATEMENT OF CHANGES IN NET ASSETS (continued)
|
|
|
| Year Ended October 31, | |||||
|
|
|
| 2023 |
| 2022 |
| ||
Capital Share Transactions (Shares): |
| ||||||||
Class Aa |
|
|
|
|
|
|
|
| |
Shares sold |
|
| 212,919 |
|
|
| 261,803 |
| |
Shares issued for distributions reinvested |
|
| 275,133 |
|
|
| 114,660 |
| |
Shares redeemed |
|
| (1,371,165) |
|
|
| (255,828) |
| |
Net Increase (Decrease) in Shares Outstanding | (883,113) |
|
|
| 120,635 |
| |||
Class C |
|
|
|
|
|
|
|
| |
Shares issued for distributions reinvested |
|
| 600 |
|
|
| 237 |
| |
Shares redeemed |
|
| (1,125) |
|
|
| (8,597) |
| |
Net Increase (Decrease) in Shares Outstanding | (525) |
|
|
| (8,360) |
| |||
Class Ia |
|
|
|
|
|
|
|
| |
Shares sold |
|
| 430,819 |
|
|
| 728,217 |
| |
Shares issued for distributions reinvested |
|
| 331,834 |
|
|
| 210,756 |
| |
Shares redeemed |
|
| (1,245,734) |
|
|
| (1,549,545) |
| |
Net Increase (Decrease) in Shares Outstanding | (483,081) |
|
|
| (610,572) |
| |||
Class Ya |
|
|
|
|
|
|
|
| |
Shares sold |
|
| 299,664 |
|
|
| 1,141,874 |
| |
Shares issued for distributions reinvested |
|
| 1,659,450 |
|
|
| 910,478 |
| |
Shares redeemed |
|
| (8,102,855) |
|
|
| (13,661,082) |
| |
Net Increase (Decrease) in Shares Outstanding | (6,143,741) |
|
|
| (11,608,730) |
| |||
|
|
|
|
|
|
|
|
|
|
a | During the period ended October 31, 2023, 313,688 Class Y shares representing $3,554,226 were exchanged for 313,272 Class I shares. During the period ended October 31, 2022, 556,342 Class Y shares representing $7,557,599 were exchanged for 555,775 Class I shares, 3,103 Class Y shares representing $44,034 were exchanged for 3,105 Class A share and 98 Class A shares representing $1,236 were exchanged for 98 Class I shares. | ||||||||
See notes to financial statements. | |||||||||
14
FINANCIAL HIGHLIGHTS
The following tables describe the performance for each share class for the fiscal periods indicated. All information (except portfolio turnover rate) reflects financial results for a single fund share. Net asset value total return is calculated assuming an initial investment made at the net asset value at the beginning of the period, reinvestment of all dividends and distributions at net asset value during the period, and redemption at net asset value on the last day of the period. Net asset value total return includes adjustments in accordance with accounting principles generally accepted in the United States of America and as such, the net asset value for financial reporting purposes and the returns based upon those net asset values may differ from the net asset value and returns for shareholder transactions. These figures have been derived from the fund’s financial statements.
Year Ended October 31, | ||||||
Class A Shares | 2023 | 2022 | 2021 | 2020 | 2019 | |
Per Share Data ($): | ||||||
Net asset value, beginning of period | 10.91 | 16.12 | 12.75 | 13.14 | 12.09 | |
Investment Operations: | ||||||
Net investment incomea | .27 | .25 | .05 | .24 | .17 | |
Net realized and unrealized | 1.17 | (4.17) | 3.48 | (.39) | 1.06 | |
Total from Investment Operations | 1.44 | (3.92) | 3.53 | (.15) | 1.23 | |
Distributions: | ||||||
Dividends from net | (.21) | (.28) | (.16) | (.24) | (.18) | |
Dividends from net realized | (1.87) | (1.01) | - | (.00)b | - | |
Total Distributions | (2.08) | (1.29) | (.16) | (.24) | (.18) | |
Net asset value, end of period | 10.27 | 10.91 | 16.12 | 12.75 | 13.14 | |
Total Return (%)c | 13.64 | (26.48) | 27.75 | (1.21) | 10.40 | |
Ratios/Supplemental Data (%): | ||||||
Ratio of total expenses | .40 | 1.14 | 1.62 | 3.26 | 4.08 | |
Ratio of net expenses | .40 | .42 | .40 | .40 | .40 | |
Ratio of net investment income | 2.37 | 1.92 | .30 | 1.92 | 1.41 | |
Portfolio Turnover Rate | 4.27 | 12.58 | 8.80 | 4.10 | 9.44 | |
Net Assets, end of period ($ x 1,000) | 6,024 | 16,030 | 21,749 | 6,501 | 5,889 | |
a Based on average shares outstanding.
b Amount represents less than $.01 per share.
c Exclusive of sales charge.
d Amounts do not include the expenses of the underlying fund.
See notes to financial statements.
15
FINANCIAL HIGHLIGHTS (continued)
Year Ended October 31, | ||||||
Class C Shares | 2023 | 2022 | 2021 | 2020 | 2019 | |
Per Share Data ($): | ||||||
Net asset value, beginning of period | 11.02 | 16.11 | 12.73 | 13.08 | 12.00 | |
Investment Operations: | ||||||
Net investment incomea | .15 | .29 | .04 | .16 | .12 | |
Net realized and unrealized | 1.23 | (4.37) | 3.39 | (.42) | 1.02 | |
Total from Investment Operations | 1.38 | (4.08) | 3.43 | (.26) | 1.14 | |
Distributions: | ||||||
Dividends from net | (.11) | - | (.05) | (.09) | (.06) | |
Dividends from net realized | (1.87) | (1.01) | - | (.00)b | - | |
Total Distributions | (1.98) | (1.01) | (.05) | (.09) | (.06) | |
Net asset value, end of period | 10.42 | 11.02 | 16.11 | 12.73 | 13.08 | |
Total Return (%)c | 12.74 | (27.05) | 26.95 | (2.02) | 9.61 | |
Ratios/Supplemental Data (%): | ||||||
Ratio of total expenses | 2.71 | 1.96 | 1.48 | 1.58 | 1.43 | |
Ratio of net expenses | 1.19 | 1.17 | 1.15 | 1.15 | 1.15 | |
Ratio of net investment income | 1.35 | 2.06 | .27 | 1.26 | .97 | |
Portfolio Turnover Rate | 4.27 | 12.58 | 8.80 | 4.10 | 9.44 | |
Net Assets, end of period ($ x 1,000) | 35 | 43 | 197 | 179 | 207 | |
a Based on average shares outstanding.
b Amount represents less than $.01 per share.
c Exclusive of sales charge.
d Amounts do not include the expenses of the underlying fund.
See notes to financial statements.
16
Year Ended October 31, | ||||||
Class I Shares | 2023 | 2022 | 2021 | 2020 | 2019 | |
Per Share Data ($): | ||||||
Net asset value, beginning of period | 10.95 | 16.17 | 12.77 | 13.17 | 12.12 | |
Investment Operations: | ||||||
Net investment incomea | .27 | .34 | .16 | .32 | .21 | |
Net realized and unrealized | 1.20 | (4.23) | 3.43 | (.43) | 1.06 | |
Total from Investment Operations | 1.47 | (3.89) | 3.59 | (.11) | 1.27 | |
Distributions: | ||||||
Dividends from net | (.25) | (.32) | (.19) | (.29) | (.22) | |
Dividends from net realized | (1.87) | (1.01) | - | (.00)b | - | |
Total Distributions | (2.12) | (1.33) | (.19) | (.29) | (.22) | |
Net asset value, end of period | 10.30 | 10.95 | 16.17 | 12.77 | 13.17 | |
Total Return (%) | 13.89 | (26.29) | 28.24 | (.96) | 10.83 | |
Ratios/Supplemental Data (%): | ||||||
Ratio of total expenses | .16 | .11 | .09 | .09 | .08 | |
Ratio of net expenses | .16 | .11 | .09 | .09 | .08 | |
Ratio of net investment income | 2.42 | 2.57 | 1.04 | 2.50 | 1.68 | |
Portfolio Turnover Rate | 4.27 | 12.58 | 8.80 | 4.10 | 9.44 | |
Net Assets, end of period ($ x 1,000) | 15,961 | 22,253 | 42,735 | 30,981 | 35,681 | |
a Based on average shares outstanding.
b Amount represents less than $.01 per share.
c Amounts do not include the expenses of the underlying fund.
See notes to financial statements.
17
FINANCIAL HIGHLIGHTS (continued)
Year Ended October 31, | ||||||
Class Y Shares | 2023 | 2022 | 2021 | 2020 | 2019 | |
Per Share Data ($): | ||||||
Net asset value, beginning of period | 10.94 | 16.16 | 12.76 | 13.16 | 12.11 | |
Investment Operations: | ||||||
Net investment incomea | .28 | .33 | .20 | .35 | .21 | |
Net realized and unrealized | 1.20 | (4.21) | 3.40 | (.46) | 1.07 | |
Total from Investment Operations | 1.48 | (3.88) | 3.60 | (.11) | 1.28 | |
Distributions: | ||||||
Dividends from net | (.26) | (.33) | (.20) | (.29) | (.23) | |
Dividends from net realized | (1.87) | (1.01) | - | (.00)b | - | |
Total Distributions | (2.13) | (1.34) | (.20) | (.29) | (.23) | |
Net asset value, end of period | 10.29 | 10.94 | 16.16 | 12.76 | 13.16 | |
Total Return (%) | 14.01 | (26.26) | 28.33 | (.92) | 10.87 | |
Ratios/Supplemental Data (%): | ||||||
Ratio of total expenses | .10 | .05 | .04 | .04 | .04 | |
Ratio of net expenses | .10 | .05 | .04 | .04 | .04 | |
Ratio of net investment income | 2.54 | 2.50 | 1.27 | 2.74 | 1.70 | |
Portfolio Turnover Rate | 4.27 | 12.58 | 8.80 | 4.10 | 9.44 | |
Net Assets, end of period ($ x 1,000) | 174,784 | 253,070 | 561,306 | 532,258 | 849,143 | |
a Based on average shares outstanding.
b Amount represents less than $.01 per share.
c Amounts do not include the expenses of the underlying fund.
See notes to financial statements.
18
NOTES TO FINANCIAL STATEMENTS
NOTE 1—Significant Accounting Policies:
BNY Mellon Diversified International Fund (the “fund”) is a separate diversified series of BNY Mellon Investment Funds V, Inc. (the “Company”), which is registered under the Investment Company Act of 1940, as amended (the “Act”), as an open-end management investment company and operates as a series company currently offering three series, including the fund. The fund’s investment objective is to seek long-term capital appreciation. BNY Mellon Investment Adviser, Inc. (the “Adviser”), a wholly-owned subsidiary of The Bank of New York Mellon Corporation (“BNY Mellon”), serves as the fund’s investment adviser.
BNY Mellon Securities Corporation (the “Distributor”), a wholly-owned subsidiary of the Adviser, is the distributor of fund’s shares. The fund is authorized to issue 600 million shares of $.001 par value Common Stock. The fund currently has authorized four classes of shares: Class A (150 million shares authorized), Class C (75 million shares authorized), Class I (75 million shares authorized) and Class Y (300 million shares authorized). Class A and Class C shares are sold primarily to retail investors through financial intermediaries and bear Distribution and/or Shareholder Services Plan fees. Class A shares generally are subject to a sales charge imposed at the time of purchase. Class A shares bought without an initial sales charge as part of an investment of $1 million or more may be charged a contingent deferred sales charge (“CDSC”) of 1.00% if redeemed within one year. Class C shares are subject to a CDSC imposed on Class C shares redeemed within one year of purchase. Class C shares automatically convert to Class A shares eight years after the date of purchase, without the imposition of a sales charge. Class I shares are sold primarily to bank trust departments and other financial service providers (including BNY Mellon and its affiliates), acting on behalf of customers having a qualified trust or an investment account or relationship at such institution, and bear no Distribution or Shareholder Services Plan fees. Class Y shares are sold at net asset value per share generally to institutional investors, and bear no Distribution or Shareholder Services Plan fees. Class I and Class Y shares are offered without a front-end sales charge or CDSC. Other differences between the classes include the services offered to and the expenses borne by each class, the allocation of certain transfer agency costs and certain voting rights. Income, expenses (other than expenses attributable to a specific class), and realized and unrealized gains or losses on investments are allocated to each class of shares based on its relative net assets.
As of October 31, 2023, MBC Investments Corporation, an indirect subsidiary of BNY Mellon, held 773 Class C shares of the fund.
19
NOTES TO FINANCIAL STATEMENTS (continued)
The Company accounts separately for the assets, liabilities and operations of each series. Expenses directly attributable to each series are charged to that series’ operations; expenses which are applicable to all series are allocated among them on a pro rata basis.
The Financial Accounting Standards Board (“FASB”) Accounting Standards Codification (“ASC”) is the exclusive reference of authoritative U.S. generally accepted accounting principles (“GAAP”) recognized by the FASB to be applied by nongovernmental entities. Rules and interpretive releases of the SEC under authority of federal laws are also sources of authoritative GAAP for SEC registrants. The fund is an investment company and applies the accounting and reporting guidance of the FASB ASC Topic 946 Financial Services-Investment Companies. The fund’s financial statements are prepared in accordance with GAAP, which may require the use of management estimates and assumptions. Actual results could differ from those estimates.
The Company enters into contracts that contain a variety of indemnifications. The fund’s maximum exposure under these arrangements is unknown. The fund does not anticipate recognizing any loss related to these arrangements.
(a) Portfolio valuation: The fair value of a financial instrument is the amount that would be received to sell an asset or paid to transfer a liability in an orderly transaction between market participants at the measurement date (i.e., the exit price). GAAP establishes a fair value hierarchy that prioritizes the inputs of valuation techniques used to measure fair value. This hierarchy gives the highest priority to unadjusted quoted prices in active markets for identical assets or liabilities (Level 1 measurements) and the lowest priority to unobservable inputs (Level 3 measurements).
Additionally, GAAP provides guidance on determining whether the volume and activity in a market has decreased significantly and whether such a decrease in activity results in transactions that are not orderly. GAAP requires enhanced disclosures around valuation inputs and techniques used during annual and interim periods.
Various inputs are used in determining the value of the fund’s investments relating to fair value measurements. These inputs are summarized in the three broad levels listed below:
Level 1—unadjusted quoted prices in active markets for identical investments.
20
Level 2—other significant observable inputs (including quoted prices for similar investments, interest rates, prepayment speeds, credit risk, etc.).
Level 3—significant unobservable inputs (including the fund’s own assumptions in determining the fair value of investments).
The inputs or methodology used for valuing securities are not necessarily an indication of the risk associated with investing in those securities.
The Company’s Board of Directors (the “Board”) has designated the Adviser as the fund’s valuation designee to make all fair value determinations with respect to the fund’s portfolio investments, subject to the Board’s oversight and pursuant to Rule 2a-5 under the Act.
Investments are valued at the net asset value of each underlying fund determined as of the close of the New York Stock Exchange (generally 4 p.m., Eastern time) on the valuation date and are generally categorized within Level 1 of the fair value hierarchy.
The following is a summary of the inputs used as of October 31, 2023 in valuing the fund’s investments:
Level 1-Unadjusted Quoted Prices | Level 2- Other Significant Observable Inputs | Level 3-Significant Unobservable Inputs | Total | |||
Assets ($) | ||||||
Investments in Securities:† | ||||||
Investment Companies | 195,119,686 | - | - | 195,119,686 | ||
† See Statement of Investments for additional detailed categorizations, if any.
(b) Securities transactions and investment income: Securities transactions are recorded on a trade date basis. Realized gains and losses from securities transactions are recorded on the identified cost basis. Dividend income is recognized on the ex-dividend date and interest income, including, where applicable, accretion of discount and amortization of premium on investments, is recognized on the accrual basis.
(c) Affiliated issuers: Investments in other investment companies advised by the Adviser are considered “affiliated” under the Act.
(d) Market Risk: The value of the securities in which the fund invests may be affected by political, regulatory, economic and social developments, and developments that impact specific economic sectors, industries or segments of the market. In addition, turbulence in financial markets and
21
NOTES TO FINANCIAL STATEMENTS (continued)
reduced liquidity in equity, credit and/or fixed-income markets may negatively affect many issuers, which could adversely affect the fund. Global economies and financial markets are becoming increasingly interconnected, and conditions and events in one country, region or financial market may adversely impact issuers in a different country, region or financial market. These risks may be magnified if certain events or developments adversely interrupt the global supply chain; in these and other circumstances, such risks might affect companies world-wide.
Allocation risk: The ability of the fund to achieve its investment goal depends, in part, on the ability of the Adviser to allocate effectively the fund’s assets among the underlying funds. There can be no assurance that the actual allocations will be effective in achieving the fund’s investment goal.
Exchanged Traded Fund (“ETFs”) and Other Investment Company Risk: To the extent the fund invests in pooled investment vehicles, such as ETF and other investment companies, the fund will be affected by the investment policies, practices and performance of such entities in direct proportion to the amount of assets the fund has invested therein. The risks of investing in other investment companies, including ETFs, typically reflect the risks associated with the types of instruments in which the investment companies invest. When the fund invests in an ETF or other investment companies, shareholders of the fund will bear indirectly their proportionate share of the expenses of the ETF or other investment companies (including management fees) in addition to the expenses of the fund.
(e) Dividends and distributions to shareholders: Dividends and distributions are recorded on the ex-dividend date. Dividends from net investment income and dividends from net realized capital gains, if any, are normally declared and paid annually, but the fund may make distributions on a more frequent basis to comply with the distribution requirements of the Internal Revenue Code of 1986, as amended (the “Code”). To the extent that net realized capital gains can be offset by capital loss carryovers, it is the policy of the fund not to distribute such gains. Income and capital gain distributions are determined in accordance with income tax regulations, which may differ from GAAP.
(f) Federal income taxes: It is the policy of the fund to continue to qualify as a regulated investment company, if such qualification is in the best interests of its shareholders, by complying with the applicable provisions of the Code, and to make distributions of taxable income and net realized capital gain sufficient to relieve it from substantially all federal income and excise taxes.
22
As of and during the period ended October 31, 2023, the fund did not have any liabilities for any uncertain tax positions. The fund recognizes interest and penalties, if any, related to uncertain tax positions as income tax expense in the Statement of Operations. During the period ended October 31, 2023, the fund did not incur any interest or penalties.
Each tax year in the four-year period ended October 31, 2023 remains subject to examination by the Internal Revenue Service and state taxing authorities.
At October 31, 2023, the components of accumulated earnings on a tax basis were as follows: undistributed ordinary income $267,003, undistributed capital gains $34,213,066 and unrealized appreciation $72,975,565.
The tax character of distributions paid to shareholders during the fiscal years ended October 31, 2023 and October 31, 2022 were as follows: ordinary income $5,999,398 and $10,423,697 and long-term capital gains $43,191,973 and $33,347,306, respectively.
During the period ended October 31, 2023, as a result of permanent book to tax differences, primarily due to treating a portion of the proceeds from redemptions as a distribution for tax purposes, the fund decreased total distributable earnings (loss) by $8,492,353 and increased paid-in capital by the same amount. Net assets and net asset value per share were not affected by this reclassification.
NOTE 2—Bank Lines of Credit:
The fund participates with other long-term open-end funds managed by the Adviser in a $738 million unsecured credit facility led by Citibank, N.A. (the “Citibank Credit Facility”) and a $300 million unsecured credit facility provided by BNY Mellon (the “BNYM Credit Facility”), each to be utilized primarily for temporary or emergency purposes, including the financing of redemptions (each, a “Facility”). The Citibank Credit Facility is available in two tranches: (i) Tranche A is in an amount equal to $618 million and is available to all long-term open-ended funds, including the fund, and (ii) Tranche B is an amount equal to $120 million and is available only to BNY Mellon Floating Rate Income Fund, a series of BNY Mellon Investment Funds IV, Inc. Prior to September 27, 2023, the Citibank Credit Facility was $823.5 million with Tranche A available in an amount equal to $688.5 million and Tranche B available in an amount equal to $135 million. In connection therewith, the fund has agreed to pay its pro rata portion of commitment fees for Tranche A of the Citibank Credit Facility and the BNYM Credit Facility. Interest is charged to the fund
23
NOTES TO FINANCIAL STATEMENTS (continued)
based on rates determined pursuant to the terms of the respective Facility at the time of borrowing.
During the period ended October 31, 2023, the fund was charged $1,413 for interest expense. These fees are included in Interest expense in the Statement of Operations. The average amount of borrowings outstanding under the Facilities during the period ended October 31, 2023 was approximately $23,014 with a related weighted average annualized interest rate of 6.14%.
NOTE 3—Management Fee and Other Transactions with Affiliates:
(a) Pursuant to a management agreement with the Adviser, there is no management fee paid to the Adviser. The fund invests in other affiliated mutual funds advised by the Adviser. All fees and expenses of the underlying funds are reflected in the underlying fund’s net asset value. The Adviser has contractually agreed, from November 1, 2022 through March 1, 2024, to assume the direct expenses of the fund so that the total annual fund operating expenses (including acquired fund (underlying funds) fees and expenses) of none of the fund’s share classes (excluding Rule 12b-1 Distribution Plan fees, Shareholder Services Plan fees, taxes, interest expense, brokerage commissions, commitment fees on borrowings and extraordinary expenses) exceed 1.05% of the fund’s average daily net assets. On or after March 1, 2024, the Adviser may terminate this expense limitation at any time. The reduction in expenses, pursuant to the undertaking, amounted to $654 during the period ended October 31, 2023.
(b) Under the Distribution Plan adopted pursuant to Rule 12b-1 under the Act, Class C shares pay the Distributor for distributing its shares at an annual rate of .75% of the value of its average daily net assets. The Distributor may pay one or more Service Agents in respect of advertising, marketing and other distribution services, and determines the amounts, if any, to be paid to Service Agents and the basis on which such payments are made. During the period ended October 31, 2023, Class C shares were charged $322 pursuant to the Distribution Plan.
(c) Under the Shareholder Services Plan, Class A and Class C shares pay the Distributor at an annual rate of .25% of the value of their average daily net assets for the provision of certain services. The services provided may include personal services relating to shareholder accounts, such as answering shareholder inquiries regarding the fund, and services related to the maintenance of shareholder accounts. The Distributor may make payments to Service Agents (securities dealers, financial institutions or other industry professionals) with respect to these services. The
24
Distributor determines the amounts to be paid to Service Agents. During the period ended October 31, 2023, Class A and Class C shares were charged $34,017 and $107, respectively, pursuant to the Shareholder Services Plan.
The fund has an arrangement with BNY Mellon Transfer, Inc., (the “Transfer Agent”), a subsidiary of BNY Mellon and an affiliate of the Adviser, whereby the fund may receive earnings credits when positive cash balances are maintained, which are used to offset Transfer Agent fees. For financial reporting purposes, the fund includes transfer agent net earnings credits, if any, as an expense offset in the Statement of Operations.
The fund has an arrangement with The Bank of New York Mellon (the “Custodian”), a subsidiary of BNY Mellon and an affiliate of the Adviser, whereby the fund will receive interest income or be charged overdraft fees when cash balances are maintained. For financial reporting purposes, the fund includes this interest income and overdraft fees, if any, as interest income in the Statement of Operations.
The fund compensates the Transfer Agent, under a transfer agency agreement, for providing transfer agency and cash management services for the fund. The majority of Transfer Agent fees are comprised of amounts paid on a per account basis, while cash management fees are related to fund subscriptions and redemptions. During the period ended October 31, 2023, the fund was charged $6,063 for transfer agency services. These fees are included in Shareholder servicing costs in the Statement of Operations. These fees were partially offset by earnings credits of $3,004.
The fund compensates the Custodian, under a custody agreement, for providing custodial services for the fund. These fees are determined based on net assets, geographic region and transaction activity. During the period ended October 31, 2023, the fund was charged $1,360 pursuant to the custody agreement.
During the period ended October 31, 2023, the fund was charged $15,533 for services performed by the fund’s Chief Compliance Officer and his staff. These fees are included in Chief Compliance Officer fees in the Statement of Operations.
The components of “Due to BNY Mellon Investment Adviser, Inc. and affiliates” in the Statement of Assets and Liabilities consist of: Distribution Plan fees of $23, Shareholder Services Plan fees of $1,321, Custodian fees of $613, Chief Compliance Officer fees of $4,840 and Transfer Agent fees of $943, which are offset against an expense reimbursement currently in effect in the amount of $54.
25
NOTES TO FINANCIAL STATEMENTS (continued)
(d) Each board member also serves as a board member of other funds in the BNY Mellon Family of Funds complex. Annual retainer fees and attendance fees are allocated to each fund based on net assets.
NOTE 4—Securities Transactions:
The aggregate amount of purchases and sales of investment securities, excluding short-term securities, during the period ended October 31, 2023, amounted to $10,453,255 and $135,644,307, respectively.
At October 31, 2023, the cost of investments for federal income tax purposes was $122,144,121; accordingly, accumulated net unrealized appreciation on investments was $72,975,565, consisting of all gross unrealized appreciation.
26
REPORT OF INDEPENDENT REGISTERED PUBLIC ACCOUNTING FIRM
To the Shareholders and the Board of Directors of BNY Mellon Diversified International Fund
Opinion on the Financial Statements
We have audited the accompanying statement of assets and liabilities of BNY Mellon Diversified International Fund (the “Fund”) (one of the funds constituting BNY Mellon Investment Funds V, Inc. (the “Company”)), including the statement of investments, as of October 31, 2023, and the related statement of operations for the year then ended, the statements of changes in net assets for each of the two years in the period then ended, the financial highlights for each of the five years in the period then ended and the related notes (collectively referred to as the “financial statements”). In our opinion, the financial statements present fairly, in all material respects, the financial position of the Fund (one of the funds constituting BNY Mellon Investment Funds V, Inc.) at October 31, 2023, the results of its operations for the year then ended, the changes in its net assets for each of the two years in the period then ended and its financial highlights for each of the five years in the period then ended, in conformity with U.S. generally accepted accounting principles.
Basis for Opinion
These financial statements are the responsibility of the Company’s management. Our responsibility is to express an opinion on the Fund’s financial statements based on our audits. We are a public accounting firm registered with the Public Company Accounting Oversight Board (United States) (“PCAOB”) and are required to be independent with respect to the Company in accordance with the U.S. federal securities laws and the applicable rules and regulations of the Securities and Exchange Commission and the PCAOB.
We conducted our audits in accordance with the standards of the PCAOB. Those standards require that we plan and perform the audit to obtain reasonable assurance about whether the financial statements are free of material misstatement, whether due to error or fraud. The Company is not required to have, nor were we engaged to perform, an audit of the Company’s internal control over financial reporting. As part of our audits, we are required to obtain an understanding of internal control over financial reporting but not for the purpose of expressing an opinion on the effectiveness of the Company’s internal control over financial reporting. Accordingly, we express no such opinion.
Our audits included performing procedures to assess the risks of material misstatement of the financial statements, whether due to error or fraud, and performing procedures that respond to those risks. Such procedures included examining, on a test basis, evidence regarding the amounts and disclosures in the financial statements. Our procedures included confirmation of securities owned as of October 31, 2023, by correspondence with the custodian, brokers and others; when replies were not received from brokers and others, we performed other auditing procedures. Our audits also included evaluating the accounting principles used and significant estimates made by management, as well as evaluating the overall presentation of the financial statements. We believe that our audits provide a reasonable basis for our opinion.

We have served as the auditor of one or more investment companies in the BNY Mellon Family of Funds since at least 1957, but we are unable to determine the specific year.
New York, New York
December 22, 2023
27
IMPORTANT TAX INFORMATION (Unaudited)
In accordance with federal tax law, the fund elects to provide each shareholder with their portion of the fund’s foreign taxes paid and the income sourced from foreign countries. Accordingly, the fund hereby reports the following information regarding its fiscal year ended October 31, 2023:
- the total amount of taxes paid to foreign countries was $915,393
- the total amount of income sourced from foreign countries was $7,399,579
Where required by Federal tax law rules, shareholders will receive notification of their proportionate share of foreign taxes paid and foreign sourced income for the 2023 calendar year with Form 1099-DIV which will be mailed in early 2024. For the fiscal year ended October 31, 2023, certain dividends paid by the fund may be subject to a maximum tax rate of 15%, as provided for by the Jobs and Growth Tax Relief Reconciliation Act of 2003. Of the distributions paid during the fiscal year, $6,205,410 represents the maximum amount that may be considered qualified dividend income. The fund also hereby reports $1.8706 per share as a long-term capital gain distribution paid on December 30, 2022.
28
PROXY RESULTS (Unaudited)
A special meeting of the Company’s shareholders was held on October 12, 2023. The proposal considered at the meeting and the results were as follows:
Shares | ||||
For | Authority Withheld | |||
To elect Board Members to hold office until their successors are duly elected and qualified† | ||||
Francine J. Bovich | 77,782,677 | 85,728 | ||
Michael D. DiLecce | 77,688,219 | 180,185 | ||
Gina D. France | 77,755,823 | 112,582 | ||
Joan L. Gulley | 77,756,290 | 112,115 | ||
Nathan Leventhal | 77,669,548 | 198,856 | ||
† Each Board Member’s term to commence January 1, 2024
In addition, Joseph S. DiMartino, Peggy C. Davis and Robin A. Melvin continue as Board Members of the Company. Mses. France and Gulley currently are Board Members of the Company, but have not been previously elected by shareholders.
29
LIQUIDITY RISK MANAGEMENT PROGRAM (Unaudited)
The fund adopted a liquidity risk management program (the “Liquidity Risk Management Program”) pursuant to the requirements of Rule 22e-4 under the Investment Company Act of 1940, as amended. Rule 22e-4 requires registered open-end funds, including mutual funds and exchange-traded funds but not money market funds, to establish liquidity risk management programs in order to effectively manage fund liquidity and shareholder redemptions. The rule is designed to mitigate the risk that a fund could not meet redemption requests without significantly diluting the interests of remaining investors.
The rule requires the fund to assess, manage and review their liquidity risk at least annually considering applicable factors such as investment strategy and liquidity during normal and foreseeable stressed conditions, including whether the strategy is appropriate for an open-end fund and whether the fund has a relatively concentrated portfolio or large positions in particular issuers. The fund must also assess its use of borrowings and derivatives, short-term and long-term cash flow projections in normal and stressed conditions, holdings of cash and cash equivalents, and borrowing arrangements and other funding sources.
The rule also requires the fund to classify its investments as highly liquid, moderately liquid, less liquid or illiquid based on the number of days the fund expects it would take to liquidate the investment, and to review these classifications at least monthly or more often under certain conditions. The periods range from three or fewer business days for a highly liquid investment to greater than seven calendar days for settlement of a less liquid investment. Illiquid investments are those a fund does not expect to be able to sell or dispose of within seven calendar days without significantly changing the market value. The fund is prohibited from acquiring an investment if, after the acquisition, its holdings of illiquid assets will exceed 15% of its net assets. In addition, if a fund permits redemptions in-kind, the rule requires the fund to establish redemption in-kind policies and procedures governing how and when it will engage in such redemptions.
Pursuant to the rule’s requirements, the Liquidity Risk Management Program has been reviewed and approved by the Board. Furthermore, the Board has received a written report prepared by the Program’s Administrator that addresses the operation of the Program, assesses its adequacy and effectiveness and describes any material changes made to the Program.
Assessment of Program
In the opinion of the Program Administrator, the Program approved by the Board continues to be adequate for the fund and the Program has been implemented effectively. The Program Administrator has monitored the fund’s liquidity risk and the liquidity classification of the securities held by the fund and has determined that the Program is operating effectively.
During the period from January 1, 2022 to December 31, 2022, there were no material changes to the Program and no material liquidity events that impacted the fund. During the period, the fund held sufficient highly liquid assets to meet fund redemptions.
Under normal expected foreseeable fund redemption forecasts and foreseeable stressed fund redemption forecasts, the Program Administrator believes that the fund maintains sufficient highly liquid assets to meet expected fund redemptions.
30
BOARD MEMBERS INFORMATION (Unaudited)
Independent Board Members
Chairman of the Board (1995)
Principal Occupation During Past 5 Years:
· Director or Trustee of funds in the BNY Mellon Family of Funds and certain other entities (as described in the fund’s Statement of Additional Information) (1995-Present)
Other Public Company Board Memberships During Past 5 Years:
· CBIZ, Inc., a public company providing professional business services, products and solutions, Director (1997-May 2023)
No. of Portfolios for which Board Member Serves: 86
———————
Peggy C. Davis (80)
Board Member (2012)
Principal Occupation During Past 5 Years:
· Shad Professor of Law, New York University School of Law (1983-Present)
No. of Portfolios for which Board Member Serves: 29
———————
Gina D. France (65)
Board Member (2019)
Principal Occupation During Past 5 Years:
· France Strategic Partners, a strategy and advisory firm serving corporate clients across the United States, Founder, President and Chief Executive Officer (2003-Present)
Other Public Company Board Memberships During Past 5 Years:
· Huntington Bancshares, a bank holding company headquartered in Columbus, Ohio, Director (2016-Present)
· Cedar Fair, L.P., a publicly-traded partnership that owns and operates amusement parks and hotels in the U.S. and Canada, Director (2011-May 2023)
· CBIZ, Inc., a public company providing professional business services, products and solutions, Director (2015-Present)
No. of Portfolios for which Board Member Serves: 22
———————
Joan Gulley (76)
Board Member (2017)
Principal Occupation During Past 5 Years:
· Nantucket Atheneum, public library, Chair (June 2018-June 2021) and Director (2015-June 2021)
· Orchard Island Club, golf and beach club, Governor (2016-Present) and President (February 2023-Present)
No. of Portfolios for which Board Member Serves: 39
———————
31
BOARD MEMBERS INFORMATION (Unaudited) (continued)
Robin A. Melvin (60)
Board Member (2011)
Principal Occupation During Past 5 Years:
· Westover School, a private girls’ boarding school in Middlebury, Connecticut, Trustee (2019-June 2023)
· Mentor Illinois, a non-profit organization dedicated to increasing the quantity and quality of mentoring services in Illinois, Co-Chair (2014–2020); Board Member (2013-2020)
· JDRF, a non-profit juvenile diabetes research foundation, Board Member (June 2021-June 2022)
Other Public Company Board Memberships During Past 5 Years:
· HPS Corporate Lending Fund, a closed-end management investment company regulated as a business development company, Trustee (August 2021-Present)
No. of Portfolios for which Board Member Serves: 68
———————
Michael D. DiLecce (61)
Advisory Board Member (2022)
Principal Occupation During Past 5 Years:
· Retired since July 2022. Global Asset Management Assurance Leader, Ernst & Young LLP (2015-2022)
· Americas Regional Talent Managing Partner for Ernst & Young’s Financial Service Practice (2017-2021)
· Partner, Ernst & Young LLP (1997-2022)
No. of Portfolios for which Board Member Serves: 22
———————
The address of the Board Members and Officers is c/o BNY Mellon Investment Adviser, Inc., 240 Greenwich Street, New York, New York 10286. Additional information about each Board Member is available in the fund’s Statement of Additional Information which can be obtained from the Adviser free of charge by calling this toll free number: 1-800-373-9387.
32
OFFICERS OF THE FUND (Unaudited)
DAVID DIPETRILLO, President since January 2021.
Vice President and Director of the Adviser since February 2021; Head of North America Distribution, BNY Mellon Investment Management since February 2023; and Head of North America Product, BNY Mellon Investment Management from January 2018 to February 2023. He is an officer of 53 investment companies (comprised of 102 portfolios) managed by the Adviser or an affiliate of the Adviser. He is 45 years old and has been an employee of BNY Mellon since 2005.
JAMES WINDELS, Treasurer since November 2001.
Director of the Adviser since February 2023; Vice President of the Adviser since September 2020; and Director–BNY Mellon Fund Administration. He is an officer of 54 investment companies (comprised of 121 portfolios) managed by the Adviser or an affiliate of the Adviser. He is 65 years old and has been an employee of the Adviser since April 1985.
PETER M. SULLIVAN, Chief Legal Officer since July 2021 and Vice President and Assistant Secretary since March 2019.
Chief Legal Officer of the Adviser and Associate General Counsel of BNY Mellon since July 2021; Senior Managing Counsel of BNY Mellon from December 2020 to July 2021; and Managing Counsel of BNY Mellon from March 2009 to December 2020. He is an officer of 54 investment companies (comprised of 121 portfolios) managed by the Adviser or an affiliate of the Adviser. He is 55 years old and has been an employee of BNY Mellon since April 2004.
JAMES BITETTO, Vice President since August 2005 and Secretary since February 2018.
Senior Managing Counsel of BNY Mellon since December 2019; Managing Counsel of BNY Mellon from April 2014 to December 2019; and Secretary of the Adviser. He is an officer of 54 investment companies (comprised of 121 portfolios) managed by the Adviser or an affiliate of the Adviser. He is 57 years old and has been an employee of the Adviser since December 1996.
DEIRDRE CUNNANE, Vice President and Assistant Secretary since March 2019.
Managing Counsel of BNY Mellon since December 2021; and Counsel of BNY Mellon from August 2018 to December 2021. She is an officer of 54 investment companies (comprised of 121 portfolios) managed by the Adviser or an affiliate of the Adviser. She is 33 years old and has been an employee of BNY Mellon since August 2013.
SARAH S. KELLEHER, Vice President and Assistant Secretary since April 2014.
Vice President of BNY Mellon ETF Investment Adviser; LLC since February 2020; Senior Managing Counsel of BNY Mellon since September 2021; and Managing Counsel of BNY Mellon from December 2017 to September 2021. She is an officer of 54 investment companies (comprised of 121 portfolios) managed by the Adviser or an affiliate of the Adviser. She is 48 years old and has been an employee of BNY Mellon since March 2013.
JEFF PRUSNOFSKY, Vice President and Assistant Secretary since August 2005.
Senior Managing Counsel of BNY Mellon. He is an officer of 54 investment companies (comprised of 121 portfolios) managed by the Adviser or an affiliate of the Adviser. He is 58 years old and has been an employee of the Adviser since October 1990.
AMANDA QUINN, Vice President and Assistant Secretary since March 2020.
Counsel of BNY Mellon since June 2019; Regulatory Administration Manager at BNY Mellon Investment Management Services from September 2018 to May 2019. She is an officer of 54 investment companies (comprised of 121 portfolios) managed by the Adviser or an affiliate of the Adviser. She is 38 years old and has been an employee of BNY Mellon since June 2012.
JOANNE SKERRETT, Vice President and Assistant Secretary since March 2023.
Managing Counsel of BNY Mellon since June 2022; and Senior Counsel with the Mutual Fund Directors Forum, a leading funds industry organization, from 2016 to June 2022. She is an officer of 54 investment companies (comprised of 121 portfolios) managed by the Adviser or an affiliate of the Adviser. She is 51 years old and has been an employee of the Adviser since June 2022.
33
OFFICERS OF THE FUND (Unaudited) (continued)
NATALYA ZELENSKY, Vice President and Assistant Secretary since March 2017.
Chief Compliance Officer since August 2021 and Vice President since February 2020 of BNY Mellon ETF Investment Adviser, LLC; Chief Compliance Officer since August 2021 and Vice President and Assistant Secretary since February 2020 of BNY Mellon ETF Trust; Managing Counsel of BNY Mellon from December 2019 to August 2021; Counsel of BNY Mellon from May 2016 to December 2019; and Assistant Secretary of the Adviser from April 2018 to August 2021. She is an officer of 54 investment companies (comprised of 121 portfolios) managed by the Adviser or an affiliate of the Adviser. She is 38 years old and has been an employee of BNY Mellon since May 2016.
DANIEL GOLDSTEIN, Vice President since March 2022.
Head of Product Development of North America Distribution, BNY Mellon Investment Management since January 2018; Executive Vice President of North America Product, BNY Mellon Investment Management since April 2023; and Senior Vice President, Development & Oversight of North America Product, BNY Mellon Investment Management from 2010 to March 2023. He is an officer of 53 investment companies (comprised of 102 portfolios) managed by the Adviser or an affiliate of the Adviser. He is 54 years old and has been an employee of the Distributor since 1991.
JOSEPH MARTELLA, Vice President since March 2022.
Vice President of the Adviser since December 2022; Head of Product Management of North America Distribution, BNY Mellon Investment Management since January 2018; Executive Vice President of North America Product, BNY Mellon Investment Management since April 2023; and Senior Vice President of North America Product, BNY Mellon Investment Management from 2010 to March 2023. He is an officer of 53 investment companies (comprised of 102 portfolios) managed by the Adviser or an affiliate of the Adviser. He is 47 years old and has been an employee of the Distributor since 1999.
GAVIN C. REILLY, Assistant Treasurer since December 2005.
Tax Manager–BNY Mellon Fund Administration. He is an officer of 54 investment companies (comprised of 121 portfolios) managed by the Adviser or an affiliate of the Adviser. He is 55 years old and has been an employee of the Adviser since April 1991.
ROBERT SALVIOLO, Assistant Treasurer since July 2007.
Senior Accounting Manager–BNY Mellon Fund Administration. He is an officer of 54 investment companies (comprised of 121 portfolios) managed by the Adviser or an affiliate of the Adviser. He is 56 years old and has been an employee of the Adviser since June 1989.
ROBERT SVAGNA, Assistant Treasurer since December 2002.
Senior Accounting Manager–BNY Mellon Fund Administration. He is an officer of 54 investment companies (comprised of 121 portfolios) managed by the Adviser or an affiliate of the Adviser. He is 56 years old and has been an employee of the Adviser since November 1990.
JOSEPH W. CONNOLLY, Chief Compliance Officer since October 2004.
Chief Compliance Officer of the BNY Mellon Family of Funds and BNY Mellon Funds Trust since 2004; and Chief Compliance Officer of the Adviser from 2004 until June 2021. He is the Chief Compliance Officer of 53 investment companies (comprised of 105 portfolios) managed by the Adviser. He is 66 years old.
CARIDAD M. CAROSELLA, Anti-Money Laundering Compliance Officer since January 2016.
Anti-Money Laundering Compliance Officer of the BNY Mellon Family of Funds and BNY Mellon Funds Trust. She is an officer of 47 investment companies (comprised of 114 portfolios) managed by the Adviser or an affiliate of the Adviser. She is 55 years old and has been an employee of the Distributor since 1997.
34
This page intentionally left blank.
35
This page intentionally left blank.
36
This page intentionally left blank.
37
BNY Mellon Diversified International Fund
240 Greenwich Street
New York, NY 10286
Adviser
BNY Mellon Investment Adviser, Inc.
240 Greenwich Street
New York, NY 10286
Custodian
The Bank of New York Mellon
240 Greenwich Street
New York, NY 10286
Transfer Agent &
Dividend Disbursing Agent
BNY Mellon Transfer, Inc.
240 Greenwich Street
New York, NY 10286
Distributor
BNY Mellon Securities Corporation
240 Greenwich Street
New York, NY 10286
Ticker Symbol: | Class A: DFPAX Class C: DFPCX Class I: DFPIX Class Y: DDIFX |
Telephone Call your financial representative or 1-800-373-9387
Mail The BNY Mellon Family of Funds, 144 Glenn Curtiss Boulevard, Uniondale, NY 11556-0144
E-mail Send your request to info@bnymellon.com
Internet Information can be viewed online or downloaded at www.im.bnymellon.com
The fund files its complete schedule of portfolio holdings with the Securities and Exchange Commission (“SEC”) for the first and third quarters of each fiscal year on Form N-PORT. The fund’s Forms N-PORT are available on the SEC’s website at www.sec.gov.
A description of the policies and procedures that the fund uses to determine how to vote proxies relating to portfolio securities and information regarding how the fund voted these proxies for the most recent 12-month period ended June 30 is available at www.im.bnymellon.com and on the SEC’s website at www.sec.gov and without charge, upon request, by calling 1-800-373-9387.
© 2023 BNY Mellon Securities Corporation |
|

Item 2. Code of Ethics.
The Registrant has adopted a code of ethics that applies to the Registrant's principal executive officer, principal financial officer, principal accounting officer or controller, or persons performing similar functions. There have been no amendments to, or waivers in connection with, the Code of Ethics during the period covered by this Report.
Item 3. Audit Committee Financial Expert.
The Registrant's Board has determined that Gina D. France, a member of the Audit Committee of the Board, is an audit committee financial expert as defined by the Securities and Exchange Commission (the "SEC"). Gina D. France is "independent" as defined by the SEC for purposes of audit committee financial expert determinations.
Item 4. Principal Accountant Fees and Services.
(a) Audit Fees. The aggregate fees billed for each of the last two fiscal years (the "Reporting Periods") for professional services rendered by the Registrant's principal accountant (the "Auditor") for the audit of the Registrant's annual financial statements or services that are normally provided by the Auditor in connection with the statutory and regulatory filings or engagements for the Reporting Periods, were $84,000 in 2022 and $85,680 in 2023.
(b) Audit-Related Fees. The aggregate fees billed in the Reporting Periods for assurance and related services by the Auditor that are reasonably related to the performance of the audit of the Registrant's financial statements and are not reported under paragraph (a) of this Item 4 were $18,616 in 2022 and $18,713 in 2023. These services consisted of one or more of the following: (i) agreed upon procedures related to compliance with Internal Revenue Code section 817(h), (ii) security counts required by Rule 17f-2 under the Investment Company Act of 1940, as amended, (iii) advisory services as to the accounting or disclosure treatment of Registrant transactions or events and (iv) advisory services to the accounting or disclosure treatment of the actual or potential impact to the Registrant of final or proposed rules, standards or interpretations by the Securities and Exchange Commission, the Financial Accounting Standards Boards or other regulatory or standard-setting bodies.
The aggregate fees billed in the Reporting Periods for non-audit assurance and related services by the Auditor to the Registrant's investment adviser (not including any sub-investment adviser whose role is primarily portfolio management and is subcontracted with or overseen by another investment adviser), and any entity controlling, controlled by or under common control with the investment adviser that provides ongoing services to the Registrant ("Service Affiliates"), that were reasonably related to the performance of the annual audit of the Service Affiliate, which required pre-approval by the Audit Committee were $0 in 2022 and $0 in 2023.
(c) Tax Fees. The aggregate fees billed in the Reporting Periods for professional services rendered by the Auditor for tax compliance, tax advice, and tax planning ("Tax Services") were $9,526 in 2022 and $9,526 in 2023. These services consisted of: (i) review or preparation of U.S. federal, state, local and excise tax returns; (ii) U.S. federal, state and local tax planning, advice and assistance regarding statutory, regulatory or administrative developments; (iii) tax advice regarding tax qualification matters and/or treatment of various financial instruments held or proposed to be acquired or held, and (iv) determination of Passive Foreign Investment Companies. The aggregate fees billed in the Reporting Periods for Tax Services by the Auditor to Service Affiliates, which required pre-approval by the Audit Committee were $13,474 in 2022 and $13,474 in 2023.
(d) All Other Fees. The aggregate fees billed in the Reporting Periods for products and services provided by the Auditor, other than the services reported in paragraphs (a) through (c) of this Item, were $179 in 2022 and $185 in 2023. These services consisted of a review of the Registrant's anti-money laundering program.
The aggregate fees billed in the Reporting Periods for Non-Audit Services by the Auditor to Service Affiliates, other than the services reported in paragraphs (b) through (c) of this Item, which required pre-approval by the Audit Committee, were $0 in 2022 and $ 0 in 2023.
(e)(1) Audit Committee Pre-Approval Policies and Procedures. The Registrant's Audit Committee has established policies and procedures (the "Policy") for pre-approval (within specified fee limits) of the Auditor's engagements for non-audit services to the Registrant and Service Affiliates without specific case-by-case consideration. The pre-approved services in the Policy can include pre-approved audit services, pre-approved audit-related services, pre-approved tax services and pre-approved all other services. Pre-approval considerations include whether the proposed services are compatible with maintaining the Auditor's independence. Pre-approvals pursuant to the Policy are considered annually.
(e)(2) Note. None of the services described in paragraphs (b) through (d) of this Item 4 were approved by the Audit Committee pursuant to paragraph (c)(7)(i)(C) of Rule 2-01 of Regulation S-X.
(f) None of the hours expended on the principal accountant's engagement to audit the registrant's financial statements for the most recent fiscal year were attributed to work performed by persons other than the principal accountant's full-time, permanent employees.
Non-Audit Fees. The aggregate non-audit fees billed by the Auditor for services rendered to the Registrant, and rendered to Service Affiliates, for the Reporting Periods were $2,189,735 in 2022 and $1,779,328 in 2023.
Auditor Independence. The Registrant's Audit Committee has considered whether the provision of non-audit services that were rendered to Service Affiliates, which were not pre-approved (not requiring pre-approval), is compatible with maintaining the Auditor's independence.
| (i) | Not applicable. |
(j) Not applicable.
Item 5. Audit Committee of Listed Registrants.
Not applicable.
Item 6. Investments.
| Item 7. | Disclosure of Proxy Voting Policies and Procedures for Closed-End Management Investment Companies. |
Not applicable.
Item 8. Portfolio Managers of Closed-End Management Investment Companies.
Not applicable.
| Item 9. | Purchases of Equity Securities by Closed-End Management Investment Companies and Affiliated Purchasers. |
Not applicable.
| Item 10. | Submission of Matters to a Vote of Security Holders. |
There have been no material changes to the procedures applicable to Item 10.
| Item 11. | Controls and Procedures. |
(a) The Registrant's principal executive and principal financial officers have concluded, based on their evaluation of the Registrant's disclosure controls and procedures as of a date within 90 days of the filing date of this report, that the Registrant's disclosure controls and procedures are reasonably designed to ensure that information required to be disclosed by the Registrant on Form N-CSR is recorded, processed, summarized and reported within the required time periods and that information required to be disclosed by the Registrant in the reports that it files or submits on Form N-CSR is accumulated and communicated to the Registrant's management, including its principal executive and principal financial officers, as appropriate to allow timely decisions regarding required disclosure.
(b) There were no changes to the Registrant's internal control over financial reporting that occurred during the period covered by this report that have materially affected, or are reasonably likely to materially affect, the Registrant's internal control over financial reporting.
| Item 12. | Disclosure of Securities Lending Activities for Closed-End Management Investment Companies. |
Not applicable.
| Item 13. | Exhibits. |
(a)(1) Code of ethics referred to in Item 2.
(a)(3) Not applicable.
SIGNATURES
Pursuant to the requirements of the Securities Exchange Act of 1934 and the Investment Company Act of 1940, the Registrant has duly caused this Report to be signed on its behalf by the undersigned, thereunto duly authorized.
BNY Mellon Investment Funds V, Inc.
By: /s/ David J. DiPetrillo
David J. DiPetrillo
President (Principal Executive Officer)
Date: December 19, 2023
Pursuant to the requirements of the Securities Exchange Act of 1934 and the Investment Company Act of 1940, this Report has been signed below by the following persons on behalf of the Registrant and in the capacities and on the dates indicated.
By: /s/ David J. DiPetrillo
David J. DiPetrillo
President (Principal Executive Officer)
Date: December 19, 2023
By: /s/ James Windels
James Windels
Treasurer (Principal Financial Officer)
Date: December 19, 2023
EXHIBIT INDEX
(a)(1) Code of ethics referred to in Item 2.
(a)(2) Certifications of principal executive and principal financial officers as required by Rule 30a-2(a) under the Investment Company Act of 1940. (EX-99.CERT)
(b) Certification of principal executive and principal financial officers as required by Rule 30a-2(b) under the Investment Company Act of 1940. (EX-99.906CERT)