Exhibit 99.2
Fourth Quarter and Full Year 2019 Financial Review and Analysis 1 January 29, 2020 Supplemental Presentation Materials Unless otherwise indicated, comparisons are to the same periods in the prior year. January 29, 2020 Fourth Quarter and Full Year 2019 Financial Review and Analysis (preliminary, unaudited)
Safe Harbor Statement Certain statements contained in this document are "forward - looking statements" intended to qualify for the safe harbor from liab ility established by the Private Securities Litigation Reform Act of 1995. These forward - looking statements, and financial or other business targets, are subject to certain risks and uncertainties. We believe that the most significant risk factors that could affect our financial performance in the near - term in clude: (1) the impacts to underlying demand for our products and/or foreign currency fluctuations from global economic conditions, political uncertainty, and chan ges in governmental regulations; (2) competitors' actions, including pricing, expansion in key markets, and product offerings; (3) the degree to whi ch higher costs can be offset with productivity measures and/or passed on to customers through selling price increases, without a significant loss o f v olume; and (4) the execution and integration of acquisitions . Actual results and trends may differ materially from historical or anticipated results depending on a variety of factors, including but are not limited to, risks and uncertainties relating to the following: fluctuations in demand affecting sales to customers; worldwide and local economic co ndi tions; changes in political conditions; changes in governmental laws and regulations; fluctuations in foreign currency exchange rates and other risks ass oci ated with foreign operations, including in emerging markets; the financial condition and inventory strategies of customers; changes in our markets due to c omp etitive conditions, technological developments, laws and regulations, and customer preferences; fluctuations in cost and availability of raw mate ria ls; our ability to generate sustained productivity improvement; our ability to achieve and sustain targeted cost reductions; the impact of competitive pr odu cts and pricing; loss of significant contracts or customers; collection of receivables from customers; selling prices; business mix shift; execution and integrati on of acquisitions; timely development and market acceptance of new products, including sustainable or sustainably - sourced products; investment in development activiti es and new production facilities; amounts of future dividends and share repurchases; customer and supplier concentrations; successful implementatio n o f new manufacturing technologies and installation of manufacturing equipment; disruptions in information technology systems, including cyber - attacks or other intrusions to network security; successful installation of new or upgraded information technology systems; data security breaches; volatility of fi nan cial markets; impairment of capitalized assets, including goodwill and other intangibles; credit risks; our ability to obtain adequate financing arrangem ent s and maintain access to capital; fluctuations in interest and tax rates; changes in tax laws and regulations, including the U.S. Tax Cuts and Jobs Act (“TCJA” ), and regulations issued hereto, and uncertainties associated with interpretations of such laws and regulations; outcome of tax audits; fluctuations in pensio n, insurance, and employee benefit costs; the impact of legal and regulatory proceedings, including with respect to environmental, health and safety; protection an d infringement of intellectual property; the impact of epidemiological events on the economy and our customers and suppliers; acts of war, terrorism, and na tur al disasters; and other factors. For a more detailed discussion of these and other factors, see “Risk Factors” and “Management’s Discussion and Analysis of Result s o f Operations and Financial Condition” in our 2018 Form 10 - K, filed with the Securities and Exchange Commission on February 27, 2019 and subsequen t quarterly reports on Form 10 - Q. The forward - looking statements included in this document are made only as of the date of this document, and we undert ake no obligation to update these statements to reflect subsequent events or circumstances, other than as may be required by law.
Use of Non - GAAP Financial Measures This presentation contains certain non - GAAP financial measures as defined by SEC rules. We report our financial results in conf ormity with accounting principles generally accepted in the United States of America, or GAAP, and also communicate with investors using certain non - GAAP financial measures. These non - GAAP financial measures are not in acc ordance with, nor are they a substitute for or superior to, the comparable GAAP financial measures. These non - GAAP financial measures are intended to supplement presentation of our financial results that are prepared in accordance with GAAP. Based upon feedback from investors and financial analysts, we believe that the supplemental non - GAAP financial measures we provide are useful to their assessment of our performance and opera ting trends, as well as liquidity. In accordance with Regulations G and S - K, reconciliations of non - GAAP financial measures to the most directly comparable GAAP financial measures, including limitations associated with these non - GAAP financial measures, are provided in the financial schedules accompanying the earnings news release for the quarter (see Attachments A - 4 through A - 8 to news release dated January 29, 2020). Our non - GAAP financial measures exclude the impact of certain events, activities or strategic decisions. The accounting effects of these events, activities or decisions, which are included in the GAAP fina nci al measures, may make it difficult to assess our underlying performance in a single period. By excluding the accounting effects, both positiv e o r negative, of certain items (e.g., restructuring charges, legal settlements, certain effects of strategic transactions and related costs, losses from debt extinguishments , gains or losses from curtailment or settlement of pension obligations, gains or losses on sales of certain assets, and other items), we believe that we are providing meaningful supplemental information that facilitates an understanding of our core operating results and liquidity m eas ures. These non - GAAP financial measures are used internally to evaluate trends in our underlying performance, as well as to facilitate comparison to the results of competitors for a single period. While some of the items w e e xclude from GAAP financial measures recur, they tend to be disparate in amount, frequency, or timing. We use the following non - GAAP financial measures in this presentation: • Sales change ex. currency refers to the increase or decrease in net sales excluding the estimated impact of foreign currency translation, and, where applicabl e, currency adjustment for transitional reporting of highly inflationary economies (Argentina). Segment results are also adjusted for the reclassification of sales between segments. The es timated impact of foreign currency translation is calculated on a constant currency basis, with prior period results translated at current period average exchange rates to exclude the effect of currency fluctuations. • Organic sales change refers to sales change ex. c urrency, excluding the estimated impact of product line exits, acquisitions and divestitures, and, where applicable, the extra week in our fiscal year. We believe that sales change ex. currency and organic sales change assist investors in evaluating the sales change from the o ngo ing activities of our businesses and enhance their ability to evaluate our results from period to period. • Adjusted operating income refers to income before taxes, interest expense, other non - operating expense, and other expense, net. • Adjusted operating margin refers to adjusted operating income as a percentage of net sales. • Adjusted tax rate refers to the full - year GAAP tax rate, adjusted to exclude certain unusual or infrequent events that are expected to significant ly impact that rate, such as impacts related to the enactment of the U.S. Tax Cuts and Jobs Act (“TCJA”) and our U.S. pension plan termination, effects of certain discrete tax planning actions, and other item s. • Adjusted net income refers to income before taxes, tax - effected at the adjusted tax rate, and adjusted for tax - effected restructuring charges and ot her items. • Adjusted net income per common share, assuming dilution (adjusted EPS) refers to adjusted net income divided by weighted average number of common shares outstanding, assuming dilution . • Adjusted EPS change, constant currency basis refers to the change in adjusted EPS, as a percent of prior year adjusted EPS, excluding the estimated impact of foreign curr enc y translation. We believe that adjusted operating margin, adjusted net income, and adjusted EPS assist investors in understanding our core o per ating trends and comparing our results with those of our competitors. • Adjusted EBITDA refers to income before taxes adjusted for interest expense, other non - operating expense, depreciation and amortization, exclud ing restructuring charges and other items. • Net debt to adjusted EBITDA ratio refers to total debt (including capital leases) less cash and cash equivalents, divided by adjusted EBITDA. We believe th at the net debt to adjusted EBITDA ratio assists investors in assessing our leverage position. • Return on total capital (ROTC) refers to income from continuing operations excluding the expense and tax benefit of debt financing divided by the average of be ginning and ending invested capital. Adjusted ROTC refers to ROTC adjusted for the impact of the TCJA and pension plan settlements. We believe that ROTC and adjusted ROTC assist investors in understanding our ability to generate returns fr om our capital. • Free cash flow refers to cash flow provided by operating activities, less payments for property, plant and equipment, software and other def err ed charges, plus proceeds from sales of property, plant and equipment, plus (minus) net proceeds from insurance and sales (purchases) of investments. Free cash flow is also adjusted for the cash contri but ions related to the termination of our U.S. pension plan. We believe that free cash flow assists investors by showing the amount of cash we have available for debt reductions, dividends, share repurchases, and acquisitions . This document has been furnished (not filed) on Form 8 - K with the SEC and may be found on our website at www.investors.averydenn ison.com.
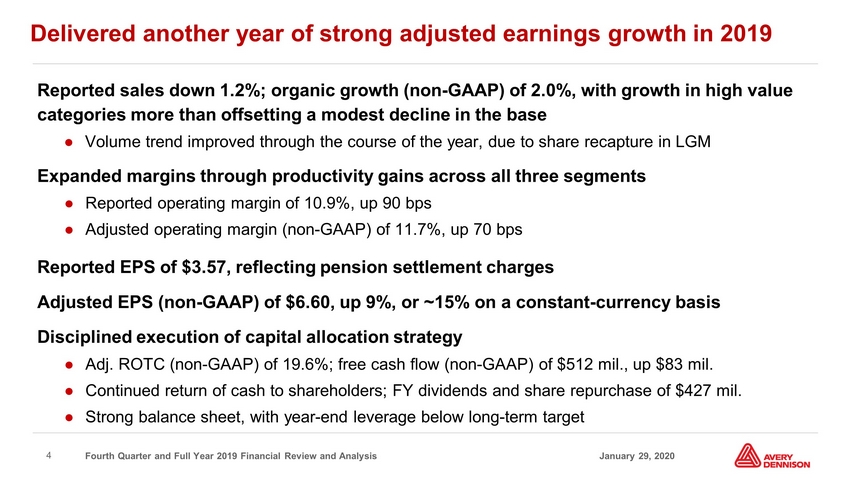
Fourth Quarter and Full Year 2019 Financial Review and Analysis 4 January 29, 2020 Delivered another year of strong adjusted earnings growth in 2019 Reported sales down 1 .2%; organic growth (non - GAAP) of 2.0%, with growth in high value categories more than offsetting a modest decline in the base ● Volume trend improved through the course of the year, due to share recapture in LGM Expanded margins through productivity gains across all three segments ● Reported operating margin of 10.9%, up 90 bps ● Adjusted operating margin (non - GAAP) of 11.7%, up 70 bps Reported EPS of $3.57, reflecting pension settlement charges Adjusted EPS (non - GAAP) of $6.60, up 9%, or ~15% on a constant - currency basis Disciplined execution of capital allocation strategy ● Adj. ROTC (non - GAAP) of 19.6%; free cash flow (non - GAAP) of $512 mil., up $83 mil. ● Continued return of cash to shareholders; FY dividends and share repurchase of $427 mil. ● Strong balance sheet, with year - end leverage below long - term target
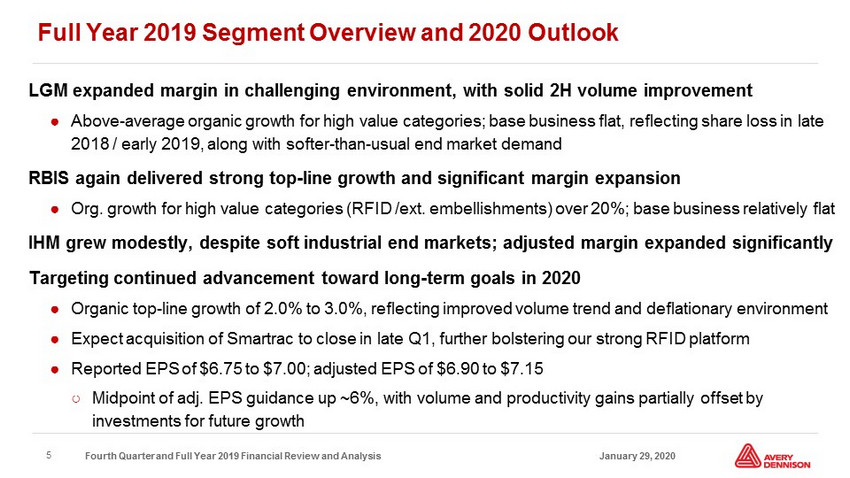
Fourth Quarter and Full Year 2019 Financial Review and Analysis 5 January 29, 2020 F u ll Year 2019 Segment Overview and 2020 Outlook LGM expanded margin in challenging environment, with solid 2H volume improvement ● Above - average organic growth for high value categories; base business flat, reflecting share loss in late 2018 / early 2019, along with softer - than - usual end market demand RBIS again delivered strong top - line growth and significant margin expansion ● Org. growth for high value categories (RFID /ext. embellishments) of ~20%; base business relatively flat IHM grew modestly, despite soft industrial end markets; adjusted margin expanded significantly Targeting continued advancement toward long - term goals in 2020 ● Organic top - line growth of 2.0% to 3.5%, reflecting improved volume trend and deflationary environment ● Expect acquisition of Smartrac to close in late Q1, further bolstering our strong RFID platform ● Reported EPS of $[6.75] to $[7.05]; a djusted EPS of $[6.90] to $[7.20] ○ Midpoint of adj. EPS guidance up ~7%, with volume and productivity gains partially offset by investments for future growth

Fourth Quarter and Full Year 2019 Financial Review and Analysis 6 January 29, 2020 Full Year Segment Sales and Margin Analysis FY19 Reported Organic Sales Change : Label and Graphic Materials (2.2%) 1.2% Retail Branding and Information Solutions 2.3% 5.1% Industrial and Healthcare Materials (3.0%) 0.4% Total Company (1.2%) 2.0% Reported Adjusted (Non - GAAP) FY19 FY18 FY19 FY18 Operating Margin : Label and Graphic Materials 12.7% 11.7% 13.3% 13.0% Retail Branding and Information Solutions 11.9% 10.6% 12.5% 11.3% Industrial and Healthcare Materials 8.9% 9.1% 10.3% 8.9% Total Company 10.9% 10.0% 11.7% 11.0%
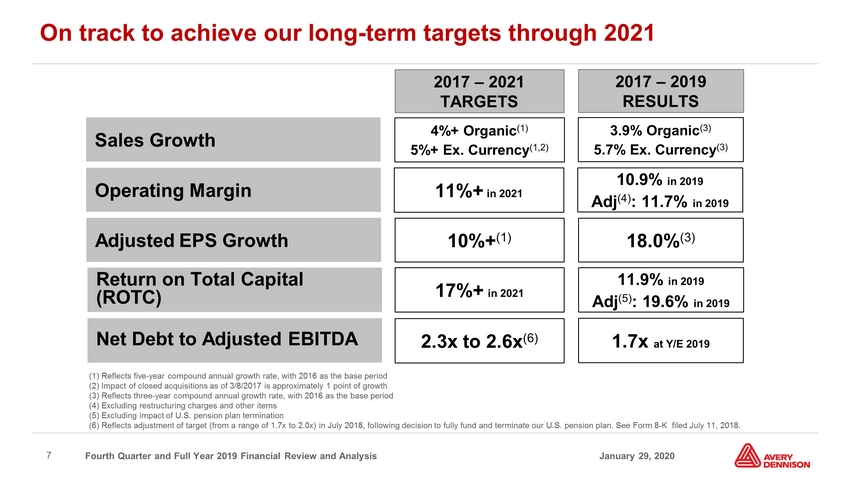
Fourth Quarter and Full Year 2019 Financial Review and Analysis 7 January 29, 2020 Sales Growth Adjusted EPS Growth Return on Total Capital (ROTC ) 3.9% Organic (3) 5.7 % Ex. Currency (3) 2017 – 2019 RESULTS (1) Reflects five - year compound annual growth rate, with 2016 as the base period (2) Impact of closed acquisitions as of 3/8/2017 is approximately 1 point of growth (3) Reflects three - year compound annual growth rate, with 2016 as the base period (4) Excluding restructuring charges and other items (5) Excluding impact of U.S. pension plan termination (6) Reflects adjustment of target (from a range of 1.7x to 2.0x) in July 2018, following decision to fully fund and terminate our U. S. pension p lan. See Form 8 - K filed July 11, 2018. 4%+ Organic (1) 5 %+ Ex. Currency (1,2) 10 %+ ( 1) 17%+ in 2021 2017 – 2021 TARGETS Operating Margin 10.9% in 2019 Adj (4) : 11.7% in 2019 11 %+ in 2021 Net Debt to Adjusted EBITDA 1.7x at Y/E 2019 2.3x to 2.6x (6) 18.0% (3) On track to achieve our long - term targets through 2021 11.9% in 2019 Adj (5) : 19.6% in 2019
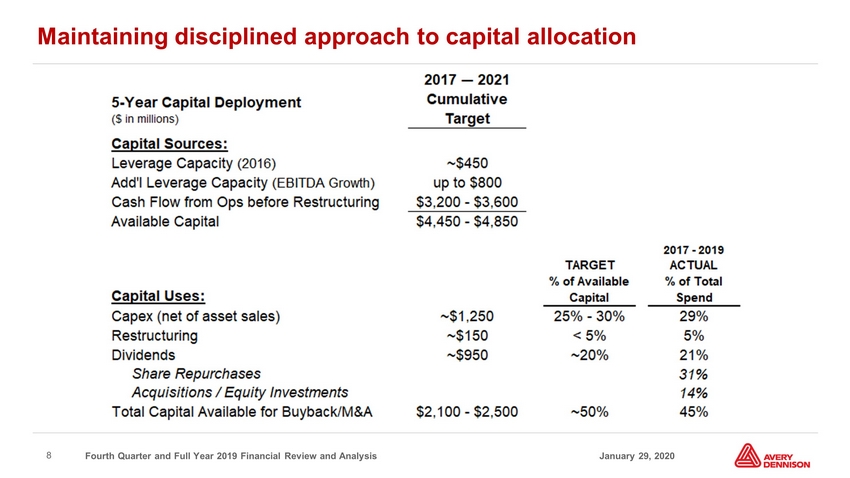
Fourth Quarter and Full Year 2019 Financial Review and Analysis 8 January 29, 2020 Maintaining disciplined approach to capital allocation

Fourth Quarter and Full Year 2019 Financial Review and Analysis 9 January 29, 2020 F ourth Quarter Overview Fourth quarter r eported EPS of $1.92 (comparison to prior year not meaningful primarily due to Q4 - 18 impact of pension plan termination) Adj . EPS of $1.73, up 14% Reported sales of $1.77 bil., up 0.2% compared to prior year ● Organic sales growth of 2.1%, with enterprise - wide RFID contributing roughly one point of growth Reported operating margin decreased 80 bps to 10.2%, reflecting higher restructuring charges associated with next wave of productivity initiatives ● Adjusted operating margin increased 80 bps to 11.9%, primarily due to productivity gains and the net impact of raw material deflation and pricing, partially offset by higher employee - related costs
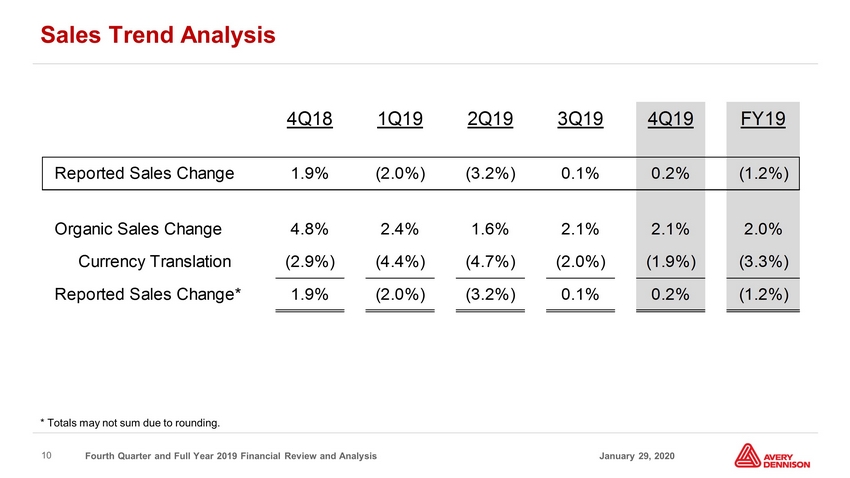
Fourth Quarter and Full Year 2019 Financial Review and Analysis 10 January 29, 2020 Sales Trend Analysis * Totals may not sum due to rounding. 4Q18 1Q19 2Q19 3Q19 4Q19 FY19 Reported Sales Change 1.9% (2.0%) (3.2%) 0.1% 0.2% (1.2%) Organic Sales Change 4.8% 2.4% 1.6% 2.1% 2.1% 2.0% Currency Translation (2.9%) (4.4%) (4.7%) (2.0%) (1.9%) (3.3%) Reported Sales Change* 1.9% (2.0%) (3.2%) 0.1% 0.2% (1.2%)
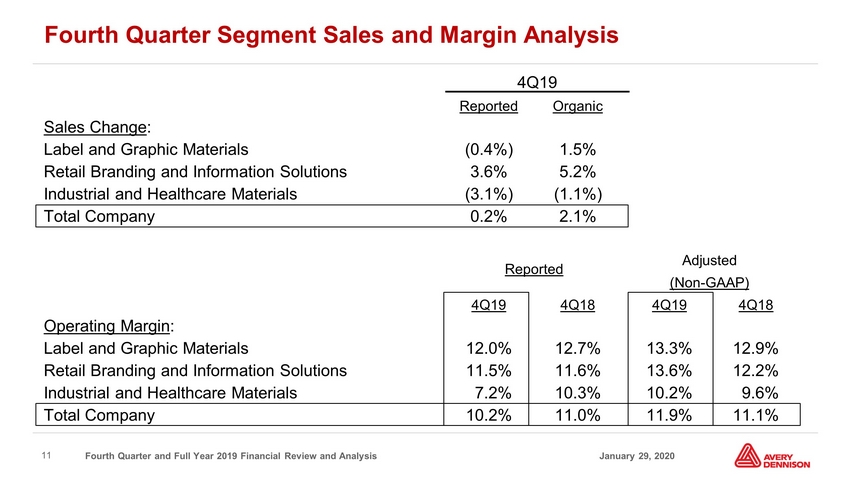
Fourth Quarter and Full Year 2019 Financial Review and Analysis 11 January 29, 2020 Fourth Quarter Segment Sales and Margin Analysis 4Q19 Reported Organic Sales Change : Label and Graphic Materials (0.4%) 1.5% Retail Branding and Information Solutions 3.6% 5.2% Industrial and Healthcare Materials (3.1%) (1.1%) Total Company 0.2% 2.1% Reported Adjusted (Non - GAAP) 4Q19 4Q18 4Q19 4Q18 Operating Margin : Label and Graphic Materials 12.0% 12.7% 13.3% 12.9% Retail Branding and Information Solutions 11.5% 11.6% 13.6% 12.2% Industrial and Healthcare Materials 7.2% 10.3% 10.2% 9.6% Total Company 10.2% 11.0% 11.9% 11.1%
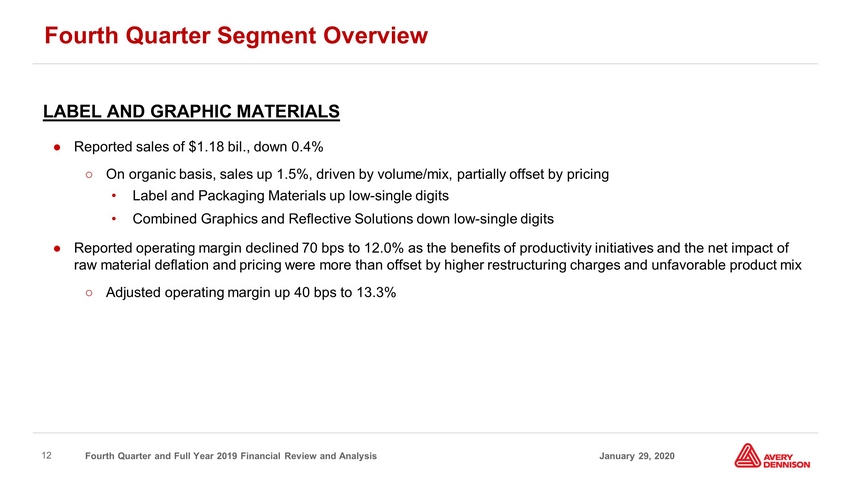
Fourth Quarter and Full Year 2019 Financial Review and Analysis 12 January 29, 2020 LABEL AND GRAPHIC MATERIALS ● Reported sales of $ 1.18 bil., down 0.4% ○ On organic basis, sales up 1.5%, driven by volume/mix, partially offset by pricing • Label and Packaging Materials up low - single digits • Combined Graphics and Reflective Solutions down low - single digits ● Reported operating margin declined 70 bps to 12.0% as the benefits of productivity initiatives and the net impact of raw material deflation and pricing were more than offset by higher restructuring charges and unfavorable product mix ○ Adjusted operating margin up 40 bps to 13.3% Fourth Quarter Segment Overview
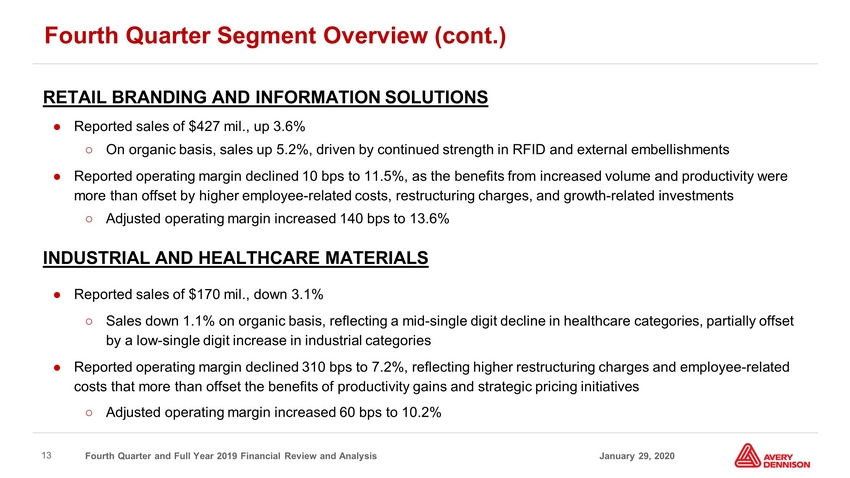
Fourth Quarter and Full Year 2019 Financial Review and Analysis 13 January 29, 2020 RETAIL BRANDING AND INFORMATION SOLUTIONS ● Reported sales of $427 mil., up 3.6% ○ On organic basis, sales up 5.2 %, driven by continued strength in RFID and external embellishments ● Reported operating margin declined 10 bps to 11.5%, as the benefits from increased volume and productivity were more than offset by higher employee - related costs, restructuring charges, and growth - related investments ○ Adjusted operating margin increased 140 bps to 13.6% INDUSTRIAL AND HEALTHCARE MATERIALS ● Reported sales of $170 mil., down 3.1% ○ Sales down 1.1% on organic basis, reflecting a mid - single digit decline in healthcare categories, partially offset by a low - single digit increase in industrial categories ● Reported operating margin declined 310 bps to 7.2%, reflecting higher restructuring charges and employee - related costs that more than offset the benefits of productivity gains and strategic pricing initiatives ○ Adjusted operating margin increased 60 bps to 10.2% Fourth Quarter Segment Overview (cont.)
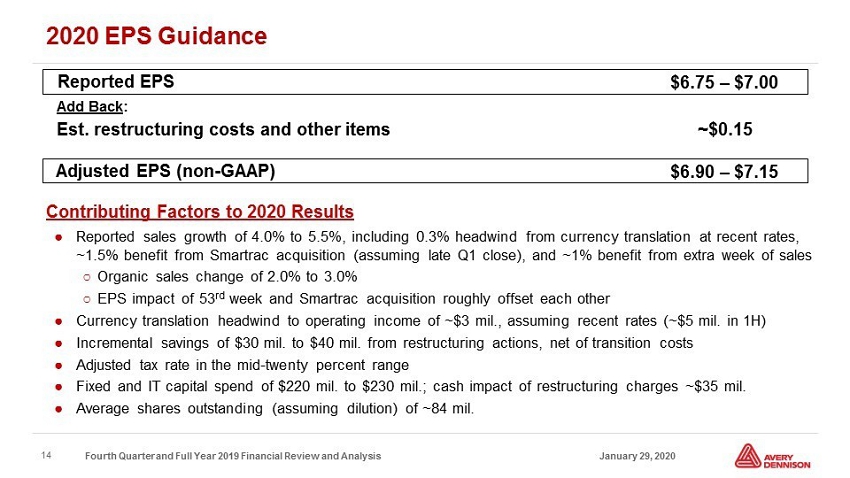
Fourth Quarter and Full Year 2019 Financial Review and Analysis 14 January 29, 2020 2020 EPS Guidance Add Back : Est. restructuring costs and other items Adjusted EPS (non - GAAP) Reported EPS [$6.75] – [$7.05] [$6.90] – [$7.20] ● Reported sales growth of 4% to 6%, including 0.3% headwind from currency translation at recent rates, ~1.5% benefit from Smartrac acquisition (assuming late Q1 close), and ~1% benefit from extra week of sales ○ O rganic sales change of 2.0% to 3.5% ○ EPS impact of 53 rd week and Smartrac acquisition roughly offset each other ● Currency translation headwind to operating income of ~$3 mil., assuming recent rates (~$5 mil. in 1H) ● Incremental savings of $30 mil. to $40 mil. from restructuring actions, net of transition costs ● Adjusted tax rate in the mid - twenty percent range ● Fixed and IT capital spend of $[220] mil. to $[230] mil.; cash impact of restructuring charges ~$35 mil. ● Average shares outstanding (assuming dilution) of ~84 mil. Contributing Factors to 2020 Results ~[$0.15]

Fourth Quarter and Full Year 2019 Financial Review and Analysis 15 January 29, 2020 Supplemental Presentation Materials Unless otherwise indicated, comparisons are to the same periods in the prior year. January 29, 2020 Appendix: Reconciliation of Financial Measures from GAAP to Non - GAAP

Fourth Quarter and Full Year 2019 Financial Review and Analysis 16 January 29, 2020 Organic Sales Change – Avery Dennison (1 ) Totals may not sum due to rounding and other factors .
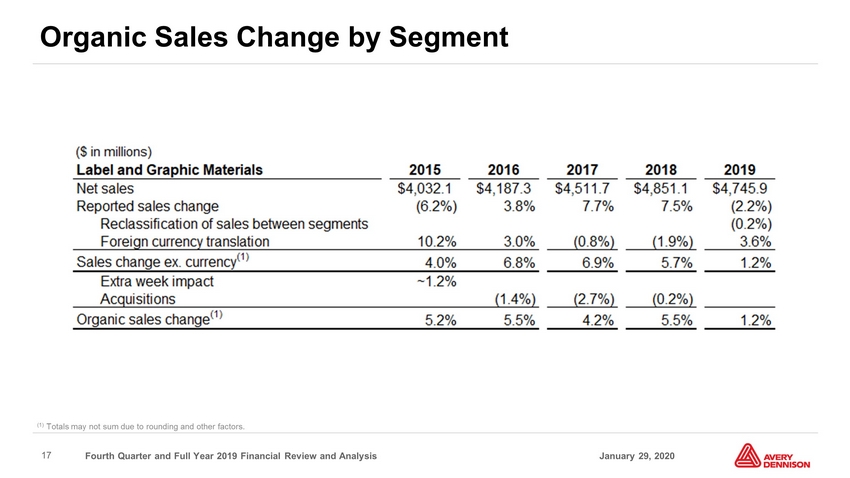
Fourth Quarter and Full Year 2019 Financial Review and Analysis 17 January 29, 2020 Organic Sales Change by Segment (1 ) Totals may not sum due to rounding and other factors .

Fourth Quarter and Full Year 2019 Financial Review and Analysis 18 January 29, 2020 Organic Sales Change by Segment - Continued (1 ) Totals may not sum due to rounding and other factors .
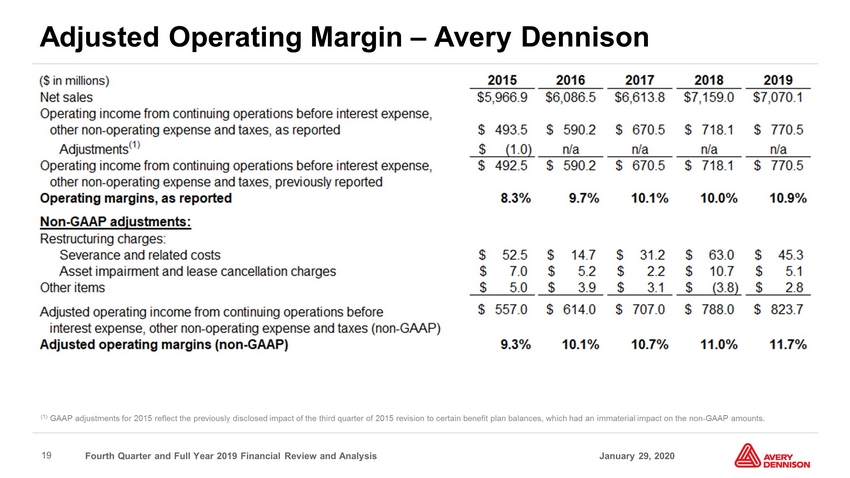
Fourth Quarter and Full Year 2019 Financial Review and Analysis 19 January 29, 2020 Adjusted Operating Margin – Avery Dennison ( 1 ) GAAP adjustments for 2015 reflect the previously disclosed impact of the third quarter of 2015 revision to certain benefit plan balances, which had an immaterial impact on the non - GAAP amounts .

Fourth Quarter and Full Year 2019 Financial Review and Analysis 20 January 29, 2020 Adjusted Operating Margin – LGM
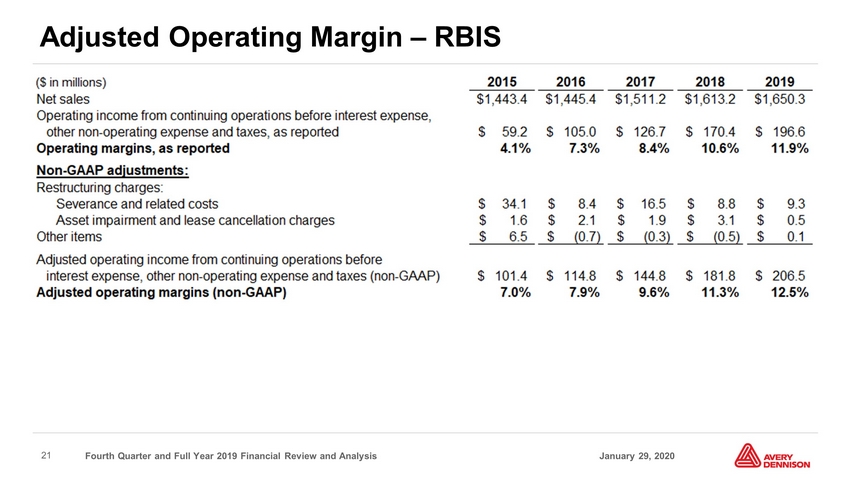
Fourth Quarter and Full Year 2019 Financial Review and Analysis 21 January 29, 2020 Adjusted Operating Margin – RBIS

Fourth Quarter and Full Year 2019 Financial Review and Analysis 22 January 29, 2020 Adjusted Operating Margin – IHM
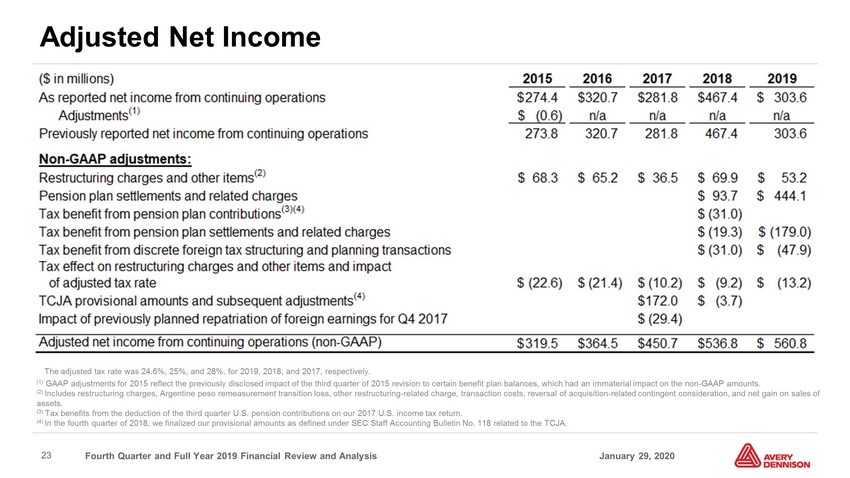
Fourth Quarter and Full Year 2019 Financial Review and Analysis 23 January 29, 2020 Adjusted Net Income (1) GAAP adjustments for 2015 reflect the previously disclosed impact of the third quarter of 2015 revision to certain benefit plan balances, which had an imm aterial impact on the non - GAAP amounts. (2) Includes restructuring charges, Argentine peso remeasurement transition loss, other restructuring - related charge, transaction costs, reversal of acquisition - related contingent consideration, and net gain on sales of assets . (3) Tax benefits from the deduction of the third quarter U.S. pension contributions on our 2017 U.S. income tax return. (4) In the fourth quarter of 2018, we finalized our provisional amounts as defined under SEC Staff Accounting Bulletin No. 118 related to the TCJA. The adjusted tax rate was 24.6%, 25%, and 28%, for 2019, 2018, and 2017, respectively.

Fourth Quarter and Full Year 2019 Financial Review and Analysis 24 January 29, 2020 Adjusted EPS (1) GAAP adjustments for 2015 reflect the previously disclosed impact of the third quarter of 2015 revision to certain benefit plan balances, which had an imm aterial impact on the non - GAAP amounts. (2) Includes restructuring charges, Argentine peso remeasurement transition loss, other restructuring - related charge, transaction costs, reversal of acquisition - related contingent consideration, and net gain on sales of assets . (3) In the fourth quarter of 2018, we finalized our provisional amounts as defined under SEC Staff Accounting Bulletin No. 118 related to the TCJA. The adjusted tax rate was 24.6%, 25%, and 28%, for 2019, 2018, and 2017, respectively.
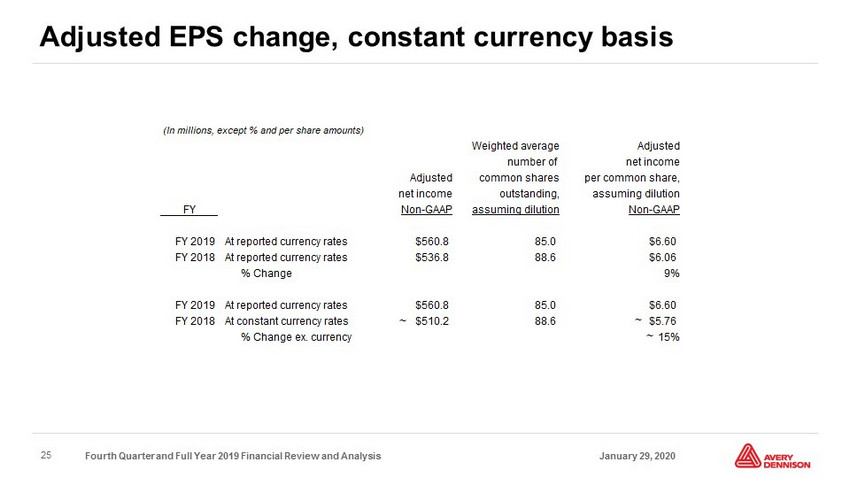
Fourth Quarter and Full Year 2019 Financial Review and Analysis 25 January 29, 2020 Adjusted EPS change, constant currency basis

Fourth Quarter and Full Year 2019 Financial Review and Analysis 26 January 29, 2020 Free Cash Flow

Fourth Quarter and Full Year 2019 Financial Review and Analysis 27 January 29, 2020 Return on Total Capital (ROTC) ( 1 ) "Provision for income taxes" for the fourth quarter of 2017 includes the estimated impact of TCJA enacted in the U.S. on Dece mbe r 22, 2017. In the fourth quarter of 2018, we finalized our provisional amounts as defined under SEC Staff Accounting Bulletin No. 118 related to TCJA. ( 2 ) Tax benefits resulting from the deduction of the third quarter 2018 pension contributions on our 2017 U.S. income tax return. ( 3 ) Interest expense, net of tax benefit for 2019, based on our GAAP tax rate of - 22.7 %, is not meaningful; Applying the adjusted tax rate of 24.6% removes the benefit of the negative tax rate from pension settlements and discrete foreign structuring transaction .

Fourth Quarter and Full Year 2019 Financial Review and Analysis 28 January 29, 2020 Net Debt to Adjusted EBITDA

Fourth Quarter and Full Year 2019 Financial Review and Analysis 29 January 29, 2020 © 2017 Avery Dennison Corporation. All rights reserved.