Exhibit 99.2 First Quarter 2023 Financial Review and Analysis (preliminary, unaudited) April 26, 2023 Supplemental Presentation Materials Unless otherwise indicated, comparisons are to the same period in the prior year. April 26, 2023 Preliminary & unaudited, Q1 2023 financial review and analysis 1
Safe Harbor Statement Certain statements contained in this document are forward-looking statements intended to qualify for the safe harbor from liability established by the Private Securities Litigation Reform Act of 1995. These forward-looking statements, and financial or other business targets, are subject to certain risks and uncertainties. We believe that the most significant risk factors that could affect our financial performance in the near term include: (i) the impacts to underlying demand for our products from global economic conditions, political uncertainty, and changes in environmental standards and governmental regulations; (ii) the cost and availability of raw materials; (iii) competitors' actions, including pricing, expansion in key markets, and product offerings; (iv) the degree to which higher costs can be offset with productivity measures and/or passed on to customers through price increases, without a significant loss of volume; (v) foreign currency fluctuations; and (vi) the execution and integration of acquisitions. Actual results and trends may differ materially from historical or anticipated results depending on a variety of factors, including but not limited to, risks and uncertainties related to the following: ● International Operations – worldwide and local economic and market conditions; changes in political conditions, including those related to China and those related to the Russian invasion of Ukraine; and fluctuations in foreign currency exchange rates and other risks associated with foreign operations, including in emerging markets ● Our Business – fluctuations in demand affecting sales to customers; fluctuations in the cost and availability of raw materials and energy; changes in our markets due to competitive conditions, technological developments, environmental standards, laws and regulations, and customer preferences; the impact of competitive products and pricing; execution and integration of acquisitions; selling prices; customer and supplier concentrations or consolidations; financial condition of distributors; outsourced manufacturers; product and service quality; timely development and market acceptance of new products, including sustainable or sustainably-sourced products; investment in development activities and new production facilities; successful implementation of new manufacturing technologies and installation of manufacturing equipment; our ability to generate sustained productivity improvement; our ability to achieve and sustain targeted cost reductions; collection of receivables from customers; our environmental, social and governance practices; and impacts from COVID-19 ● Income Taxes – fluctuations in tax rates; changes in tax laws and regulations, and uncertainties associated with interpretations of such laws and regulations; retention of tax incentives; outcome of tax audits; and the realization of deferred tax assets ● Information Technology – disruptions in information technology systems or data security breaches, including cyber-attacks or other intrusions to network security; and successful installation of new or upgraded information technology systems ● Human Capital – recruitment and retention of employees and collective labor arrangements ● Our Indebtedness – credit risks; our ability to obtain adequate financing arrangements and maintain access to capital; fluctuations in interest rates; volatility of financial markets; and compliance with our debt covenants ● Ownership of Our Stock – potential significant variability of our stock price and amounts of future dividends and share repurchases ● Legal and Regulatory Matters – protection and infringement of intellectual property; impact of legal and regulatory proceedings, including with respect to environmental, anti-corruption, health and safety, and trade compliance ● Other Financial Matters – fluctuations in pension costs and goodwill impairment For a more detailed discussion of these factors, see “Risk Factors” and “Management’s Discussion and Analysis of Financial Condition and Results of Operations” in our 2022 Form 10-K, filed with the Securities and Exchange Commission on February 22, 2023. The forward-looking statements included in this document are made only as of the date of this document, and we undertake no obligation to update these statements to reflect subsequent events or circumstances, other than as may be required by law. April 26, 2023 Preliminary & unaudited, Q1 2023 financial review and analysis 2
Use of Non-GAAP Financial Measures This presentation contains certain non-GAAP financial measures as defined by SEC rules. We report our financial results in conformity with accounting principles generally accepted in the United States of America, or GAAP, and also communicate with investors using certain non-GAAP financial measures. These non-GAAP financial measures are not in accordance with, nor are they a substitute for or superior to, the comparable GAAP financial measures. These non-GAAP financial measures are intended to supplement the presentation of our financial results prepared in accordance with GAAP. Based on feedback from investors and financial analysts, we believe that the supplemental non-GAAP financial measures we provide are useful to their assessments of our performance and operating trends, as well as liquidity. In accordance with Regulations G and S-K, reconciliations of non-GAAP financial measures from the most directly comparable GAAP financial measures, including limitations associated with these non-GAAP financial measures, are provided in the appendix to this document and/or financial schedules accompanying the earnings news release for the quarter (see Attachments A-4 through A-8 to news release dated April 26, 2023). Our non-GAAP financial measures exclude the impact of certain events, activities or strategic decisions. The accounting effects of these events, activities or decisions, which are included in the GAAP financial measures, may make it more difficult to assess our underlying performance in a single period. By excluding the accounting effects, positive or negative, of certain items (e.g., restructuring charges, outcomes of certain legal proceedings, certain effects of strategic transactions and related costs, losses from debt extinguishments, gains or losses from curtailment or settlement of pension obligations, gains or losses on sales of certain assets, gains or losses on venture investments and other items), we believe that we are providing meaningful supplemental information that facilitates an understanding of our core operating results and liquidity measures. While some of the items we exclude from GAAP financial measures recur, they tend to be disparate in amount, frequency or timing. We use these non-GAAP financial measures internally to evaluate trends in our underlying performance, as well as to facilitate comparison to the results of competitors for quarters and year-to-date periods, as applicable. We use the non-GAAP financial measures described below in this presentation. • Sales change ex. currency refers to the increase or decrease in net sales, excluding the estimated impact of foreign currency translation and the reclassification of sales between segments, and, where applicable, an extra week in our fiscal year and the calendar shift resulting from the extra week in the prior fiscal year, and currency adjustment for transitional reporting of highly inflationary economies. The estimated impact of foreign currency translation is calculated on a constant currency basis, with prior period results translated at current period average exchange rates to exclude the effect of currency fluctuations. • Organic sales change refers to sales change ex. currency, excluding the estimated impact of acquisitions and product line divestitures. We believe that sales change ex. currency and organic sales change assist investors in evaluating the sales change from the ongoing activities of our businesses and enhance their ability to evaluate our results from period to period. We believe that the following measures assist investors in understanding our core operating trends and comparing our results with those of our competitors. • Adjusted operating income refers to net income adjusted for taxes; other expense (income), net; interest expense and other non-operating expense (income), net. • Adjusted EBITDA refers to adjusted operating income before depreciation and amortization. • Adjusted operating margin refers to adjusted operating income as a percentage of net sales. • Adjusted EBITDA margin refers to adjusted EBITDA as a percentage of net sales. • Adjusted tax rate refers to the projected full-year GAAP tax rate, adjusted to exclude certain unusual or infrequent events that are expected to significantly impact that rate, such as effects of certain discrete tax planning actions, impacts related to enactments of comprehensive tax law changes, and other items. • Adjusted net income refers to income before taxes, tax-effected at the adjusted tax rate, and adjusted for tax-effected restructuring charges and other items. • Adjusted net income per common share, assuming dilution (adjusted EPS) refers to adjusted net income divided by the weighted average number of common shares outstanding, assuming dilution. • Net debt to adjusted EBITDA ratio refers to total debt (including finance leases) less cash and cash equivalents, divided by adjusted EBITDA for the last twelve months. We believe that the net debt to adjusted EBITDA ratio assists investors in assessing our leverage position. • Free cash flow (FCF) refers to cash flow provided by operating activities, less payments for property, plant and equipment, software and other deferred charges, plus proceeds from sales of property, plant and equipment, plus (minus) net proceeds from insurance and sales (purchases) of investments. Free cash flow is also adjusted for, where applicable, certain acquisition-related transaction costs. We believe that free cash flow assists investors by showing the amount of cash we have available for debt reductions, dividends, share repurchases, and acquisitions. • Free cash flow conversion refers to free cash flow divided by net income. This document has been furnished (not filed) on Form 8-K with the SEC and may be found on our website at www.investors.averydennison.com. April 26, 2023 Preliminary & unaudited, Q1 2023 financial review and analysis 3
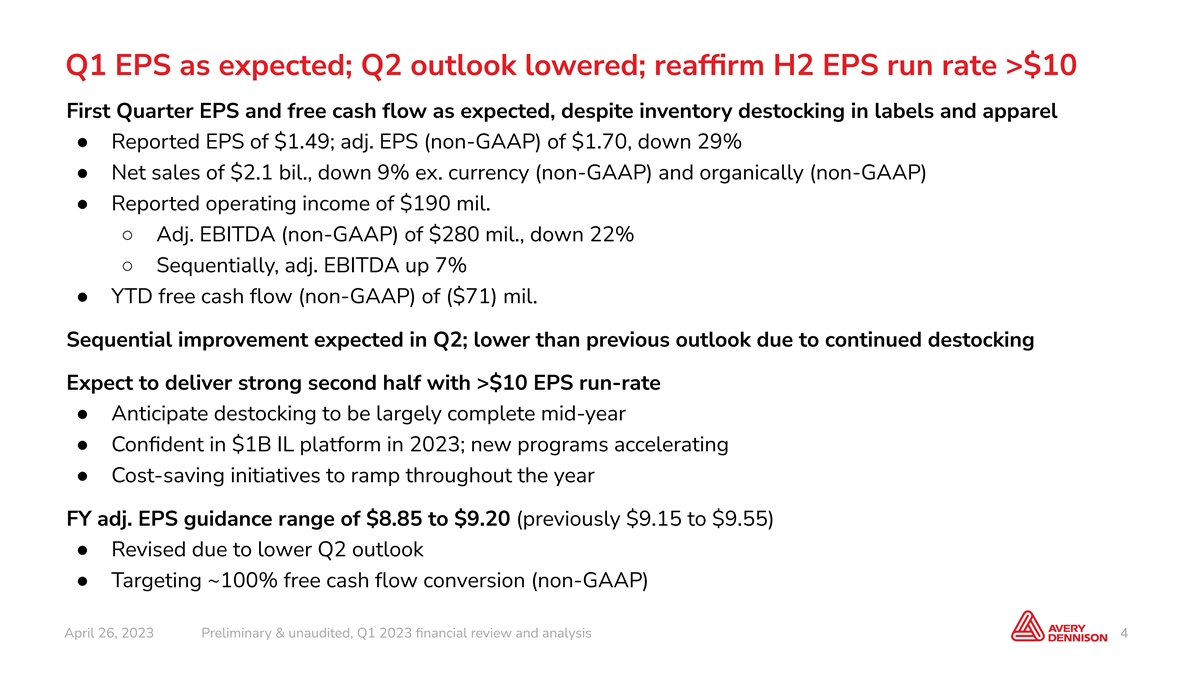
Q1 EPS as expected; Q2 outlook lowered; reaffirm H2 EPS run rate >$10 First Quarter EPS and free cash flow as expected, despite inventory destocking in labels and apparel ● Reported EPS of $1.49; adj. EPS (non-GAAP) of $1.70, down 29% ● Net sales of $2.1 bil., down 9% ex. currency (non-GAAP) and organically (non-GAAP) ● Reported operating income of $190 mil. ○ Adj. EBITDA (non-GAAP) of $280 mil., down 22% ○ Sequentially, adj. EBITDA up 7% ● YTD free cash flow (non-GAAP) of ($71) mil. Sequential improvement expected in Q2; lower than previous outlook due to continued destocking Expect to deliver strong second half with >$10 EPS run-rate ● Anticipate destocking to be largely complete mid-year ● Confident in $1B IL platform in 2023; new programs accelerating ● Cost-saving initiatives to ramp throughout the year FY adj. EPS guidance range of $8.85 to $9.20 (previously $9.15 to $9.55) ● Revised due to lower Q2 outlook ● Targeting ~100% free cash flow conversion (non-GAAP) April 26, 2023 Preliminary & unaudited, Q1 2023 financial review and analysis 4
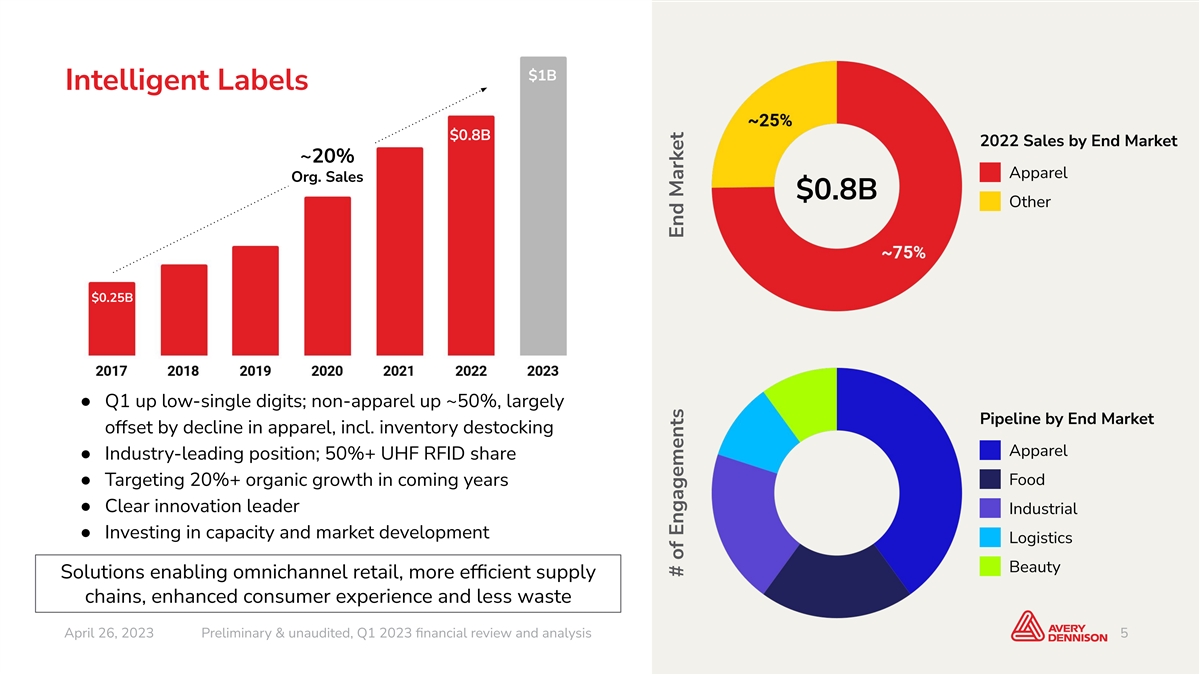
$1B Intelligent Labels $0.8B 2022 Sales by End Market ~20% Apparel Org. Sales $0.8B Other $0.25B ● Q1 up low-single digits; non-apparel up ~50%, largely Pipeline by End Market offset by decline in apparel, incl. inventory destocking Apparel ● Industry-leading position; 50%+ UHF RFID share Food ● Targeting 20%+ organic growth in coming years ● Clear innovation leader Industrial ● Investing in capacity and market development Logistics Beauty Solutions enabling omnichannel retail, more efficient supply chains, enhanced consumer experience and less waste April 26, 2023 Preliminary & unaudited, Q1 2023 financial review and analysis 5 5 # of Engagements End Market
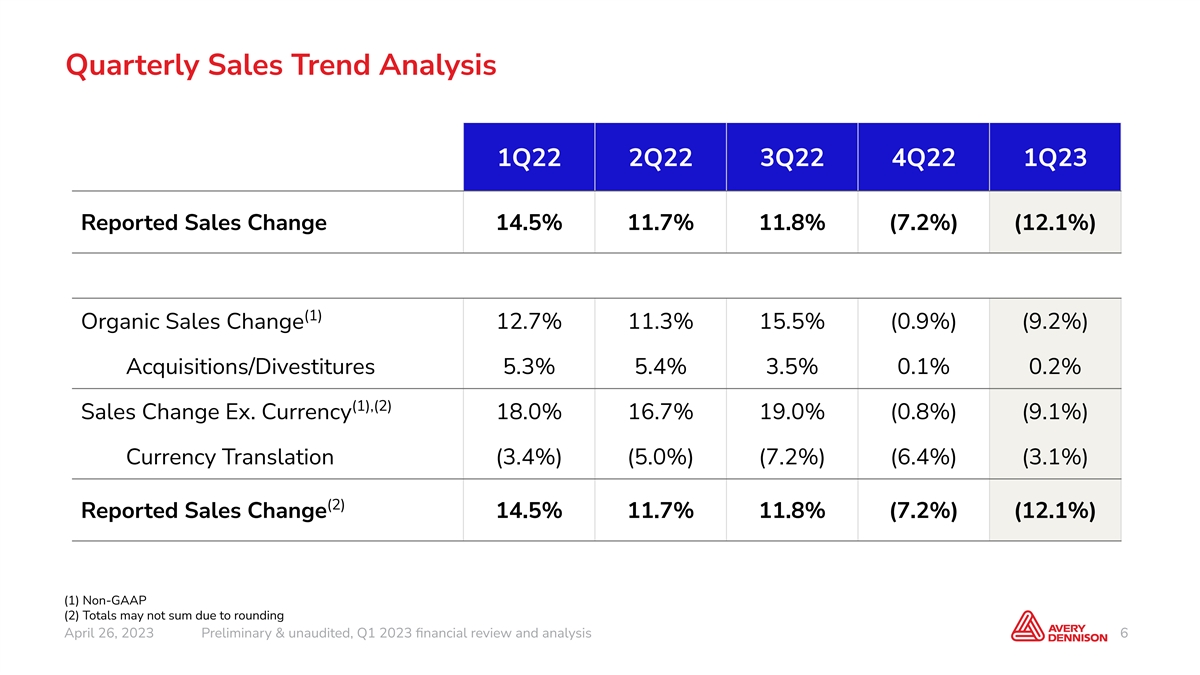
Quarterly Sales Trend Analysis 1Q22 2Q22 3Q22 4Q22 1Q23 Reported Sales Change 14.5% 11.7% 11.8% (7.2%) (12.1%) (1) Organic Sales Change 12.7% 11.3% 15.5% (0.9%) (9.2%) Acquisitions/Divestitures 5.3% 5.4% 3.5% 0.1% 0.2% (1),(2) Sales Change Ex. Currency 18.0% 16.7% 19.0% (0.8%) (9.1%) Currency Translation (3.4%) (5.0%) (7.2%) (6.4%) (3.1%) (2) Reported Sales Change 14.5% 11.7% 11.8% (7.2%) (12.1%) (1) Non-GAAP (2) Totals may not sum due to rounding April 26, 2023 Preliminary & unaudited, Q1 2023 financial review and analysis 6
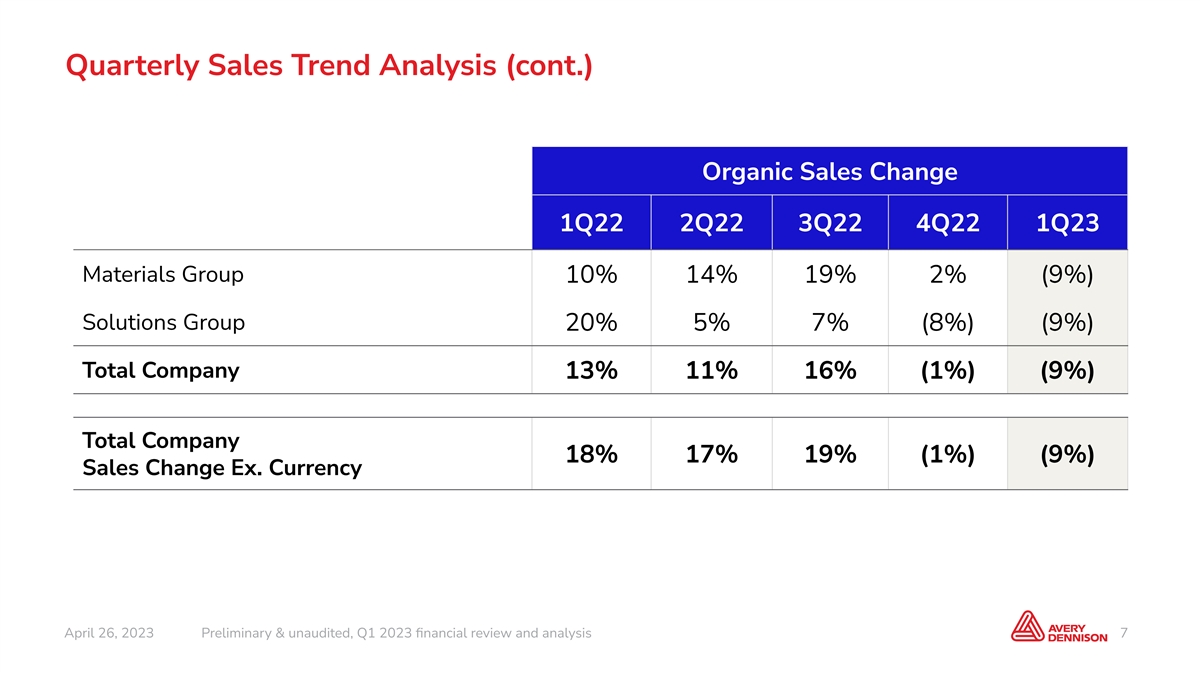
Quarterly Sales Trend Analysis (cont.) Organic Sales Change 1Q22 2Q22 3Q22 4Q22 1Q23 Materials Group 10% 14% 19% 2% (9%) Solutions Group 20% 5% 7% (8%) (9%) Total Company 13% 11% 16% (1%) (9%) Total Company 18% 17% 19% (1%) (9%) Sales Change Ex. Currency April 26, 2023 Preliminary & unaudited, Q1 2023 financial review and analysis 7
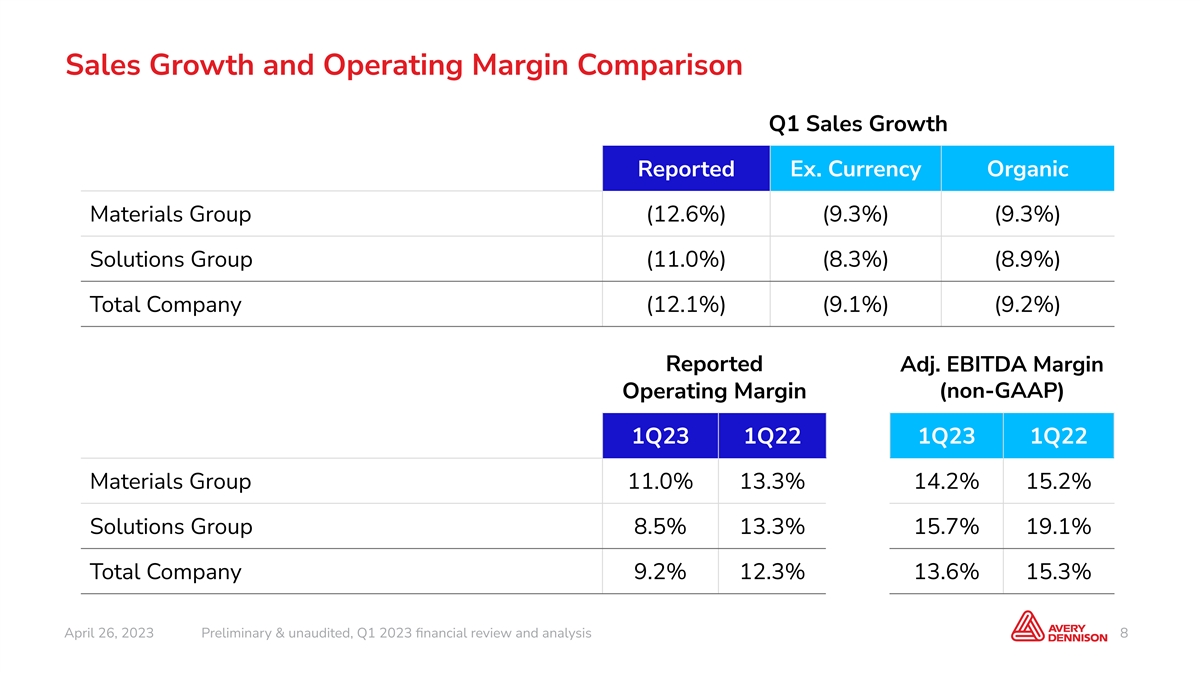
Sales Growth and Operating Margin Comparison Q1 Sales Growth Reported Ex. Currency Organic Materials Group (12.6%) (9.3%) (9.3%) Solutions Group (11.0%) (8.3%) (8.9%) Total Company (12.1%) (9.1%) (9.2%) Reported Adj. EBITDA Margin (non-GAAP) Operating Margin 1Q23 1Q22 1Q23 1Q22 Materials Group 11.0% 13.3% 14.2% 15.2% Solutions Group 8.5% 13.3% 15.7% 19.1% Total Company 9.2% 12.3% 13.6% 15.3% April 26, 2023 Preliminary & unaudited, Q1 2023 financial review and analysis 8

First Quarter 2023 Results AVY ‘22 Sales by Segment Materials Group Materials Group 72% Reported sales decreased 13% to $1.5 bil. Solutions Group Sales down 9% ex. currency and organically ● Label materials down low-double digits on organic basis ○ Lower volume, driven by inventory destocking, partially offset by pricing actions ○ Organically, sales down low-double digits in North America, Materials Group 2022 Sales by Product high-single digits in Western Europe and mid-to-high single digits in emerging markets High Value Label materials Categories ● Graphics and Reflectives up low-single digits organically Graphics & Reflectives 35% ● Performance Tapes and Medical up mid-single digits organically Performance Tapes & Medical Other Reported operating margin decreased 230 bps to 11.0% ● Adj. EBITDA margin decreased 100 bps to 14.2% driven by lower Materials Group volume/mix, partially offset by benefits from the net impact of 2022 Sales by Geography pricing and raw material input costs, and productivity U.S. & Canada ● Sequentially, adj. EBITDA margin increased 140 bps Emerging Western Europe Markets E. Europe & MENA Anticipate label destocking to be largely complete mid-year; 36% Asia Pacific adj. EBITDA margin to continue improving sequentially Latin America throughout 2023 April 26, 2023 Preliminary & unaudited, Q1 2023 financial review and analysis 9 9 End Market Product Category
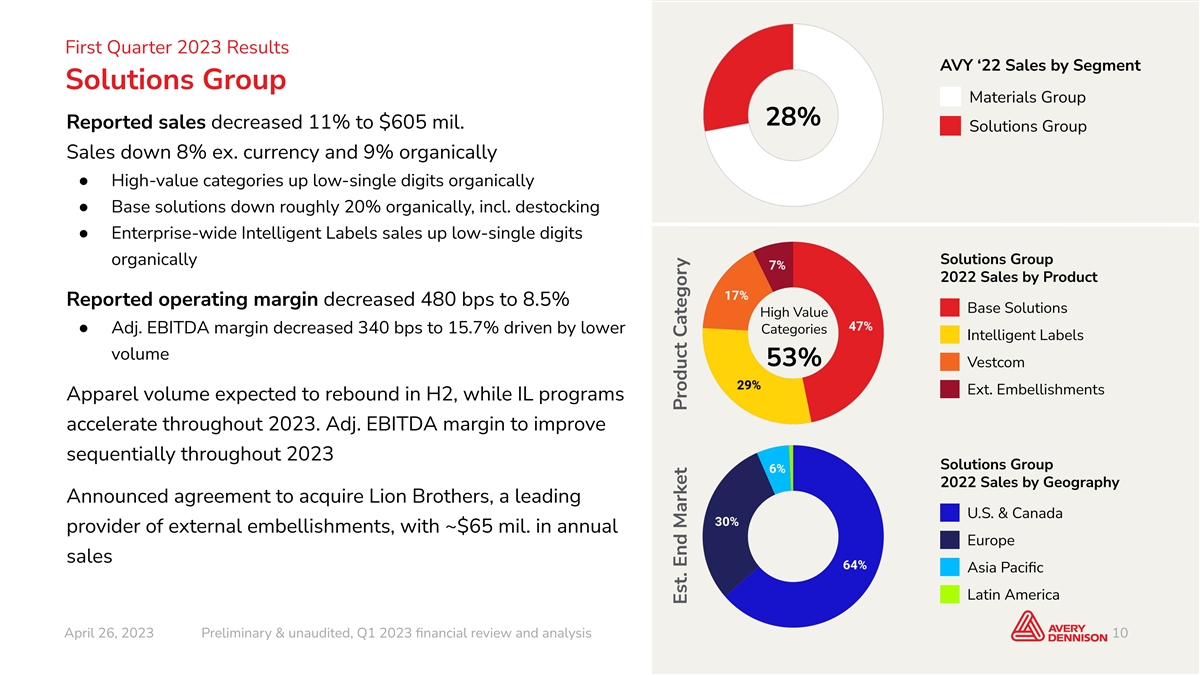
First Quarter 2023 Results AVY ‘22 Sales by Segment Solutions Group Materials Group 28% Reported sales decreased 11% to $605 mil. Solutions Group Sales down 8% ex. currency and 9% organically ● High-value categories up low-single digits organically ● Base solutions down roughly 20% organically, incl. destocking ● Enterprise-wide Intelligent Labels sales up low-single digits Solutions Group organically 2022 Sales by Product Reported operating margin decreased 480 bps to 8.5% Base Solutions High Value ● Adj. EBITDA margin decreased 340 bps to 15.7% driven by lower Categories Intelligent Labels volume 53% Vestcom Ext. Embellishments Apparel volume expected to rebound in H2, while IL programs accelerate throughout 2023. Adj. EBITDA margin to improve sequentially throughout 2023 Solutions Group 2022 Sales by Geography Announced agreement to acquire Lion Brothers, a leading U.S. & Canada provider of external embellishments, with ~$65 mil. in annual Europe sales Asia Pacific Latin America April 26, 2023 Preliminary & unaudited, Q1 2023 financial review and analysis 10 10 Est. End Market Product Category
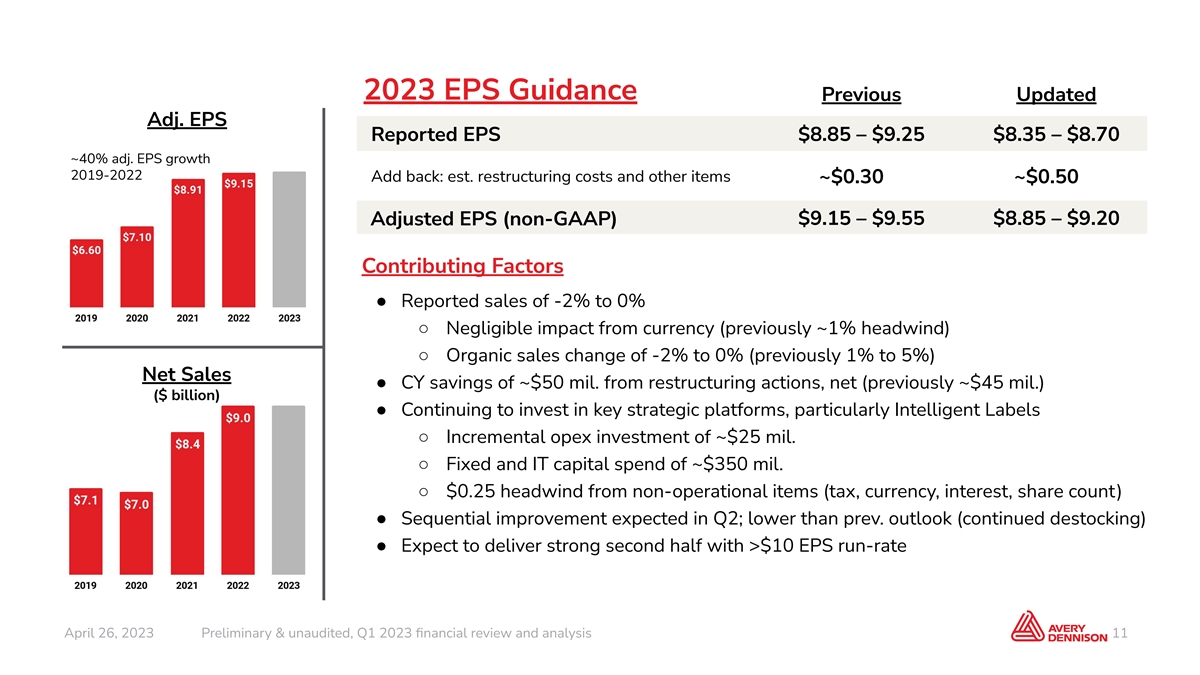
2023 EPS Guidance Previous Updated Adj. EPS Reported EPS $8.85 – $9.25 $8.35 – $8.70 ~40% adj. EPS growth 2019-2022 Add back: est. restructuring costs and other items ~$0.30 ~$0.50 Adjusted EPS (non-GAAP) $9.15 – $9.55 $8.85 – $9.20 Contributing Factors ● Reported sales of -2% to 0% ○ Negligible impact from currency (previously ~1% headwind) ○ Organic sales change of -2% to 0% (previously 1% to 5%) Net Sales ● CY savings of ~$50 mil. from restructuring actions, net (previously ~$45 mil.) ($ billion) ● Continuing to invest in key strategic platforms, particularly Intelligent Labels ○ Incremental opex investment of ~$25 mil. ○ Fixed and IT capital spend of ~$350 mil. ○ $0.25 headwind from non-operational items (tax, currency, interest, share count) ● Sequential improvement expected in Q2; lower than prev. outlook (continued destocking) ● Expect to deliver strong second half with >$10 EPS run-rate April 26, 2023 Preliminary & unaudited, Q1 2023 financial review and analysis 11

Appendix April 26, 2023 Preliminary & unaudited, Q1 2023 financial review and analysis 12
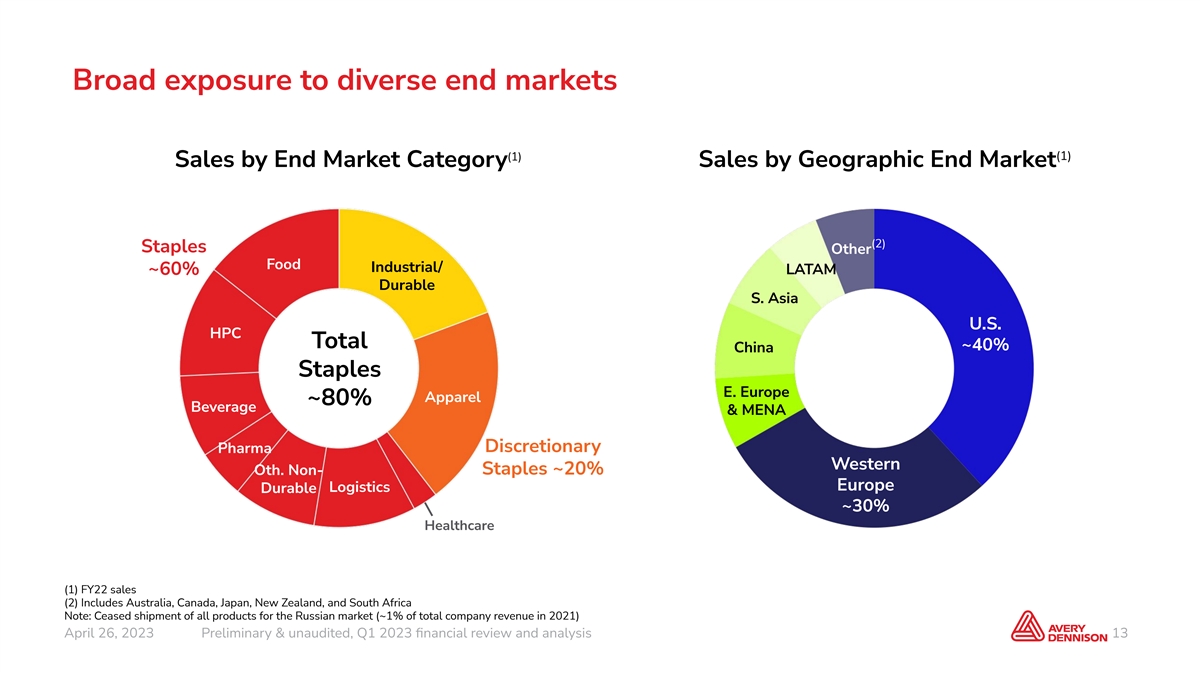
Broad exposure to diverse end markets (1) (1) Sales by End Market Category Sales by Geographic End Market (2) (2) Staples Other Other Food Industrial/ ~60% LATAM Dur U.S abl . e S. Asia 27% U.S. HPC Total ~40% China Staples E. Europe Apparel ~80% Beverage & MENA Western Discretionary Pharma Europe Western Oth. Non- Staples ~20% 22% Europe Logistics Durable ~30% Healthcare (1) FY22 sales (2) Includes Australia, Canada, Japan, New Zealand, and South Africa Note: Ceased shipment of all products for the Russian market (~1% of total company revenue in 2021) April 26, 2023 Preliminary & unaudited, Q1 2023 financial review and analysis 13
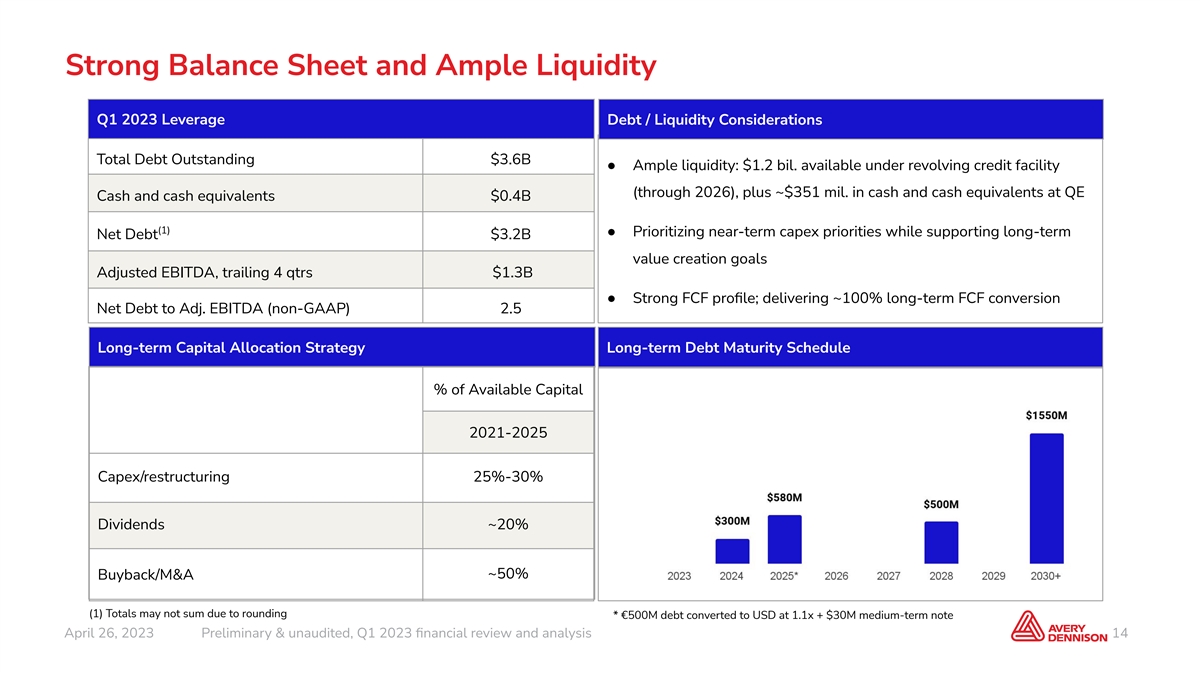
Strong Balance Sheet and Ample Liquidity Q1 2023 Leverage Debt / Liquidity Considerations Total Debt Outstanding $3.6B ● Ample liquidity: $1.2 bil. available under revolving credit facility (through 2026), plus ~$351 mil. in cash and cash equivalents at QE Cash and cash equivalents $0.4B (1) ● Prioritizing near-term capex priorities while supporting long-term Net Debt $3.2B value creation goals Adjusted EBITDA, trailing 4 qtrs $1.3B ● Strong FCF profile; delivering ~100% long-term FCF conversion Net Debt to Adj. EBITDA (non-GAAP) 2.5 Long-term Capital Allocation Strategy Long-term Debt Maturity Schedule % of Available Capital 2021-2025 Capex/restructuring 25%-30% Dividends ~20% ~50% Buyback/M&A (1) Totals may not sum due to rounding * €500M debt converted to USD at 1.1x + $30M medium-term note April 26, 2023 Preliminary & unaudited, Q1 2023 financial review and analysis 14
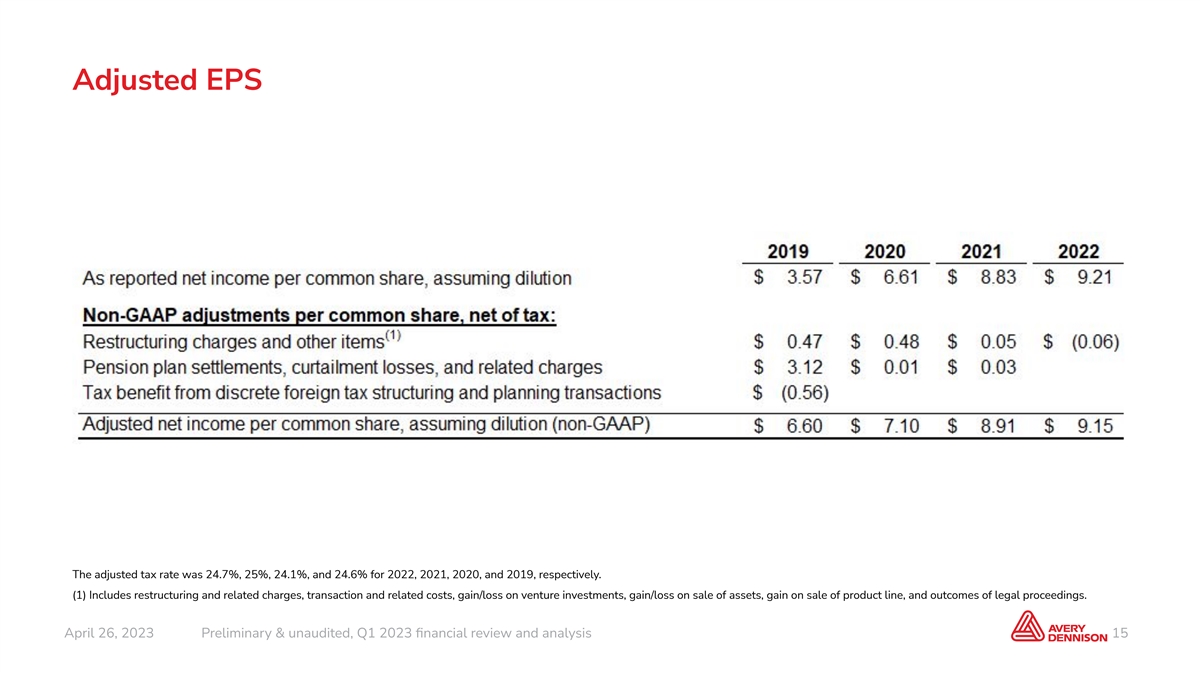
Adjusted EPS The adjusted tax rate was 24.7%, 25%, 24.1%, and 24.6% for 2022, 2021, 2020, and 2019, respectively. (1) Includes restructuring and related charges, transaction and related costs, gain/loss on venture investments, gain/loss on sale of assets, gain on sale of product line, and outcomes of legal proceedings. April 26, 2023 Preliminary & unaudited, Q1 2023 financial review and analysis 15

April 26, 2023 Preliminary & unaudited, Q1 2023 financial review and analysis 16 © 2023 Avery Dennison Corporation. All rights reserved. Avery Dennison and all other Avery Dennison brands, product names and codes are trademarks of Avery Dennison Corporation. All other brands or product names are trademarks of ® their respective owners. Fortune 500 is a trademark of Time, Inc. Branding and other information on any samples depicted is fictitious. Any resemblance to actual names is purely coincidental.