
Exhibit 99.2 Second Quarter 2024 Financial Review and Analysis (preliminary, unaudited) July 23, 2024 Supplemental Presentation Materials Unless otherwise indicated, comparisons are to the same period in the prior year. July 23, 2024 Q2 2024 financial review and analysis, preliminary and unaudited 1
Safe Harbor Statement Certain statements contained in this document are forward-looking statements intended to qualify for the safe harbor from liability established by the Private Securities Litigation Reform Act of 1995. These forward-looking statements, and financial or other business targets, are subject to certain risks and uncertainties. We believe that the most significant risk factors that could affect our financial performance in the near term include: (i) the impact on underlying demand for our products from global economic conditions, political uncertainty, and changes in environmental standards, regulations, and preferences; (ii) competitors’ actions, including pricing, expansion in key markets, and product offerings; (iii) the cost and availability of raw materials; (iv) the degree to which higher costs can be offset with productivity measures and/or passed on to customers through price increases, without a significant loss of volume; (v) foreign currency fluctuations; and (vi) the execution and integration of acquisitions. Actual results and trends may differ materially from historical or anticipated results depending on a variety of factors, including but not limited to, risks and uncertainties related to the following: ● International Operations – worldwide economic, social, political and market conditions; changes in political conditions, including those related to China, the Russia-Ukraine war, and the Israel-Hamas war and related hostilities in the Middle East; fluctuations in foreign currency exchange rates; and other risks associated with international operations, including in emerging markets ● Our Business – fluctuations in demand affecting sales to customers; fluctuations in the cost and availability of raw materials and energy; changes in our markets due to competitive conditions, technological developments, laws and regulations, tariffs and customer preferences; increasing environmental standards; the impact of competitive products and pricing; execution and integration of acquisitions; selling prices; customer and supplier concentrations or consolidations; financial condition of distributors; outsourced manufacturers; product and service quality; restructuring and other productivity actions; timely development and market acceptance of new products, including sustainable or sustainably-sourced products; investment in development activities and new production facilities; successful implementation of new manufacturing technologies and installation of manufacturing equipment; our ability to generate sustained productivity improvement; our ability to achieve and sustain targeted cost reductions; collection of receivables from customers; our sustainability and governance practices; and epidemics, pandemics or other outbreaks of illness ● Information Technology – disruptions in information technology systems, cyber attacks or other security breaches; and successful installation of new or upgraded information technology systems ● Income Taxes – fluctuations in tax rates; changes in tax laws and regulations, and uncertainties associated with interpretations of such laws and regulations; retention of tax incentives; outcome of tax audits; and the realization of deferred tax assets ● Human Capital – recruitment and retention of employees and collective labor arrangements ● Our Indebtedness – credit risks; our ability to obtain adequate financing arrangements and maintain access to capital; fluctuations in interest rates; volatility in financial markets; and compliance with our debt covenants ● Ownership of Our Stock – potential significant variability of our stock price and amounts of future dividends and share repurchases ● Legal and Regulatory Matters – protection and infringement of intellectual property; impact of legal and regulatory proceedings, including with respect to compliance and anti-corruption, environmental, health and safety, and trade compliance ● Other Financial Matters – fluctuations in pension costs and goodwill impairment For a more detailed discussion of these factors, see “Risk Factors” and “Management’s Discussion and Analysis of Financial Condition and Results of Operations” in our 2023 Form 10-K, filed with the Securities and Exchange Commission on February 21, 2024, and subsequent quarterly reports on Form 10-Q. The forward-looking statements included in this document are made only as of the date of this document, and we undertake no obligation to update these statements to reflect subsequent events or circumstances, other than as may be required by law. July 23, 2024 Q2 2024 financial review and analysis, preliminary and unaudited 2

Use of Non-GAAP Financial Measures This presentation contains certain non-GAAP financial measures as defined by SEC rules. We report our financial results in conformity with accounting principles generally accepted in the United States of America, or GAAP, and also communicate with investors using certain non-GAAP financial measures. These non-GAAP financial measures are not in accordance with, nor are they a substitute for or superior to, the comparable GAAP financial measures. These non-GAAP financial measures are intended to supplement the presentation of our financial results prepared in accordance with GAAP. We use these non-GAAP financial measures internally to evaluate trends in our underlying performance, as well as to facilitate comparisons with the results of competitors for quarters and year-to-date periods, as applicable. Based on feedback from investors and financial analysts, we believe that the supplemental non-GAAP financial measures we provide are also useful to their assessments of our performance and operating trends, as well as liquidity. In accordance with Regulations G and S-K, reconciliations of non-GAAP financial measures from the most directly comparable GAAP financial measures, including limitations associated with these non-GAAP financial measures, are provided in the appendix to this document and/or the financial schedules accompanying the earnings news release for the quarter (see Attachments A-4 through A-9 to news release dated July 23, 2024). Our non-GAAP financial measures exclude the impact of certain events, activities or strategic decisions. The accounting effects of these events, activities or decisions, which are included in the GAAP financial measures, may make it more difficult to assess our underlying performance in a single period. By excluding the accounting effects, positive or negative, of certain items (e.g., restructuring charges, outcomes of certain legal matters and settlements, certain effects of strategic transactions and related costs, losses from debt extinguishments, gains or losses from curtailment or settlement of pension obligations, gains or losses on sales of certain assets, gains or losses on venture investments, currency adjustments due to highly inflationary economies, and other items), we believe that we are providing meaningful supplemental information that facilitates an understanding of our core operating results and liquidity measures. While some of the items we exclude from GAAP financial measures recur, they tend to be disparate in amount, frequency or timing. We use the non-GAAP financial measures described below in this presentation. • Sales change ex. currency refers to the increase or decrease in net sales, excluding the estimated impact of foreign currency translation, and, where applicable, an extra week in our fiscal year, the calendar shift resulting from an extra week in the prior fiscal year, currency adjustments for transitional reporting of highly inflationary economies, and the reclassification of sales between segments. The estimated impact of foreign currency translation is calculated on a constant currency basis, with prior-period results translated at current period average exchange rates to exclude the effect of foreign currency fluctuations. • Organic sales change refers to sales change ex. currency, excluding the estimated impact of acquisitions and product line divestitures. We believe that sales change ex. currency and organic sales change assist investors in evaluating the sales change from the ongoing activities of our businesses and enhance their ability to evaluate our results from period to period. We believe that the following measures assist investors in understanding our core operating trends and comparing our results with those of our competitors. • Adjusted operating income refers to net income adjusted for taxes; other expense (income), net; interest expense; other non-operating expense (income), net; and other items. • Adjusted EBITDA refers to adjusted operating income before depreciation and amortization. • Adjusted operating margin refers to adjusted operating income as a percentage of net sales. • Adjusted EBITDA margin refers to adjusted EBITDA as a percentage of net sales. • Adjusted tax rate refers to the projected full-year GAAP tax rate, adjusted to exclude certain unusual or infrequent events that are expected to significantly impact that rate, such as effects of certain discrete tax planning actions, impacts related to enactments of comprehensive tax law changes, and other items. • Adjusted net income refers to income before taxes, tax-effected at the adjusted tax rate, and adjusted for tax-effected restructuring charges and other items. • Adjusted net income per common share, assuming dilution (adjusted EPS) refers to adjusted net income divided by the weighted average number of common shares outstanding, assuming dilution. • Net debt to adjusted EBITDA ratio refers to total debt (including finance leases) less cash and cash equivalents, divided by adjusted EBITDA for the last twelve months. We believe that the net debt to adjusted EBITDA ratio assists investors in assessing our leverage position. • Adjusted free cash flow (adjusted FCF) refers to cash flow provided by operating activities, less payments for property, plant and equipment, software and other deferred charges, plus proceeds from company-owned life insurance policies, plus proceeds from sales of property, plant and equipment, plus (minus) net proceeds from insurance and sales (purchases) of investments, less net cash used for Argentine Blue Chip Swap securities. Where applicable, adjusted free cash flow is also adjusted for certain acquisition-related transaction costs. We believe that adjusted free cash flow assists investors by showing the amount of cash we have available for debt reductions, dividends, share repurchases, and acquisitions. This document has been furnished (not filed) on Form 8-K with the SEC and may be found on our website at www.investors.averydennison.com. July 23, 2024 Q2 2024 financial review and analysis, preliminary and unaudited 3

Delivered another strong quarter; Q2 adj. EPS up 26%; raising FY guidance Materials Group delivered strong sales growth and significant margin expansion ● Label Materials volume grew double-digits, as expected ● Margins expanded more than 2 points, driven by volume leverage and productivity Solutions Group delivered double-digit sales growth and expanded margins ● Apparel volume environment continued to improve sequentially, ahead of expectations Strong growth in Intelligent Labels as apparel volumes normalize and new categories adopt Continued to generate strong adj. free cash flow Raising FY24 adj. EPS (non-GAAP) guidance to $9.30 to $9.50, up 15 cents at midpoint and 19% vs. PY ● Increasing FY organic sales growth outlook to 4.0% to 5.0% ● Increasing 2H operational outlook more than 5 cents, excluding currency translation headwind July 23, 2024 Q2 2024 financial review and analysis, preliminary and unaudited 4
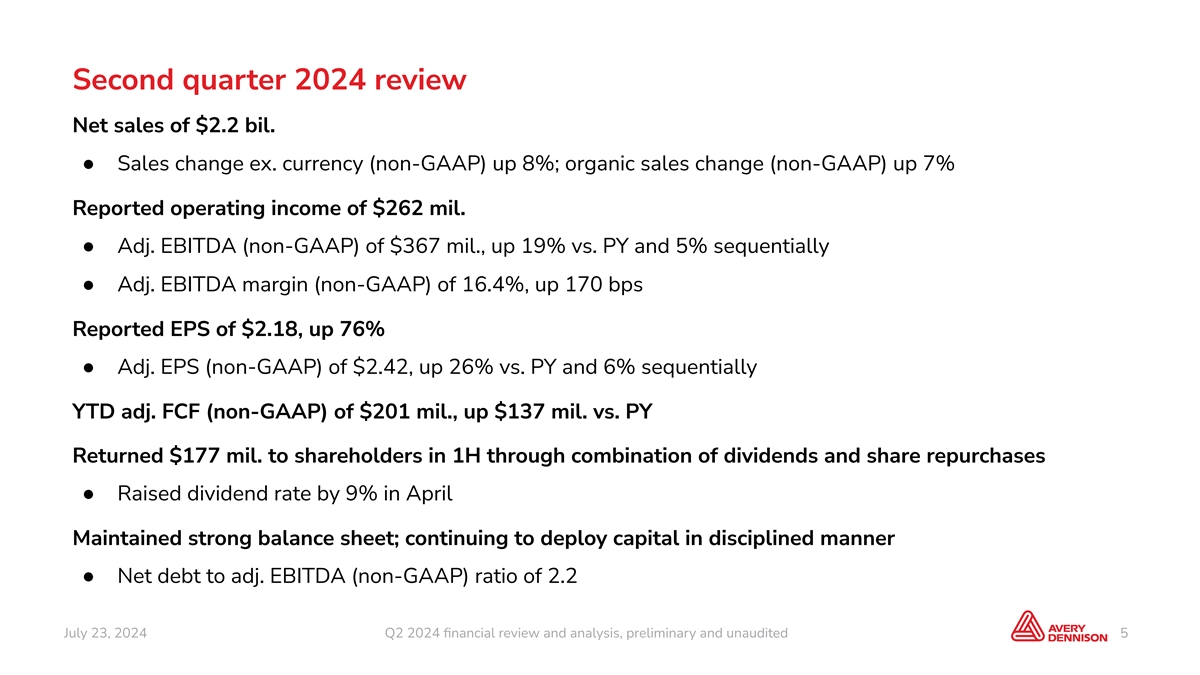
Second quarter 2024 review Net sales of $2.2 bil. ● Sales change ex. currency (non-GAAP) up 8%; organic sales change (non-GAAP) up 7% Reported operating income of $262 mil. ● Adj. EBITDA (non-GAAP) of $367 mil., up 19% vs. PY and 5% sequentially ● Adj. EBITDA margin (non-GAAP) of 16.4%, up 170 bps Reported EPS of $2.18, up 76% ● Adj. EPS (non-GAAP) of $2.42, up 26% vs. PY and 6% sequentially YTD adj. FCF (non-GAAP) of $201 mil., up $137 mil. vs. PY Returned $177 mil. to shareholders in 1H through combination of dividends and share repurchases ● Raised dividend rate by 9% in April Maintained strong balance sheet; continuing to deploy capital in disciplined manner ● Net debt to adj. EBITDA (non-GAAP) ratio of 2.2 July 23, 2024 Q2 2024 financial review and analysis, preliminary and unaudited 5
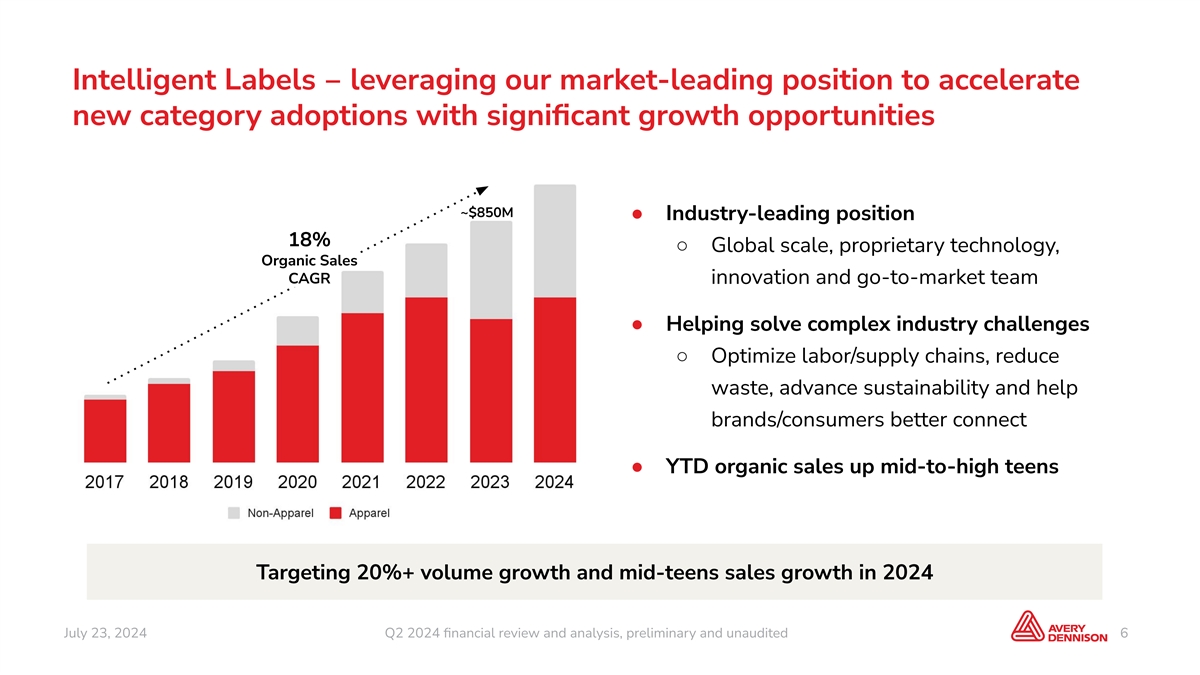
Intelligent Labels ‒ leveraging our market-leading position to accelerate new category adoptions with significant growth opportunities ~$850M ● Industry-leading position 18% ○ Global scale, proprietary technology, Organic Sales CAGR innovation and go-to-market team ● Helping solve complex industry challenges ○ Optimize labor/supply chains, reduce waste, advance sustainability and help brands/consumers better connect ● YTD organic sales up mid-to-high teens Targeting 20%+ volume growth and mid-teens sales growth in 2024 July 23, 2024 Q2 2024 financial review and analysis, preliminary and unaudited 6

Quarterly sales trend analysis 2Q23 3Q23 4Q23 1Q24 2Q24 Reported Sales Change (11%) (9%) 4% 4% 7% (1) Organic Sales Change (10%) (11%) 1% 3% 7% Acquisitions/Divestitures 1% 1% 1% 1% 1% (1)(2) Sales Change Ex. Currency (10%) (10%) 3% 4% 8% Currency Translation (1%) 1% 2% 0% (1%) (2) Reported Sales Change (11%) (9%) 4% 4% 7% (1) Non-GAAP (2) Totals may not sum due to rounding July 23, 2024 Q2 2024 financial review and analysis, preliminary and unaudited 7
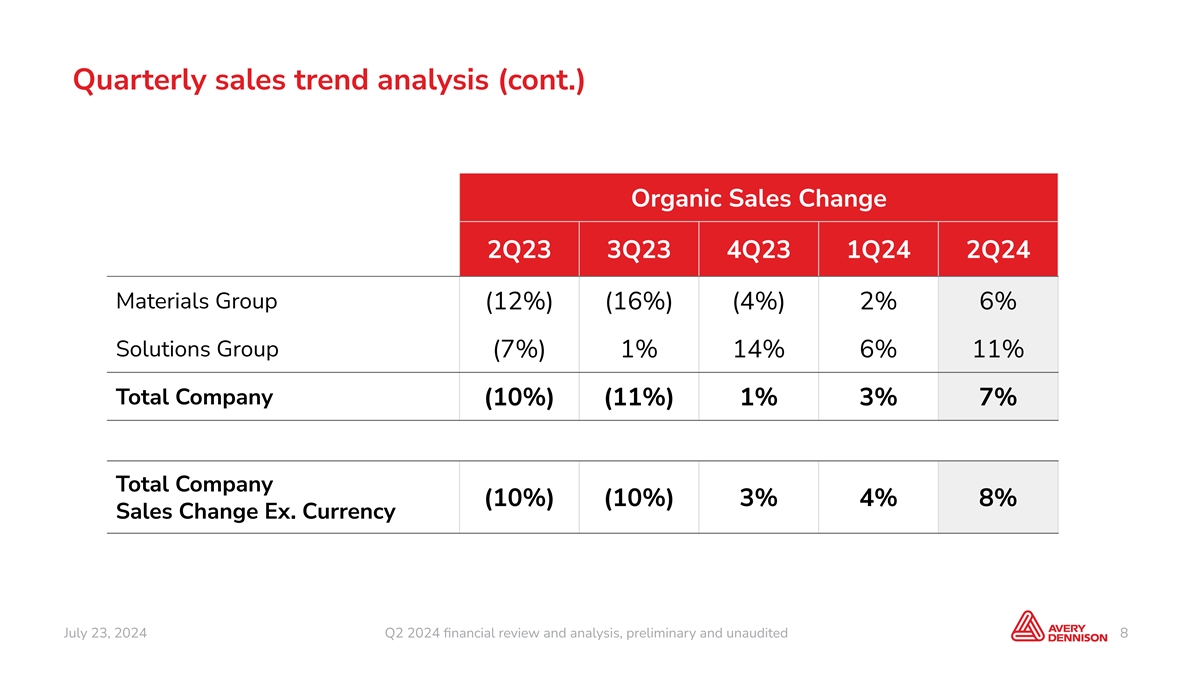
Quarterly sales trend analysis (cont.) Organic Sales Change 2Q23 3Q23 4Q23 1Q24 2Q24 Materials Group (12%) (16%) (4%) 2% 6% Solutions Group (7%) 1% 14% 6% 11% Total Company (10%) (11%) 1% 3% 7% Total Company (10%) (10%) 3% 4% 8% Sales Change Ex. Currency July 23, 2024 Q2 2024 financial review and analysis, preliminary and unaudited 8

Q2 sales and margin comparisons Q2 Sales Change Reported Ex. Currency Organic Materials Group 5% 6% 6% Solutions Group 12% 14% 11% Total Company 7% 8% 7% Reported Adj. EBITDA Margin (non-GAAP) Operating Margin 2Q24 2Q23 2Q24 2Q23 Materials Group 14.4% 13.1% 17.9% 15.7% Solutions Group 9.3% (1.2%) 16.8% 15.8% Total Company 11.7% 7.9% 16.4% 14.7% July 23, 2024 Q2 2024 financial review and analysis, preliminary and unaudited 9

Second Quarter 2024 Results AVY ‘23 Sales by Segment Materials Group Materials Group Reported sales increased 5% to $1.5 bil. 69% Solutions Group Sales up 6% ex. currency and organically ● Label Materials up mid-to-high single-digits on organic basis Materials Group ○ Volume/mix up low double-digits, partially offset by 2023 Sales by Product deflation-related price reductions High-Value Label Materials Categories Graphics & Reflectives ● Graphics and Reflectives up low single-digits organically 36% Performance Tapes & Medical ● Performance Tapes and Medical down low single-digits Other organically Materials Group Reported operating margin of 14.4% 2023 Sales by Geography U.S. & Canada ● Adj. EBITDA margin of 17.9%, up 220 bps driven by Emerging Western Europe higher volume/mix and benefits from productivity, Markets E. Europe & MENA partially offset by higher employee-related costs 38% Asia Pacific Latin America July 23, 2024 Q2 2024 financial review and anal Q2 2024 financial r ysis, preliminar ey and unaudit view and anal ed ysis , preliminary and unaudited 10 10 End Market Product Category

Second Quarter 2024 Results AVY ‘23 Sales by Segment Solutions Group Materials Group 31% Reported sales increased 12% to $689 mil. Solutions Group Sales up 14% ex. currency and 11% organically ● Solutions high-value categories up low double-digits ex. currency Solutions Group 2023 Sales by Product ● Solutions base categories up mid-to-high teens Base Solutions ex. currency High-Value Categories Intelligent Labels Reported operating margin of 9.3% 60% Vestcom Ext. Embellishments ● Adj. EBITDA margin of 16.8%, up 100 bps, driven by higher volume and benefits from productivity, partially offset by higher employee-related costs and investments Solutions Group 2023 Sales by Geography ○ Margin up 70 bps sequentially; expect margin to U.S. & Canada continue to improve in 2H Europe Asia Pacific Latin America July 23, 2024 Q2 2024 financial review and anal Q2 2024 financial r ysis, preliminar ey and unaudit view and anal ed ysis , preliminary and unaudited 11 11 Est. End Market Product Category
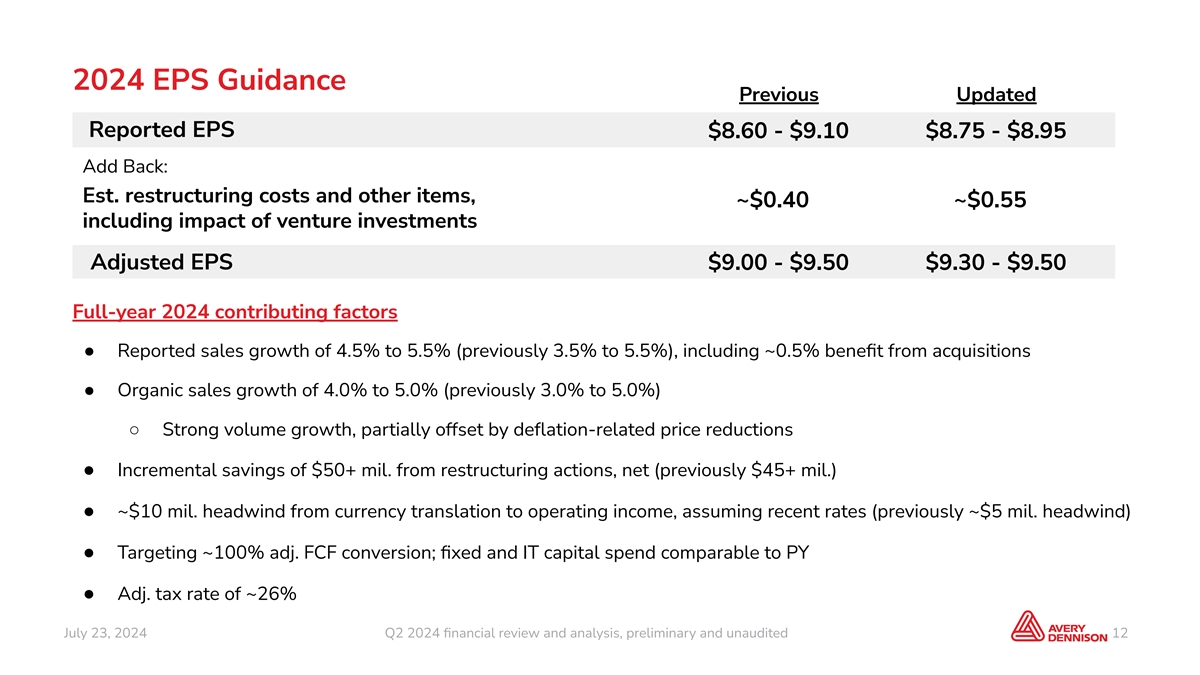
2024 EPS Guidance Previous Updated Reported EPS $8.60 - $9.10 $8.75 - $8.95 Add Back: Est. restructuring costs and other items, ~$0.40 ~$0.55 including impact of venture investments Adjusted EPS $9.00 - $9.50 $9.30 - $9.50 Full-year 2024 contributing factors ● Reported sales growth of 4.5% to 5.5% (previously 3.5% to 5.5%), including ~0.5% benefit from acquisitions ● Organic sales growth of 4.0% to 5.0% (previously 3.0% to 5.0%) ○ Strong volume growth, partially offset by deflation-related price reductions ● Incremental savings of $50+ mil. from restructuring actions, net (previously $45+ mil.) ● ~$10 mil. headwind from currency translation to operating income, assuming recent rates (previously ~$5 mil. headwind) ● Targeting ~100% adj. FCF conversion; fixed and IT capital spend comparable to PY ● Adj. tax rate of ~26% July 23, 2024 Q2 2024 financial review and analysis, preliminary and unaudited 12

July 23, 2024 Q2 2024 financial review and analysis, preliminary and unaudited 13 © 2024 Avery Dennison Corporation. All rights reserved. Avery Dennison and all other Avery Dennison brands, product names and codes are trademarks of Avery Dennison Corporation. All other brands or product names are trademarks of ® their respective owners. Fortune 500 is a trademark of Time, Inc. Branding and other information on any samples depicted is fictitious. Any resemblance to actual names is purely coincidental.