
Exhibit 99.2 Fourth Quarter and Full Year 2024 Financial Review and Analysis (preliminary, unaudited) January 30, 2025 Supplemental Presentation Materials Unless otherwise indicated, comparisons are to the same period in the prior year. January 30, 2025 Preliminary & unaudited, Q4 & FY 2024 financial review and analysis 1

Safe Harbor Statement Certain statements contained in this document are forward-looking statements intended to qualify for the safe harbor from liability established by the Private Securities Litigation Reform Act of 1995. These forward-looking statements, and financial or other business targets, are subject to certain risks and uncertainties. We believe that the most significant risk factors that could affect our financial performance in the near term include: (i) the impact on underlying demand for our products from global economic conditions, political uncertainty, and changes in environmental standards, regulations, and preferences; (ii) competitors’ actions, including pricing, expansion in key markets, and product offerings; (iii) the cost and availability of raw materials; (iv) the degree to which higher costs can be offset with productivity measures and/or passed on to customers through price increases, without a significant loss of volume; (v) foreign currency fluctuations; and (vi) the execution and integration of acquisitions. Actual results and trends may differ materially from historical or anticipated results depending on a variety of factors, including but not limited to, risks and uncertainties related to the following: ● International Operations – worldwide economic, social, political and market conditions; changes in political conditions, including those related to China, the Russia-Ukraine war, and the Israel-Hamas war and related hostilities in the Middle East; fluctuations in foreign currency exchange rates; and other risks associated with international operations, including in emerging markets ● Our Business – fluctuations in demand affecting sales to customers; fluctuations in the cost and availability of raw materials and energy; changes in our markets due to competitive conditions, technological developments, laws and regulations, tariffs and customer preferences; increasing environmental standards; the impact of competitive products and pricing; execution and integration of acquisitions; selling prices; customer and supplier concentrations or consolidations; financial condition of distributors; outsourced manufacturers; product and service quality; restructuring and other productivity actions; timely development and market acceptance of new products, including sustainable or sustainably-sourced products; investment in development activities and new production facilities; successful implementation of new manufacturing technologies and installation of manufacturing equipment; our ability to generate sustained productivity improvement; our ability to achieve and sustain targeted cost reductions; collection of receivables from customers; our sustainability and governance practices; and epidemics, pandemics or other outbreaks of illness ● Information Technology – disruptions in information technology systems, cyber attacks or other security breaches; and successful installation of new or upgraded information technology systems ● Income Taxes – fluctuations in tax rates; changes in tax laws and regulations, and uncertainties associated with interpretations of such laws and regulations; retention of tax incentives; outcome of tax audits; and the realization of deferred tax assets ● Human Capital – recruitment and retention of employees and collective labor arrangements ● Our Indebtedness – credit risks; our ability to obtain adequate financing arrangements and maintain access to capital; fluctuations in interest rates; volatility in financial markets; and compliance with our debt covenants ● Ownership of Our Stock – potential significant variability of our stock price and amounts of future dividends and share repurchases ● Legal and Regulatory Matters – protection and infringement of intellectual property; impact of legal and regulatory proceedings, including with respect to compliance and anti-corruption, environmental, health and safety, and trade compliance ● Other Financial Matters – fluctuations in pension costs and goodwill impairment For a more detailed discussion of these factors, see “Risk Factors” and “Management’s Discussion and Analysis of Financial Condition and Results of Operations” in our 2023 Form 10-K, filed with the Securities and Exchange Commission on February 21, 2024, and subsequent quarterly reports on Form 10-Q. The forward-looking statements included in this document are made only as of the date of this document, and we undertake no obligation to update these statements to reflect subsequent events or circumstances, other than as may be required by law. January 30, 2025 Preliminary & unaudited, Q4 & FY 2024 financial review and analysis 2

Use of Non-GAAP Financial Measures This presentation contains certain non-GAAP financial measures as defined by SEC rules. We report our financial results in conformity with accounting principles generally accepted in the United States of America, or GAAP, and also communicate with investors using certain non-GAAP financial measures. These non-GAAP financial measures are not in accordance with, nor are they a substitute for or superior to, the comparable GAAP financial measures. These non-GAAP financial measures are intended to supplement the presentation of our financial results prepared in accordance with GAAP. We use these non-GAAP financial measures internally to evaluate trends in our underlying performance, as well as to facilitate comparisons with the results of competitors for quarters and year-to-date periods, as applicable. Based on feedback from investors and financial analysts, we believe that the supplemental non-GAAP financial measures we provide are also useful to their assessments of our performance and operating trends, as well as liquidity. In accordance with Regulations G and S-K, reconciliations of non-GAAP financial measures from the most directly comparable GAAP financial measures, including limitations associated with these non-GAAP financial measures, are provided in the appendix to this document and/or the financial schedules accompanying the earnings news release for the quarter (see Attachments A-4 through A-8 to news release dated January 30, 2025). Our non-GAAP financial measures exclude the impact of certain events, activities or strategic decisions. The accounting effects of these events, activities or decisions, which are included in the GAAP financial measures, may make it more difficult to assess our underlying performance in a single period. By excluding the accounting effects, positive or negative, of certain items (e.g., restructuring charges, outcomes of certain legal matters and settlements, certain effects of strategic transactions and related costs, losses from debt extinguishments, gains or losses from curtailment or settlement of pension obligations, gains or losses on sales of certain assets, gains or losses on venture investments, currency adjustments due to highly inflationary economies, and other items), we believe that we are providing meaningful supplemental information that facilitates an understanding of our core operating results and liquidity measures. While some of the items we exclude from GAAP financial measures recur, they tend to be disparate in amount, frequency or timing. We use the non-GAAP financial measures described below in this presentation. • Sales change ex. currency refers to the increase or decrease in net sales, excluding the estimated impact of foreign currency translation, and, where applicable, the currency adjustments for transitional reporting of highly inflationary economies, and the reclassification of sales between segments. Additionally, where applicable, sales change ex. currency is also adjusted for an extra week in our fiscal year and the calendar shift resulting from an extra week in the prior fiscal year. The estimated impact of foreign currency translation is calculated on a constant currency basis, with prior-period results translated at current period average exchange rates to exclude the effect of foreign currency fluctuations. Our 2025 fiscal year that began on December 29, 2024 will end on December 31,2025; fiscal years 2026 and beyond will be coincident with the calendar year beginning on January 1 and ending on December 31. • Organic sales change refers to sales change ex. currency, excluding the estimated impact of acquisitions and product line divestitures. We believe that sales change ex. currency and organic sales change assist investors in evaluating the sales change from the ongoing activities of our businesses and enhance their ability to evaluate our results from period to period. We believe that the following measures assist investors in understanding our core operating trends and comparing our results with those of our competitors. • Adjusted operating income refers to net income adjusted for taxes; other expense (income), net; interest expense; other non-operating expense (income), net; and other items. • Adjusted EBITDA refers to adjusted operating income before depreciation and amortization. • Adjusted EBITDA change ex. currency refers to the change in adjusted EBITDA on a constant currency basis. The estimated impact of foreign currency translation is calculated on a constant currency basis, with prior-period results translated at current period average exchange rates to exclude the effect of currency fluctuations. • Adjusted operating margin refers to adjusted operating income as a percentage of net sales. • Adjusted EBITDA margin refers to adjusted EBITDA as a percentage of net sales. • Adjusted tax rate refers to the full-year GAAP tax rate, adjusted to exclude certain unusual or infrequent events that significantly impact that rate, such as effects of certain discrete tax planning actions, impacts related to enactments of comprehensive tax law changes, and other items. • Adjusted net income refers to income before taxes, tax-effected at the adjusted tax rate, and adjusted for tax-effected restructuring charges and other items. • Adjusted net income per common share, assuming dilution (adjusted EPS) refers to adjusted net income divided by the weighted average number of common shares outstanding, assuming dilution. • Adjusted EPS change ex. currency refers to the change in adjusted net income per common share, assuming dilution, on a constant currency basis. The estimated impact of foreign currency translation is calculated on a constant currency basis, with prior-period results translated at current period average exchange rates to exclude the effect of currency fluctuations. • Net debt to adjusted EBITDA ratio refers to total debt (including finance leases) less cash and cash equivalents, divided by adjusted EBITDA for the last twelve months. We believe that the net debt to adjusted EBITDA ratio assists investors in assessing our leverage position. • Adjusted free cash flow (adjusted FCF) refers to cash flow provided by operating activities, less payments for property, plant and equipment, less payments for software and other deferred charges, plus proceeds from company-owned life insurance policies, plus proceeds from sales of property, plant and equipment, plus (minus) net proceeds from insurance and sales (purchases) of investments, less net cash used for Argentine Blue Chip Swap securities. Where applicable, adjusted free cash flow is also adjusted for certain acquisition-related transaction costs. We believe that adjusted free cash flow assists investors by showing the amount of cash we have available for debt reductions, dividends, share repurchases, and acquisitions. • Adjusted free cash flow conversion refers to adjusted free cash flow divided by net income. • Return on total capital (ROTC) refers to net income excluding interest expense and amortization of intangible assets from acquisitions, net of tax benefit, divided by the average of beginning and ending invested capital. We believe that ROTC assists investors in understanding our ability to generate returns from our capital. This document has been furnished (not filed) on Form 8-K with the SEC and may be found on our website at www.investors.averydennison.com. January 30, 2025 Preliminary & unaudited, Q4 & FY 2024 financial review and analysis 3

Delivered 19% adj. EPS growth in 2024, at high end of original guidance, again demonstrating the strength of our franchise Reported operating income of $1.0B ● Adj. EBITDA margin (non-GAAP) of 16.4%, up 130 bps Net sales of $8.8 bil. ● Adj. Operating margin (non-GAAP) of 12.8%, up 130 bps Sales change ex. curr. (non-GAAP) up 5.1% Organic sales change (non-GAAP) up 4.5% Generated strong adj. FCF (non-GAAP) of $700 mil., up $108 mil. vs. PY Returned $525 mil. to shareholders through dividends and share repurchases (accelerated pace in 2H) Reported EPS of $8.73 Maintained strong balance sheet; continuing Adj. EPS of $9.43, up 19% to deploy capital in disciplined manner ● Net debt to adj. EBITDA ratio (non-GAAP) of 2.0 January 30, 2025 Preliminary & unaudited, Q4 & FY 2024 financial review and analysis 4
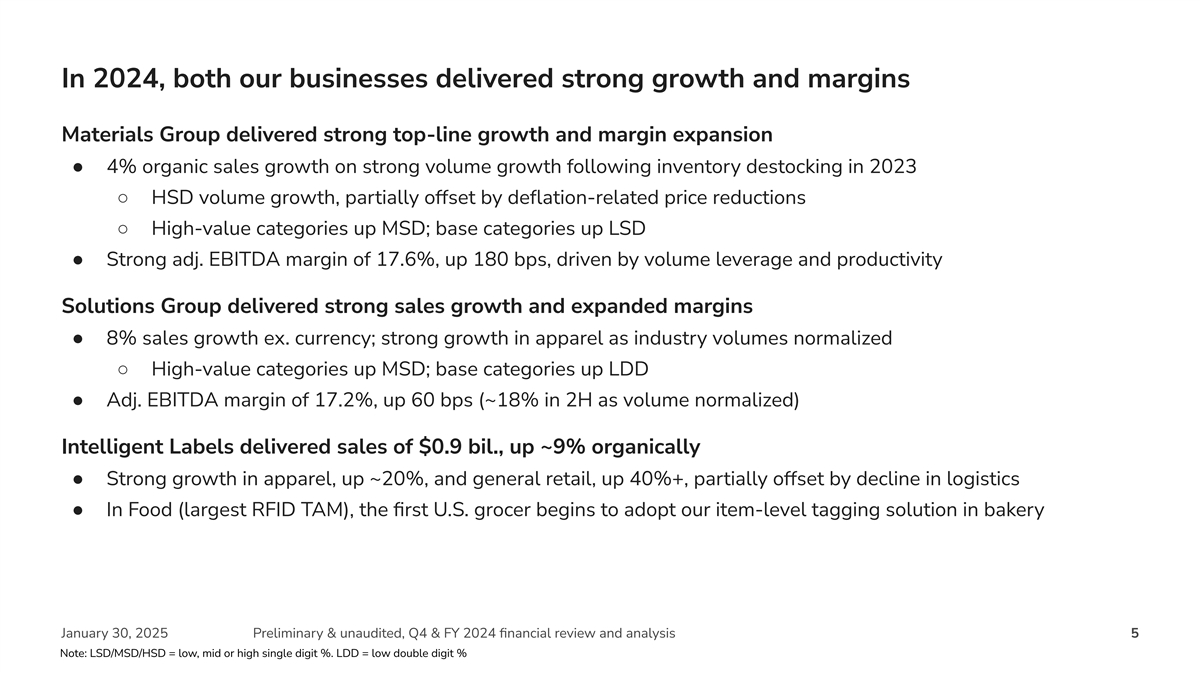
In 2024, both our businesses delivered strong growth and margins Materials Group delivered strong top-line growth and margin expansion ● 4% organic sales growth on strong volume growth following inventory destocking in 2023 ○ HSD volume growth, partially offset by deflation-related price reductions ○ High-value categories up MSD; base categories up LSD ● Strong adj. EBITDA margin of 17.6%, up 180 bps, driven by volume leverage and productivity Solutions Group delivered strong sales growth and expanded margins ● 8% sales growth ex. currency; strong growth in apparel as industry volumes normalized ○ High-value categories up MSD; base categories up LDD ● Adj. EBITDA margin of 17.2%, up 60 bps (~18% in 2H as volume normalized) Intelligent Labels delivered sales of $0.9 bil., up ~9% organically ● Strong growth in apparel, up ~20%, and general retail, up 40%+, partially offset by decline in logistics ● In Food (largest RFID TAM), the first U.S. grocer begins to adopt our item-level tagging solution in bakery January 30, 2025 Preliminary & unaudited, Q4 & FY 2024 financial review and analysis 5 Note: LSD/MSD/HSD = low, mid or high single digit %. LDD = low double digit %

Superior earnings compounder over the long term, with a consistent track record of delivering GDP+ growth, margin expansion and top-quartile ROTC 2011-2015 2013-2018 2016-2021 2020-2025 2023-2028 (1) TARGETS TARGETS TARGETS TARGETS TARGETS ‘20-’24 Sales Growth 4%-5% 5%+ 5%+ 5%+ 3%-5% ~7% ex. curr. ‘20-’24 15%- 12%- 7.4% Adjusted EPS Growth 10%+ 10% 10% 20%+ 15%+ ~9% ex. curr. 16% Top ROTC (non-GAAP) 16%+ 17%+ 18%+ in 2024 (2) Quartile Note: target metrics as stated in previous investor presentations 12.5% 13.5% 15.6% 16.4% 17%+ Adj. EBITDA margin in 2015 in 2018 in 2021 in 2024 in 2028 The strength and durability of our portfolio and our agile global team provide multiple levers to deliver strong results in various scenarios across cycles January 30, 2025 Preliminary & unaudited, Q4 & FY 2024 financial review and analysis 6 (1) See slide 16 for full details on progress toward 2025 targets (2) Compared to peer group on page 75 of our 2024 Proxy Statement

Confident in continuing to deliver strong earnings growth in 2025 Expect adj. EPS of $9.80 to $10.20 (up ~10% ex. currency), with organic sales growth of 3.0% to 4.0% ● Assumes GDP growth similar to 2024; prepared for alternative economic and geopolitical scenarios Delivering strong results across our portfolio through consistent execution of our strategies ● Driving outsized growth in high-value categories (2.0-3.5 pts. to total company organic growth) ○ Intelligent Labels up 10%-15% (1.0-1.5 pts. to total company organic growth) ○ Embelex to grow double-digits; Vestcom benefiting from new program wins ○ Materials high-value categories continuing to grow MSD ● Continuing to drive profitable growth in our base businesses (~1 pt. to total company organic growth) ○ Global footprint a source of competitive advantage and growth ● Leading at the intersection of physical and digital ○ Proprietary innovation to unlock new categories and use cases in 2025 ● Effectively allocating capital and relentlessly focusing on productivity ○ Ample capacity for M&A and share buyback (accelerated pace in 2H24) ○ Productivity delivers further margin expansion Well-positioned to continue to deliver superior value for all of our stakeholders January 30, 2025 Preliminary & unaudited, Q4 & FY 2024 financial review and analysis 7

Delivered another strong quarter in Q4, with adj. EPS up 10% Reported operating income of $263 mil. ● Adj. EBITDA margin of 16.4%, up 40 bps Net sales of $2.2 bil. ● Adj. Operating margin of 12.8%, up 40 bps Sales change ex. currency up 3.5% Organic sales change up 3.3% Generated strong adj. FCF of $280 mil., up $61 mil. vs. PY Returned $210 mil. to shareholders through accelerated pace of share repurchases and dividends Reported EPS of $2.16 Maintained strong balance sheet; continuing Adj. EPS of $2.38, up 10% to deploy capital in disciplined manner ● Net debt to adj. EBITDA ratio of 2.0 January 30, 2025 Preliminary & unaudited, Q4 & FY 2024 financial review and analysis 8

Fourth Quarter 2024 Results Materials Group 2024 Sales by Product Reported sales increased 4% to $1.5 bil. Label Materials Sales up 4% ex. currency and organically High-value Categories Graphics & Reflectives ● High-value categories up HSD digits; base 36% categories up LSD organically Performance Tapes & Medical ● Label Materials up LSD organically Other ● Graphics and Reflectives up LSD; Performance Tapes and Medical sales comparable to PY Reported operating margin of 14.7% ● Adj. Operating margin of 14.8%, up 80 bps 2024 Sales by Geography ● Adj. EBITDA margin of 17.0%, up 80 bps U.S. & Canada ○ Benefits from higher volume/mix and Emerging productivity, partially offset by net impact of Western Europe Markets pricing and raw material input costs E. Europe & MENA 38% Asia Pacific Latin America January 30, 2025 Preliminary & unaudited, Q4 & FY 2024 financial review and analysis 9 Est. End Market Product Category

Fourth Quarter 2024 Results Solutions Group 2024 Sales by Product Reported sales increased 3% to $714 mil. Base Solutions Sales up 3% ex. currency and 3% organically High-value Intelligent Labels (IL) Categories ● High-value categories down MSD ex. currency Vestcom ○ Strong growth in IL apparel and general retail, 59% more than offset by IL logistics and other Ext. Embellishments high-value solutions (Embelex) ○ In Vestcom, signed new agreement with leading U.S. health solutions company for pricing productivity solutions ● Base categories up mid teens ex. currency Reported operating margin of 9.1% 2024 Sales by Geography ● Adj. Operating margin of 11.4%, down 20 bps U.S. & Canada ● Adj. EBITDA margin of 17.8%, down 40 bps Europe ○ Benefits from productivity and higher volume, Asia Pacific more than offset by employee-related costs and growth investments Latin America January 30, 2025 Preliminary & unaudited, Q4 & FY 2024 financial review and analysis 10 Est. End Market Product Category

Enterprise-wide Intelligent Labels — delivering significant growth across the portfolio, with clear competitive advantages in scale, innovation and go-to-market strategy In Q4, LSD decline in IL; apparel up ~15% and general retail up Apparel General Retail ~40%, offset by decline in logistics All Other $0.9B In 2024, ~9% growth in IL; apparel, up ~20% and general retail up 40%+, partially offset by decline in logistics In 2025, expecting growth of 10%-15% ● Confident current program expansions to deliver ~10% growth ● Targeting pipeline conversion of key programs in 2H25 for additional growth ● Growth rate to increase throughout the year ● Expect to maintain/grow our overall share position ● Apparel: LDD growth on new customer rollouts ● General retail: significant growth driven by compliance in new categories for large U.S. retailer ● Food: significant growth off small base, driven by early stage grocery adoption Cont. to ● Logistics: no key pipeline conversion assumed in 2025; actively AVY org. 0.9pts. 0.4pts. 2.1pts. 1.2pts. 0.9pts. 0.9pts. 1.0-1.5pts. growth working projects in pipeline (1) Targeting ~15%+ long-term organic sales growth as adoption of RFID solutions continues January 30, 2025 Preliminary & unaudited, Q4 & FY 2024 financial review and analysis 11 (1) Intelligent Labels enterprise-wide long-term growth target is annualized over a horizon; growth in specific time periods is dependent on the timing of pipeline conversion and is likely to be uneven. ~15% Organic Sales Growth 6-YR CAGR (‘18-’24)

Disciplined approach to capital allocation; strong balance sheet with ample capacity Long-term capital allocation framework Long-term debt summary % of Available Capital 3.4% weighted avg. interest rate ‘20-’25 Target ‘20-’24 Actual (3.8% excl. 3/2025 €500M repayment) Capex/restructuring 25%-30% 25% Dividends ~20% 20% (1) (1) Buyback/M&A ~50% 55% Uses of capital Dividends Capex/restructuring ● Ample capacity; 2.0x leverage at year-end Share buybacks M&A ● Growing dividend in-line with earnings (~10% CAGR over past 10 years) ● Continuing to invest organically in our businesses ● Disciplined deployment of capital for strategic M&A and share buyback (1) 2025 includes €500M + $30M debt, 2034 includes €500M debt, Euro debt converted to USD at 1.042 January 30, 2025 Preliminary & unaudited, Q4 & FY 2024 financial review and analysis 12

2025 EPS Guidance Low High Reported EPS $9.55 $9.95 Est. restructuring costs and other items ~$0.25 ~$0.25 Adjusted EPS $9.80 $10.20 Sales Growth ● Reported 0.5% 1.5% ● Organic 3.0% 4.0% Additional contributing factors ● ~$30 mil. headwind to operating income from currency translation ● Incremental savings of ~$40 mil. from restructuring actions, net ● Targeting ~100% adj. FCF conversion; fixed and IT capital spend of ~$250 mil. ● Non-operational: ~26% adj. tax rate, ~$105 mil. net interest expense, ~79.5 mil. avg. shares outstanding, assuming dilution ● Changing from 52/53-week fiscal year to calendar year end on 12/31/2025 (~2 extra working days in 2025) ● Q1 adj. EPS up slightly vs. prior year, including impact of currency; earnings growth to strengthen rest of year January 30, 2025 Preliminary & unaudited, Q4 & FY 2024 financial review and analysis 13

2025 Adjusted EPS Drivers 7%-12% adj. EPS growth ex. currency $9.80-$10.20 ~$0.10 ~$0.60-$0.90 + Share count Tax rate $9.43 ~($0.25-$0.30) - Net Interest + Volume/mix + Net productivity + Restructuring - Employee costs - Investments January 30, 2025 Preliminary & unaudited, Q4 & FY 2024 financial review and analysis 14

Appendix Summary Financials & Reconciliation of Non-GAAP Financial Measures from GAAP September 18, 2024 Avery Dennison 2024 Investor Day 15 Classification: Avery Dennison - Secret

Progress vs. 2025 long-term targets 2020-2025 2020-2024 TARGETS RESULTS (1) Sales Growth Ex. Currency 7% 4-YR CAGR 5%+ 8% 4-YR CAGR (1)(2) Adjusted EBITDA Growth 6.5% ~9% ex-curr. 16%+ 16.4% Adjusted EBITDA Margin in 2025 in 2024 7.4% 4-YR CAGR (1) Adjusted EPS Growth 10% ~9% ex-curr. 16% ROTC 18%+ in 2024 (1) Percentages for targets reflect five-year compound annual growth rates, with 2020 and 2023 as the base periods. Percentages for results reflect four-year compound annual growth rates with 2020 as the base period. (2) Although adjusted EBITDA growth was not one of our original financial targets, it was implied by our sales growth ex. currency and adjusted EBITDA margin targets. January 30, 2025 Preliminary & unaudited, Q4 & FY 2024 financial review and analysis 16

Fourth quarter 2024 sales and margin comparisons Sales Change Reported Ex. Currency Organic Materials Group 3.7% 3.7% 3.7% Solutions Group 3.2% 3.1% 2.6% Total Company 3.6% 3.5% 3.3% Reported Adjusted Adjusted Operating Margin Operating Margin EBITDA Margin 4Q24 4Q23 4Q24 4Q23 4Q24 4Q23 Materials Group 14.7% 12.0% 14.8% 14.0% 17.0% 16.2% Solutions Group 9.1% 10.2% 11.4% 11.6% 17.8% 18.2% Total Company 12.0% 10.4% 12.8% 12.4% 16.4% 16.0% January 30, 2025 Preliminary & unaudited, Q4 & FY 2024 financial review and analysis 17

Full year 2024 sales and margin comparisons Sales Change Reported Ex. Currency Organic Materials Group 3.5% 3.7% 3.7% Solutions Group 7.4% 8.2% 6.1% Total Company 4.7% 5.1% 4.5% Reported Adjusted Adjusted Operating Margin Operating Margin EBITDA Margin 4Q24 4Q23 4Q24 4Q23 4Q24 4Q23 Materials Group 14.7% 12.1% 15.4% 13.6% 17.6% 15.8% Solutions Group 9.2% 6.5% 10.5% 9.9% 17.2% 16.6% Total Company 11.9% 9.4% 12.8% 11.5% 16.4% 15.1% January 30, 2025 Preliminary & unaudited, Q4 & FY 2024 financial review and analysis 18

Quarterly sales trend analysis 4Q23 1Q24 2Q24 3Q24 4Q24 Reported Sales Change 4.2% 4.2% 6.9% 4.1% 3.6% Organic Sales Change 1.1% 3.1% 7.1% 4.3% 3.3% Acquisitions/Divestitures 1.4% 1.1% 0.9% 0.3% 0.2% (1) Sales Change Ex. Currency 2.5% 4.2% 8.0% 4.7% 3.5% Currency Translation 1.6% 0.0% (1.1%) (0.6%) 0.1% (1) Reported Sales Change 4.2% 4.2% 6.9% 4.1% 3.6% (1) Totals may not sum due to rounding January 30, 2025 Preliminary & unaudited, Q4 & FY 2024 financial review and analysis 19

Quarterly sales trend analysis (cont.) Organic Sales Change 4Q23 1Q24 2Q24 3Q24 4Q24 Materials Group (3.9%) 1.9% 5.6% 3.6% 3.7% Solutions Group 13.9% 5.8% 10.8% 6.0% 2.6% Total Company 1.1% 3.1% 7.1% 4.3% 3.3% Total Company 2.5% 4.2% 8.0% 4.7% 3.5% Sales Change Ex. Currency January 30, 2025 Preliminary & unaudited, Q4 & FY 2024 financial review and analysis 20

Sales Change Ex. Currency and Organic Sales Change – Avery Dennison (1) (1) (1) Totals may not sum due to rounding January 30, 2025 Preliminary & unaudited, Q4 & FY 2024 financial review and analysis 21

Adjusted operating margin and EBITDA – Avery Dennison (1) (1) GAAP adjustments for 2015 reflect the previously disclosed impact of the third quarter of 2015 revision to certain benefit plan balances, which had an immaterial impact on the non-GAAP amounts. January 30, 2025 Preliminary & unaudited, Q4 & FY 2024 financial review and analysis 22

Adjusted EPS (1) The adjusted tax rate was 25.9%, 25.8%, 24.7%, 25.0%, 24.1%, and 24.6% for 2024, 2023, 2022, 2021, 2020, and 2019, respectively. (1) Includes restructuring and related charges, transaction and related costs, gain/(loss) on venture investments, gain/(loss) on sale of assets, gain on sale of product line, outcomes of legal matters and settlements, net, losses from Argentine peso remeasurement and Blue Chip Swap transactions, and other items. January 30, 2025 Preliminary & unaudited, Q4 & FY 2024 financial review and analysis 23

Return on total capital (ROTC) January 30, 2025 Preliminary & unaudited, Q4 & FY 2024 financial review and analysis 24

Adj. EBITDA and adj. EPS change ex. currency – Avery Dennison (1) (1) (1) Totals may not sum due to rounding January 30, 2025 Preliminary & unaudited, Q4 & FY 2024 financial review and analysis 25

averydennison.com #MakingPossible © 2025 Avery Dennison Corporation. All rights reserved. The “Making Possible” tagline, Avery Dennison and all other Avery Dennison brands, product names and codes are trademarks of Avery Dennison Corporation. All other brands or product names are trademarks of their respective owners. Fortune 500® is a trademark of Time, Inc. Branding and other information on any January 30, 2025 Preliminary & unaudited, Q4 & FY 2024 financial review and anal samples depict ysis ed ar e fictitious. Any resemblance to actual names is purely coincidental. 26