UNITED STATES
SECURITIES AND EXCHANGE COMMISSION
Washington, D.C. 20549
FORM N-CSR
CERTIFIED SHAREHOLDER REPORT OF REGISTERED
MANAGEMENT INVESTMENT COMPANIES
Investment Company Act file number | 811-06515 |
|
Morgan Stanley Global Fixed Income Opportunities Fund |
(Exact name of registrant as specified in charter) |
|
522 Fifth Avenue, New York, New York | | 10036 |
(Address of principal executive offices) | | (Zip code) |
|
John H. Gernon
522 Fifth Avenue, New York, New York 10036 |
(Name and address of agent for service) |
|
Registrant’s telephone number, including area code: | 212-296-0289 | |
|
Date of fiscal year end: | October 31, | |
|
Date of reporting period: | October 31, 2019 | |
| | | | | | | | |
Item 1 - Report to Shareholders

INVESTMENT MANAGEMENT
Morgan Stanley Global Fixed
Income Opportunities Fund
Annual Report
October 31, 2019
Beginning on January 1, 2021, as permitted by regulations adopted by the Securities and Exchange Commission ("SEC"), paper copies of the Fund's Annual and Semi-Annual Reports to Shareholders ("Shareholder Reports") will no longer be sent by mail, unless you specifically request paper copies of the Shareholder Reports from the Fund or from your financial intermediary, such as a broker-dealer or a bank. Instead, the Shareholder Reports will be made available on the Fund's website, https://www.morganstanley.com/im/shareholderreports and you will be notified by mail each time a Shareholder Report is posted and provided with a website link to access the Shareholder Report. If you already elected to receive Shareholder Reports electronically, you will not be affected by this change and you need not take any action. You may elect to receive Shareholder Reports and other communications from the Fund electronically anytime by contacting your financial intermediary or, if you are a direct investor, please follow the instructions on the envelope.
Beginning on January 1, 2019, you may elect to receive all future Shareholder Reports in paper free of charge. If you invest through a financial intermediary, you can contact your financial intermediary to request that you continue to receive paper copies of your Shareholder Reports. If you invest directly with the Fund, please follow the instructions on the envelope to let the Fund know you wish to continue receiving paper copies of your Shareholder Reports. Your election to receive Shareholder Reports in paper will apply to all funds held in your account if you invest through your financial intermediary or all funds held with the fund complex if you invest directly with a fund.

Morgan Stanley Global Fixed Income Opportunities Fund
Table of Contents
Welcome Shareholder | | | 3 | | |
Fund Report | | | 4 | | |
Performance Summary | | | 10 | | |
Expense Example | | | 12 | | |
Portfolio of Investments | | | 14 | | |
Statement of Assets and Liabilities | | | 43 | | |
Statement of Operations | | | 45 | | |
Statements of Changes in Net Assets | | | 47 | | |
Notes to Financial Statements | | | 48 | | |
| Financial Highlights | | | 70 | | |
| Report of Independent Registered Public Accounting Firm | | | 76 | | |
| Investment Advisory Agreement Approval | | | 77 | | |
| Privacy Notice | | | 80 | | |
| Trustee and Officer Information | | | 83 | | |
2
Welcome Shareholder,
We are pleased to provide this Annual Report, in which you will learn how your investment in Morgan Stanley Global Fixed Income Opportunities Fund (the "Fund") performed during the latest twelve-month period. It includes an overview of the market conditions and discusses some of the factors that affected performance during the reporting period. In addition, the report contains financial statements and a list of portfolio holdings.
Morgan Stanley Investment Management is a client-centric, investor-led organization. Our global presence, intellectual capital, and breadth of products and services enable us to partner with investors to meet the evolving challenges of today's financial markets. We aim to deliver superior investment service and to empower our clients to make the informed decisions that help them reach their investment goals.
As always, we thank you for selecting Morgan Stanley Investment Management and look forward to working with you in the months and years ahead.
This material must be preceded or accompanied by a prospectus for the fund being offered.
Market forecasts provided in this report may not necessarily come to pass. There is no assurance that the Fund will achieve its investment objective. The Fund is subject to market risk, which is the possibility that market values of securities owned by the Fund will decline and, therefore, the value of the Fund's shares may be less than what you paid for them. Accordingly, you can lose money investing in this Fund. Please see the prospectus for more complete information on investment risks.
3
Fund Report (unaudited)
For the year ended October 31, 2019
Total Return for the 12 Months Ended October 31, 2019 | |
Class A | | Class L | | Class I | | Class C | | Class IS | | Class IR | |
| | 8.55 | % | | | 8.25 | % | | | 8.93 | % | | | 7.77 | % | | | 9.01 | % | | | 9.00 | % | |
Bloomberg Barclays
Global Aggregate
(Hedged USD)
Index1 | | Global Fixed Income
Opportunities Blend
Index2 | | Lipper Global
Income Funds
Index3 | |
| | 10.67 | % | | | 10.67 | % | | | 8.51 | % | |
The performance of Morgan Stanley Global Fixed Income Opportunities Fund's (the "Fund") six share classes varies because each has different expenses. The Fund's total returns assume the reinvestment of all distributions but do not reflect the deduction of any applicable sales charges. Such costs would lower performance. See Performance Summary for standardized performance and benchmark information.
Market Conditions
Markets experienced a relief rally in the reporting period as headwinds subsided and 10-year U.S. Treasury yields fell to 2.18% at the end of October 2019 from 3.14% at the end of October 2018.(i) Risk assets across fixed income and equity markets rallied in this period with credit spreads tightening and yields falling. While some headwinds may have dissipated, they neither disappeared nor turned into tailwinds. The outlook for global growth started to improve over the last few months of the reporting period. The Federal Reserve (Fed) is now perceived to be on hold through at least 2020 after cutting interest rates three times over the last several months. Despite the fact that some of the
geopolitical issues impacting the markets — such as Brexit and U.S. China trade disputes — seemed to get better in October 2019, the final outcomes of these events are uncertain.
Performance Analysis
All share classes of the Fund underperformed the Bloomberg Barclays Global Aggregate (Hedged USD) Index (the "Index") and the Global Fixed Income Opportunities Blend Index for the 12 months ended October 31, 2019, assuming no deduction of applicable sales charges. The Fund's Class A, I, IS and IR shares outperformed and Class L and Class C shares underperformed the Lipper Global Income Funds Index for the same 12-month period, assuming no deduction of applicable sales charges.
Relative to the Index, the Fund benefited from an overweight duration position, which was advantageous as interest rates declined over the 12-month period, particularly in the last few months. On an absolute return basis, the Fund benefited from both macro and sector spread (non-government bond positioning) decisions. Within macro decisions, U.S. dollar interest rate exposure was beneficial, as was exposure to peripheral European debt, Australia and selected emerging market (EM) interest rates (Mexico, South Africa, Brazil, Peru, Egypt and Indonesia). Conversely, EM currency exposure in Argentina, Mexico, Chile and Hungary detracted from performance.
(i) Source: Bloomberg L.P. Data as of October 31, 2019.
4
Within non-government bonds, exposure to corporate debt across both the high yield and investment grade segments contributed to performance, as did exposure to bank loans and convertible debt. Securitized debt exposure was also beneficial to absolute performance, especially non-agency residential mortgage-backed securities. Conversely, derivative exposure to credit default swaps detracted from performance in the period.
With no further evidence of additional monetary policy easing around the world, it was not surprising that bond yields drifted upward toward the end of the reporting period, although in a quite ragged pattern, prolonging investors' whiplash-like experience. What we are experiencing is a lot of high-frequency volatility with little evidence of a trend. This experience is likely to continue as we approach a fork in the road: data will get better as geopolitical risks will recede, or we will return to trade war concerns and deteriorating economic fundamentals.
This ragged performance also permeated credit markets. Investment grade spreads narrowed and emerging market yields fell, which we found to be appropriate when considering the better economics and geopolitics. Surprisingly, U.S. high yield spreads widened even as U.S. equities made new highs.
The developed bond market sell-off that began in September 2019 continued in the second half of October 2019, with non-U.S. yields again hit the hardest. This time the culprit can be laid at the door of two factors: (1) better economic data, generally speaking, or at least optimism that data was troughing; and (2) growing optimism that the U.S. and China would cut
a trade deal, ending, at least for now, risks of escalation.
We are cautiously optimistic that the market is correct in starting to price a bottoming of the economic data. In our minds, this optimism is based on two interrelated factors, factors that investors should always remember. First, economic data does not deteriorate forever. Trip wires are triggered, which endogenously tends to slow the descent, especially when there are no obvious large imbalances in the world. Second, and distinctly related to the first, monetary policy globally has eased substantially in 2019. This is a normal policy response to a deterioration in economic conditions, both current and expected.
The U.S. monetary policy response has been significant and unusual in that unemployment is at record lows, unemployment claims are not rising, the economy is growing and inflation is not falling. The Fed has never before cut rates three times in such conditions. Its actions are truly pre-emptive and should significantly improve the chances of an acceleration of growth in 2020. Other central bank responses have not been so out of character and can, in some ways, be viewed as lagged responses to actual deterioration in economic conditions. But the bottom line is that economies now have a lot more support than they did 12 months ago, and we believe no recession is likely for the foreseeable future. If only that pesky trade war would go away.
However, let's not get too carried away with our optimism, as there are many potholes in the road ahead. Evidence of a growth turnaround is still scarce. Trend
5
growth has fallen. The full employment real interest rate has fallen along with growth. Capital expenditure is still weak, as the long-term U.S.-China relationship remains to be decided and animal spirits are definitely scarce. Moreover, while manufacturing/industrial activity may be bottoming, the service side of the global economy is still gently weakening. Since this is a much larger share of the global economy, if services do not turn around in the months ahead, our optimism might be misplaced. Labor markets, as we have discussed in the past, remain key. If household economies continue to grow, we may be alright. Otherwise, expect more rate cuts.
The outlook for monetary policy is probably the easiest to predict, at least in the short term. Rates are low and they are likely going to stay low. The hurdle to raise rates is much higher than it is to cut them. For now, central banks have done their duty. They responded in what we would call a fairly aggressive way to actual slowdowns and risks of further economic deterioration. We expect no further changes in the fourth quarter of 2019 and probably in the first quarter of 2020 as well. It will take time to see how effective 2019's rate cuts have been and how the U.S.-China trade negotiations and Brexit develop. In the interim, expect to see data dependency and vigilance being the watch words. And, since further rate cuts are likely to be in response to worse data, they might not be so benignly interpreted by financial markets, meaning while bad news equals rate cuts, this does not mean rate cuts equal equity/high yield rallies. Bad news is bad news.
During this period of intense uncertainty, we continue to look for signs/indicators showing how the situation is going to evolve. We continue to believe the yield curve is the best barometer of market confidence. We think a measure of success, e.g., reflation, would be a steepening of yield curves. If monetary stimulus is working, curves should steepen.
In the short term, we seem to be coming into a period of greater calm. The U.S. and China appeared to be close to a "Phase 1" deal; a hard Brexit is seemingly off the table. There has been no global recession. All we can do is reiterate our opinion. We intend to be close to home (e.g., neutral) with a small optimistic bias. We believe it is best to keep risks balanced, with not too much rate risk and not too much credit risk. Yields and credit are buys on weakness, in our opinion. And we continue to focus on bottom-up security and country selection where we believe fundamentals are sound and valuations are reasonable.
There is no guarantee that any sectors mentioned will continue to perform as discussed herein or that securities in such sectors will be held by the Fund in the future.
6
PORTFOLIO COMPOSITION* as of 10/31/19 | |
Corporate Bonds | | | 30.5 | % | |
Sovereign | | | 22.8 | | |
Asset-Backed Securities | | | 15.5 | | |
Short-Term Investments | | | 12.3 | | |
Mortgages — Other | | | 10.3 | | |
U.S. Treasury Securities | | | 3.0 | | |
Senior Loan Interests | | | 2.8 | | |
Commercial Mortgage-Backed Securities | | | 2.6 | | |
Collateralized Mortgage Obligations —
Agency Collateral Series | | | 0.2 | | |
Agency Fixed Rate Mortgages | | | 0.0 | ** | |
* Percentages indicated are based upon total investments (excluding Securities held as Collateral on Loaned Securities) as of October 31, 2019. Does not include open long/short futures contracts with a value of $123,606,921 and net unrealized appreciation of $197,447. Does not include open foreign currency forward exchange contracts with net unrealized depreciation of $2,512,243 and does not include open swap agreement with total unrealized depreciation of $37,251.
** Amount is less than 0.05%.
LONG-TERM CREDIT ANALYSIS as of 10/31/19 | |
AAA | | | 12.1 | % | |
AA | | | 3.2 | | |
A | | | 15.6 | | |
BBB | | | 24.4 | | |
BB | | | 14.8 | | |
B or Below | | | 13.3 | | |
Not Rated | | | 16.6 | | |
Subject to change daily. Provided for informational purposes only and should not be deemed as a recommendation to buy or sell the types of securities mentioned above. All percentages for portfolio composition are stated as a percentage of total investments and all percentages for long-term credit analysis are stated as a percentage of total long-term investments.
Security ratings disclosed with the exception for those labeled "not rated" have been rated by at least one Nationally Recognized Statistical Rating Organization ("NRSRO"). These ratings are obtained from Standard & Poor's Ratings Group ("S&P"), Moody's Investors Services, Inc. ("Moody's") or Fitch Ratings ("Fitch"). If two or more NRSROs have assigned a rating to a security, the highest rating is used and if securities are not rated, Morgan Stanley Investment Management Inc. (the "Adviser") has deemed them to be of comparable quality. Ratings from Moody's or Fitch, when used, are converted into their equivalent S&P rating.
Morgan Stanley is a full-service securities firm engaged in securities trading and brokerage activities, investment banking, research and analysis, financing and financial advisory services.
7
Investment Strategy
The Fund will normally invest at least 80 percent of its assets in a portfolio of fixed-income securities. This policy may be changed without shareholder approval; however, you would be notified upon 60 days' notice in writing of any changes. The Fund's "Adviser," Morgan Stanley Investment Management Inc., and/or "Sub-Adviser," Morgan Stanley Investment Management Limited, will allocate the Fund's investments among the following asset classes or market segments: (1) corporate securities, (2) residential and commercial mortgage-backed securities, (3) asset-backed securities, (4) emerging market securities, (5) convertible securities, (6) U.S. government securities and foreign sovereign debt, and (7) derivatives, including interest rate-related derivatives and currency derivatives. Securities may be rated either investment grade or below investment grade and denominated in any currency, hedged or un-hedged. The amount of the Fund's assets committed to any one asset class or market segment will fluctuate. However, the Fund may invest up to 65% of its net assets in any one asset class or market segment. The Adviser and Sub-Adviser have the flexibility to select any combination of at least two asset classes of the aforementioned groups depending upon market conditions and the current economic environment and, as a result, at any given time the Fund's assets may be invested in certain groups and not others.
For More Information About Portfolio Holdings
Each Morgan Stanley fund provides a complete schedule of portfolio holdings in its Semi-Annual and Annual Reports within 60 days of the end of the fund's second and fourth fiscal quarters. The Semi-Annual Reports and the Annual Reports are filed electronically with the Securities and Exchange Commission (SEC) on Form N-CSRS and Form N-CSR, respectively. Morgan Stanley also delivers the Semi-Annual and Annual Reports to fund shareholders and makes these reports available on its public web site, www.morganstanley.com/im/shareholderreports. Each Morgan Stanley non-money market fund also files a complete schedule of portfolio holdings with the SEC for the fund's first and third fiscal quarters as an attachment to Form N-PORT. Morgan Stanley does not deliver the reports for the first and third fiscal quarters to shareholders, nor are the reports posted to the Morgan Stanley public web site. However, the holdings for each money market fund are posted to the money market public website. You may, however, obtain the Form N-PORT filings (as well as the Form N-CSR and N-CSRS filings) by accessing the SEC's web site, http://www.sec.gov. You can also request copies of these materials, upon payment of a duplicating fee, by electronic request at the SEC's e-mail address (publicinfo@sec.gov).
8
Proxy Voting Policy and Procedures and Proxy Voting Record
You may obtain a copy of the Fund's Proxy Voting Policy and Procedures without charge, upon request, by calling toll free (800) 548-7786 or by visiting the Mutual Fund Center on our web site at www.morganstanley.com/im/shareholderreports. It is also available on the SEC's web site at http://www.sec.gov.
You may obtain information regarding how the Fund voted proxies relating to portfolio securities during the most recent twelve-month period ended June 30 without charge by visiting the Mutual Fund Center on our web site at www.morganstanley.com/im/shareholderreports. This information is also available on the SEC's web site at http://www.sec.gov.
Householding Notice
To reduce printing and mailing costs, the Fund attempts to eliminate duplicate mailings to the same address. The Fund delivers a single copy of certain shareholder documents, including shareholder reports, prospectuses and proxy materials, to investors with the same last name who reside at the same address. Your participation in this program will continue for an unlimited period of time unless you instruct us otherwise. You can request multiple copies of these documents by calling (800) 548-7786, 8:00 a.m. to 6:00 p.m., ET. Once our Customer Service Center has received your instructions, we will begin sending individual copies for each account within 30 days.
9
Performance Summary (unaudited)
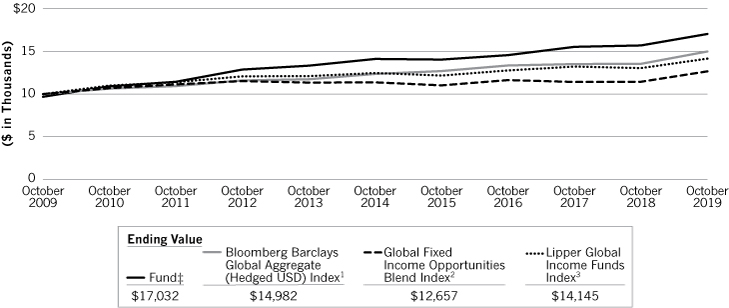
Performance of $10,000 Investment—Class A
Over 10 Years
10
Average Annual Total Returns—Period Ended October 31, 2019 (unaudtied) | |
Symbol | | Class A Shares*
(since 07/28/97)
DINAX | | Class L Shares**
(since 07/28/97)
DINCX | | Class I Shares***
(since 07/28/97)
DINDX | | Class C Shares†
(since 04/30/15)
MSIPX | | Class IS Shares††
(since 09/13/13)
MGFOX | | Class IR Shares†††
(since 06/15/18)
MFIRX | |
1 Year
| | | 8.55
4.955 | %4 | | | 8.25
— | %4 | | | 8.93
— | %4 | | | 7.77
6.775 | %4 | | | 9.01
— | %4 | | | 9.00
— | %4 | |
5 Years
| | | 3.844
3.175 | | | | 3.594
— | | | | 4.154
— | | | | —
— | | | | 4.214
— | | | | —
— | | |
10 Years
| | | 5.814
5.475 | | | | 5.434
— | | | | 6.124
— | | | | —
— | | | | —
— | | | | —
— | | |
Since
Inception | | | 4.164
4.005 | | | | 3.644
— | | | | 4.444
— | | | | 3.134
3.135 | | | | 5.064
— | | | | 6.704
— | | |
Performance data quoted represents past performance, which is no guarantee of future results and current performance may be lower or higher than the figures shown. For most recent month-end performance figures, please visit www.morganstanley.com/im/shareholderreports or speak with your Financial Advisor. Investment returns and principal value will fluctuate and fund shares, when redeemed, may be worth more or less than their original cost. The graph and table do not reflect the deduction of taxes that a shareholder would pay on fund distributions or the redemption of fund shares. Performance for Class A, Class L, Class I, Class C, Class IS and Class IR shares will vary due to differences in sales charges and expenses. See the Fund's current prospectus for complete details on fees and sales charges.
* The maximum front-end sales charge for Class A is 3.25%. Effective August 1, 2019, the maximum front-end sales charge changed from 4.25% to 3.25%.
** Class L has no sales charge. Class L shares are closed to new investments.
*** Class I has no sales charge.
† The maximum contingent deferred sales charge for Class C is 1.0% for shares redeemed within one year of purchase.
†† Class IS has no sales charge.
††† Class IR has no sales charge.
(1) The Bloomberg Barclays Global Aggregate (Hedged USD) Index provides a broad-based measure of the global investment grade fixed-rate debt markets. Currency exposure is hedged to the U.S. dollar. The Index is unmanaged and its returns do not include any sales charges or fees. Such costs would lower performance. It is not possible to invest directly in an index.
(2) The Global Fixed Income Opportunities Blend Index is a performance linked benchmark of the old and new benchmark of the Fund. Old benchmark represented by Bloomberg Barclays Global Aggregate Index (unhedged USD)(a benchmark that provides a broad-based measure of the global investment grade fixed rate debt markets with returns in unhedged USD) from the Fund's inception to December 31, 2016 and the new benchmark represented by Bloomberg Barclays Global Aggregate (Hedged USD) Index for periods thereafter. The Index is unmanaged and its returns do not include any sales charges or fees. Such costs would lower performance. It is not possible to invest directly in an index.
(3) The Lipper Global Income Funds Index is an equally weighted performance index of the largest qualifying funds (based on net assets) in the Lipper Global Income Funds classification. The Index, which is adjusted for capital gains distributions and income dividends, is unmanaged and should not be considered an investment. There are currently 30 funds represented in this Index. The Fund was in the Lipper Global Income Funds classification as of the date of this report.
(4) Figure shown assumes reinvestment of all distributions and does not reflect the deduction of any sales charges.
(5) Figure shown assumes reinvestment of all distributions and the deduction of the maximum applicable sales charge. See the Fund's current prospectus for complete details on fees and sales charges.
‡ Ending value assuming a complete redemption on October 31, 2019.
11
Expense Example (unaudited)
As a shareholder of the Fund, you incur two types of costs: (1) transaction costs, including sales charges (loads) on purchase payments; and (2) ongoing costs, which may include advisory fees, administration fees, distribution and shareholder services (12b-1) fees, and other Fund expenses. This example is intended to help you understand your ongoing costs (in dollars) of investing in the Fund and to compare these costs with the ongoing costs of investing in other mutual funds.
This example is based on an investment of $1,000 invested at the beginning of the period and held for the entire period 05/01/19 – 10/31/19.
Actual Expenses
The first line of the table on the following page provides information about actual account values and actual expenses. You may use the information in this line, together with the amount you invested, to estimate the expenses that you paid over the period. Simply divide your account value by $1,000 (for example, an $8,600 account value divided by $1,000 = 8.6), then multiply the result by the number in the first line under the heading entitled "Expenses Paid During Period" to estimate the expenses you paid on your account during this period.
Hypothetical Example for Comparison Purposes
The second line of the table on the following page provides information about hypothetical expenses based on the Fund's actual expense ratio and an assumed rate of return of 5% per year before expenses, which is not the Fund's actual return. The hypothetical account values and expenses may not be used to estimate the actual ending account balance or expenses you paid for the period. You may use this information to compare the ongoing cost of investing in the Fund and other funds. To do so, compare this 5% hypothetical example with the 5% hypothetical examples that appear in the shareholder reports of the other funds.
Please note that the expenses shown in the table are meant to highlight your ongoing costs only and do not reflect any transactional costs, such as sales charges (loads). Therefore, the second line of the table is useful in comparing ongoing costs, and will not help you determine the relative total cost of owning different funds. In addition, if these transactional costs were included, your costs would have been higher.
12
Expense Example (unaudited) continued
| | | Beginning
Account Value | | Ending
Account Value | | Expenses Paid
During Period(1) | |
| | | 05/01/19 | | 10/31/19 | | 05/01/19 –
10/31/19 | |
Class A | |
Actual (4.33% return) | | $ | 1,000.00 | | | $ | 1,043.30 | | | $ | 4.48 | | |
Hypothetical (5% annual return before expenses) | | $ | 1,000.00 | | | $ | 1,020.82 | | | $ | 4.43 | | |
Class L | |
Actual (4.36% return) | | $ | 1,000.00 | | | $ | 1,043.60 | | | $ | 6.03 | | |
Hypothetical (5% annual return before expenses) | | $ | 1,000.00 | | | $ | 1,019.31 | | | $ | 5.96 | | |
Class I | |
Actual (4.60% return) | | $ | 1,000.00 | | | $ | 1,046.00 | | | $ | 3.15 | | |
Hypothetical (5% annual return before expenses) | | $ | 1,000.00 | | | $ | 1,022.13 | | | $ | 3.11 | | |
Class C | |
Actual (3.95% return) | | $ | 1,000.00 | | | $ | 1,039.50 | | | $ | 8.33 | | |
Hypothetical (5% annual return before expenses) | | $ | 1,000.00 | | | $ | 1,017.04 | | | $ | 8.24 | | |
Class IS | |
Actual (4.64% return) | | $ | 1,000.00 | | | $ | 1,046.40 | | | $ | 2.68 | | |
Hypothetical (5% annual return before expenses) | | $ | 1,000.00 | | | $ | 1,022.58 | | | $ | 2.65 | | |
Class IR | |
Actual (4.64% return) | | $ | 1,000.00 | | | $ | 1,046.40 | | | $ | 2.68 | | |
Hypothetical (5% annual return before expenses) | | $ | 1,000.00 | | | $ | 1,022.58 | | | $ | 2.65 | | |
(1) Expenses are equal to the Fund's annualized expense ratios of 0.87%, 1.17%, 0.61%, 1.62%, 0.52% and 0.52% for Class A, Class L, Class I, Class C, Class IS and Class IR shares, respectively, multiplied by the average account value over the period and multiplied by 184/365 (to reflect the one-half year period). If the Fund had borne all of its expenses, the annualized expense ratios would have been 0.88%, 1.18%, 0.62%, 1.63%, 0.53% and 32.47% for Class A, Class L, Class I, Class C, Class IS and Class IR shares, respectively.
13
Morgan Stanley Global Fixed Income Opportunities Fund
Portfolio of Investments n October 31, 2019
PRINCIPAL
AMOUNT
(000) | |
| | COUPON
RATE | | MATURITY
DATE | | VALUE | |
| | | Corporate Bonds (30.5%) | |
| | | Australia (1.5%) | |
| | | Basic Materials | |
$ | 1,275 | | | Newcastle Coal Infrastructure Group Pty Ltd. (a) | | | 4.40 | % | | 09/29/27 | | $ | 1,279,561 | | |
| | | Consumer, Non-Cyclical | |
| | 1,550 | | | Woolworths Group Ltd. (a) | | | 4.00 | | | 09/22/20 | | | 1,574,149 | | |
| | | Energy | |
EUR | 1,000 | | | APT Pipelines Ltd. | | | 2.00 | | | 03/22/27 | | | 1,212,235 | | |
$ | 1,200 | | | APT Pipelines Ltd. (a) | | | 4.20 | | | 03/23/25 | | | 1,278,706 | | |
| | 2,875 | | | Santos Finance Ltd. | | | 4.125 | | | 09/14/27 | | | 2,931,678 | | |
| | | | 5,422,619 | | |
| | | Finance | |
| | 1,375 | | | Macquarie Group Ltd. (a) | | | 4.15 | | | 03/27/24 | | | 1,451,771 | | |
| | | Industrials | |
EUR | 1,600 | | | Aurizon Network Pty Ltd. | | | 3.125 | | | 06/01/26 | | | 2,055,326 | | |
| | | | | Total Australia | | | | | | | 11,783,426 | | |
| | | Belgium (0.5%) | |
| | | Basic Materials | |
| | 1,000 | | | Solvay Finance SA | | | 5.118 | | | (b) | | | 1,195,629 | | |
| | 700 | | | Solvay Finance SA | | | 5.425 | | | (b) | | | 897,310 | | |
| | | | 2,092,939 | | |
| | | Consumer, Non-Cyclical | |
$ | 1,500 | | | Anheuser-Busch InBev Worldwide, Inc. | | | 4.75 | | | 01/23/29 | | | 1,744,672 | | |
| | | | | Total Belgium | | | | | | | 3,837,611 | | |
| | | Brazil (0.6%) | |
| | | Basic Materials | |
| | 1,160 | | | Braskem Netherlands Finance BV (a) | | | 4.50 | | | 01/31/30(c) | | | 1,150,720 | | |
| | | Consumer, Non-Cyclical | |
| | 1,225 | | | Minerva Luxembourg SA (a) | | | 5.875 | | | 01/19/28 | | | 1,251,950 | | |
| | | Energy | |
| | 2,300 | | | Petrobras Global Finance BV (a) | | | 5.093 | | | 01/15/30 | | | 2,440,300 | | |
| | | | | Total Brazil | | | | | | | 4,842,970 | | |
See Notes to Financial Statements
14
Morgan Stanley Global Fixed Income Opportunities Fund
Portfolio of Investments n October 31, 2019 continued
PRINCIPAL
AMOUNT
(000) | |
| | COUPON
RATE | | MATURITY
DATE | | VALUE | |
| | | Canada (1.3%) | |
| | | Basic Materials | |
$ | 1,525 | | | Eldorado Gold Corp. (a) | | | 9.50 | % | | 06/01/24 | | $ | 1,654,625 | | |
| | 1,000 | | | IAMGOLD Corp. (a) | | | 7.00 | | | 04/15/25 | | | 1,037,500 | | |
| | 1,600 | | | NOVA Chemicals Corp. (a) | | | 4.875 | | | 06/01/24 | | | 1,630,000 | | |
| | | | 4,322,125 | | |
| | | Energy | |
| | 425 | | | Baytex Energy Corp. (a)(d) | | | 5.125 | | | 06/01/21 | | | 418,625 | | |
| | | Finance | |
| | 1,825 | | | Bank of Nova Scotia (The) | | | 2.00 | | | 11/15/22 | | | 1,822,171 | | |
| | 1,750 | | | National Bank of Canada (a)(d) | | | 2.15 | | | 10/07/22 | | | 1,753,911 | | |
| | 1,450 | | | Toronto-Dominion Bank (The) (d) | | | 1.90 | | | 12/01/22 | | | 1,446,949 | | |
| | | | 5,023,031 | | |
| | | Industrials | |
| | 750 | | | Bombardier, Inc. (a) | | | 7.45 | | | 05/01/34 | | | 697,500 | | |
| | | | | Total Canada | | | | | | | 10,461,281 | | |
| | | Chile (0.2%) | |
| | | Energy | |
| | 1,300 | | | Geopark Ltd. (a) | | | 6.50 | | | 09/21/24 | | | 1,347,138 | | |
| | | China (1.1%) | |
| | | Basic Materials | |
| | 1,080 | | | CNAC HK Finbridge Co. Ltd. | | | 3.875 | | | 06/19/29 | | | 1,112,659 | | |
| | 1,000 | | | Syngenta Finance N.V. (a) | | | 4.441 | | | 04/24/23 | | | 1,044,531 | | |
| | | | 2,157,190 | | |
| | | Communications | |
| | 2,000 | | | Baidu, Inc. | | | 2.875 | | | 07/06/22 | | | 2,013,645 | | |
| | 2,100 | | | Tencent Holdings Ltd. (a) | | | 3.595 | | | 01/19/28 | | | 2,191,912 | | |
| | | | 4,205,557 | | |
| | | Finance | |
| | 1,720 | | | Country Garden Holdings Co. Ltd. | | | 7.25 | | | 04/08/26 | | | 1,870,811 | | |
| | | | | Total China | | | | | | | 8,233,558 | | |
| | | Colombia (0.0%) | |
| | | Communications | |
| | 325 | | | Millicom International Cellular SA | | | 6.625 | | | 10/15/26 | | | 353,438 | | |
See Notes to Financial Statements
15
Morgan Stanley Global Fixed Income Opportunities Fund
Portfolio of Investments n October 31, 2019 continued
PRINCIPAL
AMOUNT
(000) | |
| | COUPON
RATE | | MATURITY
DATE | | VALUE | |
| | | Denmark (0.1%) | |
| | | Finance | |
$ | 850 | | | Danske Bank A/S (a) | | | 5.00 | % | | 01/12/22 | | $ | 895,840 | | |
| | | France (1.7%) | |
| | | Consumer, Non-Cyclical | |
EUR | 500 | | | Eurofins Scientific SE | | | 4.875 | | | (b) | | | 581,187 | | |
| | 1,150 | | | Europcar Mobility Group | | | 4.125 | | | 11/15/24 | | | 1,218,080 | | |
| | | | 1,799,267 | | |
| | | Energy | |
| | 1,600 | | | TOTAL SA | | | 2.708 | | | (b) | | | 1,910,797 | | |
$ | 600 | | | TOTAL SA, FP | | | 0.50 | | | 12/02/22 | | | 632,808 | | |
| | | | 2,543,605 | | |
| | | Finance | |
EUR | 1,700 | | | AXA SA | | | 3.25 | | | 05/28/49 | | | 2,157,166 | | |
| | 1,500 | | | BNP Paribas SA | | | 2.875 | | | 10/01/26 | | | 1,907,443 | | |
$ | 1,875 | | | BPCE SA (a) | | | 5.15 | | | 07/21/24 | | | 2,062,671 | | |
EUR | 2,000 | | | Credit Agricole Assurances SA | | | 4.50 | | | (b) | | | 2,510,704 | | |
| | | | 8,637,984 | | |
| | | Industrials | |
| | 500 | | | Orange SA | | | 5.00 | | | (b) | | | 675,226 | | |
| | | | | Total France | | | | | | | 13,656,082 | | |
| | | Germany (1.5%) | |
| | | Consumer, Cyclical | |
$ | 1,300 | | | Daimler Finance North America LLC (a) | | | 2.70 | | | 06/14/24 | | | 1,315,450 | | |
EUR | 1,400 | | | Volkswagen International Finance N.V. | | | 4.625 | | | (b) | | | 1,746,074 | | |
| | | | 3,061,524 | | |
| | | Consumer, Non-Cyclical | |
$ | 2,750 | | | Bayer US Finance LLC (a) | | | 3.00 | | | 10/08/21 | | | 2,788,624 | | |
| | | Finance | |
| | 1,550 | | | Deutsche Bank AG | | | 2.70 | | | 07/13/20 | | | 1,550,774 | | |
| | 2,625 | | | Deutsche Bank AG | | | 3.15 | | | 01/22/21 | | | 2,636,313 | | |
EUR | 1,200 | | | Muenchener Rueckversicherungs-Gesellschaft
AG in Muenchen | | | 3.25 | | | 05/26/49 | | | 1,579,750 | | |
| | | | 5,766,837 | | |
| | | | | Total Germany | | | | | | | 11,616,985 | | |
See Notes to Financial Statements
16
Morgan Stanley Global Fixed Income Opportunities Fund
Portfolio of Investments n October 31, 2019 continued
PRINCIPAL
AMOUNT
(000) | |
| | COUPON
RATE | | MATURITY
DATE | | VALUE | |
| | | India (0.5%) | |
| | | Communications | |
$ | 1,150 | | | Bharti Airtel International Netherlands BV (a) | | | 5.35 | % | | 05/20/24 | | $ | 1,212,988 | | |
| | 600 | | | Bharti Airtel Ltd. | | | 4.375 | | | 06/10/25 | | | 603,650 | | |
| | | | 1,816,638 | | |
| | | Energy | |
| | 1,800 | | | ONGC Videsh Vankorneft Pte Ltd. | | | 3.75 | | | 07/27/26 | | | 1,869,151 | | |
| | | | | Total India | | | | | | | 3,685,789 | | |
| | | Indonesia (0.2%) | |
| | | Energy | |
| | 1,700 | | | Pertamina Persero PT (a) | | | 3.65 | | | 07/30/29 | | | 1,749,042 | | |
| | | Ireland (0.4%) | |
| | | Industrials | |
EUR | 1,250 | | | Eircom Finance DAC | | | 3.50 | | | 05/15/26 | | | 1,464,279 | | |
$ | 1,275 | | | Park Aerospace Holdings Ltd. (a) | | | 5.25 | | | 08/15/22 | | | 1,360,999 | | |
| | | | | Total Ireland | | | | | | | 2,825,278 | | |
| | | Israel (0.2%) | |
| | | Consumer, Non-Cyclical | |
| | 1,625 | | | Teva Pharmaceutical Finance Netherlands III BV | | | 2.20 | | | 07/21/21 | | | 1,546,626 | | |
| | | Italy (1.4%) | |
| | | Finance | |
EUR | 1,700 | | | Assicurazioni Generali SpA | | | 5.50 | | | 10/27/47 | | | 2,285,839 | | |
| | 1,400 | | | Intesa Sanpaolo SpA | | | 1.125 | | | 07/14/25 | | | 1,674,024 | | |
$ | 1,000 | | | Intesa Sanpaolo SpA (a) | | | 6.50 | | | 02/24/21 | | | 1,050,239 | | |
| | 725 | | | UniCredit SpA (a) | | | 6.572 | | | 01/14/22 | | | 780,779 | | |
| | | | 5,790,881 | | |
| | | Utilities | |
| | 3,000 | | | Enel Finance International N.V. (a) | | | 4.25 | | | 09/14/23 | | | 3,189,528 | | |
EUR | 1,400 | | | Enel SpA | | | 2.50 | | | 11/24/78 | | | 1,622,023 | | |
| | | | 4,811,551 | | |
| | | | | Total Italy | | | | | | | 10,602,432 | | |
See Notes to Financial Statements
17
Morgan Stanley Global Fixed Income Opportunities Fund
Portfolio of Investments n October 31, 2019 continued
PRINCIPAL
AMOUNT
(000) | |
| | COUPON
RATE | | MATURITY
DATE | | VALUE | |
| | | Japan (0.1%) | |
| | | Communications | |
$ | 330 | | | SoftBank Group Corp. | | | 4.00 | % | | 09/19/29 | | $ | 377,366 | | |
| | 400 | | | SoftBank Group Corp. | | | 5.00 | | | 04/15/28 | | | 490,996 | | |
| | | | | Total Japan | | | | | | | 868,362 | | |
| | | Luxembourg (0.2%) | |
| | | Industrials | |
$ | 1,690 | | | Intelsat Jackson Holdings SA | | | 5.50 | | | 08/01/23 | | | 1,588,600 | | |
| | | Macau (0.2%) | |
| | | Consumer, Cyclical | |
| | 1,200 | | | Sands China Ltd. | | | 5.125 | | | 08/08/25 | | | 1,326,180 | | |
| | | Malaysia (0.3%) | |
| | | Consumer, Cyclical | |
| | 2,600 | | | Resorts World Las Vegas LLC/RWLV Capital, Inc. (a) | | | 4.625 | | | 04/16/29 | | | 2,739,136 | | |
| | | Mexico (0.2%) | |
| | | Energy | |
MXN | 1,500 | | | Petroleos Mexicanos | | | 2.50 | | | 08/21/21 | | | 1,722,737 | | |
| | | Netherlands (1.0%) | |
| | | Finance | |
EUR | 1,400 | | | ASR Nederland N.V. | | | 5.00 | | | (b) | | | 1,785,015 | | |
| | 1,625 | | | Cooperatieve Rabobank UA | | | 5.50 | | | (b) | | | 1,867,277 | | |
$ | 1,325 | | | ING Bank N.V. (a) | | | 5.80 | | | 09/25/23 | | | 1,473,513 | | |
EUR | 1,200 | | | NN Group | | | 4.50 | | | (b) | | | 1,501,940 | | |
| | | | 6,627,745 | | |
| | | Technology | |
$ | 1,250 | | | NXP Semiconductors N.V. | | | 1.00 | | | 12/01/19 | | | 1,374,278 | | |
| | | | | Total Netherlands | | | | | | | 8,002,023 | | |
| | | Peru (0.1%) | |
| | | Industrials | |
| | 700 | | | Lima Metro Line 2 Finance Ltd. (a) | | | 4.35 | | | 04/05/36 | | | 745,500 | | |
| | | Portugal (0.2%) | |
| | | Utilities | |
EUR | 1,000 | | | EDP - Energias de Portugal SA | | | 5.375 | | | 09/16/75 | | | 1,188,256 | | |
See Notes to Financial Statements
18
Morgan Stanley Global Fixed Income Opportunities Fund
Portfolio of Investments n October 31, 2019 continued
PRINCIPAL
AMOUNT
(000) | |
| | COUPON
RATE | | MATURITY
DATE | | VALUE | |
| | | South Africa (0.2%) | |
| | | Basic Materials | |
$ | 1,205 | | | SASOL Financing USA LLC | | | 6.50 | % | | 09/27/28 | | $ | 1,348,328 | | |
| | | Spain (1.3%) | |
| | | Communications | |
EUR | 1,000 | | | Telefonica Europe BV | | | 5.875 | | | (b) | | | 1,292,103 | | |
| | | Energy | |
| | 1,000 | | | Repsol International Finance BV | | | 4.50 | | | 03/25/75 | | | 1,283,608 | | |
| | | Finance | |
| | 1,000 | | | Banco Bilbao Vizcaya Argentaria SA | | | 6.75 | | | (b) | | | 1,132,357 | | |
| | 1,600 | | | Banco Santander SA | | | 3.125 | | | 01/19/27 | | | 2,047,040 | | |
| | 1,900 | | | CaixaBank SA | | | 2.25 | | | 04/17/30 | | | 2,191,971 | | |
| | | | 5,371,368 | | |
| | | Utilities | |
| | 900 | | | IE2 Holdco SAU | | | 2.875 | | | 06/01/26 | | | 1,132,843 | | |
| | 1,000 | | | NorteGas Energia Distribucion SAU | | | 2.065 | | | 09/28/27 | | | 1,199,473 | | |
| | | | 2,332,316 | | |
| | | | | Total Spain | | | | | | | 10,279,395 | | |
| | | Sweden (0.2%) | |
| | | Finance | |
| | 1,200 | | | Intrum AB | | | 3.125 | | | 07/15/24 | | | 1,360,717 | | |
| | | Switzerland (1.0%) | |
| | | Basic Materials | |
$ | 2,200 | | | Glencore Funding LLC (a)(d) | | | 3.875 | | | 10/27/27 | | | 2,276,036 | | |
| | | Finance | |
| | 1,125 | | | Credit Suisse Group Funding Guernsey Ltd. | | | 4.55 | | | 04/17/26 | | | 1,244,026 | | |
| | 1,375 | | | UBS AG | | | 5.125 | | | 05/15/24 | | | 1,483,380 | | |
| | | | 2,727,406 | | |
| | | Industrials | |
CHF | 1,300 | | | Sika AG | | | 0.15 | | | 06/05/25 | | | 1,500,040 | | |
| | | Technology | |
$ | 800 | | | STMicroelectronics N.V., B | | | 0.25 | | | 07/03/24 | | | 1,038,840 | | |
| | | | | Total Switzerland | | | | | | | 7,542,322 | | |
See Notes to Financial Statements
19
Morgan Stanley Global Fixed Income Opportunities Fund
Portfolio of Investments n October 31, 2019 continued
PRINCIPAL
AMOUNT
(000) | |
| | COUPON
RATE | | MATURITY
DATE | | VALUE | |
| | | United Kingdom (2.2%) | |
| | | Consumer, Non-Cyclical | |
$ | 1,800 | | | BAT Capital Corp. | | | 3.222 | % | | 08/15/24 | | $ | 1,828,588 | | |
| | 1,850 | | | Imperial Brands Finance PLC (a) | | | 3.125 | | | 07/26/24 | | | 1,862,721 | | |
| | 1,725 | | | Vodafone Group PLC | | | 4.875 | | | 06/19/49 | | | 1,946,992 | | |
| | | | 5,638,301 | | |
| | | Energy | |
GBP | 900 | | | BP Capital Markets PLC | | | 2.274 | | | 07/03/26 | | | 1,235,290 | | |
| | | Finance | |
EUR | 1,700 | | | Aviva PLC | | | 3.875 | | | 07/03/44 | | | 2,092,720 | | |
$ | 975 | | | HSBC Holdings PLC | | | 3.95 | | | 05/18/24 | | | 1,023,629 | | |
| | 1,000 | | | HSBC Holdings PLC | | | 4.375 | | | 11/23/26 | | | 1,081,487 | | |
GBP | 1,500 | | | Lloyds Banking Group PLC | | | 2.25 | | | 10/16/24 | | | 1,998,005 | | |
$ | 650 | | | Lloyds Banking Group PLC | | | 4.375 | | | 03/22/28 | | | 718,551 | | |
EUR | 900 | | | Lloyds Banking Group PLC | | | 6.375 | | | (b) | | | 1,035,644 | | |
$ | 1,425 | | | Santander UK PLC (a) | | | 5.00 | | | 11/07/23 | | | 1,534,327 | | |
| | | | 9,484,363 | | |
| | | Utilities | |
GBP | 750 | | | NGG Finance PLC | | | 5.625 | | | 06/18/73 | | | 1,090,731 | | |
| | | | | Total United Kingdom | | | | | | | 17,448,685 | | |
| | | United States (12.1%) | |
| | | Communications | |
EUR | 1,100 | | | AT&T, Inc. | | | 1.80 | | | 09/05/26 | | | 1,333,711 | | |
GBP | 800 | | | AT&T, Inc. | | | 2.90 | | | 12/04/26 | | | 1,107,457 | | |
$ | 675 | | | AT&T, Inc. | | | 4.50 | | | 03/09/48 | | | 723,079 | | |
| | 1,100 | | | Booking Holdings, Inc. (d) | | | 0.90 | | | 09/15/21 | | | 1,295,567 | | |
| | 743 | | | Charter Communications Operating LLC/Charter
Communications Operating Capital | | | 4.20 | | | 03/15/28 | | | 789,720 | | |
| | 900 | | | Charter Communications Operating LLC/Charter
Communications Operating Capital | | | 4.908 | | | 07/23/25 | | | 992,345 | | |
| | 750 | | | CSC Holdings LLC | | | 5.25 | | | 06/01/24 | | | 810,000 | | |
| | 2,000 | | | Fox Corp. (a) | | | 4.709 | | | 01/25/29 | | | 2,277,268 | | |
| | 700 | | | Gray Television, Inc. (a) | | | 5.125 | | | 10/15/24 | | | 727,125 | | |
| | 1,000 | | | MDC Partners, Inc. (a) | | | 6.50 | | | 05/01/24 | | | 961,250 | | |
| | 785 | | | Palo Alto Networks, Inc. | | | 0.75 | | | 07/01/23 | | | 867,396 | | |
| | 2,700 | | | Sprint Spectrum Co., LLC/Sprint Spectrum Co., II
LLC/Sprint Spectrum Co., III LLC (a) | | | 4.738 | | | 09/20/29 | | | 2,885,652 | | |
| | | | 14,770,570 | | |
See Notes to Financial Statements
20
Morgan Stanley Global Fixed Income Opportunities Fund
Portfolio of Investments n October 31, 2019 continued
PRINCIPAL
AMOUNT
(000) | |
| | COUPON
RATE | | MATURITY
DATE | | VALUE | |
| | | Consumer, Cyclical | |
$ | 1,427 | | | American Axle & Manufacturing, Inc. (d) | | | 6.50 | % | | 04/01/27 | | $ | 1,357,434 | | |
| | 1,000 | | | Century Communities, Inc. | | | 5.875 | | | 07/15/25 | | | 1,045,000 | | |
| | 725 | | | Diamond Resorts International, Inc. (a) | | | 10.75 | | | 09/01/24 | | | 754,000 | | |
| | 575 | | | Enterprise Development Authority (The) (a) | | | 12.00 | | | 07/15/24 | | | 632,500 | | |
| | 2,000 | | | Ford Motor Credit Co., LLC | | | 3.336 | | | 03/18/21 | | | 2,011,957 | | |
| | 1,875 | | | General Motors Financial Co., Inc. | | | 4.30 | | | 07/13/25 | | | 1,959,512 | | |
| | 425 | | | Global Partners LP/GLP Finance Corp. | | | 7.00 | | | 06/15/23 | | | 440,719 | | |
| | 936 | | | Guitar Center, Inc. (a)(e) | | | 13.00 | | | 04/15/22 | | | 744,120 | | |
EUR | 1,275 | | | International Game Technology PLC | | | 3.50 | | | 06/15/26 | | | 1,512,660 | | |
$ | 1,100 | | | Las Vegas Sands Corp. | | | 3.50 | | | 08/18/26 | | | 1,122,801 | | |
| | 1,475 | | | MGM Resorts International | | | 5.50 | | | 04/15/27 | | | 1,626,187 | | |
| | 3,904 | | | Resort at Summerlin LP, B (e)(f)(g)(h)(i)(j) | | | 13.00 | | | 12/15/07 | | | — | | |
| | 650 | | | Rite Aid Corp. (a) | | | 6.125 | | | 04/01/23 | | | 555,782 | | |
| | 750 | | | Speedway Motorsports, Inc. | | | 5.125 | | | 02/01/23 | | | 768,750 | | |
| | | | 14,531,422 | | |
| | | Consumer, Non-Cyclical | |
| | 1,650 | | | Avis Budget Car Rental LLC/Avis Budget Finance,
Inc. (a) | | | 5.75 | | | 07/15/27 | | | 1,693,313 | | |
| | 1,800 | | | Bristol-Myers Squibb Co. (a) | | | 2.90 | | | 07/26/24 | | | 1,866,578 | | |
| | 775 | | | Cigna Corp. (a) | | | 3.05 | | | 10/15/27 | | | 780,995 | | |
| | 925 | | | Cigna Corp. (a) | | | 4.125 | | | 09/15/20 | | | 941,553 | | |
| | 3,125 | | | CVS Health Corp. | | | 3.70 | | | 03/09/23 | | | 3,260,148 | | |
| | 1,725 | | | Diamond Sports Group LLC/Diamond Sports
Finance Co. (a)(d) | | | 6.625 | | | 08/15/27 | | | 1,781,063 | | |
| | 1,050 | | | Intercept Pharmaceuticals, Inc. | | | 3.25 | | | 07/01/23 | | | 925,079 | | |
| | 925 | | | Jazz Investments I Ltd. | | | 1.875 | | | 08/15/21 | | | 926,144 | | |
| | 500 | | | Post Holdings, Inc. (a) | | | 5.50 | | | 12/15/29 | | | 528,350 | | |
| | 575 | | | Tenet Healthcare Corp. | | | 5.125 | | | 05/01/25 | | | 590,094 | | |
| | | | 13,293,317 | | |
| | | Energy | |
| | 2,350 | | | Concho Resources, Inc. | | | 4.30 | | | 08/15/28 | | | 2,538,001 | | |
| | 975 | | | Global Partners LP/GLP Finance Corp. (a) | | | 7.00 | | | 08/01/27 | | | 1,016,603 | | |
| | 1,100 | | | Hilcorp Energy I LP/Hilcorp Finance Co. (a) | | | 6.25 | | | 11/01/28 | | | 981,750 | | |
| | 3,725 | | | Occidental Petroleum Corp. | | | 2.90 | | | 08/15/24 | | | 3,763,022 | | |
| | 750 | | | Rockies Express Pipeline LLC (a) | | | 6.875 | | | 04/15/40 | | | 795,075 | | |
| | 1,000 | | | Sabine Pass Liquefaction LLC | | | 5.625 | | | 02/01/21 | | | 1,032,329 | | |
| | | | 10,126,780 | | |
See Notes to Financial Statements
21
Morgan Stanley Global Fixed Income Opportunities Fund
Portfolio of Investments n October 31, 2019 continued
PRINCIPAL
AMOUNT
(000) | |
| | COUPON
RATE | | MATURITY
DATE | | VALUE | |
| | | Finance | |
$ | 975 | | | Air Lease Corp. | | | 3.375 | % | | 06/01/21 | | $ | 993,348 | | |
| | 2,600 | | | Bank of America Corp., MTN | | | 4.25 | | | 10/22/26 | | | 2,825,068 | | |
| | 1,450 | | | Brighthouse Financial, Inc. | | | 3.70 | | | 06/22/27 | | | 1,425,784 | | |
| | 3,050 | | | Citigroup, Inc. | | | 5.50 | | | 09/13/25 | | | 3,491,586 | | |
| | 1,950 | | | Discover Bank | | | 2.45 | | | 09/12/24 | | | 1,954,775 | | |
EUR | 1,800 | | | Goldman Sachs Group, Inc. (The) | | | 2.00 | | | 11/01/28 | | | 2,221,092 | | |
$ | 500 | | | Icahn Enterprises LP/Icahn Enterprises
Finance Corp. | | | 6.25 | | | 05/15/26 | | | 531,250 | | |
| | 400 | | | Icahn Enterprises LP/Icahn Enterprises
Finance Corp. | | | 6.375 | | | 12/15/25 | | | 421,000 | | |
| | 625 | | | Jefferies Finance LLC/JFIN Co-Issuer Corp. (a) | | | 6.25 | | | 06/03/26 | | | 643,750 | | |
| | 2,125 | | | JPMorgan Chase & Co. | | | 4.125 | | | 12/15/26 | | | 2,322,178 | | |
| | 800 | | | JPMorgan Chase Bank NA | | | 0.00 | (k) | | 12/30/20 | | | 925,506 | | |
| | 999 | | | Kennedy-Wilson, Inc. | | | 5.875 | | | 04/01/24 | | | 1,038,960 | | |
| | 1,000 | | | Lions Gate Capital Holdings LLC (a) | | | 5.875 | | | 11/01/24 | | | 947,500 | | |
| | 575 | | | Post Holdings, Inc. (a) | | | 5.00 | | | 08/15/26 | | | 600,214 | | |
EUR | 1,000 | | | Prologis Euro Finance LLC | | | 1.875 | | | 01/05/29 | | | 1,248,077 | | |
$ | 1,075 | | | Synchrony Bank | | | 3.00 | | | 06/15/22 | | | 1,090,519 | | |
| | | | 22,680,607 | | |
| | | Industrials | |
| | 1,350 | | | Berry Global, Inc. (a) | | | 4.50 | | | 02/15/26 | | | 1,361,812 | | |
| | 1,775 | | | Boeing Co. (The) | | | 2.70 | | | 02/01/27 | | | 1,804,471 | | |
| | 895 | | | Grinding Media, Inc./Moly-Cop AltaSteel Ltd. (a) | | | 7.375 | | | 12/15/23 | | | 868,150 | | |
| | 1,475 | | | Mauser Packaging Solutions Holding Co. (a) | | | 7.25 | | | 04/15/25 | | | 1,416,000 | | |
| | | | 5,450,433 | | |
| | | Technology | |
| | 831 | | | Akamai Technologies, Inc. | | | 0.125 | | | 05/01/25 | | | 934,875 | | |
| | 1,000 | | | Allscripts Healthcare Solutions, Inc. | | | 1.25 | | | 07/01/20 | | | 992,216 | | |
| | 2,150 | | | Dell International LLC/EMC Corp. (a) | | | 4.00 | | | 07/15/24 | | | 2,253,307 | | |
EUR | 1,500 | | | Fidelity National Information Services, Inc. | | | 1.50 | | | 05/21/27 | | | 1,779,831 | | |
$ | 3,000 | | | International Business Machines Corp. | | | 3.00 | | | 05/15/24 | | | 3,117,620 | | |
EUR | 790 | | | IQVIA, Inc. | | | 3.25 | | | 03/15/25 | | | 903,630 | | |
$ | 1,275 | | | Nuance Communications, Inc. | | | 1.00 | | | 12/15/35 | | | 1,245,836 | | |
| | 1,275 | | | Splunk, Inc. | | | 0.50 | | | 09/15/23 | | | 1,390,673 | | |
| | | | 12,617,988 | | |
See Notes to Financial Statements
22
Morgan Stanley Global Fixed Income Opportunities Fund
Portfolio of Investments n October 31, 2019 continued
PRINCIPAL
AMOUNT
(000) | |
| | COUPON
RATE | | MATURITY
DATE | | VALUE | |
| | | Utilities | |
$ | 1,190 | | | Florida Power & Light Co.,
3 Month USD LIBOR + 0.40% | | | 2.639 | (l)% | | 05/06/22 | | $ | 1,190,071 | | |
| | | | | Total United States | | | | | | | 94,661,188 | | |
| | | | | Total Corporate Bonds (Cost $235,112,913) | | | | | | | 238,258,925 | | |
| | | Sovereign (22.9%) | |
| | | Angola (0.3%) | |
| | 2,000 | | | Angolan Government International Bond | | | 8.25 | | | 05/09/28 | | | 2,094,070 | | |
| | | Australia (2.1%) | |
AUD | 12,000 | | | Australia Government Bond | | | 2.75 | | | 11/21/28 | | | 9,424,749 | | |
| | 8,200 | | | Australia Government Bond | | | 3.25 | | | 04/21/29 | | | 6,724,689 | | |
| | | | | Total Australia | | | | | | | 16,149,438 | | |
| | | Austria (0.6%) | |
EUR | 2,200 | | | Republic of Austria Government Bond (a) | | | 2.10 | | | 09/20/17 | | | 4,302,764 | | |
| | | Bermuda (0.0%) | |
$ | 262 | | | Bermuda Government International Bond (a) | | | 4.854 | | | 02/06/24 | | | 286,238 | | |
| | | Brazil (2.5%) | |
BRL | 34,200 | | | Brazil Notas do Tesouro Nacional, F | | | 10.00 | | | 01/01/29 | | | 10,550,997 | | |
| | 30,450 | | | Brazil Notas do Tesouro Nacional, F | | | 10.00 | | | 01/01/27 | | | 9,188,552 | | |
| | | | | Total Brazil | | | | | | | 19,739,549 | | |
| | | Croatia (0.6%) | |
EUR | 3,200 | | | Croatia Government International Bond | | | 2.75 | | | 01/27/30 | | | 4,323,044 | | |
| | | Ecuador (0.3%) | |
$ | 2,120 | | | Ecuador Government International Bond | | | 8.875 | | | 10/23/27 | | | 1,981,405 | | |
| | | Egypt (0.5%) | |
EUR | 2,400 | | | Egypt Government International Bond (a) | | | 4.75 | | | 04/16/26 | | | 2,751,239 | | |
| | 1,300 | | | Egypt Government International Bond (a) | | | 6.375 | | | 04/11/31 | | | 1,510,966 | | |
| | | | | Total Egypt | | | | | | | 4,262,205 | | |
| | | El Salvador (0.1%) | |
$ | 1,150 | | | Republic Of El Salvador (a) | | | 7.125 | | | 01/20/50 | | | 1,170,988 | | |
| | | Ghana (0.1%) | |
| | 1,100 | | | Ghana Government International Bond (a) | | | 8.95 | | | 03/26/51 | | | 1,115,758 | | |
See Notes to Financial Statements
23
Morgan Stanley Global Fixed Income Opportunities Fund
Portfolio of Investments n October 31, 2019 continued
PRINCIPAL
AMOUNT
(000) | |
| | COUPON
RATE | | MATURITY
DATE | | VALUE | |
| | | Greece (2.3%) | |
EUR | 400 | | | Hellenic Republic Government Bond (a) | | | 1.875 | % | | 07/23/26 | | $ | 478,562 | | |
| | 8,600 | | | Hellenic Republic Government Bond (a) | | | 3.375 | | | 02/15/25 | | | 11,010,881 | | |
| | 2,600 | | | Hellenic Republic Government Bond (a) | | | 3.45 | | | 04/02/24 | | | 3,288,103 | | |
| | 2,300 | | | Hellenic Republic Government Bond (a) | | | 3.875 | | | 03/12/29 | | | 3,180,856 | | |
| | | | | Total Greece | | | | | | | 17,958,402 | | |
| | | Hungary (0.9%) | |
HUF | 1,145,000 | | | Hungary Government Bond | | | 3.00 | | | 08/21/30 | | | 4,280,476 | | |
EUR | 2,100 | | | Hungary Government International Bond | | | 1.75 | | | 10/10/27 | | | 2,641,875 | | |
| | | | | Total Hungary | | | | | | | 6,922,351 | | |
| | | Indonesia (3.0%) | |
| | 2,400 | | | Indonesia Government International Bond | | | 1.45 | | | 09/18/26 | | | 2,774,888 | | |
| | 1,600 | | | Indonesia Government International Bond | | | 1.75 | | | 04/24/25 | | | 1,871,737 | | |
IDR | 53,761,000 | | | Indonesia Treasury Bond | | | 6.125 | | | 05/15/28 | | | 3,663,888 | | |
| | 41,573,000 | | | Indonesia Treasury Bond | | | 7.00 | | | 09/15/30 | | | 2,943,014 | | |
| | 138,261,000 | | | Indonesia Treasury Bond | | | 8.25 | | | 05/15/29 | | | 10,733,868 | | |
$ | 1,200 | | | Perusahaan Listrik Negara PT (a)(d) | | | 6.25 | | | 01/25/49 | | | 1,538,436 | | |
| | | | | Total Indonesia | | | | | | | 23,525,831 | | |
| | | Jamaica (0.1%) | |
| | 870 | | | Jamaica Government International Bond | | | 8.00 | | | 03/15/39 | | | 1,154,390 | | |
| | | Korea, Republic of (0.2%) | |
| | 1,490 | | | Korea Gas Corp. (a) | | | 2.875 | | | 07/16/29 | | | 1,543,696 | | |
| | | Mexico (2.6%) | |
MXN | 309,000 | | | Mexican Bonos | | | 8.50 | | | 05/31/29 | | | 18,012,645 | | |
$ | 1,900 | | | Petroleos Mexicanos (a) | | | 6.49 | | | 01/23/27 | | | 2,030,625 | | |
| | | | | Total Mexico | | | | | | | 20,043,270 | | |
| | | New Zealand (0.6%) | |
NZD | 6,000 | | | New Zealand Government Bond | | | 3.00 | | | 04/20/29 | | | 4,423,741 | | |
| | | Nigeria (0.7%) | |
$ | 1,500 | | | Africa Finance Corp. (a) | | | 4.375 | | | 04/17/26 | | | 1,575,922 | | |
| | 3,510 | | | Nigeria Government International Bond (a) | | | 9.248 | | | 01/21/49 | | | 3,896,100 | | |
| | | | | Total Nigeria | | | | | | | 5,472,022 | | |
See Notes to Financial Statements
24
Morgan Stanley Global Fixed Income Opportunities Fund
Portfolio of Investments n October 31, 2019 continued
PRINCIPAL
AMOUNT
(000) | |
| | COUPON
RATE | | MATURITY
DATE | | VALUE | |
| | | Paraguay (0.2%) | |
$ | 1,660 | | | Paraguay Government International Bond | | | 4.70 | % | | 03/27/27 | | $ | 1,820,829 | | |
| | | Qatar (0.5%) | |
| | 2,900 | | | Qatar Government International Bond | | | 5.103 | | | 04/23/48 | | | 3,704,112 | | |
| | | Russia (0.5%) | |
RUB | 207,000 | | | Russian Federal Bond - OFZ | | | 7.95 | | | 10/07/26 | | | 3,546,206 | | |
| | | Senegal (0.4%) | |
$ | 2,950 | | | Senegal Government International Bond | | | 6.25 | | | 05/23/33 | | | 3,022,490 | | |
| | | South Africa (0.2%) | |
| | 1,500 | | | Eskom Holdings SOC Ltd. | | | 7.125 | | | 02/11/25 | | | 1,546,459 | | |
| | | Spain (1.5%) | |
EUR | 5,750 | | | Spain Government Bond (a) | | | 2.70 | | | 10/31/48 | | | 8,920,058 | | |
| | 1,600 | | | Spain Government Bond (a) | | | 3.45 | | | 07/30/66 | | | 2,982,288 | | |
| | | | | Total Spain | | | | | | | 11,902,346 | | |
| | | Supernational (0.3%) | |
$ | 2,390 | | | Banque Ouest Africaine de Developpement (a) | | | 4.70 | | | 10/22/31 | | | 2,410,996 | | |
| | | Sweden (1.0%) | |
SEK | 71,300 | | | Sweden Government Bond (a) | | | 0.75 | | | 11/12/29 | | | 8,034,348 | | |
| | | Ukraine (0.8%) | |
EUR | 1,400 | | | Ukraine Government International Bond (a) | | | 6.75 | | | 06/20/26 | | | 1,729,906 | | |
$ | 3,540 | | | Ukraine Government International Bond (a) | | | 9.75 | | | 11/01/28 | | | 4,220,190 | | |
| | | | | Total Ukraine | | | | | | | 5,950,096 | | |
| | | | | Total Sovereign (Cost $169,506,409) | | | | | | | 178,407,044 | | |
| | | Agency Fixed Rate Mortgages (0.0%) | |
| | 1 | | | Federal Home Loan Mortgage Corporation,
Gold Pool: | | | 6.50 | | | 10/01/32 | | | 813 | | |
| | | Federal National Mortgage Association,
Conventional Pools: | |
| | 34 | | | | | | | | 6.50 | | | 05/01/28 - 09/01/32 | | | 38,759 | | |
| | 4 | | | | | | | | 7.00 | | | 07/01/31 - 11/01/32 | | | 4,081 | | |
See Notes to Financial Statements
25
Morgan Stanley Global Fixed Income Opportunities Fund
Portfolio of Investments n October 31, 2019 continued
PRINCIPAL
AMOUNT
(000) | |
| | COUPON
RATE | | MATURITY
DATE | | VALUE | |
| | | Government National Mortgage Association,
Various Pools: | | | |
$ | 10 | | | | | | | | 7.50 | % | | 07/20/25 | | $ | 10,362 | | |
| | 32 | | | | | | | | 8.00 | | | 02/15/22 - 05/15/30 | | | 37,361 | | |
| | | | | Total Agency Fixed Rate Mortgages (Cost $85,595) | | | | | | | 91,376 | | |
| | | Asset-Backed Securities (15.5%) | | | |
| | 673 | | | Aaset Trust (a) | | | 3.844 | | | 05/15/39 | | | 681,327 | | |
| | 1,113 | | | ABFC Trust,
1 Month USD LIBOR + 1.05% | | | 2.873 | (l) | | 08/25/33 | | | 1,116,587 | | |
| | 1,464 | | | Accredited Mortgage Loan Trust,
1 Month USD LIBOR + 0.60% | | | 2.423 | (l) | | 04/25/34 | | | 1,453,457 | | |
| | | American Credit Acceptance Receivables Trust | | | |
| | 864 | | | (a) | | | 3.80 | | | 09/12/25 | | | 866,569 | | |
| | 650 | | | (a) | | | 5.02 | | | 12/10/24 | | | 665,211 | | |
| | 1,000 | | | American Homes 4 Rent (a) | | �� | 5.885 | | | 04/17/52 | | | 1,094,393 | | |
| | 1,500 | | | American Homes 4 Rent Trust (a) | | | 6.231 | | | 10/17/36 | | | 1,673,480 | | |
| | 1,400 | | | Aqua Finance Trust (a) | | | 3.47 | | | 07/16/40 | | | 1,411,569 | | |
| | 166 | | | Asset-Backed Securities Corp. Home Equity
Loan Trust,
1 Month USD LIBOR + 0.19% | | | 2.013 | (l) | | 03/25/36 | | | 159,575 | | |
| | | Avant Loans Funding Trust | | | |
| | 700 | | | (a) | | | 3.15 | | | 10/15/26 | | | 702,018 | | |
| | 1,075 | | | (a) | | | 5.00 | | | 11/17/25 | | | 1,095,935 | | |
| | | Bear Stearns Asset-Backed Securities Trust | | | |
| | 56 | | | 1 Month USD LIBOR + 0.32% | | | 2.143 | (l) | | 01/25/47 | | | 56,444 | | |
| | 326 | | | 1 Month USD LIBOR + 0.40% | | | 2.223 | (l) | | 09/25/46 | | | 313,747 | | |
| | 561 | | | | | | | | 4.322 | (l) | | 07/25/36 | | | 564,818 | | |
| | 702 | | | Bear Stearns Asset-Backed Securities I Trust,
1 Month USD LIBOR + 0.26% | | | 2.083 | (l) | | 10/25/36 | | | 657,171 | | |
| | 1,187 | | | Business Loan Express Business Loan Trust,
1 Month USD LIBOR + 0.40% (a) | | | 2.246 | (l) | | 10/20/40 | | | 1,114,706 | | |
| | 1,000 | | | Carnow Auto Receivables Trust (a) | | | 3.36 | | | 06/17/24 | | | 1,000,472 | | |
| | 1,393 | | | Chase Funding Loan Acquisition Trust | | | 5.50 | | | 08/25/34 | | | 1,443,551 | | |
| | 651 | | | CIM Small Business Loan Trust,
1 Month USD LIBOR + 1.40% (a) | | | 3.246 | (l) | | 03/20/43 | | | 649,934 | | |
| | 800 | | | Citigroup Mortgage Loan Trust, Inc.,
1 Month USD LIBOR + 2.00% (a) | | | 3.823 | (l) | | 07/25/44 | | | 862,953 | | |
| | 1,200 | | | CLUB Credit Trust (a) | | | 5.02 | | | 09/15/23 | | | 1,212,241 | | |
See Notes to Financial Statements
26
Morgan Stanley Global Fixed Income Opportunities Fund
Portfolio of Investments n October 31, 2019 continued
PRINCIPAL
AMOUNT
(000) | |
| | COUPON
RATE | | MATURITY
DATE | | VALUE | |
$ | 1,100 | | | Conn's Receivables Funding LLC (a) | | | 5.95 | % | | 11/15/22 | | $ | 1,109,716 | | |
| | | Consumer Loan Underlying Bond Credit Trust | | | |
| | 2,500 | | | (a) | | | 4.41 | | | 10/15/26 | | | 2,484,783 | | |
| | 1,031 | | | (a) | | | 5.21 | | | 07/15/25 | | | 1,055,594 | | |
| | 2,864 | | | Diamond Resorts Owner Trust (a) | | | 4.02 | | | 02/20/32 | | | 2,879,193 | | |
| | | DT Auto Owner Trust | | | |
| | 600 | | | (a) | | | 4.94 | | | 02/17/26 | | | 623,408 | | |
| | 1,100 | | | (a) | | | 5.33 | | | 11/17/25 | | | 1,150,215 | | |
| | 1,200 | | | (a) | | | 5.42 | | | 03/17/25 | | | 1,247,138 | | |
| | 548 | | | EMC Mortgage Loan Trust,
1 Month USD LIBOR + 1.00% (a) | | | 2.823 | (l) | | 11/25/30 | | | 550,950 | | |
| | | Exeter Automobile Receivables Trust | | | |
| | 2,000 | | | (a) | | | 4.00 | | | 08/17/26 | | | 2,026,945 | | |
| | 750 | | | | | | 5.20 | | | 01/15/26 | | | 785,675 | | |
| | 600 | | | (a) | | | 5.38 | | | 07/15/25 | | | 626,803 | | |
| | 600 | | | (a) | | | 5.43 | | | 08/15/24 | | | 630,750 | | |
| | | Finance of America Structured Securities Trust | | | |
| | 2,200 | | | (a) | | | 5.682 | (l) | | 04/25/29 | | | 2,232,767 | | |
| | 1,861 | | | (a) | | | 6.00 | (l) | | 09/25/28 | | | 1,848,345 | | |
| | 700 | | | First Investors Auto Owner Trust (a) | | | 5.36 | | | 01/15/25 | | | 736,225 | | |
| | | Flagship Credit Auto Trust | | | |
| | 500 | | | (a) | | | 5.10 | | | 05/15/25 | | | 516,654 | | |
| | 805 | | | (a) | | | 5.28 | | | 12/15/25 | | | 850,431 | | |
| | 1,300 | | | FREED ABS Trust (a) | | | 3.19 | | | 11/18/26 | | | 1,298,574 | | |
| | | GLS Auto Receivables Issuer Trust | | | |
| | 700 | | | (a) | | | 3.84 | | | 05/15/26 | | | 705,688 | | |
| | 550 | | | (a) | | | 4.94 | | | 12/15/25 | | | 573,996 | | |
| | 1,250 | | | GLS Auto Receivables Trust (a) | | | 5.02 | | | 01/15/25 | | | 1,287,349 | | |
| | | GSAA Home Equity Trust | | | |
| | 200 | | | 1 Month USD LIBOR + 1.88% | | | 3.698 | (l) | | 12/25/34 | | | 205,727 | | |
| | 483 | | | | | | | | 6.002 | | | 11/25/36 | | | 288,282 | | |
| | 1,400 | | | Home Partners of America Trust,
1 Month USD LIBOR + 2.35% (a) | | | 4.239 | (l) | | 07/17/37 | | | 1,399,715 | | |
| | 450 | | | InSite Issuer LLC (a) | | | 6.414 | | | 11/15/46 | | | 470,666 | | |
| | | Invitation Homes Trust | | | |
| | 1,500 | | | 1 Month USD LIBOR + 2.00% (a) | | | 3.889 | (l) | | 07/17/37 | | | 1,503,315 | | |
| | 1,900 | | | 1 Month USD LIBOR + 2.00% (a) | | | 3.914 | (l) | | 06/17/37 | | | 1,903,154 | | |
| | 643 | | | 1 Month USD LIBOR + 2.25% (a) | | | 4.139 | (l) | | 12/17/36 | | | 643,806 | | |
| | 800 | | | 1 Month USD LIBOR + 2.25% (a) | | | 4.139 | (l) | | 07/17/37 | | | 801,699 | | |
| | 271 | | | JOL Air Ltd. (Cayman Islands) (a) | | | 4.948 | | | 04/15/44 | | | 273,955 | | |
See Notes to Financial Statements
27
Morgan Stanley Global Fixed Income Opportunities Fund
Portfolio of Investments n October 31, 2019 continued
PRINCIPAL
AMOUNT
(000) | |
| | COUPON
RATE | | MATURITY
DATE | | VALUE | |
$ | 351 | | | MASTR Specialized Loan Trust,
1 Month USD LIBOR + 0.35% (a) | | | 2.173 | (l)% | | 05/25/37 | | $ | 297,306 | | |
| | 820 | | | METAL LLC (Cayman Islands) (a) | | | 4.581 | | | 10/15/42 | | | 833,393 | | |
| | 772 | | | MFA LLC (a) | | | 4.164 | | | 07/25/48 | | | 775,014 | | |
| | | Nationstar HECM Loan Trust | | | |
| | 700 | | | | | | 5.603 | | | 07/25/28 | | | 703,577 | | |
| | 2,500 | | | (a) | | | 5.804 | (l) | | 06/25/29 | | | 2,521,349 | | |
| | 3,200 | | | (a) | | | 6.00 | (l) | | 11/25/28 | | | 3,194,455 | | |
| | 377 | | | Nationstar Home Equity Loan Trust,
1 Month USD LIBOR + 0.25% | | | 2.073 | (l) | | 04/25/37 | | | 377,709 | | |
| | | New Residential Advance Receivables Trust | | | |
| | 1,184 | | | (a) | | | 3.055 | | | 10/20/52 | | | 1,189,323 | | |
| | 2,341 | | | (a) | | | 4.39 | | | 08/15/53 | | | 2,340,712 | | |
| | 548 | | | New Residential Mortgage LLC (a) | | | 4.69 | | | 05/25/23 | | | 555,767 | | |
| | | Newday Funding PLC, | | | |
GBP | 1,000 | | | 1 Month GBP SONIA + 3.00% (United Kingdom) (a) | | | 3.711 | (l) | | 09/15/27 | | | 1,298,437 | | |
| | 800 | | | 1 Month GBP LIBOR + 2.40% (United Kingdom) | | | 3.114 | (l) | | 12/15/26 | | | 1,043,372 | | |
$ | 1,052 | | | Newtek Small Business Loan Trust,
1 Month USD LIBOR + 1.70% (a) | | | 3.523 | (l) | | 02/25/44 | | | 1,054,090 | | |
| | 900 | | | NRZ Advance Receivables Trust (a) | | | 3.33 | | | 07/15/52 | | | 905,667 | | |
| | | NRZ Excess Spread-Collateralized Notes | | | |
| | 626 | | | (a) | | | 4.374 | | | 01/25/23 | | | 629,693 | | |
| | 1,040 | | | (a) | | | 4.593 | | | 02/25/23 | | | 1,050,216 | | |
| | 2,830 | | | Oakwood Mortgage Investors, Inc. | | | 7.405 | (l) | | 06/15/31 | | | 843,487 | | |
| | 500 | | | OnDeck Asset Securitization Trust LLC (a) | | | 4.52 | | | 04/18/22 | | | 504,845 | | |
| | 1,243 | | | Ownit Mortgage Loan Trust,
1 Month USD LIBOR + 0.27% | | | 2.093 | (l) | | 03/25/37 | | | 1,194,415 | | |
| | | PNMAC GMSR Issuer Trust | | | |
| | 1,100 | | | 1 Month USD LIBOR + 2.35% (a) | | | 4.173 | (l) | | 04/25/23 | | | 1,088,558 | | |
| | 1,807 | | | 1 Month USD LIBOR + 2.65% (a) | | | 4.473 | (l) | | 08/25/25 | | | 1,815,212 | | |
| | 800 | | | 1 Month USD LIBOR + 2.85% (a) | | | 4.673 | (l) | | 02/25/23 | | | 805,722 | | |
| | 578 | | | Pretium Mortgage Credit Partners LLC (a) | | | 4.826 | | | 09/25/58 | | | 582,650 | | |
| | | Progress Residential Trust | | | |
| | 1,100 | | | (a) | | | 4.38 | | | 03/17/35 | | | 1,119,188 | | |
| | 1,200 | | | (a) | | | 4.778 | | | 03/17/35 | | | 1,220,836 | | |
| | 800 | | | (a) | | | 4.836 | | | 12/17/34 | | | 813,110 | | |
| | 550 | | | (a) | | | 4.953 | | | 08/17/35 | | | 564,474 | | |
| | 1,000 | | | (a) | | | 5.35 | | | 08/17/34 | | | 1,034,885 | | |
| | 1,200 | | | (a) | | | 5.368 | | | 10/17/35 | | | 1,244,689 | | |
See Notes to Financial Statements
28
Morgan Stanley Global Fixed Income Opportunities Fund
Portfolio of Investments n October 31, 2019 continued
PRINCIPAL
AMOUNT
(000) | |
| | COUPON
RATE | | MATURITY
DATE | | VALUE | |
$ | 750 | | | Prosper Marketplace Issuance Trust | | | 4.87 | % | | 06/17/24 | | $ | 759,887 | | |
| | | PRPM LLC | | | |
| | 429 | | | (a) | | | 3.75 | (l) | | 04/25/23 | | | 431,077 | | |
| | 1,474 | | | (a) | | | 3.967 | | | 04/25/24 | | | 1,481,951 | | |
| | 1,380 | | | Raptor Aircraft Finance I LLC (a) | | | 4.213 | | | 08/23/44 | | | 1,380,305 | | |
| | | RCO V Mortgage LLC | | | |
| | 633 | | | (a) | | | 4.00 | | | 05/25/23 | | | 635,130 | | |
| | 1,001 | | | (a) | | | 4.458 | | | 10/25/23 | | | 1,011,225 | | |
| | 2,000 | | | RMF Buyout Issuance Trust | | | 6.00 | | | 11/25/28 | | | 1,956,398 | | |
| | | Skopos Auto Receivables Trust | | | |
| | 900 | | | (a) | | | 3.63 | | | 09/16/24 | | | 901,111 | | |
| | 1,600 | | | (a) | | | 4.77 | | | 04/17/23 | | | 1,622,412 | | |
EUR | 2,600 | | | SLM Student Loan Trust,
3 Month EURIBOR + 0.55% (United States) | | | 0.148 | (l) | | 01/25/40 | | | 2,676,591 | | |
$ | 607 | | | Sprite Ltd. (a) | | | 6.90 | | | 12/15/37 | | | 601,339 | | |
| | 800 | | | Stanwich Mortgage Loan Trust (a) | | | 4.50 | | | 10/18/23 | | | 807,164 | | |
| | 1,744 | | | START Ireland (Bermuda) (a) | | | 4.089 | | | 03/15/44 | | | 1,786,784 | | |
| | 1,136 | | | Start Ltd. (Bermuda) (a) | | | 4.089 | | | 05/15/43 | | | 1,164,941 | | |
| | | Tricon American Homes Trust | | | |
| | 1,000 | | | (a) | | | 4.216 | | | 01/17/36 | | | 1,027,042 | | |
| | 1,142 | | | (a) | | | 5.104 | | | 01/17/36 | | | 1,190,279 | | |
| | 700 | | | (a) | | | 5.151 | | | 09/17/34 | | | 725,217 | | |
| | 1,114 | | | (a) | | | 5.769 | | | 11/17/33 | | | 1,144,743 | | |
| | 1,083 | | | Truman Capital Mortgage Loan Trust,
1 Month USD LIBOR + 0.26% (a) | | | 2.083 | (l) | | 03/25/36 | | | 1,073,299 | | |
| | 800 | | | United Auto Credit Securitization Trust (a) | | | 4.29 | | | 08/12/24 | | | 811,109 | | |
| | 1,500 | | | Upgrade Receivables Trust (a) | | | 5.17 | | | 11/15/24 | | | 1,525,481 | | |
| | | Upstart Securitization Trust | | | |
| | 2,200 | | | (a) | | | 3.734 | | | 09/20/29 | | | 2,215,815 | | |
| | 1,100 | | | (a) | | | 5.59 | | | 03/20/25 | | | 1,121,091 | | |
| | 797 | | | (a) | | | 6.35 | | | 06/20/24 | | | 805,596 | | |
| | | Vericrest Opportunity Loan Trust | | | |
| | 2,247 | | | (a) | | | 3.179 | | | 10/25/49 | | | 2,247,261 | | |
| | 1,948 | | | (a) | | | 3.352 | | | 09/25/49 | | | 1,954,933 | | |
| | | Veros Automobile Receivables Trust | | | |
| | 1,300 | | | (a) | | | 3.98 | | | 04/17/23 | | | 1,299,482 | | |
| | 1,000 | | | (a) | | | 5.74 | | | 08/15/25 | | | 1,020,860 | | |
| | 691 | | | VOLT LXXII LLC (a) | | | 4.213 | | | 10/26/48 | | | 693,430 | | |
| | 2,000 | | | VOLT LXXX LLC (a) | | | 3.228 | | | 10/25/49 | | | 2,006,149 | | |
| | | | | Total Asset-Backed Securities (Cost $119,516,896) | | | | | | | 121,187,929 | | |
See Notes to Financial Statements
29
Morgan Stanley Global Fixed Income Opportunities Fund
Portfolio of Investments n October 31, 2019 continued
PRINCIPAL
AMOUNT
(000) | |
| | COUPON
RATE | | MATURITY
DATE | | VALUE | |
| | | Collateralized Mortgage Obligations - Agency Collateral Series (0.2%) | | | |
| | | Federal Home Loan Mortgage Corporation | | | |
$ | 219 | | | 1 Month USD LIBOR + 5.05% | | | 7.066 | (l)% | | 07/25/23 | | $ | 226,590 | | |
| | 197 | | | 1 Month USD LIBOR + 5.25% (a) | | | 7.266 | (l) | | 07/25/26 | | | 208,516 | | |
| | | | | IO | | | | | | | | | | | | | |
| | 12,000 | | | | | | | | 1.705 | (l) | | 01/25/41 | | | 611,864 | | |
| | | Federal National Mortgage Association, | | | |
| | | | | IO REMIC | | | | | | | | | | | | | |
| | 1,415 | | | | | | | | 2.055 | (l) | | 10/25/39 | | | 71,481 | | |
| | 1,048 | | | | | | | | 2.193 | (l) | | 03/25/44 | | | 55,890 | | |
| | 538 | | | 6.55% - 1 Month USD LIBOR | | | 4.727 | (o) | | 08/25/41 | | | 52,840 | | |
| | 1,583 | | | Government National Mortgage Association, IO | | | 4.404 | | | 12/20/42 | | | 310,112 | | |
| | | | | Total Collateralized Mortgage Obligations - Agency Collateral Series
(Cost $1,151,682) | | | | | | | 1,537,293 | | |
| | | Commercial Mortgage-Backed Securities (2.7%) | | | |
| | 681 | | | BX Trust, 1 Month USD LIBOR + 1.98% (a) | | | 3.889 | (l) | | 09/15/37 | | | 682,624 | | |
| | 761 | | | CG-CCRE Commercial Mortgage Trust,
1 Month USD LIBOR + 1.85% (a) | | | 3.768 | (l) | | 11/15/31 | | | 759,250 | | |
| | 1,200 | | | CLNS Trust,
1 Month USD LIBOR + 3.50% (a) | | | 5.427 | (l) | | 06/11/32 | | | 1,207,578 | | |
| | | COMM Mortgage Trust | | | |
| | 1,000 | | | (a) | | | 3.461 | (l) | | 08/10/29 | | | 991,020 | | |
| | 225 | | | (a) | | | 4.082 | (l) | | 03/10/46 | | | 226,625 | | |
| | 300 | | | | | | 4.639 | | | 02/10/47 | | | 300,451 | | |
| | 139 | | | (a) | | | 4.73 | (l) | | 07/15/47 | | | 140,619 | | |
| | 473 | | | (a) | | | 4.89 | (l) | | 11/10/46 | | | 493,145 | | |
| | | Commercial Mortgage Pass-Through Certificates | | | |
| | 335 | | | (a) | | | 4.639 | (l) | | 02/10/47 | | | 335,503 | | |
| | | | | IO | | | | | | | | | | | | | |
| | 3,518 | | | | | | | | 0.617 | (l) | | 02/10/47 | | | 79,900 | | |
| | 850 | | | Commercial Mortgage Trust (a) | | | 6.394 | (l) | | 06/10/36 | | | 728,633 | | |
| | 1,468 | | | COOF Securitization Trust, IO (a) | | | 2.548 | (l) | | 10/25/40 | | | 111,922 | | |
| | 9,936 | | | COOF Securitization Trust II, IO (a) | | | 2.347 | (l) | | 08/25/41 | | | 659,047 | | |
| | 31,675 | | | GS Mortgage Securities Corp. II, IO (a) | | | 0.457 | (l) | | 10/10/32 | | | 415,943 | | |
| | 1,500 | | | GS Mortgage Securities Trust (a) | | | 4.517 | (l) | | 11/10/47 | | | 1,342,011 | | |
| | 443 | | | InTown Hotel Portfolio Trust,
1 Month USD LIBOR + 2.05% (a) | | | 3.964 | (l) | | 01/15/33 | | | 443,505 | | |
| | 4,788 | | | JP Morgan Chase Commercial Mortgage
Securities Trust, IO | | | 0.959 | (l) | | 07/15/47 | | | 128,843 | | |
See Notes to Financial Statements
30
Morgan Stanley Global Fixed Income Opportunities Fund
Portfolio of Investments n October 31, 2019 continued
PRINCIPAL
AMOUNT
(000) | |
| | COUPON
RATE | | MATURITY
DATE | | VALUE | |
| | | JPMBB Commercial Mortgage Securities Trust | | | |
$ | 600 | | | (a) | | | 3.842 | (l)% | | 02/15/48 | | $ | 595,119 | | |
| | 136 | | | (a) | | | 3.963 | (l) | | 09/15/47 | | | 135,707 | | |
| | 405 | | | (a) | | | 4.68 | (l) | | 04/15/47 | | | 417,271 | | |
| | 472 | | | (a) | | | 10.978 | | | 08/15/48 | | | 483,211 | | |
| | | | | IO | | | | | | | | | | | | | |
| | 3,379 | | | | | | | | 1.006 | (l) | | 08/15/47 | | | 126,965 | | |
| | | KGS-Alpha SBA COOF Trust, | | | |
| | | | | IO | | | | | | | | | | | | | |
| | 1,157 | | | (a) | | | 2.693 | (l) | | 07/25/41 | | | 144,375 | | |
| | 1,298 | | | (a) | | | 3.135 | (l) | | 04/25/40 | | | 83,336 | | |
| | 500 | | | Multifamily Connecticut Avenue Securities Trust,
1 Month USD LIBOR + 1.70% (a) | | | 3.50 | (l) | | 10/15/49 | | | 503,612 | | |
| | | Natixis Commercial Mortgage Securities Trust | | | |
| | 2,500 | | | (a) | | | 4.299 | | | 10/15/36 | | | 2,520,694 | | |
| | 2,000 | | | (a) | | | 4.409 | (l) | | 02/15/39 | | | 2,184,945 | | |
| | 1,000 | | | SG Commercial Mortgage Securities Trust (a) | | | 4.509 | (l) | | 02/15/41 | | | 1,019,017 | | |
| | 1,645 | | | VMC Finance LLC,
1 Month USD LIBOR + 2.05% (a) | | | 4.25 | (l) | | 09/15/36 | | | 1,650,012 | | |
| | 900 | | | Wells Fargo Commercial Mortgage Trust (a) | | | 4.368 | (l) | | 04/15/50 | | | 901,072 | | |
| | | WFRBS Commercial Mortgage Trust | | | |
| | 419 | | | (a) | | | 3.994 | (l) | | 10/15/57 | | | 402,906 | | |
| | 541 | | | (a) | | | 5.023 | (l) | | 09/15/46 | | | 537,836 | | |
| | | | | Total Commercial Mortgage-Backed Securities (Cost $19,938,716) | | | | | | | 20,752,697 | | |
| | | Mortgages - Other (10.3%) | | | |
| | | Aggregator of Loans-Backed by Assets PLC | | | |
GBP | 400 | | | 1 Month GBP LIBOR + 2.10% (United Kingdom) | | | 2.814 | | | 04/24/49 | | | 518,847 | | |
| | 1,000 | | | 1 Month GBP LIBOR + 2.70% (United Kingdom) | | | 3.424 | | | 04/24/49 | | | 1,296,740 | | |
| | | Alternative Loan Trust | | | |
$ | 158 | | | 1 Month USD LIBOR + 0.18% | | | 2.003 | (l) | | 05/25/47 | | | 152,045 | | |
| | 373 | | | 1 Month USD LIBOR + 0.50% | | | 2.323 | (l) | | 10/25/35 | | | 298,075 | | |
| | 120 | | | | | | | | 3.204 | (l) | | 10/25/35 | | | 104,641 | | |
| | 231 | | | | | | | | 3.591 | (l) | | 05/25/36 | | | 189,092 | | |
| | 104 | | | | | | | | 4.139 | (l) | | 08/25/35 | | | 100,114 | | |
| | 29 | | | | | | | | 5.50 | | | 02/25/36 | | | 25,257 | | |
| | 418 | | | | | | | | 6.00 | | | 04/25/36 | | | 286,083 | | |
| | 224 | | | | | | | | 6.00 | | | 07/25/37 | | | 204,886 | | |
| | | | | PAC | | | | | | | | | | | | | |
| | 22 | | | | | | | | 5.50 | | | 02/25/36 | | | 19,412 | | |
| | 64 | | | | | | | | 6.00 | | | 04/25/36 | | | 51,971 | | |
See Notes to Financial Statements
31
Morgan Stanley Global Fixed Income Opportunities Fund
Portfolio of Investments n October 31, 2019 continued
PRINCIPAL
AMOUNT
(000) | |
| | COUPON
RATE | | MATURITY
DATE | | VALUE | |
$ | 2,593 | | | American Home Mortgage Investment Trust, IO | | | 2.078 | % | | 05/25/47 | | $ | 304,586 | | |
| | 157 | | | Banc of America Alternative Loan Trust,
1 Month USD LIBOR + 0.65% | | | 2.473 | (l) | | 07/25/46 | | | 126,733 | | |
| | | Banc of America Funding Trust | | | |
| | 100 | | | | | | | | 5.25 | | | 07/25/37 | | | 99,160 | | |
| | 1,000 | | | | | | | | 5.50 | | | 09/25/35 | | | 1,105,919 | | |
| | 83 | | | | | | | | 6.00 | | | 07/25/37 | | | 76,955 | | |
| | | BCAP LLC Trust | | | |
| | 110 | | | 1 Month USD LIBOR + 0.18% (a) | | | 2.198 | (l) | | 07/26/35 | | | 131,006 | | |
| | 151 | | | (a) | | | 4.091 | (l) | | 03/26/37 | | | 135,578 | | |
| | 476 | | | Bear Stearns Structured Products, Inc. Trust | | | 4.086 | (l) | | 01/26/36 | | | 446,785 | | |
| | | Bear Stearns Trust | | | |
| | 335 | | | | | | | | 3.796 | (l) | | 05/25/36 | | | 318,329 | | |
| | 77 | | | | | | | | 3.997 | (l) | | 05/25/47 | | | 74,451 | | |
| | | Cascade Funding Mortgage Trust | | | |
| | 1,000 | | | | | | | | 2.80 | | | 06/25/69 | | | 1,008,889 | | |
| | 1,663 | | | | | | | | 4.00 | | | 10/25/68 | | | 1,694,747 | | |
| | 131 | | | Chase Mortgage Finance Trust,
1 Month USD LIBOR + 0.60% | | | 2.423 | (l) | | 02/25/37 | | | 65,140 | | |
| | 88 | | | ChaseFlex Trust | | | 6.50 | | | 02/25/35 | | | 88,145 | | |
| | | CHL Mortgage Pass-Through Trust | | | |
| | 336 | | | | | | | | 4.162 | (l) | | 09/25/34 | | | 323,282 | | |
| | 531 | | | | | | | | 4.367 | (l) | | 02/19/34 | | | 546,486 | | |
| | 281 | | | | | | | | 5.50 | | | 05/25/34 | | | 291,924 | | |
| | 1,143 | | | | | | | | 6.00 | | | 12/25/36 | | | 1,041,944 | | |
| | 142 | | | Citigroup Mortgage Loan Trust | | | 4.186 | (l) | | 11/25/36 | | | 135,045 | | |
| | | CSFB Mortgage-Backed Pass-Through Certificates | | | |
| | 619 | | | | | | | | 6.50 | | | 12/25/33 | | | 643,437 | | |
| | 457 | | | | | | | | 7.50 | | | 10/25/32 | | | 480,634 | | |
| | | CSMC Mortgage-Backed Trust | | | |
| | 929 | | | | | | | | 5.587 | (l) | | 04/25/37 | | | 408,494 | | |
| | 1,834 | | | | | | | | 6.50 | | | 05/25/36 | | | 843,865 | | |
EUR | 1,900 | | | Dssv Sarl (Spain) | | | 3.00 | | | 10/15/24 | | | 2,119,069 | | |
| | 800 | | | E-Mac de,
3 Month EURIBOR + 0.21% (Germany) | | | 3.338 | (l) | | 05/25/57 | | | 845,822 | | |
| | 1,425 | | | E-MAC Program BV,
3 Month EURIBOR + 0.13% (Netherlands) | | | 0.958 | (l) | | 04/25/39 | | | 1,484,618 | | |
| | 536 | | | EMF-NL Prime,
3 Month EURIBOR + 0.80% (Netherlands) | | | 0.382 | (l) | | 04/17/41 | | | 564,410 | | |
| | 1,144 | | | Eurohome Mortgages PLC,
3 Month EURIBOR + 0.21% (Germany) | | | 0.00 | (l) | | 08/02/50 | | | 1,131,208 | | |
See Notes to Financial Statements
32
Morgan Stanley Global Fixed Income Opportunities Fund
Portfolio of Investments n October 31, 2019 continued
PRINCIPAL
AMOUNT
(000) | |
| | COUPON
RATE | | MATURITY
DATE | | VALUE | |
GBP | 820 | | | Eurosail PLC,
3 Month GBP LIBOR + 0.95% (United Kingdom) | | | 1.735 | (l)% | | 06/13/45 | | $ | 992,463 | | |
| | | Federal Home Loan Mortgage Corporation | | | |
$ | 1,341 | | | | | | | | 3.00 | | | 12/25/46 | | | 1,354,480 | | |
| | 1,343 | | | | | | | | 3.00 | | | 05/25/47 | | | 1,358,600 | | |
| | | FMC GMSR Issuer Trust | | | |
| | 2,200 | | | (a) | | | 4.23 | (l) | | 09/25/24 | | | 2,205,907 | | |
| | 1,800 | | | (a) | | | 5.07 | (l) | | 05/25/24 | | | 1,862,544 | | |
| | 1,576 | | | GCAT Trust (a) | | | 2.65 | (l) | | 10/25/68 | | | 1,580,645 | | |
| | 218 | | | GreenPoint Mortgage Funding Trust,
1 Month USD LIBOR + 0.16% | | | 1.983 | (l) | | 02/25/37 | | | 221,008 | | |
EUR | 1,165 | | | Grifonas Finance PLC,
6 Month EURIBOR + 0.28% (Greece) | | | 0.00 | (l) | | 08/28/39 | | | 1,219,544 | | |
| | | GSR Mortgage Loan Trust | | | |
$ | 160 | | | | | | | | 4.216 | (l) | | 03/25/37 | | | 142,919 | | |
| | 24 | | | | | | | | 4.383 | (l) | | 05/25/35 | | | 23,211 | | |
| | 968 | | | | | | | | 4.764 | (l) | | 12/25/34 | | | 979,256 | | |
| | 1,886 | | | | | | | | 5.50 | | | 03/25/35 | | | 1,976,710 | | |
| | 559 | | | HarborView Mortgage Loan Trust | | | 4.56 | (l) | | 05/19/33 | | | 583,332 | | |
EUR | 781 | | | Hipocat 11 FTA,
3 Month EURIBOR + 0.13% (Spain) | | | 0.00 | (l) | | 01/15/50 | | | 826,100 | | |
| | 1,047 | | | IM Pastor 4 FTA,
3 Month EURIBOR + 0.14% (Spain) | | | 0.00 | (l) | | 03/22/44 | | | 1,082,608 | | |
| | | Impac CMB Trust | | | |
$ | 101 | | | 1 Month USD LIBOR + 0.75% | | | 2.573 | (l) | | 04/25/35 | | | 94,400 | | |
| | 430 | | | 1 Month USD LIBOR + 0.78% | | | 2.603 | (l) | | 10/25/35 | | | 421,329 | | |
| | 232 | | | JP Morgan Alternative Loan Trust | | | 6.00 | | | 12/25/35 | | | 219,644 | | |
EUR | 1,377 | | | Lansdowne Mortgage Securities No. 2 PLC,
3 Month EURIBOR + 0.34% (Ireland) | | | 0.00 | (l) | | 09/16/48 | | | 1,398,844 | | |
| | | Lehman Mortgage Trust | | | |
$ | 122 | | | | | | | | 5.50 | | | 02/25/36 | | | 101,723 | | |
| | 400 | | | | | | | | 6.50 | | | 09/25/37 | | | 230,772 | | |
| | 1,200 | | | LHOME Mortgage Trust (a) | | | 4.58 | | | 10/25/23 | | | 1,217,558 | | |
| | | Ludgate Funding PLC | | | |
EUR | 1,246 | | | 3 Month EURIBOR + 0.42% (United Kingdom) | | | 0.00 | (l) | | 12/01/60 | | | 1,220,739 | | |
| | 1,156 | | | 3 Month EURIBOR + 0.85% (United Kingdom) | | | 0.438 | (l) | | 01/01/61 | | | 1,172,804 | | |
| | 661 | | | 3 Month EURIBOR + 1.10% (United Kingdom) | | | 0.688 | (l) | | 01/01/61 | | | 665,681 | | |
| | | Magnolia Finance XI DAC | | | |
| | 1,931 | | | 3 Month EURIBOR + 2.75% (a) (Spain) | | | 2.75 | (l) | | 04/20/20 | | | 2,153,238 | | |
See Notes to Financial Statements
33
Morgan Stanley Global Fixed Income Opportunities Fund
Portfolio of Investments n October 31, 2019 continued
PRINCIPAL
AMOUNT
(000) | |
| | COUPON
RATE | | MATURITY
DATE | | VALUE | |
| | | | | IO | | | | | | | | | | | | | |
$ | 1,416 | | | (a) | | | 0.25 | % | | 04/20/20 | | $ | 316 | | |
| | | Mansard Mortgages PLC, | | | |
GBP | 1,000 | | | 3 Month GBP LIBOR + 0.80% (United Kingdom) | | | 1.581 | (l) | | 12/15/49 | | | 1,173,804 | | |
| | 590 | | | 3 Month GBP LIBOR + 1.10% (United Kingdom) | | | 1.885 | (l) | | 10/15/48 | | | 716,719 | | |
| | 615 | | | 3 Month GBP LIBOR + 2.00% (United Kingdom) | | | 2.781 | (l) | | 12/15/49 | | | 788,379 | | |
| | | MASTR Adjustable Rate Mortgages Trust | | | |
$ | 426 | | | (a) | | | 4.087 | (l) | | 11/25/35 | | | 336,521 | | |
| | 168 | | | | | | | | 4.584 | (l) | | 02/25/36 | | | 166,159 | | |
| | | MASTR Alternative Loan Trust | | | |
| | 1,154 | | | | | | | | 5.50 | | | 02/25/35 | | | 1,255,664 | | |
| | 1,191 | | | | | | | | 6.00 | | | 05/25/33 | | | 1,287,721 | | |
| | 62 | | | MASTR Asset Securitization Trust | | | 6.00 | | | 06/25/36 | | | 58,632 | | |
| | 1,730 | | | Merrill Lynch Mortgage Investors Trust, IO (a) | | | 1.802 | (l) | | 02/25/36 | | | 93,175 | | |
GBP | 1,200 | | | Mortgage Funding PLC,
3 Month GBP LIBOR + 3.20% (United Kingdom) | | | 3.985 | (l) | | 03/13/46 | | | 1,566,821 | | |
$ | 350 | | | MortgageIT Trust,
1 Month USD LIBOR + 0.45% | | | 2.273 | (l) | | 10/25/35 | | | 353,852 | | |
| | 1,500 | | | Natixis Commercial Mortgage Securities Trust (a) | | | 4.135 | (l) | | 05/15/39 | | | 1,535,292 | | |
| | | Nomura Asset Acceptance Corp. Alternative
Loan Trust | | | |
| | 210 | | | 1 Month USD LIBOR + 0.06% | | | 1.883 | (l) | | 10/25/36 | | | 186,688 | | |
| | 632 | | | | | | | | 4.622 | (l) | | 06/25/36 | | | 572,457 | | |
| | 2,101 | | | | | | | | 5.755 | (l) | | 06/25/36 | | | 995,481 | | |
GBP | 1,000 | | | Oncilla Mortgage Funding PLC,
3 Month GBP LIBOR + 1.90% (United Kingdom) | | | 2.68 | (l) | | 12/12/43 | | | 1,297,896 | | |
| | 932 | | | Paragon Mortgages No. 13 PLC,
3 Month GBP LIBOR + 0.80% (United Kingdom) | | | 1.585 | (l) | | 01/15/39 | | | 1,115,302 | | |
| | | RALI Trust | | | |
$ | 108 | | | | | | | | 6.00 | | | 04/25/36 | | | 105,208 | | |
| | 147 | | | | | | | | 6.00 | | | 08/25/36 | | | 140,759 | | |
| | 228 | | | | | | | | 6.00 | | | 11/25/36 | | | 212,732 | | |
| | 425 | | | | | | | | 6.00 | | | 11/25/36 | | | 395,731 | | |
| | 47 | | | | | | | | 6.00 | | | 01/25/37 | | | 43,060 | | |
| | | | | PAC | | | | | | | | | | | | | |
| | 59 | | | | | | | | 6.00 | | | 04/25/36 | | | 57,751 | | |
AUD | 1,442 | | | RedZed Trust,
1 Month BBSW + 1.95% (Australia) | | | 2.853 | (l) | | 03/09/56 | | | 997,267 | | |
See Notes to Financial Statements
34
Morgan Stanley Global Fixed Income Opportunities Fund
Portfolio of Investments n October 31, 2019 continued
PRINCIPAL
AMOUNT
(000) | |
| | COUPON
RATE | | MATURITY
DATE | | VALUE | |
| | | Reperforming Loan REMIC Trust | | | |
$ | 299 | | | (a) | | | 6.50 | % | | 03/25/35 | | $ | 308,733 | | |
| | 361 | | | (a) | | | 7.50 | | | 11/25/34 | | | 373,864 | | |
| | 701 | | | Residential Asset Securitization Trust | | | 6.00 | | | 05/25/36 | | | 687,947 | | |
| | | ResLoC UK PLC | | | |
EUR | 872 | | | 3 Month EURIBOR + 0.45% (United Kingdom) | | | 0.017 | (l) | | 12/15/43 | | | 869,668 | | |
GBP | 620 | | | 3 Month GBP LIBOR + 0.22% (United Kingdom) | | | 1.001 | (l) | | 12/15/43 | | | 735,600 | | |
$ | 662 | | | RFMSI Series Trust | | | 6.00 | | | 07/25/36 | | | 672,463 | | |
GBP | 757 | | | RMAC Securities No. 1 PLC,
3 Month GBP LIBOR + 0.47% (United Kingdom) | | | 1.253 | (l) | | 06/12/44 | | | 904,492 | | |
$ | 1,100 | | | RMF Buyout Issuance Trust | | | 4.23 | | | 07/25/29 | | | 1,106,011 | | |
GBP | 1,200 | | | Rochester Financing No. 2 PLC,
3 Month GBP LIBOR + 3.25% (United Kingdom) | | | 4.026 | (l) | | 06/18/45 | | | 1,562,080 | | |
$ | 333 | | | Seasoned Credit Risk Transfer Trust | | | 4.75 | (l) | | 10/25/58 | | | 338,204 | | |
| | 384 | | | Sequoia Mortgage Trust,
1 Month USD LIBOR + 0.62% | | | 2.466 | (l) | | 07/20/33 | | | 376,887 | | |
| | 1,000 | | | SG Commercial Mortgage Securities Trust (a) | | | 3.593 | (l) | | 09/15/39 | | | 967,768 | | |
| | 157 | | | STARM Mortgage Loan Trust | | | 4.209 | (l) | | 10/25/37 | | | 153,350 | | |
| | | Structured Adjustable Rate Mortgage Loan Trust | | | |
| | 494 | | | | | | | | 2.719 | (l) | | 11/25/34 | | | 473,963 | | |
| | 795 | | | | | | | | 4.294 | (l) | | 02/25/35 | | | 803,698 | | |
| | 906 | | | Structured Asset Mortgage Investments II Trust | | | 2.356 | (l) | | 04/19/35 | | | 877,622 | | |
| | 1,780 | | | Structured Asset Securities Corp., IO (a) | | | 2.654 | (l) | | 07/25/35 | | | 242,736 | | |
| | 1,835 | | | Structured Asset Securities Corp.
Reverse Mortgage Loan Trust,
1 Month USD LIBOR + 1.85% (a) | | | 3.673 | (l) | | 05/25/47 | | | 1,638,110 | | |
EUR | 2,000 | | | TDA 27 FTA,
3 Month EURIBOR + 0.19% (Spain) | | | 0.00 | (l) | | 12/28/50 | | | 1,980,453 | | |
GBP | 800 | | | Trinity Square PLC,
3 Month GBP LIBOR + 3.40% (United Kingdom) | | | 4.185 | (l) | | 07/15/51 | | | 1,054,386 | | |
$ | 1,159 | | | Verus Securitization Trust (a) | | | 3.504 | (l) | | 12/25/59 | | | 1,175,943 | | |
GBP | 1,500 | | | Warwick Finance Residential Mortgages No. 1 PLC,
3 Month GBP LIBOR + 2.20% (United Kingdom) | | | 2.965 | (l) | | 09/21/49 | | | 1,950,885 | | |
$ | 401 | | | Wells Fargo Alternative Loan Trust | | | 5.305 | (l) | | 07/25/37 | | | 419,311 | | |
| | | | | Total Mortgages - Other (Cost $78,315,541) | | | | | | | 80,217,444 | | |
See Notes to Financial Statements
35
Morgan Stanley Global Fixed Income Opportunities Fund
Portfolio of Investments n October 31, 2019 continued
PRINCIPAL
AMOUNT
(000) | |
| | COUPON
RATE | | MATURITY
DATE | | VALUE | |
| | | U.S. Treasury Securities (3.0%) | |
| | | U.S. Treasury Bonds | |
$ | 4,900 | | | | | | | | 3.125 | % | | 05/15/48 | | $ | 5,889,762 | | |
| | 6,450 | | | | | | | | 4.25 | | | 11/15/40 | | | 8,855,397 | | |
| | 7,925 | | | U.S. Treasury Note | | | 0.875 | | | 01/15/29 | | | 8,433,314 | | |
| | | | | Total U.S. Treasury Securities (Cost $21,851,054) | | | | | | | 23,178,473 | | |
| | | Senior Loan Interests (2.8%) | |
| | 697 | | | Albertsons, LLC, Term Loan B7,
1 Month USD LIBOR + 2.75% | | | 4.54 | (l) | | 11/17/25 | | | 701,461 | | |
| | 1,485 | | | American Airlines, Inc., Term B,
1 Month USD LIBOR + 2.00% | | | 3.80 | (l) | | 04/28/23 | | | 1,485,273 | | |
| | 1,225 | | | Associated Asphalt Partners LLC, Term B,
1 Month USD LIBOR + 5.23% | | | 7.04 | (l) | | 04/05/24 | | | 1,145,316 | | |
| | 1,329 | | | BJ's Wholesale Club, Inc., Term B,
1 Month USD LIBOR + 2.75% | | | 4.67 | (l) | | 02/03/24 | | | 1,331,448 | | |
| | 1,229 | | | Commercial Vehicle Group, Inc., Term B,
1 Month USD LIBOR + 6.00% | | | 7.79 | (l) | | 04/12/23 | | | 1,240,800 | | |
| | 949 | | | Dell International LLC, Term Loan A6,
1 Month USD LIBOR + 1.75% | | | 3.60 | (l) | | 03/13/24 | | | 951,715 | | |
| | 1,500 | | | Garda World Security Corp.,
Term Loan B, (Canada) | | | 0.00 | | | 10/30/26(c) | | | 1,494,060 | | |
| | 1,210 | | | Hearthside Food Solutions, LLC, Term B,
1 Month USD LIBOR + 3.69% | | | 5.47 | (l) | | 05/23/25 | | | 1,124,755 | | |
EUR | 987 | | | Ineos Finance PLC, Term B,
1 Month EURIBOR + 2.00% (Luxembourg) | | | 2.50 | (l) | | 03/31/24 | | | 1,086,834 | | |
$ | 1,228 | | | Navistar International Corp., Term B,
1 Month USD LIBOR + 3.50% | | | 5.42 | (l) | | 11/06/24 | | | 1,218,153 | | |
| | 889 | | | NCI Building Systems, Inc., Term Loan,
1 Month USD LIBOR + 3.75% | | | 5.66 | (l) | | 04/12/25 | | | 861,345 | | |
| | 414 | | | Office Depot, Inc., Term B,
1 Month USD LIBOR + 5.25% | | | 7.10 | (l) | | 11/08/22 | | | 417,057 | | |
| | 750 | | | Party City Holdings, Inc., Term Loan,
1 Month USD LIBOR + 2.50% | | | 4.29 | (l) | | 08/19/22 | | | 744,852 | | |
| | 1,481 | | | Playa Resorts Holding B.V., Term B,
1 Month USD LIBOR + 2.75% | | | 4.54 | (l) | | 04/29/24 | | | 1,447,302 | | |
| | 1,485 | | | Reynolds Group Holdings, Inc., Term Loan,
1 Month USD LIBOR + 2.75% | | | 4.54 | (l) | | 02/05/23 | | | 1,486,344 | | |
| | 333 | | | SAExploration Holdings, Inc., Term Loan, (h) | | | 12.50 | | | 01/02/20 | | | 313,500 | | |
See Notes to Financial Statements
36
Morgan Stanley Global Fixed Income Opportunities Fund
Portfolio of Investments n October 31, 2019 continued
PRINCIPAL
AMOUNT
(000) | |
| | COUPON
RATE | | MATURITY
DATE | | VALUE | |
$ | 763 | | | Scientific Games International, Inc., Term B5,
1 Month USD LIBOR + 2.75% | | | 4.54 | (l)% | | 08/14/24 | | $ | 755,799 | | |
| | 864 | | | Shape Technologies Group, Inc., Term Loan,
3 Month USD LIBOR + 3.00% | | | 4.93 | (l) | | 04/21/25 | | | 792,777 | | |
| | 1,228 | | | Surgery Center Holdings, Inc., Term Loan,
1 Month USD LIBOR + 3.25% | | | 5.04 | (l) | | 09/02/24 | | | 1,189,183 | | |
| | 788 | | | Titan Acquisition Ltd., Term Loan B,
1 Month USD LIBOR + 3.00% (Canada) | | | 4.79 | (l) | | 03/28/25 | | | 747,123 | | |
| | 1,183 | | | WEI Sales, LLC, Term B,
1 Month USD LIBOR + 3.00% | | | 4.79 | (l) | | 03/29/25 | | | 1,183,098 | | |
| | | | | Total Senior Loan Interests (Cost $22,021,136) | | | | | | | 21,718,195 | | |
| | | Short-Term Investments (13.1%) | | | |
| | | Sovereign (1.2%) | | | |
| | | Egypt Treasury Bills (n) | | | |
EGP | 24,000 | | | | | | | | 15.60 | | | 04/07/20 | | | 1,398,386 | | |
| | 5,000 | | | | | | | | 15.60 | | | 04/07/20 | | | 291,330 | | |
| | 5,000 | | | | | | | | 15.70 | | | 04/07/20 | | | 291,330 | | |
| | 7,000 | | | | | | | | 15.751 | | | 04/07/20 | | | 407,862 | | |
| | 8,000 | | | | | | | | 15.80 | | | 04/07/20 | | | 466,129 | | |
| | 7,000 | | | | | | | | 15.849 | | | 04/07/20 | | | 407,863 | | |
| | 5,000 | | | | | | | | 15.90 | | | 04/07/20 | | | 291,330 | | |
| | 35,000 | | | | | | | | 16.234 | | | 03/10/20 | | | 2,061,471 | | |
| | 68,000 | | | | | | | | 18.02 | | | 12/17/19 | | | 4,124,781 | | |
| | | | | Total Sovereign (Cost $9,514,844) | | | | | | | 9,740,482 | | |
| | | Commercial Paper (2.3%) | | | |
$ | 3,870 | | | Dupont de Nemours, Inc. | | | 2.25 | (m) | | 11/18/19 | | | 3,865,961 | | |
| | 3,750 | | | General Electric Co. | | | 2.34 | (m) | | 11/12/19 | | | 3,747,365 | | |
| | 3,000 | | | Glencore Funding LLC, GLEN | | | 2.29 | (m) | | 01/17/20 | | | 2,986,331 | | |
| | 3,860 | | | Marriott International, Inc., Class A | | | 2.29 | (m) | | 11/25/19 | | | 3,854,210 | | |
| | 3,800 | | | Vodafone Group PLC | | | 2.26 | (m) | | 12/03/19 | | | 3,792,501 | | |
| | | | | Total Commercial Paper (Cost $18,245,600) | | | | | | | 18,246,368 | | |
| | | U.S. Treasury Securities (3.5%) | | | |
| | | U.S. Treasury Bills | | | |
| | 12,250 | | | (n) | | | 1.752 | | | 01/02/20 | | | 12,217,458 | | |
| | 4,050 | | | (d)(n)(p) | | | 2.353 | | | 11/21/19 | | | 4,044,836 | | |
| | 11,000 | | | U.S. Treasury Note | | | 1.50 | | | 11/30/19 | | | 10,994,957 | | |
| | | | | Total U.S. Treasury Securities (Cost $27,253,506) | | | | | | | 27,257,251 | | |
See Notes to Financial Statements
37
Morgan Stanley Global Fixed Income Opportunities Fund
Portfolio of Investments n October 31, 2019 continued
NUMBER OF
SHARES
(000) | |
| |
| |
| | VALUE | |
| | | Securities held as Collateral on Loaned Securities (0.8%) | |
| | | Investment Company (0.8%) | |
$ | 6,451 | | | Morgan Stanley Institutional Liquidity Funds - Treasury Securities Portfolio -
Institutional Class (See Note 7) (Cost $6,451,475) | | | | | | $ | 6,451,475 | | |
| | | Investment Company (5.3%) | |
| | 41,095 | | | Morgan Stanley Institutional Liquidity Funds - Government Portfolio -
Institutional Class (See Note 7) (Cost $41,094,719) | | | | | | | | | | | 41,094,719 | | |
| | | Total Short-Term Investments (Cost $102,560,144) | | | | | | | 102,790,295 | | |
| | | Total Investments (Cost $770,060,086) (q)(r) | | | | | 101.0 | % | | | 788,139,671 | | |
| | | Liabilities in Excess of Other Assets | | | | | (1.0 | ) | | | (7,926,975 | ) | |
| | | Net Assets | | | | | 100.0 | % | | $ | 780,212,696 | | |
Country assignments and aggregations are based generally on third party vendor classifications and information, and may be different from the assignments and aggregations under the policies set forth in the Fund's prospectus and/or statement of additional information relating to geographic classifications.
BBSW Australia's Bank Bill Swap.
EURIBOR Euro Interbank Offered Rate.
IO Interest Only.
LIBOR London Interbank Offered Rate.
MTN Medium Term Note.
OFZ Obilgatsyi Federal'novo Zaima (Russian Federal Loan Obligation).
PAC Planned Amortization Class.
REMIC Real Estate Mortgage Investment Conduit.
SONIA Sterling Overnight Interbank Average Rate.
USD United States Dollar.
(a) 144A security - Certain conditions for public sale may exist. Unless otherwise noted, these securities are deemed to be liquid.
(b) Perpetual - One or more securities do not have a predetermined maturity date. Rates for these securities are fixed for a period of time, after which they revert to a floating rate. Interest rates in effect are as of October 31, 2019.
(c) When-issued security.
(d) All or a portion of this security was on loan at October 31, 2019.
(e) PIK: Payment-in-kind security for which part of the income earned may be paid as additional principal.
(f) Issuer in bankruptcy.
(g) Non-income producing security; bond in default.
(h) Illiquid security.
(i) Acquired through exchange offer.
(j) At October 31, 2019, the Fund held a fair valued security valued at $0, representing 0.0% of net assets. This security has been fair valued as determined in good faith under procedures established by and under the general supervision of the Fund's Trustees.
(k) Capital appreciation bond.
(l) Floating or variable rate securities: The rates disclosed are as of October 31, 2019. For securities based on a published reference rate and spread, the reference rate and spread are indicated in the description in the Portfolio of Investments. Certain variable rate securities may not be based on a published reference rate and spread but are determined by the issuer or agent and are based on
See Notes to Financial Statements
38
Morgan Stanley Global Fixed Income Opportunities Fund
Portfolio of Investments n October 31, 2019 continued
current market conditions. These securities do not indicate a reference rate and spread in their description in the Portfolio of Investments.
(m) The rates shown are the effective yields at the date of purchase.
(n) Rate shown is the yield to maturity at October 31, 2019.
(o) Inverse Floating Rate Security - Interest rate fluctuates with an inverse relationship to an associated interest rate. Indicated rate is the effective rate at October 31, 2019.
(p) All or a portion of the security was pledged to cover margin requirements for swap agreements.
(q) Securities are available for collateral in connection with purchase of when issued security, open foreign currency forward exchange contracts, futures contracts and swap agreement.
(r) At October 31, 2019, the aggregate cost for federal income tax purposes is $531,273,618. The aggregate gross unrealized appreciation is $24,749,148 and the aggregate gross unrealized depreciation is $8,090,513, resulting in net unrealized appreciation of $16,658,635.
Foreign Currency Forward Exchange Contracts:
The Fund had the following foreign currency forward exchange contracts open at October 31, 2019:
COUNTERPARTY | | CONTRACTS
TO DELIVER | | IN EXCHANGE
FOR | | DELIVERY
DATE | | UNREALIZED
APPRECIATION
(DEPRECIATION) | |
JPMorgan Chase Bank NA | | $ | 2,111,574 | | | BRL | 8,477,971 | | | 11/01/19 | | $ | 2,369 | | |
Barclays Bank PLC | | PEN | 5,028,000 | | | $ | 1,498,077 | | | 11/12/19 | | | (4,860 | ) | |
JPMorgan Chase Bank NA | | $ | 1,512,635 | | | PEN | 5,028,000 | | | 11/12/19 | | | (9,699 | ) | |
Bank of America NA | | HUF | 586,559,617 | | | $ | 1,961,853 | | | 12/18/19 | | | (33,786 | ) | |
Bank of America NA | | MXN | 94,960,334 | | | $ | 4,753,167 | | | 12/18/19 | | | (150,262 | ) | |
Bank of America NA | | NZD | 6,721,635 | | | $ | 4,313,945 | | | 12/18/19 | | | 893 | | |
Bank of America NA | | SEK | 12,943,351 | | | $ | 1,337,113 | | | 12/18/19 | | | (6,821 | ) | |
Bank of America NA | | ZAR | 1,243,001 | | | $ | 84,155 | | | 12/18/19 | | | 2,378 | | |
Barclays Bank PLC | | AUD | 24,100,563 | | | $ | 16,592,563 | | | 12/18/19 | | | (40,722 | ) | |
Barclays Bank PLC | | EUR | 269,561 | | | $ | 299,692 | | | 12/18/19 | | | (1,867 | ) | |
Barclays Bank PLC | | EUR | 611,321 | | | $ | 681,231 | | | 12/18/19 | | | (2,657 | ) | |
Barclays Bank PLC | | EUR | 154,673 | | | $ | 172,293 | | | 12/18/19 | | | (741 | ) | |
Barclays Bank PLC | | EUR | 1,136 | | | $ | 1,264 | | | 12/18/19 | | | (6 | ) | |
Barclays Bank PLC | | EUR | 333,019 | | | $ | 366,033 | | | 12/18/19 | | | (6,517 | ) | |
Barclays Bank PLC | | EUR | 189,699 | | | $ | 210,538 | | | 12/18/19 | | | (1,679 | ) | |
Barclays Bank PLC | | EUR | 130,898 | | | $ | 144,564 | | | 12/18/19 | | | (1,872 | ) | |
Barclays Bank PLC | | GBP | 891,984 | | | $ | 1,114,188 | | | 12/18/19 | | | (42,962 | ) | |
Barclays Bank PLC | | MXN | 114,079,023 | | | $ | 5,784,795 | | | 12/18/19 | | | (105,858 | ) | |
Barclays Bank PLC | | MXN | 3,416,697 | | | $ | 172,428 | | | 12/18/19 | | | (3,999 | ) | |
Barclays Bank PLC | | MXN | 14,651,039 | | | $ | 735,056 | | | 12/18/19 | | | (21,474 | ) | |
Barclays Bank PLC | | MXN | 3,449,263 | | | $ | 174,332 | | | 12/18/19 | | | (3,777 | ) | |
Barclays Bank PLC | | MXN | 5,756,225 | | | $ | 295,814 | | | 12/18/19 | | | (1,418 | ) | |
Barclays Bank PLC | | $ | 3,110,308 | | | COP | 10,715,009,741 | | | 12/18/19 | | | 54,876 | | |
Barclays Bank PLC | | $ | 3,825,776 | | | GBP | 3,056,000 | | | 12/18/19 | | | 138,702 | | |
Barclays Bank PLC | | $ | 3,852,107 | | | IDR | 54,700,000,000 | | | 12/18/19 | | | 27,869 | | |
Barclays Bank PLC | | $ | 1,928,530 | | | IDR | 27,255,909,000 | | | 12/18/19 | | | 4,785 | | |
Barclays Bank PLC | | $ | 57,870 | | | NZD | 90,000 | | | 12/18/19 | | | (120 | ) | |
Barclays Bank PLC | | $ | 838,812 | | | PEN | 2,845,000 | | | 12/18/19 | | | 10,662 | | |
Barclays Bank PLC | | $ | 4,796,925 | | | PEN | 16,122,000 | | | 12/18/19 | | | 16,861 | | |
BNP Paribas SA | | AUD | 1,227,460 | | | $ | 829,374 | | | 12/18/19 | | | (17,772 | ) | |
See Notes to Financial Statements
39
Morgan Stanley Global Fixed Income Opportunities Fund
Portfolio of Investments n October 31, 2019 continued
COUNTERPARTY | | CONTRACTS
TO DELIVER | | IN EXCHANGE
FOR | | DELIVERY
DATE | | UNREALIZED
APPRECIATION
(DEPRECIATION) | |
BNP Paribas SA | | BRL | 58,703,958 | | | $ | 14,400,932 | | | 12/18/19 | | $ | (198,978 | ) | |
BNP Paribas SA | | EUR | 188,849 | | | $ | 211,047 | | | 12/18/19 | | | (219 | ) | |
BNP Paribas SA | | EUR | 175,000 | | | $ | 195,006 | | | 12/18/19 | | | (768 | ) | |
BNP Paribas SA | | EUR | 1,654,858 | | | $ | 1,829,907 | | | 12/18/19 | | | (21,392 | ) | |
BNP Paribas SA | | EUR | 84,538 | | | $ | 93,446 | | | 12/18/19 | | | (1,127 | ) | |
BNP Paribas SA | | EUR | 527,938 | | | $ | 581,715 | | | 12/18/19 | | | (8,892 | ) | |
BNP Paribas SA | | IDR | 41,630,595,234 | | | $ | 2,950,223 | | | 12/18/19 | | | (2,716 | ) | |
BNP Paribas SA | | IDR | 48,215,548,643 | | | $ | 3,380,937 | | | 12/18/19 | | | (39,085 | ) | |
BNP Paribas SA | | IDR | 26,396,804,844 | | | $ | 1,848,645 | | | 12/18/19 | | | (23,731 | ) | |
BNP Paribas SA | | IDR | 4,956,642,000 | | | $ | 346,861 | | | 12/18/19 | | | (4,723 | ) | |
BNP Paribas SA | | IDR | 34,015,176,168 | | | $ | 2,402,711 | | | 12/18/19 | | | (10,051 | ) | |
BNP Paribas SA | | PEN | 24,167,000 | | | $ | 7,232,597 | | | 12/18/19 | | | 16,696 | | |
BNP Paribas SA | | $ | 1,343,132 | | | AUD | 1,979,918 | | | 12/18/19 | | | 23,332 | | |
BNP Paribas SA | | $ | 47,499 | | | AUD | 69,723 | | | 12/18/19 | | | 621 | | |
BNP Paribas SA | | $ | 43,130 | | | GBP | 35,039 | | | 12/18/19 | | | 2,325 | | |
Citibank NA | | AUD | 108,400 | | | $ | 74,580 | | | 12/18/19 | | | (234 | ) | |
Citibank NA | | AUD | 243,746 | | | $ | 165,034 | | | 12/18/19 | | | (3,191 | ) | |
Citibank NA | | CHF | 1,357,595 | | | $ | 1,380,947 | | | 12/18/19 | | | (28 | ) | |
Citibank NA | | COP | 15,039,287,000 | | | $ | 4,480,441 | | | 12/18/19 | | | 37,878 | | |
Citibank NA | | EUR | 344,324 | | | $ | 381,712 | | | 12/18/19 | | | (3,486 | ) | |
Citibank NA | | EUR | 1,362,233 | | | $ | 1,515,134 | | | 12/18/19 | | | (8,803 | ) | |
Citibank NA | | HUF | 200,266,680 | | | $ | 668,836 | | | 12/18/19 | | | (12,527 | ) | |
Citibank NA | | HUF | 295,479,486 | | | $ | 986,752 | | | 12/18/19 | | | (18,551 | ) | |
Citibank NA | | HUF | 195,387,734 | | | $ | 651,541 | | | 12/18/19 | | | (13,222 | ) | |
Citibank NA | | MXN | 38,717,000 | | | $ | 1,964,333 | | | 12/18/19 | | | (34,882 | ) | |
Citibank NA | | RUB | 224,294,000 | | | $ | 3,422,768 | | | 12/18/19 | | | (54,826 | ) | |
Citibank NA | | $ | 1,554,079 | | | AUD | 2,267,000 | | | 12/18/19 | | | 10,518 | | |
Citibank NA | | $ | 1,610,969 | | | SEK | 15,533,661 | | | 12/18/19 | | | 1,923 | | |
Goldman Sachs International | | EUR | 1,000,000 | | | $ | 1,114,450 | | | 12/18/19 | | | (4,255 | ) | |
Goldman Sachs International | | GBP | 20,469,738 | | | $ | 25,349,007 | | | 12/18/19 | | | (1,205,906 | ) | |
Goldman Sachs International | | SEK | 35,328,688 | | | $ | 3,691,569 | | | 12/18/19 | | | 23,319 | | |
Goldman Sachs International | | $ | 3,483,097 | | | RUB | 224,294,000 | | | 12/18/19 | | | (5,503 | ) | |
JPMorgan Chase Bank NA | | BRL | 8,477,971 | | | $ | 2,105,230 | | | 12/18/19 | | | (3,276 | ) | |
JPMorgan Chase Bank NA | | BRL | 838,735 | | | $ | 205,608 | | | 12/18/19 | | | (2,989 | ) | |
JPMorgan Chase Bank NA | | BRL | 819,355 | | | $ | 196,436 | | | 12/18/19 | | | (7,341 | ) | |
JPMorgan Chase Bank NA | | BRL | 1,200,793 | | | $ | 292,969 | | | 12/18/19 | | | (5,673 | ) | |
JPMorgan Chase Bank NA | | BRL | 10,536,236 | | | $ | 2,540,076 | | | 12/18/19 | | | (80,328 | ) | |
JPMorgan Chase Bank NA | | EUR | 107,515,194 | | | $ | 119,769,238 | | | 12/18/19 | | | (508,554 | ) | |
JPMorgan Chase Bank NA | | EUR | 637,942 | | | $ | 705,302 | | | 12/18/19 | | | (8,367 | ) | |
JPMorgan Chase Bank NA | | IDR | 88,588,285,232 | | | $ | 6,282,857 | | | 12/18/19 | | | (881 | ) | |
JPMorgan Chase Bank NA | | SEK | 38,532,378 | | | $ | 4,024,870 | | | 12/18/19 | | | 23,974 | | |
JPMorgan Chase Bank NA | | $ | 440,722 | | | BRL | 1,760,904 | | | 12/18/19 | | | (2,778 | ) | |
JPMorgan Chase Bank NA | | $ | 114,938 | | | GBP | 88,833 | | | 12/18/19 | | | 303 | | |
JPMorgan Chase Bank NA | | $ | 17,453 | | | JPY | 1,876,512 | | | 12/18/19 | | | (27 | ) | |
JPMorgan Chase Bank NA | | $ | 1,533,019 | | | PEN | 5,200,000 | | | 12/18/19 | | | 19,623 | | |
See Notes to Financial Statements
40
Morgan Stanley Global Fixed Income Opportunities Fund
Portfolio of Investments n October 31, 2019 continued
COUNTERPARTY | | CONTRACTS
TO DELIVER | | IN EXCHANGE
FOR | | DELIVERY
DATE | | UNREALIZED
APPRECIATION
(DEPRECIATION) | |
Royal Bank of Canada | | AUD | 2,250,000 | | | $ | 1,526,852 | | | 12/18/19 | | $ | (26,012 | ) | |
Royal Bank of Canada | | EUR | 2,100,000 | | | $ | 2,319,429 | | | 12/18/19 | | | (29,852 | ) | |
Royal Bank of Canada | | MXN | 43,700,000 | | | $ | 2,179,573 | | | 12/18/19 | | | (76,947 | ) | |
State Street Bank and Trust Co. | | EUR | 4,043,513 | | | $ | 4,507,662 | | | 12/18/19 | | | (15,836 | ) | |
State Street Bank and Trust Co. | | EUR | 400,000 | | | $ | 443,548 | | | 12/18/19 | | | (3,934 | ) | |
State Street Bank and Trust Co. | | $ | 1,757,706 | | | MXN | 34,000,000 | | | 12/18/19 | | | (2,062 | ) | |
UBS AG | | BRL | 2,200,000 | | | $ | 539,297 | | | 12/18/19 | | | (7,852 | ) | |
UBS AG | | SEK | 7,729,738 | | | $ | 789,118 | | | 12/18/19 | | | (13,476 | ) | |
| | | $ | (2,512,243 | ) | |
Futures Contracts:
The Fund had the following futures contracts open at October 31, 2019:
| | | NUMBER
OF
CONTRACTS | | EXPIRATION
DATE | | NOTIONAL AMOUNT
(000) | | VALUE | | UNREALIZED
APPRECIATION
(DEPRECIATION) | |
Long: | |
U.S. Treasury 30 yr. Bond | | | 32 | | | Dec-19 | | $ | 3,200 | | | $ | 5,164,000 | | | $ | (86,189 | ) | |
U.S. Treasury Ultra Bond | | | 18 | | | Dec-19 | | | 1,800 | | | | 3,415,500 | | | | 33,833 | | |
Australian 10 yr. Bond | | | 32 | | | Dec-19 | | AUD | 3,200 | | | | 3,216,429 | | | | (18,243 | ) | |
Short: | |
U.S. Treasury 10 yr. Note | | | 4 | | | Dec-19 | | $ | (400 | ) | | | (521,187 | ) | | | (2,625 | ) | |
UK Long Gilt Bond | | | 21 | | | Dec-19 | | GBP | (2,100 | ) | | | (3,613,561 | ) | | | (42,116 | ) | |
Canadian 10 yr. Bond | | | 42 | | | Dec-19 | | CAD | (4,200 | ) | | | (4,529,405 | ) | | | (39,275 | ) | |
U.S. Treasury 5 yr. Note | | | 91 | | | Dec-19 | | $ | (9,100 | ) | | | (10,847,484 | ) | | | (40,842 | ) | |
German Euro Bund | | | 71 | | | Dec-19 | | EUR | (7,100 | ) | | | (13,601,035 | ) | | | 185,804 | | |
German Euro 30 yr. Bond | | | 64 | | | Dec-19 | | | (6,400 | ) | | | (14,986,773 | ) | | | 162,521 | | |
U.S. Treasury 10 yr. Ultra Long Bond | | | 154 | | | Dec-19 | | $ | (15,400 | ) | | | (21,884,844 | ) | | | (5,782 | ) | |
U.S. Treasury 2 yr. Note | | | 194 | | | Dec-19 | | | (38,800 | ) | | | (41,826,703 | ) | | | 50,361 | | |
| | | | | | | | | | | $ | 197,447 | | |
See Notes to Financial Statements
41
Morgan Stanley Global Fixed Income Opportunities Fund
Portfolio of Investments n October 31, 2019 continued
Credit Default Swap Agreements:
The Fund had the following credit default swap agreements open at October 31, 2019:
SWAP
COUNTERPARTY
AND REFERENCE
OBLIGATION | | CREDIT
RATING OF
REFERENCE
OBLIGATION†
(UNAUDITED) | | BUY/SELL
PROTECTION | | PAY/
RECEIVE
FIXED
RATE | | PAYMENT
FREQUENCY | | MATURITY
DATE | | NOTIONAL
AMOUNT
(000) | | VALUE | | UPFRONT
PAYMENT
PAID
(RECEIVED) | | UNREALIZED
DEPRECIATION | |
Morgan Stanley &
Co. LLC*
CDX.NA.HY.32 | | NR | | Buy | | | 5.00 | % | | Quarterly | | 6/20/24 | | $ | 4,950 | | | $ | (403,788 | ) | | $ | (366,537 | ) | | $ | (37,251 | ) | |
† Credit rating as issued by Standard & Poor's.
* Cleared swap agreement, the broker is Morgan Stanley & Co. LLC.
NR Not rated.
Currency Abbreviations:
AUD Australian Dollar.
BRL Brazilian Real.
CAD Canadian Dollar.
CHF Swiss Franc.
COP Colombian Peso.
EGP Egyptian Pound.
EUR Euro.
GBP British Pound.
HUF Hungarian Forint.
IDR Indonesian Rupiah.
JPY Japanese Yen.
MXN Mexican Peso.
NZD New Zealand Dollar.
PEN Peruvian Nuevo Sol.
RUB Russian Ruble.
SEK Swedish Krona.
USD United States Dollar.
ZAR South African Rand.
See Notes to Financial Statements
42
Morgan Stanley Global Fixed Income Opportunities Fund
Financial Statements
Statement of Assets and Liabilities October 31, 2019
Assets: | |
Investments in securities, at value (cost $722,513,892) (Including $9,720,887 for securities loaned) | | $ | 740,593,477 | | |
Investment in affiliate, at value (cost $47,546,194) | | | 47,546,194 | | |
Total investments in securities, at value (cost $770,060,086) | | | 788,139,671 | | |
Unrealized appreciation on open foreign currency forward exchange contracts | | | 419,907 | | |
Cash (including foreign currency valued at $3,810,623 with a cost of $3,782,424) | | | 4,083,374 | | |
Receivable for: | |
Interest | | | 6,224,178 | | |
Shares of beneficial interest sold | | | 3,264,699 | | |
Investments sold | | | 2,243,533 | | |
Variation margin on open futures contracts | | | 769,743 | | |
Dividends from affiliate | | | 45,887 | | |
Foreign withholding taxes reclaimed | | | 34,771 | | |
Variation margin on open swap agreements | | | 10,100 | | |
Securities lending income | | | 1,869 | | |
Prepaid expenses and other assets | | | 95,487 | | |
Total Assets | | | 805,333,219 | | |
Liabilities: | |
Collateral on securities loaned, at value | | | 6,451,475 | | |
Unrealized depreciation on open foreign currency forward exchange contracts | | | 2,932,150 | | |
Payable for: | |
Investments purchased | | | 13,413,928 | | |
Shares of beneficial interest redeemed | | | 1,420,140 | | |
Advisory fee | | | 205,657 | | |
Dividends to shareholders | | | 155,382 | | |
Transfer and sub transfer agent fees | | | 93,955 | | |
Administration fee | | | 52,396 | | |
Distribution fee | | | 51,075 | | |
Trustees' fees | | | 43,257 | | |
Deferred capital gain country tax | | | 92,059 | | |
Accrued expenses and other payables | | | 209,049 | | |
Total Liabilities | | | 25,120,523 | | |
Net Assets | | $ | 780,212,696 | | |
Composition of Net Assets: | |
| Paid-in-Capital | | $ | 762,861,902 | | |
| Total Distributable Earnings | | | 17,350,974 | | |
Net Assets | | $ | 780,212,696 | | |
See Notes to Financial Statements
43
Morgan Stanley Global Fixed Income Opportunities Fund
Financial Statements continued
Statement of Assets and Liabilities October 31, 2019
Class A Shares: | |
Net Assets | | $ | 110,977,770 | | |
| Shares Outstanding (unlimited shares authorized, $0.01 par value) | | | 19,362,520 | | |
Net Asset Value Per Share | | $ | 5.73 | | |
Maximum Offering Price Per Share,
(net asset value plus 3.36% of net asset value) | | $ | 5.92 | | |
Class L Shares: | |
Net Assets | | $ | 5,556,604 | | |
| Shares Outstanding (unlimited shares authorized, $0.01 par value) | | | 969,852 | | |
Net Asset Value Per Share | | $ | 5.73 | | |
Class I Shares: | |
Net Assets | | $ | 425,720,257 | | |
| Shares Outstanding (unlimited shares authorized, $0.01 par value) | | | 73,378,241 | | |
Net Asset Value Per Share | | $ | 5.80 | | |
Class C Shares: | |
Net Assets | | $ | 29,889,627 | | |
| Shares Outstanding (unlimited shares authorized, $0.01 par value) | | | 5,222,783 | | |
Net Asset Value Per Share | | $ | 5.72 | | |
Class IS Shares: | |
Net Assets | | $ | 208,057,971 | | |
| Shares Outstanding (unlimited shares authorized, $0.01 par value) | | | 35,853,359 | | |
Net Asset Value Per Share | | $ | 5.80 | | |
Class IR Shares: | |
Net Assets | | $ | 10,467 | | |
| Shares Outstanding (unlimited shares authorized, $0.01 par value) | | | 1,802 | | |
Net Asset Value Per Share | | $ | 5.81 | | |
See Notes to Financial Statements
44
Morgan Stanley Global Fixed Income Opportunities Fund
Financial Statements continued
Statement of Operations For the year ended October 31, 2019
Net Investment Income:
Income | |
Interest (net of $349,785 foreign withholding tax) | | $ | 27,749,878 | | |
Dividends from affiliate (Note 7) | | | 781,237 | | |
Income from securities loaned - net | | | 60,260 | | |
Total Income | | | 28,591,375 | | |
Expenses | |
Advisory fee (Note 4) | | | 2,045,039 | | |
Distribution fee (Class A shares) (Note 5) | | | 234,114 | | |
Distribution fee (Class B shares) (Note 5)* | | | 779 | | |
Distribution fee (Class L shares) (Note 5) | | | 29,034 | | |
Distribution fee (Class C shares) (Note 5) | | | 282,862 | | |
Administration fee (Note 4) | | | 511,260 | | |
Sub transfer agent fees and expenses (Class A shares) | | | 78,984 | | |
Sub transfer agent fees and expenses (Class B shares)* | | | 76 | | |
Sub transfer agent fees and expenses (Class L shares) | | | 3,502 | | |
Sub transfer agent fees and expenses (Class I shares) | | | 256,808 | | |
Sub transfer agent fees and expenses (Class C shares) | | | 19,563 | | |
Professional fees | | | 218,965 | | |
Registration fees | | | 146,829 | | |
Custodian fees (Note 9) | | | 142,317 | | |
Shareholder reports and notices | | | 79,910 | | |
Transfer agent fees and expenses (Class A shares) (Note 6) | | | 20,538 | | |
Transfer agent fees and expenses (Class B shares) (Note 6)* | | | 856 | | |
Transfer agent fees and expenses (Class L shares) (Note 6) | | | 4,067 | | |
Transfer agent fees and expenses (Class I shares) (Note 6) | | | 15,377 | | |
Transfer agent fees and expenses (Class C shares) (Note 6) | | | 5,402 | | |
Transfer agent fees and expenses (Class IS shares) (Note 6) | | | 2,696 | | |
Transfer agent fees and expenses (Class IR shares) (Note 6) | | | 2,090 | | |
Trustees' fees and expenses | | | 41,186 | | |
Other | | | 105,532 | | |
Total Expenses | | | 4,247,786 | | |
Less: rebate from Morgan Stanley affiliated cash sweep (Note 7) | | | (57,844 | ) | |
Less: reimbursement of class specific expenses (Class B shares) (Note 4)* | | | (709 | ) | |
Less: reimbursement of class specific expenses (Class IR shares) (Note 4) | | | (2,090 | ) | |
Net Expenses | | | 4,187,143 | | |
Net Investment Income | | | 24,404,232 | | |
See Notes to Financial Statements
45
Morgan Stanley Global Fixed Income Opportunities Fund
Financial Statements continued
Statement of Operations For the year ended October 31, 2019
Realized and Unrealized Gain (Loss):
Realized Gain (Loss) on: | |
Investments | | $ | (3,625,044 | ) | |
Futures contracts | | | (357,868 | ) | |
Swap agreements | | | (3,061,053 | ) | |
Foreign currency forward exchange contracts | | | 11,019,128 | | |
Foreign currency translation | | | (77,509 | ) | |
| Net Realized Gain | | | 3,897,654 | | |
Change in Unrealized Appreciation (Depreciation) on: | |
Investments (Net of increase in deferred capital gain country tax of $90,891) | | | 30,676,415 | | |
Futures contracts | | | (464,149 | ) | |
Swap agreements | | | 311,978 | | |
Foreign currency forward exchange contracts | | | (6,115,067 | ) | |
Foreign currency translation | | | 128,336 | | |
Net Change in Unrealized Appreciation (Depreciation) | | | 24,537,513 | | |
| Net Gain | | | 28,435,167 | | |
Net Increase | | $ | 52,839,399 | | |
* All Class B shares were redeemed/converted to Class A shares as of March 26, 2019.
See Notes to Financial Statements
46
Morgan Stanley Global Fixed Income Opportunities Fund
Financial Statements continued
Statements of Changes in Net Assets
| | | FOR THE YEAR
ENDED
OCTOBER 31, 2019 | | FOR THE YEAR
ENDED
OCTOBER 31, 2018 | |
Increase (Decrease) in Net Assets:
Operations: | |
Net investment income | | $ | 24,404,232 | | | $ | 19,957,324 | | |
| Net realized gain | | | 3,897,654 | | | | 10,123,160 | | |
Net change in unrealized appreciation (depreciation) | | | 24,537,513 | | | | (22,776,765 | ) | |
| Net Increase | | | 52,839,399 | | | | 7,303,719 | | |
Dividends and Distributions to Shareholders: | |
Class A shares | | | (4,315,675 | ) | | | (2,699,379 | ) | |
Class B shares* | | | (6,570 | ) | | | (7,655 | ) | |
Class L shares | | | (268,940 | ) | | | (222,741 | ) | |
Class I shares | | | (16,273,554 | ) | | | (8,950,984 | ) | |
Class C shares | | | (1,135,890 | ) | | | (630,673 | ) | |
Class IS shares | | | (8,701,331 | ) | | | (5,943,151 | ) | |
Class IR shares | | | (510 | ) | | | (155 | )(a) | |
Total Dividends and Distributions to Shareholders | | | (30,702,470 | ) | | | (18,454,738 | ) | |
| Net increase from transactions in shares of beneficial interest | | | 198,634,793 | | | | 32,652,212 | | |
Net Increase | | | 220,771,722 | | | | 21,501,193 | | |
Net Assets: | |
Beginning of period | | | 559,440,974 | | | | 537,939,781 | | |
End of Period | | $ | 780,212,696 | | | $ | 559,440,974 | | |
* All Class B shares were redeemed/converted to Class A shares as of March 26, 2019.
(a) For the period June 15, 2018 through October 31, 2018.
See Notes to Financial Statements
47
Morgan Stanley Global Fixed Income Opportunities Fund
Notes to Financial Statements n October 31, 2019
1. Organization and Accounting Policies
Morgan Stanley Global Fixed Income Opportunities Fund (the "Fund") is registered under the Investment Company Act of 1940, as amended (the "Act"), as a diversified, open-end management investment company. The Fund applies investment company accounting and reporting guidance. The Fund's primary investment objective is to seek a high level of current income and, as a secondary objective, to maximize total return, but only to the extent consistent with its primary objective. The Fund was organized as a Massachusetts business trust on December 20, 1991 and commenced operations on April 9, 1992. On July 28, 1997, the Fund converted to a multiple class share structure.
The Fund offers Class A shares, Class B shares, Class L shares, Class I shares, Class C shares, Class IS shares and Class IR shares. The seven classes are substantially the same except that most Class A shares are subject to a sales charge imposed at the time of purchase and some Class A shares, most Class B shares and most Class C shares are subject to a contingent deferred sales charge imposed on shares redeemed within eighteen months, six years and one year, respectively. Class L shares, Class I shares, Class IS shares and Class IR shares are not subject to a sales charge. Additionally, Class A shares, Class B shares, Class L shares and Class C shares incur distribution expenses.
The Fund suspended offering Class B and Class L shares to all investors (February 25, 2013 and April 30, 2015, respectively). Class B and Class L shareholders of the Fund do not have the option of purchasing additional Class B or Class L shares. However, the existing Class B and Class L shareholders may invest through reinvestment of dividends and distributions. Effective February 28, 2019, Class B shares generally converted to Class A shares approximately six years after the end of the calendar month in which the shares were purchased. As of the reporting period, all Class B shares were redeemed/converted to Class A shares and there were no shares outstanding. Accordingly, no financial highlights have been presented for Class B.
The following is a summary of significant accounting policies:
In August 2018, the Financial Accounting Standards Board ("FASB") issued Accounting Standards Update ("ASU") 2018-13, Fair Value Measurement (Topic 820) — Disclosures Framework — Changes to Disclosure Requirements of Fair Value Measurement ("ASU 2018-13") which introduces new fair value disclosure requirements as well as eliminates and modifies certain existing fair value disclosure requirements. ASU 2018-13 would be effective for fiscal years beginning after December 15, 2019 and for interim periods within those fiscal years; however, management has elected to early adopt ASU 2018-13 as permitted by the standard. The impact of the Fund's adoption was limited to changes in the Fund's financial statement disclosures regarding fair value, primarily those disclosures related to transfers between levels of the fair value hierarchy and disclosure of the range and weighted average used to develop significant unobservable inputs for Level 3 fair value measurements, when applicable.
48
Morgan Stanley Global Fixed Income Opportunities Fund
Notes to Financial Statements n October 31, 2019 continued
A. Valuation of Investments — (1) Certain portfolio securities may be valued by an outside pricing service/vendor approved by the Fund's Board of Trustees (the "Trustees"). The pricing service/vendor may employ a pricing model that takes into account, among other things, bids, yield spreads and/or other market data and specific security characteristics. Alternatively, if a valuation is not available from an outside pricing service/vendor, and the security trades on an exchange, the security may be valued at its latest reported sale price (or at the exchange official closing price if such exchange reports an official closing price), prior to the time when assets are valued. If there are no sales on a given day and if there is no official exchange closing price for that day, the security is valued at the mean between the last reported bid and asked prices if such bid and asked prices are available in the relevant exchanges. If Morgan Stanley Investment Management Inc.(the "Adviser") or Morgan Stanley Investment Management Limited (the "Sub-Adviser"), each a wholly-owned subsidiary of the Morgan Stanley determines that the price provided by the outside pricing service/vendor or exchange does not reflect the security's fair value or is unable to provide a price, prices from brokers or dealers may also be utilized. In these circumstances, the value of the security will be the mean of bid and asked prices obtained from the brokers or dealers; (2) an equity portfolio security listed or traded on an exchange is valued at its latest reported sales price (or at the exchange official closing price if such exchange reports an official closing price), and if there were no sales on a given day and if there is no official exchange closing price for that day, the security is valued at the mean between the last reported bid and asked prices if such bid and asked prices are available on the relevant exchanges. If only bid prices are available then the latest bid price may be used. Listed equity securities not traded on the valuation date with no reported bid and asked prices available on the exchange are valued at the mean between the current bid and asked prices obtained from one or more reputable brokers or dealers. In cases where a security is traded on more than one exchange, the security is valued on the exchange designated as the primary market; (3) all other equity portfolio securities for which over-the-counter ("OTC") market quotations are readily available are valued at the latest reported sales price (or at the market official closing price if such market reports an official closing price), and if there was no trading in the security on a given day and if there is no official closing price from relevant markets for that day, the security is valued at the mean between the last reported bid and asked prices if such bid and asked prices are available on the relevant markets. An unlisted equity security that does not trade on the valuation date and for which bid and asked prices from the relevant markets are unavailable is valued at the mean between the current bid and asked prices obtained from one or more reputable brokers or dealers; (4) when market quotations are not readily available, including circumstances under which the Adviser or the Sub-Adviser, determines that the closing price, last sale price or the mean between the last reported bid and asked prices are not reflective of a security's market value, portfolio securities are valued at their fair value as determined in good faith under procedures established by and under the general supervision of the Trustees. Occasionally, developments affecting the closing prices of securities and other assets may occur between the times at which valuations of such securities are
49
Morgan Stanley Global Fixed Income Opportunities Fund
Notes to Financial Statements n October 31, 2019 continued
determined (that is, close of the foreign market on which the securities trade) and the close of business on the New York Stock Exchange ("NYSE"). If developments occur during such periods that are expected to materially affect the value of such securities, such valuations may be adjusted to reflect the estimated fair value of such securities as of the close of the NYSE, as determined in good faith by the Trustees or by the Adviser using a pricing service and/or procedures approved by the Trustees; (5) certain senior collateralized loans ("Senior Loans") are valued based on quotations received from an independent pricing service; (6) futures are valued at the settlement price on the exchange on which they trade or, if a settlement price is unavailable, at the last sale price on the exchange; (7) OTC swaps may be valued by an outside pricing service approved by the Trustees or quotes from a broker or dealer. Swaps cleared on a clearinghouse or exchange may be valued using the closing price provided by the clearinghouse or exchange; (8) quotations of foreign portfolio securities, other assets and liabilities and forward contracts stated in foreign currency are translated into U.S. dollar equivalents at the prevailing market rates prior to the close of the NYSE; and (9) investments in mutual funds, including the Morgan Stanley Institutional Liquidity Funds, are valued at the net asset value ("NAV") as of the close of each business day.
The Trustees have responsibility for determining in good faith the fair value of the investments, and the Trustees may appoint others, such as the Fund's Adviser or a valuation committee, to assist the Trustees in determining fair value and to make the actual calculations pursuant to the fair valuation methodologies previously approved by the Trustees. Under procedures approved by the Trustees, the Fund's Adviser has formed a Valuation Committee whose members are approved by the Trustees. The Valuation Committee provides administration and oversight of the Fund's valuation policies and procedures, which are reviewed at least annually by the Trustees. These procedures allow the Fund to utilize independent pricing services, quotations from securities and financial instrument dealers and other market sources to determine fair value.
B. Accounting for Investments — Security transactions are accounted for on the trade date (date the order to buy or sell is executed). Realized gains and losses on security transactions are determined by the identified cost method. Dividend income and other distributions are recorded on the ex-dividend date. Discounts are accreted and premiums are amortized over the life of the respective securities and are included in interest income. Interest income is accrued daily as earned.
C. When-Issued/Delayed Delivery Securities — The Fund may purchase or sell when-issued and delayed delivery securities. Securities purchased on a when-issued or delayed delivery basis are purchased for delivery beyond the normal settlement date at a stated price, and no income accrues to the Fund on such securities prior to delivery date. Payment and delivery for when-issued and delayed delivery securities can take place a month or more after the date of the transaction. When the Fund enters into a purchase transaction on a when-issued or delayed delivery basis, securities are available
50
Morgan Stanley Global Fixed Income Opportunities Fund
Notes to Financial Statements n October 31, 2019 continued
for collateral in an amount at least equal in value to the Fund's commitments to purchase such securities. Purchasing securities on a when-issued or delayed delivery basis may involve a risk that the market price at the time of delivery may be lower than the agreed upon purchase price, in which case there could be an unrealized loss at the time of delivery. Purchasing investments on a when-issued or delayed delivery basis may be considered a form of leverage which may increase the impact that gains (losses) may have on the Fund.
D. Multiple Class Allocations — Investment income, realized and unrealized gain (loss) and non-class specific expenses are allocated daily based upon the proportion of net assets of each class. Class specific expenses are borne by the respective share classes and include Distribution, Transfer Agent and Sub Transfer Agent fees.
E. Senior Loans — Senior Loans are typically structured by a syndicate of lenders ("Lenders"), one or more of which administers the Senior Loan on behalf of the Lenders ("Agent"). Lenders may sell interests in Senior Loans to third parties ("Participations") or may assign all or a portion of their interest in a Senior Loan to third parties ("Assignments"). Senior Loans are exempt from registration under the Securities Act of 1933. Presently, Senior Loans are not readily marketable and are often subject to restrictions on resale.
F. Foreign Currency Translation and Foreign Investments — The books and records of the Fund are maintained in U.S. dollars. Foreign currency amounts are translated into U.S. dollars as follows:
— investments, other assets and liabilities at the prevailing rate of exchange on the valuation date;
— investment transactions and investment income at the prevailing rates of exchange on the dates of such transactions.
Although the net assets of the Fund are presented at the foreign exchange rates and market values at the close of the period, the Fund does not isolate that portion of the results of operations arising as a result of changes in the foreign exchange rates from the fluctuations arising from changes in the market prices of securities held at period end. Similarly, the Fund does not isolate the effect of changes in foreign exchange rates from the fluctuations arising from changes in the market prices of securities sold during the period. Accordingly, realized and unrealized foreign currency gains (losses) on investments in securities are included in the reported net realized and unrealized gains (losses) on investment transactions and balances. However, pursuant to U.S. federal income tax regulations, gains and losses from certain foreign currency transactions and the foreign currency portion of gains and losses realized on sales and maturities of foreign denominated debt securities are treated as ordinary income for U.S. federal income tax purposes.
51
Morgan Stanley Global Fixed Income Opportunities Fund
Notes to Financial Statements n October 31, 2019 continued
Net realized gains (losses) on foreign currency transactions represent net foreign exchange gains (losses) from foreign currency forward exchange contracts, disposition of foreign currencies, currency gains (losses) realized between the trade and settlement dates on securities transactions, and the difference between the amount of investment income and foreign withholding taxes recorded on the Fund's books and the U.S. dollar equivalent amounts actually received or paid. The change in unrealized currency gains (losses) on foreign currency transactions for the period is reflected in the Statement of Operations.
G. Securities Lending — The Fund may lend securities to qualified financial institutions, such as broker-dealers, to earn additional income. Any increase or decrease in the fair value of the securities loaned that might occur and any interest earned or dividends declared on those securities during the term of the loan would remain in the Fund. The Fund receives cash or securities as collateral in an amount equal to or exceeding 100% of the current fair value of the loaned securities. The collateral is marked-to-market daily by State Street Bank and Trust Company ("State Street"), the securities lending agent, to ensure that a minimum of 100% collateral coverage is maintained.
Based on pre-established guidelines, the securities lending agent invests any cash collateral that is received in an affiliated money market portfolio and repurchase agreements. Securities lending income is generated from the earnings on the invested collateral and borrowing fees, less any rebates owed to the borrowers and compensation to the lending agent, and is recorded as "Income from securities loaned — net" in the Fund's Statement of Operations.
The Fund has the right under the securities lending agreement to recover the securities from the borrower on demand.
The following table presents financial instruments that are subject to enforceable netting arrangements as of October 31, 2019:
GROSS AMOUNTS NOT OFFSET IN THE STATEMENT OF ASSETS AND LIABILITIES
GROSS ASSET AMOUNT
PRESENTED IN THE STATEMENT
OF ASSETS AND LIABILITIES | | FINANCIAL
INSTRUMENT | | COLLATERAL
RECEIVED | | NET AMOUNT
(NOT LESS THAN $0) | |
| $ | 9,720,887 | (a) | | $ | — | | | $ | (9,720,887 | )(b)(c) | | $ | 0 | | |
(a) Represents market value of loaned securities at period end.
(b) The Fund received cash collateral of $6,451,475, which was subsequently invested in Morgan Stanley Institutional Liquidity Funds as reported in the Portfolio of Investments. In addition, the Fund received non-cash collateral of $3,478,040 in the form of U.S. Government obligations, which the Fund cannot sell or repledge, and accordingly are not reflected in the Portfolio of Investments.
(c) The actual collateral received is greater than the amount shown here due to overcollateralization.
52
Morgan Stanley Global Fixed Income Opportunities Fund
Notes to Financial Statements n October 31, 2019 continued
FASB Accounting Standards CodificationTM ("ASC") 860, "Transfers & Servicing: Repurchase-to-Maturity Transactions, Repurchase Financings, and Disclosures", is intended to provide increased transparency about the types of collateral pledged in securities lending transactions and other similar transactions that are accounted for as secured borrowing.
The following table displays a breakdown of transactions accounted for as secured borrowings, the gross obligations by class of collateral pledged and the remaining contractual maturity of those transactions as of October 31, 2019:
| | | REMAINING CONTRACTUAL MATURITY OF THE AGREEMENTS | |
| | | OVERNIGHT AND
CONTINUOUS | | <30 DAYS | | BETWEEN
30 & 90 DAYS | | >90 DAYS | | TOTAL | |
Securities Lending Transactions | |
Corporate Bonds | | $ | 6,333,125 | | | $ | — | | | $ | — | | | $ | — | | | $ | 6,333,125 | | |
Sovereign | | | 118,350 | | | | — | | | | — | | | | — | | | | 118,350 | | |
Total Borrowings | | $ | 6,451,475 | | | $ | — | | | $ | — | | | $ | — | | | $ | 6,451,475 | | |
Gross amount of recognized liabilities for securities lending transactions | | | | | | | | | | $ | 6,451,475 | | |
H. Dividends and Distributions to Shareholders — Dividends and distributions to shareholders are recorded on the ex-dividend date. Dividends from net investment income, if any, are declared and paid monthly. Net realized capital gains, if any, are distributed at least annually.
I. Use of Estimates — The preparation of financial statements in accordance with generally accepted accounting principles in the United States ("GAAP") requires management to make estimates and assumptions that affect the reported amounts and disclosures. Actual results could differ from those estimates.
J. Indemnifications — The Fund enters into contracts that contain a variety of indemnifications. The Fund's maximum exposure under these arrangements is unknown. However, the Fund has not had prior claims or losses pursuant to these contracts and expects the risk of loss to be remote.
2. Fair Valuation Measurements
FASB ASC 820, "Fair Value Measurement" ("ASC 820"), defines fair value as the value that the Fund would receive to sell an investment or pay to transfer a liability in a timely transaction with an independent buyer in the principal market, or in the absence of a principal market, the most advantageous market for the investment or liability. ASC 820 establishes a three-tier hierarchy to distinguish between (1) inputs that reflect the assumptions market participants would use in valuing an asset or liability developed based on market data obtained from sources independent of the reporting entity (observable inputs); and (2) inputs that reflect the reporting entity's own assumptions about the
53
Morgan Stanley Global Fixed Income Opportunities Fund
Notes to Financial Statements n October 31, 2019 continued
assumptions market participants would use in valuing an asset or liability developed based on the best information available in the circumstances (unobservable inputs) and to establish classification of fair value measurements for disclosure purposes. Various inputs are used in determining the value of the Fund's investments. The inputs are summarized in the three broad levels listed below:
• Level 1 — unadjusted quoted prices in active markets for identical investments
• Level 2 — other significant observable inputs (including quoted prices for similar investments, interest rates, prepayment speeds, credit risk, etc.)
• Level 3 — significant unobservable inputs including the Fund's own assumptions in determining the fair value of investments. Factors considered in making this determination may include, but are not limited to, information obtained by contacting the issuer, analysts, or the appropriate stock exchange (for exchange-traded securities), analysis of the issuer's financial statements or other available documents and, if necessary, available information concerning other securities in similar circumstances.
The inputs or methodology used for valuing securities are not necessarily an indication of the risk associated with investing in those securities and the determination of the significance of a particular input to the fair value measurement in its entirety requires judgment and considers factors specific to each security.
The following is a summary of the inputs used to value the Fund's investments as of October 31, 2019:
INVESTMENT TYPE | | LEVEL 1
UNADJUSTED
QUOTED
PRICES | | LEVEL 2
OTHER
SIGNIFICANT
OBSERVABLE
INPUTS | | LEVEL 3
SIGNIFICANT
UNOBSERVABLE
INPUTS | | TOTAL | |
Assets: | |
Fixed Income Securities | |
Corporate Bonds | | $ | — | | | $ | 238,258,925 | | | $ | — | † | | $ | 238,258,925 | † | |
Sovereign | | | — | | | | 178,407,044 | | | | — | | | | 178,407,044 | | |
Agency Fixed Rate Mortgages | | | — | | | | 91,376 | | | | — | | | | 91,376 | | |
Asset-Backed Securities | | | — | | | | 121,187,929 | | | | — | | | | 121,187,929 | | |
Collateralized Mortgage Obligations — Agency
Collateral Series | | | — | | | | 1,537,293 | | | | — | | | | 1,537,293 | | |
Commercial Mortgage-Backed Securities | | | — | | | | 20,752,697 | | | | — | | | | 20,752,697 | | |
Mortgages — Other | | | — | | | | 80,217,444 | | | | — | | | | 80,217,444 | | |
U.S. Treasury Securities | | | — | | | | 23,178,473 | | | | — | | | | 23,178,473 | | |
Senior Loan Interests | | | — | | | | 21,718,195 | | | | — | | | | 21,718,195 | | |
Total Fixed Income Securities | | | — | | | | 685,349,376 | | | | — | † | | | 685,349,376 | † | |
54
Morgan Stanley Global Fixed Income Opportunities Fund
Notes to Financial Statements n October 31, 2019 continued
INVESTMENT TYPE | | LEVEL 1
UNADJUSTED
QUOTED
PRICES | | LEVEL 2
OTHER
SIGNIFICANT
OBSERVABLE
INPUTS | | LEVEL 3
SIGNIFICANT
UNOBSERVABLE
INPUTS | | TOTAL | |
Assets (cont'd): | |
Short-Term Investments | |
Sovereign | | $ | — | | | $ | 9,740,482 | | | $ | — | | | $ | 9,740,482 | | |
Commercial Paper | | | — | | | | 18,246,368 | | | | — | | | | 18,246,368 | | |
U.S. Treasury Securities | | | — | | | | 27,257,251 | | | | — | | | | 27,257,251 | | |
Investment Company | | | 47,546,194 | | | | — | | | | — | | | | 47,546,194 | | |
Total Short-Term Investments | | | 47,546,194 | | | | 55,244,101 | | | | — | | | | 102,790,295 | | |
Foreign Currency Forward Exchange Contracts | | | — | | | | 419,907 | | | | — | | | | 419,907 | | |
Futures Contracts | | | 432,519 | | | | — | | | | — | | | | 432,519 | | |
Total Assets | | | 47,978,713 | | | | 741,013,384 | | | | — | † | | | 788,992,097 | † | |
Liabilities: | |
Foreign Currency Forward Exchange Contracts | | | — | | | | (2,932,150 | ) | | | — | | | | (2,932,150 | ) | |
Futures Contracts | | | (235,072 | ) | | | — | | | | — | | | | (235,072 | ) | |
Credit Default Swap Agreement | | | — | | | | (37,251 | ) | | | — | | | | (37,251 | ) | |
Total Liabilities | | | (235,072 | ) | | | (2,969,401 | ) | | | — | | | | (3,204,473 | ) | |
Total | | $ | 47,743,641 | | | $ | 738,043,983 | | | $ | — | † | | $ | 785,787,624 | † | |
† Includes one security which is valued at zero.
Transfers between investment levels may occur as the markets fluctuate and/or the availability of data used in an investment's valuation changes.
Following is a reconciliation of investments in which significant unobservable inputs (Level 3) were used in determining fair value:
| | | CORPORATE BOND | |
Beginning Balance | | $ | — | † | |
Purchases | | | — | | |
Sales | | | — | | |
Amortization of discount | | | — | | |
Transfers in | | | — | | |
Transfers out | | | — | | |
Corporate actions | | | — | | |
Change in unrealized appreciation (depreciation) | | | — | | |
Realized gains (losses) | | | — | | |
Ending Balance | | $ | — | † | |
Net change in unrealized appreciation (depreciation) from
investments still held as of October 31, 2019 | | $ | — | † | |
† Includes one security which is valued at zero.
55
Morgan Stanley Global Fixed Income Opportunities Fund
Notes to Financial Statements n October 31, 2019 continued
3. Derivatives
The Fund may, but it is not required to, use derivative instruments for a variety of purposes, including hedging, risk management, portfolio management or to earn income. Derivatives are financial instruments whose value is based, in part, on the value of an underlying asset, interest rate, index or financial instrument. Prevailing interest rates and volatility levels, among other things, also affect the value of derivative instruments. A derivative instrument often has risks similar to its underlying asset and may have additional risks, including imperfect correlation between the value of the derivative and the underlying asset, risks of default by the counterparty to certain transactions, magnification of losses incurred due to changes in the market value of the securities, instruments, indices or interest rates to which the derivative instrument relates, risks that the transactions may not be liquid and risks arising from margin requirements. The use of derivatives involves risks that are different from, and possibly greater than, the risks associated with other portfolio investments. Derivatives may involve the use of highly specialized instruments that require investment techniques and risk analyses different from those associated with other portfolio investments. All of the Fund's holdings, including derivative instruments, are marked-to-market each day with the change in value reflected in unrealized appreciation (depreciation). Upon disposition, a realized gain or loss is recognized.
Certain derivative transactions may give rise to a form of leverage. Leverage magnifies the potential for gain and risk of loss. Leverage associated with derivative transactions may cause the Fund to liquidate portfolio positions when it may not be advantageous to do so to satisfy its obligations or to meet earmarking or segregation requirements, pursuant to applicable Securities and Exchange Commission rules and regulations, or may cause the Fund to be more volatile than if the Fund had not been leveraged. Although the Adviser and/or Sub-Adviser seek to use derivatives to further the Fund's investment objectives, there is no assurance that the use of derivatives will achieve this result.
Following is a description of the derivative instruments and techniques that the Fund used during the period and their associated risks:
Foreign Currency Forward Exchange Contracts — The Fund entered into contracts with banks, brokers or dealers to purchase or sell securities or foreign currencies at a future date. A foreign currency forward exchange contract ("currency contract") is a negotiated agreement between the contracting parties to exchange a specified amount of currency at a specified future time at a specified rate. The rate can be higher or lower than the spot rate between the currencies that are the subject of the contract. Currency contracts may be used to protect against uncertainty in the level of future foreign currency exchange rates or to gain or modify exposure to a particular currency. In addition, the Fund may use cross currency hedging or proxy hedging with respect to currencies in which the Fund has or expects to have portfolio or currency exposure. Cross currency hedges involve the sale of one currency against the positive exposure to a different currency and may be used for hedging purposes
56
Morgan Stanley Global Fixed Income Opportunities Fund
Notes to Financial Statements n October 31, 2019 continued
or to establish an active exposure to the exchange rate between any two currencies. To the extent hedged by the use of currency contracts, the precise matching of the currency contract amounts and the value of the securities involved will not generally be possible because the future value of such securities in foreign currencies will change as a consequence of market movements in the value of those securities between the date on which the contract is entered into and the date it matures. Furthermore, such transactions may reduce or preclude the opportunity for gain if the value of the currency should move in the direction opposite to the position taken. There is additional risk to the extent that currency contracts create exposure to currencies in which the Fund's securities are not denominated. Unanticipated changes in currency prices may result in poorer overall performance for the Fund than if it had not entered into such contracts. The use of currency contracts involves the risk of loss from the insolvency or bankruptcy of the counterparty to the contract or the failure of the counterparty to make payments or otherwise comply with the terms of the contract. A currency contract is marked-to-market daily and the change in market value is recorded by the Fund as unrealized gain or loss. The Fund records realized gains (losses) when the currency contract is closed equal to the difference between the value of the currency contract at the time it was opened and the value at the time it was closed.
Futures — A futures contract is a standardized, exchange-traded agreement to buy or sell a specific quantity of an underlying asset, reference rate or index at a specific price at a specific future time. The value of a futures contract tends to increase and decrease in tandem with the value of the underlying instrument. Depending on the terms of the particular contract, futures contracts are settled through either physical delivery of the underlying instrument on the settlement date or by payment of a cash settlement amount on the settlement date. During the period the futures contract is open, payments are received from or made to the broker based upon changes in the value of the contract (the variation margin). A decision as to whether, when and how to use futures contracts involves the exercise of skill and judgment and even a well-conceived futures transaction may be unsuccessful because of market behavior or unexpected events. In addition to the derivatives risks discussed above, the prices of futures contracts can be highly volatile, using futures contracts can lower total return and the potential loss from futures contracts can exceed the Fund's initial investment in such contracts. No assurance can be given that a liquid market will exist for any particular futures contract at any particular time. There is also the risk of loss by the Fund of margin deposits in the event of bankruptcy of a broker with which the Fund has open positions in the futures contract.
Swaps — The Fund may enter into OTC swap contracts or cleared swap transactions. An OTC swap contract is an agreement between two parties pursuant to which the parties exchange payments at specified dates on the basis of a specified notional amount, with the payments calculated by reference to specified securities, indices, reference rates, currencies or other instruments. Typically swap agreements provide that when the period payment dates for both parties are the same, the payments
57
Morgan Stanley Global Fixed Income Opportunities Fund
Notes to Financial Statements n October 31, 2019 continued
are made on a net basis (i.e., the two payment streams are netted out, with only the net amount paid by one party to the other). The Fund's obligations or rights under a swap contract entered into on a net basis will generally be equal only to the net amount to be paid or received under the agreement, based on the relative values of the positions held by each party. Cleared swap transactions may help reduce counterparty credit risk. In a cleared swap, the Fund's ultimate counterparty is a clearinghouse rather than a swap dealer, bank or other financial institution. OTC swap agreements are not entered into or traded on exchanges and often there is no central clearing or guaranty function for OTC swaps. These OTC swaps are often subject to credit risk or the risk of default or non-performance by the counterparty. Both OTC and cleared swaps could result in losses if interest rates, foreign currency exchange rates or other factors are not correctly anticipated by the Fund or if the reference index, security or investments do not perform as expected. During the period swap agreements are open, payments are received from or made to the clearinghouse or counterparty based upon changes in the value of the contract (variation margin). The Dodd-Frank Wall Street Reform and Consumer Protection Act and related regulatory developments require the clearing and exchange-trading of certain standardized swap transactions. Mandatory exchange-trading and clearing is occurring on a phased-in basis.
The Fund's use of swaps during the period included those based on the credit of an underlying security commonly referred to as "credit default swaps." The Fund may be either the buyer or seller in a credit default swap. Where the Fund is the buyer of a credit default swap contract, it would typically be entitled to receive the par (or other agreed-upon) value of a referenced debt obligation from the counterparty to the contract only in the event of a default or similar event by the issuer of the debt obligation. If no default occurs, the Fund would have paid to the counterparty a periodic stream of payments over the term of the contract and received no benefit from the contract. When the Fund is the seller of a credit default swap contract, it typically receives the stream of payments but is obligated to pay an amount equal to the par (or other agreed-upon) value of a referenced debt obligation upon the default or similar event by the issuer of the referenced debt obligation. The use of credit default swaps could result in losses to the Fund if the Adviser fails to correctly evaluate the creditworthiness of the issuer of the referenced debt obligation.
If the Fund is a seller of protection and a credit event occurs, as defined under the terms of that particular swap agreement, the Fund will either (i) pay to the buyer of protection an amount equal to the notional amount of the swap agreement and take delivery of the referenced obligation, other deliverable obligations or underlying securities comprising the referenced index or (ii) pay a net settlement amount in the form of cash or securities equal to the notional amount of the swap agreement less the recovery value of the referenced obligation or underlying securities comprising the referenced index. If the Fund is a buyer of protection and a credit event occurs, as defined under the terms of that particular swap agreement, the Fund will either (i) receive from the seller of protection an amount equal to the notional
58
Morgan Stanley Global Fixed Income Opportunities Fund
Notes to Financial Statements n October 31, 2019 continued
amount of the swap agreement and deliver the referenced obligation, other deliverable obligations or underlying securities comprising the referenced index or (ii) receive a net settlement amount in the form of cash or securities equal to the notional amount of the swap agreement less the recovery value of the referenced obligation or underlying securities comprising the referenced index. Recovery values are estimated by market makers considering either industry standard recovery rates or entity specific factors and considerations until a credit event occurs. If a credit event has occurred, the recovery value is determined by a facilitated auction whereby a minimum number of allowable broker bids, together with a specified valuation method, are used to calculate the settlement value. The Fund's maximum risk of loss from counterparty risk, either as the protection seller or as the protection buyer, is the fair value of the swap agreement.
The current credit rating of each individual issuer is included in the table following the Portfolio of Investments and serves as an indicator of the current status of the payment/performance risk of the credit derivative. Alternatively, for credit default swaps on an index of credits, the quoted market prices and current values serve as an indicator of the current status of the payment/performance risk of the credit derivative. Generally, lower credit ratings and increasing market values, in absolute terms, represent a deterioration of the credit and a greater likelihood of an adverse credit event of the issuer.
When the Fund has an unrealized loss on a swap agreement, the Fund has instructed the custodian to pledge cash or liquid securities as collateral with a value approximately equal to the amount of the unrealized loss. Collateral pledges are monitored and subsequently adjusted if and when the swap valuations fluctuate. If applicable, cash collateral is included with "Due from (to) broker" in the Statement of Assets and Liabilities.
Upfront payments paid or received by the Fund will be reflected as an asset or liability, respectively, in the Statement of Assets and Liabilities.
FASB ASC 815, "Derivatives and Hedging" ("ASC 815"), is intended to improve financial reporting about derivative instruments by requiring enhanced disclosures to enable investors to better understand how and why the Fund uses derivative instruments, how these derivative instruments are accounted for and their effects on the Fund's financial position and results of operations.
59
Morgan Stanley Global Fixed Income Opportunities Fund
Notes to Financial Statements n October 31, 2019 continued
The following table sets forth the fair value of the Fund's derivative contracts by primary risk exposure as of October 31, 2019:
PRIMARY RISK EXPOSURE | | ASSET DERIVATIVES
STATEMENT OF ASSETS
AND LIABILITIES LOCATION | | FAIR VALUE | | LIABILITY DERIVATIVES
STATEMENT OF ASSETS
AND LIABILITIES LOCATION | | FAIR VALUE | |
Interest Rate Risk | | Variation margin on open
futures contracts | | $ | 432,519 | (d) | | Variation margin on open
futures contracts | | $ | (235,072 | )(d) | |
Credit Risk | | Variation margin on open
swap agreements | | | — | | | Variation margin on open
swap agreement | | | (37,251 | )(d) | |
Currency Risk | | Unrealized appreciation on
open foreign currency
forward exchange contracts | | | 419,907 | | | Unrealized depreciation
on open foreign currency
forward exchange contracts | | | (2,932,150 | ) | |
| | | | | $ | 852,426 | | | | | $ | (3,204,473 | ) | |
(d) Includes cumulative appreciation (depreciation) as reported in the Portfolio of Investments. Only current day's net variation margin is reported within the Statement of Assets and Liabilities.
The following tables set forth by primary risk exposure the Fund's realized gains (losses) and change in unrealized appreciation (depreciation) by type of derivative contract for the year ended October 31, 2019 in accordance with ASC 815:
AMOUNT OF REALIZED GAIN (LOSS) ON DERIVATIVES
PRIMARY RISK EXPOSURE | | FUTURES
CONTRACTS | | FOREIGN CURRENCY
FORWARD EXCHANGE
CONTRACTS | | SWAP
AGREEMENTS | |
Interest Rate Risk | | $ | (357,868 | ) | | $ | — | | | $ | (1,798,239 | ) | |
Credit Risk | | | — | | | | — | | | | (1,262,814 | ) | |
Currency Risk | | | — | | | | 11,019,128 | | | | — | | |
Total | | $ | (357,868 | ) | | $ | 11,019,128 | | | $ | (3,061,053 | ) | |
CHANGE IN UNREALIZED APPRECIATION (DEPRECIATION) ON DERIVATIVES
PRIMARY RISK EXPOSURE | | FUTURES
CONTRACTS | | FOREIGN CURRENCY
FORWARD EXCHANGE
CONTRACTS | | SWAP
AGREEMENTS | |
Interest Rate Risk | | $ | (464,149 | ) | | $ | — | | | $ | (266,751 | ) | |
Credit Risk | | | — | | | | — | | | | 578,729 | | |
Currency Risk | | | — | | | | (6,115,067 | ) | | | — | | |
Total | | $ | (464,149 | ) | | $ | (6,115,067 | ) | | $ | 311,978 | | |
60
Morgan Stanley Global Fixed Income Opportunities Fund
Notes to Financial Statements n October 31, 2019 continued
At October 31, 2019, the Fund's derivative assets and liabilities are as follows:
GROSS AMOUNTS OF ASSETS AND LIABILITIES PRESENTED IN THE STATEMENT OF ASSETS AND LIABILITIES
DERIVATIVES(e) | | ASSETS(f) | | LIABILITIES(f) | |
Foreign Currency Forward Exchange Contracts | | $ | 419,907 | | | $ | (2,932,150 | ) | |
(e) Excludes exchange-traded derivatives.
(f) Absent an event of default or early termination, OTC derivative assets and liabilities are presented gross and not offset in the Statement of Assets and Liabilities.
The Fund typically enters into International Swaps and Derivatives Association, Inc. Master Agreements ("ISDA Master Agreements") or similar master agreements (collectively, "Master Agreements") with its contract counterparties for certain OTC derivatives in order to, among other things, reduce its credit risk to counterparties. ISDA Master Agreements include provisions for general obligations, representations, collateral and events of default or termination. Under an ISDA Master Agreement, the Fund typically may offset with the counterparty certain OTC derivative financial instruments' payables and/or receivables with collateral held and/or posted and create one single net payment (close-out netting) in the event of default, termination and/or potential deterioration in the credit quality of the counterparty. Various Master Agreements govern the terms of certain transactions with counterparties, including transactions such as swap, forward, repurchase and reverse repurchase agreements. These Master Agreements typically attempt to reduce the counterparty risk associated with such transactions by specifying credit protection mechanisms and providing standardization that improves legal certainty. Cross-termination provisions under Master Agreements typically provide that a default in connection with one transaction between the Fund and a counterparty gives the non-defaulting party the right to terminate any other transactions in place with the defaulting party to create one single net payment due to/due from the defaulting party and may be a feature in certain Master Agreements. In the event the Fund exercises its right to terminate a Master Agreement after a counterparty experiences a termination event as defined in the Master Agreement, the return of collateral with market value in excess of the Fund's net liability may be delayed or denied.
61
Morgan Stanley Global Fixed Income Opportunities Fund
Notes to Financial Statements n October 31, 2019 continued
The following tables present derivative financial instruments that are subject to enforceable netting arrangements as of October 31, 2019:
GROSS AMOUNTS NOT OFFSET IN THE STATEMENT OF ASSETS AND LIABILITIES
COUNTERPARTY | | GROSS ASSET DERIVATIVES
PRESENTED IN THE STATEMENT
OF ASSETS AND LIABILITIES | | FINANCIAL
INSTRUMENT | | COLLATERAL
RECEIVED | | NET AMOUNT
(NOT LESS THAN $0) | |
Bank of America NA | | $ | 3,271 | | | $ | (3,271 | ) | | $ | — | | | $ | 0 | | |
Barclays Bank PLC | | | 253,755 | | | | (240,529 | ) | | | — | | | | 13,226 | | |
BNP Paribas SA | | | 42,974 | | | | (42,974 | ) | | | — | | | | 0 | | |
Citibank NA | | | 50,319 | | | | (50,319 | ) | | | — | | | | 0 | | |
Goldman Sachs International | | | 23,319 | | | | (23,319 | ) | | | — | | | | 0 | | |
JPMorgan Chase Bank NA | | | 46,269 | | | | (46,269 | ) | | | — | | | | 0 | | |
Total | | $ | 419,907 | | | $ | (406,681 | ) | | $ | — | | | $ | 13,226 | | |
GROSS AMOUNTS NOT OFFSET IN THE STATEMENT OF ASSETS AND LIABILITIES
COUNTERPARTY | | GROSS LIABILITY DERIVATIVES
PRESENTED IN THE STATEMENT
OF ASSETS AND LIABILITIES | | FINANCIAL
INSTRUMENT | | COLLATERAL
PLEDGED(g) | | NET AMOUNT
(NOT LESS THAN $0) | |
Bank of America NA | | $ | 190,869 | | | $ | (3,271 | ) | | $ | — | | | $ | 187,598 | | |
Barclays Bank PLC | | | 240,529 | | | | (240,529 | ) | | | — | | | | 0 | | |
BNP Paribas SA | | | 329,454 | | | | (42,974 | ) | | | (286,480 | ) | | | 0 | | |
Citibank NA | | | 149,750 | | | | (50,319 | ) | | | — | | | | 99,431 | | |
Goldman Sachs International | | | 1,215,664 | | | | (23,319 | ) | | | (944,579 | ) | | | 247,766 | | |
JPMorgan Chase Bank NA | | | 629,913 | | | | (46,269 | ) | | | — | | | | 583,644 | | |
Royal Bank of Canada | | | 132,811 | | | | — | | | | — | | | | 132,811 | | |
State Street Bank and Trust Co. | | | 21,832 | | | | — | | | | — | | | | 21,832 | | |
UBS AG | | | 21,328 | | | | — | | | | — | | | | 21,328 | | |
Total | | $ | 2,932,150 | | | $ | (406,681 | ) | | $ | (1,231,059 | ) | | $ | 1,294,410 | | |
(g) In some instances, the actual collateral received or pledged may be more than the amount shown here due to overcollateralization.
For the year ended October 31, 2019, the average monthly amount outstanding for each derivative type is as follows:
Foreign Currency Forward Exchange Contracts: | |
Average monthly principal amount | | $ | 253,867,483 | | |
Futures Contracts: | |
Average monthly notional value | | $ | 184,870,655 | | |
Swap Agreements: | |
Average monthly notional amount | | $ | 25,053,559 | | |
62
Morgan Stanley Global Fixed Income Opportunities Fund
Notes to Financial Statements n October 31, 2019 continued
4. Advisory/Administration and Sub-Advisory Agreements
Pursuant to an Investment Advisory Agreement with the Adviser, the Fund pays an advisory fee, accrued daily and paid monthly, by applying the annual rate of 0.32% to the net assets of the Fund determined as of the close of each business day.
The Adviser also serves as the Administrator to the Fund and provides administrative services pursuant to an Administration Agreement for an annual fee, accrued daily and paid monthly, of 0.08% of the Fund's average daily net assets.
Under a Sub-Administration Agreement between the Administrator and State Street, State Street provides certain administrative services to the Fund. For such services, the Administrator pays State Street a portion of the fee the Administrator receives from the Fund.
Under a Sub-Advisory Agreement between the Adviser and the Sub-Adviser, the Sub-Adviser provides the Fund with advisory services, subject to the overall supervision of the Adviser and the Fund's Officers and Trustees. The Adviser pays the Sub-Adviser on a monthly basis a portion of the net advisory fees the Adviser receives from the Fund.
The Adviser/Administrator has agreed to reduce its advisory fee, its administration fee and/or reimburse the Fund so that total annual operating expenses, excluding certain investment related expenses, taxes, interest and other extraordinary expenses (including litigation), will not exceed 0.95% for Class A, 1.59% for Class B, 1.24% for Class L, 0.60% for Class I, 1.70% for Class C, 0.57% for Class IS and 0.57% for Class IR. The fee waivers and/or expense reimbursements will continue for at least one year from the date of the Fund's prospectus or until such time that the Trustees act to discontinue all or a portion of such waivers and/or expense reimbursements when they deem such action is appropriate. For the year ended October 31, 2019, $2,799 of other expenses were reimbursed by the Adviser pursuant to this arrangement.
5. Plan of Distribution
Shares of the Fund are distributed by Morgan Stanley Distribution, Inc. (the "Distributor"), an affiliate of the Adviser/Administrator and Sub-Adviser. The Fund has adopted a Plan of Distribution (the "Plan") pursuant to Rule 12b-1 under the Act. The Plan provides that the Fund will pay the Distributor a fee which is accrued daily and paid monthly at the following annual rates: (i) Class A — up to 0.25% of the average daily net assets of Class A shares; (ii) Class B — up to 0.85% of the average daily net assets of Class B shares; (iii) Class L — up to 0.50% of the average daily net assets of Class L shares; and (iv) Class C — up to 1.00% of the average daily net assets of Class C shares.
In the case of Class B shares, provided that the Plan continues in effect, any cumulative expenses incurred by the Distributor but not yet recovered may or may not be recovered through the payment of
63
Morgan Stanley Global Fixed Income Opportunities Fund
Notes to Financial Statements n October 31, 2019 continued
future distribution fees from the Fund pursuant to the Plan and contingent deferred sales charges paid by investors upon redemption of Class B shares. Although there is no legal obligation for the Fund to pay expenses incurred in excess of payments made to the Distributor under the Plan and the proceeds of contingent deferred sales charges paid by investors upon redemption of shares, if for any reason the Plan is terminated, the Trustees will consider at that time the manner in which to treat such expenses. As of the reporting period, all Class B shares were redeemed/converted to Class A shares.
In the case of Class A shares, Class L shares and Class C shares, expenses incurred pursuant to the Plan in any calendar year in excess of 0.25%, 0.50% and 1.00% of the average daily net assets of Class A shares, Class L shares and Class C shares, respectively, will not be reimbursed by the Fund through payments in any subsequent year, except that expenses representing a gross sales commission credited to Financial Intermediaries at the time of sale may be reimbursed in the subsequent calendar year. For the year ended October 31, 2019, the distribution fee was accrued for Class A shares, Class L shares and Class C shares at the annual rate of 0.25%, 0.50% and 1.00%, respectively.
The Distributor has informed the Fund that for the year ended October 31, 2019, it received contingent deferred sales charges from certain redemptions of the Fund's Class A shares and Class C shares of $4,038 and $2,303, respectively, and received $97,318 in front-end sales charges from sales of the Fund's Class A shares. The respective shareholders pay such charges, which are not an expense of the Fund.
6. Dividend Disbursing and Transfer Agent
The Fund's dividend disbursing and transfer agent is DST Asset Manager Solutions, Inc. ("DST"). Pursuant to a Transfer Agency Agreement, the Fund pays DST a fee based on the number of classes, accounts and transactions relating to the Fund.
7. Security Transactions and Transactions with Affiliates
The cost of purchases and proceeds from sales of investment securities, excluding short-term investments, for the year ended October 31, 2019, aggregated $683,322,037 and $533,309,151, respectively. Included in the aforementioned are purchases and sales of U.S. Government securities of $73,819,567 and $55,994,491, respectively.
The Fund invests in the Institutional Class of the Morgan Stanley Institutional Liquidity Funds — Government Portfolio (the "Liquidity Funds"), an open-end management investment company managed by the Adviser, both directly and as a portion of the securities held as collateral on loaned securities. Advisory fees paid
64
Morgan Stanley Global Fixed Income Opportunities Fund
Notes to Financial Statements n October 31, 2019 continued
by the Fund are reduced by an amount equal to its pro-rata share of the advisory and administration fees paid by the Fund due to its investment in the Liquidity Funds. For the year ended October 31, 2019, advisory fees paid were reduced by $57,844 relating to the Fund's investment in the Liquidity Funds.
A summary of the Fund's transactions in shares of affiliated investments during the year ended October 31, 2019 is as follows:
AFFILIATED
INVESTMENT
COMPANY | | VALUE
OCTOBER 31,
2018 | | PURCHASES
AT COST | | PROCEEDS
FROM SALES | | DIVIDEND
INCOME | | REALIZED
GAIN (LOSS) | | CHANGE IN
UNREALIZED
APPRECIATION
(DEPRECIATION) | | VALUE
OCTOBER 31,
2019 | |
Liquidity Funds | | $ | 40,800,604 | | | $ | 407,862,985 | | | $ | 401,117,395 | | | $ | 781,237 | | | $ | — | | | $ | — | | | $ | 47,546,194 | | |
The Fund has an unfunded noncontributory defined benefit pension plan covering certain independent Trustees of the Fund who will have served as independent Trustees for at least five years at the time of retirement. Benefits under this plan are based on factors which include years of service and compensation. The Trustees voted to close the plan to new participants and eliminate the future benefits growth due to increases to compensation after July 31, 2003. Aggregate pension costs for the year ended October 31, 2019, included in "Trustees' fees and expenses" in the Statement of Operations amounted to $484. At October 31, 2019, the Fund had an accrued pension liability of $43,257, which is reflected as "Trustees' fees" in the Statement of Assets and Liabilities.
The Fund is permitted to purchase and sell securities ("cross-trade") from and to other Morgan Stanley funds as well as other funds and client accounts for which the Adviser or an affiliate of the Adviser serves as investment adviser, pursuant to procedures approved by the Trustees in compliance with Rule 17a-7 under the Act (the "Rule"). Each cross-trade is executed at the current market price in compliance with provisions of the Rule. For the year ended October 31, 2019, the Fund did not engage in any cross-trade transactions.
The Fund has an unfunded Deferred Compensation Plan (the "Compensation Plan"), which allows each independent Trustee to defer payment of all, or a portion, of the fees he or she receives for serving on the Board of Trustees. Each eligible Trustee generally may elect to have the deferred amounts credited with a return equal to the total return on one or more of the Morgan Stanley funds that are offered as investment options under the Compensation Plan. Appreciation/depreciation and distributions received from these investments are recorded with an offsetting increase/decrease in the deferred compensation obligation and do not affect the NAV of the Fund.
65
Morgan Stanley Global Fixed Income Opportunities Fund
Notes to Financial Statements n October 31, 2019 continued
8. Shares of Beneficial Interest
Transactions in shares of beneficial interest were as follows:
| | | FOR THE YEAR
ENDED
OCTOBER 31, 2019 | | FOR THE YEAR
ENDED
OCTOBER 31, 2018 | |
| | | SHARES | | AMOUNT | | SHARES | | AMOUNT | |
CLASS A SHARES | |
Sold | | | 9,273,004 | | | $ | 51,927,976 | | | | 5,857,797 | | | $ | 33,036,038 | | |
Conversion from Class B | | | 55,287 | | | | 304,844 | | | | 42,493 | | | | 240,009 | | |
Reinvestment of dividends | | | 720,053 | | | | 3,993,047 | | | | 447,981 | | | | 2,519,793 | | |
Redeemed | | | (5,418,416 | ) | | | (30,153,670 | ) | | | (5,574,139 | ) | | | (31,336,517 | ) | |
Net increase — Class A | | | 4,629,928 | | | | 26,072,197 | | | | 774,132 | | | | 4,459,323 | | |
CLASS B SHARES* | |
| Exchanged | | | 21,401 | | | | 118,558 | | | | 24,458 | | | | 139,566 | | |
Conversion to Class A | | | (54,987 | ) | | | (304,844 | ) | | | (42,296 | ) | | | (240,009 | ) | |
Reinvestment of dividends | | | 1,054 | | | | 5,748 | | | | 987 | | | | 5,581 | | |
Redeemed | | | (8,161 | ) | | | (45,499 | ) | | | (7,314 | ) | | | (41,437 | ) | |
| Net decrease — Class B | | | (40,693 | ) | | | (226,037 | ) | | | (24,165 | ) | | | (136,299 | ) | |
CLASS L SHARES | |
Exchanged | | | 892 | | | | 5,000 | | | | 60,456 | | | | 342,628 | | |
Reinvestment of dividends | | | 47,043 | | | | 259,555 | | | | 38,449 | | | | 216,346 | | |
Redeemed | | | (233,658 | ) | | | (1,292,894 | ) | | | (403,986 | ) | | | (2,271,368 | ) | |
Net decrease — Class L | | | (185,723 | ) | | | (1,028,339 | ) | | | (305,081 | ) | | | (1,712,394 | ) | |
CLASS I SHARES | |
Sold | | | 43,708,172 | | | | 247,944,229 | | | | 27,465,462 | | | | 156,688,061 | | |
Reinvestment of dividends | | | 2,527,520 | | | | 14,198,325 | | | | 1,386,739 | | | | 7,883,507 | | |
Redeemed | | | (25,016,625 | ) | | | (139,960,308 | ) | | | (14,498,468 | ) | | | (82,637,515 | ) | |
Net increase — Class I | | | 21,219,067 | | | | 122,182,246 | | | | 14,353,733 | | | | 81,934,053 | | |
CLASS C SHARES | |
Sold | | | 1,848,874 | | | | 10,323,976 | | | | 1,553,681 | | | | 8,737,864 | | |
Reinvestment of dividends | | | 197,582 | | | | 1,089,655 | | | | 108,017 | | | | 606,436 | | |
Redeemed | | | (1,658,001 | ) | | | (9,267,049 | ) | | | (942,276 | ) | | | (5,297,341 | ) | |
Net increase — Class C | | | 388,455 | | | | 2,146,582 | | | | 719,422 | | | | 4,046,959 | | |
CLASS IS SHARES | |
Sold | | | 7,230,322 | | | | 41,229,126 | | | | 2,890,731 | | | | 16,614,000 | | |
Reinvestment of dividends | | | 1,548,922 | | | | 8,701,055 | | | | 1,043,392 | | | | 5,942,791 | | |
Redeemed | | | (79,245 | ) | | | (442,277 | ) | | | (13,614,341 | ) | | | (78,506,221 | ) | |
Net increase (decrease) — Class IS | | | 8,699,999 | | | | 49,487,904 | | | | (9,680,218 | ) | | | (55,949,430 | ) | |
CLASS IR SHARES | |
Sold | | | — | | | | — | | | | 1,761 | (a) | | | 10,000 | (a) | |
Reinvestment of dividends and distributions | | | 41 | | | | 240 | | | | — | | | | — | | |
Net increase — Class IR | | | 41 | | | | 240 | | | | 1,761 | | | | 10,000 | | |
| Net increase in Fund | | | 34,711,074 | | | $ | 198,634,793 | | | | 5,839,584 | | | $ | 32,652,212 | | |
* All Class B shares were redeemed/converted to Class A shares as of March 26, 2019.
(a) For the period June 15, 2018 through October 31, 2018.
66
Morgan Stanley Global Fixed Income Opportunities Fund
Notes to Financial Statements n October 31, 2019 continued
9. Custodian Fees
State Street (the "Custodian") also serves as Custodian for the Fund in accordance with a Custodian Agreement. The Custodian holds cash, securities and other assets of the Fund as required by the Act. Custody fees are payable monthly based on assets held in custody, investment purchases and sales activity and account maintenance fees, plus reimbursement for certain out-of-pocket expenses.
10. Federal Income Tax Status
It is the Fund's intention to continue to qualify as a regulated investment company and distribute all of its taxable and tax-exempt income. Accordingly, no provision for Federal income taxes is required in the financial statements.
The Fund may be subject to taxes imposed by countries in which it invests. Such taxes are generally based on income and/or capital gains earned or repatriated. Taxes are accrued based on net investment income, net realized gains and net unrealized appreciation as such income and/or gains are earned. Taxes may also be based on transactions in foreign currency and are accrued based on the value of investments denominated in such currency.
FASB ASC 740-10, "Income Taxes — Overall", sets forth a minimum threshold for financial statement recognition of the benefit of a tax position taken or expected to be taken in a tax return. Management has concluded there are no significant uncertain tax positions that would require recognition in the financial statements. If applicable, the Fund recognizes interest accrued related to unrecognized tax benefits in "Interest Expense" and penalties in "Other Expenses" in the Statement of Operations. The Fund files tax returns with the U.S. Internal Revenue Service, New York and various states. Generally, each of the tax years in the four-year period ended October 31, 2019 remains subject to examination by taxing authorities.
The tax character of distributions paid may differ from the character of distributions shown for GAAP purposes due to short-term capital gains being treated as ordinary income for tax purposes. The tax character of distributions paid during fiscal years 2019 and 2018 was as follows:
| 2019 DISTRIBUTIONS PAID FROM: | | 2018 DISTRIBUTIONS PAID FROM: | |
| ORDINARY INCOME | | ORDINARY INCOME | |
| $ | 30,702,470 | | | $ | 18,454,738 | | |
The amount and character of income and gains to be distributed are determined in accordance with income tax regulations which may differ from GAAP. These book/tax differences are either considered temporary or permanent in nature.
67
Morgan Stanley Global Fixed Income Opportunities Fund
Notes to Financial Statements n October 31, 2019 continued
Temporary differences are attributable to differing book and tax treatments for the timing of the recognition of gains (losses) on certain investment transactions and the timing of the deductibility of certain expenses.
Permanent differences, due to a nondeductible expense, resulted in the following reclassifications among the components of net assets at October 31, 2019:
TOTAL
DISTRIBUTABLE
EARNINGS
(000) | | PAID-IN-CAPITAL
(000) | |
| $ | 8,977 | | | $ | (8,977 | ) | |
At October 31, 2019, the components of distributable earnings for the Fund on a tax basis were as follows:
UNDISTRIBUTED
ORDINARY
INCOME | | UNDISTRIBUTED
LONG-TERM
CAPITAL GAIN | |
| $ | 4,259,104 | | | $ | — | | |
At October 31, 2019, the Fund had available for federal income tax purposes unused long-term capital losses of $1,317,085 that do not have an expiration date.
To the extent that capital loss carryforwards are used to offset any future capital gains realized, no capital gains tax liability will be incurred by the Fund for gains realized and not distributed. To the extent that capital gains are offset, such gains will not be distributed to the shareholders.
11. Credit Facility
The Fund and other Morgan Stanley funds participated in a $150,000,000 committed, unsecured revolving line of credit facility (the "Facility") with State Street. Effective April 22, 2019, the committed line amount increased to $300,000,000. This Facility is to be used for temporary emergency purposes or funding of shareholder redemption requests. The interest rate on borrowings is based on the federal funds rate or 1 month LIBOR rate plus a spread. The Facility also has a commitment fee of 0.25% per annum based on the unused portion of the Facility. During the year ended October 31, 2019, the Fund did not have any borrowings under the Facility.
12. Other
At October 31, 2019, the Fund did not have record owners of 10% or greater.
68
Morgan Stanley Global Fixed Income Opportunities Fund
Notes to Financial Statements n October 31, 2019 continued
13. Purposes of and Risks Relating to Certain Financial Instruments
The Fund may invest in mortgage securities, including securities issued by the Federal National Mortgage Association ("FNMA") and Federal Home Loan Mortgage Corporation ("FHLMC"). These are fixed income securities that derive their value from or represent interests in a pool of mortgages or mortgage securities. An unexpectedly high rate of defaults on the mortgages held by a mortgage pool may adversely affect the value of a mortgage-backed security and could result in losses to the Fund. The risk of such defaults is generally higher in the case of mortgage pools that include sub-prime mortgages. Sub-prime mortgages refer to loans made to borrowers with weakened credit histories or with a lower capacity to make timely payments on their mortgages. The securities held by the Fund are not backed by sub-prime mortgages.
Additionally, securities issued by FNMA and FHLMC are not backed by or entitled to the full faith and credit of the United States; rather, they are supported by the right of the issuer to borrow from the U.S. Department of the Treasury.
The Federal Housing Finance Agency ("FHFA") serves as conservator of FNMA and FHLMC and the U.S. Department of the Treasury has agreed to provide capital as needed to ensure FNMA and FHLMC continue to provide liquidity to the housing and mortgage markets.
The Fund may lend securities to qualified financial institutions, such as broker-dealers, to earn additional income. Risks in securities lending transactions are that a borrower may not provide additional collateral when required or return the securities when due, and that the value of the short-term investments will be less than the amount of cash collateral plus any rebate that is required to be returned to the borrower.
Foreign security and currency transactions may involve certain considerations and risks not typically associated with those of U.S. dollar denominated transactions as a result of, among other factors, fluctuations of exchange rates in relation to the U.S. dollar, the possibility of lower levels of governmental supervision and regulation of foreign securities markets and the possibility of political or economic instability.
14. Accounting Pronouncement
In March 2017, FASB issued an Accounting Standard Update, ASU 2017-08, Receivables-Nonrefundable Fees and Other Costs (Subtopic 310-20), Premium Amortization on Purchased Callable Debt Securities ("ASU 2017-08") which amends the amortization period for certain purchased callable debt securities held at a premium, shortening such period to the earliest call date. ASU 2017-08 does not require any accounting change for debt securities held at a discount; the discount continues to be accreted to maturity. ASU 2017-08 is effective for fiscal years, and interim periods within those fiscal years, beginning after December 15, 2018. At this time, management is evaluating the implications of these changes on the financial statements.
69
Morgan Stanley Global Fixed Income Opportunities Fund
Financial Highlights
Selected ratios and per share data for a share of beneficial interest outstanding throughout each period:
| | | FOR THE YEAR ENDED OCTOBER 31, | |
| | | 2019 | | 2018 | | 2017 | | 2016(1) | | 2015 | |
Class A Shares | |
Selected Per Share Data: | |
Net asset value, beginning of period | | $ | 5.54 | | | $ | 5.66 | | | $ | 5.49 | | | $ | 5.51 | | | $ | 5.77 | | |
Income (loss) from investment operations: | |
| Net investment income(2) | | | 0.20 | | | | 0.19 | | | | 0.20 | | | | 0.19 | | | | 0.18 | | |
Net realized and unrealized gain (loss) | | | 0.26 | | | | (0.13 | ) | | | 0.16 | | | | 0.01 | | | | (0.21 | ) | |
Total income (loss) from investment operations | | | 0.46 | | | | 0.06 | | | | 0.36 | | | | 0.20 | | | | (0.03 | ) | |
Less distributions from: | |
Net investment income | | | (0.27 | ) | | | (0.18 | ) | | | (0.14 | ) | | | (0.22 | ) | | | (0.23 | ) | |
Paid-in-capital | | | — | | | | — | | | | (0.05 | ) | | | — | | | | — | | |
Total distributions | | | (0.27 | ) | | | (0.18 | ) | | | (0.19 | ) | | | (0.22 | ) | | | (0.23 | ) | |
Net asset value, end of period | | $ | 5.73 | | | $ | 5.54 | | | $ | 5.66 | | | $ | 5.49 | | | $ | 5.51 | | |
| Total Return(3) | | | 8.55 | % | | | 1.05 | % | | | 6.66 | % | | | 3.72 | % | | | (0.53 | )% | |
Ratios to Average Net Assets: | |
Net expenses | | | 0.86 | %(4) | | | 0.89 | %(4)(5) | | | 0.90 | %(4) | | | 0.88 | %(4)(6) | | | 1.04 | %(4) | |
Net investment income | | | 3.62 | %(4) | | | 3.45 | %(4)(5) | | | 3.66 | %(4) | | | 3.46 | %(4)(6) | | | 3.16 | %(4) | |
Rebate from Morgan Stanley affiliate | | | 0.01 | % | | | 0.01 | % | | | 0.01 | % | | | 0.01 | % | | | 0.00 | %(7) | |
Supplemental Data: | |
Net assets, end of period, in thousands | | $ | 110,978 | | | $ | 81,598 | | | $ | 78,970 | | | $ | 87,515 | | | $ | 112,333 | | |
Portfolio turnover rate | | | 94 | % | | | 89 | % | | | 84 | % | | | 120 | % | | | 102 | % | |
(1) Reflects prior period custodian out-of-pocket expenses that were reimbursed in September 2016. The amount of the reimbursement was immaterial on a per share basis and did not impact the total return of Class A shares.
(2) The per share amounts were computed using an average number of shares outstanding during the period.
(3) Does not reflect the deduction of sales charge. Calculated based on the net asset value as of the last business day of the period.
(4) The ratios reflect the rebate of certain Fund expenses in connection with investments in a Morgan Stanley affiliate during the period. The effect of the rebate on the ratios is disclosed in the above table as "Rebate from Morgan Stanley affiliate."
(5) If the Fund had borne all of its expenses that were waived by the Adviser/Administrator, the annualized expense and net investment income ratios would have been as follows:
| PERIOD ENDED | | EXPENSE
RATIO | | NET INVESTMENT
INCOME RATIO | |
October 31, 2018 | | | 0.93 | % | | | 3.41 | % | |
(6) If the Fund had not received the reimbursement from the custodian, the annualized expense and net investment income ratios would have been as follows:
| PERIOD ENDED | | EXPENSE
RATIO | | NET INVESTMENT
INCOME RATIO | |
October 31, 2016 | | | 0.90 | % | | | 3.44 | % | |
(7) Amount is less than 0.005%.
See Notes to Financial Statements
70
Morgan Stanley Global Fixed Income Opportunities Fund
Financial Highlights continued
| | | FOR THE YEAR ENDED OCTOBER 31, | |
| | | 2019 | | 2018 | | 2017 | | 2016(1) | | 2015 | |
Class L Shares | |
Selected Per Share Data: | |
Net asset value, beginning of period | | $ | 5.54 | | | $ | 5.66 | | | $ | 5.49 | | | $ | 5.51 | | | $ | 5.77 | | |
Income (loss) from investment operations: | |
| Net investment income(2) | | | 0.19 | | | | 0.18 | | | | 0.19 | | | | 0.17 | | | | 0.17 | | |
Net realized and unrealized gain (loss) | | | 0.25 | | | | (0.13 | ) | | | 0.16 | | | | 0.01 | | | | (0.21 | ) | |
Total income (loss) from investment operations | | | 0.44 | | | | 0.05 | | | | 0.35 | | | | 0.18 | | | | (0.04 | ) | |
Less distributions from: | |
Net investment income | | | (0.25 | ) | | | (0.17 | ) | | | (0.13 | ) | | | (0.20 | ) | | | (0.22 | ) | |
Paid-in-capital | | | — | | | | — | | | | (0.05 | ) | | | — | | | | — | | |
Total distributions | | | (0.25 | ) | | | (0.17 | ) | | | (0.18 | ) | | | (0.20 | ) | | | (0.22 | ) | |
Net asset value, end of period | | $ | 5.73 | | | $ | 5.54 | | | $ | 5.66 | | | $ | 5.49 | | | $ | 5.51 | | |
| Total Return(3) | | | 8.25 | % | | | 0.81 | % | | | 6.41 | % | | | 3.48 | % | | | (0.73 | )% | |
Ratios to Average Net Assets: | |
Net expenses | | | 1.14 | %(4) | | | 1.13 | %(4)(5) | | | 1.13 | %(4) | | | 1.11 | %(4)(6) | | | 1.25 | %(4) | |
Net investment income | | | 3.38 | %(4) | | | 3.22 | %(4)(5) | | | 3.42 | %(4) | | | 3.23 | %(4)(6) | | | 2.94 | %(4) | |
Rebate from Morgan Stanley affiliate | | | 0.01 | % | | | 0.01 | % | | | 0.01 | % | | | 0.01 | % | | | 0.01 | % | |
Supplemental Data: | |
Net assets, end of period, in thousands | | $ | 5,557 | | | $ | 6,399 | | | $ | 8,263 | | | $ | 9,909 | | | $ | 12,834 | | |
Portfolio turnover rate | | | 94 | % | | | 89 | % | | | 84 | % | | | 120 | % | | | 102 | % | |
(1) Reflects prior period custodian out-of-pocket expenses that were reimbursed in September 2016. The amount of the reimbursement was immaterial on a per share basis and did not impact the total return of the Class L shares.
(2) The per share amounts were computed using an average number of shares outstanding during the period.
(3) Calculated based on the net asset value as of the last business day of the period.
(4) The ratios reflect the rebate of certain Fund expenses in connection with investments in a Morgan Stanley affiliate during the period. The effect of the rebate on the ratios is disclosed in the above table as "Rebate from Morgan Stanley affiliate."
(5) If the Fund had borne all of its expenses that were waived by the Adviser/Administrator, the annualized expense and net investment income ratios would have been as follows:
| PERIOD ENDED | | EXPENSE
RATIO | | NET INVESTMENT
INCOME RATIO | |
October 31, 2018 | | | 1.16 | % | | | 3.19 | % | |
(6) If the Fund had not received the reimbursement from the custodian, the annualized expense and net investment income ratios would have been as follows:
| PERIOD ENDED | | EXPENSE
RATIO | | NET INVESTMENT
INCOME RATIO | |
October 31, 2016 | | | 1.13 | % | | | 3.21 | % | |
See Notes to Financial Statements
71
Morgan Stanley Global Fixed Income Opportunities Fund
Financial Highlights continued
| | | FOR THE YEAR ENDED OCTOBER 31, | |
| | | 2019 | | 2018 | | 2017 | | 2016(1) | | 2015 | |
Class I Shares | |
Selected Per Share Data: | |
Net asset value, beginning of period | | $ | 5.60 | | | $ | 5.72 | | | $ | 5.55 | | | $ | 5.57 | | | $ | 5.82 | | |
Income (loss) from investment operations: | |
| Net investment income(2) | | | 0.22 | | | | 0.21 | | | | 0.22 | | | | 0.21 | | | | 0.18 | | |
Net realized and unrealized gain (loss) | | | 0.26 | | | | (0.13 | ) | | | 0.16 | | | | 0.00 | (3) | | | (0.18 | ) | |
Total income (loss) from investment operations | | | 0.48 | | | | 0.08 | | | | 0.38 | | | | 0.21 | | | | (0.00 | )(3) | |
Less distributions from: | |
Net investment income | | | (0.28 | ) | | | (0.20 | ) | | | (0.16 | ) | | | (0.23 | ) | | | (0.25 | ) | |
Paid-in-capital | | | — | | | | — | | | | (0.05 | ) | | | — | | | | — | | |
Total distributions | | | (0.28 | ) | | | (0.20 | ) | | | (0.21 | ) | | | (0.23 | ) | | | (0.25 | ) | |
Net asset value, end of period | | $ | 5.80 | | | $ | 5.60 | | | $ | 5.72 | | | $ | 5.55 | | | $ | 5.57 | | |
| Total Return(4) | | | 8.93 | % | | | 1.34 | % | | | 6.93 | % | | | 4.00 | % | | | (0.17 | )% | |
Ratios to Average Net Assets: | |
Net expenses | | | 0.59 | %(5) | | | 0.59 | %(5)(6) | | | 0.57 | %(5) | | | 0.57 | %(5)(7) | | | 0.69 | %(5) | |
Net investment income | | | 3.88 | %(5) | | | 3.74 | %(5)(6) | | | 3.99 | %(5) | | | 3.77 | %(5)(7) | | | 3.18 | %(5) | |
Rebate from Morgan Stanley affiliate | | | 0.01 | % | | | 0.01 | % | | | 0.01 | % | | | 0.01 | % | | | 0.01 | % | |
Supplemental Data: | |
Net assets, end of period, in thousands | | $ | 425,720 | | | $ | 292,269 | | | $ | 216,306 | | | $ | 173,507 | | | $ | 134,841 | | |
Portfolio turnover rate | | | 94 | % | | | 89 | % | | | 84 | % | | | 120 | % | | | 102 | % | |
(1) Reflects prior period custodian out-of-pocket expenses that were reimbursed in September 2016. The amount of the reimbursement was immaterial on a per share basis and did not impact the total return of the Class I shares.
(2) The per share amounts were computed using an average number of shares outstanding during the period.
(3) Amount is less than $0.005 per share.
(4) Calculated based on the net asset value as of the last business day of the period.
(5) The ratios reflect the rebate of certain Fund expenses in connection with investments in a Morgan Stanley affiliate during the period. The effect of the rebate on the ratios is disclosed in the above table as "Rebate from Morgan Stanley affiliate."
(6) If the Fund had borne all of its expenses that were waived by the Adviser/Administrator, the annualized expense and net investment income ratios would have been as follows:
| PERIOD ENDED | | EXPENSE
RATIO | | NET INVESTMENT
INCOME RATIO | |
October 31, 2018 | | | 0.65 | % | | | 3.68 | % | |
(7) If the Fund had not received the reimbursement from the custodian, the annualized expense and net investment income ratios would have been as follows:
| PERIOD ENDED | | EXPENSE
RATIO | | NET INVESTMENT
INCOME RATIO | |
October 31, 2016 | | | 0.60 | % | | | 3.74 | % | |
See Notes to Financial Statements
72
Morgan Stanley Global Fixed Income Opportunities Fund
Financial Highlights continued
| | | FOR THE YEAR ENDED OCTOBER 31, | | PERIOD FROM
APRIL 30, 2015(2)
TO | |
| | 2019 | | 2018 | | 2017 | | 2016(1) | | OCTOBER 31, 2015 | |
Class C Shares | |
Selected Per Share Data: | |
Net asset value, beginning of period | | $ | 5.53 | | | $ | 5.65 | | | $ | 5.49 | | | $ | 5.51 | | | $ | 5.73 | | |
Income (loss) from investment operations: | |
| Net investment income(3) | | | 0.16 | | | | 0.15 | | | | 0.16 | | | | 0.15 | | | | 0.03 | | |
Net realized and unrealized gain (loss) | | | 0.26 | | | | (0.13 | ) | | | 0.15 | | | | 0.01 | | | | (0.17 | ) | |
Total income (loss) from investment operations | | | 0.42 | | | | 0.02 | | | | 0.31 | | | | 0.16 | | | | (0.14 | ) | |
Less distributions from: | |
Net investment income | | | (0.23 | ) | | | (0.14 | ) | | | (0.10 | ) | | | (0.18 | ) | | | (0.08 | ) | |
Paid-in-capital | | | — | | | | — | | | | (0.05 | ) | | | — | | | | — | | |
Total distributions | | | (0.23 | ) | | | (0.14 | ) | | | (0.15 | ) | | | (0.18 | ) | | | (0.08 | ) | |
Net asset value, end of period | | $ | 5.72 | | | $ | 5.53 | | | $ | 5.65 | | | $ | 5.49 | | | $ | 5.51 | | |
| Total Return(4) | | | 7.77 | % | | | 0.34 | % | | | 5.76 | % | | | 3.03 | % | | | (2.48 | )%(9) | |
Ratios to Average Net Assets: | |
Net expenses | | | 1.59 | %(5) | | | 1.61 | %(5)(6) | | | 1.58 | %(5) | | | 1.58 | %(5)(7) | | | 1.74%(5)(10) | | |
Net investment income | | | 2.91 | %(5) | | | 2.73 | %(5)(6) | | | 2.98 | %(5) | | | 2.76 | %(5)(7) | | | 1.22%(5)(10) | | |
Rebate from Morgan Stanley affiliate | | | 0.01 | % | | | 0.01 | % | | | 0.01 | % | | | 0.01 | % | | | 0.00%(8)(10) | | |
Supplemental Data: | |
Net assets, end of period, in thousands | | $ | 29,890 | | | $ | 26,741 | | | $ | 23,255 | | | $ | 21,673 | | | $ | 10,269 | | |
Portfolio turnover rate | | | 94 | % | | | 89 | % | | | 84 | % | | | 120 | % | | | 102 | % | |
(1) Reflects prior period custodian out-of-pocket expenses that were reimbursed in September 2016. The amount of the reimbursement was immaterial on a per share basis and did not impact the total return of the Class C shares.
(2) Commencement of Offering.
(3) The per share amounts were computed using an average number of shares outstanding during the period.
(4) Does not reflect the deduction of sales charge. Calculated based on the net asset value as of the last business day of the period.
(5) The ratios reflect the rebate of certain Fund expenses in connection with investments in a Morgan Stanley affiliate during the period. The effect of the rebate on the ratios is disclosed in the above table as "Rebate from Morgan Stanley affiliate."
(6) If the Fund had borne all of its expenses that were waived by the Adviser/Administrator, the annualized expense and net investment income ratios would have been as follows:
| PERIOD ENDED | | EXPENSE
RATIO | | NET INVESTMENT
INCOME RATIO | |
October 31, 2018 | | | 1.65 | % | | | 2.69 | % | |
(7) If the Fund had not received the reimbursement from the custodian, the annualized expense and net investment income ratios would have been as follows:
| PERIOD ENDED | | EXPENSE
RATIO | | NET INVESTMENT
INCOME RATIO | |
October 31, 2016 | | | 1.61 | % | | | 2.73 | % | |
(8) Amount is less than 0.005%.
(9) Not annualized.
(10) Annualized.
See Notes to Financial Statements
73
Morgan Stanley Global Fixed Income Opportunities Fund
Financial Highlights continued
| | | FOR THE YEAR ENDED OCTOBER 31, | |
| | | 2019 | | 2018 | | 2017 | | 2016(1) | | 2015 | |
Class IS Shares | |
Selected Per Share Data: | |
Net asset value, beginning of period | | $ | 5.61 | | | $ | 5.72 | | | $ | 5.55 | | | $ | 5.57 | | | $ | 5.83 | | |
Income (loss) from investment operations: | |
| Net investment income(2) | | | 0.23 | | | | 0.22 | | | | 0.23 | | | | 0.21 | | | | 0.21 | | |
Net realized and unrealized gain (loss) | | | 0.25 | | | | (0.13 | ) | | | 0.15 | | | | 0.01 | | | | (0.22 | ) | |
Total income (loss) from investment operations | | | 0.48 | | | | 0.09 | | | | 0.38 | | | | 0.22 | | | | (0.01 | ) | |
Less distributions from: | |
Net investment income | | | (0.29 | ) | | | (0.20 | ) | | | (0.16 | ) | | | (0.24 | ) | | | (0.25 | ) | |
Paid-in-capital | | | — | | | | — | | | | (0.05 | ) | | | — | | | | — | | |
Total distributions | | | (0.29 | ) | | | (0.20 | ) | | | (0.21 | ) | | | (0.24 | ) | | | (0.25 | ) | |
Net asset value, end of period | | $ | 5.80 | | | $ | 5.61 | | | $ | 5.72 | | | $ | 5.55 | | | $ | 5.57 | | |
| Total Return(3) | | | 9.01 | % | | | 1.40 | % | | | 6.99 | % | | | 4.07 | % | | | (0.13 | )% | |
Ratios to Average Net Assets: | |
Net expenses | | | 0.51 | %(4) | | | 0.53 | %(4)(5) | | | 0.51 | %(4) | | | 0.49 | %(4)(6) | | | 0.64 | %(4) | |
Net investment income | | | 3.97 | %(4) | | | 3.82 | %(4)(5) | | | 4.05 | %(4) | | | 3.85 | %(4)(6) | | | 3.60 | %(4) | |
Rebate from Morgan Stanley affiliate | | | 0.01 | % | | | 0.01 | % | | | 0.01 | % | | | 0.01 | % | | | 0.00 | %(7) | |
Supplemental Data: | |
Net assets, end of period, in thousands | | $ | 208,058 | | | $ | 152,197 | | | $ | 210,777 | | | $ | 195,039 | | | $ | 63,680 | | |
Portfolio turnover rate | | | 94 | % | | | 89 | % | | | 84 | % | | | 120 | % | | | 102 | % | |
(1) Reflects prior period custodian out-of-pocket expenses that were reimbursed in September 2016. The amount of the reimbursement was immaterial on a per share basis and did not impact the total return of the Class IS shares.
(2) The per share amounts were computed using an average number of shares outstanding during the period.
(3) Calculated based on the net asset value as of the last business day of the period.
(4) The ratios reflect the rebate of certain Fund expenses in connection with investments in a Morgan Stanley affiliate during the period. The effect of the rebate on the ratios is disclosed in the above table as "Rebate from Morgan Stanley affiliate."
(5) If the Fund had borne all of its expenses that were waived by the Adviser/Administrator, the annualized expense and net investment income ratios would have been as follows:
| PERIOD ENDED | | EXPENSE
RATIO | | NET INVESTMENT
INCOME RATIO | |
October 31, 2018 | | | 0.56 | % | | | 3.79 | % | |
(6) If the Fund had not received the reimbursement from the custodian, the annualized expense and net investment income ratios would have been as follows:
| PERIOD ENDED | | EXPENSE
RATIO | | NET INVESTMENT
INCOME RATIO | |
October 31, 2016 | | | 0.53 | % | | | 3.81 | % | |
(7) Amount is less than 0.005%.
See Notes to Financial Statements
74
Morgan Stanley Global Fixed Income Opportunities Fund
Financial Highlights continued
| | | FOR THE YEAR
ENDED
OCTOBER 31, 2019 | | PERIOD FROM
JUNE 15, 2018(1)
TO
OCTOBER 31, 2018 | |
Class IR Shares | |
Selected Per Share Data: | |
Net asset value, beginning of period | | $ | 5.61 | | | $ | 5.68 | | |
Income (loss) from investment operations: | |
| Net investment income(2) | | | 0.22 | | | | 0.05 | | |
Net realized and unrealized gain (loss) | | | 0.27 | | | | (0.03 | ) | |
Total income from investment operations | | | 0.49 | | | | 0.02 | | |
Less distributions from: | |
Net investment income | | | (0.29 | ) | | | (0.09 | ) | |
Net asset value, end of period | | $ | 5.81 | | | $ | 5.61 | | |
| Total Return(3) | | | 9.00 | % | | | 0.31 | %(6) | |
Ratios to Average Net Assets: | |
Net expenses | | | 0.51 | %(4)(5) | | | 0.53 | %(4)(5)(7) | |
| Net investment income | | | 3.89 | %(4)(5) | | | 3.75 | %(4)(5)(7) | |
Rebate from Morgan Stanley affiliate | | | 0.01 | % | | | 0.01 | %(7) | |
Supplemental Data: | |
Net assets, end of period, in thousands | | $ | 10 | | | $ | 10 | | |
Portfolio turnover rate | | | 94 | % | | | 89 | % | |
(1) Commencement of Offering.
(2) The per share amounts were computed using an average number of shares outstanding during the period.
(3) Calculated based on the net asset value as of the last business day of the period.
(4) The ratios reflect the rebate of certain Fund expenses in connection with investments in a Morgan Stanley affiliate during the period. The effect of the rebate on the ratios is disclosed in the above table as "Rebate from Morgan Stanley affiliate."
(5) If the Fund had borne all of its expenses that were waived by the Adviser/Administrator, the annualized expense and net investment loss ratios would have been as follows:
| PERIOD ENDED | | EXPENSE
RATIO | | NET INVESTMENT
LOSS RATIO | |
October 31, 2019 | | | 21.28 | % | | | (16.88 | )% | |
October 31, 2018 | | | 13.16 | | | | (8.88 | ) | |
(6) Not annualized.
(7) Annualized.
See Notes to Financial Statements
75
Morgan Stanley Global Fixed Income Opportunities Fund
Report of Independent Registered Public Accounting Firm
To the Shareholders and Board of Trustees of
Morgan Stanley Global Fixed Income Opportunities Fund
Opinion on the Financial Statements
We have audited the accompanying statement of assets and liabilities of Morgan Stanley Global Fixed Income Opportunities Fund (the "Fund"), including the portfolio of investments, as of October 31, 2019, and the related statement of operations for the year then ended, the statements of changes in net assets for each of the two years in the period then ended, the financial highlights for each of the five years in the period then ended and the related notes (collectively referred to as the "financial statements"). In our opinion, the financial statements present fairly, in all material respects, the financial position of the Fund at October 31, 2019, the results of its operations for the year then ended, the changes in its net assets for each of the two years in the period then ended and its financial highlights for each of the five years in the period then ended, in conformity with U.S. generally accepted accounting principles.
Basis for Opinion
These financial statements are the responsibility of the Fund's management. Our responsibility is to express an opinion on the Fund's financial statements based on our audits. We are a public accounting firm registered with the Public Company Accounting Oversight Board (United States) ("PCAOB") and are required to be independent with respect to the Fund in accordance with the U.S. federal securities law and the applicable rules and regulations of the Securities and Exchange Commission and the PCAOB.
We conducted our audits in accordance with the standards of the PCAOB. Those standards require that we plan and perform the audit to obtain reasonable assurance about whether the financial statements are free of material misstatement, whether due to error or fraud. The Fund is not required to have, nor were we engaged to perform, an audit of the Fund's internal control over financial reporting. As part of our audits we are required to obtain an understanding of internal control over financial reporting but not for the purpose of expressing an opinion on the effectiveness of the Fund's internal control over financial reporting. Accordingly, we express no such opinion.
Our audits included performing procedures to assess the risks of material misstatement of the financial statements, whether due to error or fraud, and performing procedures that respond to those risks. Such procedures included examining, on a test basis, evidence regarding the amounts and disclosures in the financial statements. Our procedures included confirmation of securities owned as of October 31, 2019 by correspondence with the custodian and others or by other appropriate auditing procedures where replies from others were not received. Our audits also included evaluating the accounting principles used and significant estimates made by management, as well as evaluating the overall presentation of the financial statements. We believe that our audits provide a reasonable basis for our opinion.

We have served as the auditor of one or more Morgan Stanley investment companies since 2000.
Boston, Massachusetts
December 23, 2019
76
Morgan Stanley Global Fixed Income Opportunities Fund
Investment Advisory Agreement Approval (unaudited)
Nature, Extent and Quality of Services
The Board reviewed and considered the nature and extent of the investment advisory services provided by the Adviser under the advisory agreement, including portfolio management, investment research and equity and fixed income securities trading. The Board reviewed similar information and factors regarding the Sub-Adviser, to the extent applicable. The Board also reviewed and considered the nature and extent of the non-advisory, administrative services provided by the Administrator under the administration agreement, including accounting, operations, clerical, bookkeeping, compliance, business management and planning, legal services and the provision of supplies, office space and utilities at the Adviser's expense. The Board also considered the Adviser's investment in personnel and infrastructure that benefits the Fund. (The Adviser, Sub-Adviser and Administrator together are referred to as the "Adviser" and the advisory, sub-advisory and administration agreements together are referred to as the "Management Agreement.") The Board also considered that the Adviser serves a variety of other investment advisory clients and has experience overseeing service providers. The Board also compared the nature of the services provided by the Adviser with similar services provided by non-affiliated advisers as prepared by Broadridge Financial Solutions, Inc. ("Broadridge").
The Board reviewed and considered the qualifications of the portfolio managers, the senior administrative managers and other key personnel of the Adviser who provide the advisory and administrative services to the Fund. The Board determined that the Adviser's portfolio managers and key personnel are well qualified by education and/or training and experience to perform the services in an efficient and professional manner. The Board concluded that the nature and extent of the advisory and administrative services provided were necessary and appropriate for the conduct of the business and investment activities of the Fund and supported its decision to approve the Management Agreement.
Performance, Fees and Expenses of the Fund
The Board reviewed the performance, fees and expenses of the Fund compared to its peers, as prepared by Broadridge, and to appropriate benchmarks where applicable. The Board discussed with the Adviser the performance goals and the actual results achieved in managing the Fund. When considering a fund's performance, the Board and the Adviser place emphasis on trends and longer-term returns (focusing on one-year, three-year and five-year performance, as of December 31, 2018, or since inception, as applicable). When a fund underperforms its benchmark and/or its peer group average, the Board and the Adviser discuss the causes of such underperformance and, where necessary, they discuss specific changes to investment strategy or investment personnel. The Board noted that the Fund's performance was better than its peer group average for the one-, three- and five-year periods. The Board discussed with the Adviser the level of the advisory and administration fees (together, the "management fee") for this Fund relative to comparable funds and/or other accounts advised by the Adviser and/or compared to its peers as prepared by Broadridge. In addition to the management fee, the Board also reviewed the Fund's total expense ratio. The Board noted that the Fund's management fee
77
Morgan Stanley Global Fixed Income Opportunities Fund
Investment Advisory Agreement Approval (unaudited) continued
and total expense ratio were lower than its peer group averages. After discussion, the Board concluded that the Fund's performance, management fee and total expense ratio were competitive with its peer group averages.
Economies of Scale
The Board considered the size and growth prospects of the Fund and how that relates to the Fund's total expense ratio and particularly the Fund's management fee rate, which does not include breakpoints. In conjunction with its review of the Adviser's profitability, the Board discussed with the Adviser how a change in assets can affect the efficiency or effectiveness of managing the Fund and whether the management fee level is appropriate relative to current and projected asset levels and/or whether the management fee structure reflects economies of scale as asset levels change. The Board has determined that its review of the actual and/or potential economies of scale of the Fund supports its decision to approve the Management Agreement.
Profitability of the Adviser and Affiliates
The Board considered information concerning the costs incurred and profits realized by the Adviser and its affiliates during the last year from their relationship with the Fund and during the last two years from their relationship with the Morgan Stanley Fund Complex and reviewed with the Adviser the cost allocation methodology used to determine the profitability of the Adviser and affiliates. The Board has determined that its review of the analysis of the Adviser's expenses and profitability supports its decision to approve the Management Agreement.
Other Benefits of the Relationship
The Board considered other direct and indirect benefits to the Adviser and/or its affiliates derived from their relationship with the Fund and other funds advised by the Adviser. These benefits may include, among other things, fees for trading, distribution and/or shareholder servicing and for transaction processing and reporting platforms used by securities lending agents, and research received by the Adviser generated from commission dollars spent on funds' portfolio trading. The Board reviewed with the Adviser these arrangements and the reasonableness of the Adviser's costs relative to the services performed. The Board has determined that its review of the other benefits received by the Adviser or its affiliates supports its decision to approve the Management Agreement.
Resources of the Adviser and Historical Relationship Between the Fund and the Adviser
The Board considered whether the Adviser is financially sound and has the resources necessary to perform its obligations under the Management Agreement. The Board also reviewed and considered the historical relationship between the Fund and the Adviser, including the organizational structure of the Adviser, the policies and procedures formulated and adopted by the Adviser for managing the Fund's
78
Morgan Stanley Global Fixed Income Opportunities Fund
Investment Advisory Agreement Approval (unaudited) continued
operations and the Board's confidence in the competence and integrity of the senior managers and key personnel of the Adviser. The Board concluded that the Adviser has the financial resources necessary to fulfill its obligations under the Management Agreement and that it is beneficial for the Fund to continue its relationship with the Adviser.
Other Factors and Current Trends
The Board considered the controls and procedures adopted and implemented by the Adviser and monitored by the Fund's Chief Compliance Officer and concluded that the conduct of business by the Adviser indicates a good faith effort on its part to adhere to high ethical standards in the conduct of the Fund's business.
General Conclusion
After considering and weighing all of the above factors, with various written materials and verbal information presented by the Adviser, the Board concluded that it would be in the best interest of the Fund and its shareholders to approve renewal of the Management Agreement for another year. In reaching this conclusion the Board did not give particular weight to any single piece of information or factor referenced above. The Board considered these factors and information over the course of the year and in numerous meetings, some of which were in executive session with only the independent Board members and their counsel present. It is possible that individual Board members may have weighed these factors, and the information presented, differently in reaching their individual decisions to approve the Management Agreement.
79
Morgan Stanley Global Fixed Income Opportunities Fund
Privacy Notice (unaudited) April 2019
FACTS | | WHAT DOES MSIM DO WITH YOUR PERSONAL INFORMATION? | |
Why? | | Financial companies choose how they share your personal information. Federal law gives consumers the right to limit some but not all sharing. Federal law also requires us to tell you how we collect, share, and protect your personal information. Please read this notice carefully to understand what we do. | |
What? | | The types of personal information we collect and share depend on the product or service you have with us. This information can include:
n Social Security number and income
n investment experience and risk tolerance
n checking account number and wire transfer instructions | |
How? | | All financial companies need to share customers' personal information to run their everyday business. In the section below, we list the reasons financial companies can share their customers' personal information; the reasons MSIM chooses to share; and whether you can limit this sharing. | |
Reasons we can share your personal information | | Does MSIM share? | | Can you limit this sharing? | |
For our everyday business purposes —
such as to process your transactions, maintain your account(s), respond to court orders and legal investigations, or report to credit bureaus | | Yes | | No | |
For our marketing purposes —
to offer our products and services to you | | Yes | | No | |
For joint marketing with other financial companies | | No | | We don't share | |
For our affiliates' everyday business purposes —
information about your transactions and experiences | | Yes | | No | |
For our affiliates' everyday business purposes —
information about your creditworthiness | | No | | We don't share | |
For our affiliates to market to you | | No | | We don't share | |
For non-affiliates to market to you | | No | | We don't share | |
Questions? Call toll-free (844) 312-6327 or email: imprivacyinquiries@morganstanley.com
80
Morgan Stanley Global Fixed Income Opportunities Fund
Privacy Notice (unaudited) continued April 2019
Who we are
Who is providing this notice? | | Morgan Stanley Investment Management, Inc. and its affiliated registered investment advisers, registered broker-dealers, and registered and unregistered funds ("MSIM") | |
What we do
How does MSIM protect my personal information? | | To protect your personal information from unauthorized access and use, we use security measures that comply with federal law. These measures include computer safeguards and secured files and buildings. We have policies governing the proper handling of customer information by personnel and requiring third parties that provide support to adhere to appropriate security standards with respect to such information. | |
How does MSIM collect my personal information? | | We collect your personal information, for example, when you
n open an account or make deposits or withdrawals from your account
n buy securities from us or make a wire transfer
n give us your contact information
We also collect your personal information from others, such as credit bureaus, affiliates, or other companies. | |
Why can't I limit all sharing? | | Federal law gives you the right to limit only
n sharing for affiliates' everyday business purposes — information about your creditworthiness
n affiliates from using your information to market to you
n sharing for non-affiliates to market to you
State laws and individual companies may give you additional rights to limit sharing. See below for more on your rights under state law. | |
81
Morgan Stanley Global Fixed Income Opportunities Fund
Privacy Notice (unaudited) continued April 2019
Definitions
Affiliates | | Companies related by common ownership or control. They can be financial and non-financial companies.
n Our affiliates include companies with a Morgan Stanley name and financial companies such as Morgan Stanley Smith Barney LLC and Morgan Stanley & Co. | |
Non-affiliates | | Companies not related by common ownership or control. They can be financial and non-financial companies.
n MSIM does not share with non-affiliates so they can market to you. | |
Joint marketing | | A formal agreement between non-affiliated financial companies that together market financial products or services to you.
n MSIM doesn't jointly market | |
Other important information
Vermont: Except as permitted by law, we will not share personal information we collect about Vermont residents with Non-affiliates unless you provide us with your written consent to share such information.
California: Except as permitted by law, we will not share personal information we collect about California residents with Non-affiliates and we will limit sharing such personal information with our Affiliates to comply with California privacy laws that apply to us.
82
Morgan Stanley Global Fixed Income Opportunities Fund
Trustee and Officer Information (unaudited)
Name, Age and Address of
Independent Trustee | | Position(s)
Held with
Registrant | | Length of
Time Served* | | Principal Occupation(s)
During Past 5 Years
and Other Relevant
Professional Experience | | Number of
Portfolios
in Fund
Complex
Overseen by
Independent
Trustee** | | Other Directorships
Held by Independent Trustee*** | |
Frank L. Bowman
c/o Perkins Coie LLP
Counsel to the Independent Trustees
1155 Avenue of the Americas
New York, NY 10036
Birth Year 1944 | | Trustee | | Since August 2006 | | President, Strategic Decisions, LLC (consulting) (since February 2009); Director or Trustee of various Morgan Stanley Funds (since August 2006); Chairperson of the Compliance and Insurance Committee (since October 2015); formerly, Chairperson of the Insurance Sub-Committee of the Compliance and Insurance Committee (2007-2015); served as President and Chief Executive Officer of the Nuclear Energy Institute (policy organization) (February 2005-November 2008); retired as Admiral, U.S. Navy after serving over 38 years on active duty including 8 years as Director of the Naval Nuclear Propulsion Program in the Department of the Navy and the U.S. Department of Energy (1996-2004); served as Chief of Naval Personnel (July 1994-September 1996) and on the Joint Staff as Director of Political Military Affairs (June 1992-July 1994); knighted as Honorary Knight Commander of the Most Excellent Order of the British Empire; awarded the Officier de l'Orde National du Mérite by the French Government; elected to the National Academy of Engineering (2009). | | | 82 | | | Director of Naval and Nuclear Technologies LLP; Director Emeritus of the Armed Services YMCA; Member of the National Security Advisory Council of the Center for U.S. Global Engagement and a member of the CNA Military Advisory Board; Trustee of Fairhaven United Methodist Church; Member of the Board of Advisors of the Dolphin Scholarship Foundation; Director of other various non-profit organizations; formerly, Director of BP p.l.c. (November 2010-May 2019). | |
Kathleen A. Dennis
c/o Perkins Coie LLP
Counsel to the Independent Trustees
1155 Avenue of the Americas
New York, NY 10036
Birth Year 1953 | | Trustee | | Since August 2006 | | President, Cedarwood Associates (mutual fund and investment management consulting) (since July 2006); Chairperson of the Liquidity and Alternatives Sub-Committee of the Investment Committee (since October 2006) and Director or Trustee of various Morgan Stanley Funds (since August 2006); formerly, Senior Managing Director of Victory Capital Management (1993-2006). | | | 82 | | | Director of various non-profit organizations. | |
83
Morgan Stanley Global Fixed Income Opportunities Fund
Trustee and Officer Information (unaudited) continued
Name, Age and Address of
Independent Trustee | | Position(s)
Held with
Registrant | | Length of
Time Served* | | Principal Occupation(s)
During Past 5 Years
and Other Relevant
Professional Experience | | Number of
Portfolios
in Fund
Complex
Overseen by
Independent
Trustee** | | Other Directorships
Held by Independent Trustee*** | |
Nancy C. Everett
c/o Perkins Coie LLP
Counsel to the Independent Trustees
1155 Avenue of the Americas
New York, NY 10036
Birth Year 1955 | | Trustee | | Since January 2015 | | Chief Executive Officer, Virginia Commonwealth University Investment Company (since November 2015); Owner OBIR, LLC (institutional investment management consulting) (since June 2014); formerly, Managing Director, BlackRock, Inc. (February 2011-December 2013); and Chief Executive Officer, General Motors Asset Management (a/k/a Promark Global Advisors, Inc.) (June 2005-May 2010). | | | 83 | | | Formerly, Member of Virginia Commonwealth University School of Business Foundation (2005-2016); Member of Virginia Commonwealth University Board of Visitors (2013-2015); Member of Committee on Directors for Emerging Markets Growth Fund, Inc. (2007-2010); Chairperson of Performance Equity Management, LLC (2006-2010); and Chairperson, GMAM Absolute Return Strategies Fund, LLC (2006-2010). | |
Jakki L. Haussler
c/o Perkins Coie LLP
Counsel to the Independent Trustees
1155 Avenue of the Americas
New York, NY 10036
Birth Year 1957 | | Trustee | | Since January 2015 | | Chairman and Chief Executive Officer, Opus Capital Group (since January 1996); formerly, Director, Capvest Venture Fund, LP (May 2000-December 2011); Partner, Adena Ventures, LP (July 1999-December 2010); Director, The Victory Funds (February 2005-July 2008). | | | 83 | | | Director of Service Corporation International and Member, Audit Committee and Investment Committee; Director of Cincinnati Bell Inc. and Member, Audit Committee and Governance and Nominating Committee; Chairman of Northern Kentucky University and Member, Investment Committee; Member of Chase College of Law Transactional Law Practice Center Board of Advisors; Director of Best Transport; Director of Chase College of Law Board of Visitors; formerly, Member, University of Cincinnati Foundation Investment Committee; Member, Miami University Board of Visitors (2008-2011); Trustee of Victory Funds (2005-2008) and Chairman, Investment Committee (2007-2008) and Member, Service Provider Committee (2005-2008). | |
84
Morgan Stanley Global Fixed Income Opportunities Fund
Trustee and Officer Information (unaudited) continued
Name, Age and Address of
Independent Trustee | | Position(s)
Held with
Registrant | | Length of
Time Served* | | Principal Occupation(s)
During Past 5 Years
and Other Relevant
Professional Experience | | Number of
Portfolios
in Fund
Complex
Overseen by
Independent
Trustee** | | Other Directorships
Held by Independent Trustee*** | |
Dr. Manuel H. Johnson
c/o Johnson Smick International, Inc.
220 I Street, NE — Suite 200
Washington, D.C. 20002
Birth Year 1949 | | Trustee | | Since
July 1991 | | Senior Partner, Johnson Smick International, Inc. (consulting firm); Chairperson of the Investment Committee (since October 2006) and Director or Trustee of various Morgan Stanley Funds (since July 1991); Co-Chairman and a founder of the Group of Seven Council (G7C) (international economic commission); formerly, Chairperson of the Audit Committee (July 1991-September 2006), Vice Chairman of the Board of Governors of the Federal Reserve System and Assistant Secretary of the U.S. Treasury. | | | 82 | | | Director of NVR, Inc. (home construction). | |
Joseph J. Kearns
c/o Perkins Coie LLP
Counsel to the Independent Trustees
1155 Avenue of the Americas
New York, NY 10036
Birth Year 1942 | | Trustee | | Since August 1994 | | Senior Adviser, Kearns & Associates LLC (investment consulting); Chairperson of the Audit Committee (since October 2006) and Director or Trustee of various Morgan Stanley Funds (since August 1994); formerly, Deputy Chairperson of the Audit Committee (July 2003-September 2006) and Chairperson of the Audit Committee of various Morgan Stanley Funds (since August 1994); CFO of the J. Paul Getty Trust. | | | 83 | | | Prior to August 10, 2016, Director of Electro Rent Corporation (equipment leasing); Prior to December 31, 2013, Director of The Ford Family Foundation. | |
85
Morgan Stanley Global Fixed Income Opportunities Fund
Trustee and Officer Information (unaudited) continued
Name, Age and Address of
Independent Trustee | | Position(s)
Held with
Registrant | | Length of
Time Served* | | Principal Occupation(s)
During Past 5 Years
and Other Relevant
Professional Experience | | Number of
Portfolios
in Fund
Complex
Overseen by
Independent
Trustee** | | Other Directorships
Held by Independent Trustee*** | |
Michael F. Klein
c/o Perkins Coie LLP
Counsel to the Independent Trustees
1155 Avenue of the Americas
New York, NY 10036
Birth Year 1958 | | Trustee | | Since August 2006 | | Managing Director, Aetos Alternatives Management, LP (since March 2000); Co-President, Aetos Alternatives Management, LP (since January 2004) and Co-Chief Executive Officer of Aetos Alternatives Management, LP (since August 2013); Chairperson of the Fixed Income Sub-Committee of the Investment Committee (since October 2006) and Director or Trustee of various Morgan Stanley Funds (since August 2006); formerly, Managing Director, Morgan Stanley & Co. Inc. and Morgan Stanley Dean Witter Investment Management and President, various Morgan Stanley Funds (June 1998-March 2000); Principal, Morgan Stanley & Co. Inc. and Morgan Stanley Dean Witter Investment Management (August 1997-December 1999). | | | 82 | | | Director of certain investment funds managed or sponsored by Aetos Alternatives Management, LP; Director of Sanitized AG and Sanitized Marketing AG (specialty chemicals). | |
Patricia Maleski
c/o Perkins Coie LLP
Counsel to the Independent Trustees
1155 Avenue of the Americas
New York, NY 10036
Birth Year 1960 | | Trustee | | Since January 2017 | | Managing Director, JPMorgan Asset Management (2004-2016); Oversight and Control Head of Fiduciary and Conflicts of Interest Program (2015-2016); Chief Control Officer-Global Asset Management (2013-2015); President, JPMorgan Funds (2010-2013); Chief Administrative Officer (2004-2013); various other positions including Treasurer and Board Liaison (since 2001). | | | 83 | | | None. | |
86
Morgan Stanley Global Fixed Income Opportunities Fund
Trustee and Officer Information (unaudited) continued
Name, Age and Address of
Independent Trustee | | Position(s)
Held with
Registrant | | Length of
Time Served* | | Principal Occupation(s)
During Past 5 Years
and Other Relevant
Professional Experience | | Number of
Portfolios
in Fund
Complex
Overseen by
Independent
Trustee** | | Other Directorships
Held by Independent Trustee*** | |
Michael E. Nugent
522 Fifth Avenue
New York, NY 10036
Birth Year 1936 | | Chair of the Board and Trustee | | Chair of the Boards since July 2006 and Trustee since July 1991 | | Chair of the Boards of various Morgan Stanley Funds (since July 2006); Chairperson of the Closed-End Fund Committee (since June 2012); Governance Committee (since January 2019) and Director or Trustee of various Morgan Stanley Funds (since July 1991); formerly, Chairperson of the Insurance Committee (until July 2006); General Partner, Triumph Capital, L.P. (private investment partnership) (1988-2013). | | | 82 | | | None. | |
W. Allen Reed
c/o Perkins Coie LLP
Counsel to the Independent Trustees
1155 Avenue of the Americas
New York, NY 10036
Birth Year 1947 | | Trustee | | Since August 2006 | | Chairperson of the Equity Sub-Committee of the Investment Committee (since October 2006) and Director or Trustee of various Morgan Stanley Funds (since August 2006); formerly, President and CEO of General Motors Asset Management; Chairman and Chief Executive Officer of the GM Trust Bank and Corporate Vice President of General Motors Corporation (August 1994-December 2005). | | | 82 | | | Formerly, Director of Legg Mason, Inc.; formerly, Director of the Auburn University Foundation (2010-2015). | |
* This is the earliest date the Trustee began serving the Morgan Stanley Funds. Each Trustee serves an indefinite term, until his or her successor is elected.
** The Fund Complex includes (as of December 31, 2018) all open-end and closed-end funds (including all of their portfolios) advised by Morgan Stanley Investment Management Inc. (the "Adviser") and any funds that have an adviser that is an affiliated person of the Adviser (including, but not limited to, Morgan Stanley AIP GP LP).
*** This includes any directorships at public companies and registered investment companies held by the Trustee at any time during the past five years.
87
Morgan Stanley Global Fixed Income Opportunities Fund
Trustee and Officer Information (unaudited) continued
Name, Age and Address of
Executive Officer | | Position(s)
Held with
Registrant | | Length of
Time Served* | | Principal Occupation(s) During Past 5 Years | |
John H. Gernon
522 Fifth Avenue
New York, NY 10036
Birth Year 1963 | | President and Principal Executive Officer | | Since September 2013 | | President and Principal Executive Officer of the Equity and Fixed Income Funds and the Morgan Stanley AIP Funds (since September 2013) and the Liquidity Funds and various money market funds (since May 2014) in the Fund Complex; Managing Director of the Adviser; Head of Product (since 2006). | |
Timothy J. Knierim
522 Fifth Avenue
New York, NY 10036
Birth Year 1959 | | Chief Compliance Officer | | Since December 2016 | | Managing Director of the Adviser and various entities affiliated with the Adviser; Chief Compliance Officer of various Morgan Stanley Funds and the Adviser (since December 2016) and Chief Compliance Officer of Morgan Stanley AIP GP LP (since 2014). Formerly, Managing Director and Deputy Chief Compliance Officer of the Adviser (2014-2016); and formerly, Chief Compliance Officer of Prudential Investment Management, Inc. (2007-2014). | |
Francis J. Smith
522 Fifth Avenue
New York, NY 10036
Birth Year 1965 | | Treasurer and Principal Financial Officer | | Treasurer since July 2003 and Principal Financial Officer since September 2002 | | Managing Director of the Adviser and various entities affiliated with the Adviser; Treasurer (since July 2003) and Principal Financial Officer of various Morgan Stanley Funds (since September 2002). | |
Mary E. Mullin
522 Fifth Avenue
New York, NY 10036
Birth Year 1967 | | Secretary | | Since June 1999 | | Managing Director of the Adviser; Secretary of various Morgan Stanley Funds (since June 1999). | |
Michael J. Key
522 Fifth Avenue
New York, NY 10036
Birth Year 1979 | | Vice President | | Since June 2017 | | Vice President of the Equity and Fixed Income Funds, Liquidity Funds, various money market funds and the Morgan Stanley AIP Funds in the Fund Complex (since June 2017); Executive Director of the Adviser; Head of Product Development for Equity and Fixed Income Funds (since August 2013). | |
* This is the earliest date the officer began serving the Morgan Stanley Funds. Each officer serves a one-year term, until his or her successor is elected and qualifies.
88
Transfer Agent
DST Asset Manager Solutions, Inc.
2000 Crown Colony Drive
Quincy, Massachusetts 02169
Custodian
State Street Bank and Trust Company
One Lincoln Street
Boston, Massachusetts 02111
Independent Registered Public Accounting Firm
Ernst & Young LLP
200 Clarendon Street
Boston, Massachusetts 02116
Legal Counsel
Dechert LLP
1095 Avenue of the Americas
New York, New York 10036
Counsel to the Independent Trustees
Perkins Coie LLP
1155 Avenue of the Americas
New York, New York 10036
Adviser and Administrator
Morgan Stanley Investment Management Inc.
522 Fifth Avenue
New York, New York 10036
Sub-Adviser
Morgan Stanley Investment Management Limited
25 Cabot Square, Canary Wharf
London, E14 4QA, England
This report is submitted for the general information of the shareholders of the Fund. For more detailed information about the Fund, its fees and expenses and other pertinent information, please read its Prospectus. The Fund's Statement of Additional Information contains additional information about the Fund, including its Trustees. It is available, without charge, by calling (800) 548-7786.
This report is not authorized for distribution to prospective investors in the Fund unless preceded or accompanied by an effective Prospectus. Please read the Prospectus carefully before investing.
Morgan Stanley Distribution, Inc., member FINRA.
© 2019 Morgan Stanley

DINANN
2845751 EXP. 12.31.2020
Item 2. Code of Ethics.
(a) The registrant has adopted a code of ethics (the “Code of Ethics”) that applies to its principal executive officer, principal financial officer, principal accounting officer or controller, or persons performing similar functions, regardless of whether these individuals are employed by the registrant or a third party.
(b) No information need be disclosed pursuant to this paragraph.
(c) Not applicable.
(d) Not applicable.
(e) Not applicable.
(f)
(1) The registrant’s Code of Ethics is attached hereto as Exhibit 13 A.
(2) Not applicable.
(3) Not applicable.
Item 3. Audit Committee Financial Expert.
The registrant’s Board of Trustees has determined that Joseph J. Kearns, an “independent” Trustee, is an “audit committee financial expert” serving on its audit committee. Under applicable securities laws, a person who is determined to be an audit committee financial expert will not be deemed an “expert” for any purpose, including without limitation for the purposes of Section 11 of the Securities Act of 1933, as a result of being designated or identified as an audit committee financial expert. The designation or identification of a person as an audit committee financial expert does not impose on such person any duties, obligations, or liabilities that are greater than the duties, obligations, and liabilities imposed on such person as a member of the audit committee and Board of Trustees in the absence of such designation or identification.
Item 4. Principal Accountant Fees and Services.
(a)(b)(c)(d) and (g). Based on fees billed for the periods shown:
2019 | | Registrant | | Covered Entities(1) | |
Audit Fees | | $ | 68,026 | | N/A | |
| | | | | |
Non-Audit Fees | | | | | |
Audit-Related Fees | | $ | — | (2) | $ | — | (2) |
Tax Fees | | $ | 6,048 | (3) | $ | 507,296 | (4) |
All Other Fees | | $ | — | | $ | 144,110 | (5) |
Total Non-Audit Fees | | $ | 6,048 | | $ | 651,406 | |
| | | | | |
Total | | $ | 74,074 | | $ | 651,406 | |
2018 | | Registrant | | Covered Entities(1) | |
Audit Fees | | $ | 62,026 | | N/A | |
| | | | | |
Non-Audit Fees | | | | | |
Audit-Related Fees | | $ | — | (2) | $ | — | (2) |
Tax Fees | | $ | 6,048 | (3) | $ | 11,463,155 | (4) |
All Other Fees | | $ | — | | $ | 73,115 | (5) |
Total Non-Audit Fees | | $ | 6,048 | | $ | 11,536,270 | |
| | | | | |
Total | | $ | 68,074 | | $ | 11,536,270 | |
N/A- Not applicable, as not required by Item 4.
(1) Covered Entities include the Adviser (excluding sub-advisors) and any entity controlling, controlled by or under common control with the Adviser that provides ongoing services to the Registrant.
(2) Audit-Related Fees represent assurance and related services provided that are reasonably related to the performance of the audit of the financial statements of the Covered Entities’ and funds advised by the Adviser or its affiliates, specifically data verification and agreed-upon procedures related to asset securitizations and agreed-upon procedures engagements.
(3) Tax Fees represent tax compliance, tax planning and tax advice services provided in connection with the preparation and review of the Registrant’s tax returns.
(4) Tax Fees represent tax compliance, tax planning and tax advice services provided in connection with the review of Covered Entities’ tax returns.
(5) All other fees represent project management for future business applications and improving business and operational processes.
(e)(1) The audit committee’s pre-approval policies and procedures are as follows:
APPENDIX A
AUDIT COMMITTEE
AUDIT AND NON-AUDIT SERVICES
PRE-APPROVAL POLICY AND PROCEDURES
OF THE
MORGAN STANLEY FUNDS
AS ADOPTED AND AMENDED JULY 23, 2004 AND JUNE 15 AND 16, 2016(3)
1. Statement of Principles
The Audit Committee of the Board is required to review and, in its sole discretion, pre-approve all Covered Services to be provided by the Independent Auditors to the Fund and Covered Entities in order to assure that services performed by the Independent Auditors do not impair the auditor’s independence from the Fund.
The SEC has issued rules specifying the types of services that an independent auditor may not provide to its audit client, as well as the audit committee’s administration of the engagement of the independent auditor. The SEC’s rules establish two different approaches to pre-approving services, which the SEC considers to be equally valid. Proposed services either: may be pre-approved without consideration of specific case-by-case services by the Audit Committee (“general pre-approval”); or require the specific pre-approval of the Audit Committee or its delegate (“specific pre-approval”). The Audit Committee believes that the combination of these two approaches in this Policy will result in an effective and efficient procedure to pre-approve services performed by the Independent Auditors. As set forth in this Policy, unless a type of service has received general pre-approval, it will require specific pre-approval by the Audit Committee (or by any member of the Audit Committee to which pre-approval authority has been delegated) if it is to be provided by the Independent Auditors. Any proposed services exceeding pre-approved cost levels or budgeted amounts will also require specific pre-approval by the Audit Committee.
The appendices to this Policy describe the Audit, Audit-related, Tax and All Other services that have the general pre-approval of the Audit Committee. The term of any general pre-approval is 12 months from the date of pre-approval, unless the Audit Committee considers and provides a different period and states otherwise. The Audit Committee will annually review and pre-approve the services that may be provided by the Independent Auditors without obtaining specific pre-approval from the Audit Committee. The Audit Committee will add to or subtract from the list of general pre-approved services from time to time, based on subsequent determinations.
The purpose of this Policy is to set forth the policy and procedures by which the Audit Committee intends to fulfill its responsibilities. It does not delegate the Audit Committee’s responsibilities to pre-approve services performed by the Independent Auditors to management.
The Fund’s Independent Auditors have reviewed this Policy and believes that implementation of the Policy will not adversely affect the Independent Auditors’ independence.
(3) This Audit Committee Audit and Non-Audit Services Pre-Approval Policy and Procedures (the “Policy”), adopted as of the date above, supersedes and replaces all prior versions that may have been adopted from time to time.
2. Delegation
As provided in the Act and the SEC’s rules, the Audit Committee may delegate either type of pre-approval authority to one or more of its members. The member to whom such authority is delegated must report, for informational purposes only, any pre-approval decisions to the Audit Committee at its next scheduled meeting.
3. Audit Services
The annual Audit services engagement terms and fees are subject to the specific pre-approval of the Audit Committee. Audit services include the annual financial statement audit and other procedures required to be performed by the Independent Auditors to be able to form an opinion on the Fund’s financial statements. These other procedures include information systems and procedural reviews and testing performed in order to understand and place reliance on the systems of internal control, and consultations relating to the audit. The Audit Committee will approve, if necessary, any changes in terms, conditions and fees resulting from changes in audit scope, Fund structure or other items.
In addition to the annual Audit services engagement approved by the Audit Committee, the Audit Committee may grant general pre-approval to other Audit services, which are those services that only the Independent Auditors reasonably can provide. Other Audit services may include statutory audits and services associated with SEC registration statements (on Forms N-1A, N-2, N-3, N-4, etc.), periodic reports and other documents filed with the SEC or other documents issued in connection with securities offerings.
The Audit Committee has pre-approved the Audit services in Appendix B.1. All other Audit services not listed in Appendix B.1 must be specifically pre-approved by the Audit Committee (or by any member of the Audit Committee to which pre-approval has been delegated).
4. Audit-related Services
Audit-related services are assurance and related services that are reasonably related to the performance of the audit or review of the Fund’s financial statements and, to the extent they are Covered Services, the Covered Entities or that are traditionally performed by the Independent Auditors. Because the Audit Committee believes that the provision of Audit-related services does not impair the independence of the auditor and is consistent with the SEC’s rules on auditor independence, the Audit Committee may grant general pre-approval to Audit-related services. Audit-related services include, among others, accounting consultations related to accounting, financial reporting or disclosure matters not classified as “Audit services”; assistance with understanding and implementing new accounting and financial reporting guidance from rulemaking authorities; agreed-upon or expanded audit procedures related to accounting and/or billing records required to respond to or comply with financial, accounting or regulatory reporting matters; and assistance with internal control reporting requirements under Forms N-CEN and/or N-CSR.
The Audit Committee has pre-approved the Audit-related services in Appendix B.2. All other Audit-related services not listed in Appendix B.2 must be specifically pre-approved by the Audit Committee (or by any member of the Audit Committee to which pre-approval has been delegated).
5. Tax Services
The Audit Committee believes that the Independent Auditors can provide Tax services to the Fund and, to the extent they are Covered Services, the Covered Entities, such as tax compliance, tax planning and tax advice without impairing the auditor’s independence, and the SEC has stated that the Independent Auditors may provide such services.
Pursuant to the preceding paragraph, the Audit Committee has pre-approved the Tax Services in Appendix B.3. All Tax services in Appendix B.3 must be specifically pre-approved by the Audit Committee (or by any member of the Audit Committee to which pre-approval has been delegated).
6. All Other Services
The Audit Committee believes, based on the SEC’s rules prohibiting the Independent Auditors from providing specific non-audit services, that other types of non-audit services are permitted. Accordingly, the Audit Committee believes it may grant general pre-approval to those permissible non-audit services classified as All Other services that it believes are routine and recurring services, would not impair the independence of the auditor and are consistent with the SEC’s rules on auditor independence.
The Audit Committee has pre-approved the All Other services in Appendix B.4. Permissible All Other services not listed in Appendix B.4 must be specifically pre-approved by the Audit Committee (or by any member of the Audit Committee to which pre-approval has been delegated).
7. Pre-Approval Fee Levels or Budgeted Amounts
Pre-approval fee levels or budgeted amounts for all services to be provided by the Independent Auditors will be established annually by the Audit Committee. Any proposed services exceeding these levels or amounts will require specific pre-approval by the Audit Committee. The Audit Committee is mindful of the overall relationship of fees for audit and non-audit services in determining whether to pre-approve any such services.
8. Procedures
All requests or applications for services to be provided by the Independent Auditors that do not require specific approval by the Audit Committee will be submitted to the Fund’s Principal Financial and Accounting Officer and must include a detailed description of the services to be rendered. The Fund’s Principal Financial and Accounting Officer will determine whether such services are included within the list of services that have received the general pre-approval of the Audit Committee. The Audit Committee will be informed on a timely basis of any such services rendered by the Independent Auditors. Requests or applications to provide services that require specific approval by the Audit Committee or Chairman of the Audit Committee will be submitted to the Audit Committee by the Fund’s Principal Financial and Accounting Officer,
who, after consultation with the Independent Auditors, will discuss whether, the request or application is consistent with the SEC’s rules on auditor independence.
The Audit Committee has designated the Fund’s Principal Financial and Accounting Officer to monitor the performance of all services provided by the Independent Auditors and to determine whether such services are in compliance with this Policy. The Fund’s Principal Financial and Accounting Officer will report to the Audit Committee on a periodic basis on the results of its monitoring. Both the Fund’s Principal Financial and Accounting Officer and management will immediately report to the chairman of the Audit Committee any breach of this Policy that comes to the attention of the Fund’s Principal Financial and Accounting Officer or any member of management.
9. Additional Requirements
The Audit Committee has determined to take additional measures on an annual basis to meet its responsibility to oversee the work of the Independent Auditors and to assure the auditor’s independence from the Fund, such as reviewing a formal written statement from the Independent Auditors delineating all relationships between the Independent Auditors and the Fund, consistent with the PCAOB’s Ethics and Independence Rule 3526, and discussing with the Independent Auditors its methods and procedures for ensuring independence.
10. Covered Entities
Covered Entities include the Fund’s investment adviser(s) and any entity controlling, controlled by or under common control with the Fund’s investment adviser(s) that provides ongoing services to the Fund(s). Beginning with non-audit service contracts entered into on or after May 6, 2003, the Fund’s audit committee must pre-approve non-audit services provided not only to the Fund but also to the Covered Entities if the engagements relate directly to the operations and financial reporting of the Fund. This list of Covered Entities would include:
Morgan Stanley Funds
Morgan Stanley & Co. LLC
Morgan Stanley Investment Management Inc.
Morgan Stanley Investment Management Limited
Morgan Stanley Investment Management Private Limited
Morgan Stanley Asset & Investment Trust Management Co., Limited
Morgan Stanley Investment Management Company
Morgan Stanley Services Company, Inc.
Morgan Stanley Distribution, Inc.
Morgan Stanley AIP GP LP
Morgan Stanley Alternative Investment Partners LP
Morgan Stanley Smith Barney LLC
Morgan Stanley Capital Management LLC
Morgan Stanley Asia Limited
(e)(2) Beginning with non-audit service contracts entered into on or after May 6, 2003, the audit committee also is required to pre-approve services to Covered Entities to the extent that the services are determined to have a direct impact on the operations or financial reporting of the
Registrant. 100% of such services were pre-approved by the audit committee pursuant to the Audit Committee’s pre-approval policies and procedures (attached hereto).
(f) Not applicable.
(g) See table above.
(h) The audit committee of the Board of Trustees has considered whether the provision of services other than audit services performed by the auditors to the Registrant and Covered Entities is compatible with maintaining the auditors’ independence in performing audit services.
Item 5. Audit Committee of Listed Registrants.
(a) The registrant has a separately-designated standing audit committee established in accordance with Section 3(a)(58)(A) of the Exchange Act whose members are:
Joseph J. Kearns, Jakki L. Haussler, Michael F. Klein and W. Allen Reed.
(b) Not applicable.
Item 6. Schedule of Investments
(a) Refer to Item 1.
(b) Not applicable.
Item 7. Disclosure of Proxy Voting Policies and Procedures for Closed-End Management Investment Companies.
Applicable only to reports filed by closed-end funds.
Item 8. Portfolio Managers of Closed-End Management Investment Companies
Applicable only to reports filed by closed-end funds.
Item 9. Closed-End Fund Repurchases
Applicable only to reports filed by closed-end funds.
Item 10. Submission of Matters to a Vote of Security Holders
There have been no material changes to the procedures by which shareholders may recommend nominee to the Fund’s Board of Trustees since the Fund last provided disclosure in response to this item.
Item 11. Controls and Procedures
(a) The registrant’s principal executive officer and principal financial officer have concluded that the registrant’s disclosure controls and procedures are sufficient to ensure that information required to be disclosed by the registrant in this Form N-CSR was recorded, processed, summarized and reported within the time periods specified in the Securities and Exchange Commission’s rules and forms, based upon such officers’ evaluation of these controls and procedures as of a date within 90 days of the filing date of the report.
(b) There were no changes in the registrant’s internal control over financial reporting that occurred during the second fiscal quarter of the period covered by this report that has materially affected, or is reasonably likely to materially affect, the registrant’s internal control over financial reporting.
Item 12. Disclosure of Securities Lending Activities for Closed End Management Investment Companies.
Not Applicable
Item 13. Exhibits
(a) The Code of Ethics for Principal Executive and Senior Financial Officers is attached hereto.
(b) A separate certification for each principal executive officer and principal financial officer of the registrant are attached hereto as part of EX-99.CERT.
SIGNATURES
Pursuant to the requirements of the Securities Exchange Act of 1934 and the Investment Company Act of 1940, the registrant has duly caused this report to be signed on its behalf by the undersigned, thereunto duly authorized.
Morgan Stanley Global Fixed Income Opportunities Fund
/s/ John H. Gernon | |
John H. Gernon | |
Principal Executive Officer | |
December 17, 2019 | |
Pursuant to the requirements of the Securities Exchange Act of 1934 and the Investment Company Act of 1940, this report has been signed by the following persons on behalf of the registrant and in the capacities and on the dates indicated.
/s/ John H. Gernon | |
John H. Gernon | |
Principal Executive Officer | |
December 17, 2019 | |
/s/ Francis Smith | |
Francis Smith | |
Principal Financial Officer | |
December 17, 2019 | |