UNITED STATES
SECURITIES AND EXCHANGE COMMISSION
Washington, D.C. 20549
FORM N-CSR
CERTIFIED SHAREHOLDER REPORT OF REGISTERED
MANAGEMENT INVESTMENT COMPANIES
Investment Company Act file number | 811-06526 |
|
The Boston Trust & Walden Funds |
(Exact name of registrant as specified in charter) |
|
One Beacon Street, Boston MA | | 02108 |
(Address of principal executive offices) | | (Zip code) |
|
4400 Easton Commons, Columbus, OH 43219 |
(Name and address of agent for service) |
|
Registrant’s telephone number, including area code: | 1-800-282-8782 | |
|
Date of fiscal year end: | December 31 | |
|
Date of reporting period: | June 30, 2018 | |
| | | | | | | | |
Item 1. Reports to Stockholders.
This page intentionally left blank.
Semi-Annual Report June 30, 2018 (Unaudited) | 
|
Table of Contents
Boston Trust Asset Management Fund | |
Investment Performance | 2 |
Schedule of Portfolio Investments | 8 |
Financial Statements | 10 |
Financial Highlights | 12 |
| |
Boston Trust Equity Fund | |
Investment Performance | 3 |
Schedule of Portfolio Investments | 13 |
Financial Statements | 14 |
Financial Highlights | 16 |
| |
Boston Trust Midcap Fund | |
Investment Performance | 4 |
Schedule of Portfolio Investments | 17 |
Financial Statements | 18 |
Financial Highlights | 20 |
| |
Boston Trust SMID Cap Fund | |
Investment Performance | 5 |
Schedule of Portfolio Investments | 21 |
Financial Statements | 22 |
Financial Highlights | 24 |
| |
Boston Trust Small Cap Fund | |
Investment Performance | 6 |
Schedule of Portfolio Investments | 25 |
Financial Statements | 26 |
Financial Highlights | 28 |
| |
Environmental, Social, and Governance Research and Engagement Update (Annual Impact Report) | 30 |
| |
Walden Asset Management Fund | |
Investment Performance | 33 |
Schedule of Portfolio Investments | 40 |
Financial Statements | 42 |
Financial Highlights | 44 |
| |
Walden Equity Fund | |
Investment Performance | 34 |
Schedule of Portfolio Investments | 45 |
Financial Statements | 46 |
Financial Highlights | 48 |
| |
Walden Midcap Fund | |
Investment Performance | 35 |
Schedule of Portfolio Investments | 49 |
Financial Statements | 50 |
Financial Highlights | 52 |
| |
Walden SMID Cap Fund | |
Investment Performance | 36 |
Schedule of Portfolio Investments | 53 |
Financial Statements | 54 |
Financial Highlights | 56 |
| |
Walden Small Cap Fund | |
Investment Performance | 37 |
Schedule of Portfolio Investments | 57 |
Financial Statements | 58 |
Financial Highlights | 60 |
| |
Walden International Equity Fund | |
Investment Performance | 38 |
Schedule of Portfolio Investments | 61 |
Financial Statements | 63 |
Financial Highlights | 65 |
| |
Notes to Financial Statements | 66 |
Supplementary Information | 74 |
Boston Trust Investment Management, Inc. (BTIM), a subsidiary of Boston Trust & Investment Management Company, serves as investment adviser (the “Adviser”) to The Boston Trust & Walden Funds and receives a fee for its services. Boston Trust & Investment Management Company provides certain administrative, operational, and investment support functions for the Adviser and is paid a fee for these services by the Adviser.
Shares of the Funds are not deposits of, obligations of, or guaranteed by BTIM or its affiliates, nor are they federally insured by the FDIC. Investments in the Funds involve investment risks, including the possible loss of principal. Funds are distributed by Foreside Financial Services, LLC.
The foregoing information and opinions are for general information only. Boston Trust & Walden Funds and BTIM do not assume liability for any loss, which may result from the reliance by any person upon any such information or opinions. Such information and opinions are subject to change without notice, are for general information only, and are not intended as an offer or solicitation with respect to the purchase or sale of any security or offering individual or personalized investment advice. Portfolio composition is as of June 30, 2018 and is subject to change without notice.
The Boston Trust & Walden Funds may invest in foreign securities, which may involve risk not typically associated with U.S. investments.
To reduce expenses, we may only mail one copy of the Funds’ shareholder updates, such as prospectus, annual report, semi-annual report, to those addresses shared by two or more accounts. If you are a direct shareholder and wish to receive individual copies of these documents, please call us at 800-282-8782;7050. If you are not a direct shareholder, please contact your financial institution to opt out of householding. We will begin sending you individual copies thirty days after receiving your request.
Photography credits:
· Cover: Bruce Field · Pages 1, 3, 4, 34, 35, 37 and 38: Jim Gallagher · Pages 2, 5, and 36: Rebecca Monette · Pages 6 and 33: Janet C. Dygert
1
Boston Trust Asset Management Fund | Investment Performance (Unaudited) |
June 30, 2018 | |

Fund Net Asset Value: | | $ | 47.15 | |
Gross Expense Ratio(1): | | 0.92 | % |
Past performance does not guarantee future results. The performance data quoted represents past performance and current returns may be lower or higher. The investment return and principal value will fluctuate so that an investor’s shares, when redeemed may be worth more or less than the original cost. To obtain performance information current to the most recent month-end, please call 1-800-282-8782 ext. 7050.
(1) The Gross Expense Ratio is from the Fund’s most recent prospectus, dated May 1, 2018. Additional information pertaining to the Fund’s expense ratio as of June 30, 2018 can be found in the financial highlights included in this report.
| | For the period ended 6/30/18 | |
| | Aggregate | | Average Annual Total Returns | |
| | | | | | | | | | Since | |
| | | | | | | | | | Inception | |
| | Six Months | | 1 Year | | 5 Years | | 10 Years | | (12/1/95) | |
Boston Trust Asset Management Fund(1) | | 0.58 | % | 9.08 | % | 9.36 | % | 7.96 | % | 8.00 | % |
S&P 500 Index | | 2.65 | % | 14.37 | % | 13.42 | % | 10.17 | % | 8.91 | % |
Bloomberg Barclays U.S. Government/Credit Bond Index | | -1.90 | % | -0.63 | % | 2.29 | % | 3.78 | % | 4.98 | % |
Citigroup 90-Day U.S. Treasury Bill Index | | 0.79 | % | 1.33 | % | 0.39 | % | 0.31 | % | 2.26 | % |
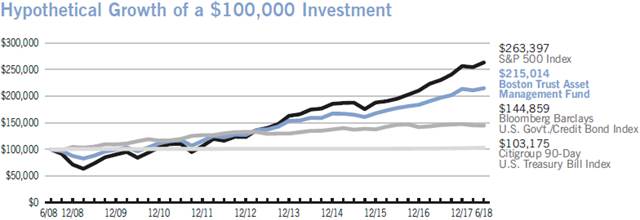
The above chart represents a 10-year hypothetical $100,000 investment in the Boston Trust Asset Management Fund and includes the reinvestment of dividends and capital gains in the Fund. The returns shown on the table and the graph do not reflect the deduction of taxes a shareholder would pay on Fund distributions or the redemption of Fund shares.
The Boston Trust Asset Management Fund is measured against a combination of equity and fixed income indices. The Standard & Poor’s 500 Index (“S&P 500”), which is widely regarded as a gauge of the U.S. equities market, includes 500 leading companies in leading industries of the U.S. economy. Although the S&P 500 focuses on the large-cap segment of the market, with approximately 75% coverage of U.S. equities, it is also widely viewed as a proxy for the total market. The Bloomberg Barclays U.S. Government/Credit Bond Index includes Treasuries (i.e., public obligations of the U.S. Treasury that have remaining maturities of more than one year), government-related issues (e.g., agency, sovereign, supranational, and local authority debt), and USD Corporates. The Bloomberg Barclays U.S. Government/Credit Bond Index is a component of the Bloomberg Barclays U.S. Aggregate Index. The Citigroup 90-Day U.S. Treasury Bill Index reflects monthly return equivalents of yield averages that are not marked to the market. The index is an average of the last three-month treasury bill issues. The three-month treasury bills are the short-term debt obligations of the U.S. Government. The indices are unmanaged and their performance does not reflect the deduction of expenses associated with a mutual fund, such as investment management and fund accounting fees. The Fund’s performance reflects the deduction of fees for these services. Investors cannot invest directly in an average or an index.
2
Investment Performance (Unaudited) | | Boston Trust Equity Fund |
| | June 30, 2018 |
| | For the period ended 6/30/18 | |
| | Aggregate | | Average Annual Total Returns | |
| | | | | | | | | | Since | |
| | | | | | | | | | Inception | |
| | Six Months | | 1 Year | | 5 Years | | 10 Years | | (10/1/03) | |
Boston Trust Equity Fund(1) | | 0.68 | % | 12.06 | % | 11.07 | % | 9.04 | % | 8.39 | % |
S&P 500 Index | | 2.65 | % | 14.37 | % | 13.42 | % | 10.17 | % | 9.11 | % |

The above chart represents a 10-year hypothetical $100,000 investment in the Boston Trust Equity Fund and includes the reinvestment of dividends and capital gains in the Fund. The returns shown on the table and the graph do not reflect the deduction of taxes a shareholder would pay on Fund distributions or the redemption of Fund shares.
The Boston Trust Equity Fund is measured against the Standard & Poor’s 500 Index (“S&P 500”), which is an unmanaged index that is widely regarded as a gauge of the U.S. equities market. This index includes 500 leading companies in leading industries of the U.S. economy. Although the S&P 500 focuses on the large cap segment of the market, with approximately 75% coverage of U.S. equities, it is also widely viewed as a proxy for the total market. The index is unmanaged and its performance does not reflect the deduction of expenses associated with a mutual fund, such as investment management and fund accounting fees. The Fund’s performance reflects the deduction of fees for these services. Investors cannot invest directly in an index.

Fund Net Asset Value: | | $ | 23.79 | |
Gross Expense Ratio(1): | | 0.93 | % |
Past performance does not guarantee future results. The performance data quoted represents past performance and current returns may be lower or higher. The investment return and principal value will fluctuate so that an investor’s shares, when redeemed may be worth more or less than the original cost. To obtain performance information current to the most recent month-end, please call 1-800-282-8782 ext. 7050.
(1) The Gross Expense Ratio is from the Fund’s most recent prospectus, dated May 1, 2018. Additional information pertaining to the Fund’s expense ratio as of June 30, 2018 can be found in the financial highlights included in this report.
3
Boston Trust Midcap Fund | | Investment Performance (Unaudited) |
June 30, 2018 | | |

Fund Net Asset Value: | | $ | 17.68 | |
Gross Expense Ratio(1): | | 1.00 | % |
Past performance does not guarantee future results. The performance data quoted represents past performance and current returns may be lower or higher. The investment return and principal value will fluctuate so that an investor’s shares, when redeemed may be worth more or less than the original cost. To obtain performance information current to the most recent month-end, please call 1-800-282-8782 ext. 7050.
(1) The Gross Expense Ratio is from the Fund’s most recent prospectus, dated May 1, 2018. The contractual fee limit under the Fund’s expense limitation agreement is 1.00% of the Fund’s average annual net assets, subject to certain limitations as described in the Fund’s prospectus. Please see the Fund’s most recent prospectus for details. Additional information pertaining to the Fund’s expense ratio as of June 30, 2018 can be found in the financial highlights included in this report. The investment performance may reflect fee reductions.
| | For the period ended 6/30/18 | |
| | Aggregate | | Average Annual Total Returns | |
| | | | | | | | | | Since | |
| | | | | | | | | | Inception | |
| | Six Months | | 1 Year | | 5 Years | | 10 Years | | 9/24/07 | |
Boston Trust Midcap Fund(1) | | 2.43 | % | 13.13 | % | 11.84 | % | 10.72 | % | 9.28 | % |
Russell Midcap® Index | | 2.35 | % | 12.33 | % | 12.22 | % | 10.23 | % | 8.41 | % |
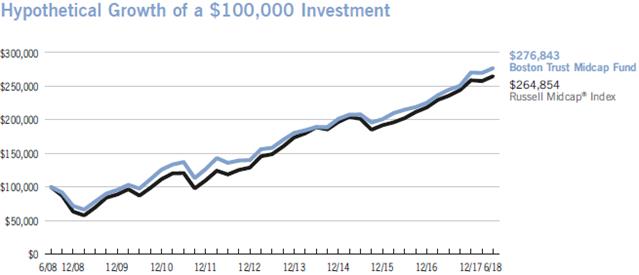
The above chart represents a 10-year hypothetical $100,000 investment in the Boston Trust Midcap Fund, and includes the reinvestment of dividends and capital gains in the Fund. The returns shown on the table and the graph do not reflect the deduction of taxes a shareholder would pay on Fund distributions or the redemption of Fund shares.
The Boston Trust Midcap Fund is measured against the Russell Midcap® Index, which is an unmanaged index that measures the performance of the mid-cap segment of the U.S. equity universe. The Russell Midcap® Index is a subset of the Russell 1000® Index. It includes approximately 800 of the smallest securities based on a combination of their market capitalization and current index membership. The Russell Midcap® Index represents approximately 31% of the total market capitalization of the Russell 1000 companies. Russell Investment Group is the source and owner of the trademarks, service marks and copyrights related to the Russell Indexes. Russell® is a trademark of Russell Investment Group. The performance of an index does not reflect the deduction of expenses associated with a mutual fund, such as investment management and fund accounting fees. The Fund’s performance reflects the deduction of fees for these services. Investors cannot invest directly in an index.
4
Investment Performance (Unaudited) | | Boston Trust SMID Cap Fund |
| | June 30, 2018 |
| | For the period ended 6/30/18 | |
| | Aggregate | | Average Annual Total Returns | |
| | | | | | | | Since | |
| | | | | | | | Inception | |
| | Six Months | | 1 Year | | 5 Years | | 11/30/11 | |
Boston Trust SMID Cap Fund(1) | | 3.86 | % | 14.16 | % | 11.73 | % | 12.51 | % |
Russell 2500™ Index | | 5.46 | % | 16.24 | % | 12.29 | % | 14.47 | % |

The above chart represents a hypothetical $1,000,000 investment in the Boston Trust SMID Cap Fund from November 30, 2011 to June 30, 2018, and includes the reinvestment of dividends and capital gains in the Fund. The returns shown on the table and the graph do not reflect the deduction of taxes a shareholder would pay on Fund distributions or the redemption of Fund shares.
The Boston Trust SMID Cap Fund is measured against the Russell 2500™ Index, which is an unmanaged index that measures the performance of the small- to mid-cap segment of the U.S. equity universe, commonly referred to as “smid” cap. The Russell 2500 is a subset of the Russell 3000® Index. It includes approximately 2500 of the smallest securities based on a combination of their market cap and current index membership. Russell Investment Group is the source and owner of the trademarks, service marks and copyrights related to the Russell Indexes. Russell® is a trademark of Russell Investment Group. The performance of an index does not reflect the deduction of expenses associated with a mutual fund, such as investment management and fund accounting fees. The Fund’s performance reflects the deduction of fees for these services. Investors cannot invest directly in an index.

Fund Net Asset Value: | | $ | 16.40 | |
Gross Expense Ratio(1): | | 1.04 | % |
Past performance does not guarantee future results. The performance data quoted represents past performance and current returns may be lower or higher. The investment return and principal value will fluctuate so that an investor’s shares, when redeemed may be worth more or less than the original cost. Returns less than one year are not annualized. To obtain performance information current to the most recent month-end, please call 1-800-282-8782 ext. 7050.
(1) The Gross Expense Ratio is from the Fund’s most recent prospectus, dated May 1, 2018. The contractual fee limit under the Fund’s expense limitation agreement is 0.75% of the Fund’s average annual net assets, subject to certain limitations as described in the Fund’s prospectus. Please see the Fund’s most recent prospectus for details. Additional information pertaining to the Fund’s expense ratio as of June 30, 2018 can be found in the financial highlights included in this report. The investment performance may reflect fee reductions. If such fee reductions had not occurred, the quoted performance would have been lower. The contractual fee waiver continues through May 1, 2019 and may be renewed thereafter.
5
Boston Trust Small Cap Fund | | Investment Performance (Unaudited) |
June 30, 2018 | | |

Fund Net Asset Value: | | $ | 15.49 | |
Gross Expense Ratio(1): | | 1.02 | % |
Past performance does not guarantee future results. The performance data quoted represents past performance and current returns may be lower or higher. The investment return and principal value will fluctuate so that an investor’s shares, when redeemed may be worth more or less than the original cost. To obtain performance information current to the most recent month-end, please call 1-800-282-8782 ext. 7050.
(1) The Gross Expense Ratio is from the Fund’s most recent prospectus, dated May 1, 2018. The contractual fee limit under the Fund’s expense limitation agreement is 1.00% of the Fund’s average annual net assets, subject to certain limitations as described in the Fund’s prospectus. Please see the Fund’s most recent prospectus for details. Additional information pertaining to the Fund’s expense ratio as of June 30, 2018 can be found in the financial highlights included in this report. The investment performance may reflect fee reductions. If such fee reductions had not occurred, the quoted performance would have been lower. The contractual fee waiver continues through May 1, 2019 and may be renewed thereafter.
| | For the period ended 6/30/18 | |
| | Aggregate | | Average Annual Total Returns | |
| | | | | | | | | | Since | |
| | | | | | | | | | Inception | |
| | Six Months | | 1 Year | | 5 Years | | 10 Years | | (12/31/94) | |
Boston Trust Small Cap Fund(1) | | 5.16 | % | 13.91 | % | 10.43 | % | 9.78 | % | 11.05 | % |
Russell 2000® Index | | 7.66 | % | 17.57 | % | 12.46 | % | 10.60 | % | 9.81 | % |

The above chart represents a 10-year hypothetical $100,000 investment in the Boston Trust Small Cap Fund and includes the reinvestment of dividends and capital gains in the Fund. The returns shown on the table and the graph do not reflect the deduction of taxes a shareholder would pay on Fund distributions or the redemption of Fund shares.
The Boston Trust Small Cap Fund is measured against the Russell 2000® Index, which is an unmanaged index that measures the performance of the small-cap segment of the U.S. equity universe. The Russell 2000® Index is a subset of the Russell 3000® Index representing approximately 10% of the total market capitalization of that index. It includes approximately 2000 of the smallest securities based on a combination of their market cap and current index membership. Russell Investment Group is the source and owner of the trademarks, service marks and copyrights related to the Russell Indexes. Russell® is a trademark of Russell Investment Group. The performance of an index does not reflect the deduction of expenses associated with a mutual fund, such as investment management and fund accounting fees. The Fund’s performance reflects the deduction of fees for these services. Investors cannot invest directly in an index.
6
This page intentionally left blank.
7
Schedule of Portfolio Investments | Boston Trust Asset Management Fund
June 30, 2018 |
| | Shares or | | | |
| | Principal | | | |
Security Description | | Amount($) | | Fair Value ($) | |
COMMON STOCKS (78.5%) | | | | | |
Consumer Discretionary (7.2%) | | | | | |
Autoliv, Inc. | | 25,000 | | 3,580,500 | |
Comcast Corp., Class A | | 275,000 | | 9,022,750 | |
NIKE, Inc., Class B | | 115,000 | | 9,163,200 | |
Omnicom Group, Inc. | | 50,000 | | 3,813,500 | |
Ross Stores, Inc. | | 30,000 | | 2,542,500 | |
Starbucks Corp. | | 135,000 | | 6,594,750 | |
| | | | 34,717,200 | |
Consumer Staples (6.5%) | | | | | |
Church & Dwight Co., Inc. | | 75,000 | | 3,987,000 | |
Colgate-Palmolive Co. | | 10,000 | | 648,100 | |
Costco Wholesale Corp. | | 45,000 | | 9,404,100 | |
Diageo PLC, Sponsored ADR | | 30,000 | | 4,320,300 | |
McCormick & Co., Inc. | | 25,000 | | 2,902,250 | |
PepsiCo, Inc. | | 40,000 | | 4,354,800 | |
Procter & Gamble Co. | | 30,000 | | 2,341,800 | |
Sysco Corp. | | 35,000 | | 2,390,150 | |
The Hershey Co. | | 10,000 | | 930,600 | |
| | | | 31,279,100 | |
Energy (3.2%) | | | | | |
Chevron Corp. | | 27,500 | | 3,476,825 | |
ConocoPhillips | | 50,000 | | 3,481,000 | |
Exxon Mobil Corp. | | 75,000 | | 6,204,750 | |
Schlumberger Ltd. | | 32,500 | | 2,178,475 | |
| | | | 15,341,050 | |
Financials (15.7%) | | | | | |
American Express Co. | | 50,000 | | 4,900,000 | |
BB&T Corp. | | 100,000 | | 5,044,000 | |
Berkshire Hathaway, Inc., Class B (a) | | 65,000 | | 12,132,250 | |
Chubb Ltd. | | 40,000 | | 5,080,800 | |
Cincinnati Financial Corp. | | 60,000 | | 4,011,600 | |
Comerica, Inc. | | 30,000 | | 2,727,600 | |
Commerce Bancshares, Inc. | | 31,906 | | 2,064,637 | |
JPMorgan Chase & Co. | | 100,000 | | 10,420,000 | |
M&T Bank Corp. | | 10,000 | | 1,701,500 | |
Marsh & McLennan Cos., Inc. | | 10,000 | | 819,700 | |
Northern Trust Corp. | | 50,000 | | 5,144,500 | |
PNC Financial Services Group, Inc. | | 45,000 | | 6,079,500 | |
State Street Corp. | | 40,000 | | 3,723,600 | |
T. Rowe Price Group, Inc. | | 40,000 | | 4,643,600 | |
U.S. Bancorp | | 125,000 | | 6,252,500 | |
| | | | 74,745,787 | |
Health Care (11.7%) | | | | | |
Becton, Dickinson & Co. | | 60,000 | | 14,373,600 | |
Dentsply Sirona, Inc. | | 50,000 | | 2,188,500 | |
Edwards Lifesciences Corp. (a) | | 45,000 | | 6,550,650 | |
Henry Schein, Inc. (a) | | 50,000 | | 3,632,000 | |
Johnson & Johnson, Inc. | | 55,000 | | 6,673,700 | |
Medtronic PLC | | 20,000 | | 1,712,200 | |
Merck & Co., Inc. | | 40,000 | | 2,428,000 | |
Mettler-Toledo International, Inc. (a) | | 7,500 | | 4,339,725 | |
Stryker Corp. | | 25,000 | | 4,221,500 | |
UnitedHealth Group, Inc. | | 32,500 | | 7,973,550 | |
Varian Medical Systems, Inc. (a) | | 20,000 | | 2,274,400 | |
| | | | 56,367,825 | |
Industrials (9.5%) | | | | | |
3M Co. | | 37,500 | | 7,377,000 | |
Donaldson Co., Inc. | | 50,000 | | 2,256,000 | |
Emerson Electric Co. | | 25,000 | | 1,728,500 | |
Honeywell International, Inc. | | 30,000 | | 4,321,500 | |
Hubbell, Inc. | | 40,000 | | 4,229,600 | |
Illinois Tool Works, Inc. | | 50,000 | | 6,927,000 | |
Rockwell Collins, Inc. | | 10,000 | | 1,346,800 | |
Union Pacific Corp. | | 50,000 | | 7,084,000 | |
United Parcel Service, Inc., Class B | | 55,000 | | 5,842,650 | |
W.W. Grainger, Inc. | | 15,000 | | 4,626,000 | |
| | | | 45,739,050 | |
Information Technology (20.4%) | | | | | |
Accenture PLC, Class A | | 70,000 | | 11,451,301 | |
Alphabet, Inc., Class A (a) | | 2,000 | | 2,258,380 | |
Alphabet, Inc., Class C (a) | | 15,000 | | 16,734,750 | |
Apple, Inc. | | 100,000 | | 18,511,000 | |
Automatic Data Processing, Inc. | | 70,000 | | 9,389,800 | |
Cisco Systems, Inc. | | 175,000 | | 7,530,250 | |
Microsoft Corp. | | 155,000 | | 15,284,550 | |
Oracle Corp. | | 150,000 | | 6,609,000 | |
Visa, Inc., Class A | | 75,000 | | 9,933,750 | |
| | | | 97,702,781 | |
Materials (2.6%) | | | | | |
Air Products & Chemicals, Inc. | | 20,000 | | 3,114,600 | |
AptarGroup, Inc. | | 30,000 | | 2,801,400 | |
PPG Industries, Inc. | | 65,000 | | 6,742,450 | |
| | | | 12,658,450 | |
Utilities (1.7%) | | | | | |
Consolidated Edison, Inc. | | 50,000 | | 3,899,000 | |
Eversource Energy | | 75,000 | | 4,395,750 | |
| | | | 8,294,750 | |
| | | | | |
TOTAL COMMON STOCKS (Cost $190,820,940) | | | | 376,845,993 | |
| | | | | |
CORPORATE BONDS (2.6%) | | | | | |
| | | | | |
Financials (1.5%) | | | | | |
American Express Co., 2.65%, 12/2/22 | | 1,926,000 | | 1,851,349 | |
Berkshire Hathaway, Inc., 3.13%, 3/15/26, Callable 12/15/25 @ 100 | | 2,000,000 | | 1,928,961 | |
JPMorgan Chase & Co., 3.90%, 7/15/25, Callable 4/15/25 @ 100 | | 1,000,000 | | 997,158 | |
National Rural Utilities Cooperative Finance Corp., 10.38%, 11/1/18 | | 500,000 | | 512,827 | |
Wells Fargo & Co., 3.55%, 9/29/25, MTN | | 2,000,000 | | 1,940,586 | |
| | | | 7,230,881 | |
| | | | | |
Health Care (0.2%) | | | | | |
Becton, Dickinson & Co., 3.13%, 11/8/21 | | 1,000,000 | | 986,269 | |
| | | | | |
Information Technology (0.9%) | | | | | |
Apple, Inc., 3.25%, 2/23/26, Callable 11/23/25 @ 100 | | 2,500,000 | | 2,442,692 | |
Visa, Inc., 3.15%, 12/14/25, Callable 9/14/25 @ 100 | | 2,000,000 | | 1,936,662 | |
| | | | 4,379,354 | |
| | | | | |
TOTAL CORPORATE BONDS (Cost $13,018,776) | | | | 12,596,504 | |
See Notes to Financial Statements
8
| | Shares or | | | |
| | Principal | | | |
Security Description | | Amount($) | | Fair Value ($) | |
MUNICIPAL BONDS (0.9%) | | | | | |
Illinois (0.1%): | | | | | |
Illinois State, GO, 5.00%, 4/1/24, Continuously Callable @ 100 | | 450,000 | | 451,350 | |
| | | | | |
Massachusetts (0.7%): | | | | | |
Massachusetts State, Series E, GO, 4.00%, 9/1/37, Callable 9/1/25 @ 100 | | 1,000,000 | | 1,044,290 | |
Massachusetts State, Series E, GO, 5.00%, 7/1/38, Callable 7/1/26 @ 100 | | 260,000 | | 296,717 | |
Massachusetts State Development Finance Agency Revenue, Series R-2, 5.00%, 7/1/28, Callable 7/1/20 @ 100 | | 460,000 | | 488,336 | |
Massachusetts State Health & Educational Facilities Authority Revenue, Series A, 5.00%, 12/15/26, Prerefunded 12/15/19 @100 | | 1,500,000 | | 1,573,245 | |
| | | | 3,402,588 | |
| | | | | |
Washington (0.1%): | | | | | |
Washington State, Series C, GO, 5.00%, 2/1/26, Prerefunded 2/1/19 @100 | | 250,000 | | 255,130 | |
| | | | | |
TOTAL MUNICIPAL BONDS (Cost $4,261,118) | | | | 4,109,068 | |
| | | | | |
U.S. GOVERNMENT & U.S. GOVERNMENT AGENCY OBLIGATIONS (16.6%) | | | | | |
| | | | | |
Federal Farm Credit Bank | | | | | |
2.63%, 8/12/19 | | 10,000,000 | | 10,025,419 | |
2.85%, 3/2/28 | | 2,000,000 | | 1,930,976 | |
2.95%, 1/27/25 | | 2,000,000 | | 1,995,408 | |
3.14%, 12/5/29 | | 2,500,000 | | 2,451,800 | |
3.39%, 2/1/28 | | 2,000,000 | | 2,020,604 | |
3.85%, 12/26/25 | | 2,770,000 | | 2,912,231 | |
| | | | 21,336,438 | |
Federal Home Loan Bank | | | | | |
2.38%, 3/13/26 | | 6,000,000 | | 5,730,390 | |
2.50%, 12/10/27 | | 1,500,000 | | 1,419,095 | |
2.63%, 6/11/27 | | 1,500,000 | | 1,436,841 | |
2.88%, 9/13/24 | | 2,500,000 | | 2,495,788 | |
3.50%, 9/24/29 | | 2,000,000 | | 2,040,678 | |
| | | | 13,122,792 | |
U.S. Treasury Bills | | | | | |
1.55%, 7/19/18 | | 7,500,000 | | 7,493,864 | |
1.83%, 9/20/18 | | 8,000,000 | | 7,966,756 | |
| | | | 15,460,620 | |
U.S. Treasury Note | | | | | |
2.75%, 2/15/24 | | 30,000,000 | | 29,966,015 | |
| | | | | |
TOTAL U.S. GOVERNMENT & U.S. GOVERNMENT AGENCY OBLIGATIONS (Cost $81,276,153) | | | | 79,885,865 | |
| | | | | |
INVESTMENT COMPANIES (1.4%) | | | | | |
JPMorgan U.S. Government Money Market Fund, Capital Shares, 1.83%(b) | | 6,610,817 | | 6,610,817 | |
TOTAL INVESTMENT COMPANIES (Cost $6,610,817) | | | | 6,610,817 | |
| | | | | |
Total Investments (Cost $295,987,804) — 100.0%(c) | | | | 480,048,247 | |
Other assets in excess of liabilities — 0.0% | | | | 202,709 | |
NET ASSETS — 100.0% | | | | $ | 480,250,956 | |
| | | | | | |
(a) Non-income producing security.
(b) Rate disclosed is the seven day yield as of June 30, 2018.
(c) See Federal Tax Information listed in the Notes to the Financial Statements.
ADR American Depositary Receipt
GO General Obligation
MTN Medium Term Note
See Notes to Financial Statements
9
Financial Statements | Boston Trust Asset Management Fund |
STATEMENT OF ASSETS AND LIABILITIES
June 30, 2018 (Unaudited)
Assets: | | | |
Investments, at fair value (cost $295,987,804) | | $ | 480,048,247 | |
Interest and dividends receivable | | 1,096,219 | |
Receivable for capital shares issued | | 22,676 | |
Prepaid expenses | | 14,769 | |
Total Assets | | 481,181,911 | |
Liabilities: | | | |
Payable for investments purchased | | 485,709 | |
Payable for capital shares redeemed | | 60,154 | |
Accrued expenses and other liabilities: | | | |
Investment adviser | | 299,039 | |
Administration and accounting | | 37,219 | |
Chief compliance officer | | 3,943 | |
Custodian | | 6,919 | |
Shareholder servicing fees | | 13,702 | |
Transfer agent | | 4,091 | |
Trustee | | 2,638 | |
Other | | 17,541 | |
Total Liabilities | | 930,955 | |
Net Assets | | $ | 480,250,956 | |
Composition of Net Assets: | | | |
Capital | | $ | 280,429,424 | |
Accumulated undistributed net investment income | | 2,443,358 | |
Accumulated net realized gains from investment transactions | | 13,317,731 | |
Net unrealized appreciation from investments | | 184,060,443 | |
Net Assets | | $ | 480,250,956 | |
Shares outstanding (par value $0.01, unlimited number of shares authorized) | | 10,185,191 | |
Net Asset Value, Offering Price and Redemption price per share | | $ | 47.15 | |
STATEMENT OF OPERATIONS
For the period ended June 30, 2018 (Unaudited)
Investment Income: | | | |
Interest | | $ | 1,289,991 | |
Dividends | | 3,431,145 | |
Total Investment Income | | 4,721,136 | |
Expenses: | | | |
Investment adviser | | 1,820,368 | |
Administration and accounting | | 204,311 | |
Chief compliance officer | | 22,247 | |
Custodian | | 33,419 | |
Shareholder servicing | | 76,507 | |
Transfer agency | | 19,651 | |
Trustee | | 14,118 | |
Other | | 87,157 | |
Total expenses | | 2,277,778 | |
Net Expenses | | 2,277,778 | |
Net Investment Income | | 2,443,358 | |
Net Realized/Unrealized Gains (Losses) from Investments: | | | |
Net realized gains from investment transactions | | 6,397,949 | |
Change in unrealized appreciation/depreciation from investments | | (5,854,197 | ) |
Net realized/unrealized gains (losses) from investments | | 543,752 | |
Change in Net Assets Resulting from Operations | | $ | 2,987,110 | |
See Notes to Financial Statements
10
STATEMENTS OF CHANGES IN NET ASSETS
| | For the | | | |
| | six months ended | | For the year ended | |
| | June 30, 2018 | | December 31, 2017 | |
| | (Unaudited) | | | |
Investment Activities: | | | | | |
Operations: | | | | | |
Net investment income | | $ | 2,443,358 | | $ | 5,033,185 | |
Net realized gains from investment transactions | | 6,397,949 | | 12,348,048 | |
Change in unrealized appreciation/depreciation from investments | | (5,854,197 | ) | 50,152,480 | |
Change in Net Assets Resulting from Operations | | 2,987,110 | | 67,533,713 | |
Dividends: | | | | | |
Net investment income | | — | | (5,061,492 | ) |
Net realized gains from investment transactions | | — | | (6,837,618 | ) |
Change in Net Assets Resulting from Shareholder Dividends | | — | | (11,899,110 | ) |
Capital Share Transactions: | | | | | |
Proceeds from shares issued | | 12,289,959 | | 59,469,516 | |
Dividends reinvested | | — | | 10,543,397 | |
Cost of shares redeemed | | (31,736,372 | ) | (32,905,814 | ) |
Change in Net Assets Resulting from Capital Share Transactions | | (19,446,413 | ) | 37,107,099 | |
Change in Net Assets | | (16,459,303 | ) | 92,741,702 | |
Net Assets: | | | | | |
Beginning of period | | 496,710,259 | | 403,968,557 | |
End of period | | $ | 480,250,956 | | $ | 496,710,259 | |
Share Transactions: | | | | | |
Issued | | 260,304 | | 1,338,314 | |
Reinvested | | — | | 224,998 | |
Redeemed | | (670,260 | ) | (741,639 | ) |
Change in shares | | (409,956 | ) | 821,673 | |
Accumulated undistributed net investment income | | $ | 2,443,358 | | $ | — | |
Amounts designated as “—” are $0 or have been rounded to $0.
See Notes to Financial Statements
11
FINANCIAL HIGHLIGHTS
Selected data for a share outstanding throughout the periods indicated.
| | | | | | For the nine | | | | | | | |
| | | | For the year | | months | | For the year | | For the year | | For the year | |
| | For the six | | ended | | ended | | ended | | ended | | ended | |
| | months ended | | December 31, | | December 31, | | March 31, | | March 31, | | March 31, | |
| | June 30, 2018 | | 2017 | | 2016 | | 2016 | | 2015 | | 2014 | |
| | (Unaudited) | | | | | | | | | | | |
Net Asset Value, Beginning of Period | | $ | 46.88 | | $ | 41.33 | | $ | 40.92 | | $ | 41.80 | | $ | 40.03 | | $ | 36.08 | |
| | | | | | | | | | | | | |
Investment Activities: | | | | | | | | | | | | | |
Operations: | | | | | | | | | | | | | |
Net investment income | | 0.24 | | 0.49 | | 0.35 | | 0.55 | | 0.50 | | 0.44 | |
Net realized and unrealized gains from investment transactions | | 0.03 | | 6.22 | | 2.18 | | 0.92 | | 2.77 | | 4.28 | |
Total from investment activities | | 0.27 | | 6.71 | | 2.53 | | 1.47 | | 3.27 | | 4.72 | |
Dividends: | | | | | | | | | | | | | |
Net investment income | | — | | (0.49 | ) | (0.46 | ) | (0.57 | ) | (0.47 | ) | (0.44 | ) |
Net realized gains from investments | | — | | (0.67 | ) | (1.66 | ) | (1.78 | ) | (1.03 | ) | (0.33 | ) |
Total dividends | | — | | (1.16 | ) | (2.12 | ) | (2.35 | ) | (1.50 | ) | (0.77 | ) |
| | | | | | | | | | | | | |
Net Asset Value, End of Period | | $ | 47.15 | | $ | 46.88 | | $ | 41.33 | | $ | 40.92 | | $ | 41.80 | | $ | 40.03 | |
| | | | | | | | | | | | | |
Total Return | | 0.58 | %(a) | 16.23 | % | 6.19 | %(a) | 3.65 | % | 8.21 | % | 13.13 | % |
| | | | | | | | | | | | | |
Ratios/Supplemental Data: | | | | | | | | | | | | | |
Net assets at end of period (000’s) | | $ | 480,251 | | $ | 496,710 | | $ | 403,969 | | $ | 354,405 | | $ | 353,851 | | $ | 340,963 | |
Ratio of net expenses to average net assets | | 0.94 | %(b) | 0.92 | % | 0.95 | %(b) | 0.94 | % | 0.92 | % | 0.92 | % |
Ratio of net investment income to average net assets | | 1.01 | %(b) | 1.13 | % | 1.15 | %(b) | 1.32 | % | 1.19 | % | 1.17 | % |
Ratio of expenses (before fee reductions or recoupment of fees previously reimbursed by the investment adviser) to average net assets | | 0.94 | %(b) | 0.92 | % | 0.95 | %(b) | 0.94 | % | 0.93 | % | 0.93 | % |
Portfolio turnover rate | | 1.08 | %(a) | 6.96 | % | 8.42 | %(a) | 11.64 | % | 17.74 | % | 8.94 | % |
Amounts designated as “—” are $0 or have been rounded to $0.
(a) Not annualized for periods less than one year.
(b) Annualized for periods less than one year.
See Notes to Financial Statements
12
Schedule of Portfolio Investments | Boston Trust Equity Fund |
June 30, 2018
Security Description | | Shares | | Fair Value ($) | |
COMMON STOCKS (98.9%) | | | | | |
Consumer Discretionary (8.5%) | | | | | |
Autoliv, Inc. | | 10,000 | | 1,432,200 | |
Comcast Corp., Class A | | 90,000 | | 2,952,900 | |
NIKE, Inc., Class B | | 30,000 | | 2,390,400 | |
Omnicom Group, Inc. | | 15,000 | | 1,144,050 | |
Ross Stores, Inc. | | 10,000 | | 847,500 | |
Starbucks Corp. | | 50,000 | | 2,442,500 | |
| | | | 11,209,550 | |
Consumer Staples (8.3%) | | | | | |
Church & Dwight Co., Inc. | | 25,000 | | 1,329,000 | |
Colgate-Palmolive Co. | | 2,500 | | 162,025 | |
Costco Wholesale Corp. | | 17,000 | | 3,552,660 | |
Diageo PLC, Sponsored ADR | | 7,500 | | 1,080,075 | |
McCormick & Co., Inc. | | 7,000 | | 812,630 | |
PepsiCo, Inc. | | 10,000 | | 1,088,700 | |
Procter & Gamble Co. | | 10,000 | | 780,600 | |
Sysco Corp. | | 25,000 | | 1,707,250 | |
The Hershey Co. | | 5,000 | | 465,300 | |
| | | | 10,978,240 | |
Energy (3.9%) | | | | | |
Chevron Corp. | | 12,500 | | 1,580,375 | |
ConocoPhillips | | 15,000 | | 1,044,300 | |
Exxon Mobil Corp. | | 22,500 | | 1,861,425 | |
Schlumberger Ltd. | | 10,000 | | 670,300 | |
| | | | 5,156,400 | |
Financials (20.2%) | | | | | |
American Express Co. | | 25,000 | | 2,450,000 | |
BB&T Corp. | | 30,000 | | 1,513,200 | |
Berkshire Hathaway, Inc., Class B (a) | | 20,000 | | 3,733,000 | |
Chubb Ltd. | | 15,000 | | 1,905,300 | |
Cincinnati Financial Corp. | | 25,000 | | 1,671,500 | |
Commerce Bancshares, Inc. | | 9,570 | | 619,275 | |
JPMorgan Chase & Co. | | 37,500 | | 3,907,500 | |
M&T Bank Corp. | | 5,000 | | 850,750 | |
Northern Trust Corp. | | 15,000 | | 1,543,350 | |
PNC Financial Services Group, Inc. | | 20,000 | | 2,702,000 | |
State Street Corp. | | 20,000 | | 1,861,800 | |
T. Rowe Price Group, Inc. | | 15,000 | | 1,741,350 | |
U.S. Bancorp | | 45,000 | | 2,250,900 | |
| | | | 26,749,925 | |
Health Care (14.2%) | | | | | |
Becton, Dickinson & Co. | | 16,000 | | 3,832,960 | |
Dentsply Sirona, Inc. | | 25,000 | | 1,094,250 | |
Edwards Lifesciences Corp. (a) | | 7,500 | | 1,091,775 | |
Henry Schein, Inc. (a) | | 15,000 | | 1,089,600 | |
Johnson & Johnson, Inc. | | 22,500 | | 2,730,150 | |
Medtronic PLC | | 10,000 | | 856,100 | |
Merck & Co., Inc. | | 15,000 | | 910,500 | |
Mettler-Toledo International, Inc. (a) | | 1,500 | | 867,945 | |
Stryker Corp. | | 12,000 | | 2,026,320 | |
UnitedHealth Group, Inc. | | 14,000 | | 3,434,760 | |
Varian Medical Systems, Inc. (a) | | 7,500 | | 852,900 | |
| | | | 18,787,260 | |
Industrials (12.7%) | | | | | |
3M Co. | | 15,000 | | 2,950,800 | |
Deere & Co. | | 7,500 | | 1,048,500 | |
Donaldson Co., Inc. | | 10,000 | | 451,200 | |
Honeywell International, Inc. | | 12,000 | | 1,728,600 | |
Hubbell, Inc. | | 15,000 | | 1,586,100 | |
Illinois Tool Works, Inc. | | 15,000 | | 2,078,100 | |
Union Pacific Corp. | | 22,500 | | 3,187,800 | |
United Parcel Service, Inc., Class B | | 15,000 | | 1,593,450 | |
W.W. Grainger, Inc. | | 7,000 | | 2,158,800 | |
| | | | 16,783,350 | |
Information Technology (26.0%) | | | | | |
Accenture PLC, Class A | | 25,000 | | 4,089,750 | |
Alphabet, Inc., Class A (a) | | 750 | | 846,893 | |
Alphabet, Inc., Class C (a) | | 5,500 | | 6,136,075 | |
Apple, Inc. | | 35,000 | | 6,478,850 | |
Automatic Data Processing, Inc. | | 20,000 | | 2,682,800 | |
Cisco Systems, Inc. | | 50,000 | | 2,151,500 | |
Microsoft Corp. | | 55,000 | | 5,423,550 | |
Oracle Corp. | | 55,000 | | 2,423,300 | |
Visa, Inc., Class A | | 32,500 | | 4,304,624 | |
| | | | 34,537,342 | |
Materials (3.1%) | | | | | |
Air Products & Chemicals, Inc. | | 7,000 | | 1,090,110 | |
AptarGroup, Inc. | | 10,000 | | 933,800 | |
PPG Industries, Inc. | | 20,000 | | 2,074,600 | |
| | | | 4,098,510 | |
Utilities (2.0%) | | | | | |
Consolidated Edison, Inc. | | 15,000 | | 1,169,700 | |
Eversource Energy | | 25,000 | | 1,465,250 | |
| | | | 2,634,950 | |
| | | | | |
TOTAL COMMON STOCKS (Cost $64,863,439) | | | | 130,935,527 | |
| | | | | |
INVESTMENT COMPANIES (1.1%) | | | | | |
JPMorgan U.S. Government Money Market | | | | | |
Fund, Capital Shares, 1.83%(b) | | 1,453,726 | | 1,453,726 | |
TOTAL INVESTMENT COMPANIES (Cost $1,453,726) | | | | 1,453,726 | |
| | | | | |
Total Investments (Cost $66,317,165) — 100.0%(c) | | | | 132,389,253 | |
Other assets in excess of liabilities — 0.0% | | | | 29,357 | |
NET ASSETS — 100.0% | | | | $ | 132,418,610 | |
| | | | | | |
(a) Non-income producing security.
(b) Rate disclosed is the seven day yield as of June 30, 2018.
(c) See Federal Tax Information listed in the Notes to the Financial Statements.
ADR American Depositary Receipt
See Notes to Financial Statements
13
Financial Statements | Boston Trust Equity Fund |
STATEMENT OF ASSETS AND LIABILITIES
June 30, 2018 (Unaudited)
Assets: | | | |
Investments, at fair value (cost $66,317,165) | | $ | 132,389,253 | |
Dividends receivable | | 127,920 | |
Receivable for capital shares issued | | 31 | |
Prepaid expenses | | 5,198 | |
Total Assets | | 132,522,402 | |
Liabilities: | | | |
Accrued expenses and other liabilities: | | | |
Investment adviser | | 82,837 | |
Administration and accounting | | 9,459 | |
Chief compliance officer | | 996 | |
Custodian | | 1,728 | |
Shareholder servicing fees | | 300 | |
Transfer agent | | 3,363 | |
Trustee | | 666 | |
Other | | 4,443 | |
Total Liabilities | | 103,792 | |
Net Assets | | $ | 132,418,610 | |
Composition of Net Assets: | | | |
Capital | | $ | 64,730,850 | |
Accumulated undistributed net investment income | | 583,540 | |
Accumulated net realized gains from investment transactions | | 1,032,132 | |
Net unrealized appreciation from investments | | 66,072,088 | |
Net Assets | | $ | 132,418,610 | |
Shares outstanding (par value $0.01, unlimited number of shares authorized) | | 5,565,199 | |
Net Asset Value, Offering Price and Redemption price per share | | $ | 23.79 | |
STATEMENT OF OPERATIONS
For the period ended June 30, 2018 (Unaudited)
Investment Income: | | | |
Dividends | | $ | 1,195,577 | |
Total Investment Income | | 1,195,577 | |
Expenses: | | | |
Investment adviser | | 499,982 | |
Administration and accounting | | 54,884 | |
Chief compliance officer | | 5,936 | |
Custodian | | 8,873 | |
Shareholder servicing | | 1,412 | |
Transfer agency | | 17,048 | |
Trustee | | 3,762 | |
Other | | 23,672 | |
Total expenses | | 615,569 | |
Net Expenses | | 615,569 | |
Net Investment Income | | 580,008 | |
Net Realized/Unrealized Gains (Losses) from Investments: | | | |
Net realized gains from investment transactions | | 580,286 | |
Change in unrealized appreciation/depreciation from investments | | (219,446 | ) |
Net realized/unrealized gains (losses) from investments | | 360,840 | |
Change in Net Assets Resulting from Operations | | $ | 940,848 | |
See Notes to Financial Statements
14
STATEMENTS OF CHANGES IN NET ASSETS
| | For the | | | |
| | six months ended | | For the year ended | |
| | June 30, 2018 | | December 31, 2017 | |
| | (Unaudited) | | | |
Investment Activities: | | | | | |
Operations: | | | | | |
Net investment income | | $ | 580,008 | | $ | 1,294,849 | |
Net realized gains from investment transactions | | 580,286 | | 6,837,726 | |
Change in unrealized appreciation/depreciation from investments | | (219,446 | ) | 15,897,512 | |
Change in Net Assets Resulting from Operations | | 940,848 | | 24,030,087 | |
Dividends: | | | | | |
Net investment income | | — | | (1,291,316 | ) |
Net realized gains from investment transactions | | — | | (2,118,848 | ) |
Change in Net Assets Resulting from Shareholder Dividends | | — | | (3,410,164 | ) |
Capital Share Transactions: | | | | | |
Proceeds from shares issued | | 635,931 | | 3,018,404 | |
Dividends reinvested | | — | | 2,546,279 | |
Cost of shares redeemed | | (3,164,407 | ) | (5,651,405 | ) |
Cost of in-kind shares redeemed(a) | | — | | (5,350,555 | ) |
Change in Net Assets Resulting from Capital Share Transactions | | (2,528,476 | ) | (5,437,277 | ) |
Change in Net Assets | | (1,587,628 | ) | 15,182,646 | |
Net Assets: | | | | | |
Beginning of period | | 134,006,238 | | 118,823,592 | |
End of period | | $ | 132,418,610 | | $ | 134,006,238 | |
Share Transactions: | | | | | |
Issued | | 26,572 | | 139,831 | |
Reinvested | | — | | 107,802 | |
Redeemed | | (132,748 | ) | (260,095 | ) |
Redeemed in-kind(a) | | — | | (231,726 | ) |
Change in shares | | (106,176 | ) | (244,188 | ) |
Accumulated undistributed net investment income | | $ | 583,540 | | $ | 3,532 | |
Amounts designated as “—” are $0 or have been rounded to $0.
(a) See Note 3 in Notes to Financial Statements.
See Notes to Financial Statements
15
FINANCIAL HIGHLIGHTS
Selected data for a share outstanding throughout the periods indicated.
| | | | | | For the nine | | | | | | | |
| | | | For the year | | months | | For the year | | For the year | | For the year | |
| | For the six | | ended | | ended | | ended | | ended | | ended | |
| | months ended | | December 31, | | December 31, | | March 31, | | March 31, | | March 31, | |
| | June 30, 2018 | | 2017 | | 2016 | | 2016 | | 2015 | | 2014 | |
| | (Unaudited) | | | | | | | | | | | |
Net Asset Value, Beginning of Period | | $ | 23.63 | | $ | 20.09 | | $ | 19.70 | | $ | 20.66 | | $ | 19.67 | | $ | 16.85 | |
| | | | | | | | | | | | | |
Investment Activities: | | | | | | | | | | | | | |
Operations: | | | | | | | | | | | | | |
Net investment income | | 0.10 | | 0.23 | | 0.16 | | 0.23 | | 0.19 | | 0.19 | |
Net realized and unrealized gains from investment transactions | | 0.06 | | 3.92 | | 1.58 | | 0.27 | | 1.38 | | 2.81 | |
Total from investment activities | | 0.16 | | 4.15 | | 1.74 | | 0.50 | | 1.57 | | 3.00 | |
Dividends: | | | | | | | | | | | | | |
Net investment income | | — | | (0.23 | ) | (0.20 | ) | (0.24 | ) | (0.19 | ) | (0.18 | ) |
Net realized gains from investments | | — | | (0.38 | ) | (1.15 | ) | (1.22 | ) | (0.39 | ) | — | |
Total dividends | | — | | (0.61 | ) | (1.35 | ) | (1.46 | ) | (0.58 | ) | (0.18 | ) |
| | | | | | | | | | | | | |
Net Asset Value, End of Period | | $ | 23.79 | | $ | 23.63 | | $ | 20.09 | | $ | 19.70 | | $ | 20.66 | | $ | 19.67 | |
| | | | | | | | | | | | | |
Total Return | | 0.68 | %(a) | 20.67 | % | 8.82 | %(a) | 2.59 | % | 8.01 | % | 17.84 | % |
| | | | | | | | | | | | | |
Ratios/Supplemental Data: | | | | | | | | | | | | | |
Net assets at end of period (000’s) | | $ | 132,419 | | $ | 134,006 | | $ | 118,824 | | $ | 110,831 | | $ | 110,664 | | $ | 98,408 | |
Ratio of net expenses to average net assets | | 0.92 | %(b) | 0.93 | % | 0.96 | %(b) | 0.95 | % | 0.94 | % | 0.94 | % |
Ratio of net investment income to average net assets | | 0.87 | %(b) | 1.02 | % | 1.01 | %(b) | 1.14 | % | 0.96 | % | 1.05 | % |
Ratio of expenses (before fee reductions or recoupment of fees previously reimbursed by the investment adviser) to average net assets(c) | | 0.92 | %(b) | 0.93 | % | 0.96 | %(b) | 0.96 | % | 0.95 | % | 0.96 | % |
Portfolio turnover rate | | 1.07 | %(a) | 9.00 | % | 6.65 | %(a) | 18.04 | % | 19.49 | % | 6.29 | % |
Amounts designated as “—” are $0 or have been rounded to $0.
(a) Not annualized for periods less than one year.
(b) Annualized for periods less than one year.
(c) During the periods ending March 31, 2014 through December 31, 2016, certain fees were reduced. If such fee reduction had not occurred, the ratio would have been as indicated.
See Notes to Financial Statements
16
Schedule of Portfolio Investments | Boston Trust Midcap Fund |
| June 30, 2018 |
Security Description | | Shares | | Fair Value ($) | |
COMMON STOCKS (98.9%) | | | | | |
Consumer Discretionary (14.1%) | | | | | |
Dollar General Corp. | | 11,275 | | 1,111,715 | |
Dunkin’ Brands Group, Inc. | | 9,500 | | 656,165 | |
Expedia, Inc. | | 5,000 | | 600,950 | |
Hasbro, Inc. | | 6,125 | | 565,399 | |
Hyatt Hotels Corp., Class A | | 15,850 | | 1,222,828 | |
Omnicom Group, Inc. | | 10,000 | | 762,700 | |
O’Reilly Automotive, Inc. (a) | | 2,750 | | 752,318 | |
Polaris Industries, Inc. | | 5,125 | | 626,172 | |
Ross Stores, Inc. | | 14,125 | | 1,197,093 | |
Service Corp. International | | 18,000 | | 644,220 | |
Williams Sonoma, Inc. | | 10,625 | | 652,163 | |
| | | | 8,791,723 | |
Consumer Staples (6.1%) | | | | | |
Brown-Forman Corp., Class B | | 11,037 | | 540,923 | |
Church & Dwight Co., Inc. | | 19,400 | | 1,031,304 | |
McCormick & Co., Inc. | | 4,125 | | 478,871 | |
The Clorox Co. | | 7,500 | | 1,014,375 | |
The Hershey Co. | | 7,675 | | 714,236 | |
| | | | 3,779,709 | |
Energy (4.1%) | | | | | |
Apache Corp. | | 21,850 | | 1,021,488 | |
Dril-Quip, Inc. (a) | | 12,300 | | 632,219 | |
Helmerich & Payne, Inc. | | 7,025 | | 447,914 | |
Technipfmc PLC | | 14,175 | | 449,915 | |
| | | | 2,551,536 | |
Financials (16.1%) | | | | | |
American Financial Group, Inc. | | 6,000 | | 643,980 | |
Brown & Brown, Inc. | | 24,000 | | 665,520 | |
Commerce Bancshares, Inc. | | 14,900 | | 964,179 | |
Discover Financial Services | | 11,225 | | 790,352 | |
East West Bancorp, Inc. | | 9,700 | | 632,440 | |
Eaton Vance Corp. | | 11,425 | | 596,271 | |
FactSet Research Systems, Inc. | | 5,950 | | 1,178,694 | |
M&T Bank Corp. | | 4,900 | | 833,735 | |
Northern Trust Corp. | | 11,000 | | 1,131,789 | |
SEI Investments Co. | | 10,500 | | 656,460 | |
Signature Bank (a) | | 6,000 | | 767,280 | |
T. Rowe Price Group, Inc. | | 5,650 | | 655,909 | |
W. R. Berkley Corp. | | 8,295 | | 600,641 | |
| | | | 10,117,250 | |
Health Care (13.1%) | | | | | |
Agilent Technologies, Inc. | | 10,000 | | 618,400 | |
Cerner Corp. (a) | | 7,775 | | 464,867 | |
Dentsply Sirona, Inc. | | 10,200 | | 446,454 | |
Henry Schein, Inc. (a) | | 8,575 | | 622,888 | |
Laboratory Corp. of America Holdings (a) | | 4,000 | | 718,120 | |
Mettler-Toledo International, Inc. (a) | | 850 | | 491,836 | |
PerkinElmer, Inc. | | 7,975 | | 584,009 | |
ResMed, Inc. | | 6,500 | | 673,270 | |
STERIS PLC | | 8,000 | | 840,081 | |
The Cooper Companies, Inc. | | 3,425 | | 806,416 | |
Varian Medical Systems, Inc. (a) | | 4,350 | | 494,682 | |
Waters Corp. (a) | | 4,075 | | 788,879 | |
Zimmer Biomet Holdings, Inc. | | 5,450 | | 607,348 | |
| | | | 8,157,250 | |
Industrials (14.6%) | | | | | |
AMETEK, Inc. | | 12,775 | | 921,843 | |
Donaldson Co., Inc. | | 20,650 | | 931,728 | |
Expeditors International of Washington, Inc. | | 6,800 | | 497,080 | |
Hubbell, Inc. | | 7,525 | | 795,694 | |
IDEX Corp. | | 4,200 | | 573,216 | |
Kansas City Southern | | 5,950 | | 630,462 | |
Lincoln Electric Holdings, Inc. | | 6,925 | | 607,738 | |
Nordson Corp. | | 7,800 | | 1,001,597 | |
Roper Technologies, Inc. | | 2,325 | | 641,491 | |
Sensata Technologies Holding PLC (a) | | 11,375 | | 541,223 | |
The Middleby Corp. (a) | | 5,000 | | 522,100 | |
Verisk Analytics, Inc. (a) | | 5,850 | | 629,694 | |
Wabtec Corp. | | 8,300 | | 818,214 | |
| | | | 9,112,080 | |
Information Technology (14.6%) | | | | | |
Akamai Technologies, Inc. (a) | | 8,900 | | 651,747 | |
Amdocs Ltd. | | 11,375 | | 752,911 | |
Amphenol Corp., Class A | | 9,400 | | 819,210 | |
ANSYS, Inc. (a) | | 3,800 | | 661,884 | |
Aspen Technology, Inc. (a) | | 6,600 | | 612,084 | |
Check Point Software Technologies Ltd. (a) | | 5,950 | | 581,196 | |
Citrix Systems, Inc. (a) | | 6,425 | | 673,597 | |
F5 Networks, Inc. (a) | | 7,000 | | 1,207,150 | |
Fiserv, Inc. (a) | | 8,300 | | 614,947 | |
IPG Photonics Corp. (a) | | 2,600 | | 573,638 | |
Juniper Networks, Inc. | | 20,625 | | 565,538 | |
Paychex, Inc. | | 20,200 | | 1,380,669 | |
| | | | 9,094,571 | |
Materials (6.9%) | | | | | |
AptarGroup, Inc. | | 10,400 | | 971,152 | |
Avery Dennison Corp. | | 9,000 | | 918,900 | |
Ball Corp. | | 14,350 | | 510,143 | |
International Flavors & Fragrances, Inc. | | 6,925 | | 858,423 | |
RPM International, Inc. | | 17,675 | | 1,030,806 | |
| | | | 4,289,424 | |
Real Estate (5.4%) | | | | | |
Digital Realty Trust, Inc. | | 5,425 | | 605,322 | |
Host Hotels & Resorts, Inc. | | 31,050 | | 654,224 | |
Jones Lang LaSalle, Inc. | | 4,500 | | 746,955 | |
Lamar Advertising Co., Class A | | 8,600 | | 587,466 | |
Realty Income Corp. | | 14,850 | | 798,781 | |
| | | | 3,392,748 | |
Utilities (3.9%) | | | | | |
American Water Works Co., Inc. | | 5,900 | | 503,742 | |
Consolidated Edison, Inc. | | 6,600 | | 514,668 | |
Eversource Energy | | 13,700 | | 802,957 | |
ONE Gas, Inc. | | 7,925 | | 592,315 | |
| | | | 2,413,682 | |
| | | | | |
TOTAL COMMON STOCKS (Cost $38,874,739) | | | | 61,699,973 | |
| | | | | |
INVESTMENT COMPANIES (1.1%) | | | | | |
| | | | | |
JPMorgan U.S. Government Money Market Fund, Capital Shares, 1.83%(b) | | 685,038 | | 685,038 | |
TOTAL INVESTMENT COMPANIES (Cost $685,038) | | | | 685,038 | |
| | | | | |
Total Investments (Cost $39,559,777) — 100.0%(c) | | | | 62,385,011 | |
Liabilities in excess of other assets — 0.0% | | | | (2,834 | ) |
NET ASSETS — 100.0% | | | | $ | 62,382,177 | |
| | | | | | |
(a) Non-income producing security.
(b) Rate disclosed is the seven day yield as of June 30, 2018.
(c) See Federal Tax Information listed in the Notes to the Financial Statements.
See Notes to Financial Statements
17
Financial Statements | Boston Trust Midcap Fund |
STATEMENT OF ASSETS AND LIABILITIES
June 30, 2018 (Unaudited)
Assets: | | | | |
Investments, at fair value (cost $39,559,777) | | $ | 62,385,011 | |
Dividends receivable | | 40,563 | |
Receivable for tax reclaims | | 539 | |
Prepaid expenses | | 7,171 | |
Total Assets | | 62,433,284 | |
Liabilities: | | | |
Accrued expenses and other liabilities: | | | |
Investment adviser | | 39,562 | |
Administration and accounting | | 4,184 | |
Chief compliance officer | | 428 | |
Custodian | | 732 | |
Shareholder servicing fees | | 753 | |
Transfer agent | | 3,207 | |
Trustee | | 286 | |
Other | | 1,955 | |
Total Liabilities | | 51,107 | |
Net Assets | | $ | 62,382,177 | |
Composition of Net Assets: | | | |
Capital | | $ | 36,760,849 | |
Accumulated undistributed net investment income | | 158,883 | |
Accumulated net realized gains from investment transactions | | 2,637,211 | |
Net unrealized appreciation from investments | | 22,825,234 | |
Net Assets | | $ | 62,382,177 | |
Shares outstanding (par value $0.01, unlimited number of shares authorized) | | 3,529,227 | |
Net Asset Value, Offering Price and Redemption price per share | | $ | 17.68 | |
STATEMENT OF OPERATIONS
For the period ended June 30, 2018 (Unaudited)
Investment Income: | | | |
Dividends | | $ | 466,283 | |
Total Investment Income | | 466,283 | |
Expenses: | | | |
Investment adviser | | 230,592 | |
Administration and accounting | | 25,662 | |
Chief compliance officer | | 2,768 | |
Custodian | | 4,112 | |
Shareholder servicing | | 2,949 | |
Transfer agency | | 17,048 | |
Trustee | | 1,753 | |
Other | | 14,723 | |
Recoupment of prior expenses reimbursed by the investment adviser | | 7,793 | |
Total expenses | | 307,400 | |
Net Expenses | | 307,400 | |
Net Investment Income | | 158,883 | |
Net Realized/Unrealized Gains (Losses) from Investments: | | | |
Net realized gains from investment transactions | | 1,805,828 | |
Change in unrealized appreciation/depreciation from investments | | (495,770 | ) |
Net realized/unrealized gains (losses) from investments | | 1,310,058 | |
Change in Net Assets Resulting from Operations | | $ | 1,468,941 | |
See Notes to Financial Statements
18
STATEMENTS OF CHANGES IN NET ASSETS
| | For the | | | |
| | six months ended | | For the year ended | |
| | June 30, 2018 | | December 31, 2017 | |
| | (Unaudited) | | | |
Investment Activities: | | | | | |
Operations: | | | | | |
Net investment income | | $ | 158,883 | | $ | 254,744 | |
Net realized gains from investment transactions | | 1,805,828 | | 3,948,758 | |
Change in unrealized appreciation/depreciation from investments | | (495,770 | ) | 6,095,730 | |
Change in Net Assets Resulting from Operations | | 1,468,941 | | 10,299,232 | |
Dividends: | | | | | |
Net investment income | | — | | (271,407 | ) |
Net realized gains from investment transactions | | — | | (3,587,314 | ) |
Change in Net Assets Resulting from Shareholder Dividends | | — | | (3,858,721 | ) |
Capital Share Transactions: | | | | | |
Proceeds from shares issued | | 825,015 | | 3,134,848 | |
Dividends reinvested | | — | | 3,284,122 | |
Cost of shares redeemed | | (1,459,693 | ) | (1,806,705 | ) |
Change in Net Assets Resulting from Capital Share Transactions | | (634,678 | ) | 4,612,265 | |
Change in Net Assets | | 834,263 | | 11,052,776 | |
Net Assets: | | | | | |
Beginning of period | | 61,547,914 | | 50,495,138 | |
End of period | | $ | 62,382,177 | | $ | 61,547,914 | |
Share Transactions: | | | | | |
Issued | | 46,700 | | 190,996 | |
Reinvested | | — | | 191,942 | |
Redeemed | | (83,724 | ) | (107,853 | ) |
Change in shares | | (37,024 | ) | 275,085 | |
Accumulated undistributed net investment income | | $ | 158,883 | | $ | — | |
Amounts designated as “—” are $0 or have been rounded to $0.
See Notes to Financial Statements
19
FINANCIAL HIGHLIGHTS
Selected data for a share outstanding throughout the periods indicated.
| | | | | | For the nine | | | | | | | |
| | | | For the year | | months | | For the year | | For the year | | For the year | |
| | For the six | | ended | | ended | | ended | | ended | | ended | |
| | months ended | | December 31, | | December 31, | | March 31, | | March 31, | | March 31, | |
| | June 30, 2018 | | 2017 | | 2016 | | 2016 | | 2015 | | 2014 | |
| | (Unaudited) | | | | | | | | | | | |
Net Asset Value, Beginning of Period | | $ | 17.26 | | $ | 15.34 | | $ | 15.29 | | $ | 16.12 | | $ | 15.03 | | $ | 13.08 | |
| | | | | | | | | | | | | |
Investment Activities: | | | | | | | | | | | | | |
Operations: | | | | | | | | | | | | | |
Net investment income | | 0.05 | | 0.08 | | 0.12 | | 0.09 | | 0.05 | | 0.04 | |
Net realized and unrealized gains from investment transactions | | 0.37 | | 2.98 | | 1.01 | | 0.05 | | 1.82 | | 2.30 | |
Total from investment activities | | 0.42 | | 3.06 | | 1.13 | | 0.14 | | 1.87 | | 2.34 | |
Dividends: | | | | | | | | | | | | | |
Net investment income | | — | | (0.08 | ) | (0.13 | ) | (0.09 | ) | (0.05 | ) | (0.04 | ) |
Net realized gains from investments | | — | | (1.06 | ) | (0.95 | ) | (0.88 | ) | (0.73 | ) | (0.35 | ) |
Total dividends | | — | | (1.14 | ) | (1.08 | ) | (0.97 | ) | (0.78 | ) | (0.39 | ) |
| | | | | | | | | | | | | |
Net Asset Value, End of Period | | $ | 17.68 | | $ | 17.26 | | $ | 15.34 | | $ | 15.29 | | $ | 16.12 | | $ | 15.03 | |
Total Return | | 2.43 | %(a) | 20.01 | % | 7.29 | %(a) | 1.07 | % | 12.65 | % | 18.02 | % |
| | | | | | | | | | | | | |
Ratios/Supplemental Data: | | | | | | | | | | | | | |
Net assets at end of period (000’s) | | $ | 62,382 | | $ | 61,548 | | $ | 50,495 | | $ | 47,941 | | $ | 47,682 | | $ | 41,793 | |
Ratio of net expenses to average net assets | | 1.00 | %(b) | 1.00 | % | 1.00 | %(b) | 1.00 | % | 1.00 | % | 1.00 | % |
Ratio of net investment income to average net assets | | 0.52 | %(b) | 0.46 | % | 0.99 | %(b) | 0.58 | % | 0.34 | % | 0.30 | % |
Ratio of expenses (before fee reductions or recoupment of fees previously reimbursed by the investment adviser) to average net assets(c) | | 1.00 | %(b) | 0.98 | % | 1.02 | %(b) | 1.03 | % | 1.02 | % | 1.01 | % |
Portfolio turnover rate | | 9.11 | %(a) | 23.22 | % | 14.53 | %(a) | 21.02 | % | 15.76 | % | 16.09 | % |
Amounts designated as “—” are $0 or have been rounded to $0.
(a) Not annualized for periods less than one year.
(b) Annualized for periods less than one year.
(c) During the periods, certain fees were reduced or recouped by the investment adviser. If such fee reductions/recoupments had not occurred, the ratio would have been as indicated.
See Notes to Financial Statements
20
Schedule of Portfolio Investments | Boston Trust SMID Cap Fund |
| June 30, 2018 |
Security Description | | Shares | | Fair Value ($) | |
COMMON STOCKS (99.0%) | | | | | |
Consumer Discretionary (12.4%) | | | | | |
Big Lots, Inc. | | 14,900 | | 622,522 | |
Brinker International, Inc. | | 12,600 | | 599,760 | |
Cheesecake Factory, Inc. | | 16,500 | | 908,490 | |
Choice Hotels International, Inc. | | 11,500 | | 869,400 | |
Dorman Products, Inc. (a) | | 10,200 | | 696,762 | |
Dunkin’ Brands Group, Inc. | | 8,200 | | 566,374 | |
Interpublic Group of Cos., Inc. | | 25,000 | | 586,000 | |
Nordstrom, Inc. | | 12,000 | | 621,360 | |
Polaris Industries, Inc. | | 4,500 | | 549,810 | |
Service Corp. International | | 27,675 | | 990,488 | |
Texas Roadhouse, Inc. | | 11,600 | | 759,916 | |
Tiffany & Co. | | 6,000 | | 789,600 | |
Williams Sonoma, Inc. | | 10,275 | | 630,680 | |
| | | | 9,191,162 | |
Consumer Staples (3.9%) | | | | | |
Church & Dwight Co., Inc. | | 22,100 | | 1,174,836 | |
Flowers Foods, Inc. | | 36,700 | | 764,461 | |
Lancaster Colony Corp. | | 3,975 | | 550,220 | |
Tootsie Roll Industries, Inc. | | 13,200 | | 407,220 | |
| | | | 2,896,737 | |
Energy (3.9%) | | | | | |
Apache Corp. | | 15,600 | | 729,300 | |
Dril-Quip, Inc. (a) | | 12,900 | | 663,060 | |
Helmerich & Payne, Inc. | | 13,000 | | 828,880 | |
National Oilwell Varco, Inc. | | 15,100 | | 655,340 | |
| | | | 2,876,580 | |
Financials (17.1%) | | | | | |
American Financial Group, Inc. | | 7,300 | | 783,509 | |
Bank of Hawaii Corp. | | 10,300 | | 859,226 | |
Brown & Brown, Inc. | | 29,500 | | 818,035 | |
Cincinnati Financial Corp. | | 8,250 | | 551,595 | |
Cohen & Steers, Inc. | | 12,900 | | 538,059 | |
Commerce Bancshares, Inc. | | 12,640 | | 817,934 | |
CVB Financial Corp. | | 22,400 | | 502,208 | |
East West Bancorp, Inc. | | 11,200 | | 730,240 | |
Eaton Vance Corp. | | 14,500 | | 756,755 | |
Everest Re Group Ltd. | | 2,700 | | 622,296 | |
FactSet Research Systems, Inc. | | 4,800 | | 950,880 | |
SEI Investments Co. | | 12,400 | | 775,248 | |
Signature Bank (a) | | 8,800 | | 1,125,344 | |
SVB Financial Group (a) | | 2,300 | | 664,148 | |
Texas Capital Bancshares, Inc. (a) | | 5,825 | | 532,988 | |
UMB Financial Corp. | | 11,600 | | 884,268 | |
W. R. Berkley Corp. | | 9,200 | | 666,172 | |
| | | | 12,578,905 | |
Health Care (12.4%) | | | | | |
Chemed Corp. | | 2,875 | | 925,204 | |
Dentsply Sirona, Inc. | | 13,100 | | 573,387 | |
Henry Schein, Inc. (a) | | 7,400 | | 537,536 | |
Masimo Corp. (a) | | 10,300 | | 1,005,794 | |
Mettler-Toledo International, Inc. (a) | | 1,050 | | 607,562 | |
PerkinElmer, Inc. | | 12,300 | | 900,729 | |
ResMed, Inc. | | 9,600 | | 994,368 | |
STERIS PLC | | 7,900 | | 829,579 | |
The Cooper Companies, Inc. | | 3,700 | | 871,165 | |
Varian Medical Systems, Inc. (a) | | 6,700 | | 761,924 | |
Waters Corp. (a) | | 6,100 | | 1,180,899 | |
| | | | 9,188,147 | |
Industrials (16.7%) | | | | | |
Applied Industrial Technologies, Inc. | | 14,200 | | 996,130 | |
C.H. Robinson Worldwide, Inc. | | 7,725 | | 646,274 | |
Donaldson Co., Inc. | | 24,500 | | 1,105,439 | |
Expeditors International of Washington, Inc. | | 14,400 | | 1,052,640 | |
Franklin Electric Co., Inc. | | 9,100 | | 410,410 | |
Hexcel Corp. | | 8,000 | | 531,040 | |
Hubbell, Inc. | | 8,325 | | 880,286 | |
IDEX Corp. | | 4,900 | | 668,752 | |
Kansas City Southern | | 5,100 | | 540,396 | |
Lincoln Electric Holdings, Inc. | | 10,000 | | 877,600 | |
Nordson Corp. | | 8,500 | | 1,091,485 | |
Sensata Technologies Holding PLC (a) | | 15,400 | | 732,732 | |
The Middleby Corp. (a) | | 5,300 | | 553,426 | |
UniFirst Corp. | | 4,200 | | 742,980 | |
Valmont Industries, Inc. | | 4,100 | | 618,075 | |
Wabtec Corp. | | 9,150 | | 902,007 | |
| | | | 12,349,672 | |
Information Technology (15.4%) | | | | | |
Akamai Technologies, Inc. (a) | | 13,200 | | 966,636 | |
Amdocs Ltd. | | 14,400 | | 953,136 | |
ANSYS, Inc. (a) | | 5,900 | | 1,027,662 | |
Aspen Technology, Inc. (a) | | 11,450 | | 1,061,873 | |
Coherent, Inc. (a) | | 2,500 | | 391,050 | |
F5 Networks, Inc. (a) | | 8,300 | | 1,431,335 | |
InterDigital, Inc. | | 6,100 | | 493,490 | |
IPG Photonics Corp. (a) | | 4,200 | | 926,646 | |
Jack Henry & Associates, Inc. | | 6,425 | | 837,563 | |
Juniper Networks, Inc. | | 27,500 | | 754,050 | |
NetApp, Inc. | | 4,825 | | 378,907 | |
NETGEAR, Inc. (a) | | 12,800 | | 800,000 | |
Tech Data Corp. (a) | | 7,650 | | 628,218 | |
Teradata Corp. (a) | | 17,800 | | 714,670 | |
| | | | 11,365,236 | |
Materials (6.0%) | | | | | |
AptarGroup, Inc. | | 11,400 | | 1,064,532 | |
Avery Dennison Corp. | | 7,700 | | 786,170 | |
International Flavors & Fragrances, Inc. | | 6,500 | | 805,740 | |
RPM International, Inc. | | 21,100 | | 1,230,552 | |
Silgan Holdings, Inc. | | 20,300 | | 544,649 | |
| | | | 4,431,643 | |
Real Estate (7.1%) | | | | | |
American Campus Communities, Inc. | | 7,925 | | 339,824 | |
Camden Property Trust | | 8,300 | | 756,379 | |
CoreSite Realty Corp. | | 9,600 | | 1,063,872 | |
CubeSmart | | 20,200 | | 650,844 | |
Jones Lang LaSalle, Inc. | | 5,200 | | 863,148 | |
Lamar Advertising Co., Class A | | 11,200 | | 765,072 | |
Ryman Hospitality Properties, Inc. | | 9,600 | | 798,240 | |
| | | | 5,237,379 | |
Utilities (4.1%) | | | | | |
American States Water Co. | | 9,700 | | 554,452 | |
Atmos Energy Corp. | | 9,100 | | 820,274 | |
New Jersey Resources Corp. | | 15,900 | | 711,525 | |
ONE Gas, Inc. | | 12,500 | | 934,250 | |
| | | | 3,020,501 | |
| | | | | |
TOTAL COMMON STOCKS (Cost $64,947,963) | | | | 73,135,962 | |
| | | | | |
INVESTMENT COMPANIES (1.0%) | | | | | |
JPMorgan U.S. Government Money Market | | | | | |
Fund, Capital Shares, 1.83%(b) | | 747,983 | | 747,983 | |
TOTAL INVESTMENT COMPANIES (Cost $747,983) | | | | 747,983 | |
| | | | | |
Total Investments (Cost $65,695,946) — 100.0%(c) | | | | 73,883,945 | |
Liabilities in excess of other assets — 0.0% | | | | (35,193 | ) |
NET ASSETS — 100.0% | | | | $ | 73,848,752 | |
| | | | | | |
(a) Non-income producing security.
(b) Rate disclosed is the seven day yield as of June 30, 2018.
(c) See Federal Tax Information listed in the Notes to the Financial Statements.
See Notes to Financial Statements
21
Financial Statements | Boston Trust SMID Cap Fund |
STATEMENT OF ASSETS AND LIABILITIES
June 30, 2018 (Unaudited)
Assets: | | | |
Investments, at fair value (cost $65,695,946) | | $ | 73,883,945 | |
Dividends receivable | | 64,376 | |
Receivable for capital shares issued | | 61,298 | |
Prepaid expenses | | 6,958 | |
Total Assets | | 74,016,577 | |
Liabilities: | | | |
Payable for capital shares redeemed | | 130,169 | |
Accrued expenses and other liabilities: | | | |
Investment adviser | | 31,649 | |
Administration and accounting | | 2,850 | |
Chief compliance officer | | 146 | |
Custodian | | 244 | |
Shareholder servicing fees | | 4 | |
Transfer agent | | 2,021 | |
Trustee | | 98 | |
Other | | 644 | |
Total Liabilities | | 167,825 | |
Net Assets | | $ | 73,848,752 | |
Composition of Net Assets: | | | |
Capital | | $ | 64,983,116 | |
Accumulated undistributed net investment income | | 278,931 | |
Accumulated net realized gains from investment transactions | | 398,706 | |
Net unrealized appreciation from investments | | 8,187,999 | |
Net Assets | | $ | 73,848,752 | |
Shares outstanding (par value $0.01, unlimited number of shares authorized) | | 4,502,796 | |
Net Asset Value, Offering Price and Redemption price per share | | $ | 16.40 | |
STATEMENT OF OPERATIONS
For the period ended June 30, 2018 (Unaudited)
Investment Income: | | | |
Dividends | | $ | 539,910 | |
Total Investment Income | | 539,910 | |
Expenses: | | | |
Investment adviser | | 260,619 | |
Administration and accounting | | 28,717 | |
Chief compliance officer | | 3,064 | |
Custodian | | 4,611 | |
Transfer agency | | 16,749 | |
Trustee | | 1,903 | |
Other | | 21,281 | |
Total expenses before fee reductions | | 336,944 | |
Fees contractually reduced by the investment adviser | | (75,965 | ) |
Net Expenses | | 260,979 | |
Net Investment Income | | 278,931 | |
Net Realized/Unrealized Gains (Losses) from Investments: | | | |
Net realized gains from investment transactions | | 230,871 | |
Change in unrealized appreciation/depreciation from investments | | 1,690,174 | |
Net realized/unrealized gains (losses) from investments | | 1,921,045 | |
Change in Net Assets Resulting from Operations | | $ | 2,199,976 | |
See Notes to Financial Statements
22
STATEMENTS OF CHANGES IN NET ASSETS
| | For the | | | |
| | six months ended | | For the year ended | |
| | June 30, 2018 | | December 31, 2017 | |
| | (Unaudited) | | | |
Investment Activities: | | | | | |
Operations: | | | | | |
Net investment income | | $ | 278,931 | | $ | 253,128 | |
Net realized gains from investment transactions | | 230,871 | | 511,700 | |
Change in unrealized appreciation/depreciation from investments | | 1,690,174 | | 5,147,292 | |
Change in Net Assets Resulting from Operations | | 2,199,976 | | 5,912,120 | |
Dividends: | | | | | |
Net investment income | | — | | (261,257 | ) |
Net realized gains from investment transactions | | — | | (327,372 | ) |
Change in Net Assets Resulting from Shareholder Dividends | | — | | (588,629 | ) |
Capital Share Transactions: | | | | | |
Proceeds from shares issued | | 17,831,910 | | 49,339,156 | |
Dividends reinvested | | — | | 574,905 | |
Cost of shares redeemed | | (2,625,747 | ) | (5,305,384 | ) |
Change in Net Assets Resulting from Capital Share Transactions | | 15,206,163 | | 44,608,677 | |
Change in Net Assets | | 17,406,139 | | 49,932,168 | |
Net Assets: | | | | | |
Beginning of period | | 56,442,613 | | 6,510,445 | |
End of period | | $ | 73,848,752 | | $ | 56,442,613 | |
Share Transactions: | | | | | |
Issued | | 1,089,369 | | 3,417,299 | |
Reinvested | | — | | 36,806 | |
Redeemed | | (161,761 | ) | (361,781 | ) |
Change in shares | | 927,608 | | 3,092,324 | |
Accumulated undistributed net investment income | | $ | 278,931 | | $ | — | |
Amounts designated as “—” are $0 or have been rounded to $0.
See Notes to Financial Statements
23
FINANCIAL HIGHLIGHTS
Selected data for a share outstanding throughout the periods indicated.
| | | | | | For the nine | | | | | | | |
| | | | For the year | | months | | For the year | | For the year | | For the year | |
| | For the six | | ended | | ended | | ended | | ended | | ended | |
| | months ended | | December 31, | | December 31, | | March 31, | | March 31, | | March 31, | |
| | June 30, 2018 | | 2017 | | 2016 | | 2016 | | 2015 | | 2014 | |
| | (Unaudited) | | | | | | | | | | | |
Net Asset Value, Beginning of Period | | $ | 15.79 | | $ | 13.48 | | $ | 12.49 | | $ | 13.72 | | $ | 13.49 | | $ | 12.05 | |
| | | | | | | | | | | | | |
Investment Activities: | | | | | | | | | | | | | |
Operations: | | | | | | | | | | | | | |
Net investment income/(loss) | | 0.06 | | 0.07 | | 0.13 | | 0.06 | | 0.01 | | (0.01 | ) |
Net realized and unrealized gains (losses) from investment transactions | | 0.55 | | 2.41 | | 1.72 | | (0.41 | ) | 0.97 | | 2.40 | |
Total from investment activities | | 0.61 | | 2.48 | | 1.85 | | (0.35 | ) | 0.98 | | 2.39 | |
Dividends: | | | | | | | | | | | | | |
Net investment income | | — | | (0.08 | ) | (0.15 | ) | (0.04 | ) | — | | — | |
Net realized gains from investments | | — | | (0.09 | ) | (0.71 | ) | (0.84 | ) | (0.75 | ) | (0.95 | ) |
Total dividends | | — | | (0.17 | ) | (0.86 | ) | (0.88 | ) | (0.75 | ) | (0.95 | ) |
| | | | | | | | | | | | | |
Net Asset Value, End of Period | | $ | 16.40 | | $ | 15.79 | | $ | 13.48 | | $ | 12.49 | | $ | 13.72 | | $ | 13.49 | |
| | | | | | | | | | | | | |
Total Return | | 3.86 | %(a) | 18.39 | % | 14.67 | %(a) | (2.34 | )% | 7.69 | % | 20.05 | % |
| | | | | | | | | | | | | |
Ratios/Supplemental Data: | | | | | | | | | | | | | |
Net assets at end of period (000’s) | | $ | 73,849 | | $ | 56,443 | | $ | 6,510 | | $ | 5,589 | | $ | 5,386 | | $ | 4,808 | |
Ratio of net expenses to average net assets | | 0.75 | %(b) | 0.75 | % | 0.75 | %(b) | 0.79 | %(c) | 1.00 | % | 1.00 | % |
Ratio of net investment income/(loss) to average net assets | | 0.80 | %(b) | 0.85 | % | 1.31 | %(b) | 0.49 | % | 0.09 | % | (0.06 | )% |
Ratio of expenses (before fee reductions or recoupment of fees previously reimbursed by the investment adviser) to average net assets(d) | | 0.97 | %(b) | 1.04 | % | 1.61 | %(b) | 1.73 | % | 1.73 | % | 1.59 | % |
Portfolio turnover rate | | 8.03 | %(a) | 37.44 | % | 22.69 | %(a) | 50.15 | % | 33.07 | % | 35.97 | % |
Amounts designated as “—” are $0 or have been rounded to $0.
(a) Not annualized for periods less than one year.
(b) Annualized for periods less than one year.
(c) The net expense ratio shown for the period presented represents the blended ratio of the current expense limit in effect as of June 1, 2015 and the higher expense limit in effect prior to that date.
(d) During the periods, certain fees were reduced. If such fee reduction had not occurred, the ratio would have been as indicated.
See Notes to Financial Statements
24
Schedule of Portfolio Investments | | Boston Trust Small Cap Fund |
| | June 30, 2018 |
Security Description | | Shares | | Fair Value ($) | |
COMMON STOCKS (99.3%) | | | | | |
Consumer Discretionary (10.8%) | | | | | |
Big Lots, Inc. | | 63,500 | | 2,653,030 | |
Brinker International, Inc. | | 48,000 | | 2,284,800 | |
Cheesecake Factory, Inc. | | 61,500 | | 3,386,190 | |
Choice Hotels International, Inc. | | 65,800 | | 4,974,481 | |
Dorman Products, Inc. (a) | | 51,075 | | 3,488,933 | |
Dunkin’ Brands Group, Inc. | | 32,375 | | 2,236,141 | |
Gentherm, Inc. (a) | | 42,600 | | 1,674,180 | |
Monro Muffler Brake, Inc. | | 52,200 | | 3,032,820 | |
Texas Roadhouse, Inc. | | 64,300 | | 4,212,293 | |
Williams Sonoma, Inc. | | 54,400 | | 3,339,072 | |
| | | | 31,281,940 | |
Consumer Staples (4.4%) | | | | | |
Flowers Foods, Inc. | | 143,700 | | 2,993,271 | |
Lancaster Colony Corp. | | 21,400 | | 2,962,188 | |
Sanderson Farms, Inc. | | 11,500 | | 1,209,225 | |
The Boston Beer Co., Inc., Class A (a) | | 13,300 | | 3,986,010 | |
Tootsie Roll Industries, Inc. | | 50,612 | | 1,561,380 | |
| | | | 12,712,074 | |
Energy (2.8%) | | | | | |
Dril-Quip, Inc. (a) | | 41,500 | | 2,133,100 | |
Forum Energy Technologies, Inc. (a) | | 164,000 | | 2,025,400 | |
Natural Gas Services Group, Inc. (a) | | 49,600 | | 1,170,560 | |
Oceaneering International, Inc. | | 49,000 | | 1,247,540 | |
RPC, Inc. | | 105,200 | | 1,532,764 | |
| | | | 8,109,364 | |
Financials (18.2%) | | | | | |
1st Source Corp. | | 52,400 | | 2,799,732 | |
Artisan Partners Asset Management, Inc., Class A | | 59,300 | | 1,787,895 | |
Bank of Hawaii Corp. | | 54,050 | | 4,508,850 | |
Bridge BanCorp, Inc. | | 40,100 | | 1,441,595 | |
Bryn Mawr Bank Corp. | | 20,000 | | 926,000 | |
Camden National Corp. | | 39,700 | | 1,814,687 | |
Cohen & Steers, Inc. | | 64,000 | | 2,669,440 | |
Commerce Bancshares, Inc. | | 58,525 | | 3,787,153 | |
CVB Financial Corp. | | 91,100 | | 2,042,462 | |
Eaton Vance Corp. | | 81,600 | | 4,258,704 | |
German American BanCorp | | 39,900 | | 1,430,415 | |
Horace Mann Educators Corp. | | 39,400 | | 1,757,240 | |
Independent Bank Corp. | | 29,000 | | 2,273,600 | |
Lakeland Financial Corp. | | 47,575 | | 2,292,639 | |
Morningstar, Inc. | | 42,650 | | 5,469,863 | |
Texas Capital Bancshares, Inc. (a) | | 27,400 | | 2,507,100 | |
Tompkins Financial Corp. | | 35,700 | | 3,065,916 | |
UMB Financial Corp. | | 54,100 | | 4,124,043 | |
Washington Federal, Inc. | | 71,600 | | 2,341,320 | |
Washington Trust BanCorp, Inc. | | 26,900 | | 1,562,890 | |
| | | | 52,861,544 | |
Health Care (16.0%) | | | | | |
Anika Therapeutics, Inc. (a) | | 45,100 | | 1,443,200 | |
Atrion Corp. | | 2,700 | | 1,618,380 | |
Bio-Techne Corp. | | 30,850 | | 4,564,258 | |
Bruker Corp. | | 137,400 | | 3,990,096 | |
Charles River Laboratories International, Inc. (a) | | 36,100 | | 4,052,586 | |
Chemed Corp. | | 17,300 | | 5,567,313 | |
CorVel Corp. (a) | | 25,300 | | 1,366,200 | |
Ensign Group, Inc. | | 80,900 | | 2,897,838 | |
Globus Medical, Inc., Class A (a) | | 67,000 | | 3,380,820 | |
Haemonetics Corp. (a) | | 46,300 | | 4,152,184 | |
Hill-Rom Holdings, Inc. | | 42,700 | | 3,729,418 | |
Masimo Corp. (a) | | 55,600 | | 5,429,340 | |
U.S. Physical Therapy, Inc. | | 42,400 | | 4,070,400 | |
| | | | 46,262,033 | |
Industrials (16.1%) | | | | | |
Applied Industrial Technologies, Inc. | | 61,900 | | 4,342,285 | |
Donaldson Co., Inc. | | 106,200 | | 4,791,743 | |
Forward Air Corp. | | 50,700 | | 2,995,356 | |
Franklin Electric Co., Inc. | | 93,550 | | 4,219,105 | |
Herman Miller, Inc. | | 76,000 | | 2,576,400 | |
Hub Group, Inc., Class A (a) | | 85,500 | | 4,257,900 | |
Kadant, Inc. | | 28,900 | | 2,778,735 | |
Landstar System, Inc. | | 37,350 | | 4,078,620 | |
Lincoln Electric Holdings, Inc. | | 48,400 | | 4,247,584 | |
Tennant Co. | | 32,500 | | 2,567,500 | |
UniFirst Corp. | | 25,100 | | 4,440,190 | |
Valmont Industries, Inc. | | 16,650 | | 2,509,988 | |
Watts Water Technologies, Inc., Class A | | 35,800 | | 2,806,720 | |
| | | | 46,612,126 | |
Information Technology (16.4%) | | | | | |
Aspen Technology, Inc. (a) | | 52,750 | | 4,892,035 | |
Coherent, Inc. (a) | | 19,400 | | 3,034,548 | |
CSG Systems International, Inc. | | 53,000 | | 2,166,110 | |
ExlService Holdings, Inc. (a) | | 43,500 | | 2,462,535 | |
InterDigital, Inc. | | 46,500 | | 3,761,850 | |
Manhattan Associates, Inc. (a) | | 62,400 | | 2,933,424 | |
NETGEAR, Inc. (a) | | 79,600 | | 4,975,000 | |
NIC, Inc. | | 246,700 | | 3,836,185 | |
Plantronics, Inc. | | 41,700 | | 3,179,625 | |
Power Integrations, Inc. | | 39,700 | | 2,900,085 | |
Syntel, Inc. (a) | | 110,475 | | 3,545,143 | |
Tech Data Corp. (a) | | 44,600 | | 3,662,552 | |
Teradata Corp. (a) | | 107,000 | | 4,296,049 | |
WEX, Inc. (a) | | 10,700 | | 2,038,136 | |
| | | | 47,683,277 | |
Materials (5.4%) | | | | | |
AptarGroup, Inc. | | 52,600 | | 4,911,788 | |
Bemis Co., Inc. | | 70,000 | | 2,954,700 | |
Minerals Technologies, Inc. | | 36,000 | | 2,712,600 | |
Quaker Chemical Corp. | | 13,800 | | 2,137,206 | |
Silgan Holdings, Inc. | | 103,900 | | 2,787,637 | |
| | | | 15,503,931 | |
Real Estate (4.7%) | | | | | |
CoreSite Realty Corp. | | 38,900 | | 4,310,898 | |
CubeSmart | | 98,500 | | 3,173,670 | |
Highwoods Properties, Inc. | | 48,700 | | 2,470,551 | |
Ryman Hospitality Properties, Inc. | | 44,150 | | 3,671,073 | |
| | | | 13,626,192 | |
Utilities (4.5%) | | | | | |
American States Water Co. | | 34,600 | | 1,977,736 | |
Hawaiian Electric Industries, Inc. | | 72,600 | | 2,490,180 | |
New Jersey Resources Corp. | | 77,300 | | 3,459,175 | |
ONE Gas, Inc. | | 67,600 | | 5,052,424 | |
| | | | 12,979,515 | |
| | | | | |
TOTAL COMMON STOCKS (Cost $196,972,276) | | | | 287,631,996 | |
| | | | | |
INVESTMENT COMPANIES (0.7%) | | | | | |
| | | | | |
JPMorgan U.S. Government Money Market | | | | | |
Fund, Capital Shares, 1.83%(b) | | 1,895,610 | | 1,895,610 | |
TOTAL INVESTMENT COMPANIES (Cost $1,895,610) | | | | 1,895,610 | |
| | | | | |
Total Investments (Cost $198,867,886) — 100.0%(c) | | | | 289,527,606 | |
Other assets in excess of liabilities — 0.0% | | | | 60,215 | |
NET ASSETS — 100.0% | | | | $ | 289,587,821 | |
| | | | | | |
(a) Non-income producing security.
(b) Rate disclosed is the seven day yield as of June 30, 2018.
(c) See Federal Tax Information listed in the Notes to the Financial Statements.
See Notes to Financial Statements
25
Financial Statements | | Boston Trust Small Cap Fund |
STATEMENT OF ASSETS AND LIABILITIES
June 30, 2018 (Unaudited)
Assets: | | | |
Investments, at fair value (cost $198,867,886) | | $ | 289,527,606 | |
Dividends receivable | | 231,341 | |
Receivable for capital shares issued | | 148,568 | |
Prepaid expenses | | 10,639 | |
Total Assets | | 289,918,154 | |
Liabilities: | | | |
Payable for capital shares redeemed | | 36,342 | |
Accrued expenses and other liabilities: | | | |
Investment adviser | | 159,280 | |
Administration and accounting | | 26,765 | |
Chief compliance officer | | 3,083 | |
Custodian | | 5,133 | |
Shareholder servicing fees | | 76,232 | |
Transfer agent | | 4,915 | |
Trustee | | 2,059 | |
Other | | 16,524 | |
Total Liabilities | | 330,333 | |
Net Assets | | $ | 289,587,821 | |
Composition of Net Assets: | | | |
Capital | | $ | 170,559,472 | |
Accumulated undistributed net investment income | | 1,096,049 | |
Accumulated net realized gains from investment transactions | | 27,272,580 | |
Net unrealized appreciation from investments | | 90,659,720 | |
Net Assets | | $ | 289,587,821 | |
Shares outstanding (par value $0.01, unlimited number of shares authorized) | | 18,697,085 | |
Net Asset Value, Offering Price and Redemption price per share | | $ | 15.49 | |
STATEMENT OF OPERATIONS
For the period ended June 30, 2018 (Unaudited)
Investment Income: | | | |
Dividends | | $ | 2,376,873 | |
Total Investment Income | | 2,376,873 | |
Expenses: | | | |
Investment adviser | | 1,103,557 | |
Administration and accounting | | 126,728 | |
Chief compliance officer | | 14,195 | |
Custodian | | 19,925 | |
Shareholder servicing | | 293,286 | |
Transfer agency | | 20,319 | |
Trustee | | 9,177 | |
Other | | 68,198 | |
Total expenses before fee reductions | | 1,655,385 | |
Fees contractually reduced by the investment adviser | | (186,066 | ) |
Net Expenses | | 1,469,319 | |
Net Investment Income | | 907,554 | |
Net Realized/Unrealized Gains (Losses) from Investments: | | | |
Net realized gains from investment transactions | | 27,754,157 | |
Change in unrealized appreciation/depreciation from investments | | (10,898,133 | ) |
Net realized/unrealized gains (losses) from investments | | 16,856,024 | |
Change in Net Assets Resulting from Operations | | $ | 17,763,578 | |
See Notes to Financial Statements
26
STATEMENTS OF CHANGES IN NET ASSETS
| | For the | | | |
| | six months ended | | For the year ended | |
| | June 30, 2018 | | December 31, 2017 | |
| | (Unaudited) | | | |
Investment Activities: | | | | | |
Operations: | | | | | |
Net investment income | | $ | 907,554 | | $ | 1,583,070 | |
Net realized gains from investment transactions | | 27,754,157 | | 16,055,505 | |
Change in unrealized appreciation/depreciation from investments | | (10,898,133 | ) | 22,621,553 | |
Change in Net Assets Resulting from Operations | | 17,763,578 | | 40,260,128 | |
Dividends: | | | | | |
Net investment income | | — | | (1,854,467 | ) |
Net realized gains from investment transactions | | — | | (28,816,187 | ) |
Change in Net Assets Resulting from Shareholder Dividends | | — | | (30,670,654 | ) |
Capital Share Transactions: | | | | | |
Proceeds from shares issued | | 13,751,369 | | 48,805,738 | |
Dividends reinvested | | — | | 30,030,732 | |
Cost of shares redeemed | | (108,040,066 | ) | (49,906,454 | ) |
Change in Net Assets Resulting from Capital Share Transactions | | (94,288,697 | ) | 28,930,016 | |
Change in Net Assets | | (76,525,119 | ) | 38,519,490 | |
Net Assets: | | | | | |
Beginning of period | | 366,112,940 | | 327,593,450 | |
End of period | | $ | 289,587,821 | | $ | 366,112,940 | |
Share Transactions: | | | | | |
Issued | | 911,475 | | 3,318,058 | |
Reinvested | | — | | 2,056,899 | |
Redeemed | | (7,073,925 | ) | (3,373,765 | ) |
Change in shares | | (6,162,450 | ) | 2,001,192 | |
Accumulated undistributed net investment income | | $ | 1,096,049 | | $ | 188,495 | |
Amounts designated as “—” are $0 or have been rounded to $0.
See Notes to Financial Statements
27
FINANCIAL HIGHLIGHTS
Selected data for a share outstanding throughout the periods indicated.
| | | | | | For the nine | | | | | | | |
| | | | For the year | | months | | For the year | | For the year | | For the year | |
| | For the six | | ended | | ended | | ended | | ended | | ended | |
| | months ended | | December 31, | | December 31, | | March 31, | | March 31, | | March 31, | |
| | June 30, 2018 | | 2017 | | 2016 | | 2016 | | 2015 | | 2014 | |
| | (Unaudited) | | | | | | | | | | | |
Net Asset Value, Beginning of Period | | $ | 14.73 | | $ | 14.33 | | $ | 12.74 | | $ | 15.20 | | $ | 15.73 | | $ | 14.25 | |
| | | | | | | | | | | | | |
Investment Activities: | | | | | | | | | | | | | |
Operations: | | | | | | | | | | | | | |
Net investment income | | 0.05 | | 0.07 | | 0.12 | | 0.06 | | 0.03 | | — | |
Net realized and unrealized gains (losses) from investment transactions | | 0.71 | | 1.67 | | 1.92 | | (0.25 | ) | 0.51 | | 2.66 | |
Total from investment activities | | 0.76 | | 1.74 | | 2.04 | | (0.19 | ) | 0.54 | | 2.66 | |
Dividends: | | | | | | | | | | | | | |
Net investment income | | — | | (0.08 | ) | (0.14 | ) | (0.06 | ) | (0.01 | ) | — | |
Net realized gains from investments | | — | | (1.26 | ) | (0.31 | ) | (2.21 | ) | (1.06 | ) | (1.18 | ) |
Total dividends | | — | | (1.34 | ) | (0.45 | ) | (2.27 | ) | (1.07 | ) | (1.18 | ) |
| | | | | | | | | | | | | |
Net Asset Value, End of Period | | $ | 15.49 | | $ | 14.73 | | $ | 14.33 | | $ | 12.74 | | $ | 15.20 | | $ | 15.73 | |
| | | | | | | | | | | | | |
Total Return | | 5.16 | %(a) | 12.26 | % | 15.94 | %(a) | (0.52 | )% | 3.81 | % | 18.74 | % |
| | | | | | | | | | | | | |
Ratios/Supplemental Data: | | | | | | | | | | | | | |
Net assets at end of period (000’s) | | $ | 289,588 | | $ | 366,113 | | $ | 327,593 | | $ | 338,656 | | $ | 439,681 | | $ | 536,292 | |
Ratio of net expenses to average net assets | | 1.00 | %(b) | 1.00 | % | 1.00 | %(b) | 1.00 | % | 1.00 | % | 1.00 | % |
Ratio of net investment income to average net assets | | 0.62 | %(b) | 0.46 | % | 1.21 | %(b) | 0.44 | % | 0.17 | % | 0.02 | % |
Ratio of expenses (before fee reductions or recoupment of fees previously reimbursed by the investment adviser) to average net assets(c) | | 1.13 | %(b) | 1.02 | % | 1.06 | %(b) | 1.08 | % | 1.05 | % | 1.07 | % |
Portfolio turnover rate | | 11.56 | %(a) | 23.78 | % | 51.92 | %(a) | 37.42 | % | 28.62 | % | 34.50 | % |
Amounts designated as “—” are $0 or have been rounded to $0.
(a) Not annualized for periods less than one year.
(b) Annualized for periods less than one year.
(c) During the periods, certain fees were reduced or recouped by the investment adviser. If such fee reductions/recoupments had not occurred, the ratio would have been as indicated.
See Notes to Financial Statements
28
This page intentionally left blank.
29

Environmental, Social, and Governance Research and Engagement Update
(Unaudited)
Report reflects engagement activities of the Adviser including engagements on behalf of the Funds. Companies engaged on behalf of the Funds and their shareholders are highlighted.
The 2018 proxy season began inauspiciously for investors that file resolutions in company proxy statements for a shareholder vote at annual general meetings. Last November, the Securities and Exchange Commission (SEC) issued a Staff Legal Bulletin that appeared to make it easier for companies to prevail when they appeal to the SEC for permission to omit shareholder proposals from their proxy statements (known as “no-action” requests). While much of Walden’s impact through active ownership comes from constructive dialogues with companies over many years, sponsoring shareholder proposals remains an essential tool to influence corporate policies and practices. The good news is that thus far the SEC Bulletin appears to have been less consequential than we anticipated. But a different and unanticipated theme emerged over the season: numerous SEC decisions seemed to contradict established precedent that had favored shareholders, and “micromanagement” emerged as a main reason to omit shareholder proposals from proxy ballots on important issues such as climate change.
SHAREHOLDER RESOLUTION SUMMARY
Notwithstanding this difficult context, Walden had a successful proxy season. We withdrew a record number of our resolutions due to positive agreements reached with companies. In 2018, Walden led or co-led 21 resolutions on a variety of environmental, social, and governance (ESG) topics and co-filed 10 more resolutions led by other investors (see summary on page 31). Sixteen of the 31 resolutions were withdrawn with agreements. The average level of support for the eight shareholder resolutions that went to a vote was 25%. The two remaining proposals are pending. In a sign of the times, however, five of our proposals faced SEC no-action challenges or the threat of a no-action challenge leading us to withdraw them for tactical reasons.
Season Highlights
Our proposals at Discover Financial, Dollar General, Morningstar, and SunTrust Bank asking each to disclose publicly data that is already collected and reported annually to the Equal Employment Opportunity Commission (the EEO-1 Report) were withdrawn based on agreements. Though none committed to disclose the full EEO-1 report detailing workforce composition by gender and race across job categories, all four companies agreed to improve the disclosure of workplace diversity programs and EEO metrics. Our proposal at American Express on the gender-wage gap, led by Arjuna Capital, was withdrawn when the company pledged to report on pay differentials between male and female employees by the end of 2018. The company also committed to make compensation adjustments in line with a goal of 100% gender pay equity.
A seventh-time proposal with ConocoPhillips urging improved disclosure on lobbying activities and trade association memberships was withdrawn after the company agreed to add more information on its lobbying activities to its website, including an annual list of trade associations to which ConocoPhillips paid more than $50,000. This experience underscores our belief that persistence over many years can lead to progress.
New Obstacles
We experienced more SEC challenges this year than ever before. For the second consecutive year, Cato issued a no-action challenge at the SEC regarding Walden’s proposal to strengthen the company’s non-discrimination policy to include sexual orientation and gender identity. Though we presented a strong case in support of the proposal, we were disappointed that the SEC again ruled in favor of the company. This led us to withdraw a similar proposal at CorVel, which planned to replicate Cato’s successful challenge. In our view the Cato decision represents a departure from the SEC’s established precedent on LGBT workplace equality resolutions. Comcast also pursued a no-action request concerning our resolution asking for energy efficiency and renewable energy goals. After a similar proposal at another company was challenged and omitted by the SEC, we withdrew the proposal.
Walden is not sitting still. We have partnered with other shareholder proponents and are communicating with the SEC to gain a better understanding of its no-action process and defend shareowners’ right to engage companies on ESG issues that we believe contribute to long-term value creation.
PROXY VOTING SUMMARY
Walden’s shareholder proposals are a small subset of the range of company-and shareholder-sponsored proposals presented in company proxy statements. Walden’s voting record on these proposals diverges significantly from management recommendations. Two-thirds of the time we voted against at least one management recommendation on the ballot. Moreover, we did not support management on 83% of shareholder-sponsored resolutions, which includes virtually all environmental and social issue proposals. Importantly, however, we do not always support shareholder proposals. We vote against shareholder proponents when we disagree with the content of the resolution or because we believe the company has strong ESG performance on the issue at hand.
With respect to company-sponsored ballot items, Walden’s voting policy on board diversity accounted for the most significant departure from management recommendations. We voted against directors serving on nominating committees at 34% of US companies because women and people of color constituted less than 30% of the board of directors. Walden will determine which of these companies to engage on board diversity.
Walden has long championed the significance of proxy voting in addressing ESG risks and opportunities. We are encouraging other large investment firms to take this responsibility as seriously. Why? Because strong shareholder support at the ballot box encourages corporate decision-makers to consider and implement more sustainable business policies and practices. Simply put, proxy voting matters.
AN INDUSTRY MILESTONE
We filed our 500th shareholder resolution this season. Since 1987, we’ve withdrawn more than 40% of our resolutions after companies committed to improve policies, practices, or transparency. In the current policy environment, in which this shareholder right is under threat, we are especially proud of our record demonstrating that resolutions contribute to positive corporate change.
The equities in bold-face in the above commentary were holdings of one or more of the Boston Trust & Walden Funds during the period.
30
SUMMARY OF 2018 SHAREHOLDER RESOLUTIONS
Walden Focus Area | | Proposal Detail | | Company | | Status |

| | Assess feasibility of setting company-wide goals for increasing energy efficiency and use of renewable energy | | Comcast | | Challenged/Withdrawn |
Climate Change | | | | | | |
| | Adopt time-bound, quantitative, company-wide goals for reducing total greenhouse gas emissions | | Emerson Electric | | 40% Support |
| | | | | | |
| | Assess impacts to business from transitioning to a “2 degree” climate change target | | ExxonMobil* | | Agreement Reached |
| | | | | | |

Equality and Human Rights | | Report a comprehensive breakdown of workforce by race and gender according to the Equal Employment Opportunity Commission’s defined job categories | | Discover Financial | | Agreement Reached |
| | Dollar General | | Agreement Reached |
| | Morningstar | | Agreement Reached |
| | | SunTrust Bank | | Agreement Reached |
| | | | | | |
| | Report on policies and goals to reduce the gender pay gap | | American Express* | | Agreement Reached |
| | Amend non-discrimination policy to include sexual orientation and gender identity | | Cato | | Challenged/Lost at SEC |
| Chemed | | Agreement Reached |
| | | | CorVel | | Challenged/Withdrawn |
| | | | IPG Photonics | | Agreement Reached |
| | | | The Ensign Group | | Agreement Reached |
| | | | | | |
| | Report on steps the company is taking to improve board diversity | | Anika Therapeutics | | Agreement Reached |
| | | | | | |
| | Report on efforts to ensure responsible labor recruitment within the supply chain | | Williams-Sonoma* | | Agreement Reached |
| | | | | | |

Governance | | Report on plans to address business ethics concerns | | Wells Fargo* | | Agreement Reached |
| | | | | |
| Issue a report describing the company’s policies, performance, and improvement targets related to key ESG risks and opportunities | | Brinker International | | Pending |
| | Natural Gas Services | | Agreement Reached |
| | | Tootsie Roll | | 3% support |
| | | | | | |
| | Report on policies and procedures relating to direct and indirect lobbying, including payments used to trade associations and think tanks to influence public policy | | Alphabet | | 9% support |
| | | AT&T | | 34% support |
| | | Chevron* | | 32% support |
| | | ConocoPhillips | | Agreement Reached |
| | | ExxonMobil* | | 26% support |
| | | | IBM | | 33% support |
| | | | Oracle* | | Pending |
| | | | UPS | | 20% support |
| | | | | | |
| | Review and report on proxy voting policies and practices | | Cohen & Steers | | Agreement Reached |
| | | | T. Rowe Price* | | Challenged/Withdrawn |
| | | | | | |
| | Adopt policy that require the Chair of the Board to be an independent member of the board | | Express Scripts* | | Challenged/Withdrawn |
| | | Johnson & Johnson* | | Agreement Reached |
* In order, these shareholder resolutions co-filed by Walden were led by: New York State Common Retirement Fund, Arjuna Capital, Mercy Investment Services, Sisters of St. Francis of Philadelphia, City of Philadelphia Public Employees Retirement System, United Steelworkers, Boston Common Asset Management, Zevin Asset Management, John Chevedden.
31
HOW WE VOTED—YEAR ENDED JUNE 30*
Company Annual Meetings (272 Total) | Shareholder-Sponsored Proposals (150 Total) |

| 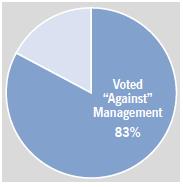
|
Our most significant votes “against” management on company-sponsored proposals:
· 34% against nominating committee members due to insufficient board diversity**
· 17% against directors for serving on too many boards**
· 8% against executive compensation
Shareholder-sponsored proposal topics that appeared on five or more proxy ballots:
· Increase various shareholder rights (supported 34 of 37)
· Improve disclosure of political contributions and lobbying (19/20)
· Commit to an independent board chair (17/17)
· Link executive compensation to ESG performance (6/6)
· Set greenhouse gas emissions goals and improve climate risk disclosure (5/5)
* The charts summarize how Walden voted on company- and shareholder-sponsored proposals for companies held in our investment strategies as of June 30, 2018. The analysis utilizes model portfolios and excludes the Walden International Equity Fund.
**The percentages are based on 240 companies headquartered in the US.
The information presented should not be considered as an offer, investment advice, or a recommendation to buy or sell any particular security. The information presented has been prepared from sources and data we believe to be reliable, but we make no guarantee to its adequacy, accuracy, timeliness or completeness. Opinions expressed herein are subject to change without notice or obligation to update..
32
Investment Performance (Unaudited) | Walden Asset Management Fund |
| June 30, 2018 |
| | For the period ended 6/30/18 | |
| | Aggregate | | Average Annual Total Returns | |
| | | | | | | | | | Since | |
| | | | | | | | | | Inception | |
| | Six Months | | 1 Year | | 5 Years | | 10 Years | | (6/18/99) | |
Walden Asset Management Fund(1) | | 0.73 | % | 8.61 | % | 8.68 | % | 6.80 | % | 5.35 | % |
S&P 500 Index | | 2.65 | % | 14.37 | % | 13.42 | % | 10.17 | % | 5.78 | % |
Bloomberg Barclays U.S. Government/Credit Bond Index | | -1.90 | % | -0.63 | % | 2.29 | % | 3.78 | % | 4.84 | % |
Citigroup 90-Day U.S. Treasury Bill Index | | 0.79 | % | 1.33 | % | 0.39 | % | 0.31 | % | 1.75 | % |

The above chart represents a 10-year hypothetical $100,000 investment in the Walden Asset Management Fund and includes the reinvestment of dividends and capital gains in the Fund. The returns shown on the table and the graph do not reflect the deduction of taxes a shareholder would pay on Fund distributions or the redemption of Fund shares.
The Walden Asset Management Fund is measured against a combination of equity and fixed income indices. The Standard & Poor’s 500 Index (“S&P 500”) is widely regarded as a gauge of the U.S. equities market. This index includes 500 leading companies in leading industries of the U.S. economy. Although the S&P 500 focuses on the large cap segment of the market, with approximately 75% coverage of U.S. equities, it is also also widely viewed as a proxy for the total market. The Bloomberg Barclays U.S. Government/Credit Bond Index includes Treasuries (i.e., public obligations of the U.S. Treasury that have remaining maturities of more than one year), government-related issues (i.e., agency, sovereign, supranational, and local authority debt), and USD Corporates. The Bloomberg Barclays U.S. Government/Credit Bond Index is a component of the Bloomberg Barclays U.S. Aggregate Index. The Citigroup 90-Day U.S. Treasury Bill Index reflects monthly return equivalents of yield averages that are not marked to the market. The index is an average of the last three-month treasury bill issues. The three-month treasury bills are the short-term debt obligations of the U.S. Government. The indices are unmanaged and their performance does not reflect the deduction of expenses associated with a mutual fund, such as investment management and fund accounting fees. The Fund’s performance reflects the deduction of fees for these services. Investors cannot invest directly in an average or an index.

Fund Net Asset Value: | | $ | 17.89 | |
Gross Expense Ratio(1): | | 1.03 | % |
Past performance does not guarantee future results. The performance data quoted represents past performance and current returns may be lower or higher. The investment return and principal value will fluctuate so that an investor’s shares, when redeemed may be worth more or less than the original cost. To obtain performance information current to the most recent month-end, please call 1-800-282-8782 ext. 7050.
(1) The Gross Expense Ratio is from the Fund’s most recent prospectus, dated May 1, 2018. The contractual fee limit under the Fund’s expense limitation agreement is 1.00% of the Fund’s average annual net assets, subject to certain limitations as described in the Fund’s prospectus. Please see the Fund’s most recent prospectus for details. Additional information pertaining to the Fund’s expense ratio as of June 30, 2018 can be found in the financial highlights included in this report. The investment performance may reflect fee reductions. If such fee reductions had not occurred, the quoted performance would have been lower. The contractual fee waiver continues through May 1, 2019 and may be renewed thereafter.
33
Walden Equity Fund | Investment Performance (Unaudited) |
June 30, 2018 | |

Fund Net Asset Value: | | $ | 21.99 | |
Gross Expense Ratio(1): | | 1.07 | % |
Past performance does not guarantee future results. The performance data quoted represents past performance and current returns may be lower or higher. The investment return and principal value will fluctuate so that an investor’s shares, when redeemed may be worth more or less than the original cost. To obtain performance information current to the most recent month-end, please call 1-800-282-8782 ext. 7050.
(1) The Gross Expense Ratio is from the Fund’s most recent prospectus, dated May 1, 2018. The contractual fee limit under the Fund’s expense limitation agreement is 1.00% of the Fund’s average annual net assets, subject to certain limitations as described in the Fund’s prospectus. Please see the Fund’s most recent prospectus for details. Additional information pertaining to the Fund’s expense ratio as of June 30, 2018 can be found in the financial highlights included in this report. The investment performance may reflect fee reductions. If such fee reductions had not occurred, the quoted performance would have been lower. The contractual fee waiver continues through May 1, 2019 and may be renewed thereafter.
| | For the period ended 6/30/18 | |
| | Aggregate | | Average Annual Total Returns | |
| | | | | | | | | | Since | |
| | | | | | | | | | Inception | |
| | Six Months | | 1 Year | | 5 Years | | 10 Years | | (6/18/99) | |
Walden Equity Fund(1) | | 1.76 | % | 13.09 | % | 11.59 | % | 8.94 | % | 6.38 | % |
S&P 500 Index | | 2.65 | % | 14.37 | % | 13.42 | % | 10.17 | % | 5.78 | % |

The above chart represents a 10-year hypothetical $100,000 investment in the Walden Equity Fund and includes the reinvestment of dividends and capital gains in the Fund. The returns shown on the table and graph do not reflect the deduction of taxes a shareholder would pay on Fund distributions or the redemption of Fund shares.
The Walden Equity Fund is measured against the Standard & Poor’s 500 Index (“S&P 500”), which is an unmanaged index that is widely regarded as a gauge of the U.S. equities market. This index includes 500 leading companies in leading industries of the U.S. economy. Although the S&P 500 focuses on the large cap segment of the market, with approximately 75% coverage of U.S. equities, it is also widely viewed as a proxy for the total market. The performance of an index does not reflect the deduction of expenses associated with a mutual fund, such as investment management and fund accounting fees. The Fund’s performance reflects the deduction of fees for these services. Investors cannot invest directly in an index.
34
Investment Performance (Unaudited) | Walden Midcap Fund |
| June 30, 2018 |
| | For the period ended 6/30/18 | |
| | Aggregate | | Average Annual Total Returns | |
| | | | | | | | Since | |
| | | | | | | | Inception | |
| | Six Months | | 1 Year | | 5 Years | | 8/1/11 | |
Walden Midcap Fund(1) | | 2.26 | % | 12.93 | % | 11.61 | % | 11.58 | % |
Russell Midcap® Index | | 2.35 | % | 12.33 | % | 12.22 | % | 12.78 | % |
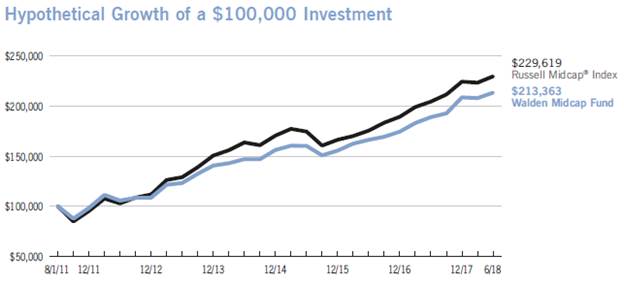
The above chart represents a hypothetical $100,000 investment in the Walden Midcap Fund from August 1, 2011 to June 30, 2018, and includes the reinvestment of dividends and capital gains in the Fund. The returns shown on the table and graph do not reflect the deduction of taxes a shareholder would pay on Fund distributions or the redemption of Fund shares.
The Walden Midcap Fund is measured against the Russell Midcap® Index, which is an unmanaged index that tracks the performance of the mid-cap segment of the U.S. equity universe. The Russell Midcap® Index is a subset of the Russell 1000® Index. It includes approximately 800 of the smallest securities based on a combination of their market capitalization and current index membership. The Russell Midcap® Index represents approximately 31% of the total market capitalization of the Russell 1000 companies. Russell Investment Group is the source and owner of the trademarks, service marks and copyrights related to the Russell Indexes. Russell® is a trademark of Russell Investment Group. The performance of an index does not reflect the deduction of expenses associated with a mutual fund, such as investment management and fund accounting fees. The Fund’s performance reflects the deduction of fees for these services. Investors cannot invest directly in an index.

Fund Net Asset Value: | | $ | 17.63 | |
Gross Expense Ratio(1): | | 1.01 | % |
Past performance does not guarantee future results. The performance data quoted represents past performance and current returns may be lower or higher. The investment return and principal value will fluctuate so that an investor’s shares, when redeemed may be worth more or less than the original cost. Returns less than one year are not annualized. To obtain performance information current to the most recent month-end, please call 1-800-282-8782 ext. 7050.
(1) The Gross Expense Ratio is from the Fund’s most recent prospectus, dated May 1, 2018. The contractual fee limit under the Fund’s expense limitation agreement is 1.00% of the Fund’s average annual net assets, subject to certain limitations as described in the Fund’s prospectus. Please see the Fund’s most recent prospectus for details. Additional information pertaining to the Fund’s expense ratio as of June 30, 2018 can be found in the financial highlights included in this report. The investment performance may reflect fee reductions. If such fee reductions had not occurred, the quoted performance would have been lower. The contractual fee waiver continues through May 1, 2019 and may be renewed thereafter.
35
Walden SMID Cap Fund | Investment Performance (Unaudited) |
June 30, 2018 | |

Fund Net Asset Value: | | $ | 17.35 | |
Gross Expense Ratio(1): | | 1.08 | % |
Past performance does not guarantee future results. The performance data quoted represents past performance and current returns may be lower or higher. The investment return and principal value will fluctuate so that an investor’s shares, when redeemed may be worth more or less than the original cost. To obtain performance information current to the most recent month-end, please call 1-800-282-8782 ext. 7050.
(1) The Gross Expense Ratio is from the Fund’s most recent prospectus, dated May 1, 2018. The contractual fee limit under the Fund’s expense limitation agreement is 1.00% of the Fund’s average annual net assets, subject to certain limitations as described in the Fund’s prospectus. Please see the Fund’s most recent prospectus for details. Additional information pertaining to the Fund’s expense ratio as of June 30, 2018 can be found in the financial highlights included in this report. The investment performance may reflect fee reductions. If such fee reductions had not occurred, the quoted performance would have been lower. The contractual fee waiver continues through May 1, 2019 and may be renewed thereafter.
| | For the period ended 6/30/18 | |
| | Aggregate | | Average Annual Total Returns | |
| | | | | | | | Since | |
| | | | | | | | Inception | |
| | Six Months | | 1 Year | | 5 Years | | 6/28/12 | |
Walden SMID Cap Fund(1) | | 3.95 | % | 13.48 | % | 11.43 | % | 13.37 | % |
Russell 2500™ Index | | 5.46 | % | 16.24 | % | 12.29 | % | 14.93 | % |

The above chart represents a hypothetical $100,000 investment in the Walden SMID Cap Fund from June 28, 2012 to June 30, 2018, and includes the reinvestment of dividends and capital gains in the Fund. The returns shown on the table and the graph do not reflect the deduction of taxes a shareholder would pay on Fund distributions or the redemption of Fund shares.
The Walden SMID Cap Fund is measured against the Russell 2500™ Index, which is an unmanaged index that tracks the performance of the small- to mid-cap segment of the U.S. equity universe, commonly referred to as “smid” cap. The Russell 2500 is a subset of the Russell 3000® Index. It includes approximately 2500 of the smallest securities based on a combination of their market cap and current index membership. Russell Investment Group is the source and owner of the trademarks, service marks and copyrights related to the Russell Indexes. Russell® is a trademark of Russell Investment Group. The performance of an index does not reflect the deduction of expenses associated with a mutual fund, such as investment management and fund accounting fees. The Fund’s performance reflects the deduction of fees for these services. Investors cannot invest directly in an index.
36
Investment Performance (Unaudited) | Walden Small Cap Fund |
| June 30, 2018 |
| | For the period ended 6/30/18 | |
| | Aggregate | | Average Annual Total Returns | |
| | | | | | | | Since | |
| | | | | | | | Inception | |
| | Six Months | | 1 Year | | 5 Years | | 10/24/08 | |
Walden Small Cap Fund(1) | | 4.79 | % | 13.16 | % | 10.37 | % | 13.96 | % |
Russell 2000® Index | | 7.66 | % | 17.57 | % | 12.46 | % | 15.37 | % |
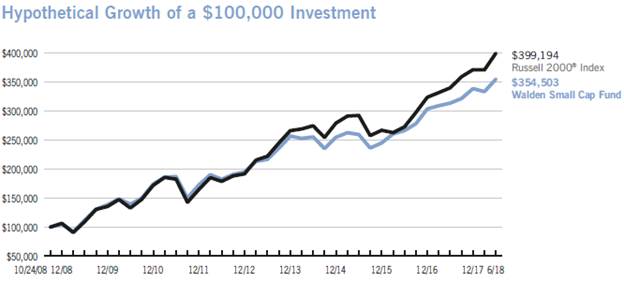
The above chart represents a hypothetical $100,000 investment in the Walden Small Cap Fund from October 24, 2008 to June 30, 2018, and includes the reinvestment of dividends and capital gains in the Fund. The returns shown on the table and within the graph do not reflect the deduction of taxes a shareholder would pay on Fund distributions or the redemption of Fund shares.
The Walden Small Cap Fund is measured against the Russell 2000® Index, which is an unmanaged index that measures the performance of the small-cap segment of the U.S. equity universe. The Russell 2000® Index is a subset of the Russell 3000® Index representing approximately 10% of the total market capitalization of that index. It includes approximately 2,000 of the smallest securities based on a combination of their market cap and current index membership. Russell Investment Group is the source and owner of the trademarks, service marks and copyrights related to the Russell Indexes. Russell® is a trademark of Russell Investment Group. The performance of an index does not reflect the deduction of expenses associated with a mutual fund, such as investment management and fund accounting fees. The Fund’s performance reflects the deduction of fees for these services. Investors cannot invest directly in an index.

Fund Net Asset Value: | | $ | 20.34 | |
Gross Expense Ratio(1): | | 1.03 | % |
Past performance does not guarantee future results. The performance data quoted represents past performance and current returns may be lower or higher. The investment return and principal value will fluctuate so that an investor’s shares, when redeemed may be worth more or less than the original cost. To obtain performance information current to the most recent month-end, please call 1-800-282-8782 ext. 7050.
(1) The Gross Expense Ratio is from the Fund’s most recent prospectus, dated May 1, 2018. The contractual fee limit under the Fund’s expense limitation agreement is 1.00% of the Fund’s average annual net assets, subject to certain limitations as described in the Fund’s prospectus. Please see the Fund’s most recent prospectus for details. Additional information pertaining to the Fund’s expense ratio as of June 30, 2018 can be found in the financial highlights included in this report. The investment performance may reflect fee reductions. If such fee reductions had not occurred, the quoted performance would have been lower. The contractual fee waiver continues through May 1, 2019 and may be renewed thereafter.
37
Walden International Equity Fund | Investment Performance (Unaudited) |
June 30, 2018 | |

Fund Net Asset Value: | | $ | 11.02 | |
Gross Expense Ratio(1): | | 1.31 | % |
Past performance does not guarantee future results. The performance data quoted represents past performance and current returns may be lower or higher. The investment return and principal value will fluctuate so that an investor’s shares, when redeemed may be worth more or less than the original cost. To obtain performance information current to the most recent month-end, please call 1-800-282-8782 ext. 7050.
(1) The Gross Expense Ratio is from the Fund’s most recent prospectus, dated May 1, 2018. The contractual fee limit under the Fund’s expense limitation agreement is 1.15% of the Fund’s average annual net assets, subject to certain limitations as described in the Fund’s prospectus. Please see the Fund’s most recent prospectus for details. Additional information pertaining to the Fund’s expense ratio as of June 30, 2018 can be found in the financial highlights included in this report. The investment performance may reflect fee reductions. If such fee reductions had not occurred, the quoted performance would have been lower. The contractual fee waiver continues through May 1, 2019 and may be renewed thereafter.
| | For the period ended 6/30/18 | |
| | Aggregate | | Average Annual Total Returns | |
| | | | | | Since | |
| | | | | | Inception | |
| | Six Months | | 1 Year | | 6/9/15 | |
Walden International Equity Fund(1) | | -0.45 | % | 6.19 | % | 4.38 | % |
MSCI World ex-USA Index (net) | | -2.77 | % | 7.04 | % | 4.44 | % |
Russell Developed ex-US Large Cap Index (net) | | -2.61 | % | 7.43 | % | 4.67 | % |

The above chart represents a hypothetical $1,000,000 investment in the Walden International Equity Fund from June 9, 2015 to June 30, 2018, and includes the reinvestment of dividends and capital gains in the Fund. The returns shown on the table and the graph do not reflect the deduction of taxes a shareholder would pay on Fund distributions or the redemption of Fund shares.
The Walden International Equity Fund is measured against the MSCI World ex-USA Index and the Russell Developed ex-US Large Cap Index. The MSCI World ex-USA Index captures large- and mid-cap representation of developed markets countries, excluding the United States. The Russell Developed ex-US Large Cap Index tracks the performance of the largest investable securities in developed countries globally, excluding companies assigned to the United States. The Russell Developed ex-US Index is constructed to provide a comprehensive and unbiased barometer for this market segment and is completely reconstituted annually to accurately reflect the changes in the market over time. These indexes are unmanaged and the performance of an index does not reflect the deduction of expenses associated with a mutual fund, such as investment management and fund accounting fees. The Fund’s performance reflects the deduction of fees for these services. Investors cannot invest directly in an index.
38
This page intentionally left blank.
39
Schedule of Portfolio Investments | Walden Asset Management Fund |
| June 30, 2018 |
| | Shares or | | | |
| | Principal | | | |
Security Description | | Amount($) | | Fair Value ($) | |
COMMON STOCKS (70.7%) | | | | | |
Consumer Discretionary (7.4%) | | | | | |
Advance Auto Parts, Inc. | | 2,500 | | 339,250 | |
Autoliv, Inc. | | 3,000 | | 429,660 | |
Booking Holdings, Inc. (a) | | 400 | | 810,836 | |
Charter Communications, Inc., Class A (a) | | 2,445 | | 716,898 | |
Comcast Corp., Class A | | 26,000 | | 853,060 | |
Dollar General Corp. | | 9,600 | | 946,560 | |
McDonald’s Corp. | | 2,000 | | 313,380 | |
NIKE, Inc., Class B | | 18,000 | | 1,434,240 | |
Omnicom Group, Inc. | | 14,000 | | 1,067,780 | |
Ross Stores, Inc. | | 14,000 | | 1,186,500 | |
Starbucks Corp. | | 16,000 | | 781,600 | |
The Home Depot, Inc. | | 2,000 | | 390,200 | |
| | | | 9,269,964 | |
Consumer Staples (6.6%) | | | | | |
Church & Dwight Co., Inc. | | 12,000 | | 637,920 | |
Colgate-Palmolive Co. | | 15,000 | | 972,150 | |
Costco Wholesale Corp. | | 9,200 | | 1,922,616 | |
Estee Lauder Cos., Inc. | | 10,000 | | 1,426,900 | |
PepsiCo, Inc. | | 11,000 | | 1,197,570 | |
Reckitt Benckiser Group PLC, Sponsored ADR | | 25,000 | | 412,875 | |
The Clorox Co. | | 7,500 | | 1,014,375 | |
The Hershey Co. | | 8,000 | | 744,480 | |
| | | | 8,328,886 | |
Energy (2.8%) | | | | | |
Apache Corp. | | 22,000 | | 1,028,500 | |
ConocoPhillips | | 35,000 | | 2,436,700 | |
| | | | 3,465,200 | |
Financials (13.0%) | | | | | |
American Express Co. | | 10,000 | | 980,000 | |
BB&T Corp. | | 24,000 | | 1,210,560 | |
Chubb Ltd. | | 6,000 | | 762,120 | |
Cincinnati Financial Corp. | | 15,000 | | 1,002,900 | |
Comerica, Inc. | | 9,000 | | 818,280 | |
Commerce Bancshares, Inc. | | 13,230 | | 856,113 | |
Discover Financial Services | | 13,000 | | 915,330 | |
JPMorgan Chase & Co. | | 20,000 | | 2,084,000 | |
Northern Trust Corp. | | 14,000 | | 1,440,460 | |
PNC Financial Services Group, Inc. | | 10,000 | | 1,351,000 | |
State Street Corp. | | 10,500 | | 977,445 | |
SunTrust Banks, Inc. | | 20,000 | | 1,320,400 | |
T. Rowe Price Group, Inc. | | 10,000 | | 1,160,900 | |
U.S. Bancorp | | 31,500 | | 1,575,630 | |
| | | | 16,455,138 | |
Health Care (10.6%) | | | | | |
Becton, Dickinson & Co. | | 7,500 | | 1,796,700 | |
Danaher Corp. | | 10,000 | | 986,800 | |
Dentsply Sirona, Inc. | | 12,000 | | 525,240 | |
Henry Schein, Inc. (a) | | 13,000 | | 944,320 | |
Johnson & Johnson, Inc. | | 16,000 | | 1,941,440 | |
Medtronic PLC | | 10,000 | | 856,100 | |
Merck & Co., Inc. | | 15,600 | | 946,920 | |
Mettler-Toledo International, Inc. (a) | | 1,800 | | 1,041,534 | |
Stryker Corp. | | 8,000 | | 1,350,880 | |
UnitedHealth Group, Inc. | | 8,000 | | 1,962,720 | |
Waters Corp. (a) | | 5,000 | | 967,950 | |
| | | | 13,320,604 | |
| | | | | |
Industrials (8.5%) | | | | | |
3M Co. | | 8,000 | | 1,573,760 | |
Deere & Co. | | 6,500 | | 908,700 | |
Donaldson Co., Inc. | | 12,000 | | 541,440 | |
Emerson Electric Co. | | 15,100 | | 1,044,014 | |
Hubbell, Inc. | | 8,000 | | 845,920 | |
Illinois Tool Works, Inc. | | 8,000 | | 1,108,320 | |
Lincoln Electric Holdings, Inc. | | 9,000 | | 789,840 | |
Union Pacific Corp. | | 11,500 | | 1,629,320 | |
United Parcel Service, Inc., Class B | | 10,000 | | 1,062,300 | |
W.W. Grainger, Inc. | | 4,000 | | 1,233,600 | |
| | | | 10,737,214 | |
Information Technology (17.4%) | | | | | |
Accenture PLC, Class A | | 12,500 | | 2,044,875 | |
Alphabet, Inc., Class A (a) | | 1,000 | | 1,129,190 | |
Alphabet, Inc., Class C (a) | | 2,400 | | 2,677,560 | |
Apple, Inc. | | 20,500 | | 3,794,755 | |
Automatic Data Processing, Inc. | | 13,800 | | 1,851,132 | |
Cisco Systems, Inc. | | 39,000 | | 1,678,170 | |
Cognizant Technology Solutions Corp., | | | | | |
Class A | | 10,000 | | 789,900 | |
Microsoft Corp. | | 36,000 | | 3,549,960 | |
Oracle Corp. | | 39,000 | | 1,718,340 | |
TE Connectivity Ltd. | | 8,000 | | 720,480 | |
Visa, Inc., Class A | | 15,000 | | 1,986,750 | |
| | | | 21,941,112 | |
Materials (2.6%) | | | | | |
AptarGroup, Inc. | | 11,000 | | 1,027,180 | |
PPG Industries, Inc. | | 12,000 | | 1,244,760 | |
Praxair, Inc. | | 6,000 | | 948,900 | |
| | | | 3,220,840 | |
Utilities (1.8%) | | | | | |
Consolidated Edison, Inc. | | 14,000 | | 1,091,720 | |
Eversource Energy | | 19,000 | | 1,113,590 | |
| | | | 2,205,310 | |
| | | | | |
TOTAL COMMON STOCKS (Cost $49,148,725) | | | | 88,944,268 | |
| | | | | |
CERTIFICATE OF DEPOSIT (0.1%) | | | | | |
| | | | | |
Certificate of Deposit (0.1%) Self Help Federal Credit Union, 1.30%, 6/21/19 (b) | | 100,000 | | 98,860 | |
| | | | | |
TOTAL CERTIFICATE OF DEPOSIT (Cost $100,000) | | | | 98,860 | |
| | | | | |
CORPORATE BONDS (2.9%) | | | | | |
| | | | | |
Consumer Discretionary (0.4%) | | | | | |
Leggett & Platt, Inc., 4.40%, 7/1/18 | | 200,000 | | 200,000 | |
Starbucks Corp., 2.45%, 6/15/26, Callable 3/15/26 @ 100 | | 350,000 | | 314,129 | |
| | | | 514,129 | |
| | | | | |
Consumer Staples (0.1%) | | | | | |
Campbell Soup Co., 4.50%, 2/15/19 | | 150,000 | | 151,352 | |
| | | | | |
Financials (0.7%) | | | | | |
American Express Co., 2.65%, 12/2/22 | | 287,000 | | 275,876 | |
KFW, 1.88%, 11/30/20 | | 250,000 | | 245,024 | |
See Notes to Financial Statements
40
| | Shares or | | | |
| | Principal | | | |
Security Description | | Amount($) | | Fair Value ($) | |
| | | | | |
CORPORATE BONDS, CONTINUED | | | | | |
Financials, continued | | | | | |
National Rural Utilities Cooperative Finance Corp., 10.38%, 11/1/18 | | 250,000 | | 256,413 | |
North American Development Bank, 4.38%, 2/11/20 | | 100,000 | | 102,308 | |
| | | | 879,621 | |
Health Care (0.4%) | | | | | |
Abbott Laboratories, 2.95%, 3/15/25, Callable 12/15/24 @ 100 | | 100,000 | | 94,784 | |
Kaiser Foundation Hospitals, 3.15%, 5/1/27, Callable 2/1/27 @ 100 | | 250,000 | | 239,695 | |
Merck & Co., Inc., 3.88%, 1/15/21, Callable 10/15/20 @ 100 | | 150,000 | | 152,955 | |
| | | | 487,434 | |
Industrials (0.3%) | | | | | |
Emerson Electric Co., 2.63%, 2/15/23, Callable 11/15/22 @ 100 | | 200,000 | | 194,188 | |
Hubbell, Inc., 3.35%, 3/1/26, Callable 12/1/25 @ 100 | | 145,000 | | 138,861 | |
Hubbell, Inc., 3.63%, 11/15/22 | | 75,000 | | 75,435 | |
| | | | 408,484 | |
Information Technology (1.0%) | | | | | |
Apple, Inc., 2.85%, 5/6/21 | | 350,000 | | 349,303 | |
Apple, Inc., 2.85%, 2/23/23, Callable 12/23/22 @ 100 | | 150,000 | | 147,755 | |
Apple, Inc., 3.00%, 6/20/27, Callable 3/20/27 @ 100 | | 200,000 | | 190,320 | |
Oracle Corp., 3.40%, 7/8/24, Callable 4/8/24 @ 100 | | 300,000 | | 297,463 | |
Visa, Inc., 3.15%, 12/14/25, Callable 9/14/25 @ 100 | | 275,000 | | 266,291 | |
| | | | 1,251,132 | |
| | | | | |
TOTAL CORPORATE BONDS (Cost $3,777,304) | | | | 3,692,152 | |
| | | | | |
MUNICIPAL BONDS (0.4%) | | | | | |
| | | | | |
New York (0.1%): | | | | | |
New York State Environmental Facilities Corp., Series C, 1.89%, 7/15/22 | | 190,000 | | 182,558 | |
| | | | | |
Wisconsin (0.3%): | | | | | |
Wisconsin State, Build America Bonds, GO, 4.60%, 5/1/26, Callable 5/1/21 @ 100 | | 250,000 | | 261,670 | |
| | | | | |
TOTAL MUNICIPAL BONDS (Cost $440,885) | | | | 444,228 | |
| | | | | |
U.S. GOVERNMENT & U.S. GOVERNMENT AGENCY OBLIGATIONS (23.0%) | | | | | |
| | | | | |
Federal Farm Credit Bank | | | | | |
2.60%, 10/6/22 | | 250,000 | | 248,244 | |
2.75%, 7/16/27 | | 250,000 | | 240,684 | |
2.85%, 3/2/28 | | 750,000 | | 724,116 | |
5.38%, 11/10/20 | | 250,000 | | 265,485 | |
| | | | 1,478,529 | |
Federal Home Loan Bank | | | | | |
1.88%, 11/29/21 | | 1,000,000 | | 973,403 | |
2.13%, 3/10/23 | | 1,000,000 | | 971,567 | |
2.50%, 3/11/22 | | 200,000 | | 198,025 | |
2.88%, 6/14/24 | | 1,000,000 | | 997,626 | |
2.88%, 9/13/24 | | 1,000,000 | | 998,315 | |
3.25%, 6/9/23 | | 850,000 | | 866,018 | |
5.25%, 8/15/22 | | 1,000,000 | | 1,094,004 | |
5.50%, 7/15/36 | | 700,000 | | 915,124 | |
| | | | 7,014,082 | |
Federal Home Loan Mortgage Corp. | | | | | |
2.38%, 1/13/22 | | 5,750,000 | | 5,677,388 | |
| | | | | |
Federal National Mortgage Association | | | | | |
1.38%, 2/26/21 | | 150,000 | | 145,203 | |
1.88%, 4/5/22 | | 1,000,000 | | 970,004 | |
1.88%, 9/24/26 | | 1,000,000 | | 914,143 | |
2.13%, 4/24/26 | | 1,250,000 | | 1,171,573 | |
2.63%, 9/6/24 | | 3,250,000 | | 3,198,585 | |
| | | | 6,399,508 | |
Government National Mortgage Association | | | | | |
4.00%, 9/15/40 | | 38,357 | | 39,522 | |
4.00%, 9/15/41 | | 168,485 | | 173,559 | |
6.50%, 5/15/32 | | 8,073 | | 8,909 | |
| | | | 221,990 | |
Housing & Urban Development | | | | | |
2.70%, 8/1/22 | | 491,000 | | 484,507 | |
| | | | | |
U.S. Treasury Inflation Index Note | | | | | |
0.63%, 7/15/21 | | 277,873 | | 278,996 | |
1.25%, 7/15/20 | | 861,518 | | 875,780 | |
| | | | 1,154,776 | |
U.S. Treasury Note | | | | | |
1.88%, 1/31/22 | | 1,500,000 | | 1,459,453 | |
2.75%, 11/15/23 | | 1,500,000 | | 1,499,707 | |
2.75%, 2/28/25 | | 3,500,000 | | 3,488,037 | |
| | | | 6,447,197 | |
TOTAL U.S. GOVERNMENT & U.S. GOVERNMENT AGENCY OBLIGATIONS (Cost $29,384,066) | | | | 28,877,977 | |
| | | | | |
INVESTMENT COMPANIES (2.7%) | | | | | |
| | | | | |
JPMorgan U.S. Government Money Market Fund, Capital Shares, 1.83%(c) | | 3,364,708 | | 3,364,708 | |
TOTAL INVESTMENT COMPANIES (Cost $3,364,708) | | | | 3,364,708 | |
| | | | | |
Total Investments (Cost $86,215,688) — 99.8%(d) | | | | 125,422,193 | |
Other assets in excess of liabilities — 0.2% | | | | 278,853 | |
NET ASSETS — 100.0% | | | | $ | 125,701,046 | |
| | | | | | |
(a) Non-income producing security.
(b) This security has been deemed illiquid and represents 0.08% of the Fund’s net assets.
(c) Rate disclosed is the seven day yield as of June 30, 2018.
(d) See Federal Tax Information listed in the Notes to the Financial Statements.
ADR American Depositary Receipt
GO General Obligation
See Notes to Financial Statements
41
Financial Statements | Walden Asset Management Fund |
STATEMENT OF ASSETS AND LIABILITIES
June 30, 2018 (Unaudited)
Assets: | | | |
Investments, at fair value (cost $86,215,688) | | $ | 125,422,193 | |
Interest and dividends receivable | | 364,886 | |
Receivable for capital shares issued | | 12,022 | |
Prepaid expenses | | 13,121 | |
Total Assets | | 125,812,222 | |
Liabilities: | | | |
Payable for capital shares redeemed | | 6,116 | |
Accrued expenses and other liabilities: | | | |
Investment adviser | | 73,453 | |
Administration and accounting | | 8,605 | |
Chief compliance officer | | 829 | |
Custodian | | 1,423 | |
Shareholder servicing fees | | 12,587 | |
Transfer agent | | 3,858 | |
Trustee | | 554 | |
Other | | 3,751 | |
Total Liabilities | | 111,176 | |
Net Assets | | $ | 125,701,046 | |
Composition of Net Assets: | | | |
Capital | | $ | 85,125,162 | |
Accumulated undistributed net investment income | | 615,948 | |
Accumulated net realized gains from investment transactions | | 753,431 | |
Net unrealized appreciation from investments | | 39,206,505 | |
Net Assets | | $ | 125,701,046 | |
Shares outstanding (par value $0.01, unlimited number of shares authorized) | | 7,025,853 | |
Net Asset Value, Offering Price and Redemption price per share | | $ | 17.89 | |
STATEMENT OF OPERATIONS
For the period ended June 30, 2018 (Unaudited)
Investment Income: | | | |
Interest | | $ | 418,585 | |
Dividends | | 810,709 | |
Total Investment Income | | 1,229,294 | |
Expenses: | | | |
Investment adviser | | 459,921 | |
Administration and accounting | | 52,461 | |
Chief compliance officer | | 5,437 | |
Custodian | | 8,108 | |
Shareholder servicing | | 55,160 | |
Transfer agency | | 20,484 | |
Trustee | | 3,438 | |
Other | | 30,451 | |
Total expenses before fee reductions | | 635,460 | |
Fees contractually reduced by the investment adviser | | (22,114 | ) |
Net Expenses | | 613,346 | |
Net Investment Income | | 615,948 | |
Net Realized/Unrealized Gains (Losses) from Investments: | | | |
Net realized gains from investment transactions | | 887,260 | |
Change in unrealized appreciation/depreciation from investments | | (569,001 | ) |
Net realized/unrealized gains (losses) from investments | | 318,259 | |
Change in Net Assets Resulting from Operations | | $ | 934,207 | |
See Notes to Financial Statements
42
STATEMENTS OF CHANGES IN NET ASSETS
| | For the | | | |
| | six months ended | | For the year ended | |
| | June 30, 2018 | | December 31, 2017 | |
| | (Unaudited) | | | |
Investment Activities: | | | | | |
Operations: | | | | | |
Net investment income | | $ | 615,948 | | $ | 1,203,506 | |
Net realized gains from investment transactions | | 887,260 | | 734,267 | |
Change in unrealized appreciation/depreciation from investments | | (569,001 | ) | 13,570,535 | |
Change in Net Assets Resulting from Operations | | 934,207 | | 15,508,308 | |
Dividends: | | | | | |
Net investment income | | — | | (1,213,718 | ) |
Net realized gains from investment transactions | | — | | (940,938 | ) |
Change in Net Assets Resulting from Shareholder Dividends | | — | | (2,154,656 | ) |
Capital Share Transactions: | | | | | |
Proceeds from shares issued | | 7,241,393 | | 16,456,804 | |
Dividends reinvested | | — | | 1,829,653 | |
Cost of shares redeemed | | (3,830,333 | ) | (11,410,706 | ) |
Change in Net Assets Resulting from Capital Share Transactions | | 3,411,060 | | 6,875,751 | |
Change in Net Assets | | 4,345,267 | | 20,229,403 | |
Net Assets: | | | | | |
Beginning of period | | 121,355,779 | | 101,126,376 | |
End of period | | $ | 125,701,046 | | $ | 121,355,779 | |
Share Transactions: | | | | | |
Issued | | 405,289 | | 989,294 | |
Reinvested | | — | | 103,312 | |
Redeemed | | (213,906 | ) | (681,099 | ) |
Change in shares | | 191,383 | | 411,507 | |
Accumulated undistributed net investment income | | $ | 615,948 | | $ | — | |
Amounts designated as “—” are $0 or have been rounded to $0.
See Notes to Financial Statements
43
FINANCIAL HIGHLIGHTS
Selected data for a share outstanding throughout the periods indicated.
| | | | | | For the nine | | | | | | | |
| | | | For the year | | months | | For the year | | For the year | | For the year | |
| | For the six | | ended | | ended | | ended | | ended | | ended | |
| | months ended | | December 31, | | December 31, | | March 31, | | March 31, | | March 31, | |
| | June 30, 2018 | | 2017 | | 2016 | | 2016 | | 2015 | | 2014 | |
| | (Unaudited) | | | | | | | | | | | |
Net Asset Value, Beginning of Period | | $ | 17.76 | | $ | 15.74 | | $ | 15.32 | | $ | 15.96 | | $ | 15.17 | | $ | 13.53 | |
| | | | | | | | | | | | | |
Investment Activities: | | | | | | | | | | | | | |
Operations: | | | | | | | | | | | | | |
Net investment income | | 0.09 | | 0.18 | | 0.13 | | 0.20 | | 0.17 | | 0.13 | |
Net realized and unrealized gains from investment transactions | | 0.04 | | 2.16 | | 0.77 | | 0.27 | | 0.89 | | 1.72 | |
Total from investment activities | | 0.13 | | 2.34 | | 0.90 | | 0.47 | | 1.06 | | 1.85 | |
Dividends: | | | | | | | | | | | | | |
Net investment income | | — | | (0.18 | ) | (0.17 | ) | (0.21 | ) | (0.16 | ) | (0.13 | ) |
Net realized gains from investments | | — | | (0.14 | ) | (0.31 | ) | (0.90 | ) | (0.11 | ) | (0.08 | ) |
Total dividends | | — | | (0.32 | ) | (0.48 | ) | (1.11 | ) | (0.27 | ) | (0.21 | ) |
| | | | | | | | | | | | | |
Net Asset Value, End of Period | | $ | 17.89 | | $ | 17.76 | | $ | 15.74 | | $ | 15.32 | | $ | 15.96 | | $ | 15.17 | |
| | | | | | | | | | | | | |
Total Return | | 0.73 | %(a) | 14.88 | % | 5.87 | %(a) | 3.10 | % | 7.00 | % | 13.73 | % |
| | | | | | | | | | | | | |
Ratios/Supplemental Data: | | | | | | | | | | | | | |
Net assets at end of period (000’s) | | $ | 125,701 | | $ | 121,356 | | $ | 101,126 | | $ | 86,891 | | $ | 84,499 | | $ | 79,168 | |
Ratio of net expenses to average net assets | | 1.00 | %(b) | 1.00 | % | 1.00 | %(b) | 1.00 | % | 1.00 | % | 1.00 | % |
Ratio of net investment income to average net assets | | 1.00 | %(b) | 1.08 | % | 1.13 | %(b) | 1.29 | % | 1.06 | % | 0.95 | % |
Ratio of expenses (before fee reductions or recoupment of fees previously reimbursed by the investment adviser) to average net assets(c) | | 1.04 | %(b) | 1.03 | % | 1.05 | %(b) | 1.06 | % | 1.04 | % | 1.05 | % |
Portfolio turnover rate | | 4.94 | %(a) | 8.40 | % | 10.18 | %(a) | 15.56 | % | 21.62 | % | 6.50 | % |
Amounts designated as “—” are $0 or have been rounded to $0.
(a) Not annualized for periods less than one year.
(b) Annualized for periods less than one year.
(c) During the periods, certain fees were reduced. If such fee reduction had not occurred, the ratio would have been as indicated.
See Notes to Financial Statements
44
Schedule of Portfolio Investments | Walden Equity Fund |
| June 30, 2018 |
Security Description | | Shares | | Fair Value ($) | |
COMMON STOCKS (98.9%) | | | | | |
Consumer Discretionary (11.2%) | | | | | |
Advance Auto Parts, Inc. | | 7,000 | | 949,900 | |
Autoliv, Inc. | | 5,500 | | 787,710 | |
Booking Holdings, Inc. (a) | | 1,100 | | 2,229,799 | |
Charter Communications, Inc., Class A (a) | | 4,879 | | 1,430,572 | |
Comcast Corp., Class A | | 70,000 | | 2,296,700 | |
Dollar General Corp. | | 22,000 | | 2,169,200 | |
McDonald’s Corp. | | 11,500 | | 1,801,935 | |
NIKE, Inc., Class B | | 45,000 | | 3,585,600 | |
Omnicom Group, Inc. | | 30,000 | | 2,288,100 | |
Ross Stores, Inc. | | 41,000 | | 3,474,750 | |
Starbucks Corp. | | 34,000 | | 1,660,900 | |
The TJX Cos., Inc. | | 3,000 | | 285,540 | |
| | | | 22,960,706 | |
Consumer Staples (9.4%) | | | | | |
Church & Dwight Co., Inc. | | 30,000 | | 1,594,800 | |
Colgate-Palmolive Co. | | 30,000 | | 1,944,300 | |
Costco Wholesale Corp. | | 20,000 | | 4,179,600 | |
Estee Lauder Cos., Inc. | | 25,000 | | 3,567,250 | |
PepsiCo, Inc. | | 26,000 | | 2,830,620 | |
Procter & Gamble Co. | | 5,000 | | 390,300 | |
Reckitt Benckiser Group PLC, Sponsored ADR | | 70,000 | | 1,156,050 | |
The Clorox Co. | | 17,000 | | 2,299,250 | |
The Hershey Co. | | 15,000 | | 1,395,900 | |
| | | | 19,358,070 | |
Energy (4.1%) | | | | | |
Apache Corp. | | 56,500 | | 2,641,375 | |
ConocoPhillips | | 77,500 | | 5,395,550 | |
Oceaneering International, Inc. | | 12,000 | | 305,520 | |
| | | | 8,342,445 | |
Financials (17.4%) | | | | | |
American Express Co. | | 25,000 | | 2,450,000 | |
BB&T Corp. | | 55,000 | | 2,774,200 | |
Chubb Ltd. | | 11,000 | | 1,397,220 | |
Cincinnati Financial Corp. | | 18,000 | | 1,203,480 | |
Comerica, Inc. | | 23,000 | | 2,091,160 | |
Discover Financial Services | | 33,000 | | 2,323,530 | |
JPMorgan Chase & Co. | | 46,000 | | 4,793,200 | |
Northern Trust Corp. | | 27,000 | | 2,778,030 | |
PNC Financial Services Group, Inc. | | 28,500 | | 3,850,350 | |
State Street Corp. | | 28,000 | | 2,606,520 | |
SunTrust Banks, Inc. | | 45,000 | | 2,970,900 | |
T. Rowe Price Group, Inc. | | 21,500 | | 2,495,935 | |
U.S. Bancorp | | 80,000 | | 4,001,600 | |
| | | | 35,736,125 | |
Health Care (15.0%) | | | | | |
Becton, Dickinson & Co. | | 17,000 | | 4,072,520 | |
Danaher Corp. | | 23,000 | | 2,269,640 | |
Dentsply Sirona, Inc. | | 22,000 | | 962,940 | |
Henry Schein, Inc. (a) | | 28,000 | | 2,033,920 | |
Johnson & Johnson, Inc. | | 35,000 | | 4,246,900 | |
Medtronic PLC | | 29,000 | | 2,482,690 | |
Merck & Co., Inc. | | 32,000 | | 1,942,400 | |
Mettler-Toledo International, Inc. (a) | | 4,500 | | 2,603,835 | |
Stryker Corp. | | 21,000 | | 3,546,060 | |
UnitedHealth Group, Inc. | | 18,000 | | 4,416,120 | |
Waters Corp. (a) | | 11,000 | | 2,129,490 | |
| | | | 30,706,515 | |
Industrials (11.8%) | | | | | |
3M Co. | | 19,000 | | 3,737,680 | |
Deere & Co. | | 15,000 | | 2,097,000 | |
Donaldson Co., Inc. | | 35,000 | | 1,579,200 | |
Emerson Electric Co. | | 38,500 | | 2,661,890 | |
Hubbell, Inc. | | 22,000 | | 2,326,280 | |
Illinois Tool Works, Inc. | | 19,000 | | 2,632,260 | |
Union Pacific Corp. | | 32,000 | | 4,533,760 | |
United Parcel Service, Inc., Class B | | 23,000 | | 2,443,290 | |
W.W. Grainger, Inc. | | 7,000 | | 2,158,800 | |
| | | | 24,170,160 | |
Information Technology (23.9%) | | | | | |
Accenture PLC, Class A | | 25,000 | | 4,089,750 | |
Alphabet, Inc., Class A (a) | | 2,800 | | 3,161,732 | |
Alphabet, Inc., Class C (a) | | 4,900 | | 5,466,685 | |
Apple, Inc. | | 48,500 | | 8,977,835 | |
Automatic Data Processing, Inc. | | 32,000 | | 4,292,480 | |
Cisco Systems, Inc. | | 75,000 | | 3,227,250 | |
International Business Machines Corp. | | 2,000 | | 279,400 | |
Microsoft Corp. | | 88,000 | | 8,677,680 | |
Oracle Corp. | | 90,000 | | 3,965,400 | |
TE Connectivity Ltd. | | 22,000 | | 1,981,320 | |
Visa, Inc., Class A | | 38,000 | | 5,033,100 | |
| | | | 49,152,632 | |
Materials (3.6%) | | | | | |
AptarGroup, Inc. | | 26,000 | | 2,427,880 | |
PPG Industries, Inc. | | 25,000 | | 2,593,250 | |
Praxair, Inc. | | 15,000 | | 2,372,250 | |
| | | | 7,393,380 | |
Utilities (2.5%) | | | | | |
Consolidated Edison, Inc. | | 31,000 | | 2,417,380 | |
Eversource Energy | | 45,000 | | 2,637,450 | |
| | | | 5,054,830 | |
| | | | | |
TOTAL COMMON STOCKS (Cost $108,074,209) | | | | 202,874,863 | |
| | | | | |
INVESTMENT COMPANIES (1.1%) | | | | | |
| | | | | |
JPMorgan U.S. Government Money Market Fund, Capital Shares, 1.83%(b) | | 2,175,509 | | 2,175,509 | |
TOTAL INVESTMENT COMPANIES (Cost $2,175,509) | | | | 2,175,509 | |
| | | | | |
Total Investments (Cost $110,249,718) — 100.0%(c) | | | | 205,050,372 | |
Other assets in excess of liabilities — 0.0% | | | | 68,322 | |
NET ASSETS — 100.0% | | | | $ | 205,118,694 | |
| | | | | | |
(a) Non-income producing security.
(b) Rate disclosed is the seven day yield as of June 30, 2018.
(c) See Federal Tax Information listed in the Notes to the Financial Statements.
ADR American Depositary Receipt
See Notes to Financial Statements
45
Financial Statements | Walden Equity Fund |
STATEMENT OF ASSETS AND LIABILITIES
June 30, 2018 (Unaudited)
Assets: | | | |
Investments, at fair value (cost $110,249,718) | | $ | 205,050,372 | |
Dividends receivable | | 182,667 | |
Receivable for capital shares issued | | 56,958 | |
Prepaid expenses | | 15,687 | |
Total Assets | | 205,305,684 | |
Liabilities: | | | |
Payable for capital shares redeemed | | 1,203 | |
Accrued expenses and other liabilities: | | | |
Investment adviser | | 113,696 | |
Administration and accounting | | 14,934 | |
Chief compliance officer | | 1,591 | |
Custodian | | 2,699 | |
Shareholder servicing fees | | 39,624 | |
Transfer agent | | 4,539 | |
Trustee | | 1,063 | |
Other | | 7,641 | |
Total Liabilities | | 186,990 | |
Net Assets | | $ | 205,118,694 | |
Composition of Net Assets: | | | |
Capital | | $ | 109,150,996 | |
Accumulated undistributed net investment income | | 783,591 | |
Accumulated net realized gains from investment transactions | | 383,453 | |
Net unrealized appreciation from investments | | 94,800,654 | |
Net Assets | | $ | 205,118,694 | |
Shares outstanding (par value $0.01, unlimited number of shares authorized) | | 9,329,764 | |
Net Asset Value, Offering Price and Redemption price per share | | $ | 21.99 | |
STATEMENT OF OPERATIONS
For the period ended June 30, 2018 (Unaudited)
Investment Income: | | | |
Dividends | | $ | 1,790,296 | |
Total Investment Income | | 1,790,296 | |
Expenses: | | | |
Investment adviser | | 754,870 | |
Administration and accounting | | 82,833 | |
Chief compliance officer | | 8,961 | |
Custodian | | 13,297 | |
Shareholder servicing | | 157,090 | |
Transfer agency | | 21,878 | |
Trustee | | 5,661 | |
Other | | 43,804 | |
Total expenses before fee reductions | | 1,088,394 | |
Fees contractually reduced by the investment adviser | | (81,689 | ) |
Net Expenses | | 1,006,705 | |
Net Investment Income | | 783,591 | |
Net Realized/Unrealized Gains (Losses) from Investments: | | | |
Net realized gains from investment transactions | | 883,271 | |
Change in unrealized appreciation/depreciation from investments | | 1,672,955 | |
Net realized/unrealized gains (losses) from investments | | 2,556,226 | |
Change in Net Assets Resulting from Operations | | $ | 3,339,817 | |
See Notes to Financial Statements
46
STATEMENTS OF CHANGES IN NET ASSETS
| | For the | | | |
| | six months ended | | For the year ended | |
| | June 30, 2018 | | December 31, 2017 | |
| | (Unaudited) | | | |
Investment Activities: | | | | | |
Operations: | | | | | |
Net investment income | | $ | 783,591 | | $ | 1,737,276 | |
Net realized gains from investment transactions | | 883,271 | | 7,172,343 | |
Change in unrealized appreciation/depreciation from investments | | 1,672,955 | | 26,282,872 | |
Change in Net Assets Resulting from Operations | | 3,339,817 | | 35,192,491 | |
Dividends: | | | | | |
Net investment income | | — | | (1,740,760 | ) |
Net realized gains from investment transactions | | — | | (8,052,912 | ) |
Change in Net Assets Resulting from Shareholder Dividends | | — | | (9,793,672 | ) |
Capital Share Transactions: | | | | | |
Proceeds from shares issued | | 16,135,471 | | 25,865,919 | |
Dividends reinvested | | — | | 8,724,992 | |
Cost of shares redeemed | | (11,795,807 | ) | (44,380,575 | ) |
Change in Net Assets Resulting from Capital Share Transactions | | 4,339,664 | | (9,789,664 | ) |
Change in Net Assets | | 7,679,481 | | 15,609,155 | |
Net Assets: | | | | | |
Beginning of period | | 197,439,213 | | 181,830,058 | |
End of period | | $ | 205,118,694 | | $ | 197,439,213 | |
Share Transactions: | | | | | |
Issued | | 727,879 | | 1,267,580 | |
Reinvested | | — | | 405,060 | |
Redeemed | | (533,591 | ) | (2,196,814 | ) |
Change in shares | | 194,288 | | (524,174 | ) |
Accumulated undistributed net investment income | | $ | 783,591 | | $ | — | |
Amounts designated as “—” are $0 or have been rounded to $0.
See Notes to Financial Statements
47
FINANCIAL HIGHLIGHTS
Selected data for a share outstanding throughout the periods indicated.
| | | | | | For the nine | | | | | | | |
| | | | For the year | | months | | For the year | | For the year | | For the year | |
| | For the six | | ended | | ended | | ended | | ended | | ended | |
| | months ended | | December 31, | | December 31, | | March 31, | | March 31, | | March 31, | |
| | June 30, 2018 | | 2017 | | 2016 | | 2016 | | 2015 | | 2014 | |
| | (Unaudited) | | | | | | | | | | | |
Net Asset Value, Beginning of Period | | $ | 21.61 | | $ | 18.82 | | $ | 17.88 | | $ | 18.55 | | $ | 18.19 | | $ | 15.41 | |
| | | | | | | | | | | | | |
Investment Activities: | | | | | | | | | | | | | |
Operations: | | | | | | | | | | | | | |
Net investment income | | 0.08 | | 0.20 | | 0.14 | | 0.23 | | 0.18 | | 0.16 | |
Net realized and unrealized gains from investment transactions | | 0.30 | | 3.70 | | 1.44 | | 0.29 | | 1.29 | | 2.86 | |
Total from investment activities | | 0.38 | | 3.90 | | 1.58 | | 0.52 | | 1.47 | | 3.02 | |
Dividends: | | | | | | | | | | | | | |
Net investment income | | — | | (0.20 | ) | (0.18 | ) | (0.24 | ) | (0.18 | ) | (0.15 | ) |
Net realized gains from investments | | — | | (0.91 | ) | (0.46 | ) | (0.95 | ) | (0.93 | ) | (0.09 | ) |
Total dividends | | — | | (1.11 | ) | (0.64 | ) | (1.19 | ) | (1.11 | ) | (0.24 | ) |
| | | | | | | | | | | | | |
Net Asset Value, End of Period | | $ | 21.99 | | $ | 21.61 | | $ | 18.82 | | $ | 17.88 | | $ | 18.55 | | $ | 18.19 | |
| | | | | | | | | | | | | |
Total Return | | 1.76 | %(a) | 20.77 | % | 8.80 | %(a) | 2.92 | % | 8.13 | % | 19.66 | % |
| | | | | | | | | | | | | |
Ratios/Supplemental Data: | | | | | | | | | | | | | |
Net assets at end of period (000’s) | | $ | 205,119 | | $ | 197,439 | | $ | 181,830 | | $ | 164,566 | | $ | 157,499 | | $ | 151,879 | |
Ratio of net expenses to average net assets | | 1.00 | %(b) | 1.00 | % | 1.00 | %(b) | 1.00 | % | 1.00 | % | 1.00 | % |
Ratio of net investment income to average net assets | | 0.78 | %(b) | 0.93 | % | 1.00 | %(b) | 1.21 | % | 0.95 | % | 0.95 | % |
Ratio of expenses (before fee reductions or recoupment of fees previously reimbursed by the investment adviser) to average net assets(c) | | 1.08 | %(b) | 1.07 | % | 1.09 | %(b) | 1.10 | % | 1.09 | % | 1.08 | % |
Portfolio turnover rate | | 2.37 | %(a) | 9.88 | % | 9.94 | %(a) | 17.78 | % | 21.31 | % | 12.33 | % |
Amounts designated as “—” are $0 or have been rounded to $0.
(a) Not annualized for periods less than one year.
(b) Annualized for periods less than one year.
(c) During the periods, certain fees were reduced. If such fee reduction had not occurred, the ratio would have been as indicated.
See Notes to Financial Statements
48
Schedule of Portfolio Investments | Walden Midcap Fund |
| June 30, 2018 |
Security Description | | Shares | | Fair Value ($) | |
COMMON STOCKS (98.9%) | | | | | |
Consumer Discretionary (13.1%) | | | | | |
Dollar General Corp. | | 8,500 | | 838,100 | |
Dunkin’ Brands Group, Inc. | | 7,500 | | 518,025 | |
Expedia, Inc. | | 4,000 | | 480,760 | |
Hasbro, Inc. | | 5,000 | | 461,550 | |
Hyatt Hotels Corp., Class A | | 11,975 | | 923,871 | |
Omnicom Group, Inc. | | 8,000 | | 610,160 | |
O’Reilly Automotive, Inc. (a) | | 2,000 | | 547,140 | |
Polaris Industries, Inc. | | 4,150 | | 507,047 | |
Ross Stores, Inc. | | 11,500 | | 974,625 | |
Williams Sonoma, Inc. | | 8,850 | | 543,213 | |
| | | | 6,404,491 | |
Consumer Staples (5.5%) | | | | | |
Church & Dwight Co., Inc. | | 15,500 | | 823,979 | |
McCormick & Co., Inc. | | 4,100 | | 475,969 | |
The Clorox Co. | | 5,850 | | 791,213 | |
The Hershey Co. | | 6,425 | | 597,911 | |
| | | | 2,689,072 | |
Energy (4.7%) | | | | | |
Apache Corp. | | 17,500 | | 818,125 | |
Dril-Quip, Inc. (a) | | 10,025 | | 515,285 | |
Helmerich & Payne, Inc. | | 9,200 | | 586,592 | |
Technipfmc PLC | | 11,225 | | 356,282 | |
| | | | 2,276,284 | |
Financials (17.1%) | | | | | |
American Financial Group, Inc. | | 4,675 | | 501,768 | |
Brown & Brown, Inc. | | 18,800 | | 521,324 | |
Commerce Bancshares, Inc. | | 13,716 | | 887,562 | |
Discover Financial Services | | 9,500 | | 668,895 | |
East West Bancorp, Inc. | | 8,550 | | 557,460 | |
Eaton Vance Corp. | | 9,500 | | 495,805 | |
FactSet Research Systems, Inc. | | 4,675 | | 926,117 | |
M&T Bank Corp. | | 4,200 | | 714,630 | |
Northern Trust Corp. | | 9,250 | | 951,732 | |
SEI Investments Co. | | 8,825 | | 551,739 | |
Signature Bank (a) | | 4,750 | | 607,430 | |
T. Rowe Price Group, Inc. | | 4,600 | | 534,014 | |
W. R. Berkley Corp. | | 6,410 | | 464,148 | |
| | | | 8,382,624 | |
Health Care (12.5%) | | | | | |
Agilent Technologies, Inc. | | 7,500 | | 463,800 | |
Cerner Corp. (a) | | 7,825 | | 467,857 | |
Dentsply Sirona, Inc. | | 8,075 | | 353,443 | |
Henry Schein, Inc. (a) | | 6,850 | | 497,584 | |
Mettler-Toledo International, Inc. (a) | | 850 | | 491,836 | |
PerkinElmer, Inc. | | 5,975 | | 437,549 | |
ResMed, Inc. | | 4,550 | | 471,289 | |
STERIS PLC | | 7,275 | | 763,947 | |
The Cooper Companies, Inc. | | 2,375 | | 559,194 | |
Varian Medical Systems, Inc. (a) | | 4,725 | | 537,327 | |
Waters Corp. (a) | | 3,050 | | 590,449 | |
Zimmer Biomet Holdings, Inc. | | 4,225 | | 470,834 | |
| | | | 6,105,109 | |
Industrials (15.0%) | | | | | |
AMETEK, Inc. | | 10,975 | | 791,956 | |
Donaldson Co., Inc. | | 16,300 | | 735,456 | |
Dover Corp. | | 6,375 | | 466,650 | |
Expeditors International of Washington, Inc. | | 5,225 | | 381,948 | |
Hubbell, Inc. | | 6,250 | | 660,875 | |
IDEX Corp. | | 3,450 | | 470,856 | |
Lincoln Electric Holdings, Inc. | | 6,275 | | 550,694 | |
Nordson Corp. | | 5,825 | | 747,987 | |
Roper Technologies, Inc. | | 1,850 | | 510,434 | |
Sensata Technologies Holding PLC (a) | | 9,000 | | 428,220 | |
The Middleby Corp. (a) | | 4,475 | | 467,280 | |
Verisk Analytics, Inc. (a) | | 4,600 | | 495,144 | |
Wabtec Corp. | | 6,550 | | 645,699 | |
| | | | 7,353,199 | |
Information Technology (13.7%) | | | | | |
Akamai Technologies, Inc. (a) | | 6,750 | | 494,303 | |
Amdocs Ltd. | | 10,425 | | 690,031 | |
ANSYS, Inc. (a) | | 2,850 | | 496,413 | |
Aspen Technology, Inc. (a) | | 5,100 | | 472,974 | |
Check Point Software Technologies Ltd. (a) | | 5,200 | | 507,936 | |
Citrix Systems, Inc. (a) | | 5,725 | | 600,209 | |
F5 Networks, Inc. (a) | | 5,575 | | 961,408 | |
Fiserv, Inc. (a) | | 6,500 | | 481,585 | |
IPG Photonics Corp. (a) | | 1,950 | | 430,229 | |
Juniper Networks, Inc. | | 16,525 | | 453,116 | |
Paychex, Inc. | | 15,800 | | 1,079,929 | |
| | | | 6,668,133 | |
Materials (6.9%) | | | | | |
AptarGroup, Inc. | | 7,800 | | 728,364 | |
Avery Dennison Corp. | | 7,375 | | 752,988 | |
Ball Corp. | | 11,500 | | 408,825 | |
International Flavors & Fragrances, Inc. | | 5,225 | | 647,691 | |
RPM International, Inc. | | 13,975 | | 815,022 | |
| | | | 3,352,890 | |
Real Estate (5.7%) | | | | | |
Digital Realty Trust, Inc. | | 4,150 | | 463,057 | |
Host Hotels & Resorts, Inc. | | 24,275 | | 511,474 | |
Jones Lang LaSalle, Inc. | | 3,875 | | 643,211 | |
Lamar Advertising Co., Class A | | 7,500 | | 512,325 | |
Realty Income Corp. | | 11,775 | | 633,378 | |
| | | | 2,763,445 | |
Utilities (4.7%) | | | | | |
American Water Works Co., Inc. | | 4,525 | | 386,345 | |
Consolidated Edison, Inc. | | 7,500 | | 584,850 | |
Eversource Energy | | 13,505 | | 791,528 | |
ONE Gas, Inc. | | 7,100 | | 530,654 | |
| | | | 2,293,377 | |
| | | | | |
TOTAL COMMON STOCKS (Cost $33,457,834) | | | | 48,288,624 | |
| | | | | |
INVESTMENT COMPANIES (1.1%) | | | | | |
| | | | | |
JPMorgan U.S. Government Money Market Fund, Capital Shares, 1.83%(b) | | 530,009 | | 530,009 | |
TOTAL INVESTMENT COMPANIES (Cost $530,009) | | | | 530,009 | |
| | | | | |
Total Investments (Cost $33,987,843) — 100.0%(c) | | | | 48,818,633 | |
Liabilities in excess of other assets — 0.0% | | | | (3,649 | ) |
NET ASSETS — 100.0% | | | | $ | 48,814,984 | |
| | | | | | |
(a) Non-income producing security.
(b) Rate disclosed is the seven day yield as of June 30, 2018.
(c) See Federal Tax Information listed in the Notes to the Financial Statements.
See Notes to Financial Statements
49
Financial Statements | Walden Midcap Fund |
STATEMENT OF ASSETS AND LIABILITIES
June 30, 2018 (Unaudited)
Assets: | | | |
Investments, at fair value (cost $33,987,843) | | $ | 48,818,633 | |
Dividends receivable | | 28,801 | |
Receivable for tax reclaims | | 555 | |
Prepaid expenses | | 5,797 | |
Total Assets | | 48,853,786 | |
Liabilities: | | | |
Payable for capital shares redeemed | | 25 | |
Accrued expenses and other liabilities: | | | |
Investment adviser | | 29,665 | |
Administration and accounting | | 3,022 | |
Chief compliance officer | | 306 | |
Custodian | | 525 | |
Shareholder servicing fees | | 493 | |
Transfer agent | | 3,126 | |
Trustee | | 205 | |
Other | | 1,435 | |
Total Liabilities | | 38,802 | |
Net Assets | | $ | 48,814,984 | |
Composition of Net Assets: | | | |
Capital | | $ | 31,554,148 | |
Accumulated undistributed net investment income | | 125,481 | |
Accumulated net realized gains from investment transactions | | 2,304,565 | |
Net unrealized appreciation from investments | | 14,830,790 | |
Net Assets | | $ | 48,814,984 | |
Shares outstanding (par value $0.01, unlimited number of shares authorized) | | 2,768,592 | |
Net Asset Value, Offering Price and Redemption price per share | | $ | 17.63 | |
STATEMENT OF OPERATIONS
For the period ended June 30, 2018 (Unaudited)
Investment Income: | | | |
Dividends | | $ | 358,111 | |
Total Investment Income | | 358,111 | |
Expenses: | | | |
Investment adviser | | 174,426 | |
Administration and accounting | | 19,299 | |
Chief compliance officer | | 2,065 | |
Custodian | | 3,069 | |
Shareholder servicing | | 2,402 | |
Transfer agency | | 16,960 | |
Trustee | | 1,308 | |
Other | | 12,478 | |
Recoupment of prior expenses reimbursed by the investment adviser | | 623 | |
Total expenses | | 232,630 | |
Net Expenses | | 232,630 | |
Net Investment Income | | 125,481 | |
Net Realized/Unrealized Gains (Losses) from Investments: | | | |
Net realized gains from investment transactions | | 1,488,364 | |
Change in unrealized appreciation/depreciation from investments | | (589,699 | ) |
Net realized/unrealized gains (losses) from investments | | 898,665 | |
Change in Net Assets Resulting from Operations | | $ | 1,024,146 | |
See Notes to Financial Statements
50
STATEMENTS OF CHANGES IN NET ASSETS
| | For the | | | |
| | six months ended | | For the year ended | |
| | June 30, 2018 | | December 31, 2017 | |
| | (Unaudited) | | | |
Investment Activities: | | | | | |
Operations: | | | | | |
Net investment income | | $ | 125,481 | | $ | 194,063 | |
Net realized gains from investment transactions | | 1,488,364 | | 2,158,098 | |
Change in unrealized appreciation/depreciation from investments | | (589,699 | ) | 5,350,670 | |
Change in Net Assets Resulting from Operations | | 1,024,146 | | 7,702,831 | |
Dividends: | | | | | |
Net investment income | | — | | (203,517 | ) |
Net realized gains from investment transactions | | — | | (1,315,187 | ) |
Change in Net Assets Resulting from Shareholder Dividends | | — | | (1,518,704 | ) |
Capital Share Transactions: | | | | | |
Proceeds from shares issued | | 3,464,507 | | 2,254,433 | |
Dividends reinvested | | — | | 1,393,823 | |
Cost of shares redeemed | | (2,235,205 | ) | (2,329,398 | ) |
Change in Net Assets Resulting from Capital Share Transactions | | 1,229,302 | | 1,318,858 | |
Change in Net Assets | | 2,253,448 | | 7,502,985 | |
Net Assets: | | | | | |
Beginning of period | | 46,561,536 | | 39,058,551 | |
End of period | | $ | 48,814,984 | | $ | 46,561,536 | |
Share Transactions: | | | | | |
Issued | | 194,961 | | 142,246 | |
Reinvested | | — | | 81,701 | |
Redeemed | | (127,324 | ) | (144,502 | ) |
Change in shares | | 67,637 | | 79,445 | |
Accumulated undistributed net investment income | | $ | 125,481 | | $ | — | |
Amounts designated as “—” are $0 or have been rounded to $0.
See Notes to Financial Statements
51
FINANCIAL HIGHLIGHTS
Selected data for a share outstanding throughout the periods indicated.
| | | | | | For the nine | | | | | | | |
| | | | For the year | | months | | For the year | | For the year | | For the year | |
| | For the six | | ended | | ended | | ended | | ended | | ended | |
| | months ended | | December 31, | | December 31, | | March 31, | | March 31, | | March 31, | |
| | June 30, 2018 | | 2017 | | 2016 | | 2016 | | 2015 | | 2014 | |
| | (Unaudited) | | | | | | | | | | | |
Net Asset Value, Beginning of Period | | $ | 17.24 | | $ | 14.90 | | $ | 14.57 | | $ | 15.18 | | $ | 14.06 | | $ | 12.06 | |
| | | | | | | | | | | | | |
Investment Activities: | | | | | | | | | | | | | |
Operations: | | | | | | | | | | | | | |
Net investment income | | 0.05 | | 0.07 | | 0.11 | | 0.09 | | 0.05 | | 0.04 | |
Net realized and unrealized gains from investment transactions | | 0.34 | | 2.85 | | 0.97 | | 0.07 | | 1.65 | | 2.08 | |
Total from investment activities | | 0.39 | | 2.92 | | 1.08 | | 0.16 | | 1.70 | | 2.12 | |
Dividends: | | | | | | | | | | | | | |
Net investment income | | — | | (0.08 | ) | (0.12 | ) | (0.08 | ) | (0.05 | ) | (0.03 | ) |
Net realized gains from investments | | — | | (0.50 | ) | (0.63 | ) | (0.69 | ) | (0.53 | ) | (0.09 | ) |
Total dividends | | — | | (0.58 | ) | (0.75 | ) | (0.77 | ) | (0.58 | ) | (0.12 | ) |
| | | | | | | | | | | | | |
Net Asset Value, End of Period | | $ | 17.63 | | $ | 17.24 | | $ | 14.90 | | $ | 14.57 | | $ | 15.18 | | $ | 14.06 | |
| | | | | | | | | | | | | |
Total Return | | 2.26 | %(a) | 19.62 | % | 7.36 | %(a) | 1.27 | % | 12.25 | % | 17.65 | % |
| | | | | | | | | | | | | |
Ratios/Supplemental Data: | | | | | | | | | | | | | |
Net assets at end of period (000’s) | | $ | 48,815 | | $ | 46,562 | | $ | 39,059 | | $ | 35,543 | | $ | 34,959 | | $ | 30,577 | |
Ratio of net expenses to average net assets | | 1.00 | %(b) | 1.00 | % | 1.00 | %(b) | 1.00 | % | 1.00 | % | 1.00 | % |
Ratio of net investment income to average net assets | | 0.54 | %(b) | 0.45 | % | 0.97 | %(b) | 0.59 | % | 0.35 | % | 0.30 | % |
Ratio of expenses (before fee reductions or recoupment of fees previously reimbursed by the investment adviser) to average net assets(c) | | 1.00 | %(b) | 1.01 | % | 1.04 | %(b) | 1.07 | % | 1.04 | % | 1.04 | % |
Portfolio turnover rate | | 9.93 | %(a) | 24.85 | % | 12.59 | %(a) | 20.10 | % | 16.06 | % | 14.86 | % |
Amounts designated as “—” are $0 or have been rounded to $0.
(a) Not annualized for periods less than one year.
(b) Annualized for periods less than one year.
(c) During the periods, certain fees were reduced. If such fee reduction had not occurred, the ratio would have been as indicated.
See Notes to Financial Statements
52
Schedule of Portfolio Investments | Walden SMID Cap Fund |
| June 30, 2018 |
Security Description | | Shares | | Fair Value ($) | |
COMMON STOCKS (99.2%) | | | | | |
Consumer Discretionary (11.6%) | | | | | |
Big Lots, Inc. | | 11,375 | | 475,247 | |
Brinker International, Inc. | | 8,775 | | 417,690 | |
Cheesecake Factory, Inc. | | 12,200 | | 671,731 | |
Choice Hotels International, Inc. | | 8,475 | | 640,710 | |
Dorman Products, Inc. (a) | | 8,025 | | 548,188 | |
Dunkin’ Brands Group, Inc. | | 6,000 | | 414,420 | |
Interpublic Group of Cos., Inc. | | 27,925 | | 654,562 | |
Nordstrom, Inc. | | 9,075 | | 469,904 | |
Polaris Industries, Inc. | | 3,250 | | 397,085 | |
Texas Roadhouse, Inc. | | 8,400 | | 550,284 | |
Tiffany & Co. | | 4,375 | | 575,750 | |
Williams Sonoma, Inc. | | 7,175 | | 440,402 | |
| | | | 6,255,973 | |
Consumer Staples (4.0%) | | | | | |
Church & Dwight Co., Inc. | | 16,325 | | 867,837 | |
Flowers Foods, Inc. | | 28,450 | | 592,613 | |
Lancaster Colony Corp. | | 2,950 | | 408,339 | |
Tootsie Roll Industries, Inc. | | 9,587 | | 295,759 | |
| | | | 2,164,548 | |
Energy (3.2%) | | | | | |
Apache Corp. | | 11,475 | | 536,456 | |
Dril-Quip, Inc. (a) | | 8,375 | | 430,475 | |
Helmerich & Payne, Inc. | | 11,625 | | 741,210 | |
| | | | 1,708,141 | |
Financials (17.2%) | | | | | |
American Financial Group, Inc. | | 5,425 | | 582,265 | |
Bank of Hawaii Corp. | | 7,400 | | 617,308 | |
Brown & Brown, Inc. | | 21,825 | | 605,207 | |
Cincinnati Financial Corp. | | 6,025 | | 402,832 | |
Cohen & Steers, Inc. | | 9,525 | | 397,288 | |
Commerce Bancshares, Inc. | | 9,587 | | 620,375 | |
CVB Financial Corp. | | 16,675 | | 373,854 | |
East West Bancorp, Inc. | | 8,100 | | 528,120 | |
Eaton Vance Corp. | | 10,925 | | 570,176 | |
Everest Re Group Ltd. | | 2,125 | | 489,770 | |
FactSet Research Systems, Inc. | | 3,550 | | 703,255 | |
SEI Investments Co. | | 8,825 | | 551,739 | |
Signature Bank (a) | | 6,400 | | 818,431 | |
SVB Financial Group (a) | | 1,675 | | 483,673 | |
Texas Capital Bancshares, Inc. (a) | | 4,150 | | 379,725 | |
UMB Financial Corp. | | 8,450 | | 644,144 | |
W. R. Berkley Corp. | | 7,025 | | 508,680 | |
| | | | 9,276,842 | |
Health Care (12.6%) | | | | | |
Chemed Corp. | | 2,200 | | 707,982 | |
Dentsply Sirona, Inc. | | 10,050 | | 439,889 | |
Henry Schein, Inc. (a) | | 5,425 | | 394,072 | |
Masimo Corp. (a) | | 7,850 | | 766,552 | |
Mettler-Toledo International, Inc. (a) | | 800 | | 462,904 | |
PerkinElmer, Inc. | | 8,825 | | 646,255 | |
ResMed, Inc. | | 7,100 | | 735,417 | |
STERIS PLC | | 6,050 | | 635,311 | |
The Cooper Companies, Inc. | | 2,700 | | 635,715 | |
Varian Medical Systems, Inc. (a) | | 4,500 | | 511,740 | |
Waters Corp. (a) | | 4,325 | | 837,277 | |
| | | | 6,773,114 | |
Industrials (17.3%) | | | | | |
Applied Industrial Technologies, Inc. | | 10,600 | | 743,590 | |
C.H. Robinson Worldwide, Inc. | | 5,675 | | 474,771 | |
Donaldson Co., Inc. | | 20,775 | | 937,367 | |
Expeditors International of Washington, Inc. | | 12,575 | | 919,232 | |
Franklin Electric Co., Inc. | | 8,625 | | 388,988 | |
Hexcel Corp. | | 6,100 | | 404,918 | |
Hubbell, Inc. | | 6,000 | | 634,440 | |
IDEX Corp. | | 3,550 | | 484,504 | |
Lincoln Electric Holdings, Inc. | | 7,350 | | 645,036 | |
Nordson Corp. | | 5,925 | | 760,828 | |
Sensata Technologies Holding PLC (a) | | 11,475 | | 545,981 | |
The Middleby Corp. (a) | | 4,850 | | 506,437 | |
UniFirst Corp. | | 4,075 | | 720,868 | |
Valmont Industries, Inc. | | 3,100 | | 467,325 | |
Wabtec Corp. | | 6,675 | | 658,022 | |
| | | | 9,292,307 | |
Information Technology (16.0%) | | | | | |
Akamai Technologies, Inc. (a) | | 9,525 | | 697,516 | |
Amdocs Ltd. | | 10,750 | | 711,542 | |
ANSYS, Inc. (a) | | 4,225 | | 735,911 | |
Aspen Technology, Inc. (a) | | 8,375 | | 776,697 | |
Coherent, Inc. (a) | | 1,875 | | 293,288 | |
F5 Networks, Inc. (a) | | 6,000 | | 1,034,699 | |
InterDigital, Inc. | | 4,750 | | 384,275 | |
IPG Photonics Corp. (a) | | 3,075 | | 678,437 | |
Jack Henry & Associates, Inc. | | 4,802 | | 625,989 | |
Juniper Networks, Inc. | | 20,400 | | 559,368 | |
NetApp, Inc. | | 7,050 | | 553,637 | |
NETGEAR, Inc. (a) | | 9,375 | | 585,938 | |
Tech Data Corp. (a) | | 5,550 | | 455,766 | |
Teradata Corp. (a) | | 13,100 | | 525,965 | |
| | | | 8,619,028 | |
Materials (6.0%) | | | | | |
AptarGroup, Inc. | | 8,275 | | 772,720 | |
Avery Dennison Corp. | | 5,650 | | 576,865 | |
International Flavors & Fragrances, Inc. | | 4,725 | | 585,711 | |
RPM International, Inc. | | 15,525 | | 905,418 | |
Silgan Holdings, Inc. | | 15,300 | | 410,499 | |
| | | | 3,251,213 | |
Real Estate (7.1%) | | | | | |
American Campus Communities, Inc. | | 5,850 | | 250,848 | |
Camden Property Trust | | 6,075 | | 553,615 | |
CoreSite Realty Corp. | | 6,975 | | 772,969 | |
CubeSmart | | 14,800 | | 476,856 | |
Jones Lang LaSalle, Inc. | | 3,750 | | 622,463 | |
Lamar Advertising Co., Class A | | 8,225 | | 561,850 | |
Ryman Hospitality Properties, Inc. | | 6,900 | | 573,735 | |
| | | | 3,812,336 | |
Utilities (4.2%) | | | | | |
American States Water Co. | | 7,175 | | 410,123 | |
Atmos Energy Corp. | | 6,625 | | 597,178 | |
New Jersey Resources Corp. | | 11,575 | | 517,981 | |
ONE Gas, Inc. | | 9,650 | | 721,241 | |
| | | | 2,246,523 | |
| | | | | |
TOTAL COMMON STOCKS (Cost $39,983,379) | | | | 53,400,025 | |
| | | | | |
INVESTMENT COMPANIES (0.8%) | | | | | |
| | | | | |
JPMorgan U.S. Government Money Market Fund, Capital Shares, 1.83%(b) | | 443,731 | | 443,731 | |
TOTAL INVESTMENT COMPANIES (Cost $443,731) | | | | 443,731 | |
| | | | | |
Total Investments (Cost $40,427,110) — 100.0%(c) | | | | 53,843,756 | |
Liabilities in excess of other assets — 0.0% | | | | (16,003 | ) |
NET ASSETS — 100.0% | | | | $ | 53,827,753 | |
| | | | | | |
(a) Non-income producing security.
(b) Rate disclosed is the seven day yield as of June 30, 2018.
(c) See Federal Tax Information listed in the Notes to the Financial Statements.
See Notes to Financial Statements
53
Financial Statements | Walden SMID Cap Fund |
STATEMENT OF ASSETS AND LIABILITIES
June 30, 2018 (Unaudited)
Assets: | | | |
Investments, at fair value (cost $40,427,110) | | $ | 53,843,756 | |
Dividends receivable | | 45,441 | |
Receivable for capital shares issued | | 24,388 | |
Prepaid expenses | | 12,846 | |
Total Assets | | 53,926,431 | |
Liabilities: | | | |
Payable for capital shares redeemed | | 58,434 | |
Accrued expenses and other liabilities: | | | |
Investment adviser | | 30,584 | |
Administration and accounting | | 2,883 | |
Chief compliance officer | | 247 | |
Custodian | | 404 | |
Shareholder servicing fees | | 1,962 | |
Transfer agent | | 2,870 | |
Trustee | | 165 | |
Other | | 1,129 | |
Total Liabilities | | 98,678 | |
Net Assets | | $ | 53,827,753 | |
Composition of Net Assets: | | | |
Capital | | $ | 39,179,004 | |
Accumulated undistributed net investment income | | 161,265 | |
Accumulated net realized gains from investment transactions | | 1,070,838 | |
Net unrealized appreciation from investments | | 13,416,646 | |
Net Assets | | $ | 53,827,753 | |
Shares outstanding (par value $0.01, unlimited number of shares authorized) | | 3,102,058 | |
Net Asset Value, Offering Price and Redemption price per share | | $ | 17.35 | |
STATEMENT OF OPERATIONS
For the period ended June 30, 2018 (Unaudited)
Investment Income: | | | |
Dividends | | $ | 412,667 | |
Total Investment Income | | 412,667 | |
Expenses: | | | |
Investment adviser | | 188,382 | |
Administration and accounting | | 20,356 | |
Chief compliance officer | | 2,131 | |
Custodian | | 3,130 | |
Shareholder servicing | | 14,777 | |
Transfer agency | | 17,904 | |
Trustee | | 1,343 | |
Other | | 16,559 | |
Total expenses before fee reductions | | 264,582 | |
Fees contractually reduced by the investment adviser | | (13,180 | ) |
Net Expenses | | 251,402 | |
Net Investment Income | | 161,265 | |
Net Realized/Unrealized Gains (Losses) from Investments: | | | |
Net realized gains from investment transactions | | 559,233 | |
Change in unrealized appreciation/depreciation from investments | | 1,289,023 | |
Net realized/unrealized gains (losses) from investments | | 1,848,256 | |
Change in Net Assets Resulting from Operations | | $ | 2,009,521 | |
See Notes to Financial Statements
54
STATEMENTS OF CHANGES IN NET ASSETS
| | For the | | | |
| | six months ended | | For the year ended | |
| | June 30, 2018 | | December 31, 2017 | |
| | (Unaudited) | | | |
Investment Activities: | | | | | |
Operations: | | | | | |
Net investment income | | $ | 161,265 | | $ | 202,024 | |
Net realized gains from investment transactions | | 559,233 | | 1,342,837 | |
Change in unrealized appreciation/depreciation from investments | | 1,289,023 | | 5,029,481 | |
Change in Net Assets Resulting from Operations | | 2,009,521 | | 6,574,342 | |
Dividends: | | | | | |
Net investment income | | — | | (234,490 | ) |
Net realized gains from investment transactions | | — | | (788,833 | ) |
Change in Net Assets Resulting from Shareholder Dividends | | — | | (1,023,323 | ) |
Capital Share Transactions: | | | | | |
Proceeds from shares issued | | 10,006,174 | | 8,072,991 | |
Dividends reinvested | | — | | 777,475 | |
Cost of shares redeemed | | (3,819,709 | ) | (6,898,171 | ) |
Change in Net Assets Resulting from Capital Share Transactions | | 6,186,465 | | 1,952,295 | |
Change in Net Assets | | 8,195,986 | | 7,503,314 | |
Net Assets: | | | | | |
Beginning of period | | 45,631,767 | | 38,128,453 | |
End of period | | $ | 53,827,753 | | $ | 45,631,767 | |
Share Transactions: | | | | | |
Issued | | 592,097 | | 519,460 | |
Reinvested | | — | | 47,091 | |
Redeemed | | (223,963 | ) | (445,035 | ) |
Change in shares | | 368,134 | | 121,516 | |
Accumulated undistributed net investment income | | $ | 161,265 | | $ | — | |
Amounts designated as “—” are $0 or have been rounded to $0.
See Notes to Financial Statements
55
FINANCIAL HIGHLIGHTS
Selected data for a share outstanding throughout the periods indicated.
| | | | | | For the nine | | | | | | | |
| | | | For the year | | months | | For the year | | For the year | | For the year | |
| | For the six | | ended | | ended | | ended | | ended | | ended | |
| | months ended | | December 31, | | December 31, | | March 31, | | March 31, | | March 31, | |
| | June 30, 2018 | | 2017 | | 2016 | | 2016 | | 2015 | | 2014 | |
| | (Unaudited) | | | | | | | | | | | |
Net Asset Value, Beginning of Period | | $ | 16.69 | | $ | 14.60 | | $ | 13.40 | | $ | 14.70 | | $ | 13.97 | | $ | 12.09 | |
| | | | | | | | | | | | | |
Investment Activities: | | | | | | | | | | | | | |
Operations: | | | | | | | | | | | | | |
Net investment income/(loss) | | 0.05 | | 0.07 | | 0.12 | | 0.04 | | 0.01 | | (0.01 | ) |
Net realized and unrealized gains (losses) from investment transactions | | 0.61 | | 2.40 | | 1.87 | | (0.44 | ) | 1.03 | | 2.38 | |
Total from investment activities | | 0.66 | | 2.47 | | 1.99 | | (0.40 | ) | 1.04 | | 2.37 | |
Dividends: | | | | | | | | | | | | | |
Net investment income | | — | | (0.09 | ) | (0.14 | ) | (0.02 | ) | (0.01 | ) | — | |
Net realized gains from investments | | — | | (0.29 | ) | (0.65 | ) | (0.88 | ) | (0.30 | ) | (0.49 | ) |
Total dividends | | — | | (0.38 | ) | (0.79 | ) | (0.90 | ) | (0.31 | ) | (0.49 | ) |
| | | | | | | | | | | | | |
Net Asset Value, End of Period | | $ | 17.35 | | $ | 16.69 | | $ | 14.60 | | $ | 13.40 | | $ | 14.70 | | $ | 13.97 | |
| | | | | | | | | | | | | |
Total Return | | 3.95 | %(a) | 16.94 | % | 14.73 | %(a) | (2.47 | )% | 7.60 | % | 19.68 | % |
| | | | | | | | | | | | | |
Ratios/Supplemental Data: | | | | | | | | | | | | | |
Net assets at end of period (000’s) | | $ | 53,828 | | $ | 45,632 | | $ | 38,128 | | $ | 32,452 | | $ | 28,369 | | $ | 25,780 | |
Ratio of net expenses to average net assets | | 1.00 | %(b) | 1.00 | % | 1.00 | %(b) | 1.00 | % | 1.00 | % | 1.00 | % |
Ratio of net investment income/(loss) to average net assets | | 0.64 | %(b) | 0.48 | % | 1.12 | %(b) | 0.30 | % | 0.08 | % | (0.05 | )% |
Ratio of expenses (before fee reductions or recoupment of fees previously reimbursed by the investment adviser) to average net assets(c) | | 1.05 | %(b) | 1.08 | % | 1.12 | %(b) | 1.15 | % | 1.12 | % | 1.12 | % |
Portfolio turnover rate | | 10.67 | %(a) | 31.92 | % | 20.85 | %(a) | 43.24 | % | 33.61 | % | 51.57 | % |
Amounts designated as “—” are $0 or have been rounded to $0.
(a) Not annualized for periods less than one year.
(b) Annualized for periods less than one year.
(c) During the periods, certain fees were reduced. If such fee reduction had not occurred, the ratio would have been as indicated.
See Notes to Financial Statements
56
Schedule of Portfolio Investments | Walden Small Cap Fund |
| June 30, 2018 |
Security Description | | Shares | | Fair Value ($) | |
COMMON STOCKS (99.3%) | | | | | |
Consumer Discretionary (10.8%) | | | | | |
Big Lots, Inc. | | 21,025 | | 878,425 | |
Brinker International, Inc. | | 16,325 | | 777,070 | |
Cheesecake Factory, Inc. | | 20,425 | | 1,124,601 | |
Choice Hotels International, Inc. | | 21,800 | | 1,648,080 | |
Dorman Products, Inc. (a) | | 16,625 | | 1,135,653 | |
Dunkin’ Brands Group, Inc. | | 10,675 | | 737,322 | |
Gentherm, Inc. (a) | | 13,975 | | 549,218 | |
Monro Muffler Brake, Inc. | | 17,800 | | 1,034,180 | |
Texas Roadhouse, Inc. | | 21,100 | | 1,382,261 | |
Williams Sonoma, Inc. | | 18,000 | | 1,104,840 | |
| | | | 10,371,650 | |
Consumer Staples (3.8%) | | | | | |
Flowers Foods, Inc. | | 59,450 | | 1,238,344 | |
Lancaster Colony Corp. | | 10,425 | | 1,443,028 | |
Tootsie Roll Industries, Inc. | | 29,525 | | 910,846 | |
| | | | 3,592,218 | |
Energy (2.8%) | | | | | |
Dril-Quip, Inc. (a) | | 13,900 | | 714,459 | |
Forum Energy Technologies, Inc. (a) | | 54,850 | | 677,398 | |
Natural Gas Services Group, Inc. (a) | | 14,475 | | 341,610 | |
Oceaneering International, Inc. | | 16,625 | | 423,273 | |
RPC, Inc. | | 34,775 | | 506,672 | |
| | | | 2,663,412 | |
Financials (18.3%) | | | | | |
1st Source Corp. | | 17,850 | | 953,726 | |
Artisan Partners Asset Management, Inc., Class A | | 20,425 | | 615,814 | |
Bank of Hawaii Corp. | | 17,625 | | 1,470,277 | |
Bridge BanCorp, Inc. | | 13,125 | | 471,844 | |
Bryn Mawr Bank Corp. | | 6,325 | | 292,848 | |
Camden National Corp. | | 12,800 | | 585,088 | |
Cohen & Steers, Inc. | | 21,675 | | 904,064 | |
Commerce Bancshares, Inc. | | 19,385 | | 1,254,402 | |
CVB Financial Corp. | | 30,500 | | 683,810 | |
Eaton Vance Corp. | | 27,375 | | 1,428,701 | |
German American BanCorp | | 13,325 | | 477,701 | |
Horace Mann Educators Corp. | | 13,800 | | 615,480 | |
Independent Bank Corp. | | 9,175 | | 719,320 | |
Lakeland Financial Corp. | | 15,850 | | 763,812 | |
Morningstar, Inc. | | 13,700 | | 1,757,025 | |
Texas Capital Bancshares, Inc. (a) | | 8,825 | | 807,488 | |
Tompkins Financial Corp. | | 11,500 | | 987,619 | |
UMB Financial Corp. | | 18,350 | | 1,398,820 | |
Washington Federal, Inc. | | 24,150 | | 789,705 | |
Washington Trust BanCorp, Inc. | | 8,775 | | 509,828 | |
| | | | 17,487,372 | |
Health Care (15.0%) | | | | | |
Anika Therapeutics, Inc. (a) | | 15,250 | | 488,000 | |
Atrion Corp. | | 925 | | 554,445 | |
Bio-Techne Corp. | | 10,100 | | 1,494,295 | |
Bruker Corp. | | 47,700 | | 1,385,208 | |
Chemed Corp. | | 5,625 | | 1,810,181 | |
CorVel Corp. (a) | | 13,125 | | 708,750 | |
Ensign Group, Inc. | | 28,150 | | 1,008,333 | |
Globus Medical, Inc., Class A (a) | | 21,800 | | 1,100,028 | |
Haemonetics Corp. (a) | | 15,250 | | 1,367,620 | |
Hill-Rom Holdings, Inc. | | 15,800 | | 1,379,972 | |
Masimo Corp. (a) | | 18,350 | | 1,791,878 | |
U.S. Physical Therapy, Inc. | | 13,650 | | 1,310,400 | |
| | | | 14,399,110 | |
Industrials (16.4%) | | | | | |
Applied Industrial Technologies, Inc. | | 20,625 | | 1,446,844 | |
Donaldson Co., Inc. | | 36,275 | | 1,636,728 | |
Forward Air Corp. | | 16,650 | | 983,682 | |
Franklin Electric Co., Inc. | | 32,600 | | 1,470,260 | |
Herman Miller, Inc. | | 25,600 | | 867,840 | |
Hub Group, Inc., Class A (a) | | 29,325 | | 1,460,385 | |
Kadant, Inc. | | 9,475 | | 911,021 | |
Landstar System, Inc. | | 12,100 | | 1,321,320 | |
Lincoln Electric Holdings, Inc. | | 16,125 | | 1,415,130 | |
Tennant Co. | | 10,675 | | 843,325 | |
UniFirst Corp. | | 8,025 | | 1,419,623 | |
Valmont Industries, Inc. | | 6,675 | | 1,006,256 | |
Watts Water Technologies, Inc., Class A | | 11,900 | | 932,960 | |
| | | | 15,715,374 | |
Information Technology (17.4%) | | | | | |
Aspen Technology, Inc. (a) | | 17,375 | | 1,611,358 | |
Coherent, Inc. (a) | | 6,190 | | 968,240 | |
CSG Systems International, Inc. | | 18,000 | | 735,660 | |
ExlService Holdings, Inc. (a) | | 14,675 | | 830,752 | |
InterDigital, Inc. | | 15,550 | | 1,257,995 | |
Manhattan Associates, Inc. (a) | | 20,400 | | 959,004 | |
NETGEAR, Inc. (a) | | 26,250 | | 1,640,625 | |
NIC, Inc. | | 81,350 | | 1,264,993 | |
Plantronics, Inc. | | 13,600 | | 1,037,000 | |
Power Integrations, Inc. | | 18,200 | | 1,329,510 | |
Syntel, Inc. (a) | | 36,400 | | 1,168,076 | |
Tech Data Corp. (a) | | 14,775 | | 1,213,323 | |
Teradata Corp. (a) | | 37,675 | | 1,512,650 | |
WEX, Inc. (a) | | 5,825 | | 1,109,546 | |
| | | | 16,638,732 | |
Materials (5.4%) | | | | | |
AptarGroup, Inc. | | 17,250 | | 1,610,805 | |
Bemis Co., Inc. | | 22,900 | | 966,609 | |
Minerals Technologies, Inc. | | 11,450 | | 862,757 | |
Quaker Chemical Corp. | | 4,550 | | 704,659 | |
Silgan Holdings, Inc. | | 38,825 | | 1,041,675 | |
| | | | 5,186,505 | |
Real Estate (4.8%) | | | | | |
CoreSite Realty Corp. | | 12,725 | | 1,410,184 | |
CubeSmart | | 34,700 | | 1,118,034 | |
Highwoods Properties, Inc. | | 16,100 | | 816,753 | |
Ryman Hospitality Properties, Inc. | | 14,550 | | 1,209,833 | |
| | | | 4,554,804 | |
Utilities (4.6%) | | | | | |
American States Water Co. | | 11,350 | | 648,766 | |
Hawaiian Electric Industries, Inc. | | 24,450 | | 838,635 | |
New Jersey Resources Corp. | | 26,725 | | 1,195,944 | |
ONE Gas, Inc. | | 22,800 | | 1,704,072 | |
| | | | 4,387,417 | |
| | | | | |
TOTAL COMMON STOCKS (Cost $67,693,073) | | | | 94,996,594 | |
| | | | | |
INVESTMENT COMPANIES (0.7%) | | | | | |
JPMorgan U.S. Government Money Market Fund, Capital Shares, 1.83%(b) | | 703,997 | | 703,997 | |
TOTAL INVESTMENT COMPANIES (Cost $703,997) | | | | 703,997 | |
| | | | | |
Total Investments (Cost $68,397,070) — 100.0%(c) | | | | 95,700,591 | |
Other assets in excess of liabilities — 0.0% | | | | 17,481 | |
NET ASSETS — 100.0% | | | | $ | 95,718,072 | |
| | | | | | |
(a) Non-income producing security.
(b) Rate disclosed is the seven day yield as of June 30, 2018.
(c) See Federal Tax Information listed in the Notes to the Financial Statements.
See Notes to Financial Statements
57
Financial Statements | Walden Small Cap Fund |
STATEMENT OF ASSETS AND LIABILITIES
June 30, 2018 (Unaudited)
Assets: | | | |
Investments, at fair value (cost $68,397,070) | | $ | 95,700,591 | |
Dividends receivable | | 79,062 | |
Prepaid expenses | | 16,286 | |
Total Assets | | 95,795,939 | |
Liabilities: | | | |
Accrued expenses and other liabilities: | | | |
Investment adviser | | 56,097 | |
Administration and accounting | | 6,632 | |
Chief compliance officer | | 674 | |
Custodian | | 1,149 | |
Shareholder servicing fees | | 6,294 | |
Transfer agent | | 3,492 | |
Trustee | | 451 | |
Other | | 3,078 | |
Total Liabilities | | 77,867 | |
Net Assets | | $ | 95,718,072 | |
Composition of Net Assets: | | | |
Capital | | $ | 66,672,731 | |
Accumulated undistributed net investment income | | 343,440 | |
Accumulated net realized gains from investment transactions | | 1,398,380 | |
Net unrealized appreciation from investments | | 27,303,521 | |
Net Assets | | $ | 95,718,072 | |
Shares outstanding (par value $0.01, unlimited number of shares authorized) | | 4,707,067 | |
Net Asset Value, Offering Price and Redemption price per share | | $ | 20.34 | * |
* NAV does not recalculate due to rounding of financial statement figures.
STATEMENT OF OPERATIONS
For the period ended June 30, 2018 (Unaudited)
Investment Income: | | | |
Dividends | | $ | 773,871 | |
Total Investment Income | | 773,871 | |
Expenses: | | | |
Investment adviser | | 356,743 | |
Administration and accounting | | 39,578 | |
Chief compliance officer | | 4,284 | |
Custodian | | 6,327 | |
Shareholder servicing | | 33,698 | |
Transfer agency | | 18,274 | |
Trustee | | 2,706 | |
Other | | 28,233 | |
Total expenses before fee reductions | | 489,843 | |
Fees contractually reduced by the investment adviser | | (14,251 | ) |
Net Expenses | | 475,592 | |
Net Investment Income | | 298,279 | |
Net Realized/Unrealized Gains (Losses) from Investments: | | | |
Net realized gains from investment transactions | | 1,465,540 | |
Change in unrealized appreciation/depreciation from investments | | 2,693,486 | |
Net realized/unrealized gains (losses) from investments | | 4,159,026 | |
Change in Net Assets Resulting from Operations | | $ | 4,457,305 | |
See Notes to Financial Statements
58
STATEMENTS OF CHANGES IN NET ASSETS
| | For the | | | |
| | six months ended | | For the year ended | |
| | June 30, 2018 | | December 31, 2017 | |
| | (Unaudited) | | | |
Investment Activities: | | | | | |
Operations: | | | | | |
Net investment income | | $ | 298,279 | | $ | 410,814 | |
Net realized gains from investment transactions | | 1,465,540 | | 3,897,223 | |
Change in unrealized appreciation/depreciation from investments | | 2,693,486 | | 5,447,583 | |
Change in Net Assets Resulting from Operations | | 4,457,305 | | 9,755,620 | |
Dividends: | | | | | |
Net investment income | | — | | (474,566 | ) |
Net realized gains from investment transactions | | — | | (4,812,342 | ) |
Change in Net Assets Resulting from Shareholder Dividends | | — | | (5,286,908 | ) |
Capital Share Transactions: | | | | | |
Proceeds from shares issued | | 2,502,407 | | 14,199,045 | |
Dividends reinvested | | — | | 4,225,840 | |
Cost of shares redeemed | | (9,385,082 | ) | (9,948,923 | ) |
Change in Net Assets Resulting from Capital Share Transactions | | (6,882,675 | ) | 8,475,962 | |
Change in Net Assets | | (2,425,370 | ) | 12,944,674 | |
Net Assets: | | | | | |
Beginning of period | | 98,143,442 | | 85,198,768 | |
End of period | | $ | 95,718,072 | | $ | 98,143,442 | |
Share Transactions: | | | | | |
Issued | | 125,378 | | 743,521 | |
Reinvested | | — | | 219,867 | |
Redeemed | | (474,514 | ) | (522,532 | ) |
Change in shares | | (349,136 | ) | 440,856 | |
Accumulated undistributed net investment income | | $ | 343,440 | | $ | 45,161 | |
Amounts designated as “—” are $0 or have been rounded to $0.
See Notes to Financial Statements
59
FINANCIAL HIGHLIGHTS
Selected data for a share outstanding throughout the periods indicated.
| | | | | | For the nine | | | | | | | |
| | | | For the year | | months | | For the year | | For the year | | For the year | |
| | For the six | | ended | | ended | | ended | | ended | | ended | |
| | months ended | | December 31, | | December 31, | | March 31, | | March 31, | | March 31, | |
| | June 30, 2018 | | 2017 | | 2016 | | 2016 | | 2015 | | 2014 | |
| | (Unaudited) | | | | | | | | | | | |
Net Asset Value, Beginning of Period | | $ | 19.41 | | $ | 18.46 | | $ | 16.45 | | $ | 19.66 | | $ | 20.43 | | $ | 18.48 | |
| | | | | | | | | | | | | |
Investment Activities: | | | | | | | | | | | | | |
Operations: | | | | | | | | | | | | | |
Net investment income | | 0.06 | | 0.09 | | 0.16 | | 0.08 | | 0.04 | | 0.01 | |
Net realized and unrealized gains (losses) from investment transactions | | 0.87 | | 2.02 | | 2.58 | | (0.38 | ) | 0.66 | | 3.42 | |
Total from investment activities | | 0.93 | | 2.11 | | 2.74 | | (0.30 | ) | 0.70 | | 3.43 | |
Dividends: | | | | | | | | | | | | | |
Net investment income | | — | | (0.10 | ) | (0.17 | ) | (0.07 | ) | (0.02 | ) | — | |
Net realized gains from investments | | — | | (1.06 | ) | (0.56 | ) | (2.84 | ) | (1.45 | ) | (1.48 | ) |
Total dividends | | — | | (1.16 | ) | (0.73 | ) | (2.91 | ) | (1.47 | ) | (1.48 | ) |
| | | | | | | | | | | | | |
Net Asset Value, End of Period | | $ | 20.34 | | $ | 19.41 | | $ | 18.46 | | $ | 16.45 | | $ | 19.66 | | $ | 20.43 | |
| | | | | | | | | | | | | |
Total Return | | 4.79 | %(a) | 11.50 | % | 16.57 | %(a) | (0.80 | )% | 3.86 | % | 18.58 | % |
| | | | | | | | | | | | | |
Ratios/Supplemental Data: | | | | | | | | | | | | | |
Net assets at end of period (000’s) | | $ | 95,718 | | $ | 98,143 | | $ | 85,199 | | $ | 69,754 | | $ | 87,740 | | $ | 103,791 | |
Ratio of net expenses to average net assets | | 1.00 | %(b) | 1.00 | % | 1.00 | %(b) | 1.00 | % | 1.00 | % | 1.00 | % |
Ratio of net investment income to average net assets | | 0.63 | %(b) | 0.47 | % | 1.14 | %(b) | 0.45 | % | 0.17 | % | 0.03 | % |
Ratio of expenses (before fee reductions or recoupment of fees previously reimbursed by the investment adviser) to average net assets(c) | | 1.03 | %(b) | 1.03 | % | 1.06 | %(b) | 1.06 | % | 1.01 | % | 1.05 | % |
Portfolio turnover rate | | 10.77 | %(a) | 27.16 | % | 14.71 | %(a) | 38.05 | % | 28.74 | % | 36.60 | % |
Amounts designated as “—” are $0 or have been rounded to $0.
(a) Not annualized for periods less than one year.
(b) Annualized for periods less than one year.
(c) During the periods, certain fees were reduced. If such fee reduction had not occurred, the ratio would have been as indicated.
See Notes to Financial Statements
60
Schedule of Portfolio Investments | Walden International Equity Fund |
| June 30, 2018 |
Security Description | | Shares | | Fair Value ($) | |
COMMON STOCKS (98.1%) | | | | | |
Australia (6.0%) | | | | | |
Australia & New Zealand Banking Group Ltd. | | 11,096 | | 231,849 | |
Brambles Ltd. | | 34,113 | | 224,134 | |
Commonwealth Bank of Australia | | 7,569 | | 408,095 | |
CSL Ltd. | | 2,877 | | 410,030 | |
Origin Energy Ltd.(a) | | 50,479 | | 374,616 | |
Telstra Corp. Ltd. | | 97,283 | | 188,587 | |
Westpac Banking Corp. | | 14,352 | | 311,139 | |
Woodside Petroleum Ltd. | | 16,719 | | 438,655 | |
| | | | 2,587,105 | |
Belgium (0.8%) | | | | | |
Colruyt SA | | 5,856 | | 334,177 | |
| | | | 334,177 | |
Canada (8.3%) | | | | | |
Bank of Montreal | | 6,130 | | 473,892 | |
BCE, Inc. | | 5,842 | | 236,613 | |
Canadian National Railway Co. | | 4,673 | | 382,265 | |
Great-West Lifeco, Inc. | | 12,649 | | 311,005 | |
Intact Financial Corp. | | 3,270 | | 231,972 | |
Magna International, Inc. | | 4,266 | | 248,139 | |
Metro, Inc. | | 8,019 | | 272,628 | |
Royal Bank of Canada | | 6,484 | | 488,285 | |
The Bank of Nova Scotia | | 6,900 | | 390,746 | |
The Toronto-Dominion Bank | | 9,285 | | 537,464 | |
| | | | 3,573,009 | |
Denmark (1.4%) | | | | | |
Novo Nordisk A/S | | 7,776 | | 360,818 | |
Novozymes A/S | | 4,918 | | 249,558 | |
| | | | 610,376 | |
Finland (0.8%) | | | | | |
Kone OYJ | | 6,517 | | 332,250 | |
| | | | 332,250 | |
France (8.7%) | | | | | |
Air Liquide SA | | 3,447 | | 433,501 | |
Danone SA | | 5,673 | | 416,476 | |
Dassault Systemes | | 3,330 | | 466,615 | |
Essilor International SA | | 2,907 | | 410,398 | |
Imerys SA | | 4,154 | | 335,908 | |
Legrand SA | | 4,891 | | 359,238 | |
L’Oreal SA | | 1,784 | | 440,594 | |
Publicis Groupe SA | | 4,098 | | 282,043 | |
Schneider Electric SE | | 4,472 | | 372,953 | |
Societe BIC SA | | 2,623 | | 243,194 | |
| | | | 3,760,920 | |
Germany (8.8%) | | | | | |
Allianz SE | | 2,165 | | 447,522 | |
Beiersdorf AG | | 2,649 | | 300,788 | |
Deutsche Boerse AG | | 3,056 | | 407,345 | |
Fresenius SE & Co. KGaA | | 5,158 | | 414,384 | |
Fuchs Petrolub SE | | 4,952 | | 244,252 | |
Hannover Rueck SE | | 1,789 | | 223,108 | |
Henkel AG & Co. KGaA | | 2,115 | | 235,239 | |
Hugo Boss AG | | 2,890 | | 262,414 | |
Linde AG | | 1,202 | | 286,892 | |
Merck KGaA | | 2,231 | | 217,843 | |
Muenchener Rueckversicherungs-Gesellschaft AG | | 1,010 | | 213,527 | |
SAP AG | | 4,429 | | 511,747 | |
| | | | 3,765,061 | |
| | | | | |
Hong Kong (3.0%) | | | | | |
Hang Lung Properties Ltd. | | 132,400 | | 273,056 | |
Hang Seng Bank Ltd. | | 14,820 | | 370,623 | |
Hysan Development Co. Ltd. | | 62,000 | | 346,138 | |
MTR Corp. Ltd. | | 54,900 | | 303,702 | |
| | | | 1,293,519 | |
Ireland (1.7%) | | | | | |
Experian PLC | | 15,812 | | 391,096 | |
Kerry Group PLC | | 3,100 | | 323,799 | |
| | | | 714,895 | |
Israel (0.7%) | | | | | |
Nice Systems Ltd.(a) | | 2,738 | | 282,818 | |
| | | | 282,818 | |
Italy (2.2%) | | | | | |
Luxottica Group SpA | | 5,132 | | 331,154 | |
Snam SpA | | 78,869 | | 329,335 | |
Terna Rete Elettrica Nazionale SpA | | 50,472 | | 272,994 | |
| | | | 933,483 | |
Japan (21.5%) | | | | | |
Astellas Pharma, Inc. | | 18,850 | | 287,603 | |
Benesse Holdings, Inc. | | 7,560 | | 268,390 | |
Canon, Inc. | | 10,775 | | 353,424 | |
Central Japan Railway Co. | | 1,415 | | 293,481 | |
Chugai Pharmaceutical Co. Ltd. | | 5,300 | | 278,166 | |
Daiwa House Industry Co. Ltd. | | 9,890 | | 337,349 | |
East Japan Railway Co. | | 2,725 | | 261,300 | |
Fast Retailing Co. Ltd. | | 805 | | 370,213 | |
JSR Corp. | | 13,200 | | 224,889 | |
Kao Corp. | | 3,600 | | 274,797 | |
KDDI Corp. | | 9,600 | | 262,851 | |
Kurita Water Industries Ltd. | | 8,200 | | 234,074 | |
Mitsubishi Estate Co. Ltd. | | 18,800 | | 328,958 | |
Nippon Telegraph & Telephone Corp. | | 7,632 | | 347,197 | |
Nitto Denko Corp. | | 3,400 | | 257,472 | |
Nomura Research Institute Ltd. | | 6,688 | | 324,431 | |
NTT DOCOMO, Inc. | | 14,310 | | 364,860 | |
Oracle Corporation Japan | | 3,700 | | 302,484 | |
Oriental Land Co. Ltd. | | 4,225 | | 443,682 | |
Secom Co. Ltd. | | 3,835 | | 294,710 | |
Sumitomo Mitsui Financial Group, Inc. | | 9,150 | | 355,917 | |
Terumo Corp. | | 6,800 | | 390,063 | |
The Chiba Bank Ltd. | | 40,245 | | 284,660 | |
The Hachijuni Bank Ltd. | | 54,240 | | 232,247 | |
The Shizuoka Bank Ltd. | | 33,180 | | 300,029 | |
Tokio Marine Holdings, Inc. | | 5,950 | | 279,118 | |
Tokyo Gas Co. Ltd. | | 12,200 | | 324,066 | |
Toyota Motor Corp. | | 6,440 | | 417,117 | |
Yahoo Japan Corp. | | 61,835 | | 205,558 | |
Yamato Holdings Co. Ltd. | | 13,075 | | 385,518 | |
| | | | 9,284,624 | |
Luxembourg (0.8%) | | | | | |
Tenaris SA | | 19,307 | | 354,293 | |
| | | | 354,293 | |
Netherlands (4.5%) | | | | | |
Akzo Nobel NV | | 4,164 | | 356,506 | |
Core Laboratories NV | | 3,056 | | 385,698 | |
Koninklijke Ahold Delhaize NV | | 18,813 | | 450,455 | |
Koninklijke Vopak NV | | 8,095 | | 374,039 | |
Wolters Kluwer NV | | 6,754 | | 380,611 | |
| | | | 1,947,309 | |
See Notes to Financial Statements
61
Security Description | | Shares | | Fair Value ($) | |
Norway (0.7%) | | | | | |
Statoil ASA | | 10,777 | | 286,465 | |
| | | | 286,465 | |
Singapore (1.2%) | | | | | |
ComfortDelGro Corp. Ltd. | | 174,950 | | 301,815 | |
Singapore Exchange Ltd. | | 41,400 | | 217,911 | |
| | | | 519,726 | |
Spain (3.0%) | | | | | |
Banco Bilbao Vizcaya Argentaria SA | | 50,988 | | 361,639 | |
Enagas SA | | 11,341 | | 331,604 | |
Gas Natural SDG SA | | 12,002 | | 317,856 | |
Inditex SA | | 8,595 | | 293,666 | |
| | | | 1,304,765 | |
Sweden (2.3%) | | | | | |
Atlas Copco AB, Class A | | 6,310 | | 183,794 | |
Epiroc AB, Class A(a) | | 6,310 | | 66,237 | |
Hennes & Mauritz AB | | 16,596 | | 247,444 | |
Nordea Bank AB | | 29,675 | | 285,952 | |
Svenska Handelsbanken AB | | 20,076 | | 223,231 | |
| | | | 1,006,658 | |
Switzerland (7.3%) | | | | | |
ABB Ltd. | | 10,427 | | 228,680 | |
Cie Financiere Richemont SA | | 3,329 | | 282,893 | |
Givaudan SA | | 118 | | 268,447 | |
Nestle SA | | 7,548 | | 586,363 | |
Roche Holding AG | | 3,235 | | 720,760 | |
SGS SA | | 134 | | 357,640 | |
Sonova Holding AG-REG | | 1,830 | | 328,786 | |
Zurich Insurance Group AG | | 1,174 | | 348,796 | |
| | | | 3,122,365 | |
United Kingdom (14.4%) | | | | | |
Admiral Group PLC | | 9,911 | | 249,455 | |
Burberry Group PLC | | 12,989 | | 370,203 | |
Compass Group PLC | | 17,226 | | 367,882 | |
Croda International PLC | | 5,711 | | 361,864 | |
Investec PLC | | 34,827 | | 247,235 | |
ITV PLC | | 114,566 | | 263,036 | |
Johnson Matthey PLC | | 8,313 | | 396,970 | |
London Stock Exchange Group PLC | | 6,576 | | 387,951 | |
Marks & Spencer Group PLC | | 56,865 | | 221,424 | |
National Grid PLC | | 35,861 | | 396,721 | |
Next PLC | | 3,982 | | 317,884 | |
Reckitt Benckiser Group PLC | | 5,118 | | 421,334 | |
RELX PLC | | 14,529 | | 311,051 | |
Sage Group PLC | | 41,182 | | 341,580 | |
Schroders PLC | | 6,790 | | 282,939 | |
Smith & Nephew PLC | | 13,802 | | 254,601 | |
Smiths Group PLC | | 12,557 | | 281,342 | |
Unilever PLC | | 8,526 | | 471,604 | |
WPP PLC | | 14,697 | | 231,356 | |
| | | | 6,176,432 | |
TOTAL COMMON STOCKS (Cost $38,961,889) | | | | 42,190,250 | |
| | | | | |
INVESTMENT COMPANIES (0.7%) | | | | | |
JPMorgan U.S. Government Money | | | | | |
Market Fund, Capital Shares, 1.83%(b) | | 288,114 | | 288,114 | |
TOTAL INVESTMENT COMPANIES (Cost $288,114) | | | | 288,114 | |
| | | | | |
Total Investments (Cost $39,250,003) — 98.8%(c) | | | | 42,478,364 | |
Other assets in excess of liabilities — 1.2% | | | | 531,689 | |
NET ASSETS — 100.0% | | | | $ | 43,010,053 | |
| | | | | | |
(a) Non-income producing security.
(b) Rate disclosed is the seven day yield as of June 30, 2018.
(c) See Federal Tax Information listed in the Notes to the Financial Statements.
The Fund invested, as a percentage of net assets at value, in the following industries as of June 30, 2018:
| | Percentage of Total | |
Industry | | Net Assets | |
Financials | | 20.9 | % |
Industrials | | 14.3 | % |
Consumer Discretionary | | 12.4 | % |
Consumer Staples | | 10.5 | % |
Health Care | | 9.6 | % |
Materials | | 7.9 | % |
Energy | | 6.8 | % |
Information Technology | | 6.5 | % |
Telecommunication Services | | 3.3 | % |
Utilities | | 3.0 | % |
Real Estate | | 2.9 | % |
Investment Companies | | 0.7 | % |
Other net assets | | 1.2 | % |
Total | | 100.0 | % |
See Notes to Financial Statements
62
Financial Statements | Walden International Equity Fund |
STATEMENT OF ASSETS AND LIABILITIES
June 30, 2018 (Unaudited)
Assets: | | | |
Investments, at fair value (cost $39,250,003) | | $ | 42,478,364 | |
Cash | | 376,278 | |
Foreign currency, at fair value (cost $21,830) | | 21,830 | |
Dividends receivable | | 104,356 | |
Receivable for tax reclaims | | 66,014 | |
Prepaid expenses | | 1,410 | |
Total Assets | | 43,048,252 | |
Liabilities: | | | |
Accrued expenses and other liabilities: | | | |
Investment adviser | | 25,498 | |
Administration and accounting | | 5,374 | |
Chief compliance officer | | 240 | |
Custodian | | 3,469 | |
Transfer agent | | 2,378 | |
Trustee | | 161 | |
Other | | 1,079 | |
Total Liabilities | | 38,199 | |
Net Assets | | $ | 43,010,053 | |
Composition of Net Assets: | | | |
Capital | | $ | 39,532,643 | |
Accumulated undistributed net investment income | | 529,706 | |
Accumulated net realized (losses) from investment transactions | | (279,508 | ) |
Net unrealized appreciation from investments | | 3,227,212 | |
Net Assets | | $ | 43,010,053 | |
Shares outstanding (par value $0.01, unlimited number of shares authorized) | | 3,901,477 | |
Net Asset Value, Offering Price and Redemption price per share | | $ | 11.02 | |
STATEMENT OF OPERATIONS
For the period ended June 30, 2018 (Unaudited)
Investment Income: | | | |
Dividends | | $ | 871,886 | |
Less: Foreign tax withholding | | (97,231 | ) |
Total Investment Income | | 774,655 | |
Expenses: | | | |
Investment adviser | | 158,311 | |
Administration and accounting | | 35,370 | |
Chief compliance officer | | 1,912 | |
Custodian | | 25,339 | |
Transfer agency | | 14,021 | |
Trustee | | 1,202 | |
Other | | 8,497 | |
Total expenses before fee reductions | | 244,652 | |
Fees contractually reduced by the investment adviser | | (1,845 | ) |
Net Expenses | | 242,807 | |
Net Investment Income | | 531,848 | |
Net Realized/Unrealized Gains (Losses) from Investments: | | | |
Net realized (losses) from investment securities and foreign currency transactions | | (58,412 | ) |
Change in unrealized appreciation/depreciation from investment securities and foreign currency transactions | | (661,346 | ) |
Net realized/unrealized gains (losses) from investments | | (719,758 | ) |
Change in Net Assets Resulting from Operations | | $ | (187,910 | ) |
See Notes to Financial Statements
63
STATEMENTS OF CHANGES IN NET ASSETS
| | For the | | | |
| | six months ended | | For the year ended | |
| | June 30, 2018 | | December 31, 2017 | |
| | (Unaudited) | | | |
Investment Activities: | | | | | |
Operations: | | | | | |
Net investment income | | $ | 531,848 | | $ | 467,578 | |
Net realized gains from investment transactions | | (58,412 | ) | (91,800 | ) |
Change in unrealized appreciation/depreciation from investments | | (661,346 | ) | 4,623,573 | |
Change in Net Assets Resulting from Operations | | (187,910 | ) | 4,999,351 | |
Dividends: | | | | | |
Net investment income | | — | | (471,514 | ) |
Change in Net Assets Resulting from Shareholder Dividends | | — | | (471,514 | ) |
Capital Share Transactions: | | | | | |
Proceeds from shares issued | | 2,062,995 | | 21,755,505 | |
Dividends reinvested | | — | | 335,788 | |
Cost of shares redeemed | | (99,316 | ) | (97,588 | ) |
Change in Net Assets Resulting from Capital Share Transactions | | 1,963,679 | | 21,993,705 | |
Change in Net Assets | | 1,775,769 | | 26,521,542 | |
Net Assets: | | | | | |
Beginning of period | | 41,234,284 | | 14,712,742 | |
End of period | | $ | 43,010,053 | | $ | 41,234,284 | |
Share Transactions: | | | | | |
Issued | | 185,420 | | 2,130,028 | |
Reinvested | | — | | 30,582 | |
Redeemed | | (9,030 | ) | (10,065 | ) |
Change in shares | | 176,390 | | 2,150,545 | |
Accumulated undistributed net investment income/(distributions in excess of net investment income) | | $ | 529,706 | | $ | (2,142 | ) |
Amounts designated as “—” are $0 or have been rounded to $0.
See Notes to Financial Statements
64
FINANCIAL HIGHLIGHTS
Selected data for a share outstanding throughout the periods indicated.
| | | | | | For the nine | | Period | |
| | | | For the year | | months | | June 9, 2015 | |
| | For the six | | ended | | ended | | through | |
| | months ended | | December 31, | | December 31, | | March 31, | |
| | June 30, 2018 | | 2017 | | 2016 | | 2016(a) | |
| | (Unaudited) | | | | | | | |
Net Asset Value, Beginning of Period | | $ | 11.07 | | $ | 9.34 | | $ | 9.45 | | $ | 10.00 | |
| | | | | | | | | |
Investment Activities: | | | | | | | | | |
Operations: | | | | | | | | | |
Net investment income | | 0.14 | | 0.13 | | 0.12 | | 0.08 | |
Net realized and unrealized gains (losses) from investment transactions | | (0.19 | ) | 1.73 | | (0.06 | ) | (0.59 | ) |
Total from investment activities | | (0.05 | ) | 1.86 | | 0.06 | | (0.51 | ) |
Dividends: | | | | | | | | | |
Net investment income | | — | | (0.13 | ) | (0.17 | ) | (0.04 | ) |
Net realized gains from investments | | — | | — | | — | | — | |
Total dividends | | — | | (0.13 | ) | (0.17 | ) | (0.04 | ) |
| | | | | | | | | |
Net Asset Value, End of Period | | $ | 11.02 | | $ | 11.07 | | $ | 9.34 | | $ | 9.45 | |
| | | | | | | | | |
Total Return | | (0.45 | )%(b) | 19.92 | % | 0.62 | %(b) | (5.09 | )%(b) |
| | | | | | | | | |
Ratios/Supplemental Data: | | | | | | | | | |
Net assets at end of period (000’s) | | $ | 43,010 | | $ | 41,234 | | $ | 14,713 | | $ | 12,786 | |
Ratio of net expenses to average net assets | | 1.15 | %(c) | 1.15 | % | 1.15 | %(c) | 1.15 | %(c) |
Ratio of net investment income to average net assets | | 2.52 | %(c) | 1.57 | % | 1.87 | %(c) | 1.22 | %(c) |
Ratio of expenses (before fee reductions or recoupment of fees previously reimbursed by the investment adviser) to average net assets(d) | | 1.16 | %(c) | 1.31 | % | 1.86 | %(c) | 2.21 | %(c) |
Portfolio turnover rate | | 1.76 | %(b) | 10.16 | % | 4.90 | %(b) | 5.11 | %(b) |
Amounts designated as “—” are $0 or have been rounded to $0.
(a) Commencement of operations on June 9, 2015.
(b) Not annualized for periods less than one year.
(c) Annualized for periods less than one year.
(d) During the periods, certain fees were reduced. If such fee reduction had not occurred, the ratio would have been as indicated.
See Notes to Financial Statements
65
Notes to Financial Statements | June 30, 2018 |
1. Organization:
The Boston Trust & Walden Funds (the “Trust”) was organized on January 8, 1992 as a Massachusetts business trust and is registered under the Investment Company Act of 1940, as amended (the “1940 Act”), as an open-end management investment company. The Trust contains the following funds (individually a “Fund”, collectively the “Funds”), each of which are registered as a diversified Fund under the 1940 Act:
Fund | | Short Name |
Boston Trust Asset Management Fund | | Asset Management Fund |
Boston Trust Equity Fund | | Equity Fund |
Boston Trust Midcap Fund | | Midcap Fund |
Boston Trust SMID Cap Fund | | SMID Cap Fund |
Boston Trust Small Cap Fund | | Small Cap Fund |
| | |
Walden Asset Management Fund | | Walden Asset Management Fund |
Walden Equity Fund | | Walden Equity Fund |
Walden Midcap Fund | | Walden Midcap Fund |
Walden SMID Cap Fund | | Walden SMID Cap Fund |
Walden Small Cap Fund | | Walden Small Cap Fund |
Walden International Equity Fund | | Walden International Equity Fund |
The investment objective of the Asset Management Fund and Walden Asset Management Fund is to seek long-term capital growth and income through an actively managed portfolio of stocks, bonds and money market instruments. The investment objective of the Equity Fund and Walden Equity Fund is to seek long-term capital growth through an actively managed portfolio of stocks. The investment objective of the Midcap Fund and Walden Midcap Fund is to seek long-term capital growth through an actively managed portfolio of stocks of middle capitalization companies. The investment objective of the SMID Cap Fund and Walden SMID Cap Fund is to seek long-term capital growth through an actively managed portfolio of stocks of small to middle capitalization companies. The investment objective of the Small Cap Fund and Walden Small Cap Fund is to seek long-term capital growth through an actively managed portfolio of stocks of small capitalization companies. The investment objective of the Walden International Equity Fund is to seek long-term capital growth through an actively managed portfolio of equities of international companies.
Under the Trust’s organizational documents, its officers and trustees are indemnified against certain liabilities arising out of the performance of their duties to the Trust. In addition, in the normal course of business, the Trust may enter into contracts with its vendors and others that provide for general indemnifications. Each Fund’s maximum exposure under these arrangements is unknown, as this would involve future claims that may be made against the Funds. However, based on experience, the Funds expect risk of loss to be remote.
2. Significant Accounting Policies:
The following is a summary of significant accounting policies followed by the Funds in the preparation of their financial statements. The policies are in conformity with accounting principles generally accepted in the United States of America (“GAAP”).
The preparation of financial statements in conformity with GAAP requires management to make estimates and assumptions that affect the reported amounts of assets and liabilities, the disclosure of contingent assets and liabilities at the date of the financial statements and the reported amounts of increases and decreases in net assets from operations during the reporting period. Actual results may differ from those estimates.
The Funds are investment companies and accordingly follow the investment company accounting and reporting guidance of the Financial Accounting Standards Board (FASB) Accounting Standards Codification Topic 946 Financial Services - Investment Companies and ASU 2013-08.
Security Valuation:
The Funds record their investments at fair value. Fair value is defined as the price that would be received to sell an asset or paid to transfer a liability in an orderly transaction between market participants at the measurement date. The valuation techniques used to determine fair value are further described below.
The value of each equity security, including common stocks, is based either on the last sale price on a national securities exchange, or in the absence of recorded sales, at the closing bid prices on such exchanges, or at the quoted bid price in the over-the-counter market. Equity securities traded on the NASDAQ stock market are valued at the NASDAQ official closing price. The prices for foreign securities are reported in local currency and converted to U.S dollars using currency exchange rates. Prices for most securities held in the Funds are provided daily by a recognized independent pricing service.
Bonds and other fixed income securities (other than short-term obligations but including listed issues) are provided by an independent pricing service, the use of which has been approved by the Board. In making such valuations, the pricing service utilizes both dealer-supplied valuations and electronic data processing techniques that take into account appropriate factors such as institutional-size trading in similar groups of securities, yield, quality, coupon rate, maturity, type of issue, and trading characteristics other than market data and without exclusive reliance upon quoted prices or exchanges or over-the-counter prices, since such valuations are believed to reflect more accurately the fair value of such securities. All debt portfolio securities with a remaining maturity of 60 days or less may be valued at amortized cost, which approximates fair value. Under the amortized cost method, discount or premium, if any, is accreted or amortized, respectively, on a constant (straight-line) basis to the maturity of the security.
The Trust may use a pricing service to value certain portfolio securities where the prices provided are believed to reflect the fair value of such securities. If market prices are not readily available or, in the opinion of the Adviser, market prices do not reflect fair value, or if an event occurs after the close of trading on the exchange or market on which the security is principally traded (but prior to the time the NAV is calculated) that materially affects fair value, the Adviser will value the Funds’ assets at their fair value according to policies approved by the Board. The Adviser believes that foreign security values may be affected by volatility that occurs in global markets on a trading day after the close of any given foreign securities markets. The fair valuation procedures, therefore, include a procedure whereby foreign security prices may be “fair valued” by an independent pricing service through the use of factors which take such volatility into account.
Investments in investment companies and money market funds are valued at net asset value per share.
Continued
66
Notes to Financial Statements | June 30, 2018 |
Fair Value Measurements:
The valuation techniques employed by the Funds, as described above in Security Valuation, maximize the use of observable inputs and minimize the use of unobservable inputs in determining fair value. The inputs used for valuing the Funds’ investments are summarized in the three broad levels listed below:
Level 1 — quoted prices in active markets for identical assets
Level 2 — other significant observable inputs (including quoted prices for similar securities, interest rates, prepayment speeds, credit risk, etc.)
Level 3 — significant unobservable inputs (including the Funds’ own assumptions in determining the fair value of investments)
The inputs or methodology used to value investments are not necessarily an indication of the risk associated with investing in those investments.
Pursuant to the valuation techniques described above in Security Valuation, equity securities are generally categorized as Level 1 securities in the fair value hierarchy (unless there is a fair valuation event, in which case affected securities are generally categorized as Level 2 securities). Debt securities, including those with a remaining maturity of 60 days or less, are generally categorized as Level 2 securities in the fair value hierarchy. Open-ended investment companies and money market funds are generally categorized as Level 1 securities in the fair value hierarchy.
Investments for which there are no such quotations, or for which quotations do not appear reliable, are valued at fair value as determined in good faith by the Adviser under the direction of the Board. These valuations are typically categorized as Level 2 or Level 3 in the fair value hierarchy.
The following is a summary of the valuation inputs used as of June 30, 2018 in valuing the Funds’ investments based on the three levels defined above:
| | | | Level 2 | | | |
| | Level 1 | | Other Significant | | Total Investments | |
Fund Name | | Quoted Prices | | Observable Inputs | | in Securities | |
Asset Management Fund | | | | | | | |
Common Stocks(1) | | $ | 376,845,993 | | $ | — | | $ | 376,845,993 | |
Corporate Bonds(1) | | — | | 12,596,504 | | 12,596,504 | |
Municipal Bonds(2) | | — | | 4,109,068 | | 4,109,068 | |
U.S. Government & U.S. Government Agency Obligations | | — | | 79,885,865 | | 79,885,865 | |
Investment Companies | | 6,610,817 | | — | | 6,610,817 | |
Total | | 383,456,810 | | 96,591,437 | | 480,048,247 | |
Equity Fund | | | | | | | |
Common Stocks(1) | | 130,935,527 | | — | | 130,935,527 | |
Investment Companies | | 1,453,726 | | — | | 1,453,726 | |
Total | | 132,389,253 | | — | | 132,389,253 | |
Midcap Fund | | | | | | | |
Common Stocks(1) | | 61,699,973 | | — | | 61,699,973 | |
Investment Companies | | 685,038 | | — | | 685,038 | |
Total | | 62,385,011 | | — | | 62,385,011 | |
SMID Cap Fund | | | | | | | |
Common Stocks(1) | | 73,135,962 | | — | | 73,135,962 | |
Investment Companies | | 747,983 | | — | | 747,983 | |
Total | | 73,883,945 | | — | | 73,883,945 | |
Small Cap Fund | | | | | | | |
Common Stocks(1) | | 287,631,996 | | — | | 287,631,996 | |
Investment Companies | | 1,895,610 | | — | | 1,895,610 | |
Total | | 289,527,606 | | — | | 289,527,606 | |
Walden Asset Management Fund | | | | | | | |
Common Stocks(1) | | 88,944,268 | | — | | 88,944,268 | |
Certificate of Deposit | | — | | 98,860 | | 98,860 | |
Corporate Bonds(1) | | — | | 3,692,152 | | 3,692,152 | |
Municipal Bonds(2) | | — | | 444,228 | | 444,228 | |
U.S. Government & U.S. Government Agency Obligations | | — | | 28,877,977 | | 28,877,977 | |
Investment Companies | | 3,364,708 | | — | | 3,364,708 | |
Total | | 92,308,976 | | 33,113,217 | | 125,422,193 | |
Walden Equity Fund | | | | | | | |
Common Stocks(1) | | 202,874,863 | | — | | 202,874,863 | |
Investment Companies | | 2,175,509 | | — | | 2,175,509 | |
Total | | 205,050,372 | | — | | 205,050,372 | |
Walden Midcap Fund | | | | | | | |
Common Stocks(1) | | 48,288,624 | | — | | 48,288,624 | |
Investment Companies | | 530,009 | | — | | 530,009 | |
Total | | 48,818,633 | | — | | 48,818,633 | |
Walden SMID Cap Fund | | | | | | | |
Common Stocks(1) | | 53,400,025 | | — | | 53,400,025 | |
Investment Companies | | 443,731 | | — | | 443,731 | |
Total | | 53,843,756 | | — | | 53,843,756 | |
| | | | | | | | | | |
Continued
67
Notes to Financial Statements | June 30, 2018 |
| | | | Level 2 | | | |
| | Level 1 | | Other Significant | | Total Investments | |
Fund Name | | Quoted Prices | | Observable Inputs | | in Securities | |
Walden Small Cap Fund | | | | | | | |
Common Stocks(1) | | $ | 94,996,594 | | $ | — | | $ | 94,996,594 | |
Investment Companies | | 703,997 | | — | | 703,997 | |
Total | | 95,700,591 | | — | | 95,700,591 | |
Walden International Equity Fund | | | | | | | |
Common Stocks(3) | | 42,190,250 | | — | | 42,190,250 | |
Investment Companies | | 288,114 | | — | | 288,114 | |
Total | | 42,478,364 | | — | | 42,478,364 | |
| | | | | | | | | | |
(1) For detailed industry descriptions, see the accompanying Schedules of Portfolio Investments.
(2) For detailed State classifications, see the accompanying Schedules of Portfolio Investments.
(3) For detailed Country classifications, see the accompanying Schedules of Portfolio Investments.
The Funds recognize transfers, if any, between fair value hierarchy levels at the reporting period end. There were transfers from Level 2 to Level 1 during the six months ended June 30, 2018. On June 30, 2018, the Fund shown below did not systematically fair value foreign securities trading on foreign stock exchanges that close before U.S. stock exchanges but did systematically fair value foreign securities on December 31, 2017 resulting in transfers from Level 2 to Level 1.
| | Transfers | |
| | from | |
| | Level 2 to | |
TRANSFERS | | Level 1 ($) | |
Walden International Equity Fund | | | |
Common Stocks | | $ | 37,357,920 | |
| | | | |
Investment Transactions and Related Income:
Investment transactions are accounted for no later than one business day after trade date. However, for financial reporting purposes, investment transactions are accounted for on trade date. Investment gains and losses are calculated on the identified cost basis. Interest income is recognized on the accrual basis and includes, where applicable, the amortization or accretion of premium or discount based on effective yield. Dividend income is recorded on the ex-dividend date except in the case of certain foreign securities, in which case dividends are recorded as soon as such information becomes available.
Real Estate Investment Trusts:
The Funds may own shares of real estate investment trusts (“REITs”), which report information on the source of their distribution annually. Certain distributions received from REITs during the year, which are known to be return of capital, are recorded as a reduction to the cost of the individual REIT.
Expenses:
Expenses directly attributable to a Fund are charged directly to that Fund. Expenses relating to the Trust are allocated proportionately to each Fund within the Trust according to the relative net assets of each Fund or on another reasonable basis.
Dividends to Shareholders:
Dividends to shareholders are recorded on the ex-dividend date. Dividends to shareholders from net investment income, if any, are declared and paid annually by the Funds. Dividends to shareholders from net realized gains, if any, are declared and distributed at least annually by the Funds.
Federal Income Taxes:
Each Fund intends to continue to qualify as a regulated investment company by complying with the provisions available to certain investment companies, as defined in Subchapter M of the Internal Revenue Code, and to make distributions from net investment income and from net realized capital gains sufficient to relieve it from all, or substantially all, federal income and excise taxes. Therefore, no federal income tax provision is required.
Management has reviewed tax positions taken in tax years that remain subject to examination by all major tax jurisdictions, including Federal (i.e., the last four tax year ends and the interim tax period since then, as applicable) and believes that there is no tax liability resulting from unrecognized tax benefits related to uncertain tax positions taken as of and during the six months ended June 30, 2018. The Funds recognize interest and penalties, if any, related to unrecognized tax benefits, as income tax expense in the Statement of Operations as incurred.
Foreign Currency Transactions:
The accounting records of the Funds are maintained in U.S. dollars denominated amounts are translated into U.S. dollars as follows, with the resultant exchange gains and losses recorded in the Statements of Operations:
i) value of investment securities and other assets and liabilities at the exchange rate on the valuation date; and
ii) purchases and sales of Investment securities and income and expenses at the exchange rate prevailing on the respective date of such transactions.
The Funds do not isolate realized and unrealized gains and losses attributable to changes in the exchange rates from gains and losses that arise from changes in the value of investments. Such fluctuations are included with net realized and unrealized gain or loss on investments.
Investment income from non-U.S. sources received by a Fund is generally subject to non-U.S. withholding taxes at rates ranging up to 30%. Such withholding taxes may be reduced or eliminated under the terms of applicable U.S. income tax treaties. The Funds may be subject to foreign taxes on gains in investments or currency repatriation. The Funds accrue such taxes, as applicable, based on their current interpretation of tax rules in the foreign markets in which they invest.
Continued
68
Notes to Financial Statements | June 30, 2018 |
New Accounting Pronouncements:
In March 2017, FASB issued Accounting Standards Update No. 2017-08 “Premium Amortization on Purchased Callable Debt Securities” (“ASU 2017-08”), which shortens the premium amortization period for purchased non-contingently callable debt securities. ASU 2017-08 specifies that the premium amortization period ends at the earliest call date, for purchased non-contingently callable debt securities. ASU 2017-08 is effective for fiscal years, and interim periods within those fiscal years, beginning after December 15, 2018. Management is currently evaluating the implications of ASU 2017-08 and its impact on the financial statements and related disclosures has not yet been determined.
3. Related Party Transactions and Other Service Arrangements:
Investment Adviser:
The Trust, with respect to the Funds, and the Adviser are parties to an Investment Advisory Agreement under which the Adviser is entitled to receive an annual fee, computed daily and paid monthly, equal to the average daily net assets of each Fund, at the following annual percentage rates before contractual waivers:
Fund | | Fee Rate | |
Asset Management Fund | | 0.75 | % |
Equity Fund | | 0.75 | % |
Midcap Fund | | 0.75 | % |
SMID Cap Fund | | 0.75 | % |
Small Cap Fund | | 0.75 | % |
Fund | | Fee Rate | |
Walden Asset Management Fund | | 0.75 | % |
Walden Equity Fund | | 0.75 | % |
Walden Midcap Fund | | 0.75 | % |
Walden SMID Cap Fund | | 0.75 | % |
Walden Small Cap Fund | | 0.75 | % |
Walden International Equity Fund | | 0.75 | % |
Additionally, two trustees of the Trust are officers of the Adviser or its affiliate, and an officer of the Trust is an officer of the Adviser. These persons are not paid directly by the Funds.
Administration and Fund Accounting:
Citi Fund Services Ohio, Inc. (“Citi”) serves the Funds as administrator. Citi provides administrative and fund accounting services for a fee that is computed daily and paid monthly, based on the aggregate daily net assets of the Trust plus certain base fees.
Certain officers of the Trust are affiliated with Citi. Such persons were paid no fees directly by the Funds for serving as Officers of the Trust. Citi makes an employee available to serve as the Funds’ Chief Compliance Officer (“CCO”) under a Compliance Service Agreement between the Funds and Citi (the “CCO Agreement”). Under the CCO Agreement, Citi also provides infrastructure and support in implementing the written policies and procedures comprising the Funds’ compliance program, including support services to the CCO. For the services provided under the CCO Agreement, the Funds paid Citi $75,000 for the six months ended June 30, 2018, plus certain out of pocket expenses. Citi pays the salary and other compensation earned by the CCO as an employee of Citi.
Distribution:
Foreside Financial Services, LLC (“Foreside”), which is not affiliated with Citi or the Adviser, serves as the Funds’ distribution agent. Prior to a name change effective February 28, 2018, Foreside operated as BHIL Distributors, LLC. Fees for these services are paid monthly by the Adviser and not by the Funds.
Shareholder Services:
The Funds may enter into shareholder services agreements with investment advisers, banks, trust companies and other types of organizations (“Authorized Service Providers”), which may include affiliates of the Funds, for providing administrative services with respect to shares of the Funds attributable to or held in the name of the Authorized Service Provider for its clients or other parties with whom they have a servicing relationship. Affiliates of the Funds did not receive any fees during the six months ended June 30, 2018.
Custodian and Transfer Agency:
Boston Trust & Investment Management Company (“Boston Trust”), the parent company of the Adviser, acts as the Funds transfer agent. Under the transfer agency agreement, Boston Trust receives a fixed fee of $18,000 annually per fund, accrued daily and paid monthly for its services. Under a sub-transfer agency agreement, FIS Investor Services, LLC receives a fixed annual fee accrued daily and paid monthly, plus annual per account fees and certain out of pocket expenses for its services to the Trust. Expenses incurred under the transfer agency agreement and sub-transfer agency agreement are presented collectively as “Transfer Agency” expenses on the Statement of Operations.
Boston Trust acts as the Funds’ custodian, with the exception of the Walden International Equity Fund. Under the custody agreement, Boston Trust receives an annual asset based fee of 0.014% of the value of securities held. Citibank, N.A. receives sub-custodian fees from Boston Trust for each Fund except the Walden International Equity Fund. Under a separate custody agreement, Citibank, N.A., an affiliate of Citi, serves as custodian for the Walden International Equity Fund and receives a fee based on a percentage of assets held on behalf of the Walden International Equity Fund, transaction fees and certain out of pocket expenses for its services. Such percentages vary by the jurisdiction in which the assets are held.
Fee Reductions:
The Adviser has agreed to reduce its fees payable by the Funds to the extent necessary, exclusive of brokerage costs, interest, taxes, dividends, litigation, indemnification, expenses associated with the investments in underlying investment companies and extraordinary expenses (as determined under generally accepted accounting principles) of each Fund, except the SMID Cap Fund and the Walden International Equity Fund, to 1.00% of the average daily net assets. The Adviser has agreed to reduce its fees payable by the SMID Cap Fund and the Walden International Equity Fund to the extent necessary, subject to certain exclusions, to limit the aggregate annual operating expenses of the SMID Cap Fund to 0.75% of its average daily net assets and the Walden International Equity Fund to 1.15% of its average daily net assets. Any such reductions made by the Adviser in its fees or in the payment or reimbursement of expenses that are a Fund’s obligation may be subject to repayment by the Fund within three years provided the Fund receiving the reduction, payment or reimbursement is able to effect such repayment and remain in compliance with applicable expense limitations. The expense limitation agreement shall automatically renew effective May 1 of every year until the Adviser provides written notice of non-renewal to the Trust.
Continued
69
Notes to Financial Statements | June 30, 2018 |
Pursuant to its agreement, the Adviser reimbursed, and has yet to recoup, fees in the following amounts for the year ended March 31, 2016, the nine months ended December 31, 2016, the year ended December 31, 2017 and the six months period ended June 30, 2018, respectively:
Fund | | Amount | | Expires | |
Midcap Fund | | $ | 288 | | 12/31/2019 | |
| | | | | |
SMID Cap Fund | | 44,650 | | 3/31/2019 | |
| | 37,894 | | 12/31/2019 | |
| | 87,452 | | 12/31/2020 | |
| | 75,965 | | 12/31/2021 | |
| | | | | |
Small Cap Fund | | 297,469 | | 3/31/2019 | |
| | 157,762 | | 12/31/2019 | |
| | 58,104 | | 12/31/2020 | |
| | 186,066 | | 12/31/2021 | |
| | | | | | |
Fund | | Amount | | Expires | |
Walden Asset Management Fund | | $ | 40,670 | | 3/31/2019 | |
| | 34,372 | | 12/31/2019 | |
| | 28,580 | | 12/31/2020 | |
| | 22,114 | | 12/31/2021 | |
| | | | | |
Walden Equity Fund | | 151,560 | | 3/31/2019 | |
| | 124,204 | | 12/31/2019 | |
| | 138,810 | | 12/31/2020 | |
| | 81,689 | | 12/31/2021 | |
| | | | | |
Walden Midcap Fund | | 17,571 | | 3/31/2019 | |
| | 12,415 | | 12/31/2019 | |
| | 4,010 | | 12/31/2020 | |
| | | | | |
Walden SMID Cap Fund | | 37,277 | | 3/31/2019 | |
| | 31,322 | | 12/31/2019 | |
| | 33,179 | | 12/31/2020 | |
| | 13,180 | | 12/31/2021 | |
| | | | | |
Walden Small Cap Fund | | 42,280 | | 3/31/2019 | |
| | 36,830 | | 12/31/2019 | |
| | 26,962 | | 12/31/2020 | |
| | 14,251 | | 12/31/2021 | |
| | | | | |
Walden International Equity Fund | | 85,178 | | 3/31/2019 | |
| | 73,099 | | 12/31/2019 | |
| | 47,374 | | 12/31/2020 | |
| | 1,845 | | 12/31/2021 | |
| | | | | | |
During the six months ended June 30, 2018, the Adviser recouped $7,793 from the Midcap Fund and $623 from Walden Midcap Fund.
As of June 30, 2018, the Adviser may recoup amounts from the Funds as follows:
Total Potential Recoupment | | | |
Asset Management Fund | | $ | — | |
Equity Fund | | — | |
Midcap Fund | | 288 | |
SMID Cap Fund | | 245,961 | |
Small Cap Fund | | 699,401 | |
| | | | |
Total Potential Recoupment | | | |
Walden Asset Management Fund | | $ | 125,736 | |
Walden Equity Fund | | 496,263 | |
Walden Midcap Fund | | 33,996 | |
Walden SMID Cap Fund | | 114,958 | |
Walden Small Cap Fund | | 120,323 | |
Walden International Equity Fund | | 207,496 | |
| | | | |
During the year ended December 31, 2017, the Equity Fund delivered securities of the Fund in exchange for the redemption of shares. The total fair value of the in-kind redemptions was $5,350,555 for 231,726 shares of the Equity Fund.
During the six months ended June 30, 2018, there were no in-kind transfers.
Interfund Lending:
Pursuant to an Exemptive Order issued by the SEC, the Funds may participate in an interfund lending program (the “Program”). This Program provides an alternative credit facility under which the Funds may lend to, or borrow from, one another, consistent with each Fund’s investment objectives, limitations and organization documents. Any open loans at period end are presented under the caption Payable for interfund lending in the Statement of Assets and Liabilities. As of June 30, 2018, the Funds had no outstanding loans to or from another fund under the Program. The Funds’ did not have any activity in the Program during the period.
Continued
70
Notes to Financial Statements | June 30, 2018 |
4. Purchases and Sales of Securities:
Cost of purchases and proceeds from sales and maturities of securities, excluding short-term securities and U.S. Government securities, for the Funds for the six months ended June 30, 2018, totaled:
Fund | | Purchases | | Sales and Maturities | |
Asset Management Fund | | $ | 5,043,083 | | $ | 23,947,657 | |
Equity Fund | | 1,420,776 | | 4,044,804 | |
Midcap Fund | | 5,573,819 | | 6,347,354 | |
SMID Cap Fund | | 20,846,838 | | 5,479,083 | |
Small Cap Fund | | 33,854,035 | | 127,208,064 | |
| | | | | |
Walden Asset Management Fund | | 8,427,312 | | 5,944,106 | |
Walden Equity Fund | | 8,909,229 | | 4,744,686 | |
Walden Midcap Fund | | 5,923,047 | | 4,600,867 | |
Walden SMID Cap Fund | | 11,407,958 | | 5,275,238 | |
Walden Small Cap Fund | | 10,161,028 | | 16,136,533 | |
Walden International Equity Fund | | 3,018,601 | | 736,462 | |
| | | | | | | |
Cost of purchases and proceeds from sales and maturities of U.S. Government Securities, excluding short-term securities, for the Funds for the six months ended June 30, 2018, totaled:
Fund | | Purchases | | Sales and Maturities | |
Walden Asset Management Fund | | $ | 4,480,488 | | $ | 10,891 | |
| | | | | | | |
5. Federal Income Tax Information:
At June 30, 2018, the cost, gross unrealized appreciation and gross unrealized depreciation on investments, for federal income tax purposes, were as follows:
| | | | Gross Tax Unrealized | | Gross Tax Unrealized | | Net Unrealized Appreciation | |
Fund | | Tax Cost | | Appreciation | | (Depreciation) | | (Depreciation) | |
Asset Management Fund | | $ | 296,035,207 | | $ | 187,591,814 | | $ | (3,578,774 | ) | $ | 184,013,040 | |
Equity Fund | | 66,409,672 | | 66,619,699 | | (640,118 | ) | 65,979,581 | |
Midcap Fund | | 39,560,103 | | 23,419,213 | | (594,305 | ) | 22,824,908 | |
SMID Cap Fund | | 65,842,625 | | 9,321,234 | | (1,279,914 | ) | 8,041,320 | |
Small Cap Fund | | 199,026,805 | | 96,370,211 | | (5,869,410 | ) | 90,500,801 | |
Walden Asset Management Fund | | 86,225,200 | | 40,426,390 | | (1,229,397 | ) | 39,196,993 | |
Walden Equity Fund | | 110,606,508 | | 95,425,684 | | (981,820 | ) | 94,443,864 | |
Walden Midcap Fund | | 33,988,656 | | 15,344,869 | | (514,892 | ) | 14,829,977 | |
Walden SMID Cap Fund | | 40,548,426 | | 13,926,990 | | (631,660 | ) | 13,295,330 | |
Walden Small Cap Fund | | 68,533,663 | | 29,165,658 | | (1,998,730 | ) | 27,166,928 | |
Walden International Equity Fund | | 39,250,481 | | 4,850,837 | | (1,622,954 | ) | 3,227,883 | |
| | | | | | | | | | | | | |
The tax character of distributions paid during the fiscal year ended December 31, 2017 was as follows:
| | Distributions paid from | | | | | |
| | | | Net Long Term | | Total Taxable | | Total Distributions | |
Fund | | Ordinary Income | | Capital Gains | | Distributions | | Paid(1) | |
Asset Management Fund | | $ | 5,033,185 | | $ | 6,865,925 | | $ | 11,899,110 | | $ | 11,899,110 | |
Equity Fund | | 1,291,316 | | 2,118,848 | | 3,410,164 | | 3,410,164 | |
Midcap Fund | | 729,312 | | 3,129,409 | | 3,858,721 | | 3,858,721 | |
SMID Cap Fund | | 519,807 | | 68,822 | | 588,629 | | 588,629 | |
Small Cap Fund | | 3,371,093 | | 27,299,561 | | 30,670,654 | | 30,670,654 | |
Walden Asset Management Fund | | 1,296,570 | | 858,086 | | 2,154,656 | | 2,154,656 | |
Walden Equity Fund | | 1,932,721 | | 7,860,951 | | 9,793,672 | | 9,793,672 | |
Walden Midcap Fund | | 408,200 | | 1,110,504 | | 1,518,704 | | 1,518,704 | |
Walden SMID Cap Fund | | 594,253 | | 429,070 | | 1,023,323 | | 1,023,323 | |
Walden Small Cap Fund | | 1,118,233 | | 4,168,675 | | 5,286,908 | | 5,286,908 | |
Walden International Equity Fund | | 471,514 | | — | | 471,514 | | 471,514 | |
| | | | | | | | | | | | | |
(1) Total distributions paid may differ from the amount reported in the Statements of Changes in Net Assets because for tax purposes distributions are recognized when actually paid.
Continued
71
Notes to Financial Statements | June 30, 2018 |
As of December 31, 2017, the components of accumulated earnings on a tax basis were as follows:
| | Undistributed | | Undistributed | | | | Accumulated | | Unrealized | | | |
| | Ordinary | | Long-Term Capital | | Accumulated | | Capital and Other | | Appreciation | | Total Accumulated | |
Fund | | Income | | Gains | | Earnings | | Losses | | (Depreciation)(2) | | Earnings (Deficit) | |
Asset Management Fund | | $ | — | | $ | 6,967,186 | | $ | 6,967,186 | | $ | — | | $ | 189,867,236 | | $ | 196,834,422 | |
Equity Fund | | 3,532 | | 544,355 | | 547,887 | | — | | 66,199,025 | | 66,746,912 | |
Midcap Fund | | 81,454 | | 750,255 | | 831,709 | | — | | 23,320,678 | | 24,152,387 | |
SMID Cap Fund | | 278,278 | | 66,908 | | 345,186 | | — | | 6,320,474 | | 6,665,660 | |
Small Cap Fund | | — | | — | | — | | (254,396 | ) | 101,519,167 | | 101,264,771 | |
Walden Asset Management Fund | | — | | — | | — | | (124,120 | ) | 39,765,797 | | 39,641,677 | |
Walden Equity Fund | | — | | — | | — | | (143,029 | ) | 92,770,910 | | 92,627,881 | |
Walden Midcap Fund | | 74,244 | | 742,771 | | 817,015 | | — | | 15,419,675 | | 16,236,690 | |
Walden SMID Cap Fund | | — | | 627,887 | | 627,887 | | — | | 12,011,341 | | 12,639,228 | |
Walden Small Cap Fund | | 21,482 | | 113,259 | | 134,741 | | — | | 24,453,295 | | 24,588,036 | |
Walden International Equity Fund | | — | | — | | — | | (222,760 | ) | 3,888,080 | | 3,665,320 | |
| | | | | | | | | | | | | | | | | | | |
(2) The differences between book-basis and tax-basis unrealized appreciation (depreciation) is attributable primarily to tax deferral of losses on wash sales.
As of the end of its tax year ended December 31, 2017, the Fund has a net capital loss carry forwards (“CLCFs”) not subject to expiration as summarized in the tables below. The Board does not intend to authorize a distribution of any realized gain for the Fund until any applicable CLCF has been offset or expires.
Fund | | Short Term | | Long Term | | Total | |
Walden International Equity Fund | | $ | 4,202 | | $ | 216,417 | | $ | 220,619 | |
| | | | | | | | | | |
During the year ended December 31, 2017, the following Funds utilized capital loss carryforwards to offset realized capital gains:
Fund | | Amount | |
Walden International Equity Fund | | $ | 58,201 | |
| | | | |
Under current tax law, net investment losses and capital losses realized after October 31 of a Fund’s fiscal year may be deferred and treated as occurring on the first business day of the following fiscal year for tax purposes. The following Funds deferred losses as follows:
| | Late Year | | Post October | |
Fund | | Ordinary Loss | | Capital Losses | |
Small Cap Fund | | $ | — | | $ | 254,396 | |
Walden Asset Management Fund | | — | | 124,120 | |
Walden Equity Fund | | — | | 143,029 | |
Walden International Equity Fund | | 2,141 | | — | |
| | | | | | | |
As of December 31, 2017, the following reclassifications have been made to increase (decrease) such accounts with offsetting adjustments as indicated:
| | Accumulated Net | | Accumulated Net | | | |
Fund | | Investment Income | | Realized Gains | | Paid in Capital | |
Asset Management Fund | | $ | 28,306 | | $ | (28,306 | ) | $ | — | |
Equity Fund | | (1 | ) | (3,996,729 | ) | 3,996,730 | |
Midcap Fund | | 10,011 | | (10,011 | ) | — | |
SMID Cap Fund | | 5,569 | | (5,569 | ) | — | |
Small Cap Fund | | 264,434 | | (115,897 | ) | (148,537 | ) |
Walden Asset Management Fund | | 10,212 | | (8,290 | ) | (1,922 | ) |
Walden Equity Fund | | 3,484 | | 14 | | (3,498 | ) |
Walden Midcap Fund | | 4,988 | | (4,988 | ) | — | |
Walden SMID Cap Fund | | 18,372 | | (18,372 | ) | — | |
Walden Small Cap Fund | | 59,196 | | (59,194 | ) | (2 | ) |
Walden International Equity Fund | | 12,304 | | (11,287 | ) | (1,017 | ) |
| | | | | | | | | | |
The amounts of dividends to shareholders from net investment income and of distributions from net realized gains are determined in accordance with federal income tax regulations, which may differ from GAAP. These “book/tax” differences are either considered temporary or permanent in nature. To the extent these differences are permanent in nature (e.g. return of capital, net operating loss, reclassification of certain market discounts, gain/ loss on paydowns, and distribution), such amounts are reclassified within the composition of net assets based on their federal tax-basis treatment: temporary differences (e.g. wash sales and post October losses) do not require reclassification. To the extent dividends to shareholders exceed net investment income and net realized gains for tax purposes, they are reported as distributions of capital.
Continued
72
Notes to Financial Statements | June 30, 2018 |
6. Control Ownership and Principal Holders:
The beneficial ownership, either directly or indirectly, of more than 25% of the voting securities of a Fund creates presumptions of control of the Fund, under section 2 (a)(9) of the 1940 Act. As of June 30, 2018, the Funds had individual shareholder accounts and/or omnibus shareholder accounts (comprised of a group of individual shareholders), owning more than 25% of the total shares outstanding of the Fund as detailed below.
Fund | | Control Ownership | | % of Ownership | |
Asset Management Fund | | US Bank N.A. | | 87.92 | |
Equity Fund | | US Bank N.A. | | 93.30 | |
Midcap Fund | | US Bank N.A. | | 94.39 | |
SMID Cap Fund | | Fidelity Investments | | 52.79 | |
Small Cap Fund | | Fidelity Investments | | 27.09 | |
Walden Asset Management Fund | | US Bank N.A. | | 60.62 | |
Walden Equity Fund | | US Bank N.A. | | 30.25 | |
Walden Midcap Fund | | US Bank N.A. | | 90.57 | |
Walden SMID Cap Fund | | US Bank N.A. | | 58.68 | |
Walden Small Cap Fund | | US Bank N.A. | | 46.41 | |
Walden International Equity Fund | | US Bank N.A. | | 85.70 | |
7. Subsequent Events:
Management has evaluated events and transactions through the date these financial statements were issued and concluded no subsequent events required recognition or disclosure in these financial statements.
Continued
73
Supplementary Information (Unaudited) | June 30, 2018 |
Table of Shareholder Expenses:
As a shareholder of the Trust, you incur ongoing costs, including management fees, and other Fund expenses. These examples are intended to help you understand your ongoing costs (in dollars) of investing in the Boston Trust & Walden Funds and to compare these costs with the ongoing costs of investing in other mutual funds.
These examples are based on an investment of $1,000 invested at the beginning of the period and held for the entire period from January 1, 2018 through June 30, 2018.
Actual Expenses
The table below provides information about actual account values and actual expenses. You may use the information below together with the amount you invested, to estimate the expenses that you paid over the period. Simply divide your account value by $1,000 (for example, an $8,600 account value divided by $1,000 = 8.6), then multiply the result by the number in the table under the heading entitled “Expenses Paid during Period” to estimate the expenses you paid on your account during this period.
Please note that the expenses shown in the tables are meant to highlight your ongoing costs only and do not reflect the costs incurred by the Funds for buying and selling securities. The Funds do not charge transaction fees, such as redemption fees, nor do the Funds charge a sales charge (load). Therefore, the table is useful in comparing ongoing costs only, and will not help you determine the relative total costs of owning different funds.
| | | | | | | | Annualized | |
| | Beginning | | Ending | | Expenses Paid | | Expense Ratio | |
| | Account Value | | Account Value | | During Period(1) | | During Period | |
| | 1/1/18 | | 6/30/18 | | 1/1/18 - 6/30/18 | | 1/1/18 - 6/30/18 | |
Asset Management Fund | | $ | 1,000.00 | | $ | 1,005.80 | | $ | 4.67 | | 0.94 | % |
Equity Fund | | 1,000.00 | | 1,006.80 | | 4.58 | | 0.92 | % |
Midcap Fund | | 1,000.00 | | 1,024.30 | | 5.02 | | 1.00 | % |
SMID Cap Fund | | 1,000.00 | | 1,038.60 | | 3.79 | | 0.75 | % |
Small Cap Fund | | 1,000.00 | | 1,051.60 | | 5.09 | | 1.00 | % |
Walden Asset Management Fund | | 1,000.00 | | 1,007.30 | | 4.98 | | 1.00 | % |
Walden Equity Fund | | 1,000.00 | | 1,017.60 | | 5.00 | | 1.00 | % |
Walden Midcap Fund | | 1,000.00 | | 1,022.60 | | 5.01 | | 1.00 | % |
Walden SMID Cap Fund | | 1,000.00 | | 1,039.50 | | 5.06 | | 1.00 | % |
Walden Small Cap Fund | | 1,000.00 | | 1,047.90 | | 5.08 | | 1.00 | % |
Walden International Equity Fund | | 1,000.00 | | 995.50 | | 5.69 | | 1.15 | % |
| | | | | | | | | | | | |
(1) Expenses are equal to the Fund’s annualized expense ratio multiplied by the average account value over the period multiplied by 181/365 (to reflect the one-half year period).
Hypothetical Example for Comparison Purposes
The table below provides information about hypothetical account values and hypothetical expenses based on each Fund’s actual expense ratio and an assumed rate of return of 5% per year before expenses, which is not the Fund’s actual return. The hypothetical account values and expenses may not be used to estimate the actual ending account balance or expenses you paid for the period. You may use this information to compare this 5% hypothetical example with the 5% hypothetical examples that appear in the shareholder reports of other funds.
Please note that the expenses shown in the table are meant to highlight your ongoing costs only and do not reflect the costs incurred by the Funds for buying and selling securities. The Funds do not charge transaction fees, such as redemption fees, nor do the Funds charge a sales charge (load). Therefore, the table is useful in comparing ongoing costs only, and will not help you determine the relative total costs of owning different funds.
| | | | | | | | Annualized | |
| | Beginning | | Ending | | Expenses Paid | | Expense Ratio | |
| | Account Value | | Account Value | | During Period(1) | | During Period | |
| | 1/1/18 | | 6/30/18 | | 1/1/18 - 6/30/18 | | 1/1/18 - 6/30/18 | |
Asset Management Fund | | $ | 1,000.00 | | $ | 1,020.13 | | $ | 4.71 | | 0.94 | % |
Equity Fund | | 1,000.00 | | 1,020.23 | | 4.61 | | 0.92 | % |
Midcap Fund | | 1,000.00 | | 1,019.84 | | 5.01 | | 1.00 | % |
SMID Cap Fund | | 1,000.00 | | 1,021.08 | | 3.76 | | 0.75 | % |
Small Cap Fund | | 1,000.00 | | 1,019.84 | | 5.01 | | 1.00 | % |
Walden Asset Management Fund | | 1,000.00 | | 1,019.84 | | 5.01 | | 1.00 | % |
Walden Equity Fund | | 1,000.00 | | 1,019.84 | | 5.01 | | 1.00 | % |
Walden Midcap Fund | | 1,000.00 | | 1,019.84 | | 5.01 | | 1.00 | % |
Walden SMID Cap Fund | | 1,000.00 | | 1,019.84 | | 5.01 | | 1.00 | % |
Walden Small Cap Fund | | 1,000.00 | | 1,019.84 | | 5.01 | | 1.00 | % |
Walden International Equity Fund | | 1,000.00 | | 1,019.09 | | 5.76 | | 1.15 | % |
| | | | | | | | | | | | |
(1) Expenses are equal to the Fund’s annualized expense ratio multiplied by the average account value over the period multiplied by 181/365 (to reflect the one-half year period).
Continued
74
Tabular Summary of Schedules of Portfolio Investments:
The Boston Trust Funds invested, as a percentage of total net assets, in the following industries as of June 30, 2018.
Asset Management Fund
| | Percentage of Total | |
Security Allocation for the Schedule of Portfolio Investments | | Net Assets | |
Information Technology | | 21.3 | % |
Financials | | 17.2 | % |
U.S. Government & U.S. Government Agency Obligations | | 16.6 | % |
Health Care | | 11.9 | % |
Industrials | | 9.5 | % |
Consumer Discretionary | | 7.2 | % |
Consumer Staples | | 6.5 | % |
Energy | | 3.2 | % |
Materials | | 2.6 | % |
Utilities | | 1.7 | % |
Investment Companies | | 1.4 | % |
Municipal Bonds | | 0.9 | % |
Other net assets | | 0.0 | % |
Total | | 100.0 | % |
Equity Fund
| | Percentage of Total | |
Security Allocation for the Schedule of Portfolio Investments | | Net Assets | |
Information Technology | | 26.0 | % |
Financials | | 20.2 | % |
Health Care | | 14.2 | % |
Industrials | | 12.7 | % |
Consumer Discretionary | | 8.5 | % |
Consumer Staples | | 8.3 | % |
Energy | | 3.9 | % |
Materials | | 3.1 | % |
Utilities | | 2.0 | % |
Investment Companies | | 1.1 | % |
Other net assets | | 0.0 | % |
Total | | 100.0 | % |
Midcap Fund
| | Percentage of Total | |
Security Allocation for the Schedule of Portfolio Investments | | Net Assets | |
Financials | | 16.1 | % |
Industrials | | 14.6 | % |
Information Technology | | 14.6 | % |
Consumer Discretionary | | 14.1 | % |
Health Care | | 13.1 | % |
Materials | | 6.9 | % |
Consumer Staples | | 6.1 | % |
Real Estate | | 5.4 | % |
Energy | | 4.1 | % |
Utilities | | 3.9 | % |
Investment Companies | | 1.1 | % |
Other net assets | | 0.0 | % |
Total | | 100.0 | % |
SMID Cap Fund
| | Percentage of Total | |
Security Allocation for the Schedule of Portfolio Investments | | Net Assets | |
Financials | | 17.1 | % |
Industrials | | 16.7 | % |
Information Technology | | 15.4 | % |
Consumer Discretionary | | 12.4 | % |
Health Care | | 12.4 | % |
Real Estate | | 7.1 | % |
Materials | | 6.0 | % |
Utilities | | 4.1 | % |
Consumer Staples | | 3.9 | % |
Energy | | 3.9 | % |
Investment Companies | | 1.0 | % |
Other net assets | | 0.0 | % |
Total | | 100.0 | % |
Small Cap Fund
| | Percentage of Total | |
Security Allocation for the Schedule of Portfolio Investments | | Net Assets | |
Financials | | 18.2 | % |
Information Technology | | 16.4 | % |
Industrials | | 16.1 | % |
Health Care | | 16.0 | % |
Consumer Discretionary | | 10.8 | % |
Materials | | 5.4 | % |
Real Estate | | 4.7 | % |
Utilities | | 4.5 | % |
Consumer Staples | | 4.4 | % |
Energy | | 2.8 | % |
Investment Companies | | 0.7 | % |
Other net assets | | 0.0 | % |
Total | | 100.0 | % |
Continued
75
The Walden Funds invested, as a percentage of total net assets, in the following industries and countries as of June 30, 2018.
Walden Asset Management Fund
| | Percentage of Total | |
Security Allocation for the Schedule of Portfolio Investments | | Net Assets | |
U.S. Government & U.S. Government Agency Obligations | | 23.0 | % |
Information Technology | | 18.4 | % |
Financials | | 13.7 | % |
Health Care | | 11.0 | % |
Industrials | | 8.8 | % |
Consumer Discretionary | | 7.8 | % |
Consumer Staples | | 6.7 | % |
Energy | | 2.8 | % |
Investment Companies | | 2.7 | % |
Materials | | 2.6 | % |
Utilities | | 1.8 | % |
Municipal Bonds | | 0.4 | % |
Certificate of Deposit | | 0.1 | % |
Other net assets | | 0.2 | % |
Total | | 100.0 | % |
Walden Equity Fund
| | Percentage of Total | |
Security Allocation for the Schedule of Portfolio Investments | | Net Assets | |
Information Technology | | 23.9 | % |
Financials | | 17.4 | % |
Health Care | | 15.0 | % |
Industrials | | 11.8 | % |
Consumer Discretionary | | 11.2 | % |
Consumer Staples | | 9.4 | % |
Energy | | 4.1 | % |
Materials | | 3.6 | % |
Utilities | | 2.5 | % |
Investment Companies | | 1.1 | % |
Other net assets | | 0.0 | % |
Total | | 100.0 | % |
Walden Midcap Fund
| | Percentage of Total | |
Security Allocation for the Schedule of Portfolio Investments | | Net Assets | |
Financials | | 17.1 | % |
Industrials | | 15.0 | % |
Information Technology | | 13.7 | % |
Consumer Discretionary | | 13.1 | % |
Health Care | | 12.5 | % |
Materials | | 6.9 | % |
Real Estate | | 5.7 | % |
Consumer Staples | | 5.5 | % |
Utilities | | 4.7 | % |
Energy | | 4.7 | % |
Investment Companies | | 1.1 | % |
Other net assets | | 0.0 | % |
Total | | 100.0 | % |
Walden SMID Cap Fund
| | Percentage of Total | |
Security Allocation for the Schedule of Portfolio Investments | | Net Assets | |
Industrials | | 17.3 | % |
Financials | | 17.2 | % |
Information Technology | | 16.0 | % |
Health Care | | 12.6 | % |
Consumer Discretionary | | 11.6 | % |
Real Estate | | 7.1 | % |
Materials | | 6.0 | % |
Utilities | | 4.2 | % |
Consumer Staples | | 4.0 | % |
Energy | | 3.2 | % |
Investment Companies | | 0.8 | % |
Other net assets | | 0.0 | % |
Total | | 100.0 | % |
Walden Small Cap Fund
| | Percentage of Total | |
Security Allocation for the Schedule of Portfolio Investments | | Net Assets | |
Financials | | 18.3 | % |
Information Technology | | 17.4 | % |
Industrials | | 16.4 | % |
Health Care | | 15.0 | % |
Consumer Discretionary | | 10.8 | % |
Materials | | 5.4 | % |
Real Estate | | 4.8 | % |
Utilities | | 4.6 | % |
Consumer Staples | | 3.8 | % |
Energy | | 2.8 | % |
Investment Companies | | 0.7 | % |
Other net assets | | 0.0 | % |
Total | | 100.0 | % |
Walden International Equity Fund
| | Percentage of Total | |
Security Allocation for the Schedule of Portfolio Investments | | Net Assets | |
Japan | | 21.5 | % |
United Kingdom | | 14.4 | % |
Germany | | 8.8 | % |
France | | 8.7 | % |
Canada | | 8.3 | % |
Switzerland | | 7.3 | % |
Australia | | 6.0 | % |
Netherlands | | 4.5 | % |
Hong Kong | | 3.0 | % |
Spain | | 3.0 | % |
Sweden | | 2.3 | % |
Italy | | 2.2 | % |
Ireland | | 1.7 | % |
Denmark | | 1.4 | % |
Singapore | | 1.2 | % |
Finland | | 0.8 | % |
Belgium | | 0.8 | % |
Luxembourg | | 0.8 | % |
United States | | 0.7 | % |
Israel | | 0.7 | % |
Norway | | 0.7 | % |
Other net assets | | 1.2 | % |
Total | | 100.0 | % |
Continued
76
Other Information:
A description of the policies and guidelines that the Funds use to determine how to vote proxies related to portfolio securities is available: (i) without charge, upon request, by calling 1-800-282-8782 ext. 7050, and (ii) on the Securities and Exchange Commission’s (the “Commission”) website at http:// www.sec.gov.
Proxy voting policies and guidelines as well as information regarding how the Funds voted proxies relating to portfolio securities during the most recent 12-month period ended June 30 is available (i) without charge, upon request, by calling 1-800-282-8782 ext. 7050, (ii) on the Boston Trust & Investment Management, Inc. website at http://www.btim.com; and (iii) on the Commission’s website at http://www.sec.gov.
The Funds file complete schedules of portfolio holdings for each Fund with the Commission for the first and third quarters of each fiscal year on Form N-Q. The Funds’ Form N-Q is available on the Commission’s website at http://www.sec.gov. The Funds’ Form N-Q may be reviewed and copied at the Commission’s Public Reference Room in Washington, D.C. and information on the operation of the Public Reference Room may be obtained by calling 800-SEC-0330.
77
Investment Adviser
Boston Trust Investment Management, Inc.
One Beacon Street
Boston, MA 02108
Transfer Agent
Boston Trust & Investment Management Company
One Beacon Street
Boston, MA 02108
Administrator
Citi Fund Services Ohio, Inc.
4400 Easton Commons, Suite 200
Columbus, OH 43219
Distributor
Foreside Financial Services, LLC
Three Canal Plaza, Suite 100
Portland, ME 04101
Independent Registered Public Accounting Firm
Cohen & Company, Ltd.
1350 Euclid Avenue, Suite 800
Cleveland, OH 44115
Legal Counsel
Thompson Hine LLP
41 South High Street, Suite 1700
Columbus, OH 43215
This report is intended for the shareholders of the Funds and may not be used as sales literature unless preceded or accompanied by a current prospectus.
Past performance results shown should not be considered a representation of future performance. Share price and returns will fluctuate so that shares, when redeemed, may be worth more or less than their original cost. Statements and other information herein are dated and subject to change.
08/18
Item 2. Code of Ethics.
Not applicable — only for annual reports.
Item 3. Audit Committee Financial Expert.
Not applicable — only for annual reports.
Item 4. Principal Accountant Fees and Services.
Not applicable — only for annual reports.
Item 5. Audit Committee of Listed Registrants.
Not applicable.
Item 6. Investments.
(a) Included as part of the report to shareholders filed under Item 1.
(b) Not applicable.
Item 7. Disclosure of Proxy Voting Policies and Procedures for Closed-End Management Investment Companies.
Not applicable.
Item 8. Portfolio Managers of Closed-End Management Investment Companies.
Not applicable
Item 9. Purchases of Equity Securities by Closed-End Management Investment Company and Affiliated Purchasers.
Not applicable.
Item 10. Submission of Matters to a Vote of Security Holders.
Not applicable.
Item 11. Controls and Procedures.
(a) The registrant’s principal executive officer and principal financial officer have concluded, based on their evaluation of the registrant’s disclosure controls and procedures as conducted within 90 days of the filing date of this report, that these disclosure controls and procedures are adequately designed and are operating effectively to ensure that information required to be disclosed by the registrant on Form N-CSR is recorded, processed, summarized and reported within the time periods specified in the Securities and Exchange Commission’s rules and forms.
(b) There were no changes in the registrant’s internal control over financial reporting (as defined in Rule 30a-3(d) under the Act (17 CFR 270.30a-3(d)) that occurred during the second fiscal quarter of the period covered by this report that have materially affected or are reasonably likely to materially affect, the registrant’s internal control over financial reporting.
Item 12. Exhibits. Disclosure of Securities Lending Activities for Closed-End Management Investment Companies.
Not applicable.
Item 13. Exhibits.
(a)(1) Not applicable — Only effective for annual reports.
(a)(2) Certifications pursuant to Rule 30a-2(a) are attached hereto.
(a)(3) Not applicable.
(b) Certifications pursuant to Rule 30a-2(b) are furnished herewith
SIGNATURES
Pursuant to the requirements of the Securities Exchange Act of 1934 and the Investment Company Act of 1940, the registrant has duly caused this report to be signed on its behalf by the undersigned, thereunto duly authorized.
(Registrant) | The Boston Trust & Walden Funds | |
| | |
| | |
By (Signature and Title)* | /s/ Lucia Santini, President |
| | |
| | |
Date | 8/22/18 | |
| | | | | |
Pursuant to the requirements of the Securities Exchange Act of 1934 and the Investment Company Act of 1940, this report has been signed below by the following persons on behalf of the registrant and in the capacities and on the dates indicated.
By (Signature and Title)* | /s/ Lucia Santini, President |
| |
| |
Date | 8/22/18 | |
| |
| |
By (Signature and Title)* | /s/ Jennifer Ellis, Treasurer |
| |
| |
Date | 8/22/18 | |
| | | | |
