UNITED STATES
SECURITIES AND EXCHANGE COMMISSION
Washington, D.C. 20549
FORM 8-K
CURRENT REPORT
Pursuant to Section 13 or 15(d)
of the Securities Exchange Act of 1934
Date of Report (Date of earliest event reported): March 20, 2024
SYNOPSYS, INC.
(Exact Name of Registrant as Specified in its Charter)
| Delaware | 000-19807 | 56-1546236 | ||
(State or Other Jurisdiction of Incorporation) | (Commission File Number) | (I.R.S. Employer Identification Number) |
| 675 Almanor Ave. |
| Sunnyvale, California 94085 |
| (Address of Principal Executive Offices) (Zip Code) |
(650) 584-5000
(Registrant’s telephone number, including area code)
N/A
(Former name or former address, if changed since last report)
Check the appropriate box below if the Form 8-K filing is intended to simultaneously satisfy the filing obligation of the registrant under any of the following provisions (see General Instruction A.2. below):
| ☒ | Written communications pursuant to Rule 425 under the Securities Act (17 CFR 230.425) |
| ☐ | Soliciting material pursuant to Rule 14a-12 under the Exchange Act (17 CFR 240-14a-12) |
| ☐ | Pre-commencement communications pursuant to Rule 14d-2(b) under the Exchange Act (17 CFR 240.14d-2(b)) |
| ☐ | Pre-commencement communications pursuant to Rule 13e-4(c) under the Exchange Act (17 CFR 240.13e-4(c)) |
Securities registered pursuant to Section 12(b) of the Act:
Title of Class | Trading Symbol(s) | Name of each exchange on which registered | ||
| Common Stock (par value of $0.01 per share) | SNPS | Nasdaq Global Select Market |
Indicate by check mark whether the registrant is an emerging growth company as defined in Rule 405 of the Securities Act of 1933 (§230.405 of this chapter) or Rule 12b-2 of the Securities Exchange Act of 1934 (§240.12b-2 of this chapter).
Emerging Growth Company ☐
If an emerging growth company, indicate by check mark if the registrant has elected not to use the extended transition period for complying with any new or revised financial accounting standards provided pursuant to Section 13(a) of the Exchange Act. ☐
| Item 7.01. | Regulation FD Disclosure. |
As previously announced, Synopsys, Inc. (“Synopsys”) hosted an investor day on March 20, 2024. The investor day included presentations by Sassine Ghazi, President and Chief Executive Officer, Shelagh Glaser, Chief Financial Officer, and certain other members of senior management.
A replay of the webcast is available on the Investor Relations page of Synopsys’ website at https://investor.synopsys.com/overview/default.aspx, and a copy of the presentation slides, which were discussed at the investor day, is furnished herein as Exhibit 99.1 and is incorporated by reference into this Item 7.01.
The information contained in Item 7.01 of this report, including the information in Exhibit 99.1, shall not be deemed “filed” for the purposes of Section 18 of the Securities and Exchange Act of 1934, as amended, or otherwise subject to the liabilities of that section, nor shall such information be deemed to be incorporated by reference in the filings of the registrant under the Securities Act of 1933, as amended (the “Securities Act”).
| Item 8.01. | Other Events. |
On March 20, 2024, Synopsys announced that, following the completion of previously announced strategic portfolio review, Synopsys’ Board of Directors has approved the initiation of a sale process of Synopsys’ Software Integrity business.
| Item 9.01 | Financial Statements and Exhibits. |
(d) Exhibits
Exhibit Number | Description | |
| 99.1 | Investor Day Presentation Slides, dated March 20, 2024 | |
| 104 | Cover Page Interactive Data File (formatted as Inline XBRL). | |
Important Information and Where to Find It
This communication relates to a proposed transaction between Synopsys and Ansys. In connection with the proposed transaction, Synopsys filed a preliminary registration statement on Form S-4 (File No. 333-277912) with the U.S. Securities and Exchange Commission (the “SEC”) on March 14, 2024, that included a prospectus with respect to the shares of common stock of Synopsys to be issued in the proposed transaction and a proxy statement of Ansys and is referred to as the proxy statement/prospectus. Each party may also file other documents regarding the proposed transaction with the SEC. The registration statement has not yet become effective and the proxy statement /prospectus included therein is in preliminary form. This communication is not a substitute for the proxy statement/prospectus or registration statement or any other document that Synopsys or Ansys may file with the SEC. The definitive proxy statement/prospectus (if and when available) will be mailed to all Ansys stockholders. INVESTORS AND SECURITY HOLDERS ARE URGED TO READ THE REGISTRATION STATEMENT, PROXY STATEMENT/PROSPECTUS AND ALL OTHER RELEVANT DOCUMENTS FILED OR THAT WILL BE FILED WITH THE SEC IN CONNECTION WITH THE PROPOSED TRANSACTION, AS WELL AS ANY AMENDMENTS OR SUPPLEMENTS TO THESE DOCUMENTS, CAREFULLY AND IN THEIR ENTIRETY IF AND WHEN THEY BECOME AVAILABLE BECAUSE THEY CONTAIN OR WILL CONTAIN IMPORTANT INFORMATION ABOUT THE PROPOSED TRANSACTION.
Investors and security holders may obtain free copies of the registration statement, proxy statement/prospectus and all other relevant documents filed or that will be filed with the SEC by Synopsys or Ansys through the website maintained by the SEC at www.sec.gov.
The documents filed by Synopsys with the SEC also may be obtained free of charge at Synopsys’ website at https://investor.synopsys.com/overview/default.aspx or upon written request to Synopsys at Synopsys, Inc., 675 Almanor Avenue, Sunnyvale, California 94085, Attention: Investor Relations. The documents filed by Ansys with the SEC also may be obtained free of charge at Ansys’ website at https://investors.ansys.com/ or upon written request to kelsey.debriyn@ansys.com.
Participants in the Solicitation
Synopsys, Ansys and their respective directors and executive officers may be deemed to be participants in the solicitation of proxies from Ansys’ stockholders in connection with the proposed transaction. Information about Ansys’ directors and executive officers and their ownership of Ansys’ common stock is set forth in Ansys’ proxy statement for its 2023 Annual Meeting of Stockholders on Schedule 14A filed with the SEC on March 28, 2023. To the extent that holdings of Ansys’ securities have changed since the amounts printed in Ansys’ proxy statement, such changes have been or will be reflected on Statements of Change in Ownership on Form 4 filed with the SEC. Information about Synopsys’ directors and executive officers is set forth in Synopsys’ proxy statement for its 2024 Annual Meeting of Stockholders on Schedule 14A filed with the SEC on February 16, 2024 and Synopsys’ subsequent filings with the SEC. Additional information regarding the direct and indirect interests of those persons and other persons who may be deemed participants in the proposed transaction may be obtained by reading the preliminary proxy statement/prospectus filed on March 14, 2024 by Synopsys and the final version and any other relevant documents that are filed with the SEC relating to the proposed transaction. You may obtain free copies of these documents as described in the preceding paragraph.
No Offer or Solicitation
This communication is for informational purposes only and is not intended to and shall not constitute an offer to buy or sell or the solicitation of an offer to buy or sell any securities, or a solicitation of any vote or approval, nor shall there be any sale of securities in any jurisdiction in which such offer, solicitation or sale would be unlawful prior to registration or qualification under the securities laws of any such jurisdiction. No offering of securities shall be made, except by means of a prospectus meeting the requirements of Section 10 of the Securities Act.
Cautionary Statement Regarding Forward-Looking Statements
This communication contains certain forward-looking statements within the meaning of the federal securities laws with respect to the proposed transaction between Synopsys and Ansys, including, but not limited to, statements regarding the proposed transaction; the anticipated market demand and outlook, products and business lines of Synopsys, Ansys and the combined company, and the benefits of and cost and revenue synergies from the proposed transaction to Synopsys; combined company financial information; long-term leverage and debt paydown targets; short-term and long-term financial targets of Synopsys’ Ansys and the combined company; Synopsys’ expectations and objectives; strategies related to Synopsys’ and Ansys’ products, technology and services; market, software, opportunities, strategies and technological trends and their potential impacts on total addressable markets, products and business lines, such as artificial intelligence; customer demand and market expansion of each of Synopsys and Ansys and the combined company; Synopsys’ planned product releases and capabilities; industry growth rates; the current and projected total addressable markets of Synopsys and certain of its segments, Ansys and the combined company; and Synopsys’ plans to divest its Software Integrity Group segment. These forward-looking statements generally are identified by the words “believe,” “project,” “expect,” “anticipate,” “estimate,” “intend,” “strategy,” “future,” “opportunity,” “plan,” “may,” “should,” “will,” “would,” “will be,” “will continue,” “will likely result,” and similar expressions or the negatives of these words or other comparable terminology to convey uncertainty of future events or outcomes. Forward-looking statements are predictions, projections and other statements about future events that are based on current expectations and assumptions and, as a result, are subject to risks and uncertainties.
Many risks, uncertainties and other factors could cause actual future events to differ materially from any future results, performance or achievements expressed or implied by the forward-looking statements, including, but not limited to: (i) the completion of the proposed transaction on anticipated terms and timing, anticipated tax treatment and unforeseen liabilities, future capital expenditures, revenues, expenses, earnings, synergies, economic performance, indebtedness, financial condition, losses, pricing trends, future prospects, credit ratings, business and management strategies which may adversely affect each of Synopsys’ and Ansys’ business, financial condition, operating results and the price of their common stock, (ii) the failure to satisfy the conditions to the consummation of the proposed transaction, including the adoption of the merger agreement by the stockholders of Ansys and the receipt of certain governmental and regulatory approvals on the terms expected, in a timely manner, or at all, (iii) the risk that such regulatory approvals may result in the imposition of conditions that could adversely affect, following completion of the proposed transaction (if completed), the combined company or the expected benefits of the proposed transaction (including as noted in any forward-looking financial information), (iv) uncertainties as to access to available financing (including any future refinancing of Ansys’ or the combined company’s debt) to consummate the proposed transaction upon acceptable terms and on a timely basis or at all, (v) the occurrence of any event, change or other circumstance that could give rise to the termination of the merger agreement, (vi) the effect of the announcement or pendency of the proposed transaction on Ansys’ or Synopsys’ business relationships, competition, business, financial condition, and operating results, (vii) risks that the proposed transaction disrupts current plans and operations of Ansys or Synopsys and the ability of Ansys or Synopsys to retain and hire key personnel, (viii) risks related to diverting either management team’s attention from ongoing business operations of Ansys or Synopsys, (ix) the outcome of any legal proceedings that may be instituted against Ansys or Synopsys related to the merger agreement or the proposed transaction, (x) the ability of Synopsys to successfully integrate Ansys’ operations and product lines, (xi) the ability of Synopsys to implement its plans, forecasts, expected financial performance and other expectations with respect to Ansys’ business or the combined business after the completion of the proposed mergers and realize the benefits expected from the proposed transaction (if completed) as well as manage the scope and size of the combined company, (xii) the ability of Synopsys to manage additional debt and debt covenants as well as successfully de-lever following the proposed transaction and the outcome of any strategic review and any resulting proposed transactions, (xiii) risks associated with third party contracts containing consent and/or other provisions that may be triggered by the proposed transaction, (xiv) macroeconomic conditions and geopolitical uncertainty in the global economy, (xv) uncertainty in the growth of the semiconductor, electronics and artificial intelligence industries, (xvi) the highly competitive industries Synopsys and Ansys operate in, (xvii) actions by the U.S. or foreign governments, such as the imposition of additional export restrictions or tariffs, (xviii) consolidation among Synopsys’ customers and Synopsys’ dependence on a relatively small number of large customers, (xix) the evolving legal, regulatory and tax regimes under which Ansys and Synopsys operate and (xx) restrictions during the pendency of the proposed transaction that may impact Ansys’ or Synopsys’ ability to pursue certain business opportunities or strategic transactions. The foregoing list of risks, uncertainties and factors is not exhaustive. Unlisted factors may present significant additional obstacles to the realization of forward-looking statements.
You should carefully consider the foregoing factors and the other risks and uncertainties that affect the businesses of Synopsys and Ansys described in the “Risk Factors” section of their respective Annual Reports on Form 10-K, Quarterly Reports on Form 10-Q and other documents filed by either of them from time to time with the SEC. These filings identify and address other important risks and uncertainties that could cause actual events and results to differ materially from those contained in the forward-looking statements. Forward-looking statements speak only as of the date they are made. All forward-looking statements by their nature address matters that involve risks and uncertainties, many of which are beyond Synopsys’ and Ansys’ control, and are not guarantees of future results. Readers are cautioned not to put undue reliance on forward-looking statements, and Synopsys and Ansys assume no obligation and do not intend to update or revise these forward-looking statements, whether as a result of new information, future events, or otherwise, unless required by law. Neither Synopsys nor Ansys gives any assurance that either Synopsys or Ansys will achieve its expectations.
Non-GAAP Financial Information
This communication certain forward looking financial measures that are not in accordance with the U.S. generally accepted accounting principles (“GAAP”). It also includes future estimated ranges for non-GAAP expenses, non-GAAP tax rate, non-GAAP earnings per diluted share and free cash flow.
| • | Adjusted EBITDA is calculated as GAAP Operating Income excluding depreciation and amortization, stock compensation, non-qualified deferred compensation plan, acquisition-related costs and restructuring charges |
| • | Free Cash Flow is calculated as cash provided from operating activities less capital expenditures and capitalization of software development costs |
| • | Free Cash Flow Margin (“FCF Margin”) is calculated as FCF for a period divided by revenue for the same period. |
| • | FCF Margin Expansion is calculated as the difference in FCF margins between two periods |
| • | Unlevered Free Cash Flow (“uFCF”) is calculated as Free Cash Flow excluding tax-effected cash net interest |
| • | uFCF Margin is calculated as Unlevered Free Cash Flow for a period divided by revenue for the same period |
| • | Non-GAAP Earnings Per Share (“EPS”) is calculated as GAAP net income excluding amortization of intangible assets, stock compensation, acquisition-related costs, restructuring charges, and legal matters, adjusted for the difference between GAAP and non-GAAP tax rates, divided by fully diluted outstanding shares |
| • | Non-GAAP EPS CAGR is calculated as the average annual growth rate of non-GAAP EPS over a period of time |
| • | Non-GAAP Operating Income is calculated as GAAP Operating Income, excluding amortization of intangible assets, stock compensation, non-qualified deferred compensation plan, acquisition-related costs and restructuring charges |
| • | Non-GAAP Operating Margin is Non-GAAP Operating income for a period divided by revenue for the same period |
Synopsys continues to provide all information required in accordance with GAAP but acknowledges evaluating its ongoing operating results may not be as useful if an investor is limited to reviewing only GAAP financial measures. Synopsys and Ansys present non-GAAP financial measures to provide their investors with an additional tool to evaluate Synopsys’ and Ansys’ respective operating results in a manner that focuses on what Synopsys and Ansys each believe to be their respective core business operations and what Synopsys and Ansys each use to evaluate their respective business operations and for internal budgeting and resource allocation purposes. These non-GAAP measures may be different from non-GAAP measures used by other companies. In addition, these non-GAAP measures are not based on any comprehensive set of accounting rules or principles, and management exercises judgment in determining which items should be excluded in the calculation of non-GAAP measures. The presentation of non-GAAP financial information is not meant to be considered in isolation from, as superior to or as a substitute for the directly comparable financial measures prepared in accordance with GAAP. These non-GAAP financial measures are meant to supplement, and be viewed in conjunction with, the corresponding GAAP financial measures.
When possible with respect to non-GAAP financial measures presented with respect to historical periods, Synopsys provides a reconciliation of its historic non-GAAP financial measures to its most closely applicable GAAP financial measures in the documents filed with the SEC. Synopsys is unable to provide a reconciliation of certain non-GAAP projections, targets and guidance measures to the corresponding GAAP measures on a forward-looking basis because doing so would not be possible without unreasonable effort due to, among other things, the potential variability and limited visibility of the excluded items and expectations as to the financial of performance of Synopsys upon the completion of the proposed transaction. For the same reasons, Synopsys is unable to address the probable significance of the unavailable information. Synopsys is presenting forward looking non-GAAP financial measures for illustrative purposes and may not report on this basis going forward.
Combined company measures for historical periods are based on combining Synopsys’ historical financial results and Ansys’ historical or preliminary financial results, as applicable, without pro forma adjustments and are included for illustrative purposes in order to provide investors with estimates of what the combined company results could have been. Combined company estimates are not pro forma financial measures, are not prepared in accordance with Regulation S-X under the Securities Act and are not necessarily indicative of the results that actually would have been realized had Synopsys and Ansys been a single entity during the relevant periods.
Other Key Business Metrics
Annual Contract Value (“ACV”) is a key performance metric for Ansys and is useful to investors in assessing the strength and trajectory of the business. ACV is a supplemental metric to help evaluate the annual performance of the business. Over the life of the contract, ACV equals the total value realized from a customer. ACV is not impacted by the timing of license revenue recognition. ACV is used by Ansys’ management in financial and operational decision-making and in setting sales targets used for compensation. ACV is not a replacement for, and should be viewed independently of, GAAP revenue and deferred revenue as ACV is a performance metric and is not intended to be combined with any of these items. There is no GAAP measure comparable to ACV.
ACV is composed of the following: 1) the annualized value of maintenance and subscription lease contracts with start dates or anniversary dates during the period, plus; 2) the value of perpetual license contracts with start dates during the period, plus; 3) the annualized value of fixed-term services contracts with start dates or anniversary dates during the period, plus; 4) the value of work performed during the period on fixed-deliverable services contracts.
SIGNATURES
Pursuant to the requirements of the Securities Exchange Act of 1934, the registrant has duly caused this report to be signed on its behalf by the undersigned hereunto duly authorized.
| SYNOPSYS, INC. | ||||||
| Dated: March 20, 2024 | By: | /s/ John F. Runkel, Jr. | ||||
| Name: | John F. Runkel, Jr. | |||||
| Title: | General Counsel and Corporate Secretary | |||||

Exhibit 99.1 © 2024 Synopsys, Inc. 1
Synopsys Cautionary Statement Regarding Forward Looking Statements This presentation contains certain forward-looking statements within the meaning of the federal securities laws with respect to the proposed transaction between Synopsys and Ansys, including, but not limited to, statements regarding the proposed transaction; the anticipated market demand and outlook, products and business lines of Synopsys, Ansys and the combined company, and the benefits of and cost and revenue synergies from the proposed transaction to Synopsys; combined company financial information; long-term leverage and debt paydown targets; short-term and long-term financial targets of Synopsys, Ansys and the combined company; Synopsys’ expectations and objectives; strategies related to Synopsys’ and Ansys’ products, technology and services; market, software, opportunities, strategies and technological trends and their potential impacts on total addressable markets, products and business lines, such as artificial intelligence; customer demand and market expansion of each of Synopsys and Ansys and the combined company; Synopsys’ planned product releases and capabilities; industry growth rates; the current and projected total addressable markets of Synopsys and certain of its segments, Ansys and the combined company; and Synopsys’ plans to divest its Software Integrity Group (“SIG”) segment. These forward-looking statements generally are identified by the words “believe,” “project,” “expect,” “anticipate,” “estimate,” “intend,” “strategy,” “future,” “opportunity,” “plan,” “may,” “should,” “will,” “would,” “will be,” “will continue,” “will likely result,” and similar expressions or the negatives of these words or other comparable terminology to convey uncertainty of future events or outcomes. Forward-looking statements are predictions, projections and other statements about future events that are based on current expectations and assumptions and, as a result, are subject to risks and uncertainties. Many risks, uncertainties and other factors could cause actual future events to differ materially from any future results, performance or achievements expressed or implied by the forward-looking statements, including, but not limited to: (i) the completion of the proposed transaction on anticipated terms and timing, anticipated tax treatment and unforeseen liabilities, future capital expenditures, revenues, expenses, earnings, synergies, economic performance, indebtedness, financial condition, losses, pricing trends, future prospects, credit ratings, business and management strategies which may adversely affect each of Synopsys’ and Ansys’ business, financial condition, operating results and the price of their common stock, (ii) the failure to satisfy the conditions to the consummation of the proposed transaction, including the adoption of the merger agreement by the stockholders of Ansys and the receipt of certain governmental and regulatory approvals on the terms expected, in a timely manner, or at all, (iii) the risk that such regulatory approvals may result in the imposition of conditions that could adversely affect, following completion of the proposed transaction (if completed), the combined company or the expected benefits of the proposed transaction (including as noted in any forward- looking financial information), (iv) uncertainties as to access to available financing (including any future refinancing of Ansys’ or the combined company’s debt) to consummate the proposed transaction upon acceptable terms and on a timely basis or at all, (v) the occurrence of any event, change or other circumstance that could give rise to the termination of the merger agreement, (vi) the effect of the announcement or pendency of the proposed transaction on Ansys’ or Synopsys’ business relationships, competition, business, financial condition, and operating results, (vii) risks that the proposed transaction disrupts current plans and operations of Ansys or Synopsys and the ability of Ansys or Synopsys to retain and hire key personnel, (viii) risks related to diverting either management team’s attention from ongoing business operations of Ansys or Synopsys, (ix) the outcome of any legal proceedings that may be instituted against Ansys or Synopsys related to the merger agreement or the proposed transaction, (x) the ability of Synopsys to successfully integrate Ansys’ operations and product lines, (xi) the ability of Synopsys to implement its plans, forecasts, expected financial performance and other expectations with respect to Ansys’ business or the combined business after the completion of the proposed mergers and realize the benefits expected from the proposed transaction (if completed) as well as manage the scope and size of the combined company, (xii) the ability of Synopsys to manage additional debt and debt covenants as well as successfully de-lever following the proposed transaction and the outcome of any strategic review and any resulting proposed transactions, (xiii) risks associated with third party contracts containing consent and/or other provisions that may be triggered by the proposed transaction, (xiv) uncertainty in the macroeconomic environment and its potential impact on the semiconductor and electronics industries, (xv) uncertainty in the growth of the semiconductor, electronics and artificial intelligence industries, (xvi) the highly competitive industries Synopsys and Ansys operate in, (xvii) actions by the U.S. or foreign governments, such as the imposition of additional export restrictions or tariffs, (xviii) consolidation among Synopsys’ customers and within the industries in which Synopsys operates, as well as Synopsys’ dependence on a relatively small number of large customers, (xix) the evolving legal, regulatory and tax regimes under which Ansys and Synopsys operate and (xx) restrictions during the pendency of the proposed transaction that may impact Ansys’ or Synopsys’ ability to pursue certain business opportunities or strategic transactions. The foregoing list of risks, uncertainties and factors is not exhaustive. Unlisted factors may present significant additional obstacles to the realization of forward-looking statements. You should carefully consider the foregoing factors and the other risks and uncertainties that affect the businesses of Synopsys and Ansys described in the “Risk Factors” section of their respective Annual Reports on Form 10-K, Quarterly Reports on Form 10-Q and other documents filed by either of them from time to time with the SEC, including Synopsys’ registration statement on Form S-4 (File No. 333-277912) with the SEC on March 14, 2024. These filings identify and address other important risks and uncertainties that could cause actual events and results to differ materially from those contained in the forward-looking statements. Forward- looking statements speak only as of the date they are made. All forward-looking statements by their nature address matters that involve risks and uncertainties, many of which are beyond Synopsys’ and Ansys’ control, and are not guarantees of future results. Readers are cautioned not to put undue reliance on forward-looking statements, and Synopsys and Ansys assume no obligation and do not intend to update or revise these forward-looking statements, whether as a result of new information, future events, or otherwise, unless required by law. Neither Synopsys nor Ansys gives any assurance that either Synopsys or Ansys will achieve its expectations. © 2024 Synopsys, Inc.
Ansys Cautionary Statement Regarding Forward-Looking Statements This presentation contains certain “forward-looking statements” within the meaning of the federal securities laws, including Section 27A of the U.S. Securities Act of 1933, as amended, and Section 21E of the Securities Exchange Act of 1934, as amended. These forward-looking statements are based on Ansys’ current expectations, estimates and projections about the expected date of closing of the proposed transaction and the potential benefits thereof, its business and industry, management’s beliefs and certain assumptions made by Ansys and Synopsys, all of which are subject to change. In this context, forward-looking statements often address expected future business and financial performance and financial condition, and often contain words such as “expect,” “anticipate,” “intend,” “plan,” “believe,” “could,” “seek,” “see,” “will,” “may,” “would,” “might,” “potentially,” “estimate,” “continue,” “expect,” “target,” similar expressions or the negatives of these words or other comparable terminology that convey uncertainty of future events or outcomes. All forward-looking statements by their nature address matters that involve risks and uncertainties, many of which are beyond our control, and are not guarantees of future results, such as statements about the consummation of the proposed transaction and the anticipated benefits thereof. These and other forward- looking statements, including the failure to consummate the proposed transaction or to make or take any filing or other action required to consummate the transaction on a timely matter or at all, are not guarantees of future results and are subject to risks, uncertainties and assumptions that could cause actual results to differ materially from those expressed in any forward-looking statements. Accordingly, there are or will be important factors that could cause actual results to differ materially from those indicated in such statements and, therefore, you should not place undue reliance on any such statements and caution must be exercised in relying on forward-looking statements. Important risk factors that may cause such a difference include, but are not limited to: (i) the completion of the proposed transaction on anticipated terms and timing, including obtaining shareholder and regulatory approvals, anticipated tax treatment, unforeseen liabilities, future capital expenditures, revenues, expenses, earnings, synergies, economic performance, indebtedness, financial condition, losses, future prospects, business and management strategies for the management, expansion and growth of Ansys’ and Synopsys’ businesses and other conditions to the completion of the transaction; (ii) failure to realize the anticipated benefits of the proposed transaction, including as a result of delay in completing the transaction or integrating the businesses of Ansys and Synopsys; (iii) Ansys’ ability to implement its business strategy; (iv) pricing trends, including Ansys’ and Synopsys’ ability to achieve economies of scale; (v) potential litigation relating to the proposed transaction that could be instituted against Ansys, Synopsys or their respective directors; (vi) the risk that disruptions from the proposed transaction will harm Ansys’ or Synopsys’ business, including current plans and operations; (vii) the ability of Ansys or Synopsys to retain and hire key personnel; (viii) potential adverse reactions or changes to business relationships resulting from the announcement or completion of the proposed transaction; (ix) uncertainty as to the long-term value of Synopsys’ common stock; (x) legislative, regulatory and economic developments affecting Ansys’ and Synopsys’ businesses; (xi) general economic and market developments and conditions; (xii) the evolving legal, regulatory and tax regimes under which Ansys and Synopsys operate; (xiii) potential business uncertainty, including changes to existing business relationships, during the pendency of the transaction that could affect Ansys’ or Synopsys’ financial performance; (xiv) restrictions during the pendency of the proposed transaction that may impact Ansys’ or Synopsys’ ability to pursue certain business opportunities or strategic transactions; (xv) unpredictability and severity of catastrophic events, including, but not limited to, acts of terrorism or outbreak of war or hostilities, as well as Ansys’ and Synopsys’ response to any of the aforementioned factors; and (xvi) failure to receive the approval of the stockholders of Ansys. These risks, as well as other risks associated with the proposed transaction, are more fully discussed in the proxy statement/prospectus to be filed with the U.S. Securities and Exchange Commission in connection with the proposed transaction. While the list of factors presented here is, and the list of factors presented in the proxy statement/prospectus will be, considered representative, no such list should be considered to be a complete statement of all potential risks and uncertainties. Unlisted factors may present significant additional obstacles to the realization of forward looking statements. Consequences of material differences in results as compared with those anticipated in the forward-looking statements could include, among other things, business disruption, operational problems, financial loss, legal liability to third parties and similar risks, any of which could have a material adverse effect on Ansys’ or Synopsys’ consolidated financial condition, results of operations, or liquidity. Neither Ansys nor Synopsys assumes any obligation to publicly provide revisions or updates to any forward-looking statements, whether as a result of new information, future developments or otherwise, should circumstances change, except as otherwise required by securities and other applicable laws. Important Information and Where to Find It This presentation relates to a proposed transaction between Synopsys and Ansys. In connection with the proposed transaction, Synopsys filed a preliminary registration statement on Form S-4 (File No. 333-277912) with the SEC on March 14, 2024, that included a prospectus with respect to shares of common stock of Synopsys to be issued in the proposed transaction and a proxy statement of Ansys and is referred to as the proxy statement/prospectus. Each party may also file other documents regarding the proposed transaction with the U.S. Securities and Exchange Commission (the “SEC”). The registration statement has not yet become effective and the proxy statement /prospectus included therein is in preliminary form. This presentation and the information contained herein is not a substitute for the proxy statement/prospectus or registration statement or any other document that Synopsys or Ansys may file with the SEC. The definitive proxy statement/prospectus (if and when available) will be mailed to all Ansys stockholders. INVESTORS AND SECURITY HOLDERS ARE URGED TO READ THE REGISTRATION STATEMENT, PROXY STATEMENT/PROSPECTUS AND ALL OTHER RELEVANT DOCUMENTS FILED OR THAT WILL BE FILED WITH THE SEC IN CONNECTION WITH THE PROPOSED TRANSACTION, AS WELL AS ANY AMENDMENTS OR SUPPLEMENTS TO THESE DOCUMENTS, CAREFULLY AND IN THEIR ENTIRETY IF AND WHEN THEY BECOME AVAILABLE BECAUSE THEY CONTAIN OR WILL CONTAIN IMPORTANT INFORMATION ABOUT THE PROPOSED TRANSACTION. Investors and security holders may obtain free copies of the registration statement, proxy statement/prospectus and all other relevant documents filed or that will be filed with the SEC by Synopsys or Ansys through the website maintained by the SEC at www.sec.gov. The documents filed by Synopsys with the SEC also may be obtained free of charge at Synopsys’ website at https://investor.synopsys.com/overview/default.aspx or upon written request to Synopsys at Synopsys, Inc., 675 Almanor Avenue, Sunnyvale, California 94085, Attention: Investor Relations Department. The documents filed by Ansys with the SEC also may be obtained free of charge at Ansys’ website at https://investors.ansys.com/ or upon written request to kelsey.debriyn@ansys.com. Participants in Solicitation Synopsys, Ansys and their respective directors and executive officers may be deemed to be participants in the solicitation of proxies from Ansys’ stockholders in connection with the proposed transaction. Information about Ansys’ directors and executive officers and their ownership of Ansys’ common stock is set forth in Ansys’ proxy statement for its 2023 Annual Meeting of Shareholders on Schedule 14A filed with the SEC on March 28, 2023. To the extent that holdings of Ansys’ securities have changed since the amounts printed in Ansys’ proxy statement, such changes have been or will be reflected on Statements of Change in Ownership on Form 4 filed with the SEC. Information about Synopsys’ directors and executive officers is set forth in Synopsys’ proxy statement for its 2024 Annual Meeting of Stockholders on Schedule 14A filed with the SEC on February 16, 2024 and Synopsys’ subsequent filings with the SEC. Additional information regarding the direct and indirect interests of those persons and other persons who may be deemed participants in the proposed transaction may be obtained by reading the preliminary proxy statement/prospectus filed on March 14, 2024 by Synopsys and the final version and any other relevant documents that are filed with the SEC relating to the proposed transaction. You may obtain free copies of these documents as described in the preceding paragraph. © 2024 Synopsys, Inc.
No Offer or Solicitation This presentation is for informational purposes only and is not intended to and shall not constitute an offer to buy or sell or the solicitation of an offer to buy or sell any securities, or a solicitation of any vote or approval, nor shall there be any sale of securities in any jurisdiction in which such offer, solicitation or sale would be unlawful prior to registration or qualification under the securities laws of any such jurisdiction. No offering of securities shall be made, except by means of a prospectus meeting the requirements of Section 10 of the U.S. Securities Act of 1933, as amended. Non-GAAP Financial Information This presentation contains certain forward looking financial measures that are not in accordance with the U.S. generally accepted accounting principles (“GAAP”). It also includes future estimated ranges for non-GAAP expenses, non- GAAP tax rate, non-GAAP earnings per diluted share and free cash flow. • Adjusted EBITDA (“Adj. EBITDA”) is calculated as GAAP Operating Income excluding depreciation and amortization, stock compensation, non-qualified deferred compensation plan, acquisition-related costs and restructuring charges • Free Cash Flow (“FCF”) is calculated as cash provided from operating activities less capital expenditures and capitalization of software development costs • FCF Margin is calculated as FCF for a period divided by revenue for the same period • FCF Margin Expansion is calculated as the difference in FCF margins between two periods • Unlevered Free Cash Flow (“uFCF”) is calculated as Free Cash Flow excluding tax-effected cash net interest • uFCF Margin is calculated as uFCF for a period divided by revenue for the same period • Non-GAAP Earnings Per Share (“EPS”) is calculated as GAAP net income excluding amortization of intangible assets, stock compensation, acquisition-related costs, restructuring charges, and legal matters, adjusted for the difference between GAAP and non-GAAP tax rates, divided by fully diluted outstanding shares • Non-GAAP EPS CAGR is calculated as the average annual growth rate of non-GAAP EPS over a period of time • Non-GAAP Operating Income is calculated as GAAP Operating Income, excluding amortization of intangible assets, stock compensation, non-qualified deferred compensation plan, acquisition-related costs and restructuring charges • Non-GAAP Operating Margin is Non-GAAP Operating Income for a period divided by revenue for the same period Synopsys continues to provide all information required in accordance with GAAP but acknowledges evaluating its ongoing operating results may not be as useful if an investor is limited to reviewing only GAAP financial measures. Synopsys and Ansys present non-GAAP financial measures to provide their investors with an additional tool to evaluate Synopsys’ and Ansys’ respective operating results in a manner that focuses on what Synopsys and Ansys each believe to be their respective core business operations and what Synopsys and Ansys each use to evaluate their respective business operations and for internal budgeting and resource allocation purposes. These non-GAAP measures may be different from non-GAAP measures used by other companies. In addition, these non-GAAP measures are not based on any comprehensive set of accounting rules or principles, and management exercises judgment in determining which items should be excluded in the calculation of non-GAAP measures. The presentation of non-GAAP financial information is not meant to be considered in isolation from, as superior to or as a substitute for the directly comparable financial measures prepared in accordance with GAAP. These non-GAAP financial measures are meant to supplement, and be viewed in conjunction with, the corresponding GAAP financial measures. When possible with respect to non-GAAP financial measures presented with respect to historical periods, Synopsys provides a reconciliation of its historic non-GAAP financial measures to its most closely applicable GAAP financial measures in the documents filed with the SEC. Synopsys is unable to provide a reconciliation of certain non-GAAP projections, targets and guidance measures to the corresponding GAAP measures on a forward-looking basis because doing so would not be possible without unreasonable effort due to, among other things, the potential variability and limited visibility of the excluded items and expectations as to the financial of performance of Synopsys upon the completion of the proposed transaction. For the same reasons, Synopsys is unable to address the probable significance of the unavailable information. Synopsys is presenting forward looking non-GAAP financial measures for illustrative purposes and may not report on this basis going forward. Combined company measures for historical periods are based on combining Synopsys’ historical financial results and Ansys’ historical financial results, as applicable, without pro forma adjustments and are included for illustrative purposes in order to provide investors with estimates of what the combined company results could have been. Combined company estimates are not pro forma financial measures, are not prepared in accordance with Regulation S- X under the U.S. Securities Act of 1933, as amended, and are not necessarily indicative of the results that actually would have been realized had Synopsys and Ansys been a single entity during the relevant periods. Other Key Business Metrics Annual Contract Value (“ACV”) is a key performance metric for Ansys and is useful to investors in assessing the strength and trajectory of the business. ACV is a supplemental metric to help evaluate the annual performance of the business. Over the life of the contract, ACV equals the total value realized from a customer. ACV is not impacted by the timing of license revenue recognition. ACV is used by Ansys’ management in financial and operational decision- making and in setting sales targets used for compensation. ACV is not a replacement for, and should be viewed independently of, GAAP revenue and deferred revenue as ACV is a performance metric and is not intended to be combined with any of these items. There is no GAAP measure comparable to ACV. ACV is composed of the following: 1) the annualized value of maintenance and subscription lease contracts with start dates or anniversary dates during the period, plus; 2) the value of perpetual license contracts with start dates during the period, plus; 3) the annualized value of fixed-term services contracts with start dates or anniversary dates during the period, plus; 4) the value of work performed during the period on fixed-deliverable services contracts. © 2024 Synopsys, Inc.
Welcome Synopsys Investor Day 2024 Trey Campbell SVP, Investor Relations

© 2024 Synopsys, Inc. 6
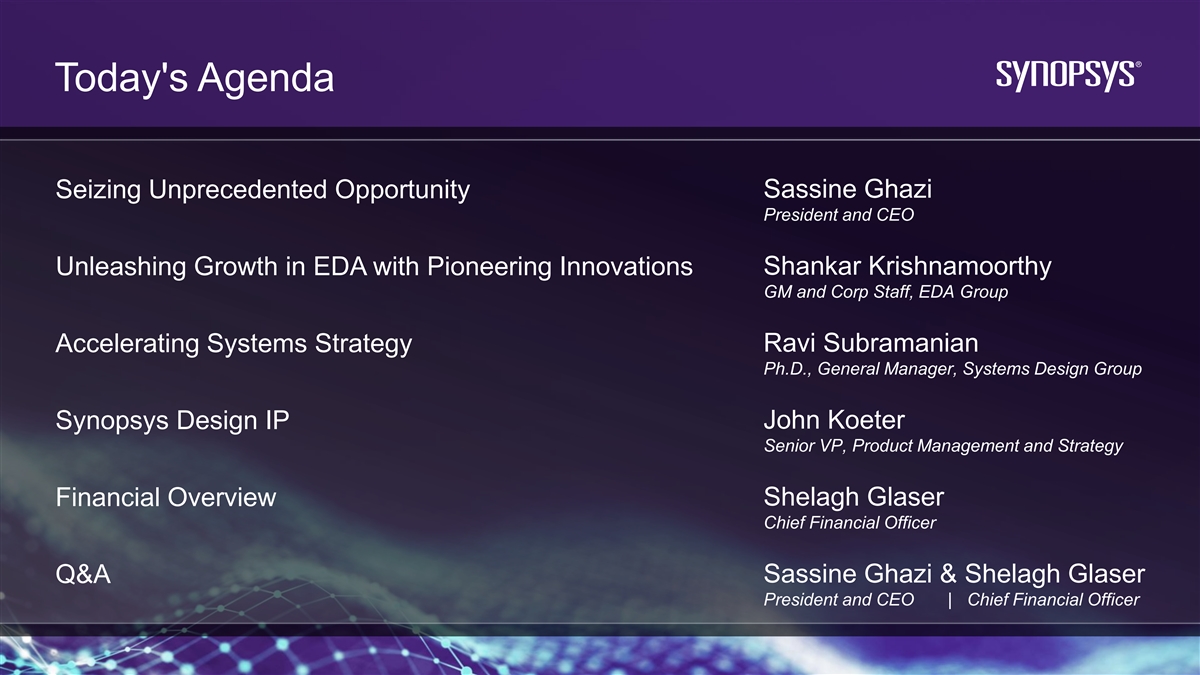
Today's Agenda Sassine Ghazi Seizing Unprecedented Opportunity President and CEO Unleashing Growth in EDA with Pioneering Innovations Shankar Krishnamoorthy GM and Corp Staff, EDA Group Accelerating Systems Strategy Ravi Subramanian Ph.D., General Manager, Systems Design Group Synopsys Design IP John Koeter Senior VP, Product Management and Strategy Financial Overview Shelagh Glaser Chief Financial Officer Sassine Ghazi & Shelagh Glaser Q&A President and CEO | Chief Financial Officer © 2024 Synopsys, Inc. 7

© 2024 Synopsys, Inc.
Seizing Unprecedented Opportunity Synopsys Investor Day 2024 Sassine Ghazi President and Chief Executive Officer
Proven Track Record of Powering Innovation and Resilient, Industry-Leading Growth
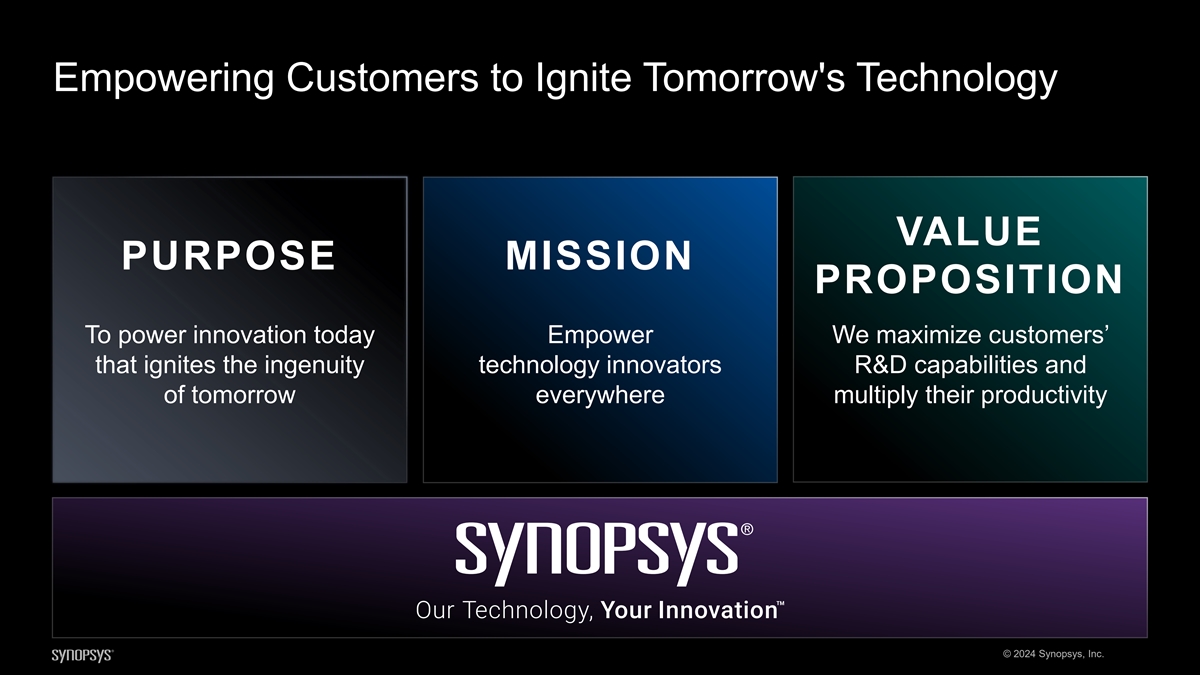
Empowering Customers to Ignite Tomorrow's Technology VALUE PURPOSE MISSION PROPOSITION To power innovation today Empower We maximize customers’ that ignites the ingenuity technology innovators R&D capabilities and of tomorrow everywhere multiply their productivity © 2024 Synopsys, Inc.
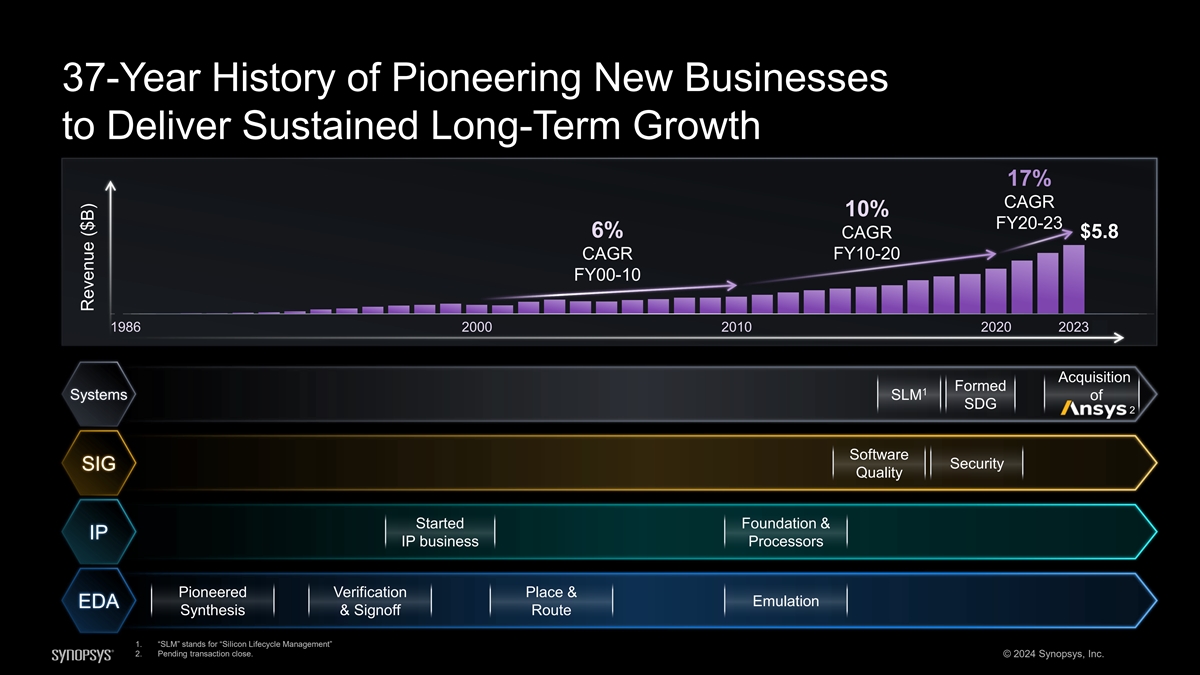
37-Year History of Pioneering New Businesses to Deliver Sustained Long-Term Growth 17% CAGR 10% FY20-23 6% CAGR $5.8 CAGR FY10-20 FY00-10 1986 2000 2010 2020 2023 Acquisition Formed 1 Systems SLM of SDG 2 Software Security SIG Quality Started Foundation & IP IP business Processors Pioneered Verification Place & Emulation EDA Synthesis & Signoff Route 1. “SLM” stands for “Silicon Lifecycle Management” 2. Pending transaction close. © 2024 Synopsys, Inc. Revenue ($B)
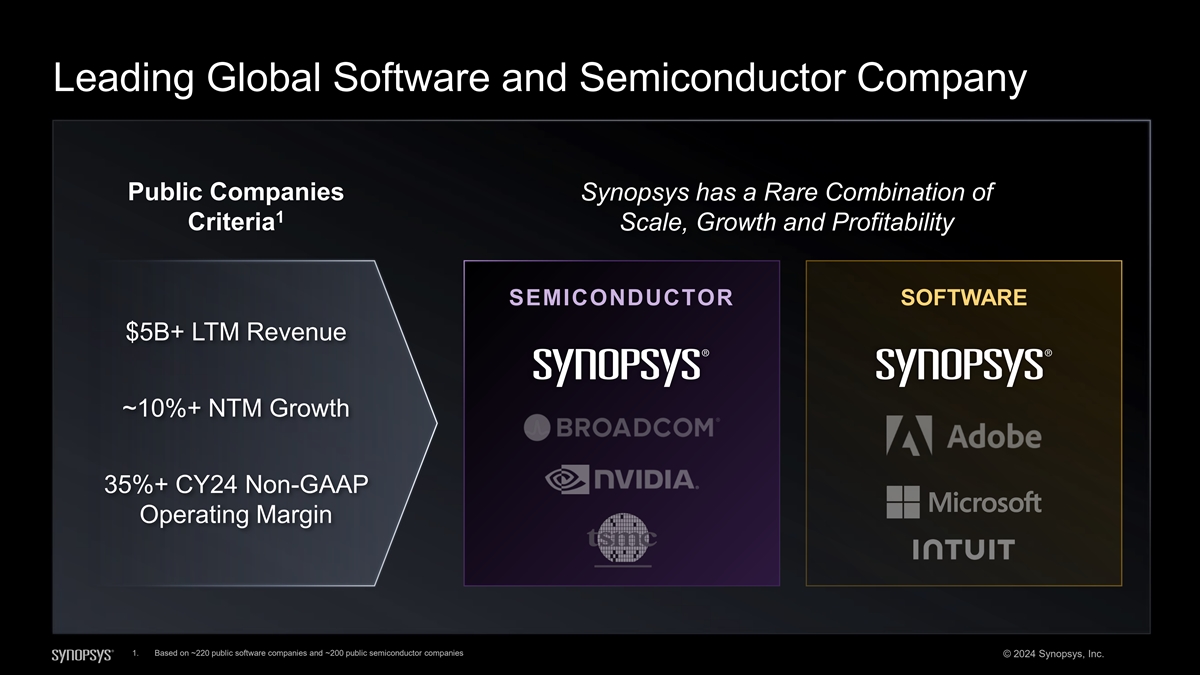
Leading Global Software and Semiconductor Company Public Companies Synopsys has a Rare Combination of 1 Criteria Scale, Growth and Profitability SEMICONDUCTOR SOFTWARE $5B+ LTM Revenue ~10%+ NTM Growth 35%+ CY24 Non-GAAP Operating Margin 1. Based on ~220 public software companies and ~200 public semiconductor companies © 2024 Synopsys, Inc.
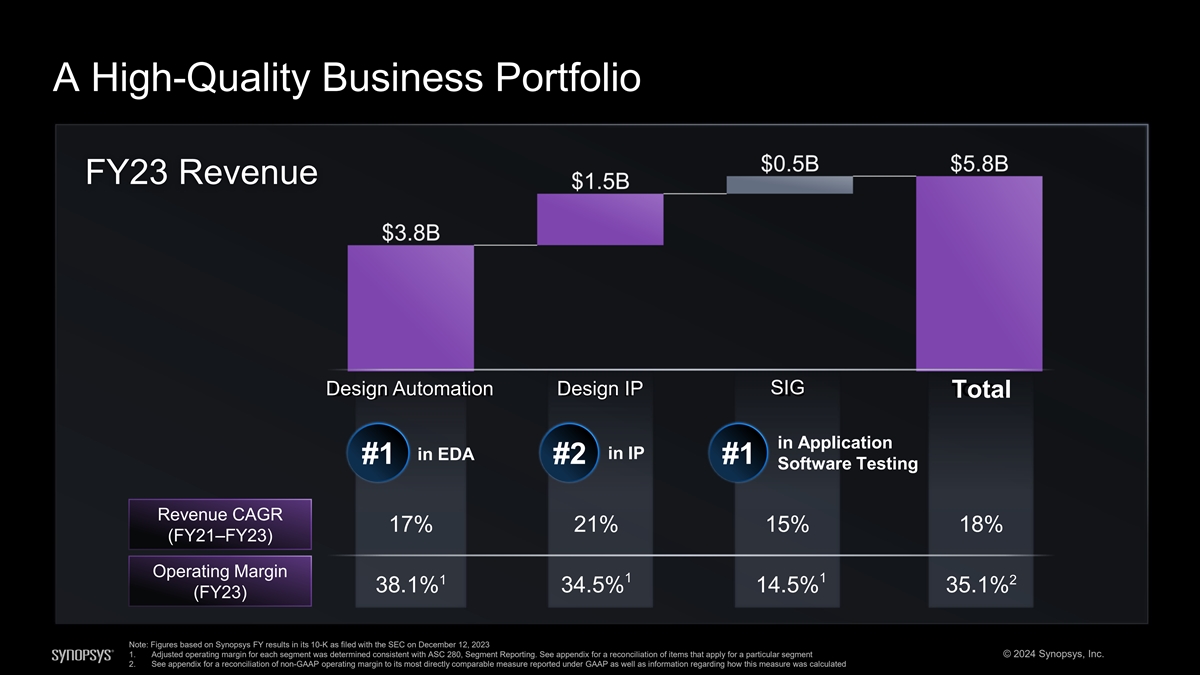
A High-Quality Business Portfolio FY23 Revenue Design Automation Design IP SIG Total in Application in IP in EDA #1 #2 #1 Software Testing Revenue CAGR 17% 21% 15% 18% (FY21–FY23) Operating Margin 1 1 1 2 38.1% 34.5% 14.5% 35.1% (FY23) Note: Figures based on Synopsys FY results in its 10-K as filed with the SEC on December 12, 2023 1. Adjusted operating margin for each segment was determined consistent with ASC 280, Segment Reporting. See appendix for a reconciliation of items that apply for a particular segment © 2024 Synopsys, Inc. 2. See appendix for a reconciliation of non-GAAP operating margin to its most directly comparable measure reported under GAAP as well as information regarding how this measure was calculated
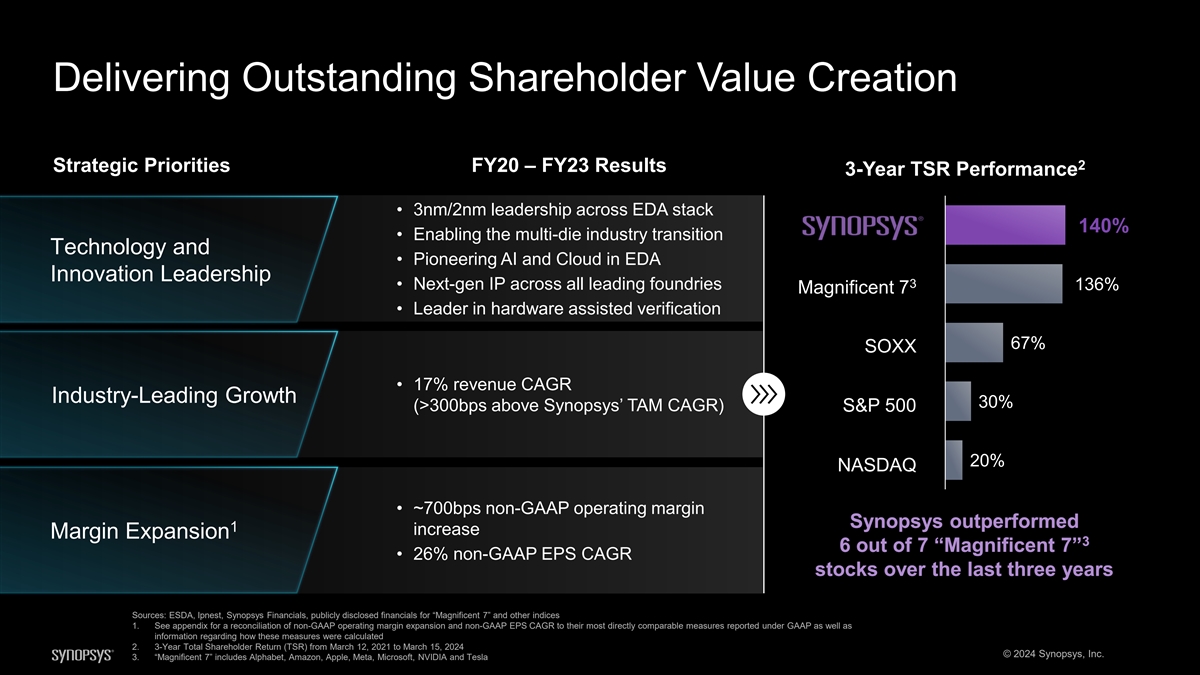
Delivering Outstanding Shareholder Value Creation 2 Strategic Priorities FY20 – FY23 Results 3-Year TSR Performance • 3nm/2nm leadership across EDA stack 140% • Enabling the multi-die industry transition Technology and • Pioneering AI and Cloud in EDA Innovation Leadership 3 • Next-gen IP across all leading foundries 136% Magnificent 7 • Leader in hardware assisted verification 67% SOXX • 17% revenue CAGR Industry-Leading Growth 30% (>300bps above Synopsys’ TAM CAGR) S&P 500 20% NASDAQ • ~700bps non-GAAP operating margin Synopsys outperformed 1 increase Margin Expansion 3 6 out of 7 “Magnificent 7” • 26% non-GAAP EPS CAGR stocks over the last three years Sources: ESDA, Ipnest, Synopsys Financials, publicly disclosed financials for “Magnificent 7” and other indices 1. See appendix for a reconciliation of non-GAAP operating margin expansion and non-GAAP EPS CAGR to their most directly comparable measures reported under GAAP as well as information regarding how these measures were calculated 2. 3-Year Total Shareholder Return (TSR) from March 12, 2021 to March 15, 2024 © 2024 Synopsys, Inc. 3. “Magnificent 7” includes Alphabet, Amazon, Apple, Meta, Microsoft, NVIDIA and Tesla

Unprecedented Market Opportunity Driven by Structural Trends
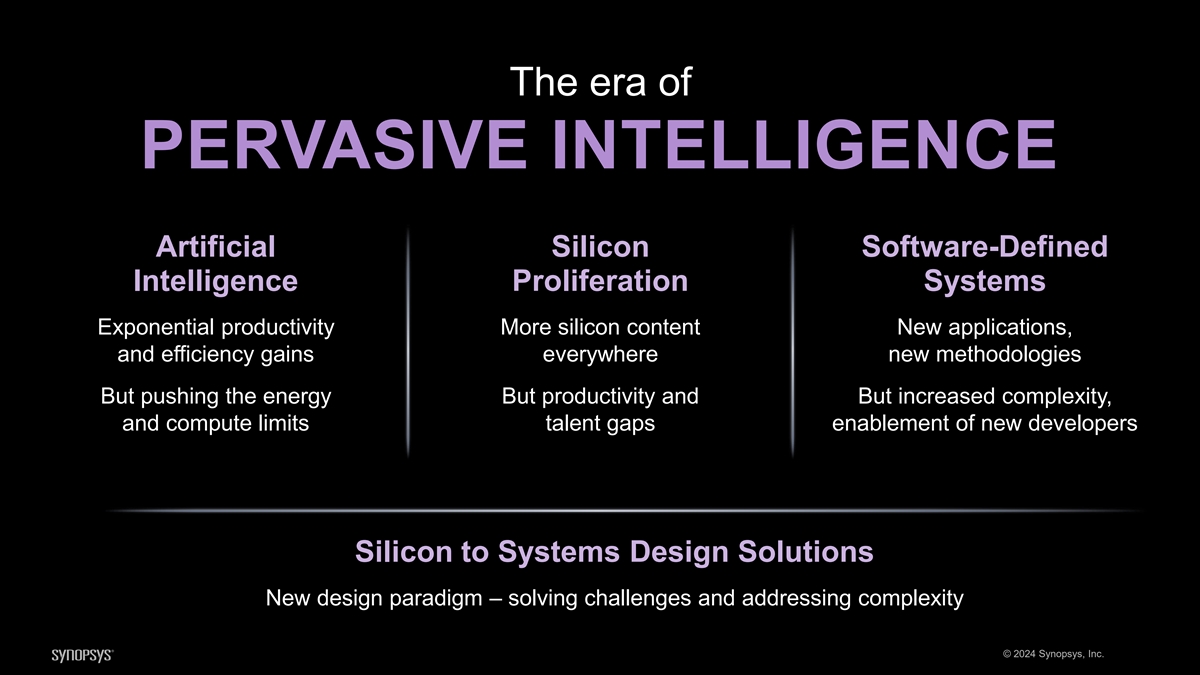
The era of PERVASIVE INTELLIGENCE Artificial Silicon Software-Defined Intelligence Proliferation Systems Exponential productivity More silicon content New applications, and efficiency gains everywhere new methodologies But pushing the energy But productivity and But increased complexity, and compute limits talent gaps enablement of new developers Silicon to Systems Design Solutions New design paradigm – solving challenges and addressing complexity © 2024 Synopsys, Inc.

Sharp Acceleration in Semiconductor Demand 1 Global Semiconductor Sales ($B) Pervasive ~10% $1T+ Intelligence CAGR Explosion in ~6% IOT & demand for CAGR Cloud 2 AI chips ~4% Mobile CAGR ~$0.5T Up to COVID ~6% Web CAGR Great Recession $400B ~18% Dotcom PC Bubble CAGR in 2027 ~1958 1985 1990 1995 2000 2005 2010 2015 2020 2025E 2030E ~ ~ 8-9 years 60 years 1. Sources: SIA/WSTS (historicals); forecasts based on Gartner, TechInsights, IBS, SIA/WSTS and consensus analyst forecasts for leading semiconductor companies 2. Sources: Gartner, AMD, Nvidia, Intel, Goldman Sachs © 2024 Synopsys, Inc.
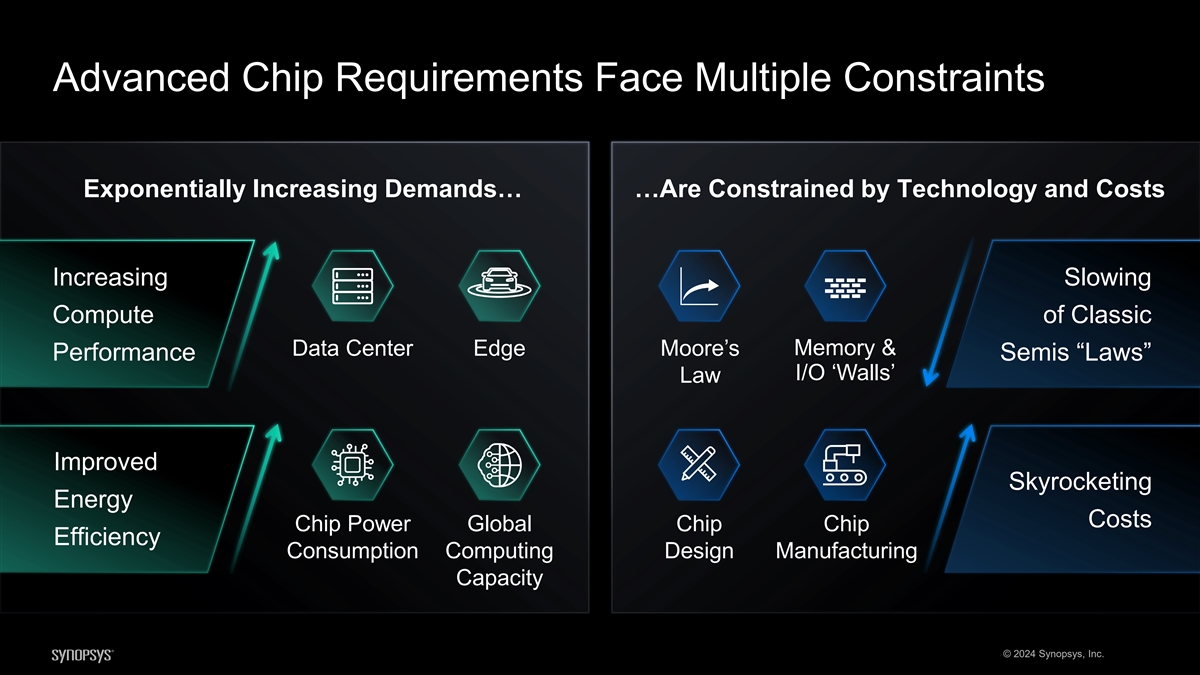
Advanced Chip Requirements Face Multiple Constraints Exponentially Increasing Demands… …Are Constrained by Technology and Costs Increasing Slowing Compute of Classic Memory & Data Center Edge Moore’s Performance Semis “Laws” I/O ‘Walls’ Law Improved Skyrocketing Energy Costs Chip Power Global Chip Chip Efficiency Consumption Computing Design Manufacturing Capacity © 2024 Synopsys, Inc.
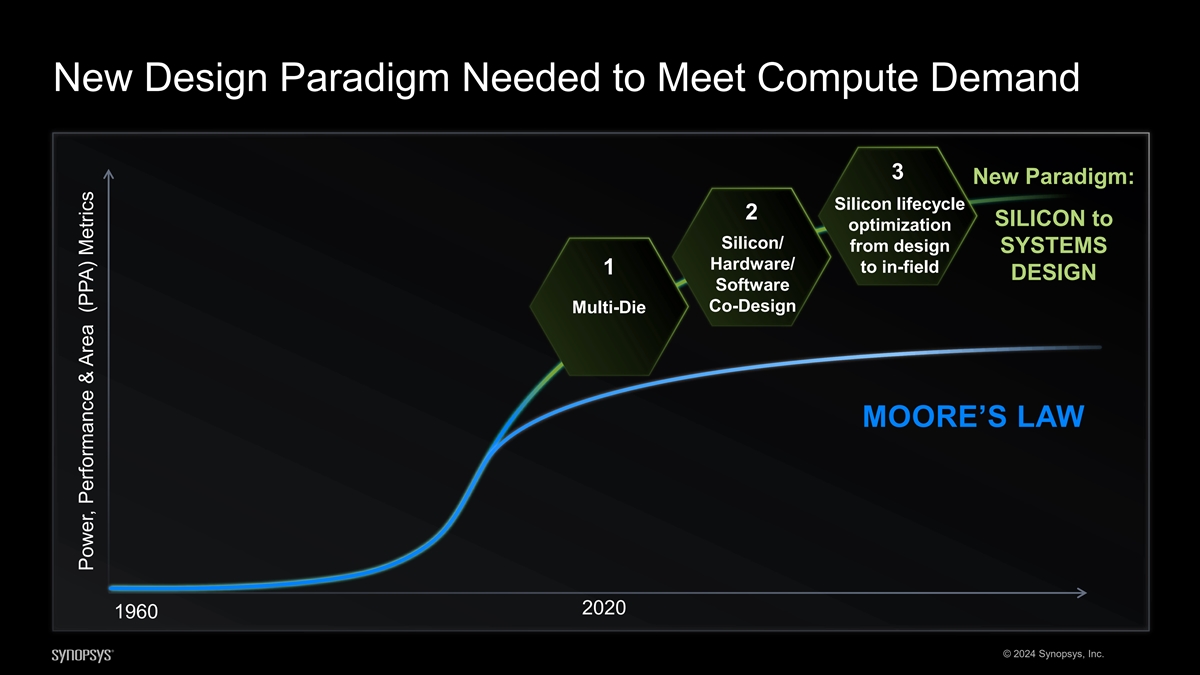
New Design Paradigm Needed to Meet Compute Demand 3 New Paradigm: Silicon lifecycle 2 SILICON to optimization Silicon/ from design SYSTEMS Hardware/ to in-field 1 DESIGN Software Co-Design Multi-Die MOORE’S LAW 2020 1960 © 2024 Synopsys, Inc. Power, Performance & Area (PPA) Metrics
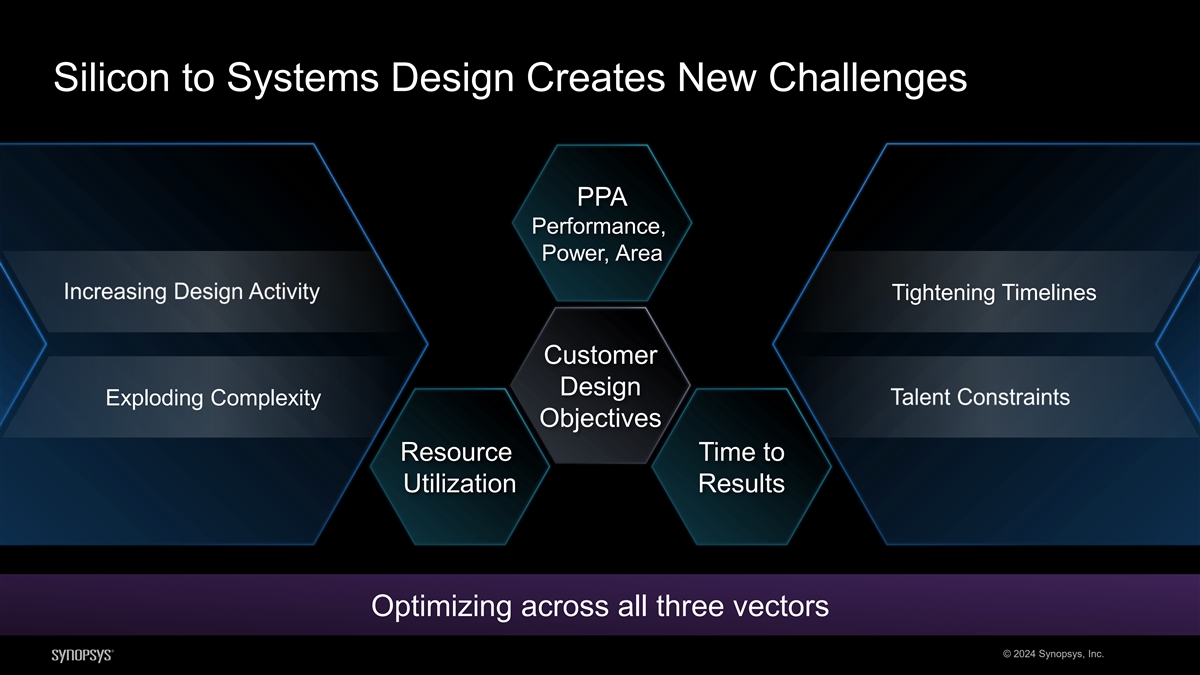
Silicon to Systems Design Creates New Challenges PPA Performance, Power, Area Tightening Timelines Customer Design Exploding Complexity Objectives Resource Time to Utilization Results Optimizing across all three vectors © 2024 Synopsys, Inc.
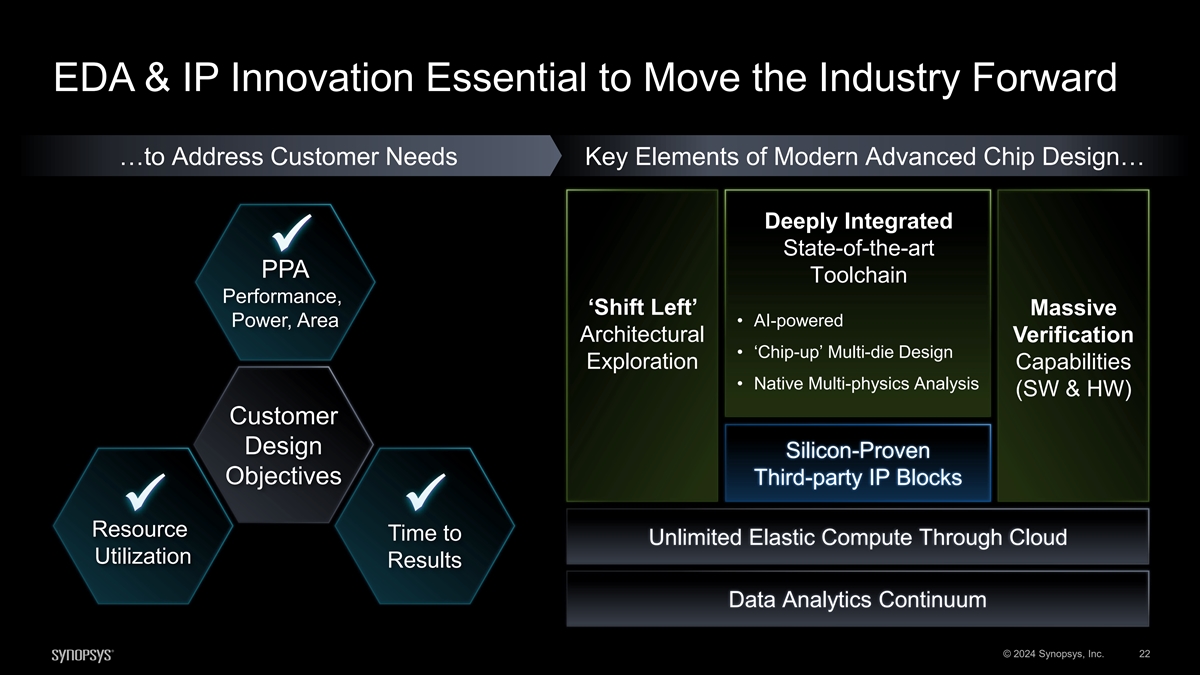
EDA & IP Innovation Essential to Move the Industry Forward …to Address Customer Needs Key Elements of Modern Advanced Chip Design… Deeply Integrated State-of-the-art ✓ PPA Toolchain Performance, ‘Shift Left’ Massive • AI-powered Power, Area Architectural Verification • ‘Chip-up’ Multi-die Design Exploration Capabilities • Native Multi-physics Analysis (SW & HW) Customer Design Silicon-Proven Objectives Third-party IP Blocks ✓✓ Resource Time to Unlimited Elastic Compute Through Cloud Utilization Results Data Analytics Continuum © 2024 Synopsys, Inc. 22
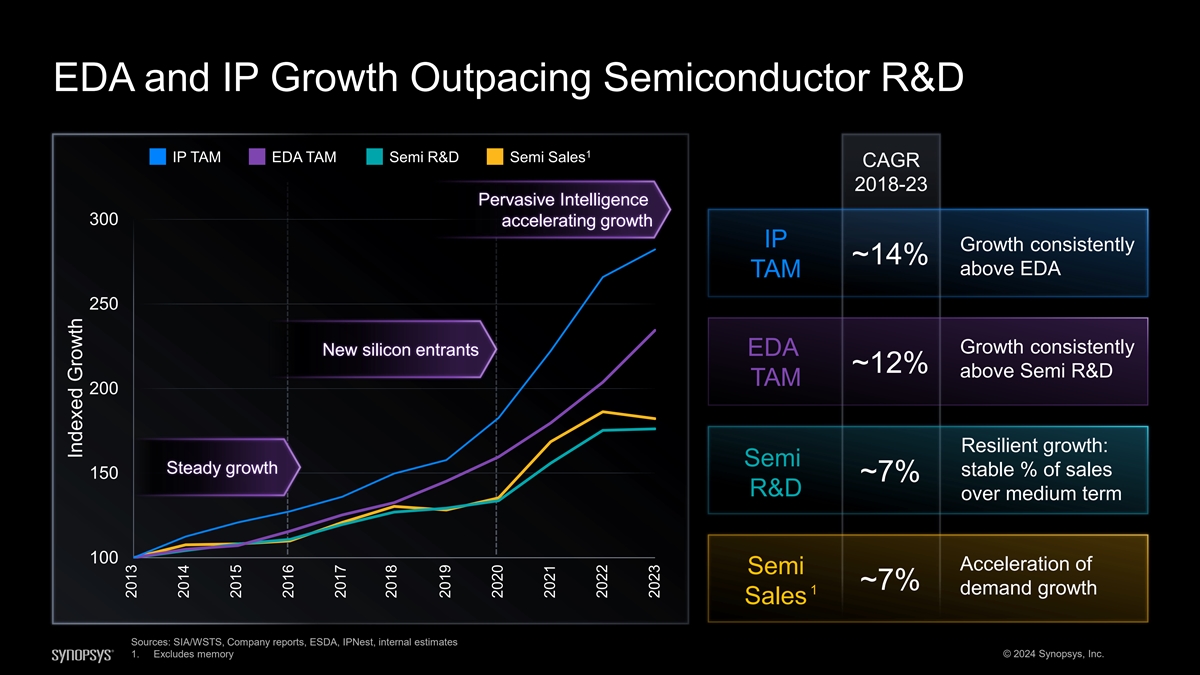
EDA and IP Growth Outpacing Semiconductor R&D 1 IP TAM EDA TAM Semi R&D Semi Sales CAGR 2018-23 Pervasive Intelligence 300 accelerating growth IP Growth consistently ~14% above EDA TAM 250 Growth consistently New silicon entrants EDA ~12% above Semi R&D TAM 200 Resilient growth: Semi Steady growth stable % of sales 150 ~7% R&D over medium term 100 Acceleration of Semi ~7% 1 demand growth Sales Sources: SIA/WSTS, Company reports, ESDA, IPNest, internal estimates 1. Excludes memory © 2024 Synopsys, Inc. Indexed Growth 2013 2014 2015 2016 2017 2018 2019 2020 2021 2022 2023

Continued Momentum from TAM Drivers to Propel Growth 2023 TAM TAM CAGR Historical Outlook 2018 - 2023 2023 - 2028E ~$18B ~13% ~13% • Increased design activity – AI/HPC, Automotive • Faster tech cycles ~$7B IP ~14% ~15% • Multi-die • Accelerated outsourcing • R&D growth linked to accelerated semi sales growth ~12% ~12% ~$11B EDA • Complexity and engineering productivity pressures • New silicon entrants with increased design activity in domain-specific chips (e.g., AI accelerators, ADAS) © 2024 Synopsys, Inc. Sources: ESDA, IPNest, internal estimates

Well-Positioned to Win
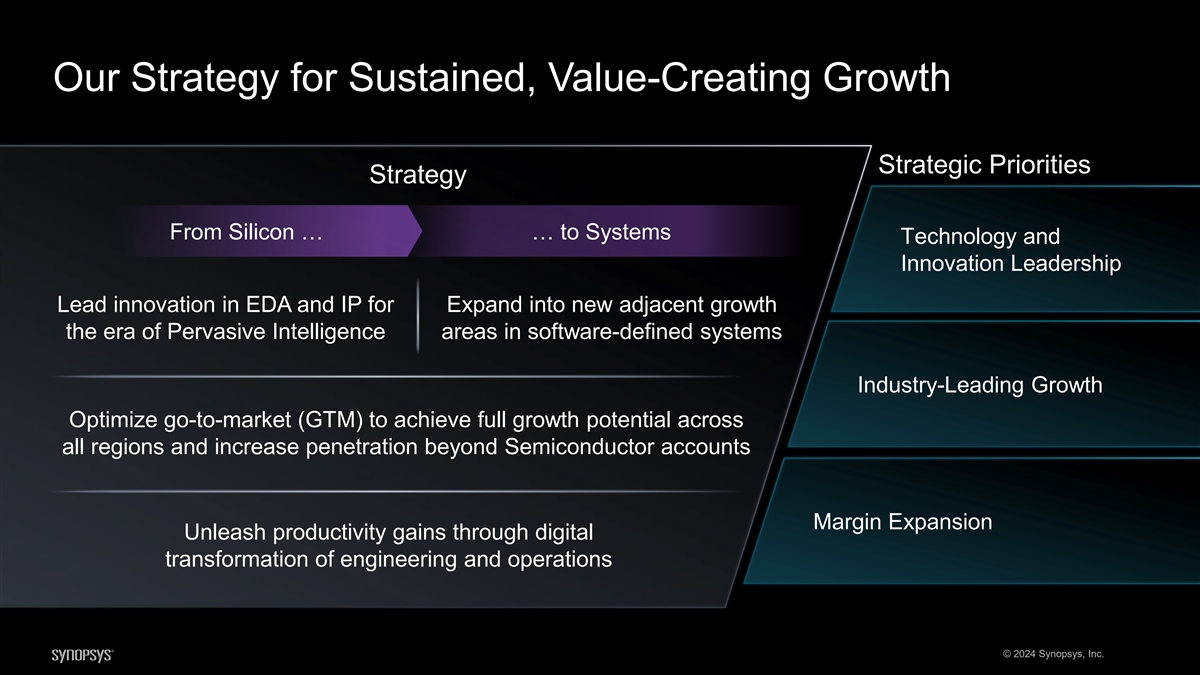
Our Strategy for Sustained, Value-Creating Growth Strategic Priorities Strategy From Silicon … … to Systems Technology and Innovation Leadership Lead innovation in EDA and IP for Expand into new adjacent growth the era of Pervasive Intelligence areas in software-defined systems Industry-Leading Growth Optimize go-to-market (GTM) to achieve full growth potential across all regions and increase penetration beyond Semiconductor accounts Margin Expansion Unleash productivity gains through digital transformation of engineering and operations © 2024 Synopsys, Inc.
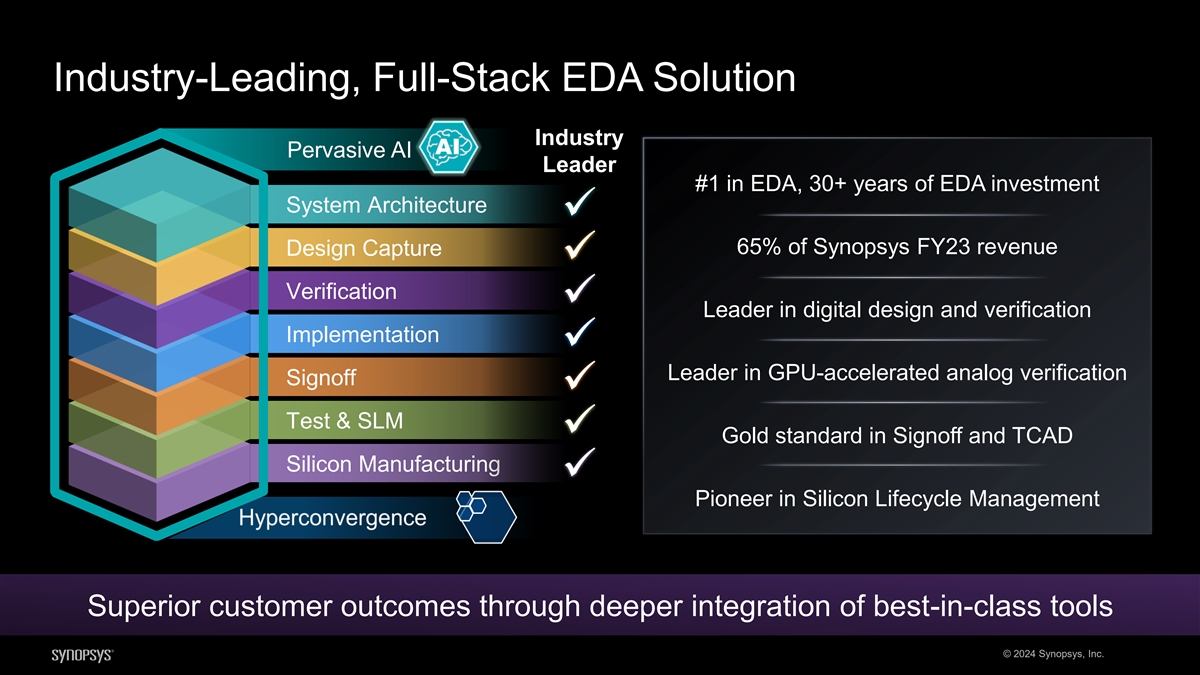
Industry-Leading, Full-Stack EDA Solution Industry Pervasive AI Leader #1 in EDA, 30+ years of EDA investment System Architecture ✓ 65% of Synopsys FY23 revenue Design Capture ✓ Verification ✓ Leader in digital design and verification Implementation ✓ Leader in GPU-accelerated analog verification Signoff ✓ Test & SLM ✓ Gold standard in Signoff and TCAD Silicon Manufacturing ✓ Pioneer in Silicon Lifecycle Management Superior customer outcomes through deeper integration of best-in-class tools © 2024 Synopsys, Inc.

Broadest IP Portfolio with Prominent Positions in Key Blocks 2023 Semi IP Market Other 8% Foundation Broadest IP portfolio, 25 years in the making IP15% Processor CPU GPU 48% Cluster Cluster Interfaces 29% A decade of sustainable, profitable growth Bus Fabrics Leader in Interfaces and Foundation IP AI Sensors Accelerator Memory (NPU) Embedded Indexed to the fastest-growing segments Processors Security System Interfaces Peripheral Interfaces IP (PCIe, Ethernet…) (USB, HDMI…) Highest quality IP portfolio with the best support Trusted provider with scope and scale to meet customer needs across markets © 2024 Synopsys, Inc. Source: IP Nest, 2015-2024 (preliminary) Reports Memory Basic Peripherals Interface (Uart, I2C) Memory Memory Die-to-Die GPIOs Interface
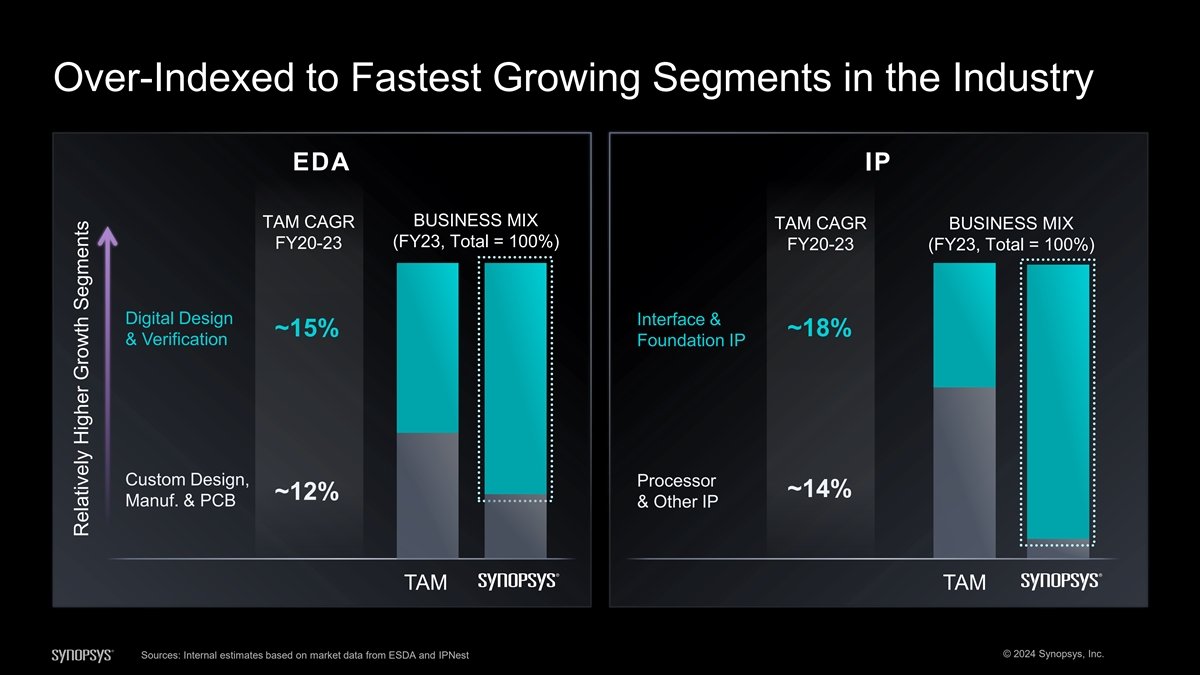
Over-Indexed to Fastest Growing Segments in the Industry EDA IP BUSINESS MIX TAM CAGR TAM CAGR BUSINESS MIX (FY23, Total = 100%) FY20-23 FY20-23 (FY23, Total = 100%) Digital Design Interface & ~15% ~18% & Verification Foundation IP Custom Design, Processor ~14% ~12% Manuf. & PCB & Other IP TAM TAM © 2024 Synopsys, Inc. Sources: Internal estimates based on market data from ESDA and IPNest Relatively Higher Growth Segments

We are an AI Company...Unlocking Massive Customer Productivity Gains…

...in the Early Stages of the AI Transition
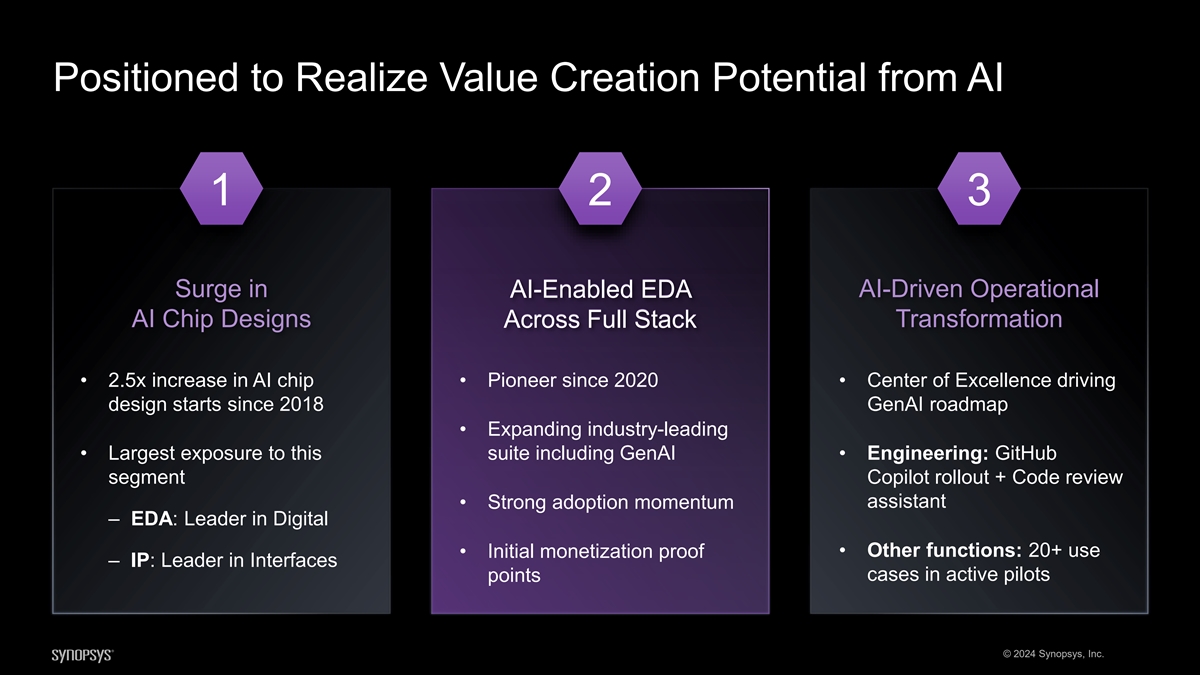
Positioned to Realize Value Creation Potential from AI 1 2 3 Surge in AI AI- -E Enabled nabled E EDA DA AI-Driven Operational AI Chip Designs Acro Across ss Full Full St Stac ack k Transformation • 2.5x increase in AI chip • Pioneer since 2020 • Center of Excellence driving design starts since 2018 GenAI roadmap • Expanding industry-leading • Largest exposure to this suite including GenAI • Engineering: GitHub segment Copilot rollout + Code review assistant • Strong adoption momentum ‒ EDA: Leader in Digital • Initial monetization proof • Other functions: 20+ use ‒ IP: Leader in Interfaces cases in active pilots points © 2024 Synopsys, Inc.
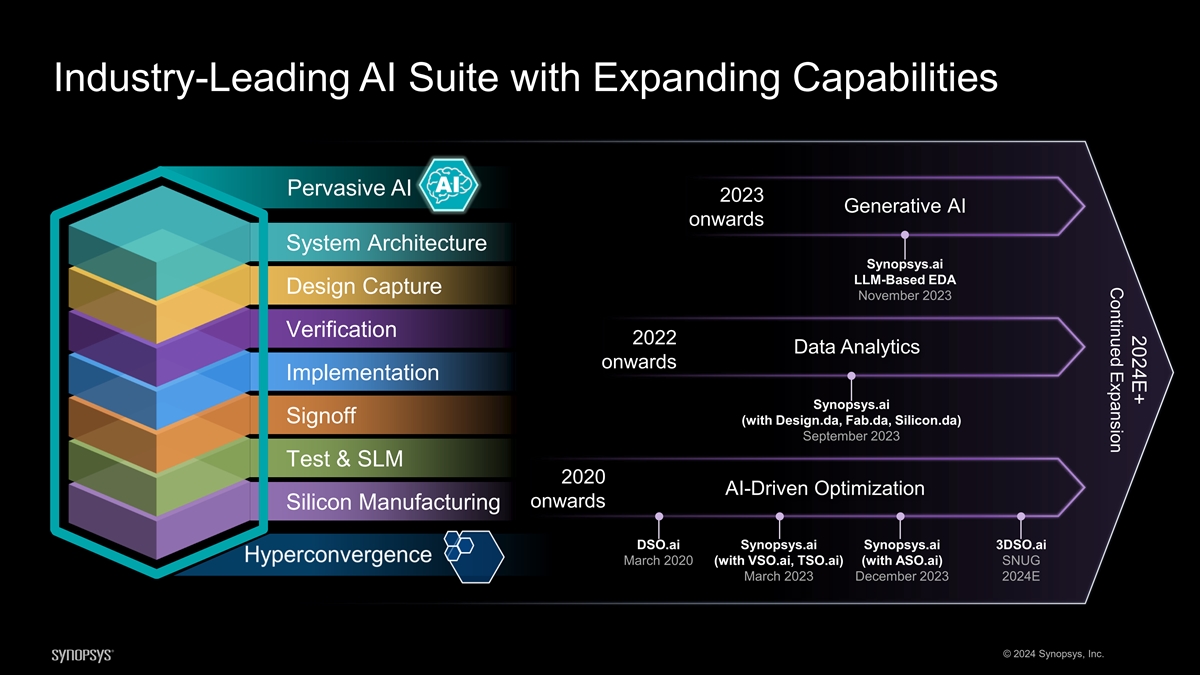
2024E+ Continued Expansion Industry-Leading AI Suite with Expanding Capabilities Pervasive AI 2023 Generative AI onwards System Architecture Synopsys.ai LLM-Based EDA Design Capture November 2023 Verification 2022 Data Analytics onwards Implementation Synopsys.ai Signoff (with Design.da, Fab.da, Silicon.da) September 2023 Test & SLM 2020 AI-Driven Optimization onwards Silicon Manufacturing DSO.ai Synopsys.ai Synopsys.ai 3DSO.ai March 2020 (with VSO.ai, TSO.ai) (with ASO.ai) SNUG March 2023 December 2023 2024E © 2024 Synopsys, Inc.
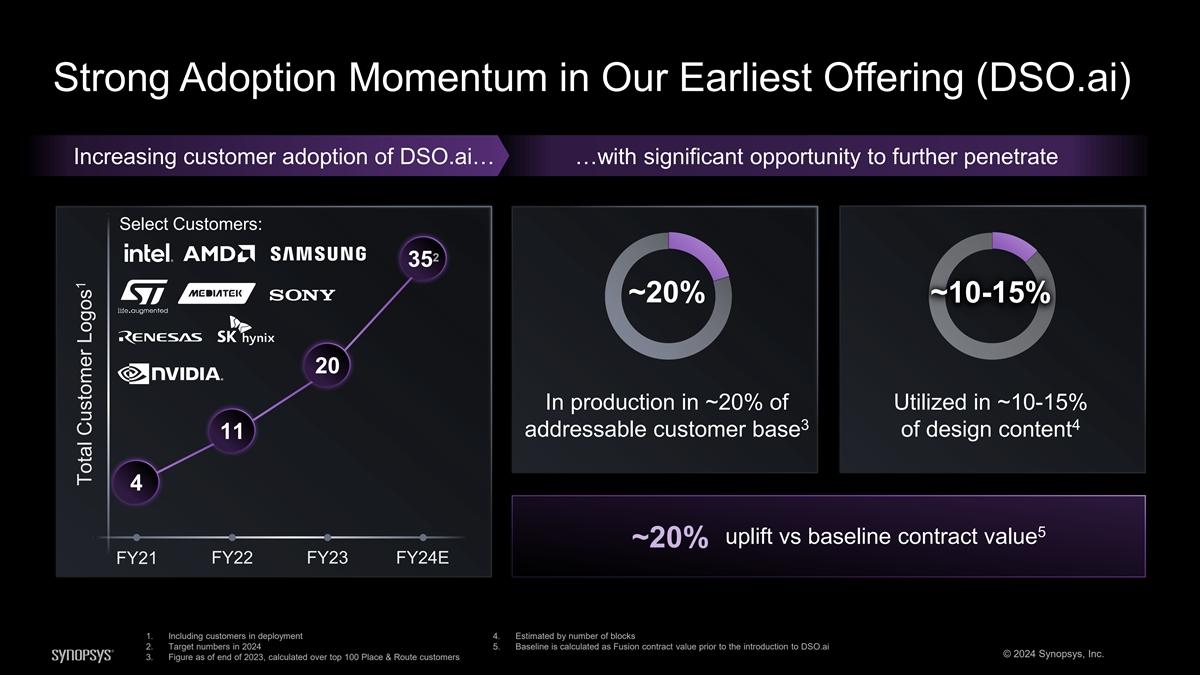
Strong Adoption Momentum in Our Earliest Offering (DSO.ai) Increasing customer adoption of DSO.ai… …with significant opportunity to further penetrate Select Customers: 2 35 ~20% ~10-15% 20 In production in ~20% of Utilized in ~10-15% 3 4 addressable customer base of design content 11 4 5 uplift vs baseline contract value ~20% FY21 FY22 FY23 FY24E 1. Including customers in deployment 4. Estimated by number of blocks 2. Target numbers in 2024 5. Baseline is calculated as Fusion contract value prior to the introduction to DSO.ai © 2024 Synopsys, Inc. 3. Figure as of end of 2023, calculated over top 100 Place & Route customers 1 Total Customer Logos
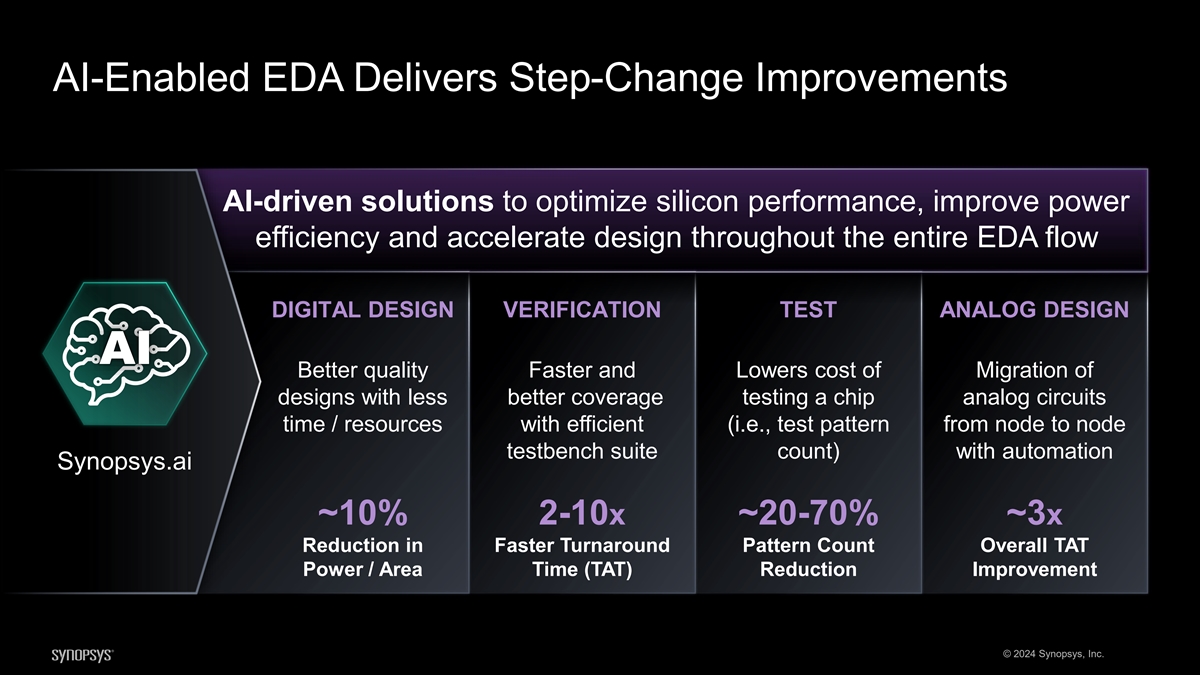
AI-Enabled EDA Delivers Step-Change Improvements AI-driven solutions to optimize silicon performance, improve power efficiency and accelerate design throughout the entire EDA flow DIGITAL DESIGN VERIFICATION TEST ANALOG DESIGN Better quality Faster and Lowers cost of Migration of designs with less better coverage testing a chip analog circuits time / resources with efficient (i.e., test pattern from node to node testbench suite count) with automation Synopsys.ai ~10% 2-10x ~20-70% ~3x Reduction in Faster Turnaround Pattern Count Overall TAT Power / Area Time (TAT) Reduction Improvement © 2024 Synopsys, Inc.
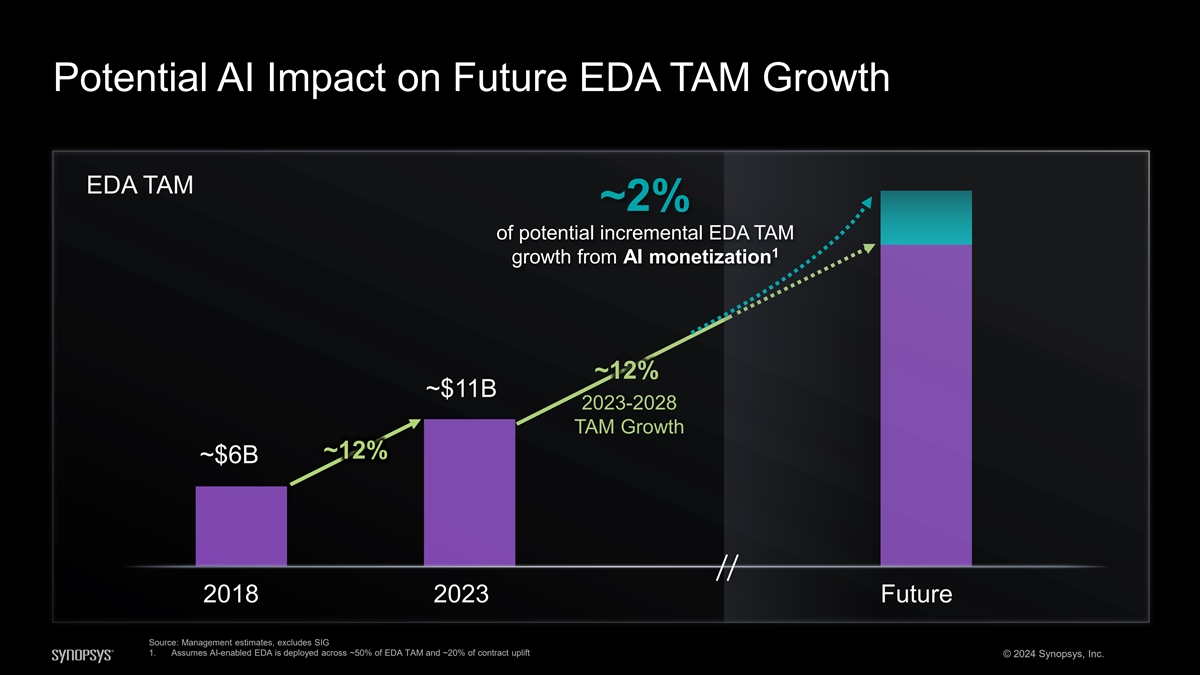
Potential AI Impact on Future EDA TAM Growth EDA TAM ~2% of potential incremental EDA TAM 1 growth from AI monetization ~12% ~$11B 2023-2028 TAM Growth ~12% ~$6B 2018 2023 Future Source: Management estimates, excludes SIG 1. Assumes AI-enabled EDA is deployed across ~50% of EDA TAM and ~20% of contract uplift © 2024 Synopsys, Inc.

Creating the Leader in Silicon to Systems Design Solutions

Systems to Silicon Silicon to Systems Transition Ongoing Across Verticals SYSTEMS SPECTRUM Electronics Electro-Mechanical Semiconductor Companies Systems Companies “Classic” Advanced Industrial Chips Computing High-Tech Automotive Aerospace Equipment Others MECHANICAL MECHANICAL MECHANICAL MECHANICAL MECHANICAL ELECTRIC ELECTRIC ELECTRIC ELECTRIC ELECTRIC ELECTRONIC ELECTRONIC ELECTRONIC ELECTRONIC ELECTRONIC ELECTRONIC ELECTRONIC Hardware Hardware Hardware Hardware Hardware Embedded Software Software Software Software Software control Silicon Silicon Silicon Silicon Silicon Silicon © 2024 Synopsys, Inc. Silicon to Systems
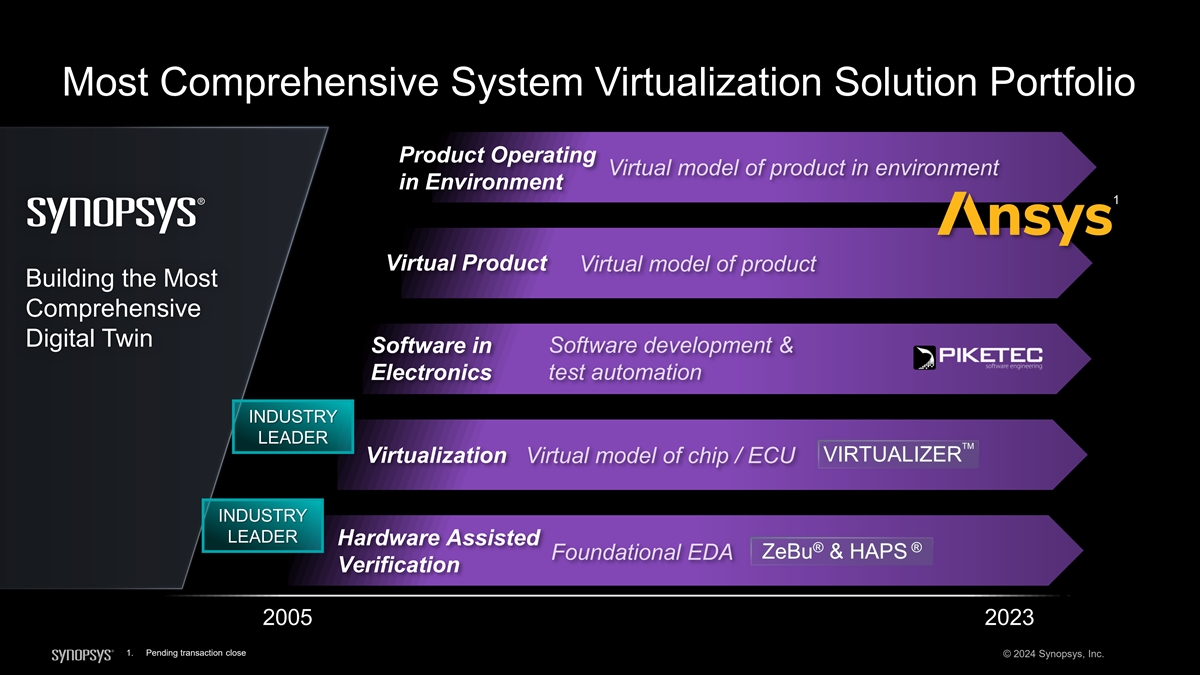
Most Comprehensive System Virtualization Solution Portfolio Product Operating Virtual model of product in environment in Environment 1 Virtual Product Virtual model of product Building the Most Comprehensive Digital Twin Software development & Software in Electronics test automation INDUSTRY LEADER TM VIRTUALIZER Virtualization Virtual model of chip / ECU INDUSTRY LEADER Hardware Assisted ® ® ZeBu & HAPS Foundational EDA Verification 2005 2023 1. Pending transaction close © 2024 Synopsys, Inc.
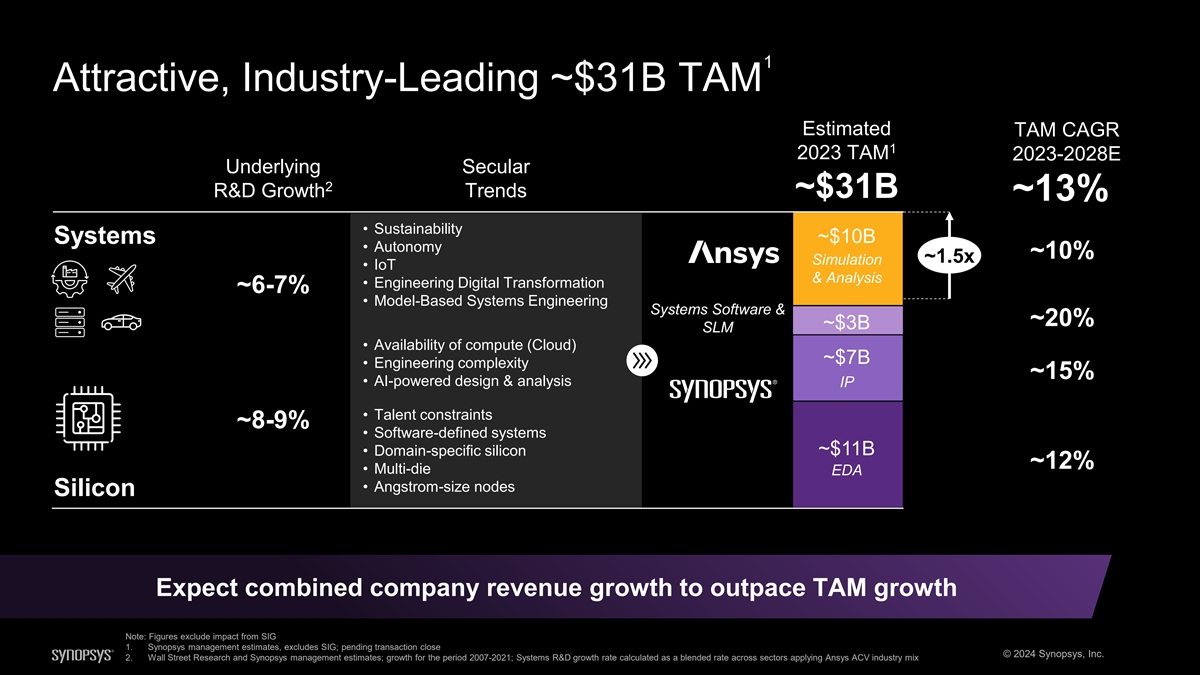
1 Attractive, Industry-Leading ~$31B TAM Estimated TAM CAGR 1 2023 TAM 2023-2028E Underlying Secular 2 R&D Growth Trends ~$31B ~13% • Sustainability Systems ~$10B • Autonomy ~10% ~1.5x Simulation • IoT & Analysis • Engineering Digital Transformation ~6-7% • Model-Based Systems Engineering Systems Software & ~20% ~$3B SLM • Availability of compute (Cloud) ~$7B • Engineering complexity ~15% • AI-powered design & analysis IP • Talent constraints ~8-9% • Software-defined systems ~$11B • Domain-specific silicon ~12% • Multi-die EDA • Angstrom-size nodes Silicon Expect combined company revenue growth to outpace TAM growth Note: Figures exclude impact from SIG 1. Synopsys management estimates, excludes SIG; pending transaction close © 2024 Synopsys, Inc. 2. Wall Street Research and Synopsys management estimates; growth for the period 2007-2021; Systems R&D growth rate calculated as a blended rate across sectors applying Ansys ACV industry mix

Accelerating Our Silicon to Systems Strategy From Silicon … … to Systems Strengthens Accelerates expansion capabilities in into new growth advanced chip design verticals 31% 22% technology Semiconductor / Aerospace • Opportunities to improve High-Tech EDA penetration • Extends portfolio with • Scale fast-growing industry-leading simulation • Scale fast-growing Synopsys system and analysis solutions Synopsys system software businesses software businesses through • Enables fusion of FY23 tAns hrough ys GT Ans Mys GTM multi-physics analysis into ACV $2.3B • • H High igh- -pot potent ential ial v vert ertic icals als digital design flows 18% for digital twin and functional for digital twin and functional Automotive • Allows development safety solutions combining safety solutions combining of joint solutions in physics and electronics physics and electronics 13% new areas (e.g., Analog/RF) 8% 8% Other Energy Industrial Equipment © 2024 Synopsys, Inc. Note: Figures based on Ansys press release as furnished with the SEC on February 21, 2024
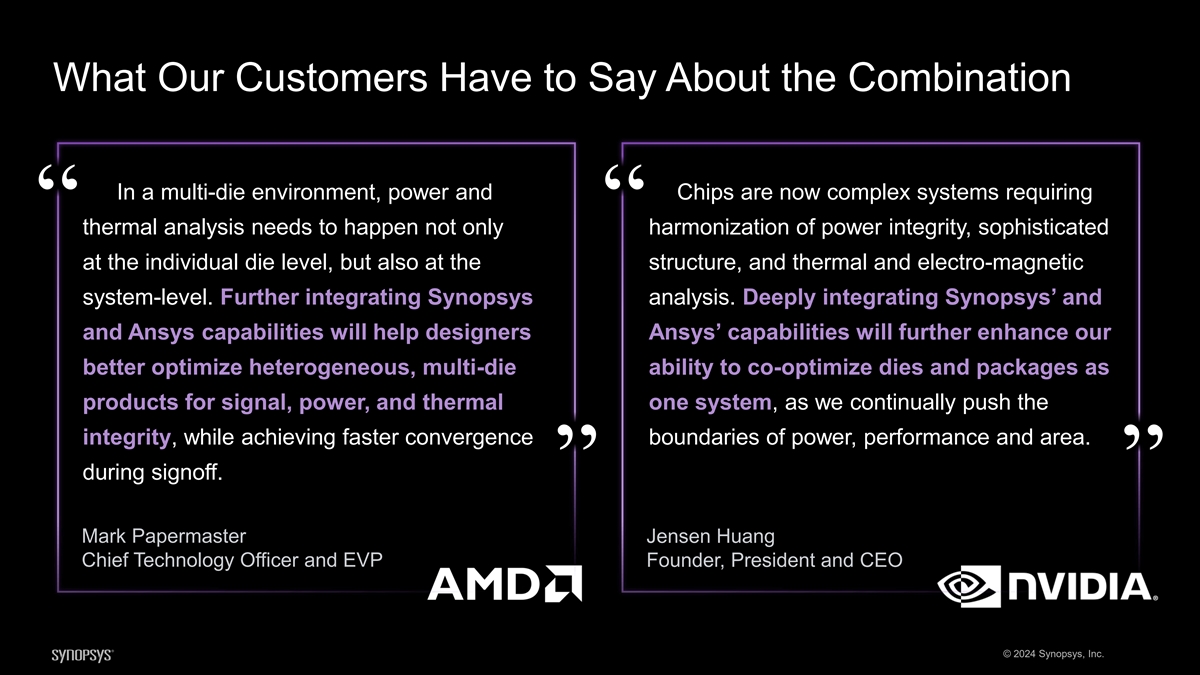
What Our Customers Have to Say About the Combination In a multi-die environment, power and Chips are now complex systems requiring ““ thermal analysis needs to happen not only harmonization of power integrity, sophisticated at the individual die level, but also at the structure, and thermal and electro-magnetic system-level. Further integrating Synopsys analysis. Deeply integrating Synopsys’ and and Ansys capabilities will help designers Ansys’ capabilities will further enhance our better optimize heterogeneous, multi-die ability to co-optimize dies and packages as products for signal, power, and thermal one system, as we continually push the integrity, while achieving faster convergence boundaries of power, performance and area. during signoff. ”” Mark Papermaster Jensen Huang Chief Technology Officer and EVP Founder, President and CEO © 2024 Synopsys, Inc.
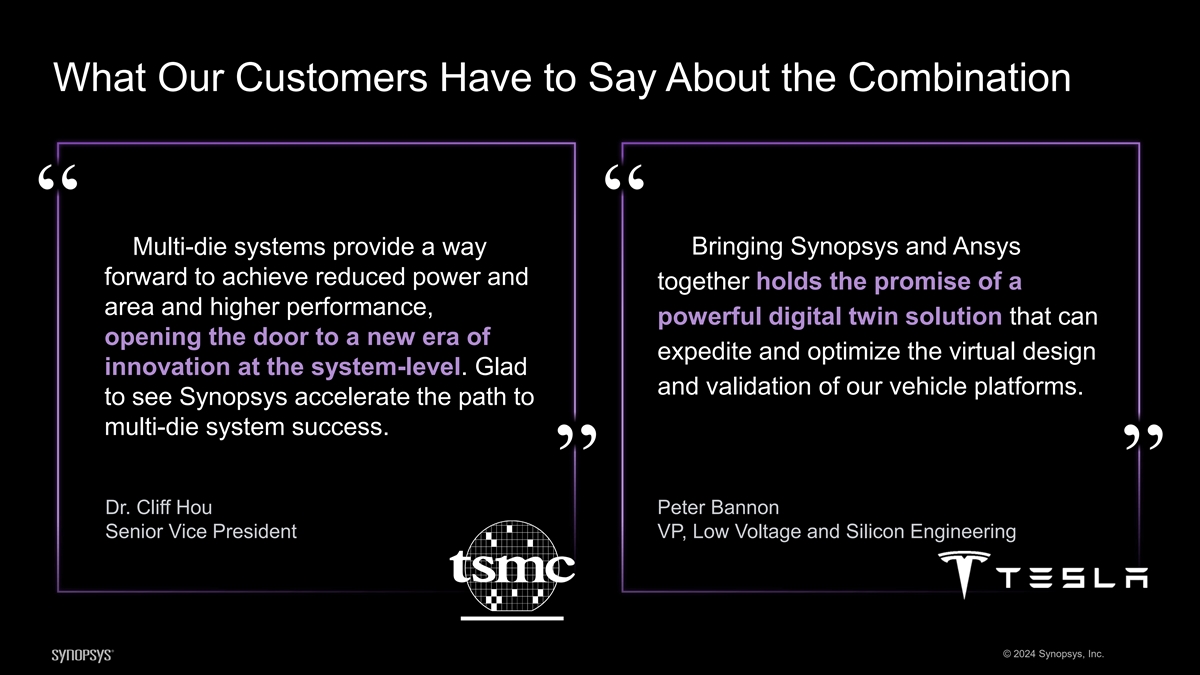
What Our Customers Have to Say About the Combination ““ Multi-die systems provide a way Bringing Synopsys and Ansys forward to achieve reduced power and together holds the promise of a area and higher performance, powerful digital twin solution that can opening the door to a new era of expedite and optimize the virtual design innovation at the system-level. Glad and validation of our vehicle platforms. to see Synopsys accelerate the path to multi-die system success. ”” Dr. Cliff Hou Peter Bannon Senior Vice President VP, Low Voltage and Silicon Engineering © 2024 Synopsys, Inc.
Ansys Synopsys Investor Day 2024 Ajei Gopal President and Chief Executive Officer, Ansys
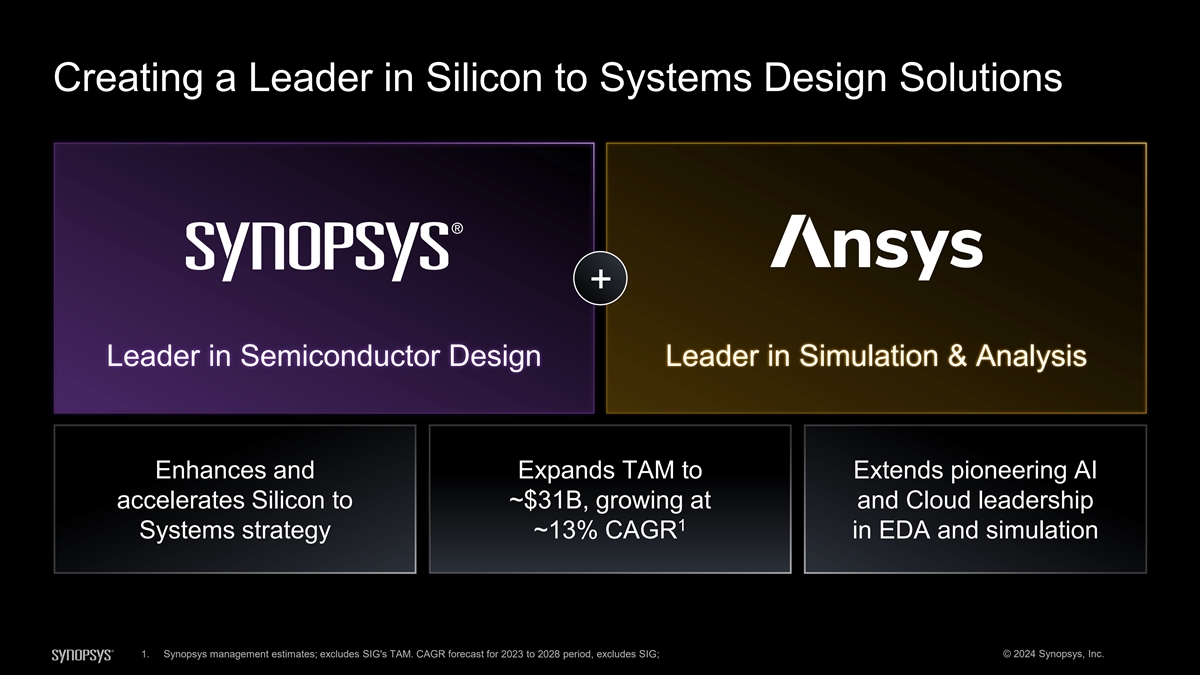
Creating a Leader in Silicon to Systems Design Solutions + Leader in Semiconductor Design Leader in Simulation & Analysis Enhances and Expands TAM to Extends pioneering AI accelerates Silicon to ~$31B, growing at and Cloud leadership 1 Systems strategy ~13% CAGR in EDA and simulation 1. Synopsys management estimates; excludes SIG's TAM. CAGR forecast for 2023 to 2028 period, excludes SIG; © 2024 Synopsys, Inc.

Committed to Industry-Leading Revenue Growth and Margin Accretion

1 Long-Term Financial Objectives Aligned with Strategy Non-GAAP Op. Revenue Free Cash Flow Non-GAAP EPS Margin 17% 28% 35% 23% 26% 26% FY20-23 FY20-23 Non-GAAP FY20-23 FCF FY20-23 Non-GAAP 2 3 2 CAGR Op. Margin Margin EPS CAGR Combined company long-term, multi-year objectives Industry-leading Long-term non-GAAP Long-term unlevered Non-GAAP EPS growth 4 double-digit operating margins in free cash flow margins in the high-teens range 4 4 growth mid-40s in mid-30s Note: Combined company objectives exclude impact from SIG 1. These multi-year objectives are provided as of March 20, 2024 2. See appendix for a reconciliation of non-GAAP operating margin and non-GAAP EPS CAGR to their most directly comparable measures reported under GAAP as well as information regarding how these measures were calculated 3. Calculated as cash flows from operating activities less net capital expenditures less capitalized software development costs; see appendix for a reconciliation of free cash flow margin to its most directly comparable measure reported under © 2024 Synopsys, Inc. GAAP as well as information regarding how this measure was calculated 4. Reconciliations of long-term non-GAAP operating margin, unlevered free cash flow margin and non-GAAP EPS are not available, see Non-GAAP Financial Information for more information
Seizing Unprecedented Opportunity Multi-decade track record of delivering outsized shareholder value Solving customer challenges in the face of exploding complexity Technology leadership in AI, multi-die & Silicon to Systems design Commitment to resilient, market-leading growth © 2024 Synopsys, Inc.


© 2024 Synopsys, Inc.
Unleashing Growth in EDA with Pioneering Innovations Shankar Krishnamoorthy GM and Corp Staff, EDA Group
Synopsys EDA is Moving from Important to Mission Critical
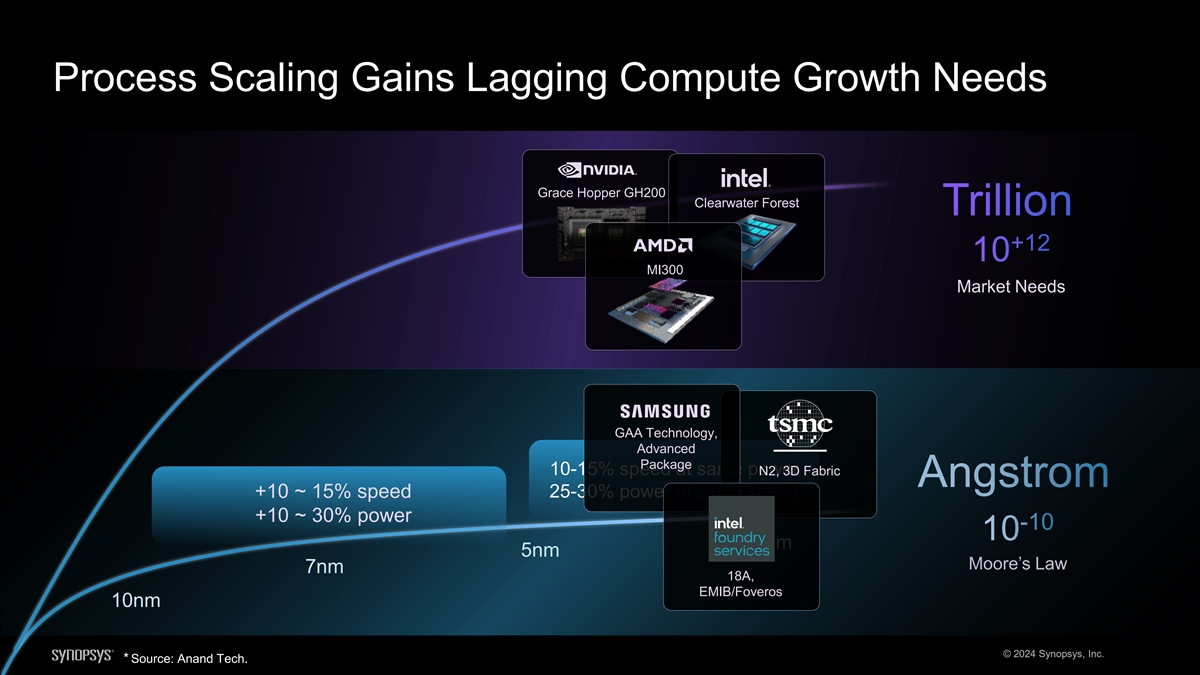
Process Scaling Gains Lagging Compute Growth Needs Grace Hopper GH200 Clearwater Forest Trillion +12 10 MI300 Market Needs GAA Technology, Advanced Package 10-15% speed at same po N2 w , e 3D r Fabric Angstrom 25-30% power at same speed +10 ~ 15% speed +10 ~ 30% power -10 10 2nm 5nm Moore’s Law 7nm 18A, EMIB/Foveros 10nm © 2024 Synopsys, Inc. * Source: Anand Tech.
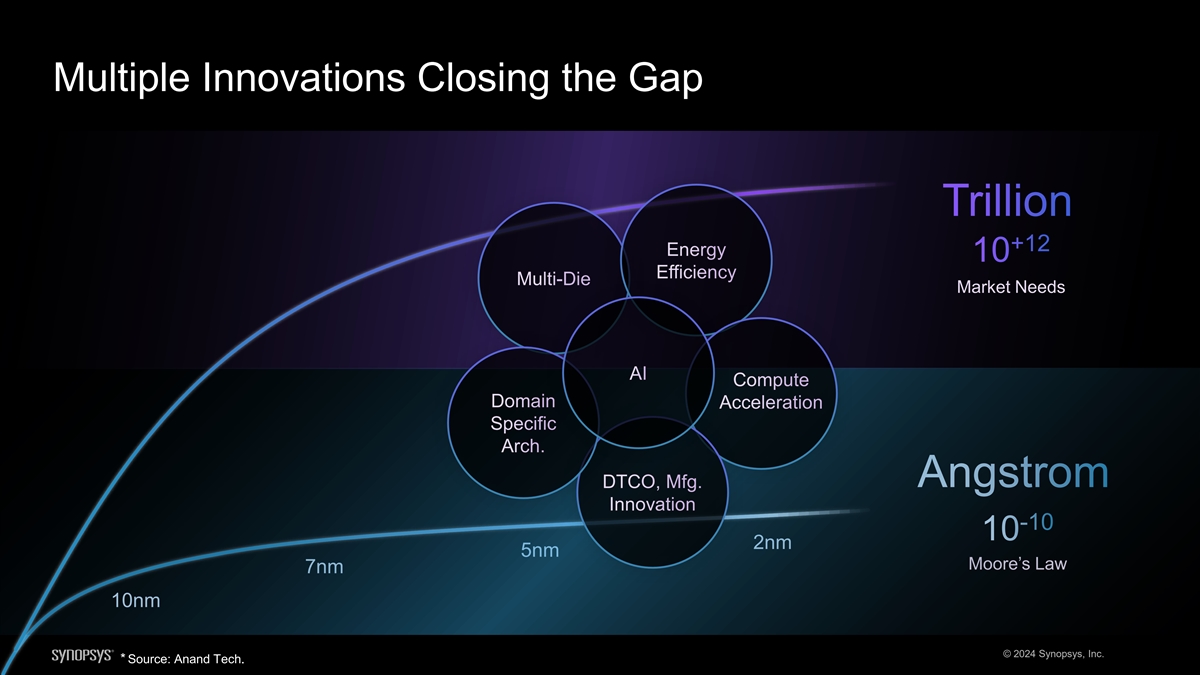
Multiple Innovations Closing the Gap Trillion +12 Energy 10 Efficiency Multi-Die Market Needs AI Compute Domain Acceleration Specific Arch. Angstrom DTCO, Mfg. Innovation -10 10 2nm 5nm Moore’s Law 7nm 10nm © 2024 Synopsys, Inc. * Source: Anand Tech.
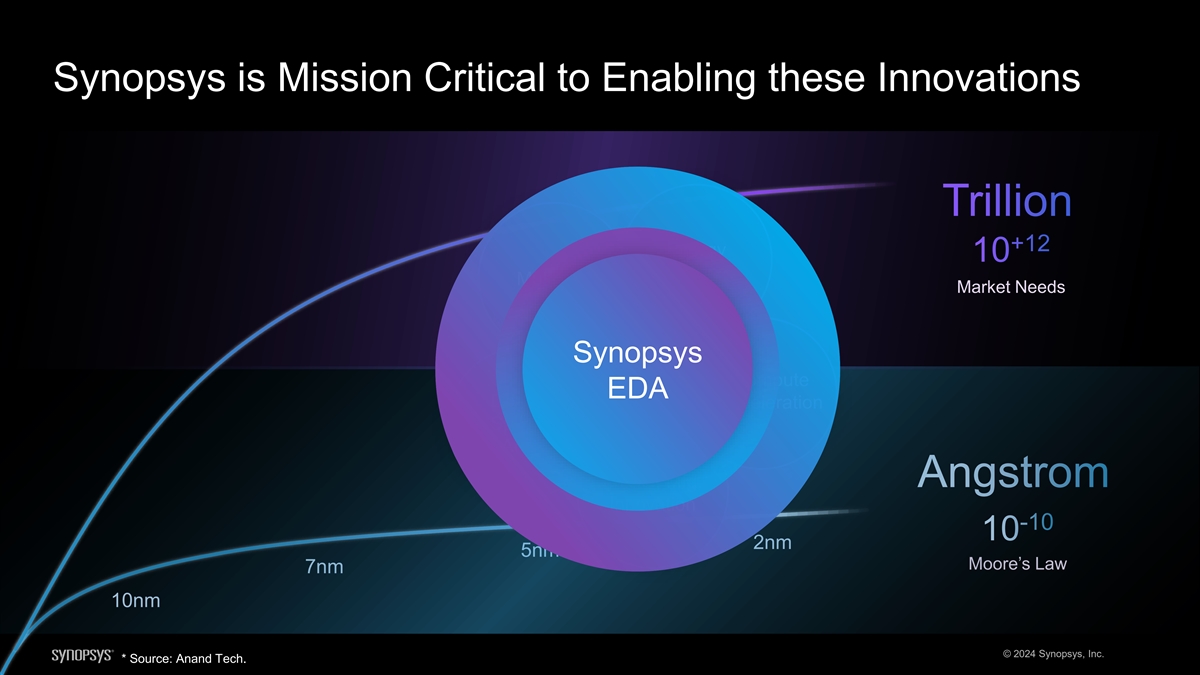
Synopsys is Mission Critical to Enabling these Innovations Trillion +12 Energy 10 Efficiency Multi-Die Market Needs Synopsys AI Compute EDA Domain Acceleration Specific Arch. Angstrom DTCO, Mfg. Innovation -10 10 2nm 5nm Moore’s Law 7nm 10nm © 2024 Synopsys, Inc. * Source: Anand Tech.

Synopsys EDA Well Positioned with Breadth and Depth of Portfolio
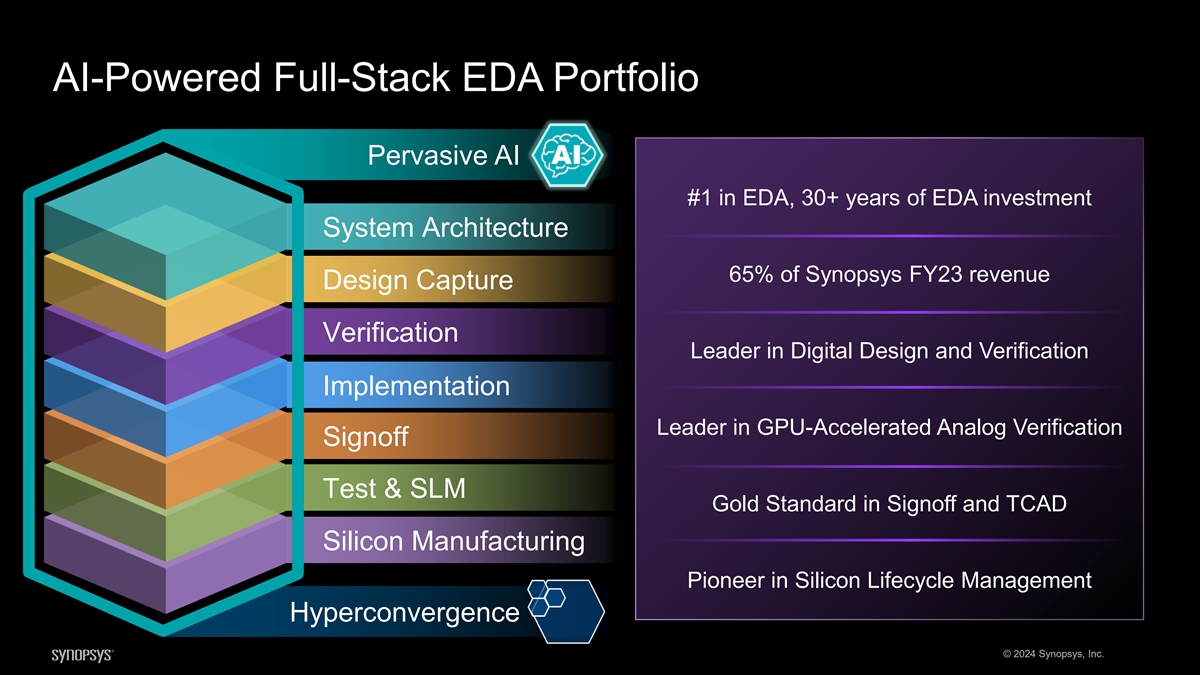
AI-Powered Full-Stack EDA Portfolio Pervasive AI #1 in EDA, 30+ years of EDA investment System Architecture 65% of Synopsys FY23 revenue Design Capture Verification Leader in Digital Design and Verification Implementation Leader in GPU-Accelerated Analog Verification Signoff Test & SLM Gold Standard in Signoff and TCAD Silicon Manufacturing Pioneer in Silicon Lifecycle Management Hyperconvergence © 2024 Synopsys, Inc.
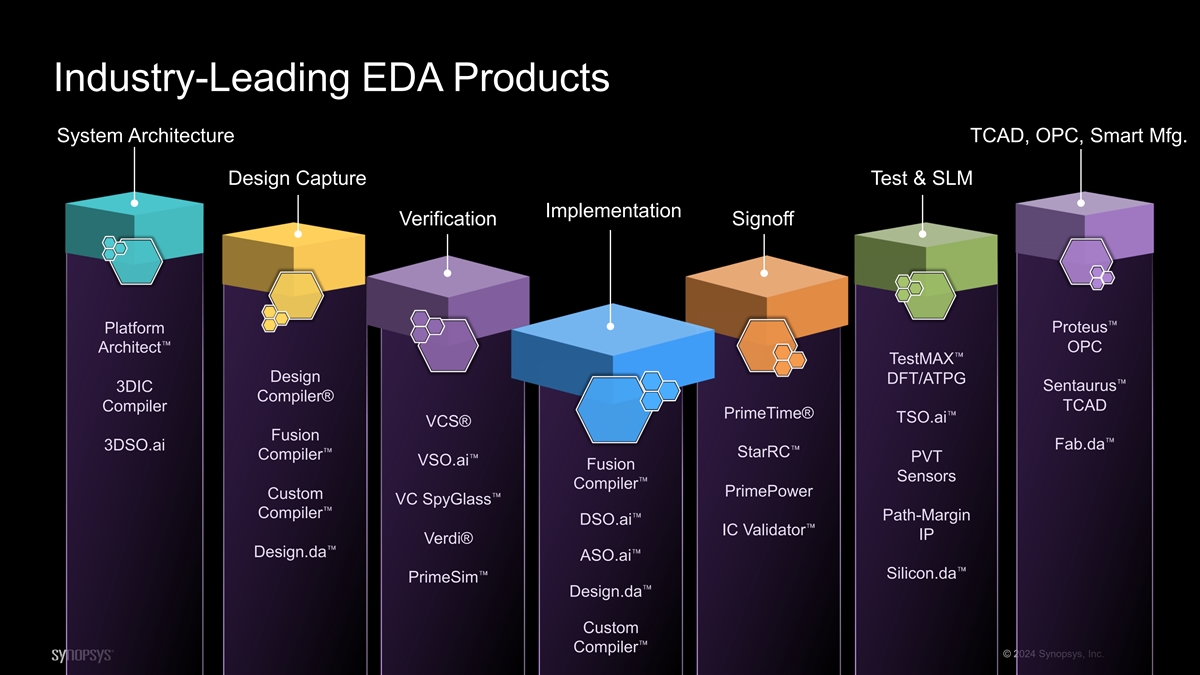
Industry-Leading EDA Products System Architecture TCAD, OPC, Smart Mfg. Design Capture Test & SLM Implementation Verification Signoff Proteus Platform Architect OPC TestMAX Design DFT/ATPG Sentaurus 3DIC Compiler® Compiler TCAD PrimeTime® TSO.ai VCS® Fusion Fab.da 3DSO.ai StarRC Compiler PVT VSO.ai Fusion Sensors Compiler PrimePower Custom VC SpyGlass Compiler Path-Margin DSO.ai IC Validator IP Verdi® Design.da ASO.ai Silicon.da PrimeSim Design.da Custom Compiler © 2024 Synopsys, Inc.
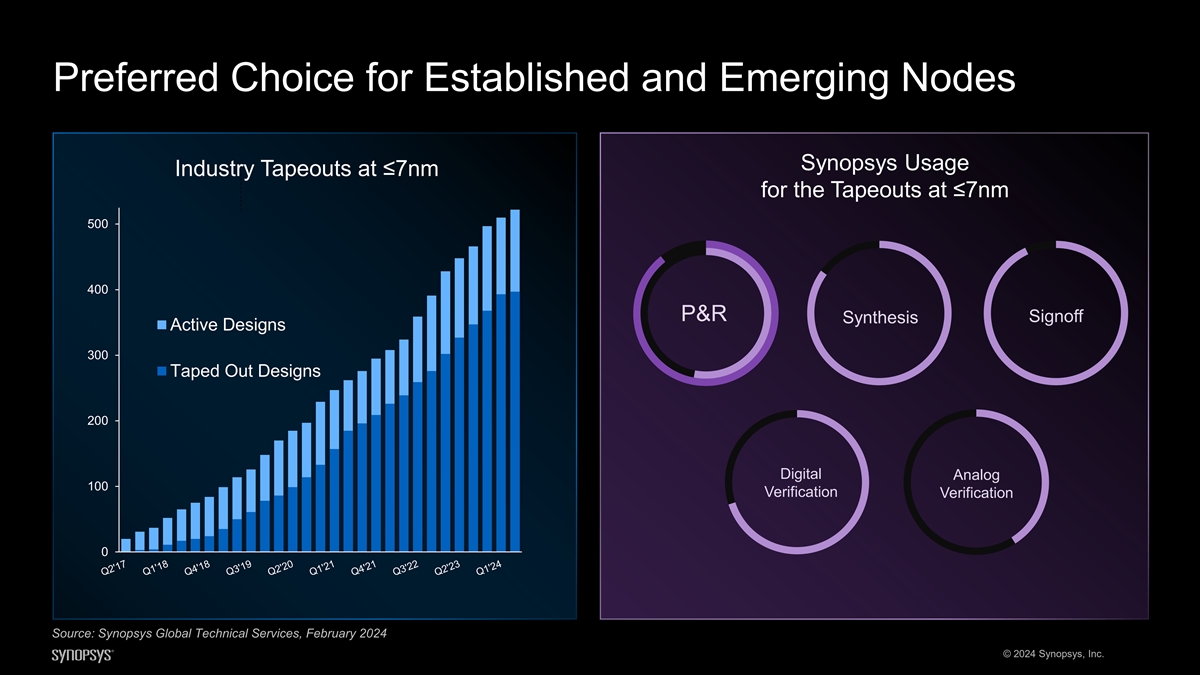
Preferred Choice for Established and Emerging Nodes Synopsys Usage Industry Tapeouts at ≤7nm for the Tapeouts at ≤7nm 500 400 P&R Signoff Synthesis Active Designs 300 Taped Out Designs 200 Digital Analog 100 Verification Verification 0 Source: Synopsys Global Technical Services, February 2024 © 2024 Synopsys, Inc.

Pioneering Innovations Enable Semiconductor Progress RTL Exploration and Synopsys.ai Optimization (with VSO.ai, TSO.ai) March 2020 March 2023 AI-Driven Fusion GPU Acceleration GPU Acceleration Synopsys.ai Optimization 3DSO.ai Architecture SPICE OPC LLM-Based EDA (DSO.ai) SNUG 2024 Nov 2018 April 2021 March 2023 November 2023 March 2020 Synopsys.ai Multi-Die Full Chip (with Design,da, April 2020 Inverse Lithography Silicon,da, Fab.da) May 2022 September 2023 Silicon Lifecycle Synopsys.ai Management (with ASO.ai) October 2020 December 2023 © 2024 Synopsys, Inc.
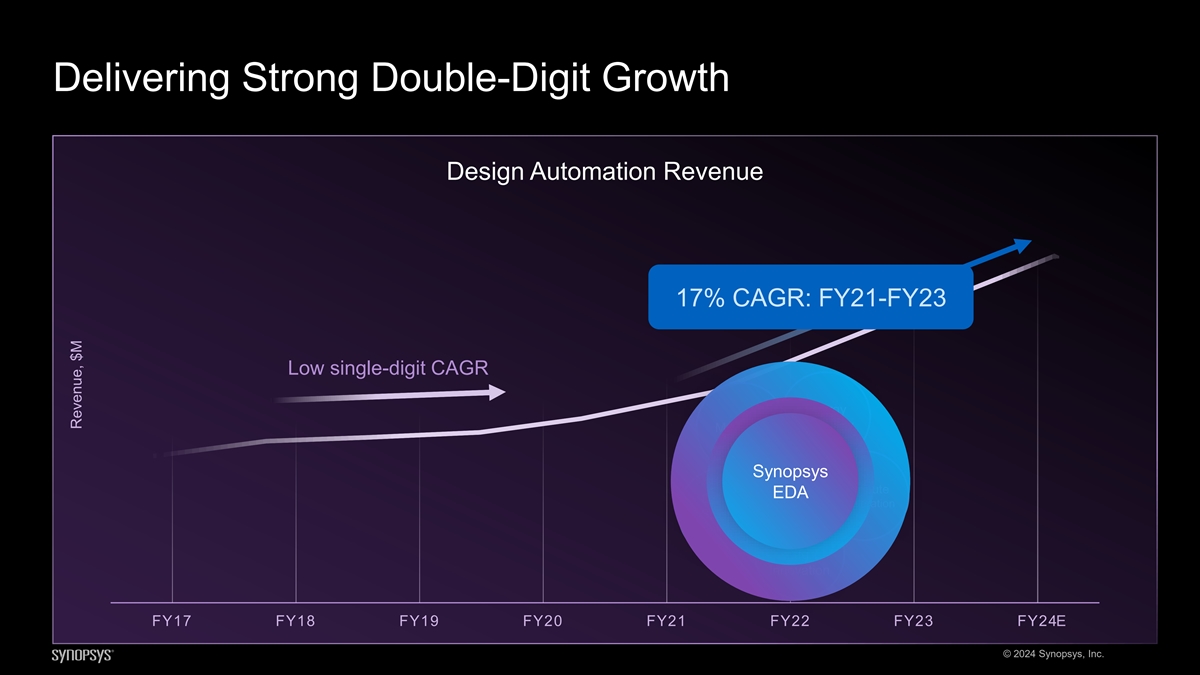
Delivering Strong Double-Digit Growth Design Automation Revenue 17% CAGR: FY21-FY23 Low single-digit CAGR Energy Efficiency Multi-Die Synopsys AI Compute EDA Domain Acceleration Specific Architecture DTCO Mfg. Innovation FY17 FY18 FY19 FY20 FY21 FY22 FY23 FY24E © 2024 Synopsys, Inc. Revenue, $M

It’s All About the Architecture

Synopsys Next-Gen Fusion EDA Architecture Separate Tools with Value Links Synthesis P&R Extraction Timing Pre 2016 © 2024 Synopsys, Inc.
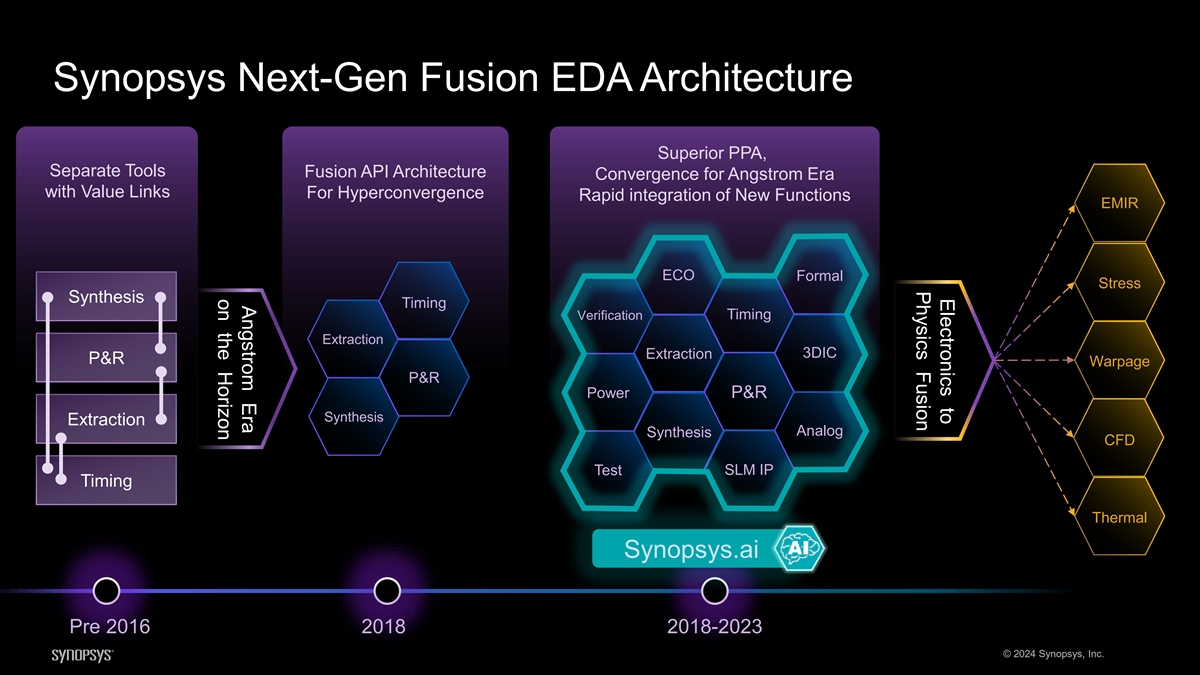
Electronics to Physics Fusion Angstrom Era on the Horizon Synopsys Next-Gen Fusion EDA Architecture Superior PPA, Separate Tools Fusion API Architecture Convergence for Angstrom Era with Value Links For Hyperconvergence Rapid integration of New Functions EMIR ECO Formal Stress Synthesis Timing Verification Timing Extraction 3DIC Extraction P&R Warpage P&R Power P&R Synthesis Extraction Analog Synthesis CFD Test SLM IP Timing Thermal Synopsys.ai Pre 2016 2018 2018-2023 © 2024 Synopsys, Inc.
Pioneering Innovations Unleash New Growth Vectors March to Angstroms
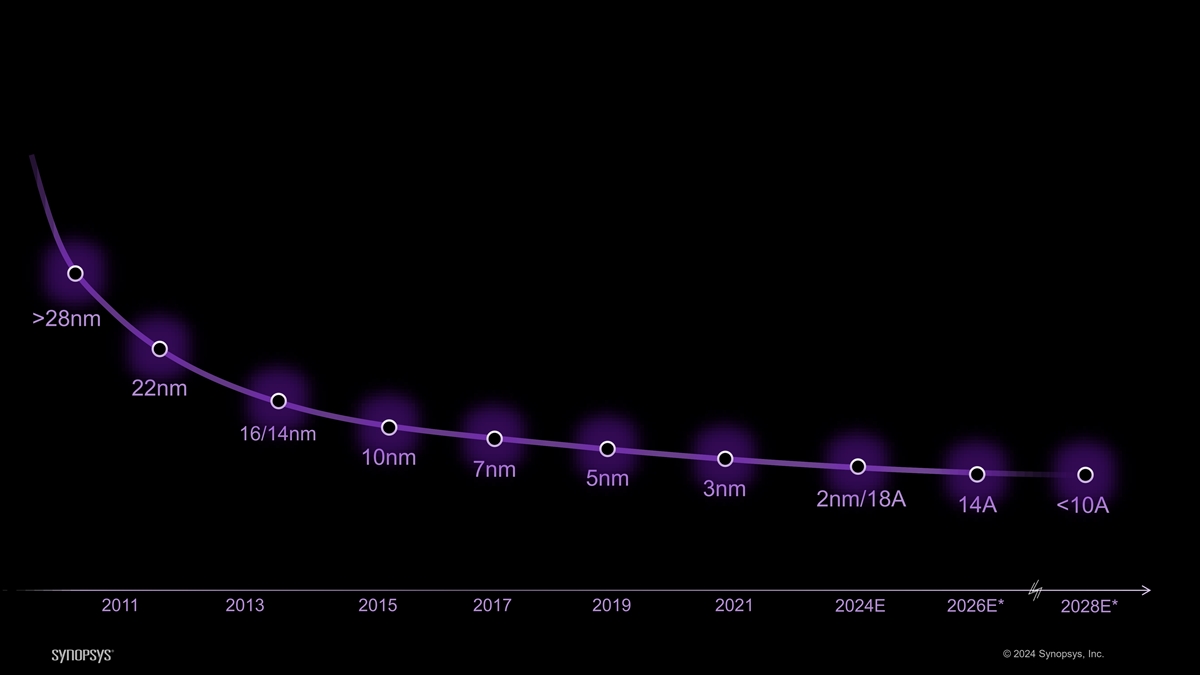
Process Geometry Shrinking to Angstrom Levels >28nm 22nm 16/14nm 10nm 7nm 5nm 3nm 2nm/18A 14A <10A 2011 2013 2015 2017 2019 2021 2024E 2026E* 2028E* © 2024 Synopsys, Inc.

Maximizing Process Entitlement in Angstrom Era PPA Optimized Double Patterning Nanosheet Optimized Pre-PDK DTCO Library Double Patterning Hybrid Row Backside Power Backside Clock, Signal P&R SI Modeling Hierarchical Modeling Variability Modeling Hybrid Extraction Signoff Model Based OPC Inverse Lithography (ILT) Curve OPC High NA EUV Mask 248nm Deep UV = 193nm, 193i Extreme UV = 13.5nm λ TCAD Physics based New materials, 3D simulation 2D materials modeling DTCO DTCO Planar FinFET CFET GAA © 2024 Synopsys, Inc. 67
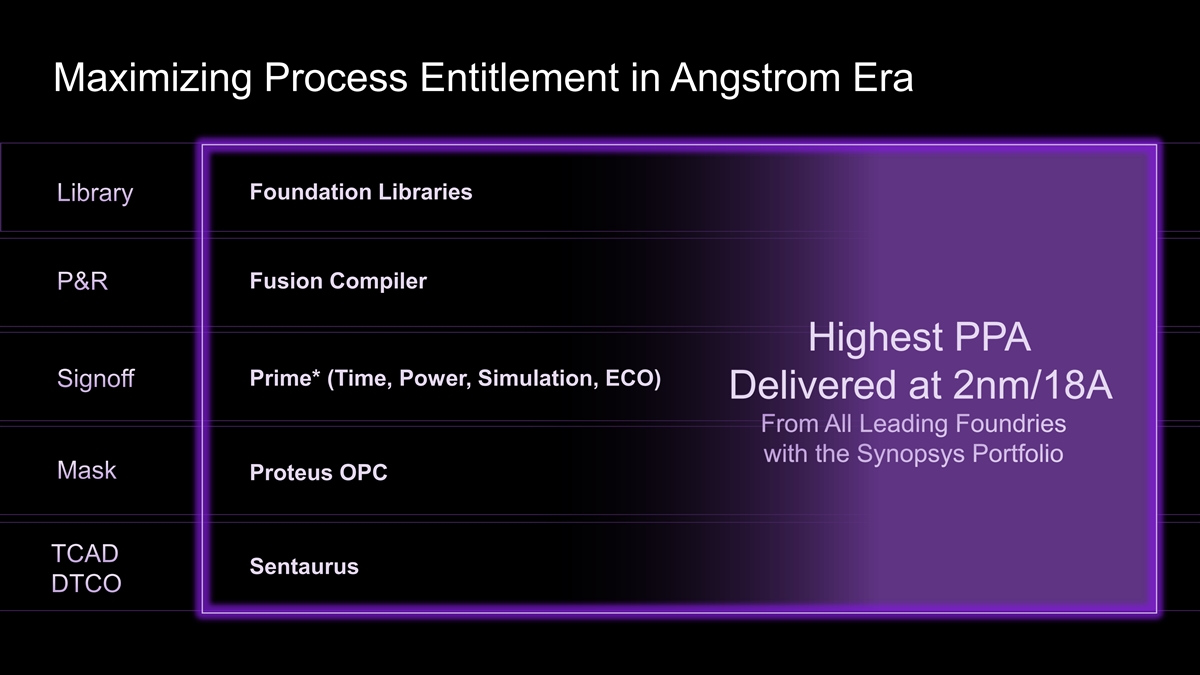
Maximizing Process Entitlement in Angstrom Era Ultra Short Lib DPT PPA Optimized Pre-PDK DTCO Nanosheet Opt M1 Routing Opt. Libraries Foundation Libraries Library Backside Power Backside Power Double Patterning Hybrid Row Distribution Distribution Fusion Compiler P&R SMC, 3DIC HyperGrid SI STA HyperScale Highest PPA STA Hybrid NanoSheet, Multi Pattern Multi-Gate/Color Extraction BSPDN Modeling Prime* (Time, Power, Simulation, ECO) Signoff Delivered at 2nm/18A OPC/ILT on GPU High NA EUV Model Based OPC Inverse Lithography (ILT) From All Leading Foundries Curvilinear data Deep UV = 193nm, 193i 248nm Extreme UV = 13.5nm with the Synopsys Portfolio λ Mask Proteus OPC Physics based 3D modeling & New materials, 2D materials device modeling simulation DTCO TCAD Sentaurus DTCO © 2024 Synopsys, Inc. 68

Maximizing Process Entitlement in Angstrom Era TSMC and Synopsys help our mutual customers Synopsys provides designers with access to achieve the best-in-class design results across industry-leading certified EDA flows and IP that the full Synopsys EDA stack on TSMC's most deliver the best performance, power, and area for advanced N2 process the Intel 18A technology Rahul Goyal Dan Kochpatcharin Vice President & General Manager, Head of Design Infrastructure Product & Design Ecosystem, Intel Foundry Management Division, TSMC …our latest, advanced 3nm GAA process has benefited from our extensive collaboration with Synopsys to enable the efficient realization of the process' promise. Sangyun Kim Vice President of Foundry Design Technology Team, Samsung Electronics © 2024 Synopsys, Inc.
Pioneering Innovations Unleash New Growth Vectors Synopsys.ai
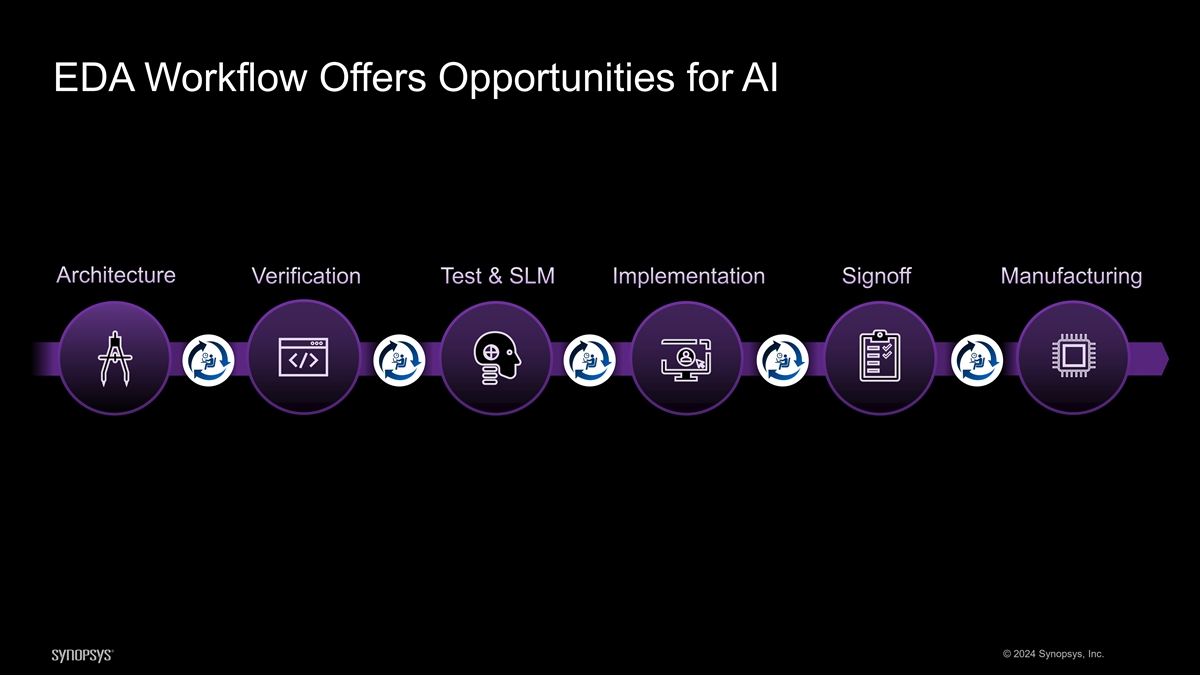
EDA Workflow Offers Opportunities for AI Architecture Verification Test & SLM Implementation Signoff Manufacturing © 2024 Synopsys, Inc.
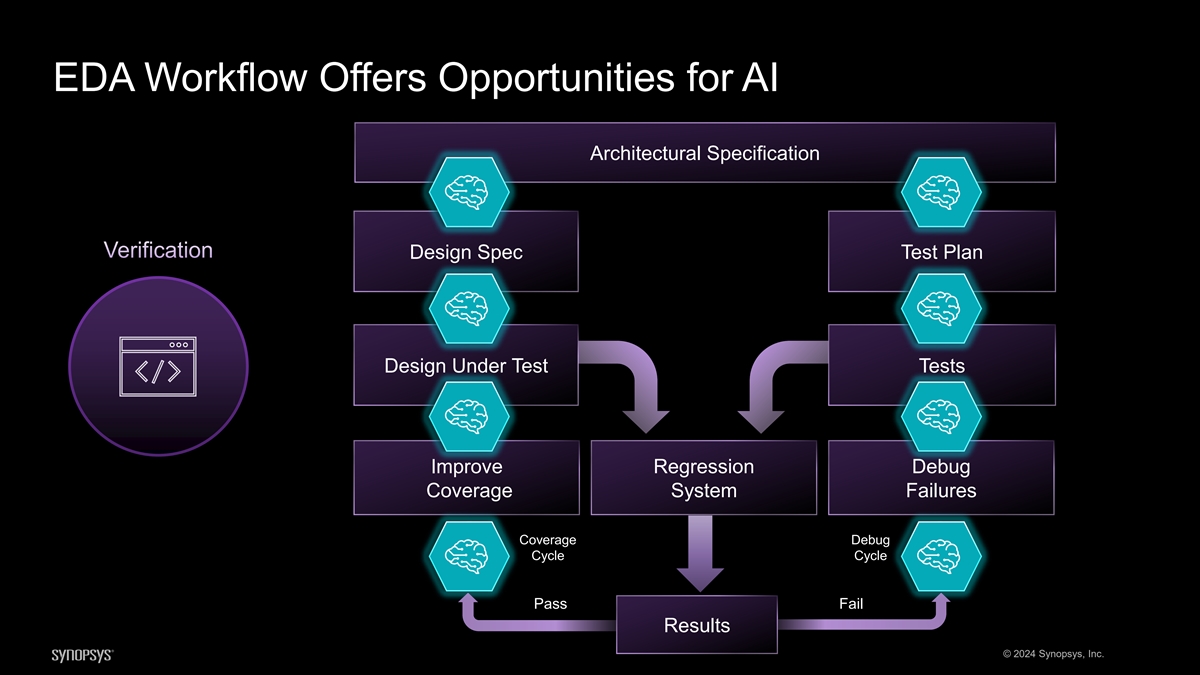
EDA Workflow Offers Opportunities for AI Architectural Specification Verification Design Spec Test Plan Design Under Test Tests Improve Regression Debug Coverage System Failures Coverage Debug Cycle Cycle Pass Fail Results © 2024 Synopsys, Inc.
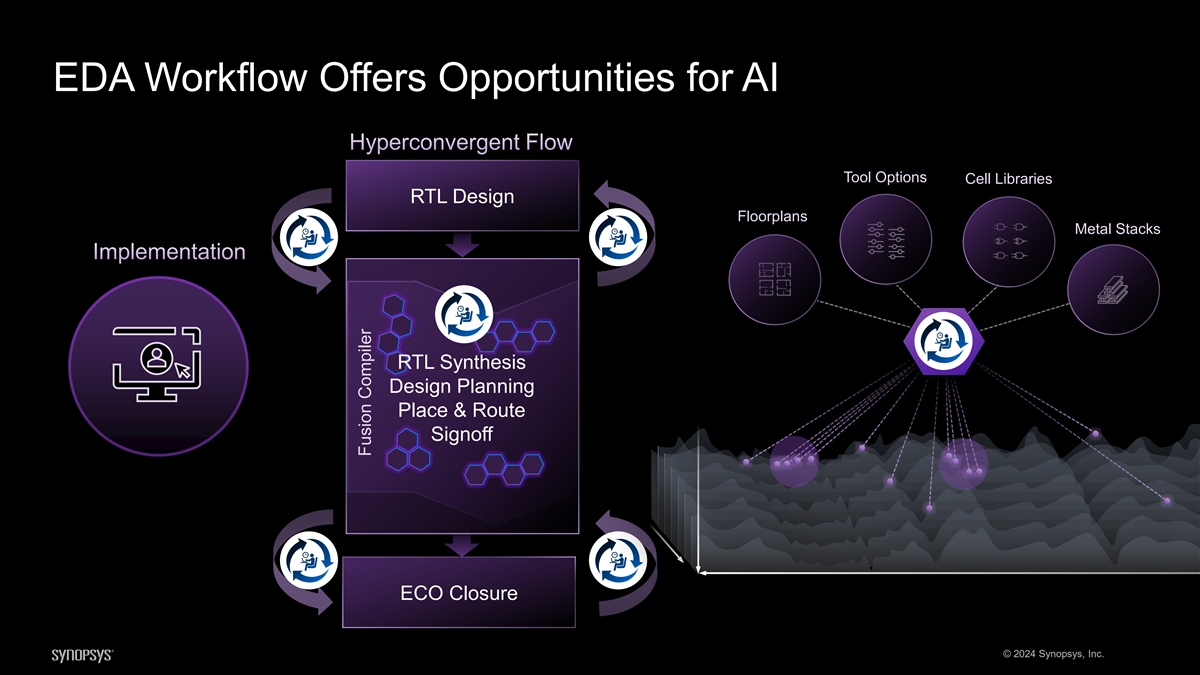
EDA Workflow Offers Opportunities for AI Hyperconvergent Flow Tool Options Cell Libraries RTL Design Floorplans Metal Stacks Implementation EDA RTL Synthesis Design Planning Place & Route Signoff ECO Closure © 2024 Synopsys, Inc. Fusion Compiler
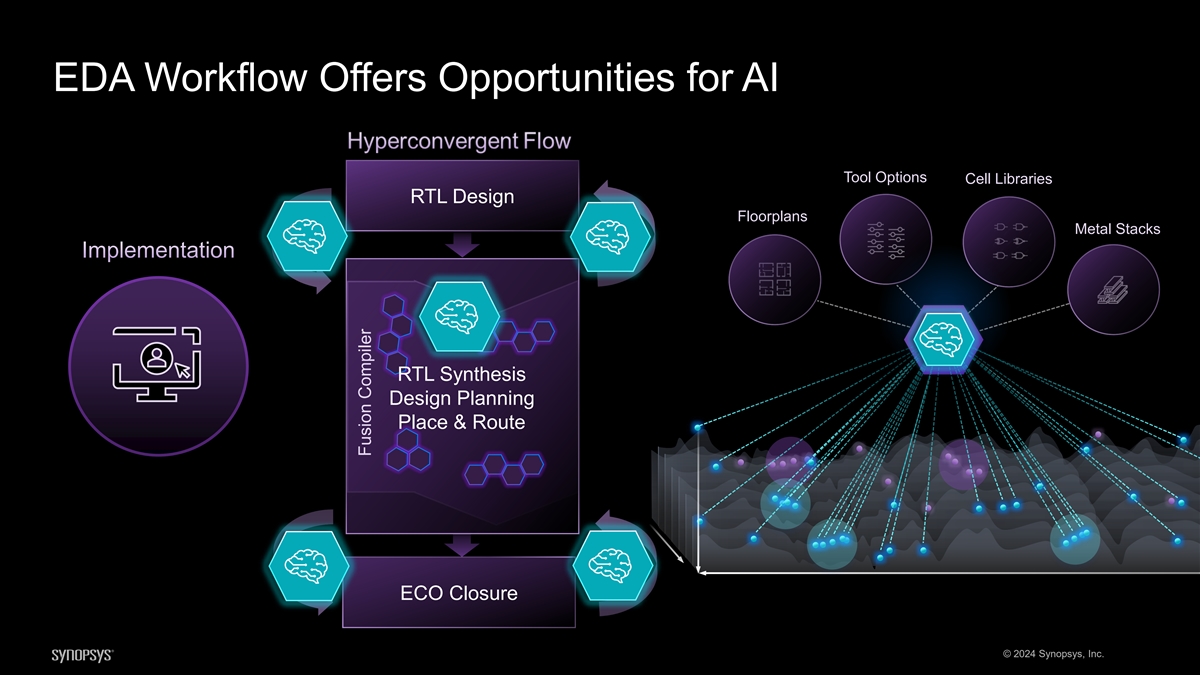
EDA Workflow Offers Opportunities for AI Tool Options Cell Libraries RTL Design Floorplans Metal Stacks Implementation RTL Synthesis Design Planning Place & Route ECO Closure © 2024 Synopsys, Inc. Fusion Compiler
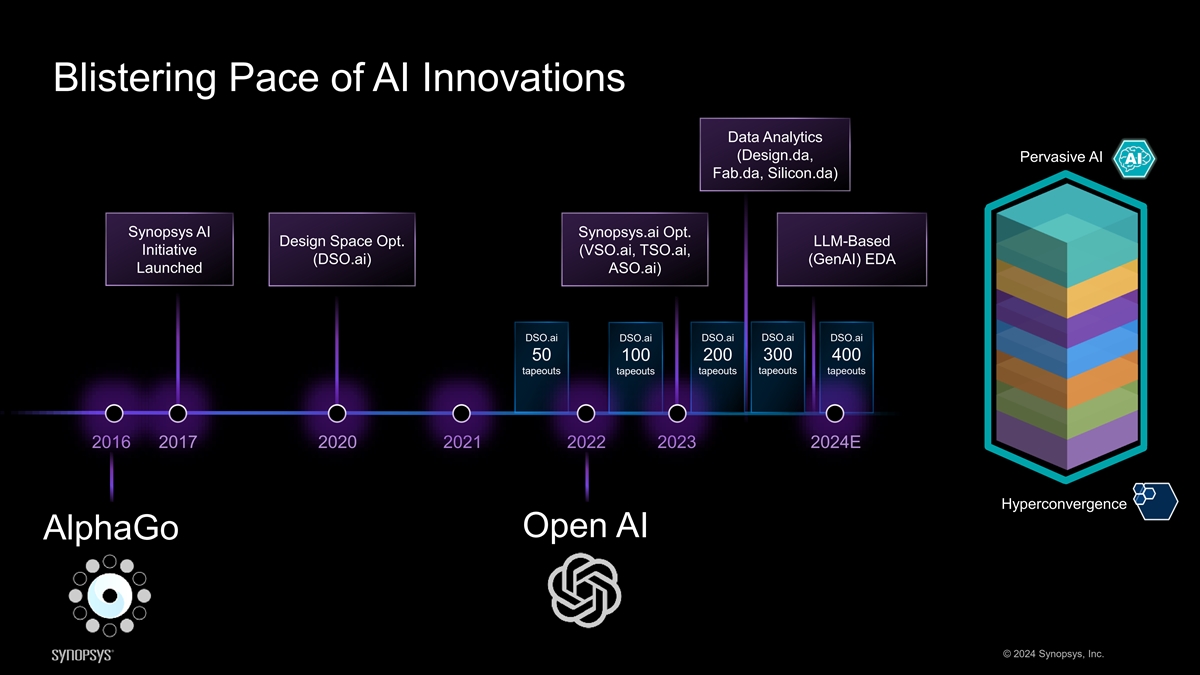
Blistering Pace of AI Innovations Data Analytics (Design.da, Pervasive AI Fab.da, Silicon.da) Synopsys AI Synopsys.ai Opt. Design Space Opt. LLM-Based Initiative (VSO.ai, TSO.ai, (DSO.ai) (GenAI) EDA Launched ASO.ai) DSO.ai DSO.ai DSO.ai DSO.ai DSO.ai 300 50 100 200 400 tapeouts tapeouts tapeouts tapeouts tapeouts 2016 2017 2020 2021 2022 2023 2024E Hyperconvergence Open AI AlphaGo © 2024 Synopsys, Inc.
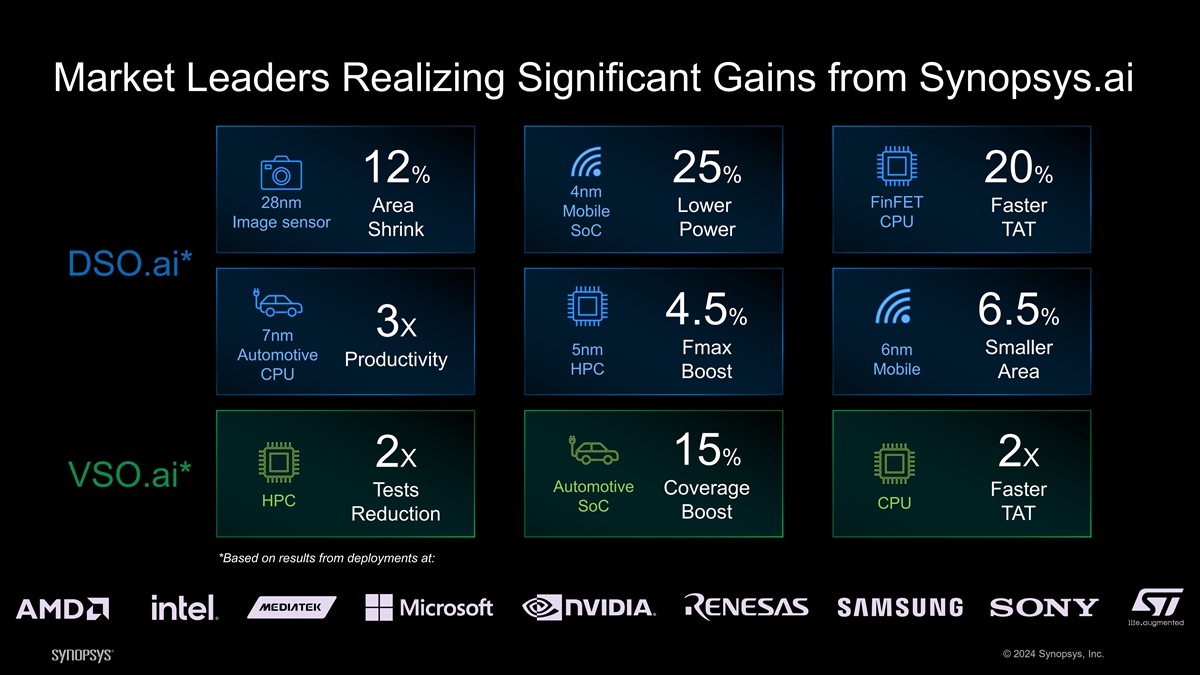
Market Leaders Realizing Significant Gains from Synopsys.ai 12% 25% 20% 4nm FinFET 28nm Area Lower Faster Mobile Image sensor CPU Shrink SoC Power TAT DSO.ai* 4.5% 6.5% 3X 7nm Fmax Smaller 5nm 6nm Automotive Productivity HPC Mobile Boost Area CPU 15% 2X 2X VSO.ai* Automotive Coverage Tests Faster HPC CPU SoC Boost TAT Reduction *Based on results from deployments at: © 2024 Synopsys, Inc.

Rapid Adoption of AI-Driven Optimization DSO.ai DSO.ai and VSO.ai Design Activity 350 320 300 250 VSO.ai 200 187 150 150 100 63 50 50 16 0 2022 2023 2024E 2021 © 2024 Synopsys, Inc. # of Design Activity
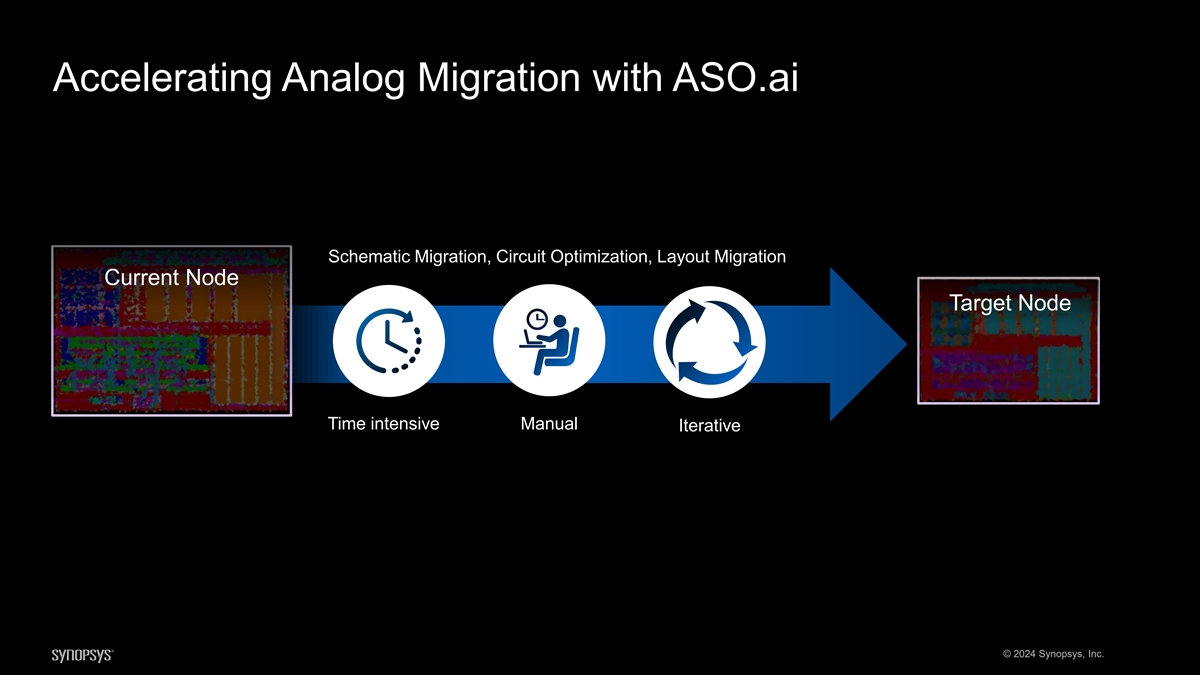
Accelerating Analog Migration with ASO.ai Schematic Migration, Circuit Optimization, Layout Migration Current Node Target Node Time intensive Manual Iterative © 2024 Synopsys, Inc.
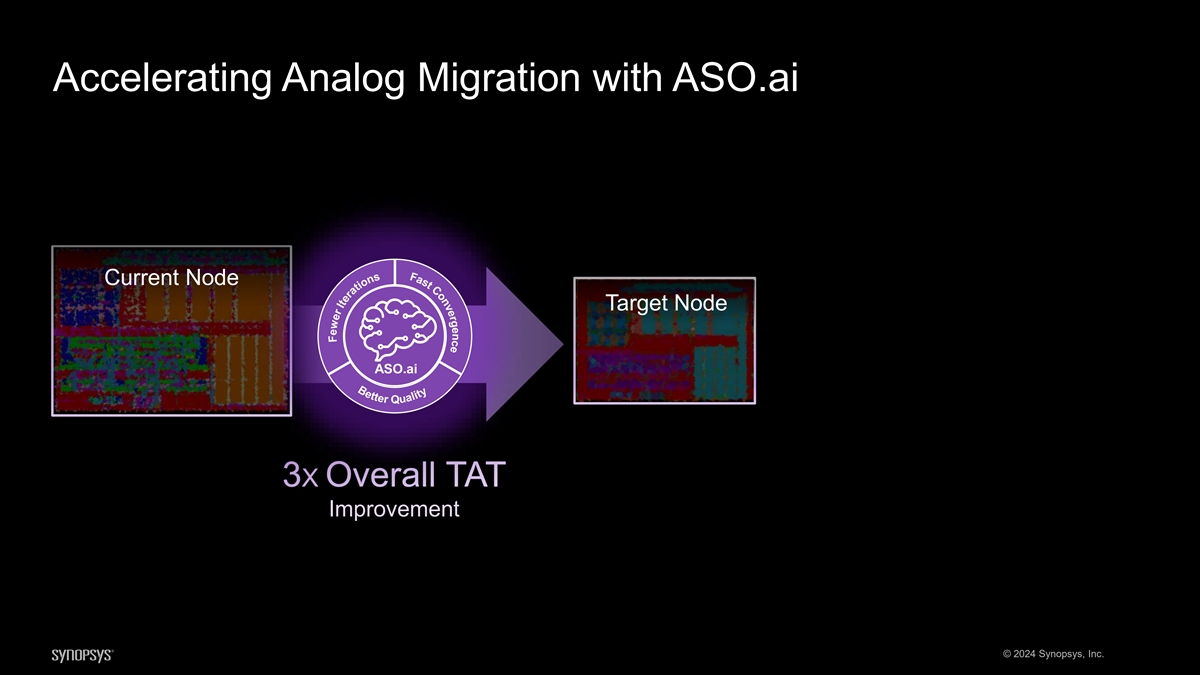
e c n e g r e v n o C t B s e a t F t e r Accelerating Analog Migration with ASO.ai Current Node Target Node ASO.ai 3X Overall TAT Improvement © 2024 Synopsys, Inc. Q u a s l i n t o y i t a r e t I r e w e F
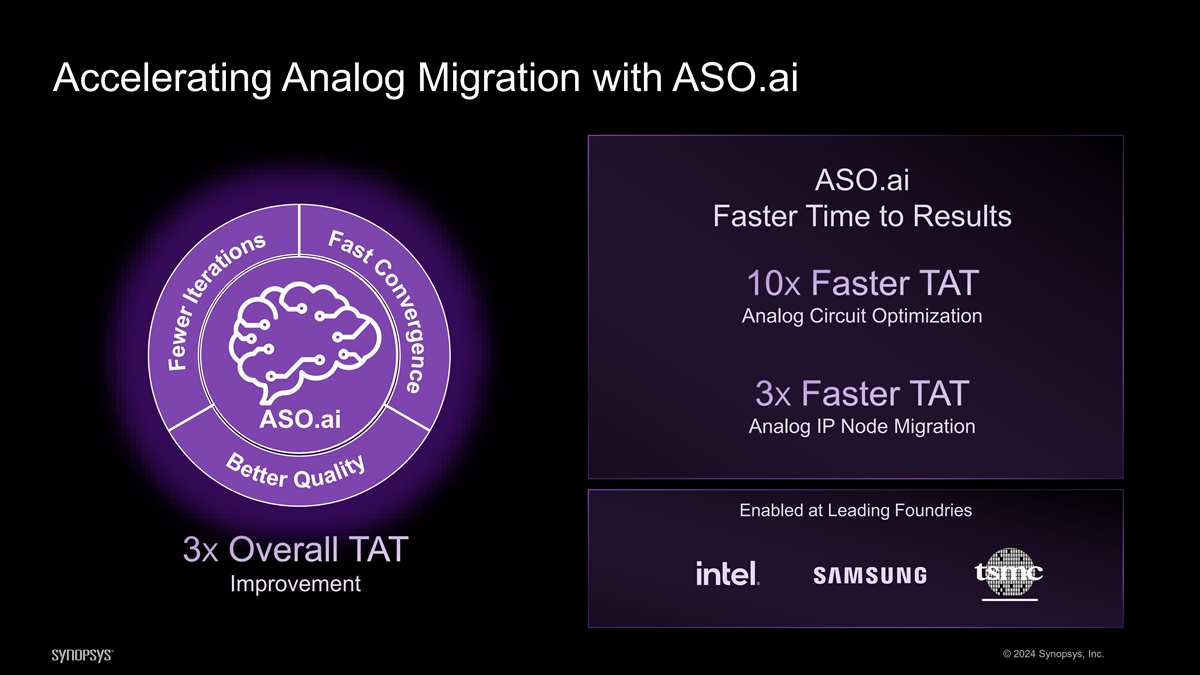
e c n e g r e v n o C t B s e a t F t e r Accelerating Analog Migration with ASO.ai ASO.ai Faster Time to Results 10X Faster TAT Analog Circuit Optimization 3X Faster TAT ASO.ai Analog IP Node Migration Enabled at Leading Foundries 3X Overall TAT Improvement © 2024 Synopsys, Inc. Q u a s l n i t o y i t a r e t I r e w e F
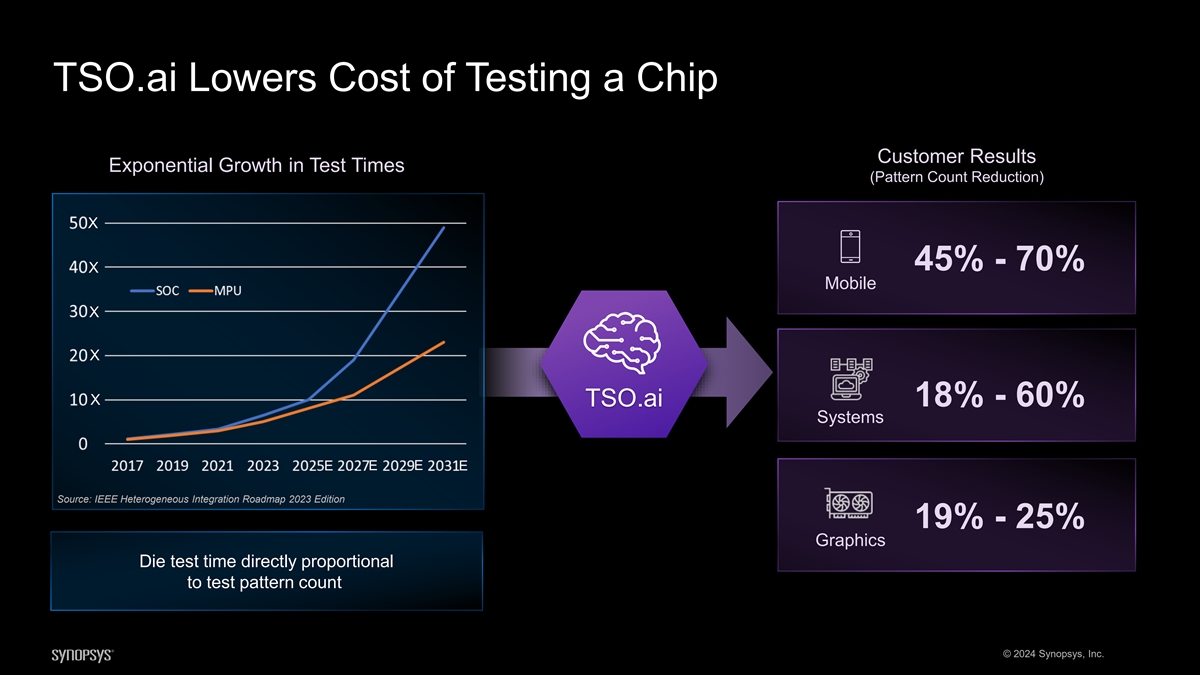
TSO.ai Lowers Cost of Testing a Chip Customer Results Exponential Growth in Test Times (Pattern Count Reduction) X 45% - 70% X Mobile X X X TSO.ai 18% - 60% Systems E E E E Source: IEEE Heterogeneous Integration Roadmap 2023 Edition 19% - 25% Graphics Die test time directly proportional to test pattern count © 2024 Synopsys, Inc.
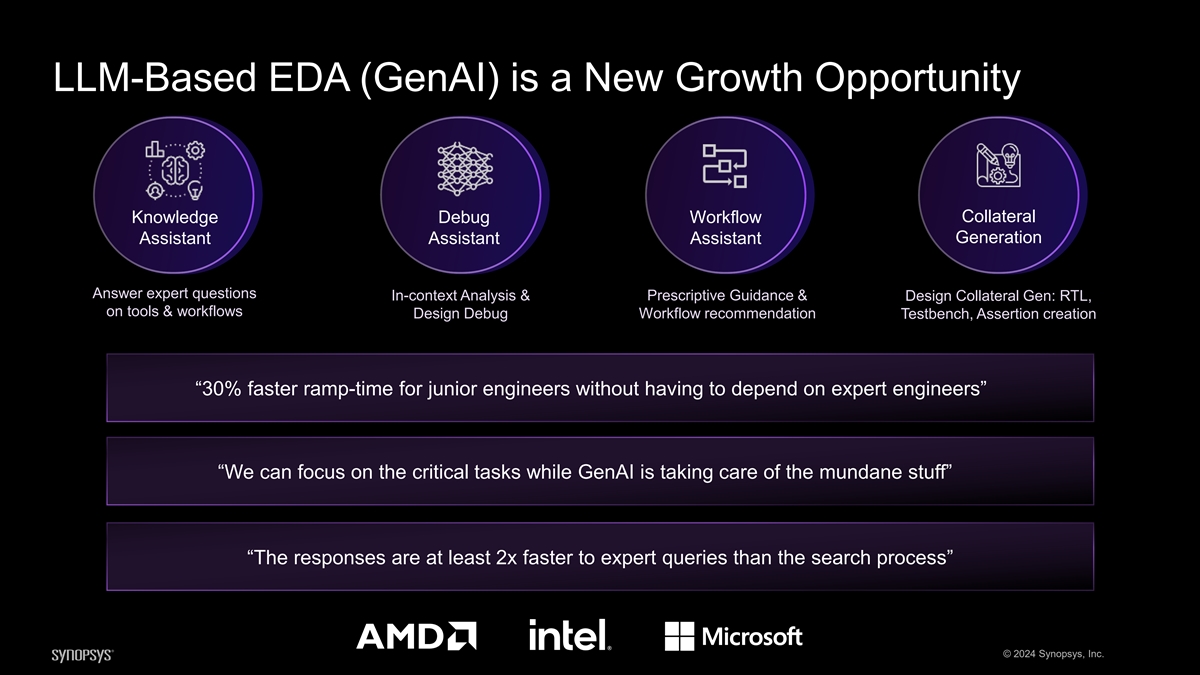
LLM-Based EDA (GenAI) is a New Growth Opportunity Collateral Knowledge Debug Workflow Assistant Assistant Assistant Generation Answer expert questions Prescriptive Guidance & In-context Analysis & Design Collateral Gen: RTL, on tools & workflows Design Debug Workflow recommendation Testbench, Assertion creation “30% faster ramp-time for junior engineers without having to depend on expert engineers” “We can focus on the critical tasks while GenAI is taking care of the mundane stuff” “The responses are at least 2x faster to expert queries than the search process” © 2024 Synopsys, Inc.
Pioneering Innovations Unleash New Growth Vectors Multi-Die
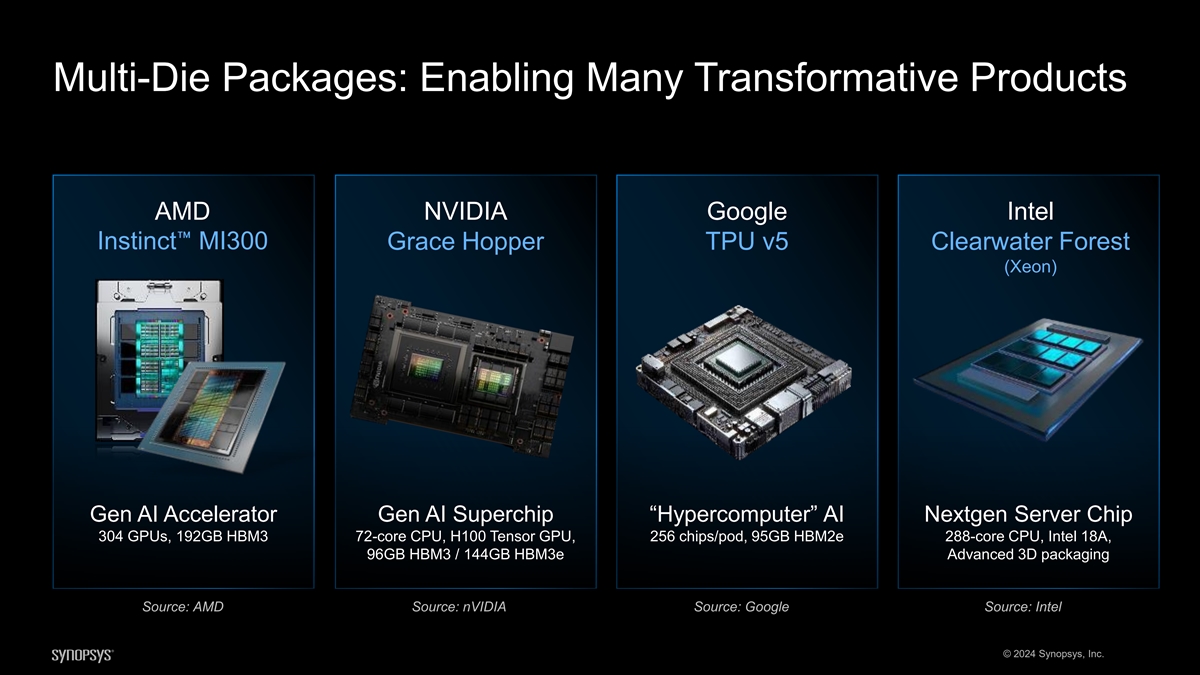
Multi-Die Packages: Enabling Many Transformative Products AMD NVIDIA Google Intel Instinct MI300 Grace Hopper TPU v5 Clearwater Forest (Xeon) Gen AI Accelerator Gen AI Superchip “Hypercomputer” AI Nextgen Server Chip 304 GPUs, 192GB HBM3 72-core CPU, H100 Tensor GPU, 256 chips/pod, 95GB HBM2e 288-core CPU, Intel 18A, 96GB HBM3 / 144GB HBM3e Advanced 3D packaging Source: AMD Source: nVIDIA Source: Google Source: Intel © 2024 Synopsys, Inc.
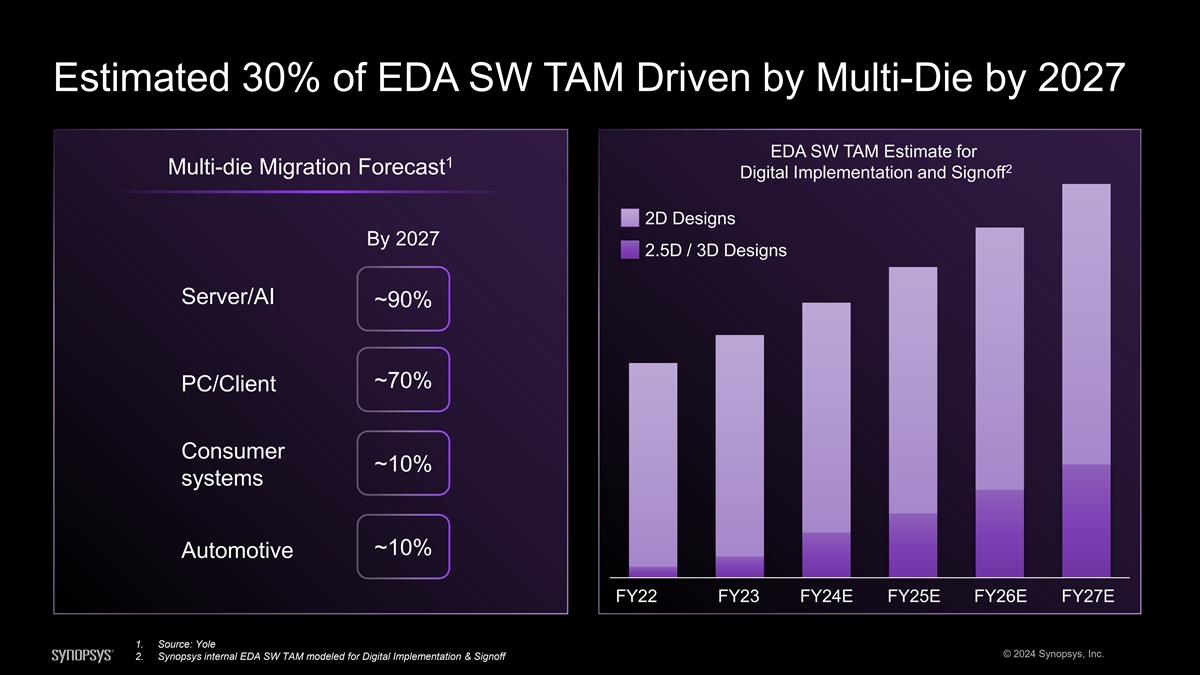
Estimated 30% of EDA SW TAM Driven by Multi-Die by 2027 EDA SW TAM Estimate for 1 2 Multi-die Migration Forecast Digital Implementation and Signoff 2D Designs By 2027 2.5D / 3D Designs Server/AI ~90% ~70% PC/Client Consumer ~10% systems ~10% Automotive FY22 FY23 FY24E FY25E FY26E FY27E 1. Source: Yole © 2024 Synopsys, Inc. 2. Synopsys internal EDA SW TAM modeled for Digital Implementation & Signoff
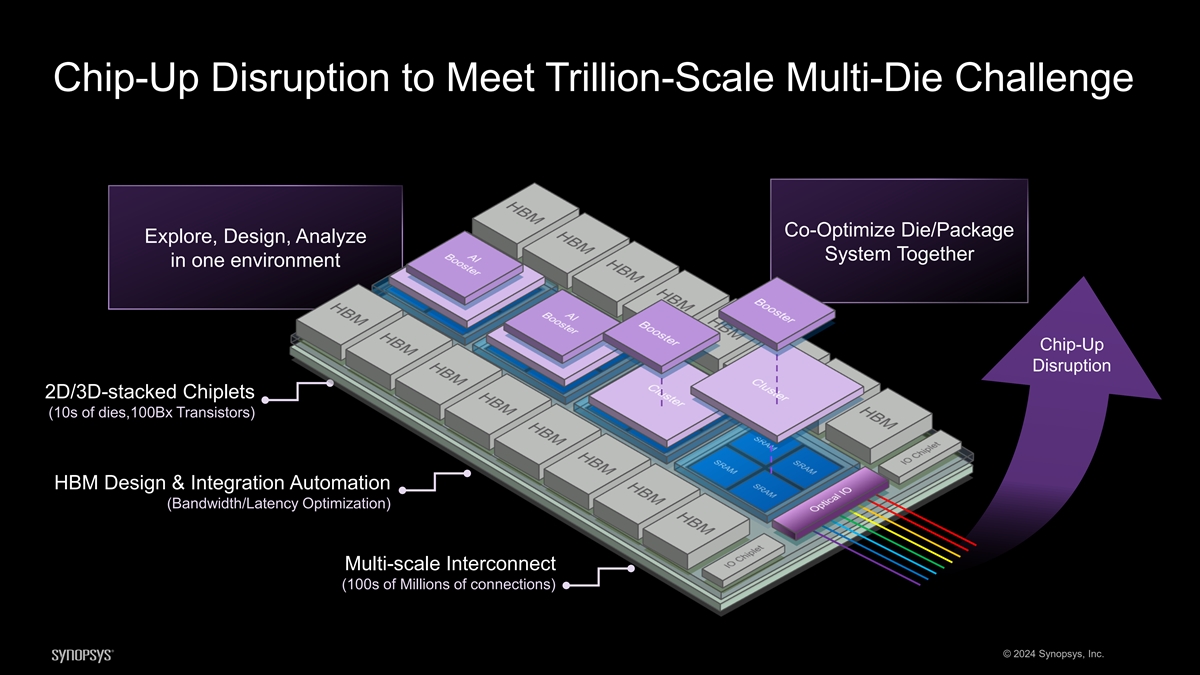
Chip-Up Disruption to Meet Trillion-Scale Multi-Die Challenge Co-Optimize Die/Package Explore, Design, Analyze System Together in one environment Chip-Up Disruption 2D/3D-stacked Chiplets (10s of dies,100Bx Transistors) HBM Design & Integration Automation (Bandwidth/Latency Optimization) Multi-scale Interconnect (100s of Millions of connections) © 2024 Synopsys, Inc.
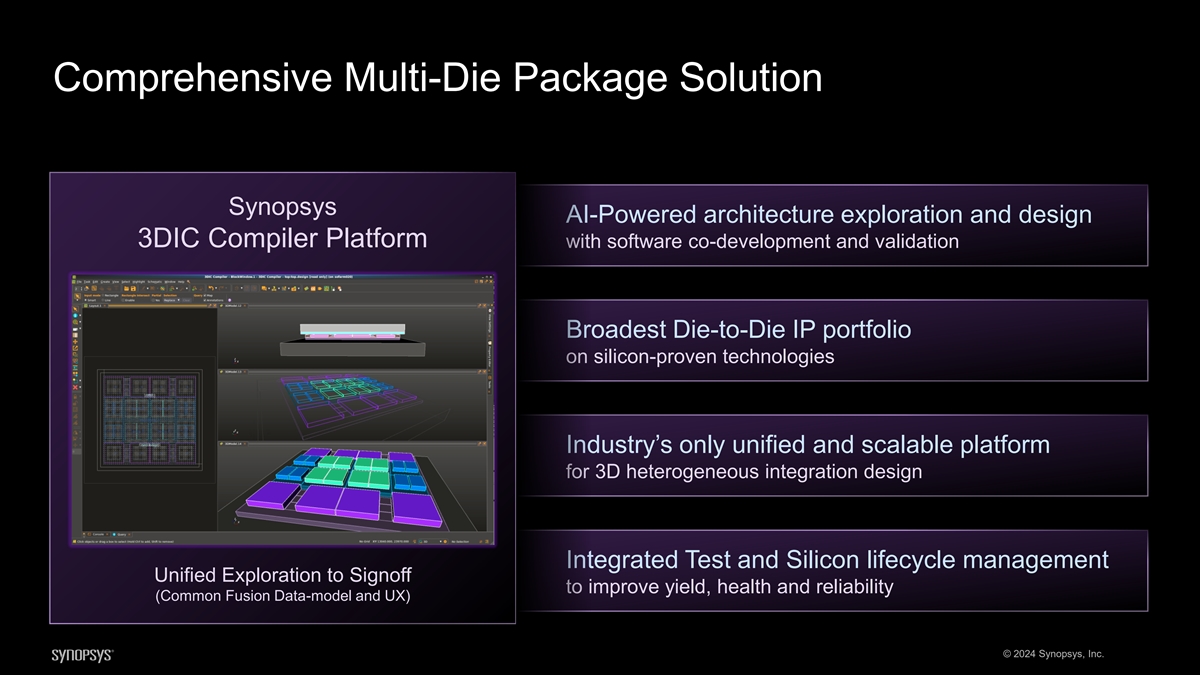
Comprehensive Multi-Die Package Solution Synopsys AI-Powered architecture exploration and design 3DIC Compiler Platform with software co-development and validation Broadest Die-to-Die IP portfolio on silicon-proven technologies Industry’s only unified and scalable platform for 3D heterogeneous integration design Integrated Test and Silicon lifecycle management Unified Exploration to Signoff to improve yield, health and reliability (Common Fusion Data-model and UX) © 2024 Synopsys, Inc.
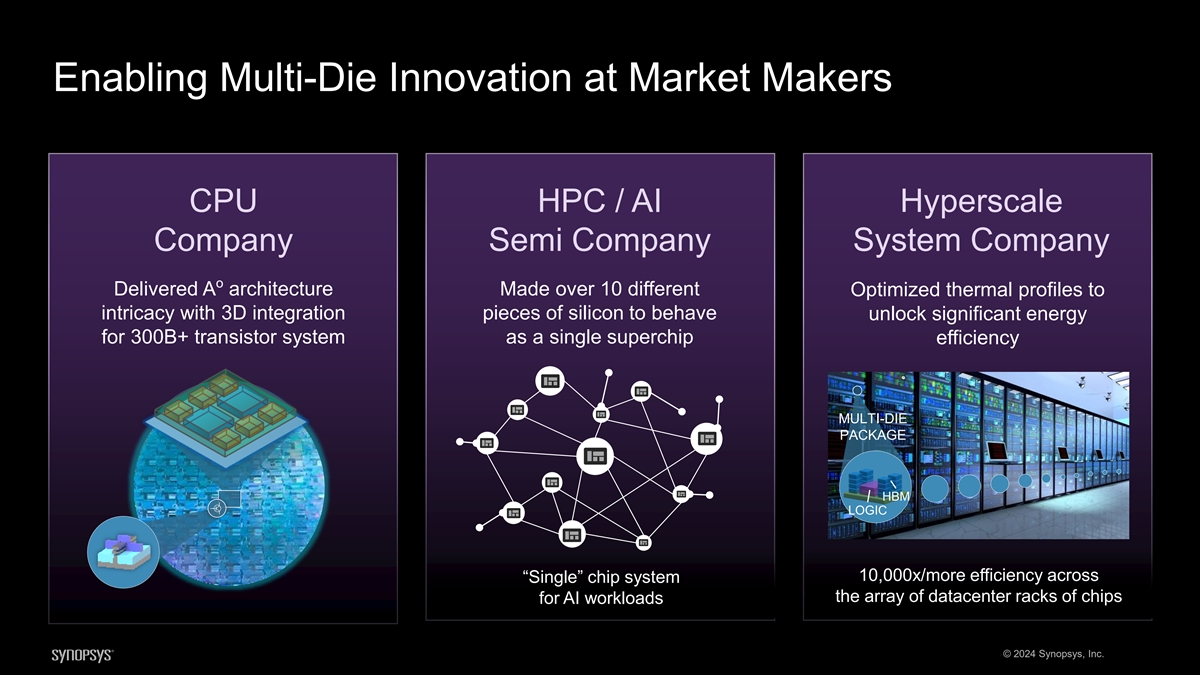
Enabling Multi-Die Innovation at Market Makers CPU HPC / AI Hyperscale Company Semi Company System Company o Delivered A architecture Made over 10 different Optimized thermal profiles to intricacy with 3D integration pieces of silicon to behave unlock significant energy for 300B+ transistor system as a single superchip efficiency MULTI-DIE PACKAGE HBM LOGIC 10,000x/more efficiency across “Single” chip system the array of datacenter racks of chips for AI workloads © 2024 Synopsys, Inc.
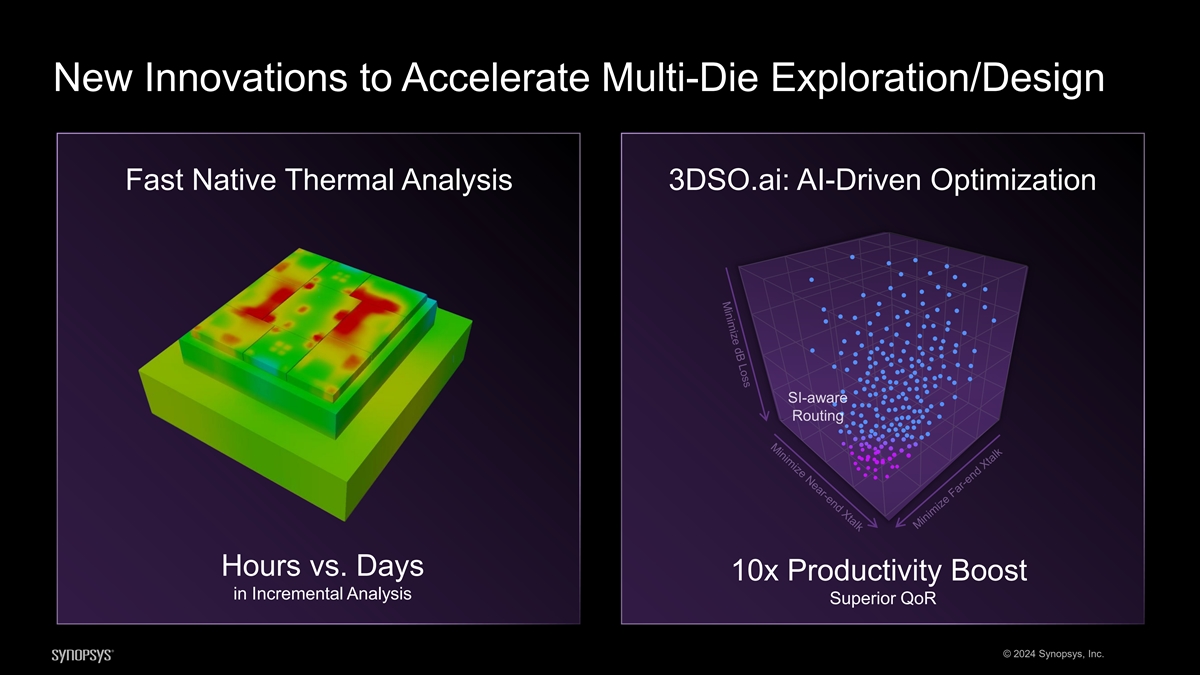
New Innovations to Accelerate Multi-Die Exploration/Design Fast Native Thermal Analysis 3DSO.ai: AI-Driven Optimization Hours vs. Days 10x Productivity Boost in Incremental Analysis Superior QoR © 2024 Synopsys, Inc.
Pioneering Innovations Unleash New Growth Vectors Energy Efficiency
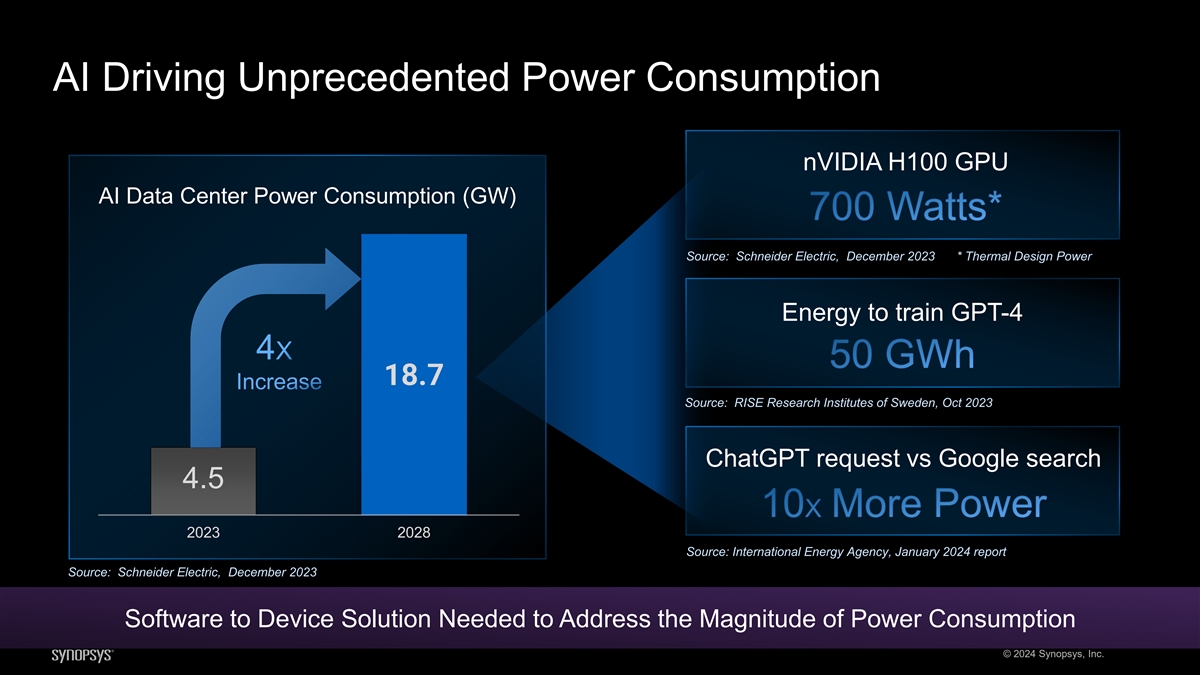
AI Driving Unprecedented Power Consumption nVIDIA H100 GPU AI Data Center Power Consumption (GW) 700 Watts* Source: Schneider Electric, December 2023 * Thermal Design Power Energy to train GPT-4 4X 50 GWh 18.7 Increase Source: RISE Research Institutes of Sweden, Oct 2023 ChatGPT request vs Google search 4.5 10X More Power 2023 2028 Source: International Energy Agency, January 2024 report Source: Schneider Electric, December 2023 Software to Device Solution Needed to Address the Magnitude of Power Consumption © 2024 Synopsys, Inc.

Optimizing Power at Every Design Phase System Architecture Design Capture Implementation Signoff Test & SLM Software Profiling HW-SW Arch. HW Micro Arch. PPA Chip Power Adaptive Voltage Tradeoffs Optimization Optimization Analysis Scaling ZeBu Empower, PrimePower RTL Fusion Compiler PrimePower SLM Portfolio Platform Architect PrimeClosure High-Level SW-Workload Exploration to Device-Level In-Field Sensors >2X 20% 12% Savings with Arch. Exploration Dynamic Power Savings from Savings from RTL Implementation Opt. of HPC Design and SW Profiling of AI Design Changes of NPU Design © 2024 Synopsys, Inc.

Pioneering Innovations Unleash New Growth Vectors EDA Compute Acceleration
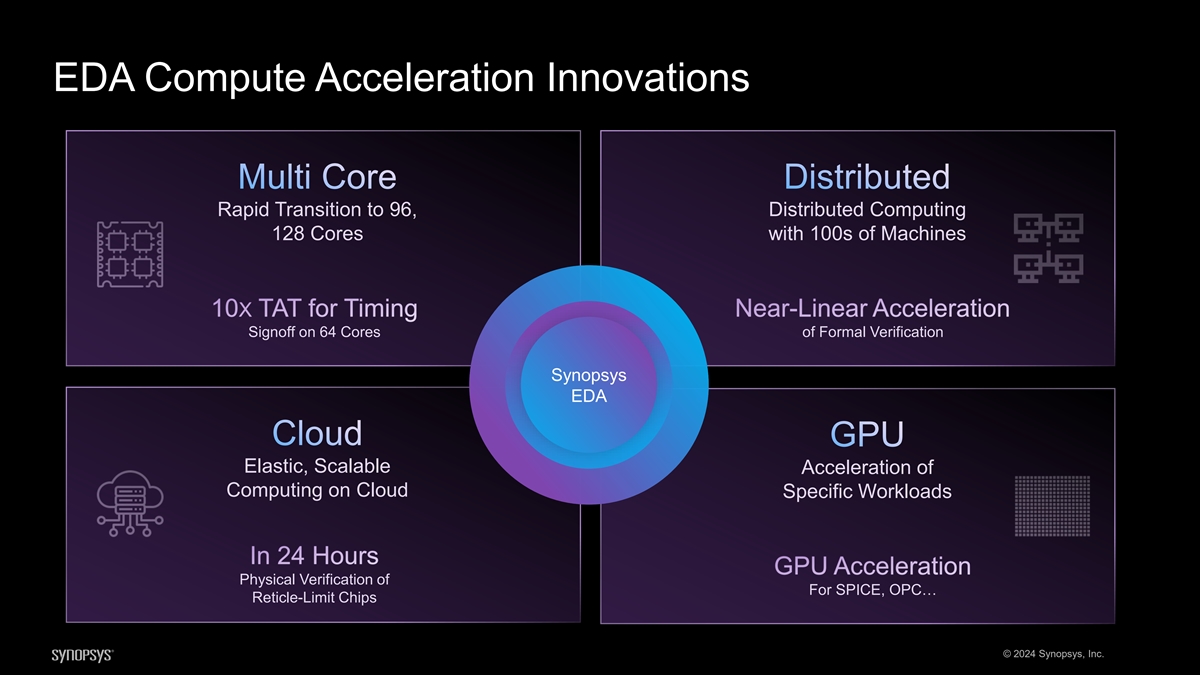
EDA Compute Acceleration Innovations Multi Core Distributed Rapid Transition to 96, Distributed Computing 128 Cores with 100s of Machines 10X TAT for Timing Near-Linear Acceleration Signoff on 64 Cores of Formal Verification Synopsys EDA Cloud GPU Elastic, Scalable Acceleration of Computing on Cloud Specific Workloads In 24 Hours GPU Acceleration Physical Verification of For SPICE, OPC… Reticle-Limit Chips © 2024 Synopsys, Inc.

SYNOPSYS: MISSION CRITICAL FOR NVIDIA SILICON SUCCESS DECADES OF COLLABORATION ACROSS FULL EDA SUITE POWERS ACCELERATED COMPUTING 13X 10X 15X 15X Systems Generative AI st Industry’s 1 LLM- Manufacturing Software Verification Design Simulation Based GenAI EDA Computational Testing & Validation of SPICE Simulation Functional Verification Place and Route Solution Automotive Software Lithography • Synopsys Electronics • Synopsys VCS • Synopsys Fusion • Synopsys PrimeSim • Synopsys Proteus • Synopsys.ai Digital Twin, vECU, TPT Compiler • NVIDIA L40 • NVIDIA Hopper • NVIDIA cuLitho • NVIDIA NeMo & NIM • NVIDIA Omniverse • NVIDIA Grace Hopper • NVIDIA Grace Hopper • NVIDIA Grace Hopper • NVIDIA Grace Hopper • NVIDIA DGX © 2024 Synopsys, Inc. *Performance Speed-Up Based on Projected Results

Synopsys EDA is Mission Critical in the Era of Pervasive AI Well Positioned with Breadth and Depth of Portfolio Next-Gen Architecture to Rapidly Fuse Electronics & Multi-Physics Pioneering in Emerging Areas Unleashes New Growth Vectors © 2024 Synopsys, Inc.


© 2024 Synopsys, Inc.
Accelerating Systems Strategy Synopsys Investor Day 2024 Ravi Subramanian, Ph.D. General Manager, Systems Design Group
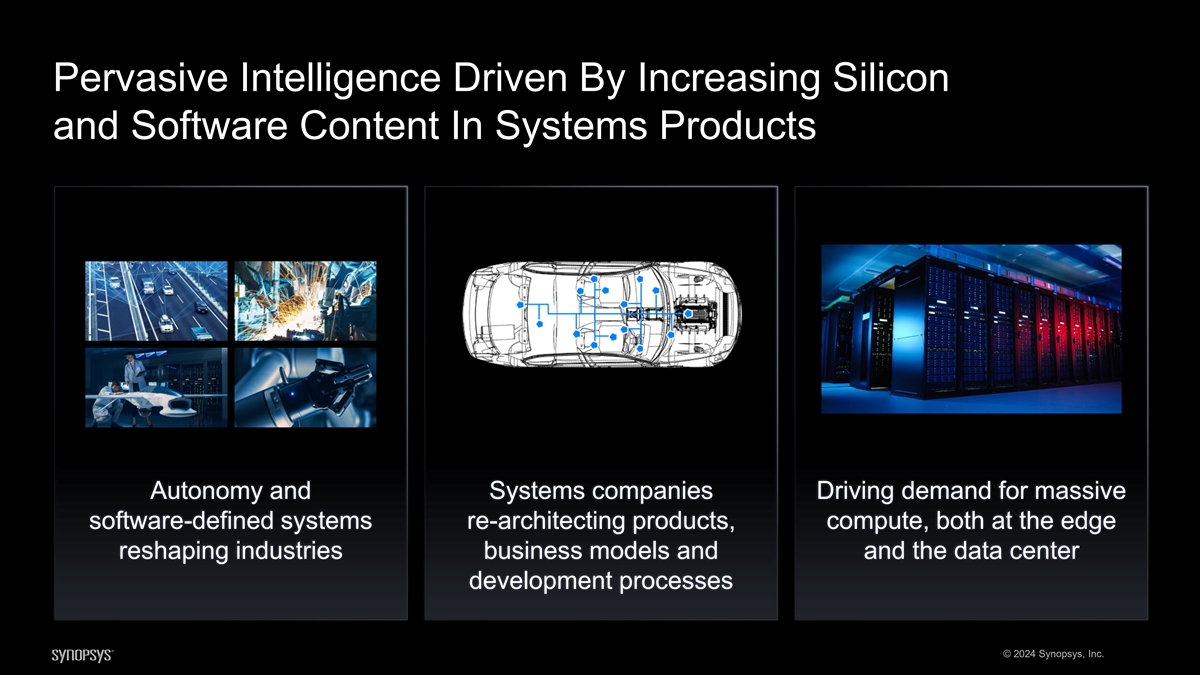
Pervasive Intelligence Driven By Increasing Silicon and Software Content In Systems Products Autonomy and Systems companies Driving demand for massive software-defined systems re-architecting products, compute, both at the edge reshaping industries business models and and the data center development processes © 2024 Synopsys, Inc.

Systems to Silicon Silicon to Systems Transition Ongoing Across Verticals SYSTEMS SPECTRUM Electronics Electro-Mechanical Semiconductor Companies Systems Companies “Classic” Advanced Industrial Chips Computing High-Tech Automotive Aerospace Equipment Others MECHANICAL MECHANICAL MECHANICAL MECHANICAL MECHANICAL ELECTRIC ELECTRIC ELECTRIC ELECTRIC ELECTRIC ELECTRONIC ELECTRONIC ELECTRONIC ELECTRONIC ELECTRONIC ELECTRONIC ELECTRONIC Hardware Hardware Hardware Hardware Hardware Embedded Software Software Software Software Software control Silicon Silicon Silicon Silicon Silicon Silicon © 2024 Synopsys, Inc. Silicon to Systems
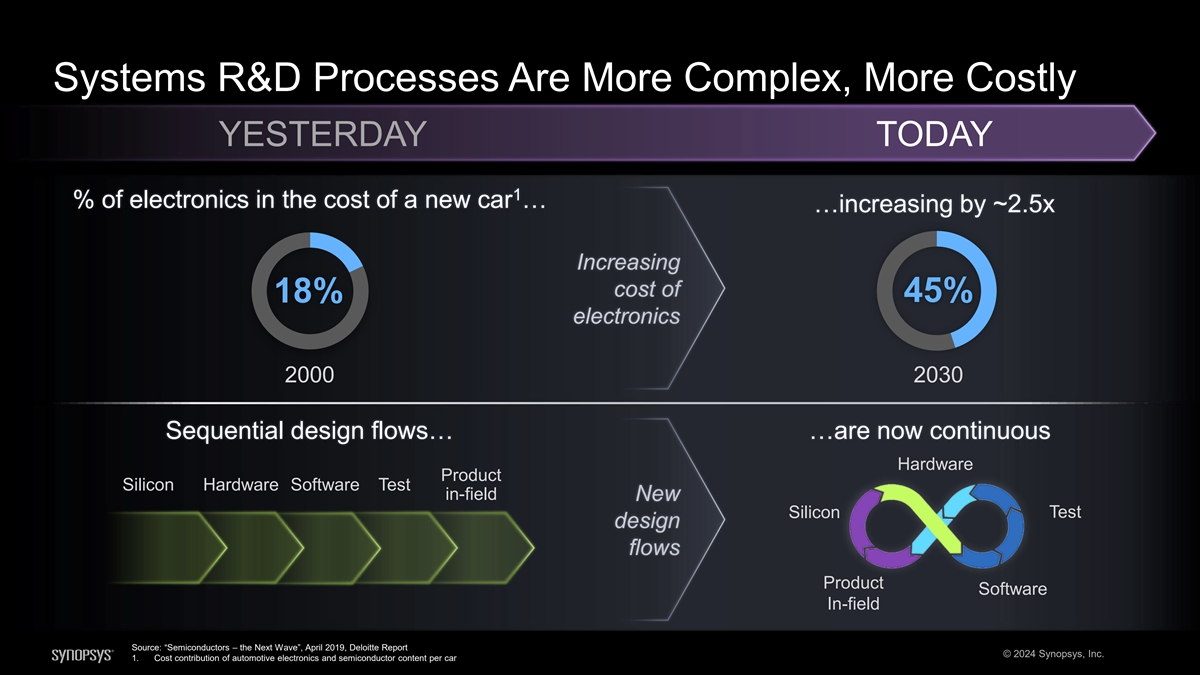
Systems R&D Processes Are More Complex, More Costly YESTERDAY TODAY 1 % of electronics in the cost of a new car … …increasing by ~2.5x Increasing cost of 18% 45% electronics 2000 2030 Sequential design flows… …are now continuous Hardware Product Silicon Hardware Software Test in-field New Test Silicon design flows Product Software In-field Source: “Semiconductors – the Next Wave”, April 2019, Deloitte Report © 2024 Synopsys, Inc. 1. Cost contribution of automotive electronics and semiconductor content per car
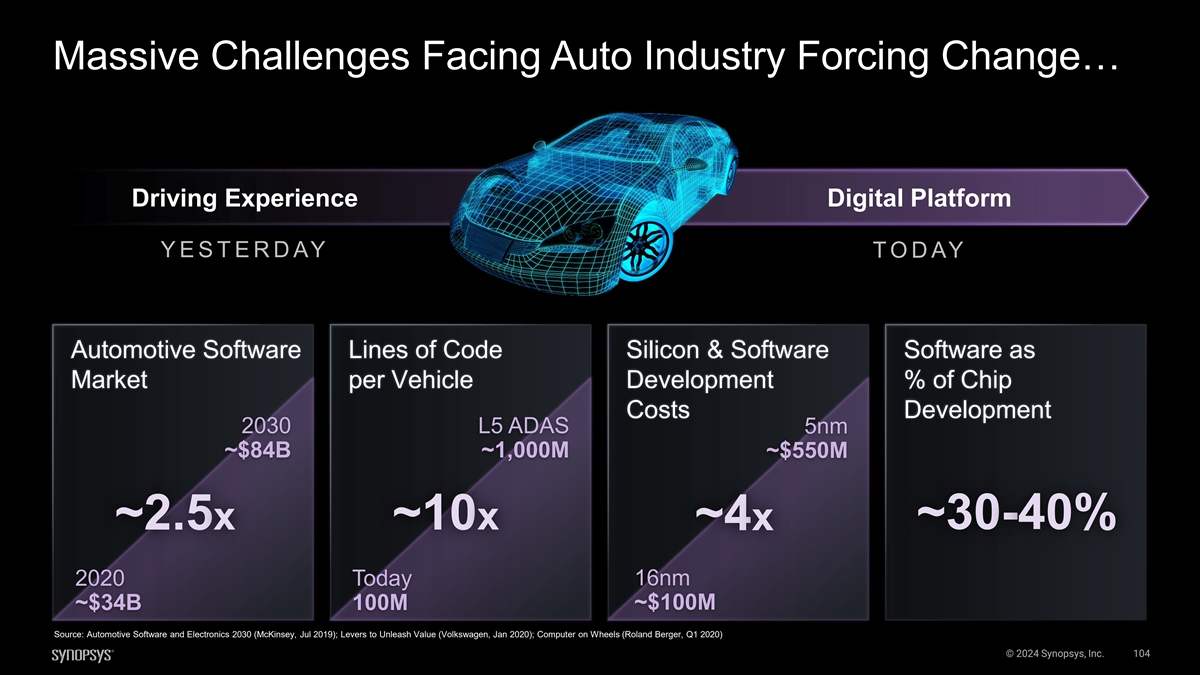
Massive Challenges Facing Auto Industry Forcing Change… Driving Experience Digital Platform Y E S T E R D AY T O D AY Automotive Software Lines of Code Silicon & Software Software as Market per Vehicle Development % of Chip Costs Development 2030 L5 ADAS 5nm ~$84B ~1,000M ~$550M ~30-40% ~2.5x ~10x ~4x 16nm 2020 Today ~$34B 100M ~$100M Source: Automotive Software and Electronics 2030 (McKinsey, Jul 2019); Levers to Unleash Value (Volkswagen, Jan 2020); Computer on Wheels (Roland Berger, Q1 2020) © 2024 Synopsys, Inc. 104
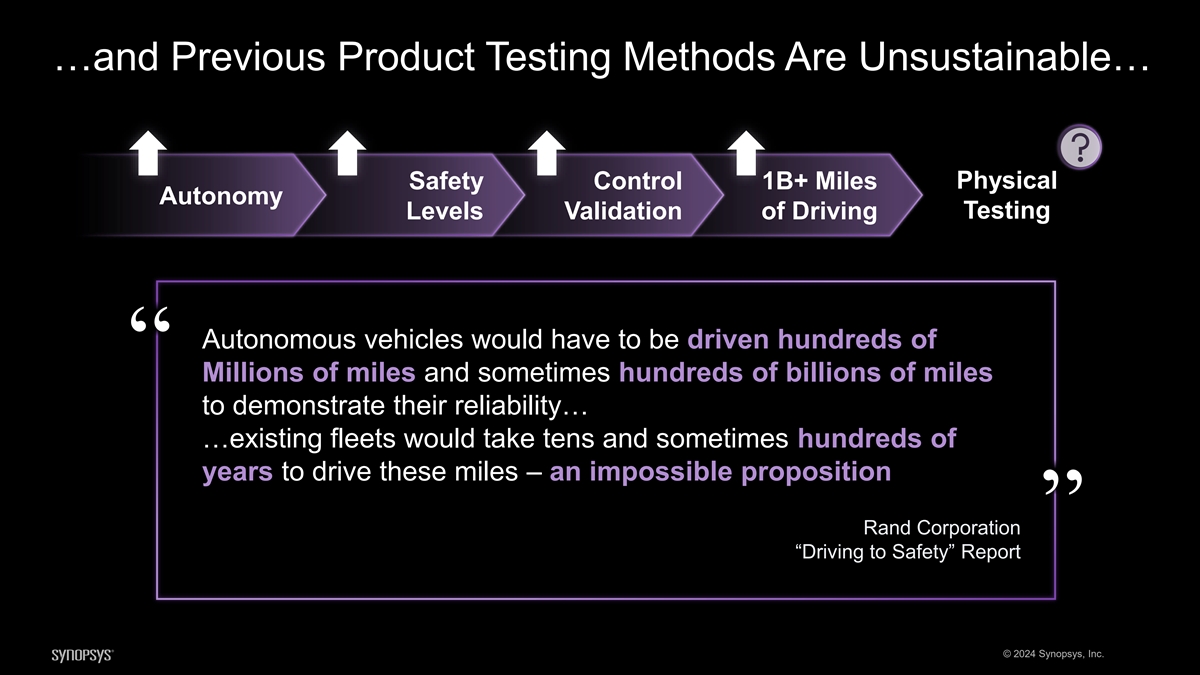
…and Previous Product Testing Methods Are Unsustainable… Physical Safety Control 1B+ Miles Autonomy Testing Levels Validation of Driving Autonomous vehicles would have to be driven hundreds of “ Millions of miles and sometimes hundreds of billions of miles to demonstrate their reliability… …existing fleets would take tens and sometimes hundreds of years to drive these miles – an impossible proposition Rand Corporation ” “Driving to Safety” Report © 2024 Synopsys, Inc.
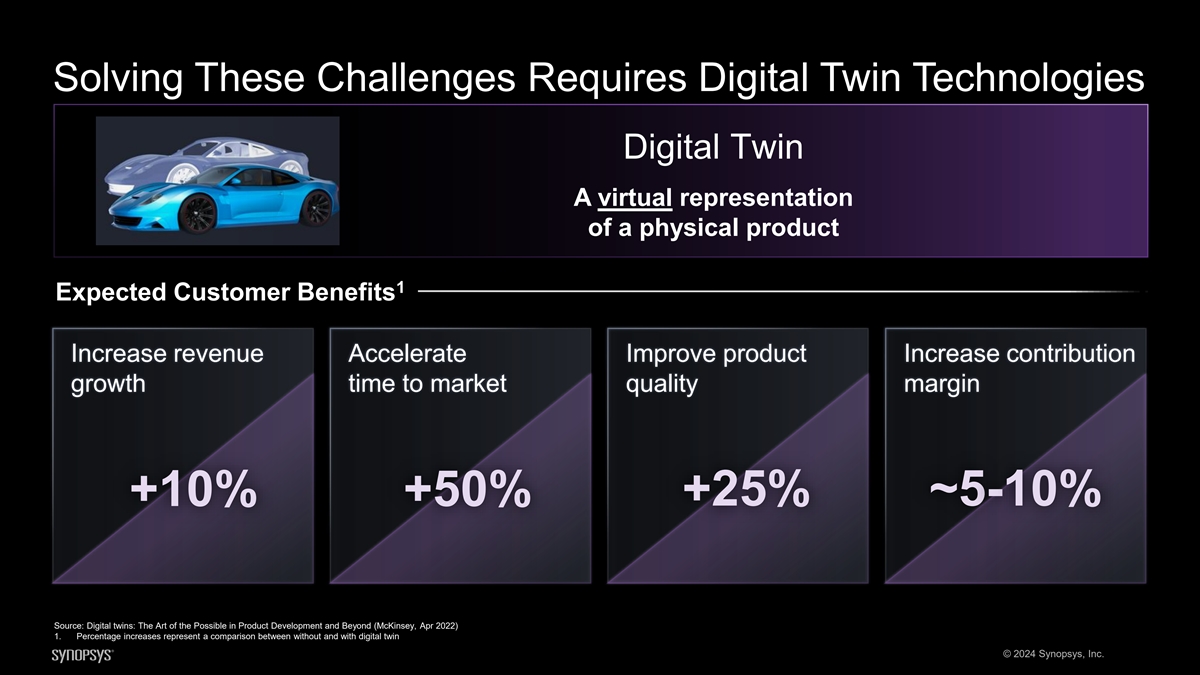
Solving These Challenges Requires Digital Twin Technologies Digital Twin A virtual representation of a physical product 1 Expected Customer Benefits Increase revenue Accelerate Improve product Increase contribution growth time to market quality margin +10% +50% +25% ~5-10% Source: Digital twins: The Art of the Possible in Product Development and Beyond (McKinsey, Apr 2022) 1. Percentage increases represent a comparison between without and with digital twin © 2024 Synopsys, Inc.
Industry Leaders Agree Virtualization Is Necessary Today Virtual “ development is essential for solving our challenges. ” Volkswagen Synopsys 2022 Virtual Prototyping Day © 2024 Synopsys, Inc.
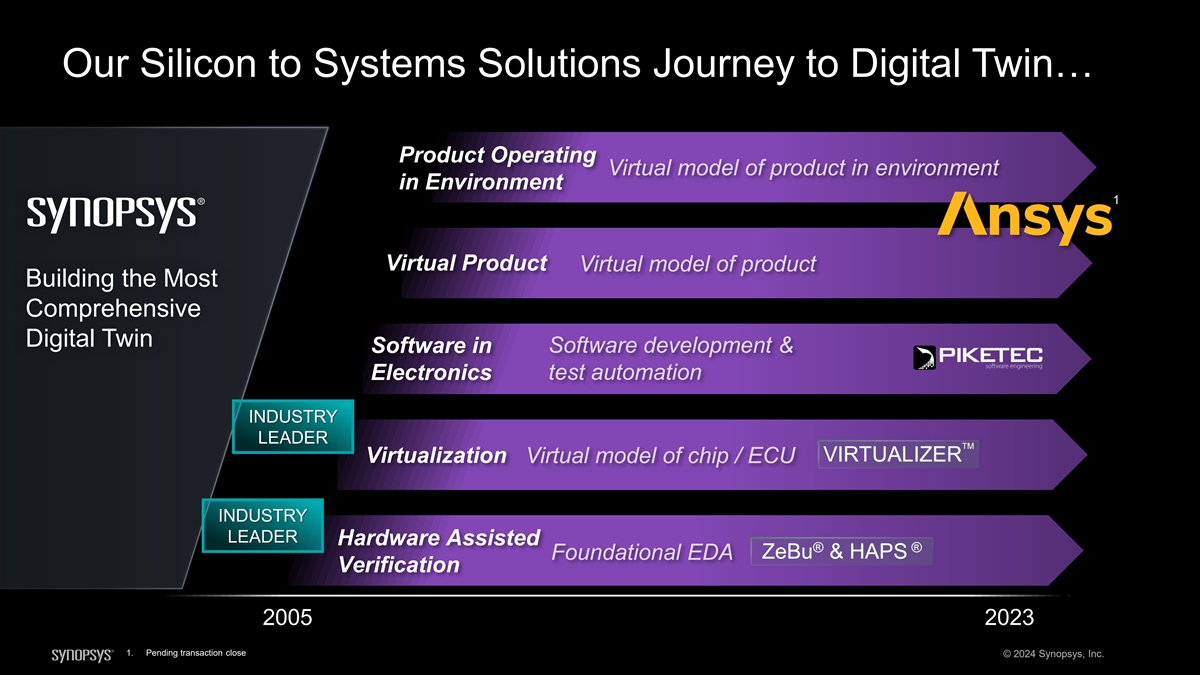
Our Silicon to Systems Solutions Journey to Digital Twin… Product Operating Virtual model of product in environment in Environment 1 Virtual Product Virtual model of product Building the Most Comprehensive Digital Twin Software development & Software in Electronics test automation INDUSTRY LEADER TM VIRTUALIZER Virtualization Virtual model of chip / ECU INDUSTRY LEADER Hardware Assisted ® ® ZeBu & HAPS Foundational EDA Verification 2005 2023 1. Pending transaction close © 2024 Synopsys, Inc.
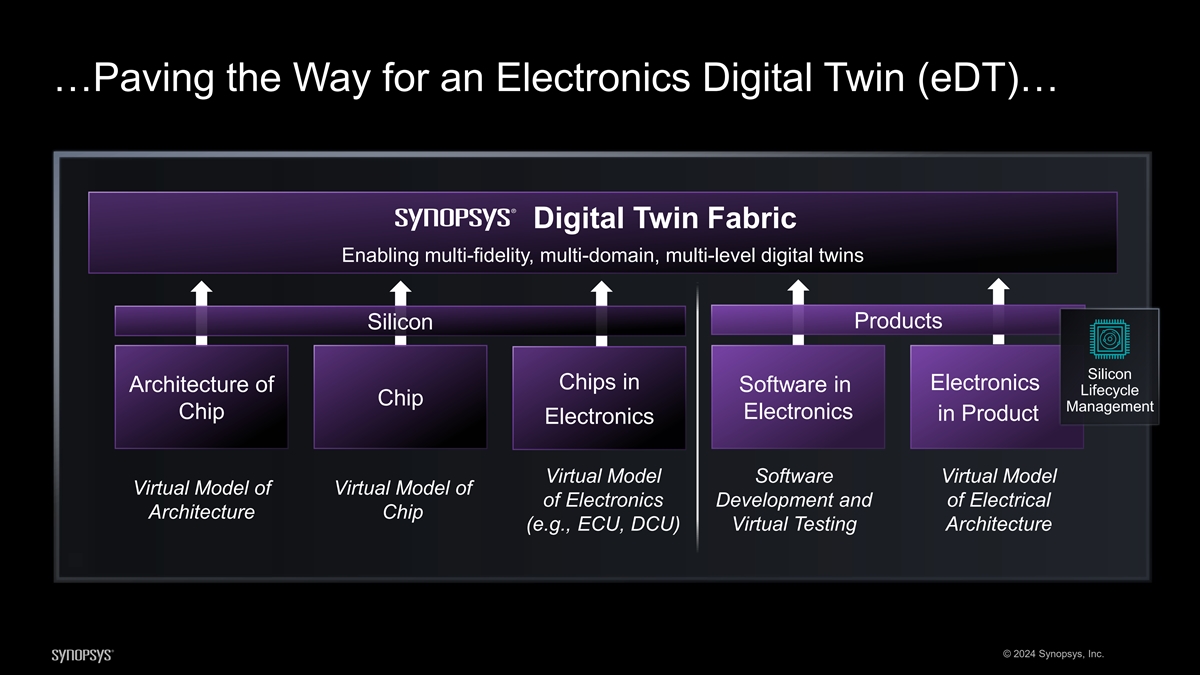
…Paving the Way for an Electronics Digital Twin (eDT)… Digital Twin Fabric Enabling multi-fidelity, multi-domain, multi-level digital twins Products Silicon Silicon Chips in Electronics Architecture of Software in Lifecycle Chip Management Chip Electronics in Product Electronics Virtual Model Software Virtual Model Virtual Model of Virtual Model of of Electronics Development and of Electrical Architecture Chip (e.g., ECU, DCU) Virtual Testing Architecture © 2024 Synopsys, Inc.

…Including Silicon Lifecycle Management Innovation Monitoring and optimization of relevant chip metrics across lifecycle stages Margin Yield Silicon Predictive Optimization Optimization Insights Maintenance & in-field Optimization In-Chip In-Ramp In-Production In-Field In-Design Monitors Design Analytics In-Field Analytics Manufacturing Analytics Data Store S i l i co n L i f ecycl e Man ag emen t © 2024 Synopsys, Inc.
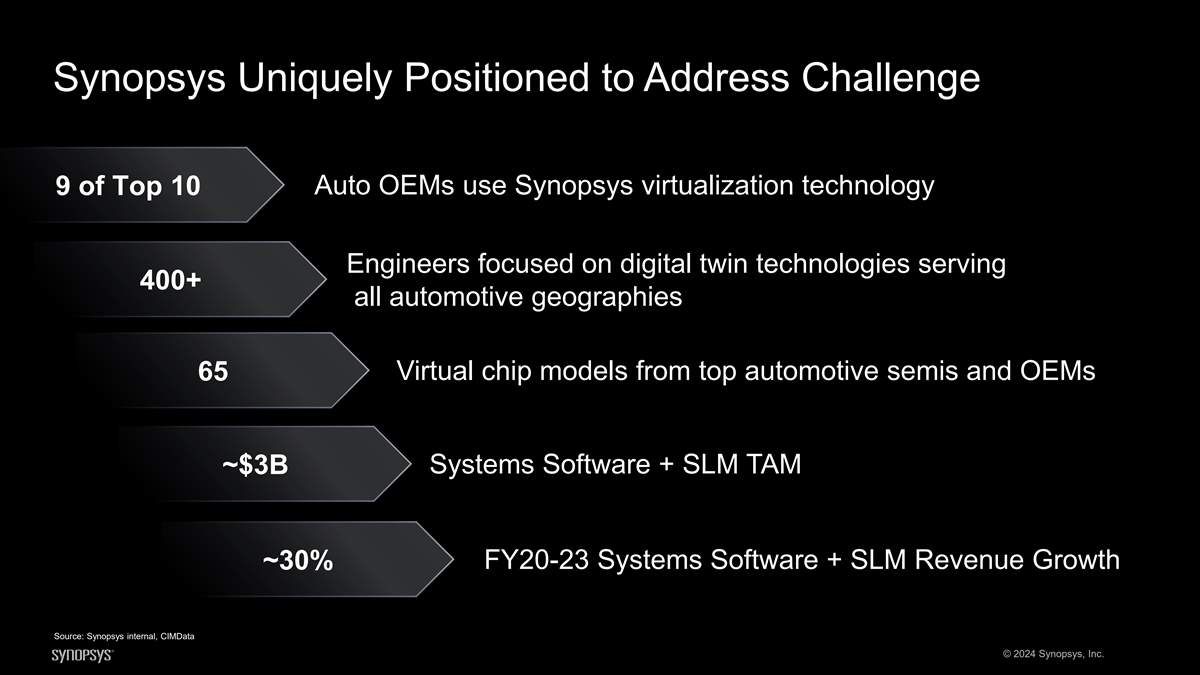
Synopsys Uniquely Positioned to Address Challenge 9 of Top 10 Auto OEMs use Synopsys virtualization technology Engineers focused on digital twin technologies serving 400+ all automotive geographies Virtual chip models from top automotive semis and OEMs 65 ~$3B Systems Software + SLM TAM FY20-23 Systems Software + SLM Revenue Growth ~30% Source: Synopsys internal, CIMData © 2024 Synopsys, Inc.
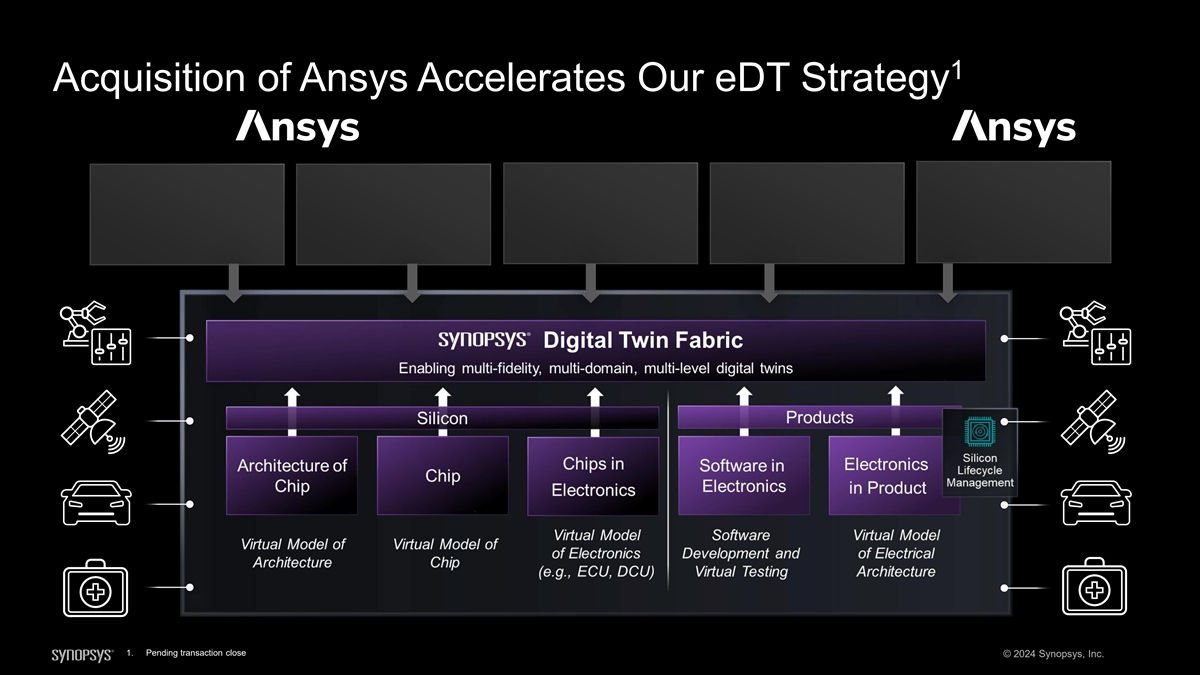
1 Acquisition of Ansys Accelerates Our eDT Strategy Embedded Software Multi-physics Driving Scenarios Embedded Software Multi-physics Hardware-in-the- Tools for Safety and Domains Vehicle Dynamics Generators Tools for Safety and Domains Vehicle Dynamics Loop (HIL) Systems Security Sensors and Coverage Security Sensors 1. Pending transaction close © 2024 Synopsys, Inc.

Pending Combination Will Accelerate Automotive Opportunity New Joint Solutions Automotive Digital Twin • Core multi-physics (mechanical, • Virtual vehicle for electronic systems thermal, etc.) and software testing • Comprehensive digital twins for SDV • Auto-specific virtual testing (e.g., • Software testing continuum from • Virtual vehicle testing collision) virtual to physical platforms • Multi-domain system modeling • Auto-grade secure and safe • Simulation data management software generation • Integration into rich ecosystem for • Twin deployment and lifecycle complete automotive flow management • Simulation process data management • Model-based systems engineering © 2024 Synopsys, Inc.
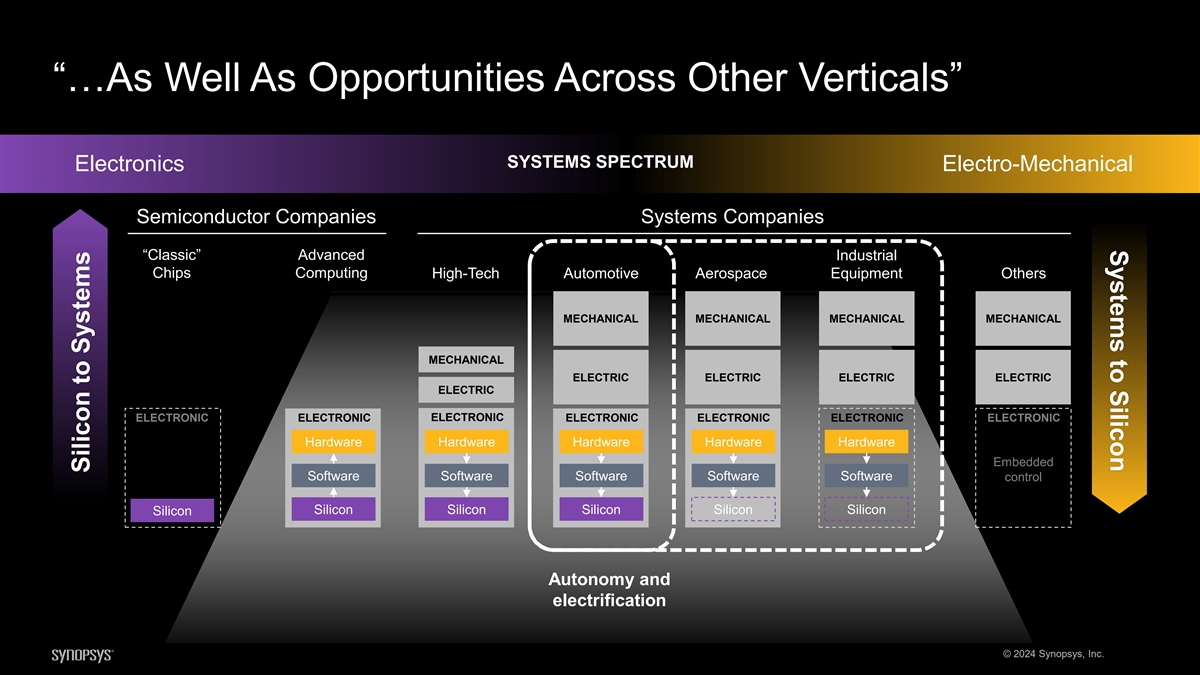
Systems to Silicon “…As Well As Opportunities Across Other Verticals” SYSTEMS SPECTRUM Electronics Electro-Mechanical Semiconductor Companies Systems Companies “Classic” Advanced Industrial Chips Computing High-Tech Automotive Aerospace Equipment Others MECHANICAL MECHANICAL MECHANICAL MECHANICAL MECHANICAL ELECTRIC ELECTRIC ELECTRIC ELECTRIC ELECTRIC ELECTRONIC ELECTRONIC ELECTRONIC ELECTRONIC ELECTRONIC ELECTRONIC ELECTRONIC Hardware Hardware Hardware Hardware Hardware Embedded Software Software Software Software Software control Silicon Silicon Silicon Silicon Silicon Silicon Autonomy and electrification © 2024 Synopsys, Inc. Silicon to Systems
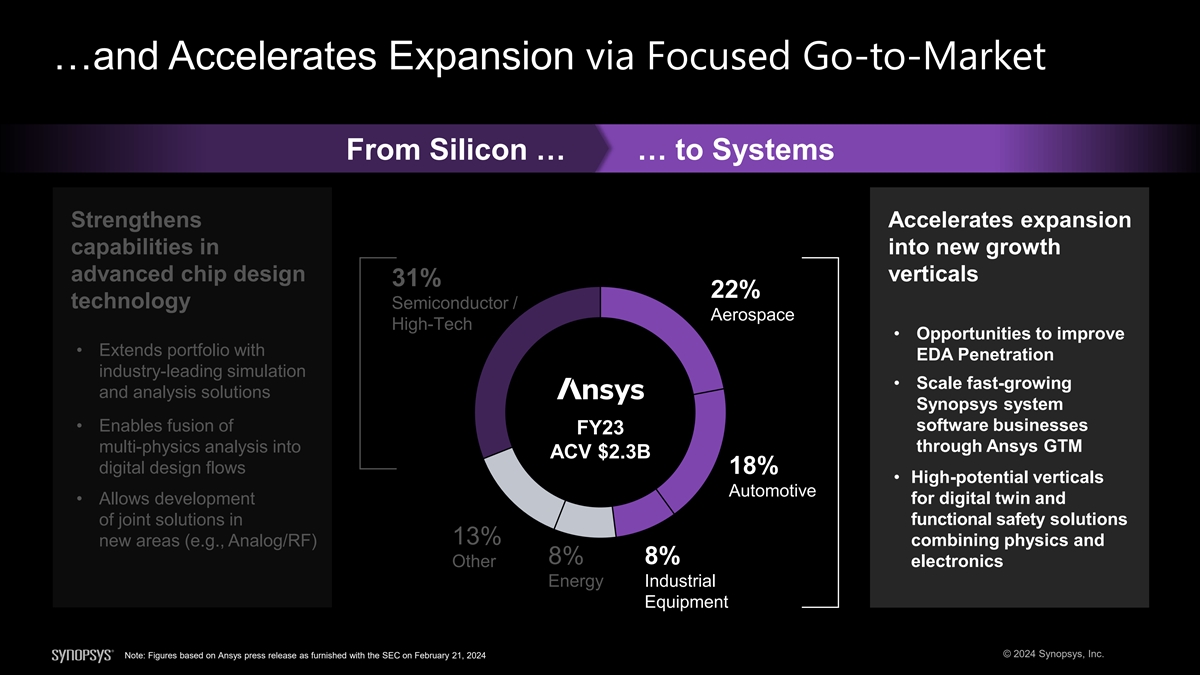
…and Accelerates Expansion via Focused Go-to-Market From Silicon … … to Systems Strengthens Accelerates expansion capabilities in into new growth advanced chip design verticals 31% 22% technology Semiconductor / Aerospace High-Tech • Opportunities to improve • Extends portfolio with EDA Penetration industry-leading simulation • Scale fast-growing and analysis solutions Synopsys system • Enables fusion of software businesses FY23 multi-physics analysis into through Ansys GTM ACV $2.3B digital design flows 18% • High-potential verticals Automotive for digital twin and • Allows development functional safety solutions of joint solutions in 13% new areas (e.g., Analog/RF) combining physics and 8% 8% Other electronics Energy Industrial Equipment © 2024 Synopsys, Inc. Note: Figures based on Ansys press release as furnished with the SEC on February 21, 2024

Unlocking ~$13 Billion Systems TAM with Ansys Potential Simulation additional Systems TAM & Analysis future TAM from digital twin ~$10B ~$13B Systems Software & SLM ~$3B Combined Systems TAM TAM CAGR >20% ~10% ~12% (2023–2028) Note: Figures exclude impact from SIG © 2024 Synopsys, Inc. Source: Synopsys internal, CIMData
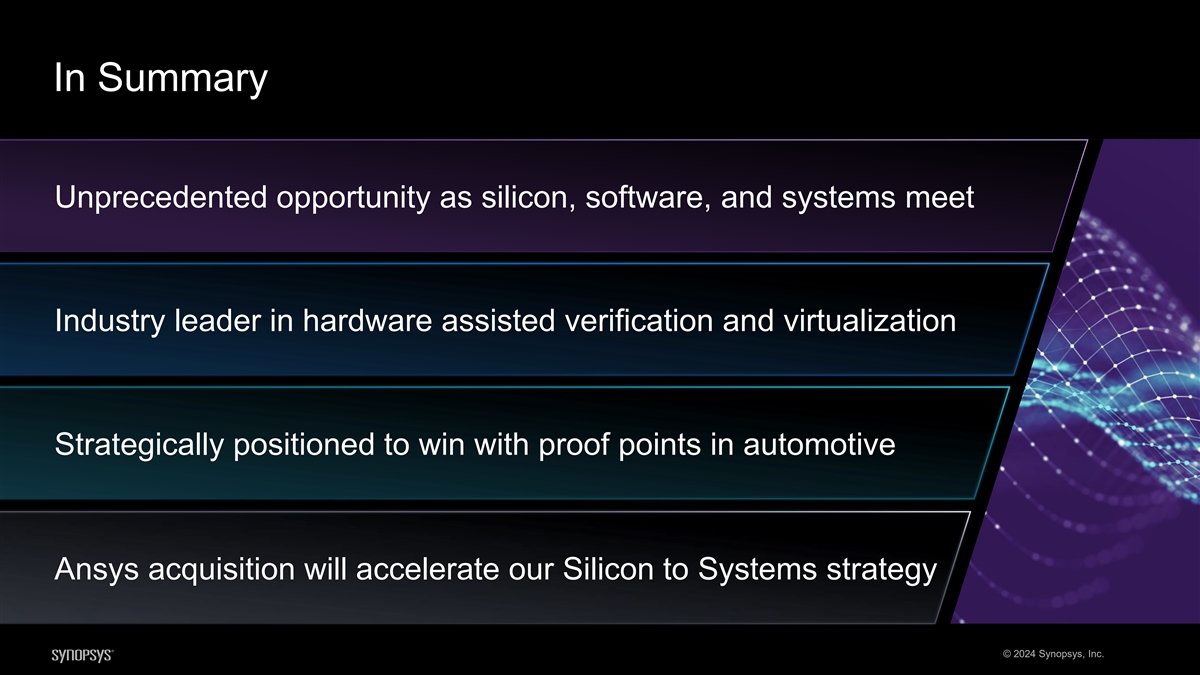
In Summary Unprecedented opportunity as silicon, software, and systems meet Industry leader in hardware assisted verification and virtualization Strategically positioned to win with proof points in automotive Ansys acquisition will accelerate our Silicon to Systems strategy © 2024 Synopsys, Inc.


© 2024 Synopsys, Inc.
Synopsys Design IP John Koeter Senior VP, Product Management and Strategy

Major Components of Semiconductor Chip CPU GPU Cluster Cluster Bus Fabrics AI Sensors Accelerator Memory (NPU) Embedded Processors Security System Interfaces Peripheral Interfaces IP (PCIe, Ethernet…) (USB, HDMI…) * Small boxes are standard cell library elements © 2024 Synopsys, Inc. Memory Basic Peripherals Interface (Uart, I2C) Memory Memory Die-to-Die GPIOs Interface
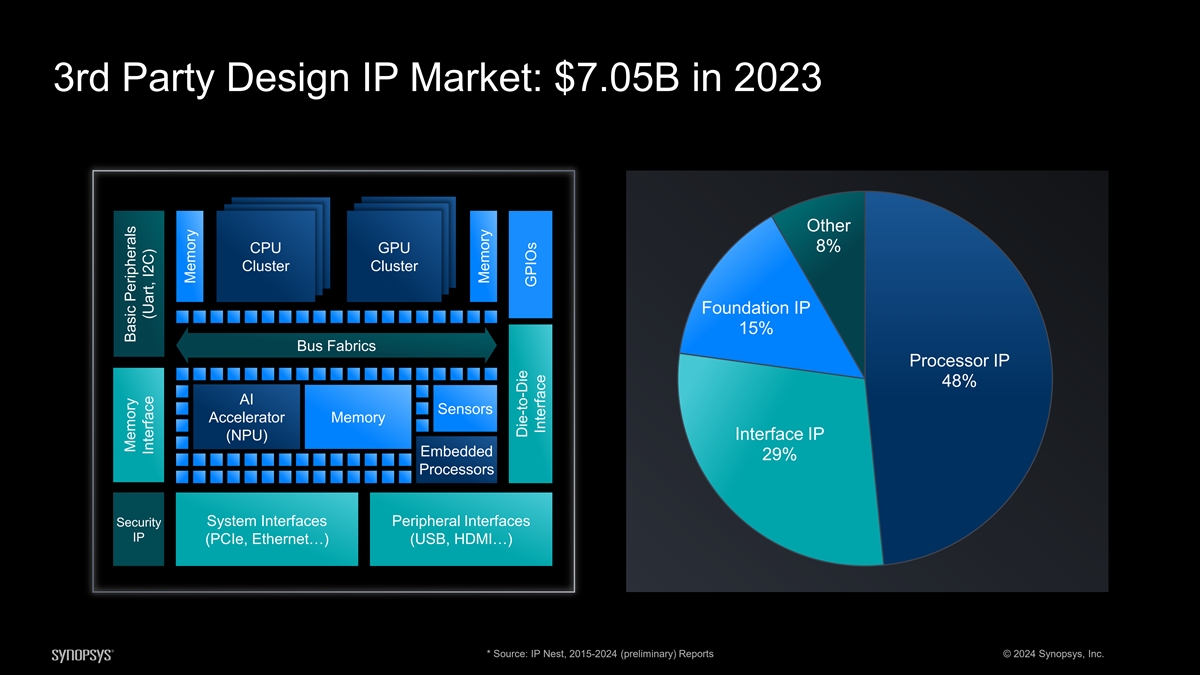
3rd Party Design IP Market: $7.05B in 2023 Other 8% CPU CPU GP GPU U Cl Clu uste ster r Cl Clu uste ster r Foundation IP 15% B Bu us s Fa Fab bri rics cs Processor IP 48% AI AI S Se en nso sors rs A Acce ccelera lerato tor r M Me em mo ory ry Interface IP (N (NP PU) U) E Em mb be ed dd de ed d 29% P Processo rocessors rs S Secu ecurit rity y Sy Syste stem m In Inte ter rf face aces s Pe Per riiph phera eral l In Inte ter rf face aces s IP IP (PCIe (PCIe, , E Eth the erne rnet…) t…) (U (US SB B, , HD HDM MI…) I…) * Source: IP Nest, 2015-2024 (preliminary) Reports © 2024 Synopsys, Inc. M Me em mo ory ry B Ba asic sic P Pe eri rip ph he era rals ls In Inte ter rfface ace ( (U Uart art, I , I2C) 2C) M Me em mo ory ry M Me em mo ory ry Die Die- -to to- -Di Die e GP GPIO IOs s In Inte terf rfa ace ce
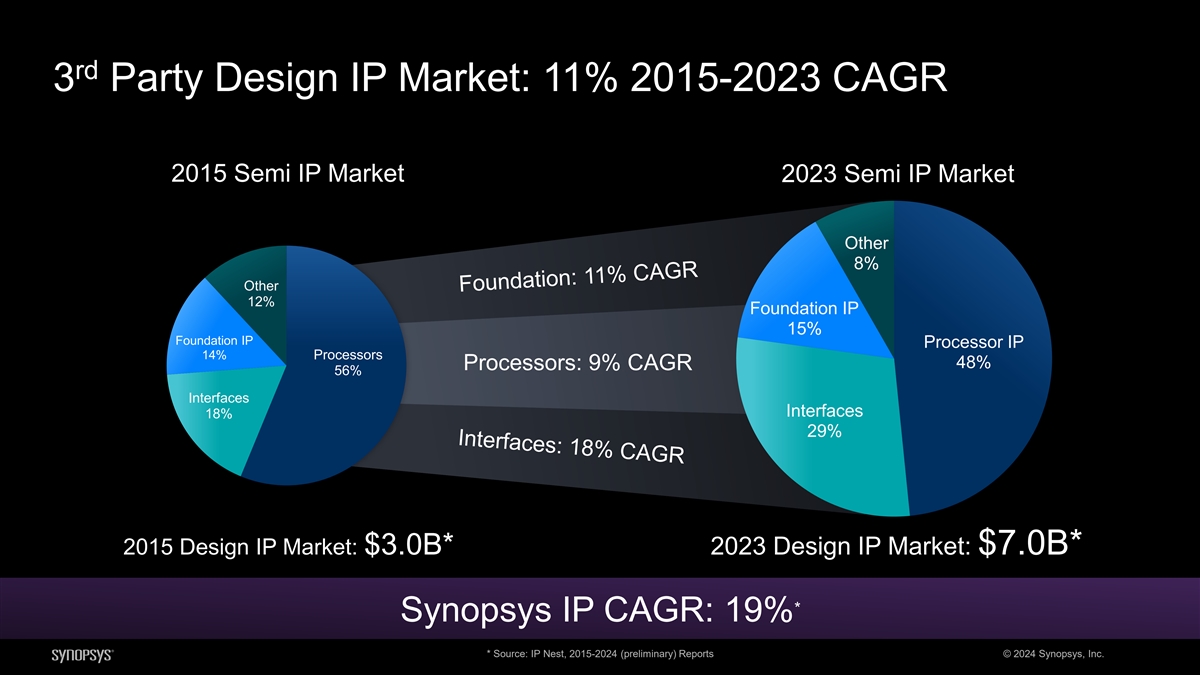
rd 3 Party Design IP Market: 11% 2015-2023 CAGR 2015 Semi IP Market 2023 Semi IP Market Other 8% Other 12% Foundation IP 15% Foundation IP Processor IP 14% Processors 48% Processors: 9% CAGR 56% Interfaces Interfaces 18% 29% 2015 Design IP Market: $3.0B* 2023 Design IP Market: $7.0B* * Synopsys IP CAGR: 19% * Source: IP Nest, 2015-2024 (preliminary) Reports © 2024 Synopsys, Inc.
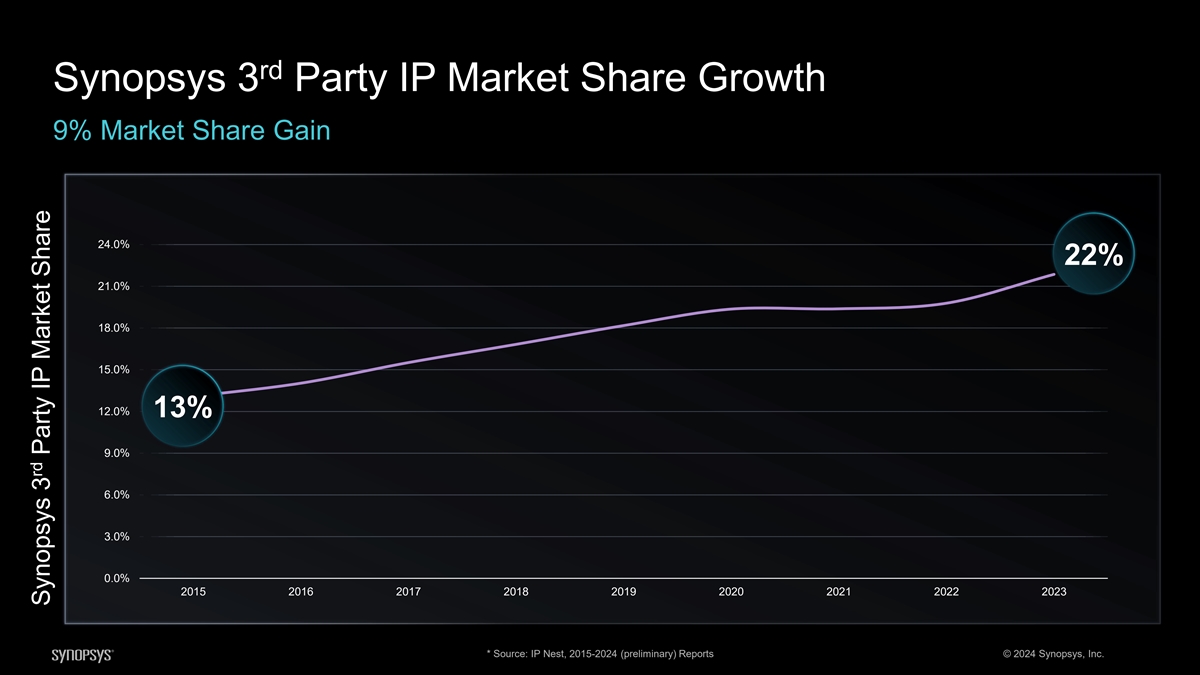
rd Synopsys 3 Party IP Market Share Growth 9% Market Share Gain 24.0% 22% 21.0% 18.0% 15.0% 12.0% 13% 9.0% 6.0% 3.0% 0.0% 2015 2016 2017 2018 2019 2020 2021 2022 2023 * Source: IP Nest, 2015-2024 (preliminary) Reports © 2024 Synopsys, Inc. rd Synopsys 3 Party IP Market Share
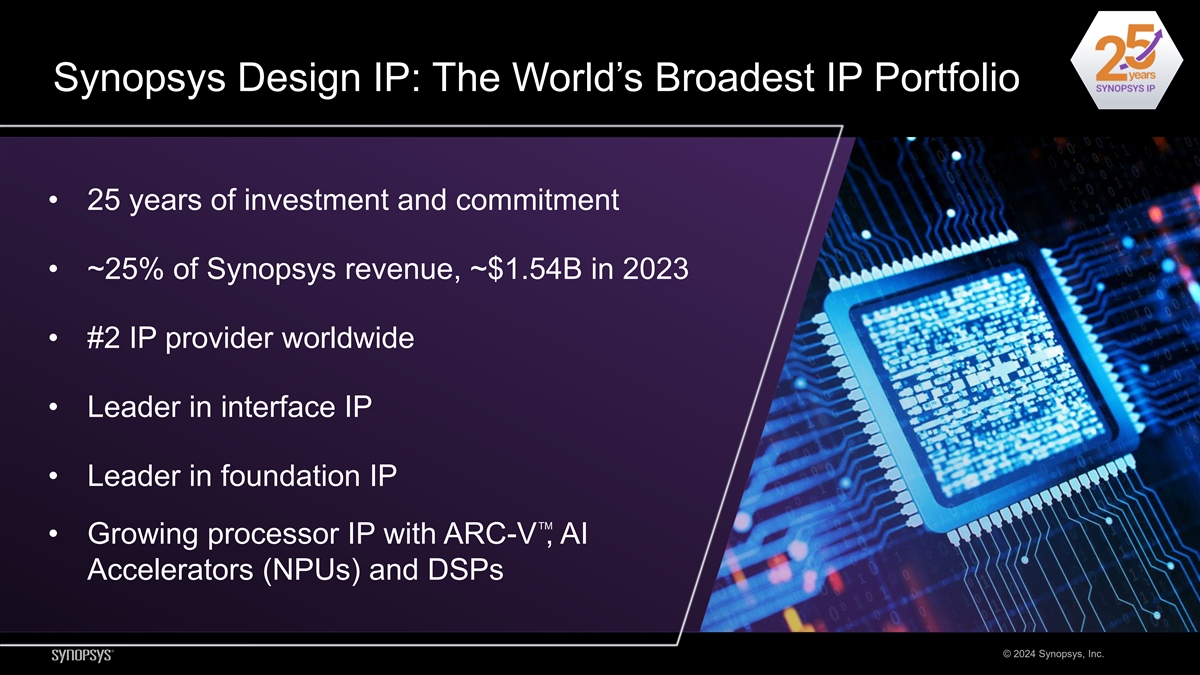
Synopsys Design IP: The World’s Broadest IP Portfolio • 25 years of investment and commitment CPU GPU • ~25% of Synopsys revenue, ~$1.54B in 2023 Cluster Cluster • #2 IP provider wo Bus Fabrrldw ics ide AI Sensors Accelerator Memory • Leader in interface IP (NPU) Embedded Processors • Leader in foundation IP Security System Interfaces Peripheral Interfaces IP (PCIe, Ethernet…) (USB, HDMI…) TM • Growing processor IP with ARC-V , AI Accelerators (NPUs) and DSPs © 2024 Synopsys, Inc. Basic Peripherals (Uart, Memory Interface I2C) Memory Memory Die-to-Die GPIOs Interface
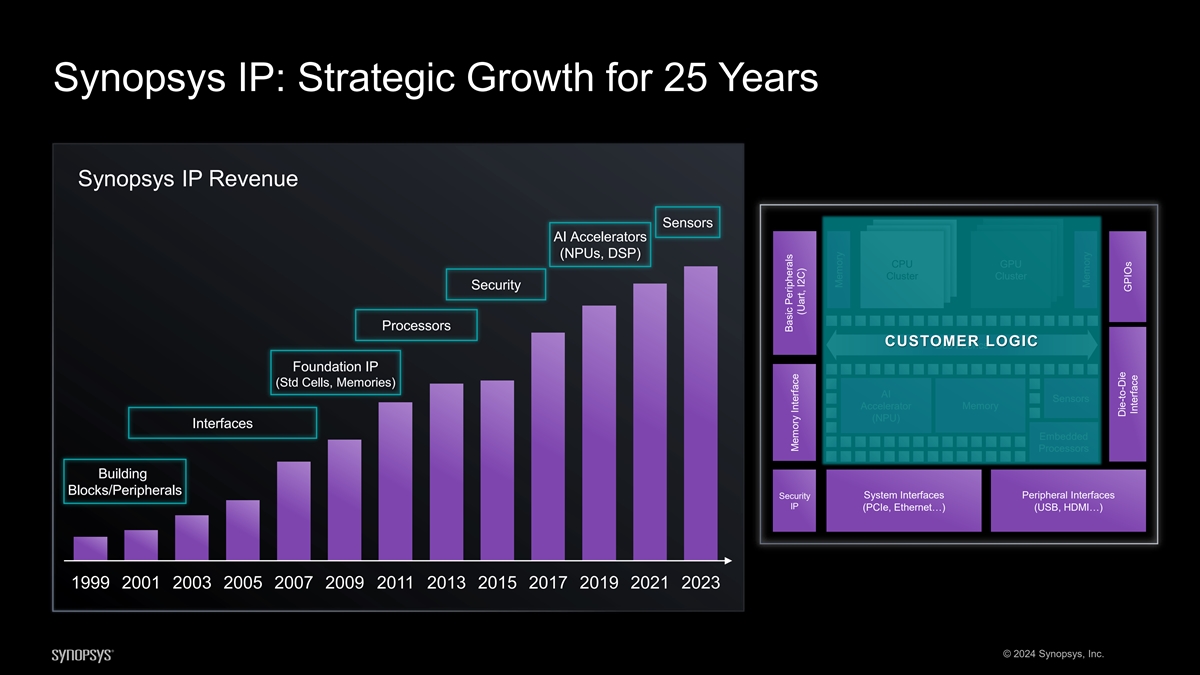
Synopsys IP: Strategic Growth for 25 Years Synopsys IP Revenue Sensors AI Accelerators (NPUs, DSP) C CP PU U GPU C Clus lustte er r Cluster Security Processors CUSTOMER LOGIC B Bu us s Fab Fabr ric ics s Foundation IP (Std Cells, Memories) AI AI S Se en ns so or rs s A Ac cc ce eler lera atto or r M Me em mo or ry y ( (N NP PU U) ) Interfaces E Em mb be ed dd de ed d P Pr ro oc ce es ss so or rs s Building Blocks/Peripherals S Se ecu cur rity ity S Sy ys stte em m IIn ntte er rffa ac ce es s P Pe er riph iphe er ra al l IIn ntte er rffa ac ce es s IP IP ( (PC PCIIe e,, E Et th he er rn ne ett…) …) ( (U US SB B,, H HD DM MI I…) …) 1999 2001 2003 2005 2007 2009 2011 2013 2015 2017 2019 2021 2023 © 2024 Synopsys, Inc. Bas Bas ic Per ic Per iphe ip rh ae lsr a (U lsart, M Me em mo or ry y IIn ntte er rffa ac ce e (Ua I2 rtC , I)2C) M Me em mo or ry y M Me em mo or ry y D Die ie- -to to- -D Die ie GPI GPIOs Os IIn ntte er rffa ac ce e
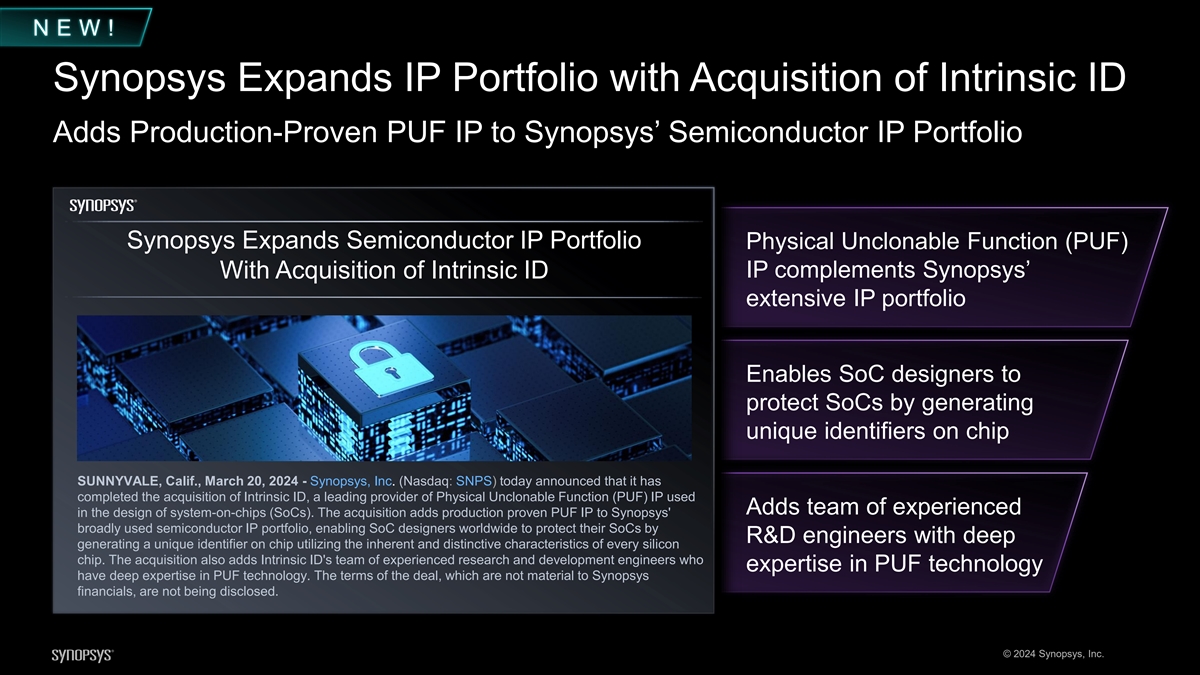
N E W ! Synopsys Expands IP Portfolio with Acquisition of Intrinsic ID Adds Production-Proven PUF IP to Synopsys’ Semiconductor IP Portfolio Synopsys Expands Semiconductor IP Portfolio Physical Unclonable Function (PUF) IP complements Synopsys’ With Acquisition of Intrinsic ID extensive IP portfolio Enables SoC designers to protect SoCs by generating unique identifiers on chip SUNNYVALE, Calif., March 20, 2024 - Synopsys, Inc. (Nasdaq: SNPS) today announced that it has completed the acquisition of Intrinsic ID, a leading provider of Physical Unclonable Function (PUF) IP used Adds team of experienced in the design of system-on-chips (SoCs). The acquisition adds production proven PUF IP to Synopsys' broadly used semiconductor IP portfolio, enabling SoC designers worldwide to protect their SoCs by R&D engineers with deep generating a unique identifier on chip utilizing the inherent and distinctive characteristics of every silicon chip. The acquisition also adds Intrinsic ID's team of experienced research and development engineers who expertise in PUF technology have deep expertise in PUF technology. The terms of the deal, which are not material to Synopsys financials, are not being disclosed. © 2024 Synopsys, Inc.
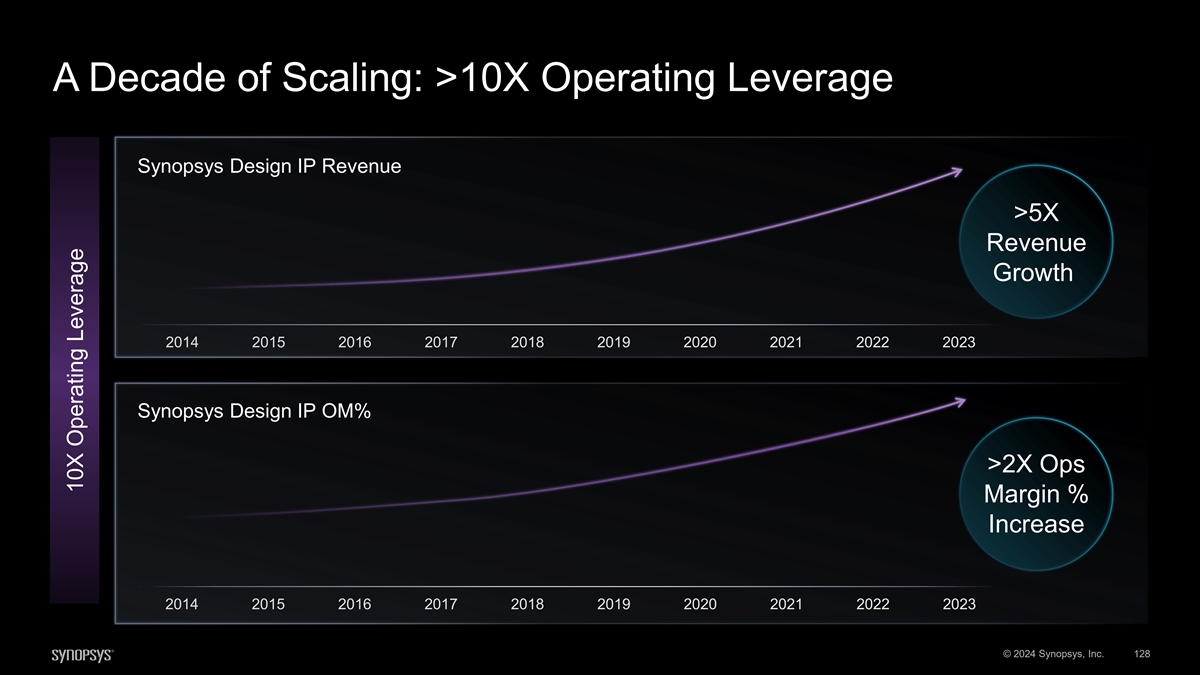
A Decade of Scaling: >10X Operating Leverage Synopsys Design IP Revenue >5X Revenue Growth 2014 2015 2016 2017 2018 2019 2020 2021 2022 2023 Synopsys Design IP OM% >2X Ops Margin % Increase 2014 2015 2016 2017 2018 2019 2020 2021 2022 2023 © 2024 Synopsys, Inc. 128 10X Operating Leverage
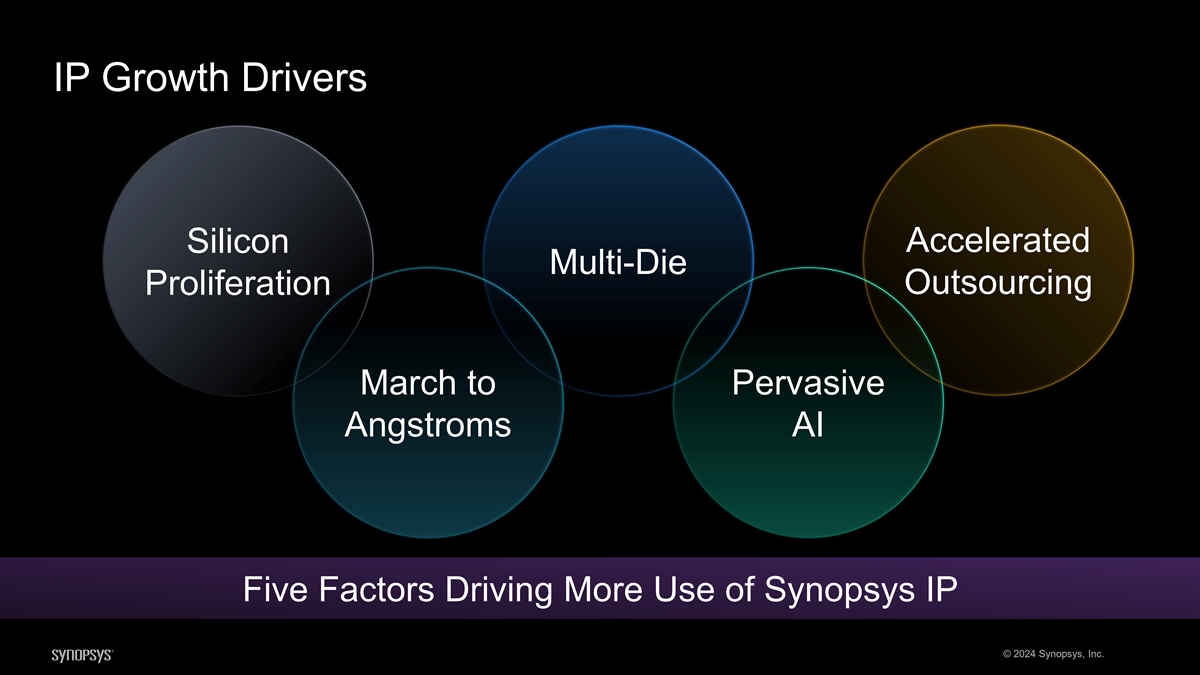
IP Growth Drivers Silicon Accelerated Multi-Die Outsourcing Proliferation March to Pervasive Angstroms AI Five Factors Driving More Use of Synopsys IP © 2024 Synopsys, Inc.
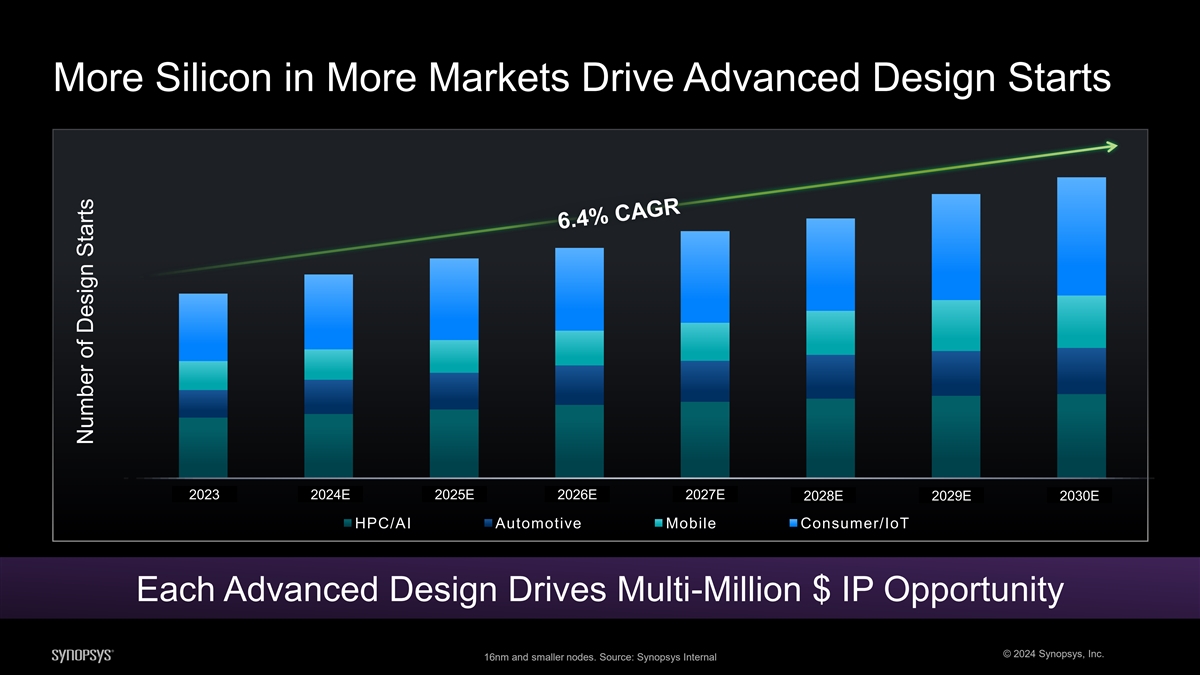
More Silicon in More Markets Drive Advanced Design Starts 2023 2024E 2025E 2026E 2027E 2028E 2029E 2030E HPC/AI Automotive Mobile Consumer/IoT Each Advanced Design Drives Multi-Million $ IP Opportunity © 2024 Synopsys, Inc. 16nm and smaller nodes. Source: Synopsys Internal Number of Design Starts
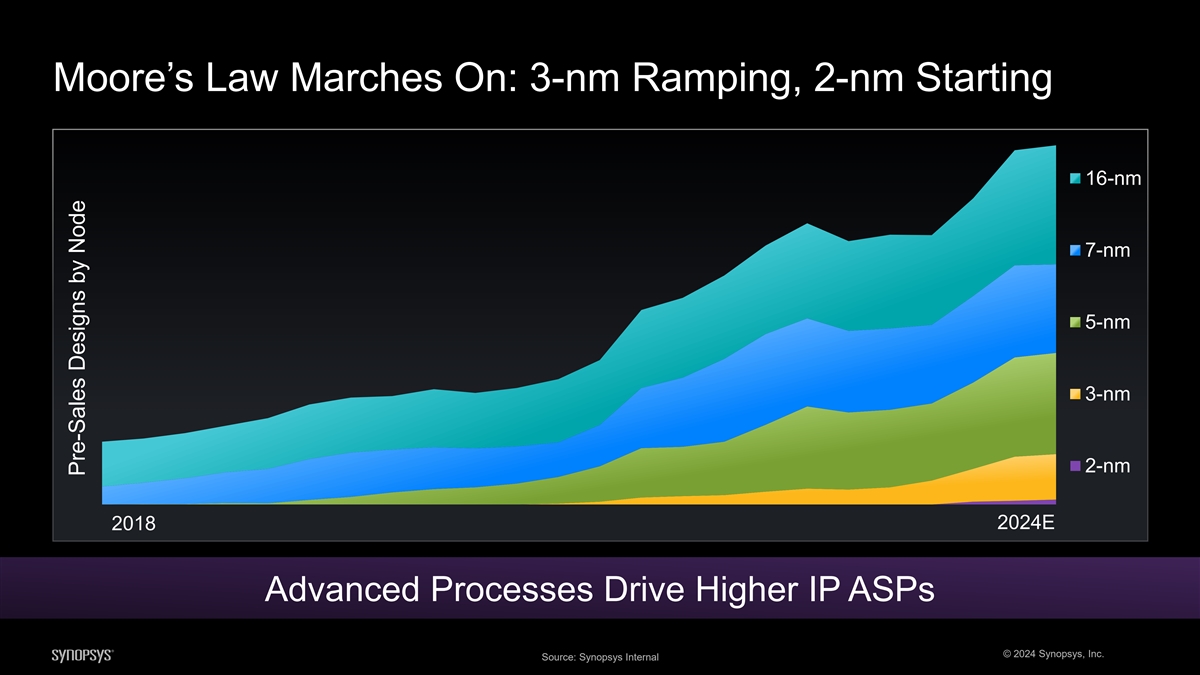
Moore’s Law Marches On: 3-nm Ramping, 2-nm Starting 16-nm 7-nm 5-nm 3-nm 2-nm 2024E 2018 Advanced Processes Drive Higher IP ASPs © 2024 Synopsys, Inc. Source: Synopsys Internal Pre-Sales Designs by Node

Silicon Complexity Exploding Software Defined Systems: SoCs Shifting from Compounds Silicon Complexity Monolithic to Multi-Die Designs Pervasive Intelligence: Explosion of Heterogenous Complexity March to Trillions of Transistors: Expanding System Functionality © 2024 Synopsys, Inc.
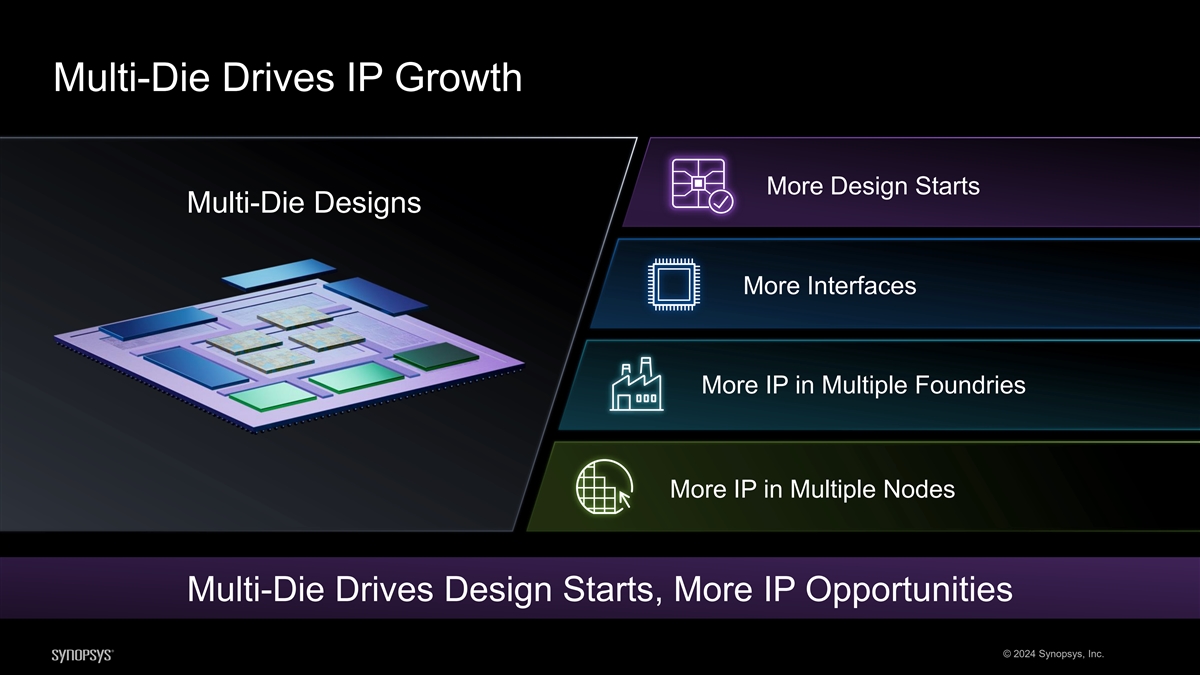
Multi-Die Drives IP Growth More Design Starts Multi-Die Designs More Interfaces More IP in Multiple Foundries More IP in Multiple Nodes Multi-Die Drives Design Starts, More IP Opportunities © 2024 Synopsys, Inc.

Pervasive AI is Driving Insatiable Need for Data Processing 3.5 CPU Core Count Memory channel BW per core 3 2.5 INCREASING 2 GAP 1.5 1 0.5 0 2012 2014 2016 2018 2020 © 2024 Synopsys, Inc. Source: Meta, OCP Summit Presentation Nov 2021 Source: Standards Bodies Normalized to growth rate

Pervasive AI is Driving Insatiable Need for Data Processing CPU Core Count Memory channel BW per core 3.5 USB PCIe S Stan tandards dards DDR Stand HBM Standards ards USB4 v2 1800 250 600 90 3 HBM4 PCIe 7.0 MRDIMM v2 1600 80 500 2.5 200 1400 70 HBM3E 1200 400 INCREASING 60 2 MRDIMM v1 150 GAP HBM3 1000 50 USB4 PCIe 6.0 300 1.5 800 40 DDR5 5200 100 HBM2E USB 3.2 600 200 HBM2E+ 30 PCIe 5.0 1 DDR5 HBM2+ HBM2 400 USB 3.1 20 DDR4 50 PCIe 4.0 HBM USB 3.0 DDR3 100 PCIe 3.0 DDR2 USB 2.0 PCIe 2.0 PCIe 1.0 0.5 200 10 0 0 0 0 0 2012 2014 2016 2018 2020 © 2024 Synopsys, Inc. Source: Meta, OCP Summit Presentation Nov 2021 Source: Standards Bodies Normalized to growth rate Bandwidth (GB/s) Ban Ban dw dw idt idt h h (GB (Gbps /s) ) Bandwidth (GB/s) 20 2000 00 2003 20 2001 01 2004 20 2002 02 2005 20 2003 03 2006 20 2004 04 2007 20 2005 05 2008 20 2006 06 2009 2007 2007 2010 2008 2008 2009 20 2009 11 2010 2010 2012 2011 2011 2013 2012 2012 2014 2013 2013 2015 2014 2014 2016 2015 2015 2017 2016 2016 2018 2017 2017 20 2018 19 2018 2019 2019 2020 2020 2020 2021 2021 2021 2022 2022 2022 2023 2023 2023 2024 2024 2024
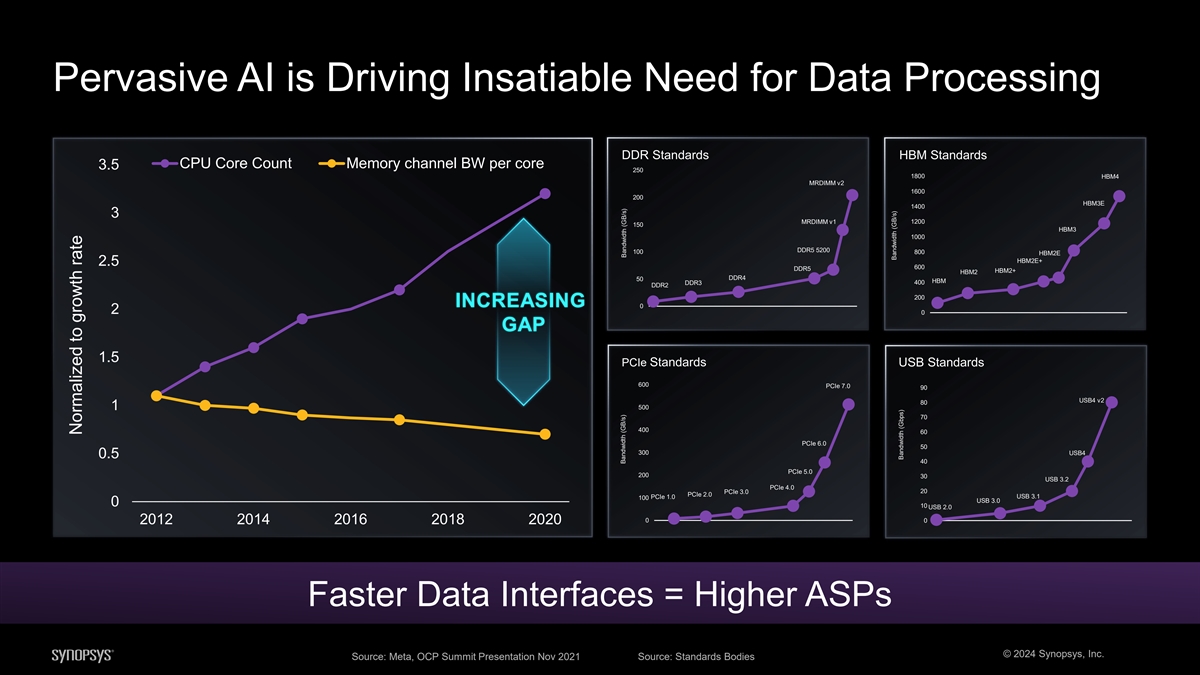
Pervasive AI is Driving Insatiable Need for Data Processing DDR Standards HBM Standards CPU Core Count Memory channel BW per core 3.5 250 1800 HBM4 MRDIMM v2 1600 200 HBM3E 1400 3 MRDIMM v1 1200 150 HBM3 1000 DDR5 5200 100 800 HBM2E HBM2E+ 2.5 600 DDR5 HBM2+ HBM2 DDR4 50 HBM DDR3 400 DDR2 200 INCREASING 0 2 0 GAP 1.5 PCIe Standards USB Standards 600 PCIe 7.0 90 USB4 v2 80 1 500 70 400 60 PCIe 6.0 50 300 USB4 0.5 40 PCIe 5.0 200 30 USB 3.2 PCIe 4.0 PCIe 3.0 20 PCIe 2.0 PCIe 1.0 USB 3.1 100 USB 3.0 0 10 USB 2.0 0 0 2012 2014 2016 2018 2020 Faster Data Interfaces = Higher ASPs © 2024 Synopsys, Inc. Source: Meta, OCP Summit Presentation Nov 2021 Source: Standards Bodies Normalized to growth rate Bandwidth (GB/s) Bandwidth (GB/s) Bandwidth (GB/s) Bandwidth (Gbps)
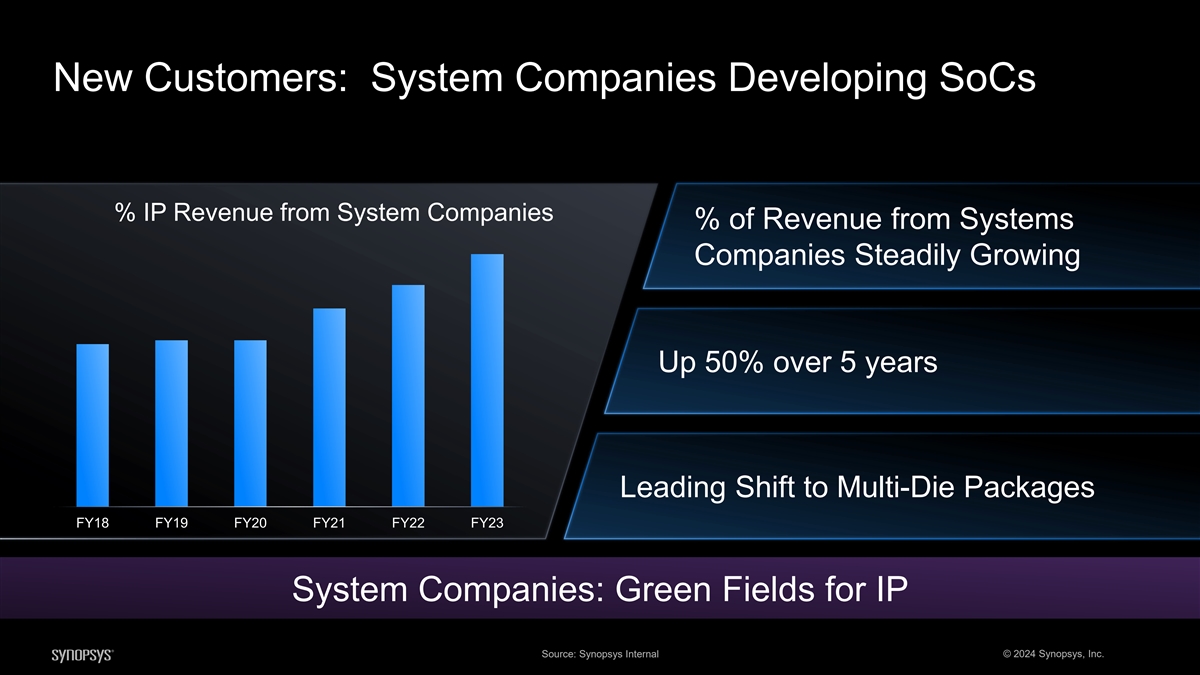
New Customers: System Companies Developing SoCs % IP Revenue from System Companies % of Revenue from Systems Companies Steadily Growing Up 50% over 5 years Leading Shift to Multi-Die Packages FY18 FY19 FY20 FY21 FY22 FY23 System Companies: Green Fields for IP Source: Synopsys Internal © 2024 Synopsys, Inc.
Supply Chain Resilience: Optionality and Optimality Synopsys Broad IP Portfolio: The On-Ramp to Foundries © 2024 Synopsys, Inc.
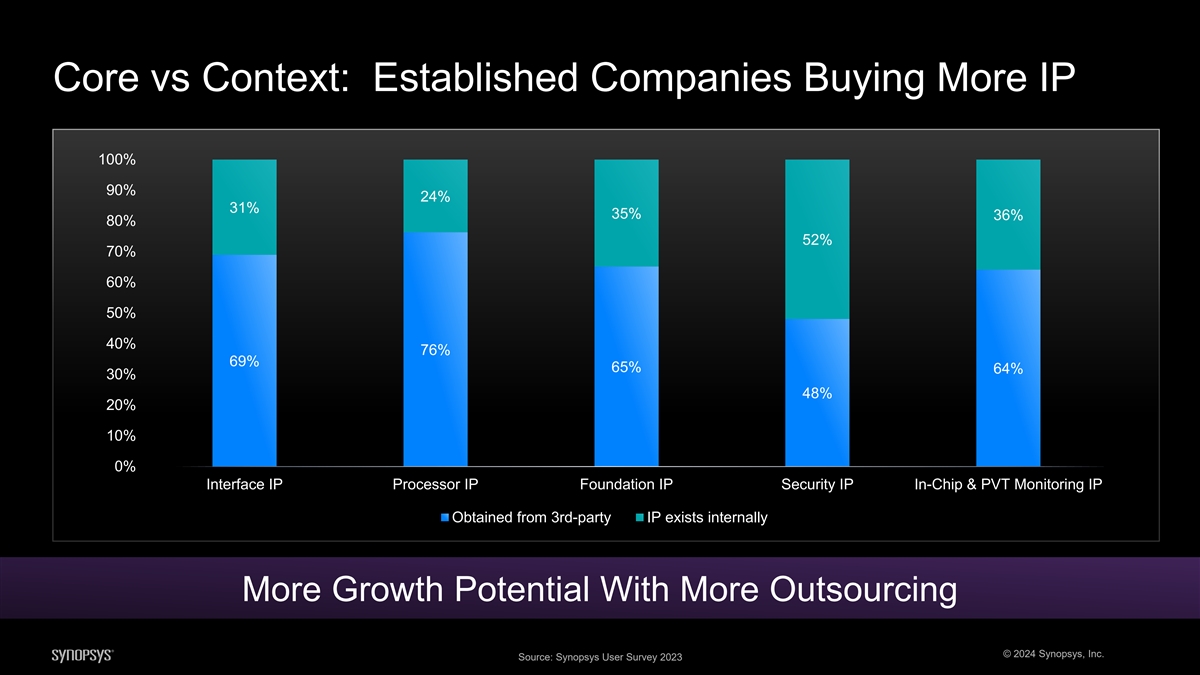
Core vs Context: Established Companies Buying More IP 100% 90% 24% 31% 35% 36% 80% 52% 70% 60% 50% 40% 76% 69% 65% 64% 30% 48% 20% 10% 0% Interface IP Processor IP Foundation IP Security IP In-Chip & PVT Monitoring IP Obtained from 3rd-party IP exists internally More Growth Potential With More Outsourcing © 2024 Synopsys, Inc. Source: Synopsys User Survey 2023
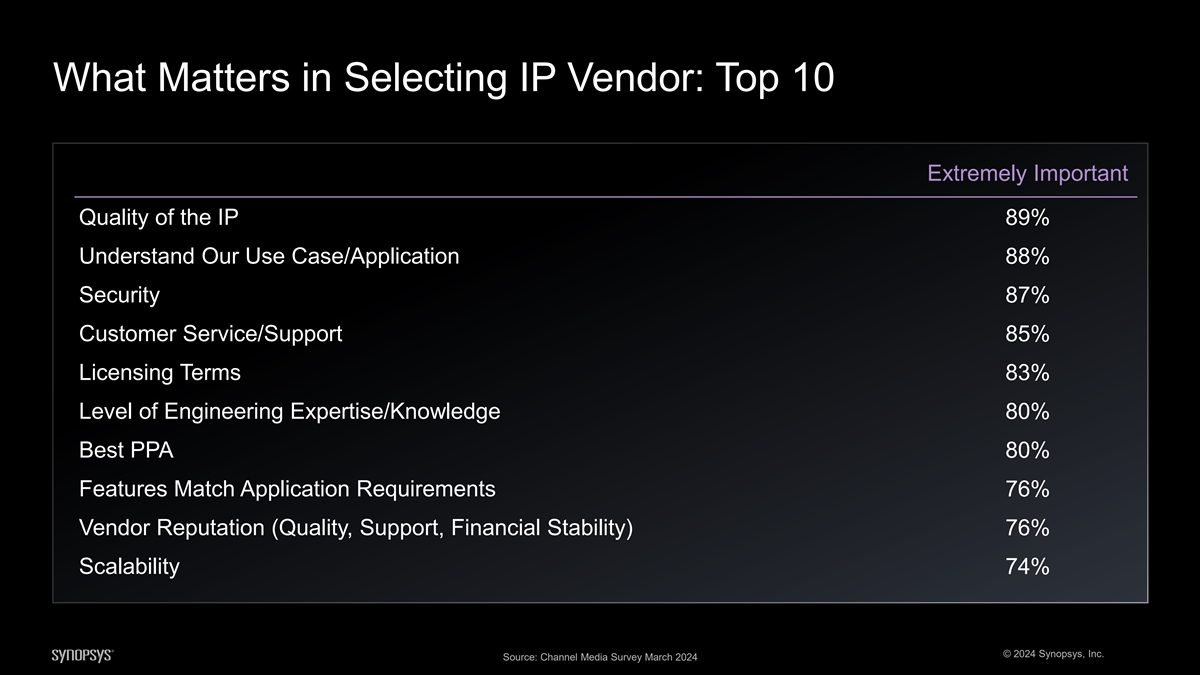
What Matters in Selecting IP Vendor: Top 10 Extremely Important Quality of the IP 89% Understand Our Use Case/Application 88% Security 87% Customer Service/Support 85% Licensing Terms 83% Level of Engineering Expertise/Knowledge 80% Best PPA 80% Features Match Application Requirements 76% Vendor Reputation (Quality, Support, Financial Stability) 76% Scalability 74% © 2024 Synopsys, Inc. Source: Channel Media Survey March 2024
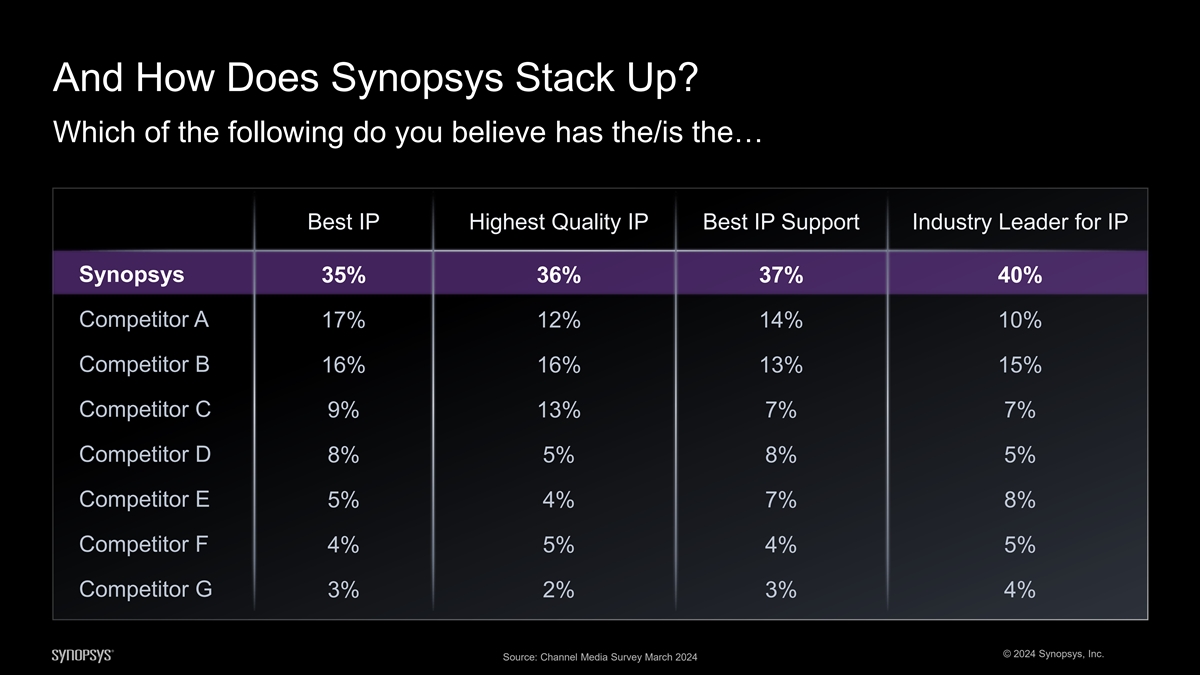
And How Does Synopsys Stack Up? Which of the following do you believe has the/is the… Best IP Highest Quality IP Best IP Support Industry Leader for IP Synopsys 35% 36% 37% 40% Competitor A 17% 12% 14% 10% Competitor B 16% 16% 13% 15% Competitor C 9% 13% 7% 7% Competitor D 8% 5% 8% 5% Competitor E 5% 4% 7% 8% Competitor F 4% 5% 4% 5% Competitor G 3% 2% 3% 4% © 2024 Synopsys, Inc. Source: Channel Media Survey March 2024
Here is What our Customers & Partners Have to Say Synopsys provides We know they Synopsys is technology to innovate, will be there to help supporting us to… build “ ““ speed design time & us achieve our automotive systems reduce risk – our most best designs. with the highest levels recent autopilot chip, of functional safety. AP4, shipped on first- pass silicon. ”” ” Rohit Vidwans, Thomas Boehm Pete Bannon Chief Eng & Manufacturing Officer Sr. VP, Auto Microcontroller VP of Low Voltage & Silicon Engineering © 2024 Synopsys, Inc.
Here is What our Customers & Partners Have to Say Synopsys’ broad IP Synopsys…our Our collaboration with portfolio helps chip primary IP partner, Synopsys leads “““ designers achieve first- has benefited our customers to their pass silicon success. mutual customers by fastest path to silicon providing access to success. high-quality IP. ” ”” Stuart Pann Jongshin Shin Cliff Hou Sr. VP & General Manager Corp Exec VP of Foundry IP Development Sr Vice President, Europe & Asia Sales © 2024 Synopsys, Inc.
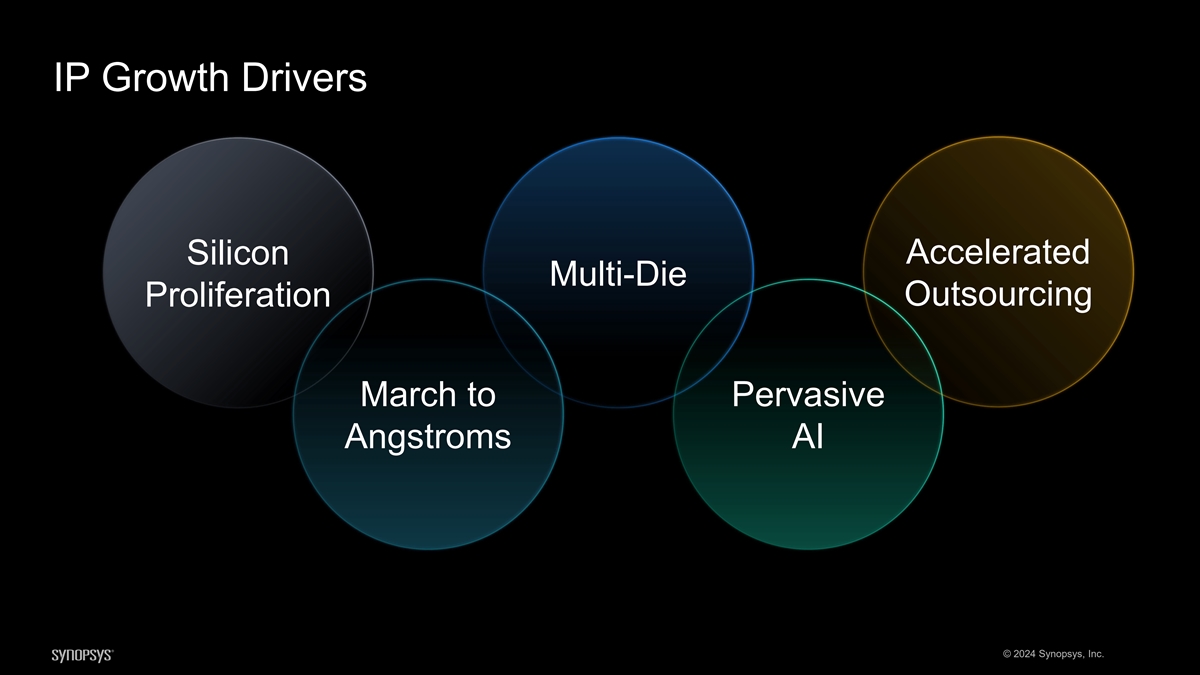
IP Growth Drivers Accelerated Silicon Multi-Die Proliferation Outsourcing March to Pervasive Angstroms AI © 2024 Synopsys, Inc.

IP Growth Drives Revenue Growth Accelerated Silicon Multi-Die Proliferation Outsourcing March to Pervasive Angstroms AI More Designs Faster Interfaces Higher ASPs More Outsourcing Sustainable Mid-Teens Growth © 2024 Synopsys, Inc.
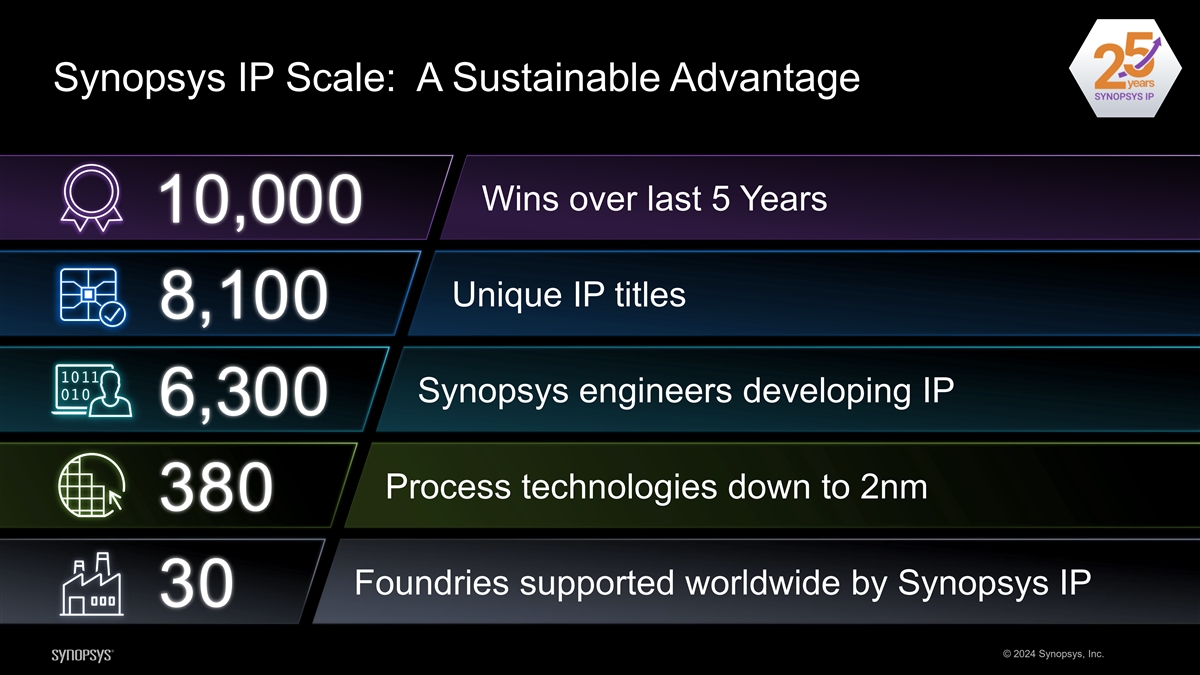
Synopsys IP Scale: A Sustainable Advantage Wins over last 5 Years 10,000 Unique IP titles 8,100 Synopsys engineers developing IP 6,300 Process technologies down to 2nm 380 Foundries supported worldwide by Synopsys IP 30 © 2024 Synopsys, Inc.
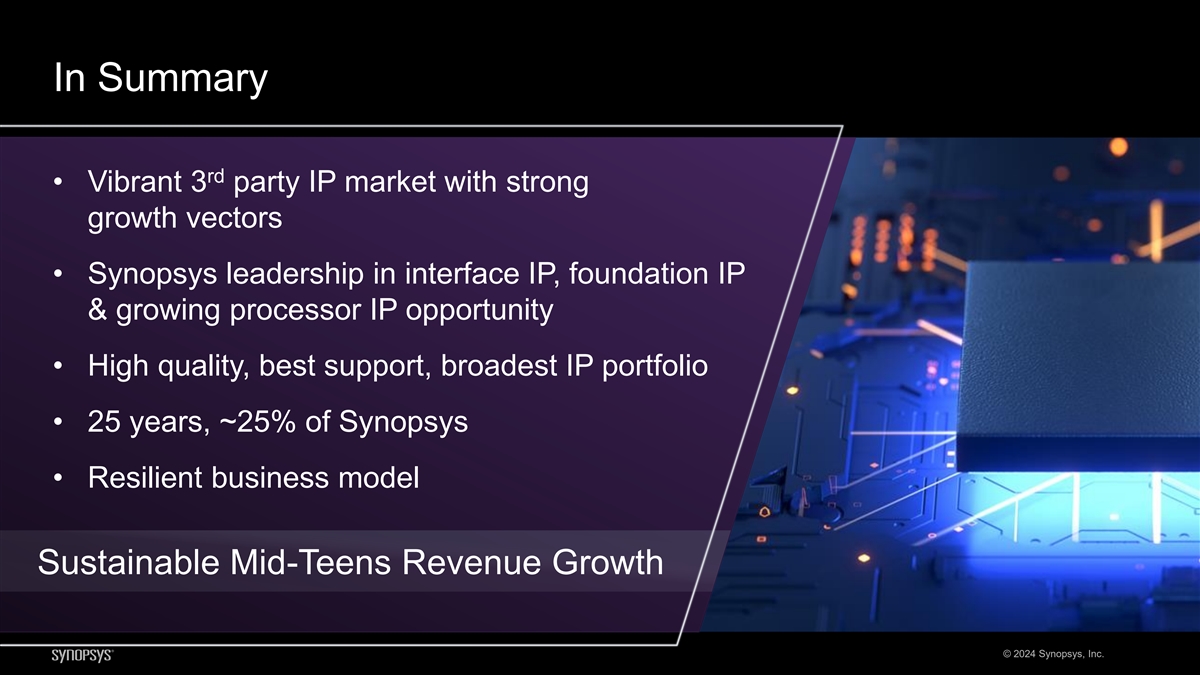
In Summary rd • Vibrant 3 party IP market with strong growth vectors • Synopsys leadership in interface IP, foundation IP & growing processor IP opportunity • High quality, best support, broadest IP portfolio • 25 years, ~25% of Synopsys • Resilient business model Sustainable Mid-Teens Revenue Growth © 2024 Synopsys, Inc.


© 2024 Synopsys, Inc.
Financial Overview Shelagh Glaser Chief Financial Officer
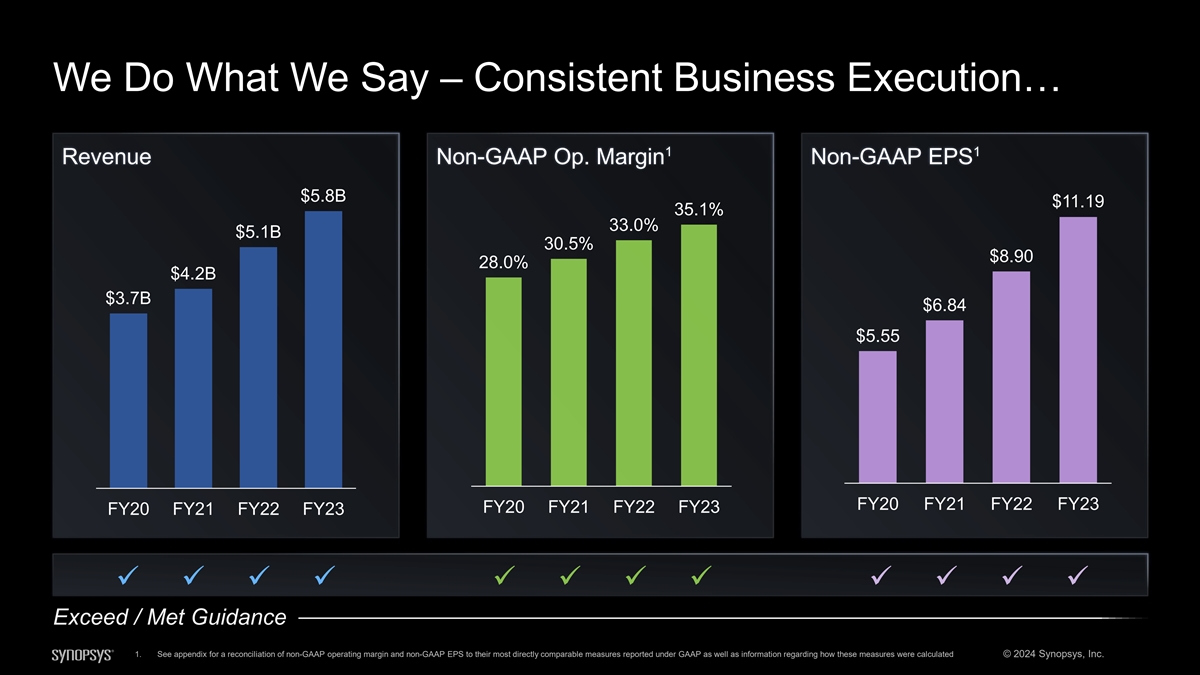
We Do What We Say – Consistent Business Execution… 1 1 Revenue Non-GAAP Op. Margin Non-GAAP EPS $5.8B $11.19 35.1% 33.0% $5.1B 30.5% $8.90 28.0% $4.2B $3.7B $6.84 $5.55 FY20 FY21 FY22 FY23 FY20 FY21 FY22 FY23 FY20 FY21 FY22 FY23 ✓✓✓✓✓✓✓✓✓✓✓✓ Exceed / Met Guidance 1. See appendix for a reconciliation of non-GAAP operating margin and non-GAAP EPS to their most directly comparable measures reported under GAAP as well as information regarding how these measures were calculated © 2024 Synopsys, Inc.
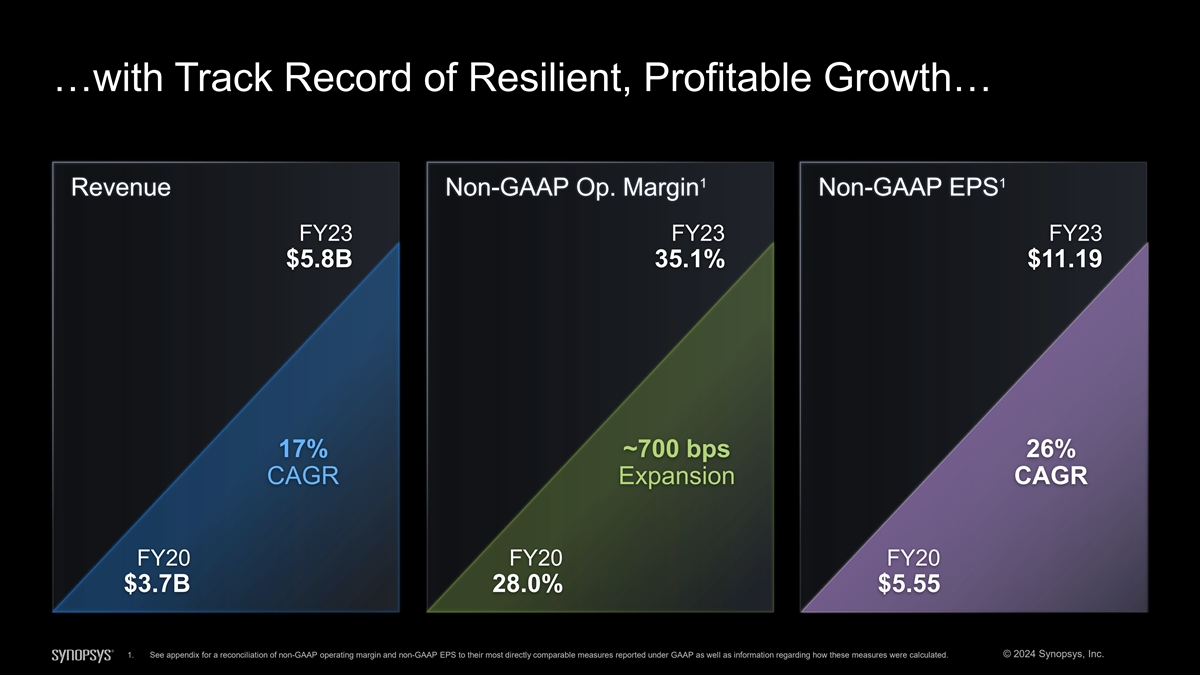
…with Track Record of Resilient, Profitable Growth… 1 1 Revenue Non-GAAP Op. Margin Non-GAAP EPS FY23 FY23 FY23 $5.8B 35.1% $11.19 17% ~700 bps 26% CAGR Expansion CAGR FY20 FY20 FY20 $3.7B 28.0% $5.55 1. See appendix for a reconciliation of non-GAAP operating margin and non-GAAP EPS to their most directly comparable measures reported under GAAP as well as information regarding how these measures were calculated. © 2024 Synopsys, Inc.
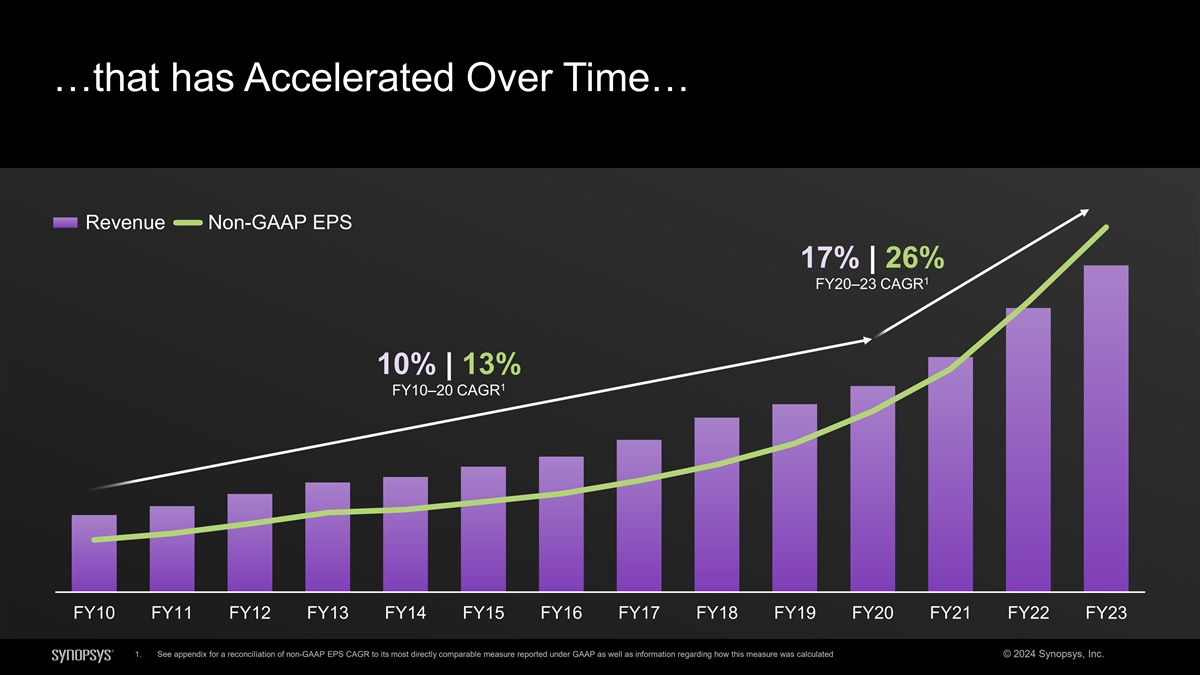
…that has Accelerated Over Time… Revenue Non-GAAP EPS 17% | 26% 1 FY20–23 CAGR 10% | 13% 1 FY10–20 CAGR FY10 FY11 FY12 FY13 FY14 FY15 FY16 FY17 FY18 FY19 FY20 FY21 FY22 FY23 1. See appendix for a reconciliation of non-GAAP EPS CAGR to its most directly comparable measure reported under GAAP as well as information regarding how this measure was calculated © 2024 Synopsys, Inc.

…Leading to Shareholder Value Creation Outperformance Synopsys outperformed 1 3-Year TSR Performance 6 out of 7 “Magnificent 7” 2 stocks over the last three years Magnificent 7 (3-Year TSR) 140% 2 136% Magnificent 7 67% SOXX S&P 500 30% S&P 500 20% Mar-21 Sep-21 Mar-22 Sep-22 Mar-23 Sep-23 Mar-24 NASDAQ 1. 3-Year Total Shareholder Return (TSR) from March 12, 2021, to March 15, 2024; 3-Year TSR is a weighted average based on each company’s market cap © 2024 Synopsys, Inc. 2. “Magnificent 7” consists of Alphabet, Amazon, Apple, Meta, Microsoft, NVIDIA and Tesla

A High-Quality Business Portfolio FY23 Revenue Design Automation Design IP SIG Total in Application in IP in EDA #1 #2 #1 Software Testing Revenue CAGR 17% 21% 15% 18% (FY21–FY23) Operating Margin 1 1 1 2 38.1% 34.5% 14.5% 35.1% (FY23) Note: Figures based on Synopsys FY results in its 10-K as filed with the SEC on December 12, 2023 1. Adjusted operating margin for each segment was determined consistent with ASC 280, Segment Reporting. See appendix for a reconciliation of items that apply for a particular segment © 2024 Synopsys, Inc. 2. See appendix for a reconciliation of non-GAAP operating margin to its most directly comparable measure reported under GAAP as well as information regarding how this measure was calculated
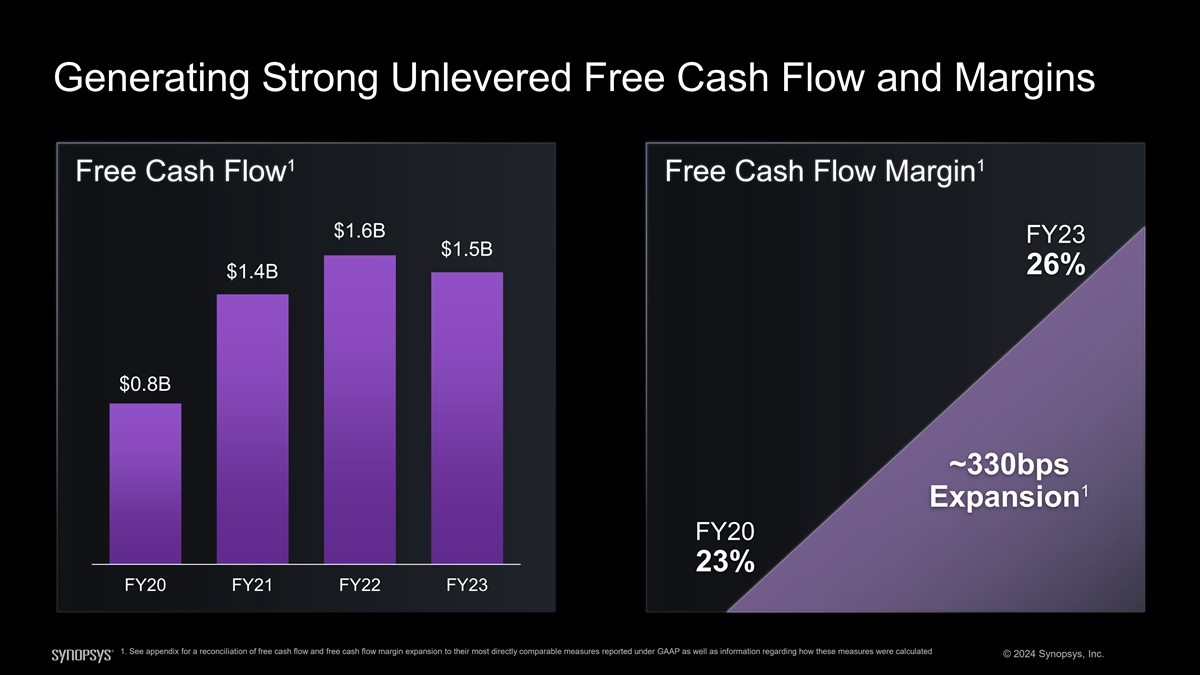
Generating Strong Unlevered Free Cash Flow and Margins 1 1 Free Cash Flow Free Cash Flow Margin $1.6B FY23 $1.5B 26% $1.4B $0.8B ~330bps 1 Expansion FY20 23% FY20 FY21 FY22 FY23 1. See appendix for a reconciliation of free cash flow and free cash flow margin expansion to their most directly comparable measures reported under GAAP as well as information regarding how these measures were calculated © 2024 Synopsys, Inc.
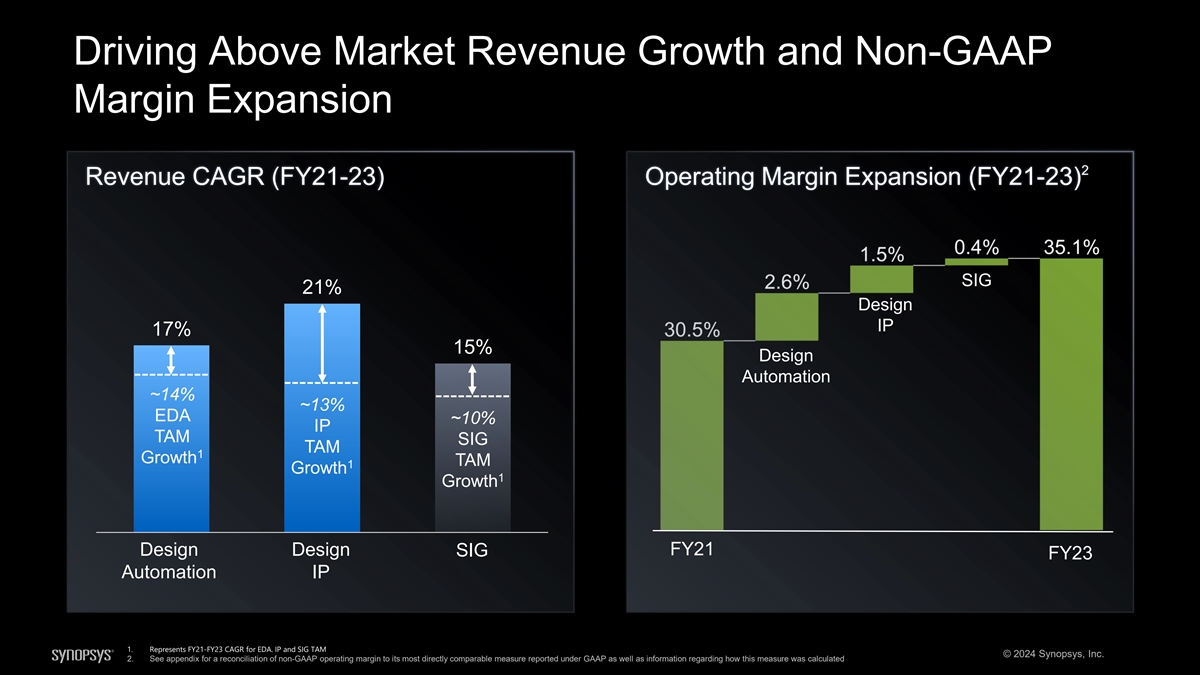
Driving Above Market Revenue Growth and Non-GAAP Margin Expansion 2 Revenue CAGR (FY21-23) Operating Margin Expansion (FY21-23) SIG 21% Design IP 17% 15% Design Automation ~14% ~13% EDA ~10% IP TAM SIG TAM 1 Growth TAM 1 Growth 1 Growth FY21 Design Design SIG FY23 Automation IP 1. Represents FY21-FY23 CAGR for EDA. IP and SIG TAM © 2024 Synopsys, Inc. 2. See appendix for a reconciliation of non-GAAP operating margin to its most directly comparable measure reported under GAAP as well as information regarding how this measure was calculated
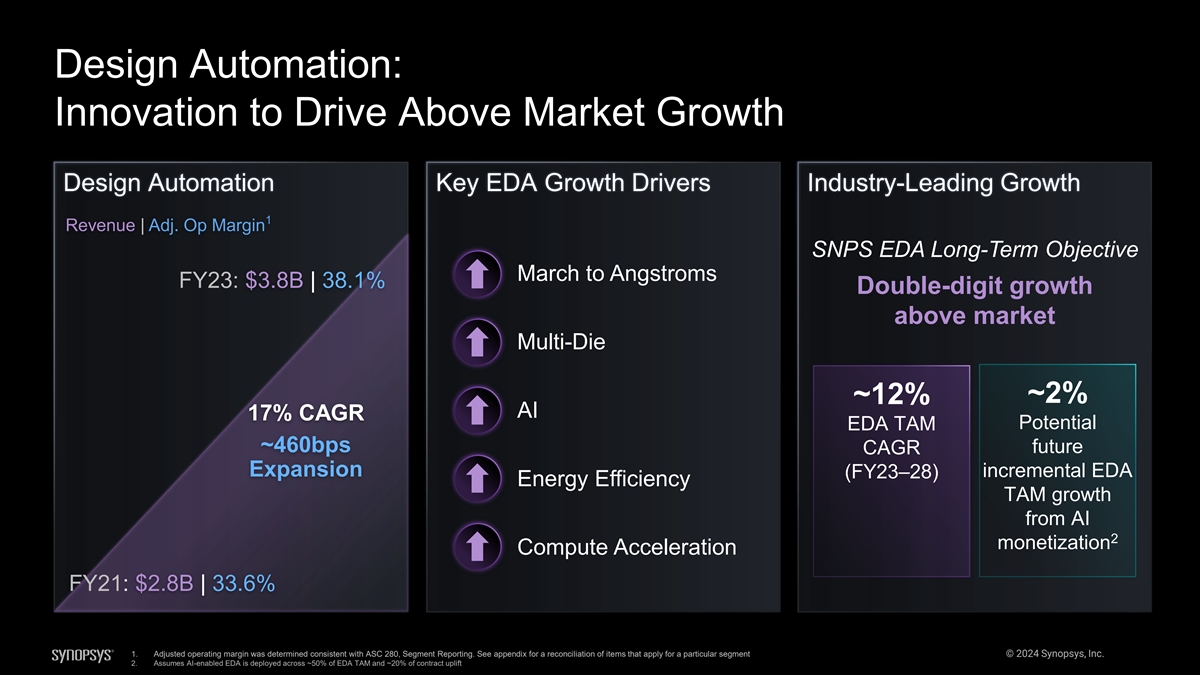
Design Automation: Innovation to Drive Above Market Growth Design Automation Key EDA Growth Drivers Industry-Leading Growth 1 Revenue | Adj. Op Margin SNPS EDA Long-Term Objective March to Angstroms FY23: $3.8B | 38.1% Double-digit growth above market Multi-Die ~2% ~12% AI 17% CAGR Potential EDA TAM ~460bps future CAGR Expansion incremental EDA (FY23–28) Energy Efficiency TAM growth from AI 2 monetization Compute Acceleration FY21: $2.8B | 33.6% 1. Adjusted operating margin was determined consistent with ASC 280, Segment Reporting. See appendix for a reconciliation of items that apply for a particular segment © 2024 Synopsys, Inc. 2. Assumes AI-enabled EDA is deployed across ~50% of EDA TAM and ~20% of contract uplift
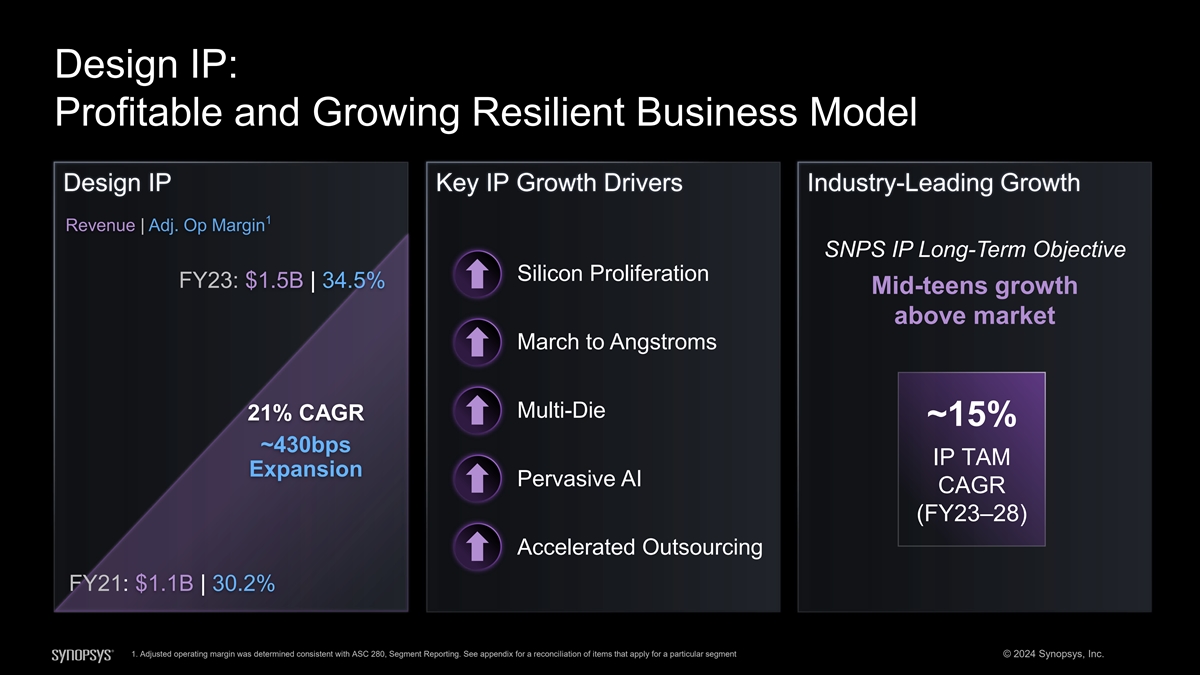
Design IP: Profitable and Growing Resilient Business Model Design IP Key IP Growth Drivers Industry-Leading Growth 1 Revenue | Adj. Op Margin SNPS IP Long-Term Objective Silicon Proliferation FY23: $1.5B | 34.5% Mid-teens growth above market March to Angstroms Multi-Die 21% CAGR ~15% ~430bps IP TAM Expansion Pervasive AI CAGR (FY23–28) Accelerated Outsourcing FY21: $1.1B | 30.2% 1. Adjusted operating margin was determined consistent with ASC 280, Segment Reporting. See appendix for a reconciliation of items that apply for a particular segment © 2024 Synopsys, Inc.
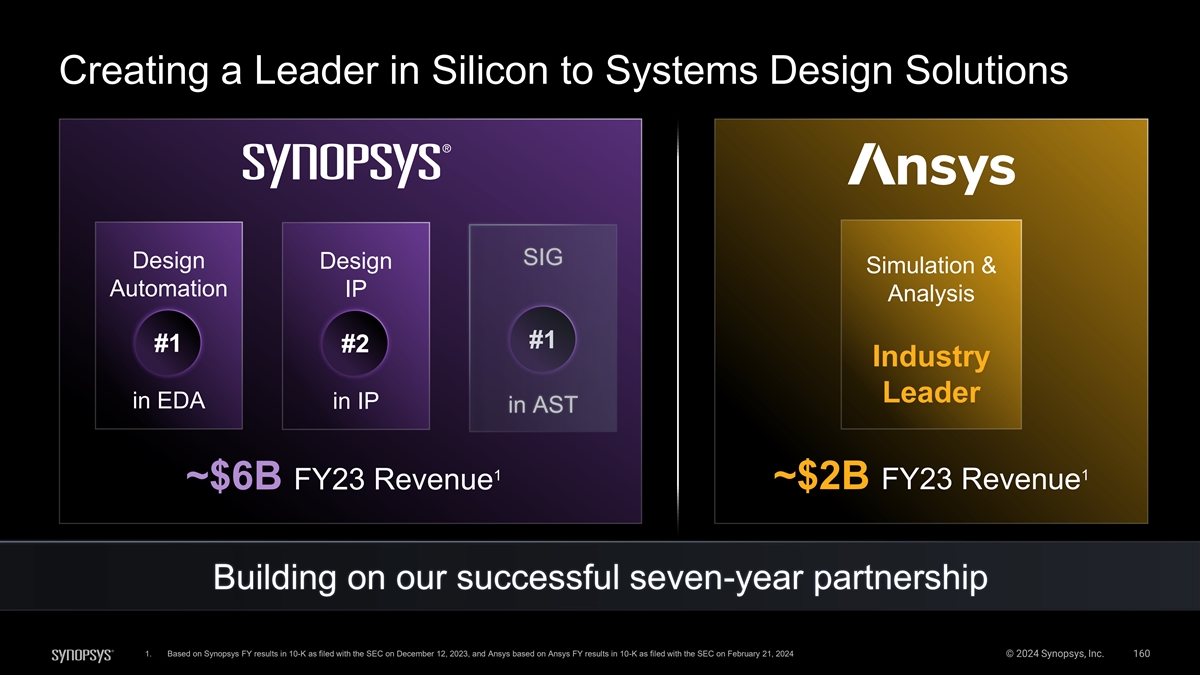
Creating a Leader in Silicon to Systems Design Solutions SIG Design Design Simulation & Automation IP Analysis #1 #1 #2 Industry Leader in EDA in IP in AST 1 1 ~$6B FY23 Revenue ~$2B FY23 Revenue Building on our successful seven-year partnership 1. Based on Synopsys FY results in 10-K as filed with the SEC on December 12, 2023, and Ansys based on Ansys FY results in 10-K as filed with the SEC on February 21, 2024 © 2024 Synopsys, Inc. 160
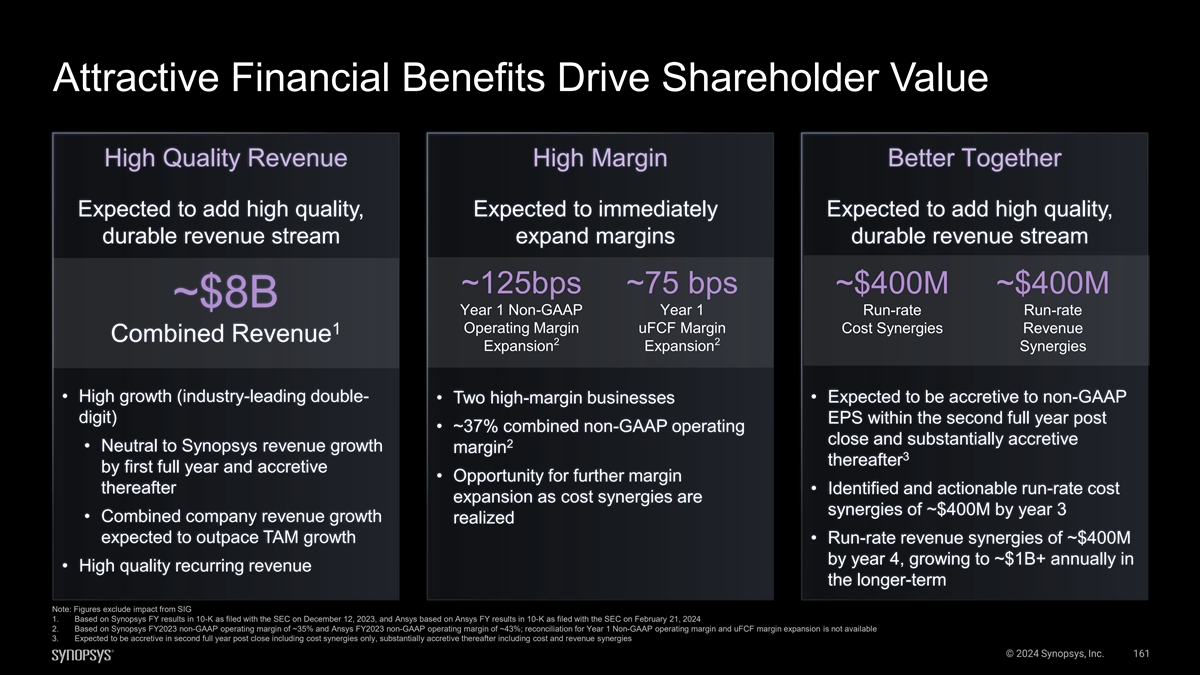
Attractive Financial Benefits Drive Shareholder Value High Quality Revenue High Margin Better Together Expected to add high quality, Expected to immediately Expected to add high quality, durable revenue stream expand margins durable revenue stream ~125bps ~75 bps ~$400M ~$400M ~$8B Year 1 Non-GAAP Year 1 Run-rate Run-rate Operating Margin uFCF Margin Cost Synergies Revenue 1 Combined Revenue 2 2 Expansion Expansion Synergies • High growth (industry-leading double- • Expected to be accretive to non-GAAP • Two high-margin businesses digit) EPS within the second full year post • ~37% combined non-GAAP operating close and substantially accretive 2 • Neutral to Synopsys revenue growth margin 3 thereafter by first full year and accretive • Opportunity for further margin thereafter • Identified and actionable run-rate cost expansion as cost synergies are synergies of ~$400M by year 3 • Combined company revenue growth realized expected to outpace TAM growth • Run-rate revenue synergies of ~$400M by year 4, growing to ~$1B+ annually in • High quality recurring revenue the longer-term Note: Figures exclude impact from SIG 1. Based on Synopsys FY results in 10-K as filed with the SEC on December 12, 2023, and Ansys based on Ansys FY results in 10-K as filed with the SEC on February 21, 2024 2. Based on Synopsys FY2023 non-GAAP operating margin of ~35% and Ansys FY2023 non-GAAP operating margin of ~43%; reconciliation for Year 1 Non-GAAP operating margin and uFCF margin expansion is not available 3. Expected to be accretive in second full year post close including cost synergies only, substantially accretive thereafter including cost and revenue synergies © 2024 Synopsys, Inc. 161

Highly Achievable, Identified Synergies and Potential for More ~$400M ~$400M ~$1B+ of run-rate cost synergies of run-rate revenue of annual revenue synergies expected by year 3 synergies expected by year 4 expected over longer-term • Streamlining and realizing the benefits • Integration of multi-physics system • Full potential realization of current of scale analysis for advanced chip design identified synergies and TAM growth • Expansion of direct account coverage • Integration of engineering platforms and • Significant potential for additional for Ansys portfolio in Semiconductor / technology reuse for AI and Cloud revenue synergies from High-Tech sector • Further penetration beyond • Joint semiconductor solutions (e.g., Semiconductor / High-Tech sector Analog/RF) • Accelerated expansion in Automotive, • New joint innovative system solutions Aerospace, and Industrial Equipment (e.g., digital twin, functional safety) We have identified specific, substantial and actionable cost and revenue synergies © 2024 Synopsys, Inc. Note: Figures exclude impact from SIG
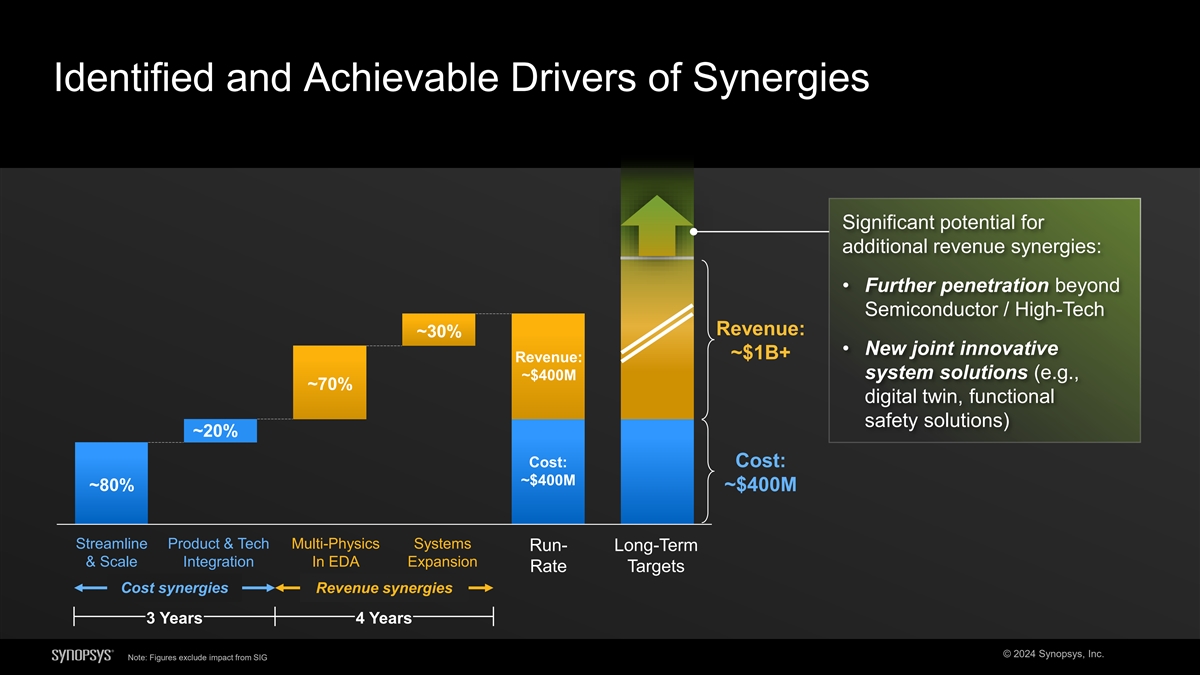
Identified and Achievable Drivers of Synergies Significant potential for additional revenue synergies: • Further penetration beyond Semiconductor / High-Tech Revenue: ~30% • New joint innovative ~$1B+ Revenue: system solutions (e.g., ~$400M ~70% digital twin, functional safety solutions) ~20% Cost: Cost: ~$400M ~80% ~$400M Streamline Product & Tech Multi-Physics Systems Run- Long-Term & Scale Integration In EDA Expansion Rate Targets Cost synergies Revenue synergies 3 Years 4 Years © 2024 Synopsys, Inc. Note: Figures exclude impact from SIG

Strong Combined Balance Sheet with Strong Free Cash Flow Generation Supporting Financial Flexibility Expected Rapid Financial Flexibility for Disciplined Capital Allocation 1 Deleveraging • Expect rapid deleveraging to <2x within 2 Debt / Adj. EBITDA years post close Deleveraging • Long-term gross leverage target of <1x 3.9x • Maintain investment grade credit rating • Temporary suspension of share buybacks Share Buybacks <2x • Expected to resume as leverage approaches <2x <1x • Focused on successful integration M&A • Strong free cash flow to support financial At Close 2 Years Long-Term flexibility for future M&A Post Close Target 1. Does not include any proceeds from potential divestitures © 2024 Synopsys, Inc.
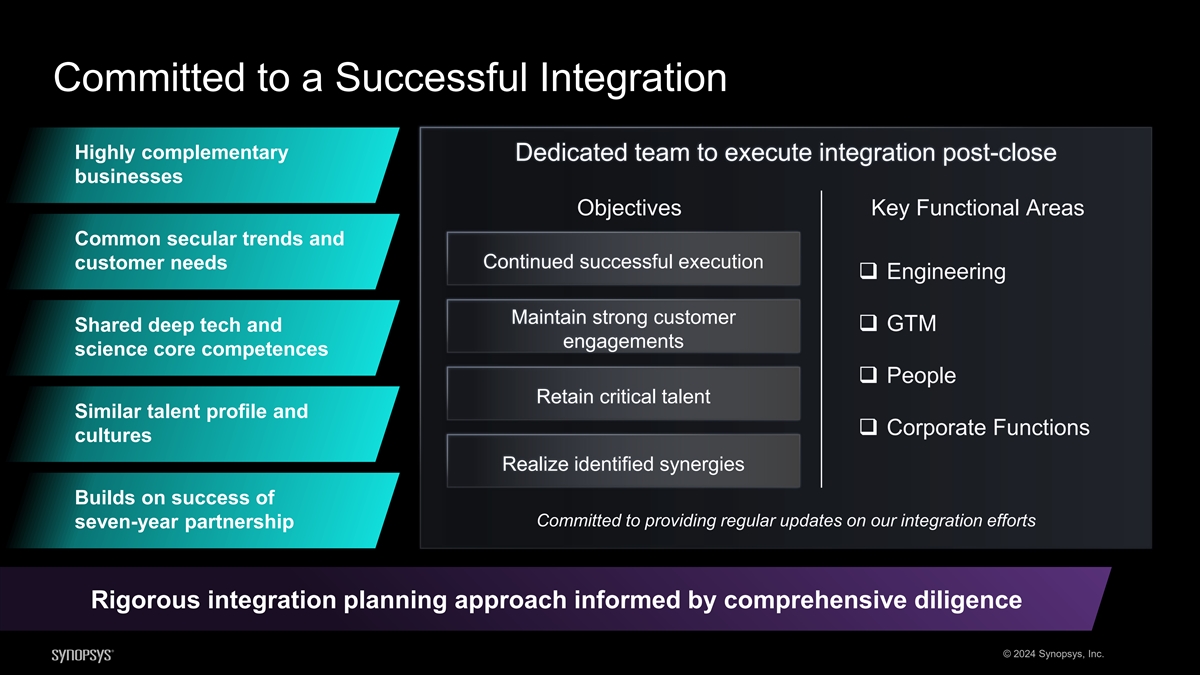
Committed to a Successful Integration Highly complementary Dedicated team to execute integration post-close businesses Objectives Key Functional Areas Common secular trends and Continued successful execution customer needs ❑ Engineering Maintain strong customer ❑ GTM Shared deep tech and engagements science core competences ❑ People Retain critical talent Similar talent profile and ❑ Corporate Functions cultures Realize identified synergies Builds on success of Committed to providing regular updates on our integration efforts seven-year partnership Rigorous integration planning approach informed by comprehensive diligence © 2024 Synopsys, Inc.

Disciplined Capital Allocation: Strategic Portfolio Decision Compelling growth opportunities in Design Automation and Design IP Announced in Q4’23 exploration of strategic alternatives for Software Integrity Group, the leader in application security testing Completed a comprehensive review of alternatives and have decided to pursue the sale of SIG FY 2024 guidance updated to reflect the strength of Design Automation and Design IP, and discontinued operations of Software Integrity Group © 2024 Synopsys, Inc.
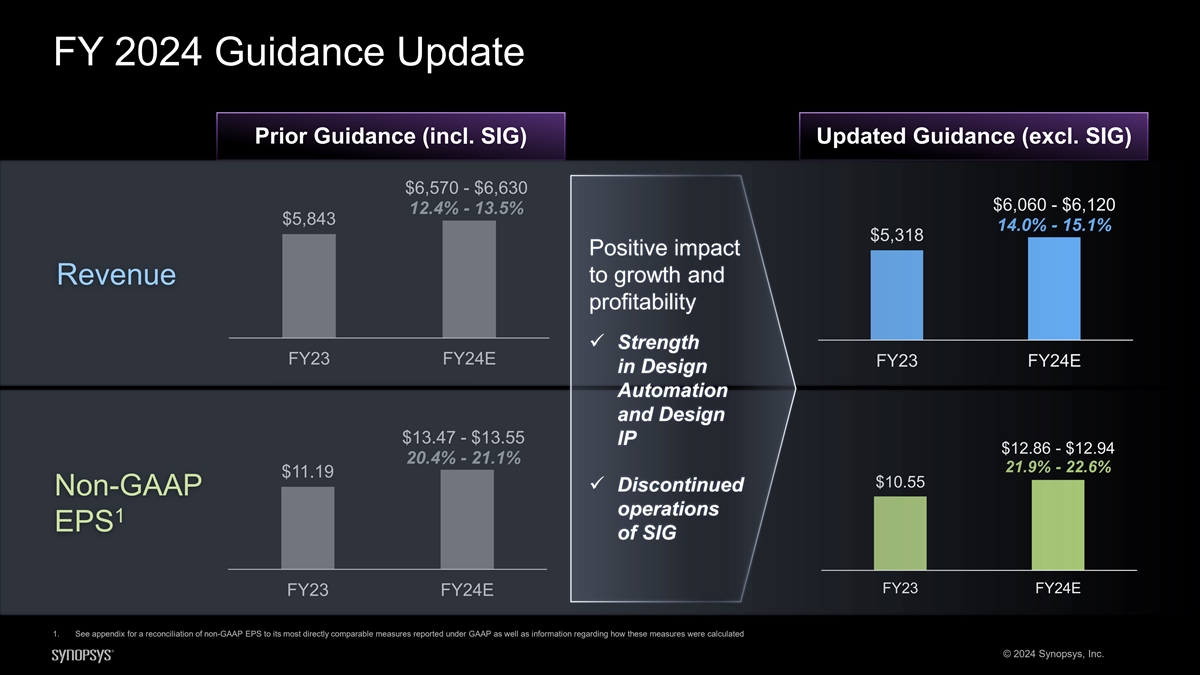
FY 2024 Guidance Update Prior Guidance (incl. SIG) Updated Guidance (excl. SIG) $6,570 - $6,630 $6,060 - $6,120 12.4% - 13.5% $5,843 14.0% - 15.1% $5,318 Positive impact to growth and Revenue profitability ✓ Strength FY23 FY24E FY23 FY24E in Design Automation and Design $13.47 - $13.55 IP $12.86 - $12.94 20.4% - 21.1% 21.9% - 22.6% $11.19 $10.55 ✓ Discontinued Non-GAAP operations 1 EPS of SIG FY23 FY24E FY23 FY24E 1. See appendix for a reconciliation of non-GAAP EPS to its most directly comparable measures reported under GAAP as well as information regarding how these measures were calculated © 2024 Synopsys, Inc.
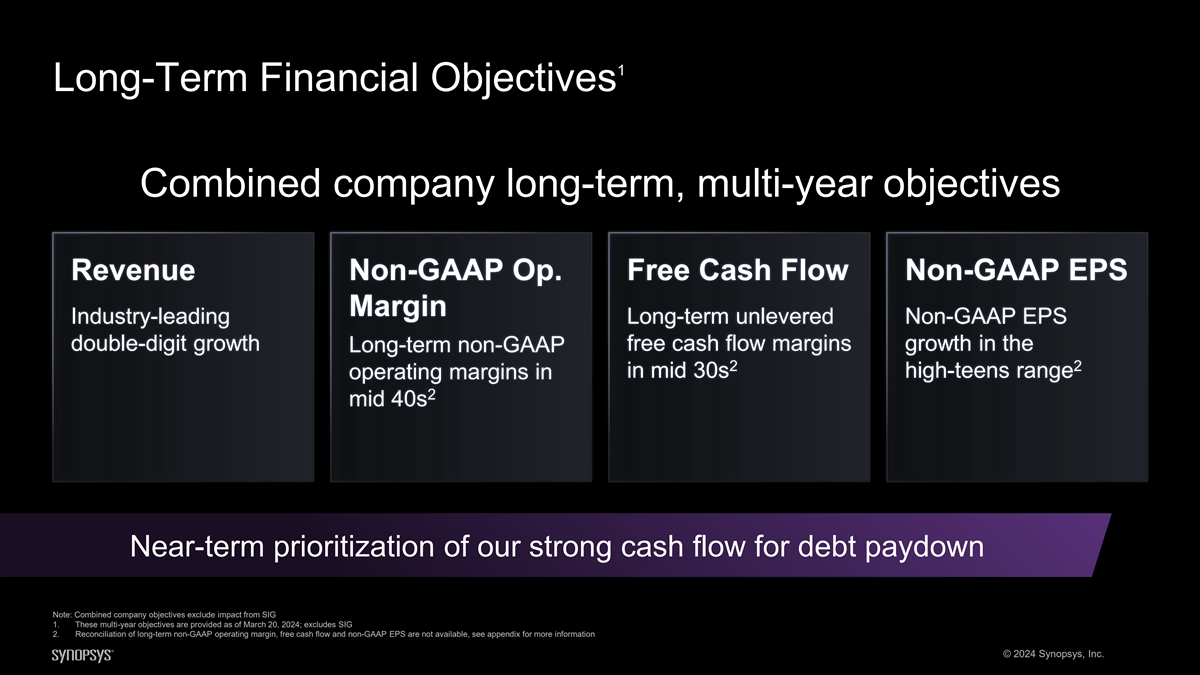
1 Long-Term Financial Objectives Combined company long-term, multi-year objectives Revenue Non-GAAP Op. Free Cash Flow Non-GAAP EPS Margin Industry-leading Long-term unlevered Non-GAAP EPS double-digit growth free cash flow margins growth in the Long-term non-GAAP 2 2 in mid 30s high-teens range operating margins in 2 mid 40s Near-term prioritization of our strong cash flow for debt paydown Note: Combined company objectives exclude impact from SIG 1. These multi-year objectives are provided as of March 20, 2024; excludes SIG 2. Reconciliation of long-term non-GAAP operating margin, free cash flow and non-GAAP EPS are not available, see appendix for more information © 2024 Synopsys, Inc.
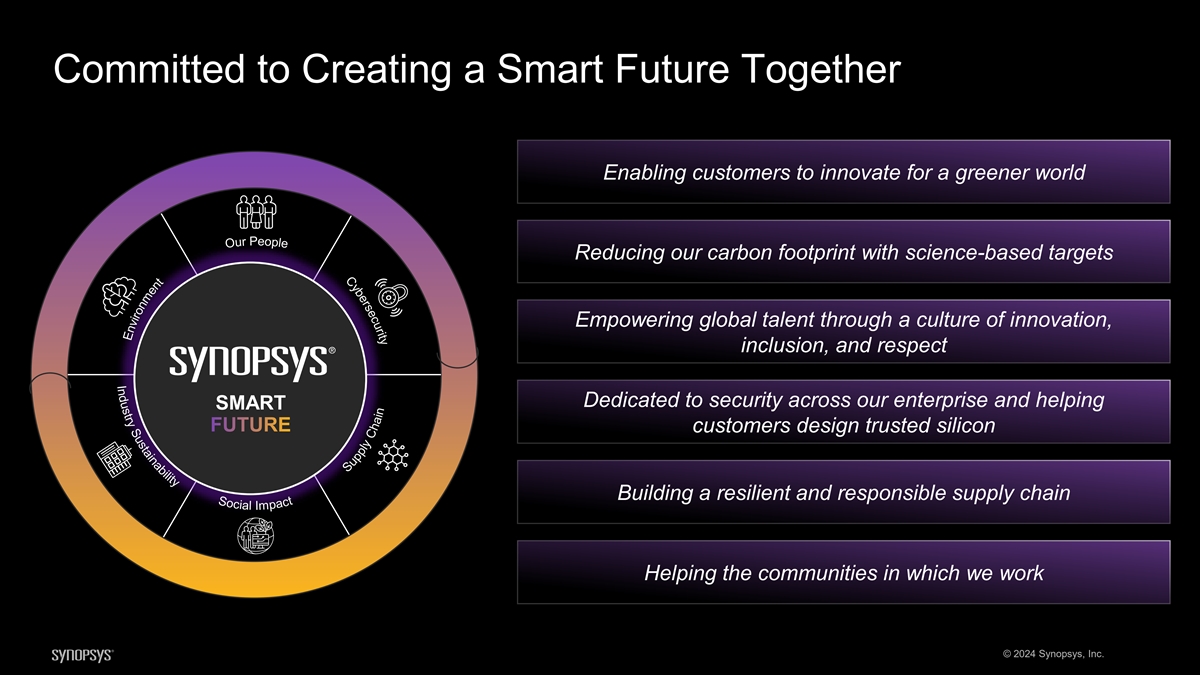
I n d u y s t t i r r y u c S e s u r s e t b a i y n C a b i l i t y S o e c l i p a o l e Committed to Creating a Smart Future Together Enabling customers to innovate for a greener world Reducing our carbon footprint with science-based targets Empowering global talent through a culture of innovation, inclusion, and respect Dedicated to security across our enterprise and helping SMART FUTURE customers design trusted silicon Building a resilient and responsible supply chain Helping the communities in which we work © 2024 Synopsys, Inc. I P m r u p O a c t S t u n p e p m l y n o C r i v h n a E i n
Confidence in Trajectory Delivering outsized shareholder value Industry-leading, resilient growth Expanding and accelerating margins Balanced, disciplined capital allocation priorities © 2024 Synopsys, Inc.


© 2024 Synopsys, Inc.

JOIN US AT SNUG PUB! Synopsys Confidential Information

© 2024 Synopsys, Inc.

Appendix © 2024 Synopsys, Inc. 175
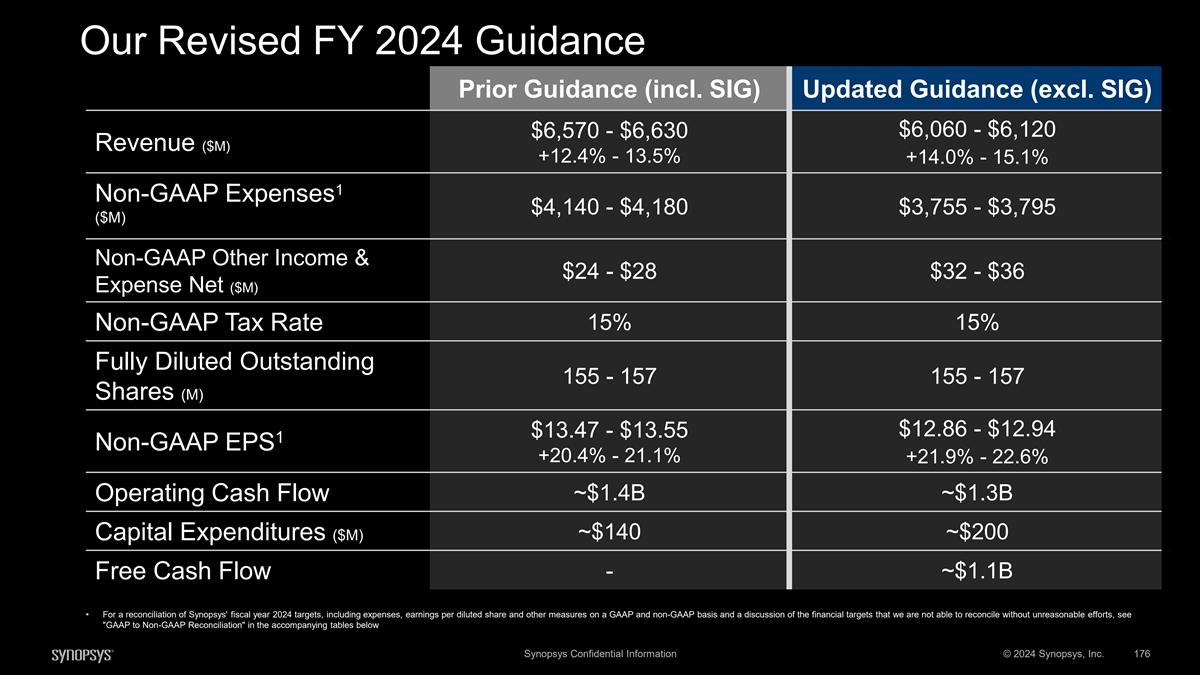
Our Revised FY 2024 Guidance Prior Guidance (incl. SIG) Updated Guidance (excl. SIG) $6,060 - $6,120 $6,570 - $6,630 Revenue ($M) +12.4% - 13.5% +14.0% - 15.1% 1 Non-GAAP Expenses $4,140 - $4,180 $3,755 - $3,795 ($M) Non-GAAP Other Income & $24 - $28 $32 - $36 Expense Net ($M) 15% 15% Non-GAAP Tax Rate Fully Diluted Outstanding 155 - 157 155 - 157 Shares (M) $12.86 - $12.94 $13.47 - $13.55 1 Non-GAAP EPS +20.4% - 21.1% +21.9% - 22.6% ~$1.4B ~$1.3B Operating Cash Flow Capital Expenditures ($M) ~$140 ~$200 - ~$1.1B Free Cash Flow • For a reconciliation of Synopsys' fiscal year 2024 targets, including expenses, earnings per diluted share and other measures on a GAAP and non-GAAP basis and a discussion of the financial targets that we are not able to reconcile without unreasonable efforts, see GAAP to Non-GAAP Reconciliation in the accompanying tables below Synopsys Confidential Information © 2024 Synopsys, Inc. 176
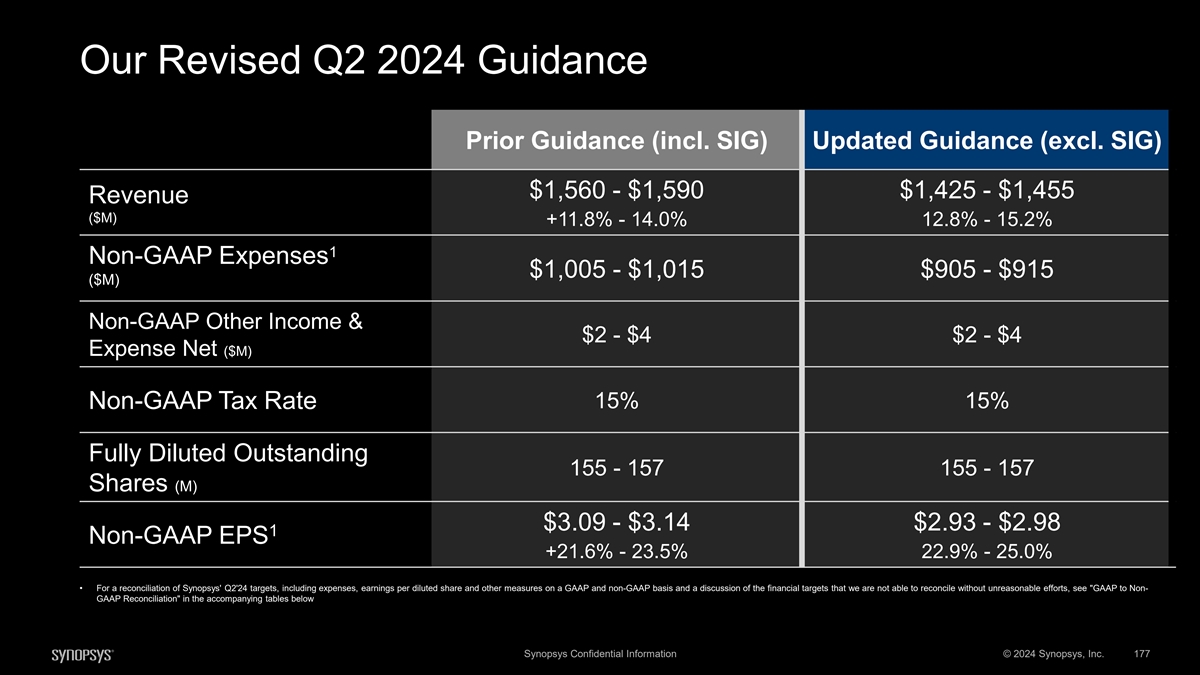
Our Revised Q2 2024 Guidance Prior Guidance (incl. SIG) Updated Guidance (excl. SIG) $1,560 - $1,590 $1,425 - $1,455 Revenue ($M) +11.8% - 14.0% 12.8% - 15.2% 1 Non-GAAP Expenses $1,005 - $1,015 $905 - $915 ($M) Non-GAAP Other Income & $2 - $4 $2 - $4 Expense Net ($M) Non-GAAP Tax Rate 15% 15% Fully Diluted Outstanding 155 - 157 155 - 157 Shares (M) $3.09 - $3.14 $2.93 - $2.98 1 Non-GAAP EPS +21.6% - 23.5% 22.9% - 25.0% • For a reconciliation of Synopsys' Q2'24 targets, including expenses, earnings per diluted share and other measures on a GAAP and non-GAAP basis and a discussion of the financial targets that we are not able to reconcile without unreasonable efforts, see GAAP to Non- GAAP Reconciliation in the accompanying tables below Synopsys Confidential Information © 2024 Synopsys, Inc. 177
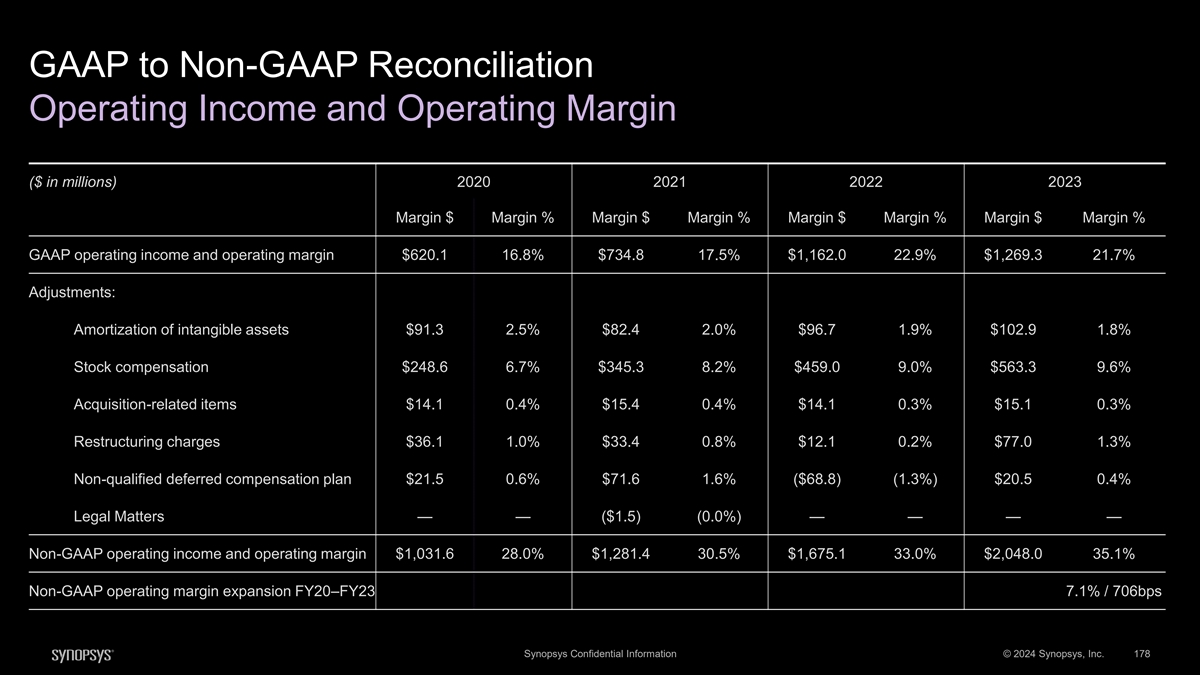
GAAP to Non-GAAP Reconciliation Operating Income and Operating Margin ($ in millions) 2020 2021 2022 2023 Margin $ Margin % Margin $ Margin % Margin $ Margin % Margin $ Margin % GAAP operating income and operating margin $620.1 16.8% $734.8 17.5% $1,162.0 22.9% $1,269.3 21.7% Adjustments: Amortization of intangible assets $91.3 2.5% $82.4 2.0% $96.7 1.9% $102.9 1.8% Stock compensation $248.6 6.7% $345.3 8.2% $459.0 9.0% $563.3 9.6% Acquisition-related items $14.1 0.4% $15.4 0.4% $14.1 0.3% $15.1 0.3% Restructuring charges $36.1 1.0% $33.4 0.8% $12.1 0.2% $77.0 1.3% Non-qualified deferred compensation plan $21.5 0.6% $71.6 1.6% ($68.8) (1.3%) $20.5 0.4% Legal Matters — — ($1.5) (0.0%) — — — — Non-GAAP operating income and operating margin $1,031.6 28.0% $1,281.4 30.5% $1,675.1 33.0% $2,048.0 35.1% Non-GAAP operating margin expansion FY20–FY23 7.1% / 706bps Synopsys Confidential Information © 2024 Synopsys, Inc. 178
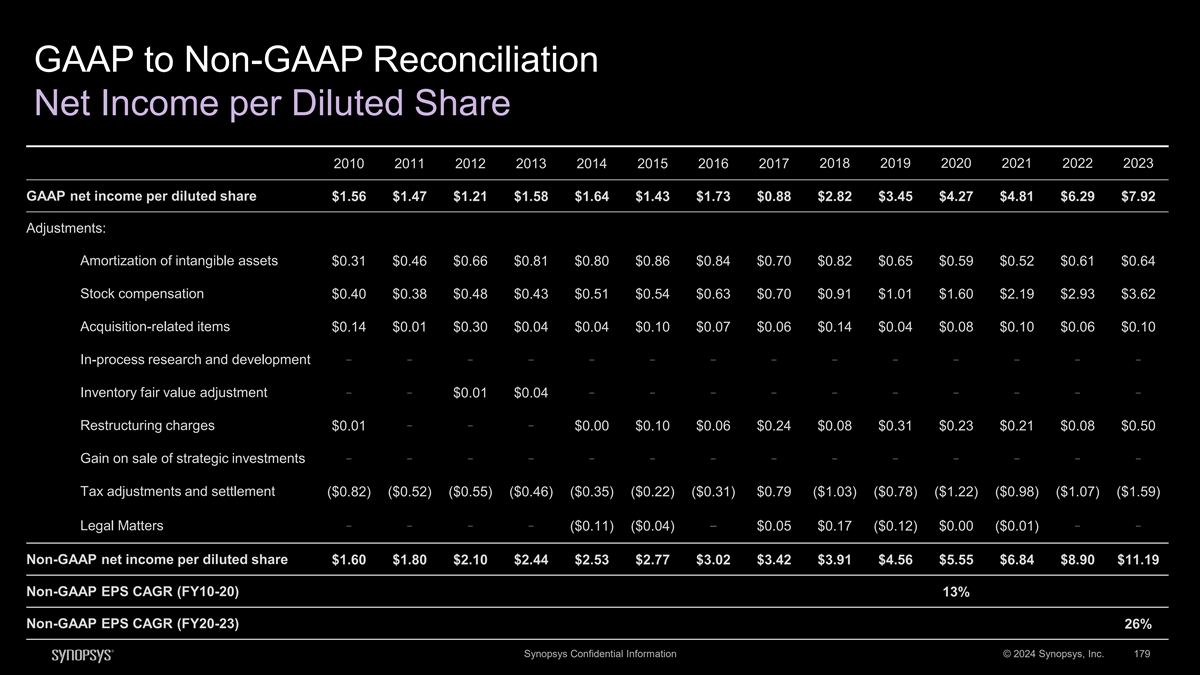
GAAP to Non-GAAP Reconciliation Net Income per Diluted Share 2018 2019 2020 2021 2022 2023 2010 2011 2012 2013 2014 2015 2016 2017 GAAP net income per diluted share $1.56 $1.47 $1.21 $1.58 $1.64 $1.43 $1.73 $0.88 $2.82 $3.45 $4.27 $4.81 $6.29 $7.92 Adjustments: Amortization of intangible assets $0.31 $0.46 $0.66 $0.81 $0.80 $0.86 $0.84 $0.70 $0.82 $0.65 $0.59 $0.52 $0.61 $0.64 Stock compensation $0.40 $0.38 $0.48 $0.43 $0.51 $0.54 $0.63 $0.70 $0.91 $1.01 $1.60 $2.19 $2.93 $3.62 Acquisition-related items $0.14 $0.01 $0.30 $0.04 $0.04 $0.10 $0.07 $0.06 $0.14 $0.04 $0.08 $0.10 $0.06 $0.10 — — — — — — — — — — — — — — In-process research and development — — — — — — — — — — — — Inventory fair value adjustment $0.01 $0.04 — — — Restructuring charges $0.01 $0.00 $0.10 $0.06 $0.24 $0.08 $0.31 $0.23 $0.21 $0.08 $0.50 — — — — — — — — — — — — — — Gain on sale of strategic investments Tax adjustments and settlement ($0.82) ($0.52) ($0.55) ($0.46) ($0.35) ($0.22) ($0.31) $0.79 ($1.03) ($0.78) ($1.22) ($0.98) ($1.07) ($1.59) — — — — — — — Legal Matters ($0.11) ($0.04) $0.05 $0.17 ($0.12) $0.00 ($0.01) Non-GAAP net income per diluted share $1.60 $1.80 $2.10 $2.44 $2.53 $2.77 $3.02 $3.42 $3.91 $4.56 $5.55 $6.84 $8.90 $11.19 Non-GAAP EPS CAGR (FY10-20) 13% Non-GAAP EPS CAGR (FY20-23) 26% Synopsys Confidential Information © 2024 Synopsys, Inc. 179
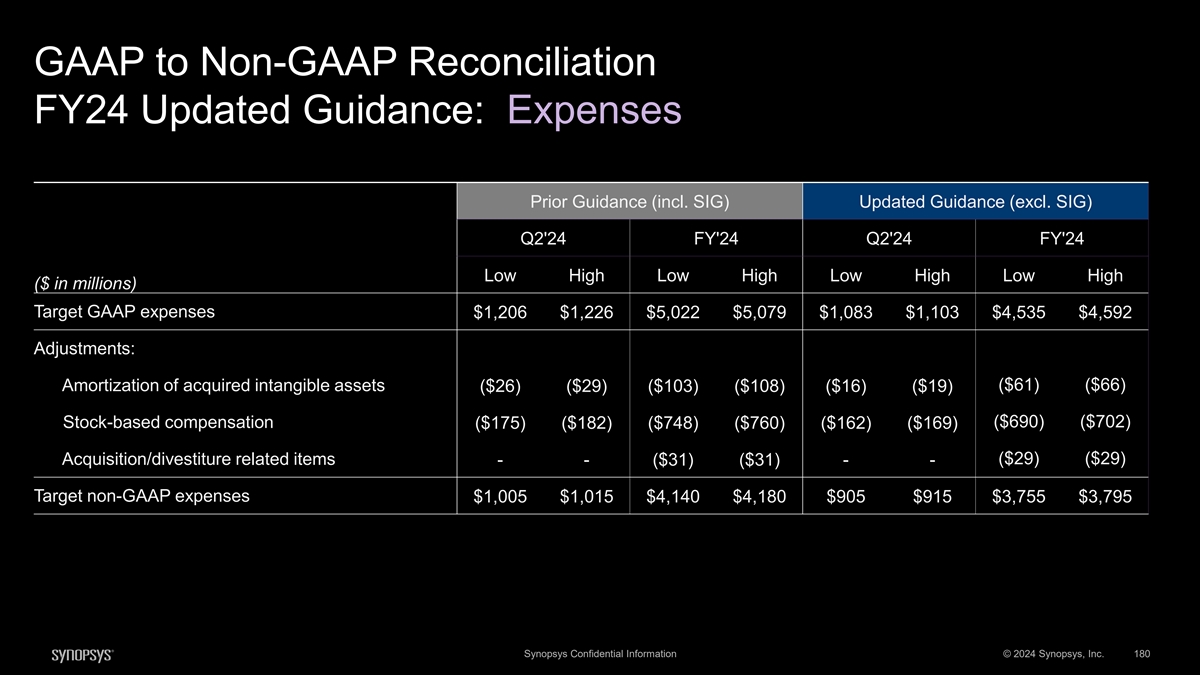
GAAP to Non-GAAP Reconciliation FY24 Updated Guidance: Expenses Prior Guidance (incl. SIG) Updated Guidance (excl. SIG) Q2'24 FY'24 Q2'24 FY'24 Low High Low High Low High Low High ($ in millions) Target GAAP expenses $1,206 $1,226 $5,022 $5,079 $1,083 $1,103 $4,535 $4,592 Adjustments: Amortization of acquired intangible assets ($61) ($66) ($26) ($29) ($103) ($108) ($16) ($19) ($690) ($702) Stock-based compensation ($175) ($182) ($748) ($760) ($162) ($169) Acquisition/divestiture related items ($29) ($29) - - ($31) ($31) - - Target non-GAAP expenses $1,005 $1,015 $4,140 $4,180 $905 $915 $3,755 $3,795 Synopsys Confidential Information © 2024 Synopsys, Inc. 180
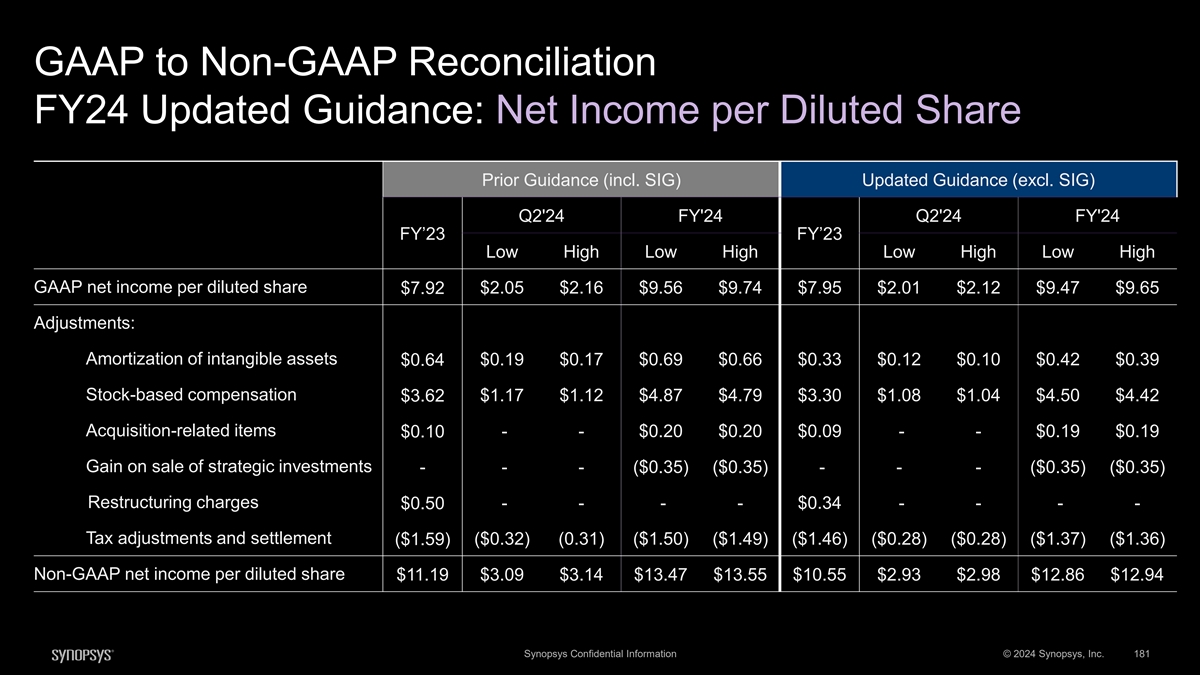
GAAP to Non-GAAP Reconciliation FY24 Updated Guidance: Net Income per Diluted Share Prior Guidance (incl. SIG) Updated Guidance (excl. SIG) Q2'24 FY'24 Q2'24 FY'24 FY’23 FY’23 Low High Low High Low High Low High GAAP net income per diluted share $7.92 $2.05 $2.16 $9.56 $9.74 $7.95 $2.01 $2.12 $9.47 $9.65 Adjustments: Amortization of intangible assets $0.19 $0.17 $0.69 $0.66 $0.33 $0.12 $0.10 $0.42 $0.39 $0.64 Stock-based compensation $3.62 $1.17 $1.12 $4.87 $4.79 $3.30 $1.08 $1.04 $4.50 $4.42 Acquisition-related items $0.10 - - $0.20 $0.20 $0.09 - - $0.19 $0.19 Gain on sale of strategic investments - - - ($0.35) ($0.35) - - - ($0.35) ($0.35) Restructuring charges - - - - $0.34 - - - - $0.50 Tax adjustments and settlement ($1.59) ($0.32) (0.31) ($1.50) ($1.49) ($1.46) ($0.28) ($0.28) ($1.37) ($1.36) Non-GAAP net income per diluted share $11.19 $3.09 $3.14 $13.47 $13.55 $10.55 $2.93 $2.98 $12.86 $12.94 Synopsys Confidential Information © 2024 Synopsys, Inc. 181
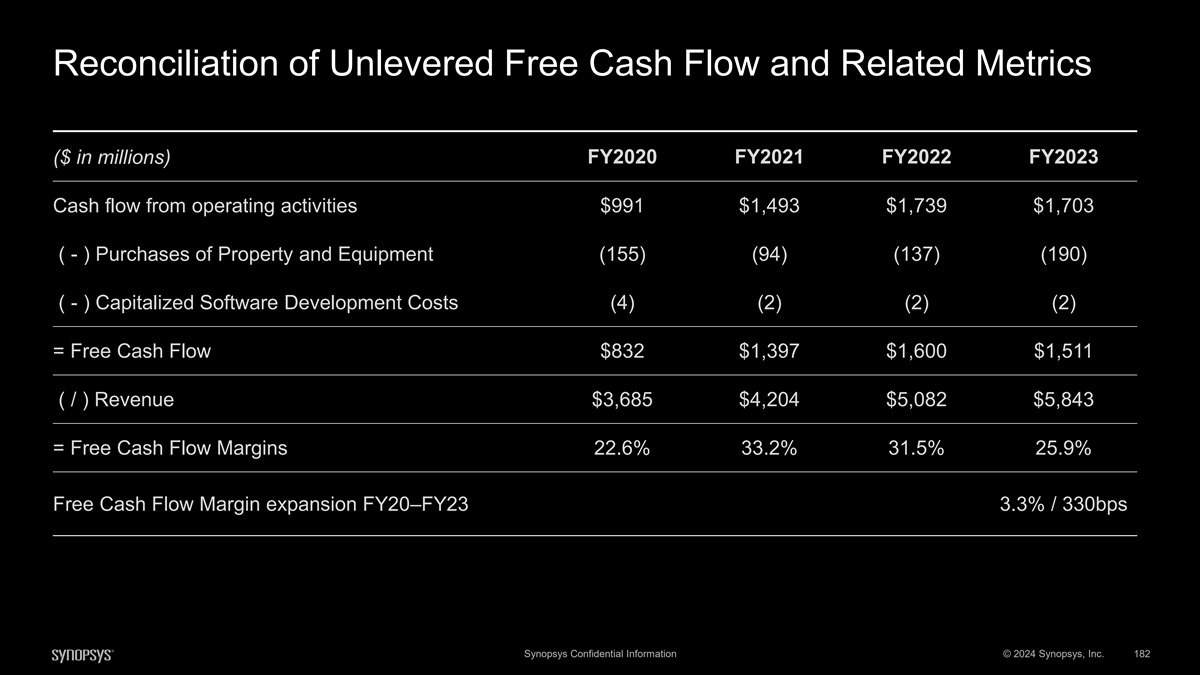
Reconciliation of Unlevered Free Cash Flow and Related Metrics ($ in millions) FY2020 FY2021 FY2022 FY2023 Cash flow from operating activities $991 $1,493 $1,739 $1,703 ( - ) Purchases of Property and Equipment (155) (94) (137) (190) ( - ) Capitalized Software Development Costs (4) (2) (2) (2) = Free Cash Flow $832 $1,397 $1,600 $1,511 ( / ) Revenue $3,685 $4,204 $5,082 $5,843 = Free Cash Flow Margins 22.6% 33.2% 31.5% 25.9% Free Cash Flow Margin expansion FY20–FY23 3.3% / 330bps Synopsys Confidential Information © 2024 Synopsys, Inc. 182

1, 2 Business Segment Reporting UNAUDITED, IN MILLIONS FY 2021 FY 2022 FY 2023 Revenue by segment Design automation $2,754.7 $3,300.2 $3,775.3 % of total 65.5% 64.9% 64.6% Design IP $1,055.7 $1,315.5 $1,542.7 % of total 25.1% 25.9% 26.4% Software integrity $393.8 $465.8 $524.6 % of total 9.4% 9.2% 9.0% Adjusted operating income by segment Design automation $924.6 $1,206.6 $1,439.7 Design IP $318.5 $421.5 $532.1 Software integrity $38.3 $47.0 $76.3 Adjusting operating margin by segment Design automation 33.6% 36.6% 38.1% Design IP 30.2% 32.0% 34.5% Software integrity 9.7% 10.1% 14.5% Certain operating expenses are not allocated to the segments and are managed at a consolidated level. The unallocated expenses managed at a consolidated level, including amortization of intangible assets, stock- based compensation, the gains (losses) related to deferred compensation plan, restructuring charges, and certain acquisition-related items, are presented in the table below to provide a reconciliation of the total adjusted operating income from segments to our consolidated operating income: 1 Synopsys' fiscal year 2023 ended on October 28, 2023. For presentation purposes, we refer to the closest calendar month end 2 Synopsys manages the business on a long-term, annual basis, and considers quarterly fluctuations of revenue and profitability as normal elements of our business. Amounts may not foot due to rounding Synopsys Confidential Information © 2024 Synopsys, Inc. 183