 ® Delivering Value to Consumers – how, when and where they want Deutsche Bank Leveraged Finance Conference September 24, 2008 Exhibit 99.1 |
 2 ® Safe Harbor Certain statements found in this document constitute “forward-looking statements” within the meaning of the Private Securities Litigation Reform Act of 1995. Such forward-looking statements involve known and unknown risks and uncertainties and other factors which may cause the actual results, performance or achievements of Valassis to be materially different from any future results, performance or achievements expressed or implied by such forward-looking statements. Such factors include, among others, the following: price competition from our existing competitors; new competitors in any of our businesses; a shift in customer preference for different promotional materials, promotional strategies or coupon delivery methods including as a result of declines in newspaper circulations; an unforeseen increase in our paper or postal costs; changes which affect the businesses of our clients and lead to reduced sales promotion spending including a decrease in marketing budgets which are generally discretionary in nature and easier to reduce in the short-term than other expenses; challenges and costs of achieving synergies and cost savings in connection with the ADVO acquisition and integrating ADVO’s operations may be greater than expected; our substantial indebtedness, and our ability to incur additional indebtedness, may affect our financial health; certain covenants in our debt documents could adversely restrict our financial and operating flexibility; fluctuations in the amount, timing, pages, weight and kinds of advertising pieces from period to period, due to a change in our clients’ promotional needs, inventories and other factors; our failure to attract and retain qualified personnel may affect our business and results of operations; a rise in interest rates could increase our borrowing costs; the outcome of ADVO’s pending shareholder lawsuits; possible governmental regulation or litigation affecting aspects of our business; and general economic conditions, whether nationally or in the market areas in which we conducts business, may be less favorable than expected. We disclaim any intention or obligation to update or revise any forward-looking statements, whether as a result of new information, future events or otherwise. Additional risks include, but are not limited to those risk factors described in our Annual Report on Form 10-K for the year ended Dec. 31, 2007 (the 2007 Form 10-K) and our other filings with the United States Securities and Exchange Commission (“SEC”). |
 3 ® Delivering value to consumers… In-store Industry Size: $1 billion Strategy: Growth Interactive Industry Size: $18 billion Strategy: Growth Newspaper Industry Size/Valassis Revenue*: ROP: $25 billion/$147 million FSI: $1 billion/$401 million Preprint: $14 billion/$279 million Strategy: Grow Share Sampling Industry Size: $2 billion Valassis Revenue*: $54 million Strategy: Grow Share Shared Mail Direct Mail Industry Size: $33 billion Valassis Revenue*: $1.4 billion Strategy: Growth and Grow Share *Revenue figures based on Valassis 2007 revenue (including pre-acquisition ADVO revenue for Jan/Feb, 2007). how, when and where they want |
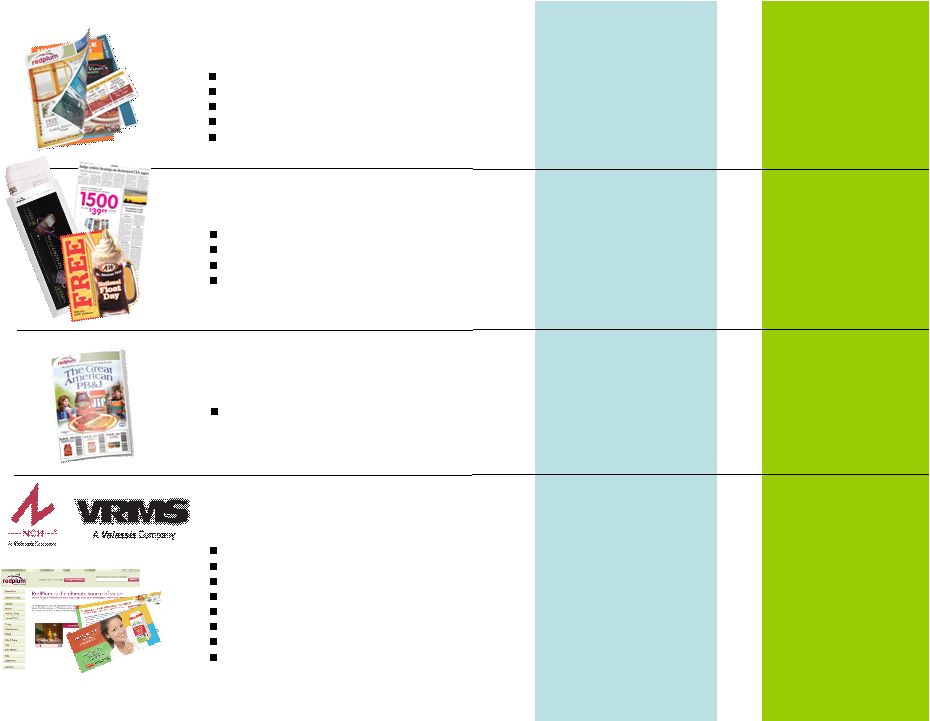 Shared Mail Free-standing insert (FSI) - Co-op newspaper inserts Coupon and promotion clearing European and Canadian media operations Sweepstakes/security consulting In-store partnerships China: minority interest in point-of-sale marketing company Direct mail sampling/advertising Loyalty marketing software Internet-delivered promotions Preprinted inserts On-page newspaper advertising (ROP) Newspaper polybag sampling/advertising Door hanger sampling/advertising (Direct-to-Door) Shared mail wrap Targeted inserts Saturation mail List services MailCoups/Mail Marketing Systems, Inc. (MMSI) Neighborhood Targeted Market Delivered International, Digital Media & Services $480.5M $401.2M $177.1M $1,406.8M 2007 Revenue 2007 Total Revenue $2,465.6M *Includes ADVO Jan & Feb ‘07 pre-acquisition revenue. $208.5M $187.3M $ 89.5M $706.7M 1H08 Revenue 1H08 Total Revenue $1,192.0M -0.4% vs. 1H07 The segments previously known as International and Services and Household Targeted were aggregated into one segment, International, Digital Media and Services, due to their immateriality versus the remaining segments. Also as of Jan. 1, 2008, the ADVO Canada business previously accounted for in the Shared Mail segment was merged into Valassis Canada and is now included in International, Digital Media and Services. Prior year pro forma revenue has been reclassified here for comparison purposes. +3.7% vs. 1H07 -5.5% vs. 1H07 -10.1% vs. 1H07 +3.6% vs. 1H07 |
 5 ® Diversification - 2007 Revenue by Product Revenue by Client |
ADVO acquisition completes are long-term strategy to diversify customer base. “Strategic Accounts” and “Local Accounts” Objective to have 4,000 new local customers in 2008 Clients 2006 2007 Consumer Packaged Goods Total 17.9% 17.4% Consumer Services Total 9.4% 9.1% Direct Marketers Total 6.8% 6.6% Financial Total 1.8% 3.0% Food Service Total 13.7% 13.3% Grocery and Drug Total 17.6% 17.2% Satellite Total 2.0% 1.6% Telecom Total 7.3% 8.1% Specialty Retail Total 15.0% 15.5% Discount Stores Total 5.4% 5.4% Other Totals 3.2% 2.8% Grand Total 100% 100% Products 2006 vs. 2007 (Pro Forma Revenue) 2006 2007 Shared Mail Inserts 43.9% 53% FSI 17.7% 19% Neighborhood Targeted 12.7% 21% International and Services 4.5% 5% Household Targeted 2.4% 2% Shared Mail Zone Products 9.3% In ’07, moved to “Shared Mail Inserts” category ROP 4.7% In ’07, moved to “Neighborhood Targeted” category Other 4.9% In ’07, moved to “Shared Mail Inserts” |
 6 ® We have relationships with more than 15,000 advertisers worldwide in various industries. “Blue Chip” Client Base |
• Combined 15,000 customers • Long-term customers; stable; biggest in the industry; • These logos represent strategic accounts |
 7 ® Second Half 2008 Strategy • Marketers need to move product and consumers seek deals – Valassis products drive traffic and move product – We believe the current economic environment will have a more permanent effect on consumer behavior – 72% of consumers are using more coupons 1 – Consumers are searching on “coupon” 44% more often than in previous years 2 • Launch of Integrated Media Optimization facilitates cross selling and gains audience with client • Increase share by cross selling and new client acquisition • Successful cost management 1 Prospectiv Study, August 2008 2 Google Trends, September 2008 U.S. “Coupon” search; July 2007 – August 2008 vs. January 2004 vs. June 2007 |
• Valassis products drive traffic and move inventory • We believe this recession will have a more permanent affect on consumer behavior now and in the future • A new study finds that 72% of consumers are using more coupons than they did six months ago (Source: Prospectiv Study, August 2008) • Consumers are seeking more value-oriented content. They are searching for coupons 44% more over the last year vs. the previous three years (Source: Google Trends, September 2008 U.S. “Coupon” search; July 2007 – August 2008 vs. January 2004 vs. June 2007) |
 8 ® Long-term Growth Strategy • Diversify and extend product portfolio • As newspaper circulation declines, migrate newspaper- delivered content to Shared Mail and online • Value Proposition: The only company to blend a one-of-a- kind national shared mail network and newspaper distribution Execution = Long-term Profitable Revenue Growth |
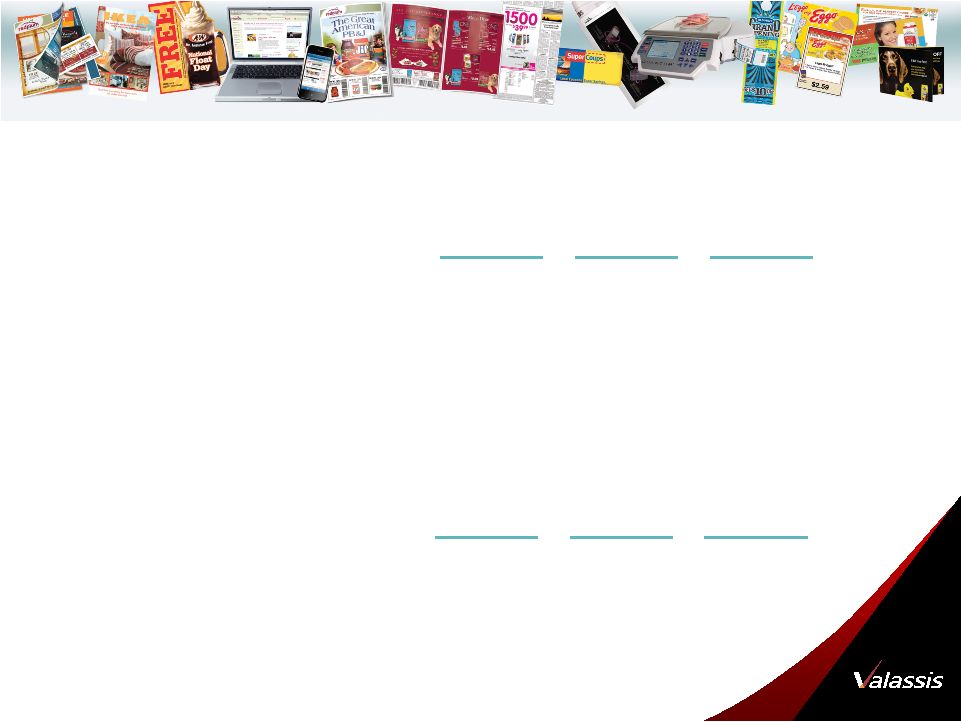 9 ® Cost Synergies Update Paper $ 4 $ 0 $ 0 Print 4 15 15 Media 2 2 5 Newspaper Alliances 0 3 7 Facility Consolidation 2 4 4 Data Center 0 0 4 SG&A 14 14 14 Total $26 $38 $49 2007A 2008E 2009E ($ in millions) A = Actual E = Estimate |
 10 ® Why Invest in Valassis? • Consumer demand for value-oriented media • Value proposition – shared mail and newspaper blended solution – one-of-a-kind shared mail distribution • Cross-sell opportunity – extensive product portfolio – expansive client base • Sustainable, profitable revenue growth – long-term newspaper circulation declines = shift to shared mail (improved margins) • Outperforming print media peers • Capital structure • Cash flow • Experienced, results-oriented management team |
 ® Appendix |
 12 ® Net Earnings to Adjusted EBITDA and Cash Flow from Operations 1 ($ in millions) 1 For reconciliation of non-GAAP measures see slide 17. Three Months Ended Six Months Ended 6/30/2008 6/30/2008 Net Earnings - GAAP 7.3 $ 19.7 $ plus: Income taxes 5.0 12.8 Interest and other expense, net 22.4 44.5 Depreciation and amortization 17.2 34.8 EBITDA 51.9 $ 111.8 $ Stock-based compensation expense (SFAS No. 123R) 2.0 3.4 Amortization of customer contract incentive 1.2 2.4 Restructuring costs 0.8 1.5 Adjusted EBITDA 55.9 $ 119.1 $ Interest and other expense, net (22.4) (44.5) Income taxes (5.0) (12.8) Restructuring costs, cash (0.8) (1.5) Changes in operating assets and liabilities 49.9 20.7 Cash Flow from Operations 77.6 $ 81.0 $ |
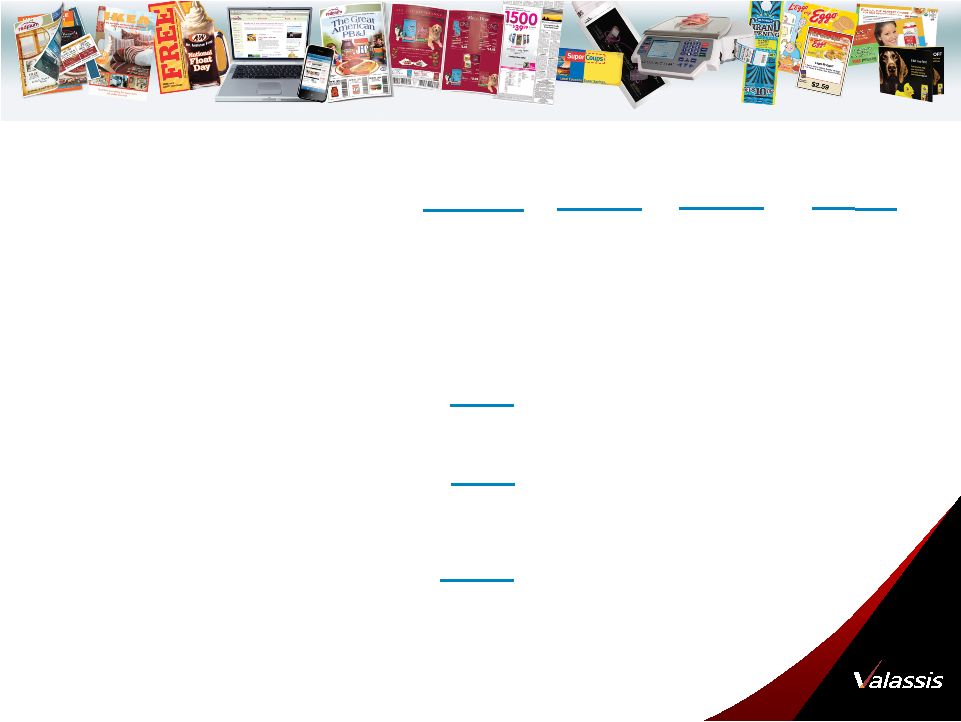 13 ® Capital Structure ($ in millions) $191.8 Senior Secured Debt: Senior Notes $100.0 6-5/8% 1/15/2009 fixed rate Senior Secured Credit Facility – fixed portion 480.0 6.80% 3/31/2014 swaps expire 12/31/10 Senior Secured Credit Facility – floating portion (1) 162.6 4.55% (2) 3/31/2014 LIBOR +175 Senior Convertible Notes .1 1-5/8% 5/22/2033 fixed rate Senior Secured Revolving Credit Facility – $120mm (3) 0.0 5.05% (2) 3/31/2012 LIBOR +225 Total Secured Debt $742.7 Senior Unsecured Notes 540.0 8-1/4% 3/31/2015 fixed rate Total Debt $1,282.7 Total Net Debt $1,090.9 Current Market Capitalization $395.5 48.05 mm shares at 9/19/08 Total Capitalization $1,486.4 As of 6/30/08 Rate Due Comments closing price of $8.23 (1) On July 3, 2008, we applied net proceeds of $28.8 million from sale and leaseback of our Windsor, CT locations to our term loan portion of our Senior Secured Credit Facility, as required by our Senior Secured Credit Facility (see 10-K for details). (2) Based on three-month LIBOR as of 8/13/08 of 2.8% plus spread. (3) $120 million (less approx. $11.2 million in letters of credit) is current available credit. Cash and equivalents (1) |
 14 ® Covenant Analysis As of 6/30/08 Consolidated Senior Secured Leverage Ratio: Senior Secured Debt $742.7 Adjusted EBITDA (LTM) (1) $261.0 Covenant Ratio Level (2) 4.00x Consolidated Senior Secured Leverage Ratio 2.85x Test Pass Covenant EBITDA Cushion % 28.9% Consolidated Interest Coverage Ratio: As of 6/30/08 Consolidated Interest Expense (LTM) $92.8 Adjusted EBITDA (LTM) (1) $261.0 Covenant Ratio Level (3) 1.60x Consolidated Interest Coverage Ratio 2.81x Test Pass Covenant EBITDA Cushion % 43.1% (1) Calculated pursuant to the terms of the senior secured credit facility for the trailing twelve-month period ended March 31. 2008. Adjusted EBITDA under the senior secured credit facility is calculated differently than the Company’s publicly disclosed Adjusted EBITDA because the senior secured credit facility definition does not permit certain adjustments the Company has included in its publicly disclosed Adjusted EBITDA. (2) Ratio decreases to 3.75x on Dec. 31, 2008. (3) Ratio increases to 1.75x on Dec. 31, 2008. ($ in millions) |
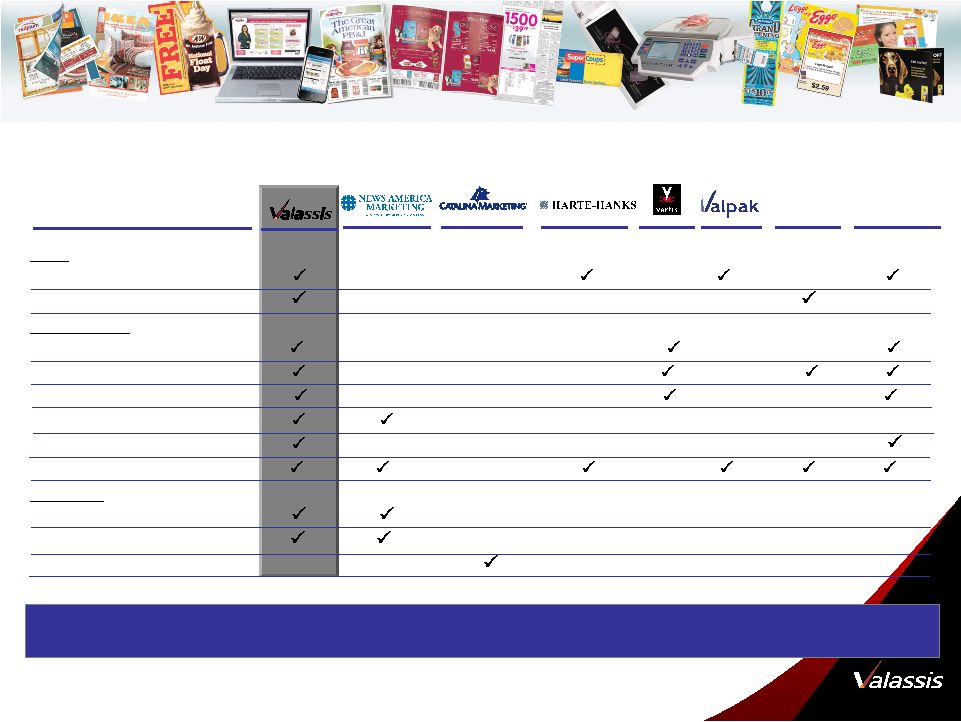 15 ® Unique Value Proposition Mail Shared Mail Loyalty Mail Newspaper Preprinted Inserts Run of Press Polybag/Sampling Co-op FSI Direct-to-Door Internet (Value-oriented Content) In Store In Aisle Perimeter Point-of-Sale (POS) Ad Agencies Large Metro Newspapers We offer the only industry turnkey solution including targeting, media optimization and placement, printing and back-end analytics. Distribution Channel |
• No competitor has the product portfolio that rivals ours within the marketing services industry • We also have 2 major distribution channels (newspaper and shared mail) and can supplement with in-store, internet and direct-to-door • Also, vertically integrated and can do everything from targeting, media optimization and placement, printing and back-end analytics. • We can also provide integrated solutions utilizing a variety of products, targeting levels and distribution methods to more efficiently reach the consumer---The most complete solution. • Lots of upside in the segments we compete in. For example: Run of press-$25 billion industry excluding classifieds-we place $250 million Preprinted inserts-$13.7 billion industry – we handle $260 million Sampling - $1.8 Billion industry – we do $50 million Direct mail - $32.8 Billion – we do $1.5 Billion with ADVO • Targeting Media planning and promotional services Response & ROI optimization • Portfolio Multi-channel media Breadth of products and formats • Scale Largest customer of newspapers and the USPS Coast-to-coast national reach with household level targeting |
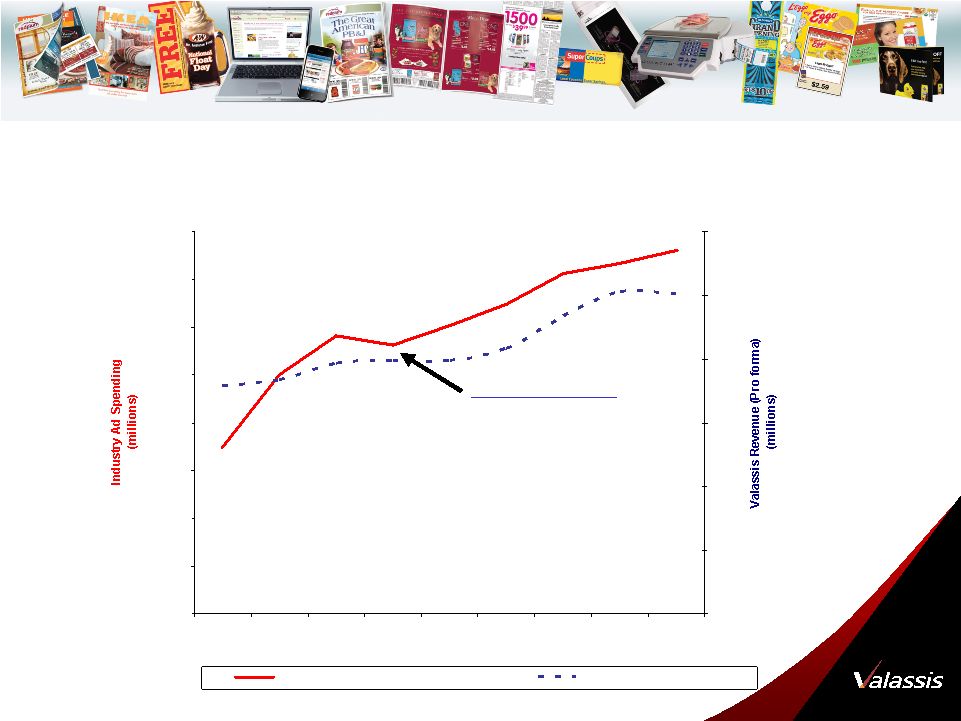  ® Strong Execution Dictates Success – Elasticity Within Ad Recession Sources: Industry Ad Spend, TNS 2007 Valassis Revenue, Internal Tracking $0 $20,000 $40,000 $60,000 $80,000 $100,000 $120,000 $140,000 $160,000 1998 1999 2000 2001 2002 2003 2004 2005 2006 $0 $500 $1,000 $1,500 $2,000 $2,500 $3,000 Industry Ad Spending Total (millions) Valassis Revenue (millions) 2001 Ad Recession Industry: -3.2% Valassis: +1.0% |
• 2000 vs. 2001 total industry is 3.2% decrease – Valassis 1.0% increase. • Legacy Valassis 1.5% increase; legacy ADVO .7% increase • Studies on recessions from 1947 through 1985 reveal short-term and long-term effects when advertisers cut ad spending… • sales and profits dropped off at companies that cut back on advertising - after the recession those companies continued to fall behind the ones that maintained their ad spending levels. • companies that did not cut their budgets or chose to increase spending experienced significantly higher sales during and after the 1981-82 recession • at the end of 1985, those companies that had maintained or increased their advertising during the recession enjoyed an average sales growth of 275 percent over the preceding five years, while those that had decreased their advertising had to settle for an average sales increase of only 19 percent • Increase market share (91-92 recession)… • a 1993 study among 127 brands showed that the brands that increased ad spending by an average of 7percent enjoyed an average 1.1 percent increase in market share, while those that • reduced spending by 8 percent on average lost 1.6 percent of market share • A recession provides a prime opportunity for increasing your market share, so • monitor your market share, not just your sales volume. If you are aggressive when • your competitors are cutting back their ad spending, you may enjoy your greatest gain in market share. • Those who cut their budgets decrease their chances to improve their market share • for as many as five years after a recession. |
 17 ® We define adjusted EBITDA as earnings before net interest and other expenses, income taxes, depreciation, amortization, acquisition/litigation-related expenses, stock-based compensation expense associated with SFAS No. 123R, amortization of a customer contract incentive and other non-cash and non-recurring charges. We define adjusted free cash flow as net earnings plus depreciation, amortization, stock-based compensation expense, acquisition/litigation-related expenses and other non-cash and non-recurring items, less capital expenditures. Adjusted EBITDA and adjusted free cash flow are non-GAAP financial measures commonly used by financial analysts, investors, rating agencies and other interested parties in evaluating companies, including marketing services companies. Accordingly, management believes that adjusted EBITDA and adjusted free cash flow may be useful in assessing our operating performance and our ability to meet our debt service requirements. In addition, adjusted EBITDA is used by management to determine our operating performance and, along with other data, as internal measures for setting annual operating budgets, assessing financial performance of numerous business segments and as a measurement component of incentive compensation. However, these non-GAAP financial measures have limitations as analytical tools and should not be considered in isolation from, or as an alternative to, operating income, cash flow or other income or cash flow data prepared in accordance with GAAP. Some of these limitations are: • adjusted EBITDA does not reflect our cash expenditures for capital equipment or other contractual commitments; • although depreciation and amortization are non-cash charges, the assets being depreciated or amortized may have to be replaced in the future, and adjusted EBITDA does not reflect cash capital expenditure requirements for such replacements; • adjusted EBITDA does not reflect changes in, or cash requirements for, our working capital needs; • adjusted EBITDA does not reflect the significant interest expense or the cash requirements necessary to service interest or principal payments on our indebtedness; • adjusted EBITDA does not reflect income tax expense or the cash necessary to pay income taxes; • adjusted EBITDA does not reflect the impact of earnings or charges resulting from matters we consider not to be indicative of our ongoing operations; • adjusted free cash flow does not represent our residual cash flow available for discretionary expenditures since we have mandatory debt service requirements and other required expenditures that are not deducted from adjusted free cash flow; • adjusted free cash flow does not capture debt repayment and/or the receipt of proceeds from the issuance of debt; and • other companies, including companies in our industry, may calculate these measures differently and as the number of differences in the way two different companies calculate these measures increases, the degree of their usefulness as a comparative measure correspondingly decreases. Because of these limitations, adjusted EBITDA and adjusted free cash flow should not be considered as measures of discretionary cash available to us to invest in the growth of our business or reduce indebtedness. We compensate for these limitations by relying primarily on our GAAP results and using these non-GAAP financial measures only as a supplement. Reconciliation of Non-GAAP Measures |