 Investor Presentation August 2011 Exhibit 99.1 1 |
 2 Safe Harbor Cautionary Statements Regarding Forward-looking Statements This document contains “forward-looking statements” within the meaning of the Private Securities Litigation Reform Act of 1995. Such forward-looking statements involve known and unknown risks and uncertainties and other factors which may cause our actual results, performance or achievements to be materially different from any future results, performance or achievements expressed or implied by such forward-looking statements. Such factors include, among others, the following: price competition from our existing competitors; new competitors in any of our businesses; a shift in client preference for different promotional materials, strategies or coupon delivery methods, including, without limitation, as a result of declines in newspaper circulation; an unforeseen increase in paper or postal costs; changes which affect the businesses of our clients and lead to reduced sales promotion spending, including, without limitation, a decrease of marketing budgets which are generally discretionary in nature and easier to reduce in the short-term than other expenses; our substantial indebtedness, and ability to refinance such indebtedness, if necessary, and our ability to incur additional indebtedness, may affect our financial health; the financial condition, including bankruptcies, of our clients, suppliers, senior secured credit facility lenders or other counterparties; certain covenants in our debt documents could adversely restrict our financial and operating flexibility; fluctuations in the amount, timing, pages, weight and kinds of advertising pieces from period to period, due to a change in our clients’ promotional needs, inventories and other factors; our failure to attract and retain qualified personnel may affect our business and results of operations; a rise in interest rates could increase our borrowing costs; we may be required to recognize additional impairment charges against goodwill and intangible assets in the future; possible governmental regulation or litigation affecting aspects of our business; clients experiencing financial difficulties, or otherwise being unable to meet their obligations as they become due, could affect our results of operations and financial condition; uncertainty in the application and interpretation of applicable state sales tax laws may expose us to additional sales tax liability; and general economic conditions, whether nationally, internationally, or in the market areas in which we conduct our business, including the adverse impact of the ongoing economic downturn on the marketing expenditures and activities of our clients and prospective clients as well as our vendors, with whom we rely on to provide us with quality materials at the right prices and in a timely manner. These and other risks and uncertainties related to our business are described in greater detail in our filings with the United States Securities and Exchange Commission, including our reports on Forms 10-K and 10-Q and the foregoing information should be read in conjunction with these filings. We disclaim any intention or obligation to update or revise any forward-looking statements, whether as a result of new information, future events or otherwise. |
 Delivering value how, when and where consumers want it Shared Mail • 70 million households • 31 billion inserts distributed Digital • 13,000+ websites in the RedPlum Digital Network • 75 million opt-in email list In-Store • Nearly 3,000 stores in the network at the end of first quarter 2011 Newspaper • 15,000+ newspapers • 6 billion inserts distributed • 90 billion FSI pages (including Shared Mail distribution) Information for the year ended 12/31/10 except where noted otherwise 3 |
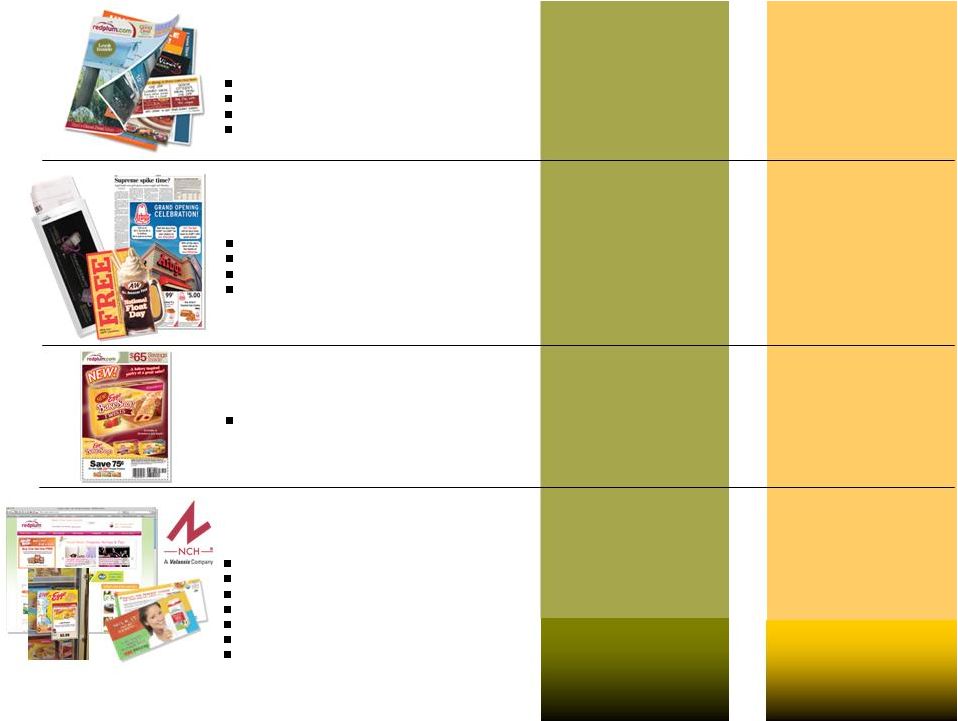 4 RedPlum Shared Mail Free-standing inserts (FSI) - Co-op newspaper inserts Coupon and promotion clearing Digital portfolio In-store media Canadian media operations Sweepstakes/security consulting Direct mail sampling/advertising Loyalty marketing software Newspaper inserts On-page newspaper advertising (ROP) Newspaper polybag sampling/advertising Door hanger sampling/advertising (Direct-to-Door) Shared mail wrap Shared mail inserts Saturation mail List services Neighborhood Targeted RedPlum Free-standing Inserts International, Digital Media & Services $479.9 M +7.9%* $367.6M +1.7%* $178.8M +12.5%* $1,307.2 M +2.2%* 2010 Segment Revenue/Profit $156.8M +42.3%* 2010 Total $2,333.5M +4.0%* $225.0M*** +23.0%* $20.6M -43.3%* $24.9M +116.5%* $22.7M -9.2%* *Compared to 2009 segment revenue and profit, respectively **Compared to 2Q10 segment revenue and profit, respectively ***Total segment profit is a non-GAAP financial measure. Important information regarding operating results and reconciliations of non-GAAP financial measures to the most comparable GAAP measures may be found under “Reconciliation of Non-GAAP Financial Measures” on slides 18-22. $88.8 M -23.6%** $89.2M -5.7%** $50.0M +16.8%** $337.2 M +3.3%** 2Q11 Segment Revenue/Profit (unaudited) $47.7M +17.5%** 2Q11 Total $565.2M -2.5%** $63.2M*** +4.6%** $0.8M -84.9%** $8.3M -27.2%** $6.4M +106.5%** |
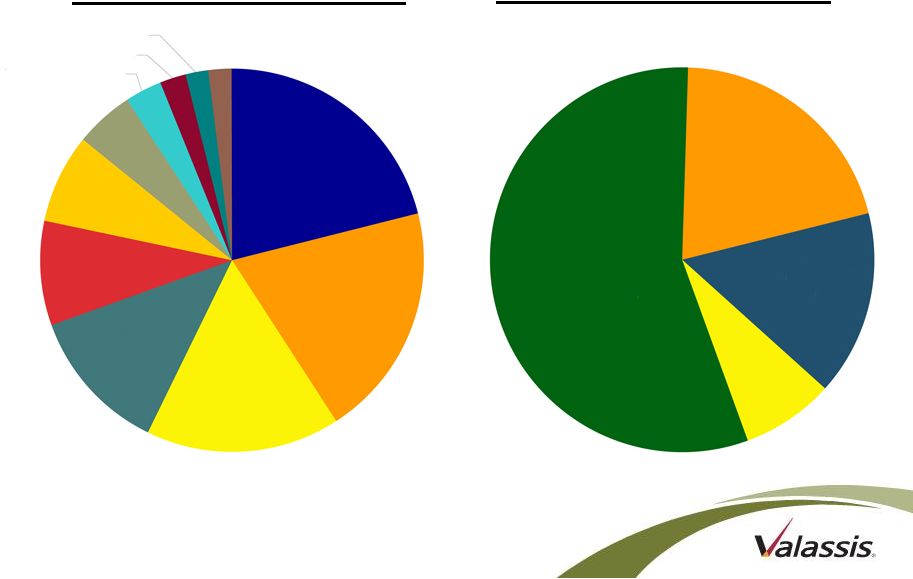 5 Diversification - 2010 Revenue by Product Revenue by Client Other 1.9% Direct Marketers, 1.9% Financial, 2.2% Discount Stores, 3.2% Satellite 5.0% Telecom 7.5% Consumer Services 8.8% Restaurants 12.2% Specialty Retail 16.4% Grocery & Drug 19.7% Consumer Packaged Goods 21.2% Shared Mail 56.0% Neighborhood Targeted 20.6% Free-standing Insert 15.7% IDMS 7.7% |
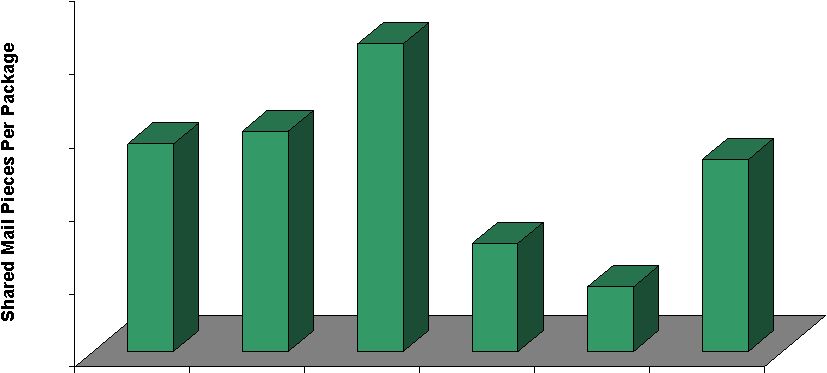 Shared Mail Performance – Newspaper Coverage Correlation Sources: Valassis Internal Tracking for Shared Mail pieces per package data for calendar year 2010. Newspaper Penetration: Audited and Paid newspapers (major and local) with over 100k circulation in the Top 75 Designated Marketing Areas (DMA’s) for 2010 where shared mail is distributed. There is no newspaper coverage greater than 40% in the Top 75 DMA's. Low Newspaper Coverage = Larger Shared Mail Packages 7.0 8.0 9.0 10.0 11.0 12.0 < 15% 15-20% 21-25% 26-30% 31-35% 36-40% Newspaper Penetration Combined SM Pieces Per Package is 10.7 in DMA’s with 25% or less newspaper coverage Combined SM Pieces Per Package is 8.5 in DMA’s with > 26% newspaper coverage |
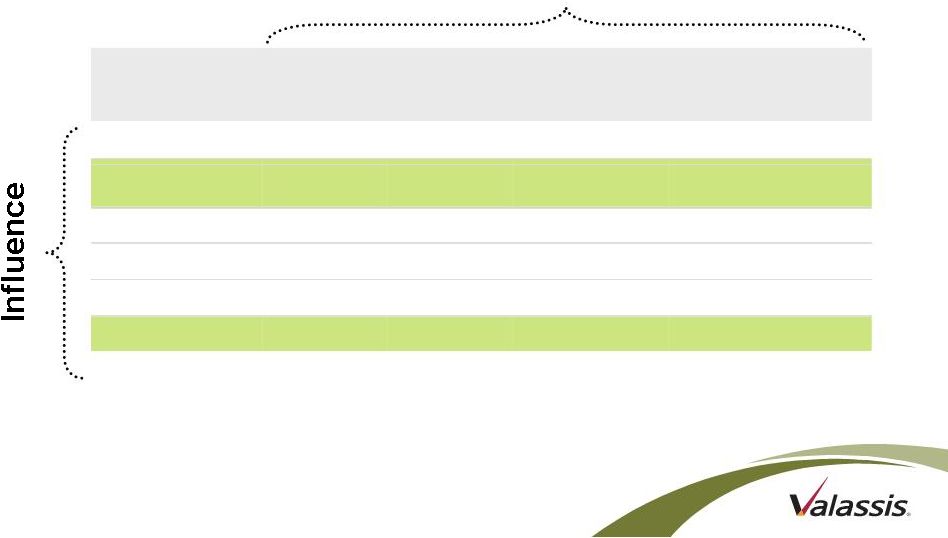 7 Source: BIGresearch Simultaneous Media Survey, June 2010 Power of Value-Oriented Products Purchase Category Electronics Apparel Home Improvement Grocery Eating Out Word of Mouth 43% 34% 33% 39% 50% Circulars/ Inserts 24% 26% 21% 40% 27% TV Broadcast 28% 23% 22% 26% 26% Internet 25% 19% 12% 13% 15% Email 24% 26% 11% 15% 20% Coupons 21% 31% 18% 71% 53% |
 8 What Sets Valassis Apart? Our Targeting & Portfolio Hypothetical Retail Example Newspaper Only Buy Valassis Optimized Recommendation # of Stores 45 45 Newspaper 370,583 188,747 Shared Mail 0 180,449 Total Distribution 370,583 369,196 % of Stores Covered 43.5% 66.4% % of Targeted HH’s Covered 40.3% 91.1% Sales Dollars Covered $7.1M $10.8M |
 9 Long-term Growth Strategy Drive sustainable revenue and profit growth • Shared Mail – Benefits from declining newspaper circulations – 3 billion more Shared Mail inserts delivered in 2010 vs. 2009 – Strong operating leverage • FSI – Marketers’ response to consumers’ demand for value drives unit growth; 89.6% of all coupon delivery (1) – Marketers distributed a record-breaking 332 billion coupons in 2010 (2) • In-Store – Better concept for retailers and consumers – Unique business model for retailers – Retailer network is growing (1) Source: NCH Coupon Fact Report – Mid-year 2011 (NCH Marketing Services, Inc. is a Valassis company) (2) Source: NCH Coupon Fact Report – Year-end 2010 |
 10 Long-term Growth Strategy (continued) • Digital – Ongoing investment – Expanding digital portfolio – Opportunity for integration of offline and online media • Cash Flow Utilization – Improve EPS Share repurchase – Invest in the business New client development New product development Acquisitions Secure print Email Display ads Coupon to Card/ID Mobile offer to ID Drive sustainable revenue and profit growth |
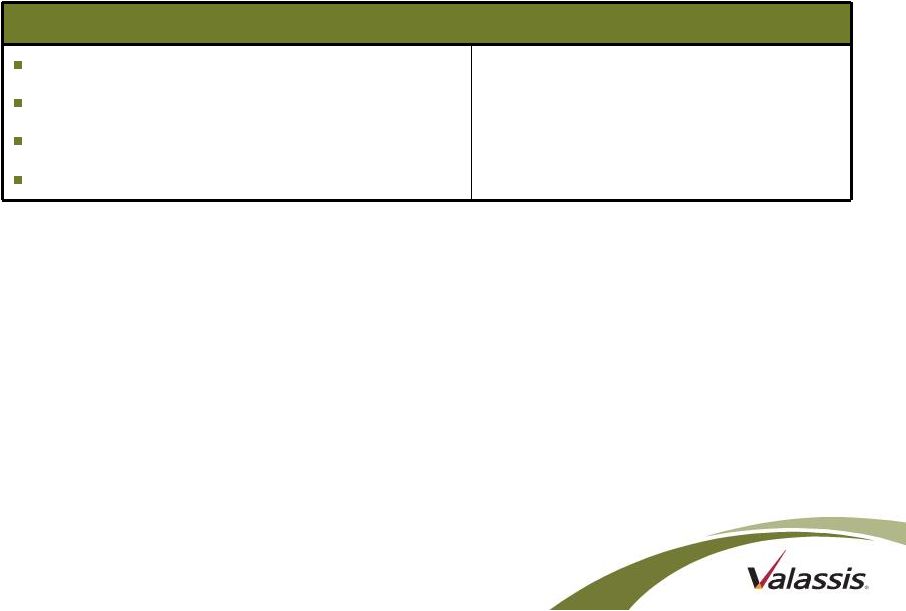 11 2011 Guidance Full-year 2011 Guidance (as of 7/28/11) (1) Diluted earnings per share Diluted cash earnings per share (2) Adjusted EBITDA (2) Capital expenditures $2.76 $3.71 Approximately $355 million Approximately $30 million (1) All data are as of July 28, 2011. This guidance by management was based on the economic environment as of such date. Actual results may differ materially. No reference (oral or written) to such data should be construed as an update, revision, confirmation or clarification of same. (2) Diluted cash earnings per share and Adjusted EBITDA are non-GAAP financial measures. Important information regarding operating results and reconciliations of non- GAAP financial measures to the most comparable GAAP measures may be found under “Reconciliation of Non-GAAP Financial Measures” on slides 18-22. |
 12 ($ in millions) (1) On 12/17/09, we entered into an interest rate swap agreement effective 12/31/10 fixing an amortizing notional amount (initially $300 million) of the variable rate debt under our senior secured credit facility at an effective interest rate, based on the current spread of 1.75%, of 3.755% per annum through 6/30/12. For additional details, refer to our 10-Q filed with the SEC on 8/9/11 and slide 23 for the amortization schedule. (2) On 7/6/11, we entered into a forward-starting interest rate swap agreement which, effective 6/30/12 (the expiration date of our existing interest rate swap agreement), will fix an amortizing notional amount (initially $186.25 million) of the variable rate debt under our senior secured credit facility at an effective interest rate, based on the current spread of 1.75%, of 3.62% per annum through 6/30/15. For additional details, refer to our 8-K filed with the SEC on 7/6/11 and slide 23 for the amortization schedule. (3) Based on three-month LIBOR as of 6/27/11 of 0.250% plus spread. (4) $100 million less $50 million previously drawn and less approximately $11.0 million in letters of credit is current available credit. Capital Structure As of 6/30/11 Interest Rate Due Cash and equivalents $119.0 Senior Secured Debt: Senior Secured Credit Facility – fixed portion 220.0 3.755% 6/27/2016 current swap expires 6/30/12 (1)(2) Senior Secured Credit Facility – floating portion 80.0 2.000% (3) 6/27/2016 LIBOR +175 Senior Secured Credit Facility – Revolver - $100mm (4) 50.0 2.000% (3) 6/27/2016 LIBOR +175 Senior Secured Convertible Notes 0.1 -- 5/22/2033 interest no longer payable Total Secured Debt $350.1 Senior Unsecured Notes 260.0 6.625% 2/1/2021 fixed rate Total Debt $610.1 Total Net Debt $491.1 Current Market Capitalization 1,174.4 50.167M fully diluted shares Total Capitalization $1,665.5 8/9/11 closing price of $23.41 Comments |
 13 Debt Refinancing and Interest Rate Hedging • Refinanced our existing senior secured credit facility with a new senior secured credit facility in June 2011. – Includes a $300 million Term Loan A and a $100 million revolving line of credit, of which $50 million was drawn at closing (exclusive of any outstanding letters of credit). – Expected to save $2.4 million in cash interest expense in the second half of 2011. – Provides increased flexibility in how we can deploy cash flow. • Entered into a new swap agreement in July 2011 (effective June 30, 2012, upon the expiration of our existing interest rate swap agreement). – Fixed the underlying interest rate for a portion of our variable rate debt under our new senior secured credit facility at 1.8695%. – After giving effect to the swap agreement, our effective interest rate for the notional amount of the swap, based on the current spread of 1.75%, will be 3.62% per annum through June 30, 2015. – The initial notional amount is $186,250,000 and amortizes quarterly through the expiration date. For the amortization schedule see slide 23. |
 14 Second Quarter 2011 Financial Highlights • 2Q11 Adjusted Net Earnings (1) were $33.7 million, an increase of 30.6% from $25.8 million for the prior year quarter. • 2Q11 Adjusted Diluted Earnings Per Share (1) was $0.67, an increase of 36.7% from $0.49 for the prior year quarter. • Total cash was $119.0 million at June 30, 2011, a decrease of $111.2 million from March 31, 2011, due primarily to a net debt repayment of $112.2 million and share repurchases of $60.3 million; offset, in part, by cash generated from operations of $73.1 million in the quarter. • Stock Repurchase Update: During the quarter, we repurchased $60.3 million, or 2.1 million shares, of our common stock at an average price of $28.14 per share, including commissions, under our stock repurchase program. During the first half of the year, we have repurchased $105.9 million, or 3.8 million shares, of our common stock. (2) (1) Adjusted net earnings and adjusted diluted earnings per share are non-GAAP financial measures. Important information regarding operating results and reconciliations of non-GAAP financial measures to the most comparable GAAP measures may be found under “Reconciliation of Non-GAAP Financial Measures” on slides 18-22. (2) Our ability to make stock repurchases may be limited by the documents governing our indebtedness. |
 15 • Consumer demand for value-oriented media and clients’ desire for measurable results • Value proposition – long-term newspaper coverage declines = shift to shared mail (improved margins) – one-of-a-kind shared mail distribution – shared mail and newspaper blended solution (plus integration of online media) – digital and in-store contribution • Low-cost capital structure • Cash flow yield • Experienced, results-oriented management team Summary |
 16 Questions |
 17 Appendix |
 18 Reconciliation of Non-GAAP Financial Measures Non-GAAP Financial Measures *We define adjusted EBITDA as net earnings before interest expense, net, other non-cash expenses (income), net, income taxes, gain or loss on extinguishment of debt, depreciation, amortization, stock-based compensation expense, and News America litigation settlement proceeds, net of related payments. We define diluted cash EPS as net earnings per common share, diluted, plus the per-share effect of depreciation, amortization, stock-based compensation expense and loss on extinguishment of debt, net of tax, less the per-share effect of capital expenditures and News America litigation settlement proceeds, net of tax and related payments. We define adjusted net earnings and adjusted diluted EPS as net earnings and diluted EPS excluding the effect of News America litigation settlement proceeds, net of tax and related payments, and loss on extinguishment of debt, net of tax. We define total segment profit as earnings from operations excluding a gain from News America litigation settlement proceeds, net of related payments. Adjusted EBITDA, adjusted net earnings, adjusted diluted EPS, diluted cash EPS and total segment profit are non-GAAP financial measures commonly used by financial analysts, investors, rating agencies and other interested parties in evaluating companies, including marketing services companies. Accordingly, management believes that these non-GAAP measures may be useful in assessing our operating performance and our ability to meet our debt service requirements. In addition, these non-GAAP measures are used by management to measure and analyze our operating performance and, along with other data, as our internal measure for setting annual operating budgets, assessing financial performance of business segments and as a performance criteria for incentive compensation. Management also believes that diluted cash EPS is useful to investors because it provides a measure of our profitability on a more comparable basis to historical periods and provides a more meaningful basis for forecasting future performance, by replacing non-cash amortization and depreciation expenses, which are currently running significantly higher than our annual capital needs, with actual and forecasted capital expenditures. Additionally, because of management’s focus on generating shareholder value, of which profitability is a primary driver, management believes these non-GAAP measures, as defined above, provide an important measure of our results of operations. However, these non-GAAP financial measures have limitations as analytical tools and should not be considered in isolation from, or as alternatives to, operating income, cash flow, EPS or other income or cash flow data prepared in accordance with GAAP. Some of these limitations are: adjusted EBITDA does not reflect our cash expenditures for capital equipment or other contractual commitments; although depreciation and amortization are non-cash charges, the assets being depreciated or amortized may have to be replaced in the future, and adjusted EBITDA does not reflect cash capital expenditure requirements for such replacements; adjusted EBITDA and diluted cash EPS do not reflect changes in, or cash requirements for, our working capital needs; adjusted EBITDA does not reflect the significant interest expense or the cash requirements necessary to service interest or principal payments on our indebtedness; adjusted EBITDA does not reflect income tax expense or the cash necessary to pay income taxes; adjusted EBITDA, adjusted net earnings, adjusted diluted EPS, diluted cash EPS and total segment profit do not reflect the impact of earnings or charges resulting from matters we consider not to be indicative of our ongoing operations; and other companies, including companies in our industry, may calculate these measures differently and as the number of differences in the way two different companies calculate these measures increases, the degree of their usefulness as comparative measures correspondingly decreases. Because of these limitations, adjusted EBITDA, adjusted net earnings, adjusted diluted EPS, diluted cash EPS and total segment profit should not be considered as measures of discretionary cash available to us to invest in the growth of our business or reduce indebtedness. We compensate for these limitations by relying primarily on our GAAP results and using these non-GAAP financial measures only supplementally. Further important information regarding reconciliations of these non-GAAP financial measures to their respective most comparable GAAP measures can be found on slides 19-22. |
 19 Reconciliation of Full-year 2011 Adjusted EBITDA Guidance to Full-year 2011 Net Earnings Guidance (1) : Full-year 2011 Guidance ($ in millions) Net Earnings $138.3 plus: Interest expense, net Income taxes Depreciation and amortization Loss on extinguishment of debt less: Other non-cash income EBITDA plus: Stock-based compensation expense 36.7 89.0 62.5 16.3 (3.4) $339.4 15.6 Adjusted EBITDA $355.0 (1) Due to the forward-looking nature of adjusted EBITDA, information necessary to reconcile adjusted EBITDA to cash flows from operating activities is not available without unreasonable effort. We believe that the information necessary to reconcile these measures is not reasonably estimable or predictable. |
 20 Reconciliation of Full-year 2011 Diluted Cash EPS Guidance to Full-year 2011 Diluted EPS Guidance: Full-year 2011 Guidance Net Earnings (in millions) $138.3 Diluted EPS plus effect of: Loss on extinguishment of debt and related charges, net of tax Depreciation Amortization Stock-based compensation expense less effect of: Capital expenditures $2.60 (1) 0.22 0.93 0.24 0.29 (0.57) Diluted Cash EPS $3.71 Shares Outstanding (in thousands) 53,100 (2) (1) Includes the effect of $8.2 million in costs, net of tax, related to the extinguishment of our 8¼% Senior Notes due 2015 during the first quarter of 2011, and $3.4 million in costs, net of tax, related to the refinancing of our senior secured credit facility. (2) Shares outstanding for 2011 is based on the estimated 53.1 million fully diluted shares in our original full-year 2011 financial guidance reported on Dec. 15, 2010 and does not include the effect of any share repurchases, option exercises or changes in dilution caused by movement in the stock price. Actual weighted average shares outstanding, diluted, for the quarter ended June 30, 2011 was 50.2 million. |
 21 Reconciliation of Adjusted EBITDA to Net Earnings and Cash Flows from Operating Activities ($ in millions) Three Months Ended Six Months Ended 6/30/2011 6/30/2011 Net Earnings - GAAP 30.3 $ 51.7 $ plus: Income taxes 19.8 33.1 Interest expense, net 11.6 21.2 Loss on extinguishment of debt 2.9 16.3 Depreciation and amortization 15.4 31.1 less: Other non-cash income, net (1.4) (2.3) EBITDA 78.6 $ 151.1 $ Stock-based compensation expense 2.5 4.4 Adjusted EBITDA 81.1 $ 155.5 $ Income taxes (19.8) (33.1) Interest expense, net (11.6) (21.2) Changes in operating assets and liabilities 23.4 (10.2) Cash Flows from Operating Activities 73.1 $ 91.0 $ |
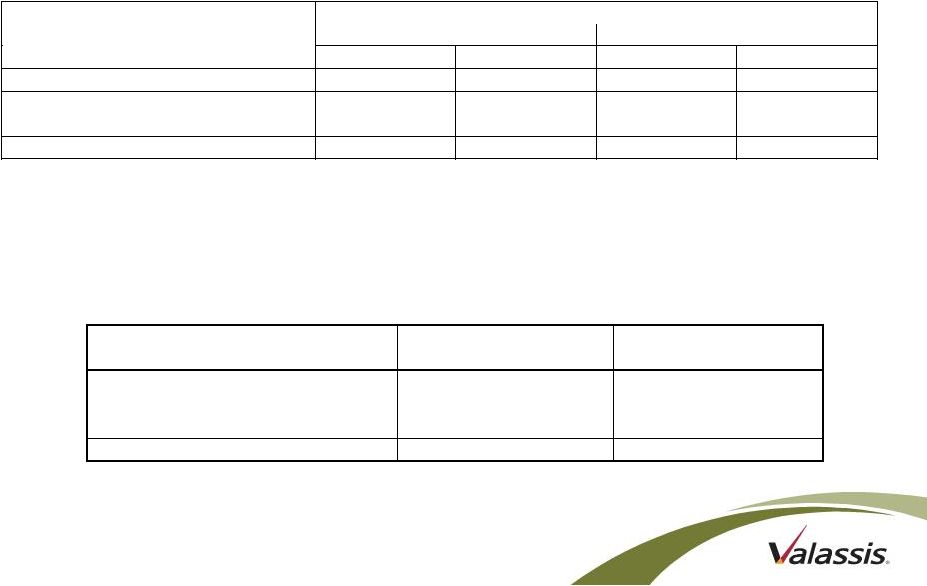 22 Reconciliation of Adjusted Net Earnings and Adjusted Diluted EPS to Net Earnings and Diluted EPS: Three Months Ended June 30, 2011 June 30, 2010 (in millions) Net Earnings Diluted EPS Net Earnings Diluted EPS As reported $30.3 $0.60 $11.1 $0.21 Loss on extinguishment of debt and related charges, net of tax (1) 3.4 0.07 14.7 0.28 As adjusted $33.7 $0.67 $25.8 $0.49 (1) Net earnings for three months ended June 30, 2011 include $3.4 million, net of tax, in costs related to the refinancing of our senior secured credit facility and net earnings for three months ended June 30, 2010 include $14.7 million, net of tax, in costs related to the repurchase of $297.8 million of our 8¼% senior notes due 2015. Reconciliation of Segment Profit to Earnings from Operations Year Ended Three Months Ended December 31, 2010 Total segment profit $225.0 Unallocated amounts: Gain from litigation settlement 490.1 Earnings from operations $715.1 $63.2 June 30, 2011 (in millions) $63.2 --- |
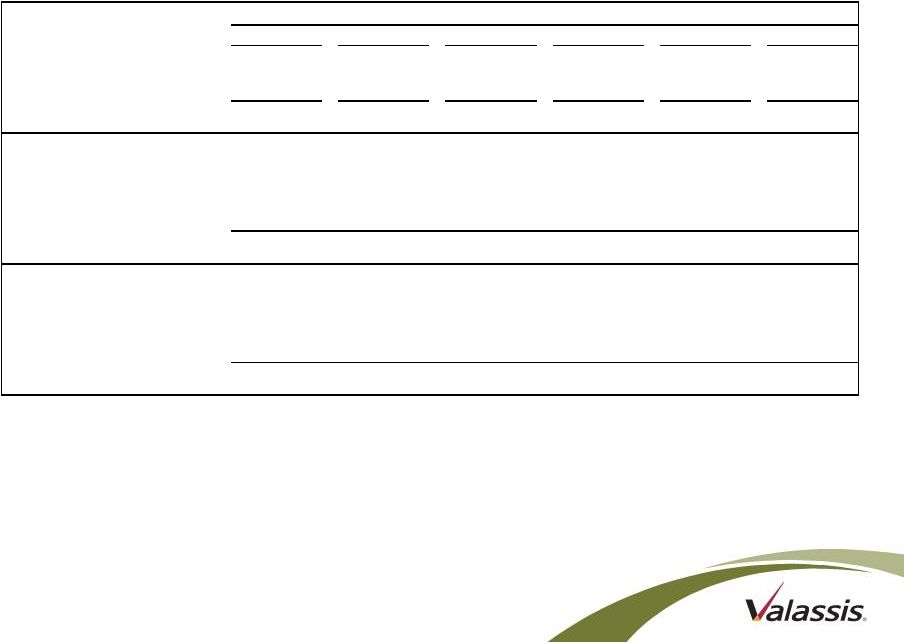 23 Senior Secured Credit Facility Principal Balance and Interest Rate Swaps Schedule (1) (1) The total principal balances reflected in the table represent the average balance per quarter shown. However, pursuant to the terms of the credit agreement, the principal amount of the term loan A amortizes on the last day of each quarter in the amount of $3.75 million for each of the quarters shown above. The amounts included in this schedule assume that no further amounts will be drawn or repaid on the revolving line of credit. (2) The fixed amounts are the quarterly notional amounts of (i) our $300 million December 2009 interest rate swap that amortizes by $40 million per quarter through June 2012, and (ii) our $186.25 million July 2011 forward-starting interest rate swap that amortizes quarterly by $2,812,000 from 6/30/12 through 9/30/13 and terminates on 6/30/15. For additional details on the amortization schedule after 9/30/13, refer to our 8-K filed with the SEC on 7/6/11. (3) The floating amount represents the difference between the outstanding principal amounts of the term loan A and revolving line of credit less the notional amount of the applicable interest rate swap, each as of the date indicated. (4) The rate applied to the fixed amounts indicated above is based on the interest rate swap agreement in effect as of the date indicated. See footnote (2) and slide 12 for additional information. (5) The actual spread will be based upon the applicable margin in effect at the time. As of 6/30/11, the applicable margin was 1.75%. (6) For the definition of Adjusted LIBOR, see the definition for “Adjusted LIBO Rate” included in our credit agreement filed as an exhibit to the 8-K filed with the SEC on 7/1/11. (000's) Sep-11 Dec-11 Mar-12 Jun-12 Sep-12 Dec-12 Fixed amount (2) 220,000 $ 180,000 $ 140,000 $ 100,000 $ 186,250 $ 183,438 $ Floating amount (3) 130,000 166,250 202,500 238,750 148,750 147,813 Total 350,000 $ 346,250 $ 342,500 $ 338,750 $ 335,000 $ 331,250 $ Applicable fixed rate (4) Swap rate 2.0050% 2.0050% 2.0050% 2.0050% 1.8695% 1.8695% + Spread (5) 1.5% to 2.0% Effective fixed rate Applicable floating rate Adjusted LIBOR (6) + Spread (5) 1.5% to 2.0% Effective floating rate Senior Secured Credit Facility Principal Balance During Quarter Ended (1) |