Exhibit 99.1
| [LOGO] |
| SAFE HARBOR 2 Certain statements contained herein that are not historical facts constitute “forward-looking statements” within the meaning of the Private Securities Litigation Reform Act of 1995 and involve a number of risks and uncertainties. The actual results of the future events described in such forward-looking statements could differ materially from those stated in such forward-looking statements. Among the factors that could cause actual results to differ materially are: changes in economic trends and financial performance, changes in consumer demands, tastes and fashion trends, lower levels of consumer spending resulting from a general economic downturn, shifts in market demand resulting in inventory risks, changes in foreign currency exchange rates, and the outcome of current and possible future litigation, as well as the risks and uncertainties set forth in the Company’s Annual Report on Form 10-K for the fiscal year ended December 29, 2012 and its Quarterly Reports on Form 10-Q filed with the Securities and Exchange Commission (the “SEC”). 3/12/13 |
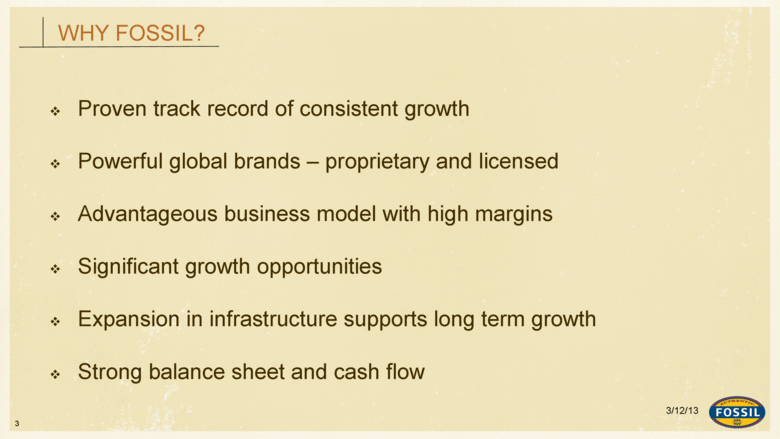
| WHY FOSSIL? Proven track record of consistent growth Powerful global brands – proprietary and licensed Advantageous business model with high margins Significant growth opportunities Expansion in infrastructure supports long term growth Strong balance sheet and cash flow 3 3/12/13 |
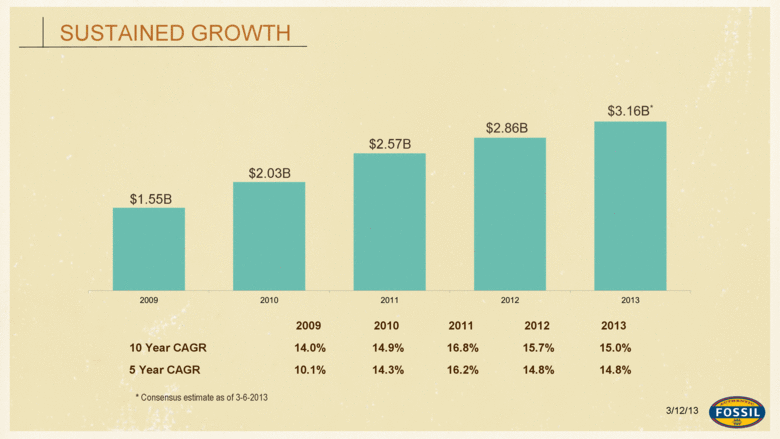
| 2009 2010 2011 2012 2013 10 Year CAGR 14.0% 14.9% 16.8% 15.7% 15.0% 5 Year CAGR 10.1% 14.3% 16.2% 14.8% 14.8% $1.55B $2.03B $2.57B * Consensus estimate as of 3-6-2013 SUSTAINED GROWTH 3/12/13 |
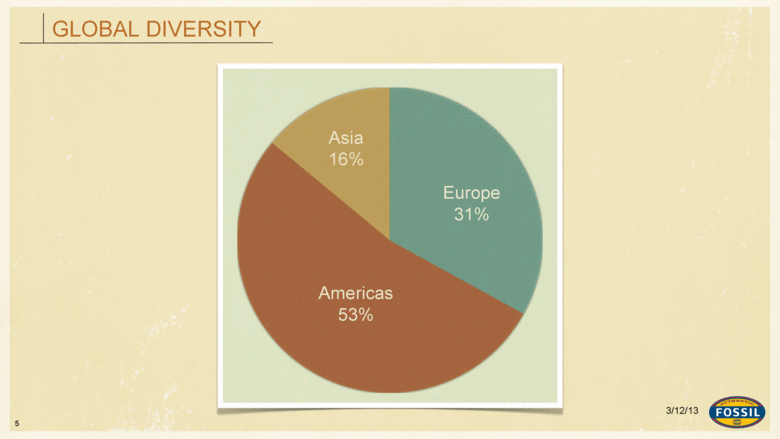
| GLOBAL DIVERSITY Europe 31% Americas 53% Asia 16% 5 3/12/13 |
| BRAND BUILDING We build world-class brands. 6 3/12/13 |
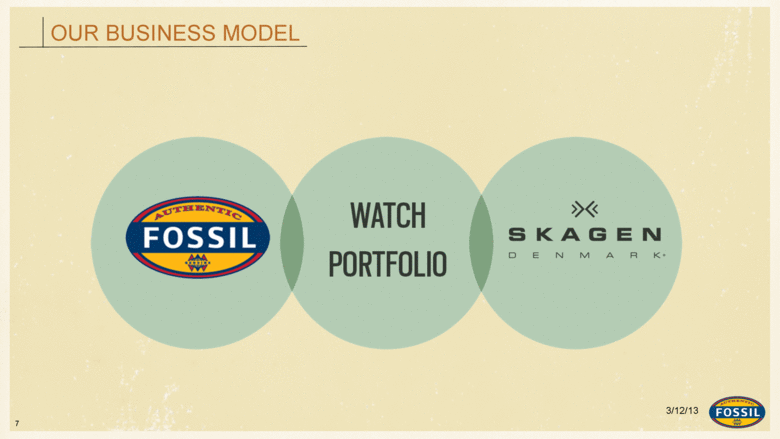
| OUR BUSINESS MODEL 7 3/12/13 |
| 8 3/12/13 |
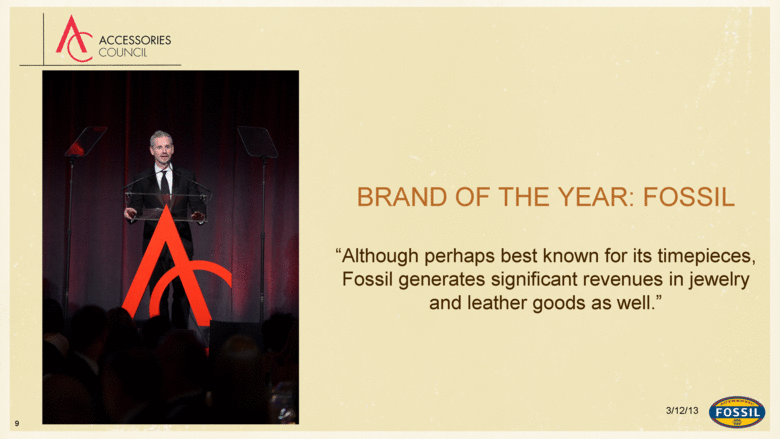
| BRAND OF THE YEAR: FOSSIL “Although perhaps best known for its timepieces, Fossil generates significant revenues in jewelry and leather goods as well.” 9 3/12/13 |
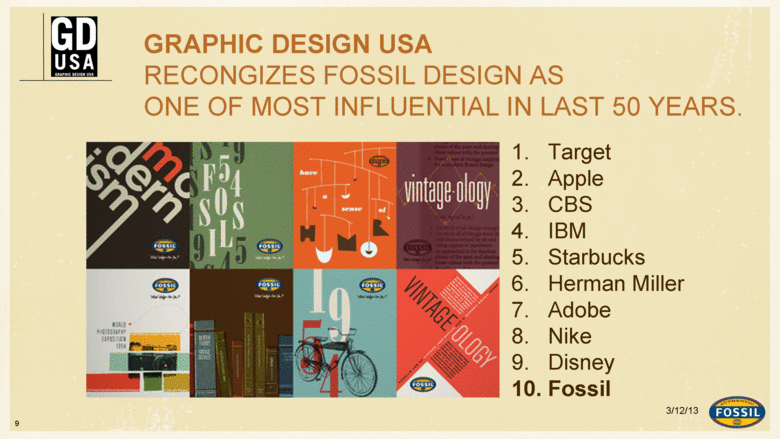
| 9 3/12/13 GRAPHIC DESIGN USA RECONGIZES FOSSIL DESIGN AS ONE OF MOST INFLUENTIAL IN LAST 50 YEARS. 1. Target 2. Apple 3. CBS 4. IBM 5. Starbucks 6. Herman Miller 7. Adobe 8. Nike 9. Disney 10. Fossil |
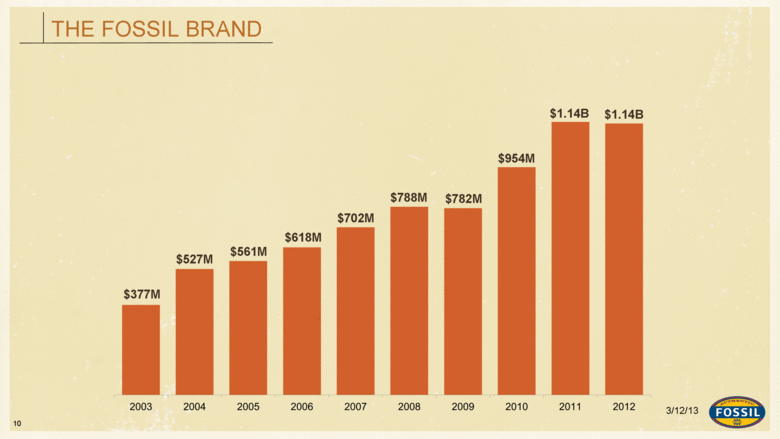
| THE FOSSIL BRAND 10 $377M $782M $954M $1.14B $1.14B $788M $702M $618M $561M $527M 3/12/13 |
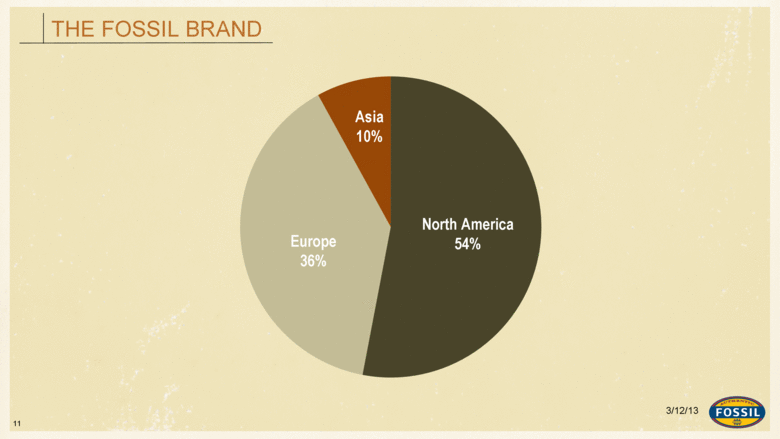
| THE FOSSIL BRAND 11 North America 54% Europe 36% Asia 10% 3/12/13 |
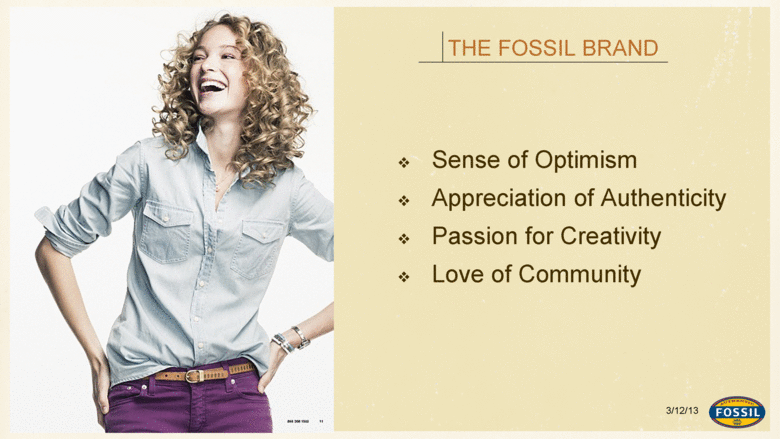
| Sense of Optimism Appreciation of Authenticity Passion for Creativity Love of Community THE FOSSIL BRAND 12 3/12/13 |
| 13 3/12/13 |
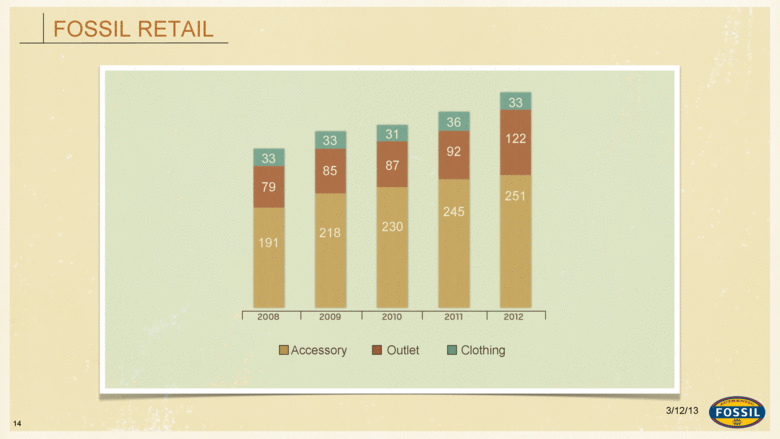
| FOSSIL RETAIL Accessory Outlet Clothing 33 85 218 191 79 33 31 87 230 36 92 245 33 122 251 14 3/12/13 |
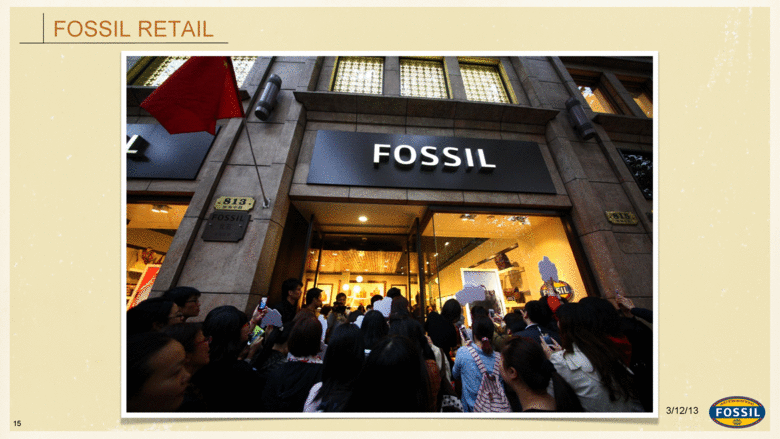
| FOSSIL RETAIL 15 3/12/13 |
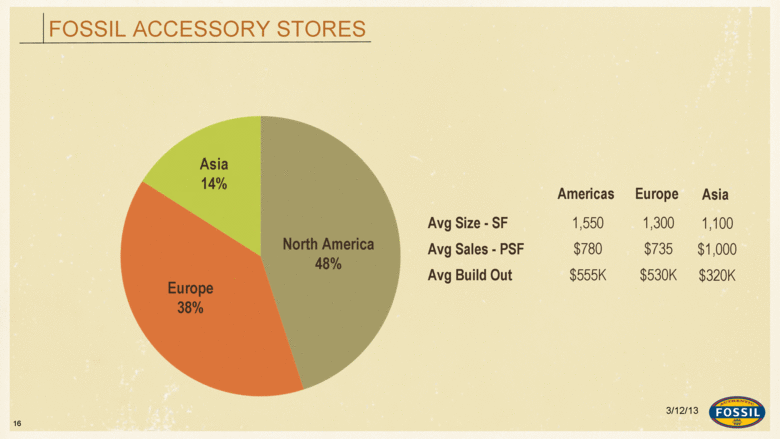
| FOSSIL ACCESSORY STORES 16 North America 48% Europe 38% Asia 14% Americas Europe Avg Size - SF 1,550 1,300 Avg Sales - PSF $780 $735 Avg Build Out $555K $530K Asia 1,100 $1,000 $320K 3/12/13 |
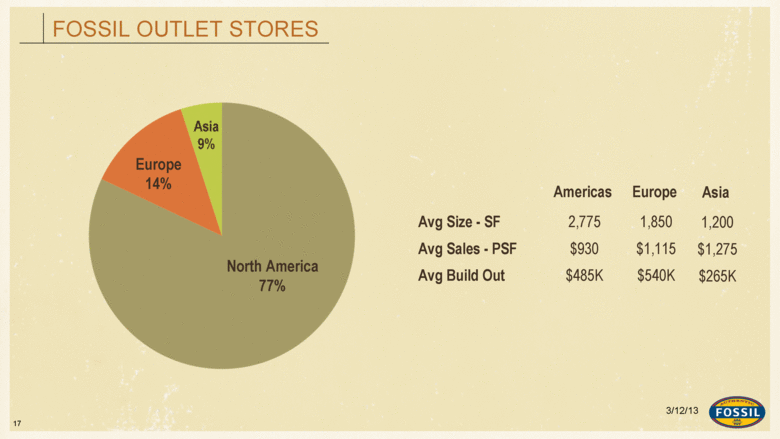
| FOSSIL OUTLET STORES 17 North America 77% Europe 14% Asia 9% Americas Europe Avg Size - SF 2,775 1,850 Avg Sales - PSF $930 $1,115 Avg Build Out $485K $540K Asia 1,200 $1,275 $265K 3/12/13 |
| 18 3/12/13 |
| 19 |
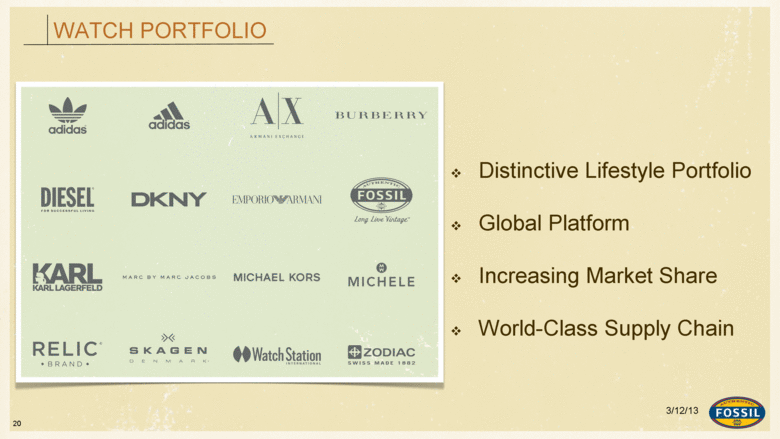
| WATCH PORTFOLIO Distinctive Lifestyle Portfolio Global Platform Increasing Market Share World-Class Supply Chain 20 3/12/13 |
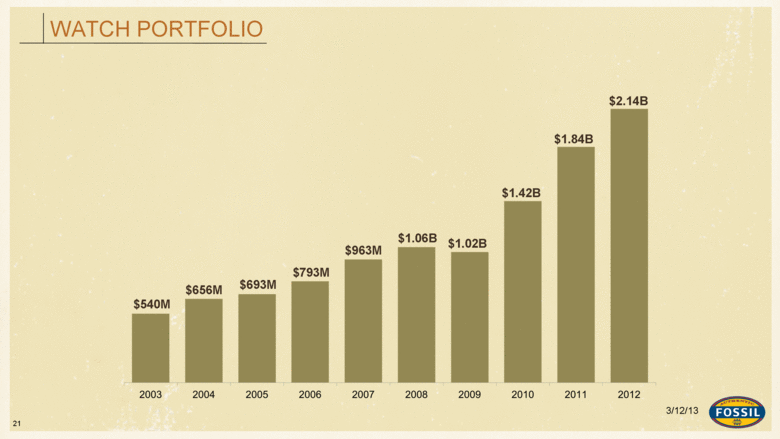
| WATCH PORTFOLIO 20 3/12/13 |
| WATCH PORTFOLIO 21 $1.02B $1.42B $1.84B $1.06B $963M $793M $693M $656M $2.14B $540M 3/12/13 |
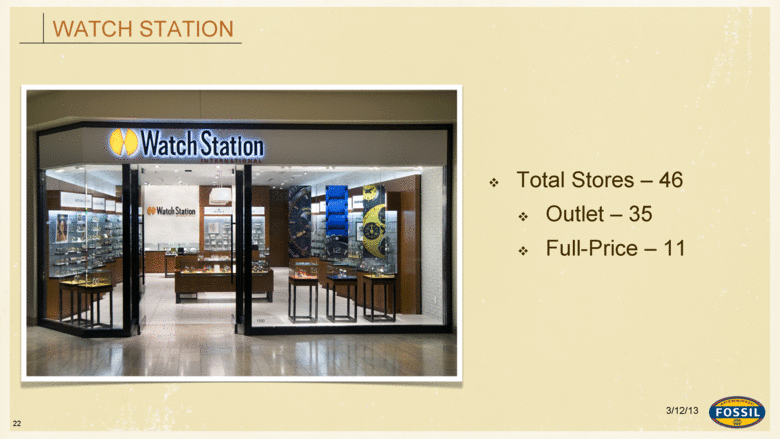
| WATCH STATION Total Stores – 46 Outlet – 35 Full-Price – 11 22 3/12/13 |
| ASIA CONCESSION OPPORTUNITY Total Concessions – 270 Multi-brand – 227 Fossil – 30 Mono-brand – 13 23 3/12/13 |
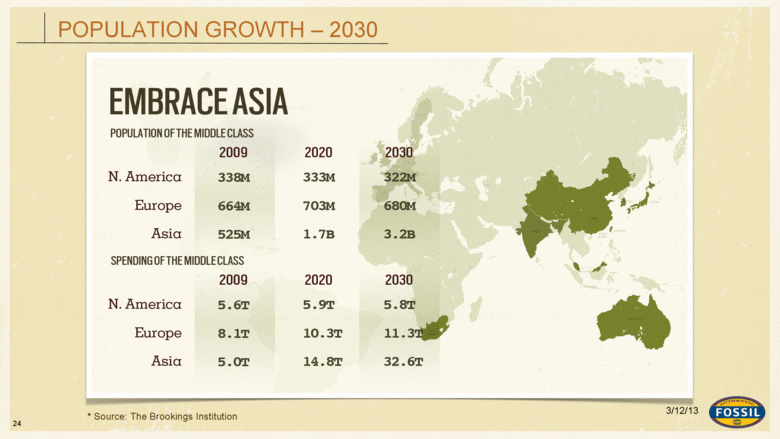
| POPULATION GROWTH – 2030 * Source: The Brookings Institution 24 3/12/13 |
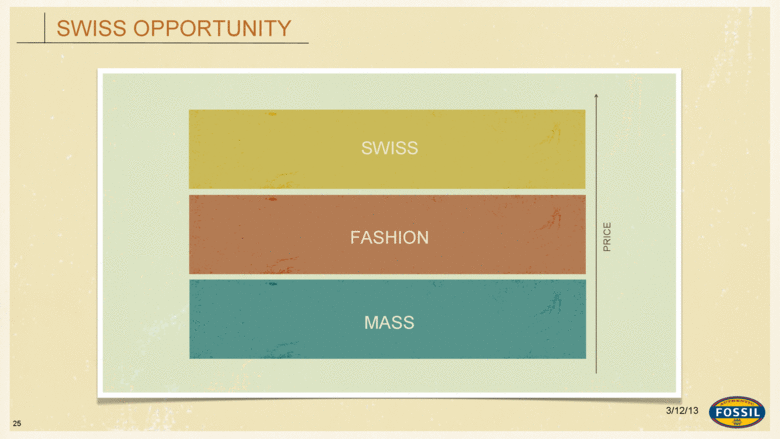
| SWISS OPPORTUNITY SWISS FASHION MASS PRICE 25 3/12/13 |
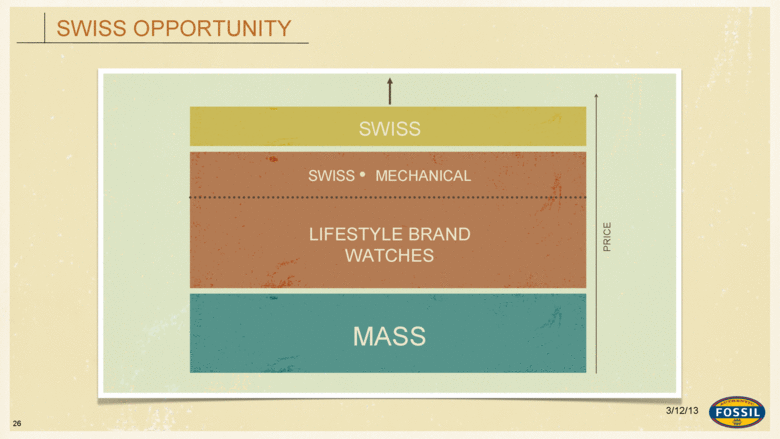
| SWISS OPPORTUNITY SWISS LIFESTYLE BRAND WATCHES MASS PRICE SWISS MECHANICAL 26 3/12/13 |
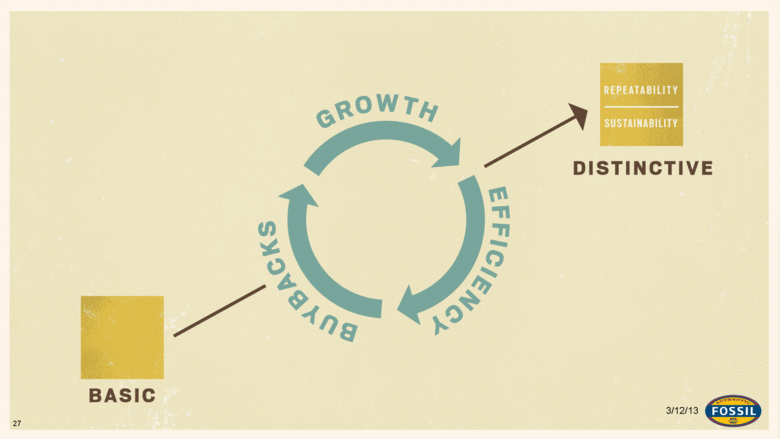
| 27 3/12/13 |
| Financials 28 3/12/13 |
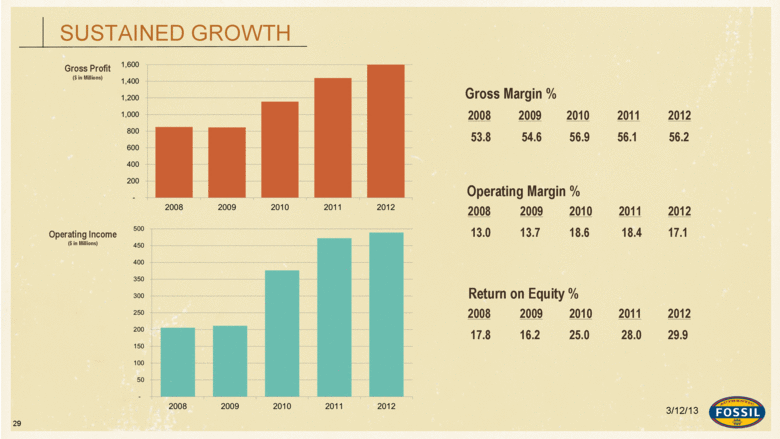
| SUSTAINED GROWTH 29 2008 2009 2010 2011 2012 53.8 54.6 56.9 56.1 56.2 Gross Margin % 2008 2009 2010 2011 2012 13.0 13.7 18.6 18.4 17.1 Operating Margin % Gross Profit ($ in Millions) Operating Income ($ in Millions) 2008 2009 2010 2011 2012 17.8 16.2 25.0 28.0 29.9 Return on Equity % 3/12/13 |
| Leverage strategic investments Mix shift to higher-margin regions (Asia impact) Direct channel growth and productivity Effective use of capital Ongoing stock buyback LONG-TERM OPPORTUNITIES 30 3/12/13 |
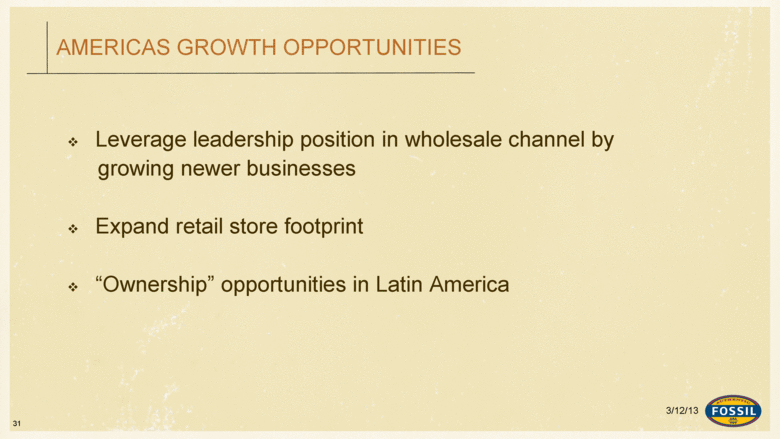
| Leverage leadership position in wholesale channel by growing newer businesses Expand retail store footprint “Ownership” opportunities in Latin America AMERICAS GROWTH OPPORTUNITIES 31 3/12/13 |
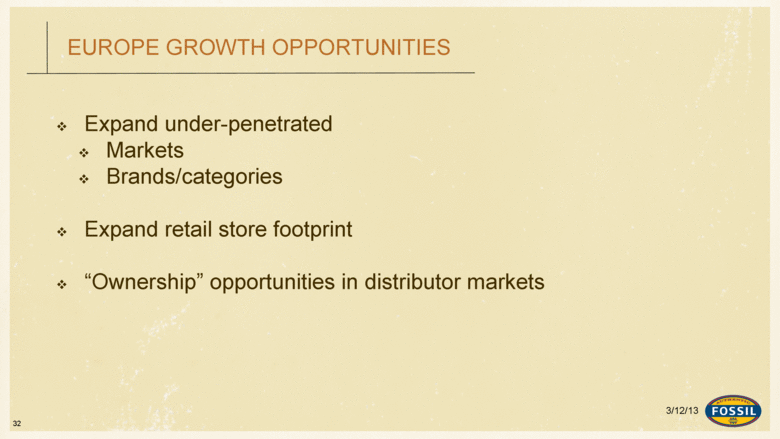
| EUROPE GROWTH OPPORTUNITIES Expand under-penetrated Markets Brands/categories Expand retail store footprint “Ownership” opportunities in distributor markets 32 3/12/13 |
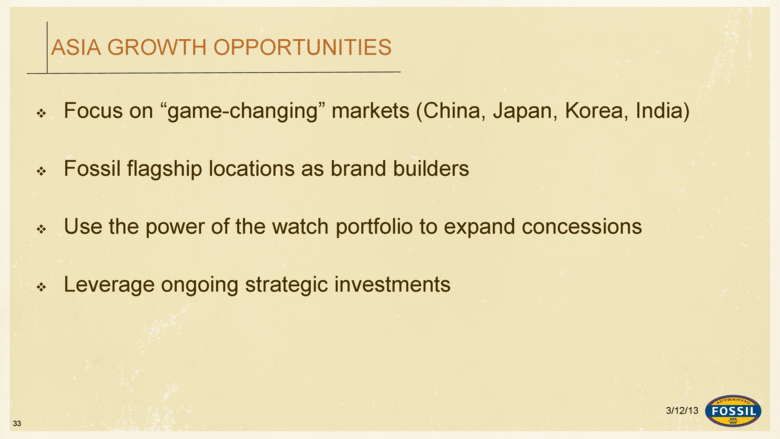
| Focus on “game-changing” markets (China, Japan, Korea, India) Fossil flagship locations as brand builders Use the power of the watch portfolio to expand concessions Leverage ongoing strategic investments ASIA GROWTH OPPORTUNITIES 33 3/12/13 |
| THANKS for stopping by! |
