Registration No. 333- 192918
SECURITIES AND EXCHANGE COMMISSION
Washington, D. C. 20549
Form N-14
REGISTRATION STATEMENT
| | |
| UNDER | | |
| THE SECURITIES ACT OF 1933 | | x |
| Pre-Effective Amendment No. 1 | | |
| |
| Post-Effective Amendment No. | | |
and/or
REGISTRATION STATEMENT
UNDER
| | |
THE INVESTMENT COMPANY ACT OF 1940 | | x |
| Amendment No. | | |
IVY FUNDS
(a Delaware statutory trust)
(Exact Name as Specified in Charter)
| | | | |
| 6300 Lamar Avenue, Overland Park, Kansas | | 66202-4200 | | |
| (Address of Principal Executive Office) | | (Zip Code) | | |
Registrant’s Telephone Number, including Area Code (913) 236-2000
Mara D. Herrington
6300 Lamar Avenue
Overland Park, Kansas 66202-4200
(Name and Address of Agent for Service)
Copies to:
Alan P. Goldberg
K&L Gates LLP
70 West Madison Street
Suite 3100
Chicago, IL 60602
Approximate Date of Proposed Public Offering: As soon as practicable after the Registration Statement becomes effective under the Securities Act of 1933.
Title of Securities Being Registered: Shares of Beneficial Interest, $0.001 par value per share.
An indefinite amount of the Registrant’s securities has been registered under the Securities Act of 1933 pursuant to Rule 24f-2 under the Investment Company Act of 1940. In reliance upon such Rule, no filing fee is being paid at this time.
It is proposed that this filing will go effective on January 30, 2014 pursuant to Rule 488.
IVY FUNDS
IVY ASSET STRATEGY NEW OPPORTUNITIES FUND
6300 LAMAR AVENUE
OVERLAND PARK, KANSAS 66202-4200
Dear Shareholder:
As a shareholder of the Ivy Asset Strategy New Opportunities Fund, you are invited to vote on a proposal to reorganize your Fund into the Ivy Emerging Markets Equity Fund (formerly, the Ivy Pacific Opportunities Fund). Your Fund will hold a special meeting of shareholders on March 6, 2014, at 4:00PM, Central Time, to consider the proposed reorganization. The specific details and reasons for the proposed reorganization are contained in the enclosed combined Prospectus and Proxy Statement. Please read it carefully.
After careful consideration, the Board of Trustees of Ivy Funds unanimously approved the proposed reorganization and recommends that shareholders vote “FOR” the proposal.
This special meeting will be held at 6300 Lamar Avenue, Overland Park, Kansas 66202-4200. While we hope you can attend this meeting, it is very important that you vote your shares at your earliest convenience. To assist with the solicitation of proxies, we have engaged Broadridge Financial Solutions, Inc., a proxy solicitation firm. As the meeting date approaches, if you have not voted your shares you may receive a phone call from them urging you to vote your shares.
Your vote is important, regardless of the number of shares you own. It is important that we receive your vote no later than the time of the special meeting of shareholders on March 6, 2014. If you have more than one account registered in your name, you will receive a separate proxy card for each account. Please vote and return each proxy card that you receive, or take advantage of the telephonic or electronic voting procedures described in the proxy card(s). Please help your Fund avoid the expense of a follow-up mailing by voting today!
If you have any questions regarding the enclosed combined Prospectus and Proxy Statement, please call Broadridge at 1-877-605-2536, Ivy Client Services at 1-800-777-6472 or your financial advisor.
We appreciate your participation and prompt response in these matters and thank you for your continued support.
Sincerely,

Henry J. Herrmann
President
January 29, 2014
IVY ASSET STRATEGY NEW OPPORTUNITIES FUND
NOTICE OF SPECIAL MEETING OF SHAREHOLDERS
TO BE HELD MARCH 6, 2014
NOTICE IS HEREBY GIVEN that a Special Meeting of the shareholders of the Ivy Asset Strategy New Opportunities Fund will be held at 4:00PM, Central Time, on March 6, 2014, at 6300 Lamar Avenue, Overland Park, Kansas 66202-4200 for these purposes:
| | 1. | To approve an Agreement and Plan of Reorganization providing for the transfer of all of the assets of Ivy Asset Strategy New Opportunities Fund to, and the assumption of all of the liabilities of the Ivy Asset Strategy New Opportunities Fund by, the Ivy Emerging Markets Equity Fund in exchange for shares of the Ivy Emerging Markets Equity Fund and the distribution of such shares to the shareholders of the Ivy Asset Strategy New Opportunities Fund in complete liquidation of the Ivy Asset Strategy New Opportunities Fund. |
| | 2. | To consider and act upon any other matters that may properly come before the meeting and any adjourned session of the meeting. |
Shareholders of record at the close of business on January 17, 2014, are entitled to notice of and to vote at the meeting and any adjourned session.
By order of the Board of Trustees of Ivy Funds,

Mara Herrington
Secretary
January 29, 2014
Your vote is important, regardless of the number of shares you own. You can vote easily and quickly by phone, by mail, by internet or in person. See the enclosed proxy card for instructions.
Please help your Fund avoid the expense of a follow-up mailing by voting today!
Combined Prospectus and Proxy Statement
January 29, 2014
Transfer of all of the Assets and Liabilities of the
Ivy Asset Strategy New Opportunities Fund, a series of
Ivy Funds
By and in Exchange for Shares of and Assumption of Liabilities by
Ivy Emerging Markets Equity Fund, a series of
Ivy Funds
6300 Lamar Avenue
Overland Park, Kansas 66202-4200
TABLE OF CONTENTS
This Combined Prospectus and Proxy Statement (“Prospectus/Proxy”) contains information you should know before voting on the Agreement and Plan of Reorganization (the “Plan”) relating to the proposed reorganization (the “Reorganization”) of the Ivy Asset Strategy New Opportunities Fund (the “Asset Strategy New Opportunities Fund”) into the Ivy Emerging Markets Equity Fund (formerly, the Ivy Pacific Opportunities Fund) (the “Emerging Markets Equity Fund,” and together with the Asset Strategy New Opportunities Fund, the “Funds”) at a Special Meeting of Shareholders of the Asset Strategy New Opportunities Fund (the “Meeting”), which will be held at 4:00PM, Central Time, on March 6, 2014 at 6300 Lamar Avenue, Overland Park, Kansas.
The Funds are each a series of Ivy Funds, a registered, open-end management investment company organized as a Delaware statutory trust (the “Trust”). The Asset Strategy New Opportunities Fund’s investment objective is to seek to provide total return. The Emerging Markets Equity Fund’s investment objective is to seek to provide growth of capital. You should read this Prospectus/Proxy, which contains important information you should know, and keep it for future reference.
This Prospectus/Proxy will be mailed to shareholders on or about February 5, 2014. Also enclosed is the Prospectus for the Emerging Markets Equity Fund dated January 29, 2014.
1
The Proposal in this Prospectus/Proxy relates to the Reorganization. If the Reorganization of the Asset Strategy New Opportunities Fund occurs, you will become a shareholder of the Emerging Markets Equity Fund. If the Plan is approved by the shareholders of the Asset Strategy New Opportunities Fund and the Reorganization occurs, the Asset Strategy New Opportunities Fund will transfer all of the assets and liabilities attributable to each class of its shares to the Emerging Markets Equity Fund in exchange for shares of the same class of shares of the Emerging Markets Equity Fund with the same aggregate net asset value (“NAV”) as the net value of the assets and liabilities transferred. After that exchange, shares of each class received by the Asset Strategy New Opportunities Fund will be distributed pro rata to the Asset Strategy New Opportunities Fund’s shareholders of the corresponding class.
Shareholders of the Asset Strategy New Opportunities Fund are being asked to vote on the Proposal in this Prospectus/Proxy. Please review the Proposal carefully.
Please review the enclosed Prospectus and the unaudited financial statements contained in the Funds’ semi-annual report, relating to the Funds for the six-month period ended September 30, 2013, each of which contains important information about the Funds you should know, and keep them for future reference. These documents are incorporated into this Prospectus/Proxy by reference. The following documents have been filed with the Securities and Exchange Commission (the “SEC”) and are incorporated into this Prospectus/Proxy by reference:
| | – | The Prospectus for the funds of the Trust dated July 31, 2013, relating to the Funds (as supplemented October 2, 2013, November 6, 2013, November 21, 2013, November 25, 2013 and January 2, 2014) (the “Combined Prospectus”). |
| | – | The Statement of Additional Information for the funds of the Trust dated July 31, 2013, relating to the Funds (as supplemented October 3, 2013, November 21, 2013, November 25, 2013 and January 2, 2014) (the “Combined SAI”). |
| | – | The Prospectus for the Emerging Markets Equity Fund dated January 29, 2014. |
| | – | The Statement of Additional Information for the Emerging Markets Equity Fund dated January 29, 2014. |
| | – | The audited financial statements included in the Funds’ Annual Report to shareholders, relating to the Funds dated March 31, 2013, and the unaudited financial statements and Fund highlights included in the Funds’ Semi-Annual Report to shareholders relating to the Funds dated September 30, 2013. |
| | – | The Statement of Additional Information dated January 29, 2014 relating to the Reorganization. |
2
For a free copy of any of the documents listed above, you may call 1-800-777-6472, or you may write to the attention of either Fund at:
Ivy Funds
6300 Lamar Avenue
P. O. Box 29217
Shawnee Mission, Kansas 66201-9217
The Trust is subject to the informational requirements of the Securities Exchange Act of 1934, as amended, and the Investment Company Act of 1940, as amended, and in accordance therewith files reports and other information with the SEC. You also may obtain many of these documents by accessing the Internet site for Ivy Funds at www.ivyfunds.com. Text-only versions of the Ivy Funds documents can be viewed online or downloaded from the EDGAR database on the SEC’s Internet site at www.sec.gov. You can review and copy information about the Funds by visiting the SEC’s Public Reference Room at 100 F Street, N.E., Washington, D.C. 20549 or at the SEC’s Northeast Regional Office (3 World Financial Center, New York, New York 10281) or Midwest Regional Office (175 W. Jackson Boulevard, Suite 900, Chicago, Illinois 60604). You can obtain copies, upon payment of a duplicating fee, by sending an e-mail request to publicinfo@sec.gov or by writing the SEC Public Reference Branch, Office of Consumer Affairs and Information Services, Securities and Exchange Commission, Washington, D.C. 20549. Information on the operations of the Public Reference Room may be obtained by calling 1.202.551.8090.
The Securities and Exchange Commission has not approved or disapproved these securities or determined if this Prospectus/Proxy is truthful or complete. Any representation to the contrary is a criminal offense.
3
SYNOPSIS
This Prospectus/Proxy provides a brief overview of the key features and other matters typically of concern to shareholders affected by a reorganization of a mutual fund into another mutual fund. These responses are qualified in their entirety by the remainder of this Prospectus/Proxy, which you should read carefully because it contains additional information and further details regarding the Reorganization. The description of the Reorganization is qualified by reference to the full text of the Plan, which is attached as Appendix A.
| 1. | WHAT IS BEING PROPOSED? |
Both the Asset Strategy New Opportunities Fund and the Emerging Markets Equity Fund are series of the Trust. The Board of Trustees of the Trust (the “Board”) is recommending approval of the Plan. This means that the Emerging Markets Equity Fund would receive all of the assets and liabilities of the Asset Strategy New Opportunities Fund in exchange for shares of the Emerging Markets Equity Fund. Please see the answer to Question 4 below and the “Summary of The Funds” section of this Prospectus/Proxy for more information comparing the investment strategies and policies of the Funds.
If the Plan is approved and the resulting Reorganization is consummated, your shares of the Asset Strategy New Opportunities Fund will be cancelled and you will receive shares of the Emerging Markets Equity Fund with an aggregate NAV value equal to the aggregate NAV of your Asset Strategy New Opportunities Fund shares as of the business day before the closing of the Reorganization. The Reorganization currently is scheduled to take place on or around March 17, 2014.
| 2. | WHY IS THE REORGANIZATION BEING PROPOSED? |
The Board recommends approval of the Plan and the Reorganization because it offers shareholders of the Asset Strategy New Opportunities Fund the opportunity to invest in a larger fund (allowing the potential for more efficient operations by spreading relatively fixed costs, such as audit and legal fees, over a larger asset base). In reviewing the Reorganization, the Board also considered the following factors, among others:
| | – | the Board considered the desirability of continuing to maintain the Asset Strategy New Opportunities Fund given its performance and size. After considering the proposed Reorganization and other alternatives identified by Ivy Investment Management Company (“IICO” or “Adviser”), the Board concluded that reorganizing the Asset Strategy New Opportunities Fund into the Emerging Markets Equity Fund, a larger fund with an investment strategy focused in equity investments in emerging markets in a growing asset class, would be in the best interests of each Fund; |
4
| | – | based on estimated expense ratios calculated using each Fund’s net assets and numbers of shareholders as of September 30, 2013, shareholders of the Asset Strategy New Opportunities Fund are expected to experience the same or lower net expenses after expense reimbursements; |
| | – | the Emerging Markets Equity Fund has a better performance record for a longer period of time; |
| | – | the Funds are both diversified, share the same concentration policy and fundamental investment restrictions; and |
| | – | the Reorganization is expected to be tax-free for shareholders of the Asset Strategy New Opportunities Fund who choose to remain shareholders of the Emerging Markets Equity Fund, while a liquidation or shareholder redemption would be a realization event for tax purposes. |
Please review “Reasons for the Reorganization” in the “Information about the Reorganization” section under “Proposal” in this Prospectus/Proxy for more information regarding the factors considered by the Board.
| 3. | WHAT EMERGING MARKETS EQUITY FUND SHARES WILL I RECEIVE IN THE REORGANIZATION? |
The shares of the Emerging Markets Equity Fund you receive in exchange for your Asset Strategy New Opportunities Fund shares will have an aggregate NAV equal to the aggregate NAV of your respective Asset Strategy New Opportunities Fund shares as of the close of business on the business day before the closing of the Reorganization. If you own Class A, Class B, Class C, Class E, Class I, Class R and Class Y shares of the Asset Strategy New Opportunities Fund, you will receive Class A, Class B, Class C, Class E, Class I, Class R and Class Y shares of the Emerging Markets Equity Fund, respectively. You will have voting rights identical to those you currently have, but as a shareholder of the Emerging Markets Equity Fund. The rights of the shareholders of each Fund are identical since each Fund is a series of the Trust.
The Emerging Markets Equity Fund distributes net investment income annually in December, while the Asset Strategy New Opportunities Fund distributes net investment income quarterly. Distributions for the Emerging Markets Equity Fund will continue to be paid annually in December after the Reorganization. Net realized capital gains (and any gains from foreign currency transactions) ordinarily are distributed by each Fund in December and will continue to be distributed annually by the Emerging Markets Equity Fund after the Reorganization. All shareholder features that you have elected will remain available and in effect after the Reorganization unless you direct that those elections be changed.
For more information on the characteristics of the Emerging Markets Equity Fund shares you will receive in comparison to the Asset Strategy New Opportunities Fund
5
shares you currently own, please see the section “Shares You Will Receive” in the “Information About the Reorganization” section of this Prospectus/Proxy.
| 4. | HOW DO THE FUNDS’ INVESTMENT OBJECTIVES, STRATEGIES AND RISKS COMPARE? |
The following summarizes the primary similarities and differences in the Funds’ investment objectives, principal investment strategies and risks. Please see the “Summary of The Funds” section of this Prospectus/Proxy for more information comparing the investment strategies and policies of the Funds.
The Asset Strategy New Opportunities Fund’s investment objective is to seek to provide total return. The Emerging Markets Equity Fund’s investment objective is to seek to provide growth of capital. The Asset Strategy New Opportunities Fund’s investment objective is broader than the Emerging Markets Equity Fund’s investment objective in that the Asset Strategy New Opportunities Fund may seek income and growth of capital.
Generally, the Asset Strategy New Opportunities Fund’s investment strategy is broader than the Emerging Markets Equity Fund’s investment strategy. While the Asset Strategy New Opportunities Fund may invest in the same asset classes and countries as the Emerging Markets Equity Fund, it also may invest in additional asset classes and countries. The Asset Strategy New Opportunities Fund seeks to achieve its objective by allocating its assets primarily among stocks, bonds and short-term instruments of issuers in markets around the globe, as well as investments in derivative instruments, precious metals and investments with exposure to various foreign currencies. The Fund may invest its assets in any market that IICO believes can offer a high probability of return or, alternatively, can provide a high degree of relative safety in uncertain times. Depending on its outlook for the U.S. and global economies, IICO identifies growth themes and then focuses its strategy on allocating the Fund’s assets among stocks, bonds, cash, precious metals, currency and derivative instruments, including derivatives traded over-the-counter or on exchanges.
The Emerging Markets Equity Fund invests, under normal circumstances, at least 80% of its net assets in equity securities, primarily common stock, of companies whose securities are located within emerging market countries or economically linked to emerging market countries. Emerging market countries include, but are not limited to, those considered to be developing by the International Monetary Fund, the World Bank, the International Financial Corporation or one of the leading global investment banks. Generally, IICO, has broad discretion to identify other countries that it considers to qualify as emerging market countries. The majority of these countries are likely to be located in Asia, Latin America, the Middle East, Central and Eastern Europe, and Africa. The Fund may invest in companies of any size and market capitalization and in companies of any industry in any such country.
6
The primary difference between the Funds is that the Asset Strategy New Opportunities Fund may invest in more asset classes and more countries. The Emerging Markets Equity Fund utilizes an investment strategy focused in equity investments in emerging markets. The investment process followed by the Funds’ portfolio managers to identify investments and countries are substantively similar. There is overlap between the Funds’ investment portfolios. Each Fund is managed by IICO, but the Funds have different portfolio managers. Frederick Jiang is primarily responsible for the day-to-day management of the Emerging Markets Equity Fund. Mr. Jiang has held his Fund responsibilities since February 2004 and will continue his responsibilities after the Reorganization. Jonas Krumplys is primarily responsible for the day-to-day management of the Asset Strategy New Opportunities Fund. Mr. Krumplys has held his Fund responsibilities since May 2010. After the reorganization, it is expected that Messrs. Krumplys and Jiang will serve as portfolio managers of the combined Fund.
In addition, both Funds are diversified and have the same fundamental investment restrictions.
As of September 30, 2013, the Asset Strategy New Opportunities Fund held 52 equity securities in its portfolio with a median market cap of $4.5 billion, while the Emerging Markets Equity Fund held 69 equity securities in its portfolio with a median market cap of $9.6 billion. The Asset Strategy New Opportunities Fund held 9 equity securities, representing 12.3% of its assets that were also held in the Emerging Markets Equity Fund, and the Emerging Markets Equity Fund held 9 equity securities, representing 12.9% of its assets that were also held in the Asset Strategy New Opportunities Fund.
The Funds are subject to many common risks that include: Company Risk, Emerging Market Risk, Foreign Currency Risk, Foreign Securities Risk, Growth Stock Risk, Liquidity Risk, Management Risk, Market Risk, Mid Size Company Risk and Small Company Risk. The Emerging Markets Equity Fund also is subject to Large Company Risk.
| 5. | HOW DO THE FUNDS COMPARE IN SIZE? |
As of September 30, 2013, the Emerging Markets Equity Fund’s net assets were approximately $573.1 million and Asset Strategy New Opportunities Fund’s net assets were approximately $251.2 million. The asset size of each Fund fluctuates on a daily basis and the asset size of the Emerging Markets Equity Fund after the Reorganization may be larger or smaller than the combined assets of the Funds as of September 30, 2013. More current total net asset information is available at www.ivyfunds.com.
7
| 6. | WILL THE REORGANIZATION RESULT IN A HIGHER INVESTMENT ADVISORY FEE RATE AND HIGHER FUND EXPENSE RATES? |
The Reorganization will result in lower advisory fees for each Fund. Asset Strategy New Opportunities Fund’s net management fee, as a percent of its average net assets, for the fiscal year ended March 31, 2013 was 1.00%. Emerging Markets Equity Fund’s net management fee for the same period was 0.96%, and is estimated to have been 0.93% if the Reorganization had occurred on April 1, 2012. The Reorganization would have resulted in slightly higher Fund expense rates, for Class A and Class B shareholders of Asset Strategy New Opportunities Fund, but not for any other classes of shares. However, IICO has agreed to limit the operating expenses that will be charged to Class A and Class B shareholders of the Emerging Markets Equity Fund to be equal to the lowest expense ratio of such classes for either the Asset Strategy New Opportunities Fund or the Emerging Markets Equity Fund for a two year period, if the Reorganization is approved by shareholders.
The table below shows, for each Fund, total average net assets and the total expense ratio, with and without waivers, as of March 31, 2013. The table shows total average net assets and the total average expense ratio with and without the expense reimbursement agreement for the Emerging Markets Equity Fund, assuming the Reorganization occurred on April 1, 2012.
| | | | | | | | | | | | |
| | | | | | Total Annual Operating Expense
Ratio (including Interest Expenses) | |
Fund/Share Class | | Average Net
Assets | | | Excluding
Waivers | | | Including
Waivers | |
Asset Strategy New Opportunities Fund | | | | | | | | | | | | |
Class A Shares | | $ | 179,488,000 | | | | 1.72 | % | | | 1.50 | %1 |
Class B Shares | | $ | 6,013,000 | | | | 2.50 | % | | | 2.50 | % |
Class C Shares | | $ | 57,794,000 | | | | 2.35 | % | | | 2.35 | % |
Class E Shares | | $ | 103,000 | | | | 1.50 | % | | | 1.50 | % |
Class I Shares | | $ | 60,590,000 | | | | 1.29 | % | | | 1.25 | %1 |
Class R Shares | | $ | 561,000 | | | | 1.87 | % | | | 1.87 | % |
Class Y Shares | | $ | 6,440,000 | | | | 1.54 | % | | | 1.50 | %2 |
Emerging Markets Equity Fund | | | | | | | | | | | | |
Class A Shares | | $ | 486,153,000 | | | | 1.74 | % | | | 1.74 | % |
Class B Shares | | $ | 8,707,000 | | | | 2.94 | % | | | 2.94 | % |
Class C Shares | | $ | 17,148,000 | | | | 2.53 | % | | | 2.53 | % |
Class E Shares | | $ | 108,000 | | | | 1.34 | % | | | 1.34 | % |
Class I Shares | | $ | 140,732,000 | | | | 1.22 | % | | | 1.22 | % |
Class R Shares | | $ | 253,000 | | | | 1.80 | % | | | 1.80 | % |
Class Y Shares | | $ | 5,673,000 | | | | 1.47 | % | | | 1.47 | % |
8
| | | | | | | | | | | | |
| | | | | | Total Annual Operating Expense
Ratio (including Interest Expenses) | |
Fund/Share Class | | Average Net
Assets | | | Excluding
Waivers | | | Including
Waivers | |
Emerging Markets Equity Fund (pro forma assuming Reorganization) | | | | | | | | | | | | |
Class A Shares | | $ | 665,641,000 | | | | 1.69 | % | | | 1.50 | %3 |
Class B Shares | | $ | 14,720,000 | | | | 2.71 | % | | | 2.50 | %3 |
Class C Shares | | $ | 74,942,000 | | | | 2.33 | % | | | 2.33 | % |
Class E Shares | | $ | 211,000 | | | | 1.37 | % | | | 1.37 | % |
Class I Shares | | $ | 201,322,000 | | | | 1.20 | % | | | 1.20 | % |
Class R Shares | | $ | 814,000 | | | | 1.79 | % | | | 1.79 | % |
Class Y Shares | | $ | 12,113,000 | | | | 1.46 | % | | | 1.46 | % |
| 1 | Through July 31, 2015, IICO, the Fund’s investment manager, Ivy Funds Distributor, Inc. (IFDI), the Fund’s distributor, and/or Waddell & Reed Services Company, doing business as WI Services Company (WISC), the Fund’s transfer agent, have contractually agreed to reimburse sufficient management fees, 12b-1 fees and/or shareholder servicing fees to cap the total annual ordinary fund operating expenses for Class A shares at 1.50% and Class I shares at 1.25%. Prior to that date, the expense limitation may not be terminated by IICO, IFDI, WISC or the Board. |
| 2 | Through July 31, 2015, to the extent that the total annual ordinary fund operating expenses of the Class Y shares exceeds the total annual ordinary fund operating expenses of the Class A shares, Ivy Funds Distributor, Inc. (IFDI), the Fund’s distributor, and/or Waddell & Reed Services Company, doing business as WI Services Company (WISC), the Fund’s transfer agent, have contractually agreed to reimburse sufficient 12b-1 and/or shareholder servicing fees to ensure that the total annual ordinary fund operating expenses of the Class Y shares do not exceed the total annual ordinary fund operating expenses of the Class A shares, as calculated at the end of each month. Prior to that date, the expense limitation may not be terminated by IFDI, WISC or the Board. |
| 3 | If the Reorganization is approved, through July 30, 2016, IICO, the Fund’s investment manager, Ivy Funds Distributor, Inc. (IFDI), the Fund’s distributor, and/or Waddell & Reed Services Company, doing business as WI Services Company (WISC), the Fund’s transfer agent, have contractually agreed to reimburse sufficient management fees, 12b-1 fees and/or shareholder servicing fees to cap the total annual ordinary fund operating expenses for Class A shares at 1.50% and Class B shares at 2.50%. Prior to that date, the expense limitation may not be terminated by IICO, IFDI, WISC or the Board. |
Additional pro forma fee, expense, and financial information is included in the “Summary of the Funds” section of this Prospectus/Proxy.
9
| 7. | WHAT ARE THE FEDERAL INCOME TAX CONSEQUENCES OF THE REORGANIZATION? |
The Reorganization is expected to be tax-free to you for federal income tax purposes. This means that neither you nor the Asset Strategy New Opportunities Fund is expected to recognize a gain or loss as a result of the Reorganization.
Immediately prior to the Reorganization, the Asset Strategy New Opportunities Fund will declare and pay a distribution of all net investment company taxable income, if any, and net realized capital gains (after reduction by any available capital loss carry-forwards), if any, to its shareholders. The cost basis and holding period of the Asset Strategy New Opportunities Fund shares are expected to carry over to your new shares in the Emerging Markets Equity Fund.
| 8. | WILL THE SERVICES PROVIDED BY IICO CHANGE? |
No. IICO currently manages both the Asset Strategy New Opportunities Fund and the Emerging Markets Equity Fund, and will continue to serve as investment manager of the Emerging Markets Equity Fund following the Reorganization. In all cases, the Funds have the same service providers. Upon completion of the Reorganization, the Emerging Markets Equity Fund will continue to engage its existing service providers. In all cases, the types of services provided to the Funds under these service arrangements are the same.
| 9. | WILL THERE BE ANY SALES LOAD, COMMISSION OR OTHER TRANSACTION FEE IN CONNECTION WITH THE ACQUISITION? |
No. There will be no sales charge, sales load, commission or other transactional fee in connection with the Reorganization. The full and fractional value of shares of the Asset Strategy New Opportunities Fund will be exchanged for full and fractional corresponding shares of the Emerging Markets Equity Fund having approximately equal aggregate value, without any sales charge, sales load, commission or other transactional fee being imposed.
The shares acquired in the Reorganization may be exchanged for shares of the same class of any other fund in the Ivy Family of Funds without the payment of an additional initial sales charge or contingent deferred sales charge (“CDSC”). The procedures for purchasing and redeeming your shares of the Emerging Markets Equity Fund will be the same after the Reorganization as they are currently for the Asset Strategy New Opportunities Fund.
For Class B and Class C shares, or Class A or Class E shares that you received in connection with the Reorganization to which a CDSC would otherwise apply, the time period for the CDSC will continue to age from the date you purchased the respective shares of the Asset Strategy New Opportunities Fund. Class I, Class R and Class Y shares are not subject to a CDSC.
10
| 10. | MAY I STILL ADD TO MY EXISTING ASSET STRATEGY NEW OPPORTUNITIES FUND ACCOUNT UNTIL THE ACQUISITION? |
Yes. Asset Strategy New Opportunities Fund shareholders may continue to make additional investments until the Closing Date (anticipated to be on or about March 17, 2014), unless the Board determines to limit future investments to ensure a smooth transition of shareholder accounts or for any other reason. In anticipation of the Reorganization, the Asset Strategy New Opportunities Fund is expected to be closed to new shareholders as of February 25, 2014.
| 11. | WILL I NEED TO OPEN AN ACCOUNT IN THE EMERGING MARKETS EQUITY FUND PRIOR TO THE ACQUISITION? |
No. An account will be set up in your name and your shares of the Asset Strategy New Opportunities Fund will automatically be converted to corresponding shares of the Emerging Markets Equity Fund. You will receive confirmation of this transaction following the Reorganization.
| 12. | WILL MY COST BASIS CHANGE AS A RESULT OF THE ACQUISITION? |
Your total cost basis is not expected to change as a result of the Reorganization. However, since the number of shares you hold after the Reorganization may be different than the number of shares you held prior to the Reorganization, your average cost basis per share may change. Since the Reorganization is expected to be treated as a tax-free transaction for the Asset Strategy New Opportunities Fund, shareholders should not recognize any capital gain or loss as a direct result of the Reorganization.
| 13. | WILL EITHER FUND PAY FEES ASSOCIATED WITH THE ACQUISITION? |
The costs of the Reorganization will be borne by the Asset Strategy New Opportunities Fund and IICO in the following percentages (and estimated corresponding dollar amounts): Asset Strategy New Opportunities Fund 50% ($129,466) and IICO 50% ($129,466). The Emerging Markets Equity Fund will bear the transfer agency costs related to the Reorganization and the costs of registration of its shares to be issued to shareholders of the Asset Strategy New Opportunities Fund upon the closing of the Reorganization.
| 14. | WHEN WILL THE ACQUISITION TAKE PLACE? |
The Reorganization will occur on or about the Closing Date, which currently is scheduled for March 17, 2014. Shortly after completion of the Reorganization, affected shareholders will receive a confirmation statement reflecting their new Fund account number and number of shares owned.
11
| 15. | WHAT IF I WANT TO EXCHANGE MY SHARES INTO ANOTHER FUND IN THE TRUST PRIOR TO THE ACQUISITION? |
You may exchange your shares into another fund of the Trust before the Closing Date (on or about March 17, 2014) in accordance with your pre-existing exchange privileges. If you choose to exchange your shares of the Asset Strategy New Opportunities Fund for another fund in the Ivy Family of Funds, your request will be treated as a normal exchange of shares and will be a taxable transaction unless your shares are held in a tax-deferred account, such as an individual retirement account (“IRA”). Exchanges may be subject to minimum investment requirements, sales loads, and redemption fees. This is not an offer to sell shares of other funds of the Trust, it is for informational purposes only. Before exchanging into a fund, please read its prospectus carefully.
12
SUMMARY OF THE FUNDS
This section provides a summary of each Fund, including but not limited to, each Fund’s investment objective, primary investment strategies, restrictions, fees, and historical performance. Please note that this is only a brief discussion and is qualified in its entirety by reference to the information contained herein and incorporated herein by reference. There is no assurance that a Fund will achieve its stated objective. Both Funds are designed for long-term investors who can tolerate greater risk.
Investment Objectives
The Asset Strategy New Opportunities Fund’s investment objective is to seek to provide total return. The Emerging Markets Equity Fund’s investment objective is to seek to provide growth of capital.
Comparison of Fees and Expenses
The types of expenses currently paid by each class of shares of the Asset Strategy New Opportunities Fund are the same types of expenses to be paid by the corresponding share classes of the Emerging Markets Equity Fund. Currently, the Funds have the same investment management agreement and each Fund has the same investment advisory fee rate schedule. The annual investment advisory fee rate payable under the advisory agreements for the Asset Strategy New Opportunities Fund and Emerging Markets Equity Fund were 1.00% and 0.96%, respectively, as a percent of the Fund’s average net assets, for the fiscal year ended March 31, 2013. The difference in the Funds’ advisory fee rate is a result of differences in the Funds’ assets under management.
Current and Pro Forma Fees and Expenses
The following tables compare the fees and expenses you may bear directly or indirectly as an investor in the Asset Strategy New Opportunities Fund versus the Emerging Markets Equity Fund, and show the projected (“pro forma”) estimated fees and expenses of the Emerging Markets Equity Fund, assuming consummation of the Reorganization as of April 1, 2012. Fees and expenses shown for the Asset Strategy New Opportunities Fund and Emerging Markets Equity Fund were determined based on each Fund’s average net assets as of the fiscal year ended March 31, 2013. The pro forma fees and expenses are estimated in good faith and are hypothetical, and do not reflect any change in expense ratios resulting from a change in assets under management since March 31, 2013 for either Fund. Total net assets as of these dates are shown in a footnote to the table. Class E shares are not available for investment. More current total net asset information is available at www.ivyfunds.com. If the Reorganization is approved, IICO has agreed to an expense reimbursement agreement so that all Emerging Markets Equity Fund shareholders will experience the same or lower net expenses that Asset Strategy New
13
Opportunities Fund shareholders experienced as of March 31, 2013 for two years following the Reorganization.
Annual Fund Operating Expenses
Annual Fund Operating Expenses are paid out of a Fund’s assets and include fees for portfolio management and administrative services, including recordkeeping, accounting and other shareholder services. You do not pay these fees directly, but as the examples in the table below show, these costs are borne indirectly by all shareholders.
The Annual Fund Operating Expenses shown in the table below represent annualized expenses for the Asset Strategy New Opportunities Fund and Emerging Markets Equity Fund, as well as those estimated for the Emerging Markets Equity Fund on a pro forma basis, assuming consummation of the Reorganization, for the fiscal year ended March 31, 2013. Total Annual Fund Operating Expenses shown in the table below for the combined Emerging Markets Equity Fund include the expense reimbursement agreement so that all Emerging Markets Equity Fund shareholders will experience the same or lower net expenses that Asset Strategy New Opportunities Fund shareholders experienced as of March 31, 2013 for two years following the Reorganization.
Shareholder Fees
(fees paid directly from your investment)
| | | | | | | | | | | | |
| | | Asset Strategy
New
Opportunities
Fund | | | Emerging
Markets Equity
Fund | | | Emerging
Markets Equity
Fund
(combined
pro forma) | |
Maximum sales charge (load) imposed on purchases (as a % of offering price) | | | | | | | | | | | | |
Class A | | | 5.75 | % | | | 5.75 | % | | | 5.75 | % |
Class B | | | None | | | | None | | | | None | |
Class C | | | None | �� | | | None | | | | None | |
Class E | | | 5.75 | % | | | 5.75 | % | | | 5.75 | % |
Class I | | | None | | | | None | | | | None | |
Class R | | | None | | | | None | | | | None | |
Class Y | | | None | | | | None | | | | None | |
Maximum deferred sales charge (load) on redemptions (as a % of lesser of amount invested or redemption value) | | | | | | | | | | | | |
Class A1 | | | 1.00 | % | | | 1.00 | % | | | 1.00 | % |
Class B1 | | | 5.00 | % | | | 5.00 | % | | | 5.00 | % |
Class C1 | | | 1.00 | % | | | 1.00 | % | | | 1.00 | % |
Class E | | | None | | | | None | | | | None | |
Class I | | | None | | | | None | | | | None | |
Class R | | | None | | | | None | | | | None | |
Class Y | | | None | | | | None | | | | None | |
14
| | | | | | | | | | | | |
| | | Asset Strategy
New
Opportunities
Fund | | | Emerging
Markets Equity
Fund | | | Emerging
Markets Equity
Fund
(combined
pro forma) | |
Maximum Account Fee | | | | | | | | | | | | |
Class A | | $ | 20 | 2 | | $ | 20 | 2 | | $ | 20 | 2 |
Class B | | | None | | | | None | | | | None | |
Class C | | $ | 20 | 2 | | $ | 20 | 2 | | $ | 20 | 2 |
Class E | | | None | | | | None | | | | None | |
Class I | | | None | | | | None | | | | None | |
Class R | | | None | | | | None | | | | None | |
Class Y | | | None | | | | None | | | | None | |
| 1 | For Class A shares, a 1% contingent deferred sales charge is only imposed on Class A shares that were purchased at net asset value for $1 million or more that are subsequently redeemed within 12 months of purchase. For Class B shares, the CDSC declines from 5% for redemptions within the first year of purchase, to 4% for redemptions within the second year, to 3% for redemptions within the third and fourth years, to 2% for redemptions within the fifth year, to 1% for redemptions within the sixth year and to 0% for redemptions after the sixth year. For Class C shares, a 1% CDSC applies to redemptions within 12 months of purchase. |
| 2 | With limited exceptions, for Class A and Class C shares, if your account balance is below $750 at the close of business on September 26, 2014, and on the Friday prior to the last week of September each year thereafter, the account will be assessed an account fee of $20. |
Annual Fund Operating Expenses
(expenses that you pay each year as a percentage of the value of your investment)
| | | | | | | | | | | | |
| | | Asset Strategy
New
Opportunities
Fund | | | Emerging
Markets Equity
Fund | | | Emerging
Markets Equity
Fund
(combined
pro forma) | |
Management Fees | | | | | | | | | | | | |
Class A | | | 1.00 | % | | | 0.96 | % | | | 0.93 | % |
Class B | | | 1.00 | % | | | 0.96 | % | | | 0.93 | % |
Class C | | | 1.00 | % | | | 0.96 | % | | | 0.93 | % |
Class E | | | 1.00 | % | | | 0.96 | % | | | 0.93 | % |
Class I | | | 1.00 | % | | | 0.96 | % | | | 0.93 | % |
Class R | | | 1.00 | % | | | 0.96 | % | | | 0.93 | % |
Class Y | | | 1.00 | % | | | 0.96 | % | | | 0.93 | % |
Distribution and Service (12b-1) Fees | | | | | | | | | | | | |
Class A | | | 0.25 | % | | | 0.25 | % | | | 0.25 | % |
Class B | | | 1.00 | % | | | 1.00 | % | | | 1.00 | % |
Class C | | | 1.00 | % | | | 1.00 | % | | | 1.00 | % |
Class E | | | 0.25 | % | | | 0.25 | % | | | 0.25 | % |
Class I | | | 0.00 | % | | | 0.00 | % | | | 0.00 | % |
Class R | | | 0.50 | % | | | 0.50 | % | | | 0.50 | % |
Class Y | | | 0.25 | % | | | 0.25 | % | | | 0.25 | % |
15
| | | | | | | | | | | | |
| | | Asset Strategy
New
Opportunities
Fund | | | Emerging
Markets Equity
Fund | | | Emerging
Markets Equity
Fund
(combined
pro forma) | |
Other Expenses | | | | | | | | | | | | |
Class A | | | 0.47 | % | | | 0.53 | % | | | 0.51 | % |
Class B | | | 0.50 | % | | | 0.98 | % | | | 0.78 | % |
Class C | | | 0.35 | % | | | 0.57 | % | | | 0.40 | % |
Class E | | | 0.25 | % | | | 0.13 | % | | | 0.19 | % |
Class I | | | 0.29 | % | | | 0.26 | % | | | 0.27 | % |
Class R | | | 0.37 | % | | | 0.34 | % | | | 0.36 | % |
Class Y | | | 0.29 | % | | | 0.26 | % | | | 0.28 | % |
Total Annual Fund Operating Expenses | | | | | | | | | | | | |
Class A | | | 1.72 | % | | | 1.74 | % | | | 1.69 | % |
Class B | | | 2.50 | % | | | 2.94 | % | | | 2.71 | % |
Class C | | | 2.35 | % | | | 2.53 | % | | | 2.33 | % |
Class E | | | 1.50 | % | | | 1.34 | % | | | 1.37 | % |
Class I | | | 1.29 | % | | | 1.22 | % | | | 1.20 | % |
Class R | | | 1.87 | % | | | 1.80 | % | | | 1.79 | % |
Class Y | | | 1.54 | % | | | 1.47 | % | | | 1.46 | % |
Fee Wavier and/or Expense Reimbursement | | | | | | | | | | | | |
Class A | | | (0.22 | )%1 | | | 0.00 | % | | | (0.19 | )%3 |
Class B | | | 0.00 | % | | | 0.00 | % | | | (0.21 | )%3 |
Class C | | | 0.00 | % | | | 0.00 | % | | | 0.00 | % |
Class E | | | 0.00 | % | | | 0.00 | % | | | 0.00 | % |
Class I | | | (0.04 | )%1 | | | 0.00 | % | | | 0.00 | % |
Class R | | | 0.00 | % | | | 0.00 | % | | | 0.00 | % |
Class Y | | | (0.04 | )%2 | | | 0.00 | % | | | 0.00 | % |
Total Annual Fund Operating Expenses After Fee Waiver and/or Expense Reimbursement | | | | | | | | | | | | |
Class A | | | 1.50 | % | | | 1.74 | % | | | 1.50 | % |
Class B | | | 2.50 | % | | | 2.94 | % | | | 2.50 | % |
Class C | | | 2.35 | % | | | 2.53 | % | | | 2.33 | % |
Class E | | | 1.50 | % | | | 1.34 | % | | | 1.37 | % |
Class I | | | 1.25 | % | | | 1.22 | % | | | 1.20 | % |
Class R | | | 1.87 | % | | | 1.80 | % | | | 1.79 | % |
Class Y | | | 1.50 | % | | | 1.47 | % | | | 1.46 | % |
| 1 | Through July 31, 2015, IICO, the Fund’s investment manager, Ivy Funds Distributor, Inc. (IFDI), the Fund’s distributor, and/or Waddell & Reed Services Company, doing business as WI Services Company (WISC), the Fund’s transfer agent, have contractually agreed to reimburse sufficient management fees, 12b-1 fees and/or shareholder servicing fees to cap the total annual |
16
| | ordinary fund operating expenses for Class A shares at 1.50% and Class I shares at 1.25%. Prior to that date, the expense limitation may not be terminated by IICO, IFDI, WISC or the Board. |
| 2 | Through July 31, 2015, to the extent that the total annual ordinary fund operating expenses of the Class Y shares exceeds the total annual ordinary fund operating expenses of the Class A shares, Ivy Funds Distributor, Inc. (IFDI), the Fund’s distributor, and/or Waddell & Reed Services Company, doing business as WI Services Company (WISC), the Fund’s transfer agent, have contractually agreed to reimburse sufficient 12b-1 and/or shareholder servicing fees to ensure that the total annual ordinary fund operating expenses of the Class Y shares do not exceed the total annual ordinary fund operating expenses of the Class A shares, as calculated at the end of each month. Prior to that date, the expense limitation may not be terminated by IFDI, WISC or the Board. |
| 3 | If the Reorganization is approved, through July 30, 2016, IICO, the Fund’s investment manager, Ivy Funds Distributor, Inc. (IFDI), the Fund’s distributor, and/or Waddell & Reed Services Company, doing business as WI Services Company (WISC), the Fund’s transfer agent, have contractually agreed to reimburse sufficient management fees, 12b-1 fees and/or shareholder servicing fees to cap the total annual ordinary fund operating expenses for Class A shares at 1.50% and Class B shares at 2.50%. Prior to that date, the expense limitation may not be terminated by IICO, IFDI, WISC or the Board. |
Examples:
These Examples are intended to help you compare the cost of investing in the Asset Strategy New Opportunities Fund, the Emerging Markets Equity Fund and the Emerging Markets Equity Fund, after the Reorganization, with the cost of investing in other mutual funds. The Examples assume that you invest $10,000 in the Asset Strategy New Opportunities Fund, the Emerging Markets Equity Fund and the Emerging Markets Equity Fund after the Reorganization for the time periods indicated and reinvest all dividends and distributions. The Examples also assume that your investment has a 5% return each year, that the Funds’ operating expenses without waivers remain the same and that expenses were capped for the periods indicated above. Although your actual costs may be higher or lower, based on these assumptions your costs would be:
If shares are redeemed:
| | | | | | | | | | | | | | | | |
| | | 1 Year | | | 3 Years | | | 5 Years | | | 10 Years | |
Class A Shares | | | | | | | | | | | | | | | | |
Ivy Asset Strategy New Opportunities Fund | | $ | 719 | | | $ | 1,066 | | | $ | 1,435 | | | $ | 2,471 | |
Ivy Emerging Markets Equity Fund | | $ | 742 | | | $ | 1,091 | | | $ | 1,464 | | | $ | 2,509 | |
Ivy Emerging Markets Equity Fund (pro forma, assuming consummation of the Reorganization) | | $ | 719 | | | $ | 1,041 | | | $ | 1,406 | | | $ | 2,427 | |
17
| | | | | | | | | | | | | | | | |
| | | 1 Year | | | 3 Years | | | 5 Years | | | 10 Years | |
Class B Shares | | | | | | | | | | | | | | | | |
Ivy Asset Strategy New Opportunities Fund | | $ | 653 | | | $ | 1,079 | | | $ | 1,431 | | | $ | 2,644 | |
Ivy Emerging Markets Equity Fund | | $ | 697 | | | $ | 1,210 | | | $ | 1,648 | | | $ | 2,978 | |
Ivy Emerging Markets Equity Fund (pro forma, assuming consummation of the Reorganization) | | $ | 653 | | | $ | 1,101 | | | $ | 1,496 | | | $ | 2,763 | |
Class C Shares | | | | | | | | | | | | | | | | |
Ivy Asset Strategy New Opportunities Fund | | $ | 238 | | | $ | 733 | | | $ | 1,255 | | | $ | 2,686 | |
Ivy Emerging Markets Equity Fund | | $ | 256 | | | $ | 788 | | | $ | 1,345 | | | $ | 2,866 | |
Ivy Emerging Markets Equity Fund (pro forma, assuming consummation of the Reorganization) | | $ | 236 | | | $ | 727 | | | $ | 1,245 | | | $ | 2,666 | |
Class E Shares | | | | | | | | | | | | | | | | |
Ivy Asset Strategy New Opportunities Fund | | $ | 739 | | | $ | 1,082 | | | $ | 1,446 | | | $ | 2,463 | |
Ivy Emerging Markets Equity Fund | | $ | 724 | | | $ | 1,035 | | | $ | 1,367 | | | $ | 2,295 | |
Ivy Emerging Markets Equity Fund (pro forma, assuming consummation of the Reorganization) | | $ | 726 | | | $ | 1,041 | | | $ | 1,379 | | | $ | 2,324 | |
Class I Shares | | | | | | | | | | | | | | | | |
Ivy Asset Strategy New Opportunities Fund | | $ | 127 | | | $ | 405 | | | $ | 704 | | | $ | 1,553 | |
Ivy Emerging Markets Equity Fund | | $ | 124 | | | $ | 387 | | | $ | 670 | | | $ | 1,477 | |
Ivy Emerging Markets Equity Fund (pro forma, assuming consummation of the Reorganization) | | $ | 122 | | | $ | 381 | | | $ | 660 | | | $ | 1,455 | |
Class R Shares | | | | | | | | | | | | | | | | |
Ivy Asset Strategy New Opportunities Fund | | $ | 190 | | | $ | 588 | | | $ | 1,011 | | | $ | 2,190 | |
Ivy Emerging Markets Equity Fund | | $ | 183 | | | $ | 566 | | | $ | 975 | | | $ | 2,116 | |
Ivy Emerging Markets Equity Fund (pro forma, assuming consummation of the Reorganization) | | $ | 182 | | | $ | 563 | | | $ | 970 | | | $ | 2,105 | |
Class Y Shares | | | | | | | | | | | | | | | | |
Ivy Asset Strategy New Opportunities Fund | | $ | 153 | | | $ | 483 | | | $ | 836 | | | $ | 1,831 | |
Ivy Emerging Markets Equity Fund | | $ | 150 | | | $ | 465 | | | $ | 803 | | | $ | 1,757 | |
Ivy Emerging Markets Equity Fund (pro forma, assuming consummation of the Reorganization) | | $ | 149 | | | $ | 462 | | | $ | 797 | | | $ | 1,746 | |
18
If shares are not redeemed:
| | | | | | | | | | | | | | | | |
| | | 1 Year | | | 3 Years | | | 5 Years | | | 10 Years | |
Class A Shares | | | | | | | | | | | | | | | | |
Ivy Asset Strategy New Opportunities Fund | | $ | 719 | | | $ | 1,066 | | | $ | 1,435 | | | $ | 2,471 | |
Ivy Emerging Markets Equity Fund | | $ | 742 | | | $ | 1,091 | | | $ | 1,464 | | | $ | 2,509 | |
Ivy Emerging Markets Equity Fund (pro forma, assuming consummation of the Reorganization) | | $ | 719 | | | $ | 1,041 | | | $ | 1,406 | | | $ | 2,427 | |
Class B Shares | | | | | | | | | | | | | | | | |
Ivy Asset Strategy New Opportunities Fund | | $ | 253 | | | $ | 779 | | | $ | 1,331 | | | $ | 2,644 | |
Ivy Emerging Markets Equity Fund | | $ | 297 | | | $ | 910 | | | $ | 1,548 | | | $ | 2,978 | |
Ivy Emerging Markets Equity Fund (pro forma, assuming consummation of the Reorganization) | | $ | 253 | | | $ | 801 | | | $ | 1,396 | | | $ | 2,763 | |
Class C Shares | | | | | | | | | | | | | | | | |
Ivy Asset Strategy New Opportunities Fund | | $ | 238 | | | $ | 733 | | | $ | 1,255 | | | $ | 2,686 | |
Ivy Emerging Markets Equity Fund | | $ | 256 | | | $ | 788 | | | $ | 1,345 | | | $ | 2,866 | |
Ivy Emerging Markets Equity Fund (pro forma, assuming consummation of the Reorganization) | | $ | 236 | | | $ | 727 | | | $ | 1,245 | | | $ | 2,666 | |
Class E Shares | | | | | | | | | | | | | | | | |
Ivy Asset Strategy New Opportunities Fund | | $ | 739 | | | $ | 1,082 | | | $ | 1,446 | | | $ | 2,463 | |
Ivy Emerging Markets Equity Fund | | $ | 724 | | | $ | 1,035 | | | $ | 1,367 | | | $ | 2,295 | |
Ivy Emerging Markets Equity Fund (pro forma, assuming consummation of the Reorganization) | | $ | 726 | | | $ | 1,041 | | | $ | 1,379 | | | $ | 2,324 | |
Class I Shares | | | | | | | | | | | | | | | | |
Ivy Asset Strategy New Opportunities Fund | | $ | 127 | | | $ | 405 | | | $ | 704 | | | $ | 1,553 | |
Ivy Emerging Markets Equity Fund | | $ | 124 | | | $ | 387 | | | $ | 670 | | | $ | 1,477 | |
Ivy Emerging Markets Equity Fund (pro forma, assuming consummation of the Reorganization) | | $ | 122 | | | $ | 381 | | | $ | 660 | | | $ | 1,455 | |
Class R Shares | | | | | | | | | | | | | | | | |
Ivy Asset Strategy New Opportunities Fund | | $ | 190 | | | $ | 588 | | | $ | 1,011 | | | $ | 2,190 | |
Ivy Emerging Markets Equity Fund | | $ | 183 | | | $ | 566 | | | $ | 975 | | | $ | 2,116 | |
I Ivy Emerging Markets Equity Fund (pro forma, assuming consummation of the Reorganization) | | $ | 182 | | | $ | 563 | | | $ | 970 | | | $ | 2,105 | |
Class Y Shares | | | | | | | | | | | | | | | | |
Ivy Asset Strategy New Opportunities Fund | | $ | 153 | | | $ | 483 | | | $ | 836 | | | $ | 1,831 | |
Ivy Emerging Markets Equity Fund | | $ | 150 | | | $ | 465 | | | $ | 803 | | | $ | 1,757 | |
Ivy Emerging Markets Equity Fund (pro forma, assuming consummation of the Reorganization) | | $ | 149 | | | $ | 462 | | | $ | 797 | | | $ | 1,746 | |
19
The Examples do not reflect sales charges (loads) on reinvested dividends and other distributions. If these sales charges (loads) were included, your costs would be higher.
Portfolio Turnover
Each Fund pays transaction costs, such as commissions, when it buys and sells securities (or “turns over” its portfolio). A higher portfolio turnover rate may indicate higher transaction costs and may result in higher taxes when Fund shares are held in a taxable account. These costs, which are not reflected in annual fund operating expenses or in the Examples, affect the Funds’ performance. During the six-month period ended September 30, 2013, the Asset Strategy New Opportunities Fund’s portfolio turnover rate was 51% of the average value of its portfolio and the Emerging Markets Equity Fund’s portfolio turnover rate was 70% of the average value of its portfolio.
Principal Investment Strategies
The Asset Strategy New Opportunities Fund and the Emerging Markets Equity Fund have similar investment objectives, investment strategies and policies, but there are important differences. The key differences are outlined in the table below.
This table compares the investment objectives and principal investment strategies of the Asset Strategy New Opportunities Fund to those of the Emerging Markets Equity Fund. The primary difference between the Funds is that the Asset Strategy New Opportunities Fund may invest in more asset classes and more countries. The Emerging Markets Equity Fund utilizes an investment strategy focused in equity investments in emerging markets. Each Fund is managed by IICO and the investment process followed by the Funds’ portfolio managers to identify investments and countries are substantively similar. There is overlap between the Fund’s investment portfolios. Based on its review of the Funds’ respective investment portfolios, IICO has determined that their respective holdings generally are compatible and, as a result, believes that all or substantially all of the Asset Strategy New Opportunities Fund’s assets are suitable for transfer to the Emerging Markets Equity Fund pursuant to the Reorganization.
20
| | |
ASSET STRATEGY NEW
OPPORTUNITIES FUND | | EMERGING MARKETS
EQUITY FUND |
| |
| INVESTMENT OBJECTIVE: To seek to provide total return. | | INVESTMENT OBJECTIVE. To seek to provide growth of capital. |
| |
– The Fund seeks to achieve its objective by allocating its assets primarily among stocks, bonds and short-term instruments of issuers in markets around the globe, as well as investments in derivative instruments, precious metals and investments with exposure to various foreign currencies. – The Fund may invest its assets in any market that IICO believes can offer a high probability of return or, alternatively, can provide a high degree of relative safety in uncertain times. Dependent on its outlook for the U.S. and global economies, IICO identifies growth themes and then focuses its strategy on allocating the Fund’s assets among stocks, bonds, cash, precious metals, currency and derivative instruments, including derivatives traded over-the-counter or on exchanges. After determining these allocations, IICO seeks attractive opportunities within each market by focusing generally on issuers in countries, sectors and companies with strong cash flow streams and low balance sheet leverage. The Fund, however, may also invest in issuers with higher balance sheet leverage if IICO believes that the Fund will be appropriately compensated for the increased risk. | | – The Fund invests, under normal circumstances, at least 80% of its net assets, plus any borrowings for investment purposes, in equity securities, primarily common stock, of companies from countries considered to be emerging market countries or economically linked to emerging market countries. Emerging market countries include, but are not limited to, those considered to be developing by the International Monetary Fund, the World Bank, the International Financial Corporation or one of the leading global investment banks. Generally, IICO, has broad discretion to identify other countries that it considers to qualify as emerging market countries. The majority of these countries are likely to be located in Asia, Latin America, the Middle East, Central and Eastern Europe, and Africa. The Fund may invest in companies of any size and market capitalization and in companies of any industry in any such country. |
21
| | |
– IICO may allocate the Fund’s investments among these different types of securities in different proportions at different times, including up to 100% in stocks of small-to-mid-cap issuers, bonds, or short-term instruments, respectively. – IICO may exercise a flexible strategy in the selection of securities, and the Fund is not required to allocate its investments among stocks and bonds in any fixed proportion, nor is it limited by investment style or by the issuer’s location, size, market capitalization or industry sector except that its stock holdings will be securities of primarily small-to-mid-cap companies. The Fund may have none, some or all of its assets invested in each asset class in relative proportions that change over time based upon market and economic conditions. Subject to diversification limits, the Fund also may invest up to 25% of its total assets in precious metals. | | – The Fund may invest up to 100% of its total assets in foreign securities. Subject to the 80% policy noted above, the Fund may also invest in companies that are not in emerging countries: (1) if the portfolio manager believes that the performance of a company or its industry will be influenced by opportunities in the emerging markets; (2) to maintain exposure to industry segments where the portfolio manager believes there are not satisfactory investment opportunities in emerging market countries; and (3) if the portfolio manager believes there is the potential for significant benefit to the Fund. – IICO utilizes a top-down approach of worldwide analysis in order to identify what it believes are the best emerging market countries and sectors for growth, and balances the top-down analysis with a bottom-up stock selection process to identify stocks that it believes may outperform that market over a one to three year period and are best positioned to maximize their competitive advantage. IICO uses an investment approach that focuses on analyzing a company’s financial statements and taking advantage of overvalued or undervalued emerging markets. |
22
| | |
| |
– The Fund may gain exposure to commodities, including precious metals, derivatives and commodity-linked instruments by investing in a subsidiary organized in the Cayman Islands (the “Subsidiary”). The Subsidiary is wholly owned and controlled by the Fund. Should the Fund invest in the Subsidiary, it would be expected to provide the Fund with exposure to investment returns from commodities, derivatives and commodity-linked instruments within the limits of the Federal tax requirements applicable to investment companies, such as the Fund. The Subsidiary is subject to the same general investment policies and restrictions as the Fund, except that unlike the Fund, the Subsidiary is able to invest without limitation in commodities, derivatives and commodity-linked instruments and, to the extent the Subsidiary invests in derivative instruments, it may use leveraged investment techniques. – IICO may reduce the Fund’s net equity exposure by selling, among other instruments, combined futures and option positions, and may effect short sales of individual securities and/or exchange-traded funds (“ETFs”) or take long positions in inverse ETFs. | | – The Fund may invest in companies of any size and market capitalization and in companies of any industry in any such country. Market risk for small or medium-sized companies may be greater than for large companies. For example, smaller companies may have less certain growth prospects, limited financial resources, limited product lines, volatile trading and price fluctuation or inexperienced management. – Although the Fund invests primarily in companies from countries considered to be emerging market countries, the Fund will also invest in companies that are not in emerging countries: (1) if the portfolio manager believes that the performance of a company or its industry will be influenced by opportunities in the emerging markets; (2) to maintain exposure to industry segments where the portfolio manager believes there are not satisfactory investment opportunities in emerging market countries; and (3) if the portfolio manager believes there is the potential for significant benefit to the Fund. – Subject to diversification limits, the Fund may invest up to 20% of its total assets in precious metals. Investments in physical commodities, including precious metals, may experience severe price fluctuations over short periods of time; as well, storage and trading costs may exceed the custodial and/or brokerage costs associated with other investments. |
23
| | |
– IICO may, when consistent with the Fund’s investment objective, seek to manage exposure to certain securities, companies, sectors, markets, foreign currencies and/or precious metals and seek to hedge certain event risks on positions held by the Fund. In an effort to manage exposure to companies, sectors or equity markets, IICO may utilize various instruments including, but not limited to, the following: futures contracts; both long and short positions on foreign and U.S. equity indices; total return swaps; and options contracts, both written and purchased, on foreign and U.S. equity indices and/or on individual equity securities. In seeking to manage foreign currency exposure, IICO may utilize forward contracts and option contracts, both written and purchased, either to increase or decrease exposure to a given currency. In seeking to manage the Fund’s exposure to precious metals, IICO may utilize futures contracts, both long and short positions as well as options contracts, both written and purchased, on precious metals. – Generally, in determining whether to sell a security, IICO considers many factors, which may include a deterioration in a company’s fundamentals caused by global-specific factors such as geo-political landscape changes, regulatory or currency changes, or increased competition, as well as company-specific factors, such as reduced pricing power, diminished market opportunity, or increased competition. | | – The Fund may gain exposure to commodities, including precious metals, derivatives and commodity-linked instruments by investing in a subsidiary organized in the Cayman Islands (the “Subsidiary”). The Subsidiary is wholly owned and controlled by the Fund. Should the Fund invest in the Subsidiary, it would be expected to provide the Fund with exposure to investment returns from commodities, derivatives and commodity-linked instruments within the limits of the Federal tax requirements applicable to investment companies, such as the Fund. The Subsidiary is subject to the same general investment policies and restrictions as the Fund, except that unlike the Fund, the Subsidiary is able to invest without limitation in commodities, derivatives and commodity-linked instruments and, to the extent the Subsidiary invests in derivative instruments, it may use leveraged investment techniques. |
24
| | |
| | – The Fund may use a range of derivative instruments to gain exposure to certain individual securities that are not available for direct purchase, to hedge various market and event risks (such as interest rates, currency exchange rates, and broad or specific equity or fixed-income market movements), to manage foreign currency risk and as a means of generating additional income from written options. Derivative instruments that may be used include total return swaps, options, both written and purchased on individual equity securities, and forward contracts to either increase or decrease exposure to a given currency. – In determining whether to sell a security, IICO generally considers whether the security has failed to meet its growth expectations, whether its valuation has exceeded its target, or whether it has lost confidence in management. IICO may also sell a security to reduce the Fund’s holding in that security, to take advantage of what it believes are more attractive investment opportunities or to raise cash. |
25
For more information concerning investment policies and restrictions, see the Funds’ Combined SAI and the SAI for the Emerging Markets Equity Fund.
Principal Investment Risks
All of the principal risks applicable to the Funds are described below. As previously noted, the Funds have different investment objectives and investment strategies. An investment in the Emerging Markets Equity Fund involves different risks than an investment in the Asset Strategy New Opportunities Fund, as noted below. The fact that a particular risk is not identified does not mean that a Fund, as part of its overall investment strategy, does not invest or is precluded from investing in securities that give rise to that risk.
As with any mutual fund, the value of a Fund’s shares will change, and you could lose money on your investment. A variety of factors can affect the investment performance of a Fund and prevent it from achieving its objective. These include:
| | | | |
| Principal Risk | | Funds Subject to
that Principal Risk | | Description of that Principal Risk
in the Funds’ Current Prospectus |
Commodities Risk | | Asset Strategy New Opportunities Fund | | Commodity trading, including trading in precious metals, is generally considered speculative because of the significant potential for investment loss. Among the factors that could affect the value of a Fund’s investments in commodities are cyclical economic conditions, sudden political events and adverse international monetary policies. Markets for commodities are likely to be volatile and there may be sharp price fluctuations even during periods when prices overall are rising. Also, a Fund may pay more to store and accurately value its commodity holdings than it does with its other portfolio investments. Moreover, under the Federal tax law, a Fund may not derive more than 10% of its annual gross income from gains resulting from selling commodities (and other non-qualifying income). Accordingly, a Fund may be required to hold its commodities or sell them at a loss, or to sell portfolio securities at a gain, when, for investment reasons, it would not otherwise do so. |
Company Risk | | Asset Strategy New Opportunities Fund and Emerging Markets Equity Fund | | An individual company may perform differently than the overall market. This may be a result of specific factors such as changes in corporate profitability due to the success or failure of specific products or management strategies, or it may be due to changes in investor perceptions regarding a company. |
26
| | | | |
| Principal Risk | | Funds Subject to
that Principal Risk | | Description of that Principal Risk
in the Funds’ Current Prospectus |
Credit Risk | | Asset Strategy New Opportunities Fund | | An issuer of a debt security (including a mortgage-backed security) or a real estate investment trust (REIT) may not make payments on the security when due, or the other party to a contract may default on its obligation. There is also the risk that an issuer could suffer adverse changes in its financial condition that could lower the credit quality of a security. This could lead to greater volatility in the price of the security and, therefore, in the NAV of a Fund. Also, a change in the quality rating of a debt security or a REIT security can affect the security’s liquidity and make it more difficult to sell. If a Fund purchases unrated securities and obligations, it will depend on the Investment Manager’s analysis of credit risk more heavily than usual. |
Derivatives Risk | | Asset Strategy New Opportunities Fund | | A derivative is a financial instrument whose value or return is “derived,” in some manner, from the price of another security, index, asset, rate or event. Derivatives are traded either on an organized exchange or OTC. Futures contracts, options and swaps are common types of derivatives that a Fund may occasionally use. A futures contract is an agreement to buy or sell a security or other instrument, index, or commodity at a specific price on a specific date. An option is the right to buy or sell a security or other instrument, index, or commodity at a specific price on or before a specific date. A swap is an agreement involving the exchange by a Fund with another party of their respective commitments to pay or receive payments at specified dates on the basis of a specified amount. Swaps include options on commodities, caps, floors, collars and certain forward contracts. Some swaps currently are, and more in the future will be, centrally settled (“cleared”). The use of derivatives presents several risks, including the risk that these instruments may change in value in a manner that adversely affects a Fund’s NAV and the risk that fluctuations in the value of the derivatives may not correlate with securities markets or the underlying asset upon which the derivative’s value is based. Moreover, some derivatives are more sensitive to interest rate changes and market price fluctuations than others. To the extent the judgment of the Investment Manager as to certain anticipated price movements is incorrect, the risk of loss may be greater than if the derivative technique(s) had not been used. Derivatives also may be subject to counterparty risk, which includes the risk that a Fund may sustain a loss as a result of the insolvency or bankruptcy of, or other non-compliance by, another party to the transaction. Certain derivatives can create leverage, which may amplify or otherwise increase a Fund’s investment loss, possibly in an amount that could exceed the cost of that instrument or, under certain circumstances, that could be unlimited. |
27
| | | | |
| Principal Risk | | Funds Subject to
that Principal Risk | | Description of that Principal Risk
in the Funds’ Current Prospectus |
| | | | Each Fund may enter into credit default swap contracts for hedging or investment purposes. A Fund may either sell or buy credit protection under these contracts. Swap instruments may shift a Fund’s investment exposure from one type of investment to another. Swap agreements also may have a leverage component, and adverse changes in the value or level of the underlying asset, reference rate or index can result in gains or losses that are substantially greater than the amount invested in the swap itself. Certain swaps have the potential for unlimited loss, regardless of the size of the initial investment. The use of swap agreements entails certain risks that may be different from, or possibly greater than, the risks associated with investing directly in the referenced assets that underlie the swap agreement. Swaps are highly specialized instruments that require investment techniques and risk analyses different from those associated with stocks, bonds, and other traditional investments. Certain derivatives transactions are not entered into or traded on exchanges or cleared by clearing organizations. Instead, such derivatives may be entered into directly with the counterparty and may be traded only through financial institutions acting as market makers. OTC derivatives transactions can only be entered into with a willing counterparty. Where no such counterparty is available for a desired transaction, a Fund will be unable to enter into the transaction. There also may be greater risk that no liquid secondary market in the trading of OTC derivatives will exist, in which case a Fund may be required to hold such instruments until exercise, expiration or maturity. Certain of the protections afforded to exchange participants will not be available to participants in OTC derivatives transactions. OTC derivatives transactions are not subject to the guarantee of an exchange or clearinghouse and, as a result, a Fund would bear greater risk of default by the counterparties to such transactions. When traded on foreign exchanges, derivatives may not be regulated as rigorously as in the United States, may not involve a clearing mechanism and related guarantees, and will be subject to the risk of governmental actions affecting trading in, or the prices of, foreign securities, currencies and other instruments. |
28
| | | | |
| Principal Risk | | Funds Subject to
that Principal Risk | | Description of that Principal Risk
in the Funds’ Current Prospectus |
| | | | The counterparty risk for exchange-traded derivatives is generally less than for privately negotiated or OTC derivatives, since generally an exchange or clearinghouse, which is the issuer or counterparty to each exchange-traded instrument, provides a guarantee of performance. For privately negotiated instruments, there is no similar exchange or clearinghouse guarantee. In all such transactions, the Fund bears the risk that the counterparty will default, and this could result in a loss of the expected benefit of the derivative transactions and possibly other losses to the Fund. A Fund will enter into transactions in derivative instruments only with counterparties that the Investment Manager reasonably believes are capable of performing under the contract. The Investment Manager may seek to manage counterparty risk in an OTC derivative transaction by entering into bilateral collateral documentation, such as a Credit Support Annex and an accompanying Account Control Agreement, where it is market practice to do so for the particular type of derivative; however, there is no guarantee that such documentation will have the intended effect. The enactment of the Dodd-Frank Wall Street Reform and Consumer Protection Act (Dodd-Frank Act) resulted in historic and comprehensive statutory reform of derivatives, including the manner in which derivatives are designed, negotiated, reported, executed or cleared and regulated. The Dodd-Frank Act requires the SEC and the Commodity Futures Trading Commission (CFTC) to establish regulations with respect to security-based swaps (e.g., derivatives based on an equity) and swaps (e.g., derivatives based on a broad-based index or commodity), respectively, and the markets in which these instruments trade. Generally, all futures will continue to be regulated by the CFTC, and all swaps and security-based swaps are subject to CFTC and SEC jurisdiction, respectively. However, security futures, which are futures on a single equity security or a narrow-based securities index, and mixed swaps, which have elements of both a swap and a security-based swap, are subject to joint CFTC-SEC jurisdiction. In addition, with respect to security-based swap agreements, which include swaps on a broad-based securities index, the SEC asserts anti-fraud, anti-manipulation and insider trading prohibition jurisdiction, even though the CFTC has regulatory jurisdiction over transactions involving such agreements. |
29
| | | | |
| Principal Risk | | Funds Subject to
that Principal Risk | | Description of that Principal Risk
in the Funds’ Current Prospectus |
| | | | Specifically, the SEC and CFTC are required to mandate by regulation under certain circumstances that certain derivatives, previously traded OTC, be executed in a regulated, transparent market and settled by means of a central clearing house. The Dodd-Frank Act also requires the CFTC or the SEC, in consultation with banking regulators, to establish capital requirements as well as requirements for margin on uncleared derivatives in certain circumstances that will be clarified by rules that the CFTC or SEC will promulgate in the future. All derivatives are to be reported to a swap repository. The extent and impact of the new regulations are not yet fully known and may not be for some time. Any such changes may, among various possible effects, increase the cost of entering into derivatives transactions, require more assets of a Fund to be used for collateral in support of those derivatives than is currently the case, or restrict the ability of a Fund to enter into certain types of derivative transactions, or could limit a Fund’s ability to pursue its investment strategies. |
Emerging Market Risk | | Asset Strategy New Opportunities Fund and Emerging Markets Equity Fund | | Investments in countries with emerging economies or securities markets may carry greater risk than investments in more developed countries. Political and economic structures in many such countries may be undergoing significant evolution and rapid development, and such countries may lack the social, political and economic stability characteristics of more developed countries. Certain of those countries may have failed in the past to recognize private property rights and have nationalized or expropriated the assets of private companies. As a result, the risks described above, including the risks of nationalization or expropriation of assets, may be heightened. In addition, unanticipated political or social developments may affect the value of a Fund’s investments in those countries and the availability of additional investments in those countries. The small size and inexperience of the securities markets in such countries and the limited volume of trading in securities in those countries may make a Fund’s investments in such countries illiquid and more volatile than investments in more developed countries, and a Fund may be required to establish special custodial or other arrangements before making certain investments in those countries. The repatriation of capital with regard to investments made in certain securities or countries may be restricted during certain times or even indefinitely. There may be little financial or accounting information available with respect to issuers located in certain countries, and it may be difficult as a result to assess the value or prospects of an investment in such issuers. |
30
| | | | |
| Principal Risk | | Funds Subject to
that Principal Risk | | Description of that Principal Risk
in the Funds’ Current Prospectus |
Foreign Currency Risk | | Asset Strategy New Opportunities Fund and Emerging Markets Equity Fund | | Foreign securities may be denominated in foreign currencies. The value of a Fund’s investments, as measured in U.S. dollars, may be unfavorably affected by changes in foreign currency exchange rates and exchange control regulations. |
Foreign Exposure Risk | | Asset Strategy New Opportunities Fund | | The securities of many companies may have significant exposure to foreign markets as a result of the company’s operations, products or services in those foreign markets. As a result, a company’s domicile and/or the markets in which the company’s securities trade may not be fully reflective of its sources of revenue. Such securities would be subject to some of the same risks as an investment in foreign securities, including the risk that political and economic events unique to a country or region will adversely affect those markets in which the company’s products or services are sold. |
Foreign Securities Risk | | Asset Strategy New Opportunities Fund and Emerging Markets Equity Fund | | Investing in foreign securities involves a number of economic, financial, legal and political considerations that are not associated with the U.S. markets and that could affect a Fund’s performance unfavorably, depending upon prevailing conditions at any given time. For example, the securities markets of many foreign countries may be smaller, less liquid and subject to greater price volatility than those in the United States. Foreign investing also may involve brokerage costs and tax considerations that are not usually present in the U.S. markets. Other factors that can affect the value of a Fund’s foreign investments include the comparatively weak supervision and regulation by some foreign governments of securities exchanges, brokers and issuers, and the fact that many foreign companies may not be subject to uniform and/or stringent accounting, auditing and financial reporting standards. It also may be difficult to obtain reliable information about the securities and business operations of certain foreign issuers. Settlement of portfolio transactions also may be delayed due to local restrictions or communication problems, which can cause a Fund to miss attractive investment opportunities or impair its ability to dispose of securities in a timely fashion (resulting in a loss if the value of the securities subsequently declines). To the extent that a Fund invests in sovereign debt instruments, the Fund is subject to the risk that a government or agency issuing the debt may be unable to pay interest and/or repay principal due to cash flow problems, insufficient foreign currency reserves or political concerns. In such instance, a Fund may have limited recourse against the issuing government or agency. Financial markets have recently experienced, and may continue to experience, increased volatility due to the uncertainty surrounding the sovereign debt of certain European countries. |
31
| | | | |
| Principal Risk | | Funds Subject to
that Principal Risk | | Description of that Principal Risk
in the Funds’ Current Prospectus |
Growth Stock Risk | | Asset Strategy New Opportunities Fund and Emerging Markets Equity Fund | | Growth stocks are stocks of companies believed to have above-average potential for growth in revenue and earnings. Prices of growth stocks may be more sensitive to changes in current or expected earnings than the prices of other stocks. Growth stocks may not perform as well as value stocks or the stock market in general. |
Holdings Risk | | Asset Strategy New Opportunities Fund | | If a Fund typically holds a small number of stocks, or if a Fund’s portfolio manager(s) tend to invest a significant portion of a Fund’s total assets in a limited number of stocks, the appreciation or depreciation of any one security held by a Fund will have a greater impact on the Fund’s NAV than it would if a Fund invested in a larger number of securities or if a Fund’s portfolio manager(s) invested a greater portion of the Fund’s total assets in a larger number of stocks. Although that strategy has the potential to generate attractive returns over time, it also may increase a Fund’s volatility. |
Interest Rate Risk | | Asset Strategy New Opportunities Fund | | The value of a debt security, mortgage-backed security or other fixed-income obligation, as well as of shares of mortgage REITs, may decline due to changes in market interest rates. Generally, when interest rates rise, the value of such a security or obligation decreases. Conversely, when interest rates decline, the value of a debt security, mortgage-backed security or other fixed-income obligation, as well as of shares of mortgage REITs, generally increases. Long-term debt securities, mortgage-backed securities and other fixed-income obligations are generally more sensitive to interest rate changes than short-term debt securities. A Fund may experience a decline in its income due to falling interest rates. Interest rates in the U.S. are at, or near, historic lows, which may increase a Fund’s exposure to risks associated with rising rates. In general, a portfolio of debt, mortgage-related and asset-backed securities and other fixed-income obligations experiences a decrease in principal value with an increase in interest rates. The extent of the decrease in principal value may be affected by a Fund’s duration of its portfolio of debt, mortgage-related and asset-backed securities and other fixed-income obligations. Duration measures the relative price sensitivity of a security to changes in interest rates. “Effective” duration takes into consideration the likelihood that a security will be called, or prepaid, prior to maturity given current market interest rates. Typically, a security with a longer duration is more price sensitive than a security with a shorter duration. In general, a portfolio of debt, mortgage-related and asset-backed securities experiences a percentage decrease in principal value equal to its effective duration for each 1% increase in interest rates. For example, if a Fund holds a portfolio of securities with an effective duration of five years and interest rates rise 1%, the principal value of such securities could be expected to decrease by approximately 5%. |
32
| | | | |
| Principal Risk | | Funds Subject to
that Principal Risk | | Description of that Principal Risk
in the Funds’ Current Prospectus |
Investment Company Securities Risk | | Asset Strategy New Opportunities Fund | | The risks of investment in other investment companies typically reflect the risks of the types of securities in which the investment companies invest. As a shareholder in an investment company, a Fund would bear its pro rata share of that investment company’s expenses, which could result in the duplication of certain fees, including management and administrative fees. Certain Funds may invest in ETFs as a means of tracking the performance of a designated stock index while maintaining liquidity or to gain exposure to precious metals and other commodities without purchasing them directly. Since many ETFs are a type of investment company, a Fund’s purchases of shares of such ETFs are subject to the Fund’s investment restrictions regarding investments in other investment companies. ETFs have a market price that reflects a specified fraction of the value of the designated index or underlying basket of commodities or commodities futures and are exchange-traded. As with other equity securities transactions, brokers charge a commission in connection with the purchase and sale of shares of ETFs and closed-end funds. In addition, an asset management fee is charged in connection with the management of the ETF’s or the closed-end fund’s portfolio (which is in addition to the investment management fee paid by a Fund). Investments in an ETF or a closed-end fund generally present the same primary risks as investments in conventional funds, which are not exchange-traded. The price of an ETF or a closed-end fund can fluctuate, and a Fund could lose money investing in an ETF. In addition, ETFs are subject to the following risks that do not apply to conventional funds: (i) the market price of an ETF’s or a closed-end fund’s shares may trade at a premium or discount to its NAV; (ii) an active trading market for an ETF’s or a closed-end fund’s shares may not develop or be maintained; or (iii) trading of an ETF’s or a closed-end fund’s shares may be halted if the listing exchange officials determine such action to be appropriate, the shares are delisted from the exchange, or the activation of market-wide “circuit breakers” (which are tied to large decreases in stock prices) halts stock trading generally. |
33
| | | | |
| Principal Risk | | Funds Subject to
that Principal Risk | | Description of that Principal Risk
in the Funds’ Current Prospectus |
Large Company Risk | | Emerging Markets Equity Fund | | Large capitalization companies may go in and out of favor based on market and economic conditions. Large capitalization companies may be unable to respond quickly to new competitive challenges, such as changes in technology, and also may not be able to attain the high growth rate of successful smaller companies, especially during extended periods of economic expansion. Although the securities of larger companies may be less volatile than those of companies with smaller market capitalizations, returns on investments in securities of large capitalization companies could trail the returns on investments in securities of smaller companies. |
Liquidity Risk | | Asset Strategy New Opportunities Fund and Emerging Markets Equity Fund | | Generally, a security is liquid if a Fund is able to sell the security at a fair price within a reasonable time. Liquidity is generally related to the market trading volume for a particular security. Investments in smaller companies, foreign companies, companies in emerging markets or certain instruments such as derivatives are subject to a variety of risks, including potential lack of liquidity. Illiquid securities may trade at a discount from comparable, more liquid investments, and may be subject to wider fluctuations in market value. Less liquid securities are more difficult to dispose of at their recorded values and are subject to increased spreads and volatility. Also, a Fund may not be able to dispose of illiquid securities when that would be beneficial at a favorable time or price. |
Low-Rated Securities Risk | | Asset Strategy New Opportunities Fund | | In general, low-rated debt securities (commonly referred to as “high-yield” or “junk” bonds) offer higher yields due to the increased risk that the issuer will be unable to meet its obligations on interest or principal payments at the time called for by the debt instrument. For this reason, these securities are considered speculative and could significantly weaken a Fund’s returns. In adverse economic or other circumstances, issuers of these low-rated securities and obligations are more likely to have difficulty making principal and interest payments than issuers of higher-rated securities and obligations. |
Management Risk | | Asset Strategy New Opportunities Fund and Emerging Markets Equity Fund | | IICO applies a Fund’s investment strategies and selects securities for a Fund in seeking to achieve a Fund’s investment objective. Securities selected by a Fund may not perform as well as the securities held by other mutual funds with investment objectives that are similar to the investment objective of a Fund. In general, investment decisions made by IICO may not produce the anticipated returns, may cause a Fund’s shares to lose value or may cause a Fund to perform less favorably than other mutual funds with investment objectives similar to the investment objective of a Fund. |
34
| | | | |
| Principal Risk | | Funds Subject to
that Principal Risk | | Description of that Principal Risk
in the Funds’ Current Prospectus |
Market Risk | | Asset Strategy New Opportunities Fund and Emerging Markets Equity Fund | | All securities and other investments may be subject to adverse trends in the markets. Securities are subject to price movements due to changes in general economic conditions, the level of prevailing interest rates or investor perceptions of the market. The value of assets or income from a Fund’s investments may be adversely affected by inflation or changes in the market’s expectations regarding inflation. In addition, prices are affected by the outlook for overall corporate profitability. In the municipal securities markets, securities backed by current or anticipated revenues from a specific project or specific asset may be adversely impacted by declines in revenue collection from the project or asset. Market prices of equity securities are generally more volatile than debt securities. This may cause a security to be worth less than the price originally paid for it, or less than it was worth at an earlier time. Market risk may affect a single issuer or the market as a whole. As a result, a portfolio of such securities may underperform the market as a whole. In addition, certain unanticipated events, such as natural disasters, terrorist attacks, war, and other geopolitical events, can have a dramatic adverse effect on securities held by a Fund. The financial crisis in the U.S. and global economies over the past several years, including the European sovereign debt crisis, has resulted, and may continue to result, in an unusually high degree of volatility in the financial markets, both domestic and foreign. Liquidity in some markets has decreased and credit has become scarcer worldwide. Recent regulatory changes, including the Dodd-Frank Act and the introduction of new international capital and liquidity requirements under the Basel III Accords (“Basel III”), may cause lending activity within the financial services sector to be constrained for several years as Basel III rules phase in and rules and regulations are promulgated and interpreted under the Dodd-Frank Act. These market conditions may continue or deteriorate further and may add significantly to the risk of short-term volatility in a Fund. In response to the crisis, the U.S. and other governments and the Federal Reserve and certain foreign central banks have taken a number of steps in an attempt to support financial markets. Withdrawal of this support, failure of efforts in response to the crisis, or investor perception that such efforts are not succeeding, could adversely impact the value and liquidity of certain securities. Because the situation is widespread and largely unprecedented, it may be unusually difficult to identify both risks and opportunities using past models of the interplay of market forces, or to project the duration of these market conditions. The severity or duration of these conditions may also be affected by policy changes made by governments or quasi-governmental organizations. Changes in market conditions will not have the same impact on all types of securities. |
35
| | | | |
| Principal Risk | | Funds Subject to
that Principal Risk | | Description of that Principal Risk
in the Funds’ Current Prospectus |
| | | | In addition, since 2010, the risks of investing in certain foreign government debt have increased dramatically as a result of the ongoing European debt crisis, which began in Greece and has begun to spread throughout various other European countries. These debt crises and the ongoing efforts of governments around the world to address these debt crises have also resulted in increased volatility and uncertainty in the global securities markets and it is impossible to predict the effects of these or similar events in the future on a Fund, though it is possible that these or similar events could have a significant adverse impact on the value and risk profile of a Fund. |
Mid Size Company Risk | | Asset Strategy New Opportunities Fund and Emerging Markets Equity Fund | | Securities of mid capitalization companies may be more vulnerable to adverse developments than those of large companies due to such companies’ limited product lines, limited markets and financial resources and dependence upon a relatively small management group. Securities of mid capitalization companies may be more volatile and less liquid than the stocks of larger companies, and may be more affected than other types of stocks by the underperformance of a sector or during market downturns. |
Private Placements and Other Restricted Securities Risk | | Asset Strategy New Opportunities Fund | | Restricted securities, which include private placements, are securities that are subject to legal or contractual restrictions on resale, and there can be no assurance of a ready market for resale. A Fund could find it difficult to sell privately placed securities and other restricted securities when the Adviser believes it is desirable to do so, especially under adverse market or economic conditions or in the event of adverse changes in the financial condition of the issuer, and the prices realized could be less than those originally paid or less than the fair market value. At times, it also may be difficult to determine the fair value of such securities for purposes of computing the NAV of a Fund. |
Small Company Risk | | Asset Strategy New Opportunities Fund and Emerging Markets Equity Fund | | Securities of small capitalization companies are subject to greater price volatility, lower trading volume and less liquidity due to, among other things, such companies’ small size, limited product lines, limited access to financing sources and limited management depth. In addition, the frequency and volume of trading of such securities may be less than is typical of larger companies, making them subject to wider price fluctuations, and such securities may be more affected than other types of securities by the underperformance of a sector or during market downturns. In some cases, there could be difficulties in selling securities of small capitalization companies at the desired time. |
36
| | | | |
| Principal Risk | | Funds Subject to
that Principal Risk | | Description of that Principal Risk
in the Funds’ Current Prospectus |
Subsidiary Investment Risk | | Asset Strategy New Opportunities Fund | | By investing in its subsidiary, a Fund is exposed to the risks associated with its Subsidiary’s investments. A Fund’s Subsidiary is not registered under the 1940 Act, and is not subject to all of the investor protections of the 1940 Act. Thus, a Fund, as an investor in its Subsidiary, would not have all of the protections offered to investors in registered investment companies. However, because a Fund wholly owns and controls its Subsidiary, and the Fund and its Subsidiary are managed by IICO, it is unlikely that a Fund’s Subsidiary would take action contrary to the interests of the Fund or the Fund’s shareholders. In addition, changes in the laws of the United States and/or the Cayman Islands, under which a Fund and its Subsidiary are organized, respectively, could result in the inability of a Fund and/or its Subsidiary to operate as intended and could negatively affect the Fund and its shareholders. Although, under the federal tax law, a Fund may not earn more than 10% of its annual gross income from gains resulting from selling commodities (and other non-qualifying income), the Funds have received an opinion of counsel, which is not binding on the Internal Revenue Service or the courts, that income a Fund receives from its Subsidiary should constitute qualifying income. |
Comparison of Fund Performance
Asset Strategy New Opportunities Fund
The chart and table below provide some indication of the risks of investing in the Fund. The chart shows how performance has varied from year to year for Class A shares. The table shows the average annual total returns for each Class of the Fund and also compares the performance with those of broad-based securities market indexes and a Lipper peer group (a universe of mutual funds with investment objectives similar to that of the Fund). The chart does not reflect any sales charges and, if those sales charges were included, returns would be less than those shown.
After-tax returns are calculated using the historical highest individual Federal marginal income tax rates and do not reflect the impact of state and local taxes. Actual after-tax returns depend on an investor’s tax situation and may differ from those shown. After-tax returns are not relevant to investors who hold their Fund shares through tax-deferred arrangements, such as 401(k) plans or individual retirement accounts (IRAs), or to shares held by non-taxable entities. After-tax returns are shown only for Class A shares. After-tax returns for other Classes may vary. Return After Taxes on Distributions and Sale of Fund Shares may be better than Return Before Taxes due to an assumed tax benefit from losses on a sale of the Fund’s shares at the end of the period.
37
Performance results include the effect of expense reduction arrangements for some or all of the periods shown. If those arrangements had not been in place, the performance results for those periods would have been lower.
The Fund’s past performance (before and after taxes) does not necessarily indicate how it will perform in the future. Current performance may be lower or higher. Please visit www.ivyfunds.com or call 800.777.6472 for the Fund’s updated performance.
CHART OF YEAR-BY-YEAR RETURNS (as of December 31, 2013)
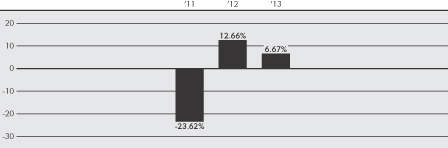
In the period shown in the chart, the highest quarterly return was 13.25% (the first quarter of 2012) and the lowest quarterly return was -24.84 (the third quarter of 2011).
AVERAGE ANNUAL TOTAL RETURNS
(as of December 31, 2013)
| | | | | | | | |
| | | 1 Year | | | (Life of Class) | |
Class A (began on 05-03-2010) | | | | | | | | |
Return Before Taxes | | | 0.53 | % | | | 2.05 | % |
Return After Taxes on Distributions | | | 0.53 | % | | | 2.02 | % |
Return After Taxes on Distributions and Sale of Fund Shares | | | 0.30 | % | | | 1.59 | % |
Class B (began on 05-03-2010) | | | | | | | | |
Return Before Taxes | | | 1.66 | % | | | 1.91 | % |
Class C (began on 05-03-2010) | | | | | | | | |
Return Before Taxes | | | 5.74 | % | | | 2.79 | % |
Class E (began on 05-03-2010) | | | | | | | | |
Return Before Taxes | | | 0.54 | % | | | 2.02 | % |
Class I (began on 05-03-2010) | | | | | | | | |
Return Before Taxes | | | 6.93 | % | | | 3.95 | % |
Class R (began on 05-03-2010) | | | | | | | | |
Return Before Taxes | | | 6.25 | % | | | 3.28 | % |
Class Y (began on 05-03-2010) | | | | | | | | |
Return Before Taxes | | | 6.67 | % | | | 3.68 | % |
38
| | | | | | | | |
| | | 1 Year | | | (Life of Class) | |
Indexes | | | | | | | | |
Barclays U.S. Aggregate Bond Index (reflects no deduction for fees, expenses or taxes) (Life of Class index comparison begins on May 1, 2010) | | | -2.02 | % | | | 3.66 | % |
Barclays U.S. Treasury Bills: 1-3 Month Index (reflects no deduction for fees, expenses or taxes) (Life of Class index comparison begins on May 1, 2010) | | | 0.05 | % | | | 0.08 | % |
MSCI AC World SMID Index (reflects no deduction for fees, expenses or taxes) (Life of Class index comparison begins on May 1, 2010) | | | 26.37 | % | | | 11.78 | % |
Lipper Global Flexible Portfolio Funds Universe Average (net of fees and expenses) (Life of Class index comparison begins on May 1, 2010) | | | 8.90 | % | | | 7.11 | % |
Emerging Markets Equity Fund
The chart and table below provide some indication of the risks of investing in the Fund. The chart shows how performance has varied from year to year for Class A shares. The table shows the average annual total returns for each Class of the Fund and also compares the performance with those of a broad-based securities market index and a Lipper peer group (a universe of mutual funds with investment objectives similar to that of the Fund). The chart does not reflect any sales charges and, if those sales charges were included, returns would be less than those shown.
After-tax returns are calculated using the historical highest individual Federal marginal income tax rates and do not reflect the impact of state and local taxes. Actual after-tax returns depend on an investor’s tax situation and may differ from those shown. After-tax returns are not relevant to investors who hold their Fund shares through tax-deferred arrangements, such as 401(k) plans or individual retirement accounts (IRAs), or to shares held by non-taxable entities. After-tax returns are shown only for Class A shares. After-tax returns for other Classes may vary. Return After Taxes on Distributions and Sale of Fund Shares may be better than Return Before Taxes due to an assumed tax benefit from losses on a sale of the Fund’s shares at the end of the period.
Performance results include the effect of expense reduction arrangements for some or all of the periods shown. If those arrangements had not been in place, the performance results for those periods would have been lower.
The Fund’s past performance (before and after taxes) does not necessarily indicate how it will perform in the future. Current performance may be lower or higher. Please visit www.ivyfunds.com or call 800.777.6472 for the Fund’s updated performance.
39
CHART OF YEAR-BY-YEAR RETURNS (as of December 31, 2013)
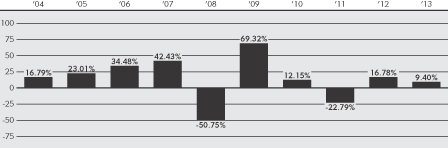
In the period shown in the chart, the highest quarterly return was 39.62% (the second quarter of 2009) and the lowest quarterly return was -26.75% (the third quarter of 2011).
AVERAGE ANNUAL TOTAL RETURNS
(as of December 31, 2013)
| | | | | | | | | | | | |
| | | 1 Year | | | 5 Years | | | 10 Years
(or Life of Class) | |
Class A | | | | | | | | | | | | |
Return Before Taxes | | | 3.11 | % | | | 12.04 | % | | | 9.12 | % |
Return After Taxes on Distributions | | | 2.98 | % | | | 11.84 | % | | | 8.21 | % |
Return After Taxes on Distributions and Sale of Fund Shares | | | 1.92 | % | | | 9.74 | % | | | 7.51 | % |
Class B | | | | | | | | | | | | |
Return Before Taxes | | | 3.96 | % | | | 11.91 | % | | | 8.58 | % |
Class C | | | | | | | | | | | | |
Return Before Taxes | | | 8.52 | % | | | 12.53 | % | | | 8.93 | % |
Class E (began on April 2, 2007) | | | | | | | | | | | | |
Return Before Taxes | | | 3.48 | % | | | 12.49 | % | | | 3.52 | % |
Class I (began on 04-02-2007) | | | | | | | | | | | | |
Return Before Taxes | | | 9.96 | % | | | 13.96 | % | | | 4.59 | % |
Class R (began on 12-19-2012) | | | | | | | | | | | | |
Return Before Taxes | | | 9.28 | % | | | N/A | | | | 10.69 | % |
Class Y | | | | | | | | | | | | |
Return Before Taxes | | | 9.70 | % | | | 13.68 | % | | | 10.07 | % |
40
| | | | | | | | | | | | |
| | | 1 Year | | | 5 Years | | | 10 Years
(or Life of Class) | |
Indexes | | | | | | | | | | | | |
MSCI AC Asia Ex Japan Index (reflects no deduction for fees, expenses or other taxes) | | | 3.07 | % | | | 16.51 | % | | | 10.64 | % |
MSCI Emerging Markets Index (reflects no deduction for fees, expenses or other taxes) (The Fund’s benchmark changed from MSCI AC Asia Ex Japan Index, effective February 2014. IICO believes that the MSCI Emerging Markets Index provides a better benchmark for the Fund in light of the types of securities in which the Fund invests.) | | | -2.60 | % | | | 14.79 | % | | | 11.17 | % |
Lipper Pacific Ex Japan Funds Universe Average (net of fees and expenses) | | | 2.11 | % | | | 16.40 | % | | | 10.55 | % |
Management of the Funds
Investment Adviser: Each Fund is managed by IICO. IICO will remain the investment adviser of the Emerging Markets Equity Fund after the Reorganization.
Portfolio Managers: Jonas M. Krumplys is primarily responsible for the day-to-day management of Ivy Asset Strategy New Opportunities Fund, and has held his Fund responsibilities since the inception of the Fund in May 2010. He is Vice President of IICO and Vice President of the Trust. Mr. Krumplys joined IICO in November 2006 as an investment analyst. He has served as Assistant Vice President and assistant portfolio manager for other investment companies managed by WRIMCO since April 2008. He earned a BS in architecture and an MS in chemical engineering from the University of Illinois, and holds an MBA with an emphasis in finance and marketing from the University of Chicago Graduate School of Business. Mr. Krumplys is a Chartered Financial Analyst.
Frederick Jiang is primarily responsible for the day-to-day management of Ivy Emerging Markets Equity Fund. Mr. Jiang has held his Fund responsibilities since February 2004, and had been assistant portfolio manager for the Fund since July 2003. He is Senior Vice President of IICO and Vice President of the Trust. From July 1999 to July 2003, he served as an investment analyst for IICO. Mr. Jiang holds a BA degree in Economics from the Central University of Finance and Economics, Beijing, China, and earned an MBA degree in Finance from New York University. Mr. Jiang is a Chartered Financial Analyst.
Mr. Jiang and Mr. Krumplys are expected to serve as portfolio managers of the Emerging Markets Equity Fund after the Reorganization.
41
Purchase and Sale of Fund Shares
Each Fund’s shares are redeemable. You may purchase or redeem shares at a Fund’s NAV per share next calculated after your order is received in proper form, subject to any applicable sales charge, on any business day through your dealer or financial adviser (all share classes), by writing to WI Services Company, P.O. Box 29217, Shawnee Mission, Kansas 66201-9217 (all share classes), or by telephone (Class A, B and C: 800.777.6472); fax (Class A, B and C: 800.532.2749; Class I and Y: 800.532.2784), or internet (www.ivyfunds.com) (Class A, B and C) if you have completed an Express Transaction Authorization Form. If your individual account is not maintained on a Fund’s shareholder servicing system, such as for Class R shares, please contact your selling broker-dealer, plan administrator or third-party record keeper to sell shares of the Fund. Class E shares are not available for purchase. The Fund’s Class B shares are not available for purchase by new and existing investors. Class B shares are available for dividend reinvestment and exchanges.
Each Fund’s initial and subsequent investment minimums generally are as follows, although the Fund and/or IFDI may reduce or waive the minimums in some cases:
| | | | |
For Class A and Class C: | | | | |
To Open an Account | | $ | 750 | |
For accounts opened with Automatic Investment Service (AIS) | | $ | 150 | |
For accounts established through payroll deductions and salary deferrals | | | Any amount | |
| |
To Add to an Account | | | Any amount | |
For AIS | | $ | 50 | |
| |
For Class I, Class R and Class Y: | | | | |
Please check with your individual selling dealer, plan administrator or third party record keeper for information about minimum investment requirements.
Tax Information
The Fund’s distributions are generally taxable to you as ordinary income, capital gains, or a combination of the two, unless you are investing through a tax-deferred arrangement, such as a 401(k) plan or an individual retirement account.
Payments to Broker-Dealers and other Financial Intermediaries
If you purchase the Fund through a broker-dealer or other financial intermediary (such as a bank), the Fund and/or IICO and/or its affiliates may pay the intermediary for the sale of Fund shares and related services. These payments may create a conflict of interest by influencing the broker-dealer or other intermediary
42
and your salesperson to recommend the Fund over another investment. Ask your salesperson or visit your financial intermediary’s web site for more information.
Additional Information
For additional information about the Asset Strategy New Opportunities Fund, see the Combined Prospectus and Combined SAI. For additional information about the Emerging Markets Equity Fund see the Prospectus dated January 29, 2014 and the SAI dated January 29, 2014.
INFORMATION ABOUT THE REORGANIZATION
General
Shareholders of the Asset Strategy New Opportunities Fund are being asked to approve the Plan. A form of the Plan is attached as Appendix A to this Prospectus/Proxy. By approving the Plan, you are also approving the Reorganization.
Shareholders who are concerned about the reorganization of the Asset Strategy New Opportunities Fund into the Emerging Markets Equity Fund may redeem or exchange their Asset Strategy New Opportunities Fund shares at any time prior to the consummation of the Reorganization. Exchanges and redemptions are considered taxable events and may result in capital gains or capital loss for tax purposes. In anticipation of the Reorganization, the Asset Strategy New Opportunities Fund is expected to be closed to new shareholders as of February 25, 2014. In addition, shareholders should be aware that the Reorganization as proposed is not expected to result in recognition of gain or loss to shareholders for federal income tax purposes and that, if the Reorganization is consummated, shareholders will be free to redeem their shares of the Emerging Markets Equity Fund that they receive in the transaction at the shares’ current NAV, less any applicable CDSC.
Shares You Will Receive
If the Reorganization occurs, the shares you receive in exchange for your Asset Strategy New Opportunities Fund shares will have the characteristics described below.
The shares of the Emerging Markets Equity Fund you receive will have an aggregate NAV equal to the aggregate NAV of your Asset Strategy New Opportunities Fund shares as of the close of business on the business day before the closing of the Reorganization. You will have voting rights identical to those you currently have, but as a shareholder of the Emerging Markets Equity Fund. The rights of shareholders of each Fund are identical since each Fund is a series of the Trust.
43
The shares acquired in the Reorganization may be exchanged for shares of the same class of any other fund in the Ivy Family of Funds without the payment of an additional sales charge or CDSC.
The procedures for purchasing and redeeming your shares of the Emerging Markets Equity Fund will be the same after the Reorganization as they currently are for the Asset Strategy New Opportunities Fund.
The Emerging Markets Equity Fund distributes net investment income annually in December, while the Asset Strategy New Opportunities Fund distributes net investment income quarterly. Distributions for the Emerging Markets Equity Fund will be paid annually in December after the Reorganization. Net realized capital gains (and any gains from foreign currency transactions) ordinarily are distributed by each Fund in December and will continue to be distributed annually by the Emerging Markets Equity Fund after the Reorganization. All shareholder features that you have elected will remain available and in effect after the Reorganization unless you direct that the elections be changed.
Reasons for the Reorganization
Within the scope of its investment management responsibilities, IICO maintains an ongoing process of considering and comparing product offerings of the Ivy Family of Funds and from time to time may recommend to the Board proposals for enhancing the product offerings within the Ivy Family of Funds. IICO has reviewed the fund offerings within the Ivy Family of Funds and determined that the Reorganization would be in the best interest of each Fund and its shareholders.
At a meeting held on November 12, 2013, the Board, including all Trustees who are not “interested persons” of the Trust, determined that the Plan, and the resulting Reorganization, would be in the best interests of the shareholders of each Fund, and that the interests of existing shareholders of both Funds would not be diluted as a result of the Reorganization. The Board has unanimously approved the Plan, and the resulting Reorganization.
In proposing the Reorganization, IICO presented to the Board, at the November 12, 2013 meeting, its rationale for the Reorganization and, in particular identified, the following factors:
| | – | for two years, IICO has agreed to limit the operating expenses that will be charged to shareholders of each class of the Emerging Markets Equity Fund so they will be equal to the lowest expense ratio of that class for either the Asset Strategy New Opportunities Fund or the Emerging Markets Equity Fund determined as of March 31, 2013; |
| | – | the Reorganization is intended to create a larger fund, and this is expected to permit fixed costs to be spread over a larger asset base, potentially resulting in economies of scale over time; |
44
| | – | shareholders of the Asset Strategy New Opportunities Fund will become shareholders of a fund with a better performance record for a longer period of time; |
| | – | the Reorganization will enable the Asset Strategy New Opportunities Fund’s shareholders to exchange their investment for an investment in the Emerging Markets Equity Fund without recognizing gain or loss for federal income tax purposes. By contrast, if an Asset Strategy New Opportunities Fund shareholder were to redeem his or her shares to invest in another fund, such as the Emerging Markets Equity Fund, the transaction would be a taxable event for such shareholder (unless the shareholder is tax exempt). Similarly, if the Asset Strategy New Opportunities Fund were liquidated or reorganized in a taxable transaction, the transaction would be a taxable event for the Asset Strategy New Opportunities Fund’s shareholders (other than tax-exempt shareholders). After the Reorganization, shareholders may redeem any or all of their Emerging Markets Equity Fund shares at NAV (subject to any applicable CDSC, as with a redemption of their Asset Strategy New Opportunities Fund shares) at any time, at which point the shareholders (other than those who are tax-exempt) would recognize a taxable gain or loss; |
| | – | the Reorganization will provide the Asset Strategy New Opportunities Fund shareholders with the opportunity to invest in a growing asset class; and |
| | – | the costs of the Meeting, including the costs of soliciting proxies, and the costs of the Reorganization that are estimated to be $258,932 will be borne by the Asset Strategy New Opportunities Fund and IICO in the following percentages (and corresponding dollar amounts): Asset Strategy New Opportunities Fund 50% ($129,466) and IICO 50% ($129,466). If the shareholders of the Asset Strategy New Opportunities Fund do not approve the Plan or the Reorganization does not close for any reason, IICO will bear all the costs of the failed Reorganization. |
In addition, the Board considered the relative Fund performance results set forth above under “Comparison of Fund Performance.” No assurance can be given that the Emerging Markets Equity Fund will achieve any particular level of performance after the Reorganization. The Board also considered the Emerging Markets Equity Fund’s prior performance was performance for a different investment strategy.
In reviewing the Reorganization, the Board considered the investment strategies of the Funds. The Board also considered the fact that if the Reorganization occurs, certain of the Asset Strategy New Opportunities Fund’s capital loss carryovers will be available to the Emerging Markets Equity Fund to offset its capital gains, although the amount of those losses that may be used to offset the Emerging Markets
45
Equity Fund’s capital gains in any given year may be limited. As a result of this limitation, it is possible that the Emerging Markets Equity Fund may not be able to use these losses as rapidly as the Asset Strategy New Opportunities Fund might have, and part or all of these losses may not be usable at all. The ability of the Asset Strategy New Opportunities Fund or the Emerging Markets Equity Fund to absorb losses in the future depends on a variety of factors that cannot be known in advance, including the existence of capital gains against which these losses may be used to offset. Net capital losses of regulated investment companies for taxable years beginning before December 23, 2010 generally expire at the end of the eighth taxable year after they arise, if not previously absorbed by that time; therefore, it is possible that some or all of the Asset Strategy New Opportunities Fund’s losses will expire unused. In addition, the benefits of any capital loss carryovers currently are available only to the shareholders of the Asset Strategy New Opportunities Fund, but after the Reorganization these benefits will inure to all the shareholders of the Emerging Markets Equity Fund.
Terms of the Agreement and Plan of Reorganization
A form of the Agreement and Plan of Reorganization is attached as Appendix A to this Prospectus/Proxy for your review. The following is a brief summary of the principal terms of the Plan:
| | – | the Asset Strategy New Opportunities Fund will transfer all of its assets in exchange for the Emerging Markets Equity Fund’s assumption of all of the Asset Strategy New Opportunities Fund’s liabilities and obligations and shares of the Emerging Markets Equity Fund with an aggregate NAV equal to the aggregate NAV of the transferred assets and liabilities; |
| | – | the Reorganization will occur on the next business day after the time (currently scheduled to be 9:00 AM Central Time on March 17, 2014, or such other date and time as the parties may determine) when the assets of each Fund are valued for purposes of the Reorganization; |
| | – | the shares of each class of the Emerging Markets Equity Fund received by the Asset Strategy New Opportunities Fund will be distributed to the Asset Strategy New Opportunities Fund’s respective shareholders of the corresponding class pro rata in accordance with their percentage ownership of such class of the Asset Strategy New Opportunities Fund in full liquidation of the Asset Strategy New Opportunities Fund; and |
| | – | after the Reorganization, the Asset Strategy New Opportunities Fund will be terminated, and its affairs will be wound up in an orderly fashion. |
The consummation of the Reorganization is subject to a number of conditions set forth in the Plan. The Plan may be terminated and the Reorganization abandoned at any time prior to the Closing Date, as set forth in the Plan, by the Board if it
46
determines that the Reorganization would be inadvisable for either Fund. Authorized officers of the Trust also may amend the Plan at any time in any manner. The Trust’s officers also may change the Closing Date.
Federal Income Tax Consequences
The Reorganization is intended to be tax-free. As a condition to consummation of the Reorganization, K&L Gates LLP will deliver an opinion (“Tax Opinion”) to the Trust to the effect that, based on the facts and assumptions stated therein (as well as certain representations of the Trust) and the existing federal income tax law, and conditioned on the Reorganization’s being completed in accordance with the Plan, for federal income tax purposes:
| | • | | the Reorganization will qualify as a “reorganization” (as defined in section 368(a)(1) of the Internal Revenue Code of 1986, as amended (“Code”)), and each Fund will be a “party to a reorganization” (within the meaning of section 368(b) of the Code); |
| | • | | neither Fund will recognize any gain or loss on the Reorganization; |
| | • | | the Asset Strategy New Opportunities Fund’s shareholders will not recognize any gain or loss on the exchange of their Asset Strategy New Opportunities Fund shares for Emerging Markets Equity Fund shares; |
| | • | | the holding period for and tax basis in the Emerging Markets Equity Fund shares that a Asset Strategy New Opportunities Fund shareholder receives pursuant to the Reorganization will include the holding period for, and will be the same as the aggregate tax basis in, the Asset Strategy New Opportunities Fund shares the shareholder holds immediately before the Reorganization (provided the shareholder holds the shares as capital assets at the time of the closing of the Reorganization); and |
| | • | | the Emerging Markets Equity Fund’s tax basis in each asset the Asset Strategy New Opportunities Fund transfers to it will be the same as the Asset Strategy New Opportunities Fund’s tax basis therein immediately before the Reorganization, and the Emerging Markets Equity Fund’s holding period for each such asset will include the Asset Strategy New Opportunities Fund’s holding period therefore (except where the Emerging Markets Equity Fund’s investment activities have the effect of reducing or eliminating an asset’s holding period). |
The Tax Opinion is not binding on the Internal Revenue Service or the courts and is not a guarantee that the tax consequences of the Reorganization will be as described above.
Prior to the closing of the Reorganization, the Asset Strategy New Opportunities Fund will distribute to its shareholders all of its investment company
47
taxable income and net realized capital gain (after reduction by any available capital loss carryforwards), if any, that have not previously been distributed to them. That distribution will be taxable to the shareholders.
The Emerging Markets Equity Fund’s ability to use pre-Reorganization losses of the Asset Strategy New Opportunities Fund to offset post-Reorganization gains of the combined Fund is expected to be limited due to the application of loss limitation rules under federal tax law. The effect of this limitation will depend on the amount of losses in each Fund at the time of the Reorganization, as well as the amount of post-Reorganization gains that are recognized. As a result, under certain circumstances the Asset Strategy New Opportunities Fund’s shareholders could receive taxable distributions as shareholders of the Emerging Markets Equity Fund earlier than they would have if the Reorganization had not occurred. A portion of the portfolio assets of the Asset Strategy New Opportunities Fund may be sold in connection with the Reorganization. The actual tax impact of such sales will depend on the difference between the price at which such portfolio assets are sold and the Asset Strategy New Opportunities Fund’s basis in such assets. Any net capital gains recognized in these sales not offset by the Asset Strategy New Opportunities Fund’s capital loss carryforwards will be distributed to the Asset Strategy New Opportunities Fund’s shareholders as capital gain dividends (to the extent of net realized long-term capital gains) and/or ordinary dividends (to the extent of net realized short-term capital gains) during or with respect to the year of sale, and such distributions will be taxable to shareholders. Any such sales may also result in higher portfolio turnover for the Asset Strategy New Opportunities Fund and increased brokerage costs to be borne by the Asset Strategy New Opportunities Fund than would otherwise be the case.
As of September 30, 2013 the Asset Strategy New Opportunities Fund had a capital loss carryforward of $77 million. As of September 30, 2013, the Asset Strategy New Opportunities Fund had additional net unrealized capital gains of $24 million. Capital loss carryforwards are used to reduce the amount of realized capital gains that a fund is required to distribute to its shareholders in order to avoid paying taxes on undistributed capital gain.
If the Reorganization occurs, the tax attributes of the Emerging Markets Equity Fund and the Asset Strategy New Opportunities Fund, including any capital loss carryforwards that could have been used by each Fund to offset its future realized capital gains, will be shared by the surviving combined Fund.
The foregoing description of the federal income tax consequences of the Reorganization applies generally to shareholders who are not tax-exempt investors and does not take into account your particular facts and circumstances. Consult your own tax adviser about the effect of state, local, foreign, and other tax laws.
48
Capitalization
The following table shows on an unaudited basis the capitalization of each of the Asset Strategy New Opportunities Fund and the Emerging Markets Equity Fund as of September 30, 2013, and on a pro forma combined basis, giving effect to the reorganization of the assets and liabilities of Asset Strategy New Opportunities Fund by the Emerging Markets Equity Fund at NAV as of that date.
| | | | | | | | | | | | | | | | |
| | | ASSET
STRATEGY NEW
OPPORTUNITIES
FUND | | | EMERGING
MARKETS
EQUITY
FUND1 | | | PRO FORMA
ADJUSTMENTS | | | EMERGING
MARKETS
EQUITY FUND
PRO FORMA
COMBINED2,3 | |
Class A | | | | | | | | | | | | | | | | |
Net asset value | | $ | 159,231,563 | | | $ | 413,871,518 | | | $ | (82,046 | )4 | | $ | 573,021,035 | |
Shares outstanding | | | 14,957,486 | | | | 29,742,230 | | | | (3,534,412 | ) | | | 41,165,304 | |
Net asset value per share | | $ | 10.65 | | | $ | 13.92 | | | | | | | $ | 13.92 | |
| | | | |
Class B | | | | | | | | | | | | | | | | |
Net asset value | | $ | 4,771,890 | | | $ | 6,020,175 | | | $ | (2,459 | )4 | | $ | 10,789,606 | |
Shares outstanding | | | 461,045 | | | | 513,270 | | | | (54,485 | ) | | | 919,830 | |
Net asset value per share | | $ | 10.35 | | | $ | 11.73 | | | | | | | $ | 11.73 | |
| | | | |
Class C | | | | | | | | | | | | | | | | |
Net asset value | | $ | 39,780,797 | | | $ | 13,022,055 | | | $ | (20,498 | )4 | | $ | 52,782,355 | |
Shares outstanding | | | 3,829,050 | | | | 1,066,720 | | | | (572,891 | ) | | | 4,322,879 | |
Net asset value per share | | $ | 10.39 | | | $ | 12.21 | | | | | | | $ | 12.21 | |
| | | | |
Class E | | | | | | | | | | | | | | | | |
Net asset value | | $ | 107,179 | | | $ | 111,962 | | | $ | (55 | )4 | | $ | 219,086 | |
Shares outstanding | | | 10,070 | | | | 7,941 | | | | (2,473 | ) | | | 15,538 | |
Net asset value per share | | $ | 10.64 | | | $ | 14.10 | | | | | | | $ | 14.10 | |
| | | | |
Class I | | | | | | | | | | | | | | | | |
Net asset value | | $ | 38,714,282 | | | $ | 135,520,481 | | | $ | (19,948 | )4 | | $ | 174,214,815 | |
Shares outstanding | | | 3,619,535 | | | | 9,476,549 | | | | (913,229 | ) | | | 12,182,854 | |
Net asset value per share | | $ | 10.70 | | | $ | 14.30 | | | | | | | $ | 14.30 | |
| | | | |
Class R | | | | | | | | | | | | | | | | |
Net asset value | | $ | 598,612 | | | $ | 250,389 | | | $ | (308 | )4 | | $ | 848,693 | |
Shares outstanding | | | 56,873 | | | | 18,014 | | | | (13,830 | ) | | | 61,057 | |
Net asset value per share | | $ | 10.53 | | | $ | 13.90 | | | | | | | $ | 13.90 | |
| | | | |
Class Y | | | | | | | | | | | | | | | | |
Net asset value | | $ | 8,018,568 | | | $ | 4,302,770 | | | $ | (4,132 | )4 | | $ | 2,317,206 | |
Shares outstanding | | | 753,423 | | | | 303,305 | | | | (188,707 | ) | | | 868,020 | |
Net asset value per share | | $ | 10.64 | | | $ | 14.19 | | | | | | | $ | 14.19 | |
| 1 | Emerging Markets Equity Fund will be the accounting survivor for financial statement purposes. |
| 2 | Assumes the reorganization was consummated on September 30, 2013, and is for information purposes only. No assurance can be given as to how many shares of Emerging Markets Equity Fund will be received by shareholders of |
49
| | Ivy Asset Strategy New Opportunities Fund on the date the Reorganization takes place, and the foregoing should not be relied upon to reflect the number of shares of Emerging Markets Equity Fund that will actually be received on or after that date. |
| 3 | Class A shares, Class B shares, Class C shares, Class E shares, Class I shares, Class R shares and Class Y shares of Asset Strategy New Opportunities Fund will be exchanged for new Class A shares, Class B shares, Class C shares, Class E shares, Class I shares, Class R shares and Class Y shares, respectively, of Emerging Markets Equity Fund upon consummation of the reorganization. |
| 4 | Adjustments reflect estimated one-time proxy, accounting, legal and other costs of approximately $129,446 to be borne by the Asset Strategy New Opportunities Fund. No expenses will be borne by the Emerging Markets Equity Fund as a result of the Reorganization. |
Shares Outstanding and Entitled to Vote of the Asset Strategy New Opportunities Fund
Only the shareholders of record of the Asset Strategy New Opportunities Fund at the close of business on January 17, 2014, will be entitled to vote at the Meeting. On that date, the number of shares outstanding of the Asset Strategy New Opportunities Fund was as follows:
| | | | |
CLASS | | Number of Shares
Outstanding and
Entitled to Vote | |
Class A | | | 14,592,307.06 | |
Class B | | | 420,086.543 | |
Class C | | | 3,348,401.498 | |
Class E | | | 10,070.053 | |
Class I | | | 2,864,190.68 | |
Class R | | | 56,004.904 | |
Class Y | | | 747,679.240 | |
TOTAL | | | 22,038,739.978 | |
Ownership of Shares
As of January 17, 2014, the Trust believes that its Trustees and officers, as a group, owned less than one percent of each class of shares of each Fund and of the Trust as a whole. The tables below show, as of January 17, 2014, the shareholders of record who owned 5% or more of the outstanding shares of the noted class of shares of the noted Fund and their ownership upon consummation of the Reorganization.
50
The percentages presented below assume that the Reorganization of the Asset Strategy New Opportunities Fund is consummated:
| | | | | | | | | | | | |
Name and Address
of Shareholder | | Asset Strategy
New Opportunities
Fund | | | Emerging Markets
Equity Fund | | | ProForma
Combined Fund | |
First Clearing, LLC Special Custody Account for the Exclusive Benefit of Customer 2801 Market St St. Louis, MO 63103-2523 | |
| Class B
84,138.454 20.03 |
% | | | | | |
| Class B
73,225.109 7.96 |
1 % |
MLPF&S for the Sole Benefit of Its Customers Attn: Fund Administration 4800 Deer Lake Dr E Jacksonville, FL 32246-6484 | |
| Class B
38,813.513 9.24 |
% | | | | | |
| Class B
33,779.099 3.67 |
1 % |
Morgan Stanley Smith Barney for Exclusive Benefit of Customer Harborside Financial Center Plaza 2; 3rd Floor Jersey City, NJ 07311 | |
| Class B
21,596.323 5.14 |
% | | | | | |
| Class B
18,795.794 2.04 |
1 % |
LPL Financial FBO: Customer Accounts Attn: Mutual Fund Operations PO Box 509046 San Diego, CA 92150-9046 | |
| Class C
318,604.843 9.52 |
% | | | | | |
| Class C
264,065.620 6.11 |
1 % |
First Clearing, LLC Special Custody Account for the Exclusive Benefit of Customer 2801 Market St St. Louis, MO 63103-2523 | |
| Class C
574,389.777 17.15 |
% | | | | | |
| Class C
476,138.971 11.01 |
1 % |
MLPF&S for the Sole Benefit of Its Customers Attn: Fund Administration 4800 Deer Lake Dr E Jacksonville, FL 32246-6484 | |
| Class C
338,002.104 10.09 |
% | |
| Class C
127,170.299 12.68 |
% | |
| Class C
405,367.701 9.38 |
1 % |
Morgan Stanley Smith Barney for Exclusive Benefit of Customer Harborside Financial Center Plaza 2; 3rd Floor Jersey City, NJ 07311 | |
| Class C
353,734.582 10.56 |
% | |
| Class C
117,215.489 11.69 |
% | |
| Class C
410,452.781 9.49 |
1 % |
Raymond James Omnibus for Mutual Funds House Acct Firm 92500015 Attn: Courtney Waller 880 Carillon Pkwy St. Petersburg, FL 33716-1100 | |
| Class C
300,359.381 8.97 |
% | | | | | |
| Class C
248,971.058 5.76 |
1 % |
RBC Capital Markets LLC Special Custody Account for Exclusive Benefit of Customers Attn: Mutual Fund Ops Manager 510 Marquette Ave S Minneapolis, MN 55402-1110 | | | | | |
| Class C
53,508.000 5.34 |
% | |
| Class C
53,508.000 1.24 |
% |
51
| | | | | | | | | | | | |
Name and Address
of Shareholder | | Asset Strategy
New Opportunities
Fund | | | Emerging Markets
Equity Fund | | | ProForma
Combined Fund | |
Waddell & Reed Inc 1999 DCA Acct Attn: Treasury Department PO Box 29217 Shawnee Mission, KS 66201-9217 | |
| Class E
10,070.053 100 |
% | | | | | |
| Class E
7,597.053 48.89 |
1 % |
Waddell & Reed Financial Inc Attn: Treasury Department PO Box 29217 Shawnee Mission, KS 66201-9217 | | | | | |
| Class E
8,005.201 100 |
% | |
| Class E
8,005.2010 51.52 |
% |
First Clearing, LLC Special Custody Account for the Exclusive Benefit of Customer 2801 Market St St. Louis, MO 63103-2523 | |
| Class I
436,451.815 15.24 |
% | | | | | |
| Class I
297,275.715 2.44 |
1 % |
MLPF&S for the Sole Benefit of Its Customers Attn: Fund Administration 4800 Deer Lake Dr E Jacksonville, FL 32246-6484 | |
| Class I
463,694.518 16.19 |
% | | | | | |
| Class I
315,842.743 2.59 |
1 % |
NFS LLC FEBO Marshall & Ilsley Trust Co FBO Bank 98 Dly Rcrdkpg Attn: Mut Funds 11270 W Park Pl; Ste 400 Milwaukee, WI 53224 | |
| Class I
185,830.161 6.49 |
% | | | | | |
| Class I
126,561.599 1.04 |
1 % |
Morgan Stanley Smith Barney for Exclusive Benefit of Customer Harborside Financial Center Plaza 2; 3rd Floor Jersey City, NJ 07311 | |
| Class I
496,012.712 17.32 |
% | | | | | |
| Class I
337,841.449 2.77 |
1 % |
Raymond James Omnibus for Mutual Funds House Acct Firm 92500015 Attn: Courtney Waller 880 Carillon Pkwy St. Petersburg, FL 33716-1100 | |
| Class I
311,081.653 10.86 |
% | | | | | |
| Class I
211,904.984 1.74 |
1 % |
Bank of New York-Mellon Cust Ivy Managed International Opportunities Master Account c/o Carrie Kelly 6300 Lamar Ave Mission, KS 66202-4247 | | | | | |
| Class I
4,902,355.812 55.68 |
% | |
| Class I
4,902,355.812 40.24 |
% |
Bank of New York-Mellon Cust Ivy Managed EuroPacific Fund Master Account c/o Carrie Kelly 6300 Lamar Ave Mission, KS 66202-4247 | | | | | |
| Class I
3,545,002.165 40.26 |
% | |
| Class I
3,545,002.165 29.10 |
% |
Waddell & Reed Inc 1999 DCA Acct Attn: Treasury Department PO Box 29217 Shawnee Mission, KS 66201-9217 | |
| Class R
37,809.187 67.51 |
% | | | | | |
| Class R
28,472.554 46.63 |
1 % |
52
| | | | | | | | | | | | |
Name and Address
of Shareholder | | Asset Strategy
New Opportunities
Fund | | | Emerging Markets
Equity Fund | | | ProForma
Combined Fund | |
FIIOC FBO Resource Management Group Inc 401K PSP Plan 100 Magellan Way Covington, KY 41015-1987 | |
| Class R
8,761.251 15.64 |
% | | | | | |
| Class R
6,598.239 10.81 |
1 % |
MLPF&S for the Sole Benefit of Its Customers Attn: Fund Administration 4800 Deer Lake Dr E Jacksonville, FL 32246-6484 | | | | | |
| Class R
1,234.877 6.42 |
% | |
| Class R
1,234.877 2.02 |
% |
Ivy Funds Distributor Inc Attn: Treasury Department PO Box 29217 Mission, KS 66201-9217 | | | | | |
| Class R
18,013.699 93.58 |
% | |
| Class R
18,013.699 29.50 |
% |
LPL Financial FBO: AXA Customer Accounts Attn: Mutual Fund Operations PO Box 509046 San Diego, CA 92150-9046 | |
| Class Y
111,219.605 14.88 |
% | | | | | |
| Class Y
83,140.003 9.58 |
1 % |
Charles Schwab & Co Inc Special Custody A/C for the Benefit of Customers Attn: Mutual Funds 211 Main St San Francisco, CA 94105-1905 | |
| Class Y
136,697.900 18.28 |
% | | | | | |
| Class Y
102,202.260 11.77 |
1 % |
Nationwide Trust Company FSB c/o IPO Portfolio Accounting PO Box 182029 Columbus, OH 43218-2029 | | | | | |
| Class Y
262,565.145 85.71 |
% | |
| Class Y
262,565.145 30.25 |
% |
| 1 | Adjustments reflect estimated one-time proxy, accounting, legal and other costs of approximately $129,446 to be borne by the Asset Strategy New Opportunities Fund. No expenses will be borne by the Emerging Markets Equity Fund as a result of the Reorganization. |
VOTING INFORMATION
General
Required Vote for the Proposal
Approval of the Plan will require the affirmative vote of the holders of a majority of the shares of the Asset Strategy New Opportunities entitled to vote at the Meeting. A majority of shareholders is defined as (i) 67% or more of the voting securities present at the meeting, if the holders of more than 50% of the outstanding voting securities are present or represented by proxy, or (ii) more than 50% of the outstanding voting securities of the Asset Strategy New Opportunities Fund, whichever is less. A vote of the shareholders of the Emerging Markets Equity Fund is not needed to approve the Reorganization.
53
The Board is soliciting proxies from the shareholders of the Asset Strategy New Opportunities Fund in connection with the Meeting, which has been called to be held at 4:00 PM, Central Time, on March 6, 2014 at 6300 Lamar Avenue, Overland Park, Kansas. The meeting notice, this Prospectus/Proxy, the Prospectus for the Emerging Markets Equity Fund and proxy cards are being mailed to shareholders beginning on or about February 5, 2014.
THE BOARD UNANIMOUSLY RECOMMENDS APPROVAL OF THE AGREEMENT AND PLAN OF REORGANIZATION.
Information About Proxies and the Conduct of the Meeting
Solicitation of Proxies. Proxies will be solicited primarily by mailing this Prospectus/Proxy and its enclosures, but proxies may also be solicited through further mailings, telephone calls, personal interviews or e-mail by officers of the Trust or by employees or agents of its service contractors.
Voting Process
You can vote in any one of the following ways:
| | (a) | By mail, by filling out and returning the enclosed proxy card; |
| | (b) | By phone or Internet (see enclosed proxy card for instructions); or |
| | (c) | In person at the Meeting. |
Shareholders who owned shares on the record date, January 17, 2014, are entitled to vote at the Meeting. For each dollar of NAV of the Asset Strategy New Opportunities Fund that you own, you are entitled to one vote, and for each fractional share you hold, you are entitled to a proportionate fractional vote. If you choose to vote by mail and you are an individual account owner, please sign exactly as your name appears on the proxy card. Either owner of a joint account may sign the proxy card, but the signer’s name must exactly match the name that appears on the card.
Costs. The Emerging Markets Equity Fund will bear the transfer agency costs related to the Reorganization and the costs of registration of its shares to be issued to shareholders of the Asset Strategy New Opportunities Fund upon the closing of the Reorganization. All other costs of the Meeting that are estimated to be $258,892, including the costs of soliciting proxies, and the costs of the Reorganization will be borne by the Asset Strategy New Opportunities Fund and IICO in the following percentages (and corresponding dollar amounts): Asset Strategy New Opportunities Fund 50% ($129,446) and IICO 50% ($129,446). These amounts, using information as of September 30, 2013, are estimated to have an impact of less than one-half cent per share to the Asset Strategy New Opportunities Fund. In the event that the shareholders of the Asset Strategy New Opportunities Fund do not approve the Plan
54
or the Reorganization does not close for any reason, the Adviser will bear the costs of the failed Reorganization, which would otherwise have been borne by the Asset Strategy New Opportunities Fund and the Emerging Markets Equity Fund.
Voting and Tabulation of Proxies. Shares represented by duly executed proxies will be voted as instructed on the proxy. If no instructions are given, the proxy will be voted in favor of the Proposal. You can revoke your proxy at any time before it is exercised by sending a signed, written letter of revocation to the Secretary of the Trust, by properly executing and submitting a later-dated proxy or by attending the Meeting and voting in person.
Votes cast in person or by proxy at the Meeting will be counted by persons appointed by the Asset Strategy New Opportunities Fund as proxies for the Meeting (the “Designees”). A quorum is constituted with respect to the Asset Strategy New Opportunities Fund by presence in person or by proxy of the holders of more than 33 1/3% of the outstanding shares of the Asset Strategy New Opportunities Fund entitled to vote at the Meeting. In determining whether a quorum is present, abstentions and “broker non-votes” will be counted as outstanding shares that are entitled to vote. Since these shares will be counted as present, but not as voting in favor of the Proposal, these shares will have the same effect as if they cast votes against the Proposal. “Broker non-votes” are shares held by brokers or nominees as to which (i) the broker or nominee does not have discretionary voting power and (ii) the broker or nominee has not received instructions from the beneficial owner or other person who is entitled to instruct how the shares will be voted.
Adviser and Underwriter. The address of the investment manager to both the Asset Strategy New Opportunities Fund and the Emerging Markets Equity Fund is Ivy Investment Management Company, 6300 Lamar Avenue, P.O. Box 29217, Shawnee Mission, Kansas 66201-9217. The Adviser is an indirect, wholly-owned subsidiary of Waddell & Reed Financial, Inc. (“Waddell & Reed”), a publicly held company. During the fiscal year ended March 31, 2013, the Asset Strategy New Opportunities Fund paid the Adviser management fees at an annual rate of 1.00% as a percentage of the Asset Strategy New Opportunities Fund’s net assets. During the fiscal year ended March 31, 2013, the Emerging Markets Equity Fund paid the Adviser management fees at an annual rate of 0.96% as a percentage of the Emerging Markets Equity Fund’s net assets. The Management Fee schedule for each Fund is set forth below.
| | |
Ivy Asset Strategy New Opportunities Fund | | |
Net Assets | | Fee |
Up to $500 million | | 1.00% of net assets |
Over $500 million and up to $1 billion | | 0.85% of net assets |
Over $1 billion and up to $2 billion | | 0.83% of net assets |
Over $2 billion and up to $3 billion | | 0.80% of net assets |
Over $3 billion | | 0.76% of net assets |
55
| | |
Ivy Emerging Markets Equity Fund | | |
Net Assets | | Fee |
Up to $500 million | | 1.00% of net assets |
Over $500 million and up to $1 billion | | 0.85% of net assets |
Over $1 billion and up to $2 billion | | 0.83% of net assets |
Over $2 billion and up to $3 billion | | 0.80% of net assets |
Over $3 billion | | 0.76% of net assets |
The address of the Funds’ principal underwriter, Ivy Funds Distributor, Inc., is 6300 Lamar Avenue, P.O. Box 29217, Shawnee Mission, Kansas 66201.
Other Service Providers for the Emerging Markets Equity Fund and the Asset Strategy New Opportunities Fund. The Asset Strategy New Opportunities Fund and Emerging Markets Equity Fund have the same service providers. Upon completion of the Reorganization, the Emerging Markets Equity Fund will continue to engage its existing service providers.
Adjournments; Other Business. In the event that a quorum is not present at the Meeting with respect to a particular Asset Strategy New Opportunities Fund, or if the Asset Strategy New Opportunities Fund has not received enough votes by the time of the Meeting to approve the Proposal, the chairman, or his or her substitutes, may propose that such Meeting be adjourned one or more times to permit further solicitation of proxies. Any adjournment requires the affirmative vote of a majority of the total number of shares of the Asset Strategy New Opportunities Fund that are present in person or by proxy when the adjournment is being voted on. If a quorum is present, the Designees will vote in favor of any such adjournment all proxies that they are entitled to vote in favor of the Proposal and the Designees will vote against any such adjournment any proxy that directs them to vote against the Proposal. The Designees will not vote any proxy that directs them to abstain from voting on the Proposal.
The Meeting has been called to transact any business that properly comes before it. The only business that management of the Asset Strategy New Opportunities Fund intends to present or knows that others will present is the Proposal. If any other matters properly come before the Meeting, and on all matters incidental to the conduct of the Meeting, the Designees intend to vote the proxies in accordance with their judgment, unless the Secretary of the Trust has previously received written contrary instructions from the shareholder entitled to vote the shares.
Shareholder Proposals at Future Meetings. Neither the Asset Strategy New Opportunities Fund nor the Emerging Markets Equity Fund holds annual or other regular meetings of shareholders. Shareholder proposals to be presented at any future meeting of shareholders of the Asset Strategy New Opportunities Fund or Emerging Markets Equity Fund must be received by the relevant Fund or Trust in writing a
56
reasonable time before the Asset Strategy New Opportunities Fund or Emerging Markets Equity Fund, as the case may be, solicits proxies for that meeting in order to be considered for inclusion in the proxy materials for that meeting. Shareholder proposals should be sent to the relevant Fund, Attention: Mara Herrington, Secretary, at 6300 Lamar Avenue, P.O. Box 29217, Shawnee Mission, Kansas 66201-9217.
Shareholder Communications. Shareholder communications to the Board must be in writing and addressed to the Board and to the attention of Mara Herrington, Secretary of the respective Fund, at 6300 Lamar Avenue, Overland Park, Kansas 66202. If a specific Trustee is the intended recipient of such communication, the name of that Trustee must be noted therein. The Secretary will forward such correspondence only to the intended recipient if one is noted. Prior to forwarding any correspondence, the Secretary will review the communication and will not forward communications deemed by the Secretary, in her discretion, to be frivolous, of inconsequential commercial value or otherwise inappropriate for Board’s consideration. Any communication reviewed by the Secretary and not forwarded to the Board for consideration shall be forwarded to and reviewed by independent legal counsel to the Independent Trustees. In the event independent legal counsel to the Independent Trustees disagrees with the determination of the Secretary and deems such communication appropriate for Board consideration, such communication shall be forwarded to the Board or members thereof, as appropriate. Each Fund will retain shareholder communications addressed to the Board in accordance with its record retention policy.
57
APPENDIX A
AGREEMENT AND PLAN OF REORGANIZATION
THIS AGREEMENT AND PLAN OF REORGANIZATION (the “Agreement”) dated as of , 2014 by and between (i) Ivy Funds (the “Trust”), a Delaware statutory trust established under an Agreement and Declaration of Trust dated November 13, 2008, and in effect on the date hereof (the “Declaration of Trust”), on behalf of the Ivy Asset Strategy New Opportunities Fund (the “Acquired Fund”), a series of the Trust, (ii) the Trust, on behalf of the Ivy Emerging Markets Equity Fund (the “Acquiring Fund”), a series of the Trust, and (iii) Ivy Investment Management Company, the investment manager to the Acquired Fund and Acquiring Fund (“IICO”)(for purposes of paragraphs 9.1 and 9.2 of this Agreement only).
This Agreement is intended to be and is adopted as a plan of reorganization within the meaning of the regulations under Section 368(a) of the United States Internal Revenue Code of 1986, as amended (the “Code”). The reorganization will consist of the transfer of all of the assets of the Acquired Fund in exchange for Class A shares, Class B shares, Class C shares, Class E shares, Class I shares, Class R shares and Class Y shares of beneficial interest of the Acquiring Fund (the “Acquiring Shares”), and the assumption by the Acquiring Fund of all the liabilities of the Acquired Fund (other than certain expenses of the reorganization contemplated hereby) and the distribution of such shares of the Acquiring Fund to the shareholders of the Acquired Fund in liquidation of the Acquired Fund, all upon the terms and conditions set forth in this Agreement.
In consideration of the premises and of the covenants and agreements hereinafter set forth, the parties hereto covenant and agree as follows:
| 1. | TRANSFER OF ASSETS OF ACQUIRED FUND IN EXCHANGE FOR ASSUMPTION OF LIABILITIES AND ACQUIRING SHARES AND LIQUIDATION OF ACQUIRED FUND. |
| 1.1 | Subject to the terms and conditions herein set forth and on the basis of the representations and warranties contained herein, |
| | (a) | The Trust, on behalf of the Acquired Fund, will transfer and deliver to the Trust, on behalf of the Acquiring Fund, and the Acquiring Fund will acquire, all the assets of the Acquired Fund as set forth in paragraph 1.2. |
| | (b) | The Acquiring Fund will assume all of the Acquired Fund’s liabilities and obligations of any kind whatsoever, whether absolute, accrued, contingent or otherwise in existence on the Closing Date (as defined in paragraph 1.2 hereof) (collectively, the “Obligations”), except that expenses of reorganization contemplated hereby to be paid by the Acquired Fund |
A-1
| | pursuant to paragraph 9 shall not be assumed or paid by the Acquiring Fund. |
| | (c) | The Acquiring Fund will issue and deliver to the Acquired Fund in exchange for the assets transferred pursuant to paragraph 1.1(a) and the assumption of liabilities pursuant to paragraph 1.1(b) the number of full and fractional (rounded to the third decimal place) Class A shares, Class B shares, Class C shares, Class E shares, Class I shares, Class R shares and Class Y shares determined by dividing the net value of the Acquired Fund, computed in the manner and as of the time and date set forth in paragraph 2.1, attributable to each such class of shares of the Acquired Fund by the net asset value (“NAV”) of one Acquiring Share of the same class, computed in the manner and as of the time and date set forth in paragraph 2.2. Such transactions shall take place at the closing provided for in paragraph 3.1 (the “Closing”). |
| 1.2 | The assets of the Acquired Fund to be acquired by the Acquiring Fund shall consist of all cash, securities, dividends and interest receivable, receivables for shares sold and all other assets which are owned by the Acquired Fund on the closing date provided in paragraph 3.1 (the “Closing Date”), including any deferred expenses, other than unamortized organizational expenses, shown as an asset on the books of the Acquired Fund on the Closing Date. |
| 1.3 | As provided in paragraph 3.4, as soon after the Closing Date as is conveniently practicable (the “Liquidation Date”), the Acquired Fund will liquidate and distribute pro rata to its shareholders of record (the “Acquired Fund Shareholders”), determined as of the close of business on the Valuation Date (as defined in paragraph 2.1), the Acquiring Shares received by the Acquired Fund pursuant to paragraph 1.1. Such liquidation and distribution will be accomplished by the transfer of the Acquiring Shares then credited to the account of the Acquired Fund on the books of the Acquiring Fund to open accounts on the share records of the Acquiring Fund in the names of the Acquired Fund Shareholders and representing the respective pro rata number of full and fractional (rounded to the third decimal place) Acquiring Shares due such shareholders, by class (i.e., the account for each Acquired Fund Shareholder of a class of Acquired Shares will be credited with the respective pro rata number of shares of the Corresponding Class of Acquiring Shares due that Shareholder). The Acquiring Fund shall not be obligated to issue certificates representing Acquiring Shares in connection with such exchange. |
| 1.4 | With respect to Acquiring Shares distributable pursuant to paragraph 1.3 to an Acquired Fund Shareholder holding a certificate or certificates for shares of the Acquired Fund, if any, on the Valuation Date, the Trust will not permit such shareholder to receive Acquiring Share certificates therefor, exchange such Acquiring Shares for shares of other investment companies, effect an account |
A-2
| | transfer of such Acquiring Shares, or pledge or redeem such Acquiring Shares until such Shareholder has surrendered all his or her outstanding certificates for Acquired Fund shares or, in the event of lost certificates, posted adequate bond. |
| 1.5 | As promptly as possible after the Closing Date, the Acquired Fund shall be terminated pursuant to the provisions of the Declaration of Trust and the laws of the State of Delaware, and, after the Closing Date, the Acquired Fund shall not conduct any business except in connection with its liquidation. |
| 2.1 | For the purpose of paragraph 1, the value of the shares of each class of the Acquired Fund shall be equal to the net asset value of such shares of the Acquired Fund computed as of the close of regular trading on the New York Stock Exchange on the business day next preceding the Closing (such time and date being herein called the “Valuation Date”) using the valuation procedures as adopted by the Board of Trustees of the Trust and as set forth in the then-current prospectus or prospectuses or statement or statements of additional information of the Trust (collectively, as amended or supplemented from time to time, the “Acquiring Fund Prospectus”), after deduction for the expenses of the reorganization contemplated hereby to be paid by the Acquired Fund pursuant to paragraph 9. |
| 2.2 | For the purpose of paragraph 1, the net asset value per share of each class of Acquiring Shares shall be the net asset value per share computed as of the close of regular trading on the New York Stock Exchange on the Valuation Date, using the valuation procedures as adopted by the Board of Trustees of the Trust and as set forth in the Acquiring Fund Prospectus. All computations pursuant to paragraphs 2.1 and 2.2 shall be made by or under the direction of IICO. |
| 3. | CLOSING AND CLOSING DATE. |
| 3.1 | The Closing Date shall be on March 17, 2014 or on such other date as the parties may agree in writing. The Closing shall be held at 9:00AM on the Closing Date at the offices of IICO, located at 6300 Lamar Avenue, Overland Park, Kansas or at such other time and/or place as the parties may agree. |
| 3.2 | On the Closing Date, the portfolio securities of the Acquired Fund and all the Acquired Fund’s cash shall be delivered by the Acquired Fund to the account of the Acquiring Fund, such portfolio securities to be duly endorsed in proper form for transfer in such manner and condition as to constitute good delivery thereof in accordance with the custom of brokers or, in the case of portfolio securities held in the U.S. Treasury Department’s book-entry system or by the Depository Trust Company, Participants Trust Company or other third party depositories, by transfer in accordance with Rule 17f-4, Rule 17f-5 or Rule 17f-7, as the case |
A-3
| | may be, under the Investment Company Act of 1940, as amended (the “1940 Act”) and accompanied by all necessary federal and state stock transfer stamps or a check for the appropriate purchase price of such transfer stamps. The cash delivered shall be in the form of currency or certified or official bank checks, payable to the order of “Bank of New York Mellon, custodian for Ivy Emerging Markets Equity Fund, a series of Ivy Funds.” |
| 3.3 | In the event that on the Valuation Date (a) the New York Stock Exchange shall be closed to trading or general trading thereon shall be restricted, or (b) trading or the reporting of trading on said Exchange or elsewhere shall be disrupted so that accurate appraisal of the value of the net assets of the Acquired Fund is impracticable, the Valuation Date shall be postponed until the first business day after the day when trading shall have been fully resumed and reporting shall have been restored; provided that if trading shall not be fully resumed and reporting restored within three business days after the original Valuation Date, this Agreement may be terminated by either Fund upon the giving of written notice to the other Fund. |
| 3.4 | At the Closing, the Acquired Fund or its transfer agent shall deliver to the Acquiring Fund or its designated agent a list of the names and addresses of the Acquired Fund Shareholders and the number of outstanding shares of beneficial interest of each class of the Acquired Fund owned by each Acquired Fund Shareholder, all as of the close of business on the Valuation Date. |
| 3.5 | At the Closing, each party shall deliver to the other such bills of sale, instruments of assumption of liabilities, checks, assignments, stock certificates, receipts or other documents as such other party or its counsel may reasonably request in connection with the transfer of assets, assumption of liabilities and liquidation contemplated by paragraph 1. |
| 4. | REPRESENTATIONS AND WARRANTIES. |
| 4.1 | The Trust, on behalf of the Acquired Fund, represents and warrants the following to the Acquiring Fund as of the date hereof and agrees to confirm the continuing accuracy and completeness in all material respects of the following on the Closing Date: |
| | (a) | The Acquired Fund’s current prospectus or prospectuses and statement of additional information or statements of additional information (collectively, as amended or supplemented from time to time, the “Acquired Fund Prospectus”) conform in all material respects with the applicable requirements of the Securities Act of 1933, as amended (the “1933 Act”), and the rules and regulations of the SEC thereunder and does not include any untrue statement of a material fact or omit to state any material fact required to be stated therein or necessary to make the |
A-4
| | statements therein, in light of the circumstances under which they were made, not misleading, and there are no material contracts to which the Acquired Fund is a party that are not referred to in the Acquired Fund Prospectus or in the registration statement of which it is a part; |
| | (b) | The financial statements of the Acquired Fund as of March 31, 2013 and for the fiscal year then ended have been prepared in accordance with generally accepted accounting principles and have been audited by independent auditors, and such statements fairly reflect the financial condition of the Acquired Fund as of March 31, 2013, and there are no known contingent liabilities of the Acquired Fund as of such date that are not disclosed in such statements; |
| | (c) | The financial statements of the Acquired Fund as of September 30, 2013 and for the period then ended have been prepared in accordance with generally accepted accounting principles, and such statements fairly reflect the financial condition of the Acquired Fund as of September 30, 2013, and there are no known contingent liabilities of the Acquired Fund as of such date that are not disclosed in such statements; |
| | (d) | Since the date of the financial statements referred to in subsection (c) above, there have been no material adverse changes in the Acquired Fund’s financial condition, assets, liabilities, or business (other than changes occurring in the ordinary course of business) and there are no known contingent liabilities of the Acquired Fund arising after such date. For the purposes of this subsection (d), a decline in the net asset value of the Acquired Fund shall not constitute a material adverse change; |
| | (e) | By the Closing Date, all federal and other tax returns and reports of the Acquired Fund required by law to have been filed by such date (giving effect to extensions) shall have been filed, and all federal and other taxes shown to be due on said returns and reports shall have been paid so far as due, or provision shall have been made for the payment thereof, and to the best of the Acquired Fund’s knowledge no such return is currently under audit and no assessment has been asserted with respect to any such return; |
| | (f) | For all taxable years and all applicable quarters of such years from the date of its inception, the Acquired Fund has met, and for the taxable year ending on the Closing Date, will meet the requirements of Subchapter M of the Code for treatment as a “regulated investment company” within the meaning of Section 851 of the Code, and the Acquired Fund has no earnings and profits accumulated in any taxable year in which the provisions of Subchapter M did not apply to it. Neither the Trust nor the Acquired Fund has at any time since its inception been liable for, nor is now liable for, any material tax pursuant to Sections 852 or 4982 of the |
A-5
| | Code, except as previously disclosed in writing to and accepted by the Acquiring Fund. The Acquired Fund has duly filed all federal, state, local and foreign tax returns which are required to have been filed, and all taxes of the Acquired Fund which are due and payable have been paid except for amounts that alone or in the aggregate would not reasonably be expected to have a material adverse effect. The Acquired Fund is in compliance in all material respects with applicable regulations of the Internal Revenue Service pertaining to the reporting of dividends and other distributions on and redemptions of its capital stock and to withholding in respect of dividends and other distributions to shareholders, and is not liable for any material penalties which could be imposed thereunder; |
| | (g) | The authorized capital of the Trust consists of an unlimited number of shares of beneficial interest, $0.001 par value, of such number of different series as the Board of Trustees of the Trust may authorize from time to time. The outstanding shares of beneficial interest in the Acquired Fund are, and at the Closing Date will be, divided into Class A shares, Class B shares, Class C shares, Class E shares, Class I shares, Class R shares and Class Y shares, each having the characteristics described in the Acquired Fund Prospectus. All issued and outstanding shares of the Acquired Fund are, and at the Closing Date will be, duly and validly issued and outstanding, fully paid and (except as set forth in the Acquired Fund Prospectus), nonassessable by the Acquired Fund and will have been issued in compliance with all applicable registration or qualification requirements of federal and state securities laws. No options, warrants or other rights to subscribe for or purchase, or securities convertible into, any shares of beneficial interest of the Acquired Fund are outstanding and none will be outstanding on the Closing Date; |
| | (h) | The Acquired Fund’s investment operations from inception to the date hereof have been in compliance in all material respects with the investment policies and investment restrictions set forth in its prospectus and statement of additional information as in effect from time to time, except as previously disclosed in writing to and accepted by the Acquiring Fund; |
| | (i) | The Acquiring Shares to be issued to the Acquired Fund pursuant to paragraph 1 will not be acquired for the purpose of making any distribution thereof other than to the Acquired Fund Shareholders as provided in paragraph 1.3; |
| | (j) | No consent, approval, authorization or order of any court or governmental authority is required for the consummation by the Acquired Fund of the transactions contemplated by this Agreement, except such as may be required under the 1933 Act, the Securities Exchange Act of 1934, as amended (the “1934 Act”), the 1940 Act and state insurance, securities or |
A-6
| | blue sky laws (which term as used in this Agreement shall include the laws of the District of Columbia and of Puerto Rico); |
| | (k) | At the Closing Date, the Trust, on behalf of the Acquired Fund, will have good and marketable title to its assets to be transferred to the Acquiring Fund pursuant to paragraph 1.1 and will have full right, power and authority to sell, assign, transfer and deliver the Investments (as defined below) and any other assets of the Acquired Fund to be transferred to the Acquiring Fund pursuant to this Agreement. At the Closing Date, subject only to the delivery of the Investments and any such other assets and payment therefor as contemplated by this Agreement, the Acquiring Fund will acquire good and marketable title thereto and will acquire the Investments and any such other assets subject to no encumbrances, liens or security interests whatsoever and without any restrictions upon the transfer thereof, except as previously disclosed to and accepted by the Acquiring Fund. As used in this Agreement, the term “Investments” shall mean the Acquired Fund’s investments shown on the schedule of its investments as of September 30, 2013 referred to in Section 4.1(c) hereof, as supplemented with such changes in the portfolio as the Acquired Fund shall make, and changes resulting from stock dividends, stock splits, mergers and similar corporate actions through the Closing Date; |
| | (l) | At the Closing Date, the Acquired Fund will have sold such of its assets, if any, as are necessary to assure that, after giving effect to the acquisition of the assets of the Acquired Fund pursuant to this Agreement, the Acquiring Fund will remain a “diversified company” within the meaning of Section 5(b)(1) of the 1940 Act and in compliance with such other mandatory investment restrictions as are set forth in the Acquiring Fund Prospectus, as amended through the Closing Date; and |
| | (m) | No registration of any of the Investments under the Securities Act or under any state securities or blue sky laws would be required if they were, as of the time of such transfer, the subject of a public distribution by either of the Acquiring Fund or the Acquired Fund, except as previously disclosed by the Acquired Fund to and accepted by the Acquiring Fund. |
| 4.2 | The Trust, on behalf of the Acquiring Fund, represents and warrants the following to the Acquired Fund as of the date hereof and agrees to confirm the continuing accuracy and completeness in all material respects of the following on the Closing Date: |
| | (a) | The Acquiring Fund Prospectus conforms in all material respects with the applicable requirements of the 1933 Act and the rules and regulations of the SEC thereunder and does not include any untrue statement of a material fact or omit to state any material fact required to be stated therein |
A-7
| | or necessary to make the statements therein, in light of the circumstances under which they were made, not misleading, and there are no material contracts to which the Acquiring Fund is a party that are not referred to in the Acquiring Fund Prospectus or in the registration statement of which it is a part; |
| | (b) | At the Closing Date, the Acquiring Fund will have good and marketable title to its assets; |
| | (c) | The financial statements of the Acquiring Fund as of March 31, 2013 and for the fiscal year then ended have been prepared in accordance with generally accepted accounting principles and have been audited by independent auditors, and such statements fairly reflect the financial condition of the Acquiring Fund as of March 31, 2013, and there are no known contingent liabilities of the Acquiring Fund as of such date that are not disclosed in such statements; |
| | (d) | The financial statements of the Acquiring Fund as of September 30, 2013 and for the period then ended have been prepared in accordance with generally accepted accounting principles, and such statements fairly reflect the financial condition of the Acquiring Fund as of September 30, 2013, and there are no known contingent liabilities of the Acquiring Fund as of such date that are not disclosed in such statements; |
| | (e) | Since the date of the financial statements referred to in subsection (d) above, there have been no material adverse changes in the Acquiring Fund’s financial condition, assets, liabilities, or business (other than changes occurring in the ordinary course of business) and there are no known contingent liabilities of the Acquiring Fund arising after such date. For the purposes of this subsection (e), a decline in the net asset value of the Acquiring Fund shall not constitute a material adverse change. |
| | (f) | By the Closing Date, all federal and other tax returns and reports of the Acquiring Fund required by law to have been filed by such date (giving effect to extensions) shall have been filed, and all federal and other taxes shown to be due on said returns and reports shall have been paid so far as due, or provision shall have been made for the payment thereof, and to the best of the Acquiring Fund’s knowledge, no such return is currently under audit and no assessment has been asserted with respect to such returns; |
| | (g) | For all taxable years and all applicable quarters of such years from the date of its inception, the Acquiring Fund has met, and for the current taxable year will meet, the requirements of Subchapter M of the Code for treatment as a “regulated investment company” within the meaning of Section 851 of the Code. Neither the Trust nor the Acquiring Fund has at any time since its inception been liable for, nor is now liable for, any |
A-8
| | material tax pursuant to Sections 852 or 4982 of the Code, except as previously disclosed in writing to and accepted by the Acquired Fund. The Acquiring Fund has duly filed all federal, state, local and foreign tax returns which are required to have been filed, and all taxes of the Acquiring Fund which are due and payable have been paid except for amounts that alone or in the aggregate would not reasonably be expected to have a material adverse effect. The Acquiring Fund is in compliance in all material respects with applicable regulations of the Internal Revenue Service pertaining to the reporting of dividends and other distributions on and redemptions of its capital stock and to withholding in respect of dividends and other distributions to shareholders, and is not liable for any material penalties which could be imposed thereunder; |
| | (h) | The authorized capital of the Trust consists of an unlimited number of shares of beneficial interest, $.001 par value, of such number of different series as the Board of Trustees of the Trust may authorize from time to time. The outstanding shares in the Acquiring Fund are, and at the Closing Date will be, divided into Class A shares, Class B shares, Class C shares, Class E shares, Class I shares, Class R shares and Class Y shares, each having the characteristics described in the Acquiring Fund Prospectus. All issued and outstanding shares of the Acquiring Fund are, and at the Closing Date will be, duly and validly issued and outstanding, fully paid and (except as set forth in the Acquiring Fund Prospectus) non-assessable by the Trust, and will have been issued in compliance with all applicable registration or qualification requirements of federal and state securities laws. No options, warrants or other rights to subscribe for or purchase, or securities convertible into, any shares of common stock in the Acquiring Fund of any class are outstanding and none will be outstanding on the Closing Date (except such rights as the Acquiring Fund may have pursuant to this Agreement); |
| | (i) | The Acquiring Fund’s investment operations from inception to the date hereof have been in compliance in all material respects with the investment policies and investment restrictions set forth in its prospectus or prospectuses and statement or statements of additional information as in effect from time to time; |
| | (j) | The Acquiring Shares to be issued and delivered to the Acquired Fund pursuant to the terms of this Agreement will at the Closing Date have been duly authorized and, when so issued and delivered, will be duly and validly issued Class A shares, Class B shares, Class C shares, Class E shares, Class I shares, Class R shares or Class Y shares, as the case may be, in the Acquiring Fund, and will be fully paid and (except as set forth in the Acquiring Fund Prospectus) non-assessable by the Trust, and no |
A-9
| | shareholder of the Trust will have any preemptive right of subscription or purchase in respect thereof; |
| | (k) | No consent, approval, authorization or order of any court or governmental authority is required for the consummation by the Acquiring Fund of the transactions contemplated by this Agreement, except such as may be required under 1933 Act, the 1934 Act, the 1940 Act and state insurance, securities or blue sky laws. |
| 5. | COVENANTS OF THE ACQUIRED FUND AND THE ACQUIRING FUND. |
The Trust, on behalf of the Acquiring Fund on the one hand and the Acquired Fund on the other hand, hereby covenants and agrees as follows:
| 5.1 | The Acquired Fund will operate its business in the ordinary course between the date hereof and the Closing Date, it being understood that such ordinary course of business may include paying regular and customary periodic dividends and other distributions. |
| 5.2 | The Acquired Fund will call a meeting of its shareholders to be held prior to the Closing Date to consider and approve this Agreement and take all other reasonable action necessary to obtain the required shareholder approval of the transactions contemplated hereby. |
| 5.3 | In connection with the Acquired Fund shareholders’ meeting referred to in paragraph 5.2, the Acquired Fund will prepare a Proxy Statement for such meeting, to be included in a Registration Statement on Form N-14 (the “Registration Statement”), which the Trust will prepare and file for the registration under the 1933 Act of the Acquiring Shares to be distributed to the Acquired Fund Shareholders pursuant hereto, all in compliance with the applicable requirements of the 1933 Act, the 1934 Act, and the 1940 Act. |
| 5.4 | The Acquiring Fund will advise the Acquired Fund promptly if at any time prior to the Closing Date, the Acquiring Fund becomes aware that the assets of the Acquired Fund include any securities which the Acquiring Fund is not permitted to acquire. |
| 5.5 | Subject to the provisions of this Agreement, the Acquired Fund and the Acquiring Fund will each take or cause to be taken all actions, and do or cause to be done all things reasonably necessary, proper or advisable to cause the conditions to the other party’s obligations to consummate the transactions contemplated hereby to be met or fulfilled and otherwise to consummate and make effective such transactions. |
| 5.6 | The Acquiring Fund will use all reasonable efforts to obtain the approvals and authorizations required by the 1933 Act, the 1940 Act and such of the state securities or blue sky laws as it may deem appropriate in order to continue its operations after the Closing Date. |
A-10
| 6. | CONDITIONS PRECEDENT TO OBLIGATIONS OF THE ACQUIRED FUND. |
The obligations of the Acquired Fund to consummate the transactions provided for herein shall be subject, at its election, to the performance by the Acquiring Trust, on behalf of the Acquiring Fund, of all the obligations to be performed by it hereunder on or before the Closing Date.
| 7. | CONDITIONS PRECEDENT TO OBLIGATIONS OF THE ACQUIRING FUND. |
The obligations of the Acquiring Fund to consummate the transactions provided for herein shall be subject, at its election, to the performance by the Trust, on behalf of the Acquired Fund, of all the obligations to be performed by it hereunder on or before the Closing Date and, in addition thereto, to the following further conditions:
| 7.1 | Prior to the Closing Date, the Acquired Fund shall have declared a dividend or dividends which, together with all previous dividends, shall have the effect of distributing all of the Acquired Fund’s investment company taxable income for its taxable years ending on or after March 31, 2013 and on or prior to the Closing Date (computed without regard to any deduction for dividends paid), and all of its net capital gains realized in each of its taxable years ending on or after March 31, 2013 and on or prior to the Closing Date. |
| 7.2 | The custodian of the Acquired Fund shall have delivered to the Acquiring Fund a certificate identifying all of the assets of the Acquired Fund held by such custodian as of the Valuation Date, and the Acquired Fund shall have delivered to the Acquiring Fund a statement of assets and liabilities of the Acquired Fund as of the Valuation Date, prepared in accordance with generally accepted accounting principles consistently applied from the prior audited period, certified by the Treasurer of the Acquired Fund. |
| 8. | FURTHER CONDITIONS PRECEDENT TO OBLIGATIONS OF EACH OF THE ACQUIRING FUND AND THE ACQUIRED FUND. |
The obligations of the Trust on behalf of the Acquired Fund on the one hand and on behalf of the Acquiring Fund on the other hand hereunder are subject to the further conditions that on or before the Closing Date:
| 8.1 | This Agreement and the transactions contemplated herein shall have been approved by the vote of the required majority of the holders of the outstanding shares of the Acquired Fund of record on the record date for the meeting of its shareholders referred to in section 5.2. |
| 8.2 | On the Closing Date, no action, suit or other proceeding shall be pending before any court or governmental agency in which it is sought to restrain or prohibit, or |
A-11
| | obtain damages or other relief in connection with, this Agreement or the transactions contemplated hereby; |
| 8.3 | All consents of other parties and all other consents, orders and permits of federal, state and local regulatory authorities (including those of the SEC and of state blue sky and securities authorities) deemed necessary by the Trust to permit consummation, in all material respects, of the transactions contemplated hereby shall have been obtained, except where failure to obtain any such consent, order or permit would not involve a risk of a material adverse effect on the assets or properties of the Acquiring Fund or the Acquired Fund; |
| 8.4 | The Registration Statement referred to in paragraph 5.3 shall have become effective under the 1933 Act and no stop order suspending the effectiveness thereof shall have been issued and, to the best knowledge of the parties hereto, no investigation or proceeding for that purpose shall have been instituted or be pending, threatened or contemplated under the 1933 Act; |
| 8.5 | The Trust on behalf of each of the Acquired Fund and the Acquiring Fund shall have received a favorable opinion of K&L Gates LLP satisfactory to the Trust substantially to the effect that, for federal income tax purposes: |
| | (a) | The acquisition by the Acquiring Fund of the assets of the Acquired Fund in exchange for the Acquiring Fund’s assumption of the Obligations of the Acquired Fund and issuance of the Acquiring Shares, followed by the distribution by the Acquired Fund of such Acquiring Shares to the shareholders of the Acquired Fund in exchange for their shares of the Acquired Fund, all as provided in paragraph 1 hereof, will constitute a reorganization within the meaning of Section 368(a) of the Code, and the Acquired Fund and the Acquiring Fund will each be “a party to a reorganization” within the meaning of Section 368(b) of the Code; |
| | (b) | No gain or loss will be recognized to the Acquired Fund (i) upon the transfer of its assets to the Acquiring Fund in exchange for the Acquiring Shares and the Acquiring Fund’s assumption of the Obligations or (ii) upon the distribution of the Acquiring Shares to the shareholders of the Acquired Fund as contemplated in paragraph 1 hereof; |
| | (c) | No gain or loss will be recognized by the Acquiring Fund upon the receipt of the assets of the Acquired Fund in exchange for the assumption of the Obligations and issuance of the Acquiring Shares as contemplated in paragraph 1 hereof; |
| | (d) | The tax basis of the assets of the Acquired Fund acquired by the Acquiring Fund will be the same as the basis of those assets in the hands of the Acquired Fund immediately prior to the transfer, and the holding period of the assets of the Acquired Fund in the hands of the Acquiring Fund will |
A-12
| | include the period during which those assets were held by the Acquired Fund; |
| | (e) | The Acquired Fund Shareholders will recognize no gain or loss upon the exchange of their shares of the Acquired Fund for the Acquiring Shares; |
| | (f) | The tax basis of the Acquiring Shares to be received by each Acquired Fund Shareholder will be the same in the aggregate as the aggregate tax basis of the shares of the Acquired Fund surrendered in exchange therefor; |
| | (g) | The holding period of the Acquiring Shares to be received by each Acquired Fund Shareholder will include the period during which the shares of the Acquired Fund surrendered in exchange therefor were held by such shareholder, provided such shares of the Acquired Fund were held as a capital asset on the date of the exchange; and |
| | (h) | The Acquiring Fund will succeed to and take into account the items of the Acquired Fund described in Section 381(c) of the Code, subject to the conditions and limitations specified in Sections 381, 382, 383 and 384 of the Code and the regulations thereunder. |
| 8.6 | At any time prior to the Closing, any of the foregoing conditions of this paragraph 8 may be waived by the Board of Trustees of the Trust if, in their judgment, such waiver will not have a material adverse effect on the interests of the shareholders of the Acquired Fund and the Acquiring Fund. |
| 9.1 | All fees paid to governmental authorities for the registration or qualification of the Acquiring Shares and all transfer agency costs related to the Acquiring Shares shall be allocated to the Trust, on behalf of the Acquiring Fund. All of the other expenses of the transactions, including without limitation, fees and expenses related to printing, mailing, and accounting, legal and custodial expenses, contemplated by this Agreement shall be allocated to the Trust, on behalf of the Acquired Fund. The expenses detailed above shall be borne as follows: Asset Strategy New Opportunities Fund 50% and IICO 50%. Neither Fund will be reimbursed for any expenses incurred by it or on its behalf in connection with the reorganization contemplated by this Agreement unless those expenses are solely and directly related to the reorganization contemplated by this Agreement (determined in accordance with the guidelines set forth in Rev. Rul. 73-54, 1973-1 C.B. 187). |
| 9.2 | In the event the transactions contemplated by this Agreement are not consummated, then IICO agrees that it shall bear all of the costs and expenses incurred by both the Acquiring Fund and the Acquired Fund in connection with such transactions. |
A-13
| 9.3 | Notwithstanding any other provisions of this Agreement, if for any reason the transactions contemplated by this Agreement are not consummated, neither the Acquiring Fund nor the Acquired Fund shall be liable to the other for any damages resulting therefrom, including, without limitation, consequential damages. |
| 9.4 | Notwithstanding any of the foregoing, costs and expenses will in any event be paid by the party directly incurring them if and to the extent that the payment by another party of such costs and expenses would result in the disqualification of such party as a “regulated investment company” within the meaning of Section 851 of the Code. |
| 10. | ENTIRE AGREEMENT; SURVIVAL OF WARRANTIES. |
| 10.1 | The Trust on behalf of the Acquired Fund and the Trust on behalf of the Acquiring Fund agree that neither party has made any representation, warranty or covenant to the other not set forth herein and that this Agreement constitutes the entire agreement between the parties. |
| 10.2 | The representations, warranties and covenants contained in this Agreement or in any document delivered pursuant hereto or in connection herewith shall not survive the consummation of the transactions contemplated hereunder, except paragraphs 1.1, 1.3, 1.4, 1.5, 3.4, 9, 10, 13 and 14. |
| 11.1 | The Trust may at its option terminate this Agreement at or prior to the Closing Date. |
| 11.2 | If the transactions contemplated by this Agreement have not been substantially completed by August 29, 2014, this Agreement shall automatically terminate on that date unless a later date is agreed to by the Trust. |
This Agreement may be amended, modified or supplemented in such manner as may be mutually agreed upon in writing by the authorized officers of the Trust on behalf of the Acquiring Fund and the Trust on behalf of the Acquiring Fund; provided, however, that following the effectiveness of the Registration Statement called for in paragraph 5.3, no such amendment may have the effect of changing the provisions for determining the number of the Acquiring Shares to be issued to the Acquired Fund Shareholders under this Agreement to the detriment of such shareholders without their further approval.
A-14
Any notice, report, statement or demand required or permitted by any provisions of this Agreement shall be in writing and shall be given by prepaid courier, telecopy or certified mail addressed to: Ivy Funds, 6300 Lamar Avenue, P. O. Box 29217, Shawnee Mission, Kansas 66201-9217, attn: Secretary.
| 14. | HEADINGS; COUNTERPARTS; GOVERNING LAW; ASSIGNMENT; NON-RECOURSE; FINDERS’ FEES. |
| 14.1 | The article and paragraph headings contained in this Agreement are for reference purposes only and shall not affect in any way the meaning or interpretation of this Agreement. |
| 14.2 | This Agreement may be executed in any number of counterparts, each of which shall be deemed an original. |
| 14.3 | This Agreement shall be governed by and construed in accordance with the domestic substantive laws of the State of Delaware, without giving effect to any choice or conflicts of law rule or provision that would result in the application of the domestic substantive laws of any other jurisdiction. |
| 14.4 | This Agreement shall bind and inure to the benefit of the parties hereto and their respective successors and assigns, but no assignment or transfer hereof or of any rights or obligations hereunder shall be made by any party without the written consent of the other party. Nothing herein expressed or implied is intended or shall be construed to confer upon or give any person, firm or corporation, other than the parties hereto and their respective successors and assigns, any rights or remedies under or by reason of this Agreement. |
| 14.5 | A copy of the Declaration of Trust is on file with the Secretary of the State of Delaware, and notice is hereby given that no trustee, director, officer, agent or employee of the Trust shall have any personal liability under this Agreement, and that this Agreement is binding only upon the assets and properties of the Acquired Fund and the Acquiring Fund. |
| 14.6 | The Trust, on behalf of the Acquired Fund, and the Trust, on behalf of the Acquiring Fund, represents and warrants that there are no brokers or finders entitled to receive any payments in connection with the transactions provided for herein. |
A-15
IN WITNESS WHEREOF, each of the parties hereto has caused this Agreement to be executed as a sealed instrument by its President or Vice President and its corporate seal to be affixed thereto and attested by its Secretary or Assistant Secretary.
| | | | | | |
| | | | IVY FUNDS, |
| ATTEST: | | on behalf of Ivy Asset Strategy New Opportunities Fund |
| | | |
| By: | | | | By: | | |
| | | |
| Name: | | | | Name: | | |
| | | |
| Title: | | | | Title: | | |
| | |
| | | | IVY FUNDS, |
| ATTEST: | | on behalf of Ivy Emerging Markets Equity Fund |
| | | |
| By: | | | | By: | | |
| | | |
| Name: | | | | Name: | | |
| | | |
| Title: | | | | Title: | | |
| | |
| | | | Agreed and accepted as to paragraphs 9.1 and 9.2 only: |
| |
| ATTEST: | | IVY INVESTMENT MANAGEMENT COMPANY |
| | | |
| By: | | | | By: | | |
| | | |
| Name: | | | | Name: | | |
| | | |
| Title: | | | | Title: | | |
A-16
APPENDIX B
FINANCIAL HIGHLIGHTS
The following information is to help you understand the financial performance of each of the classes of the Asset Strategy New Opportunities Fund and the Emerging Markets Equity Fund (formerly Ivy Pacific Opportunities Fund) for the fiscal periods shown. Certain information reflects financial results for a single Fund share. Total return shows how much your investment would have increased (or decreased) during each period, assuming reinvestment of all dividends and other distributions. Except for the six-month period information ended September 30, 2013, this information has been audited by Deloitte & Touche LLP, whose Reports of Independent Registered Public Accounting Firm, along with the Funds’ financial statements and financial highlights for the fiscal year ended March 31, 2013, are included in the Funds’ Annual Report to Shareholders which is incorporated by reference into the SAI. The annual report contains additional performance information and will be made available upon request and without charge.
B-1
IVY ASSET STRATEGY NEW OPPORTUNITIES FUND
| | | | | | | | | | | | | | | | | | | | | | | | |
| | | Net Asset
Value,
Beginning of
Period | | | Net
Investment
Income
(Loss)(1) | | | Net Realized
and
Unrealized
Gain
(Loss) on
Investments | | | Total from
Investment
Operations | | | Distributions
From Net
Investment
Income | | | Distributions
From Net
Realized
Gains | |
| Class A Shares | | | | | | | | | | | | | | | | | | | | | | | | |
Six-month period ended 9-30-2013 (unaudited) | | $ | 11.01 | | | $ | (0.01 | ) | | $ | (0.35 | ) | | $ | (0.36 | ) | | $ | - | | | $ | - | |
Year ended 3-31-2013 | | | 10.77 | | | | 0.01 | | | | 0.29 | | | | 0.30 | | | | (0.06 | ) | | | - | |
Year ended 3-31-2012 | | | 12.63 | | | | (0.01 | ) | | | (1.85 | ) | | | (1.86 | ) | | | - | | | | - | |
Year ended 3-31-2011(5) | | | 10.00 | | | | (0.10 | ) | | | 2.73 | | | | 2.63 | | | | - | | | | - | |
Class B Shares | | | | | | | | | | | | | | | | | | | | | | | | |
Six-month period ended 9-30-2013 (unaudited) | | | 10.76 | | | | (0.06 | ) | | | (0.35 | ) | | | (0.41 | ) | | | - | | | | - | |
Year ended 3-31-2013 | | | 10.57 | | | | (0.09 | ) | | | 0.28 | | | | 0.19 | | | | - | | | | - | |
Year ended 3-31-2012 | | | 12.52 | | | | (0.13 | ) | | | (1.82 | ) | | | (1.95 | ) | | | - | | | | - | |
Year ended 3-31-2011(5) | | | 10.00 | | | | (0.19 | ) | | | 2.71 | | | | 2.52 | | | | - | | | | - | |
Class C Shares | | | | | | | | | | | | | | | | | | | | | | | | |
Six-month period ended 9-30-2013 (unaudited) | | | 10.80 | | | | (0.06 | ) | | | (0.35 | ) | | | (0.41 | ) | | | - | | | | - | |
Year ended 3-31-2013 | | | 10.59 | | | | (0.07 | ) | | | 0.28 | | | | 0.21 | | | | - | * | | | - | |
Year ended 3-31-2012 | | | 12.53 | | | | (0.11 | ) | | | (1.83 | ) | | | (1.94 | ) | | | - | | | | - | |
Year ended 3-31-2011(5) | | | 10.00 | | | | (0.20 | ) | | | 2.73 | | | | 2.53 | | | | - | | | | - | |
| | | | | | |
Class E Shares(7) | | | | | | | | | | | | | | | | | | | | | | | | |
Six-month period ended 9-30-2013 (unaudited) | | | 11.01 | | | | (0.01 | ) | | | (0.36 | ) | | | (0.37 | ) | | | - | | | | - | |
Year ended 3-31-2013 | | | 10.77 | | | | 0.00 | | | | 0.30 | | | | 0.30 | | | | (0.06 | ) | | | - | |
Year ended 3-31-2012 | | | 12.63 | | | | (0.01 | ) | | | (1.85 | ) | | | (1.86 | ) | | | - | | | | - | |
Year ended 3-31-2011(5) | | | 10.00 | | | | (0.07 | ) | | | 2.70 | | | | 2.63 | | | | - | | | | - | |
| | | | | | |
Class I Shares | | | | | | | | | | | | | | | | | | | | | | | | |
Six-month period ended 9-30-2013 (unaudited) | | | 11.05 | | | | 0.01 | | | | (0.36 | ) | | | (0.35 | ) | | | - | | | | - | |
Year ended 3-31-2013 | | | 10.80 | | | | 0.04 | | | | 0.29 | | | | 0.33 | | | | (0.08 | ) | | | - | |
Year ended 3-31-2012 | | | 12.65 | | | | 0.02 | | | | (1.85 | ) | | | (1.83 | ) | | | (0.02 | ) | | | - | |
Year ended 3-31-2011(5) | | | 10.00 | | | | (0.08 | ) | | | 2.73 | | | | 2.65 | | | | - | | | | - | |
| | | | | | |
Class R Shares | | | | | | | | | | | | | | | | | | | | | | | | |
Six-month period ended 9-30-2013 (unaudited) | | | 10.91 | | | | (0.04 | ) | | | (0.34 | ) | | | (0.38 | ) | | | - | | | | - | |
Year ended 3-31-2013 | | | 10.69 | | | | (0.04 | ) | | | 0.29 | | | | 0.25 | | | | (0.03 | ) | | | - | |
Year ended 3-31-2012 | | | 12.58 | | | | (0.06 | ) | | | (1.83 | ) | | | (1.89 | ) | | | - | | | | - | |
Year ended 3-31-2011(5) | | | 10.00 | | | | (0.12 | ) | | | 2.70 | | | | 2.58 | | | | - | | | | - | |
Class Y Shares | | | | | | | | | | | | | | | | | | | | | | | | |
Six-month period ended 9-30-2013 (unaudited) | | | 11.01 | | | | (0.01 | ) | | | (0.36 | ) | | | (0.37 | ) | | | - | | | | - | |
Year ended 3-31-2013 | | | 10.77 | | | | (0.01 | ) | | | 0.31 | | | | 0.30 | | | | (0.06 | ) | | | - | |
Year ended 3-31-2012 | | | 12.63 | | | | (0.01 | ) | | | (1.85 | ) | | | (1.86 | ) | | | - | | | | - | |
Year ended 3-31-2011(5) | | | 10.00 | | | | (0.10 | ) | | | 2.73 | | | | 2.63 | | | | - | | | | - | |
B-2
| | | | | | | | | | | | | | | | | | | | | | | | | | | | | | | | | | |
Total
Distributions | | | Net Asset
Value,
End of
Period | | | Total
Return(2) | | | Net Assets,
End of
Period
(in millions) | | | Ratio of
Expenses
to Average
Net Assets
Including
Expense
Waiver | | |
Ratio of Net
Investment
Income (Loss)
to Average Net
Assets
Including
Expense
Waiver | | | Ratio of
Expenses to
Average
Net Assets
Excluding
Expense
Waiver(3) | | | Ratio of Net
Investment
Income (Loss)
to Average
Net Assets
Excluding
Expense
Waiver(3) | | | Portfolio
Turnover
Rate | |
| | | | | | | | | | | | | | | | | | | | | | | | | | | | | | | | | | |
$ | - | | | $ | 10.65 | | | | -3.27 | % | | $ | 158 | | | | 1.50 | %(4) | | | -0.22 | %(4) | | | 1.78 | %(4) | | | -0.50 | %(4) | | | 51 | % |
| | (0.06 | ) | | | 11.01 | | | | 2.84 | | | | 172 | | | | 1.50 | | | | 0.12 | | | | 1.72 | | | | -0.10 | | | | 31 | |
| | - | | | | 10.77 | | | | -14.73 | | | | 214 | | | | 1.50 | | | | -0.11 | | | | 1.68 | | | | -0.29 | | | | 54 | |
| | - | | | | 12.63 | | | | 26.30 | | | | 246 | | | | 1.50 | (4) | | | -0.97 | (4) | | | 1.71 | (4) | | | -1.18 | (4) | | | 36 | (6) |
| | | | | | | | | | | | | | | | | | | | | | | | | | | | | | | | | | |
| | | | | | | | | | | | | | | | | | | | | | | | | | | | | | | | | | |
| | - | | | | 10.35 | | | | -3.81 | | | | 5 | | | | 2.53 | (4) | | | -1.22 | (4) | | | - | | | | - | | | | 51 | |
| | - | | | | 10.76 | | | | 1.80 | | | | 6 | | | | 2.50 | | | | -0.91 | | | | - | | | | - | | | | 31 | |
| | - | | | | 10.57 | | | | -15.58 | | | | 7 | | | | 2.49 | | | | -1.16 | | | | - | | | | - | | | | 54 | |
| | - | | | | 12.52 | | | | 25.20 | | | | 7 | | | | 2.43 | (4) | | | -1.84 | (4) | | | 2.48 | (4) | | | -1.89 | (4) | | | 36 | (6) |
| | | | | | | | |
| | | | | | | | | | | | | | | | | | | | | | | | | | | | | | | | | | |
| | | | | | | | | | | | | | | | | | | | | | | | | | | | | | | | | | |
| | - | | | | 10.39 | | | | -3.80 | | | | 40 | | | | 2.41 | (4) | | | -1.08 | (4) | | | - | | | | - | | | | 51 | |
| | - | * | | | 10.80 | | | | 2.01 | | | | 51 | | | | 2.35 | | | | -0.71 | | | | - | | | | - | | | | 31 | |
| | - | | �� | | 10.59 | | | | -15.48 | | | | 74 | | | | 2.37 | | | | -0.98 | | | | - | | | | - | | | | 54 | |
| | - | | | | 12.53 | | | | 25.30 | | | | 86 | | | | 2.34 | (4) | | | -1.85 | (4) | | | 2.39 | (4) | | | -1.90 | (4) | | | 36 | (6) |
| | | | | | | | |
| | | | | | | | | | | | | | | | | | | | | | | | | | | | | | | | | | |
| - | | | | 10.64 | | | | -3.36 | | | | - | * | | | 1.50 | (4) | | | -0.23 | (4) | | | - | | | | - | | | | 51 | |
| | (0.06 | ) | | | 11.01 | | | | 2.84 | | | | - | * | | | 1.50 | | | | 0.04 | | | | - | | | | - | | | | 31 | |
| | - | | | | 10.77 | | | | -14.73 | | | | - | * | | | 1.50 | | | | -0.11 | | | | - | | | | - | | | | 54 | |
| | - | | | | 12.63 | | | | 26.30 | | | | - | * | | | 1.50 | (4) | | | -0.72 | (4) | | | 1.58 | (4) | | | -0.80 | (4) | | | 36 | (6) |
| | | | | | | | |
| | | | | | | | | | | | | | | | | | | | | | | | | | | | | | | | | | |
| - | | | | 10.70 | | | | -3.17 | | | | 39 | | | | 1.25 | (4) | | | 0.10 | (4) | | | 1.31 | (4) | | | 0.04 | (4) | | | 51 | |
| | (0.08 | ) | | | 11.05 | | | | 3.10 | | | | 53 | | | | 1.25 | | | | 0.42 | | | | 1.29 | | | | 0.38 | | | | 31 | |
| | (0.02 | ) | | | 10.80 | | | | -14.48 | | | | 81 | | | | 1.25 | | | | 0.17 | | | | 1.31 | | | | 0.11 | | | | 54 | |
| | - | | | | 12.65 | | | | 26.50 | | | | 109 | | | | 1.25 | (4) | | | -0.77 | (4) | | | 1.40 | (4) | | | -0.92 | (4) | | | 36 | (6) |
| | | | | | | | |
| | | | | | | | | | | | | | | | | | | | | | | | | | | | | | | | | | |
| - | | | | 10.53 | | | | -3.48 | | | | 1 | | | | 1.93 | (4) | | | -0.66 | (4) | | | - | | | | - | | | | 51 | |
| | (0.03 | ) | | | 10.91 | | | | 2.40 | | | | 1 | | | | 1.87 | | | | -0.35 | | | | - | | | | - | | | | 31 | |
| | - | | | | 10.69 | | | | -15.02 | | | | 1 | | | | 1.89 | | | | -0.59 | | | | - | | | | - | | | | 54 | |
| | - | | | | 12.58 | | | | 25.80 | | | | 1 | | | | 1.92 | (4) | | | -1.15 | (4) | | | 1.97 | (4) | | | -1.20 | (4) | | | 36 | (6) |
| | | | | | | | | | | | | | | | | | | | | | | | | | | | | | | | | | |
| - | | | | 10.64 | | | | -3.36 | | | | 8 | | | | 1.50 | (4) | | | -0.20 | (4) | | | 1.57 | (4) | | | -0.27 | (4) | | | 51 | |
| | (0.06 | ) | | | 11.01 | | | | 2.84 | | | | 9 | | | | 1.50 | | | | -0.08 | | | | 1.54 | | | | -0.12 | | | | 31 | |
| | - | | | | 10.77 | | | | -14.73 | | | | 7 | | | | 1.50 | | | | -0.09 | | | | 1.58 | | | | -0.16 | | | | 54 | |
| | - | | | | 12.63 | | | | 26.30 | | | | 12 | | | | 1.50 | (4) | | | -0.94 | (4) | | | 1.67 | (4) | | | -1.11 | (4) | | | 36 | (6) |
| * | Not shown due to rounding. |
| (1) | Based on average weekly shares outstanding. |
| (2) | Based on net asset value, which does not reflect the sales charge, redemption fee or contingent deferred sales charge, if applicable. Total returns for periods less than one year are not annualized. |
B-3
| (3) | Ratios excluding expense waivers are only included for periods in which the class had waived or reimbursed expenses. |
| (5) | For the period from May 3, 2010 (commencement of operations of the class) through March 31, 2011. |
| (6) | For the fiscal year ended March 31, 2011. |
| (7) | Class is closed to investment. |
See Accompanying Notes to Financial Statements.
B-4
(This page intentionally left blank.)
IVY EMERGING MARKETS EQUITY FUND
| | | | | | | | | | | | | | | | | | | | | | | | |
| | | Net Asset
Value,
Beginning
of Period | | | Net
Investment
Income
(Loss) | | | Net Realized
and
Unrealized
Gain
(Loss)
on
Investments | | | Total from
Investment
Operations | | | Distributions
From Net
Investment
Income | | | Distributions
From Net
Realized
Gains | |
| Class A Shares | | | | | | | | | | | | | | | | | | | | | | | | |
Six-month period ended
9-30-2013 (unaudited) | | $ | 13.88 | | | $ | 0.09 | (1) | | $ | (0.05 | ) | | $ | 0.04 | | | $ | - | | | $ | - | |
Year ended 3-31-2013 | | | 13.98 | | | | 0.03 | (1) | | | (0.03 | ) | | | 0.00 | | | | (0.10 | ) | | | - | |
Year ended 3-31-2012 | | | 16.94 | | | | 0.01 | (1) | | | (2.39 | ) | | | (2.38 | ) | | | (0.06 | ) | | | (0.52 | ) |
Year ended 3-31-2011 | | | 14.84 | | | | (0.01 | )(1) | | | 2.11 | | | | 2.10 | | | | - | | | | - | |
Year ended 3-31-2010 | | | 8.86 | | | | (0.08 | )(1) | | | 6.06 | | | | 5.98 | | | | - | | | | - | |
Year ended 3-31-2009 | | | 17.61 | | | | 0.05 | | | | (6.96 | ) | | | (6.91 | ) | | | - | | | | (1.84 | ) |
| | | | | | |
| Class B Shares | | | | | | | | | | | | | | | | | | | | | | | | |
Six-month period ended
9-30-2013 (unaudited) | | | 11.78 | | | | 0.00 | (1) | | | (0.05 | ) | | | (0.05 | ) | | | - | | | | - | |
Year ended 3-31-2013 | | | 11.92 | | | | (0.10 | )(1) | | | (0.04 | ) | | | (0.14 | ) | | | - | * | | | - | |
Year ended 3-31-2012 | | | 14.64 | | | | (0.13 | )(1) | | | (2.07 | ) | | | (2.20 | ) | | | - | | | | (0.52 | ) |
Year ended 3-31-2011 | | | 12.97 | | | | (0.15 | )(1) | | | 1.82 | | | | 1.67 | | | | - | | | | - | |
Year ended 3-31-2010 | | | 7.83 | | | | (0.19 | )(1) | | | 5.33 | | | | 5.14 | | | | - | | | | - | |
Year ended 3-31-2009 | | | 16.01 | | | | (0.09 | ) | | | (6.30 | ) | | | (6.39 | ) | | | - | | | | (1.79 | ) |
| | | | | | |
| Class C Shares | | | | | | | | | | | | | | | | | | | | | | | | |
Six-month period ended
9-30-2013 (unaudited) | | | 12.23 | | | | 0.03 | (1) | | | (0.05 | ) | | | (0.02 | ) | | | - | | | | - | |
Year ended 3-31-2013 | | | 12.36 | | | | (0.06 | )(1) | | | (0.03 | ) | | | (0.09 | ) | | | (0.04 | ) | | | - | |
Year ended 3-31-2012 | | | 15.10 | | | | (0.08 | )(1) | | | (2.14 | ) | | | (2.22 | ) | | | - | | | | (0.52 | ) |
Year ended 3-31-2011 | | | 13.33 | | | | (0.10 | )(1) | | | 1.87 | | | | 1.77 | | | | - | | | | - | |
Year ended 3-31-2010 | | | 8.01 | | | | (0.17 | )(1) | | | 5.49 | | | | 5.32 | | | | - | | | | - | |
Year ended 3-31-2009 | | | 16.27 | | | | (0.09 | ) | | | (6.37 | ) | | | (6.46 | ) | | | - | | | | (1.80 | ) |
| | | | | | |
| Class E Shares(4) | | | | | | | | | | | | | | | | | | | | | | | | |
Six-month period ended
9-30-2013 (unaudited) | | | 14.04 | | | | 0.12 | (1) | | | (0.06 | ) | | | 0.06 | | | | - | | | | - | |
Year ended 3-31-2013 | | | 14.12 | | | | 0.09 | (1) | | | (0.03 | ) | | | 0.06 | | | | (0.14 | ) | | | - | |
Year ended 3-31-2012 | | | 17.15 | | | | 0.06 | (1) | | | (2.41 | ) | | | (2.35 | ) | | | (0.16 | ) | | | (0.52 | ) |
Year ended 3-31-2011 | | | 14.98 | | | | 0.05 | (1) | | | 2.12 | | | | 2.17 | | | | - | | | | - | |
Year ended 3-31-2010 | | | 8.90 | | | | (0.01 | )(1) | | | 6.09 | | | | 6.08 | | | | - | | | | - | |
Year ended 3-31-2009 | | | 17.62 | | | | 0.07 | | | | (6.93 | ) | | | (6.86 | ) | | | - | | | | (1.86 | ) |
| | | | | | |
| Class I Shares | | | | | | | | | | | | | | | | | | | | | | | | |
Six-month period ended
9-30-2013 (unaudited) | | | 14.23 | | | | 0.13 | (1) | | | (0.06 | ) | | | 0.07 | | | | - | | | | - | |
Year ended 3-31-2013 | | | 14.30 | | | | 0.10 | (1) | | | (0.02 | ) | | | 0.08 | | | | (0.15 | ) | | | - | |
Year ended 3-31-2012 | | | 17.39 | | | | 0.08 | (1) | | | (2.46 | ) | | | (2.38 | ) | | | (0.19 | ) | | | (0.52 | ) |
Year ended 3-31-2011 | | | 15.16 | | | | 0.05 | (1) | | | 2.18 | | | | 2.23 | | | | - | | | | - | |
Year ended 3-31-2010 | | | 9.00 | | | | (0.01 | )(1) | | | 6.17 | | | | 6.16 | | | | - | | | | - | |
Year ended 3-31-2009 | | | 17.77 | | | | 0.10 | (1) | | | (7.00 | ) | | | (6.90 | ) | | | - | | | | (1.87 | ) |
| | | | | | |
| Class R Shares | | | | | | | | | | | | | | | | | | | | | | | | |
Six-month period ended
9-30-2013 (unaudited) | | | 13.87 | | | | 0.08 | (1) | | | (0.05 | ) | | | 0.03 | | | | - | | | | - | |
Year ended 3-31-2013(5) | | | 14.07 | | | | (0.04 | )(1) | | | (0.16 | ) | | | (0.20 | ) | | | - | | | | - | |
| | | | | | |
| Class Y Shares | | | | | | | | | | | | | | | | | | | | | | | | |
Six-month period ended
9-30-2013 (unaudited) | | | 14.13 | | | | 0.11 | (1) | | | (0.05 | ) | | | 0.06 | | | | - | | | | - | |
Year ended 3-31-2013 | | | 14.22 | | | | 0.09 | (1) | | | (0.05 | ) | | | 0.04 | | | | (0.13 | ) | | | - | |
Year ended 3-31-2012 | | | 17.25 | | | | 0.05 | (1) | | | (2.44 | ) | | | (2.39 | ) | | | (0.12 | ) | | | (0.52 | ) |
Year ended 3-31-2011 | | | 15.08 | | | | 0.03 | (1) | | | 2.14 | | | | 2.17 | | | | - | | | | - | |
Year ended 3-31-2010 | | | 8.98 | | | | (0.05 | )(1) | | | 6.15 | | | | 6.10 | | | | - | | | | - | |
Year ended 3-31-2009 | | | 17.75 | | | | 0.08 | | | | (6.99 | ) | | | (6.91 | ) | | | - | | | | (1.86 | ) |
B-6
| | | | | | | | | | | | | | | | | | | | | | | | | | |
Total
Distributions | | | Net Asset
Value,
End of
Period | | | Total
Return(2) | | | Net Assets,
End of
Period
(in millions) | | | Ratio of
Expenses
to Average
Net
Assets
Including
Expense
Waiver | | | Ratio of Net
Investment
Income (Loss)
to Average Net
Assets
Including
Expense
Waiver | | | Portfolio
Turnover
Rate | |
| | | | | | | | | | | | | | | | | | | | | | | | | | |
| | | | | | | | | | | | | | | | | | | | | | | | | | |
| | $ - | | | $ | 13.92 | | | | 0.29 | % | | $ | 414 | | | | 1.73 | %(3) | | | 1.33 | %(3) | | | 70 | % |
| | (0.10) | | | | 13.88 | | | | -0.02 | | | | 491 | | | | 1.74 | | | | 0.25 | | | | 142 | |
| | (0.58) | | | | 13.98 | | | | -13.71 | | | | 504 | | | | 1.75 | | | | 0.04 | | | | 97 | |
| | - | | | | 16.94 | | | | 14.15 | | | | 600 | | | | 1.72 | | | | -0.07 | | | | 137 | |
| | - | | | | 14.84 | | | | 67.50 | | | | 514 | | | | 1.83 | | | | -0.61 | | | | 81 | |
| | (1.84) | | | | 8.86 | | | | -38.76 | | | | 239 | | | | 1.92 | | | | 0.37 | | | | 112 | |
| | | | | | | | | | | | | | | | | | | | | | | | | | |
| | | | | | |
| | - | | | | 11.73 | | | | -0.42 | | | | 6 | | | | 3.00 | (3) | | | 0.07 | (3) | | | 70 | |
| | - | * | | | 11.78 | | | | -1.13 | | | | 8 | | | | 2.94 | | | | -0.88 | | | | 142 | |
| | (0.52) | | | | 11.92 | | | | -14.69 | | | | 10 | | | | 2.88 | | | | -1.03 | | | | 97 | |
| | - | | | | 14.64 | | | | 12.88 | | | | 16 | | | | 2.81 | | | | -1.07 | | | | 137 | |
| | - | | | | 12.97 | | | | 65.65 | | | | 17 | | | | 2.91 | | | | -1.64 | | | | 81 | |
| | (1.79) | | | | 7.83 | | | | -39.46 | | | | 10 | | | | 3.07 | | | | -0.77 | | | | 112 | |
| | | | | | |
| | | | | | | | | | | | | | | | | | | | | | | | | | |
| | | | | | |
| | - | | | | 12.21 | | | | -0.16 | | | | 13 | | | | 2.57 | (3) | | | 0.47 | (3) | | | 70 | |
| | (0.04) | | | | 12.23 | | | | -0.77 | | | | 16 | | | | 2.53 | | | | -0.48 | | | | 142 | |
| | (0.52) | | | | 12.36 | | | | -14.37 | | | | 20 | | | | 2.51 | | | | -0.63 | | | | 97 | |
| | - | | | | 15.10 | | | | 13.28 | | | | 32 | | | | 2.46 | | | | -0.73 | | | | 137 | |
| | - | | | | 13.33 | | | | 66.42 | | | | 35 | | | | 2.56 | | | | -1.38 | | | | 81 | |
| | (1.80) | | | | 8.01 | | | | -39.22 | | | | 16 | | | | 2.69 | | | | -0.36 | | | | 112 | |
| | | | | | | | | | | | | | | | | | | | | | | | | | |
| | | | | | | | | | | | | | | | | | | | | | | | | | |
| | - | | | | 14.10 | | | | 0.43 | | | | - | * | | | 1.33 | (3) | | | 1.69 | (3) | | | 70 | |
| | (0.14) | | | | 14.04 | | | | 0.40 | | | | - | * | | | 1.34 | | | | 0.64 | | | | 142 | |
| | (0.68) | | | | 14.12 | | | | -13.32 | | | | - | * | | | 1.37 | | | | 0.41 | | | | 97 | |
| | - | | | | 17.15 | | | | 14.49 | | | | - | * | | | 1.36 | | | | 0.30 | | | | 137 | |
| | - | | | | 14.98 | | | | 68.32 | | | | - | * | | | 1.42 | | | | -0.11 | | | | 81 | |
| | (1.86) | | | | 8.90 | | | | -38.43 | | | | - | * | | | 1.44 | | | | 0.79 | | | | 112 | |
| | | | | | |
| | | | | | | | | | | | | | | | | | | | | | | | | | |
| - | | | | 14.30 | | | | 0.49 | | | | 136 | | | | 1.21 | (3) | | | 1.82 | (3) | | | 70 | |
| | (0.15) | | | | 14.23 | | | | 0.55 | | | | 147 | | | | 1.22 | | | | 0.69 | | | | 142 | |
| | (0.71) | | | | 14.30 | | | | -13.28 | | | | 138 | | | | 1.25 | | | | 0.52 | | | | 97 | |
| | - | | | | 17.39 | | | | 14.71 | | | | 159 | | | | 1.24 | | | | 0.28 | | | | 137 | |
| | - | | | | 15.16 | | | | 68.44 | | | | 104 | | | | 1.29 | | | | -0.11 | | | | 81 | |
| | (1.87) | | | | 9.00 | | | | -38.34 | | | | 45 | | | | 1.31 | | | | 0.81 | | | | 112 | |
| | | | | | |
| | | | | | | | | | | | | | | | | | | | | | | | | | |
| | | | | | |
| | - | | | | 13.90 | | | | 0.14 | | | | - | * | | | 1.82 | (3) | | | 1.21 | (3) | | | 70 | |
| | - | | | | 13.87 | | | | -1.35 | | | | - | * | | | 1.80 | (3) | | | -1.09 | (3) | | | 142 | (6) |
| | | | | | |
| | | | | | | | | | | | | | | | | | | | | | | | | | |
| - | | | | 14.19 | | | | 0.35 | | | | 4 | | | | 1.46 | (3) | | | 1.57 | (3) | | | 70 | |
| | (0.13) | | | | 14.13 | | | | 0.31 | | | | 5 | | | | 1.47 | | | | 0.63 | | | | 142 | |
| | (0.64) | | | | 14.22 | | | | -13.48 | | | | 6 | | | | 1.50 | | | | 0.30 | | | | 97 | |
| | - | | | | 17.25 | | | | 14.39 | | | | 9 | | | | 1.50 | | | | 0.22 | | | | 137 | |
| | - | | | | 15.08 | | | | 67.93 | | | | 9 | | | | 1.55 | | | | -0.38 | | | | 81 | |
| | (1.86) | | | | 8.98 | | | | -38.47 | | | | 4 | | | | 1.57 | | | | 0.69 | | | | 112 | |
B-7
| * | Not shown due to rounding. |
| (1) | Based on average weekly shares outstanding. |
| (2) | Based on net asset value, which does not reflect the sales charge, redemption fee or contingent deferred sales charge, if applicable. Total returns for periods less than one year are not annualized. |
| (4) | Class is closed to investment. |
| (5) | For the period from December 19, 2012 (commencement of operations of the class) through March 31, 2013. |
| (6) | For the fiscal year ended March 31, 2013. |
See Accompanying Notes to Financial Statements.
B-8
IVY FUNDS
6300 Lamar Avenue, Overland Park, Kansas 66202-9217
(913) 236-2000
STATEMENT OF ADDITIONAL INFORMATION
January 29, 2014
This Statement of Additional Information (the “SAI”) relates to the reorganization (the “Reorganization”) of Ivy Asset Strategy New Opportunities Fund (the “Asset Strategy New Opportunities Fund”) into Ivy Emerging Markets Equity Fund (formerly, the Ivy Pacific Opportunities Fund) (the “Emerging Markets Equity Fund,” and, together with the Asset Strategy New Opportunities Fund, the “Funds,” each a “Fund”), each a series of Ivy Funds, a Delaware statutory trust (the “Trust”).
This SAI contains information which may be of interest to shareholders but which is not included in the Combined Prospectus and Proxy Statement dated January 29, 2014 (the “Prospectus/Proxy”), which relates to the Reorganization. As described in the Prospectus/Proxy, if approved by shareholders, the Asset Strategy New Opportunities Fund will transfer all of its assets to the Emerging Markets Equity Fund in exchange for the Emerging Markets Equity Fund’s assumption of all of the Asset Strategy New Opportunities Fund’s liabilities and shares of the Emerging Markets Equity Fund with an aggregate net asset value (“NAV”) equal to the aggregate NAV of the transferred assets and liabilities.
This SAI is not a prospectus and should be read in conjunction with the Prospectus/Proxy. The Prospectus/Proxy has been filed with the Securities and Exchange Commission and is available upon request and without charge by writing to or calling the Trust at the address or telephone number set forth above.
Unless otherwise indicated, capitalized terms used herein and not otherwise defined have the same meanings as are given to them in the Prospectus/Proxy.
Table of Contents
I. Additional Information about the Emerging Markets Equity Fund
II. Financial Statements
III. Pro Forma Financial Statements
I. Additional Information about the Emerging Markets Equity Fund
Further information about Class A shares, Class B shares, Class C shares, Class E shares, Class I shares, Class R shares and Class Y shares of the Emerging Markets Equity Fund is contained in, and incorporated herein by reference to, the Statement of Additional Information for the Emerging Markets Equity Fund dated January 29, 2014 (File No. 811-06569).
II. Financial Statements
The audited financial statements and financial highlights and the related Report of Independent Registered Public Accounting Firm included in the Annual Report for the Fiscal Year ended March 31, 2013, for the Asset Strategy New Opportunities Fund and the audited financial statements and financial highlights and the related Report of Independent Registered Public Accounting Firm included in the Annual Report for the fiscal year ended March 31, 2013, for the Emerging Markets Equity Fund are incorporated herein by reference. The unaudited financial statements included in the Semi-Annual Report for the six months ended September 30, 2013, for the Asset Strategy New Opportunities Fund and the unaudited financial statements included in the Semi-Annual Report for the six months ended September 30, 2013, for the Emerging Markets Equity Fund are incorporated herein by reference.
III. Pro Forma Financial Statements
SAI-1
IVY EMERGING MARKETS EQUITY FUND PRO FORMA STATEMENT OF ASSETS AND LIABILITIES AS OF SEPTEMBER 30, 2013 AND THE PRO FORMA STATEMENT OF OPERATIONS FOR THE TWELVE MONTHS ENDED SEPTEMBER 30, 2013 (UNAUDITED)
The following unaudited Pro Forma Combined Statement of Assets and Liabilities, including the unaudited Pro Forma Combined Schedule of Investments of Ivy Emerging Markets Equity Fund and Ivy Asset Strategy New Opportunities Fund as of September 30, 2013, has been derived from the respective unaudited Statements of Assets and Liabilities, including the Schedules of Investments, of Ivy Emerging Markets Equity Fund and Ivy Asset Strategy New Opportunities Fund as of September 30, 2013 and the Statements of Operations for the Funds for the twelve month period ended September 30, 2013.
The unaudited Pro Forma Combined Statement of Assets and Liabilities and Statement of Operations is presented for informational purposes only, assuming the merger took place at the beginning of the 12 month period presented, and does not purport to be indicative of the financial condition and operations that would have resulted if the Reorganization had been consummated on September 30, 2013. The unaudited Pro Forma Combined Financial Statements should be read in conjunction with the respective financial statements and related notes of Ivy Emerging Markets Equity Fund and Ivy Asset Strategy New Opportunities Fund incorporated by reference in this Statement of Additional Information.
SAI-2
PRO FORMA SCHEDULE OF INVESTMENTS SEPTEMBER 30, 2013
(Unaudited)
| | | | | | | | | | | | | | | | | | | | | | | | |
SHARES | | | DESCRIPTION | | VALUE | |
Ivy
Emerging
Market
Equity
Fund | | | Ivy
Asset
Strategy
New
Opportunities
Fund | | | Acquiring
Fund
Proforma | | | | | Ivy
Emerging
Market
Equity
Fund | | | Ivy
Asset
Strategy
New
Opportunities
Fund | | | Acquiring
Fund
Proforma | |
| | | | | | | | | | COMMON STOCKS | | | | | | | | | |
| | | | | | | | | | | | Brazil—2.3% | | | | | | | | | | | | |
| | — | | | | 117 | | | | 117 | | | Abril Educacao S.A. | | $ | — | | | $ | 1,729 | | | $ | 1,729 | |
| | — | | | | 243 | | | | 243 | | | Anhanguera Educacional Participacoes S.A. | | | — | | | | 1,444 | | | | 1,444 | |
| | — | | | | 213 | | | | 213 | | | BRF-Brasil Foods S.A. | | | — | | | | 5,207 | | | | 5,207 | |
| | — | | | | 80 | | | | 80 | | | MercadoLibre, Inc. | | | — | | | | 10,788 | | | | 10,788 | |
| | | | | | | | | | | | | | | | | | | | | | | | |
| | | | | | | | | | | | | | | — | | | | 19,168 | | | $ | 19,168 | |
| | | | | | | | | | | | | | | | | | | | | | | | |
| | | | | | | | | | | | China—25.3% | | | | | | | | | | | | |
| | 103 | | | | — | | | | 103 | | | Baidu.com, Inc., ADR (A) | | | 15,929 | | | | — | | | | 15,929 | |
| | 755 | | | | — | | | | 755 | | | Biostime International Holdings Limited | | | 5,709 | | | | — | | | | 5,709 | |
| | 601 | | | | — | | | | 601 | | | Bona Film Group Limited, ADR (A) | | | 3,155 | | | | — | | | | 3,155 | |
| | 10,572 | | | | — | | | | 10,572 | | | BYD Electronic (International) Company Limited | | | 4,730 | | | | — | | | | 4,730 | |
| | 18,076 | | | | — | | | | 18,076 | | | China Communications Services Corporation Limited, H Shares | | | 10,558 | | | | — | | | | 10,558 | |
| | 11,712 | | | | — | | | | 11,712 | | | China Foods Limited | | | 4,213 | | | | — | | | | 4,213 | |
| | 6,085 | | | | — | | | | 6,085 | | | China Merchants Bank Co., Limited, H Shares | | | 11,062 | | | | — | | | | 11,062 | |
| | 2,362 | | | | — | | | | 2,362 | | | China Merchants Holdings (International) Company Limited | | | 8,588 | | | | — | | | | 8,588 | |
| | 16,700 | | | | — | | | | 16,700 | | | China Minsheng Banking Corp., Ltd., H Shares | | | 19,960 | | | | — | | | | 19,960 | |
| | 2,574 | | | | — | | | | 2,574 | | | China Oilfield Services Limited | | | 6,452 | | | | — | | | | 6,452 | |
| | 6,654 | | | | — | | | | 6,654 | | | China Unicom Limited | | | 10,381 | | | | — | | | | 10,381 | |
| | 3,348 | | | | — | | | | 3,348 | | | CNOOC Limited | | | 6,812 | | | | — | | | | 6,812 | |
| | 625 | | | | — | | | | 625 | | | Forgame Holdings Limited (A)(B) | | | 4,110 | | | | — | | | | 4,110 | |
| | 20,881 | | | | — | | | | 20,881 | | | Guodian Technology & Environment Group Corporation Limited | | | 4,227 | | | | — | | | | 4,227 | |
| | 9,994 | | | | — | | | | 9,994 | | | Haitong Securities Co., Ltd., H Shares | | | 14,921 | | | | — | | | | 14,921 | |
| | 4,000 | | | | — | | | | 4,000 | | | HC International, Inc. (A)(B) | | | 4,704 | | | | — | | | | 4,704 | |
| | 5,408 | | | | — | | | | 5,408 | | | Huaneng Power International, Inc., H Shares | | | 5,397 | | | | — | | | | 5,397 | |
| | 19,338 | | | | — | | | | 19,338 | | | Industrial and Commercial Bank of China Limited, H Shares | | | 13,489 | | | | — | | | | 13,489 | |
| | 1,410 | | | | — | | | | 1,410 | | | Ping An Insurance (Group) Company of China, Ltd., A Shares | | | 8,219 | | | | — | | | | 8,219 | |
| | 2,796 | | | | — | | | | 2,796 | | | Shimao Property Holdings Limited | | | 6,430 | | | | — | | | | 6,430 | |
| | — | | | | 177 | | | | 177 | | | SINA Corporation (A) | | | — | | | | 14,367 | | | | 14,367 | |
| | 403 | | | | — | | | | 403 | | | Tencent Holdings Limited | | | 21,137 | | | | — | | | | 21,137 | |
| | 152 | | | | — | | | | 152 | | | Youku.com Inc., ADR (A) | | | 4,153 | | | | — | | | | 4,153 | |
| | | | | | | | | | | | | | | | | | | | | | | | |
| | | | | | | | | | | | | | | 194,336 | | | | 14,367 | | | | 208,703 | |
| | | | | | | | | | | | | | | | | | | | | | | | |
| | | | | | | | | | | | Denmark—0.6% | | | | | | | | | | | | |
| | — | | | | 111 | | | | 111 | | | Chr. Hansen Holding A/S | | | — | | | | 3,931 | | | | 3,931 | |
| | — | | | | 19 | | | | 19 | | | Novozymes A/S, Class B | | | — | | | | 712 | | | | 712 | |
| | | | | | | | | | | | | | | | | | | | | | | | |
| | | | | | | | | | | | | | | — | | | | 4,643 | | | | 4,643 | |
| | | | | | | | | | | | | | | | | | | | | | | | |
| | | | | | | | | | | | Hong Kong—7.7% | | | | | | | | | | | | |
| | 1,976 | | | | 510 | | | | 2,486 | | | AAC Technologies Holdings Inc. | | | 8,981 | | | | 2,316 | | | | 11,297 | |
| | 22,464 | | | | — | | | | 22,464 | | | China Modern Dairy Holdings Ltd., H Shares | | | 8,776 | | | | — | | | | 8,776 | |
| | 4,664 | | | | — | | | | 4,664 | | | China Overseas Land & Investment Limited | | | 13,741 | | | | — | | | | 13,741 | |
| | 3,423 | | | | — | | | | 3,423 | | | Galaxy Entertainment Group Limited, ADR | | | 24,008 | | | | — | | | | 24,008 | |
| | 4,329 | | | | — | | | | 4,329 | | | SmarTone Telecommunications Holdings Limited | | | 5,738 | | | | — | | | | 5,738 | |
| | | | | | | | | | | | | | | | | | | | | | | | |
| | | | | | | | | | | | | | | 61,244 | | | | 2,316 | | | | 63,560 | |
| | | | | | | | | | | | | | | | | | | | | | | | |
| | | | | | | | | | | | India—5.6% | | | | | | | | | | | | |
| | — | | | | 112 | | | | 112 | | | Axis Bank Limited | | | — | | | | 1,797 | | | | 1,797 | |
| | 186 | | | | — | | | | 186 | | | Bajaj Auto Ltd. | | | 5,915 | | | | — | | | | 5,915 | |
SAI-3
| | | | | | | | | | | | | | | | | | | | | | | | |
SHARES | | | DESCRIPTION | | VALUE | |
Ivy
Emerging
Market
Equity
Fund | | | Ivy
Asset
Strategy
New
Opportunities
Fund | | | Acquiring
Fund
Proforma | | | | | Ivy
Emerging
Market
Equity
Fund | | | Ivy
Asset
Strategy
New
Opportunities
Fund | | | Acquiring
Fund
Proforma | |
| | 594 | | | | 86 | | | | 680 | | | HCL Technologies Limited (A) | | | 10,307 | | | | 1,500 | | | | 11,807 | |
| | 2,743 | | | | — | | | | 2,743 | | | Indiabulls Real Estate Limited | | | 2,366 | | | | — | | | | 2,366 | |
| | 400 | | | | — | | | | 400 | | | Just Dial Limited (A)(B) | | | 5,394 | | | | — | | | | 5,394 | |
| | — | | | | 12 | | | | 12 | | | Kaveri Seed Company Limited | | | — | | | | 271 | | | | 271 | |
| | 265 | | | | — | | | | 265 | | | Lupin Limited | | | 3,628 | | | | — | | | | 3,628 | |
| | — | | | | 30 | | | | 30 | | | Page Industries Limited | | | — | | | | 2,101 | | | | 2,101 | |
| | 423 | | | | — | | | | 423 | | | Reliance Industries Limited | | | 5,551 | | | | — | | | | 5,551 | |
| | — | | | | 574 | | | | 574 | | | Tata Steel Limited | | | — | | | | 2,490 | | | | 2,490 | |
| | — | | | | 71 | | | | 71 | | | United Spirits Limited | | | — | | | | 2,865 | | | | 2,865 | |
| | — | | | | 379 | | | | 379 | | | YES BANK Limited | | | — | | | | 1,740 | | | | 1,740 | |
| | | | | | | | | | | | | | | | | | | | | | | | |
| | | | | | | | | | | | | | | 33,161 | | | | 12,764 | | | | 45,925 | |
| | | | | | | | | | | | | | | | | | | | | | | | |
| | | | | | | | | | | | Japan—0.6% | | | | | | | | | | | | |
| | — | | | | 431 | | | | 431 | | | Chiyoda Corporation | | | — | | | | 5,174 | | | | 5,174 | |
| | | | | | | | | | | | | | | | | | | | | | | | |
| | | | | | | | | | | | Malaysia—1.7% | | | | | | | | | | | | |
| | — | | | | 764 | | | | 764 | | | Gamuda Berhad | | | — | | | | 1,079 | | | | 1,079 | |
| | 3,233 | | | | — | | | | 3,233 | | | Tenaga Nasional Berhad | | | 8,958 | | | | — | | | | 8,958 | |
| | — | | | | 5,075 | | | | 5,075 | | | UEM Land Holdings Berhad | | | — | | | | 3,971 | | | | 3,971 | |
| | | | | | | | | | | | | | | | | | | | | | | | |
| | | | | | | | | | | | | | | 8,958 | | | | 5,050 | | | | 14,008 | |
| | | | | | | | | | | | | | | | | | | | | | | | |
| | | | | | | | | | | | Mexico—1.4% | | | | | | | | | | | | |
| | — | | | | 1,168 | | | | 1,168 | | | Alpek, S.A.B. de C.V. | | | — | | | | 2,519 | | | | 2,519 | |
| | — | | | | 298 | | | | 298 | | | BanRegio Grupo Financiero, S.A.B. de C.V. | | | — | | | | 1,696 | | | | 1,696 | |
| | — | | | | 548 | | | | 548 | | | FIBRA Terrafina | | | — | | | | 1,089 | | | | 1,089 | |
| | — | | | | 15 | | | | 15 | | | Macquarie Mexican REIT | | | — | | | | 26 | | | | 26 | |
| | — | | | | 574 | | | | 574 | | | Mexichem, S.A.B. de C.V. | | | — | | | | 2,504 | | | | 2,504 | |
| | — | | | | 688 | | | | 688 | | | OHL Mexico, S.A.B. de C.V. (A) | | | — | | | | 1,811 | | | | 1,811 | |
| | — | | | | 198 | | | | 198 | | | Promotora y Operadora de Infraestructura, S.A.B. de C.V. (A) | | | — | | | | 1,912 | | | | 1,912 | |
| | | | | | | | | | | | | | | | | | | | | | | | |
| | | | | | | | | | | | | | | — | | | | 11,557 | | | | 11,557 | |
| | | | | | | | | | | | | | | | | | | | | | | | |
| | | | | | | | | | | | Netherlands—1.7% | | | | | | | | | | | | |
| | — | | | | 210 | | | | 210 | | | Chicago Bridge & Iron Company N.V., NY Shares | | | — | | | | 14,211 | | | | 14,211 | |
| | | | | | | | | | | | | | | | | | | | | | | | |
| | | | | | | | | | | | Panama—1.5% | | | | | | | | | | | | |
| | — | | | | 92 | | | | 92 | | | Copa Holdings, S.A., Class A | | | — | | | | 12,765 | | | | 12,765 | |
| | | | | | | | | | | | | | | | | | | | | | | | |
| | | | | | | | | | | | Peru—0.2% | | | | | | | | | | | | |
| | — | | | | 78 | | | | 78 | | | InRetail Peru Corp. (A)(B) | | | — | | | | 1,303 | | | | 1,303 | |
| | | | | | | | | | | | | | | | | | | | | | | | |
| | | | | | | | | | | | Philippines—2.4% | | | | | | | | | | | | |
| | 258 | | | | 251 | | | | 509 | | | GT Capital Holdings Incorporated | | | 4,504 | | | | 4,389 | | | | 8,893 | |
| | 19,186 | | | | 7,159 | | | | 26,345 | | | LT Group, Inc. | | | 7,932 | | | | 2,960 | | | | 10,892 | |
| | | | | | | | | | | | | | | | | | | | | | | | |
| | | | | | | | | | | | | | | 12,436 | | | | 7,349 | | | | 19,785 | |
| | | | | | | | | | | | | | | | | | | | | | | | |
| | | | | | | | | | | | Singapore—5.5% | | | | | | | | | | | | |
| | 1,054 | | | | — | | | | 1,054 | | | DBS Group Holdings Ltd | | | 13,795 | | | | — | | | | 13,795 | |
| | 13,067 | | | | — | | | | 13,067 | | | Golden Agri-Resources Ltd. | | | 5,416 | | | | — | | | | 5,416 | |
| | 1,621 | | | | — | | | | 1,621 | | | Keppel Corporation Limited | | | 13,463 | | | | — | | | | 13,463 | |
| | 130 | | | | — | | | | 130 | | | K-REIT Asia | | | 127 | | | | — | | | | 127 | |
| | — | | | | 1,992 | | | | 1,992 | | | Olam International Limited | | | — | | | | 2,429 | | | | 2,429 | |
| | 3,280 | | | | — | | | | 3,280 | | | Singapore Telecommunications Limited | | | 9,752 | | | | — | | | | 9,752 | |
| | | | | | | | | | | | | | | | | | | | | | | | |
| | | | | | | | | | | | | | | 42,553 | | | | 2,429 | | | | 44,982 | |
| | | | | | | | | | | | | | | | | | | | | | | | |
SAI-4
| | | | | | | | | | | | | | | | | | | | | | | | |
SHARES | | | DESCRIPTION | | VALUE | |
Ivy
Emerging
Market
Equity
Fund | | | Ivy
Asset
Strategy
New
Opportunities
Fund | | | Acquiring
Fund
Proforma | | | | | Ivy
Emerging
Market
Equity
Fund | | | Ivy
Asset
Strategy
New
Opportunities
Fund | | | Acquiring
Fund
Proforma | |
| | | | | | | | | | | | South Korea—18.5% | | | | | | | | | | | | |
| | 113 | | | | 18 | | | | 131 | | | Daelim Industrial Co., Ltd. | | | 10,223 | | | | 1,607 | | | | 11,830 | |
| | 158 | | | | — | | | | 158 | | | Duksan Hi-Metal Co., LTD. (A) | | | 3,195 | | | | — | | | | 3,195 | |
| | 34 | | | | 59 | | | | 93 | | | GLOVIS Co., Ltd. | | | 6,697 | | | | 11,625 | | | | 18,322 | |
| | 375 | | | | 73 | | | | 448 | | | Hana Financial Group, Inc. | | | 12,871 | | | | 2,495 | | | | 15,366 | |
| | 29 | | | | — | | | | 29 | | | Hyundai Heavy Industries Co., Ltd. | | | 7,070 | | | | — | | | | 7,070 | |
| | 29 | | | | — | | | | 29 | | | Hyundai Mobis | | | 7,744 | | | | — | | | | 7,744 | |
| | 63 | | | | — | | | | 63 | | | Hyundai Motor Company | | | 14,724 | | | | — | | | | 14,724 | |
| | — | | | | 8 | | | | 8 | | | Hyundai Steel Co | | | — | | | | 635 | | | | 635 | |
| | — | | | | 211 | | | | 211 | | | Kia Motors Corporation | | | — | | | | 12,794 | | | | 12,794 | |
| | — | | | | 117 | | | | 117 | | | Kolao Holdings | | | — | | | | 3,552 | | | | 3,552 | |
| | 226 | | | | — | | | | 226 | | | Korea Electric Power Corporation (A) | | | 6,326 | | | | — | | | | 6,326 | |
| | 17 | | | | 5 | | | | 22 | | | Naver Corporation | | | 8,977 | | | | 2,695 | | | | 11,672 | |
| | 11 | | | | — | | | | 11 | | | Samsung Electronics Co., Ltd. | | | 14,438 | | | | — | | | | 14,438 | |
| | 26 | | | | — | | | | 26 | | | Samsung Fire & Marine Insurance Co., Ltd | | | 5,975 | | | | — | | | | 5,975 | |
| | 55 | | | | — | | | | 55 | | | Samsung SDI Co., Ltd. | | | 9,603 | | | | — | | | | 9,603 | |
| | 340 | | | | — | | | | 340 | | | SK hynix Inc. | | | 9,570 | | | | — | | | | 9,570 | |
| | | | | | | | | | | | | | | | | | | | | | | | |
| | | | | | | | | | | | | | | 117,413 | | | | 35,403 | | | | 152,816 | |
| | | | | | | | | | | | | | | | | | | | | | | | |
| | | | | | | | | | | | Taiwan—9.4% | | | | | | | | | | | | |
| | 8,682 | | | | — | | | | 8,682 | | | Cathay Financial Holding Co., Ltd. | | | 12,362 | | | | — | | | | 12,362 | |
| | 2,616 | | | | — | | | | 2,616 | | | Cheng Shin Rubber Industry Co., Ltd. | | | 6,849 | | | | — | | | | 6,849 | |
| | 11,539 | | | | — | | | | 11,539 | | | Chinatrust Financial Holding Company, Ltd. | | | 7,532 | | | | — | | | | 7,532 | |
| | 1,318 | | | | — | | | | 1,318 | | | Delta Electronics, Inc. | | | 6,397 | | | | — | | | | 6,397 | |
| | 924 | | | | — | | | | 924 | | | MediaTek Incorporation | | | 11,422 | | | | — | | | | 11,422 | |
| | 1,578 | | | | — | | | | 1,578 | | | Novatek Microelectronics Corp. | | | 6,538 | | | | — | | | | 6,538 | |
| | 1,997 | | | | — | | | | 1,997 | | | Taiwan Mobile Co., Ltd. | | | 7,092 | | | | — | | | | 7,092 | |
| | 2,222 | | | | — | | | | 2,222 | | | Taiwan Semiconductor Manufacturing Company Ltd. | | | 7,553 | | | | — | | | | 7,553 | |
| | 380 | | | | 137 | | | | 517 | | | TPK Holding Co., Ltd. | | | 3,451 | | | | 1,244 | | | | 4,695 | |
| | 2,864 | | | | — | | | | 2,864 | | | Zhen Ding Technology Holding Limited | | | 6,809 | | | | — | | | | 6,809 | |
| | | | | | | | | | | | | | | | | | | | | | | | |
| | | | | | | | | | | | | | | 76,005 | | | | 1,244 | | | | 77,249 | |
| | | | | | | | | | | | | | | | | | | | | | | | |
| | | | | | | | | | | | Thailand—1.8% | | | | | | | | | | | | |
| | — | | | | 216 | | | | 216 | | | Bangkok Bank Public Company Limited | | | — | | | | 1,362 | | | | 1,362 | |
| | 8,000 | | | | — | | | | 8,000 | | | BTS Rail Mass Transit Growth Infrastructure Fund | | | 2,481 | | | | — | | | | 2,481 | |
| | — | | | | 2,012 | | | | 2,012 | | | Charoen Pokphand Foods Public Company Limited | | | — | | | | 1,543 | | | | 1,543 | |
| | — | | | | 421 | | | | 421 | | | Kasikornbank Public Company Limited | | | — | | | | 2,374 | | | | 2,374 | |
| | — | | | | 676 | | | | 676 | | | Major Cineplex Group Public Company Limited | | | — | | | | 402 | | | | 402 | |
| | — | | | | 228 | | | | 228 | | | Siam Commercial Bank Public Company Limited (A) | | | — | | | | 1,079 | | | | 1,079 | |
| | 13,180 | | | | — | | | | 13,180 | | | Thai Beverage Public Company Limited | | | 5,778 | | | | — | | | | 5,778 | |
| | | | | | | | | | | | | | | | | | | | | | | | |
| | | | | | | | | | | | | | | 8,259 | | | | 6,760 | | | | 15,019 | |
| | | | | | | | | | | | | | | | | | | | | | | | |
| | | | | | | | | | | | United Kingdom—1.3% | | | | | | | | | | | | |
| | — | | | | 318 | | | | 318 | | | Aggreko plc | | | — | | | | 8,252 | | | | 8,252 | |
| | — | | | | 629 | | | | 629 | | | Cairn Energy plc (A) | | | — | | | | 2,672 | | | | 2,672 | |
| | | | | | | | | | | | | | | | | | | | | | | | |
| | | | | | | | | | | | | | | — | | | | 10,924 | | | | 10,924 | |
| | | | | | | | | | | | | | | | | | | | | | | | |
| | | | | | | | | | | | United States—4.2% | | | | | | | | | | | | |
| | 82 | | | | — | | | | 82 | | | Cognizant Technology Solutions Corporation, Class A (A) | | | 6,754 | | | | — | | | | 6,754 | |
| | — | | | | 58 | | | | 58 | | | Harman International Industries, Incorporated | | | — | | | | 3,821 | | | | 3,821 | |
| | — | | | | 152 | | | | 152 | | | Ironwood Pharmaceuticals, Inc., Class A (A) | | | — | | | | 1,806 | | | | 1,806 | |
| | — | | | | 458 | | | | 458 | | | Kosmos Energy Ltd. (A) | | | — | | | | 4,705 | | | | 4,705 | |
| | — | | | | 61 | | | | 61 | | | KYTHERA Biopharmaceuticals, Inc. | | | — | | | | 2,805 | | | | 2,805 | |
| | — | | | | 25 | | | | 25 | | | Pall Corporation | | | — | | | | 1,887 | | | | 1,887 | |
| | 2,667 | | | | — | | | | 2,667 | | | Samsonite International S.A. | | | 7,445 | | | | — | | | | 7,445 | |
SAI-5
| | | | | | | | | | | | | | | | | | | | | | | | |
SHARES | | | DESCRIPTION | | VALUE | |
Ivy
Emerging
Market
Equity
Fund | | | Ivy
Asset
Strategy
New
Opportunities
Fund | | | Acquiring
Fund
Proforma | | | | | Ivy
Emerging
Market
Equity
Fund | | | Ivy
Asset
Strategy
New
Opportunities
Fund | | | Acquiring
Fund
Proforma | |
| | — | | | | 45 | | | | 45 | | | WageWorks, Inc. (A) | | | — | | | | 2,290 | | | | 2,290 | |
| | 185 | | | | — | | | | 185 | | | WisdomTree India Earnings Fund, ETF | | | 2,828 | | | | — | | | | 2,828 | |
| | | | | | | | | | | | | | | | | | | | | | | | |
| | | | | | | | | | | | | | | 17,027 | | | | 17,314 | | | | 34,341 | |
| | | | | | | | | | | | | | | | | | | | | | | | |
| | | | | | | | | | | | TOTAL COMMON STOCKS—91.7% | | $ | 571,392 | | | $ | 184,741 | | | $ | 756,133 | |
| | | | | | | | | | | | (Cost: $640,731) | | | | | | | | | | | | |
| | | | | | |
| | | | | | | | | | WARRANTS | | | | | | | | | |
| | | | | | | | | | | | Singapore—0.0% | | | | | | | | | | | | |
| | — | | | | 400 | | | | 400 | | | Olam International Limited, Expires 1-29-18 (C) | | | — | | | | 92 | | | | 92 | |
| | | | | | | | | | | | | | | | | | | | | | | | |
| | | | | | | | | | | | TOTAL WARRANTS—0.0% | | | | | | | | | | | | |
| | | | | | | | | | | | (Cost: $—) | | | | | | | | | | | | |
| | | | |
| NUMBER OF CONTRACTS (UNROUNDED) | | | PURCHASED OPTIONS
(Counterparty, if OTC) | | | | | | | | | |
| | | | | | | | | | | | HSCEI Index, | | | | | | | | | | | | |
| | — | | | | 240 | | | | 240 | | | Call HKD10,600.00,
Expires 10-30-13,
OTC (Ctrpty: Bank of America N.A.) (D) | | | — | | | | 210 | | | | 210 | |
| | | | | | | | | | | | iShares FTSE China 25 Index Fund, | | | | | | | | | | | | |
| | 1,605 | | | | — | | | | 1,605 | | | Call $38.00, Expires 11-16-13 | | | 122 | | | | — | | | | 122 | |
| | | | | | | | | | | | iShares MSCI Emerging Markets ETF, | | | | | | | | | | | | |
| | — | | | | 589 | | | | 589 | | | Call $413.28, Expires 10-19-13,
OTC (Ctrpty: Deutsche Bank AG) | | | — | | | | 297 | | | | 297 | |
| | | | | | | | | | | | Nikkei 225 Index: | | | | | | | | | | | | |
| | — | | | | 150 | | | | 150 | | | Call JPY14,750.00,
Expires 10-11-13, OTC (Ctrpty:
JPMorgan Chase Bank N.A.) (D). | | | — | | | | 237 | | | | 237 | |
| | — | | | | 95 | | | | 95 | | | Call JPY15,000.00,
Expires 10-11-13, OTC (Ctrpty: UBS AG) (D) | | | — | | | | 82 | | | | 82 | |
| | — | | | | 60 | | | | 60 | | | Call JPY14,500.00,
Expires 10-18-13,
OTC (Ctrpty: JPMorgan Chase Bank N.A.) (D) | | | — | | | | 159 | | | | 159 | |
| | | | | | | | | | | | S&P/ASX 200 Index, | | | | | | | | | | | | |
| | — | | | | 313 | | | | 313 | | | Call AUD5,250.00,
Expires 10-17-13,
OTC (Ctrpty: Bank of America N.A.) (D) | | | — | | | | 147 | | | | 147 | |
| | | | | | | | | | | | | | | | | | | | | | | | |
| | | | | | | | | | | | TOTAL PURCHASED OPTIONS—0.2% | | $ | 122 | | | $ | 1,132 | | | $ | 1,254 | |
| | | | | | | | | | | | (Cost: $1,863) | | | | | | | | | | | | |
| | | | |
| TROY OUNCES | | | BULLION—2.3% | | | | | | | | | |
| | — | | | | 14 | | | | 14 | | | Gold | | | — | | | | 18,571 | | | | 18,571 | |
| | | | | | | | | | | | (Cost: $20,045) | | | | | | | | | | | | |
| | | | |
| PRINCIPAL | | | CORPORATE DEBT SECURITIES | | | | | | | | | |
| | | | | | | | | | | | India—0.0% | | | | | | | | | | | | |
| | | | | | | | | | | | Dr. Reddy’s Laboratories Ltd., | | | | | | | | | | | | |
| | INR 1,480 | | | | — | | | | INR 1,480 | | | 9.250%, 3-24-14 (D) | | | 122 | | | | — | | | | 122 | |
| | | | | | | | | | | | | | | | | | | | | | | | |
| | | | | | | | | | | | Singapore—0.1% | | | | | | | | | | | | |
| | | | | | | | | | | | Olam International Limited, | | | | | | | | | | | | |
| | $— | | | $ | 773 | | | $ | 773 | | | 6.750%, 1-29-18 | | | — | | | | 740 | | | | 740 | |
| | | | | | | | | | | | | | | | | | | | | | | | |
| | | | | | | | | | | | TOTAL CORPORATE DEBT SECURITIES—0.1% | | $ | 122 | | | $ | 740 | | | $ | 862 | |
| | | | | | | | | | | | (Cost: $739) | | | | | | | | | | | | |
SAI-6
| | | | | | | | | | | | | | | | | | | | | | | | |
SHARES | | | DESCRIPTION | | VALUE | |
Ivy
Emerging
Market
Equity
Fund | | | Ivy
Asset
Strategy
New
Opportunities
Fund | | | Acquiring
Fund
Proforma | | | | | Ivy
Emerging
Market
Equity
Fund | | | Ivy
Asset
Strategy
New
Opportunities
Fund | | | Acquiring
Fund
Proforma | |
| | | | |
| | | SHORT-TERM SECURITIES | | | | | | | | | |
| | | | | | | | | | | | Certificate Of Deposit—1.2% | | | | | | | | | | | | |
| | | | | | | | | | | | Toronto-Dominion Bank: | | | | | | | | | | | | |
| | 5,000 | | | | 5,000 | | | | 10,000 | | | 0.110%, 10-17-13 | | | 5,000 | | | | 5,000 | | | | 10,000 | |
| | | | | | | | | | | | | | | | | | | | | | | | |
| | | | | | | | | | | | Commercial Paper (E)—4.6% | | | | | | | | | | | | |
| | | | | | | | | | | | CVS Caremark Corporation, | | | | | | | | | | | | |
| | — | | | | 3,000 | | | | 3,000 | | | 0.180%, 10-4-13 | | | — | | | | 3,000 | | | | 3,000 | |
| | | | | | | | | | | | Illinois Tool Works Inc., | | | | | | | | | | | | |
| | — | | | | 7,000 | | | | 7,000 | | | 0.050%, 10-9-13 | | | — | | | | 7,000 | | | | 7,000 | |
| | | | | | | | | | | | McCormick & Co. Inc., | | | | | | | | | | | | |
| | — | | | | 3,000 | | | | 3,000 | | | 0.160%, 10-1-13 | | | — | | | | 3,000 | | | | 3,000 | |
| | | | | | | | | | | | National Oilwell Varco, Inc., | | | | | | | | | | | | |
| | — | | | | 5,000 | | | | 5,000 | | | 0.200%, 10-30-13 | | | — | | | | 4,999 | | | | 4,999 | |
| | | | | | | | | | | | Roche Holdings, Inc., | | | | | | | | | | | | |
| | — | | | | 10,000 | | | | 10,000 | | | 0.050%, 10-1-13 | | | — | | | | 10,000 | | | | 10,000 | |
| | | | | | | | | | | | Wisconsin Electric Power Co., | | | | | | | | | | | | |
| | — | | | | 2,137 | | | | 2,137 | | | 0.100%, 10-1-13 | | | — | | | | 2,137 | | | | 2,137 | |
| | | | | | | | | | | | L Air Liquide S.A., | | | | | | | | | | | | |
| | 4,000 | | | | — | | | | 4,000 | | | 0.200%, 11-22-13 | | | 3,999 | | | | — | | | | 3,999 | |
| | | | | | | | | | | | Verizon Communications Inc., | | | | | | | | | | | | |
| | 4,000 | | | | — | | | | 4,000 | | | 0.210%, 10-21-13 | | | 3,999 | | | | — | | | | 3,999 | |
| | | | | | | | | | | | | | | | | | | | | | | | |
| | | | | | | | | | | | | | | 7,998 | | | | 30,136 | | | | 38,134 | |
| | | | | | | | | | | | | | | | | | | | | | | | |
| | | | | | | | | | | | Master Note—0.1% | | | | | | | | | | | | |
| | | | | | | | | | | | Toyota Motor Credit Corporation: | | | | | | | | | | | | |
| | 603 | | | | 104 | | | | 707 | | | 0.100%, 10-2-13 (F) | | | 603 | | | | 104 | | | | 707 | |
| | | | | | | | | | | | | | | | | | | | | | | | |
| | | | | | | | | | | | TOTAL SHORT-TERM SECURITIES—5.9% | | $ | 13,601 | | | $ | 35,240 | | | $ | 48,841 | |
| | | | | | | | | | | | | | | | | | | | | | | | |
| | | | | | | | | | | | (Cost: $48,842) | | | | | | | | | | | | |
| | | | | | | | | | | | TOTAL INVESTMENT SECURITIES—100.2% | | $ | 585,237 | | | $ | 240,516 | | | $ | 825,753 | |
| | | | | | | | | | | | | | | | | | | | | | | | |
| | | | | | | | | | | | (Cost: $712,220) | | | | | | | | | | | | |
| | | | | | | | | | | | LIABILITIES, NET OF CASH AND OTHER ASSETS—(0.2%) | | | (12,138 | ) | | | 10,707 | | | | (1,431 | ) |
| | | | | | | | | | | | | | | | | | | | | | | | |
| | | | | | | | | | | | NET ASSETS—100.0% | | $ | 573,099 | | | $ | 251,223 | | | $ | 824,322 | |
| | | | | | | | | | | | | | | | | | | | | | | | |
| | | | | | | | | | | | | | | | | | | | | | | | |
Notes to Proforma Schedule of Investments
| (A) | No dividends were paid during the preceding 12 months. |
| (B) | Securities were purchased pursuant to Rule 144A under the Securities Act of 1933 and may be resold in transactions exempt from registration, normally to qualified institutional buyers. At September 30, 2013, the total value of these securities amounted to $15,511 or 1.9% of net assets. |
| (C) | Warrants entitle the Fund to purchase a predetermined number of shares of common stock and are non-income producing. The purchase price and number of shares are subject to adjustment under certain conditions until the expiration date, if any. |
| (D) | Principal amount and exercise prices are denominated in the indicated foreign currency, where applicable (AUD—Australian Dollar, HKD—Hong Kong Dollar, JPY-Japanese Yen and INR—Indian Rupee). |
| (E) | Rate shown is the yield to maturity at September 30, 2013. |
| (F) | Variable rate security. Interest rate disclosed is that which is in effect at September 30, 2013. Date shown represents the date the variable rate resets. |
| (G) | No adjustments are shown to the unaudited Pro Forma Combined Schedule of Investments due to the fact that upon consummation of the merger, securities will not need to be sold in order for the Acquiring Fund to comply with its prospectus restrictions. The foregoing sentence shall not restrict in any way the ability of the investment adviser of either of the Funds from buying or selling securities in the normal course of such Fund’s business and operations. |
SAI-7
| | | | | | | | | | | | | | | | | | | | | | | | |
PRINCIPAL AMOUNT OF CONTRACT
(DENOMINATED IN INDICATED
CURRENCY) | | | FORWARD FOREIGN CURRENCY CONTRACTS | | UNREALIZED
(DEPRECIATION) | |
| | — | | | | JPY 464,628 | | | | JPY 464,628 | | | Sell Japanese Yen, Counterparty—Barclays Capital, Inc., Settlement Date 10-20-13 | | $ | — | | | $ | (55 | ) | | $ | (55 | ) |
| | | | | | | | | | | | | | | | | | | | | | | | |
| | |
NUMBER OF CONTRACTS
(UNROUNDED) | | | WRITTEN OPTIONS (Counterparty, if OTC) | | VALUE | |
| | | | | | | | | | | | Baidu.com, Inc., ADR | | | | | | | | | | | | |
| | 1,026 | | | | — | | | | 1,026 | | | Put $90.00, Expires December 2013,
Premium Received ($339) | | $ | (36 | ) | | $ | — | | | $ | (36 | ) |
| | 1,026 | | | | — | | | | 1,026 | | | Call $125.00, Expires December 2013,
Premium Received ($495) | | | (3,357 | ) | | | — | | | | (3,357 | ) |
| | | | | | | | | | | | ICICI Bank Limited, ADR | | | | | | | | | | | | |
| | 1,265 | | | | — | | | | 1,265 | | | Put $20.00, Expires January 2015,
Premium Received ($250) | | | (211 | ) | | | — | | | | (211 | ) |
| | 835 | | | | — | | | | 835 | | | Put $28.00, Expires January 2015,
Premium Received ($236) | | | (382 | ) | | | — | | | | (382 | ) |
| | | | | | | | | | | | iShares FTSE China 25 Index Fund | | | | | | | | | | | | |
| | 1,605 | | | | — | | | | 1,605 | | | Put $33.50, Expires November 2013,
Premium Received ($104) | | | (41 | ) | | | — | | | | (41 | ) |
| | 1,605 | | | | — | | | | 1,605 | | | Call $41.00, Expires November 2013,
Premium Received ($40)
Nikkei 225 Index | | | (24 | ) | | | — | | | | (24 | ) |
| | | | | | | | | | | | Call JPY15,500.00, Expires October 2013,
OTC (Ctrpty: JPMorgan Chase Bank N.A.), | | | | | | | | | | | | |
| | — | | | | 150 | | | | 150 | | | Premium Received ($94) | | | — | | | | (27 | ) | | | (27 | ) |
| | | | | | | | | | | | Tencent Holdings Limited | | | | | | | | | | | | |
| | | | | | | | | | | | Call HKD370.00, Expires December 2013, OTC (Ctrpty: Morgan Stanley & Co., Inc.), | | | | | | | | | | | | |
| | 4,030 | | | | — | | | | 4,030 | | | Premium Received ($726) | | | (2,738 | ) | | | — | | | | (2,738 | ) |
| | | | | | | | | | | | | | | | | | | | | | | | |
| | | | | | | | | | | | Total Premium Received ($2,284) | | $ | (6,789 | ) | | $ | (27 | ) | | $ | (6,816 | ) |
| | | | | | | | | | | | | | | | | | | | | | | | |
| | | | | | | | | | | | | | | | | | | | | | | | |
| | |
| NOTIONAL AMOUNT | | | TOTAL RETURN SWAP AGREEMENTS | | UNREALIZED
DEPRECIATION | |
| $ | 5,588 | | | $ | — | | | $ | 5,588 | | | China Vanke Company Ltd. | | | | | | | | | | | | |
| | | | | | | | | | | | Termination Date 6-17-14, Financing Fee (1)–USD LIBOR + 0.700%, | | | | | | | | | | | | |
| | | | | | | | | | | | OTC (Ctrpty: UBS AG, London) | | $ | (471 | ) | | $ | — | | | $ | (471 | ) |
| | | | | | | | | | | | | | | | | | | | | | | | |
| (1) | The Fund pays the financing fee multiplied by the notional amount each month. On the termination date of the swap contracts, the Fund will pay/receive the return of the underlying security. |
The following table is a summary of the valuation of the Pro Forma Fund’s investments by the fair value hierarchy levels as of September 30, 2013. See Note 3 to the Financial Statements for further information regarding fair value measurement.
| | | | | | | | | | | | | | | | | | |
| | | | | Assets | | | | Level 1 | | | Level 2 | | | Level 3 | |
| | Investments in Securities | | | | | | | | | | | | |
| | | | | | | | | | | | | | | | | | |
| | | | | | Common Stocks | | | | | | | | | | | | |
| | | | | | Consumer Discretionary | | $ | 105,799 | | | $ | — | | | $ | — | |
| | | | | | Consumer Staples | | | 53,099 | | | | — | | | | — | |
| | | | | | Energy | | | 26,192 | | | | — | | | | — | |
| | | | | | Financials | | | 172,074 | | | | — | | | | — | |
| | | | | | Health Care | | | 8,951 | | | | — | | | | — | |
| | | | | | Industrials | | | 115,361 | | | | — | | | | — | |
| | | | | | Information Technology | | | 198,250 | | | | — | | | | — | |
| | | | | | Materials | | | 12,079 | | | | | | | | | |
| | | | | | Real Estate | | | 127 | | | | — | | | | — | |
| | | | | | Telecommunication Services | | | 43,520 | | | | — | | | | — | |
| | | | | | Utilities | | | 20,681 | | | | — | | | | — | |
| | | | | | | | | | | | | | | | | | |
| | | | | | Total Common Stocks | | $ | 756,133 | | | $ | — | | | $ | — | |
| | | | | | | | | | | | | | | | | | |
SAI-8
| | | | | | | | | | | | | | | | | | |
| | | | | Assets | | | | Level 1 | | | Level 2 | | | Level 3 | |
| | | | | | | | | | | | | | | | | | |
| | | | | | Warrants | | $ | 92 | | | | | | | | | |
| | | | | | Purchased Options | | | 122 | | | $ | 1,132 | | | $ | — | |
| | | | | | Bullion | | | 18,571 | | | | — | | | | — | |
| | | | | | Corporate Debt Securities | | | — | | | | 862 | | | | — | |
| | | | | | Short-Term Securities | | | — | | | | 48,841 | | | | — | |
| | | | | | | | | | | | | | | | | | |
| | | | | | Total | | $ | 774,918 | | | $ | 50,835 | | | $ | — | |
| | | | | | | | | | | | | | | | | | |
| | | | Liabilities | | | | | | | | | | | |
| | | | | | Forward Foreign Currency Contracts | | $ | — | | | $ | 55 | | | $ | — | |
| | | | | | Written Options | | $ | 4,051 | | | $ | 2,765 | | | $ | — | |
| | | | | | Swap Agreements | | $ | — | | | $ | 471 | | | $ | — | |
| | | | | | | | | | | | | | | | | | |
As of September 30, 2013, there were no transfers between Level 1 and 2 during the period.
The following acronyms are used throughout this pro forma schedule:
ADR = American Depositary Receipts
OTC = Over the Counter
REIT = Real Estate Investment Trusts
| | | | |
Pro Forma Market Sector Diversification (as a % of net assets) | | | |
Information Technology | | | 24.0 | % |
Financials | | | 20.9 | % |
Industrials | | | 14.0 | % |
Consumer Discretionary | | | 12.8 | % |
Consumer Staples | | | 6.5 | % |
Telecommunication Services | | | 5.3 | % |
Energy | | | 3.2 | % |
Utilities | | | 2.5 | % |
Materials | | | 1.5 | % |
Health Care | | | 1.1 | % |
Real Estate | | | 0.0 | % |
Other+ | | | 8.2 | % |
| + | Includes gold bullion, options, cash and cash equivalents and other assets and liabilities. |
SAI-9
Pro Forma Statement of Assets and Liabilities (Unaudited)
(000 omitted, except per share amounts)
September 30, 2013
| | | | | | | | | | | | | | | | |
| | | Ivy
Emerging
Markets
Equity
Fund | | | Ivy Asset
Strategies
New
Opportunities
Fund+ | | | Pro forma
Adjustments | | | Combining
Pro Forma | |
ASSETS | | | | | | | | | | | | | | | | |
Investment in securities at value | | $ | 585,237 | | | $ | 221,945 | | | $ | 0 | | | $ | 807,182 | |
Bullion at value | | | 0 | | | | 18,571 | | | | 0 | | | | 18,571 | |
Cash | | | 1 | | | | 7,500 | | | | 0 | | | | 7,501 | |
Cash denominated in foreign currencies at value | | | 1,791 | | | | 4,351 | | | | 0 | | | | 6,142 | |
Restristed cash | | | 2,068 | | | | 6 | | | | 0 | | | | 2,074 | |
Investment securities sold receivable | | | 5,990 | | | | 834 | | | | 0 | | | | 6,824 | |
Other Assets | | | 1,359 | | | | 900 | | | | 0 | | | | 2,259 | |
| | | | | | | | | | | | | | | | |
Total assets | | | 596,446 | | | | 254,107 | | | | 0 | | | | 850,553 | |
| | | | | | | | | | | | | | | | |
LIABILITIES | | | | | | | | | | | | | | | | |
Investment securities purchased payable | | | 13,804 | | | | 1,895 | | | | 0 | | | | 15,699 | |
Capital shares redeemed payable | | | 1,858 | | | | 729 | | | | 0 | | | | 2,587 | |
Payable to affiliates | | | 345 | | | | 148 | | | | 0 | | | | 493 | |
Unrealized depreciation on swap agreements | | | 471 | | | | 0 | | | | 0 | | | | 471 | |
Unrealized depreciation on forward foreign currency contracts | | | 0 | | | | 55 | | | | 0 | | | | 55 | |
Written options at value | | | 6,789 | | | | 27 | | | | 0 | | | | 6,816 | |
Other payables | | | 80 | | | | 30 | | | | 129 | (a) | | | 239 | |
| | | | | | | | | | | | | | | | |
Total liabilities | | | 23,347 | | | | 2,884 | | | | 129 | | | | 26,360 | |
| | | | | | | | | | | | | | | | |
Net Assets | | $ | 573,099 | | | $ | 251,223 | | | ($ | 129 | ) | | $ | 824,193 | |
| | | | | | | | | | | | | | | | |
Net Assets | | | | | | | | | | | | | | | | |
Capital paid in | | $ | 567,841 | | | $ | 312,308 | | | $ | 0 | | | $ | 880,149 | |
Accumulated net realized loss on investments | | | (79,033 | ) | | | (85,935 | ) | | | 0 | | | | (164,968 | ) |
Undistributed (distribution in excess of) net investment income (loss) | | | 3,582 | | | | (3,243 | ) | | | (129 | ) (a) | | | 210 | |
Net unrealized appreciation on investments | | | 80,709 | | | | 28,093 | | | | 0 | | | | 108,802 | |
| | | | | | | | | | | | | | | | |
Total Net Assets | | $ | 573,099 | | | $ | 251,223 | | | ($ | 129 | ) | | $ | 824,193 | |
| | | | | | | | | | | | | | | | |
Class A | | | | | | | | | | | | | | | | |
Net Assets | | $ | 413,872 | | | $ | 159,231 | | | $ | (82 | ) (a) | | $ | 573,021 | |
Outstanding Shares | | | 29,742 | | | | 14,957 | | | | (3,534 | ) (b) | | | 41,165 | |
Net asset value per share | | $ | 13.92 | | | $ | 10.65 | | | | | | | $ | 13.92 | |
Class B | | | | | | | | | | | | | | | | |
Net Assets | | $ | 6,020 | | | $ | 4,772 | | | $ | (3 | ) (a) | | $ | 10,789 | |
Outstanding Shares | | | 513 | | | | 461 | | | | (54 | ) (b) | | | 920 | |
Net asset value per share | | $ | 11.73 | | | $ | 10.35 | | | | | | | $ | 11.73 | |
Class C | | | | | | | | | | | | | | | | |
Net Assets | | $ | 13,022 | | | $ | 39,781 | | | $ | (20 | ) (a) | | $ | 52,783 | |
Outstanding Shares | | | 1,067 | | | | 3,829 | | | | (573 | ) (b) | | | 4,323 | |
Net asset value per share | | $ | 12.21 | | | $ | 10.39 | | | | | | | $ | 12.21 | |
Class E | | | | | | | | | | | | | | | | |
Net Assets | | $ | 112 | | | $ | 107 | | | | — | (a) | | $ | 219 | |
Outstanding Shares | | | 8 | | | | 10 | | | | (2 | ) (b) | | | 16 | |
Net asset value per share | | $ | 14.10 | | | $ | 10.64 | | | | | | | $ | 14.10 | |
Class I | | | | | | | | | | | | | | | | |
Net Assets | | $ | 135,520 | | | $ | 38,714 | | | $ | (20 | ) (a) | | $ | 174,214 | |
Outstanding Shares | | | 9,477 | | | | 3,620 | | | | (914 | ) (b) | | | 12,183 | |
Net asset value per share | | $ | 14.30 | | | $ | 10.70 | | | | | | | $ | 14.30 | |
SAI-10
| | | | | | | | | | | | | | | | |
| | | Ivy
Emerging
Markets
Equity
Fund | | | Ivy Asset
Strategies
New
Opportunities
Fund+ | | | Pro forma
Adjustments | | | Combining
Pro Forma | |
Class R | | | | | | | | | | | | | | | | |
Net Assets | | $ | 250 | | | $ | 599 | | | $ | — | (a) | | $ | 849 | |
Outstanding Shares | | | 18 | | | | 57 | | | | (14 | ) (b) | | | 61 | |
Net asset value per share | | $ | 13.90 | | | $ | 10.53 | | | | | | | $ | 13.90 | |
Class Y | | | | | | | | | | | | | | | | |
Net Assets | | $ | 4,303 | | | $ | 8,019 | | | $ | (4 | ) (a) | | $ | 12,318 | |
Outstanding Shares | | | 303 | | | | 753 | | | | (188 | ) (b) | | | 868 | |
Net asset value per share | | $ | 14.19 | | | $ | 10.64 | | | | | | | $ | 14.19 | |
| + | Consolidated Statements of Assets and Liabilities (See Note 5 to Pro Forma Financial Statements). |
| (a) | Accrued cost of one time proxy, accounting, legal and other costs borne 50% by Ivy Investment Management Company and 50% by the Acquired Fund. |
| (b) | Share adjustment—redemption of Acquired Fund’s shares and issuance of Acquiring Fund’s shares for net assets at NAV per share of each class of Acquiring Fund. |
See Accompanying Notes to Pro Forma Financial Statements.
SAI-11
Pro Forma Statement of Operations (Unaudited)
(000 omitted)
For the twelve month period ended September 30, 2013
| | | | | | | | | | | | | | | | |
| | | Ivy
Emerging
Markets
Equity
Fund | | | Ivy Asset
Strategies
New
Opportunities
Fund+ | | | Pro forma
Adjustments | | | Combining
Pro Forma | |
Investment Income | | | | | | | | | | | | | | | | |
Income | | | | | | | | | | | | | | | | |
Dividends (net of foreign withholding tax) | | $ | 13,176 | | | $ | 3,474 | | | $ | 0 | | | $ | 16,650 | |
Foreign dividend withholding tax | | ($ | 1,349 | ) | | ($ | 345 | ) | | | 0 | | | | (1,694 | ) |
Interest and amortization (net of foreign withholding tax) | | | 55 | | | | 75 | | | | 0 | | | | 130 | |
Foreign interest withholding tax | | | (5 | ) | | | (2 | ) | | | 0 | | | | (7 | ) |
| | | | | | | | | | | | | | | | |
Total income | | | 11,877 | | | | 3,202 | | | | 0 | | | | 15,079 | |
| | | | | | | | | | | | | | | | |
Expenses | | | | | | | | | | | | | | | | |
Investment management fee | | | 6,261 | | | | 2,802 | | | | (415 | ) (a) | | | 8,648 | |
Shareholder Servicing (Transfer Agency) | | | | | | | | | | | | | | | | |
Class A | | | 1,929 | | | | 605 | | | | (199 | ) (b) | | | 2,335 | |
Class B | | | 67 | | | | 21 | | | | (2 | ) (b) | | | 86 | |
Class C | | | 73 | | | | 123 | | | | (4 | ) (b) | | | 192 | |
Class E | | | 0 | | | | 0 | | | | 0 | (b) | | | 0 | |
Class I | | | 217 | | | | 78 | | | | 0 | (b) | | | 295 | |
Class R | | | 0 | | | | 1 | | | | 0 | (b) | | | 1 | |
Class Y | | | 6 | | | | 13 | | | | 0 | (b) | | | 19 | |
Distribution and Service Fee | | | | | | | | | | | | | | | | |
Class A | | | 1,186 | | | | 420 | | | | 0 | | | | 1,606 | |
Class B | | | 76 | | | | 55 | | | | 0 | | | | 131 | |
Class C | | | 155 | | | | 489 | | | | 0 | | | | 644 | |
Class E | | | 0 | | | | 0 | | | | 0 | | | | 0 | |
Class R | | | 0 | | | | 3 | | | | 0 | | | | 3 | |
Class Y | | | 12 | | | | 20 | | | | 0 | | | | 32 | |
Accounting Service Fees | | | 176 | | | | 101 | | | | (44 | ) (c) | | | 233 | |
Custodian Fees | | | 123 | | | | 59 | | | | 0 | | | | 182 | |
Professional Fees | | | 30 | | | | 53 | | | | (20 | ) (d) | | | 63 | |
Other | | | 253 | | | | 154 | | | | (29 | ) (e) | | | 378 | |
| | | | | | | | | | | | | | | | |
Total expenses | | | 10,564 | | | | 4,997 | | | | (713 | ) | | | 14,848 | |
| | | | | | | | | | | | | | | | |
Expenses reimbursement | | | 0 | | | | (426 | ) | | | (211 | ) (f) | | | (637 | ) |
| | | | | | | | | | | | | | | | |
Net Expenses | | | 10,564 | | | | 4,571 | | | | (924 | ) | | | 14,211 | |
| | | | | | | | | | | | | | | | |
Net investment income (loss) | | $ | 1,313 | | | ($ | 1,369 | ) | | $ | 924 | | | $ | 868 | |
| | | | | | | | | | | | | | | | |
SAI-12
| | | | | | | | | | | | | | | | |
| | | Ivy
Emerging
Markets
Equity
Fund | | | Ivy Asset
Strategies
New
Opportunities
Fund+ | | | Pro forma
Adjustments | | | Combining
Pro Forma | |
Realized and Unrealized Gain (Loss) on Investments | | | | | | | | | | | | | | | | |
Net realized gain (loss) on investments | | $ | 2,975 | | | ($ | 6,938 | ) | | $ | 0 | | | ($ | 3,963 | ) |
Net realized gain (loss) on written options | | | 534 | | | | 87 | | | | 0 | | | | 621 | |
Net realized gain (loss) on foreign currency exchange transactions | | | (870 | ) | | | (421 | ) | | | 0 | | | | (1,291 | ) |
Net realized gain (loss) on forward foreign currency contracts | | | (2,948 | ) | | | (652 | ) | | | 0 | | | | (3,600 | ) |
Net realized gain (loss) on futures contracts | | | 0 | | | | (1,822 | ) | | | 0 | | | | (1,822 | ) |
Net realized gain (loss) on swap agreements | | | 867 | | | | 0 | | | | 0 | | | | 867 | |
Unrealized appreciation in value of investments during the period | | | 25,198 | | | | 15,926 | | | | 0 | | | | 41,124 | |
Unrealized appreciation (depreciation) in value of forward foreign currency contracts during the period | | | 0 | | | | (16 | ) | | | 0 | | | | (16 | ) |
Unrealized appreciation (depreciation) in value of foreign currency exchange transactions during the period | | | (117 | ) | | | 114 | | | | 0 | | | | (3 | ) |
Unrealized appreciation (depreciation) in value of swap agreements | | | (422 | ) | | | 0 | | | | 0 | | | | (422 | ) |
Unrealized appreciation (depreciation) in value of written options during the period | | | (4,644 | ) | | | 67 | | | | 0 | | | | (4,577 | ) |
| | | | | | | | | | | | | | | | |
Net gain on investments | | $ | 20,573 | | | $ | 6,345 | | | $ | 0 | | | $ | 26,918 | |
| | | | | | | | | | | | | | | | |
Net increase in net assets resulting from operations | | $ | 21,886 | | | $ | 4,976 | | | $ | 924 | | | $ | 27,786 | |
| | | | | | | | | | | | | | | | |
| + | Consolidated Statements of Operations (See Note 5 to Pro Forma Financial Statements). |
| (a) | Based on management fee of 0.93% of net assets. |
| (b) | Shareholder Servicing adjusted due to combining identical accounts as well as a reduction in out-of-pocket expenses |
| (c) | Accounting services fee adjustment due to lower annual fee due to a higher total net assets. |
| (d) | Audit fees adjustment due to combination of funds to one entity. |
| (e) | Decrease due to economies of scale achieved by merging funds. |
| (f) | Decrease due to expense waivers on surviving fund. |
See Notes to Pro Forma Financial Statements.
SAI-13
IVY EMERGING MARKETS EQUITY FUND
NOTES TO PRO FORMA STATEMENT OF ASSETS AND LIABILITIES
AS OF SEPTEMBER 30, 2013
AND THE PRO FORMA STATEMENT OF OPERATIONS
FOR THE TWELVE MONTH PERIOD ENDED SEPTEMBER 30, 2013
(In thousands, except where otherwise noted) (Unaudited)
1. ORGANIZATION
Ivy Emerging Markets Equity Fund and Ivy Asset Strategy New Opportunities Fund (each a “Fund”, collectively the “Funds”) are registered under the Investment Company Act of 1940, as amended (the “1940 Act”), as diversified, open-end management investment companies. Ivy Emerging Markets Equity Fund’s investment objective is to provide growth of capital by investing in equity securities, primarily common stock, of large to mid capitalization companies whose securities are traded mainly on markets located within the Pacific region, issued by companies organized under the laws of a Pacific region country or issued by any company with more than half of its business in the Pacific region. Ivy Asset Strategy New Opportunities Fund’s investment objective is to provide total return by allocating its assets primarily among stocks, bonds, and short-term instruments of issuers in markets around the globe, as well as investments in derivative instruments, precious metals and investments with exposure to various foreign currencies. Each Fund’s investment manager is Ivy Investment Management Company (“IICO” or the “Manager”).
Each Fund currently offers Class A, Class C, Class I, Class Y and Class R shares. Class B shares are not available for purchase by new and existing investors. Class B shares are available for dividend reinvestment and exchanges. Class A shares are sold at their offering price, which is normally net asset value plus a front-end sales charge. Class C shares are sold without a front-end sales charge and Class B and Class C shares may be subject to a contingent deferred sales charge (“CDSC”). Class I, Class R and Class Y shares are sold without either a front-end sales charge or a CDSC. All classes of shares have identical rights and voting privileges with respect to the Fund in general and exclusive voting rights on matters that affect that class alone. Net investment income, net assets and net asset value per share may differ due to each class having its own expenses, such as transfer agent and shareholder servicing fees, directly attributable to that class. Class A, B, C, E, R and Y have a distribution and service plan. Class I shares are not included in the plan. Class B shares will automatically convert to Class A shares 96 months after the date of purchase.
2. SIGNIFICANT ACCOUNTING POLICIES
The following is a summary of significant accounting policies consistently followed by each Fund.
Security Transactions and Related Investment Income. Security transactions are accounted for on the trade date (date the order to buy or sell is executed). Realized gains and losses are calculated on the identified cost basis. Interest income is recorded on the accrual basis and includes paydown gain (loss) and accretion of discounts and amortization of premiums. Dividend income is recorded on the ex-dividend date, except certain dividends from foreign securities where the ex-dividend date may have passed, which are recorded as soon as the Fund is informed of the ex-dividend date. All or a portion of the distributions received from a real estate investment trust or publicly traded partnership may be designated as a reduction of cost of the related investment and/or realized gain.
Foreign Currency Translation. Each Fund’s accounting records are maintained in U.S. dollars. All assets and liabilities denominated in foreign currencies are translated into U.S. dollars daily, using foreign exchange rates obtained from an independent pricing service authorized by the Board of Trustees of the Trust (the “Board”). Purchases and sales of investment securities and accruals of income and expenses are translated at the rate of exchange prevailing on the date of the transaction. For assets and liabilities other than investments in securities, net realized and unrealized gains and losses from foreign currency translation arise from changes in currency exchange rates. Each Fund combines fluctuations from currency exchange rates and fluctuations in value when computing net realized gain (loss) and net change in unrealized appreciation (depreciation) on investments. Foreign exchange rates are valued as of the close of the New York Stock Exchange (“NYSE”), normally 4:00 P.M. Eastern time, on each day the NYSE is open for trading.
Allocation of Income, Expenses, Gains and Losses. Income, expenses (other than those attributable to a specific class), gains and losses are allocated on a daily basis to each class of shares based upon the relative proportion of net assets represented by such class. Operating expenses directly attributable to a specific class are charged against the operations of that class.
It is the policy of each Fund to distribute all of its taxable income and capital gains to its shareholders and otherwise qualify as a regulated investment company under Subchapter M of the Internal Revenue Code. After the acquisition, the Acquiring Fund
SAI-14
intends to continue to qualify as a regulated investment company, if such qualification is in the best interests of its shareholders, by complying with the provisions available to certain investment companies, as defined in applicable sections of the Internal Revenue Code, and to make distributions of taxable income sufficient to relieve it from all, or substantially all, Federal income taxes. In addition, each Fund intends to pay distributions as required to avoid imposition of excise tax. Accordingly, no provision has been made for Federal income taxes. Management of the Trust periodically reviews all tax positions to assess that it is more likely than not that the position would be sustained upon examination by the relevant tax authority based on the technical merits of each position. As of and for the twelve month period ended September 30, 2013, management believes that no liability for unrecognized tax positions is required. The Funds are subject to examination by U.S. federal and state authorities for returns filed for tax years after 2008.
Dividends and Distributions to Shareholders. Dividends and distributions to shareholders are recorded by each Fund on the business day following record date. Net investment income dividends and capital gains distributions are determined in accordance with income tax regulations which may differ from accounting principles generally accepted in the United States of America (“U.S. GAAP”). If the total dividends and distributions made in any tax year exceeds net investment income and accumulated realized capital gains, a portion of the total distribution may be treated as a tax return of capital.
Segregation and Collateralization. In cases in which the 1940 Act and the interpretive positions of the Securities and Exchange Commission (“SEC”) require that a Fund either deliver collateral or segregate assets in connection with certain investments (e.g., dollar rolls, financial futures contracts, foreign currency exchange contracts, options written, securities with extended settlement periods and swaps), the Fund will segregate collateral or designate on its books and records cash or other liquid securities having a value at least equal to the amount that is required to be physically segregated for the benefit of the counterparty. Furthermore, based on requirements and agreements with certain exchanges and third party broker-dealers, each party has requirements to deliver/deposit cash or securities as collateral for certain investments. Certain countries require that cash reserves be held while investing in companies incorporated in that country. These cash reserves and cash collateral that has been pledged to cover obligations of the Funds under derivative contracts, if any, will be reported separately on the Statement of Assets and Liabilities as “Restricted cash.” Securities collateral pledged for the same purpose, if any, is noted on the Schedule of Investments.
Concentration of Market and Credit Risk. In the normal course of business, the Funds invest in securities and enter into transactions where risks exist due to fluctuations in the market (market risk) or failure of the issuer of a security to meet all its obligations (issuer credit risk). The value of securities held by the Funds may decline in response to certain events, including those directly involving the issuers whose securities are owned by the Funds; conditions affecting the general economy; overall market changes; local, regional or global political, social or economic instability; and currency and interest rate and price fluctuations. Similar to issuer credit risk, the Funds may be exposed to counterparty credit risk, or the risk that an entity with which the Funds have unsettled or open transactions may fail to or be unable to perform on its commitments. The Funds manage counterparty credit risk by entering into transactions only with counterparties that they believe have the financial resources to honor their obligations and by monitoring the financial stability of those counterparties. Financial assets, which potentially expose the Funds to market, issuer and counterparty credit risks, consist principally of financial instruments and receivables due from counterparties. The extent of the Funds’ exposure to market, issuer and counterparty credit risks with respect to these financial assets is generally approximated by their value recorded on the Funds’ Statement of Assets and Liabilities, less any collateral held by the Funds.
Certain Funds may hold high-yield and/or non-investment-grade bonds, which may be subject to a greater degree of credit risk. Credit risk relates to the ability of the issuer to meet interest or principal payments or both as they become due. The Funds may acquire securities in default and are not obligated to dispose of securities whose issuers subsequently default.
Certain Funds may enter into financial instrument transactions (such as swaps, futures, options and other derivatives) that may have off-balance sheet market risk. Off-balance sheet market risk exists when the maximum potential loss on a particular financial instrument is greater than the value of such financial instrument, as reflected on the Statement of Assets and Liabilities.
If a Fund invests directly in foreign currencies or in securities that trade in, and receive revenues in, foreign currencies, or in financial derivatives that provide exposure to foreign currencies, it will be subject to the risk that those currencies will decline in value relative to the base currency of the Fund, or, in the case of hedging positions, that the Fund’s base currency will decline in value relative to the currency being hedged. Currency rates in foreign countries may fluctuate significantly over short periods of time for a number of reasons, including changes in interest rates, intervention (or the failure to intervene) by U.S. or foreign governments, central banks or supranational entities such as the International Monetary Fund, or by the imposition of currency controls or other political developments in the United States or abroad.
Custodian Fees. “Custodian fees” on the Statement of Operations may include interest expense incurred by a Fund on any cash overdrafts of its custodian account during the period. Such cash overdrafts may result from the effects of failed trades in
SAI-15
portfolio securities and from cash outflows resulting from unanticipated shareholder redemption activity. A Fund pays interest to its custodian on such cash overdrafts, to the extent they are not offset by positive cash balances maintained by that Fund. The “Earnings credit” line item, if shown, represents earnings on cash balances maintained by that Fund during the period. Such interest expense and other custodian fees may be paid with these earnings.
Trustees and Chief Compliance Officer Fees. Fees paid to the Trustees can be paid in cash or deferred to a later date, at the election of the Trustee according to the Deferred Fee Agreement entered into between the Trust and the Trustee(s). Each Fund records its portion of the deferred fees as a liability on the Statement of Assets and Liabilities. All fees paid in cash plus any appreciation (depreciation) in the underlying deferred plan are shown on the Statement of Operations. Additionally, fees paid to the office of the Chief Compliance Officer of the Funds are shown on the Statement of Operations.
Indemnifications. The Trust’s organizational documents provide current and former Trustees and Officers with a limited indemnification against liabilities arising in connection with the performance of their duties to the Trust. In the normal course of business, the Trust may also enter into contracts that provide general indemnification. The Trust’s maximum exposure under these arrangements is unknown and is dependent on future claims that may be made against the Trust. The risk of material loss from such claims is considered remote.
Estimates. The preparation of financial statements in accordance with U.S. GAAP requires management to make estimates and assumptions that affect the reported amounts and disclosures in the financial statements. Actual results could differ from those estimates.
Subsequent Events. Management has performed a review for subsequent events through the date this report was issued.
3. INVESTMENT VALUATION AND FAIR VALUE MEASUREMENTS
Each Fund’s investments are reported at fair value. Fair value is defined as the price that each Fund would receive upon selling an asset or would pay upon satisfying a liability in an orderly transaction between market participants at the measurement date. Each Fund calculates the Net Asset Value (“NAV”) of its shares as of the close of the NYSE, normally 4:00 P.M. Eastern time, on each day the NYSE is open for trading.
For purposes of calculating the NAV, the portfolio securities and other assets are valued on each business day using pricing and valuation methods as adopted by the Board. Where market quotes are readily available, fair value is generally determined on the basis of last reported sales prices, or if no sales are reported, based on quotes obtained from a quotation reporting system, established market makers, or pricing services.
Prices for fixed-income securities are typically based on quotes that are obtained from an independent pricing service authorized by the Board. To determine values of fixed-income securities, the independent pricing service utilizes such factors as current quotations by broker/dealers, coupon, maturity, quality, type of issue, trading characteristics, and other yield and risk factors it deems relevant in determining valuations. Securities that cannot be valued by the independent pricing service may be valued using quotes obtained from dealers that make markets in the securities.
Short-term securities with maturities of 60 days or less are valued on the basis of amortized cost (which approximates value), whereby a portfolio security is valued at its cost initially, and thereafter valued to reflect a constant amortization to maturity of any discount or premium.
Because many foreign markets close before the NYSE, events may occur between the close of the foreign market and the close of the NYSE that could have a material impact on the valuation of foreign securities. Waddell & Reed Services Company (“WRSCO”), pursuant to procedures adopted by the Board, evaluates the impact of these events and may adjust the valuation of foreign securities to reflect the fair value as of the close of the NYSE. In addition, all securities for which values are not readily available or are deemed unreliable are appraised at fair value as determined in good faith under the supervision of the Board.
Where market quotes are not readily available, portfolio securities or assets are valued at fair value, as determined in good faith by the Board or WRSCO pursuant to instructions from the Board.
Market quotes are considered not readily available in circumstances where there is an absence of current or reliable market-based data (e.g., trade information or broker quotes), including where events occur after the close of the relevant market, but prior to the NYSE close, that materially affect the values of a Fund’s securities or assets. In addition, market quotes are considered not readily available when, due to extraordinary circumstances, the exchanges or markets on which the securities trade do not open for trading for the entire day and no other market prices are available.
SAI-16
The Board has delegated to WRSCO, the responsibility for monitoring significant events that may materially affect the values of a Fund’s securities or assets and for determining whether the value of the applicable securities or assets should be re-evaluated in light of such significant events. WRSCO has established a Valuation Committee to administer and oversee the valuation process, including the use of third party pricing vendors.
The Board has adopted methods for valuing securities and other assets in circumstances where market quotes are not readily available. For instances in which daily market quotes are not readily available, investments may be valued, pursuant to guidelines established by the Board, with reference to other securities or indices. In the event that the security or asset cannot be valued pursuant to one of the valuation methods established by the Board, the value of the security or asset will be determined in good faith by the Valuation Committee and appropriate consultation with the Board.
When a Fund uses these fair valuation methods applied by WRSCO that use significant unobservable inputs to determine its NAV, securities will be priced by a method that the Board or persons acting at their direction believe accurately reflects fair value and are categorized as Level 3 of the fair value hierarchy. These methods may require subjective determinations about the value of a security. The prices used by a Fund may differ from the value that will ultimately be realized at the time the securities were sold.
WRSCO is responsible for monitoring the implementation of the pricing and valuation policies through a series of activities to provide reasonable comfort of the accuracy of prices including: 1) periodic vendor due diligence meetings to review methodologies, new developments, and process at vendors, 2) daily and monthly multi-source pricing comparisons reviewed and submitted to the Valuation Committee, and 3) daily review of unpriced, stale, and variance reports with exceptions reviewed by management and the Valuation Committee.
Accounting standards establish a framework for measuring fair value and a three-level hierarchy for fair value measurements based upon the transparency of inputs to the valuation of an asset or liability. Inputs may be observable or unobservable and refer broadly to the assumptions that market participants would use in pricing the asset or liability. Observable inputs reflect the assumptions market participants would use in pricing the asset or liability based on market data obtained from sources independent of the reporting entity. Unobservable inputs reflect the reporting entity’s own assumptions about the factors that market participants would use in pricing the asset or liability developed based on the best information available in the circumstances.
An individual investment’s fair value measurement is assigned a level based upon the observability of the inputs which are significant to the overall valuation.
The three-tier hierarchy of inputs is summarized as follows:
| | | | |
| Level 1 | | — | | Observable input such as quoted prices, available in active markets, for identical assets or liabilities. |
| Level 2 | | — | | Significant other observable inputs, which may include, but are not limited to, quoted prices for similar assets or liabilities in markets that are active, quoted prices for identical or similar assets or liabilities in markets that are not active, inputs other than quoted prices that are observable for the assets or liabilities (such as interest rates, yield curves, volatilities, prepayment speeds, loss severities, credit risks and default rates) or other market corroborated inputs. |
| Level 3 | | — | | Significant unobservable inputs based on the best information available in the circumstances, to the extent observable inputs are not available, which may include assumptions made by the Board or persons acting at their direction that are used in determining the fair value of investments. |
A description of the valuation techniques applied to the Funds’ major classes of assets and liabilities measured at fair value on a recurring basis follows:
Bullion. The fair value of bullion is at the last settlement price at the end of each day on the board of trade or exchange upon which they are traded and are categorized in Level 1 of the fair value hierarchy.
Corporate Bonds. The fair value of corporate bonds is estimated using various techniques, which consider recently executed transactions in securities of the issuer or comparable issuers, market price quotations (where observable), bond spreads, fundamental data relating to the issuer, and credit default swap spreads adjusted for any basis difference between cash and derivative instruments. While most corporate bonds are categorized in Level 2 of the fair value hierarchy, in instances where lower relative weight is placed on transaction prices, quotations, or similar observable inputs, they are categorized in Level 3 of the fair value hierarchy.
SAI-17
Derivative Instruments. Forward foreign currency contracts are valued based upon the closing prices of the forward currency rates determined at the close of the NYSE. Swaps are valued by an independent pricing service unless the price is unavailable, in which case they are valued at the price provided by a dealer in that security. Futures contracts traded on an exchange are generally valued at the settlement price. Listed options are ordinarily valued at the mean of the last bid and ask price provided by an independent pricing service unless the price is unavailable, in which case they are valued at a quotation obtained from a broker-dealer. Over-the-counter (“OTC”) options are ordinarily valued at the mean of the last bid and ask price provided by an independent pricing service for a comparable listed option unless such a price is unavailable, in which case they are valued at a quotation obtained from a broker-dealer. If no comparable listed option exists from which to obtain a price from an independent pricing service and a quotation cannot be obtained from a broker-dealer, the OTC option will be valued using a model reasonably designed to provide a current market price.
Listed derivatives that are actively traded are valued based on quoted prices from the exchange and are categorized in Level 1 of the fair value hierarchy. OTC derivative contracts include forward foreign currency contracts, swap agreements, and option contracts related to interest rates, foreign currencies, credit standing of reference entities, equity prices, or commodity prices. Depending on the product and the terms of the transaction, the fair value of the OTC derivative products are modeled taking into account the counterparties’ creditworthiness and using a series of techniques, including simulation models. Many pricing models do not entail material subjectivity because the methodologies employed do not necessitate significant judgments and the pricing inputs are observed from actively quoted markets, as is the case with interest rate swap and option contracts. A substantial majority of OTC derivative products valued using pricing models fall into this category and are categorized within Level 2 of the fair value hierarchy.
Equity Securities. Equity securities traded on U.S. or foreign securities exchanges or included in a national market system are valued at the official closing price at the close of each business day unless otherwise stated below. OTC equity securities and listed securities for which no price is readily available are valued at the average of the last bid and asked prices.
Mutual funds, including investment funds, typically are valued at the NAV reported as of the valuation date.
Securities that are stated at the last reported sales price or closing price on the day of valuation taken from the primary exchange where the security is principally traded and to the extent these securities are actively traded and valuation adjustments are not applied, they are categorized in Level 1 of the fair value hierarchy.
Foreign securities, for which the primary trading market closes at the same time or after the NYSE, are valued based on quotations from the primary market in which they are traded and categorized in Level 1. Because many foreign securities markets and exchanges close prior to the close of the NYSE, closing prices for foreign securities in those markets or on those exchanges do not reflect the events that occur after that close. Certain foreign securities may be fair valued using a pricing service that considers the correlation of the trading patterns of the foreign security to the intra-day trading in the U.S. markets for investments such as American Depositary Receipts, financial futures, Exchange Traded Funds, and the movement of certain indices of securities based on a statistical analysis of their historical relationship; such valuations generally are categorized in Level 2.
Preferred stock, repurchase agreements, and other equities traded on inactive markets or valued by reference to similar instruments are also generally categorized in Level 2.
Transfers from Level 2 to Level 3 occurred generally due to the lack of observable market data due to decreased market activity or information for these securities. Transfers from Level 3 to Level 2 occurred generally due to the increased availability of observable market data due to increased market activity or information. Transfers between levels represent the values as of the beginning of the reporting period.
For fair valuations using unobservable inputs, U.S. GAAP requires a reconciliation of the beginning to ending balances for reported fair values that presents changes attributable to total realized and unrealized gains or losses, purchases and sales, and transfers in or out of the Level 3 category during the period. The beginning of period timing recognition is used for the transfers between Levels of the Funds’ assets and liabilities. In accordance with the requirements of U.S. GAAP, a fair value hierarchy and Level 3 reconciliation, if any, have been included in the Notes to the Schedule of Investments for each respective Fund.
Net realized gain (loss) and net unrealized appreciation (depreciation), shown on the reconciliation of Level 3 investments if applicable, are included on the Statement of Operations in net realized gain (loss) on investments in unaffiliated securities and in net change in unrealized appreciation (depreciation) on investments in unaffiliated securities, respectively. Additionally, the net change in unrealized appreciation for all Level 3 investments still held as of period ended September 30, 2013, if applicable, is included on the Statement of Operations in net change in unrealized appreciation (depreciation) on investments in unaffiliated securities.
SAI-18
The Funds may own different types of assets that are classified as Level 2 or Level 3. Assets classified as Level 2 can have a variety of observable inputs, including, but not limited to, benchmark yields, reported trades, broker quotes, benchmark securities, and bid/offer quotations. These observable inputs are collected and utilized, primarily by an independent pricing service, in different evaluated pricing approaches depending upon the specific asset to determine a value.
The following tables are a summary of the valuation of each Fund’s investments by the fair value hierarchy levels as of September 30, 2013.
| | | | | | | | | | | | |
Ivy Emerging Markets Equity Fund | | Level 1 | | | Level 2 | | | Level 3 | |
Assets | | | | | | | | | | | | |
Investments in Securities | | | | | | | | | | | | |
Common Stocks | | | | | | | | | | | | |
Consumer Discretionary | | $ | 78,653 | | | $ | — | | | $ | — | |
Consumer Staples | | | 37,824 | | | | — | | | | — | |
Energy | | | 18,815 | | | | — | | | | — | |
Financials | | | 150,056 | | | | — | | | | — | |
Health Care | | | 3,628 | | | | — | | | | — | |
Industrials | | | 52,748 | | | | — | | | | — | |
Information Technology | | | 165,340 | | | | — | | | | — | |
Real Estate | | | 127 | | | | — | | | | — | |
Telecommunication Services | | | 43,520 | | | | — | | | | — | |
Utilities | | | 20,681 | | | | — | | | | — | |
| | | | | | | | | | | | |
Total Common Stocks | | $ | 571,392 | | | $ | — | | | $ | — | |
Purchased Options | | | 122 | | | | — | | | | — | |
Corporate Debt Securities | | | — | | | | 122 | | | | — | |
Short-Term Securities | | | — | | | | 13,601 | | | | — | |
| | | | | | | | | | | | |
Total | | $ | 571,514 | | | $ | 13,723 | | | $ | — | |
| | | | | | | | | | | | |
Liabilities | | | | | | | | | | | | |
Written Options | | $ | 4,051 | | | $ | 2,738 | | | $ | — | |
Swap Agreements | | $ | — | | | $ | 471 | | | $ | — | |
As of September 30, 2013, there were no transfers between Level 1 and 2 during the twelve month period.
| | | | | | | | | | | | |
Ivy Asset Strategy New Opportunities Fund | | Level 1 | | | Level 2 | | | Level 3 | |
Assets | | | | | | | | | | | | |
Investments in Securities | | | | | | | | | | | | |
Common Stocks | | | | | | | | | | | | |
Consumer Discretionary | | $ | 27,146 | | | $ | — | | | $ | — | |
Consumer Staples | | | 15,275 | | | | — | | | | — | |
Energy | | | 7,377 | | | | — | | | | — | |
Financials | | | 22,018 | | | | — | | | | — | |
Health Care | | | 5,323 | | | | — | | | | — | |
Industrials | | | 62,613 | | | | — | | | | — | |
Information Technology | | | 32,910 | | | | — | | | | — | |
Materials | | | 12,079 | | | | — | | | | — | |
| | | | | | | | | | | | |
Total Common Stocks | | $ | 184,741 | | | $ | — | | | $ | — | |
Warrants | | | 92 | | | | — | | | | — | |
Purchased Options | | | — | | | | 1,132 | | | | — | |
Corporate Debt Securities | | | — | | | | 740 | | | | — | |
Bullion | | | 18,571 | | | | — | | | | — | |
Short-Term Securities | | | — | | | | 35,240 | | | | — | |
| | | | | | | | | | | | |
Total | | $ | 203,404 | | | $ | 37,112 | | | $ | — | |
| | | | | | | | | | | | |
Liabilities | | | | | | | | | | | | |
Forward Foreign Currency Contracts | | $ | — | | | $ | 55 | | | $ | — | |
Written Options | | $ | — | | | $ | 27 | | | $ | — | |
As of September 30, 2013, there were no transfers between Level 1 and 2 during the twelve month period.
SAI-19
4. DERIVATIVE INSTRUMENTS
The following disclosures contain information on why and how the Funds use derivative instruments, the associated risks of investing in derivative instruments, and how derivative instruments affect the Funds’ financial positions and results of operations when presented by primary underlying risk exposure.
Forward Foreign Currency Contracts. Each Fund may enter into forward foreign currency contracts (“forward contracts”) for the purchase or sale of a foreign currency at a negotiated rate at a future date. Forward contracts are reported on a schedule following the Schedule of Investments. Forward contracts will be valued daily based upon the closing prices of the forward currency rates determined at the close of the NYSE as provided by a bank, dealer or independent pricing service. The resulting unrealized appreciation and depreciation is reported on the Statement of Assets and Liabilities as a receivable or payable and on the Statement of Operations within the change in unrealized appreciation (depreciation). At contract close, the difference between the original cost of the contract and the value at the close date is recorded as a realized gain (loss) on the Statement of Operations.
Risks to a Fund related to the use of such contracts include both market and credit risk. Market risk is the risk that the value of the forward contract will depreciate due to unfavorable changes in the exchange rates. Credit risk arises from the possibility that the counterparty will default. If the counterparty defaults, a Fund’s maximum loss will consist of the aggregate unrealized gain on appreciated contracts that is not collateralized.
Futures Contracts. Each Fund may engage in buying and selling futures contracts. Upon entering into a futures contract, the Fund is required to deposit, in a segregated account, an amount equal to a varying specified percentage of the contract amount. This amount is known as the initial margin. Subsequent payments (variation margins) are made or received by the Fund each day, dependent on the daily fluctuations in the value of the underlying debt security or index.
Futures contracts are reported on a schedule following the Schedule of Investments. Securities held in collateralized accounts to cover initial margin requirements on open futures contracts are identified on the Schedule of Investments. Cash held by the broker to cover initial margin requirements on open futures contracts and the receivable and/or payable for the daily mark to market for the variation margin are noted on the Statement of Assets and Liabilities. The net change in unrealized appreciation (depreciation) is reported on the Statement of Operations. Realized gains (losses) are reported on the Statement of Operations at the closing or expiration of futures contracts.
Risks of entering into futures contracts include the possibility of loss of securities or cash held as collateral, that there may be an illiquid market where the Fund is unable to close the contract or enter into an offsetting position and, if used for hedging purposes, the risk that the price of the contract will correlate imperfectly with the prices of the Fund’s securities.
Option Contracts. Options purchased by a Fund are accounted for in the same manner as marketable portfolio securities. The cost of portfolio securities acquired through the exercise of call options is increased by the premium paid to purchase the call. The proceeds from securities sold through the exercise of put options are decreased by the premium paid to purchase the put.
When a Fund writes (sells) an option, an amount equal to the premium received by the Fund is recorded as a liability. The amount of the liability is subsequently adjusted to reflect the current value of the option written. When an option expires on its stipulated expiration date or a Fund enters into a closing purchase transaction, the Fund realizes a gain (or loss if the cost of a closing purchase transaction exceeds the premium received when the call option was sold), and the liability related to such option is extinguished. When a call option is exercised, the premium is added to the proceeds from the sale of the underlying security in determining whether a Fund has realized a gain or loss. For each Fund, when a written put is exercised, the cost basis of the securities purchased by a Fund is reduced by the amount of the premium received.
Investments in options, whether purchased or written, involve certain risks. Writing put options and purchasing call options may increase a Fund’s exposure to the underlying security (or basket of securities). With written options, there may be times when a Fund will be required to purchase or sell securities to meet its obligation under the option contract where the required action is not beneficial to the Fund, due to unfavorable movement of the market price of the underlying security (or basket of securities). Additionally, to the extent a Fund enters into OTC option transactions with counterparties, the Fund will be exposed to the risk that counterparties to these OTC transactions will be unable to meet their obligations under the terms of the transaction.
SAI-20
Swap Agreements. Each Fund may invest in swap agreements.
Total return swaps involve a commitment to pay periodic interest payments in exchange for a market-linked return based on a security or a basket of securities representing a variety of securities or a particular index. To the extent the total return of the security, index or other financial measure underlying the transaction exceeds or falls short of the offsetting interest rate obligation, the Fund will receive a payment from or make a payment to the counterparty.
The creditworthiness of firms with which a Fund enters into a swap agreement is monitored by IICO. If a firm’s creditworthiness declines, the value of the agreement would likely decline, potentially resulting in losses. If a default occurs by the counterparty to such a transaction, the Fund will have contractual remedies pursuant to the agreement related to the transaction. The maximum loss a Fund may incur consists of the aggregate unrealized gain on appreciated contracts that is not collateralized.
Collateral and rights of offset. A Fund may mitigate credit risk with respect to OTC derivative counterparties through credit support annexes (“CSA”) included with an International Swaps and Derivatives Association, Inc. (“ISDA”) Master Agreement which is the standard contract governing most derivative transactions between the Fund and each of its counterparties. The CSA allows the Fund and its counterparty to offset certain derivative financial instruments’ payables and/or receivables against each other and/or with collateral, which is generally held by the Fund’s custodian. The amount of collateral moved to/from applicable counterparties is based upon minimum transfer amounts specified in the CSA. To the extent amounts due to the Fund from its counterparties are not fully collateralized contractually or otherwise, the Fund bears the risk of loss from counterparty non-performance. See Note 2 “Segregation and Collateralization” for additional information with respect to collateral practices.
Offsetting of Assets and Liabilities. Financial Accounting Standards Board (“FASB”) Accounting Standards Update 2011-11, Disclosures about Offsetting Assets and Liabilities, requires an entity that has financial instruments that are either (1) offset or (2) subject to an enforceable master netting arrangement or similar agreement to disclose information about offsetting and related arrangements to enable users of its financial statements to understand the effect of those arrangements on its financial position.
The following tables present the offsetting of assets and liabilities as of September 30, 2013:
Assets
| | | | | | | | | | | | | | | | | | | | | | | | | | | | |
| | | | Gross Amounts Not Offset on the
Statement of Assets and Liabilities | |
Fund | | Gross
Amounts of
Recognized
Assets | | | Gross
Amounts
Offset on the
Statement of
Assets and
Liabilities | | | Net Amounts
of Assets
Presented on
the Statement
of Assets and
Liabilities | | | Financial
Instruments
and
Derivatives
Available
for Offset | | | Non-Cash
Collateral
Received | | | Cash
Collateral
Received | | | Net
Amount | |
Ivy Asset Strategy New Opportunities Fund | | | | | | | | | | | | | | | | | | | | | | | | | | | | |
Investments in unaffiliated securities at value* | | $ | 1,132 | | | $ | — | | | $ | 1,132 | | | $ | (27 | ) | | $ | — | | | $ | — | | | $ | 1,105 | |
| * | Purchased options are reported as investments in unaffiliated securities on the Statement of Assets and Liabilities. |
Liabilities
| | | | | | | | | | | | | | | | | | | | | | | | | | | | |
| | | | Gross Amounts Not Offset on the
Statement of Assets and Liabilities | |
Fund | | Gross
Amounts of
Recognized
Liabilities | | | Gross
Amounts
Offset on the
Statement of
Assets and
Liabilities | | | Net Amounts
of Liabilities
Presented on
the Statement
of Assets and
Liabilities | | | Financial
Instruments
and
Derivatives
Available
for Offset | | | Non-Cash
Collateral
Pledged | | | Cash
Collateral
Pledged | | | Net
Amount | |
Ivy Emerging Markets Equity Fund | | | | | | | | | | | | | | | | | | | | |
Written options at value | | $ | 2,738 | | | $ | — | | | $ | 2,738 | | | $ | — | | | $ | (2,738 | ) | | $ | — | | | $ | — | |
Unrealized depreciation on swap agreements | | | 471 | | | | — | | | | 471 | | | | — | | | | — | | | | (320 | ) | | | 151 | |
| | | | | | | | | | | | | | | | | | | | | | | | | | | | |
Total | | $ | 3,209 | | | $ | — | | | $ | 3,209 | | | $ | — | | | $ | (2,738 | ) | | $ | (320 | ) | | $ | 151 | |
| | | | | | | | | | | | | | | | | | | | | | | | | | | | |
Ivy Asset Strategy New Opportunities Fund | | | | | | | | | | | | | | | | | | | | |
Written options at value | | $ | 27 | | | $ | — | | | $ | 27 | | | $ | (27 | ) | | $ | — | | | $ | — | | | $ | — | |
Unrealized depreciation on forward foreign currency | | | 55 | | | | — | | | | 55 | | | | — | | | | — | | | | — | | | | 55 | |
| | | | | | | | | | | | | | | | | | | | | | | | | | | | |
Total | | $ | 82 | | | $ | — | | | $ | 82 | | | $ | (27 | ) | | $ | — | | | $ | — | | | $ | 55 | |
| | | | | | | | | | | | | | | | | | | | | | | | | | | | |
SAI-21
Additional Disclosure Related to Derivative Instruments
Fair values of derivative instruments as of the twelve month period ended September 30, 2013:
| | | | | | | | | | | | | | |
| | | Assets | | | Liabilities | |
Fund | | Type of
Risk
Exposure | | Statement of Assets &
Liabilities Location | | Value | | | Statement of Assets &
Liabilities Location | | Value | |
Ivy Emerging Markets Equity Fund | | Equity | | Investments in unaffiliated
securities at value* | | $ | 122 | | | Unrealized depreciation
on swap agreements | | $ | 471 | |
| | | Equity | | | | | | | | Written options at value | | | 6,789 | |
Ivy Asset Strategy New Opportunities Fund | | Equity | | Investments in unaffiliated
securities at value* | | | 1,132 | | | Written options at value | | | 27 | |
| | | Foreign
currency | | | | | | | | Unrealized depreciation
on forward foreign
currency contracts | | | 55 | |
| * | Purchased options are reported as investments in unaffiliated securities and are reflected in the accompanying Schedule of Investments. |
Amount of realized gain (loss) on derivatives recognized on the Statement of Operations for the twelve month period ended September 30, 2013:
| | | | | | | | | | | | | | | | | | | | | | | | | | |
| | | Net realized gain (loss) on: | |
Fund | | Type of Risk
Exposure | | Investments
in
unaffiliated
securities* | | | Swap
agreements | | | Futures
contracts | | | Written
options | | | Forward
foreign
currency
contracts | | | Total | |
Ivy Emerging Markets Equity Fund | | Equity | | $ | 607 | | | $ | 867 | | | $ | — | | | $ | 534 | | | $ | — | | | $ | 2,008 | |
| | | Foreign currency | | | — | | | | — | | | | — | | | | — | | | | (2,948 | ) | | | (2,948 | ) |
Ivy Asset Strategy New Opportunities Fund | | Commodity | | | — | | | | — | | | | (1,822 | ) | | | — | | | | — | | | | (1,822 | ) |
| | Equity | | | 70 | | | | — | | | | — | | | | 87 | | | | — | | | | 157 | |
| | Foreign currency | | | — | | | | — | | | | — | | | | — | | | | (652 | ) | | | (652 | ) |
| * | Purchased options are reported as investments in unaffiliated securities and are reflected in the accompanying Schedule of Investments. |
Change in unrealized appreciation (depreciation) on derivatives recognized on the Statement of Operations for the twelve month period ended September 30, 2013:
| | | | | | | | | | | | | | | | | | | | | | | | | | |
| | | Net change in unrealized appreciation (depreciation) on: | |
Fund | | Type of Risk
Exposure | | Investments
in
unaffiliated
securities* | | | Swap
agreements | | | Futures
contracts | | | Written
options | | | Forward
foreign
currency
contracts | | | Total | |
Ivy Emerging Markets Equity Fund | | Equity | | $ | (21 | ) | | $ | (422 | ) | | $ | — | | | $ | (4,644 | ) | | $ | — | | | $ | (5,087 | ) |
Ivy Asset Strategy New Opportunities Fund | | Equity | | | (588 | ) | | | — | | | | — | | | | 67 | | | | — | | | | (521 | ) |
| | Foreign currency | | | — | | | | — | | | | — | | | | — | | | | (16 | ) | | | (16 | ) |
| * | Purchased options are reported as investments in unaffiliated securities and are reflected on the accompanying Schedule of Investments. |
During the twelve month period ended September 30, 2013, the average derivative volume was as follows:
| | | | | | | | | | | | | | | | | | | | | | | | | | | | |
Fund | | Long
forward
contracts1 | | | Short
forward
contracts1 | | | Long
futures
contracts1 | | | Short
futures
contracts1 | | | Swap
agreements2 | | | Purchased
options1 | | | Written
options1 | |
Ivy Emerging Markets Equity Fund | | $ | 7,692 | | | $ | 7,870 | | | $ | — | | | $ | — | | | $ | 3,435 | | | $ | 224 | | | $ | 1,440 | |
Ivy Asset Strategy New Opportunities Fund | | | 9,278 | | | | 9,298 | | | | — | | | | — | | | | — | | | | 381 | | | | 5 | |
| 1 | Average value outstanding during the period. |
| 2 | Average notional amount outstanding during the period. |
SAI-22
Objectives and Strategies
Ivy Emerging Markets Equity Fund. The Fund’s objectives in using derivatives during the period included managing the exposure to various foreign currencies, hedging certain event risks on positions held by the Fund and gaining exposure to certain individual securities that are not available for direct purchase. To manage foreign currency exposure, the Fund utilized forward contracts to either increase or decrease exposure to a given currency. To hedge event risk, the Fund utilized options, both written and purchased, on individual equity securities. To gain exposure to certain individual securities, the Fund utilized total return swaps.
Ivy Asset Strategy New Opportunities Fund. The Fund’s objectives in using derivatives during the period included hedging market risk on equity securities and managing the exposure to various foreign currencies. To achieve the objective of hedging market risk, the Fund utilized option contracts, both written and purchased, on individual equity securities and foreign equity indices. To manage foreign currency exposure, the Fund utilized forward contracts to either increase or decrease exposure to a given currency.
5. BASIS FOR CONSOLIDATION
Ivy ASNO II, Ltd. (the “Subsidiary”), a Cayman Islands exempted company, was incorporated as a wholly owned subsidiary acting as an investment vehicle for the Ivy Asset Strategy New Opportunities Fund (referred to as “the Fund” in this sub-section). The Subsidiary acts as an investment vehicle for a Fund in order to effect certain investments for the Fund consistent with the Fund’s investment objectives and policies as specified in its prospectus and statement of additional information.
The Fund’s investment portfolio has been consolidated and includes the portfolio holdings of the Fund and its Subsidiary. The consolidated financial statements include the accounts of the Fund and its Subsidiary. All inter-company transactions and balances have been eliminated. A subscription agreement was entered into between the Fund and its Subsidiary comprising the entire issued share capital of the Subsidiary with the intent that the Fund will remain the sole shareholder and retain all rights. Under the Articles of Association, shares issued by the Subsidiary confer upon a shareholder the right to receive notice of, to attend and to vote at general meetings of the Subsidiary and shall confer upon the shareholder rights in a winding-up or repayment of capital and the right to participate in the profits or assets of the Subsidiary.
See the table below for details regarding the structure, incorporation and relationship as of September 30, 2013 of the Subsidiary to the Fund (amounts in thousands).
| | | | | | | | | | | | | | | | | | | | |
Subsidiary | | Date of
Incorporation | | | Subscription
Agreement | | | Fund Net
Assets | | | Subsidiary
Net Assets | | | Percentage
of Fund
Net Assets | |
Ivy ASNO II, Ltd. | | | 1-31-13 | | | | 4-10-13 | | | $ | 251,223 | | | $ | 26,070 | | | | 10.38 | % |
6. BASIS OF COMBINATION
The Board of Trustees of the Trust at a meeting held on November 12, 2013 unanimously approved the reorganization, in which the Ivy Emerging Markets Equity Fund series of the Trust will acquire all of the assets and assume all of the liabilities of the Ivy Asset Strategy New Opportunities Fund in exchange for an equal aggregate NAV of newly issued shares of beneficial interest of the Ivy Emerging Markets Equity Fund series of the Trust (the Reorganization). As contemplated under the Reorganization, the Ivy Asset Strategy New Opportunities Fund will distribute Ivy Emerging Markets Equity Fund shares of beneficial interest to its shareholders, after which it will liquidate and cease to be a series of the Trust. Under the Reorganization, shareholders of each class of shares of the Ivy Asset Strategy New Opportunities Fund will receive shares of the same class in the Ivy Emerging Markets Equity Fund that they currently own. The aggregate NAV of Ivy Emerging Markets Equity Fund shares received by the Ivy Asset Strategy New Opportunities Fund shareholders in the Reorganization will be equal to the aggregate NAV of the shareholders’ current shares of the Ivy Asset Strategy New Opportunities Fund held on the business day prior to closing of the Reorganization, less the costs of the Reorganization attributable to their common shares. The Ivy Emerging Markets Equity Fund will continue to operate after the Reorganization as a separate series of the Trust.
The Reorganization is intended to be accounted for as a tax-free reorganization of investments companies. The unaudited Pro Forma Combined Schedule of Investments and Combined Statement of Assets and Liabilities reflect the financial position of the Funds at September 30, 2013 and assumes the merger occurred on that date. The unaudited Pro Forma Combined Statement of Operations reflects the results of operations of the Funds for the twelve months ended September 30, 2013 and assumes the merger occurred at the beginning of the period. These statements have been derived from the books and records of the Funds at the dates indicated above in conformity with U.S. GAAP. As of September 30, 2013, the portfolio of securities held by the Ivy Asset Strategy New Opportunities Fund complied with the fundamental investment restrictions of the Ivy Emerging Markets Equity Fund, and the Funds’ investment objectives were the same. The historical cost basis of investment securities is expected to be carried forward to the surviving entity. The fiscal year end for the Funds is March 31.
SAI-23
The accompanying pro forma combined financial statements should be read in conjunction with the historical financial statements of the Funds incorporated by reference in the Reorganization Statement of Additional Information. Such pro forma combined financial statements are presented for information only and may not necessarily be representative of what the actual combined financial statements would have been had the Reorganization occurred on September 30, 2013. Following the Reorganization, the Ivy Emerging Markets Equity Fund will be the accounting survivor.
Certain expenses of the Reorganization, estimated to be $129, will be borne by the Ivy Asset Strategy New Opportunities Fund.
7. INVESTMENT MANAGEMENT AND PAYMENTS TO AFFILIATED PERSONS
Management Fees. IICO, a wholly owned subsidiary of Waddell & Reed Financial, Inc. (“WDR”), serves as each Fund’s investment manager. The management fee is accrued daily by each Fund at the following annual rates as a percentage of average daily net assets:
| | | | | | |
Fund | | Net Asset Breakpoints | | Annual Rate | |
Ivy Emerging Markets Equity Fund | | $0 to $250 Million | | | 1.00 | % |
(pre and post merger) | | $250 to $500 Million | | | 1.00 | % |
| | $500 to $1,000 Million | | | 0.85 | % |
| | $1,000 to $1,500 Million | | | 0.83 | % |
| | $1,500 to $2,000 Million | | | 0.83 | % |
| | $2,000 to $3,000 Million | | | 0.80 | % |
| | $3,000 to $5,000 Million | | | 0.76 | % |
| | $5,000 to $6,000 Million | | | 0.76 | % |
| | Over $6,000 Million | | | 0.76 | % |
| | |
Ivy Asset Strategy New Opportunities Fund | | $0 to $500 Million | | | 1.00 | % |
| | $500 to $1,000 Million | | | 0.85 | % |
| | $1,000 to $2,000 Million | | | 0.83 | % |
| | $2,000 to $3,000 Million | | | 0.80 | % |
| | Over $3,000 Million | | | 0.76 | % |
Accounting Services Fees. The Trust has an Accounting Services Agreement with WRSCO, doing business as WI Services Company (“WISC”), an indirect subsidiary of WDR. Under the agreement, WISC acts as the agent in providing bookkeeping and accounting services and assistance to the Trust, including maintenance of Fund records, pricing of Fund shares and preparation of certain shareholder reports. For these services, each Fund pays WISC a monthly fee of one-twelfth of the annual fee based on the average net asset levels shown in the following table:
| | | | | | | | | | | | | | | | | | | | | | | | | | | | | | | | | | | | | | | | |
(M—Millions) | | $0 to
$10M | | | $10 to
$25M | | | $25 to
$50M | | | $50 to
$100M | | | $100 to
$200M | | | $200 to
$350M | | | $350 to
$550M | | | $550 to
$750M | | | $750 to
$1,000M | | | Over
$1,000M | |
Annual Fee Rate | | $ | 0.00 | | | $ | 11.50 | | | $ | 23.10 | | | $ | 35.50 | | | $ | 48.40 | | | $ | 63.20 | | | $ | 82.50 | | | $ | 96.30 | | | $ | 121.60 | | | $ | 148.50 | |
In addition, for each class of shares in excess of one, each Fund pays WISC a monthly per-class fee equal to 2.5% of the monthly accounting services base fee.
Administrative Fee. Each Fund also pays WISC a monthly fee at the annual rate of 0.01%, or one basis point, for the first $1 billion of net assets with no fee charged for net assets in excess of $1 billion. This fee is voluntarily waived by WISC until a Fund’s net assets are at least $10 million and is included in “Accounting services fee” on the Statement of Operations.
Shareholder Servicing. General. Under the Shareholder Servicing Agreement between the Trust and WISC, with respect to Class A, Class B, Class C and Class E shares, for each shareholder account that was in existence at any time during the prior month, each Fund pays a monthly fee that ranges from $1.5042 to $1.6958 per account; however, WISC has agreed to reduce that fee if the number of total shareholder accounts within the Complex (Waddell & Reed Advisors Funds, InvestEd Portfolios and Ivy Funds) reaches certain levels. Effective June 6, 2011 for Class R shares, each Fund pays a monthly fee equal to one-twelfth of 0.25 of 1% of the average daily net assets of the class for the preceding month. Prior to June 6, 2011 the fee was 0.20 of 1%. For Class I and Class Y shares, each Fund pays a monthly fee equal to one-twelfth of 0.15 of 1% of the average daily net assets of the class for the preceding month. Each Fund also reimburses WISC for certain out-of-pocket costs for all classes.
Networked accounts. For certain networked accounts (that is, those accounts whose Fund shares are purchased through certain financial intermediaries), WISC has agreed to reduce its per account fees charged to the Funds to $0.50 per month per
SAI-24
shareholder account. Additional fees may be paid by the Funds to those intermediaries. If the aggregate annual rate of the WISC transfer agent fee and the costs charged by the financial services companies exceeds $18.00 per account for a Fund, WISC will reimburse the Fund the amount in excess of $18.00.
Broker accounts. Certain broker-dealers that maintain shareholder accounts with each Fund through an omnibus account provide transfer agent and other shareholder-related services that would otherwise be provided by WISC if the individual accounts that comprise the omnibus account were opened by their beneficial owners directly. Each Fund may pay such broker-dealers a per account fee for each open account within the omnibus account, or a fixed rate fee, based on the average daily net asset value of the omnibus account (or a combination thereof).
Distribution and Service Plan. Class A and Class E Shares. Under a Distribution and Service Plan adopted by the Trust pursuant to Rule 12b–1 under the 1940 Act (the “Distribution and Service Plan”), each Fund, other than Ivy Money Market Fund, may pay a distribution and/or service fee to Ivy Funds Distributors, Inc. (“IFDI”) for Class A and Class E shares in an amount not to exceed 0.25% of the Fund’s average annual net assets. The fee is to be paid to compensate IFDI for amounts it expends in connection with the distribution of the Class A and Class E shares and/or provision of personal services to Fund shareholders and/or maintenance of shareholder accounts of that class.
Class B and Class C Shares. Under the Distribution and Service Plan, each Fund may pay IFDI a service fee not to exceed 0.25% and a distribution fee not to exceed 0.75% of the Fund’s average annual net assets for Class B and Class C shares to compensate IFDI for its services in connection with the distribution of shares of that class and/or provision of personal services to Class B or Class C shareholders and/or maintenance of shareholder accounts of that class.
Class R Shares. Under the Distribution and Service Plan, each Fund may pay IFDI a fee of up to 0.50%, on an annual basis, of the average daily net assets of the Fund’s Class R shares to compensate IFDI for, either directly or through third parties, distributing the Class R shares of that Fund, providing personal services to Class R shareholders and/or maintaining Class R shareholder accounts.
Class Y Shares. Under the Distribution and Service Plan, each Fund may pay IFDI a fee of up to 0.25%, on an annual basis, of the average daily net assets of the Fund’s Class Y shares to compensate IFDI for, either directly or through third parties, distributing the Class Y shares of that Fund, providing personal services to Class Y shareholders and/or maintaining Class Y shareholder accounts.
Sales Charges. As principal underwriter for the Trust’s shares, IFDI receives sales commissions (which are not an expense of the Trust) for sales of Class A and Class E shares. A CDSC may be assessed against a shareholder’s redemption amount of Class B, Class C or certain Class A and Class E shares and is paid to IFDI. During the twelve months ended September 30, 2013, IFDI received the following amounts in sales commissions and CDSCs:
| | | | | | | | | | | | | | | | | | | | | | | | |
| | | Gross Sales
Commissions | | | CDSC | | | Commissions
Paid1 | |
| | | | Class A | | | Class B | | | Class C | | | Class E | | |
Ivy Emerging Markets Equity Fund | | $ | 364 | | | $ | 1 | | | $ | 8 | | | $ | 2 | | | $ | — | | | $ | 376 | |
Ivy Asset Strategy New Opportunities Fund | | | 146 | | | | — | * | | | 25 | | | | 5 | | | | — | | | | 189 | |
| * | Not shown due to rounding. |
| 1 | IFDI reallowed/paid this portion of the sales charge to financial advisors and selling broker-dealers. |
SAI-25
Expense Reimbursements and/or Waivers. Fund and class expense limitations and related waivers/reimbursements for the twelve months ended September 30, 2013 were as follows:
| | | | | | | | | | | | |
Fund Name | | Share
Class
Name | | Type of
Expense
Limit | | Commencement
Date | | End Date | | Expense Limit | | Expense Reduced |
Ivy Emerging Markets Equity Fund | | Class Y | | Contractual | | 8-1-2011 | | 7-31-2015 | | Not to exceed Class A | | N/A |
Ivy Asset Strategy New Opportunities Fund | | Class A | | Contractual | | 5-3-2010 | | 7-31-2015 | | 1.50% | | 12b-1 Fees and/or Shareholder Servicing |
| | Class I | | Contractual | | 5-3-2010 | | 7-31-2015 | | 1.25% | | Shareholder Servicing |
| | | Class Y | | Contractual | | 8-1-2011 | | 7-31-2015 | | Not to exceed Class A | | 12b-1 Fees and/or Shareholder Servicing |
Acquiring Fund ProForma | | Class A | | Contractual | | Effective Date of Merger | | 7-31-2016 | | 1.50% | | 12b-1 Fees and/or Shareholder Servicing |
| | Class B | | Contractual | | Effective Date of Merger | | 7-31-2016 | | 2.50% | | 12b-1 Fees and/or Shareholder Servicing |
| | | Class Y | | Contractual | | Effective Date of Merger | | 7-31-2015 | | Not to exceed Class A | | 12b-1 Fees and/or Shareholder Servicing |
Any amounts due to the Funds as a reimbursement but not paid as of September 30, 2013 are shown as a receivable from affiliates on the Statement of Assets and Liabilities.
8. CAPITAL SHARE TRANSACTIONS
The Trust has authorized an unlimited number of $0.001 par value shares of beneficial interest of each class of each Fund. Transactions in shares of beneficial interest were as follows:
| | | | | | | | |
| | | For the twelve months ended
September 30, 2013 | |
Ivy Emerging Markets Equity Fund | | Shares | | | Value | |
Shares issued from sale of shares: | | | | | | | | |
Class A | | | 8,413 | | | $ | 116,529 | |
Class B | | | 92 | | | | 1,098 | |
Class C | | | 165 | | | | 2,042 | |
Class E | | | — | | | | — | * |
Class I | | | 762 | | | | 10,752 | |
Class R | | | 36 | | | | 513 | |
Class Y | | | 94 | | | | 1,313 | |
Shares issued in reinvestment of distributions to shareholders: | | | | | | | | |
Class A | | | 244 | | | | 3,408 | |
Class B | | | — | | | | 3 | |
Class C | | | 3 | | | | 41 | |
Class E | | | — | | | | — | |
Class I | | | 109 | | | | 1,563 | |
Class R | | | — | | | | — | |
Class Y | | | 4 | | | | 49 | |
Shares redeemed: | | | | | | | | |
Class A | | | (15,142 | ) | | | (207,618 | ) |
Class B | | | (327 | ) | | | (3,752 | ) |
Class C | | | (525 | ) | | | (6,334 | ) |
Class E | | | — | | | | — | |
Class I | | | (2,255 | ) | | | (31,851 | ) |
Class R | | | (18 | ) | | | (259 | ) |
Class Y | | | (219 | ) | | | (3,118 | ) |
| | | | | | | | |
Net decrease | | | (8,564 | ) | | $ | (115,621 | ) |
| | | | | | | | |
| * | Not shown due to rounding. |
SAI-26
| | | | | | | | |
| | | For the twelve months ended
September 30, 2013 | |
Ivy Asset Strategy New Opportunities Fund | | Shares | | | Value | |
Shares issued from sale of shares: | | | | | | | | |
Class A | | | 5,740 | | | $ | 61,550 | |
Class B | | | 52 | | | | 546 | |
Class C | | | 482 | | | | 5,044 | |
Class E | | | 10 | | | | 115 | |
Class I | | | 1,021 | | | | 11,043 | |
Class R | | | 79 | | | | 872 | |
Class Y | | | 548 | | | | 5,766 | |
Shares issued in reinvestment of distributions to shareholders: | | | | | | | | |
Class A | | | 92 | | | | 957 | |
Class B | | | — | | | | — | |
Class C | | | 1 | | | | 11 | |
Class E | | | — | | | | — | |
Class I | | | 25 | | | | 259 | |
Class R | | | — | | | | — | |
Class Y | | | 5 | | | | 56 | |
Shares redeemed: | | | | | | | | |
Class A | | | (8,072 | ) | | | (86,099 | ) |
Class B | | | (183 | ) | | | (1,908 | ) |
Class C | | | (2,253 | ) | | | (23,520 | ) |
Class E | | | (10 | ) | | | (114 | ) |
Class I | | | (3,118 | ) | | | (33,399 | ) |
Class R | | | (76 | ) | | | (836 | ) |
Class Y | | | (248 | ) | | | (2,655 | ) |
| | | | | | | | |
Net decrease | | | (5,905 | ) | | $ | (63,312 | ) |
| | | | | | | | |
9. CAPITAL SHARES
The pro forma NAV per share assumes the issuance of shares of the Acquiring Fund that would have been issued at September 30, 2013, in connection with proposed reorganization. The number of shares assumed to be issued is equal to the NAV of shares of the Acquired Fund, as of September 30, 2013, divided by the NAV per share of the shares of the Acquiring Fund as of September 30, 2013. The pro forma number of shares outstanding, by class, for the combined fund consists of the following at September 30, 2013:
| | | | | | | | | | | | |
Class of Shares | | Shares of
Acquiring Fund
Pre-Combination | | | Additional Shares
Assumed Issued in
Reorganization | | | Total Outstanding
Shares Post-
Combination | |
Class A | | | 29,742 | | | | 11,423 | | | | 41,165 | |
Class B | | | 513 | | | | 407 | | | | 920 | |
Class C | | | 1,067 | | | | 3,256 | | | | 4,323 | |
Class E | | | 8 | | | | 8 | | | | 16 | |
Class I | | | 9,477 | | | | 2,706 | | | | 12,183 | |
Class R | | | 18 | | | | 43 | | | | 61 | |
Class Y | | | 303 | | | | 565 | | | | 868 | |
10. FEDERAL INCOME TAX MATTERS
For Federal income tax purposes, cost of investments owned at September 30, 2013 and the related unrealized appreciation (depreciation) were as follows:
| | | | | | | | | | | | | | | | |
Fund | | Cost of
investments | | | Gross
appreciation | | | Gross
depreciation | | | Net unrealized
appreciation | |
Ivy Emerging Markets Equity Fund | | $ | 503,064 | | | $ | 97,466 | | | $ | 15,293 | | | $ | 82,173 | |
Ivy Asset Strategy New Opportunities Fund | | | 216,179 | | | | 36,397 | | | | 12,060 | | | | 24,337 | |
SAI-27
The tax cost of investments will remain unchanged for the combined fund.
For Federal income tax purposes, the Funds’ distributed and undistributed earnings and profit for the fiscal year ended March 31, 2013 and the post-October and late-year ordinary activity updated with information available through the date of this report were as follows:
| | | | | | | | |
| | | Ivy
Emerging
Markets
Equity Fund | | | Ivy Asset
Strategy New
Opportunities
Fund | |
Distributed Ordinary Income | | $ | 5,114 | | | $ | 1,483 | |
Undistributed Ordinary Income | | | 181 | | | | — | |
Distributed Long-Term Capital Gains | | | — | | | | — | |
Undistributed Long-Term Capital Gains | | | — | | | | — | |
Tax Return of Capital | | | — | | | | — | |
Post-October Capital Losses Deferred | | | — | | | | 2,654 | |
Late-Year Ordinary Losses Deferred | | | — | | | | 1,728 | |
Internal Revenue Code regulations permit each Fund to elect to defer into its next fiscal year capital losses incurred between each November 1 and the end of its fiscal year. Each Fund is also permitted to defer into its next fiscal year late-year ordinary losses that arise from the netting of activity generated between each November 1 and the end of its fiscal year on certain specified ordinary items.
Accumulated capital losses represent net capital loss carryovers as of September 30, 2013 that may be available to offset future realized capital gains and thereby reduce future capital gains distributions. Under the Regulated Investment Company Modernization Act of 2010 (the “Modernization Act”), a Fund is permitted to carry forward capital losses incurred in taxable years beginning after December 22, 2010 for an unlimited period. Any losses incurred during those future taxable years will be required to be utilized prior to any losses incurred in pre-enactment taxable years which have only an eight year carryforward period. As a result of this ordering rule, pre-enactment capital loss carryovers may expire unused. Additionally, post-enactment capital losses that are carried forward will retain their character as either short-term or long-term capital losses rather than being considered all short-term as under the previous law. The Fund’s first fiscal year end subject to the Modernization Act is March 31, 2012. The following table shows the expiration dates for capital loss carryovers from pre-enactment taxable years and the amounts of capital loss carryovers, if any, by each of the applicable Funds electing to be taxed as a RIC during the year ended September 30, 2013:
| | | | | | | | | | | | | | | | | | | | | | | | | | | | | | | | |
| | | Pre-Enactment | | | Post-Enactment | |
Fund | | 2014 | | | 2015 | | | 2016 | | | 2017 | | | 2018 | | | 2019 | | | Short-Term
Capital Loss
Carryover | | | Long-Term
Capital Loss
Carryover | |
Ivy Emerging Markets Equity Fund | | $ | — | | | $ | — | | | $ | — | | | $ | — | | | $ | — | | | $ | — | | | $ | 32,189 | | | $ | 22,414 | |
Ivy Asset Strategy New Opportunities Fund | | | — | | | | — | | | | — | | | | — | | | | — | | | | 606 | | | | 48,200 | | | | 28,017 | |
SAI-28
REGISTRATION STATEMENT
Ivy Funds
PART C
OTHER INFORMATION
Reference is made to Article VII of the Trust Instrument of the Registrant, filed by EDGAR on January 29, 2010 as Exhibit (a)(1) to Post-Effective Amendment No. 65 and to Article VI of the Distribution Agreement, filed by EDGAR on January 29, 2010 as Exhibit (e)(1) to Post-Effective Amendment No. 65, each of which provides indemnification. Also refer to Section 3817 of the Delaware Statutory Trust Act.
Registrant undertakes to carry out all indemnification provisions of its Trust Instrument, Bylaws, and the above-described contracts in accordance with the Investment Company Act Release No. 11330 (September 4, 1980) and successor releases.
Insofar as indemnification for liability arising under the 1933 Act, as amended, may be provided to directors, officers and controlling persons of the Registrant pursuant to the foregoing provisions, or otherwise, the Registrant has been advised that in the opinion of the Securities and Exchange Commission such indemnification is against public policy as expressed in the Act and is, therefore unenforceable. In the event that a claim for indemnification against such liabilities (other than the payment by the Registrant of expenses incurred or paid by a director, officer of controlling person of the Registrant in the successful defense of any action, suit or proceeding) is asserted by such director, officer, or controlling person in connection with the securities being registered, the Registrant will, unless in the opinion of its counsel the matter has been settled by controlling precedent, submit to a court of appropriate jurisdiction the question whether such indemnification by it is against public policy as expressed in the Act and will be governed by the final adjudication of such issue.
| | (1)(a) | Declaration of Trust for Ivy Funds, dated November 13, 2008, filed with Post-Effective Amendment No. 65 to the Registration Statement on Form N-1A, and incorporated by reference herein. |
| | (1)(b) | Schedule A to Declaration of Trust, amended and effective November 12, 2013, filed with Post-Effective Amendment No. 90 to the Registration Statement on Form N-1A, and incorporated by reference herein. |
| | (2) | By-laws for Ivy Funds, dated November 13, 2008, filed with Post-Effective Amendment No. 65 to the Registration Statement on Form N-1A, and incorporated by reference herein. |
| | (4) | Agreement and Plan of Reorganization, filed with this Pre-Effective Amendment No. 1 as Appendix A to Part A. |
| | (5) | Articles III, V, VI and VII of the Trust Instrument and Articles II and VI of the Bylaws each define the rights of shareholders. |
| | (6)(a) | Investment Management Agreement between Ivy Funds and Ivy Investment Management Company on behalf of each of the series of the Trust, as amended February 11, 2010, filed with Post-Effective Amendment No. 68 to the Registration Statement on Form N-1A, and incorporated by reference herein. |
| | (6)(b) | Appendix A to the Investment Management Agreement between Ivy Funds and Ivy Investment Management Company, amended and effective November 12, 2013, filed with Post-Effective Amendment No. 90 to the Registration Statement on Form N-1A, and incorporated by reference herein. |
| | (6)(c) | Appendix B to the Investment Management Agreement between Ivy Funds and Ivy Investment Management Company, amended and effective November 12, 2013, filed with Post-Effective Amendment No. 90 to the Registration Statement on Form N-1A, and incorporated by reference herein. |
| | (7) | Ivy Funds Distributor, Inc. (IFDI) has served as principal underwriter and distributor to the Funds. Pursuant to the Principal Underwriting Agreement, IFDI offers the Fund’s shares through financial advisors of Waddell & Reed, Inc. and Legend Equities Corporation (Legend) and sales managers and through other broker-dealers, banks and other appropriate intermediaries (the sales force). |
| | | The information contained in the underwriter’s application on Form BD, as filed on January 18, 2013, SEC No. 8-27030, under the Securities Exchange Act of 1934, is herein incorporated by reference. |
| | | No compensation was paid by the Registrant to any principal underwriter who is not an affiliated person of the Registrant or an affiliated person of such affiliated person. |
| | (9)(a) | Custody Agreement between The Bank of New York Mellon and Ivy Funds, dated March 9, 2012, filed with Post-Effective Amendment No. 73 to the Registration Statement on Form N-1A, and incorporated by reference herein. |
| | (9)(b) | Foreign Custody Manager Agreement between Ivy Funds and The Bank of New York Mellon, dated March 9, 2012, filed with Post-Effective Amendment No. 82 to the Registration Statement on Form N-1A, and incorporated by reference herein. |
| | (9)(c) | Schedule I to the Custody Agreement between Ivy Funds and The Bank of New York Mellon, amended and effective November 12, 2013, filed with Post-Effective Amendment No. 90 to the Registration Statement on Form N-1A, and incorporated by reference herein. |
| | (9)(d) | Annex I to the Foreign Custody Manager Agreement between Ivy Funds and The Bank of New York Mellon, amended and effective November 12, 2013, filed with Post-Effective Amendment No. 90 to the Registration Statement on Form N-1A, and incorporated by reference herein. |
| | (10)(a) | Distribution and Service Plan, dated November 13, 2008, filed with Post-Effective Amendment No. 65 to the Registration Statement on Form N-1A, and incorporated by reference herein. |
| | (10)(b) | Multiple Class Plan for Ivy Funds, as amended February 11, 2010, filed with Post-Effective Amendment No. 68 to the Registration Statement on Form N-1A, and incorporated by reference herein. |
| | (10)(c) | Distribution Agreement between Ivy Funds and Ivy Funds Distributor, Inc., as amended May 22, 2012, filed with Post-Effective Amendment No. 73 to the Registration Statement on Form N-1A, and incorporated by reference herein. |
| | (10)(d) | Appendix A to the Multiple Class Plan for Ivy Funds, amended and effective November 12, 2013, filed with Post-Effective Amendment No. 90 to the Registration Statement on Form N-1A, and incorporated by reference herein. |
| | (11) | Opinion and Consent of Counsel, filed with this Pre-Effective Amendment No. 1. |
| | (12) | Opinion of Counsel Supporting Tax Matters, to be filed in a subsequent filing. |
| | (13)(a) | Shareholder Servicing Agreement between Ivy Funds and Waddell & Reed Services Company, as amended May 22, 2012, filed with Post-Effective Amendment No. 73 to the Registration Statement on Form N-1A, and incorporated by reference herein. |
| | (13)(b) | Appendix A to the Shareholder Servicing Agreement between Ivy Funds and Waddell & Reed Services Company, amended and effective November 12, 2013, filed with Post-Effective Amendment No. 90 to the Registration Statement on Form N-1A, and incorporated by reference herein. |
| | (13)(c) | Exhibit B to the Shareholder Servicing Agreement between Ivy Funds and Waddell & Reed Services Company, amended and effective November 12, 2013, filed with Post-Effective Amendment No. 90 to the Registration Statement on Form N-1A, and incorporated by reference herein. |
| | (14) | Consent of Independent Registered Public Accounting Firm, filed with this Pre-Effective Amendment No. 1. |
| | (16) | Power of Attorney appointing Mara D. Herrington and Philip A. Shipp as attorneys and agents of Ivy Funds, filed with this Pre-Effective Amendment No. 1. |
| | (17)(a) | Code of Ethics pursuant to the Sarbanes-Oxley Act of 2002, filed by EDGAR on January 28, 2004 as EX-99.B(p)code-so-ivy to Post-Effective Amendment No. 21 to the Registration Statement on Form N-1A, and incorporated by reference herein. |
| | (17)(b) | Code of Ethics, as amended August 2007, filed by EDGAR on May 30, 2008 as EX-99.B(p)code to Post-Effective Amendment No. 37 to the Registration Statement on Form N-1A, and incorporated by reference herein. |
| | (17)(c) | Code of Ethics for Waddell & Reed Financial, Inc., Waddell & Reed, Inc., Waddell & Reed Investment Management Company, Fiduciary Trust Company of New Hampshire, Waddell & Reed Advisors Funds, Ivy Funds Variable Insurance Portfolios, InvestEd Portfolios, Ivy Funds, Ivy Investment Management Company, Ivy Funds Distributor, Inc., and Waddell & Reed Services Company, doing business as WI Services Company, as revised November 2012, filed with Post-Effective Amendment No. 79 to the Registration Statement on Form N-1A, and incorporated by reference herein. |
| | (17)(d) | Prospectus for the Acquiring Fund dated January 29, 2014, filed with Post-Effective Amendment No. 90 to the Registration Statement on Form N-1A, and incorporated by reference herein. |
| | (17)(e) | Statement of Additional Information for the Acquiring Fund dated January 29, 2014, filed with Post-Effective Amendment No. 90 to the Registration Statement on Form N-1A, and incorporated by reference herein. |
| | (17)(f) | Annual Report for the Acquiring Fund and the Acquired Fund dated March 30, 2013, filed on Form N-CSR on June 7, 2013, and incorporated by reference herein. |
| | (17)(g) | Semiannual Report for the Acquiring Fund and the Acquired Fund dated September 30, 2013, filed on Form N-CSRS on December 6, 2013, and incorporated by reference herein. |
POWER OF ATTORNEY
KNOW ALL MEN BY THESE PRESENTS, that the undersigned, IVY FUNDS (hereafter called the Trust), and certain trustees and officers of the Trust, do hereby constitute and appoint MARA D. HERRINGTON and PHILIP A. SHIPP, each of them individually, their true and lawful attorneys and agents to take any and all action and execute any and all instruments which said attorneys and agents may deem necessary or advisable to enable the Trust, on behalf of its Ivy Asset Strategy New Opportunities Fund and Ivy Emerging Markets Equity Fund (formerly, the Ivy Pacific Opportunities Fund), to comply with the Securities Act of 1933 and the Investment Company Act of 1940, as amended, and any rules, regulations, orders or other requirements of the United States Securities and Exchange Commission thereunder, in connection with the registration of shares under the Securities Act of 1933 and the Investment Company Act of 1940, as amended, including specifically, but without limitation of the foregoing, power and authority to sign the names of each of such trustees and officers in his/her behalf as such trustee or officer as indicated below opposite his/her signature hereto, to the Registration Statement as filed on Form N-14 and on behalf of Ivy Asset Strategy New Opportunities Fund and Ivy Emerging Markets Equity Fund, each a series of the Trust, and to any amendment or supplement to such Registration Statement, and to any instruments or documents filed or to be filed as a part of or in connection with such Registration Statement or amendment or supplement thereto; and each of the undersigned hereby ratifies and confirms all that said attorneys and agents shall do or cause to be done by virtue hereof.
Date: November 12, 2013
| | | | | | |
| | | | /s/ Henry J. Herrmann | | |
| | | | Henry J. Herrmann, President |
| | | |
/s/ Joseph Harroz, Jr. | | | | Chairman and Trustee | | |
| Joseph Harroz, Jr. | | | | | | |
| | | |
/s/ Jarold W. Boettcher | | | | Trustee | | |
| Jarold W. Boettcher | | | | | | |
| | | |
/s/ James D. Gressett | | | | Trustee | | |
| James D. Gressett | | | | | | |
| | | |
/s/ Henry J. Herrmann | | | | Trustee | | |
| Henry J. Herrmann | | | | | | |
| | | |
/s/ Glendon E. Johnson, Jr. | | | | Trustee | | |
| Glendon E. Johnson, Jr. | | | | | | |
| | | |
/s/ Eleanor B. Schwartz | | | | Trustee | | |
| Eleanor B. Schwartz | | | | | | |
| | | |
/s/ Michael G. Smith | | | | Trustee | | |
| Michael G. Smith | | | | | | |
| | | | | | |
| | | |
/s/ Edward M. Tighe | | | | Trustee | | |
| Edward M. Tighe | | | | | | |
| | | |
Attest: | | | | | | |
| | | |
/s/ Mara D. Herrington | | | | | | |
| Mara D. Herrington, Secretary | | | | | | |
SIGNATURES
Pursuant to the requirements of the Securities Act of 1933 and the Investment Company Act of 1940, the Registrant has duly caused this Form N-14 to be signed on its behalf by the undersigned, thereunto duly authorized, in the city of Overland Park, and State of Kansas, on the 29th day of January, 2014.
IVY FUNDS
a Delaware statutory trust
(Registrant)
By /s/ Henry J. Herrmann
Henry J. Herrmann, President
Pursuant to the requirements of the Securities Act of 1933, and/or the Investment Company Act of 1940, this Pre-Effective Amendment has been signed below by the following persons in the capacities shown and on the 29th day of January, 2014.
| | | | |
| Signatures | | Title | | |
| | |
/s/Joseph Harroz, Jr.* Joseph Harroz, Jr. | | Chairman and Trustee | | |
| | |
/s/Henry J. Herrmann Henry J. Herrmann | | President and Trustee | | |
| |
/s/Joseph W. Kauten Joseph W. Kauten | | Vice President, Treasurer, Principal Financial Officer and Principal Accounting
Officer |
| | |
/s/Jarold W. Boettcher* Jarold W. Boettcher | | Trustee | | |
| | |
/s/James D. Gressett* James D. Gressett | | Trustee | | |
| | |
/s/Glendon E. Johnson, Jr.* Glendon E. Johnson, Jr. | | Trustee | | |
| | |
/s/Eleanor B. Schwartz* Eleanor B. Schwartz | | Trustee | | |
| | |
/s/Michael G. Smith* Michael G. Smith | | Trustee | | |
| | |
/s/Edward M. Tighe* Edward M. Tighe | | Trustee | | |
| | |
| *By: | | /s/Philip A. Shipp |
| | Philip A. Shipp |
| | Attorney-in-Fact |
| | |
| ATTEST: | | /s/Mara D. Herrington |
| | Mara D. Herrington Secretary |