UNITED STATES
SECURITIES AND EXCHANGE COMMISSION
WASHINGTON, D.C. 20549
FORM N-CSR
CERTIFIED SHAREHOLDER REPORT OF REGISTERED
MANAGEMENT INVESTMENT COMPANIES
Investment Company Act file number: 811-06554
ALLIANCEBERNSTEIN GLOBAL BOND FUND, INC.
|
| (Exact name of registrant as specified in charter) |
1345 Avenue of the Americas, New York, New York 10105
|
| (Address of principal executive offices) (Zip code) |
Joseph J. Mantineo
AllianceBernstein L.P.
1345 Avenue of the Americas
New York, New York 10105
|
| (Name and address of agent for service) |
Registrant’s telephone number, including area code: (800) 221-5672
Date of fiscal year end: September 30, 2008
Date of reporting period: September 30, 2008
ITEM 1. REPORTS TO STOCKHOLDERS.
ANNUAL REPORT
AllianceBernstein Global Bond Fund

Annual Report
Investment Products Offered
| | • | | Are Not Bank Guaranteed |
The investment return and principal value of an investment in the Fund will fluctuate as the prices of the individual securities in which it invests fluctuate, so that your shares, when redeemed, may be worth more or less than their original cost. You should consider the investment objectives, risks, charges and expenses of the Fund carefully before investing. For a free copy of the Fund’s prospectus, which contains this and other information, visit our web site at www.alliancebernstein.com or call your financial advisor or AllianceBernstein® at (800) 227-4618. Please read the prospectus carefully before you invest.
You may obtain performance information current to the most recent month-end by visiting www.alliancebernstein.com.
This shareholder report must be preceded or accompanied by the Fund’s prospectus for individuals who are not current shareholders of the Fund.
You may obtain a description of the Fund’s proxy voting policies and procedures, and information regarding how the Fund voted proxies relating to portfolio securities during the most recent 12-month period ended June 30, without charge. Simply visit AllianceBernstein’s web site at www.alliancebernstein.com, or go to the Securities and Exchange Commission’s (the “Commission”) web site at www.sec.gov, or call AllianceBernstein at (800) 227-4618.
The Fund files its complete schedule of portfolio holdings with the Commission for the first and third quarters of each fiscal year on Form N-Q. The Fund’s Forms N-Q are available on the Commission’s web site at www.sec.gov. The Fund’s Forms N-Q may also be reviewed and copied at the Commission’s Public Reference Room in Washington, DC; information on the operation of the Public Reference Room may be obtained by calling (800) SEC-0330. AllianceBernstein publishes full portfolio holdings for the Fund monthly at www.alliancebernstein.com.
AllianceBernstein Investments, Inc. is an affiliate of AllianceBernstein L.P., the manager of the AllianceBernstein funds, and is a member of FINRA.
AllianceBernstein® and the AB Logo are registered trademarks and service marks used by permission of the owner, AllianceBernstein L.P.
November 24, 2008
Annual Report
This report provides management’s discussion of fund performance for AllianceBernstein Global Bond Fund (the “Fund”) for the annual reporting period ended September 30, 2008. On August 2, 2007, the Board of Directors (the “Board”) of the Fund approved a change to the Fund’s investment policy of investing at least 80% of its net assets in government securities. Under the revised investment policy, the Fund invests at least 80% of its net assets in fixed-income securities. To reflect the Fund’s broader investment approach, the Board approved a change of the Fund’s name from AllianceBernstein Global Government Income Trust to AllianceBernstein Global Bond Fund. This change allowed the Fund to invest in a broader range of debt securities, including corporate debt securities. These changes became effective on November 5, 2007.
Investment Objectives and Policies
The Fund’s investment objective is to generate current income consistent with preservation of capital. The Fund invests, under normal circumstances, at least 80% of its net assets in fixed-income securities. The Fund may invest in a broad range of fixed-income securities in both developed and emerging markets. The Fund may invest across all fixed-income sectors, including U.S. and non-U.S. government and corporate debt securities. The Fund’s investments may be denominated in local currency or U.S. Dollar-denominated. The Fund may invest in debt securities with a
range of maturities from short- to long-term. The Fund may use borrowings or other leverage for investment purposes.
AllianceBernstein L.P. (the “Adviser”) will actively manage the Fund’s assets in relation to market conditions and general economic conditions and adjust the Fund’s investments in an effort to best enable the Fund to achieve its investment objective. Thus, the percentage of the Fund’s assets invested in a particular country or denominated in a particular currency will vary in accordance with the Adviser’s assessment of the relative yield and appreciation potential of such securities and the relationship of the country’s currency to the U.S. Dollar.
Under normal circumstances, the Fund invests at least 75% of its net assets in fixed-income securities rated investment grade at the time of investment and may invest up to 25% of its net assets in below investment-grade fixed-income securities.
The Fund may invest in mortgage-related and other asset-backed securities, loan participations, inflation-protected securities, structured securities, variable, floating, and inverse floating rate instruments, preferred stock, and may use other investment techniques. The Fund intends, among other things, to enter into transactions such as reverse repurchase agreements and dollar rolls. The Fund may invest, without limit, in derivatives, such as option, futures, forwards, or swap agreements.
| | |
| ALLIANCEBERNSTEIN GLOBAL BOND FUND • | | 1 |
Investment Results
The table on page 5 shows the Fund’s performance compared to its new benchmark, the Lehman Brothers (LB) Global Aggregate Bond Index (hedged to the U.S. dollar—the “USD”), along with the Fund’s old benchmark, the LB Global Treasury Index (hedged to the USD). In November 2007, the Fund’s investment guidelines changed to comprise a multi-sector approach, as opposed to a government-only approach. As a result, the benchmark was changed on November 5, 2007, to the LB Global Aggregate Bond Index (hedged to the USD), which complies more accurately with the Fund’s broadened guidelines.
The Fund’s Class A shares without sales charges underperformed both its new and old benchmarks for the six-month and 12-month periods as non-government debt markets sold off in the face of extreme risk aversion. For both periods, the Fund’s underweight in government holdings, particularly U.S. Treasuries, detracted from performance as global government bonds benefited from the flight to quality. The Fund’s overweight to corporate debt, commercial mortgage-backed securities (CMBS) and exposure to high-yield bank loan debt also detracted. On a security level, the Fund’s exposure to the financial industry was a negative contributor as financial corporates dramatically underperformed other sectors. The Fund’s exposure to unhedged local emerging market debt also detracted from performance, as did overall non-U.S. currency exposure.
Market Review and Investment Strategy
The credit crisis entered a new and more menacing phase late in the annual period ended September 30, 2008, with fear of counterparty risk paralyzing interbank lending and threatening the survival of some of the world’s most powerful financial firms. Stocks fell sharply while government bonds rallied around the world. Credit spreads widened as investors sought safety in risk-free assets; spreads on global investment-grade corporates hit record highs, while three-month U.S. Treasury-Bill yields briefly reached zero and the U.S. dollar rose against most currencies.
Loss of confidence undermined several prominent financial firms, and their collapses further undermined confidence. The severe difficulties that financial firms faced prompted government rescues of Fannie Mae, Freddie Mac and American International Group in the U.S.; Bradford & Bingley in the U.K.; and Fortis Group and Dexia in the euro area. These difficulties also led to the bankruptcy of Lehman Brothers and the rapid consolidations of Merrill Lynch with Bank of America, HBOS with Lloyds TSB and Washington Mutual with JPMorgan Chase; and Wachovia with Wells Fargo.
Evidence also mounted that the global economic outlook was worsening as the credit crisis unfolded, darkening corporate profit outlooks. Major central banks responded to the deepening financial crisis by flooding the money markets with liquidity, and the U.S.
| | |
| 2 | | • ALLIANCEBERNSTEIN GLOBAL BOND FUND |
government moved forward with a $700 billion effort to aid the financial system, which included capital injections directly into banks rather than their original plan to purchase bad bank assets. At the time of writing, the Treasury has already committed approximately $310 billion. It has allocated $125 billion to the nine largest banks, another $125 billion for publicly traded regional banks; and $40 billion to expand the existing bailout of American International Group, the insurance conglomerate that collapsed in September. Most recently, Citigroup Inc. received a rescue package that shields the bank from losses on toxic assets and injects an additional $20 billion of capital.
During the annual period, government securities significantly outperformed in the flight to quality. Global developed government bonds returned 5.16% (hedged in USD) during the annual period with U.S. Treasuries far outperforming at 8.73%, according to Lehman Brothers. Global investment-grade corporates returned -5.43% and spreads widened 248 basis points. Most industry returns were negative for the year with the financial
industry particularly hard hit, returning -9.80%. High-yield corporates returned -10.46% with spreads widening 577 basis points for the year. Spread is the additional yield above a comparative Treasury paid to assume added risk.
The Global Fixed Income Investment Team views recent spread widening as an opportunity not seen in decades, particularly in corporate debt and CMBS. Current valuations in investment grade corporates are at the widest levels since the depression, and imply a default rate nearly four times investment grade defaults experienced during that period. The spread on U.S. high-yield corporate debt is also several standard deviations above its long-term average, and far in excess of the last major downturn in 2002. While the breadth and depth of the global slowdown is unknown, and the recovery—for both the credit markets and the economy—will take time, worst case scenarios, coupled with significant liquidity premiums, are priced into today’s valuations. As risk aversion begins to abate and valuations align with fundamentals, we expect corporate debt and CMBS to outperform.
| | |
| ALLIANCEBERNSTEIN GLOBAL BOND FUND • | | 3 |
HISTORICAL PERFORMANCE
An Important Note About the Value of Historical Performance
The performance on the following pages represents past performance and does not guarantee future results. Current performance may be lower or higher than the performance information shown. You may obtain performance information current to the most recent month-end by visiting www.alliancebernstein.com.
The investment return and principal value of an investment in the Fund will fluctuate, so that your shares, when redeemed, may be worth more or less than their original cost. You should consider the investment objectives, risks, charges and expenses of the Fund carefully before investing. For a free copy of the Fund’s prospectus, which contains this and other information, visit our website at www.alliancebernstein.com or call your financial advisor or AllianceBernstein Investments at 800.227.4618. You should read the prospectus carefully before you invest.
All fees and expenses related to the operation of the Fund have been deducted. NAV returns do not reflect sales charges; if sales charges were reflected, the Fund’s quoted performance would be lower. SEC returns reflect the applicable sales charges for each share class: a 4.25% maximum front-end sales charge for Class A shares; the applicable contingent deferred sales charge for Class B shares (3% year 1, 2% year 2, 1% year 3, 0% year 4); a 1% 1 year contingent deferred sales charge for Class C shares. Returns for the different share classes will vary due to different expenses associated with each class. Performance assumes reinvestment of distributions and does not account for taxes.
Benchmark Disclosure
Neither the Lehman Brothers (LB) Global Aggregate Bond Index (hedged to the USD) nor the LB Global Treasury Index (hedged to the USD) reflects fees and expenses associated with the active management of a mutual fund portfolio. The LB Global Aggregate Bond Index (hedged to the USD) is designed to track the global investment-grade bond market, which includes different types of bonds from around the world. The LB Global Treasury Index (hedged to the USD) is a basket of Treasury securities from approximately 35 global developed countries and approximately 1,000 different issues. An investor cannot invest directly in an index, and its results are not indicative of the performance for any specific investment, including the Fund.
A Word About Risk
The Fund invests a significant amount of its assets in foreign securities which may magnify fluctuations due to changes in foreign exchange rates and the possibility of political and economic uncertainties in foreign countries. These risks may be magnified for investments in emerging markets. Since the Fund is non-diversified, it can invest more of its assets in a smaller number of countries, making the Fund more susceptible to risks associated with a single economic, political or regulatory occurrence than a more diversified portfolio might be. To increase yield, the Fund can use leverage, a speculative technique, which may increase share price fluctuation. Price fluctuation in the Fund’s portfolio securities may be caused by changes in the general level of interest rates or changes in bond credit quality ratings. Please note, as interest rates rise, existing bond prices fall and can cause the value of an investment in the Fund to decline. Changes in interest rates have a greater effect on bonds with longer maturities than on those with shorter maturities. High-yield bonds, otherwise known as “junk bonds,” involve a greater risk of default and price volatility than other bonds. Investing in below-investment-grade securities presents special risks, including credit risk. Investments in the Fund are not guaranteed because of fluctuation in the net asset value of the underlying fixed-income related investments. Similar to direct bond ownership, bond funds have the same interest rate, inflation and credit risks that are associated with the underlying bonds owned by the Fund. Fund purchasers should understand that, in contrast to owning individual bonds, there are ongoing fees and expenses associated with owning shares of bond funds. While the Fund invests principally in bonds and other fixed-income securities, in order to achieve its investment objectives, the Fund may at times use certain types of investment derivatives, such as options, futures, forward and swaps. These instruments involve risks different from, and in certain cases, greater than, the risks presented by more traditional investments. These risks are fully discussed in the Fund’s prospectus.
(Historical Performance continued on next page)
| | |
| 4 | | • ALLIANCEBERNSTEIN GLOBAL BOND FUND |
Historical Performance
HISTORICAL PERFORMANCE
(continued from previous page)
| | | | | | | | |
| | | | | | | | |
THE FUND VS. ITS BENCHMARKS
PERIODS ENDED SEPTEMBER 30, 2008 | | Returns | | | |
| | 6 Months | | | 12 Months | | | |
AllianceBernstein Global Bond Fund | | | | | | | | |
Class A | | -6.41% | | | -3.75% | | | |
| |
Class B | | -6.74% | | | -4.44% | | | |
| |
Class C | | -6.72% | | | -4.42% | | | |
| |
Advisor Class* | | -6.27% | | | -4.83% | † | | |
| |
Class R* | | -6.37% | | | -5.15% | † | | |
| |
Class K* | | -6.38% | | | -5.07% | † | | |
| |
Class I* | | -6.18% | | | -4.72% | † | | |
| |
New Benchmark: LB Global Aggregate Bond Index – Hedged to the U.S. Dollar | | -0.96% | | | 3.12% | | | |
| |
Old Benchmark: LB Global Treasury Index – Hedged to the U.S. Dollar | | 0.26% | | | 5.15% | | | |
| |
* Please note that these share classes are for investors purchasing shares through accounts established under certain fee-based programs sponsored and maintained by certain broker-dealers and financial intermediaries, institutional pension plans and/or investment advisory clients of, and certain other persons associated with, the Adviser and its affiliates or the Funds. |
† This return is since the share class’s inception on 11/5/07 and is cumulative. |
| | | | | | | | |
GROWTH OF A $10,000 INVESTMENT IN THE FUND
9/30/98 to 9/30/08
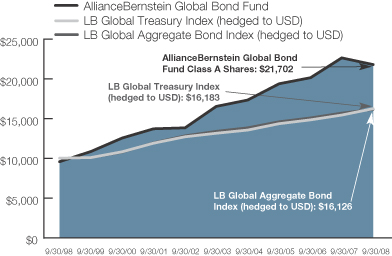
This chart illustrates the total value of an assumed $10,000 investment in AllianceBernstein Global Bond Fund Class A shares (from 9/30/98 to 9/30/08) as compared to its new and old benchmarks. The chart reflects the deduction of the maximum 4.25% sales charge from the initial $10,000 investment in the Fund and assumes the reinvestment of dividends and capital gains distributions.
See Historical Performance and Benchmark disclosures on the previous page.
(Historical Performance continued on next page)
| | |
| ALLIANCEBERNSTEIN GLOBAL BOND FUND • | | 5 |
Historical Performance
HISTORICAL PERFORMANCE
(continued from previous page)
| | | | | | | | | |
| AVERAGE ANNUAL RETURNS AS OF SEPTEMBER 30, 2008 | |
| | | NAV Returns | | | SEC Returns | | | SEC Yields* | |
| | | | | | | | | |
| Class A Shares | | | | | | | | 5.15 | % |
1 Year | | -3.75 | % | | -7.86 | % | | | |
5 Years | | 5.66 | % | | 4.76 | % | | | |
10 Years | | 8.53 | % | | 8.06 | % | | | |
| | | | | | | | | |
| Class B Shares | | | | | | | | 4.66 | % |
1 Year | | -4.44 | % | | -7.19 | % | | | |
5 Years | | 4.91 | % | | 4.91 | % | | | |
10 Years(a) | | 8.03 | % | | 8.03 | % | | | |
| | | | | | | | | |
| Class C Shares | | | | | | | | 4.64 | % |
1 Year | | -4.42 | % | | -5.33 | % | | | |
5 Years | | 4.88 | % | | 4.88 | % | | | |
10 Years | | 7.74 | % | | 7.74 | % | | | |
| | | | | | | | | |
| Advisor Class Shares‡ | | | | | | | | 5.75 | % |
Since Inception† | | -4.83 | % | | -4.83 | % | | | |
| | | | | | | | | |
| Class R Shares‡ | | | | | | | | 5.21 | % |
Since Inception† | | -5.15 | % | | -5.15 | % | | | |
| | | | | | | | | |
| Class K Shares‡ | | | | | | | | 5.46 | % |
Since Inception† | | -5.07
| %
| | -5.07 | % | | | |
| | | | | | | | | |
| Class I Shares‡ | | | | | | | | 5.71 | % |
Since Inception† | | -4.72 | % | | -4.72 | % | | | |
The Fund’s current prospectus fee table shows the Fund’s total annual operating expense ratios as 1.80%, 2.53%, 2.50%, 1.50%, 2.15%, 1.84% and 1.51% for Class A, Class B, Class C, Advisor, Class R, Class K and Class I shares, respectively, gross of any fee waivers or expense reimbursements and including interest expense. Contractual fee waivers and/or expense reimbursements limit the Fund’s annual operating expense ratios, exclusive of interest expense, to 0.90%, 1.60%, 1.60%, 0.60%, 1.10%, 0.85% and 0.60% for Class A, Class B, Class C, Advisor, Class R, Class K and Class I shares, respectively. These waivers/reimbursements extend throughout the Fund’s current fiscal year and may be extended by the Adviser for additional one-year terms. Absent reimbursements or waivers, performance would have been lower. The Financial Highlights section of this report sets forth expense ratio data for the current reporting period; the expense ratios shown above may differ from the expense ratios in the Financial Highlights sections since they are based on different time periods.
| (a) | Assumes conversion of Class B shares into Class A shares after six years. |
| * | SEC Yields are calculated based on SEC guidelines for the 30-day period ended September 30, 2008. |
| † | Inception date: 11/5/07 for Advisor Class, Class R, Class K and Class I shares. Returns for these share classes are cumulative. |
| ‡ | These share classes are offered at net asset value (NAV) to eligible investors and their SEC returns are the same as the NAV returns. Please note that these share classes are for investors purchasing shares through accounts established under certain fee-based programs sponsored and maintained by certain broker-dealers and financial intermediaries, institutional pension plans and/or investment advisory clients of, and certain other persons associated with, the Adviser and its affiliates or the Fund. The inception date for these share classes are listed above. |
See Historical Performance and Benchmark disclosures on page 4.
(Historical Performance continued on next page)
| | |
| 6 | | • ALLIANCEBERNSTEIN GLOBAL BOND FUND |
Historical Performance
HISTORICAL PERFORMANCE
(continued from previous page)
| | | | | | | |
| SEC AVERAGE ANNUAL RETURNS (WITH ANY APPLICABLE SALES CHARGES) AS OF THE MOST RECENT CALENDAR QUARTER-END (SEPTEMBER 30, 2008) | |
| | | | | | | SEC Returns | |
| | | | | | | |
| Class A Shares | | | | | | | |
1 Year | | | | | | -7.86 | % |
5 Years | | | | | | 4.76 | % |
10 Years | | | | | | 8.06 | % |
| | | | | | | |
| Class B Shares | | | | | | | |
1 Year | | | | | | -7.19 | % |
5 Years | | | | | | 4.91 | % |
10 Years(a) | | | | | | 8.03 | % |
| | | | | | | |
| Class C Shares | | | | | | | |
1 Year | | | | | | -5.33 | % |
5 Years | | | | | | 4.88 | % |
10 Years | | | | | | 7.74 | % |
| | | | | | | |
| Advisor Class Shares‡ | | | | | | | |
Since Inception† | | | | | | -4.83 | % |
| | | | | | | |
| Class R Shares‡ | | | | | | | |
Since Inception† | | | | | | -5.15 | % |
| | | | | | | |
| Class K Shares‡ | | | | | | | |
Since Inception† | | | | | | -5.07 | % |
| | | | | | | |
| Class I Shares‡ | | | | | | | |
Since Inception† | | | | | | -4.72 | % |
| (a) | Assumes conversion of Class B shares into Class A shares after six years. |
| † | Inception date: 11/5/07 for Advisor Class, Class R, Class K and Class I shares. Returns for these share classes are cumulative. |
| ‡ | Please note that these share classes are for investors purchasing shares through accounts established under certain fee-based programs sponsored and maintained by certain broker-dealers and financial intermediaries, institutional pension plans and/or investment advisory clients of, and certain other persons associated with, the Adviser and its affiliates or the Funds. The inception date for these share classes are listed above. |
See Historical Performance and Benchmark disclosures on page 4.
| | |
| ALLIANCEBERNSTEIN GLOBAL BOND FUND • | | 7 |
Historical Performance
FUND EXPENSES
As a shareholder of the Fund, you incur two types of costs: (1) transaction costs, including sales charges (loads) on purchase payments, contingent deferred sales charges on redemptions and (2) ongoing costs, including management fees; distribution (12b-1) fees; and other Fund expenses. This example is intended to help you understand your ongoing costs (in dollars) of investing in the Fund and to compare these costs with the ongoing costs of investing in other mutual funds.
The Example is based on an investment of $1,000 invested at the beginning of the period and held for the entire period as indicated below.
Actual Expenses
The table below provides information about actual account values and actual expenses. You may use the information in this line, together with the amount you invested, to estimate the expenses that you paid over the period. Simply divide your account value by $1,000 (for example, an $8,600 account value divided by $1,000 = 8.6), then multiply the result by the number in the first line under the heading entitled “Expenses Paid During Period” to estimate the expenses you paid on your account during this period.
Hypothetical Example for Comparison Purposes
The table below provides information about hypothetical account values and hypothetical expenses based on the Fund’s actual expense ratio and an assumed annual rate of return of 5% before expenses, which is not the Fund’s actual return. The hypothetical account values and expenses may not be used to estimate the actual ending account balance or expenses you paid for the period. You may use this information to compare the ongoing costs of investing in the Fund and other funds by comparing this 5% hypothetical example with the 5% hypothetical examples that appear in the shareholder reports of other funds.
Please note that the expenses shown in the table are meant to highlight your ongoing costs only and do not reflect any transactional costs, such as sales charges (loads), or contingent deferred sales charges on redemptions. Therefore, the second line of the table is useful in comparing ongoing costs only, and will not help you determine the relative total costs of owning different funds. In addition, if these transactional costs were included, your costs would have been higher.
| | | | | | | | | | | | | | | | | | |
| | | Beginning
Account Value
April 1, 2008 | | Ending
Account Value
September 30, 2008 | | Expenses Paid
During Period* |
| | | Actual | | Hypothetical | | Actual | | Hypothetical** | | Actual | | Hypothetical |
| Class A | | $ | 1,000 | | $ | 1,000 | | $ | 935.93 | | $ | 1,020.50 | | $ | 4.36 | | $ | 4.55 |
| Class B | | $ | 1,000 | | $ | 1,000 | | $ | 932.62 | | $ | 1,017.00 | | $ | 7.73 | | $ | 8.07 |
| Class C | | $ | 1,000 | | $ | 1,000 | | $ | 932.78 | | $ | 1,017.00 | | $ | 7.73 | | $ | 8.07 |
| Advisor Class | | $ | 1,000 | | $ | 1,000 | | $ | 937.30 | | $ | 1,022.00 | | $ | 2.91 | | $ | 3.03 |
| Class R | | $ | 1,000 | | $ | 1,000 | | $ | 936.28 | | $ | 1,019.50 | | $ | 5.32 | | $ | 5.55 |
| Class K | | $ | 1,000 | | $ | 1,000 | | $ | 936.19 | | $ | 1,020.75 | | $ | 4.11 | | $ | 4.29 |
| Class I | | $ | 1,000 | | $ | 1,000 | | $ | 938.24 | | $ | 1,022.00 | | $ | 2.91 | | $ | 3.03 |
| * | Expenses are equal to the classes’ annualized expense ratios of 0.90%, 1.60%, 1.60%, 0.60%, 1.10% 0.85% and 0.60%, respectively multiplied by the average account value over the period, multiplied by 183/366 (to reflect the one-half year period). |
| ** | Assumes 5% return before expenses. |
| | |
| 8 | | • ALLIANCEBERNSTEIN GLOBAL BOND FUND |
Fund Expenses
PORTFOLIO SUMMARY
September 30, 2008
PORTFOLIO STATISTICS
Net Assets ($mil): $2,145.5
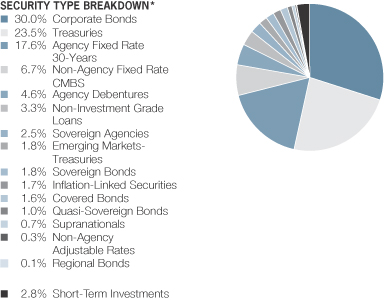
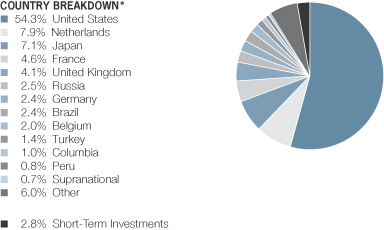
| * | All data are as of September 30, 2008. The Fund’s security type and country breakdowns are expressed as a percentage of total investments and may vary over time. “Other” country weightings represent 0.7% or less in the following countries: Argentina, Australia, Bermuda, Canada, Cayman Islands, Chile, Ecuador, Hong Kong, India, Indonesia, Ireland, Luxembourg, Kazakhstan, Mexico and Spain. |
| | |
| ALLIANCEBERNSTEIN GLOBAL BOND FUND • | | 9 |
Portfolio Summary
PORTFOLIO OF INVESTMENTS
September 30, 2008
| | | | | | | |
| | | | | Principal
Amount
(000) | | U.S. $ Value |
| |
| | | | | | | |
CORPORATE BONDS – 35.3% | | | | | | | |
Australia – 0.9% | | | | | | | |
National Australia Bank Ltd.
5.50%, 5/20/15(a) | | EUR | | 5,750 | | $ | 7,543,089 |
Rio Tinto Finance USA Ltd.
5.875%, 7/15/13(a) | | US$ | | 11,230 | | | 11,008,881 |
| | | | | | | |
| | | | | | | 18,551,970 |
| | | | | | | |
Bermuda – 0.3% | | | | | | | |
Weatherford International Ltd.
5.15%, 3/15/13(a) | | | | 1,640 | | | 1,579,401 |
6.00%, 3/15/18(a) | | | | 6,250 | | | 5,611,331 |
| | | | | | | |
| | | | | | | 7,190,732 |
| | | | | | | |
Brazil – 0.3% | | | | | | | |
GTL Trade Finance, Inc.
7.25%, 10/20/17(a)(b) | | | | 2,362 | | | 2,264,662 |
Usiminas Commercial Ltd.
7.25%, 1/18/18(a)(b) | | | | 3,526 | | | 3,427,145 |
| | | | | | | |
| | | | | | | 5,691,807 |
| | | | | | | |
Canada – 0.4% | | | | | | | |
Canadian Natural Resources Ltd.
5.15%, 2/01/13(a) | | | | 1,245 | | | 1,159,444 |
Canadian Pacific Railway Co.
6.50%, 5/15/18(a) | | | | 1,675 | | | 1,579,522 |
YPG Holdings, Inc.
5.25%, 2/15/16(a) | | CAD | | 7,840 | | | 6,701,183 |
| | | | | | | |
| | | | | | | 9,440,149 |
| | | | | | | |
Cayman Islands – 0.8% | | | | | | | |
Mizuho Financial Group Cayman Ltd.
4.75%, 4/15/14(a)(b)(c) | | EUR | | 2,765 | | | 3,843,595 |
Pacific Life Funding LLC
5.50%, 5/14/09(a) | | | | 405 | | | 563,374 |
Vale Overseas Ltd.
6.875%, 11/21/36(a) | | US$ | | 15,405 | | | 13,712,098 |
| | | | | | | |
| | | | | | | 18,119,067 |
| | | | | | | |
France – 0.6% | | | | | | | |
Caisse Nationale des Caisses d’Epargne et de Prevoyance
4.75%, 2/01/16(a)(c) | | EUR | | 1,250 | | | 1,071,688 |
Societe Generale
6.999%, 12/19/17(a)(c) | | | | 3,000 | | | 3,139,481 |
Veolia Environnement
5.25%, 6/03/13(a) | | US$ | | 9,375 | | | 9,218,437 |
| | | | | | | |
| | | | | | | 13,429,606 |
| | | | | | | |
Hong Kong – 0.1% | | | | | | | |
Noble Group Ltd.
8.50%, 5/30/13(a)(b) | | | | 1,767 | | | 1,457,775 |
| | | | | | | |
| | |
| 10 | | • ALLIANCEBERNSTEIN GLOBAL BOND FUND |
Portfolio of Investments
| | | | | | | |
| | | | | Principal
Amount
(000) | | U.S. $ Value |
| |
| | | | | | | |
India – 0.3% | | | | | | | |
Vedanta Resources PLC
8.75%, 1/15/14(a)(b) | | US$ | | 8,139 | | $ | 7,258,360 |
| | | | | | | |
| | | |
Ireland – 0.7% | | | | | | | |
GPB Eurobond Finance PLC for Gazprombank
7.25%, 2/22/10(a) | | RUB | | 400,000 | | | 14,068,617 |
| | | | | | | |
| | | |
Japan – 1.1% | | | | | | | |
Aiful Corp.
6.00%, 12/12/11(a)(b) | | US$ | | 3,728 | | | 2,901,241 |
Mizuho Capital Investment Euro
5.02%, 12/31/49(a) | | EUR | | 6,450 | | | 7,444,674 |
Resona Bank Ltd.
4.125%, 9/27/12(a)(b)(c) | | | | 7,815 | | | 8,730,174 |
Sumitomo Mitsui Banking Corp.
4.375%, 10/15/15(a)(b)(c) | | | | 3,149 | | | 2,975,982 |
5.625%, 10/15/15(a)(b)(c) | | US$ | | 2,170 | | | 1,733,563 |
| | | | | | | |
| | | | | | | 23,785,634 |
| | | | | | | |
Kazakhstan – 0.1% | | | | | | | |
CenterCredit International BV
8.625%, 1/30/14(a)(b) | | | | 2,490 | | | 1,743,000 |
| | | | | | | |
| | | |
Luxembourg – 0.8% | | | | | | | |
ArcelorMittal
5.375%, 6/01/13(a)(b) | | | | 11,145 | | | 10,528,659 |
Telecom Italia Capital SA
5.25%, 11/15/13(a) | | | | 3,389 | | | 3,006,687 |
Vip Finance
8.375%, 4/30/13(a)(b) | | | | 5,450 | | | 4,333,121 |
| | | | | | | |
| | | | | | | 17,868,467 |
| | | | | | | |
Mexico – 0.2% | | | | | | | |
Telefonos de Mexico SAB de CV
4.50%, 11/19/08(a) | | | | 4,401 | | | 4,405,225 |
| | | | | | | |
| | | |
Netherlands – 0.1% | | | | | | | |
Aegon NV
4.75%, 6/01/13(a) | | | | 1,460 | | | 1,387,740 |
| | | | | | | |
| | | |
Russia – 1.7% | | | | | | | |
Evraz Group SA
8.875%, 4/24/13(a)(b) | | | | 3,468 | | | 2,635,680 |
Gaz Capital SA
6.212%, 11/22/16(a)(b) | | | | 20,030 | | | 14,912,535 |
Red Arrow Intl Leasing PLC
8.375%, 6/30/12(a) | | RUB | | 99,921 | | | 3,504,644 |
Steel Capital SA for OAO Severstal
9.75%, 7/29/13(a)(b) | | US$ | | 5,485 | | | 4,497,700 |
| | |
| ALLIANCEBERNSTEIN GLOBAL BOND FUND • | | 11 |
Portfolio of Investments
| | | | | | | |
| | | | | Principal
Amount
(000) | | U.S. $ Value |
| |
| | | | | | | |
TransCapitalInvest Ltd. for OJSC AK Transneft
7.70%, 8/07/13(a)(b) | | US$ | | 8,497 | | $ | 7,766,386 |
VTB Capital SA
6.875%, 5/29/18(a)(b) | | | | 2,936 | | | 2,257,050 |
| | | | | | | |
| | | | | | | 35,573,995 |
| | | | | | | |
Spain – 0.3% | | | | | | | |
Santander Perpetual SA Unipersonal
4.375%, 12/10/14(a)(c) | | EUR | | 6,834 | | | 6,985,739 |
| | | | | | | |
| | | |
United Kingdom – 3.0% | | | | | | | |
Alliance & Leicester PLC
4.25%, 12/30/08(a) | | GBP | | 1,990 | | | 3,512,601 |
Barclays Bank PLC
4.875%, 12/15/14(a)(c) | | EUR | | 3,540 | | | 3,139,676 |
6.00%, 1/23/18(a) | | | | 6,144 | | | 7,770,117 |
BSKYB Finance UK PLC
5.625%, 10/15/15(a)(b) | | US$ | | 3,905 | | | 3,730,318 |
5.75%, 10/20/17(a)(b) | | GBP | | 3,977 | | | 6,266,946 |
HBOS Capital Funding LP
4.939%, 5/23/16(a)(c) | | EUR | | 3,544 | | | 2,830,966 |
HBOS PLC
6.05%, 11/23/11(a)(c) | | | | 2,760 | | | 2,765,097 |
HSBC Holdings PLC
6.50%, 9/15/37(a) | | US$ | | 11,272 | | | 9,586,441 |
Lloyds TSB Bank PLC
6.35%, 2/25/13(a)(c) | | EUR | | 2,076 | | | 2,474,983 |
Lloyds TSB Group PLC
6.267%, 11/14/16(a)(b)(c) | | US$ | | 8,999 | | | 6,739,864 |
Marks & Spencer PLC
5.625%, 3/24/14(a) | | GBP | | 3,458 | | | 5,216,032 |
Nationwide Building Society
3.125%, 1/26/10(a) | | EUR | | 2,600 | | | 3,405,528 |
Royal Bank of Scotland Group PLC
7.648%, 9/30/31(a)(c) | | US$ | | 7,768 | | | 6,384,139 |
| | | | | | | |
| | | | | | | 63,822,708 |
| | | | | | | |
United States – 23.6% | | | | | | | |
Aetna, Inc.
6.75%, 12/15/37(a) | | | | 12,500 | | | 11,412,600 |
Alcoa, Inc.
5.55%, 2/01/17(a) | | | | 10,381 | | | 9,272,922 |
The Allstate Corp.
6.125%, 5/15/37(a)(c) | | | | 15,215 | | | 11,166,851 |
American International Group, Inc.
4.25%, 5/15/13(a) | | | | 9,460 | | | 5,408,528 |
6.25%, 3/15/37(a) | | | | 9,015 | | | 1,444,365 |
Apache Corp.
6.90%, 9/15/18 | | | | 5,916 | | | 5,924,661 |
| | |
| 12 | | • ALLIANCEBERNSTEIN GLOBAL BOND FUND |
Portfolio of Investments
| | | | | | | |
| | | | | Principal
Amount
(000) | | U.S. $ Value |
| |
| | | | | | | |
AT&T Corp.
8.00%, 11/15/31(a) | | US$ | | 6,601 | | $ | 6,685,163 |
AT&T, Inc.
5.60%, 5/15/18(a) | | | | 5,475 | | | 4,900,344 |
Bank of America Corp.
5.65%, 5/01/18(a) | | | | 10,790 | | | 9,088,331 |
Baxter International, Inc.
5.375%, 6/01/18(a) | | | | 10,370 | | | 9,913,585 |
The Bear Stearns Co., Inc.
5.55%, 1/22/17(a) | | | | 13,525 | | | 11,614,459 |
7.625%, 12/07/09(a) | | | | 3,735 | | | 3,771,842 |
BMW US Capital LLC
5.00%, 5/28/15(a) | | EUR | | 6,000 | | | 7,864,782 |
Capital One Financial Corp.
6.75%, 9/15/17(a) | | US$ | | 6,016 | | | 5,295,867 |
Caterpillar Financial Services Corp.
6.20%, 9/30/13(a) | | | | 10,917 | | | 10,916,694 |
CBS Corp.
5.625%, 8/15/12(a) | | | | 2,225 | | | 2,094,824 |
6.625%, 5/15/11(a) | | | | 1,875 | | | 1,823,244 |
Centex Corp.
7.50%, 1/15/12(a) | | | | 7,451 | | | 6,854,920 |
CIT Group, Inc.
5.00%, 2/01/15(a) | | | | 10,860 | | | 5,368,065 |
7.625%, 11/30/12(a) | | | | 6,830 | | | 4,332,720 |
Series MTN
5.125%, 9/30/14(a) | | | | 5,665 | | | 2,793,734 |
Citigroup, Inc.
4.625%, 8/03/10(a) | | | | 3,830 | | | 3,497,108 |
5.50%, 4/11/13(a) | | | | 7,460 | | | 6,511,543 |
Commerzbank Capital Funding Trust I
5.012%, 4/12/16(a)(c) | | EUR | | 2,200 | | | 1,854,270 |
The Dow Chemical Co.
7.375%, 11/01/29(a) | | US$ | | 1,745 | | | 1,691,460 |
Echostar DBS Corp.
6.625%, 10/01/14(a) | | | | 4,140 | | | 3,322,350 |
7.125%, 2/01/16(a) | | | | 1,585 | | | 1,271,963 |
Edison Mission Energy
7.00%, 5/15/17(a) | | | | 4,275 | | | 3,847,500 |
Electronic Data Systems Corp.
Series B
6.00%, 8/01/13(a) | | | | 3,975 | | | 4,052,854 |
Embarq Corp.
7.082%, 6/01/16(a) | | | | 16,674 | | | 13,513,277 |
ERP Operating LP
5.25%, 9/15/14(a) | | | | 2,115 | | | 1,871,513 |
Freeport-McMoRan Copper & Gold, Inc.
8.375%, 4/01/17(a) | | | | 3,790 | | | 3,733,150 |
| | |
| ALLIANCEBERNSTEIN GLOBAL BOND FUND • | | 13 |
Portfolio of Investments
| | | | | | | |
| | | | | Principal
Amount
(000) | | U.S. $ Value |
| |
| | | | | | | |
General Electric Capital Corp.
5.625%, 5/01/18(a) | | US$ | | 18,660 | | $ | 15,772,850 |
Genworth Financial, Inc.
4.95%, 10/01/15(a) | | | | 7,020 | | | 5,636,498 |
GlaxoSmithKline Capital, Inc.
4.375%, 4/15/14(a) | | | | 3,965 | | | 3,761,421 |
The Goldman Sachs Group, Inc.
7.35%, 10/01/09(a) | | | | 3,690 | | | 3,577,772 |
HSBC Finance Corp.
5.25%, 1/15/14(a) | | | | 4,940 | | | 4,603,695 |
International Paper Co.
7.95%, 6/15/18(a) | | | | 2,550 | | | 2,505,658 |
JPMorgan Chase Capital XXV
Series Y
6.80%, 10/01/37(a) | | | | 8,340 | | | 6,393,060 |
JPMorgan Chase & Co.
4.625%, 1/31/11(a) | | EUR | | 1,400 | | | 1,894,636 |
JPMorgan Chase Bank NA
4.625%, 5/31/17(a)(c) | | | | 950 | | | 1,150,127 |
Kraft Foods, Inc.
6.125%, 8/23/18(a) | | US$ | | 10,240 | | | 9,561,549 |
Liberty Mutual Group, Inc.
5.75%, 3/15/14(a)(b) | | | | 5,310 | | | 4,743,349 |
7.80%, 3/15/37(a)(b) | | | | 5,195 | | | 3,137,718 |
Limited Brands, Inc.
6.90%, 7/15/17(a) | | | | 5,968 | | | 5,031,191 |
7.60%, 7/15/37(a) | | | | 4,675 | | | 3,807,493 |
Manufacturers & Traders Trust
6.625%, 12/04/17(a) | | | | 9,586 | | | 7,970,625 |
Masco Corp.
6.125%, 10/03/16(a) | | | | 4,765 | | | 4,140,218 |
McKesson Corp.
5.25%, 3/01/13(a) | | | | 7,605 | | | 7,551,552 |
Merrill Lynch & Co., Inc.
5.70%, 5/02/17(a) | | | | 8,855 | | | 7,247,950 |
6.05%, 5/16/16(a) | | | | 7,398 | | | 6,036,332 |
Mohawk Industries, Inc.
6.125%, 1/15/16(a) | | | | 10,340 | | | 9,314,748 |
Morgan Stanley
3.75%, 3/01/13(a) | | EUR | | 4,553 | | | 4,003,744 |
10.09%, 5/03/17(a)(b) | | BRL | | 13,035 | | | 3,973,041 |
Motorola, Inc.
6.50%, 9/01/25(a) | | US$ | | 12,010 | | | 9,213,640 |
National City Bank
5.80%, 6/07/17(a) | | | | 4,925 | | | 1,829,780 |
NB Capital Trust IV
8.25%, 4/15/27(a) | | | | 4,509 | | | 4,340,025 |
| | |
| 14 | | • ALLIANCEBERNSTEIN GLOBAL BOND FUND |
Portfolio of Investments
| | | | | | | |
| | | | | Principal
Amount
(000) | | U.S. $ Value |
| |
| | | | | | | |
Nextel Communications, Inc.
Series E
6.875%, 10/31/13(a) | | US$ | | 4,085 | | $ | 2,777,800 |
Nisource Finance Corp.
6.80%, 1/15/19(a) | | | | 7,790 | | | 7,075,976 |
NRG Energy, Inc.
7.375%, 2/01/16-1/15/17(a) | | | | 8,240 | | | 7,457,200 |
Oracle Corp.
5.75%, 4/15/18(a) | | | | 10,987 | | | 10,201,484 |
Owens Corning, Inc.
6.50%, 12/01/16(a) | | | | 9,619 | | | 8,511,978 |
PPG Industries, Inc.
6.65%, 3/15/18(a) | | | | 10,654 | | | 10,521,539 |
Prudential Financial, Inc.
Series MTND
5.15%, 1/15/13(a) | | | | 2,580 | | | 2,440,022 |
Qwest Corp.
7.625%, 6/15/15(a) | | | | 3,715 | | | 3,232,050 |
RBS Capital Trust A
6.467%, 6/30/12(a)(c) | | EUR | | 2,770 | | | 3,155,483 |
Reynolds American, Inc.
7.625%, 6/01/16(a) | | US$ | | 3,370 | | | 3,345,901 |
SLM Corp.
5.05%, 11/14/14(a) | | | | 11,588 | | | 7,068,680 |
5.375%, 5/15/14(a) | | | | 7,340 | | | 4,550,800 |
Southwest Airlines Co.
Series 07-1
6.15%, 8/01/22(a) | | | | 8,082 | | | 7,273,766 |
Sovereign Bank
5.125%, 3/15/13(a) | | | | 7,781 | | | 4,476,176 |
Sprint Capital Corp.
6.875%, 11/15/28(a) | | | | 7,150 | | | 4,790,500 |
8.75%, 3/15/32(a) | | | | 3,971 | | | 3,097,380 |
Starwood Hotels & Resorts Worldwide, Inc.
6.25%, 2/15/13(a) | | | | 8,000 | | | 7,540,240 |
7.375%, 11/15/15(a) | | | | 3,830 | | | 3,617,462 |
UBS Preferred Funding Trust I
8.622%, 10/01/10(a)(c) | | | | 8,481 | | | 8,197,311 |
Union Bank of California
5.95%, 5/11/16(a) | | | | 8,694 | | | 7,863,027 |
United States Steel Corp.
6.05%, 6/01/17(a) | | | | 8,280 | | | 7,194,914 |
US Bank NA
6.30%, 2/04/14(a) | | | | 4,585 | | | 4,469,738 |
Verizon Communications, Inc.
5.25%, 4/15/13(a) | | | | 2,825 | | | 2,722,848 |
Wachovia Bank NA
4.875%, 2/01/15(a) | | | | 4,080 | | | 2,418,363 |
| | |
| ALLIANCEBERNSTEIN GLOBAL BOND FUND • | | 15 |
Portfolio of Investments
| | | | | | | |
| | | | | Principal
Amount
(000) | | U.S. $ Value |
| |
| | | | | | | |
Wachovia Corp.
5.50%, 5/01/13(a) | | US$ | | 4,955 | | $ | 4,099,385 |
Wells Fargo & Co.
4.20%, 1/15/10(a) | | | | 3,845 | | | 3,792,224 |
Western Financial Bank
9.625%, 5/15/12(a) | | | | 3,179 | | | 2,963,909 |
The Western Union Co.
5.93%, 10/01/16(a) | | | | 9,665 | | | 8,689,628 |
Weyerhaeuser Co.
7.375%, 3/15/32(a) | | | | 8,345 | | | 7,317,330 |
Williams Cos, Inc.
7.875%, 9/01/21(a) | | | | 5,200 | | | 5,200,000 |
8.125%, 3/15/12(a) | | | | 1,460 | | | 1,475,067 |
Wyeth
5.50%, 2/01/14(a) | | | | 3,805 | | | 3,771,782 |
Wyndham Worldwide Corp.
6.00%, 12/01/16(a) | | | | 13,793 | | | 11,769,139 |
Wynn Las Vegas Capital Corp.
6.625%, 12/01/14(a) | | | | 4,100 | | | 3,495,250 |
| | | | | | | |
| | | | | | | 506,888,513 |
| | | | | | | |
Total Corporate Bonds
(cost $890,334,946) | | | | | | | 757,669,104 |
| | | | | | | |
| | | | | | | |
TREASURIES – 27.7% | | | | | | | |
Belgium – 2.3% | | | | | | | |
Belgium Government Bond
Series 48
4.00%, 3/28/22(a) | | EUR | | 38,000 | | | 49,822,267 |
| | | | | | | |
| | | |
Brazil – 2.0% | | | | | | | |
Republic of Brazil
12.50%, 1/05/16-1/05/22(a) | | BRL | | 80,503 | | | 43,795,265 |
| | | | | | | |
| | | |
Colombia – 0.5% | | | | | | | |
Republic of Colombia
12.00%, 10/22/15(a) | | COP | | 21,361,000 | | | 10,269,927 |
| | | | | | | |
| | | |
France – 4.8% | | | | | | | |
France Government Bond OAT
3.75%, 4/25/21(a) | | EUR | | 11,055 | | | 14,465,243 |
5.75%, 10/25/32(a) | | | | 54,960 | | | 87,867,520 |
| | | | | | | |
| | | | | | | 102,332,763 |
| | | | | | | |
Germany – 2.4% | | | | | | | |
Bundesrepublik Deutschland
Series 03
4.75%, 7/04/34(a) | | | | 6,690 | | | 9,546,740 |
Series 97
6.50%, 7/04/27(a) | | | | 23,900 | | | 41,390,144 |
| | | | | | | |
| | | | | | | 50,936,884 |
| | | | | | | |
| | |
| 16 | | • ALLIANCEBERNSTEIN GLOBAL BOND FUND |
Portfolio of Investments
| | | | | | | |
| | | | | Principal
Amount
(000) | | U.S. $ Value |
| |
| | | | | | | |
Netherlands – 9.3% | | | | | | | |
Netherlands Government Bond
4.50%, 7/15/17(a) | | EUR | | 108,079 | | $ | 154,413,706 |
7.50%, 1/15/23(a) | | | | 24,000 | | | 43,964,580 |
| | | | | | | |
| | | | | | | 198,378,286 |
| | | | | | | |
Peru – 0.9% | | | | | | | |
Peru Bono Soberano
9.91%, 5/05/15(a) | | PEN | | 54,332 | | | 19,589,942 |
| | | | | | | |
| | | |
Japan Government Ten Year Bond – 5.5% | | | | | | | |
Series 288
1.70%, 9/20/17(a) | | JPY | | 12,100,000 | | | 117,119,536 |
| | | | | | | |
| | | |
U.S. Treasury Notes – 0.0% | | | | | | | |
4.125%, 8/15/10(a) | | US$ | | 765 | | | 796,257 |
| | | | | | | |
| | | |
U.S. Treasury Bonds – 0.0% | | | | | | | |
4.75%, 2/15/37(a) | | | | 659 | | | 704,924 |
| | | | | | | |
| | | |
Total Treasuries
(cost $613,928,190) | | | | | | | 593,746,051 |
| | | | | | | |
| | | | | | | |
AGENCY FIXED RATE 30-YEARS – 20.8% | | | | | | | |
Federal National Mortgage Association
4.50%, TBA | | | | 130,000 | | | 122,931,250 |
5.50%, TBA | | | | 323,035 | | | 322,126,625 |
| | | | | | | |
| | | |
Total Agency Fixed Rate 30-Years
(cost $452,245,301) | | | | | | | 445,057,875 |
| | | | | | | |
| | | | | | | |
NON-AGENCY FIXED RATE CMBS – 7.8% | | | | | | | |
Banc of America Commercial Mortgage, Inc.
Series 2007-5, Class A4
5.492%, 2/10/51(a) | | | | 13,875 | | | 11,548,003 |
Bear Stearns Commercial Mortgage Securities, Inc.
Series 2006-T24, Class A4
5.537%, 10/12/41(a) | | | | 10,225 | | | 9,229,320 |
Commercial Mortgage Pass Through Certificates
Series 2006-C8, Class A4
5.306%, 12/10/46(a) | | | | 2,585 | | | 2,238,770 |
Series 2007-C9, Class A4
6.01%, 12/10/49(a) | | | | 11,682 | | | 10,463,926 |
| | |
| ALLIANCEBERNSTEIN GLOBAL BOND FUND • | | 17 |
Portfolio of Investments
| | | | | | | |
| | | | | Principal
Amount
(000) | | U.S. $ Value |
| |
| | | | | | | |
Credit Suisse Mortgage Capital Certificates
Series 2006-C5, Class A3
5.311%, 12/15/39(a) | | US$ | | 10,910 | | $ | 9,456,834 |
CS First Boston Mortgage Securities Corp.
Series 2004-C3, Class A5
5.113%, 7/15/36(a) | | | | 9,000 | | | 8,299,665 |
Greenwich Capital Commercial Funding Corp.
Series 2007-GG9, Class A2
5.381%, 3/10/39(a) | | | | 6,275 | | | 5,852,650 |
JP Morgan Chase Commercial Mortgage Securities Corp.
Series 2005-LDP5, Class A4
5.345%, 12/15/44(a) | | | | 8,530 | | | 7,726,008 |
Series 2006-CB16, Class A4
5.552%, 5/12/45(a) | | | | 7,160 | | | 6,298,956 |
Series 2006-CB17, Class A4
5.429%, 12/12/43(a) | | | | 17,020 | | | 14,783,301 |
Series 2007-C1, Class A4
5.716%, 2/15/51(a) | | | | 5,614 | | | 4,691,043 |
LB-UBS Commercial Mortgage Trust
Series 2006-C6, Class A4
5.372%, 9/15/39(a) | | | | 5,456 | | | 4,775,744 |
Series 2007-C1, Class A4
5.424%, 2/15/40(a) | | | | 11,490 | | | 9,648,730 |
Merrill Lynch Mortgage Trust
Series 2008-C1, Class A4
5.69%, 2/12/51(a) | | | | 6,460 | | | 5,459,414 |
Merrill Lynch/Countrywide Commercial Mortgage Trust
Series 2006-3, Class A4
5.414%, 7/12/46(a) | | | | 10,660 | | | 9,348,236 |
Series 2007-9, Class A4
5.70%, 9/12/49(a) | | | | 5,650 | | | 4,983,332 |
Morgan Stanley Capital
Series 2005-HQ6, Class A4A
4.989%, 8/13/42(a) | | | | 11,200 | | | 10,320,703 |
Series 2006-IQ12, Class A4
5.332%, 12/15/43(a) | | | | 10,000 | | | 8,673,572 |
Series 2007-HQ13, Class A3
5.569%, 12/15/44(a) | | | | 8,110 | | | 6,766,538 |
Series 2007-IQ15, Class A4
6.077%, 6/11/49(a) | | | | 2,624 | | | 2,271,050 |
Wachovia Bank Commercial Mortgage Trust
Series 2007-C32, Class A2
5.924%, 6/15/49(a) | | | | 16,425 | | | 15,380,922 |
| | | | | | | |
| | | |
Total Non-Agency Fixed Rate CMBS
(cost $184,694,247) | | | | | | | 168,216,717 |
| | | | | | | |
| | |
| 18 | | • ALLIANCEBERNSTEIN GLOBAL BOND FUND |
Portfolio of Investments
| | | | | | | |
| | | | | Principal
Amount
(000) | | U.S. $ Value |
| |
| | | | | | | |
AGENCY DEBENTURES – 5.4% | | | | | | | |
United States – 5.4% | | | | | | | |
Federal Home Loan Banks
3.625%, 10/18/13(a)
(cost $120,158,935) | | US$ | | 120,000 | | $ | 116,713,800 |
| | | | | | | |
| | | | | | | |
NON-INVESTMENT GRADE LOANS – 3.9% | | | | | | | |
United States – 3.9% | | | | | | | |
Aleris International, Inc.
5.25%, 12/19/13(c) | | | | 746 | | | 605,170 |
Alltel Corp.
5.32%, 5/15/15(c) | | | | 3,227 | | | 3,116,669 |
Amscan Holdings, Inc.
5.05%-5.46%, 5/27/13(c) | | | | 1,492 | | | 1,298,409 |
Aramark Corp.
2.44%, 1/27/14(c) | | | | 90 | | | 78,021 |
5.64%, 1/27/14(c) | | | | 1,410 | | | 1,228,104 |
Ashmore Energy International
3.66%, 3/30/12(c) | | | | 287 | | | 251,150 |
6.76%, 3/30/14(c) | | | | 2,158 | | | 1,888,339 |
Asurion Corp.
5.49%-5.80%, 7/03/14(c) | | | | 2,000 | | | 1,743,000 |
Boston Generating LLC
3.64%, 12/20/13(c) | | | | 167 | | | 131,752 |
6.01%, 12/20/13(c) | | | | 580 | | | 457,109 |
Calpine Corp.
6.65%, 3/31/14(c) | | | | 1,492 | | | 1,273,489 |
Carestream Health, Inc.
4.80%-5.76%, 4/30/13(c) | | | | 2,431 | | | 2,090,487 |
Celanese US Holdings LLC
4.28%, 4/02/14(c) | | | | 1,496 | | | 1,367,792 |
Charter Communications Operating LLC
4.80%, 3/06/14(c) | | | | 2,980 | | | 2,368,256 |
Chrysler Financial Services Americas LLC
6.82%, 8/03/12(c) | | | | 1,741 | | | 1,179,423 |
Clarke American Corp.
5.29%-6.26%, 6/30/14(c) | | | | 1,492 | | | 1,141,719 |
Community Health Services, Inc.
5.06%-5.97%, 7/25/14(c) | | | | 1,903 | | | 1,670,410 |
7/25/14(d) | | | | 97 | | | 85,430 |
Constellation Brands, Inc.
4.00%-4.31%, 6/05/13(c) | | | | 3,498 | | | 3,186,214 |
CSC Holdings, Inc. (Cablevision)
4.57%, 3/29/13(c) | | | | 1,489 | | | 1,339,695 |
Dealer Computer Services, Inc.
5.70%, 10/26/12(c) | | | | 1,880 | | | 1,673,156 |
Dex Media West LLC
7.00%-7.77%, 10/24/14(c) | | | | 2,000 | | | 1,756,660 |
| | |
| ALLIANCEBERNSTEIN GLOBAL BOND FUND • | | 19 |
Portfolio of Investments
| | | | | | | |
| | | | | Principal
Amount
(000) | | U.S. $ Value |
| |
| | | | | | | |
Dresser, Inc.
5.06%-5.95%, 5/04/14(c) | | US$ | | 1,977 | | $ | 1,783,794 |
First Data Corp.
5.93%-6.51%, 9/24/14(c) | | | | 1,484 | | | 1,278,063 |
FirstLight Power Resources, Inc.
3.66%, 11/01/13(c) | | | | 109 | | | 103,574 |
5.75%, 11/01/13(c) | | | | 849 | | | 803,855 |
7.71%, 5/01/14(c)(e) | | | | 1,750 | | | 1,645,000 |
Ford Motor Co.
5.49%, 12/16/13(c) | | | | 2,487 | | | 1,642,218 |
Freescale Semiconductor, Inc.
4.24%, 11/29/13(c) | | | | 1,990 | | | 1,616,036 |
Georgia-Pacific Corp.
4.57%-5.51%, 12/20/12(c) | | | | 1,913 | | | 1,668,695 |
Getty Images, Inc.
7.25%, 7/02/15(c) | | | | 1,050 | | | 1,015,875 |
Graham Packaging
4.75%-6.06%, 10/07/11(c) | | | | 1,985 | | | 1,776,474 |
Graphic Packaging Holding Co.
5.54%-6.51%, 5/16/14(c) | | | | 2,464 | | | 2,204,187 |
Hanesbrands, Inc.
4.55%-5.45%, 9/05/13(c) | | | | 2,000 | | | 1,807,000 |
Harrah’s Operating Co., Inc.
5.80%-6.76%, 1/28/15(c) | | | | 2,985 | | | 2,442,984 |
HCA, Inc.
6.01%, 11/18/13(c) | | | | 2,481 | | | 2,196,830 |
HCR Healthcare, LLC
6.21%, 12/22/14(c) | | | | 499 | | | 413,950 |
Health Management Associates
5.51%, 2/28/14(c) | | | | 1,936 | | | 1,633,355 |
Hexion Specialty
5.06%, 5/06/13(c) | | | | 1,633 | | | 1,224,481 |
6.06%, 5/06/13(c) | | | | 355 | | | 265,992 |
Huntsman International LLC
5.46%, 4/21/14(c) | | | | 2,000 | | | 1,757,860 |
IDEARC, Inc. (Verizon)
5.71%-5.77%, 11/17/14(c) | | | | 1,990 | | | 1,167,399 |
Lear Corp.
5.68%-6.26%, 4/25/12(c) | | | | 997 | | | 772,963 |
Level 3 Communications
4.74%-5.04%, 3/13/14(c) | | | | 2,000 | | | 1,696,260 |
Lyondellbasell
7.00%, 12/22/14(c) | | | | 1,393 | | | 978,583 |
Manitowoc Co., Inc.
8/25/14(d) | | | | 525 | | | 501,638 |
Metro-Goldwyn Mayer
7.01%, 4/09/12(c) | | | | 1,492 | | | 1,003,603 |
Mylan Laboratories, Inc.
7.00%-7.06%, 10/02/14(c) | | | | 1,492 | | | 1,393,395 |
| | |
| 20 | | • ALLIANCEBERNSTEIN GLOBAL BOND FUND |
Portfolio of Investments
| | | | | | | |
| | | | | Principal
Amount
(000) | | U.S. $ Value |
| |
| | | | | | | |
Newpage Corp.
7.00%, 12/22/14(c) | | US$ | | 1,492 | | $ | 1,360,188 |
Northeast Biofuels LLC
6/28/13(e) | | | | 960 | | | 480,094 |
6/28/13(e) | | | | 40 | | | 19,906 |
NRG Energy, Inc.
5.26%, 2/01/13(c) | | | | 994 | | | 869,399 |
Penn National Gaming, Inc.
4.24%-4.55%, 10/03/12(c) | | | | 1,343 | | | 1,218,681 |
Rite Aid Corp.
4.57%-5.52%, 6/04/14(c) | | | | 995 | | | 805,950 |
Sabre, Inc.
4.79%-5.71%, 9/30/14(c) | | | | 2,500 | | | 1,696,425 |
Sungard Data Systems, Inc.
4.55%, 2/28/14(c) | | | | 2,235 | | | 1,940,131 |
Telesat Canada
5.80%-6.77%, 10/31/14(c) | | | | 1,990 | | | 1,785,363 |
Thomson Learning
6.20%, 7/03/14(c) | | | | 2,235 | | | 1,813,507 |
TXU Corp.
5.99%-7.26%, 10/10/14(c) | | | | 2,481 | | | 2,084,980 |
Univision Communications, Inc.
5.05%-6.25%, 9/29/14(c) | | | | 2,750 | | | 1,750,842 |
West Corp.
5.17%-6.08%, 10/24/13(c) | | | | 1,492 | | | 1,119,318 |
Wide Open West Finance LLC
5.30%-6.27%, 6/30/14(c) | | | | 2,000 | | | 1,500,000 |
Wrigley Jr Company
7/25/14(e) | | | | 900 | | | 882,621 |
| | | | | | | |
| | | |
Total Non-Investment Grade Loans
(cost $91,957,302) | | | | | | | 84,051,923 |
| | | | | | | |
| | | | | | | |
SOVEREIGN AGENCIES – 3.0% | | | | | | | |
Germany – 0.5% | | | | | | | |
Kreditanstalt fuer Wiederaufbau
1.35%, 1/20/14(a) | | JPY | | 1,000,000 | | | 9,432,044 |
| | | | | | | |
| | | |
Japan – 1.8% | | | | | | | |
Development Bank of Japan
Series INTL
1.75%, 3/17/17(a) | | | | 3,000,000 | | | 28,752,104 |
Japan Finance Org for Municipal Enterprises
2.00%, 5/09/16(a) | | | | 1,000,000 | | | 9,847,839 |
| | | | | | | |
| | | | | | | 38,599,943 |
| | | | | | | |
Kazakhstan – 0.7% | | | | | | | |
KazMunaiGaz Finance Sub BV
8.375%, 7/02/13(a)(b) | | US$ | | 10,885 | | | 9,361,100 |
| | |
| ALLIANCEBERNSTEIN GLOBAL BOND FUND • | | 21 |
Portfolio of Investments
| | | | | | | |
| | | | | Principal
Amount
(000) | | U.S. $ Value |
| |
| | | | | | | |
9.125%, 7/02/18(a)(b) | | US$ | | 7,355 | | $ | 6,251,750 |
| | | | | | | |
| | | | | | | 15,612,850 |
| | | | | | | |
| | | |
Total Sovereign Agencies
(cost $68,463,248) | | | | | | | 63,644,837 |
| | | | | | | |
| | | | | | | |
EMERGING MARKETS – TREASURIES – 2.2% | | | | | | | |
Brazil – 0.5% | | | | | | | |
Federative Republic of Brazil
10.25%, 1/10/28(a) | | BRL | | 22,699 | | | 10,571,753 |
| | | | | | | |
| | | |
Colombia – 0.1% | | | | | | | |
Republic of Colombia
9.85%, 6/28/27(a) | | COP | | 5,288,000 | | | 2,205,232 |
| | | | | | | |
| | | |
Turkey – 1.6% | | | | | | | |
Turkey Government Bond
Zero Coupon, 11/26/08(a) | | TRY | | 7,989 | | | 6,133,503 |
Zero Coupon, 2/04/09(a) | | | | 4,461 | | | 3,310,749 |
Zero Coupon, 5/06/09(a) | | | | 11,880 | | | 8,434,379 |
16.00%, 3/07/12(a) | | | | 21,083 | | | 15,452,772 |
| | | | | | | |
| | | | | | | 33,331,403 |
| | | | | | | |
Total Emerging Markets – Treasuries
(cost $46,726,405) | | | | | | | 46,108,388 |
| | | | | | | |
| | | | | | | |
SOVEREIGN BONDS – 2.1% | | | | | | | |
Argentina – 0.3% | | | | | | | |
Argentina Bonos
7.00%, 10/03/15(a) | | US$ | | 13,136 | | | 7,540,179 |
| | | | | | | |
| | | |
Colombia – 0.5% | | | | | | | |
Republic of Colombia
11.75%, 2/25/20(a) | | | | 8,228 | | | 11,375,210 |
| | | | | | | |
| | | |
Ecuador – 0.2% | | | | | | | |
Ecuador Government International Bond
10.00%, 8/15/30(a)(b) | | | | 5,451 | | | 3,979,230 |
| | | | | | | |
| | | |
Indonesia – 0.6% | | | | | | | |
Indonesia Government International Bond
7.75%, 1/17/38(a)(b) | | | | 5,568 | | | 5,011,200 |
Indonesia Rupiah Credit Linked Note
12.90%, 6/17/22(a) | | IDR | | 70,203,600 | | | 7,200,861 |
| | | | | | | |
| | | | | | | 12,212,061 |
| | | | | | | |
Russia – 0.3% | | | | | | | |
Russian Federation
7.50%, 3/31/30(a)(b)(f) | | US$ | | 7,350 | | | 7,386,750 |
| | | | | | | |
| | |
| 22 | | • ALLIANCEBERNSTEIN GLOBAL BOND FUND |
Portfolio of Investments
| | | | | | | |
| | | | | Principal
Amount
(000) | | U.S. $ Value |
| |
| | | | | | | |
Turkey – 0.2% | | | | | | | |
Republic of Turkey
6.875%, 3/17/36(a) | | US$ | | 3,780 | | $ | 3,326,400 |
| | | | | | | |
| | | |
Total Sovereign Bonds
(cost $49,366,236) | | | | | | | 45,819,830 |
| | | | | | | |
| | | | | | | |
INFLATION-LINKED SECURITIES – 2.0% | | | | | | | |
U.S. Treasury Notes – 2.0% | | | | | | | |
3.00%, 7/15/12 (TIPS)(a)
(cost $45,974,124) | | | | 41,949 | | | 43,662,594 |
| | | | | | | |
| | | | | | | |
COVERED BONDS – 1.8% | | | | | | | |
United Kingdom – 1.8% | | | | | | | |
Abbey National Treasury Services PLC/London
4.25%, 4/12/21(a) | | EUR | | 16,000 | | | 19,894,016 |
HBOS Treasury Services PLC
4.75%, 6/08/22(a) | | | | 16,000 | | | 19,378,558 |
| | | | | | | |
| | | |
Total Covered Bonds
(cost $40,024,538) | | | | | | | 39,272,574 |
| | | | | | | |
| | | | | | | |
QUASI-SOVEREIGN BONDS – 1.2% | | | | | | | |
Chile – 0.2% | | | | | | | |
Corp. Nacional del Cobre de Chile – CODELCO
6.15%, 10/24/36(a)(b) | | US$ | | 6,110 | | | 5,435,884 |
| | | | | | | |
| | | |
Russia – 1.0% | | | | | | | |
RSHB Capital SA for OJSC Russian Agricultural Bank
7.125%, 1/14/14(a)(b) | | | | 13,552 | | | 11,214,280 |
7.75%, 5/29/18(a)(b) | | | | 13,000 | | | 9,869,600 |
| | | | | | | |
| | | | | | | 21,083,880 |
| | | | | | | |
Total Quasi-Sovereign Bonds
(cost $32,414,798) | | | | | | | 26,519,764 |
| | | | | | | |
| | | | | | | |
SUPRANATIONALS – 0.9% | | | | | | | |
Supranational – 0.9% | | | | | | | |
European Investment Bank
Series INTL
1.40%, 6/20/17(a)
(cost $20,016,529) | | JPY | | 2,000,000 | | | 18,673,236 |
| | | | | | | |
| | | | | | | |
NON-AGENCY ADJUSTABLE
RATES – 0.3% | | | | | | | |
Merrill Lynch Mortgage Investors, Inc. Series 2005-A9, Class 2A1A
5.141%, 12/25/35(g)
(cost $6,420,250) | | US$ | | 6,903 | | | 6,449,479 |
| | | | | | | |
| | |
| ALLIANCEBERNSTEIN GLOBAL BOND FUND • | | 23 |
Portfolio of Investments
| | | | | | | | |
| | | | | Principal
Amount
(000) | | U.S. $ Value | |
| | |
| | | | | | | | |
REGIONAL BONDS – 0.1% | | | | | | | | |
Colombia – 0.1% | | | | | | | | |
Bogota Distrio Capital
9.75%, 7/26/28(a)(b)
(cost $2,411,470) | | COP | | 5,550,000 | | $ | 2,084,055 | |
| | | | | | | | |
| | | |
| | | | | Shares | | | |
PREFERRED STOCKS – 0.0% | | | | | | | | |
Federal National Mortgage Association
8.25%(a)(c)
(cost $2,673,750) | | | | 106,950 | | | 213,900 | |
| | | | | | | | |
| | | |
| | | | | Principal
Amount
(000) | | | |
SHORT-TERM INVESTMENTS – 3.4% | | | | | | | | |
Treasury Bills – 3.4% | | | | | | | | |
United States Treasury Bill
Zero Coupon, 12/04/08(a)
(cost $71,818,240) | | US$ | | 72,000 | | | 71,908,488 | |
| | | | | | | | |
| | | |
Total Investments – 117.9%
(cost $2,739,628,509) | | | | | | | 2,529,812,615 | |
Other assets less liabilities – (17.9)% | | | | | | | (384,295,973 | ) |
| | | | | | | | |
| | | |
Net Assets – 100.0% | | | | | | $ | 2,145,516,642 | |
| | | | | | | | |
FINANCIAL FUTURES CONTRACTS (see Note D)
| | | | | | | | | | | | | | |
| Type | | Number of
Contracts | | Expiration
Month | | Original
Value | | Value at
September 30,
2008 | | Unrealized
Appreciation/
(Depreciation) | |
Sold Contracts | | | | | | | | | | | | | | |
Euro-Bobl Future* | | 850,000 | | December 2008 | | $ | 131,449,805 | | $ | 131,288,260 | | $ | 161,545 | |
Euro-Bobl Future* | | 593,000 | | December 2008 | | | 90,511,770 | | | 91,592,869 | | | (1,081,099 | ) |
Euro-Bobl Future* | | 71,000 | | December 2008 | | | 10,837,491 | | | 10,966,431 | | | (128,940 | ) |
Euro-Bobl Future* | | 302,000 | | December 2008 | | | 46,108,125 | | | 46,645,947 | | | (537,822 | ) |
Euro-Bobl Future* | | 30,000 | | December 2008 | | | 4,580,488 | | | 4,633,703 | | | (53,215 | ) |
Euro-Bobl Future* | | 4,000 | | December 2008 | | | 610,816 | | | 617,827 | | | (7,011 | ) |
US 2 Yr Treasury Note | | 72,000 | | December 2008 | | | 7,625,250 | | | 7,683,750 | | | (58,500 | ) |
US 2 Yr Treasury Note | | 518,000 | | December 2008 | | | 54,862,675 | | | 55,280,312 | | | (417,637 | ) |
US 2 Yr Treasury Note | | 454,000 | | December 2008 | | | 48,095,625 | | | 48,450,312 | | | (354,687 | ) |
US 2 Yr Treasury Note | | 22,000 | | December 2008 | | | 2,330,763 | | | 2,347,813 | | | (17,050 | ) |
US 5 Yr Treasury Note | | 1,037,000 | | December 2008 | | | 115,900,953 | | | 116,387,047 | | | (486,094 | ) |
US 5 Yr Treasury Note | | 153,000 | | December 2008 | | | 17,101,097 | | | 17,171,859 | | | (70,762 | ) |
| | |
| 24 | | • ALLIANCEBERNSTEIN GLOBAL BOND FUND |
Portfolio of Investments
| | | | | | | | | | | | | | |
| Type | | Number of
Contracts | | Expiration
Month | | Original
Value | | Value at
September 30,
2008 | | Unrealized
Appreciation/
(Depreciation) | |
US 5 Yr Treasury Note | | 167,000 | | December 2008 | | $ | 18,672,688 | | $ | 18,743,141 | | $ | (70,453 | ) |
US 5 Yr Treasury Note | | 1,488,000 | | December 2008 | | | 166,388,625 | | | 167,004,750 | | | (616,125 | ) |
US 5 Yr Treasury Note | | 275,000 | | December 2008 | | | 30,752,734 | | | 30,864,453 | | | (111,719 | ) |
US Treasury Bond Future | | 716,000 | | December 2008 | | | 83,883,875 | | | 83,895,063 | | | (11,188 | ) |
| | | | | | | | | | | | | | |
| | | | | | | | | | | | | $ (3,860,757 | ) |
| | | | | | | | | | | | | | |
FORWARD CURRENCY EXCHANGE CONTRACTS (see Note D)
| | | | | | | | | | | | |
| | | Contract
Amount
(000) | | U.S. $
Value on
Origination
Date | | U.S. $
Value at
September 30,
2008 | | Unrealized
Appreciation/
(Depreciation) | |
Buy Contracts: | | | | | | | | | | | | |
Canadian Dollar
settling 10/23/08 | | 33,098 | | $ | 31,030,612 | | $ | 31,140,361 | | $ | 109,749 | |
Japanese Yen
settling 10/27/08 | | 368,912 | | | 3,489,636 | | | 3,483,147 | | | (6,489 | ) |
Japanese Yen
settling 11/06/08 | | 6,642,778 | | | 61,349,856 | | | 62,813,258 | | | 1,463,402 | |
Norwegian Kroner
settling 10/20/08 | | 188,734 | | | 35,280,717 | | | 32,086,644 | | | (3,194,073 | ) |
Norwegian Kroner
settling 10/20/08 | | 5,431 | | | 952,473 | | | 923,323 | | | (29,150 | ) |
Swedish Krona
settling 10/15/08 | | 184,861 | | | 28,138,811 | | | 26,710,849 | | | (1,427,962 | ) |
Swedish Krona
settling 10/15/08 | | 9,131 | | | 1,356,479 | | | 1,319,354 | | | (37,125 | ) |
Swedish Krona
settling 10/15/08 | | 171,966 | | | 25,489,702 | | | 24,847,632 | | | (642,070 | ) |
| | | | | | | | | | | | |
Sale Contracts: | | | | | | | | | | | | |
British Pound
settling 10/22/08 | | 8,450 | | | 16,333,876 | | | 15,048,021 | | | 1,285,855 | |
Canadian Dollar
settling 10/23/08 | | 18,401 | | | 17,580,205 | | | 17,312,897 | | | 267,308 | |
Canadian Dollar
settling 10/23/08 | | 21,927 | | | 20,588,818 | | | 20,630,468 | | | (41,650 | ) |
Euro Dollar
settling 10/06/08 | | 113,666 | | | 177,728,789 | | | 160,106,737 | | | 17,622,052 | |
Euro Dollar
settling 10/30/08 | | 119,716 | | | 175,129,885 | | | 169,040,259 | | | 6,089,626 | |
Euro Dollar
settling 10/30/08 | | 2,238 | | | 3,161,297 | | | 3,160,267 | | | 1,030 | |
Euro Dollar
settling 12/03/08 | | 146,609 | | | 215,571,440 | | | 207,040,927 | | | 8,530,513 | |
Japanese Yen
settling 10/08/08 | | 6,842,368 | | | 63,828,057 | | | 64,384,471 | | | (556,414 | ) |
| | |
| ALLIANCEBERNSTEIN GLOBAL BOND FUND • | | 25 |
Portfolio of Investments
| | | | | | | | | | | | |
| | | Contract
Amount
(000) | | U.S. $
Value on
Origination
Date | | U.S. $
Value at
September 30,
2008 | | Unrealized
Appreciation/
(Depreciation) | |
Japanese Yen
settling 10/27/08 | | 6,951,011 | | $ | 65,240,138 | | $ | 65,629,102 | | $ | (388,964 | ) |
Japanese Yen
settling 10/27/08 | | 343,812 | | | 3,257,055 | | | 3,246,158 | | | 10,897 | |
Japanese Yen
settling 10/27/08 | | 12,230,513 | | | 116,292,796 | | | 115,476,392 | | | 816,404 | |
Norwegian Kroner
settling 10/20/08 | | 66,755 | | | 12,047,605 | | | 11,348,925 | | | 698,680 | |
Swedish Krona
settling 10/15/08 | | 70,690 | | | 10,887,217 | | | 10,214,065 | | | 673,152 | |
Turkish Lira
settling 11/05/08 | | 16,328 | | | 12,886,075 | | | 12,715,520 | | | 170,555 | |
| (a) | Position, or a portion thereof, has been segregated to collateralize forward currency exchange contracts. The aggregate market value of these securities amounted to $1,979,853,093. |
| (b) | Security is exempt from registration under Rule 144A of the Securities Act of 1933. These securities are considered liquid and may be resold in transactions exempt from registration, normally to qualified institutional buyers. At September 30, 2008, the aggregate market value of these securities amounted to $172,451,713 or 8.0% of net assets. |
| (c) | Variable rate coupon, rate shown as of September 30, 2008. |
| (d) | This position represents unfunded or partially unfunded loan commitments. Investments in unfunded loan commitments obligate the Fund to fund these commitments at the borrower’s discretion. At period end, the market value and unrealized (loss) of these unfunded loan commitments amounted to $587,068 and $(18,464), respectively. The coupon rate will be determined at the time of funding and will be based upon the London-Interbank Offered Rate (“LIBOR”) plus a premium which was determined at the time of purchase. |
| (e) | This position or a portion of this position represents an unsettled loan purchase. At September 30, 2008, the market value and unrealized (loss) of these unsettled loan purchases amounted to $2,322,621 and $(150,539), respectively. The coupon rate will be determined at the time of settlement and will be based upon the London-Interbank Offered Rate (“LIBOR”) plus a premium which was determined at the time of purchase. |
| (f) | Coupon rate adjusts periodically based upon a predetermined schedule. Stated interest rate in effect at September 30, 2008. |
| (g) | Floating Rate Security. Stated interest rate was in effect at September 30, 2008. |
| * | Medium-term debt security issued by the German Government. |
| | |
Currency Abbreviations: BRL – Brazilian Real CAD – Canadian Dollar COP – Colombian Peso EUR – Euro Dollar GBP – Great British Pound | | IDR – Indonesian Rupiah JPY – Japanese Yen PEN – Peruvian New Sol RUB – Russian Rouble TRY – New Turkish Lira |
Glossary:
CMBS – Commercial Mortgage-Backed Securities
MTN – Medium Term Note
OJSC – Open Joint Stock Company
TBA – To Be Announced
TIPS – Treasury Inflation Protected Security
See notes to financial statements.
| | |
| 26 | | • ALLIANCEBERNSTEIN GLOBAL BOND FUND |
Portfolio of Investments
STATEMENT OF ASSETS & LIABILITIES
September 30, 2008
| | | | |
| Assets | | | | |
Investments in securities, at value (cost $2,739,628,509) | | $ | 2,529,812,615 | |
Cash | | | 8,930,135 | (a) |
Foreign currencies, at value (cost $463,616) | | | 453,895 | |
Unrealized appreciation of forward currency
exchange contracts | | | 37,739,223 | |
Interest receivable | | | 36,379,716 | |
Receivable for variation margin on futures contracts | | | 17,235,142 | |
Receivable for capital stock sold | | | 6,867,000 | |
Receivable for investment securities sold | | | 2,771,685 | |
Other assets | | | 528,520 | |
| | | | |
Total assets | | | 2,640,717,931 | |
| | | | |
| Liabilities | | | | |
Unrealized depreciation of forward currency
exchange contracts | | | 6,323,897 | |
Payable for investment securities purchased | | | 469,172,319 | |
Payable for capital stock redeemed | | | 14,085,856 | |
Dividends payable | | | 2,670,047 | |
Payable for variation margin on futures contracts | | | 981,237 | |
Distribution fee payable | | | 912,989 | |
Advisory fee payable | | | 409,270 | |
Transfer Agent fee payable | | | 183,174 | |
Custodian fee payable | | | 152,356 | |
Administrative fee payable | | | 28,137 | |
Accrued expenses and other liabilities | | | 282,007 | |
| | | | |
Total liabilities | | | 495,201,289 | |
| | | | |
Net Assets | | $ | 2,145,516,642 | |
| | | | |
| Composition of Net Assets | | | | |
Capital stock, at par | | $ | 290,248 | |
Additional paid-in capital | | | 2,391,407,016 | |
Distributions in excess of net investment income | | | (8,237,096 | ) |
Accumulated net realized loss on investments
and foreign currency transactions | | | (52,765,466 | ) |
Net unrealized depreciation of investments and foreign currency denominated assets and liabilities | | | (185,178,060 | ) |
| | | | |
| | $ | 2,145,516,642 | |
| | | | |
Net Asset Value Per Share—21 billion shares of capital stock authorized, $.001 par value
| | | | | | | | | |
| Class | | Net Asset | | Shares
Outstanding | | Net Asset
Value | |
| A | | $ | 1,425,649,263 | | 193,003,988 | | $ | 7.39 | * |
| | |
| B | | $ | 137,926,105 | | 18,665,469 | | $ | 7.39 | |
| | |
| C | | $ | 492,541,251 | | 66,469,453 | | $ | 7.41 | |
| | |
| Advisor | | $ | 89,152,214 | | 12,075,609 | | $ | 7.38 | |
| | |
| R | | $ | 122,018 | | 16,518 | | $ | 7.39 | |
| | |
| K | | $ | 58,605 | | 7,939 | | $ | 7.38 | |
| | |
| I | | $ | 67,186 | | 9,097 | | $ | 7.39 | |
| | |
| * | The maximum offering price per share for Class A shares was $7.72 which reflects a sales charge of 4.25%. |
| (a) | An amount equivalent to $7,581,500 has been segregated to collateralize margin requirements for open futures contracts outstanding at September 30, 2008. |
See notes to financial statements.
| | |
| ALLIANCEBERNSTEIN GLOBAL BOND FUND • | | 27 |
Statement of Assets & Liabilities
STATEMENT OF OPERATIONS
Year Ended September 30, 2008
| | | | | | | | |
| Investment Income | | | | | | | | |
Interest (net of foreign taxes withheld of $44,472) | | $ | 125,355,873 | | | | | |
Dividends | | | 177,687 | | | $ | 125,533,560 | |
| | | | | | | | |
| Expenses | | | | | | | | |
Advisory fee (see Note B) | | | 10,057,085 | | | | | |
Distribution fee—Class A | | | 4,165,831 | | | | | |
Distribution fee—Class B | | | 1,585,541 | | | | | |
Distribution fee—Class C | | | 4,376,726 | | | | | |
Distribution fee—Class R | | | 185 | | | | | |
Distribution fee—Class K | | | 40 | | | | | |
Transfer agency—Class A | | | 1,416,955 | | | | | |
Transfer agency—Class B | | | 196,697 | | | | | |
Transfer agency—Class C | | | 463,257 | | | | | |
Transfer agency—Advisor Class | | | 36,855 | | | | | |
Transfer agency—Class R | | | 87 | | | | | |
Transfer agency—Class K | | | 17 | | | | | |
Transfer agency—Class I | | | 24 | | | | | |
Custodian | | | 1,267,982 | | | | | |
Printing | | | 287,383 | | | | | |
Registration | | | 271,395 | | | | | |
Administrative | | | 109,575 | | | | | |
Audit | | | 95,652 | | | | | |
Legal | | | 81,965 | | | | | |
Directors’ fees | | | 49,622 | | | | | |
Miscellaneous | | | 46,465 | | | | | |
| | | | | | | | |
Total expenses before interest expense | | | 24,509,339 | | | | | |
Interest expense | | | 2,912,937 | | | | | |
| | | | | | | | |
Total expenses | | | 27,422,276 | | | | | |
Less: expenses waived and reimbursed by the Adviser (see Note B) | | | (2,051,161 | ) | | | | |
Less: expense offset arrangement
(see Note B) | | | (53,106 | ) | | | | |
| | | | | | | | |
Net expenses | | | | | | | 25,318,009 | |
| | | | | | | | |
Net investment income | | | | | | | 100,215,551 | |
| | | | | | | | |
| Realized and Unrealized Gain (Loss) on Investments and Foreign Currency Transactions | | | | | | | | |
Net realized gain (loss) on: | | | | | | | | |
Investment transactions | | | | | | | 60,551,615 | |
Futures contracts | | | | | | | (1,103,412 | ) |
Foreign currency transactions | | | | | | | 7,106,697 | |
Net change in unrealized appreciation/depreciation of: | | | | | | | | |
Investments | | | | | | | (312,179,077 | ) |
Futures contracts | | | | | | | (4,861,178 | ) |
Foreign currency denominated assets and liabilities | | | | | | | 44,230,455 | |
| | | | | | | | |
Net loss on investments and foreign currency transactions | | | | | | | (206,254,900 | ) |
| | | | | | | | |
Net Decrease in Net Assets from Operations | | | | | | $ | (106,039,349 | ) |
| | | | | | | | |
See notes to financial statements.
| | |
| 28 | | • ALLIANCEBERNSTEIN GLOBAL BOND FUND |
Statement of Operations
STATEMENT OF CHANGES IN NET ASSETS
| | | | | | | | |
| | | Year Ended
September 30,
2008 | | | Year Ended
September 30,
2007 | |
| Increase (Decrease) in Net Assets from Operations | | | | | | | | |
Net investment income | | $ | 100,215,551 | | | $ | 70,965,301 | |
Net realized gain on investments and foreign currency transactions | | | 66,554,900 | | | | 87,098,363 | |
Net change in unrealized
appreciation/depreciation of investments and foreign currency denominated assets and liabilities | | | (272,809,800 | ) | | | 11,215,167 | |
| | | | | | | | |
Net increase (decrease) in net assets from operations | | | (106,039,349 | ) | | | 169,278,831 | |
| Dividends to Shareholders from | | | | | | | | |
Net investment income | | | | | | | | |
Class A | | | (69,217,164 | ) | | | (48,204,983 | ) |
Class B | | | (6,716,788 | ) | | | (9,719,344 | ) |
Class C | | | (18,662,192 | ) | | | (11,522,327 | ) |
Advisor Class | | | (1,409,612 | ) | | | – 0 | – |
Class R | | | (1,815 | ) | | | – 0 | – |
Class K | | | (804 | ) | | | – 0 | – |
Class I | | | (4,344 | ) | | | – 0 | – |
| Capital Stock Transactions | | | | | | | | |
Net increase (decrease) | | | 796,947,653 | | | | (19,137,841 | ) |
| | | | | | | | |
Capital Contributions | | | | | | | | |
Proceeds from third party contributions (see Note E) | | | 528,520 | | | | – 0 | – |
| | | | | | | | |
Total increase | | | 595,424,105 | | | | 80,694,336 | |
| Net Assets | | | | | | | | |
Beginning of period | | | 1,550,092,537 | | | | 1,469,398,201 | |
| | | | | | | | |
End of period (including distributions in excess of net investment income of $(8,237,096) and $(19,546,625), respectively) | | $ | 2,145,516,642 | | | $ | 1,550,092,537 | |
| | | | | | | | |
See notes to financial statements.
| | |
| ALLIANCEBERNSTEIN GLOBAL BOND FUND • | | 29 |
Statement of Changes in Net Assets
NOTES TO FINANCIAL STATEMENTS
September 30, 2008
NOTE A
Significant Accounting Policies
AllianceBernstein Global Bond Fund, Inc. (the “Fund”), formerly AllianceBernstein Global Government Income Trust, Inc., was incorporated as a Maryland corporation on February 3, 1992 and is registered under the Investment Company Act of 1940 as a non-diversified, open-end management investment company. The Fund offers Class A, Class B, Class C, Advisor Class, Class R, Class K and Class I shares. Class A shares are sold with a front-end sales charge of up to 4.25% for purchases not exceeding $1,000,000. With respect to purchases of $1,000,000 or more, Class A shares redeemed within one year of purchase may be subject to a contingent deferred sales charge of 1%. Class B shares are currently sold with a contingent deferred sales charge which declines from 3% to zero depending on the period of time the shares are held. Class B shares will automatically convert to Class A shares six years after the end of the calendar month of purchase. Class C shares are subject to a contingent deferred sales charge of 1% on redemptions made within the first year after purchase. Class R and Class K shares are sold without an initial or contingent deferred sales charge. Advisor Class and Class I shares are sold without an initial or contingent deferred sales charge and are not subject to ongoing distribution expense. All seven classes of shares have identical voting, dividend, liquidation and other rights, except that the classes bear different distribution and transfer agency expenses. Each class has exclusive voting rights with respect to its distribution plan. The financial statements have been prepared in conformity with U.S. generally accepted accounting principles, which require management to make certain estimates and assumptions that affect the reported amounts of assets and liabilities in the financial statements and amounts of income and expenses during the reporting period. Actual results could differ from those estimates. The following is a summary of significant accounting policies followed by the Fund.
1. Security Valuation
Portfolio securities are valued at their current market value determined on the basis of market quotations or, if market quotations are not readily available or are deemed unreliable, at “fair value” as determined in accordance with procedures established by and under the general supervision of the Fund’s Board of Directors.
In general, the market value of securities which are readily available and deemed reliable are determined as follows. Securities listed on a national securities exchange (other than securities listed on the NASDAQ Stock Market, Inc. (“NASDAQ”)) or on a foreign securities exchange are valued at the last sale price at the close of the exchange or foreign securities exchange. If there has been no sale on such day, the securities are valued at the mean of the closing bid and asked prices on such day. Securities listed on more than one exchange are valued by reference to the principal exchange on which the securities are traded; securities listed only on NASDAQ are valued in accordance with the NASDAQ Official Closing Price; listed put or call options are valued at the last sale price. If
| | |
| 30 | | • ALLIANCEBERNSTEIN GLOBAL BOND FUND |
Notes to Financial Statements
there has been no sale on that day, such securities will be valued at the closing bid prices on that day; open futures contracts and options thereon are valued using the closing settlement price or, in the absence of such a price, the most recent quoted bid price. If there are no quotations available for the day of valuation, the last available closing settlement price is used; securities traded in the over-the-counter market (“OTC”) are valued at the mean of the current bid and asked prices as reported by the National Quotation Bureau or other comparable sources; U.S. Government securities and other debt instruments having 60 days or less remaining until maturity are valued at amortized cost if their original maturity was 60 days or less; or by amortizing their fair value as of the 61st day prior to maturity if their original term to maturity exceeded 60 days; fixed-income securities, including mortgage backed and asset backed securities, may be valued on the basis of prices provided by a pricing service or at a price obtained from one or more of the major broker/dealers. In cases where broker/dealer quotes are obtained, AllianceBernstein, L.P. (the “Adviser”) may establish procedures whereby changes in market yields or spreads are used to adjust, on a daily basis, a recently obtained quoted price on a security; and OTC and other derivatives are valued on the basis of a quoted bid price or spread from a major broker/dealer in such security.
Investments in money market funds are valued at their net asset value each day.
Securities for which market quotations are not readily available (including restricted securities) or are deemed unreliable are valued at fair value. Factors considered in making this determination may include, but are not limited to, information obtained by contacting the issuer, analysts, analysis of the issuer’s financial statements or other available documents. In addition, the Fund may use fair value pricing for securities primarily traded in non-U.S. markets because, most foreign markets close well before the Fund values its securities at 4:00 p.m., Eastern Time. The earlier close of these foreign markets gives rise to the possibility that significant events, including broad market moves, may have occurred in the interim and may materially affect the value of those securities.
2. Currency Translation
Asset and liabilities denominated in foreign currencies and commitments under forward currency exchange contracts are translated into U.S. dollars at the mean of the quoted bid and asked prices of such currencies against the U.S. dollar. Purchases and sales of portfolio securities are translated into U.S. dollars at the rates of exchange prevailing when such securities were acquired or sold. Income and expenses are translated into U.S. dollars at the rates of exchange prevailing when accrued.
Net realized gain or loss on foreign currency transactions represents foreign exchange gains and losses from sales and maturities of foreign fixed income investments, foreign currency exchange contracts, holding of foreign currencies, currency gains or losses realized between the trade and settlement dates on
| | |
| ALLIANCEBERNSTEIN GLOBAL BOND FUND • | | 31 |
Notes to Financial Statements
foreign investment transactions, and the difference between the amounts of dividends, interest and foreign withholding taxes recorded on the Fund’s books and the U.S. dollar equivalent amounts actually received or paid. Net unrealized currency gains and losses from valuing foreign currency denominated assets and liabilities at period end exchange rates are reflected as a component of unrealized appreciation and depreciation of investments and foreign currency denominated assets and liabilities.
3. Taxes
It is the Fund’s policy to meet the requirements of the Internal Revenue Code applicable to regulated investment companies and to distribute all of its investment company taxable income and net realized gains, if any, to shareholders. Therefore, no provisions for federal income or excise taxes are required. The Fund may be subject to taxes imposed by countries in which it invests. Such taxes are generally based on income and/or capital gains earned or repatriated. Taxes are accrued and applied to net investment income, net realized gains and net unrealized appreciation/depreciation as such income and/or gains are earned.
In accordance with the Financial Accounting Standard Board (“FASB”) Interpretation No. 48, Accounting for Uncertainties in Income Taxes (“FIN 48”), management has analyzed the Fund’s tax positions taken on federal and state income tax returns for all open tax years (the current and the prior three tax years) and has concluded that no provision for income tax is required in the Fund’s financial statements.
4. Investment Income and Investment Transactions
Dividend income is recorded on the ex-dividend date or as soon as the Fund is informed of the dividend. Interest income is accrued daily. Investment transactions are accounted for on the date securities are purchased or sold. Investment gains or losses are determined on the identified cost basis. The Fund amortizes premiums and accretes discounts as adjustments to interest income.
5. Class Allocations
All income earned and expenses incurred by the Fund are borne on a pro-rata basis by each settled class of shares, based on the proportionate interest in the Fund represented by the net assets of such class, except for class specific expenses which are allocated to the respective class. Realized and unrealized gains and losses are allocated among the various share classes based on their respective net assets.
6. Dividends and Distributions
Dividends and distributions to shareholders are recorded on the ex-dividend date. Income and capital gains distributions are determined in accordance with federal tax regulations and may differ from those determined in accordance with U.S. generally accepted accounting principles. To the extent these differences are permanent, such amounts are reclassified within the capital accounts based on their federal tax basis treatment; temporary differences do not require such reclassification.
| | |
| 32 | | • ALLIANCEBERNSTEIN GLOBAL BOND FUND |
Notes to Financial Statements
7. Repurchase Agreements
It is the Fund’s policy that its custodian or designated subcustodian take control of securities as collateral under repurchase agreements and to determine on a daily basis that the value of such securities is sufficient to cover the value of the repurchase agreements. If the seller defaults and the value of the collateral declines, or if bankruptcy proceedings are commenced with respect to seller of the security, realization of collateral by the Fund may be delayed or limited.
NOTE B
Advisory Fee and Other Transactions with Affiliates
Under the terms of the investment advisory agreement, the Fund pays the Adviser an advisory fee at an annual rate of .50% of the first $2.5 billion, .45% of the next $2.5 billion and .40% in excess of $5 billion, of the Fund’s average daily adjusted net assets. The fee is accrued daily and paid monthly. Effective November 5, 2007, the Fund’s Adviser has agreed to waive its fees and bear certain expenses to the extent necessary to limit total operating expenses on an annual basis to .90%, 1.60%, 1.60%, .60%, 1.10%, .85% and .60% of the average daily net assets for Class A, Class B, Class C, Advisor Class, Class R, Class K and Class I shares, respectively. For the year ended September 30, 2008, such reimbursement amounted to $2,051,161.
Pursuant to the investment advisory agreement, the Fund may reimburse the Adviser for certain legal and accounting services provided to the Fund by the Adviser. For the year ended September 30, 2008, such fees amounted to $109,575.
The Fund compensates AllianceBernstein Investor Services, Inc. (“ABIS”), a wholly-owned subsidiary of the Adviser, under a Transfer Agency Agreement for providing personnel and facilities to perform transfer agency services for the Fund. ABIS may make payments to intermediaries that provide omnibus account services, sub-accounting services and/or networking services. The compensation retained by ABIS amounted to $954,060 for the year ended September 30, 2008.
For the year ended September 30, 2008, the expenses of Class A, Class B, Class C and Advisor Class shares were reduced by $53,106 under an expense offset arrangement with ABIS.
AllianceBernstein Investments, Inc. (the “Distributor”), a wholly-owned subsidiary of the Adviser, serves as the distributor of the Fund’s shares. The Distributor has advised the Fund that it has retained front-end sales charges of $219,813 from the sales of Class A shares and received $44,147, $132,810 and $134,516 in contingent deferred sales charges imposed upon redemptions by shareholders of Class A, Class B and Class C shares, respectively, for the year ended September 30, 2008.
| | |
| ALLIANCEBERNSTEIN GLOBAL BOND FUND • | | 33 |
Notes to Financial Statements
NOTE C
Distribution Services Agreement
The Fund has adopted a Distribution Services Agreement (the “Agreement”) pursuant to Rule 12b-1 under the Investment Company Act of 1940. Under the Agreement the Fund pays distribution and servicing fees to the Distributor at an annual rate of up to .30% of the Fund’s average daily net assets attributable to Class A shares, 1% of the Fund’s average daily net assets attributable to the Class B and Class C shares, .50% of the Fund’s average daily net assets attributable to Class R shares and .25% of the Fund’s average daily net assets attributable to Class K shares. There are no distribution and servicing fees on the Advisor Class and Class I shares. The fees are accrued daily and paid monthly. The Agreement provides that the Distributor will use such payments in their entirety for distribution assistance and promotional activities. The Distributor has incurred expenses in excess of the distribution costs reimbursed by the Fund in the amounts of $27,858,582, $11,386,920, $94 and $18 for Class B, Class C, Class R and Class K shares, respectively. While such costs may be recovered from the Fund in future periods so long as the Agreement is in effect, the rate of the distribution and servicing fees payable under the Agreement may not be increased without a shareholder vote. In accordance with the Agreement, there is no provision for recovery of unreimbursed distribution costs incurred by the Distributor beyond the current fiscal year for Class A shares. The Agreement also provides that the Adviser may use its own resources to finance the distribution of the Fund’s shares.
NOTE D
Investment Transactions
Purchases and sales of investment securities (excluding short-term investments) for the year ended September 30, 2008, were as follows:
| | | | | | |
| | | Purchases | | Sales |
Investment securities (excluding
U.S. government securities) | | $ | 3,066,271,991 | | $ | 2,505,956,342 |
U.S. government securities | | | 323,984,813 | | | 385,320,552 |
The cost of investments for federal income tax purposes, gross unrealized appreciation and unrealized depreciation (excluding foreign currency contracts and futures contracts) are as follows:
| | | | |
Cost | | $ | 2,739,762,709 | |
| | | | |
Gross unrealized appreciation | | $ | 17,640,107 | |
Gross unrealized depreciation | | | (227,590,201 | ) |
| | | | |
Net unrealized depreciation | | $ | (209,950,094 | ) |
| | | | |
1. Financial Futures Contracts
The Fund may buy or sell financial futures contracts for the purpose of hedging its portfolio against adverse effects of anticipated movements in the market. The
| | |
| 34 | | • ALLIANCEBERNSTEIN GLOBAL BOND FUND |
Notes to Financial Statements
Fund bears the market risk that arises from changes in the value of these financial instruments and the imperfect correlation between movements in the price of the futures contracts and movements in the price of the securities hedged or used for cover. The Fund may also purchase or sell futures contracts for foreign currencies or options thereon for non hedging purposes as a means of making direct investment in foreign currencies, as described below under “Currency Transactions”.
At the time the Fund enters into a futures contract, the Fund deposits and maintains as collateral an initial margin with the broker, as required by the exchange on which the transaction is effected. Pursuant to the contract, the Fund agrees to receive from or pay to the broker an amount of cash equal to the daily fluctuation in the value of the contract. Such receipts or payments are known as variation margin and are recorded by the Fund as unrealized gains or losses. Risks may arise from the potential inability of a counter party to meet the terms of the contract. When the contract is closed, the Fund records a realized gain or loss equal to the difference between the value of the contract at the time it was opened and the time it was closed.
2. Forward Currency Exchange Contracts
The Fund may enter into forward currency exchange contracts in order to hedge its exposure to changes in foreign currency exchange rates on its foreign portfolio holdings or to hedge certain firm purchase and sales commitments denominated in foreign currencies and for non-hedging purposes as a means of making direct investments in foreign currencies, as described below under “Currency Transactions”. A forward currency exchange contract is a commitment to purchase or sell a foreign currency at a future date at a negotiated forward rate. The gain or loss arising from the difference between the original contract and the closing of such contract would be included in net realized gain or loss on foreign currency transactions.
Fluctuations in the value of open forward currency exchange contracts are recorded for financial reporting purposes as net unrealized appreciation or depreciation by the Fund.
The Fund’s custodian will place and maintain cash not available for investment or other liquid assets in a separate account of the Fund having a value at least equal to the aggregate amount of the Fund’s commitments under forward currency exchange contracts entered into with respect to position hedges. Risks may arise from the potential inability of a counterparty to meet the terms of a contract and from unanticipated movements in the value of a foreign currency relative to the U.S. dollar. The face or contract amount, in U.S. dollars reflects the total exposure the Fund has in that particular currency contract.
3. Option Transactions
For hedging purposes, the Fund may purchase and write (sell) put and call options on U.S. and foreign securities, including government securities, and
| | |
| ALLIANCEBERNSTEIN GLOBAL BOND FUND • | | 35 |
Notes to Financial Statements
foreign currencies that are traded on U.S. and foreign securities exchanges and over-the-counter markets. The Fund may also use options transactions for non-hedging purposes as a means of making direct investments in foreign currencies, as described below under “Currency Transactions”.
The risk associated with purchasing an option is that the Fund pays a premium whether or not the option is exercised. Additionally, the Fund bears the risk of loss of the premium and change in market value should the counterparty not perform under the contract. Put and call options purchased are accounted for in the same manner as portfolio securities. The cost of securities acquired through the exercise of call options is increased by premiums paid. The proceeds from securities sold through the exercise of put options are decreased by the premiums paid.
When the Fund writes an option, the premium received by the Fund is recorded as a liability and is subsequently adjusted to the current market value of the option written. Premiums received from written options which expire unexercised are recorded by the Fund on the expiration date as realized gains from options written. The difference between the premium received and the amount paid on effecting a closing purchase transaction, including brokerage commissions, is also treated as a realized gain, or if the premium received is less than the amount paid for the closing purchase transaction, as a realized loss. If a call option is exercised, the premium received is added to the proceeds from the sale of the underlying security or currency in determining whether the Fund has realized a gain or loss. If a put option is exercised, the premium received reduces the cost basis of the security or currency purchased by the Fund. In writing an option, the Fund bears the market risk of an unfavorable change in the price of the security or currency underlying the written option. Exercise of an option written by the Fund could result in the Fund selling or buying a security or currency at a price different from the current market value.
For the year ended September 30, 2008, the Fund had no transactions in written options.
4. Swap Agreements
The Fund may enter into swaps to hedge its exposure to interest rates, credit risk, or currencies. The Fund may also enter into swaps for non-hedging purposes as a means of making direct investments in foreign currencies, as described below under “Currency Transactions”. A swap is an agreement that obligates two parties to exchange a series of cash flows at specified intervals based upon or calculated by reference to changes in specified prices or rates for a specified amount of an underlying asset. The payment flows are usually netted against each other, with the difference being paid by one party to the other.
Risks may arise as a result of the failure of the counterparty to the swap contract to comply with the terms of the swap contract. The loss incurred by the failure of
| | |
| 36 | | • ALLIANCEBERNSTEIN GLOBAL BOND FUND |
Notes to Financial Statements
a counterparty is generally limited to the net interim payment to be received by the Fund, and/or the termination value at the end of the contract. Therefore, the Fund considers the creditworthiness of each counterparty to a swap contract in evaluating potential credit risk. Additionally, risks may arise from unanticipated movements in interest rates or in the value of the underlying securities.
As of October 1, 2003, the Fund has adopted the method of accounting for interim payments on swap contracts in accordance with Financial Accounting Standards Board Statement No. 133. The Fund accrues for the interim payments on swap contracts on a daily basis, with the net amount recorded within unrealized appreciation/depreciation of swap contracts on the statement of assets and liabilities. Once the interim payments are settled in cash, the net amount is recorded as realized gain/loss on swaps, in addition to realized gain/loss recorded upon termination of swap contracts on the statement of operations. Prior to October 1, 2003, these interim payments were reflected within interest income/expense in the statement of operations. Fluctuations in the value of swap contracts are recorded as a component of net change in unrealized appreciation/depreciation of investments.
The Fund may enter into credit default swaps. The Fund may purchase credit protection on the referenced obligation of the credit default swap (“Buy Contract”) or provide credit protection on the referenced obligation of the credit default swap (“Sale Contract”). A sale/(buy) in a credit default swap provides upon the occurrence of a credit event, as defined in the swap agreement, for the Fund to buy/(sell) from/(to) the counterparty at the notional amount (the “Notional Amount”) and receive/(deliver) the principal amount of the referenced obligation. If a credit event occurs, the maximum payout amount for a Sale Contract is limited to the Notional Amount of the swap contract (“Maximum Payout Amount”). During the term of the swap agreement, the Fund receives/(pays) fixed payments from/(to) the respective counterparty, calculated at the agreed upon interest rate applied to the Notional Amount. These interim payments are recorded within unrealized appreciation/ depreciation of swap contracts on the statement of assets and liabilities.
Credit default swaps may involve greater risks than if a Fund had invested in the referenced obligation directly. Credit default swaps are subject to general market risk, liquidity risk, counterparty risk and credit risk. If the Fund is a buyer and no credit event occurs, it will lose its investment. In addition, if the Fund is a seller and a credit event occurs, the value of the referenced obligation received by the Fund coupled with the periodic payments previously received, may be less than the Maximum Payout Amount it pays to the buyer, resulting in a loss to the Fund.
At September 30, 2008, the Fund had no Sale or Buy Contracts outstanding.
| | |
| ALLIANCEBERNSTEIN GLOBAL BOND FUND • | | 37 |
Notes to Financial Statements
5. Currency Transactions
The Fund may invest in non-U.S. Dollar securities on a currency hedged or unhedged basis. The Fund may seek investment opportunities by taking long or short positions in currencies through the use of currency-related derivatives, including forward currency exchange contracts, futures and options on futures, swaps, and options. The Fund may enter into transactions for investment opportunities when it anticipates that a foreign currency will appreciate or depreciate in value but securities denominated in that currency are not held by the Fund and do not present attractive investment opportunities. Such transactions may also be used when the Adviser believes that it may be more efficient than a direct investment in a foreign currency-denominated security. The Fund may also conduct currency exchange contracts on a spot basis (i.e., for cash at the spotrate prevailing in the currency exchange market for buying or selling currencies).
6. Reverse Repurchase Agreements
Under a reverse repurchase agreement, the Fund sells securities and agrees to repurchase them at a mutually agreed upon date and price. At the time the Fund enters into a reverse repurchase agreement, it will establish a segregated account with the custodian containing liquid assets having at least equal to the repurchase price.
For the year ended September 30, 2008, the average amount of reverse repurchase agreements outstanding was $95,627,616 and the daily weighted average annual interest rate was 6.30%.
NOTE E
Capital Stock
Each class consists of 3,000,000,000 authorized shares. Transactions in capital shares for each class were as follows:
| | | | | | | | | | | | | | | | | | |
| | | | | | | | | | | | | | | | | | |
| | | Shares | | | | | Amount | | | |
| | | Year Ended
September 30,
2008 | | | Year Ended
September 30,
2007 | | | | | Year Ended
September 30,
2008 | | | Year Ended
September 30,
2007 | | | |
| | | | | |
| Class A | | | | | | | | | | | | | | | | | | |
Shares sold | | 99,009,613 | | | 26,704,930 | | | | | $ | 797,378,695 | | | $ | 216,287,161 | | | |
| | | | |
Shares issued in reinvestment of dividends and distributions | | 5,487,053 | | | 3,926,145 | | | | | | 43,811,532 | | | | 23,773,715 | | | |
| | | | |
Shares converted from Class B | | 6,053,179 | | | 11,511,127 | | | | | | 48,716,054 | | | | 90,180,319 | | | |
| | | | |
Shares redeemed | | (50,382,355 | ) | | (33,428,140 | ) | | | | | (399,831,747 | ) | | | (260,619,518 | ) | | |
| | | | |
Net increase | | 60,167,490 | | | 8,714,062 | | | | | $ | 490,074,534 | | | $ | 69,621,677 | | | |
| | | | |
| | |
| 38 | | • ALLIANCEBERNSTEIN GLOBAL BOND FUND |
Notes to Financial Statements
| | | | | | | | | | | | | | | | | | |
| | | | | | | | | | | | | | | | | | |
| | | Shares | | | | | Amount | | | |
| | | Year Ended
September 30,
2008 | | | Year Ended
September 30,
2007 | | | | | Year Ended
September 30,
2008 | | | Year Ended
September 30,
2007 | | | |
| | | | | |
| Class B | | | | | | | | | | | | | | | | | | |
Shares sold | | 7,543,429 | | | 2,620,890 | | | | | $ | 60,681,259 | | | $ | 22,048,326 | | | |
| | | | |
Shares issued in reinvestment of dividends and distributions | | 528,900 | | | 835,940 | | | | | | 4,232,726 | | | | 4,967,740 | | | |
| | | | |
Shares converted to Class A | | (6,050,898 | ) | | (11,510,103 | ) | | | | | (48,716,054 | ) | | | (90,180,319 | ) | | |
| | | | |
Shares redeemed | | (4,564,286 | ) | | (7,545,339 | ) | | | | | (36,483,560 | ) | | | (58,646,172 | ) | | |
| | | | |
Net decrease | | (2,542,855 | ) | | (15,598,612 | ) | | | | $ | (20,285,629 | ) | | $ | (121,810,425 | ) | | |
| | | | |
| | | | | | | | | | | | | | | | | | |
| Class C | | | | | | | | | | | | | | | | | | |
Shares sold | | 36,778,333 | | | 11,601,108 | | | | | $ | 297,183,045 | | | $ | 90,976,751 | | | |
| | | | |
Shares issued in reinvestment of dividends and distributions | | 1,645,365 | | | 818,379 | | | | | | 13,165,884 | | | | 6,677,998 | | | |
| | | | |
Shares redeemed | | (9,972,918 | ) | | (8,257,939 | ) | | | | | (79,350,591 | ) | | | (64,603,842 | ) | | |
| | | | |
Net increase | | 28,450,780 | | | 4,161,548 | | | | | $ | 230,998,338 | | | $ | 33,050,907 | | | |
| | | | |
| | | | | | | | | | | | | | | | | | |
| | | November 5,
2007(a) to
September 30,
2008 | | | | | | | | November 5,
2007(a) to
September 30,
2008 | | | | | | |
| | | | | |
| Advisor Class | | | | | | | | | | | | | | | | | | |
Shares sold | | 12,484,852 | | | | | | | | $ | 99,055,055 | | | | | | | |
| | | | |
Shares issued in reinvestment of dividends and distributions | | 152,620 | | | | | | | | | 1,206,365 | | | | | | | |
| | | | |
Shares redeemed | | (561,863 | ) | | | | | | | | (4,371,383 | ) | | | | | | |
| | | | |
Net increase | | 12,075,609 | | | | | | | | $ | 95,890,037 | | | | | | | |
| | | | |
| | | | | | | | | | | | | | | | | | |
| Class R | | | | | | | | | | | | | | | | | | |
Shares sold | | 23,157 | | | | | | | | $ | 182,019 | | | | | | | |
| | | | |
Shares issued in reinvestment of dividends and distributions | | 171 | | | | | | | | | 1,343 | | | | | | | |
| | | | |
Shares redeemed | | (6,810 | ) | | | | | | | | (53,478 | ) | | | | | | |
| | | | |
Net increase | | 16,518 | | | | | | | | $ | 129,884 | | | | | | | |
| | | | |
| | | | | | | | | | | | | | | | | | |
| Class K | | | | | | | | | | | | | | | | | | |
Shares sold | | 8,455 | | | | | | | | $ | 66,854 | | | | | | | |
| | | | |
Shares issued in reinvestment of dividends and distributions | | 49 | | | | | | | | | 379 | | | | | | | |
| | | | |
Shares redeemed | | (565 | ) | | | | | | | | (4,430 | ) | | | | | | |
| | | | |
Net increase | | 7,939 | | | | | | | | $ | 62,803 | | | | | | | |
| | | | |
| | |
| ALLIANCEBERNSTEIN GLOBAL BOND FUND • | | 39 |
Notes to Financial Statements
| | | | | | | | | | | |
| | | | | | | | | | | |
| | | Shares | | | | | Amount | | | |
| | | November 5,
2007(a) to
September 30,
2008 | | | | | November 5,
2007(a) to September 30,
2008 | | | |
| Class I | | | | | | | | | | | |
Shares sold | | 26,630 | | | | | $ | 215,297 | | | |
| |
Shares issued in reinvestment of dividends and distributions | | 354 | | | | | | 2,824 | | | |
| |
Shares redeemed | | (17,887 | ) | | | | | (140,435 | ) | | |
| |
Net increase | | 9,097 | | | | | $ | 77,686 | | | |
| |
(a) | Commencement of distribution. |
During the period, a third party vendor reimbursed the Fund $528,520 for losses incurred due to a trade entry error.
NOTE F
Security Lending
The Fund may make secured loans of portfolio securities to brokers, dealers and financial institutions, provided that cash, liquid high-grade debt securities or bank letters of credit equal to at least 100% of the market values of the securities loaned is deposited and maintained by the borrower with the Fund. Under the terms of the securities lending agreement, security voting rights pass to the borrower, although the Fund can at will terminate a loan and regain the right to vote.
The risks in lending portfolio securities, as with other extensions of credit, consist of possible loss of rights in the collateral should the borrower fail financially. In determining whether to lend securities to a particular borrower, the Adviser will consider all relevant facts and circumstances, including the creditworthiness of the borrower. While securities are on loan, the borrower will pay the Fund any income earned thereon and the Fund may invest any cash collateral in portfolio securities, thereby earning additional income, or receive an agreed upon amount of income from a borrower who has delivered equivalent collateral. When such securities are borrowed against cash, the Fund agrees to pay the borrower of such securities a “rebate rate” for the use of the cash the borrower has pledged as collateral. As of September 30, 2008, the Fund had no securities on loan.
NOTE G
Risks Involved in Investing in the Fund
Interest Rate Risk and Credit Risk—Interest rate risk is the risk that changes in interest rates will affect the value of the Fund’s investments in fixed-income debt securities such as bonds or notes. Increases in interest rates may cause the value of the Fund’s investments to decline. Credit risk is the risk that the issuer or
| | |
| 40 | | • ALLIANCEBERNSTEIN GLOBAL BOND FUND |
Notes to Financial Statements
guarantor of a debt security, or the counterparty to a derivative contract, will be unable or unwilling to make timely principal and/or interest payments, or to otherwise honor its obligations. The degree of risk for a particular security may be reflected in its credit risk rating. Credit risk is greater for medium quality and lower-rated securities. Lower-rated debt securities and similar unrated securities (commonly known as “junk bonds”) have speculative elements or are predominantly speculative risks.
Foreign Securities Risk—Investing in securities of foreign companies or foreign governments involves special risks which include changes in foreign currency exchange rates and the possibility of future political and economic developments which could adversely affect the value of such securities. Moreover, securities of many foreign companies or foreign governments and their markets may be less liquid and their prices more volatile than those of comparable U.S. companies or of the U.S. government.
Currency Risk—This is the risk that changes in foreign currency exchange rates may negatively affect the value of the Fund’s investments or reduce the returns of the Fund. For example, the value of the Fund’s investments in foreign currency-denominated securities or currencies may decrease if the U.S. Dollar is strong (i.e., gaining value relative to other currencies) and other currencies are weak (i.e., losing value relative to the U.S. Dollar). Currency markets are generally not as regulated as securities markets. Independent of the Fund’s investments in securities denominated in foreign currencies, the Fund’s positions in various foreign currencies may cause the Fund to experience investment losses due to the changes in exchange rates and interest rates.
Leverage Risk—When the Fund borrows money or otherwise leverages its portfolio, it may be volatile because leverage tends to exaggerate the effect of any increase or decrease in the value of the Fund’s investments. The Fund may create leverage through the use of reverse repurchase arrangements, forward currency exchange contracts, forward commitments, dollar rolls or futures contracts or by borrowing money.
Indemnification Risk—In the ordinary course of business, the Fund enters into contracts that contain a variety of indemnifications. The Fund’s maximum exposure under these arrangements is unknown. However, the Fund has not had prior claims or losses pursuant to these indemnification provisions and expects the risk of loss thereunder to be remote.
NOTE H
Joint Credit Facility
A number of open-end mutual funds managed by the Adviser, including the Fund, participate in a $250 million revolving credit facility (the “Facility”) intended to provide short-term financing if necessary, subject to certain restrictions in connection with abnormal redemption activity. Commitment fees
| | |
| ALLIANCEBERNSTEIN GLOBAL BOND FUND • | | 41 |
Notes to Financial Statements
related to the Facility are paid by the participating funds and are included in miscellaneous expenses in the statement of operations. The Fund did not utilize the Facility during the year ended September 30, 2008.
NOTE I
Distributions to Shareholders
The tax character of distributions paid during the fiscal year ended September 30, 2008 and September 30, 2007 were as follows.
| | | | | | |
| | | 2008 | | 2007 |
Distributions paid from: | | | | | | |
Ordinary income | | $ | 96,012,719 | | $ | 69,446,654 |
| | | | | | |
Total taxable distributions | | | 96,012,719 | | | 69,446,654 |
| | | | | | |
Total distributions paid | | $ | 96,012,719 | | $ | 69,446,654 |
| | | | | | |
As of September 30, 2008, the components of accumulated earnings/(deficit) on a tax basis were as follows:
| | | | |
Undistributed ordinary income | | $ | 33,502,603 | |
Accumulated capital and other losses | | | (62,670,362 | )(a) |
Unrealized appreciation/(depreciation) | | | (214,342,816 | )(b) |
| | | | |
Total accumulated earnings/(deficit) | | $ | (243,510,575 | )(c) |
| | | | |
(a) | On September 30, 2008, the Fund had a net capital loss carryforward of $54,979,681, of which $42,380,088 expires in the year 2009 and $12,599,593 expires in the year 2010. To the extent future capital gains are offset by capital loss carryforwards, such gains will not be distributed. During the fiscal year, the Fund utilized capital loss carryforwards of $57,227,821. As of September 30, 2008, the Fund had deferred tax straddle losses of $7,690,681. |
(b) | The difference between book-basis and tax basis unrealized appreciation/(depreciation) is attributable primarily to the tax deferral of losses on wash sales, the realization for tax purposes of unrealized gains/losses on certain derivative instruments. |
(c) | The difference between book-basis and tax-basis components of accumulated earnings/ (deficit) is attributable to dividends payable. |
During the current fiscal year, permanent differences, primarily due to foreign currency transactions, resulted in a net decrease in distributions in excess of net investment income, a net increase in accumulated net realized loss on investment and foreign currency transactions. This reclassification had no effect on net assets.
NOTE J
Legal Proceedings
On October 2, 2003, a purported class action complaint entitled Hindo, et al. v. AllianceBernstein Growth & Income Fund, et al. (“Hindo Complaint”) was filed against the Adviser, Alliance Capital Management Holding L.P. (“Alliance Holding”), Alliance Capital Management Corporation, AXA Financial, Inc., the
| | |
| 42 | | • ALLIANCEBERNSTEIN GLOBAL BOND FUND |
Notes to Financial Statements
AllianceBernstein Funds, certain officers of the Adviser (“AllianceBernstein defendants”), and certain other unaffiliated defendants, as well as unnamed Doe defendants. The Hindo Complaint was filed in the United States District Court for the Southern District of New York by alleged shareholders of two of the AllianceBernstein Funds. The Hindo Complaint alleges that certain of the AllianceBernstein defendants failed to disclose that they improperly allowed certain hedge funds and other unidentified parties to engage in “late trading” and “market timing” of AllianceBernstein Fund securities, violating Sections 11 and 15 of the Securities Act, Sections 10(b) and 20(a) of the Exchange Act and Sections 206 and 215 of the Advisers Act. Plaintiffs seek an unspecified amount of compensatory damages and rescission of their contracts with the Adviser, including recovery of all fees paid to the Adviser pursuant to such contracts.
Following October 2, 2003, 43 additional lawsuits making factual allegations generally similar to those in the Hindo Complaint were filed in various federal and state courts against the Adviser and certain other defendants. On September 29, 2004, plaintiffs filed consolidated amended complaints with respect to four claim types: mutual fund shareholder claims; mutual fund derivative claims; derivative claims brought on behalf of Alliance Holding; and claims brought under ERISA by participants in the Profit Sharing Plan for Employees of the Adviser. All four complaints include substantially identical factual allegations, which appear to be based in large part on the Order of the SEC dated December 18, 2003 as amended and restated January 15, 2004 (“SEC Order”) and the New York State Attorney General Assurance of Discontinuance dated September 1, 2004 (“NYAG Order”).
On April 21, 2006, the Adviser and attorneys for the plaintiffs in the mutual fund shareholder claims, mutual fund derivative claims, and ERISA claims entered into a confidential memorandum of understanding containing their agreement to settle these claims. The agreement will be documented by a stipulation of settlement and will be submitted for court approval at a later date. The settlement amount ($30 million), which the Adviser previously accrued and disclosed, has been disbursed. The derivative claims brought on behalf of Alliance Holding, in which plaintiffs seek an unspecified amount of damages, remain pending.
It is possible that these matters and/or other developments resulting from these matters could result in increased redemptions of the AllianceBernstein Mutual Funds’ shares or other adverse consequences to the AllianceBernstein Mutual Funds. This may require the AllianceBernstein Mutual Funds to sell investments held by those funds to provide for sufficient liquidity and could also have an adverse effect on the investment performance of the AllianceBernstein Mutual Funds. However, the Adviser believes that these matters are not likely to have a material adverse effect on its ability to perform advisory services relating to the AllianceBernstein Mutual Funds.
| | |
| ALLIANCEBERNSTEIN GLOBAL BOND FUND • | | 43 |
Notes to Financial Statements
NOTE K
Recent Accounting Pronouncements
On September 20, 2006, the FASB released Statement of Financial Accounting Standards No. 157 “Fair Value Measurements” (“FAS 157”). FAS 157 establishes an authoritative definition of fair value, sets out a framework for measuring fair value, and requires additional disclosures about fair-value measurements. The application of FAS 157 is required for fiscal years beginning after November 15, 2007 and interim periods within those fiscal years. As of September 30, 2008, management believes the adoption of FAS 157 will not impact the amounts reported in the financial statements. However, additional disclosures will be required.
On March 19, 2008, the FASB released Statement of Financial Accounting Standards No. 161, “Disclosures about Derivative Instruments and Hedging Activities” (“FAS 161”). FAS 161 requires qualitative disclosures about objectives and strategies for using derivatives, quantitative disclosures about fair value amounts of and gains and losses on derivative instruments, and disclosures about credit-risk-related contingent features in derivative agreements. The application of FAS 161 is required for fiscal years beginning after November 15, 2008 and interim periods within those fiscal years. At this time, management is evaluating the implications of FAS 161 and believes the adoption of FAS 161 will have no material impact on the Fund’s financial statements.
| | |
| 44 | | • ALLIANCEBERNSTEIN GLOBAL BOND FUND |
Notes to Financial Statements
FINANCIAL HIGHLIGHTS
Selected Data For A Share of Capital Stock Outstanding Throughout Each Period
| | | | | | | | | | | | | | | |
| | | Class A | |
| | | Year Ended September 30, | |
| | | 2008 | | | 2007 | | | 2006 | | | 2005 | | | 2004(a) | |
| | | |
| | | | | | | | | | | | | | | |
Net asset value, beginning of period | | $ 8.07 | | | $ 7.54 | | | $ 7.69 | | | $ 7.35 | | | $ 7.54 | |
| | | |
Income From Investment Operations | | | | | | | | | | | | | | | |
Net investment income(b) | | .42 | | | .40 | | | .44 | | | .50 | | | .50 | (c) |
Net realized and unrealized gain (loss) on investment and foreign currency transactions | | (.70 | ) | | .52 | | | (.15 | ) | | .34 | | | (.16 | ) |
| | | |
Net increase (decrease) in
net asset value from operations | | (.28 | ) | | .92 | | | .29 | | | .84 | | | .34 | |
| | | |
Less: Dividends and Distributions | | | | | | | | | | | | | | | |
Dividends from net investment income | | (.40 | ) | | (.39 | ) | | (.44 | ) | | (.50 | ) | | (.53 | ) |
| | | |
Total dividends and distributions | | (.40 | ) | | (.39 | ) | | (.44 | ) | | (.50 | ) | | (.53 | ) |
| | | |
Net asset value, end of period | | $ 7.39 | | | $ 8.07 | | | $ 7.54 | | | $ 7.69 | | | $ 7.35 | |
| | | |
Total Return | | | | | | | | | | | | | | | |
Total investment return based on net asset value(d) | | (3.75 | )% | | 12.47 | % | | 3.90 | % | | 11.83 | % | | 4.72 | % |
Ratios/ Supplemental Data | | | | | | | | | | | | | | | |
Net assets, end of period (000’s omitted) | | $1,425,649 | | | $1,071,398 | | | $935,901 | | | $957,697 | | | $956,690 | |
Ratio to average net assets of: | | | | | | | | | | | | | | | |
Expenses, net of waivers/ reimbursements | | .90 | % | | 1.80 | % | | 1.04 | %(e) | | 1.05 | % | | 1.25 | % |
Expenses, before waivers/ reimbursements | | 1.15 | % | | 1.80 | % | | 1.04 | %(e) | | 1.05 | % | | 1.41 | % |
Expenses, before waivers/ reimbursements excluding interest expense | | 1.01 | % | | 1.05 | % | | 1.04 | %(e) | | 1.05 | % | | 1.27 | % |
Net investment income | | 5.19 | % | | 5.09 | % | | 5.81 | %(e) | | 6.78 | % | | 6.80 | %(c) |
Portfolio turnover rate | | 140 | % | | 170 | % | | 104 | % | | 66 | % | | 76 | % |
See footnote summary on page 49.
| | |
| ALLIANCEBERNSTEIN GLOBAL BOND FUND • | | 45 |
Financial Highlights
Selected Data For A Share of Capital Stock Outstanding Throughout Each Period
| | | | | | | | | | | | | | | |
| | | Class B | |
| | | Year Ended September 30, | |
| | | 2008 | | | 2007 | | | 2006 | | | 2005 | | | 2004(a) | |
| | | |
| | | | | | | | | | | | | | | |
Net asset value, beginning of period | | $ 8.07 | | | $ 7.54 | | | $ 7.68 | | | $ 7.35 | | | $ 7.54 | |
| | | |
Income From Investment Operations | | | | | | | | | | | | | | | |
Net investment income(b) | | .36 | | | .34 | | | .38 | | | .44 | | | .45 | (c) |
Net realized and unrealized gain (loss) on investment and foreign currency transactions | | (.70 | ) | | .52 | | | (.14 | ) | | .33 | | | (.16 | ) |
| | | |
Net increase (decrease) in net asset value from operations | | (.34 | ) | | .86 | | | .24 | | | .77 | | | .29 | |
| | | |
Less: Dividends and Distributions | | | | | | | | | | | | | | | |
Dividends from net investment income | | (.34 | ) | | (.33 | ) | | (.38 | ) | | (.44 | ) | | (.48 | ) |
| | | |
Total dividends and distributions | | (.34 | ) | | (.33 | ) | | (.38 | ) | | (.44 | ) | | (.48 | ) |
| | | |
Net asset value, end of period | | $ 7.39 | | | $ 8.07 | | | $ 7.54 | | | $ 7.68 | | | $ 7.35 | |
| | | |
Total Return | | | | | | | | | | | | | | | |
Total investment return based on net asset value(d) | | (4.44 | )% | | 11.65 | % | | 3.28 | % | | 11.04 | % | | 3.98 | % |
Ratios/ Supplemental Data | | | | | | | | | | | | | | | |
Net assets, end of period (000’s omitted) | | $137,926 | | | $171,078 | | | $277,450 | | | $373,923 | | | $476,171 | |
Ratio to average net assets of: | | | | | | | | | | | | | | | |
Expenses, net of waivers/ reimbursements | | 1.60 | % | | 2.53 | % | | 1.76 | %(e) | | 1.77 | % | | 1.98 | % |
Expenses, before waivers/ reimbursements | | 1.88 | % | | 2.53 | % | | 1.76 | %(e) | | 1.77 | % | | 2.15 | % |
Expenses, before waivers/ reimbursements excluding interest expense | | 1.73 | % | | 1.77 | % | | 1.76 | %(e) | | 1.77 | % | | 1.99 | % |
Net investment income | | 4.52 | % | | 4.36 | % | | 5.10 | %(e) | | 5.82 | % | | 6.07 | %(c) |
Portfolio turnover rate | | 140 | % | | 170 | % | | 104 | % | | 66 | % | | 76 | % |
See footnote summary on page 49.
| | |
| 46 | | • ALLIANCEBERNSTEIN GLOBAL BOND FUND |
Financial Highlights
Selected Data For A Share of Capital Stock Outstanding Throughout Each Period
| | | | | | | | | | | | | | | |
| | | Class C | |
| | | Year Ended September 30, | |
| | | 2008 | | | 2007 | | | 2006 | | | 2005 | | | 2004(a) | |
| | | |
| | | | | | | | | | | | | | | |
Net asset value, beginning of period | | $ 8.09 | | | $ 7.56 | | | $ 7.71 | | | $ 7.38 | | | $ 7.57 | |
| | | |
Income From Investment Operations | | | | | | | | | | | | | | | |
Net investment income(b) | | .36 | | | .34 | | | .38 | | | .44 | | | .45 | (c) |
Net realized and unrealized gain (loss) on investment and foreign currency transactions | | (.70 | ) | | .52 | | | (.15 | ) | | .34 | | | (.16 | ) |
| | | |
Net increase (decrease) in net asset value from operations | | (.34 | ) | | .86 | | | .23 | | | .78 | | | .29 | |
| | | |
Less: Dividends and Distributions | | | | | | | | | | | | | | | |
Dividends from net investment income | | (.34 | ) | | (.33 | ) | | (.38 | ) | | (.45 | ) | | (.48 | ) |
| | | |
Total dividends and distributions | | (.34 | ) | | (.33 | ) | | (.38 | ) | | (.45 | ) | | (.48 | ) |
| | | |
Net asset value, end of period | | $ 7.41 | | | $ 8.09 | | | $ 7.56 | | | $ 7.71 | | | $ 7.38 | |
| | | |
Total Return | | | | | | | | | | | | | | | |
Total investment return based on net asset value(d) | | (4.42 | )% | | 11.65 | % | | 3.15 | % | | 10.87 | % | | 3.97 | % |
Ratios/ Supplemental Data | | | | | | | | | | | | | | | |
Net assets, end of period (000’s omitted) | | $492,541 | | | $307,616 | | | $256,047 | | | $251,752 | | | $251,666 | |
Ratio to average net assets of: | | | | | | | | | | | | | | | |
Expenses, net of waivers/ reimbursements | | 1.60 | % | | 2.50 | % | | 1.74 | %(e) | | 1.76 | % | | 1.96 | % |
Expenses, before waivers/ reimbursements | | 1.86 | % | | 2.50 | % | | 1.74 | %(e) | | 1.76 | % | | 2.12 | % |
Expenses, before waivers/ reimbursements excluding interest expense | | 1.71 | % | | 1.75 | % | | 1.74 | %(e) | | 1.76 | % | | 1.97 | % |
Net investment income | | 4.46 | % | | 4.37 | % | | 5.07 | %(e) | | 5.88 | % | | 6.07 | %(c) |
Portfolio turnover rate | | 140 | % | | 170 | % | | 104 | % | | 66 | % | | 76 | % |
See footnote summary on page 49.
| | |
| ALLIANCEBERNSTEIN GLOBAL BOND FUND • | | 47 |
Financial Highlights
Selected Data For A Share of Capital Stock Outstanding Throughout Each Period
| | | | | | | | | | | | |
| | | Advisor Class | | | Class R | | | Class K | | | Class I | |
| | | November 5, 2007(f)
to
September 30, 2008 | | | November 5, 2007(f)
to
September 30, 2008 | | | November 5, 2007(f)
to
September 30, 2008 | | | November 5, 2007(f)
to
September 30, 2008 | |
| | | |
| | | | | | | | | | | | |
Net asset value, beginning of period | | $ 8.14 | | | $ 8.14 | | | $ 8.14 | | | $ 8.14 | |
| | | |
Income From Investment Operations | | | | | | | | | | | | |
Net investment income(b) | | .41 | | | .35 | | | .36 | | | .47 | |
Net realized and unrealized loss on investment and foreign currency transactions | | (.78 | ) | | (.75 | ) | | (.75 | ) | | (.83 | ) |
| | | |
Net increase (decrease) in net asset value from operations | | (.37 | ) | | (.40 | ) | | (.39 | ) | | (.36 | ) |
| | | |
Less: Dividends and Distributions | | | | | | | | | | | | |
Dividends from net investment income | | (.39 | ) | | (.35 | ) | | (.37 | ) | | (.39 | ) |
| | | |
Total dividends and distributions | | (.39 | ) | | (.35 | ) | | (.37 | ) | | (.39 | ) |
| | | |
Net asset value, end of period | | $ 7.38 | | | $ 7.39 | | | $ 7.38 | | | $ 7.39 | |
| | | |
Total Return | | | | | | | | | | | | |
Total investment return based on net asset value(d) | | (4.83 | )% | | (5.15 | ) % | | (5.07 | )% | | (4.72 | )% |
Ratios/ Supplemental Data | | | | | | | | | | | | |
Net assets, end of period (000’s omitted) | | $89,152 | | | $122 | | | $59 | | | $67 | |
Ratio to average net assets of: | | | | | | | | | | | | |
Expenses, net
of waivers/ reimbursements(g) | | .60 | % | | 1.10 | % | | .85 | % | | .60 | % |
Expenses, before waivers/ reimbursements(g) | | .88 | % | | 1.48 | % | | 1.09 | % | | .77 | % |
Expenses, before waivers/ reimbursements excluding interest expense(g) | | .74 | % | | 1.34 | % | | .95 | % | | .63 | % |
Net investment income(g) | | 5.37 | % | | 4.92 | % | | 5.06 | % | | 5.45 | % |
Portfolio turnover rate | | 140 | % | | 140 | % | | 140 | % | | 140 | % |
See footnote summary on page 49.
| | |
| 48 | | • ALLIANCEBERNSTEIN GLOBAL BOND FUND |
Financial Highlights
| (a) | As of October 1, 2003, the Fund has adopted the method of accounting for interim pay- ments on swap contracts in accordance with Financial Accounting Standards Board Statement No. 133. These interim payments are reflected within net realized and unreal- ized gain (loss) on swap contracts, however, prior to October 1, 2003, these interim pay- ments were reflected within interest income/expense on the statement of operations. The effect of this change for the fiscal year ended September 30, 2004, was to decrease net investment income per share by $0.0002 for Class A, B and C and increase net realized and unrealized gain (loss) on investment transactions per share by $0.0002 for Class A, B and C. Consequently, the ratios of net investment income to average net assets were decreased by 0.003% for Class A, B and C, respectively. |
| (b) | Based on average shares outstanding. |
| (c) | Net of waivers/reimbursement by the Adviser. |
| (d) | Total investment return is calculated assuming an initial investment made at the net asset value at the beginning of the period, reinvestment of all dividends and distributions at net asset value during the period, and redemption on the last day of the period. Initial sales charges or contingent deferred sales charges are not reflected in the calculation of total investment return. Total return does not reflect the deduction of taxes that a shareholder would pay on fund distributions or the redemption of fund shares. Total investment return calculated for a period of less than one year is not annualized. |
| (e) | The ratio includes expenses attributable to costs of proxy solicitation. |
| (f) | Commencement of distribution. |
See notes to financial statements
| | |
| ALLIANCEBERNSTEIN GLOBAL BOND FUND • | | 49 |
Financial Highlights
REPORT OF INDEPENDENT REGISTERED
PUBLIC ACCOUNTING FIRM
To the Shareholders and Board of Directors of AllianceBernstein Global Bond Fund, Inc.
We have audited the accompanying statement of assets and liabilities of AllianceBernstein Global Bond Fund, Inc. (formerly AllianceBernstein Global Government Income Trust, Inc.) (the “Fund”), including the portfolio of investments, as of September 30, 2008, and the related statement of operations for the year then ended, the statement of changes in net assets for each of the two years in the period then ended, and the financial highlights for each of the periods indicated therein. These financial statements and financial highlights are the responsibility of the Fund’s management. Our responsibility is to express an opinion on these financial statements and financial highlights based on our audits.
We conducted our audits in accordance with the standards of the Public Company Accounting Oversight Board (United States). Those standards require that we plan and perform the audit to obtain reasonable assurance about whether the financial statements and financial highlights are free of material misstatement. We were not engaged to perform an audit of the Fund’s internal control over financial reporting. Our audits included consideration of internal control over financial reporting as a basis for designing audit procedures that are appropriate in the circumstances, but not for the purpose of expressing an opinion on the effectiveness of the Fund’s internal control over financial reporting. Accordingly, we express no such opinion. An audit also includes examining, on a test basis, evidence supporting the amounts and disclosures in the financial statements and financial highlights, assessing the accounting principles used and significant estimates made by management, and evaluating the overall financial statement presentation. Our procedures included confirmation of securities owned as of September 30, 2008 by correspondence with the custodian and others or by other appropriate auditing procedures where replies from others were not received. We believe that our audits provide a reasonable basis for our opinion.
In our opinion, the financial statements and financial highlights referred to above present fairly, in all material respects, the financial position of AllianceBernstein Global Bond Fund, Inc. at September 30, 2008, the results of its operations for the year then ended, the changes in its net assets for each of the two years in the period then ended, and the financial highlights for each of the indicated periods, in conformity with U.S. generally accepted accounting principles.

New York, New York
November 26, 2008
| | |
| 50 | | • ALLIANCEBERNSTEIN GLOBAL BOND FUND |
Report of Independent Registered Public Accounting Firm
TAX INFORMATION
(unaudited)
38.5% of the ordinary income dividends paid by the Fund during the fiscal year ended September 30, 2008 qualify as “interest related dividends” for non-U.S. shareholders.
| | |
| ALLIANCEBERNSTEIN GLOBAL BOND FUND • | | 51 |
Tax Information
BOARD OF DIRECTORS
William H. Foulk, Jr.(1), Chairman
Marc O. Mayer
John H. Dobkin(1)
Michael J. Downey(1)
D. James Guzy(1)
Nancy P. Jacklin(1)
Garry L. Moody(1)
Marshall C. Turner, Jr.(1)
Earl D. Weiner(1)
OFFICERS(2)
Robert M. Keith, President and Chief Executive Officer
Philip L. Kirstein, Senior Vice President and Independent Compliance Officer
Paul J. DeNoon(2), Vice President
Scott DiMaggio(2), Vice President
Fernando Grisales(2), Assistant Vice President
Michael L. Mon(2), Vice President
Douglas J. Peebles(2), Vice President
Matthew S. Sheridan(2), Vice President
Emilie D. Wrapp, Secretary
Joseph J. Mantineo, Treasurer and Chief Financial Officer
Phyllis J. Clarke, Controller
| | |
Custodian and Accounting Agent Brown Brothers Harriman & Co. 40 Water Street Boston, MA 02109 Principal Underwriter AllianceBernstein Investments, Inc. 1345 Avenue of the Americas New York, NY 10105 Legal Counsel Seward & Kissel LLP One Battery Park Plaza New York, NY 10004 | | Transfer Agent AllianceBernstein Investor Services, Inc. P.O. Box 786003 San Antonio, TX 78278-6003 Toll-free (800) 221-5672 Independent Registered Public Accounting Firm Ernst & Young LLP 5 Times Square New York, NY 10036 |
| (1) | Member of the Audit Committee, the Governance and Nominating Committee and the Independent Directors Committee. Mr. Foulk is the sole member of the Fair Value Pricing Committee. |
| (2) | The management of, and investment decisions for, the Fund’s portfolio are made by the Global Fixed Income Investment Team. Mr. Paul J. DeNoon, Mr. Scott DiMaggio, Mr. Fernando Grisales, Mr. Michael L. Mon, Mr. Douglas J. Peebles and Mr. Matthew S. Sheridan are the investment professionals with the most significant responsibility for the day-to-day management of the Fund’s portfolio. |
| | |
| 52 | | • ALLIANCEBERNSTEIN GLOBAL BOND FUND |
Board of Directors
MANAGEMENT OF THE FUND
Board of Directors Information
The business and affairs of the Fund are managed under the direction of the Board of Directors. Certain information concerning the Fund’s Directors is set forth below.
| | | | | | |
NAME, ADDRESS*,
AND AGE
(YEAR ELECTED**) | | PRINCIPAL
OCCUPATION(S)
DURING PAST 5 YEARS | | PORTFOLIOS
IN FUND
COMPLEX
OVERSEEN BY
DIRECTOR | | OTHER
DIRECTORSHIPS
HELD BY
DIRECTOR |
| INTERESTED DIRECTOR | | | | |
Marc O. Mayer,***
1345 Avenue of the
Americas,
New York, NY 10105
51
(2003) | | Executive Vice President of the Adviser since 2000, and Chief Investment Officer of Blend Solutions since June 2008. Previously, Executive Managing Director of AllianceBernstein Investments, Inc. (“ABI”) since 2003; prior thereto, he was head of AllianceBernstein Institutional Investments, a unit of the Adviser from 2001-2003. Prior to 2001, Chief Executive Officer of Sanford C. Bernstein & Co., LLC (institutional research and brokerage arm of Bernstein & Co., LLC) (“SCB & Co.”) and its predecessor. | | 95 | | SCB Partners, Inc. and SCB Inc. |
| | | | | | |
| DISINTERESTED DIRECTORS | | | | |
Chairman of the Board
William H. Foulk, Jr., #,+
76
(1992) | | Investment Adviser and an Independent Consultant. Formerly, Senior Manager of Barrett Associates, Inc., a registered investment adviser, with which he had been associated since prior to 2003. He was formerly Deputy Comptroller and Chief Investment Officer of the State of New York and, prior thereto, Chief Investment Officer of the New York Bank for Savings. | | 97 | | None |
| | | | | | |
John H. Dobkin, #
66
(1992) | | Consultant. Formerly, President of Save Venice, Inc. (preservation organization) from 2001-2002, Senior Advisor from June 1999-June 2000 and President of Historic Hudson Valley (historic preservation) from December 1989-May 1999. Previously, Director of the National Academy of Design and during 1988-1992, Director and Chairman of the Audit Committee of AllianceBernstein Corporation (“AB Corp.”) (formerly, Alliance Capital Management Corporation). | | 95 | | None |
| | |
| ALLIANCEBERNSTEIN GLOBAL BOND FUND • | | 53 |
Management of the Fund
| | | | | | |
NAME, ADDRESS*,
AND AGE
(YEAR ELECTED**) | | PRINCIPAL
OCCUPATION(S)
DURING PAST 5 YEARS | | PORTFOLIOS
IN FUND
COMPLEX
OVERSEEN BY
DIRECTOR | | OTHER
DIRECTORSHIPS
HELD BY
DIRECTOR |
DISINTERESTED DIRECTORS
(continued) | | | | |
Michael J. Downey, #
64
(2005) | | Private Investor since January 2004. Formerly, managing partner of Lexington Capital, LLC (investment advisory firm) from December 1997 until December 2003. Prior thereto, Chairman and CEO of Prudential Mutual Fund Management from 1987 to 1993. | | 95 | | Asia Pacific Fund, Inc.; The Merger Fund and Prospect Acquisition Corp. (financial services) |
| | | | | | |
D. James Guzy, #
72
(2005) | | Chairman of the Board of PLX Technology (semi-conductors) and of SRC Computers Inc., with which he has been associated since prior to 2003. | | 95 | | Intel Corporation (semi-conductors) and Cirrus Logic Corporation (semi-conductors) |
| | | | | | |
Nancy P. Jacklin, #
60
(2006) | | Professorial Lecturer at the Johns Hopkins School of Advanced International Studies and Adjunct Professor at Georgetown University Law Center in the 2008-2009 academic year. Formerly, U.S. Executive Director of the International Monetary Fund (December 2002-May 2006); Partner, Clifford Chance (1992-2002); Sector Counsel, International Banking and Finance, and Associate General Counsel, Citicorp (1985-1992); Assistant General Counsel (International), Federal Reserve Board of Governors (1982-1985); and Attorney Advisor, U.S. Department of the Treasury (1973-1982). Member of the Bar of the District of Columbia and of New York; and member of the Council on Foreign Relations. | | 95 | | None |
| | |
| 54 | | • ALLIANCEBERNSTEIN GLOBAL BOND FUND |
Management of the Fund
| | | | | | |
NAME, ADDRESS*,
AND AGE
(YEAR ELECTED**) | | PRINCIPAL
OCCUPATION(S)
DURING PAST 5 YEARS | | PORTFOLIOS
IN FUND
COMPLEX
OVERSEEN BY
DIRECTOR | | OTHER
DIRECTORSHIPS
HELD BY
DIRECTOR |
DISINTERESTED DIRECTORS
(continued) | | | | |
Garry L. Moody, #
56
(2008) | | Formerly, Partner, Deloitte & Touche LLP, Vice Chairman, and U.S. and Global Managing Partner, Investment Management Services Group 1995-2008. | | 94 | | None |
| | | | | | |
Marshall C. Turner, Jr., #
67
(2005) | | Interim CEO of MEMC Electronic Materials, Inc. (semi-conductor and solar cell substrates) since November 2008. He was Chairman and CEO of Dupont Photomasks, Inc. (components of semi-conductor manufacturing), 2003-2005, and President and CEO, 2005-2006, after the company was renamed Toppan Photomasks, Inc. | | 95 | | Xilinx, Inc. (programmable logic semi-conductors) and MEMC Electronic Materials, Inc. (semi-conductor and solar cell substrates) |
| | | | | | |
Earl D. Weiner, #
69
(2007) | | Of Counsel and Partner prior to January 2007, of the law firm Sullivan & Cromwell LLP; member of ABA Federal Regulation of Securities Committee Task Force on Fund Director’s Guidebook; member of Advisory Board of Sustainable Forestry Management Limited. | | 95 | | None |
| * | The address for each of the Fund’s disinterested Directors is c/o AllianceBernstein L.P., Attn: Philip L. Kirstein, 1345 Avenue of the Americas, New York, NY 10105. |
| ** | There is no stated term of office for the Fund’s Directors. |
| *** | Mr. Mayer is an “interested person”, as defined in the 1940 Act, due to his position as Executive Vice President of the Adviser. |
| # | Member of the Audit Committee, Governance and Nominating Committee and Independent Directors Committee. |
| + | Member of the Fair Value Pricing Committee. |
| | |
| ALLIANCEBERNSTEIN GLOBAL BOND FUND • | | 55 |
Management of the Fund
Officer Information
Certain information concerning the Fund’s Officers is listed below.
| | | | |
NAME, ADDRESS*
AND AGE | | POSITION(S)
HELD WITH FUND | | PRINCIPAL OCCUPATION
DURING PAST 5 YEARS** |
Robert M. Keith,
48 | | President and Chief Executive Officer | | Executive Vice President of the Adviser** since July 2008; Executive Managing Director of ABI** since 2006 and the head of ABI since July 2008. Prior to joining ABI in 2006, Executive Managing Director of Bernstein Global Wealth Management, and prior thereto, Senior Managing Director and Global Head of Client Service and Sales of AllianceBernstein’s institutional investment management business since 2004. Prior thereto, he was a Managing Director and Head of North American Client Service and Sales in AllianceBernstein’s institutional investment management business, with which he had been associated since prior to 2003. |
| | | | |
Philip L. Kirstein,
63 | | Senior Vice President and Independent Compliance Officer | | Senior Vice President and Independent Compliance Officer of the AllianceBernstein Funds, with which he has been associated since October 2004. Prior thereto, he was Of Counsel to Kirkpatrick & Lockhart, LLP from October 2003 to October 2004, and General Counsel of Merrill Lynch Investment Managers, L.P. since prior to March 2003. |
| | | | |
Paul J. DeNoon,
46 | | Vice President | | Senior Vice President of the Adviser,** with which he has been associated since prior to 2003. |
| | | | |
Scott DiMaggio,
37 | | Vice President | | Senior Vice President of the Adviser,** with which he has been associated since prior to 2003. |
| | | | |
Fernando Grisales,
29 | | Vice President | | Assistant Vice President of the Adviser,** with which he has been associated since prior to 2003. |
| | | | |
Michael L. Mon,
39 | | Vice President | | Vice President of the Adviser,** with which he has been associated since prior to 2003. |
| | | | |
Douglas J. Peebles,
43 | | Vice President | | Executive Vice President of the Adviser,** with which he has been associated since prior to 2003. |
| | | | |
Matthew S. Sheridan,
33 | | Vice President | | Vice President of the Adviser,** with which he has been associated since prior to 2003. |
| | |
| 56 | | • ALLIANCEBERNSTEIN GLOBAL BOND FUND |
Management of the Fund
| | | | |
NAME, ADDRESS*
AND AGE | | POSITION(S)
HELD WITH FUND | | PRINCIPAL OCCUPATION
DURING PAST 5 YEARS** |
Emilie D. Wrapp,
52 | | Secretary | | Senior Vice President, Assistant General Counsel and Assistant Secretary of ABI,** with which she has been associated since prior to 2003. |
| | | | |
Joseph J. Mantineo,
49 | | Treasurer and Chief Financial Officer | | Senior Vice President of ABIS,** with which he has been associated since prior to 2003. |
| | | | |
Phyllis J. Clarke,
47 | | Controller | | Assistant Vice President of ABIS,** with which she has been associated since prior to 2003. |
| * | The address for each of the Fund’s Officers is 1345 Avenue of the Americas, New York, NY 10105. |
| ** | The Adviser, ABI and ABIS are affiliates of the Fund. |
| | The Fund’s Statement of Additional Information (“SAI”) has additional information about the Fund’s Directors and Officers and is available without charge upon request. Contact your financial representative or AllianceBernstein at 1-800-227-4618 for a free prospectus or SAI. |
| | |
| ALLIANCEBERNSTEIN GLOBAL BOND FUND • | | 57 |
Management of the Fund
THE FOLLOWING IS NOT PART OF THE SHAREHOLDER REPORT OR THE FINANCIAL STATEMENTS.
SUMMARY OF SENIOR OFFICER’S EVALUATION OF INVESTMENT ADVISORY AGREEMENT1
The following is a summary of the evaluation of the Investment Advisory Agreement between AllianceBernstein L.P. (the “Adviser”) and the AllianceBernstein Global Government Income Trust (the “Fund”).2,3 The evaluation of the Investment Advisory Agreement was prepared by Philip L. Kirstein, the Senior Officer of the Fund for the Directors of the Fund, as required by an August 2004 agreement between the Adviser and the New York State Attorney General (the “NYAG”). The Senior Officer’s evaluation of the Investment Advisory Agreement is not meant to diminish the responsibility or authority of the Board of Directors of the Fund to perform its duties pursuant to Section 15 of the Investment Company Act of 1940 (the “40 Act”) and applicable state law. The purpose of the summary is to provide shareholders with a synopsis of the independent evaluation of the reasonableness of the advisory fees proposed to be paid by the Fund which was provided to the Directors in connection with their review of the proposed approval of the continuance of the Investment Advisory Agreement. The Senior Officer’s evaluation considered the following factors:
| | 1. | Advisory fees charged to institutional and other clients of the Adviser for like services; |
| | 2. | Advisory fees charged by other mutual fund companies for like services; |
| | 3. | Costs to the Adviser and its affiliates of supplying services pursuant to the advisory agreement, excluding any intra-corporate profit; |
| | 4. | Profit margins of the Adviser and its affiliates from supplying such services; |
| | 5. | Possible economies of scale as the Fund grows larger; and |
| | 6. | Nature and quality of the Adviser’s services including the performance of the Fund. |
FUND ADVISORY FEES, EXPENSE REIMBURSEMENTS & RATIOS
The Adviser proposed that the Fund pay the advisory fee set forth in the table below for receiving the services to be provided pursuant to the Investment Advisory Agreement. The fee schedule below, implemented in January 2004 in
| 1 | It should be noted that Senior Officer’s fee evaluation was completed on October 18, 2007. |
| 2 | Future references to the Fund do not include “AllianceBernstein.” References in the fee summary pertaining to performance and expense ratios refer to the Class A shares of the Fund. |
| 3 | The Board of Directors approved a fixed-income fund realignment pursuant to which the Fund will expand its non-fundamental investment policies, implement expense caps for its share classes, change its name to AllianceBernstein Global Bond Fund and add retirement classes to the Fund. Note that these changes were completed on November 5, 2007. |
| | |
| 58 | | • ALLIANCEBERNSTEIN GLOBAL BOND FUND |
consideration of the Adviser’s settlement with the NYAG in December 2003, is based on a master schedule that contemplates eight categories of funds with almost all funds in each category having the same advisory schedule.4
| | | | | | | |
| Category | | Advisory Fee Based on % of
Average Daily Net Assets | | Net Assets
09/30/07
($MIL) | | Fund |
| High Income | | 50 bp on 1st $2.5 billion 45 bp on next $2.5 billion 40 bp on the balance | | $ | 1,547.6 | | Global Government Income Trust |
The Adviser is reimbursed as specified in the Investment Advisory Agreement for certain clerical, legal, accounting, administrative and other services provided to the Fund. During the Fund’s most recently completed fiscal year, the Adviser received $98,000 (0.006% of the Fund’s average daily net assets) for such services.
Set forth below are the Fund’s total expense ratios, annualized for the most recent semi-annual period:
| | | | | | | |
| Fund | | Total Expense
Ratio | | | Fiscal
Year End |
| Global Government Income Trust5 | | Class A Class B Class C | | 1.58
2.30 2.28 | %
% % | | September 30 |
| I. | ADVISORY FEES CHARGED TO INSTITUTIONAL AND OTHER CLIENTS |
The advisory fees charged to investment companies which the Adviser manages and sponsors are normally higher than those charged to similar sized institutional accounts, including pension plans and sub-advised investment companies. The fee differential reflects, among other things, different services provided to such clients, and different liabilities assumed. Services provided by the Adviser to the Fund that are not provided to non-investment company clients include providing office space and personnel to serve as Fund Officers, who among other responsibilities make the certifications required under the Sarbanes-Oxley Act of 2002, and coordinating with and monitoring the Fund’s third party service providers such as Fund counsel, auditors, custodians, transfer agents and pricing services. The accounting, administrative, legal and compliance requirements for the Fund are more costly than those for institutional client assets due to the greater complexities and time required for investment companies, although as
| 4 | Most of the AllianceBernstein Mutual Funds, which the Adviser manages, were affected by the Adviser’s settlement with the NYAG. |
| 5 | Includes interest expense of 0.51%. Excluding interest expense (related to reverse repurchase agreements of the Fund), the expense ratios would be 1.07%, 1.79% and 1.77% for Classes A, B, and C. The Adviser implemented expense caps, effective November 5, 2007. The expense caps are 0.90%, 1.60%, 1.60%, 0.60%, 1.10%, 0.85% and 0.60% for classes A, B, C, Advisor, R (new), K (new), and I (new). |
| | |
| ALLIANCEBERNSTEIN GLOBAL BOND FUND • | | 59 |
previously noted, a portion of these expenses are reimbursed by the Fund to the Adviser. Also, retail mutual funds managed by the Adviser are widely held. Servicing the Fund’s investors is more time consuming and labor intensive compared to institutional clients since the Adviser needs to communicate with a more extensive network of financial intermediaries and shareholders. In addition, managing the cash flow of an investment company may be more difficult than that of a stable pool of assets, such as an institutional account with little cash movement in either direction, particularly, if a fund is in net redemption and the Adviser is frequently forced to sell securities to raise cash for redemptions. However, managing a fund with positive cash flow may be easier at times than managing a stable pool of assets. Finally, in recent years, investment advisers have been sued by institutional clients and have suffered reputational damage both by the attendant publicity and outcomes other than complete victories. Accordingly, the legal and reputational risks associated with institutional accounts are greater than previously thought, although still not equal to those related to the mutual fund industry.
Notwithstanding the Adviser’s view that managing an investment company is not comparable to managing other institutional accounts because the services provided are different, it is worth considering information regarding the advisory fees charged to institutional accounts with substantially similar investment styles as the Fund. However, with respect to the Fund, the Adviser represented that there is no institutional product in the Adviser’s Form ADV that has a substantially similar investment style as the Fund.
The Adviser represented that it does not sub-advise any registered investment company that has a similar investment strategy as the Fund.
| II. | MANAGEMENT FEES CHARGED BY OTHER MUTUAL FUND COMPANIES FOR LIKE SERVICES. |
Lipper, Inc. (“Lipper”), an analytical service that is not affiliated with the Adviser, compared the fees charged to the Fund with fees charged to other investment companies for similar services by other investment advisers. Lipper’s analysis included the Fund’s ranking with respect to the contractual management fee relative to the median of the Fund’s Lipper Expense Group (“EG”) at the approximate current asset level of the Fund.6
| 6 | The contractual management fee is calculated by Lipper using the Fund’s contractual management fee rate at a hypothetical asset level. The hypothetical asset level is based on the combined net assets of all classes of the Fund, rounded up to the next $25 million. Lipper’s total expense ratio information is based on the most recent annual report except as otherwise noted. A ranking of “1” means that the Fund has the lowest effective fee rate in the Lipper peer group. |
| | |
| 60 | | • ALLIANCEBERNSTEIN GLOBAL BOND FUND |
Lipper describes an EG as a representative sample of comparable funds. Lipper’s standard methodology for screening funds to be included in an EG entails the consideration of several fund criteria, including fund type, investment classification/objective, load type and similar 12b-1/non-12b-1 service fees, asset (size) comparability, and expense components and attributes.7 An EG will typically consist of seven to twenty funds. The Fund had an original EG that had an insufficient number of peers, in the view of the Senior Officer and the Adviser. Consequently, at the request of the Senior Officer and the Adviser, Lipper expanded those Fund’s EG to include peers that had a similar but not the same Lipper investment classification/objective.
| | | | | | |
| Fund | | Contractual
Management
Fee (%)8 | | Lipper
Expense Group
Median (%) | | Rank |
| Global Government Income Trust | | 0.500 | | 0.597 | | 1/8 |
Because Lipper had expanded the Fund’s EG, under Lipper’s standard guidelines, the Fund’s Lipper Expense Universes (“EU”) was also expanded to include the universes of the peers that had a similar but not the same Lipper investment objective/classification as the subject Fund. 9 A “normal” EU will include funds that have the same investment objective/classification as the subject Fund.10 Set forth below is the comparison of the Fund’s total expense ratio and the medians of the Fund’s EG and EU and the Fund’s total expense ratio ranking. Pro-forma total expense ratio information (shown in bold and italicized) is included:
| | | | | | | | | | |
| Fund | | Expense
Ratio (%)11 | | Lipper
Group
Median (%) | | Lipper
Group
Rank | | Lipper
Universe
Median (%) | | Lipper
Universe
Rank |
| Global Government Income Trust | | 1.038 | | 1.053 | | 3/8 | | 1.157 | | 5/21 |
Pro-forma12 | | 0.900 | | 1.053 | | 1/8 | | 1.157 | | 1/21 |
| 7 | Lipper does not consider average account size when constructing EGs. Funds with relatively small average account sizes tend to have higher transfer agent expense ratios than comparable sized funds that have relatively large average account sizes. Note that there are limitations on Lipper expense category data because different funds categorize expenses differently. |
| 8 | The contractual management fee does not reflect any expense reimbursements made by the Fund to the Adviser for certain clerical, legal, accounting, administrative, and other services. |
| 9 | The expansion of the Fund’s EU was not requested by the Adviser or the Senior Officer. They requested that only the EG be expanded. |
| 10 | Except for asset size comparability, Lipper uses the same criteria for selecting an EG peer when selecting an EU peer. Unlike the EG, the EU allows for the same adviser to be represented by more than just one fund. |
| 11 | Most recently completed fiscal year Class A share total expense ratio. |
| 12 | Pro-forma shows what would have been the total expense ratio of the Fund had the Fund’s new expense limitation undertaking related to the fixed-income fund realignment been in effect for the full fiscal year. |
| | |
| ALLIANCEBERNSTEIN GLOBAL BOND FUND • | | 61 |
Based on this analysis, the Fund has equally favorable rankings on a management fee basis versus pro-forma total expense ratio basis.
| III. | COSTS TO THE ADVISER AND ITS AFFILIATES OF SUPPLYING SERVICES PURSUANT TO THE ADVISORY FEE ARRANGEMENT, EXCLUDING ANY INTRA-CORPORATE PROFIT. |
The Adviser utilizes two profitability reporting systems, which operate independently but are aligned with each other, to estimate the Adviser’s profitability in connection with investment advisory services provided to the Fund. The Senior Officer has retained a consultant to provide independent advice regarding the alignment of the two profitability systems as well as the methodologies and allocations utilized by both profitability systems. See Section IV for additional discussion.
| IV. | PROFIT MARGINS OF THE ADVISER AND ITS AFFILIATES FOR SUPPLYING SUCH SERVICES. |
The profitability information for the Fund prepared by the Adviser for the Board of Directors was reviewed by the Senior Officer and the consultant. The Adviser’s profitability from providing investment advisory services to the Fund increased during calendar year 2006, relative to 2005.
In addition to the Adviser’s direct profits from managing the Fund, certain of the Adviser’s affiliates have business relationships with the Fund and may earn a profit from providing other services to the Fund. The courts have referred to this type of business opportunity as “fall-out benefits” to the Adviser and indicated that such benefits should be factored into the evaluation of the total relationship between the Fund and the Adviser. Neither case law nor common business practice precludes the Adviser’s affiliates from earning a reasonable profit on this type of relationship provided the affiliates’ charges and services are competitive. These affiliates provide transfer agent and distribution related services to the Fund and receive transfer agent fees, Rule 12b-1 payments, front-end sales loads and contingent deferred sales charges (“CDSC”).
AllianceBernstein Investments, Inc. (“ABI”), an affiliate of the Adviser, is the Fund’s principal underwriter. ABI and the Adviser have disclosed in the Fund’s prospectus that they may make revenue sharing payments from their own resources, in addition to resources derived from sales loads and Rule 12b-1 fees, to firms that sell shares of the Fund. In 2006, ABI paid approximately 0.044% of the average monthly assets of the AllianceBernstein Mutual Funds or approximately $20.40 million for distribution services and educational support (revenue sharing payments). For 2007, it is anticipated, ABI will pay approximately 0.040% of the average monthly assets of the AllianceBernstein Mutual Funds or
| | |
| 62 | | • ALLIANCEBERNSTEIN GLOBAL BOND FUND |
approximately $20 million.13 During the Fund’s most recently completed fiscal year, ABI received from the Fund $110,658, $8,715,399 and $264,857 in front-end sales charges, Rule 12b-1 and CDSC fees, respectively.
Fees and reimbursements for out of pocket expenses charged by AllianceBernstein Investor Services, Inc. (“ABIS”), the affiliated transfer agent for the Fund, are charged on a per account basis, based on the level of service provided and the class of share held by the account. ABIS also receives a fee per shareholder sub-account for each account maintained by an intermediary on an omnibus basis. ABIS’ after-tax profitability decreased in 2006 in comparison to 2005. During the Fund’s most recently completed fiscal year, ABIS received $961,297 in fees from the Fund.14
| V. | POSSIBLE ECONOMIES OF SCALE |
The Adviser has indicated that economies of scale are being shared with shareholders through fee structures,15 subsidies and enhancement to services. Based on some of the professional literature that has considered economies of scale in the mutual fund industry, it is thought that to the extent economies of scale exist, they may more often exist across a fund family as opposed to a specific fund. This is because the costs incurred by the Adviser, such as investment research or technology for trading or compliance systems, can be spread across a greater asset base as the fund family increases in size. It is also possible that as the level of services required to operate a successful investment company has increased over time, and advisory firms have made such investments in their business to provide services, there may be a sharing of economies of scale without a reduction in advisory fees.
An independent consultant, retained by the Senior Officer, provided the Board of Directors an update of the Deli16 study on advisory fees and various fund characteristics. The preliminary results of the updated study, based on more recent data and using Lipper classifications, were found to be consistent with the results of the original study. The independent consultant observed patterns of lower advisory fees for funds with larger asset sizes and funds from larger family sizes compared to funds with smaller asset sizes and funds from smaller family
| 13 | ABI currently inserts the “Advance” in quarterly account statements and pays the incremental costs associated with the mailing. The incremental cost is less than what an “independent mailing” would cost. |
| 14 | The fees disclosed are net of any expense offsets with ABIS. An expense offset is created by the interest earned on the positive cash balance that occur within the transfer agent account as there is a one day lag with regards to money movement from the shareholder’s account to the transfer agent’s account and then the transfer agent’s account to the Fund’s account. During the Fund’s most recently completed fiscal year, the fees paid by the Fund to ABIS were reduced by $46,190 under the offset agreement between the Fund and ABIS. |
| 15 | Fee structures include fee reductions, pricing at scale and breakpoints in advisory fee schedules. |
| 16 | The Deli study was originally published in 2002 based on 1997 data. |
| | |
| ALLIANCEBERNSTEIN GLOBAL BOND FUND • | | 63 |
sizes, which according to the independent consultant is indicative of a sharing of economies of scale and scope. However, in less liquid and active markets, such is not the case, as the empirical analysis showed potential for diseconomies of scale in those markets. The empirical analysis also showed diminishing economies of scale and scope as funds surpassed a certain high level of assets.
| VI. | NATURE AND QUALITY OF THE ADVISER’S SERVICES, INCLUDING THE PERFORMANCE OF THE FUND |
With assets under management of approximately $813 billion as of September 30, 2007, the Adviser has the investment experience to manage and provide non-investment services (described in Section I) to the Fund.
The information below, prepared by Lipper, shows the 1, 3, 5 and 10 year performance returns and rankings of the Fund17 relative to its Lipper Performance Group (“PG”) and Lipper Performance Universe (“PU”)18 for the periods ended July 31, 2007.19
| | | | | | | | | | |
| | | Fund
Return (%) | | PG
Median (%) | | PU
Median (%) | | PG
Rank | | PU
Rank |
1 year | | 11.49 | | 6.56 | | 5.76 | | 2/6 | | 2/21 |
3 year | | 9.49 | | 5.75 | | 4.79 | | 2/6 | | 2/19 |
5 year | | 10.85 | | 8.11 | | 6.64 | | 2/6 | | 3/18 |
10 year | | 8.66 | | 6.35 | | 4.83 | | 1/4 | | 1/13 |
| 17 | The performance returns and rankings are for the Class A shares of the Fund. It should be noted that the performance returns of the Fund that is shown were provided by the Adviser. Lipper maintains its own database that includes the Fund’s performance returns. However, differences in the distribution price (ex-date versus payable date) and rounding differences may cause the Adviser’s own performance returns of the Fund to be one or two basis points different from Lipper. To maintain consistency in this evaluation, the performance returns of the Fund, as reported by the Adviser, are provided instead of Lipper. |
| 18 | The Fund’s PG/PU are not identical to the Fund’s EG/EU as the criteria for including/excluding a fund in/from an EG/EU is somewhat different than that of a PG/PU. |
| 19 | Note that the current Lipper investment classification/objective dictates the PG and PU throughout the life of the Fund even if the Fund may have had a different investment classification/objective at different points in time. |
| | |
| 64 | | • ALLIANCEBERNSTEIN GLOBAL BOND FUND |
Set forth below are the 1, 3, 5, 10 year and since inception performance returns of the Fund (in bold)20 versus its benchmarks.21 Fund and benchmark volatility and reward-to-variability ratio (“Sharpe Ratio”) information is also shown.22
| | | | | | | | | | | | | | | | |
| | | Periods Ending July 31, 2007
Annualized Performance |
| | | 1 Year
(%) | | 3 Year
(%) | | 5 Year
(%) | | 10 Year
(%) | | Since
Inception
(%) | | Annualized | | Risk
Period
(Year) |
| | | | | | | Volatility
(%) | | Sharpe
(%) | |
| Global Government Income Trust, Inc. | | 11.49 | | 9.49 | | 10.85 | | 8.66 | | 8.96 | | 8.42 | | 0.59 | | 10 |
| Lehman Brothers Global Treasury Index (USD hedged) | | 4.80 | | 4.63 | | 4.21 | | 5.74 | | N/A | | 2.74 | | 0.71 | | 10 |
| Inception Date: March 27, 1992 |
CONCLUSION:
Based on the factors discussed above the Senior Officer’s conclusion is that the proposed advisory fee for the Fund is reasonable and within the range of what would have been negotiated at arms-length in light of all the surrounding circumstances. This conclusion in respect of the Fund is based on an evaluation of all of these factors and no single factor was dispositive.
Dated: November 26, 2007
| 20 | The performance returns and risk measures shown in the table are for the Class A shares of the Fund. |
| 21 | The benchmark’s since inception performance return is from the nearest month-end after inception date. In contrast to the benchmark, the Fund’s since inception performance return is from the Fund’s actual inception date. |
| 22 | Fund volatility and Sharpe Ratio information was obtained through Lipper LANA, a database maintained by Lipper. Benchmark Volatility and Sharpe Ratio information was estimated by the Senior Officer using Standard Lipper methodology. Volatility is a statistical measure of the tendency of a market price or yield to vary over time. A Sharpe Ratio is a risk adjusted measure of return that divides a fund’s return in excess of the riskless return by the fund’s standard deviation. A fund with a greater volatility would be seen as more risky than a fund with equivalent performance but lower volatility; for that reason, a greater return would be demanded for the more risky fund. A fund with a higher Sharpe Ratio would be viewed as better performing than a fund with a lower Sharpe Ratio. |
| | |
| ALLIANCEBERNSTEIN GLOBAL BOND FUND • | | 65 |
THIS PAGE IS NOT PART OF THE SHAREHOLDER REPORT OR THE FINANCIAL STATEMENTS
ALLIANCEBERNSTEIN FAMILY OF FUNDS
Wealth Strategies Funds
Balanced Wealth Strategy
Wealth Appreciation Strategy
Wealth Preservation Strategy
Tax-Managed Balanced Wealth Strategy
Tax-Managed Wealth Appreciation Strategy
Tax-Managed Wealth Preservation Strategy
Blended Style Funds
U.S. Large Cap Portfolio
International Portfolio
Tax-Managed International Portfolio
Growth Funds
Domestic
Growth Fund
Mid-Cap Growth Fund
Large Cap Growth Fund
Small/Mid Cap Growth Portfolio*
Global & International
Global Growth Fund*
Global Thematic Growth Fund*
Greater China ‘97 Fund
International Growth Fund
Value Funds
Domestic
Balanced Shares
Focused Growth & Income Fund
Growth & Income Fund
Small/Mid Cap Value Fund
Utility Income Fund
Value Fund
Global & International
Global Real Estate Investment Fund
Global Value Fund
International Value Fund
Taxable Bond Funds
Diversified Yield Fund
Global Bond Fund
High Income Fund*
Intermediate Bond Portfolio
Short Duration Portfolio
Municipal Bond Funds
| | |
National
National Portfolio II
Arizona
California
California Portfolio II
Florida
Massachusetts | | Michigan
Minnesota
New Jersey
New York
Ohio
Pennsylvania
Virginia |
Intermediate Municipal Bond Funds
Intermediate California
Intermediate Diversified
Intermediate New York
Closed-End Funds
AllianceBernstein Global High Income Fund
AllianceBernstein Income Fund
AllianceBernstein National Municipal Income Fund
ACM Managed Dollar Income Fund
Alliance California Municipal Income Fund
Alliance New York Municipal Income Fund
The Spain Fund
Retirement Strategies Funds
| | | | |
2000 Retirement Strategy | | 2020 Retirement Strategy | | 2040 Retirement Strategy |
2005 Retirement Strategy | | 2025 Retirement Strategy | | 2045 Retirement Strategy |
2010 Retirement Strategy | | 2030 Retirement Strategy | | 2050 Retirement Strategy |
2015 Retirement Strategy | | 2035 Retirement Strategy | | 2055 Retirement Strategy |
We also offer Exchange Reserves,** which serves as the money market fund exchange vehicle for the AllianceBernstein mutual funds.
You should consider the investment objectives, risks, charges and expenses of any AllianceBernstein fund/portfolio carefully before investing. For free copies of our prospectuses, which contain this and other information, visit us online at www.alliancebernstein.com or contact your financial advisor. Please read the prospectus carefully before investing.
| * | | Prior to January 28, 2008, High Income Fund was named Emerging Market Debt Fund. Prior to November 3, 2008, Small/Mid Cap Growth Portfolio was named Small Cap Growth Portfolio, Global Growth Fund was named Global Research Growth Fund, and Global Thematic Growth Fund was named Global Technology Fund. Prior to December 1, 2008, National Portfolio II was named Insured National Portfolio, and California Portfolio II was named Insured California Portfolio. |
| ** | An investment in the Fund is not a deposit in a bank and is not insured or guaranteed by the Federal Deposit Insurance Corporation or any other government agency. Although the Fund seeks to preserve the value of your investment at $1.00 per share, it is possible to lose money by investing in the Fund. |
| | |
| 66 | | • ALLIANCEBERNSTEIN GLOBAL BOND FUND |
AllianceBernstein Family of Funds
NOTES
| | |
| ALLIANCEBERNSTEIN GLOBAL BOND FUND • | | 67 |
NOTES
| | |
| 68 | | • ALLIANCEBERNSTEIN GLOBAL BOND FUND |
ALLIANCEBERNSTEIN GLOBAL BOND FUND
1345 Avenue of the Americas
New York, NY 10105
800.221.5672
| | |
| |
| GBF-0151-0908 | |  |
ITEM 2. CODE OF ETHICS.
(a) The registrant has adopted a code of ethics that applies to its principal executive officer, principal financial officer and principal accounting officer. A copy of the registrant’s code of ethics is filed herewith as Exhibit 12(a)(1).
(b) During the period covered by this report, no material amendments were made to the provisions of the code of ethics adopted in 2(a) above.
(c) During the period covered by this report, no implicit or explicit waivers to the provisions of the code of ethics adopted in 2(a) above were granted.
ITEM 3. AUDIT COMMITTEE FINANCIAL EXPERT.
The registrant’s Board of Directors has determined that independent directors Garry L. Moody and William H. Foulk, Jr. qualify as audit committee financial experts.
ITEM 4. PRINCIPAL ACCOUNTANT FEES AND SERVICES.
(a) - (c) The following table sets forth the aggregate fees billed by the independent registered public accounting firm Ernst & Young LLP, for the Fund’s last two fiscal years for professional services rendered for: (i) the audit of the Fund’s annual financial statements included in the Fund’s annual report to stockholders; (ii) assurance and related services that are reasonably related to the performance of the audit of the Fund’s financial statements and are not reported under (i), which include advice and education related to accounting and auditing issues and quarterly press release review (for those Funds which issue press releases), and preferred stock maintenance testing (for those Funds that issue preferred stock); and (iii) tax compliance, tax advice and tax return preparation.
| | | | | | | | | |
| | | Audit Fees | | Audit-Related Fees | | Tax Fees |
2007 | | $ | 64,000 | | $ | 5,652 | | $ | 19,875 |
2008 | | $ | 70,587 | | $ | 3,211 | | $ | 21,907 |
(d) Not applicable.
(e) (1) Beginning with audit and non-audit service contracts entered into on or after May 6, 2003, the Fund’s Audit Committee policies and procedures require the pre-approval of all audit and non-audit services provided to the Fund by the Fund’s independent registered public accounting firm. The Fund’s Audit Committee policies and procedures also require pre-approval of all audit and non-audit services provided to the Adviser and Service Affiliates to the extent that these services are directly related to the operations or financial reporting of the Fund.
(e) (2) All of the amounts for Audit Fees, Audit-Related Fees and Tax Fees in the table under Item 4 (a) – (c) are for services pre-approved by the Fund’s Audit Committee.
(f) Not applicable.
(g) The following table sets forth the aggregate non-audit services provided to the Fund, the Fund’s Adviser and entities that control, are controlled by or under common control with the Adviser that provide ongoing services to the Fund, which include preparing an annual internal control report pursuant to Statement on Auditing Standards No. 70 (“Service Affiliates”):
| | | | | | | |
| | | All Fees for Non-Audit Services Provided to the Portfolio, the Adviser and Service Affiliates | | Total Amount of Foregoing Column Pre- approved by the Audit Committee (Portion Comprised of Audit Related Fees) (Portion Comprised of Tax Fees) | |
2007 | | $ | 1,218,782 | | $ | 145,047 | |
| | | | | $ | (125,172 | ) |
| | | | | $ | (19,875 | ) |
2008 | | $ | 1,031,365 | | $ | 168,237 | |
| | | | | $ | (146,330 | ) |
| | | | | $ | (21,907 | ) |
(h) The Audit Committee of the Fund has considered whether the provision of any non-audit services not pre-approved by the Audit Committee provided by the Fund’s independent registered public accounting firm to the Adviser and Service Affiliates is compatible with maintaining the auditor’s independence.
ITEM 5. AUDIT COMMITTEE OF LISTED REGISTRANTS.
Not applicable to the registrant.
ITEM 6. SCHEDULE OF INVESTMENTS.
Please see Schedule of Investments contained in the Report to Shareholders included under Item 1 of this Form N-CSR.
ITEM 7. DISCLOSURE OF PROXY VOTING POLICIES AND PROCEDURES FOR CLOSED-END MANAGEMENT INVESTMENT COMPANIES.
Not applicable to the registrant.
ITEM 8. PORTFOLIO MANAGERS OF CLOSED-END MANAGEMENT INVESTMENT COMPANIES.
Not applicable to the registrant.
ITEM 9. PURCHASES OF EQUITY SECURITIES BY CLOSED-END MANAGEMENT INVESTMENT COMPANY AND AFFILIATED PURCHASERS.
Not applicable to the registrant.
ITEM 10. SUBMISSION OF MATTERS TO A VOTE OF SECURITY HOLDERS.
There have been no material changes to the procedures by which shareholders may recommend nominees to the Fund’s Board of Directors since the Fund last provided disclosure in response to this item.
ITEM 11. CONTROLS AND PROCEDURES.
(a) The registrant’s principal executive officer and principal financial officer have concluded that the registrant’s disclosure controls and procedures (as defined in Rule 30a-2(c) under the Investment Company Act of 1940, as amended) are effective at the reasonable assurance level based on their evaluation of these controls and procedures as of a date within 90 days of the filing date of this document.
(b) There were no changes in the registrant’s internal controls over financial reporting that occurred during the second fiscal quarter of the period that has materially affected, or is reasonably likely to materially affect, the registrant’s internal control over financial reporting.
ITEM 12. EXHIBITS.
The following exhibits are attached to this Form N-CSR:
| | |
EXHIBIT NO. | | DESCRIPTION OF EXHIBIT |
| 12 (a) (1) | | Code of Ethics that is subject to the disclosure of Item 2 hereof |
| |
| 12 (b) (1) | | Certification of Principal Executive Officer Pursuant to Section 302 of the Sarbanes-Oxley Act of 2002 |
| |
| 12 (b) (2) | | Certification of Principal Financial Officer Pursuant to Section 302 of the Sarbanes-Oxley Act of 2002 |
| |
| 12 (c) | | Certification of Principal Executive Officer and Principal Financial Officer Pursuant to Section 906 of the Sarbanes-Oxley Act of 2002 |
SIGNATURES
Pursuant to the requirements of the Securities Exchange Act of 1934 and the Investment Company Act of 1940, the registrant has duly caused this report to be signed on its behalf by the undersigned, thereunto duly authorized.
(Registrant): AllianceBernstein Global Bond Fund, Inc.
| | |
| By: | | /s/ Robert M. Keith |
| | Robert M. Keith |
| | President |
| |
| Date: | | November 26, 2008 |
Pursuant to the requirements of the Securities Exchange Act of 1934 and the Investment Company Act of 1940, this report has been signed below by the following persons on behalf of the registrant and in the capacities and on the dates indicated.
| | |
| By: | | /s/ Robert M. Keith |
| | Robert M. Keith |
| | President |
| |
| Date: | | November 26, 2008 |
| | |
| By: | | /s/ Joseph J. Mantineo |
| | Joseph J. Mantineo |
| | Treasurer and Chief Financial Officer |
| |
| Date: | | November 26, 2008 |