UNITED STATES
SECURITIES AND EXCHANGE COMMISSION
WASHINGTON, D.C. 20549
FORM N-CSR
CERTIFIED SHAREHOLDER REPORT OF REGISTERED
MANAGEMENT INVESTMENT COMPANIES
Investment Company Act file number: 811-06554
ALLIANCEBERNSTEIN GLOBAL BOND FUND, INC.
(Exact name of registrant as specified in charter)
1345 Avenue of the Americas, New York, New York 10105
(Address of principal executive offices) (Zip code)
Joseph J. Mantineo
AllianceBernstein L.P.
1345 Avenue of the Americas
New York, New York 10105
(Name and address of agent for service)
Registrant’s telephone number, including area code: (800) 221-5672
Date of fiscal year end: September 30, 2014
Date of reporting period: September 30, 2014
| ITEM 1. | REPORTS TO STOCKHOLDERS. |
ANNUAL REPORT
AllianceBernstein Global Bond Fund
Annual Report

Investment Products Offered
| | • | | Are Not Bank Guaranteed |
Investors should consider the investment objectives, risks, charges and expenses of the Fund carefully before investing. For copies of our prospectus or summary prospectus, which contain this and other information, visit us online at www.alliancebernstein.com or contact your AllianceBernstein Investments representative. Please read the prospectus and/or summary prospectus carefully before investing.
This shareholder report must be preceded or accompanied by the Fund’s prospectus for individuals who are not current shareholders of the Fund.
You may obtain a description of the Fund’s proxy voting policies and procedures, and information regarding how the Fund voted proxies relating to portfolio securities during the most recent 12-month period ended June 30, without charge. Simply visit AllianceBernstein’s website at www.alliancebernstein.com, or go to the Securities and Exchange Commission’s (the “Commission”) website at www.sec.gov, or call AllianceBernstein at (800) 227-4618.
The Fund files its complete schedule of portfolio holdings with the Commission for the first and third quarters of each fiscal year on Form N-Q. The Fund’s Forms N-Q are available on the Commission’s website at www.sec.gov. The Fund’s Forms N-Q may also be reviewed and copied at the Commission’s Public Reference Room in Washington, DC; information on the operation of the Public Reference Room may be obtained by calling (800) SEC-0330. AllianceBernstein publishes full portfolio holdings for the Fund monthly at www.alliancebernstein.com.
AllianceBernstein Investments, Inc. (ABI) is the distributor of the AllianceBernstein family of mutual funds. ABI is a member of FINRA and is an affiliate of AllianceBernstein L.P., the manager of the funds.
AllianceBernstein® and the AB Logo are registered trademarks and service marks used by permission of the owner, AllianceBernstein L.P.
November 11, 2014
Annual Report
This report provides management’s discussion of fund performance for AllianceBernstein Global Bond Fund (the “Fund”) for the annual reporting period ended September 30, 2014.
Investment Objectives and Policies
The Fund’s investment objective is to generate current income consistent with preservation of capital. The Fund invests, under normal circumstances, at least 80% of its net assets in fixed-income securities. Under normal market conditions, the Fund invests significantly in fixed-income securities of non-U.S. companies. In addition, the Fund invests, under normal circumstances, in the fixed-income securities of companies located in at least three countries. The Fund may invest in a broad range of fixed-income securities in both developed and emerging markets. The Fund may invest across all fixed-income sectors, including U.S. and non-U.S. Government and corporate debt securities. The Fund’s investments may be denominated in local currency or U.S. dollar-denominated. The Fund may invest in debt securities with a range of maturities from short- to long-term. The Fund may use borrowings or other leverage for investment purposes.
AllianceBernstein L.P. (the “Adviser”) will actively manage the Fund’s assets in relation to market conditions and general economic conditions and adjust the Fund’s investments in an effort to best enable the Fund to achieve its investment objective. Thus, the percentage of the Fund’s assets invested in a particular country or denominated in a particular currency
will vary in accordance with the Adviser’s assessment of the relative yield and appreciation potential of such securities and the relationship of the country’s currency to the U.S. dollar.
Under normal circumstances, the Fund invests at least 75% of its net assets in fixed-income securities rated investment-grade at the time of investment and may invest up to 25% of its net assets in below investment grade fixed-income securities (commonly known as “junk bonds”).
The Fund may invest in mortgage-related and other asset-backed securities, loan participations, inflation-protected securities, structured securities, variable, floating, and inverse floating rate instruments and preferred stock, and may use other investment techniques. The Fund intends, among other things, to enter into transactions such as reverse repurchase agreements and dollar rolls. The Fund may invest, without limit, in derivatives, such as options, futures, forwards or swaps.
Investment Results
The table on page 6 shows the Fund’s performance compared to its benchmark, the Barclays Global Aggregate Bond Index (U.S. dollar hedged), for the six- and 12-month periods ended September 30, 2014. The inception date for Class Z shares was October 15, 2013; due to limited performance history, there is no discussion of comparison to the benchmark.
All share classes of the Fund outperformed the benchmark for the 12-month period, excluding Classes B, C
| | | | |
| ALLIANCEBERNSTEIN GLOBAL BOND FUND • | | | 1 | |
and R; all share classes underperformed for the six-month period. For both periods, currency exposure was a primary positive contributor, driven by the Fund’s long position in the U.S. dollar versus several short positions in other developed-market currencies. Security selection in the Fund’s investment-grade corporate holdings, especially a focus on the financials sector, contributed positively for both periods. An allocation to inflation-linked securities detracted for both periods. Within country positioning, an underweight to Japan contributed, while an underweight to the euro area and overweight to the U.S. detracted for both periods. Sector selection was a notable positive for the 12-month period, as an overweight to investment-grade corporates, exposure to high-yield corporates, non-agency mortgages, preferred stock and emerging-market corporates all contributed positively.
For both periods, interest rate swaps and Treasury futures were utilized to manage the overall interest rate risk exposure of the Fund; for both periods, the Fund’s shorter-than-benchmark duration exposure detracted, as yields declined. Currency forwards were utilized for hedging and investment purposes, which added to returns for both periods; purchased and written options for hedging purposes, and credit default swaps for investment purposes, had an immaterial impact during both periods. Variance swaps were utilized for hedging purposes during both periods, which detracted from returns.
Market Review and Investment Strategy
During the 12-month period ended September 30, 2014, markets remained heavily focused on both central bank monetary policy and global growth. Early in the period, volatility increased as the U.S. Federal Reserve (the “Fed”) began to taper its asset purchase program and investors worried about the impact of higher interest rates. However, fixed-income markets stabilized in the first quarter of 2014 and bond fund flows turned positive once again, as U.S. economic data cooled, blamed mostly on winter weather. Ongoing geopolitical concerns, specifically the conflict between Ukraine and Russia, as well as continued violence in the Middle East, contributed to periodic safe haven rallies into U.S. Treasuries, keeping a lid on yields.
Contrary to expectations, interest rates continued to decline toward the end of the period as investors became increasingly wary regarding global growth, particularly in Europe and China. Worries about Europe increased, as core inflation moved closer to zero and the European Central Bank (“ECB”) cut key interest rates, announcing plans to repurchase asset-backed securities and covered bonds to further stimulate the struggling economy. Low yields in the euro area and further easing by the ECB helped anchor U.S. Treasury yields. The U.S. Federal Open Market Committee (the “Committee”) also announced no changes to the stance of U.S. monetary policy after its mid-September meeting, easing concerns
| | |
| 2 | | • ALLIANCEBERNSTEIN GLOBAL BOND FUND |
for higher interest rates. The Committee continued the reduction in asset purchases (tapering) and reaffirmed its views that U.S. interest rates will remain low until unemployment and inflation are more closely aligned with Fed targets. Despite the intra-period volatility, the 10-year U.S. Treasury yield declined by 0.12% during the annual period to end at a yield of 2.49%. The U.S. Treasury curve flattened, as intermediate yields rose and longer-term yields declined.
Against this backdrop, fixed-income sectors benefited from the low-yield environment with major U.S. fixed-income sectors posting positive returns. Credit-sensitive securities generally outperformed global Treasuries with corporate sectors, both investment-grade and high-yield, posting the strongest returns. Corporate fundamentals as well as earnings remained favorable, amid ample global liquidity and tighter spreads.
During the 12-month period, the risk profile of the Fund was reduced amid both increased volatility and tighter spread levels. The Fund continued to hold an overweight to U.S. corporates with modest exposure to high yield and emerging market corporates. Within corporate exposure, financials are favored on a relative value basis. The Fund continued to be underweight government bonds, with a focus on underweighting Japan and core Europe. The Fund maintained an overweight in the UK, where the spread premium relative to German bunds was at historical highs. Exposure to inflation-protected securities was modestly increased on the back of attractive breakeven levels. With diverging global growth and central bank policies, currency exposure was increased late in the period, with a bias toward long U.S. dollar positions on expected U.S. dollar strength. The Fund’s overall duration remained short versus its benchmark.
| | | | |
| ALLIANCEBERNSTEIN GLOBAL BOND FUND • | | | 3 | |
DISCLOSURES AND RISKS
Benchmark Disclosure
The unmanaged Barclays Global Aggregate Bond Index (U.S. dollar hedged) does not reflect fees and expenses associated with the active management of a mutual fund portfolio. The Barclays Global Aggregate Bond Index represents the performance of the global investment-grade developed fixed-income markets. An investor cannot invest directly in an index, and its results are not indicative of the performance for any specific investment, including the Fund.
A Word About Risk
Market Risk: The value of the Fund’s assets will fluctuate as the stock or bond market fluctuates. The value of its investments may decline, sometimes rapidly and unpredictably, simply because of economic changes or other events that affect large portions of the market.
Interest Rate Risk: Changes in interest rates will affect the value of investments in fixed-income securities. When interest rates rise, the value of investments in fixed-income securities tends to fall and this decrease in value may not be offset by higher income from new investments. Interest rate risk is generally greater for fixed-income securities with longer maturities or durations.
Duration Risk: Duration is a measure that relates the expected price volatility of a fixed-income security to changes in interest rates. The duration of a fixed-income security may be shorter than or equal to full maturity of a fixed-income security. Fixed-income securities with longer durations have more risk and will decrease in price as interest rates rise. For example, a fixed-income security with a duration of three years will decrease in value by approximately 3% if interest rates increase by 1%.
Credit Risk: An issuer or guarantor of a fixed-income security, or the counterparty to a derivatives or other contract, may be unable or unwilling to make timely payments of interest or principal, or to otherwise honor its obligations. The issuer or guarantor may default, causing a loss of the full principal amount of a security. The degree of risk for a particular security may be reflected in its credit rating. There is the possibility that the credit rating of a fixed-income security may be downgraded after purchase, which may adversely affect the value of the security.
Below Investment Grade Securities Risk: Investments in fixed-income securities with lower ratings (commonly known as “junk bonds”) are subject to a higher probability that an issuer will default or fail to meet its payment obligations. These securities may be subject to greater price volatility due to such factors as specific corporate developments, negative perceptions of the junk bond market generally and less secondary market liquidity.
Inflation Risk: This is the risk that the value of assets or income from investments will be less in the future as inflation decreases the value of money. As inflation increases, the value of the Fund’s assets can decline as can the value of the Fund’s distributions. This risk is significantly greater if the Fund invests a significant portion of its assets in fixed-income securities with longer maturities.
Foreign (Non-U.S.) Risk: Investments in securities of non-U.S. issuers may involve more risk than those of U.S. issuers. These securities may fluctuate more widely in price and may be less liquid due to adverse market, economic, political, regulatory or other factors.
Emerging Market Risk: Investments in emerging market countries may have more risk because the markets are less developed and less liquid as well as being subject to increased economic, political, regulatory or other uncertainties.
Currency Risk: Fluctuations in currency exchange rates may negatively affect the value of the Fund’s investments or reduce its returns.
(Disclosures, Risks and Note about Historical Performance continued on next page)
| | |
| 4 | | • ALLIANCEBERNSTEIN GLOBAL BOND FUND |
Disclosures and Risks
DISCLOSURES AND RISKS
(continued from previous page)
Leverage Risk: To the extent the Fund uses leveraging techniques, its net asset value (“NAV”), may be more volatile because leverage tends to exaggerate the effect of changes in interest rates and any increase or decrease in the value of the Fund’s investments.
Diversification Risk: The Fund may have more risk because it is “non-diversified”, meaning that it can invest more of its assets in a smaller number of issuers and that adverse changes in the value of one security could have a more significant effect on the Fund’s NAV.
Derivatives Risk: Derivatives may be illiquid, difficult to price, and leveraged so that small changes may produce disproportionate losses for the Fund, and may be subject to counterparty risk to a greater degree than more traditional investments.
Management Risk: The Fund is subject to management risk because it is an actively managed investment fund. The Adviser will apply its investment techniques and risk analyses in making investment decisions, but there is no guarantee that its techniques will produce the intended results.
These risks are fully discussed in the Fund’s prospectus.
An Important Note About Historical Performance
The investment return and principal value of an investment in the Fund will fluctuate, so that shares, when redeemed, may be worth more or less than their original cost. Performance shown on the following pages represents past performance and does not guarantee future results. Current performance may be lower or higher than the performance information shown. You may obtain performance information current to the most recent month-end by visiting
www.alliancebernstein.com.
All fees and expenses related to the operation of the Fund have been deducted. NAV returns do not reflect sales charges; if sales charges were reflected, the Fund’s quoted performance would be lower. SEC returns reflect the applicable sales charges for each share class: a 4.25% maximum front-end sales charge for Class A shares; the applicable contingent deferred sales charge for Class B shares (3% year 1, 2% year 2, 1% year 3); a 1% 1-year contingent deferred sales charge for Class C shares. Returns for the different share classes will vary due to different expenses associated with each class. Performance assumes reinvestment of distributions and does not account for taxes.
| | | | |
| ALLIANCEBERNSTEIN GLOBAL BOND FUND • | | | 5 | |
Disclosures and Risks
HISTORICAL PERFORMANCE
| | | | | | | | | | |
| | | | | | | | | | |
THE FUND VS. ITS BENCHMARK
PERIODS ENDED SEPTEMBER 30, 2014 (unaudited) | | NAV Returns | | | |
| | 6 Months | | | 12 Months | | | |
| AllianceBernstein Global Bond Fund | | | | | | | | | | |
Class A | | | 2.97% | | | | 5.82% | | | |
|
Class B* | | | 2.48% | | | | 5.08% | | | |
|
Class C | | | 2.48% | | | | 5.07% | | | |
|
Advisor Class† | | | 3.00% | | | | 6.14% | | | |
|
Class R† | | | 2.67% | | | | 5.48% | | | |
|
Class K† | | | 2.84% | | | | 5.83% | | | |
|
Class I† | | | 3.02% | | | | 6.19% | | | |
|
Class Z† | | | 3.04% | | | | 6.38%‡ | | | |
|
Barclays Global Aggregate Bond Index
(U.S. dollar hedged) | | | 3.17% | | | | 5.50% | | | |
|
* Effective January 31, 2009, Class B shares are no longer available for purchase to new investors. Please see Note A for more information. † Please note that these share classes are for investors purchasing shares through accounts established under certain fee-based programs sponsored and maintained by certain broker-dealers and financial intermediaries, institutional pension plans and/or investment advisory clients of, and certain other persons associated with, the Adviser and its affiliates or the Fund. ‡ Since inception on 10/15/2013. |
| | | | | | | | | | |
See Disclosures, Risks and Note about Historical Performance on pages 4-5.
(Historical Performance continued on next page)
| | |
| 6 | | • ALLIANCEBERNSTEIN GLOBAL BOND FUND |
Historical Performance
HISTORICAL PERFORMANCE
(continued from previous page)
GROWTH OF A $10,000 INVESTMENT IN THE FUND
9/30/04 TO 9/30/14 (unaudited)
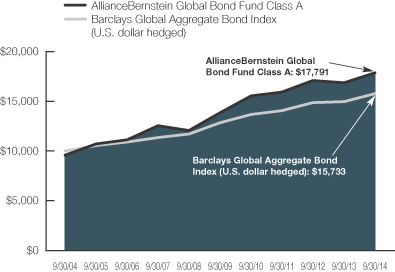
This chart illustrates the total value of an assumed $10,000 investment in AllianceBernstein Global Bond Fund Class A shares (from 9/30/04 to 9/30/14) as compared to the performance of its benchmark. The chart reflects the deduction of the maximum 4.25% sales charge from the initial $10,000 investment in the Fund and assumes the reinvestment of dividends and capital gains distributions.
See Disclosures, Risks and Note about Historical Performance on pages 4-5.
(Historical Performance continued on next page)
| | | | |
| ALLIANCEBERNSTEIN GLOBAL BOND FUND • | | | 7 | |
Historical Performance
HISTORICAL PERFORMANCE
(continued from previous page)
| | | | | | | | | | | | |
| AVERAGE ANNUAL RETURNS AS OF SEPTEMBER 30, 2014 (unaudited) | |
| | | NAV Returns | | | SEC Returns
(reflects applicable
sales charges) | | | SEC Yields* | |
| | | | | | | | | | | | |
| Class A Shares | | | | | | | | | | | 1.60 | % |
1 Year | | | 5.82 | % | | | 1.29 | % | | | | |
5 Years | | | 5.21 | % | | | 4.30 | % | | | | |
10 Years | | | 6.40 | % | | | 5.93 | % | | | | |
| | | | | | | | | | | | |
| Class B Shares | | | | | | | | | | | 0.95 | % |
1 Year | | | 5.08 | % | | | 2.08 | % | | | | |
5 Years | | | 4.44 | % | | | 4.44 | % | | | | |
10 Years(a) | | | 5.96 | % | | | 5.96 | % | | | | |
| | | | | | | | | | | | |
| Class C Shares | | | | | | | | | | | 0.97 | % |
1 Year | | | 5.07 | % | | | 4.07 | % | | | | |
5 Years | | | 4.44 | % | | | 4.44 | % | | | | |
10 Years | | | 5.62 | % | | | 5.62 | % | | | | |
| | | | | | | | | | | | |
| Advisor Class Shares† | | | | | | | | | | | 1.96 | % |
1 Year | | | 6.14 | % | | | 6.14 | % | | | | |
5 Years | | | 5.50 | % | | | 5.50 | % | | | | |
Since Inception‡ | | | 5.33 | % | | | 5.33 | % | | | | |
| | | | | | | | | | | | |
| Class R Shares† | | | | | | | | | | | 1.31 | % |
1 Year | | | 5.48 | % | | | 5.48 | % | | | | |
5 Years | | | 4.89 | % | | | 4.89 | % | | | | |
Since Inception‡ | | | 4.75 | % | | | 4.75 | % | | | | |
| | | | | | | | | | | | |
| Class K Shares† | | | | | | | | | | | 1.62 | % |
1 Year | | | 5.83 | % | | | 5.83 | % | | | | |
5 Years | | | 5.23 | % | | | 5.23 | % | | | | |
Since Inception‡ | | | 5.08 | % | | | 5.08 | % | | | | |
| | | | | | | | | | | | |
| Class I Shares† | | | | | | | | | | | 1.94 | % |
1 Year | | | 6.19 | % | | | 6.19 | % | | | | |
5 Years | | | 5.55 | % | | | 5.55 | % | | | | |
Since Inception‡ | | | 5.37 | % | | | 5.37 | % | | | | |
| | | | | | | | | | | | |
| Class Z Shares† | | | | | | | | | | | 2.05 | % |
Since Inception‡ | | | 6.38 | % | | | 6.38 | % | | | | |
The Fund’s prospectus fee table shows the Fund’s total annual operating expense ratios as 0.94%, 1.65%, 1.64%, 0.64%, 1.29%, 0.95%, 0.59% and 0.54% for Class A, Class B, Class C, Advisor Class, Class R, Class K, Class I and Class Z shares, respectively. The Financial Highlights section of this report sets forth expense ratio data for the current reporting period; the expense ratios shown above may differ from the expense ratios in the Financial Highlights sections since they are based on different time periods.
| * | | SEC yields are calculated based on SEC guidelines for the 30-day period ended September 30, 2014. |
| (a) | | Assumes conversion of Class B shares into Class A shares after six years. |
| † | | These share classes are offered at NAV to eligible investors and their SEC returns are the same as their NAV returns. Please note that these share classes are for investors purchasing shares through accounts established under certain fee-based programs sponsored and maintained by certain broker-dealers and financial intermediaries, institutional pension plans and/or investment advisory clients of, and certain other persons associated with, the Adviser and its affiliates or the Fund. The inception dates for these share classes are listed below. |
| ‡ | | Inception dates: 11/5/2007 for Advisor Class, Class R, Class K and Class I shares; 10/15/2013 for Class Z shares. |
See Disclosures, Risks and Note about Historical Performance on pages 4-5.
(Historical Performance continued on next page)
| | |
| 8 | | • ALLIANCEBERNSTEIN GLOBAL BOND FUND |
Historical Performance
HISTORICAL PERFORMANCE
(continued from previous page)
| | | | |
SEC AVERAGE ANNUAL RETURNS
AS OF THE MOST RECENT CALENDAR QUARTER-END
SEPTEMBER 30, 2014 (unaudited) | |
| | | SEC Returns
(reflects applicable
sales charges) | |
| | | | |
| Class A Shares | | | | |
1 Year | | | 1.29 | % |
5 Years | | | 4.30 | % |
10 Years | | | 5.93 | % |
| | | | |
| Class B Shares | | | | |
1 Year | | | 2.08 | % |
5 Years | | | 4.44 | % |
10 Years(a) | | | 5.96 | % |
| | | | |
| Class C Shares | | | | |
1 Year | | | 4.07 | % |
5 Years | | | 4.44 | % |
10 Years | | | 5.62 | % |
| | | | |
| Advisor Class Shares* | | | | |
1 Year | | | 6.14 | % |
5 Years | | | 5.50 | % |
Since Inception† | | | 5.33 | % |
| | | | |
| Class R Shares* | | | | |
1 Year | | | 5.48 | % |
5 Years | | | 4.89 | % |
Since Inception† | | | 4.75 | % |
| | | | |
| Class K Shares* | | | | |
1 Year | | | 5.83 | % |
5 Years | | | 5.23 | % |
Since Inception† | | | 5.08 | % |
| | | | |
| Class I Shares* | | | | |
1 Year | | | 6.19 | % |
5 Years | | | 5.55 | % |
Since Inception† | | | 5.37 | % |
| | | | |
| Class Z Shares* | | | | |
Since Inception† | | | 6.38 | % |
| (a) | | Assumes conversion of Class B shares into Class A shares after six years. |
| * | | These share classes are offered at NAV to eligible investors and their SEC returns are the same as their NAV returns. Please note that these share classes are for investors purchasing shares through accounts established under certain fee-based programs sponsored and maintained by certain broker-dealers and financial intermediaries, institutional pension plans and/or investment advisory clients of, and certain other persons associated with, the Adviser and its affiliates or the Fund. The inception dates for these share classes are listed below. |
| † | | Inception dates: 11/5/2007 for Advisor Class, Class R, Class K and Class I shares; 10/15/2013 for Class Z shares. |
See Disclosures, Risks and Note about Historical Performance on pages 4-5.
| | | | |
| ALLIANCEBERNSTEIN GLOBAL BOND FUND • | | | 9 | |
Historical Performance
EXPENSE EXAMPLE
(unaudited)
As a shareholder of the Fund, you incur two types of costs: (1) transaction costs, including sales charges (loads) on purchase payments, contingent deferred sales charges on redemptions and (2) ongoing costs, including management fees; distribution (12b-1) fees; and other Fund expenses. This example is intended to help you understand your ongoing costs (in dollars) of investing in the Fund and to compare these costs with the ongoing costs of investing in other mutual funds.
The Example is based on an investment of $1,000 invested at the beginning of the period and held for the entire period as indicated below.
Actual Expenses
The table below provides information about actual account values and actual expenses. You may use the information in this line, together with the amount you invested, to estimate the expenses that you paid over the period. Simply divide your account value by $1,000 (for example, an $8,600 account value divided by $1,000 = 8.6), then multiply the result by the number in the first line under the heading entitled “Expenses Paid During Period” to estimate the expenses you paid on your account during this period.
Hypothetical Example for Comparison Purposes
The table below provides information about hypothetical account values and hypothetical expenses based on the Fund’s actual expense ratio and an assumed annual rate of return of 5% before expenses, which is not the Fund’s actual return. The hypothetical account values and expenses may not be used to estimate the actual ending account balance or expenses you paid for the period. You may use this information to compare the ongoing costs of investing in the Fund and other funds by comparing this 5% hypothetical example with the 5% hypothetical examples that appear in the shareholder reports of other funds.
Please note that the expenses shown in the table are meant to highlight your ongoing costs only and do not reflect any transactional costs, such as sales charges (loads), or contingent deferred sales charges on redemptions. Therefore, the second line of the table is useful in comparing ongoing costs only, and will not help you determine the relative total costs of owning different funds. In addition, if these transactional costs were included, your costs would have been higher.
| | | | | | | | | | | | | | | | |
| | | Beginning
Account Value
April 1, 2014 | | | Ending
Account Value
September 30, 2014 | | | Expenses Paid
During Period* | | | Annualized
Expense Ratio* | |
| Class A | | | | | | | | | | | | | | | | |
Actual | | $ | 1,000 | | | $ | 1,029.70 | | | $ | 4.68 | | | | 0.92 | % |
Hypothetical** | | $ | 1,000 | | | $ | 1,020.46 | | | $ | 4.66 | | | | 0.92 | % |
| Class B | | | | | | | | | | | | | | | | |
Actual | | $ | 1,000 | | | $ | 1,024.80 | | | $ | 8.32 | | | | 1.64 | % |
Hypothetical** | | $ | 1,000 | | | $ | 1,016.85 | | | $ | 8.29 | | | | 1.64 | % |
| Class C | | | | | | | | | | | | | | | | |
Actual | | $ | 1,000 | | | $ | 1,024.80 | | | $ | 8.22 | | | | 1.62 | % |
Hypothetical** | | $ | 1,000 | | | $ | 1,016.95 | | | $ | 8.19 | | | | 1.62 | % |
| Advisor Class | | | | | | | | | | | | | | | | |
Actual | | $ | 1,000 | | | $ | 1,030.00 | | | $ | 3.16 | | | | 0.62 | % |
Hypothetical** | | $ | 1,000 | | | $ | 1,021.96 | | | $ | 3.14 | | | | 0.62 | % |
| Class R | | | | | | | | | | | | | | | | |
Actual | | $ | 1,000 | | | $ | 1,026.70 | | | $ | 6.45 | | | | 1.27 | % |
Hypothetical** | | $ | 1,000 | | | $ | 1,018.70 | | | $ | 6.43 | | | | 1.27 | % |
| | |
| 10 | | • ALLIANCEBERNSTEIN GLOBAL BOND FUND |
Expense Example
EXPENSE EXAMPLE
(unaudited)
(continued from previous page)
| | | | | | | | | | | | | | | | |
| | | Beginning
Account Value
April 1, 2014 | | | Ending
Account Value
September 30, 2014 | | | Expenses Paid
During Period* | | | Annualized
Expense Ratio* | |
| Class K | | | | | | | | | | | | | | | | |
Actual | | $ | 1,000 | | | $ | 1,028.40 | | | $ | 4.73 | | | | 0.93 | % |
Hypothetical** | | $ | 1,000 | | | $ | 1,020.41 | | | $ | 4.71 | | | | 0.93 | % |
| Class I | | | | | | | | | | | | | | | | |
Actual | | $ | 1,000 | | | $ | 1,030.20 | | | $ | 2.95 | | | | 0.58 | % |
Hypothetical** | | $ | 1,000 | | | $ | 1,022.16 | | | $ | 2.94 | | | | 0.58 | % |
| Class Z | | | | | | | | | | | | | | | | |
Actual | | $ | 1,000 | | | $ | 1,030.40 | | | $ | 2.80 | | | | 0.55 | % |
Hypothetical** | | $ | 1,000 | | | $ | 1,022.31 | | | $ | 2.79 | | | | 0.55 | % |
| * | | Expenses are equal to the classes’ annualized expense ratios multiplied by the average account value over the period, multiplied by 183/365 (to reflect the one-half year period). |
| ** | | Assumes 5% annual return before expenses. |
| | | | |
| ALLIANCEBERNSTEIN GLOBAL BOND FUND • | | | 11 | |
Expense Example
PORTFOLIO SUMMARY
September 30, 2014 (unaudited)
PORTFOLIO STATISTICS
Net Assets ($mil): $3,615.8
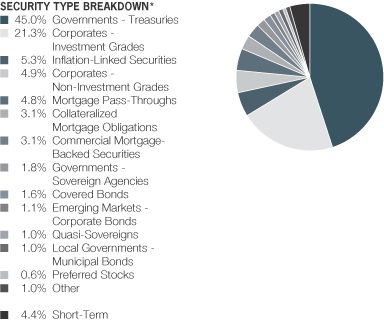
| * | | All data are as of September 30, 2014. The Fund’s security type breakdown is expressed as a percentage of total investments and may vary over time. The Fund also enters into derivative transactions, which may be used for hedging or investment purposes (see “Portfolio of Investments” section of the report for additional details). “Other” securities type weightings represent 0.4% or less in the following security types: Agencies, Asset-Backed Securities, Bank Loans, Governments-Sovereign Bonds, Investment Companies, Supranationals and Whole Loan Trusts. |
| | |
| 12 | | • ALLIANCEBERNSTEIN GLOBAL BOND FUND |
Portfolio Summary
PORTFOLIO SUMMARY
September 30, 2014 (unaudited)
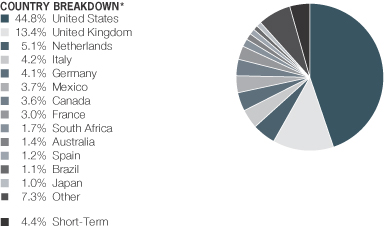
| * | | All data are as of September 30, 2014. The Fund’s country breakdown is expressed as a percentage of total investments and may vary over time. The Fund also enters into derivative transactions, which may be used for hedging or investment purposes (see “Portfolio of Investments” section of the report for additional details). “Other” country weightings represent 0.9% or less in the following countries or regions: Belgium, Chile, China, Colombia, Denmark, Dominican Republic, Guatemala, India, Indonesia, Ireland, Luxembourg, Morocco, Norway, Peru, Portugal, Supranational, Sweden, Switzerland, Turkey and United Arab Emirates. |
| | | | |
| ALLIANCEBERNSTEIN GLOBAL BOND FUND • | | | 13 | |
Portfolio Summary
PORTFOLIO OF INVESTMENTS
September 30, 2014
| | | | | | | | | | |
| | | | | Principal
Amount
(000) | | | U.S. $ Value | |
| | | | | |
| | | | | | | | | | |
GOVERNMENTS -
TREASURIES – 46.1% | | | | | | | | | | |
Australia – 1.1% | | | | | | | | | | |
Australia Government Bond
Series 122
5.25%, 3/15/19 | | AUD | | | 21,827 | | | $ | 20,974,680 | |
Series 128
5.75%, 7/15/22 | | | | | 3,520 | | | | 3,591,164 | |
Series 137
2.75%, 4/21/24 | | | | | 15,935 | | | | 13,119,380 | |
| | | | | | | | | | |
| | | | | | | | | 37,685,224 | |
| | | | | | | | | | |
Belgium – 0.6% | | | | | | | | | | |
Belgium Government Bond
Series 61
4.25%, 9/28/21(a) | | EUR | | | 12,230 | | | | 19,215,298 | |
Series 71
3.75%, 6/22/45(a) | | | | | 2,300 | | | | 3,748,660 | |
| | | | | | | | | | |
| | | | | | | | | 22,963,958 | |
| | | | | | | | | | |
Canada – 2.8% | | | | | | | | | | |
Canadian Government Bond
1.25%, 9/01/18 | | CAD | | | 115,000 | | | | 101,823,697 | |
| | | | | | | | | | |
| | | |
France – 1.2% | | | | | | | | | | |
France Government Bond OAT
1.75%, 11/25/24 | | EUR | | | 28,160 | | | | 37,127,264 | |
3.25%, 5/25/45(a) | | | | | 3,600 | | | | 5,428,367 | |
| | | | | | | | | | |
| | | | | | | | | 42,555,631 | |
| | | | | | | | | | |
Germany – 2.0% | | | | | | | | | | |
Bundesobligation
Series 169
0.50%, 4/12/19 | | | | | 17,250 | | | | 22,181,968 | |
Bundesrepublik Deutschland
1.50%, 5/15/23 | | | | | 14,325 | | | | 19,256,479 | |
2.25%, 9/04/21 | | | | | 12,646 | | | | 17,961,733 | |
3.25%, 7/04/42 | | | | | 1,000 | | | | 1,655,349 | |
Series 2007
4.25%, 7/04/39 | | | | | 4,900 | | | | 9,201,042 | |
| | | | | | | | | | |
| | | | | | | | | 70,256,571 | |
| | | | | | | | | | |
Ireland – 0.5% | | | | | | | | | | |
Ireland Government Bond
5.40%, 3/13/25 | | | | | 11,000 | | | | 18,507,598 | |
| | | | | | | | | | |
| | | |
Italy – 3.9% | | | | | | | | | | |
Italy Buoni Poliennali Del Tesoro
3.50%, 11/01/17 | | | | | 10,175 | | | | 13,962,786 | |
3.75%, 3/01/21-5/01/21 | | | | | 23,525 | | | | 33,718,522 | |
4.00%, 9/01/20 | | | | | 1,870 | | | | 2,720,015 | |
4.25%, 9/01/19 | | | | | 6,710 | | | | 9,778,615 | |
| | |
| 14 | | • ALLIANCEBERNSTEIN GLOBAL BOND FUND |
Portfolio of Investments
| | | | | | | | | | |
| | | | | Principal
Amount
(000) | | | U.S. $ Value | |
| | | | | |
| | | | | | | | | | |
4.50%, 2/01/20(a) | | EUR | | | 5,075 | | | $ | 7,514,341 | |
4.50%, 3/01/24 | | | | | 10,745 | | | | 16,154,259 | |
4.75%, 5/01/17 | | | | | 4,755 | | | | 6,648,303 | |
5.00%, 3/01/22 | | | | | 23,975 | | | | 36,893,919 | |
5.00%, 9/01/40(a) | | | | | 9,125 | | | | 14,300,170 | |
| | | | | | | | | | |
| | | | | | | | | 141,690,930 | |
| | | | | | | | | | |
Japan – 0.5% | | | | | | | | | | |
Japan Government Ten Year Bond
Series 333
0.60%, 3/20/24 | | JPY | | | 1,986,750 | | | | 18,311,486 | |
| | | | | | | | | | |
| | | |
Mexico – 2.7% | | | | | | | | | | |
Mexican Bonos
Series M
7.75%, 11/13/42 | | MXN | | | 200,000 | | | | 16,313,331 | |
Series M 10
8.50%, 12/13/18 | | | | | 586,285 | | | | 49,270,378 | |
Series MI10
9.50%, 12/18/14 | | | | | 395,000 | | | | 29,792,185 | |
| | | | | | | | | | |
| | | | | | | | | 95,375,894 | |
| | | | | | | | | | |
Netherlands – 4.2% | | | | | | | | | | |
Netherlands Government Bond
1.25%, 1/15/19(a) | | EUR | | | 26,850 | | | | 35,496,692 | |
1.75%, 7/15/23(a) | | | | | 17,150 | | | | 23,144,197 | |
2.00%, 7/15/24 | | | | | 13,000 | | | | 17,798,769 | |
2.25%, 7/15/22(a) | | | | | 21,850 | | | | 30,692,773 | |
2.50%, 1/15/33(a) | | | | | 16,725 | | | | 23,816,407 | |
4.00%, 7/15/19(a) | | | | | 6,830 | | | | 10,176,043 | |
7.50%, 1/15/23 | | | | | 5,750 | | | | 11,150,682 | |
| | | | | | | | | | |
| | | | | | | | | 152,275,563 | |
| | | | | | | | | | |
Portugal – 0.5% | | | | | | | | | | |
Portugal Obrigacoes do Tesouro OT
3.85%, 4/15/21(a) | | | | | 6,090 | | | | 8,391,303 | |
4.75%, 6/14/19(a) | | | | | 5,800 | | | | 8,311,288 | |
| | | | | | | | | | |
| | | | | | | | | 16,702,591 | |
| | | | | | | | | | |
South Africa – 1.5% | | | | | | | | | | |
South Africa Government Bond
Series R203 | | | | | | | | | | |
8.25%, 9/15/17 | | ZAR | | | 550,000 | | | | 50,084,598 | |
Series R213 7.00%, 2/28/31 | | | | | 50,000 | | | | 3,762,381 | |
| | | | | | | | | | |
| | | | | | | | | 53,846,979 | |
| | | | | | | | | | |
Spain – 0.9% | | | | | | | | | | |
Spain Government Bond
4.70%, 7/30/41 | | EUR | | | 7,500 | | | | 11,634,585 | |
4.85%, 10/31/20 | | | | | 8 | | | | 12,268 | |
5.15%, 10/31/44(a) | | | | | 8,200 | | | | 13,502,330 | |
5.50%, 7/30/17 | | | | | 6,000 | | | | 8,637,670 | |
| | | | | | | | | | |
| | | | | | | | | 33,786,853 | |
| | | | | | | | | | |
| | | | |
| ALLIANCEBERNSTEIN GLOBAL BOND FUND • | | | 15 | |
Portfolio of Investments
| | | | | | | | | | |
| | | | | Principal
Amount
(000) | | | U.S. $ Value | |
| | | | | |
| | | | | | | | | | |
Sweden – 0.3% | | | | | | | | | | |
Sweden Government Bond
Series 1054
3.50%, 6/01/22 | | SEK | | | 75,000 | | | $ | 12,158,980 | |
| | | | | | | | | | |
| | | |
United Kingdom – 9.2% | | | | | | | | | | |
United Kingdom Gilt
1.75%, 7/22/19-9/07/22(a) | | GBP | | | 58,150 | | | | 93,611,908 | |
2.25%, 9/07/23(a) | | | | | 7,603 | | | | 12,263,852 | |
3.25%, 1/22/44(a) | | | | | 2,500 | | | | 4,198,835 | |
4.00%, 3/07/22(a) | | | | | 59,100 | | | | 108,303,582 | |
4.25%, 12/07/40(a) | | | | | 32,800 | | | | 64,981,475 | |
4.75%, 3/07/20(a) | | | | | 27,000 | | | | 50,330,578 | |
| | | | | | | | | | |
| | | | | | | | | 333,690,230 | |
| | | | | | | | | | |
United States – 14.2% | | | | | | | | | | |
U.S. Treasury Bonds
2.875%, 5/15/43 | | U.S.$ | | | 18,475 | | | | 17,305,884 | |
3.125%, 11/15/41-8/15/44 | | | | | 34,000 | | | | 33,583,116 | |
3.625%, 8/15/43-2/15/44 | | | | | 15,600 | | | | 16,862,445 | |
4.625%, 2/15/40(b) | | | | | 21,200 | | | | 26,851,114 | |
5.375%, 2/15/31(b) | | | | | 103,000 | | | | 136,330,182 | |
U.S. Treasury Notes
1.00%, 5/31/18 | | | | | 1,575 | | | | 1,551,498 | |
1.625%, 8/15/22 | | | | | 16,900 | | | | 16,047,074 | |
2.00%, 11/30/20-11/15/21 | | | | | 96,840 | | | | 95,677,701 | |
2.375%, 12/31/20 | | | | | 64,000 | | | | 65,014,976 | |
2.50%, 5/15/24 | | | | | 8,500 | | | | 8,505,313 | |
2.625%, 11/15/20(c) | | | | | 78,093 | | | | 80,533,406 | |
2.75%, 2/15/24 | | | | | 15,000 | | | | 15,352,740 | |
| | | | | | | | | | |
| | | | | | | | | 513,615,449 | |
| | | | | | | | | | |
Total Governments – Treasuries
(cost $1,655,847,982) | | | | | | | | | 1,665,247,634 | |
| | | | | | | | | | |
| | | | | | | | | | |
CORPORATES – INVESTMENT
GRADES – 21.8% | | | | | | | | | | |
Industrial – 11.1% | | | | | | | | | | |
Basic – 1.1% | | | | | | | | | | |
Alpek SA de CV
5.375%, 8/08/23(a) | | | | | 6,500 | | | | 6,727,500 | |
Barrick North America Finance LLC
4.40%, 5/30/21 | | | | | 4,675 | | | | 4,734,611 | |
BHP Billiton Finance USA Ltd.
3.25%, 11/21/21 | | | | | 15 | | | | 15,309 | |
Braskem Finance Ltd.
6.45%, 2/03/24 | | | | | 6,485 | | | | 6,744,400 | |
Celulosa Arauco y Constitucion SA
4.50%, 8/01/24(a) | | | | | 270 | | | | 263,155 | |
CF Industries, Inc.
7.125%, 5/01/20 | | | | | 125 | | | | 150,797 | |
| | |
| 16 | | • ALLIANCEBERNSTEIN GLOBAL BOND FUND |
Portfolio of Investments
| | | | | | | | | | |
| | | | | Principal
Amount
(000) | | | U.S. $ Value | |
| | | | | |
| | | | | | | | | | |
Dow Chemical Co. (The)
4.375%, 11/15/42 | | U.S.$ | | | 505 | | | $ | 471,739 | |
7.375%, 11/01/29 | | | | | 1,615 | | | | 2,128,131 | |
8.55%, 5/15/19 | | | | | 3,000 | | | | 3,770,502 | |
Freeport-McMoRan, Inc. | | | | | | | | | | |
2.375%, 3/15/18 | | | | | 40 | | | | 40,101 | |
3.10%, 3/15/20 | | | | | 275 | | | | 272,845 | |
Georgia-Pacific LLC
5.40%, 11/01/20(a) | | | | | 333 | | | | 376,285 | |
Gerdau Trade, Inc.
5.75%, 1/30/21(a) | | | | | 168 | | | | 173,250 | |
Glencore Funding LLC
4.125%, 5/30/23(a) | | | | | 90 | | | | 89,074 | |
LyondellBasell Industries NV
5.75%, 4/15/24 | | | | | 4,700 | | | | 5,456,644 | |
Minsur SA
6.25%, 2/07/24(a) | | | | | 2,157 | | | | 2,358,556 | |
Mosaic Co. (The)
4.25%, 11/15/23 | | | | | 205 | | | | 213,364 | |
Plains Exploration & Production Co.
6.50%, 11/15/20 | | | | | 462 | | | | 505,945 | |
Samarco Mineracao SA
5.75%, 10/24/23(a) | | | | | 250 | | | | 256,250 | |
Teck Resources Ltd.
4.50%, 1/15/21 | | | | | 185 | | | | 192,297 | |
5.20%, 3/01/42 | | | | | 95 | | | | 86,803 | |
Vale Overseas Ltd.
4.625%, 9/15/20 | | | | | 325 | | | | 341,058 | |
Vale SA
5.625%, 9/11/42 | | | | | 4,513 | | | | 4,415,605 | |
| | | | | | | | | | |
| | | | | | | | | 39,784,221 | |
| | | | | | | | | | |
Capital Goods – 0.8% | | | | | | | | | | |
Odebrecht Finance Ltd.
4.375%, 4/25/25(a) | | | | | 9,445 | | | | 8,860,034 | |
5.25%, 6/27/29(a) | | | | | 2,996 | | | | 2,898,630 | |
Owens Corning
6.50%, 12/01/16(d) | | | | | 2,943 | | | | 3,242,147 | |
7.00%, 12/01/36(d) | | | | | 85 | | | | 103,018 | |
Republic Services, Inc.
5.25%, 11/15/21 | | | | | 6,898 | | | | 7,815,889 | |
5.50%, 9/15/19 | | | | | 15 | | | | 17,071 | |
Yamana Gold, Inc.
4.95%, 7/15/24(a)(c) | | | | | 6,961 | | | | 6,929,446 | |
| | | | | | | | | | |
| | | | | | | | | 29,866,235 | |
| | | | | | | | | | |
Communications - Media – 1.1% | | | | | | | | | | |
21st Century Fox America, Inc.
3.00%, 9/15/22 | | | | | 1,468 | | | | 1,426,102 | |
5.65%, 8/15/20 | | | | | 480 | | | | 549,183 | |
| | | | |
| ALLIANCEBERNSTEIN GLOBAL BOND FUND • | | | 17 | |
Portfolio of Investments
| | | | | | | | | | |
| | | | | Principal
Amount
(000) | | | U.S. $ Value | |
| | | | | |
| | | | | | | | | | |
BSKYB Finance UK PLC
5.75%, 10/20/17(a) | | GBP | | | 3,977 | | | $ | 7,120,413 | |
CBS Corp.
4.90%, 8/15/44 | | U.S.$ | | | 160 | | | | 158,157 | |
5.75%, 4/15/20 | | | | | 475 | | | | 541,409 | |
Comcast Cable Communications
Holdings, Inc.
9.455%, 11/15/22 | | | | | 619 | | | | 888,981 | |
Comcast Corp.
4.25%, 1/15/33 | | | | | 9,490 | | | | 9,605,199 | |
Cox Communications, Inc.
4.50%, 6/30/43(a) | | | | | 125 | | | | 117,800 | |
6.25%, 6/01/18(a) | | | | | 175 | | | | 199,866 | |
DirecTV Holdings LLC/DirecTV Financing Co., Inc.
3.80%, 3/15/22 | | | | | 1,358 | | | | 1,380,230 | |
4.45%, 4/01/24 | | | | | 4,900 | | | | 5,103,130 | |
4.60%, 2/15/21 | | | | | 45 | | | | 48,904 | |
5.15%, 3/15/42 | | | | | 125 | | | | 126,393 | |
5.20%, 3/15/20 | | | | | 2,925 | | | | 3,275,816 | |
Discovery Communications LLC
4.875%, 4/01/43 | | | | | 130 | | | | 128,633 | |
Globo Comunicacao e Participacoes SA
5.307%, 5/11/22(a)(e) | | | | | 1,661 | | | | 1,753,186 | |
Moody’s Corp.
2.75%, 7/15/19 | | | | | 173 | | | | 173,910 | |
Omnicom Group, Inc.
3.625%, 5/01/22 | | | | | 2,729 | | | | 2,769,152 | |
Reed Elsevier Capital, Inc.
8.625%, 1/15/19 | | | | | 30 | | | | 37,393 | |
Time Warner Cable, Inc.
4.50%, 9/15/42 | | | | | 100 | | | | 98,679 | |
5.00%, 2/01/20 | | | | | 410 | | | | 455,611 | |
6.55%, 5/01/37 | | | | | 80 | | | | 100,920 | |
Time Warner, Inc.
7.625%, 4/15/31 | | | | | 1,821 | | | | 2,457,933 | |
Viacom, Inc.
3.875%, 4/01/24 | | | | | 2,756 | | | | 2,744,557 | |
5.25%, 4/01/44 | | | | | 120 | | | | 124,021 | |
5.625%, 9/15/19 | | | | | 10 | | | | 11,379 | |
| | | | | | | | | | |
| | | | | | | | | 41,396,957 | |
| | | | | | | | | | |
Communications - Telecommunications – 1.7% | | | | | | | | | | |
America Movil SAB de CV
3.125%, 7/16/22 | | | | | 375 | | | | 364,155 | |
5.00%, 3/30/20 | | | | | 700 | | | | 766,017 | |
American Tower Corp.
5.05%, 9/01/20 | | | | | 5,800 | | | | 6,289,688 | |
AT&T, Inc.
4.45%, 5/15/21 | | | | | 4,749 | | | | 5,142,203 | |
| | |
| 18 | | • ALLIANCEBERNSTEIN GLOBAL BOND FUND |
Portfolio of Investments
| | | | | | | | | | |
| | | | | Principal
Amount
(000) | | | U.S. $ Value | |
| | | | | |
| | | | | | | | | | |
5.35%, 9/01/40 | | U.S.$ | | | 305 | | | $ | 323,421 | |
5.80%, 2/15/19 | | | | | 2,937 | | | | 3,365,623 | |
6.45%, 6/15/34 | | | | | 120 | | | | 145,483 | |
Bell Canada
5.00%, 2/15/17(a) | | CAD | | | 5,900 | | | | 5,626,323 | |
British Telecommunications PLC
5.95%, 1/15/18 | | U.S.$ | | | 375 | | | | 423,252 | |
9.625%, 12/15/30 | | | | | 3,392 | | | | 5,326,373 | |
Deutsche Telekom International Finance BV
4.875%, 3/06/42(a) | | | | | 6,245 | | | | 6,457,199 | |
ENTEL Chile SA
4.875%, 10/30/24(a) | | | | | 4,969 | | | | 5,092,768 | |
Rogers Communications, Inc.
4.00%, 6/06/22 | | CAD | | | 5,000 | | | | 4,633,868 | |
4.10%, 10/01/23 | | U.S.$ | | | 245 | | | | 254,001 | |
Telefonica Emisiones SAU
3.192%, 4/27/18 | | | | | 285 | | | | 293,940 | |
5.462%, 2/16/21 | | | | | 485 | | | | 540,123 | |
7.045%, 6/20/36 | | | | | 80 | | | | 101,338 | |
Verizon Communications, Inc.
3.85%, 11/01/42 | | | | | 255 | | | | 222,678 | |
4.50%, 9/15/20 | | | | | 560 | | | | 605,838 | |
5.15%, 9/15/23 | | | | | 6,372 | | | | 7,056,155 | |
6.25%, 4/01/37 | | | | | 235 | | | | 284,349 | |
6.55%, 9/15/43 | | | | | 6,856 | | | | 8,565,831 | |
7.35%, 4/01/39 | | | | | 25 | | | | 33,822 | |
Vodafone Group PLC
6.15%, 2/27/37 | | | | | 30 | | | | 34,442 | |
| | | | | | | | | | |
| | | | | | | | | 61,948,890 | |
| | | | | | | | | | |
Consumer Cyclical - Automotive – 0.8% | | | | | | | | |
BMW US Capital LLC
5.00%, 5/28/15 | | EUR | | | 6,000 | | | | 7,813,273 | |
Ford Motor Credit Co. LLC
5.00%, 5/15/18 | | U.S.$ | | | 5,135 | | | | 5,608,170 | |
5.875%, 8/02/21 | | | | | 3,689 | | | | 4,241,701 | |
Harley-Davidson Funding Corp.
5.75%, 12/15/14(a) | | | | | 4,647 | | | | 4,696,239 | |
6.80%, 6/15/18(a) | | | | | 4,000 | | | | 4,670,600 | |
| | | | | | | | | | |
| | | | | | | | | 27,029,983 | |
| | | | | | | | | | |
Consumer Cyclical - Other – 0.1% | | | | | | | | | | |
Wyndham Worldwide Corp.
2.50%, 3/01/18 | | | | | 40 | | | | 40,122 | |
4.25%, 3/01/22 | | | | | 3,300 | | | | 3,341,158 | |
| | | | | | | | | | |
| | | | | | | | | 3,381,280 | |
| | | | | | | | | | |
Consumer Cyclical - Retailers – 0.2% | | | | | | | | |
Gap, Inc. (The)
5.95%, 4/12/21 | | | | | 255 | | | | 290,002 | |
| | | | |
| ALLIANCEBERNSTEIN GLOBAL BOND FUND • | | | 19 | |
Portfolio of Investments
| | | | | | | | | | |
| | | | | Principal
Amount
(000) | | | U.S. $ Value | |
| | | | | |
| | | | | | | | | | |
Kohl’s Corp.
6.25%, 12/15/17 | | U.S.$ | | | 350 | | | $ | 396,906 | |
Macy’s Retail Holdings, Inc.
3.875%, 1/15/22 | | | | | 4,148 | | | | 4,320,996 | |
Wal-Mart Stores, Inc.
5.00%, 10/25/40 | | | | | 450 | | | | 508,682 | |
| | | | | | | | | | |
| | | | | | | | | 5,516,586 | |
| | | | | | | | | | |
Consumer Non-Cyclical – 1.1% | | | | | | | | | | |
AbbVie, Inc.
1.75%, 11/06/17 | | | | | 10 | | | | 9,966 | |
2.90%, 11/06/22 | | | | | 300 | | | | 286,837 | |
Actavis Funding SCS
3.85%, 6/15/24(a) | | | | | 2,217 | | | | 2,149,100 | |
Ahold Finance USA LLC
6.875%, 5/01/29 | | | | | 5,735 | | | | 7,237,673 | |
Alicorp SAA
3.875%, 3/20/23(a) | | | | | 2,260 | | | | 2,189,468 | |
Altria Group, Inc.
2.85%, 8/09/22 | | | | | 390 | | | | 373,556 | |
9.25%, 8/06/19 | | | | | 400 | | | | 520,723 | |
Amgen, Inc.
5.15%, 11/15/41 | | | | | 235 | | | | 248,035 | |
Anheuser-Busch InBev Finance, Inc.
4.00%, 1/17/43 | | | | | 250 | | | | 229,941 | |
Anheuser-Busch InBev Worldwide, Inc.
2.50%, 7/15/22 | | | | | 500 | | | | 472,471 | |
6.875%, 11/15/19 | | | | | 260 | | | | 311,983 | |
AstraZeneca PLC
6.45%, 9/15/37 | | | | | 100 | | | | 129,701 | |
BRF SA
4.75%, 5/22/24(a) | | | | | 250 | | | | 246,250 | |
Bristol-Myers Squibb Co.
5.875%, 11/15/36 | | | | | 125 | | | | 154,877 | |
Bunge Ltd. Finance Corp.
8.50%, 6/15/19 | | | | | 9,216 | | | | 11,445,194 | |
Forest Laboratories, Inc.
4.375%, 2/01/19(a) | | | | | 230 | | | | 242,089 | |
Grupo Bimbo SAB de CV
3.875%, 6/27/24(a) | | | | | 275 | | | | 271,411 | |
Kroger Co. (The)
3.85%, 8/01/23 | | | | | 360 | | | | 366,915 | |
Laboratory Corp. of America Holdings
2.20%, 8/23/17 | | | | | 2,109 | | | | 2,135,379 | |
Reynolds American, Inc.
3.25%, 11/01/22 | | | | | 3,874 | | | | 3,737,961 | |
Thermo Fisher Scientific, Inc.
4.15%, 2/01/24 | | | | | 220 | | | | 227,779 | |
| | |
| 20 | | • ALLIANCEBERNSTEIN GLOBAL BOND FUND |
Portfolio of Investments
| | | | | | | | | | |
| | | | | Principal
Amount (000) | | | U.S. $ Value | |
| | | | | |
| | | | | | | | | | |
Tyson Foods, Inc.
2.65%, 8/15/19 | | U.S.$ | | | 1,620 | | | $ | 1,623,031 | |
3.95%, 8/15/24 | | | | | 5,381 | | | | 5,390,417 | |
4.50%, 6/15/22 | | | | | 16 | | | | 16,957 | |
| | | | | | | | | | |
| | | | | | | | | 40,017,714 | |
| | | | | | | | | | |
Energy – 2.5% | | | | | | | | | | |
Anadarko Petroleum Corp.
5.95%, 9/15/16 | | | | | 1,913 | | | | 2,086,718 | |
6.375%, 9/15/17 | | | | | 475 | | | | 538,421 | |
Apache Corp.
4.25%, 1/15/44 | | | | | 510 | | | | 472,585 | |
6.90%, 9/15/18 | | | | | 2,950 | | | | 3,469,566 | |
CenterPoint Energy Resources Corp.
4.50%, 1/15/21 | | | | | 1,460 | | | | 1,596,511 | |
ConocoPhillips
6.50%, 2/01/39 | | | | | 150 | | | | 196,365 | |
Diamond Offshore Drilling, Inc.
4.875%, 11/01/43 | | | | | 85 | | | | 78,791 | |
Enable Midstream Partners LP
3.90%, 5/15/24(a) | | | | | 171 | | | | 170,076 | |
Encana Corp.
3.90%, 11/15/21 | | | | | 60 | | | | 61,927 | |
Energy Transfer Partners LP
4.15%, 10/01/20 | | | | | 3,225 | | | | 3,348,905 | |
4.90%, 2/01/24 | | | | | 3,120 | | | | 3,261,149 | |
6.125%, 2/15/17 | | | | | 30 | | | | 33,118 | |
Enterprise Products Operating LLC
4.45%, 2/15/43 | | | | | 125 | | | | 120,616 | |
5.10%, 2/15/45 | | | | | 7,290 | | | | 7,689,543 | |
5.20%, 9/01/20 | | | | | 630 | | | | 707,417 | |
Hess Corp.
5.60%, 2/15/41 | | | | | 215 | | | | 242,156 | |
7.875%, 10/01/29 | | | | | 90 | | | | 122,176 | |
Kinder Morgan Energy Partners LP
2.65%, 2/01/19 | | | | | 735 | | | | 732,812 | |
3.50%, 9/01/23 | | | | | 2,783 | | | | 2,642,779 | |
3.95%, 9/01/22 | | | | | 1,116 | | | | 1,107,897 | |
4.15%, 3/01/22 | | | | | 1,959 | | | | 1,979,158 | |
6.85%, 2/15/20 | | | | | 2,947 | | | | 3,456,295 | |
Marathon Petroleum Corp.
5.125%, 3/01/21 | | | | | 15 | | | | 16,709 | |
Nabors Industries, Inc.
5.10%, 9/15/23 | | | | | 5,000 | | | | 5,417,015 | |
Nisource Finance Corp.
6.80%, 1/15/19 | | | | | 7,815 | | | | 9,190,932 | |
Noble Energy, Inc.
8.25%, 3/01/19 | | | | | 6,280 | | | | 7,764,893 | |
Noble Holding International Ltd.
4.90%, 8/01/20 | | | | | 520 | | | | 550,240 | |
| | | | |
| ALLIANCEBERNSTEIN GLOBAL BOND FUND • | | | 21 | |
Portfolio of Investments
| | | | | | | | | | |
| | | | | Principal
Amount
(000) | | | U.S. $ Value | |
| | | | | |
| | | | | | | | | | |
Reliance Holding USA, Inc.
5.40%, 2/14/22(a)(c) | | U.S.$ | | | 4,758 | | | $ | 5,201,065 | |
Southwestern Energy Co.
4.10%, 3/15/22 | | | | | 2,200 | | | | 2,257,127 | |
Spectra Energy Partners LP
4.60%, 6/15/21 | | | | | 330 | | | | 358,318 | |
Suncor Energy, Inc.
6.50%, 6/15/38 | | | | | 385 | | | | 490,251 | |
Sunoco Logistics Partners Operations LP
5.30%, 4/01/44 | | | | | 2,060 | | | | 2,101,824 | |
Talisman Energy, Inc.
3.75%, 2/01/21 | | | | | 115 | | | | 116,238 | |
7.75%, 6/01/19 | | | | | 165 | | | | 200,144 | |
TransCanada PipeLines Ltd.
6.35%, 5/15/67 | | | | | 15 | | | | 15,488 | |
Transocean, Inc.
6.375%, 12/15/21 | | | | | 5,500 | | | | 5,850,301 | |
6.50%, 11/15/20 | | | | | 4,300 | | | | 4,569,055 | |
Valero Energy Corp.
6.125%, 2/01/20 | | | | | 20 | | | | 23,194 | |
6.625%, 6/15/37 | | | | | 200 | | | | 238,774 | |
Weatherford International Ltd./Bermuda
5.125%, 9/15/20 | | | | | 190 | | | | 207,219 | |
9.625%, 3/01/19 | | | | | 255 | | | | 327,373 | |
Williams Partners LP
3.90%, 1/15/25 | | | | | 3,963 | | | | 3,933,614 | |
4.00%, 11/15/21 | | | | | 2,603 | | | | 2,692,949 | |
4.50%, 11/15/23 | | | | | 4,200 | | | | 4,389,067 | |
5.25%, 3/15/20 | | | | | 1,000 | | | | 1,110,432 | |
| | | | | | | | | | |
| | | | | | | | | 91,137,203 | |
| | | | | | | | | | |
Other Industrial – 0.0% | | | | | | | | | | |
Fresnillo PLC
5.50%, 11/13/23(a) | | | | | 250 | | | | 259,925 | |
| | | | | | | | | | |
| | | |
Technology – 0.7% | | | | | | | | | | |
Agilent Technologies, Inc.
5.00%, 7/15/20 | | | | | 1,040 | | | | 1,131,136 | |
Baidu, Inc.
2.75%, 6/09/19 | | | | | 6,048 | | | | 6,005,470 | |
3.25%, 8/06/18 | | | | | 524 | | | | 539,505 | |
3.50%, 11/28/22 | | | | | 260 | | | | 252,855 | |
Fidelity National Information Services, Inc.
3.875%, 6/05/24 | | | | | 250 | | | | 249,734 | |
Hewlett-Packard Co.
4.65%, 12/09/21 | | | | | 6,360 | | | | 6,888,866 | |
Intel Corp.
4.80%, 10/01/41 | | | | | 20 | | | | 20,855 | |
Microsoft Corp.
3.50%, 11/15/42 | | | | | 140 | | | | 125,531 | |
| | |
| 22 | | • ALLIANCEBERNSTEIN GLOBAL BOND FUND |
Portfolio of Investments
| | | | | | | | | | |
| | | | | Principal
Amount
(000) | | | U.S. $ Value | |
| | | | | |
| | | | | | | | | | |
Motorola Solutions, Inc.
3.50%, 9/01/21 | | U.S.$ | | | 260 | | | $ | 256,332 | |
Oracle Corp.
5.375%, 7/15/40 | | | | | 150 | | | | 170,042 | |
Seagate HDD Cayman
4.75%, 1/01/25(a) | | | | | 2,761 | | | | 2,747,195 | |
Telefonaktiebolaget LM Ericsson
4.125%, 5/15/22 | | | | | 388 | | | | 404,929 | |
Tencent Holdings Ltd.
3.375%, 5/02/19(a) | | | | | 5,636 | | | | 5,694,061 | |
Total System Services, Inc.
2.375%, 6/01/18 | | | | | 20 | | | | 19,859 | |
Tyco Electronics Group SA
3.45%, 8/01/24 | | | | | 255 | | | | 255,461 | |
Xerox Corp.
2.80%, 5/15/20 | | | | | 250 | | | | 246,512 | |
| | | | | | | | | | |
| | | | | | | | | 25,008,343 | |
| | | | | | | | | | |
Transportation - Airlines – 0.3% | | | | | | | | | | |
Southwest Airlines Co.
5.25%, 10/01/14 | | | | | 3,015 | | | | 3,015,000 | |
Southwest Airlines Co. Pass-Through Trust
Series 07-1
6.15%, 8/01/22 | | | | | 6,137 | | | | 7,041,682 | |
| | | | | | | | | | |
| | | | | | | | | 10,056,682 | |
| | | | | | | | | | |
Transportation - Railroads – 0.4% | | | | | | | | | | |
Burlington Northern Santa Fe LLC
4.95%, 9/15/41 | | | | | 6,713 | | | | 7,216,173 | |
Canadian Pacific Railway Co.
6.50%, 5/15/18 | | | | | 1,276 | | | | 1,469,172 | |
CSX Corp.
4.40%, 3/01/43 | | | | | 100 | | | | 99,129 | |
6.25%, 3/15/18 | | | | | 5,000 | | | | 5,737,615 | |
| | | | | | | | | | |
| | | | | | | | | 14,522,089 | |
| | | | | | | | | | |
Transportation - Services – 0.3% | | | | | | | | | | |
Asciano Finance Ltd.
3.125%, 9/23/15(a) | | | | | 2,722 | | | | 2,772,172 | |
4.625%, 9/23/20(a) | | | | | 1,501 | | | | 1,589,509 | |
5.00%, 4/07/18(a) | | | | | 2,676 | | | | 2,882,908 | |
Ryder System, Inc.
5.85%, 11/01/16 | | | | | 4,332 | | | | 4,734,742 | |
7.20%, 9/01/15 | | | | | 20 | | | | 21,195 | |
| | | | | | | | | | |
| | | | | | | | | 12,000,526 | |
| | | | | | | | | | |
| | | | | | | | | 401,926,634 | |
| | | | | | | | | | |
Financial Institutions – 9.1% | | | | | | | | | | |
Banking – 6.1% | | | | | | | | | | |
ABN AMRO Bank NV
2.50%, 10/30/18(a) | | | | | 7,200 | | | | 7,266,977 | |
| | | | |
| ALLIANCEBERNSTEIN GLOBAL BOND FUND • | | | 23 | |
Portfolio of Investments
| | | | | | | | | | |
| | | | | Principal
Amount
(000) | | | U.S. $ Value | |
| | | | | |
| | | | | | | | | | |
Akbank TAS
3.875%, 10/24/17(a) | | U.S.$ | | | 8,485 | | | $ | 8,521,655 | |
Bank of America Corp.
3.30%, 1/11/23 | | | | | 4,600 | | | | 4,486,477 | |
4.00%, 4/01/24 | | | | | 5,040 | | | | 5,092,522 | |
4.20%, 8/26/24 | | | | | 3,784 | | | | 3,751,280 | |
4.875%, 4/01/44 | | | | | 485 | | | | 502,882 | |
5.49%, 3/15/19 | | | | | 300 | | | | 331,187 | |
5.875%, 2/07/42 | | | | | 606 | | | | 726,116 | |
Series L
5.65%, 5/01/18 | | | | | 125 | | | | 139,037 | |
Barclays Bank PLC
3.75%, 5/15/24 | | | | | 300 | | | | 298,128 | |
5.14%, 10/14/20 | | | | | 461 | | | | 497,283 | |
6.05%, 12/04/17(a) | | | | | 735 | | | | 817,000 | |
6.625%, 3/30/22(a) | | EUR | | | 3,145 | | | | 4,976,790 | |
BBVA Banco Continental SA
5.00%, 8/26/22(a)(c) | | U.S.$ | | | 4,224 | | | | 4,414,923 | |
BNP Paribas SA
5.00%, 1/15/21 | | | | | 305 | | | | 338,801 | |
BPCE SA
5.70%, 10/22/23(a) | | | | | 6,236 | | | | 6,633,296 | |
Capital One Bank USA NA
3.375%, 2/15/23 | | | | | 470 | | | | 460,481 | |
Capital One Financial Corp.
4.75%, 7/15/21 | | | | | 25 | | | | 27,174 | |
Citigroup, Inc.
3.875%, 10/25/23 | | | | | 6,265 | | | | 6,361,782 | |
4.50%, 1/14/22 | | | | | 125 | | | | 134,023 | |
5.50%, 2/15/17 | | | | | 740 | | | | 802,177 | |
5.875%, 1/30/42 | | | | | 3,947 | | | | 4,757,007 | |
6.675%, 9/13/43 | | | | | 160 | | | | 196,102 | |
Compass Bank
2.75%, 9/29/19 | | | | | 3,648 | | | | 3,638,266 | |
5.50%, 4/01/20 | | | | | 230 | | | | 250,163 | |
Cooperatieve Centrale Raiffeisen-Boerenleenbank BA/Netherlands
3.95%, 11/09/22 | | | | | 4,212 | | | | 4,229,930 | |
Credit Suisse AG
6.50%, 8/08/23(a) | | | | | 5,199 | | | | 5,654,622 | |
Deutsche Bank AG
3.70%, 5/30/24 | | | | | 150 | | | | 148,698 | |
DNB Bank ASA
4.75%, 3/08/22(a) | | EUR | | | 8,391 | | | | 11,457,071 | |
Fifth Third Bancorp
3.50%, 3/15/22 | | U.S.$ | | | 15 | | | | 15,286 | |
Goldman Sachs Group, Inc. (The)
3.85%, 7/08/24 | | | | | 1,500 | | | | 1,491,145 | |
5.75%, 1/24/22 | | | | | 8,100 | | | | 9,211,117 | |
| | |
| 24 | | • ALLIANCEBERNSTEIN GLOBAL BOND FUND |
Portfolio of Investments
| | | | | | | | | | |
| | | | | Principal
Amount
(000) | | | U.S. $ Value | |
| | | | | |
| | | | | | | | | | |
6.25%, 2/01/41 | | U.S.$ | | | 100 | | | $ | 121,122 | |
Series D
6.00%, 6/15/20 | | | | | 135 | | | | 155,092 | |
HSBC Holdings PLC
4.00%, 3/30/22 | | | | | 7,055 | | | | 7,424,569 | |
5.10%, 4/05/21 | | | | | 65 | | | | 73,145 | |
6.50%, 9/15/37 | | | | | 1,982 | | | | 2,438,300 | |
HSBC USA, Inc.
5.00%, 9/27/20 | | | | | 490 | | | | 535,507 | |
ING Bank NV
3.75%, 3/07/17(a) | | | | | 8,070 | | | | 8,490,600 | |
5.80%, 9/25/23(a) | | | | | 200 | | | | 220,303 | |
Intesa Sanpaolo SpA
3.875%, 1/15/19 | | | | | 330 | | | | 342,350 | |
JPMorgan Chase & Co.
4.40%, 7/22/20 | | | | | 450 | | | | 484,851 | |
4.95%, 3/25/20 | | | | | 395 | | | | 436,414 | |
Series S
6.75%, 2/01/24(f) | | | | | 250 | | | | 262,500 | |
Series X
6.10%, 10/01/24(f) | | | | | 200 | | | | 197,750 | |
JPMorgan Chase Bank NA
0.767%, 5/31/17(d) | | EUR | | | 950 | | | | 1,196,898 | |
6.00%, 7/05/17 | | U.S.$ | | | 595 | | | | 665,268 | |
Lloyds Bank PLC
6.50%, 9/14/20(a) | | | | | 425 | | | | 494,134 | |
Macquarie Bank Ltd.
5.00%, 2/22/17(a) | | | | | 607 | | | | 654,132 | |
Macquarie Group Ltd.
4.875%, 8/10/17(a) | | | | | 2,595 | | | | 2,798,186 | |
Manufacturers & Traders Trust Co.
6.625%, 12/04/17 | | | | | 9,586 | | | | 10,971,263 | |
Mizuho Financial Group Cayman 3 Ltd.
4.60%, 3/27/24(a) | | | | | 7,391 | | | | 7,686,100 | |
Morgan Stanley
5.625%, 9/23/19 | | | | | 350 | | | | 393,986 | |
Series F
3.875%, 4/29/24 | | | | | 8,566 | | | | 8,557,117 | |
Series G
5.45%, 1/09/17 | | | | | 690 | | | | 749,469 | |
5.50%, 7/24/20-7/28/21 | | | | | 405 | | | | 455,783 | |
6.625%, 4/01/18 | | | | | 535 | | | | 612,695 | |
Murray Street Investment Trust I
4.647%, 3/09/17 | | | | | 765 | | | | 818,825 | |
National City Bank/Cleveland OH
5.80%, 6/07/17 | | | | | 4,925 | | | | 5,469,927 | |
Nordea Bank AB
4.875%, 5/13/21(a) | | | | | 8,365 | | | | 8,982,253 | |
6.125%, 9/23/24(a)(f) | | | | | 1,157 | | | | 1,133,860 | |
| | | | |
| ALLIANCEBERNSTEIN GLOBAL BOND FUND • | | | 25 | |
Portfolio of Investments
| | | | | | | | | | |
| | | | | Principal
Amount
(000) | | | U.S. $ Value | |
| | | | | |
| | | | | | | | | | |
People’s United Bank
4.00%, 7/15/24 | | U.S.$ | | | 300 | | | $ | 297,872 | |
PNC Funding Corp.
5.125%, 2/08/20 | | | | | 50 | | | | 56,375 | |
Rabobank Capital Funding Trust III
5.254%, 10/21/16(a)(f) | | | | | 4,630 | | | | 4,861,500 | |
Royal Bank of Scotland PLC (The)
5.625%, 8/24/20 | | | | | 40 | | | | 45,536 | |
Societe Generale SA
5.75%, 4/20/16(a) | | | | | 1,856 | | | | 1,972,215 | |
Standard Chartered Bank Hong Kong Ltd.
Series E
5.875%, 6/24/20(a) | | | | | 150 | | | | 166,306 | |
Standard Chartered PLC
4.00%, 7/12/22(a) | | | | | 8,701 | | | | 8,932,360 | |
State Street Corp.
3.70%, 11/20/23 | | | | | 3,000 | | | | 3,101,565 | |
SunTrust Bank/Atlanta GA
7.25%, 3/15/18 | | | | | 250 | | | | 288,853 | |
Svenska Handelsbanken AB
2.875%, 4/04/17 | | | | | 8,000 | | | | 8,316,568 | |
Turkiye Garanti Bankasi AS
4.75%, 10/17/19(a)(c) | | | | | 2,067 | | | | 2,079,883 | |
Turkiye Halk Bankasi AS
3.875%, 2/05/20(a) | | | | | 6,219 | | | | 5,873,309 | |
UBS AG/Stamford CT
7.50%, 7/15/25 | | | | | 210 | | | | 263,794 | |
7.625%, 8/17/22 | | | | | 3,671 | | | | 4,264,806 | |
US Bancorp/MN
3.60%, 9/11/24 | | | | | 255 | | | | 251,997 | |
Wells Fargo & Co.
4.10%, 6/03/26 | | | | | 500 | | | | 498,242 | |
Series M
3.45%, 2/13/23 | | | | | 205 | | | | 201,441 | |
Wells Fargo Bank NA
6.18%, 2/15/36 | | | | | 5,363 | | | | 6,629,939 | |
Zions Bancorporation
4.50%, 6/13/23 | | | | | 26 | | | | 27,222 | |
| | | | | | | | | | |
| | | | | | | | | 218,581,580 | |
| | | | | | | | | | |
Brokerage – 0.2% | | | | | | | | | | |
Nomura Holdings, Inc.
2.00%, 9/13/16 | | | | | 8,480 | | | | 8,563,740 | |
| | | | | | | | | | |
| | | |
Finance – 0.7% | | | | | | | | | | |
Aviation Capital Group Corp.
7.125%, 10/15/20(a) | | | | | 5,499 | | | | 6,373,187 | |
| | |
| 26 | | • ALLIANCEBERNSTEIN GLOBAL BOND FUND |
Portfolio of Investments
| | | | | | | | | | |
| | | | | Principal
Amount
(000) | | | U.S. $ Value | |
| | | | | |
| | | | | | | | | | |
General Electric Capital Corp.
2.30%, 4/27/17 | | U.S.$ | | | 12,650 | | | $ | 12,997,824 | |
4.65%, 10/17/21 | | | | | 485 | | | | 534,212 | |
5.875%, 1/14/38 | | | | | 240 | | | | 289,480 | |
Series G
5.625%, 5/01/18 | | | | | 1,360 | | | | 1,537,533 | |
6.875%, 1/10/39 | | | | | 120 | | | | 161,506 | |
HSBC Finance Capital Trust IX
5.911%, 11/30/35 | | | | | 200 | | | | 205,750 | |
HSBC Finance Corp.
6.676%, 1/15/21 | | | | | 1,894 | | | | 2,220,297 | |
| | | | | | | | | | |
| | | | | | | | | 24,319,789 | |
| | | | | | | | | | |
Insurance – 1.5% | | | | | | | | | | |
Aflac, Inc.
8.50%, 5/15/19 | | | | | 3,400 | | | | 4,303,162 | |
Allied World Assurance Co. Holdings Ltd.
7.50%, 8/01/16 | | | | | 5 | | | | 5,543 | |
American International Group, Inc.
3.375%, 8/15/20 | | | | | 6,800 | | | | 7,003,381 | |
6.82%, 11/15/37 | | | | | 418 | | | | 556,136 | |
Aquarius & Investments PLC for Swiss Reinsurance Co., Ltd.
6.375%, 9/01/24(a) | | | | | 455 | | | | 480,458 | |
Coventry Health Care, Inc.
5.95%, 3/15/17 | | | | | 2,205 | | | | 2,441,334 | |
6.125%, 1/15/15 | | | | | 835 | | | | 847,760 | |
Five Corners Funding Trust
4.419%, 11/15/23(a) | | | | | 2,400 | | | | 2,512,010 | |
Guardian Life Insurance Co. of America (The) 7.375%, 9/30/39(a) | | | | | 109 | | | | 149,124 | |
Hartford Financial Services Group, Inc. (The) 5.125%, 4/15/22 | | | | | 2,940 | | | | 3,279,114 | |
6.30%, 3/15/18 | | | | | 2,296 | | | | 2,582,809 | |
Humana, Inc.
6.45%, 6/01/16 | | | | | 442 | | | | 481,140 | |
7.20%, 6/15/18 | | | | | 15 | | | | 17,687 | |
Lincoln National Corp.
8.75%, 7/01/19 | | | | | 2,963 | | | | 3,774,432 | |
Markel Corp.
7.125%, 9/30/19 | | | | | 1,430 | | | | 1,703,186 | |
Massachusetts Mutual Life Insurance Co.
8.875%, 6/01/39(a) | | | | | 5 | | | | 7,724 | |
MetLife Capital Trust IV
7.875%, 12/15/37(a) | | | | | 107 | | | | 136,960 | |
MetLife, Inc.
3.048%, 12/15/22 | | | | | 325 | | | | 320,109 | |
4.75%, 2/08/21 | | | | | 2,840 | | | | 3,137,678 | |
| | | | |
| ALLIANCEBERNSTEIN GLOBAL BOND FUND • | | | 27 | |
Portfolio of Investments
| | | | | | | | | | |
| | | | | Principal
Amount
(000) | | | U.S. $ Value | |
| | | | | |
| | | | | | | | | | |
Series D
4.368%, 9/15/23 | | U.S.$ | | | 485 | | | $ | 518,467 | |
Muenchener Rueckversicherungs AG
6.25%, 5/26/42(a) | | EUR | | | 4,300 | | | | 6,643,416 | |
Nationwide Mutual Insurance Co.
9.375%, 8/15/39(a) | | U.S.$ | | | 765 | | | | 1,177,750 | |
Progressive Corp. (The)
6.70%, 6/15/37 | | | | | 155 | | | | 169,822 | |
Prudential Financial, Inc.
4.50%, 11/15/20 | | | | | 555 | | | | 601,259 | |
5.625%, 6/15/43 | | | | | 5,995 | | | | 6,247,989 | |
Torchmark Corp.
9.25%, 6/15/19 | | | | | 3,400 | | | | 4,364,648 | |
WellPoint, Inc.
3.30%, 1/15/23 | | | | | 15 | | | | 14,830 | |
ZFS Finance USA Trust V
6.50%, 5/09/37(a) | | | | | 500 | | | | 537,500 | |
| | | | | | | | | | |
| | | | | | | | | 54,015,428 | |
| | | | | | | | | | |
Other Finance – 0.1% | | | | | | | | | | |
ORIX Corp.
4.71%, 4/27/15 | | | | | 2,824 | | | | 2,895,227 | |
| | | | | | | | | | |
| | | |
REITS – 0.5% | | | | | | | | | | |
Alexandria Real Estate Equities, Inc.
2.75%, 1/15/20 | | | | | 213 | | | | 211,050 | |
Duke Realty LP
6.75%, 3/15/20 | | | | | 2,135 | | | | 2,519,691 | |
EPR Properties
7.75%, 7/15/20 | | | | | 3,569 | | | | 4,300,584 | |
Essex Portfolio LP
3.375%, 1/15/23 | | | | | 260 | | | | 256,056 | |
HCP, Inc.
5.375%, 2/01/21 | | | | | 8,454 | | | | 9,433,700 | |
6.70%, 1/30/18 | | | | | 35 | | | | 40,263 | |
Health Care REIT, Inc.
2.25%, 3/15/18 | | | | | 250 | | | | 252,226 | |
5.25%, 1/15/22 | | | | | 35 | | | | 38,722 | |
Healthcare Realty Trust, Inc.
6.50%, 1/17/17 | | | | | 20 | | | | 22,118 | |
Healthcare Trust of America Holdings LP
3.375%, 7/15/21 | | | | | 1,838 | | | | 1,828,751 | |
Mid-America Apartments LP
3.75%, 6/15/24 | | | | | 250 | | | | 246,432 | |
Ventas Realty LP/Ventas Capital Corp.
2.70%, 4/01/20 | | | | | 150 | | | | 147,572 | |
WEA Finance LLC/ Westfield UK & Europe Finance PLC
3.75%, 9/17/24(a) | | | | | 200 | | | | 199,457 | |
| | | | | | | | | | |
| | | | | | | | | 19,496,622 | |
| | | | | | | | | | |
| | | | | | | | | 327,872,386 | |
| | | | | | | | | | |
| | |
| 28 | | • ALLIANCEBERNSTEIN GLOBAL BOND FUND |
Portfolio of Investments
| | | | | | | | | | |
| | | | | Principal
Amount
(000) | | | U.S. $ Value | |
| | | | | |
| | | | | | | | | | |
Utility – 0.8% | | | | | | | | | | |
Electric – 0.5% | | | | | | | | | | |
Berkshire Hathaway Energy Co.
6.125%, 4/01/36 | | U.S.$ | | | 130 | | | $ | 160,881 | |
CenterPoint Energy, Inc.
6.50%, 5/01/18 | | | | | 1,665 | | | | 1,919,795 | |
CMS Energy Corp.
5.05%, 3/15/22 | | | | | 2,595 | | | | 2,899,640 | |
Constellation Energy Group, Inc.
5.15%, 12/01/20 | | | | | 1,224 | | | | 1,355,163 | |
Duke Energy Florida, Inc.
6.40%, 6/15/38 | | | | | 150 | | | | 199,927 | |
Duke Energy Indiana, Inc.
3.75%, 7/15/20 | | | | | 495 | | | | 526,018 | |
Empresa Nacional de Electricidad SA/Chile
4.25%, 4/15/24 | | | | | 100 | | | | 100,091 | |
Monongahela Power Co.
4.10%, 4/15/24(a) | | | | | 3,481 | | | | 3,675,696 | |
Oncor Electric Delivery Co. LLC
7.00%, 5/01/32 | | | | | 175 | | | | 239,352 | |
Pacific Gas & Electric Co.
4.50%, 12/15/41 | | | | | 510 | | | | 517,675 | |
TECO Finance, Inc.
4.00%, 3/15/16 | | | | | 315 | | | | 329,133 | |
5.15%, 3/15/20 | | | | | 2,970 | | | | 3,308,093 | |
Union Electric Co.
6.70%, 2/01/19 | | | | | 2,019 | | | | 2,396,222 | |
Wisconsin Electric Power Co.
4.25%, 12/15/19 | | | | | 35 | | | | 38,134 | |
| | | | | | | | | | |
| | | | | | | | | 17,665,820 | |
| | | | | | | | | | |
Natural Gas – 0.3% | | | | | | | | | | |
Sempra Energy
6.50%, 6/01/16 | | | | | 5,700 | | | | 6,219,378 | |
Talent Yield Investments Ltd.
4.50%, 4/25/22(a)(c) | | | | | 6,500 | | | | 6,707,350 | |
| | | | | | | | | | |
| | | | | | | | | 12,926,728 | |
| | | | | | | | | | |
| | | | | | | | | 30,592,548 | |
| | | | | | | | | | |
Non Corporate Sectors – 0.7% | | | | | | | | | | |
ABS - Other – 0.1% | | | | | | | | | | |
Rio Oil Finance Trust
Series 2014-1
6.25%, 7/06/24(a) | | | | | 4,396 | | | | 4,525,585 | |
| | | | | | | | | | |
| | | |
Agencies - Not Government
Guaranteed – 0.6% | | | | | | | | | | |
CNOOC Nexen Finance 2014 ULC
4.25%, 4/30/24 | | | | | 4,057 | | | | 4,111,818 | |
| | | | |
| ALLIANCEBERNSTEIN GLOBAL BOND FUND • | | | 29 | |
Portfolio of Investments
| | | | | | | | | | |
| | | | | Principal
Amount
(000) | | | U.S. $ Value | |
| | | | | |
| | | | | | | | | | |
Electricite de France SA
5.25%, 1/29/23(a)(f) | | U.S.$ | | | 7,903 | | | $ | 8,011,666 | |
OCP SA
5.625%, 4/25/24(a) | | | | | 1,784 | | | | 1,855,717 | |
Oleoducto Central SA
4.00%, 5/07/21(a) | | | | | 3,210 | | | | 3,193,950 | |
Petrobras Global Finance BV
4.75%, 1/14/25(c) | | EUR | | | 2,325 | | | | 3,144,208 | |
| | | | | | | | | | |
| | | | | | | | | 20,317,359 | |
| | | | | | | | | | |
| | | | | | | | | 24,842,944 | |
| | | | | | | | | | |
Industrials – 0.1% | | | | | | | | | | |
Capital Goods – 0.1% | | | | | | | | | | |
BAE Systems Holdings, Inc.
3.80%, 10/07/24 | | U.S.$ | | | 4,224 | | | | 4,217,942 | |
| | | | | | | | | | |
| | | |
Total Corporates – Investment Grades
(cost $755,239,796) | | | | | | | | | 789,452,454 | |
| | | | | | | | | | |
| | | | | | | | | | |
| | | |
INFLATION-LINKED SECURITIES – 5.5% | | | | | | | | | | |
United Kingdom – 1.8% | | | | | | | | | | |
United Kingdom Gilt Inflation Linked
Series 8MO
7.774%, 7/26/16(a)(g) | | GBP | | | 12,000 | | | | 64,989,308 | |
| | | | | | | | | | |
| | | |
United States – 3.7% | | | | | | | | | | |
U.S. Treasury Inflation Index
0.125%, 4/15/19 (TIPS) | | U.S.$ | | | 132,688 | | | | 133,009,857 | |
| | | | | | | | | | |
| | | |
Total Inflation-Linked Securities
(cost $201,814,428) | | | | | | | | | 197,999,165 | |
| | | | | | | | | | |
| | | | | | | | | | |
CORPORATES – NON-INVESTMENT GRADES – 5.1% | | | | | | | | | | |
Financial Institutions – 2.7% | | | | | | | | | | |
Banking – 2.5% | | | | | | | | | | |
Ally Financial, Inc.
2.75%, 1/30/17 | | | | | 149 | | | | 146,020 | |
Bank of America Corp.
Series U
5.20%, 6/01/23(f) | | | | | 3,552 | | | | 3,338,880 | |
Bank of Ireland
Series MPLE
2.063%, 9/22/15(d) | | CAD | | | 5,835 | | | | 5,014,677 | |
Barclays Bank PLC
6.86%, 6/15/32(a)(f) | | U.S.$ | | | 1,118 | | | | 1,239,583 | |
7.625%, 11/21/22 | | | | | 1,281 | | | | 1,376,595 | |
7.75%, 4/10/23 | | | | | 3,360 | | | | 3,637,200 | |
| | |
| 30 | | • ALLIANCEBERNSTEIN GLOBAL BOND FUND |
Portfolio of Investments
| | | | | | | | | | |
| | | | | Principal
Amount
(000) | | | U.S. $ Value | |
| | | | | |
| | | | | | | | | | |
BNP Paribas SA
4.73%, 4/12/16(a)(f) | | EUR | | | 10,500 | | | $ | 13,626,730 | |
Commerzbank AG
8.125%, 9/19/23(a) | | U.S.$ | | | 5,977 | | | | 6,900,446 | |
Credit Suisse Group AG
7.50%, 12/11/23(a)(f) | | | | | 3,363 | | | | 3,535,186 | |
Danske Bank A/S
5.684%, 2/15/17(f) | | GBP | | | 3,580 | | | | 6,021,356 | |
DNB Bank ASA
6.012%, 3/29/17(a)(f) | | | | | 266 | | | | 454,512 | |
HBOS Capital Funding LP
4.939%, 5/23/16(f) | | EUR | | | 4,696 | | | | 5,920,191 | |
Intesa Sanpaolo SpA
5.017%, 6/26/24(a) | | U.S.$ | | | 5,232 | | | | 5,097,726 | |
LBG Capital No.1 PLC
8.00%, 6/15/20(a)(f) | | | | | 1,658 | | | | 1,790,972 | |
Lloyds Banking Group PLC
6.657%, 5/21/37(a)(f) | | | | | 129 | | | | 139,320 | |
7.50%, 6/27/24(f) | | | | | 2,630 | | | | 2,708,900 | |
Royal Bank of Scotland PLC (The)
9.50%, 3/16/22(a) | | | | | 3,991 | | | | 4,589,650 | |
Skandinaviska Enskilda Banken AB
5.471%, 3/23/15(a)(f) | | | | | 1,271 | | | | 1,283,710 | |
Societe Generale SA
5.922%, 4/05/17(a)(f) | | | | | 4,800 | | | | 5,064,000 | |
UBS AG/Jersey
4.28%, 4/15/15(f) | | EUR | | | 7,000 | | | | 8,907,660 | |
Unicredit Luxembourg Finance SA
6.00%, 10/31/17(a) | | U.S.$ | | | 8,552 | | | | 9,168,924 | |
| | | | | | | | | | |
| | | | | | | | | 89,962,238 | |
| | | | | | | | | | |
Finance – 0.0% | | | | | | | | | | |
Navient LLC
8.00%, 3/25/20 | | | | | 410 | | | | 459,713 | |
| | | | | | | | | | |
| | | |
Insurance – 0.1% | | | | | | | | | | |
American Equity Investment Life Holding Co.
6.625%, 7/15/21 | | | | | 1,651 | | | | 1,733,550 | |
ING Groep NV
5.775%, 12/08/15(f) | | | | | 2,332 | | | | 2,384,470 | |
| | | | | | | | | | |
| | | | | | | | | 4,118,020 | |
| | | | | | | | | | |
Other Finance – 0.1% | | | | | | | | | | |
iPayment, Inc.
10.25%, 5/15/18 | | | | | 3,059 | | | | 2,699,567 | |
| | | | | | | | | | |
| | | | | | | | | 97,239,538 | |
| | | | | | | | | | |
Industrial – 2.4% | | | | | | | | | | |
Basic – 0.1% | | | | | | | | | | |
Ashland, Inc.
3.875%, 4/15/18 | | | | | 100 | | | | 100,250 | |
| | | | |
| ALLIANCEBERNSTEIN GLOBAL BOND FUND • | | | 31 | |
Portfolio of Investments
| | | | | | | | | | |
| | | | | Principal
Amount
(000) | | | U.S. $ Value | |
| | | | | |
| | | | | | | | | | |
NOVA Chemicals Corp.
5.25%, 8/01/23(a) | | U.S.$ | | | 3,890 | | | $ | 4,045,600 | |
Novelis, Inc./GA
8.375%, 12/15/17 | | | | | 42 | | | | 43,680 | |
| | | | | | | | | | |
| | | | | | | | | 4,189,530 | |
| | | | | | | | | | |
Capital Goods – 0.1% | | | | | | | | | | |
Sealed Air Corp.
5.25%, 4/01/23(a) | | | | | 2,979 | | | | 2,919,420 | |
| | | | | | | | | | |
| | | |
Communications - Media – 0.4% | | | | | | | | | | |
Intelsat Jackson Holdings SA
5.50%, 8/01/23 | | | | | 7,000 | | | | 6,685,000 | |
Quebecor Media, Inc.
5.75%, 1/15/23 | | | | | 3,754 | | | | 3,725,845 | |
Virgin Media Secured Finance PLC
5.25%, 1/15/21 | | | | | 2,523 | | | | 2,535,615 | |
6.00%, 4/15/21(a) | | GBP | | | 882 | | | | 1,469,175 | |
| | | | | | | | | | |
| | | | | | | | | 14,415,635 | |
| | | | | | | | | | |
Communications - Telecommunications – 0.1% | | | | | | | | | | |
United States Cellular Corp.
6.70%, 12/15/33 | | U.S.$ | | | 1,714 | | | | 1,705,689 | |
| | | | | | | | | | |
| | |
Consumer Cyclical - Automotive – 0.1% | | | | | | | | |
General Motors Co.
3.50%, 10/02/18 | | | | | 245 | | | | 248,981 | |
Goodyear Dunlop Tires Europe BV
6.75%, 4/15/19(a) | | EUR | | | 1,287 | | | | 1,717,210 | |
Goodyear Tire & Rubber Co. (The)
8.25%, 8/15/20 | | U.S.$ | | | 65 | | | | 69,550 | |
| | | | | | | | | | |
| | | | | | | | | 2,035,741 | |
| | | | | | | | | | |
Consumer Cyclical - Other – 0.0% | | | | | | | | | | |
Choice Hotels International, Inc.
5.75%, 7/01/22 | | | | | 305 | | | | 324,825 | |
KB Home
4.75%, 5/15/19 | | | | | 159 | | | | 154,627 | |
| | | | | | | | | | |
| | | | | | | | | 479,452 | |
| | | | | | | | | | |
Consumer Cyclical - Restaurants – 0.1% | | | | | | | | |
Stonegate Pub Co. Financing PLC
5.75%, 4/15/19(a) | | GBP | | | 1,822 | | | | 2,931,582 | |
| | | | | | | | | | |
| | | |
Consumer Non-Cyclical – 0.5% | | | | | | | | | | |
Boparan Finance PLC
5.25%, 7/15/19(a) | | | | | 4,245 | | | | 6,176,399 | |
CHS/Community Health Systems, Inc.
5.125%, 8/15/18 | | U.S.$ | | | 81 | | | | 83,228 | |
Elli Finance UK PLC
8.75%, 6/15/19(a) | | GBP | | | 3,740 | | | | 6,393,540 | |
Smithfield Foods, Inc.
5.875%, 8/01/21(a) | | U.S.$ | | | 6,091 | | | | 6,167,137 | |
| | | | | | | | | | |
| | | | | | | | | 18,820,304 | |
| | | | | | | | | | |
| | |
| 32 | | • ALLIANCEBERNSTEIN GLOBAL BOND FUND |
Portfolio of Investments
| | | | | | | | | | |
| | | | | Principal
Amount
(000) | | | U.S. $ Value | |
| | | | | |
| | | | | | | | | | |
Energy – 1.0% | | | | | | | | | | |
Access Midstream Partners LP/ACMP
Finance Corp.
4.875%, 3/15/24 | | U.S.$ | | | 3,126 | | | $ | 3,196,335 | |
California Resources Corp.
5.50%, 9/15/21(a) | | | | | 3,434 | | | | 3,485,510 | |
Cimarex Energy Co.
4.375%, 6/01/24 | | | | | 2,544 | | | | 2,563,080 | |
Golden Energy Offshore Services AS
8.99%, 5/28/17(d)(h) | | NOK | | | 10,000 | | | | 1,552,590 | |
Offshore Group Investment Ltd.
7.125%, 4/01/23 | | U.S.$ | | | 7,916 | | | | 6,975,975 | |
Paragon Offshore PLC
6.75%, 7/15/22(a) | | | | | 1,406 | | | | 1,188,070 | |
7.25%, 8/15/24(a) | | | | | 5,352 | | | | 4,522,440 | |
Sabine Pass Liquefaction LLC
5.75%, 5/15/24(a) | | | | | 3,755 | | | | 3,820,712 | |
SandRidge Energy, Inc.
7.50%, 2/15/23 | | | | | 1,894 | | | | 1,839,548 | |
SM Energy Co.
5.00%, 1/15/24 | | | | | 3,500 | | | | 3,342,500 | |
6.50%, 1/01/23 | | | | | 305 | | | | 317,200 | |
Southern Star Central Corp.
5.125%, 7/15/22(a) | | | | | 5,000 | | | | 4,975,000 | |
| | | | | | | | | | |
| | | | | | | | | 37,778,960 | |
| | | | | | | | | | |
Services – 0.0% | | | | | | | | | | |
Sabre GLBL, Inc.
8.50%, 5/15/19(a) | | | | | 181 | | | | 193,670 | |
| | | | | | | | | | |
| | | |
Technology – 0.0% | | | | | | | | | | |
Numericable Group SA
5.375%, 5/15/22(a) | | EUR | | | 635 | | | | 828,761 | |
| | | | | | | | | | |
| | | |
Transportation - Services – 0.0% | | | | | | | | | | |
Avis Budget Car Rental LLC/Avis Budget Finance, Inc.
4.875%, 11/15/17 | | U.S.$ | | | 140 | | | | 142,800 | |
Hertz Corp. (The)
6.75%, 4/15/19 | | | | | 21 | | | | 21,656 | |
| | | | | | | | | | |
| | | | | | | | | 164,456 | |
| | | | | | | | | | |
| | | | | | | | | 86,463,200 | |
| | | | | | | | | | |
Utility – 0.0% | | | | | | | | | | |
Electric – 0.0% | | | | | | | | | | |
AES Corp./VA
7.375%, 7/01/21 | | | | | 135 | | | | 151,200 | |
FirstEnergy Transmission LLC
4.35%, 1/15/25(a) | | | | | 250 | | | | 254,374 | |
| | | | |
| ALLIANCEBERNSTEIN GLOBAL BOND FUND • | | | 33 | |
Portfolio of Investments
| | | | | | | | | | |
| | | | | Principal
Amount
(000) | | | U.S. $ Value | |
| | | | | |
| | | | | | | | | | |
NRG Energy, Inc.
6.25%, 7/15/22-5/01/24(a) | | U.S.$ | | | 77 | | | $ | 78,164 | |
6.625%, 3/15/23 | | | | | 62 | | | | 63,860 | |
| | | | | | | | | | |
| | | | | | | | | 547,598 | |
| | | | | | | | | | |
Total Corporates – Non-Investment Grades
(cost $182,124,388) | | | | | | | | | 184,250,336 | |
| | | | | | | | | | |
| | | | | | | | | | |
MORTGAGE PASS-THROUGHS – 4.9% | | | | | | | | |
Agency Fixed Rate 30-Year – 4.9% | | | | | | | | | | |
Federal National Mortgage Association
3.00%, 4/01/43-11/01/43 | | | | | 29,248 | | | | 28,880,736 | |
3.50%, 7/01/43 | | | | | 148 | | | | 152,669 | |
4.00%, 11/25/44, TBA | | | | | 133,487 | | | | 140,253,122 | |
5.00%, 12/01/39 | | | | | 53 | | | | 58,035 | |
5.50%, 9/01/36-5/01/38 | | | | | 6,811 | | | | 7,591,687 | |
Series 2005
5.50%, 2/01/35 | | | | | 47 | | | | 52,300 | |
Series 2007
5.50%, 9/01/36-8/01/37 | | | | | 56 | | | | 63,134 | |
Series 2008
5.50%, 3/01/37 | | | | | 16 | | | | 17,701 | |
| | | | | | | | | | |
| | | |
Total Mortgage Pass-Throughs
(cost $176,221,937) | | | | | | | | | 177,069,384 | |
| | | | | | | | | | |
| | | | | | | | | | |
COMMERCIAL MORTGAGE-BACKED SECURITIES – 3.1% | | | | | | | | | | |
Non-Agency Fixed Rate CMBS – 2.4% | | | | | | | | |
Banc of America Commercial Mortgage Trust Series 2006-5, Class A4
5.414%, 9/10/47 | | | | | 60 | | | | 63,729 | |
BHMS Mortgage Trust
Series 2014-ATLS, Class AFX
3.601%, 7/05/33(a) | | | | | 8,400 | | | | 8,351,599 | |
Citigroup Commercial Mortgage Trust
Series 2006-C4, Class A1A
5.974%, 3/15/49 | | | | | 437 | | | | 462,727 | |
Series 2006-C4, Class A3
5.974%, 3/15/49 | | | | | 8,506 | | | | 8,989,903 | |
Series 2007-C6, Class A4
5.899%, 12/10/49 | | | | | 14,000 | | | | 15,357,860 | |
Series 2013-GC17, Class D
5.262%, 11/10/46(a) | | | | | 2,480 | | | | 2,352,158 | |
Series 2014-GC21, Class D
4.996%, 5/10/47(a) | | | | | 425 | | | | 395,590 | |
Series 2014-GC23, Class D
4.658%, 7/10/47(a) | | | | | 2,196 | | | | 2,005,855 | |
Commercial Mortgage Pass-Through Certificates | | | | | | | | | | |
Series 2006-C8, Class A4
5.306%, 12/10/46 | | | | | 2,635 | | | | 2,805,569 | |
| | |
| 34 | | • ALLIANCEBERNSTEIN GLOBAL BOND FUND |
Portfolio of Investments
| | | | | | | | | | |
| | | | | Principal
Amount
(000) | | | U.S. $ Value | |
| | | | | |
| | | | | | | | | | |
Series 2007-GG9, Class A4
5.444%, 3/10/39 | | U.S.$ | | | 6,547 | | | $ | 7,052,062 | |
Series 2007-GG9, Class AM
5.475%, 3/10/39 | | | | | 3,619 | | | | 3,828,109 | |
Series 2013-CR6, Class A2
2.122%, 3/10/46 | | | | | 80 | | | | 80,590 | |
Series 2013-SFS, Class A1
1.873%, 4/12/35(a) | | | | | 4,089 | | | | 3,979,064 | |
GE Capital Commercial Mortgage Corp.
Series 2006-C1, Class AJ
5.452%, 3/10/44 | | | | | 1,218 | | | | 1,221,056 | |
GS Mortgage Securities Trust
Series 2013-G1, Class A2
3.557%, 4/10/31(a) | | | | | 4,825 | | | | 4,723,124 | |
JP Morgan Chase Commercial Mortgage Securities Trust | | | | | | | | | | |
Series 2007-LDPX, Class A1A
5.439%, 1/15/49 | | | | | 82 | | | | 88,739 | |
Series 2008-C2, Class A1A
5.998%, 2/12/51 | | | | | 1,722 | | | | 1,894,803 | |
LB-UBS Commercial Mortgage Trust
Series 2007-C2, Class AM
5.493%, 2/15/40 | | | | | 3,757 | | | | 3,994,378 | |
LSTAR Commercial Mortgage Trust
Series 2014-2, Class A1
1.519%, 1/20/41(a) | | | | | 9,628 | | | | 9,609,611 | |
Merrill Lynch Mortgage Trust
Series 2006-C2, Class A1A
5.739%, 8/12/43 | | | | | 26 | | | | 27,655 | |
Merrill Lynch/Countrywide Commercial Mortgage Trust | | | | | | | | | | |
Series 2006-4, Class A1A
5.166%, 12/12/49 | | | | | 98 | | | | 104,340 | |
Series 2006-4, Class AJ
5.239%, 12/12/49 | | | | | 5,398 | | | | 5,426,349 | |
Series 2007-9, Class A4
5.70%, 9/12/49 | | | | | 65 | | | | 71,243 | |
UBS-Barclays Commercial Mortgage Trust | | | | | | | | | | |
Series 2012-C3, Class A4
3.091%, 8/10/49 | | | | | 15 | | | | 14,882 | |
Series 2012-C4, Class A5
2.85%, 12/10/45 | | | | | 30 | | | | 29,150 | |
Wachovia Bank Commercial Mortgage Trust
Series 2005-C22, Class AJ
5.539%, 12/15/44 | | | | | 1,325 | | | | 1,348,612 | |
WF-RBS Commercial Mortgage Trust
Series 2012-C8, Class E
5.039%, 8/15/45(a) | | | | | 1,600 | | | | 1,594,835 | |
Series 2013-C14, Class A5
3.337%, 6/15/46 | | | | | 40 | | | | 40,187 | |
| | | | |
| ALLIANCEBERNSTEIN GLOBAL BOND FUND • | | | 35 | |
Portfolio of Investments
| | | | | | | | | | |
| | | | | Principal
Amount
(000) | | | U.S. $ Value | |
| | | | | |
| | | | | | | | | | |
Series 2013-C18, Class D
4.83%, 12/15/46(a) | | U.S.$ | | | 3,000 | | | $ | 2,874,021 | |
| | | | | | | | | | |
| | | | | | | | | 88,787,800 | |
| | | | | | | | | | |
Non-Agency Floating Rate
CMBS – 0.4% | | | | | | | | |
Commercial Mortgage Pass-Through Certificates
Series 2014-SAVA, Class A
1.304%, 6/15/34(a)(d) | | | | | 5,509 | | | | 5,510,925 | |
PFP III Ltd.
Series 2014-1, Class A
1.324%, 6/14/31(a)(d) | | | | | 5,123 | | | | 5,133,140 | |
Resource Capital Corp., Ltd.
Series 2014-CRE2, Class A
1.204%, 4/15/32(a)(d) | | | | | 3,472 | | | | 3,471,500 | |
| | | | | | | | | | |
| | | | | | | | | 14,115,565 | |
| | | | | | | | | | |
Agency CMBS – 0.3% | | | | | | | | | | |
Federal Home Loan Mortgage Corp.
Multifamily Structured Pass-Through Certificates
Series K008, Class A2
3.531%, 6/25/20 | | | | | 10,273 | | | | 10,878,093 | |
| | | | | | | | | | |
| | | |
Total Commercial Mortgage-Backed Securities
(cost $113,117,729) | | | | | | | | | 113,781,458 | |
| | | | | | | | | | |
| | | | | | | | | | |
COLLATERALIZED MORTGAGE OBLIGATIONS – 3.1% | | | | | | | | | | |
Non-Agency Fixed Rate – 1.6% | | | | | | | | | | |
Citigroup Mortgage Loan Trust
Series 2006-4, Class 2A1A
6.00%, 12/25/35 | | | | | 7,607 | | | | 7,012,695 | |
Series 2007-AR4, Class 1A1A
5.467%, 3/25/37 | | | | | 1,147 | | | | 1,104,724 | |
Countrywide Alternative Loan Trust
Series 2006-19CB, Class A15
6.00%, 8/25/36 | | | | | 488 | | | | 426,619 | |
Series 2006-19CB, Class A24
6.00%, 8/25/36 | | | | | 312 | | | | 279,499 | |
Series 2006-24CB, Class A15
5.75%, 6/25/36 | | | | | 4,070 | | | | 3,619,097 | |
Series 2006-41CB, Class 2A13
5.75%, 1/25/37 | | | | | 3,352 | | | | 2,920,475 | |
Series 2006-J1, Class 1A11
5.50%, 2/25/36 | | | | | 3,016 | | | | 2,782,150 | |
Series 2007-13, Class A2
6.00%, 6/25/47 | | | | | 4,878 | | | | 4,220,480 | |
Series 2007-15CB, Class A19
5.75%, 7/25/37 | | | | | 845 | | | | 787,708 | |
| | |
| 36 | | • ALLIANCEBERNSTEIN GLOBAL BOND FUND |
Portfolio of Investments
| | | | | | | | | | |
| | | | | Principal
Amount
(000) | | | U.S. $ Value | |
| | | | | |
| | | | | | | | | | |
Countrywide Home Loan Mortgage Pass-Through Trust
Series 2007-3, Class A30
5.75%, 4/25/37 | | U.S.$ | | | 3,279 | | | $ | 2,980,859 | |
Series 2007-HY4, Class 1A1
2.584%, 9/25/47 | | | | | 1,476 | | | | 1,321,073 | |
Credit Suisse Mortgage-Backed Trust
Series 2006-7, Class 3A12
6.25%, 8/25/36 | | | | | 2,826 | | | | 2,482,254 | |
First Horizon Alternative Mortgage Securities Trust
Series 2006-AA5, Class A1
2.253%, 9/25/36 | | | | | 1,919 | | | | 1,520,862 | |
Series 2006-AA7, Class A1
2.217%, 1/25/37 | | | | | 2,558 | | | | 2,072,197 | |
Morgan Stanley Mortgage Loan Trust
Series 2005-10, Class 4A1
5.50%, 12/25/35 | | | | | 1,797 | | | | 1,637,457 | |
Residential Accredit Loans, Inc.
Series 2005-QA7, Class A21
2.911%, 7/25/35 | | | | | 2,363 | | | | 2,180,781 | |
Series 2005-QS14, Class 3A1
6.00%, 9/25/35 | | | | | 4,901 | | | | 4,534,621 | |
Series 2006-QS2, Class 1A8
6.00%, 2/25/36 | | | | | 6,190 | | | | 5,314,350 | |
Wells Fargo Mortgage Backed Securities Trust
Series 2007-AR7, Class A1
2.593%, 12/28/37 | | | | | 7,302 | | | | 6,759,709 | |
Series 2007-AR8, Class A1
4.371%, 11/25/37 | | | | | 2,929 | | | | 2,656,071 | |
| | | | | | | | | | |
| | | | | | | | | 56,613,681 | |
| | | | | | | | | | |
GSE Risk Share Floating Rate – 1.2% | | | | | | | | | | |
Fannie Mae Connecticut Avenue Securities
Series 2013-C01, Class M2
5.405%, 10/25/23(d) | | | | | 1,500 | | | | 1,694,280 | |
Federal Home Loan Mortgage Corp.
Structured Agency Credit Risk Debt Notes Series 2013-DN1, Class M2
7.305%, 7/25/23(d) | | | | | 5,330 | | | | 6,655,987 | |
Series 2013-DN2, Class M2
4.405%, 11/25/23(d) | | | | | 5,910 | | | | 6,236,521 | |
Series 2014-DN1, Class M1
1.155%, 2/25/24(d) | | | | | 2,976 | | | | 2,951,762 | |
Series 2014-DN1, Class M2
2.355%, 2/25/24(d) | | | | | 7,270 | | | | 7,223,970 | |
Series 2014-DN1, Class M3
4.655%, 2/25/24(d) | | | | | 4,495 | | | | 4,680,782 | |
Series 2014-DN3, Class M3
4.157%, 8/25/24(d) | | | | | 8,445 | | | | 8,413,670 | |
| | | | |
| ALLIANCEBERNSTEIN GLOBAL BOND FUND • | | | 37 | |
Portfolio of Investments
| | | | | | | | | | |
| | | | | Principal
Amount
(000) | | | U.S. $ Value | |
| | | | | |
| | | | | | | | | | |
Series 2014-HQ2, Class M3
3.904%, 9/25/24(d) | | U.S.$ | | | 1,595 | | | $ | 1,556,483 | |
Federal National Mortgage Association Connecticut Avenue Securities
Series 2014-C01, Class M2 | | | | | | | | | | |
4.555%, 1/25/24(d) | | | | | 2,563 | | | | 2,727,239 | |
Series 2014-C03, Class 1M1
1.355%, 7/25/24(d) | | | | | 3,197 | | | | 3,174,097 | |
| | | | | | | | | | |
| | | | | | | | | 45,314,791 | |
| | | | | | | | | | |
Non-Agency Floating Rate – 0.3% | | | | | | | | | | |
First Horizon Alternative Mortgage Securities Trust | | | | | | | | | | |
Series 2007-FA2, Class 1A10
0.405%, 4/25/37(d) | | | | | 1,738 | | | | 1,005,886 | |
Series 2007-FA2, Class 1A5
0.455%, 4/25/37(d) | | | | | 1,969 | | | | 1,145,282 | |
Residential Accredit Loans, Inc.
Series 2006-QO6, Class A2
0.385%, 6/25/46(d) | | | | | 1,932 | | | | 888,707 | |
Washington Mutual Alternative Mortgage Pass-Through Certificates
Series 2007-OA4, Class A1A
0.875%, 4/25/47(d) | | | | | 3,525 | | | | 2,673,783 | |
Washington Mutual Mortgage Pass-Through Certificates
Series 2007-OA1, Class A1A
0.817%, 2/25/47(d) | | | | | 7,342 | | | | 6,041,439 | |
| | | | | | | | | | |
| | | | | | | | | 11,755,097 | |
| | | | | | | | | | |
Total Collateralized Mortgage Obligations
(cost $110,186,073) | | | | | | | | | 113,683,569 | |
| | | | | | | | | | |
| | | | | | | | | | |
GOVERNMENTS – SOVEREIGN AGENCIES – 1.7% | | | | | | | | | | |
Colombia – 0.1% | | | | | | | | | | |
Ecopetrol SA
5.875%, 9/18/23-5/28/45 | | | | | 3,395 | | | | 3,478,813 | |
| | | | | | | | | | |
| | | |
Germany – 1.5% | | | | | | | | | | |
FMS Wertmanagement AoeR
1.125%, 9/03/18(a) | | EUR | | | 12,000 | | | | 15,725,670 | |
3.00%, 8/03/18(a) | | | | | 3,600 | | | | 5,042,946 | |
Kreditanstalt fuer Wiederaufbau
3.875%, 1/21/19 | | | | | 22,100 | | | | 32,357,609 | |
Landwirtschaftliche Rentenbank
5.125%, 2/01/17 | | U.S.$ | | | 5 | | | | 5,483 | |
| | | | | | | | | | |
| | | | | | | | | 53,131,708 | |
| | | | | | | | | | |
Norway – 0.1% | | | | | | | | | | |
Eksportfinans ASA
2.00%, 9/15/15 | | | | | 442 | | | | 441,448 | |
| | |
| 38 | | • ALLIANCEBERNSTEIN GLOBAL BOND FUND |
Portfolio of Investments
| | | | | | | | | | |
| | | | | Principal
Amount
(000) | | | U.S. $ Value | |
| | | | | |
| | | | | | | | | | |
2.375%, 5/25/16 | | U.S.$ | | | 5,271 | | | $ | 5,277,325 | |
| | | | | | | | | | |
| | | | | | | | | 5,718,773 | |
| | | | | | | | | | |
Total Governments – Sovereign Agencies
(cost $64,286,780) | | | | | | | | | 62,329,294 | |
| | | | | | | | | | |
| | | | | | | | | | |
| COVERED BONDS – 1.7% | | | | | | | | | | |
Abbey National Treasury Services
PLC/London
4.25%, 4/12/21(a) | | EUR | | | 8,100 | | | | 12,511,886 | |
Banco Bilbao Vizcaya Argentaria SA
3.25%, 1/24/16 | | | | | 6,000 | | | | 7,875,793 | |
BNP Paribas Home Loan SFH
2.20%, 11/02/15(a) | | U.S.$ | | | 9,054 | | | | 9,205,030 | |
Caisse Francaise de Financement Local
3.50%, 9/16/16 | | EUR | | | 2,600 | | | | 3,502,016 | |
CaixaBank SA
3.00%, 3/22/18 | | | | | 2,300 | | | | 3,161,644 | |
Cie de Financement Foncier SA
4.125%, 10/25/17 | | | | | 5,215 | | | | 7,384,955 | |
Credit Agricole Home Loan SFH
2.875%, 9/09/16(a) | | | | | 5,300 | | | | 7,055,690 | |
Danske Bank A/S
4.125%, 11/26/19 | | | | | 2,350 | | | | 3,526,762 | |
Societe Generale SFH
1.00%, 12/19/17 | | | | | 100 | | | | 129,665 | |
3.25%, 6/06/16(a) | | | | | 4,000 | | | | 5,319,966 | |
| | | | | | | | | | |
| | | |
Total Covered Bonds
(cost $57,185,487) | | | | | | | | | 59,673,407 | |
| | | | | | | | | | |
| | | | | | | | | | |
EMERGING MARKETS – CORPORATE BONDS – 1.1% | | | | | | | | | | |
Industrial – 1.1% | | | | | | | | | | |
Basic – 0.1% | | | | | | | | | | |
Gold Fields Orogen HoldingS BVI Ltd.
4.875%, 10/07/20(a) | | U.S.$ | | | 3,800 | | | | 3,382,000 | |
| | | | | | | | | | |
| | | |
Capital Goods – 0.4% | | | | | | | | | | |
CEMEX Espana SA/Luxembourg
9.875%, 4/30/19(a) | | | | | 1,554 | | | | 1,724,940 | |
Cemex SAB de CV
7.25%, 1/15/21(a)(c) | | | | | 4,049 | | | | 4,281,818 | |
Ferreycorp SAA
4.875%, 4/26/20(a) | | | | | 1,007 | | | | 996,292 | |
Grupo Cementos de Chihuahua SAB de CV 8.125%, 2/08/20(a) | | | | | 2,075 | | | | 2,241,000 | |
Grupo KUO SAB de CV
6.25%, 12/04/22(a) | | | | | 953 | | | | 981,734 | |
Servicios Corporativos Javer SAPI de CV
9.875%, 4/06/21(a) | | | | | 3,500 | | | | 3,780,000 | |
| | | | | | | | | | |
| | | | | | | | | 14,005,784 | |
| | | | | | | | | | |
| | | | |
| ALLIANCEBERNSTEIN GLOBAL BOND FUND • | | | 39 | |
Portfolio of Investments
| | | | | | | | | | |
| | | | | Principal
Amount
(000) | | | U.S. $ Value | |
| | | | | |
| | | | | | | | | | |
Communications - Media – 0.1% | | | | | | | | | | |
Myriad International Holdings BV
6.00%, 7/18/20(a) | | U.S.$ | | | 5,287 | | | $ | 5,732,518 | |
| | | | | | | | | | |
| | | |
Communications - Telecommunications – 0.1% | | | | | | | | | | |
Comcel Trust
6.875%, 2/06/24(a) | | | | | 2,500 | | | | 2,637,500 | |
| | | | | | | | | | |
| | | |
Consumer Cyclical - Retailers – 0.2% | | | | | | | | | | |
Office Depot de Mexico SA de CV
6.875%, 9/20/20(a) | | | | | 6,500 | | | | 6,955,000 | |
| | | | | | | | | | |
| | | |
Consumer Non-Cyclical – 0.2% | | | | | | | | | | |
Cosan Luxembourg SA
5.00%, 3/14/23(a) | | | | | 2,190 | | | | 2,113,350 | |
Marfrig Holding Europe BV
6.875%, 6/24/19(a) | | | | | 3,155 | | | | 3,069,815 | |
Virgolino de Oliveira Finance SA
10.50%, 1/28/18(a) | | | | | 4,300 | | | | 2,715,751 | |
| | | | | | | | | | |
| | | | | | | | | 7,898,916 | |
| | | | | | | | | | |
Total Emerging Markets – Corporate Bonds
(cost $39,551,210) | | | | | | | | | 40,611,718 | |
| | | | | | | | | | |
| | | | | | | | | | |
QUASI-SOVEREIGNS – 1.1% | | | | | | | | | | |
Quasi-Sovereign Bonds – 1.1% | | | | | | | | | | |
China – 0.3% | | | | | | | | | | |
CNOOC Curtis Funding No. 1 Pty Ltd.
4.50%, 10/03/23(a) | | | | | 2,055 | | | | 2,128,594 | |
State Grid Overseas Investment 2014 Ltd.
4.125%, 5/07/24(a) | | | | | 8,049 | | | | 8,252,366 | |
| | | | | | | | | | |
| | | | | | | | | 10,380,960 | |
| | | | | | | | | | |
Indonesia – 0.3% | | | | | | | | | | |
Pertamina Persero PT
6.00%, 5/03/42(a) | | | | | 8,000 | | | | 7,660,000 | |
Perusahaan Listrik Negara PT
5.50%, 11/22/21(a) | | | | | 3,874 | | | | 4,038,645 | |
| | | | | | | | | | |
| | | | | | | | | 11,698,645 | |
| | | | | | | | | | |
Mexico – 0.2% | | | | | | | | | | |
Petroleos Mexicanos
4.875%, 1/18/24 | | | | | 8,000 | | | | 8,392,000 | |
| | | | | | | | | | |
| | | |
United Arab Emirates – 0.3% | | | | | | | | | | |
IPIC GMTN Ltd.
5.50%, 3/01/22(a) | | | | | 7,800 | | | | 8,921,250 | |
| | | | | | | | | | |
| | | |
Total Quasi-Sovereigns
(cost $37,657,390) | | | | | | | | | 39,392,855 | |
| | | | | | | | | | |
| | |
| 40 | | • ALLIANCEBERNSTEIN GLOBAL BOND FUND |
Portfolio of Investments
| | | | | | | | | | |
| | | | | Principal
Amount
(000) | | | U.S. $ Value | |
| | | | | |
| | | | | | | | | | |
LOCAL GOVERNMENTS – MUNICIPAL BONDS – 1.1% | | | | | | | | | | |
United States – 1.1% | | | | | | | | | | |
Buckeye Tobacco Settlement Financing Authority
Series 2007A-2
5.875%, 6/01/47 | | U.S.$ | | | 5,350 | | | $ | 4,173,321 | |
California GO
Series 2010
7.625%, 3/01/40 | | | | | 30 | | | | 43,744 | |
Golden State Tobacco Securitization Corp.
Series 2007A-1
5.125%, 6/01/47 | | | | | 3,570 | | | | 2,615,132 | |
Iowa Tobacco Settlement Authority
Series 2005C
5.625%, 6/01/46 | | | | | 2,635 | | | | 2,187,234 | |
Michigan Tobacco Settlement Finance Authority
Series 2007A
6.00%, 6/01/48 | | | | | 6,460 | | | | 5,138,672 | |
State of California
Series 2010
7.95%, 3/01/36 | | | | | 10,685 | | | | 13,033,456 | |
State of Illinois
7.35%, 7/01/35 | | | | | 4,440 | | | | 5,096,188 | |
Texas Transp Comm
(Texas St Hwy Fund First Tier)
Series 2010B
5.178%, 4/01/30 | | | | | 3,400 | | | | 3,988,370 | |
Tobacco Settlement Financing Corp/NJ
Series 20071A
5.00%, 6/01/41 | | | | | 785 | | | | 576,331 | |
Tobacco Settlement Financing Corp/VA
Series 2007B1
5.00%, 6/01/47 | | | | | 2,810 | | | | 1,872,022 | |
| | | | | | | | | | |
| | | |
Total Local Governments – Municipal Bonds
(cost $37,257,332) | | | | | | | | | 38,724,470 | |
| | | | | | | | | | |
| | | |
| | | | | Shares | | | | |
PREFERRED STOCKS – 0.6% | | | | | | | | | | |
Financial Institutions – 0.5% | | | | | | | | | | |
Banking – 0.1% | | | | | | | | | | |
Goldman Sachs Group, Inc. (The)
Series J
5.50% | | | | | 64,375 | | | | 1,528,906 | |
| | | | | | | | | | |
| | | |
REITS – 0.4% | | | | | | | | | | |
DDR Corp.
Series K
6.25% | | | | | 10,000 | | | | 245,100 | |
| | | | |
| ALLIANCEBERNSTEIN GLOBAL BOND FUND • | | | 41 | |
Portfolio of Investments
| | | | | | | | | | |
| | | | |
Shares | | | U.S. $ Value | |
| | | | | |
| | | | | | | | | | |
Health Care REIT, Inc.
Series J
6.50% | | | | | 16,350 | | | $ | 422,811 | |
Kilroy Realty Corp.
Series G
6.875% | | | | | 53,750 | | | | 1,381,375 | |
Kilroy Realty Corp.
Series H
6.375% | | | | | 6,000 | | | | 147,720 | |
Kimco Realty Corp.
Series I
6.00% | | | | | 69,050 | | | | 1,722,798 | |
Kimco Realty Corp.
Series K
5.625% | | | | | 28,250 | | | | 664,158 | |
National Retail Properties, Inc.
Series D
6.625% | | | | | 50,000 | | | | 1,294,000 | |
National Retail Properties, Inc.
Series E
5.70% | | | | | 106,350 | | | | 2,536,447 | |
Public Storage
Series W
5.20% | | | | | 45,875 | | | | 1,035,858 | |
Public Storage
Series X
5.20% | | | | | 3,000 | | | | 67,770 | |
Sabra Health Care REIT, Inc.
Series A
7.125% | | | | | 194,150 | | | | 4,952,766 | |
Vornado Realty Trust
Series K
5.70% | | | | | 25,600 | | | | 611,840 | |
| | | | | | | | | | |
| | | | | | | | | 15,082,643 | |
| | | | | | | | | | |
| | | | | | | | | 16,611,549 | |
| | | | | | | | | | |
Industrial – 0.1% | | | | | | | | | | |
Consumer Non-Cyclical – 0.1% | | | | | | | | | | |
Ventas Realty LP/Ventas Capital Corp.
5.45% | | | | | 227,075 | | | | 5,418,009 | |
| | | | | | | | | | |
| | | |
Total Preferred Stocks
(cost $21,018,857) | | | | | | | | | 22,029,558 | |
| | | | | | | | | | |
| | | |
| | | | | Principal
Amount
(000) | | | | |
WHOLE LOAN TRUSTS – 0.4% | | | | | | | | | | |
Performing Asset – 0.4% | | | | | | | | | | |
Aeroservicios Especializados
10.75%, 3/19/18(i)(j) | | U.S.$ | | | 6,313 | | | | 6,312,653 | |
| | |
| 42 | | • ALLIANCEBERNSTEIN GLOBAL BOND FUND |
Portfolio of Investments
| | | | | | | | | | |
| | | | | Principal
Amount
(000) | | | U.S. $ Value | |
| | | | | |
| | | | | | | | | | |
Alpha Credit Debt Fund LLC
15.00%, 12/31/17(i)(j) | | U.S.$ | | | 2,914 | | | $ | 2,914,327 | |
Deutsche Bank Mexico SA
6.905%, 10/31/34(i)(j) | | MXN | | | 50,428 | | | | 2,787,120 | |
Ede Del Este SA (DPP)
12.00%, 3/31/16(i)(j) | | U.S.$ | | | 759 | | | | 781,667 | |
Ede Del Este SA (ITABO)
12.00%, 3/31/16(i)(j) | | | | | 1,280 | | | | 1,319,208 | |
| | | | | | | | | | |
| | | |
Total Whole Loan Trusts
(cost $14,192,407) | | | | | | | | | 14,114,975 | |
| | | | | | | | | | |
| | | | | | | | | | |
BANK LOANS – 0.3% | | | | | | | | | | |
Industrial – 0.3% | | | | | | | | | | |
Basic – 0.1% | | | | | | | | | | |
FMG Resources (August 2006) Pty Ltd.
(FMG America Finance, Inc.)
3.75%, 6/30/19(d) | | | | | 1,887 | | | | 1,845,129 | |
| | | | | | | | | | |
| | | |
Capital Goods – 0.1% | | | | | | | | | | |
ClubCorp Club Operations, Inc.
4.50%, 7/24/20(d) | | | | | 2,946 | | | | 2,915,574 | |
| | | | | | | | | | |
| | | |
Communications - Media – 0.0% | | | | | | | | | | |
Clear Channel Communications, Inc.
3.80%, 1/29/16(d) | | | | | 150 | | | | 148,483 | |
| | | | | | | | | | |
| | | |
Consumer Cyclical - Retailers – 0.0% | | | | | | | | | | |
Burlington Coat Factory Warehouse Corp.
4.25%, 8/13/21(d) | | | | | 830 | | | | 820,563 | |
Harbor Freight Tools USA, Inc.
4.75%, 7/26/19(d) | | | | | 983 | | | | 979,912 | |
| | | | | | | | | | |
| | | | | | | | | 1,800,475 | |
| | | | | | | | | | |
Consumer Non-Cyclical – 0.1% | | | | | | | | | | |
Air Medical Group Holdings, Inc.
5.00%, 6/30/18(d) | | | | | 2,436 | | | | 2,435,013 | |
| | | | | | | | | | |
| | | |
Other Industrial – 0.0% | | | | | | | | | | |
Gardner Denver, Inc.
4.25%, 7/30/20(d) | | | | | 1,634 | | | | 1,599,556 | |
| | | | | | | | | | |
| | | |
Technology – 0.0% | | | | | | | | | | |
Avaya, Inc.
4.65%, 10/26/17(d) | | | | | 156 | | | | 148,947 | |
| | | | | | | | | | |
| | | |
Total Bank Loans
(cost $10,962,860) | | | | | | | | | 10,893,177 | |
| | | | | | | | | | |
| | | |
| | | | | Shares | | | | |
INVESTMENT COMPANIES – 0.1% | | | | | | | | | | |
Funds and Investment Trusts – 0.1% | | | | | | | | | | |
OCL Opportunities Fund I(i) | | | | | 25,200 | | | | 3,182,886 | |
| | | | |
| ALLIANCEBERNSTEIN GLOBAL BOND FUND • | | | 43 | |
Portfolio of Investments
| | | | | | | | | | | | |
| | | | | |
Shares | | | U.S. $ Value | |
| | | | | |
| | | | | | | | | | | | |
OCL Opportunities Fund II(i) | | | | | | | 7,350 | | | $ | 928,315 | |
| | | | | | | | | | | | |
| | | |
Total Investment Companies
(cost $4,208,200) | | | | | | | | | | | 4,111,201 | |
| | | | | | | | | | | | |
| | | |
| | | | | | Principal
Amount
(000) | | | | |
GOVERNMENTS – SOVEREIGN BONDS – 0.1% | | | | | | | | | | | | |
Indonesia – 0.1% | | | | | | | | | | | | |
Indonesia Government International Bond
5.875%, 1/15/24(a)
(cost $3,126,372) | | U.S.$ | | | | | 3,143 | | | | 3,465,158 | |
| | | | | | | | | | | | |
| | | | | | | | | | | | |
SUPRANATIONALS – 0.1% | | | | | | | | | | | | |
European Investment Bank
7.25%, 2/22/15
(cost $2,785,524) | | | IDR | | | | 24,700,000 | | | | 2,027,022 | |
| | | | | | | | | | | | |
| | | | | | | | | | | | |
ASSET-BACKED SECURITIES – 0.0% | | | | | | | | | | | | |
Autos - Fixed Rate – 0.0% | | | | | | | | | | | | |
Ally Auto Receivables Trust
Series 2013-SN1, Class A3
0.72%, 5/20/16 | | | U.S.$ | | | | 56 | | | | 56,303 | |
AmeriCredit Automobile Receivables Trust
Series 2013-1, Class A2
0.49%, 6/08/16 | | | | | | | 1 | | | | 1,167 | |
Series 2013-3, Class A3
0.92%, 4/09/18 | | | | | | | 80 | | | | 80,034 | |
Bank of America Auto Trust
Series 2012-1, Class A4
1.03%, 12/15/16 | | | | | | | 35 | | | | 35,131 | |
Capital Auto Receivables Asset Trust
Series 2013-3, Class A2
1.04%, 11/21/16 | | | | | | | 80 | | | | 80,281 | |
Carfinance Capital Auto Trust
Series 2013-1A, Class A
1.65%, 7/17/17(a) | | | | | | | 10 | | | | 9,737 | |
Fifth Third Auto Trust
Series 2013-A, Class A3
0.61%, 9/15/17 | | | | | | | 30 | | | | 30,026 | |
Flagship Credit Auto Trust
Series 2013-1, Class A
1.32%, 4/16/18(a) | | | | | | | 9 | | | | 8,697 | |
Mercedes-Benz Auto Lease Trust
Series 2013-A, Class A3
0.59%, 2/15/16 | | | | | | | 30 | | | | 30,015 | |
Santander Drive Auto Receivables Trust
Series 2013-3, Class C
1.81%, 4/15/19 | | | | | | | 40 | | | | 39,852 | |
| | |
| 44 | | • ALLIANCEBERNSTEIN GLOBAL BOND FUND |
Portfolio of Investments
| | | | | | | | | | |
| | | | | Principal
Amount
(000) | | | U.S. $ Value | |
| | | | | |
| | | | | | | | | | |
Series 2013-4, Class A3
1.11%, 12/15/17 | | U.S.$ | | | 95 | | | $ | 95,398 | |
World Omni Automobile Lease Securitization Trust
Series 2012-A, Class A3
0.93%, 11/16/15 | | | | | 6 | | | | 5,882 | |
| | | | | | | | | | |
| | | | | | | | | 472,523 | |
| | | | | | | | | | |
Credit Cards - Fixed Rate – 0.0% | | | | | | | | | | |
American Express Credit Account
Master Trust
Series 2012-2, Class A
0.68%, 3/15/18 | | | | | 100 | | | | 100,198 | |
World Financial Network Credit Card Master Trust
Series 2012-B, Class A
1.76%, 5/17/21 | | | | | 30 | | | | 30,118 | |
| | | | | | | | | | |
| | | | | | | | | 130,316 | |
| | | | | | | | | | |
Autos - Floating Rate – 0.0% | | | | | | | | | | |
Ford Credit Floorplan Master
Owner Trust A
Series 2010-3, Class A2
1.854%, 2/15/17(a)(d) | | | | | 105 | | | | 105,616 | |
| | | | | | | | | | |
| | | |
Other ABS - Fixed Rate – 0.0% | | | | | | | | | | |
CNH Equipment Trust
Series 2013-C, Class A2
0.63%, 1/17/17 | | | | | 28 | | | | 28,213 | |
| | | | | | | | | | |
| | | |
Total Asset-Backed Securities
(cost $734,620) | | | | | | | | | 736,668 | |
| | | | | | | | | | |
| | | | | | | | | | |
AGENCIES – 0.0% | | | | | | | | | | |
Agency Debentures – 0.0% | | | | | | | | | | |
Federal National Mortgage Association
6.25%, 5/15/29 | | | | | 95 | | | | 128,467 | |
6.625%, 11/15/30 | | | | | 150 | | | | 213,142 | |
Residual Funding Corp. Principal Strip
Zero Coupon, 7/15/20 | | | | | 225 | | | | 197,239 | |
| | | | | | | | | | |
| | | |
Total Agencies
(cost $513,351) | | | | | | | | | 538,848 | |
| | | | | | | | | | |
| | | |
| | | | | Shares | | | | |
SHORT-TERM INVESTMENTS – 4.5% | | | | | | | | | | |
Investment Companies – 4.5% | | | | | | | | | | |
AllianceBernstein Fixed-Income Shares, Inc. – Government STIF Portfolio, 0.07%(k)(l)
(cost $161,309,354) | | | | | 161,309,354 | | | | 161,309,354 | |
| | | | | | | | | | |
| | | | |
| ALLIANCEBERNSTEIN GLOBAL BOND FUND • | | | 45 | |
Portfolio of Investments
| | | | | | | | | | |
| | | | | Principal
Amount
(000) | | | U.S. $ Value | |
| | | | | |
| | | | | | | | | | |
Time Deposits – 0.0% | | | | | | | | | | |
BBH, Grand Cayman
0.005%, 10/01/14 | | JPY | | | 5,960 | | | $ | 54,345 | |
0.06%, 10/01/14 | | GBP | | | – 0 | –** | | | – 0 | –*** |
0.35%, 10/01/14 | | NOK | | | – 0 | –** | | | – 0 | –*** |
2.75%, 10/01/14 | | NZD | | | – 0 | –** | | | 3 | |
BTMU, Grand Cayman
0.03%, 10/01/14 | | U.S.$ | | | 567 | | | | 567,222 | |
Wells Fargo, Grand Cayman
Zero Coupon, 10/01/14 | | EUR | | | 520 | | | | 657,387 | |
0.299%, 10/01/14 | | CAD | | | 30 | | | | 27,082 | |
1.579%, 10/01/14 | | AUD | | | 573 | | | | 501,655 | |
| | | | | | | | | | |
Total Time Deposits
(cost $1,828,869) | | | | | | | | | 1,807,694 | |
| | | | | | | | | | |
| | | |
Total Short-Term Investments
(cost $163,138,223) | | | | | | | | | 163,117,048 | |
| | | | | | | | | | |
| | | |
Total Investments – 102.4%
(cost $3,651,170,946) | | | | | | | | | 3,703,249,399 | |
Other assets less liabilities – (2.4)% | | | | | | | | | (87,459,886 | ) |
| | | | | | | | | | |
| | | |
Net Assets – 100.0% | | | | | | | | $ | 3,615,789,513 | |
| | | | | | | | | | |
FUTURES (see Note D)
| | | | | | | | | | | | | | | | | | | | |
| Type | | Number of
Contracts | | | Expiration
Month | | | Original
Value | | | Value at
September 30,
2014 | | | Unrealized
Appreciation/
(Depreciation) | |
Purchased Contracts | | | | | | | | | | | | | | | | | |
10 Yr Japan Government Bond (OSE) Futures | | | 29 | | | | December 2014 | | | $ | 38,512,423 | | | $ | 38,562,662 | | | $ | 50,239 | |
U.S. T-Note 10 Yr (CBT) Futures | | | 4 | | | | December 2014 | | | | 503,125 | | | | 498,563 | | | | (4,562 | ) |
U.S. Ultra Bond (CBT) Futures | | | 15 | | | | December 2014 | | | | 2,286,750 | | | | 2,287,500 | | | | 750 | |
| | | | | | | | | | | | | | | | | | | | |
| | | | | |
Sold Contracts | | | | | | | | | | | | | | | | | | | | |
Euro-Bobl Futures | | | 198 | | | | December 2014 | | | | 31,875,769 | | | | 31,990,732 | | | | (114,963 | ) |
Euro-Buxl Futures | | | 107 | | | | December 2014 | | | | 19,161,049 | | | | 19,244,840 | | | | (83,791 | ) |
U.S. Long Bond (CBT) Futures | | | 2,025 | | | | December 2014 | | | | 281,475,000 | | | | 279,260,156 | | | | 2,214,844 | |
U.S. T-Note 5 Yr (CBT) Futures | | | 1,925 | | | | December 2014 | | | | 227,881,891 | | | | 227,646,290 | | | | 235,601 | |
| | | | | | | | | | | | | | | | | | | | |
| | | | | | | | | | | | | | | | | | $ | 2,298,118 | |
| | | | | | | | | | | | | | | | | | | | |
| | |
| 46 | | • ALLIANCEBERNSTEIN GLOBAL BOND FUND |
Portfolio of Investments
FORWARD CURRENCY EXCHANGE CONTRACTS (see Note D)
| | | | | | | | | | | | | | | | | | | | | | | | |
| Counterparty | | Contracts to Deliver (000) | | | In Exchange For (000) | | | Settlement
Date | | | Unrealized
Appreciation/
(Depreciation) | |
Barclays Bank PLC | | | USD | | | | 656 | | | | CAD | | | | 721 | | | | 10/10/14 | | | $ | (12,606 | ) |
Barclays Bank PLC | | | USD | | | | 3,223 | | | | GBP | | | | 2,001 | | | | 10/14/14 | | | | 20,126 | |
Barclays Bank PLC | | | EUR | | | | 553,038 | | | | USD | | | | 729,587 | | | | 10/16/14 | | | | 31,007,765 | |
Barclays Bank PLC | | | USD | | | | 2,275 | | | | EUR | | | | 1,757 | | | | 10/16/14 | | | | (55,364 | ) |
BNP Paribas SA | | | GBP | | | | 5,134 | | | | USD | | | | 8,562 | | | | 10/14/14 | | | | 240,385 | |
BNP Paribas SA | | | ZAR | | | | 594,751 | | | | USD | | | | 52,997 | | | | 10/15/14 | | | | 400,213 | |
BNP Paribas SA | | | USD | | | | 30,435 | | | | JPY | | | | 3,325,944 | | | | 10/17/14 | | | | (106,138 | ) |
BNP Paribas SA | | | SEK | | | | 82,499 | | | | USD | | | | 11,780 | | | | 10/22/14 | | | | 348,469 | |
Brown Brothers Harriman & Co. | | | GBP | | | | 4,128 | | | | USD | | | | 6,835 | | | | 10/14/14 | | | | 144,055 | |
Brown Brothers Harriman & Co. | | | EUR | | | | 9,802 | | | | USD | | | | 12,647 | | | | 10/16/14 | | | | 266,194 | |
Brown Brothers Harriman & Co. | | | JPY | | | | 7,259,382 | | | | USD | | | | 69,252 | | | | 10/17/14 | | | | 3,054,994 | |
Brown Brothers Harriman & Co. | | | NOK | | | | 2,851 | | | | USD | | | | 448 | | | | 10/22/14 | | | | 4,709 | |
Citibank, NA | | | EUR | | | | 13,034 | | | | USD | | | | 16,970 | | | | 10/16/14 | | | | 505,684 | |
Credit Suisse International | | | GBP | | | | 228,977 | | | | USD | | | | 380,473 | | | | 10/14/14 | | | | 9,306,714 | |
Credit Suisse International | | | NOK | | | | 198,696 | | | | USD | | | | 31,251 | | | | 10/22/14 | | | | 346,925 | |
Deutsche Bank AG | | | GBP | | | | 26,118 | | | | USD | | | | 43,653 | | | | 10/14/14 | | | | 1,315,429 | |
Goldman Sachs Bank USA | | | CAD | | | | 187,789 | | | | USD | | | | 171,120 | | | | 10/10/14 | | | | 3,476,133 | |
Goldman Sachs Bank USA | | | GBP | | | | 1,392 | | | | USD | | | | 2,272 | | | | 10/14/14 | | | | 14,705 | |
Goldman Sachs Bank USA | | | USD | | | | 30,769 | | | | NOK | | | | 191,807 | | | | 10/22/14 | | | | (937,095 | ) |
Goldman Sachs Bank USA | | | AUD | | | | 39,981 | | | | USD | | | | 36,381 | | | | 10/24/14 | | | | 1,433,845 | |
Goldman Sachs Bank USA | | | NZD | | | | 4,269 | | | | USD | | | | 3,347 | | | | 10/31/14 | | | | 25,279 | |
Morgan Stanley Capital Services LLC | | | MXN | | | | 1,334,885 | | | | USD | | | | 101,717 | | | | 10/16/14 | | | | 2,427,307 | |
Royal Bank of Scotland PLC | | | AUD | | | | 116,687 | | | | USD | | | | 106,439 | | | | 10/24/14 | | | | 4,442,642 | |
Royal Bank of Scotland PLC | | | NZD | | | | 40,892 | | | | USD | | | | 33,243 | | | | 10/31/14 | | | | 1,418,635 | |
UBS AG | | | GBP | | | | 2,426 | | | | USD | | | | 4,032 | | | | 10/14/14 | | | | 100,272 | |
UBS AG | | | AUD | | | | 4,231 | | | | USD | | | | 3,743 | | | | 10/24/14 | | | | 44,438 | |
| | | | | | | | | | | | | | | | | | | | | | | | |
| | | | | | | | | | | | | | | | | | | | | | $ | 59,233,715 | |
| | | | | | | | | | | | | | | | | | | | | | | | |
CENTRALLY CLEARED INTEREST RATE SWAPS (see Note D)
| | | | | | | | | | | | | | | | | | | | |
| | | | | | | | | Rate Type | | | | | | |
Clearing
Broker/ (Exchange) | | Notional
Amount (000) | | | Termination Date | | | Payments
made by the Fund | | Payments
received by the Fund | | Market Value | | | Unrealized
Appreciation/
(Depreciation) | |
Morgan Stanley & Co. LLC/(CME Group) | | $ | 193,770 | | | | 8/08/15 | | | 3 Month
LIBOR | | 0.48% | | $ | 333,427 | | | $ | 333,427 | |
Morgan Stanley & Co. LLC/(CME Group) | | | 339,200 | | | | 8/08/18 | | | 1.56% | | 3 Month
LIBOR | | | 219,396 | | | | 219,396 | |
Morgan Stanley & Co. LLC/(CME Group) | | NZD | 59,600 | | | | 4/28/19 | | | 3 Month
BKBM | | 4.57% | | | 1,042,175 | | | | 1,042,175 | |
| | | | |
| ALLIANCEBERNSTEIN GLOBAL BOND FUND • | | | 47 | |
Portfolio of Investments
| | | | | | | | | | | | | | | | | | | | |
| | | | | | | | | Rate Type | | | | | | |
Clearing Broker/ (Exchange) | | Notional
Amount (000) | | | Termination Date | | | Payments
made by the Fund | | Payments
received by the Fund | | Market Value | | | Unrealized
Appreciation/
(Depreciation) | |
Morgan Stanley & Co. LLC/(CME Group) | | $ | 145,430 | | | | 8/08/23 | | | 3 Month
LIBOR | | 2.82% | | $ | 3,849,884 | | | $ | 3,849,884 | |
Morgan Stanley & Co. LLC/(CME Group) | | | 1,130 | | | | 9/11/24 | | | 2.62% | | 3 Month
LIBOR | | | 1,073 | | | | 1,073 | |
Morgan Stanley & Co. LLC/(CME Group) | | | 678 | | | | 9/11/24 | | | 3 Month
LIBOR | | 2.62% | | | (644 | ) | | | (790 | ) |
Morgan Stanley & Co. LLC/(LCH) | | | 75,000 | | | | 12/23/23 | | | 2.99% | | 3 Month
LIBOR | | | (3,197,861 | ) | | | (3,197,861 | ) |
Morgan Stanley & Co. LLC/(LCH) | | | 38,000 | | | | 1/13/24 | | | 3.07% | | 3 Month
LIBOR | | | (1,803,544 | ) | | | (1,803,544 | ) |
| | | | | | | | | | | | | | | | | | | | |
| | | | | | | | | | | | | | $ | 443,906 | | | $ | 443,760 | |
| | | | | | | | | | | | | | | | | | | | |
CREDIT DEFAULT SWAPS (see Note D)
| | | | | | | | | | | | | | | | | | | | | | | | |
Swap Counterparty & Referenced
Obligation | | Fixed
Rate
(Pay)
Receive | | | Implied Credit Spread at
September 30,
2014 | | | Notional
Amount
(000) | | | Market
Value | | | Upfront
Premiums
Paid
(Received) | | | Unrealized
Appreciation/
(Depreciation) | |
Buy Contracts | | | | | | | | | | | | | | | | | | | | | | | | |
Citibank, NA | | | | | | | | | | | | | | | | | | | | | | | | |
Russian Federation, 7.50%, 3/31/30, 6/20/19^ | | | (1.00 | )% | | | 2.42 | % | | $ | 14,587 | | | $ | 896,547 | | | $ | 853,628 | | | $ | 42,919 | |
Goldman Sachs Bank USA: | | | | | | | | | | | | | | | | | | | | | | | | |
Russian Federation, 7.50%, 3/31/30, 6/20/19^ | | | (1.00 | ) | | | 2.42 | | | | 18,363 | | | | 1,128,604 | | | | 1,065,853 | | | | 62,751 | |
| | | | | | |
Sale Contracts | | | | | | | | | | | | | | | | | | | | | | | | |
Credit Suisse International: | | | | | | | | | | | | | | | | | | | | | | | | |
CMBX.NA.B B, 6.00%, 5/11/63^ | | | 5.00 | | | | – 0 | – | | | 6,500 | | | | (4,943 | ) | | | 85,027 | | | | (89,970 | ) |
Kohl’s Corp., 6.25%, 12/15/17, 6/20/19^ | | | 1.00 | | | | 0.92 | | | | 3,440 | | | | 8,257 | | | | (43,936 | ) | | | 52,193 | |
Kohl’s Corp., 6.25%, 12/15/17, 6/20/19^ | | | 1.00 | | | | 0.92 | | | | 2,018 | | | | 4,843 | | | | (23,120 | ) | | | 27,963 | |
| | |
| 48 | | • ALLIANCEBERNSTEIN GLOBAL BOND FUND |
Portfolio of Investments
| | | | | | | | | | | | | | | | | | | | | | | | |
Swap Counterparty
& Referenced
Obligation | | Fixed
Rate
(Pay)
Receive | | | Implied Credit Spread at
September 30,
2014 | | | Notional
Amount
(000) | | | Market
Value | | | Upfront
Premiums
Paid
(Received) | | | Unrealized
Appreciation/
(Depreciation) | |
Kohl’s Corp., 6.25%, 12/15/17, 6/20/19^ | | | 1.00 | % | | | 0.92 | % | | $ | 1,401 | | | $ | 3,364 | | | $ | (17,894 | ) | | $ | 21,258 | |
Kohl’s Corp., 6.25%, 12/15/17, 6/20/19^ | | | 1.00 | | | | 0.92 | | | | 1,391 | | | | 3,338 | | | | (17,754 | ) | | | 21,092 | |
| | | | | | | | | | | | | | | | | | | | | | | | |
| | | | | | | | | | | | | | $ | 2,040,010 | | | $ | 1,901,804 | | | $ | 138,206 | |
| | | | | | | | | | | | | | | | | | | | | | | | |
REVERSE REPURCHASE AGREEMENTS (see Note D)
| | | | | | | | | | | | | | | | | | | | |
| Broker | | Principal
Amount
(000’s) | | | Currency | | | Interest Rate | | | Maturity | | | U.S. $ Value at
September 30,
2014 | |
Barclays Capital, Inc.† | | | 4,523 | | | | USD | | | | (0.25 | )%* | | | — | | | $ | 4,520,678 | |
Barclays Capital, Inc.† | | | 4,420 | | | | USD | | | | (0.05 | )%* | | | — | | | | 4,419,748 | |
Credit Suisse Securities (USA) LLC† | | | 3,038 | | | | USD | | | | (0.50 | )%* | | | — | | | | 3,028,556 | |
HSBC Securities (USA), Inc. | | | 20,800 | | | | USD | | | | 0.15 | % | | | 10/28/14 | | | | 20,801,127 | |
JPMorgan Chase Bank, NA† | | | 500 | | | | USD | | | | (0.50 | )%* | | | — | | | | 498,681 | |
JPMorgan Chase Bank, NA† | | | 2,085 | | | | USD | | | | (0.50 | )%* | | | — | | | | 2,083,696 | |
JPMorgan Chase Bank, NA† | | | 1,836 | | | | USD | | | | (0.25 | )%* | | | — | | | | 1,835,388 | |
JPMorgan Chase Bank, NA† | | | 2,233 | | | | EUR | | | | (0.25 | )%* | | | — | | | | 2,819,348 | |
| | | | | | | | | | | | | | | | | | | | |
| | | | | | | | | | | | | | | | | | $ | 40,007,222 | |
| | | | | | | | | | | | | | | | | | | | |
| † | | The reverse repurchase agreement matures on demand. Interest rate resets daily and the rate shown is the rate in effect on September 30, 2014 |
| * | | Interest payment due from counterparty. |
| ** | | Principal amount less than 500. |
| *** | | Amount less than 0.50. |
| (a) | | Security is exempt from registration under Rule 144A of the Securities Act of 1933. These securities are considered liquid and may be resold in transactions exempt from registration, normally to qualified institutional buyers. At September 30, 2014, the aggregate market value of these securities amounted to $1,127,896,149 or 31.2% of net assets. |
| (b) | | Position, or a portion thereof, has been segregated to collateralize margin requirements for open centrally cleared swaps. |
| (c) | | Position, or a portion thereof, has been segregated to collateralize reverse repurchase agreements. |
| (d) | | Floating Rate Security. Stated interest rate was in effect at September 30, 2014. |
| (e) | | Coupon rate adjusts periodically based upon a predetermined schedule. Stated interest rate in effect at September 30, 2014. |
| (f) | | Securities are perpetual and, thus, do not have a predetermined maturity date. The date shown, if applicable, reflects the next call date. |
| (g) | | Variable rate coupon, rate shown as of September 30, 2014. |
| | | | |
| ALLIANCEBERNSTEIN GLOBAL BOND FUND • | | | 49 | |
Portfolio of Investments
| (h) | | Security is exempt from registration under Rule 144A of the Securities Act of 1933. These securities, which represent 0.04% of net assets as of September 30, 2014, are considered illiquid and restricted. |
| | | | | | | | | | | | | | | | |
| Restricted Securities | | Acquisition
Date | | | Cost | | | Market
Value | | | Percentage of
Net Assets | |
Golden Energy Offshore Services AS 8.99%, 5/28/17 | | | 5/28/14 | | | | 1,653,760 | | | | 1,552,590 | | | | 0.04 | % |
| (i) | | Fair valued by the Adviser. |
| (k) | | To obtain a copy of the fund’s financial statements, please go to the Securities and Exchange Commission’s website at www.sec.gov, or call AllianceBernstein at (800) 227-4618. |
| (l) | | Investment in affiliated money market mutual fund. The rate shown represents the 7-day yield as of period end. |
Currency Abbreviations:
AUD – Australian Dollar
CAD – Canadian Dollar
EUR – Euro
GBP – Great British Pound
IDR – Indonesian Rupiah
JPY – Japanese Yen
MXN – Mexican Peso
NOK – Norwegian Krone
NZD – New Zealand Dollar
SEK – Swedish Krona
USD – United States Dollar
ZAR – South African Rand
Glossary:
ABS – Asset-Backed Securities
BKBM – Bank Bill Benchmark (New Zealand)
CBT – Chicago Board of Trade
CMBS – Commercial Mortgage-Backed Securities
CMBX.NA – North American Commercial Mortgage-Backed Index
CME – Chicago Mercantile Exchange
GO – General Obligation
GSE – Government-Sponsored Enterprise
LCH – London Clearing House
LIBOR – London Interbank Offered Rates
OAT – Obligations Assimilables du Trésor
OSE – Osaka Securities Exchange
REIT – Real Estate Investment Trust
TBA – To Be Announced
TIPS – Treasury Inflation Protected Security
See notes to financial statements.
| | |
| 50 | | • ALLIANCEBERNSTEIN GLOBAL BOND FUND |
Portfolio of Investments
STATEMENT OF ASSETS & LIABILITIES
September 30, 2014
| | | | |
| Assets | | | | |
Investments in securities, at value | | | | |
Unaffiliated issuers (cost $3,489,861,592) | | $ | 3,541,940,045 | (a) |
Affiliated issuers (cost $161,309,354) | | | 161,309,354 | |
Due from broker | | | 6,676,220 | (b) |
Foreign currencies, at value (cost $1,422) | | | 1,409 | |
Receivable for investment securities sold | | | 146,833,587 | |
Unrealized appreciation on forward currency exchange contracts | | | 60,344,918 | |
Dividends and interest receivable | | | 31,067,229 | |
Receivable for capital stock sold | | | 11,913,833 | |
Upfront premiums paid on credit default swaps | | | 2,004,508 | |
Receivable for variation margin on exchange-traded derivatives | | | 917,930 | |
Unrealized appreciation on credit default swaps | | | 228,176 | |
| | | | |
Total assets | | | 3,963,237,209 | |
| | | | |
| Liabilities | | | | |
Payable for investment securities purchased | | | 289,045,359 | |
Payable for reverse repurchase agreements | | | 40,007,222 | |
Payable for capital stock redeemed | | | 8,783,238 | |
Cash collateral received from broker | | | 4,150,000 | |
Advisory fee payable | | | 1,379,755 | |
Unrealized depreciation on forward currency exchange contracts | | | 1,111,203 | |
Dividends payable | | | 926,328 | |
Distribution fee payable | | | 607,144 | |
Due to Custodian | | | 176,800 | |
Upfront premiums received on credit default swaps | | | 102,704 | |
Transfer Agent fee payable | | | 93,463 | |
Unrealized depreciation on credit default swaps | | | 89,970 | |
Administrative fee payable | | | 13,775 | |
Payable for newly entered interest rate swaps | | | 1,000 | |
Accrued expenses and other liabilities | | | 959,735 | |
| | | | |
Total Liabilities | | | 347,447,696 | |
| | | | |
Net Assets | | $ | 3,615,789,513 | |
| | | | |
| Composition of Net Assets | | | | |
Capital stock, at par | | $ | 424,575 | |
Additional paid-in capital | | | 3,491,800,676 | |
Undistributed net investment income | | | 26,403,717 | |
Accumulated net realized loss on investment
and foreign currency transactions | | | (16,482,187 | ) |
Net unrealized appreciation of investments
and foreign currency denominated assets and liabilities | | | 113,642,732 | |
| | | | |
| | $ | 3,615,789,513 | |
| | | | |
| (a) | | Includes investment of cash collateral of $4,150,000 received from broker for OTC derivatives outstanding at September 30, 2014. |
| (b) | | Represents amount on deposit at the broker as collateral for open derivative contracts. |
See notes to financial statements.
| | | | |
| ALLIANCEBERNSTEIN GLOBAL BOND FUND • | | | 51 | |
Statement of Assets & Liabilities
Net Asset Value Per Share—24 billion shares of capital stock authorized, $.001 par value
| | | | | | | | | | | | |
| Class | | Net Assets | | | Shares
Outstanding | | | Net Asset
Value | |
| |
| A | | $ | 1,076,697,327 | | | | 126,410,774 | | | $ | 8.52 | * |
| |
| B | | $ | 7,320,909 | | | | 859,382 | | | $ | 8.52 | |
| |
| C | | $ | 395,728,058 | | | | 46,314,632 | | | $ | 8.54 | |
| |
| Advisor | | $ | 1,504,431,635 | | | | 176,771,035 | | | $ | 8.51 | |
| |
| R | | $ | 54,550,360 | | | | 6,408,369 | | | $ | 8.51 | |
| |
| K | | $ | 19,039,479 | | | | 2,236,708 | | | $ | 8.51 | |
| |
| I | | $ | 546,549,941 | | | | 64,225,815 | | | $ | 8.51 | |
| |
| Z | | $ | 11,471,804 | | | | 1,347,824 | | | $ | 8.51 | |
| |
| * | | The maximum offering price per share for Class A shares was $8.90, which reflects a sales charge of 4.25%. |
See notes to financial statements.
| | |
| 52 | | • ALLIANCEBERNSTEIN GLOBAL BOND FUND |
Statement of Assets & Liabilities
STATEMENT OF OPERATIONS
Year Ended September 30, 2014
| | | | | | | | |
| Investment Income | | | | | | | | |
Interest (net of foreign taxes withheld of $22,975) | | $ | 116,475,509 | | | | | |
Dividends | | | | | | | | |
Unaffiliated issuers | | | 3,659,115 | | | | | |
Affiliated issuers | | | 106,956 | | | | | |
Other fee income | | | 165,625 | | | $ | 120,407,205 | |
| | | | | | | | |
| Expenses | | | | | | | | |
Advisory fee (see Note B) | | | 16,230,260 | | | | | |
Distribution fee—Class A | | | 3,670,865 | | | | | |
Distribution fee—Class B | | | 138,687 | | | | | |
Distribution fee—Class C | | | 4,244,582 | | | | | |
Distribution fee—Class R | | | 253,220 | | | | | |
Distribution fee—Class K | | | 41,029 | | | | | |
Transfer agency—Class A | | | 1,294,834 | | | | | |
Transfer agency—Class B | | | 16,485 | | | | | |
Transfer agency—Class C | | | 454,701 | | | | | |
Transfer agency—Advisor Class | | | 1,241,321 | | | | | |
Transfer agency—Class R | | | 118,860 | | | | | |
Transfer agency—Class K | | | 26,184 | | | | | |
Transfer agency—Class I | | | 247,002 | | | | | |
Transfer agency—Class Z | | | 578 | | | | | |
Custodian | | | 337,737 | | | | | |
Printing | | | 211,889 | | | | | |
Registration fees | | | 201,813 | | | | | |
Audit and tax | | | 116,081 | | | | | |
Directors’ fees | | | 58,789 | | | | | |
Legal | | | 58,379 | | | | | |
Administrative | | | 57,909 | | | | | |
Miscellaneous | | | 140,987 | | | | | |
| | | | | | | | |
Total expenses before interest expense | | | 29,162,192 | | | | | |
Interest expense | | | 55,964 | | | | | |
| | | | | | | | |
Total expenses | | | | | | | 29,218,156 | |
| | | | | | | | |
Net investment income | | | | | | | 91,189,049 | |
| | | | | | | | |
| Realized and Unrealized Gain (Loss) on Investment and Foreign Currency Transactions | | | | | | | | |
Net realized gain (loss) on: | | | | | | | | |
Investment transactions | | | | | | | 62,759,853 | |
Swaps | | | | | | | (7,522,026 | ) |
Futures | | | | | | | (32,976,851 | ) |
Options written | | | | | | | 1,151,086 | |
Foreign currency transactions | | | | | | | 19,680,879 | |
Net change in unrealized appreciation/depreciation of: | | | | | | | | |
Investments | | | | | | | (28,281,222 | ) |
Swaps | | | | | | | 630,395 | |
Futures | | | | | | | 9,584,362 | |
Options written | | | | | | | (686,865 | ) |
Foreign currency denominated assets and liabilities | | | | | | | 74,153,321 | |
| | | | | | | | |
Net gain on investment and foreign currency transactions | | | | | | | 98,492,932 | |
| | | | | | | | |
Net Increase in Net Assets from Operations | | | | | | $ | 189,681,981 | |
| | | | | | | | |
See notes to financial statements.
| | | | |
| ALLIANCEBERNSTEIN GLOBAL BOND FUND • | | | 53 | |
Statement of Operations
STATEMENT OF CHANGES IN NET ASSETS
| | | | | | | | |
| | | Year Ended
September 30,
2014 | | | Year Ended
September 30,
2013 | |
| Increase (Decrease) in Net Assets from Operations | | | | | | | | |
Net investment income | | $ | 91,189,049 | | | $ | 78,494,763 | |
Net realized gain (loss) on investment and foreign currency transactions | | | 43,092,941 | | | | (12,208,167 | ) |
Net change in unrealized appreciation/depreciation of investments and foreign currency denominated assets and liabilities | | | 55,399,991 | | | | (112,038,842 | ) |
| | | | | | | | |
Net increase (decrease) in net assets from operations | | | 189,681,981 | | | | (45,752,246 | ) |
Dividends and Distributions
to Shareholders from | | | | | | | | |
Net investment income | | | | | | | | |
Class A | | | (31,500,862 | ) | | | (34,760,445 | ) |
Class B | | | (258,911 | ) | | | (497,922 | ) |
Class C | | | (7,899,866 | ) | | | (8,844,386 | ) |
Advisor Class | | | (33,679,935 | ) | | | (26,574,959 | ) |
Class R | | | (1,134,839 | ) | | | (869,785 | ) |
Class K | | | (420,813 | ) | | | (288,622 | ) |
Class I | | | (12,165,737 | ) | | | (6,955,444 | ) |
Class Z | | | (83,595 | ) | | | – 0 | – |
Net realized gain on investment and foreign currency transactions | | | | | | | | |
Class A | | | – 0 | – | | | (15,591,322 | ) |
Class B | | | – 0 | – | | | (357,717 | ) |
Class C | | | – 0 | – | | | (5,901,970 | ) |
Advisor Class | | | – 0 | – | | | (9,610,939 | ) |
Class R | | | – 0 | – | | | (417,637 | ) |
Class K | | | – 0 | – | | | (117,245 | ) |
Class I | | | – 0 | – | | | (2,429,213 | ) |
| Capital Stock Transactions | | | | | | | | |
Net increase | | | 246,960,906 | | | | 49,742,141 | |
| Capital Contributions | | | | | | | | |
Proceeds from third party service providers (see Note E) | | | – 0 | – | | | 347,309 | |
| | | | | | | | |
Total increase (decrease) | | | 349,498,329 | | | | (108,880,402 | ) |
| Net Assets | | | | | | | | |
Beginning of period | | | 3,266,291,184 | | | | 3,375,171,586 | |
| | | | | | | | |
End of period (including undistributed net investment income of $26,403,717 and $3,224,733, respectively) | | $ | 3,615,789,513 | | | $ | 3,266,291,184 | |
| | | | | | | | |
See notes to financial statements.
| | |
| 54 | | • ALLIANCEBERNSTEIN GLOBAL BOND FUND |
Statement of Changes in Net Assets
NOTES TO FINANCIAL STATEMENTS
September 30, 2014
NOTE A
Significant Accounting Policies
AllianceBernstein Global Bond Fund, Inc. (the “Fund”), was incorporated as a Maryland corporation on February 3, 1992 and is registered under the Investment Company Act of 1940 as a non-diversified, open-end management investment company. The Fund offers Class A, Class B, Class C, Advisor Class, Class R, Class K, Class I and Class Z shares. Effective October 15, 2013, the Fund commenced offering of Class Z shares. Class A shares are sold with a front-end sales charge of up to 4.25% for purchases not exceeding $1,000,000. With respect to purchases of $1,000,000 or more, Class A shares redeemed within one year of purchase may be subject to a contingent deferred sales charge of 1%. Class B shares are currently sold with a contingent deferred sales charge which declines from 3% to zero depending on the period of time the shares are held. Effective January 31, 2009, sales of Class B shares of the Fund to new investors were suspended. Class B shares will only be issued (i) upon the exchange of Class B shares from another AllianceBernstein Mutual Fund, (ii) for purposes of dividend reinvestment, (iii) through the Fund’s Automatic Investment Program (the “Program”) for accounts that established the Program prior to January 31, 2009, and (iv) for purchases of additional shares by Class B shareholders as of January 31, 2009. The ability to establish a new Program for accounts containing Class B shares was suspended as of January 31, 2009. Class B shares will automatically convert to Class A shares six years after the end of the calendar month of purchase. Class C shares are subject to a contingent deferred sales charge of 1% on redemptions made within the first year after purchase. Class R and Class K shares are sold without an initial or contingent deferred sales charge. Advisor Class, Class I and Class Z shares are sold without an initial or contingent deferred sales charge and are not subject to ongoing distribution expense. All eight classes of shares have identical voting, dividend, liquidation and other rights, except that the classes bear different distribution and transfer agency expenses. Each class has exclusive voting rights with respect to its distribution plan. The financial statements have been prepared in conformity with U.S. generally accepted accounting principles (“U.S. GAAP”), which require management to make certain estimates and assumptions that affect the reported amounts of assets and liabilities in the financial statements and amounts of income and expenses during the reporting period. Actual results could differ from those estimates. The following is a summary of significant accounting policies followed by the Fund.
1. Security Valuation
Portfolio securities are valued at their current market value determined on the basis of market quotations or, if market quotations are not readily available or are deemed unreliable, at “fair value” as determined in accordance with procedures established by and under the general supervision of the Fund’s Board of Directors (the “Board”).
| | | | |
| ALLIANCEBERNSTEIN GLOBAL BOND FUND • | | | 55 | |
Notes to Financial Statements
In general, the market values of securities which are readily available and deemed reliable are determined as follows: securities listed on a national securities exchange (other than securities listed on the NASDAQ Stock Market, Inc. (“NASDAQ”)) or on a foreign securities exchange are valued at the last sale price at the close of the exchange or foreign securities exchange. If there has been no sale on such day, the securities are valued at last traded price from the previous day. Securities listed on more than one exchange are valued by reference to the principal exchange on which the securities are traded; securities listed only on NASDAQ are valued in accordance with the NASDAQ Official Closing Price; listed or over the counter (“OTC”) market put or call options are valued at the mid level between the current bid and ask prices. If either a current bid or current ask price is unavailable, AllianceBernstein L.P. (the “Adviser”) will have discretion to determine the best valuation (e.g. last trade price in the case of listed options); open futures are valued using the closing settlement price or, in the absence of such a price, the most recent quoted bid price. If there are no quotations available for the day of valuation, the last available closing settlement price is used; U.S. government securities and other debt instruments having 60 days or less remaining until maturity are valued at amortized cost if their original maturity was 60 days or less. If the original term to maturity exceeded 60 days, the securities are valued by a pricing service, if a market price is available. If a market price is not available, the securities are valued by using amortized cost as of the 61st day prior to maturity. Fixed-income securities, including mortgage-backed and asset-backed securities, may be valued on the basis of prices provided by a pricing service or at a price obtained from one or more of the major broker-dealers. In cases where broker-dealer quotes are obtained, the Adviser may establish procedures whereby changes in market yields or spreads are used to adjust, on a daily basis, a recently obtained quoted price on a security; swaps and other derivatives are valued daily, primarily using independent pricing services, independent pricing models using market inputs, as well as third party broker-dealers or counterparties. Investment companies are valued at their net asset value each day.
Securities for which market quotations are not readily available (including restricted securities) or are deemed unreliable are valued at fair value. Factors considered in making this determination may include, but are not limited to, information obtained by contacting the issuer, analysts, analysis of the issuer’s financial statements or other available documents. In addition, the Fund may use fair value pricing for securities primarily traded in non-U.S. markets because most foreign markets close well before the Fund values its securities at 4:00 p.m., Eastern Time. The earlier close of these foreign markets gives rise to the possibility that significant events, including broad market moves, may have occurred in the interim and may materially affect the value of those securities.
2. Fair Value Measurements
In accordance with U.S. GAAP regarding fair value measurements, fair value is defined as the price that the Fund would receive to sell an asset or pay to transfer
| | |
| 56 | | • ALLIANCEBERNSTEIN GLOBAL BOND FUND |
Notes to Financial Statements
a liability in an orderly transaction between market participants at the measurement date. U.S. GAAP establishes a framework for measuring fair value, and a three-level hierarchy for fair value measurements based upon the transparency of inputs to the valuation of an asset or liability (including those valued based on their market values as described in Note A.1 above). Inputs may be observable or unobservable and refer broadly to the assumptions that market participants would use in pricing the asset or liability. Observable inputs reflect the assumptions market participants would use in pricing the asset or liability based on market data obtained from sources independent of the Fund. Unobservable inputs reflect the Fund’s own assumptions about the assumptions that market participants would use in pricing the asset or liability based on the best information available in the circumstances. Each investment is assigned a level based upon the observability of the inputs which are significant to the overall valuation. The three-tier hierarchy of inputs is summarized below.
| | • | | Level 1—quoted prices in active markets for identical investments |
| | • | | Level 2—other significant observable inputs (including quoted prices for similar investments, interest rates, prepayment speeds, credit risk, etc.) |
| | • | | Level 3—significant unobservable inputs (including the Fund’s own assumptions in determining the fair value of investments) |
The fair value of debt instruments, such as bonds, and over-the-counter derivatives is generally based on market price quotations, recently executed market transactions (where observable) or industry recognized modeling techniques and are generally classified as Level 2. Pricing vendor inputs to Level 2 valuations may include quoted prices for similar investments in active markets, interest rate curves, coupon rates, currency rates, yield curves, option adjusted spreads, default rates, credit spreads and other unique security features in order to estimate the relevant cash flows which is then discounted to calculate fair values. If these inputs are unobservable and significant to the fair value, these investments will be classified as Level 3. In addition, non-agency rated investments are classified as Level 3.
Where readily available market prices or relevant bid prices are not available for certain equity investments, such investments may be valued based on similar publicly traded investments, movements in relevant indices since last available prices or based upon underlying company fundamentals and comparable company data (such as multiples to earnings or other multiples to equity). Where an investment is valued using an observable input, such as another publicly traded security, the investment will be classified as Level 2. If management determines that an adjustment is appropriate based on restrictions on resale, illiquidity or uncertainty, and such adjustment is a significant component of the valuation, the investment will be classified as Level 3. An investment will also be classified as Level 3 where management uses company fundamentals and other significant inputs to determine the valuation.
| | | | |
| ALLIANCEBERNSTEIN GLOBAL BOND FUND • | | | 57 | |
Notes to Financial Statements
Valuations of mortgage-backed or other asset-backed securities, by pricing vendors, are based on both proprietary and industry recognized models and discounted cash flow techniques. Significant inputs to the valuation of these instruments are value of the collateral, the rates and timing of delinquencies, the rates and timing of prepayments, and default and loss expectations, which are driven in part by housing prices for residential mortgages. Significant inputs are determined based on relative value analyses, which incorporate comparisons to instruments with similar collateral and risk profiles, including relevant indices. Mortgage and asset-backed securities for which management has collected current observable data through pricing services are generally categorized within Level 2. Those investments for which current observable data has not been provided are classified as Level 3.
Other fixed-income investments, including non-U.S. government and corporate debt, are generally valued using quoted market prices, if available, which are typically impacted by current interest rates, maturity dates and any perceived credit risk of the issuer. Additionally, in the absence of quoted market prices, these inputs are used by pricing vendors to derive a valuation based upon industry or proprietary models which incorporate issuer specific data with relevant yield/spread comparisons with more widely quoted bonds with similar key characteristics. Those investments for which there are observable inputs are classified as Level 2. Where the inputs are not observable, the investments are classified as Level 3.
Bank loan prices are provided by third party pricing services and consist of a composite of the quotes received by the vendor into a consensus price. Bank loans are classified as Level 3, as significant input used in the fair value measurement of these instruments is the market quotes that are received by the vendor and these inputs are not observable.
The following table summarizes the valuation of the Fund’s investments by the above fair value hierarchy levels as of September 30, 2014:
| | | | | | | | | | | | | | | | |
Investments in
Securities | | Level 1 | | | Level 2 | | | Level 3 | | | Total | |
Assets: | | | | | | | | | | | | | | | | |
Governments –Treasuries | | $ | – 0 | – | | $ | 1,665,247,634 | | | $ | – 0 | – | | $ | 1,665,247,634 | |
Corporates – Investment Grades | | | – 0 | – | | | 789,452,454 | | | | – 0 | – | | | 789,452,454 | |
Inflation-Linked Securities | | | – 0 | – | | | 197,999,165 | | | | – 0 | – | | | 197,999,165 | |
Corporates – Non-Investment Grades | | | – 0 | – | | | 182,697,746 | | | | 1,552,590 | | | | 184,250,336 | |
Mortgage Pass-Throughs | | | – 0 | – | | | 177,069,384 | | | | – 0 | – | | | 177,069,384 | |
Commercial Mortgage –Backed Securities | | | – 0 | – | | | 86,845,692 | | | | 26,935,766 | | | | 113,781,458 | |
Collateralized Mortgage Obligations | | | – 0 | – | | | – 0 | – | | | 113,683,569 | | | | 113,683,569 | |
Governments – Sovereign Agencies | | | – 0 | – | | | 62,329,294 | | | | – 0 | – | | | 62,329,294 | |
| | |
| 58 | | • ALLIANCEBERNSTEIN GLOBAL BOND FUND |
Notes to Financial Statements
| | | | | | | | | | | | | | | | |
Investments in
Securities | | Level 1 | | | Level 2 | | | Level 3 | | | Total | |
Covered Bonds | | $ | – 0 | – | | $ | 59,673,407 | | | $ | – 0 | – | | $ | 59,673,407 | |
Emerging Markets –Corporate Bonds | | | – 0 | – | | | 40,611,718 | | | | – 0 | – | | | 40,611,718 | |
Quasi-Sovereigns | | | – 0 | – | | | 39,392,855 | | | | – 0 | – | | | 39,392,855 | |
Local Governments –Municipal Bonds | | | – 0 | – | | | 38,724,470 | | | | – 0 | – | | | 38,724,470 | |
Preferred Stocks | | | 22,029,558 | | | | – 0 | – | | | – 0 | – | | | 22,029,558 | |
Whole Loan Trusts | | | – 0 | – | | | – 0 | – | | | 14,114,975 | | | | 14,114,975 | |
Bank Loans | | | – 0 | – | | | – 0 | – | | | 10,893,177 | | | | 10,893,177 | |
Investment Companies | | | – 0 | – | | | – 0 | – | | | 4,111,201 | | | | 4,111,201 | |
Governments – Sovereign Bonds | | | – 0 | – | | | 3,465,158 | | | | – 0 | – | | | 3,465,158 | |
Supranationals | | | – 0 | – | | | 2,027,022 | | | | – 0 | – | | | 2,027,022 | |
Asset-Backed Securities | | | – 0 | – | | | 708,455 | | | | 28,213 | | | | 736,668 | |
Agencies | | | – 0 | – | | | 538,848 | | | | – 0 | – | | | 538,848 | |
Short-Term Investments: | | | | | | | | | | | | | | | | |
Investment Companies | | | 161,309,354 | | | | – 0 | – | | | – 0 | – | | | 161,309,354 | |
Time Deposits | | | – 0 | – | | | 1,807,694 | | | | – 0 | – | | | 1,807,694 | |
| | | | | | | | | | | | | | | | |
Total Investments in Securities | | | 183,338,912 | | | | 3,348,590,996 | | | | 171,319,491 | | | | 3,703,249,399 | |
Other Financial Instruments*: | | | | | | | | | | | | | | | | |
Assets | | | | | | | | | | | | | | | | |
Credit Default Swaps | | | – 0 | – | | | 228,176 | | | | – 0 | – | | | 228,176 | |
Centrally Cleared Interest Rate Swaps | | | – 0 | – | | | 5,445,955 | | | | – 0 | – | | | 5,445,955 | † |
Futures | | | 2,501,434 | | | | – 0 | – | | | – 0 | – | | | 2,501,434 | † |
Forward Currency Exchange Contracts | | | – 0 | – | | | 60,344,918 | | | | – 0 | – | | | 60,344,918 | |
Liabilities | | | | | | | | | | | | | | | | |
Credit Default Swaps | | | – 0 | – | | | (89,970 | ) | | | – 0 | – | | | (89,970 | ) |
Centrally Cleared Interest Rate Swaps | | | – 0 | – | | | (5,002,195 | ) | | | – 0 | – | | | (5,002,195 | )† |
Futures | | | (203,316 | ) | | | – 0 | – | | | – 0 | – | | | (203,316 | )† |
Forward Currency Exchange Contracts | | | – 0 | – | | | (1,111,203 | ) | | | – 0 | – | | | (1,111,203 | ) |
| | | | | | | | | | | | | | | | |
Total^ | | $ | 185,637,030 | | | $ | 3,408,406,677 | | | $ | 171,319,491 | | | $ | 3,765,363,198 | |
| | | | | | | | | | | | | | | | |
| * | | Other financial instruments are derivative instruments, such as futures, forwards and swaps, which are valued at the unrealized appreciation/depreciation on the instrument. |
| † | | Only variation margin receivable/payable at period end is reported within the statement of assets and liabilities. This amount reflects cumulative appreciation/(depreciation) of exchange-traded derivatives as reported in the portfolio of investments. |
| ^ | | There were no transfers between Level 1 and Level 2 during the reporting period. |
| | | | |
| ALLIANCEBERNSTEIN GLOBAL BOND FUND • | | | 59 | |
Notes to Financial Statements
The Fund recognizes all transfers between levels of the fair value hierarchy assuming the financial instrument was transferred at the beginning of the reporting period.
The following is a reconciliation of investments in which significant unobservable inputs (Level 3) were used in determining fair value.
| | | | | | | | | | | | | | | | | | |
| | | | | Corporates -
Non-
Investment
Grades | | | Commercial
Mortgage-
Backed
Securities | | | Collateralized
Mortgage
Obligations | | | | |
Balance as of 9/30/13 | | | | $ | – 0 | – | | $ | 18,768,945 | | | $ | 76,335,841 | | | | | |
Accrued discounts/ (premiums) | | | | | 3 | | | | 24,352 | | | | 721,555 | | | | | |
Realized gain (loss) | | | | | – 0 | – | | | 520,277 | | | | 1,236,241 | | | | | |
Change in unrealized appreciation/depreciation | | | | | (101,170 | ) | | | 225,702 | | | | 2,585,992 | | | | | |
Purchases | | | | | 1,653,757 | | | | 16,567,761 | | | | 48,474,948 | | | | | |
Sales/Paydowns | | | | | – 0 | – | | | (9,171,271 | ) | | | (20,371,258 | ) | | | | |
Reclassification | | | | | – 0 | – | | | – 0 | – | | | – 0 | – | | | | |
Transfers into Level 3 | | | | | – 0 | – | | | – 0 | – | | | 4,700,250 | | | | | |
Transfers out of Level 3 | | | | | – 0 | – | | | – 0 | – | | | – 0 | – | | | | |
| | | | | | | | | | | | | | | | | | |
Balance as of 9/30/14 | | | | $ | 1,552,590 | | | $ | 26,935,766 | | | $ | 113,683,569 | | | | | |
| | | | | | | | | | | | | | | | | | |
Net change in unrealized appreciation/depreciation from investments held as of 9/30/14** | | | | $ | (101,170 | ) | | $ | 273,434 | | | $ | 3,180,611 | | | | | |
| | | | | | | | | | | | | | | | | | |
| | | | | |
| | | | | Preferred
Stocks | | | Whole Loan
Trusts | | | Bank Loans | | | Investment
Companies | |
Balance as of 9/30/13 | | | | $ | 18,865,368 | | | $ | – 0 | – | | $ | 17,525,196 | | | $ | – 0 | – |
Accrued discounts/ (premiums) | | | | | – 0 | – | | | (16,457 | ) | | | 35,434 | | | | – 0 | – |
Realized gain (loss) | | | | | – 0 | – | | | (9,883 | ) | | | 110,154 | | | | – 0 | – |
Change in unrealized appreciation/depreciation | | | | | – 0 | – | | | (77,432 | ) | | | (259,921 | ) | | | (96,998 | ) |
Purchases | | | | | – 0 | – | | | 15,637,368 | | | | 2,740,875 | | | | 4,208,199 | |
Sales/Paydowns | | | | | – 0 | – | | | (1,418,621 | ) | | | (9,258,561 | ) | | | – 0 | – |
Reclassification | | | | | (18,865,368 | ) | | | – 0 | – | | | – 0 | – | | | – 0 | – |
Transfers into Level 3 | | | | | – 0 | – | | | – 0 | – | | | – 0 | – | | | – 0 | – |
Transfers out of Level 3 | | | | | – 0 | – | | | – 0 | – | | | – 0 | – | | | – 0 | – |
| | | | | | | | | | | | | | | | | | |
Balance as of 9/30/14 | | | | $ | – 0 | – | | $ | 14,114,975 | | | $ | 10,893,177 | | | $ | 4,111,201 | |
| | | | | | | | | | | | | | | | | | |
Net change in unrealized appreciation/depreciation from investments held as of 9/30/14** | | | | $ | – 0 | – | | $ | (77,432 | ) | | $ | (138,935 | ) | | $ | (96,998 | ) |
| | | | | | | | | | | | | | | | | | |
| | |
| 60 | | • ALLIANCEBERNSTEIN GLOBAL BOND FUND |
Notes to Financial Statements
| | | | | | | | | | | | | | |
| | | Asset-Backed
Securities | | | Common
Stocks | | | Total | | | |
Balance as of 9/30/13 | | $ | 65,020 | | | $ | – 0 | – | | $ | 131,560,370 | | | |
Accrued discounts/ (premiums) | | | – 0 | – | | | – 0 | – | | | 764,887 | | | |
Realized gain (loss) | | | – 0 | – | | | – 0 | – | | | 1,856,789 | | | |
Change in unrealized appreciation/depreciation | | | (5 | ) | | | (765,368 | ) | | | 1,510,800 | | | |
Purchases | | | – 0 | – | | | – 0 | – | | | 89,282,908 | | | |
Sales/Paydowns | | | (36,802 | ) | | | (18,100,000 | ) | | | (58,356,513 | ) | | |
Reclassification | | | – 0 | – | | | 18,865,368 | | | | – 0 | – | | |
Transfers into Level 3 | | | – 0 | – | | | – 0 | – | | | 4,700,250 | | | |
Transfers out of Level 3 | | | – 0 | – | | | – 0 | – | | | – 0 | – | | |
| | | | | | | | | | | | | | |
Balance as of 9/30/14 | | $ | 28,213 | | | $ | – 0 | – | | $ | 171,319,491 | + | | |
| | | | | | | | | | | | | | |
Net change in unrealized appreciation/depreciation from investments held as of 9/30/14** | | $ | (5 | ) | | $ | – 0 | – | | $ | 3,039,505 | | | |
| | | | | | | | | | | | | | |
| ** | | The unrealized appreciation/depreciation is included in net change in unrealized appreciation/depreciation of investments and other financial instruments in the accompanying statement of operations. |
| + | | There were de minimis transfers under 1% of net assets during the reporting period. |
The following represents information about significant unobservable inputs related to the Fund with material categories of Level 3 investments at September 30, 2014. Securities priced by third party vendors or at cost are excluded from the following table.
Quantitative Information about Level 3 Fair Value Measurements
| | | | | | | | | | |
| | | Fair Value at
9/30/2014 | | Valuation
Technique | | Unobservable
Input | | Range/ Weighted
Average | |
Whole Loan Trusts | | $ 2,787,120 | | Projected
Cashflow | | Level Yield | |
| 12.64%/
N/A |
|
| | $ 2,100,875 | | Projected
Cashflow | | Internal Rate of Return | |
| 8.247%/
N/A |
|
The Adviser has established a Valuation Committee (the “Committee”) which is responsible for overseeing the pricing and valuation of all securities held in the Fund. The Committee operates under pricing and valuation policies and procedures established by the Adviser and approved by the Board, including pricing policies which set forth the mechanisms and processes to be employed on a daily basis to implement these policies and procedures. In particular, the pricing policies describe how to determine market quotations for securities and other instruments. The Committee’s responsibilities include: 1) fair value and liquidity determinations (and oversight of any third parties to whom any responsibility for fair value and liquidity determinations is delegated), and 2) regular monitoring of the Adviser’s
| | | | |
| ALLIANCEBERNSTEIN GLOBAL BOND FUND • | | | 61 | |
Notes to Financial Statements
pricing and valuation policies and procedures and modification or enhancement of these policies and procedures (or recommendation of the modification of these policies and procedures) as the Committee believes appropriate.
The Committee is also responsible for monitoring the implementation of the pricing policies by the Adviser’s Pricing Group (the “Pricing Group”) and a third party which performs certain pricing functions in accordance with the pricing policies. The Pricing Group is responsible for the oversight of the third party on a day-to-day basis. The Committee and the Pricing Group perform a series of activities to provide reasonable assurance of the accuracy of prices including: 1) periodic vendor due diligence meetings, review of methodologies, new developments, and process at vendors, 2) daily comparisons of security valuation versus prior day for all securities that exceeded established thresholds, and 3) daily review of unpriced, stale, and variance reports with exceptions reviewed by senior management and the Committee.
In addition, several processes outside of the pricing process are used to monitor valuation issues including: 1) performance and performance attribution reports are monitored for anomalous impacts based upon benchmark performance, and 2) portfolio managers review all portfolios for performance and analytics (which are generated using the Adviser’s prices).
3. Currency Translation
Asset and liabilities denominated in foreign currencies and commitments under forward currency exchange contracts are translated into U.S. dollars at the mean of the quoted bid and ask prices of such currencies against the U.S. dollar. Purchases and sales of portfolio securities are translated into U.S. dollars at the rates of exchange prevailing when such securities were acquired or sold. Income and expenses are translated into U.S. dollars at the rates of exchange prevailing when accrued.
Net realized gain or loss on foreign currency transactions represents foreign exchange gains and losses from sales and maturities of foreign fixed-income investments, foreign currency exchange contracts, holding of foreign currencies, currency gains or losses realized between the trade and settlement dates on foreign investment transactions, and the difference between the amounts of dividends, interest and foreign withholding taxes recorded on the Fund’s books and the U.S. dollar equivalent amounts actually received or paid. Net unrealized currency gains and losses from valuing foreign currency denominated assets and liabilities at period end exchange rates are reflected as a component of net unrealized appreciation and depreciation of foreign currency denominated assets and liabilities.
| | |
| 62 | | • ALLIANCEBERNSTEIN GLOBAL BOND FUND |
Notes to Financial Statements
4. Taxes
It is the Fund’s policy to meet the requirements of the Internal Revenue Code applicable to regulated investment companies and to distribute all of its investment company taxable income and net realized gains, if any, to shareholders. Therefore, no provisions for federal income or excise taxes are required. The Fund may be subject to taxes imposed by countries in which it invests. Such taxes are generally based on income and/or capital gains earned or repatriated. Taxes are accrued and applied to net investment income, net realized gains and net unrealized appreciation/depreciation as such income and/or gains are earned.
In accordance with U.S. GAAP requirements regarding accounting for uncertainties in income taxes, management has analyzed the Fund’s tax positions taken or expected to be taken on federal and state income tax returns for all open tax years (the current and the prior three tax years) and has concluded that no provision for income tax is required in the Fund’s financial statements.
5. Investment Income and Investment Transactions
Dividend income is recorded on the ex-dividend date or as soon as the Fund is informed of the dividend. Interest income is accrued daily. Investment transactions are accounted for on the date securities are purchased or sold. Investment gains or losses are determined on the identified cost basis. The Fund amortizes premiums and accretes discounts as adjustments to interest income.
6. Class Allocations
All income earned and expenses incurred by the Fund are borne on a pro-rata basis by each settled class of shares, based on the proportionate interest in the Fund represented by the net assets of such class, except for class specific expenses which are allocated to the respective class. Realized and unrealized gains and losses are allocated among the various share classes based on their respective net assets.
7. Dividends and Distributions
Dividends and distributions to shareholders, if any, are recorded on the ex-dividend date. Income dividends and capital gains distributions are determined in accordance with federal tax regulations and may differ from those determined in accordance with U.S. GAAP. To the extent these differences are permanent, such amounts are reclassified within the capital accounts based on their federal tax basis treatment; temporary differences do not require such reclassification.
8. Repurchase Agreements
It is the Fund’s policy that its custodian or designated sub-custodian take control of securities as collateral under repurchase agreements and to determine on a daily basis that the value of such securities is sufficient to cover the value of the repurchase agreements. If the seller defaults and the value of the collateral declines, or if bankruptcy proceedings are commenced with respect to seller of the security, realization of collateral by the Fund may be delayed or limited.
| | | | |
| ALLIANCEBERNSTEIN GLOBAL BOND FUND • | | | 63 | |
Notes to Financial Statements
NOTE B
Advisory Fee and Other Transactions with Affiliates
Under the terms of the investment advisory agreement, the Fund pays the Adviser an advisory fee at an annual rate of .50% of the first $2.5 billion, .45% of the next $2.5 billion and .40% in excess of $5 billion, of the Fund’s average daily net assets. The fee is accrued daily and paid monthly.
Pursuant to the investment advisory agreement, the Fund may reimburse the Adviser for certain legal and accounting services provided to the Fund by the Adviser. For the year ended September 30, 2014, such fee amounted to $57,909.
The Fund compensates AllianceBernstein Investor Services, Inc. (“ABIS”), a wholly-owned subsidiary of the Adviser, under a Transfer Agency Agreement for providing personnel and facilities to perform transfer agency services for the Fund. ABIS may make payments to intermediaries that provide omnibus account services, sub-accounting services and/or networking services. The compensation retained by ABIS amounted to $1,063,584 for the year ended September 30, 2014.
For the year ended September 30, 2014, there was no reduction for the expenses of Class A, Class B, Class C and Advisor Class shares under an expense offset arrangement with ABIS.
AllianceBernstein Investments, Inc. (the “Distributor”), a wholly-owned subsidiary of the Adviser, serves as the distributor of the Fund’s shares. The Distributor has advised the Fund that it has retained front-end sales charges of $22,364 from the sale of Class A shares and received $5,136, $2,517 and $23,869 in contingent deferred sales charges imposed upon redemptions by shareholders of Class A, Class B and Class C shares, respectively, for the year ended September 30, 2014.
The Fund may invest in the AllianceBernstein Fixed-Income Shares, Inc.— Government STIF Portfolio (“Government STIF Portfolio”), an open-end management investment company managed by the Adviser. The Government STIF Portfolio is offered as a cash management option to mutual funds and other institutional accounts of the Adviser, and is not available for direct purchase by members of the public. The Government STIF Portfolio pays no investment management fees but does bear its own expenses. A summary of the Fund’s transactions in shares of the Government STIF Portfolio for the year ended September 30, 2014 is as follows:
| | | | | | | | | | | | | | | | |
Market Value
September 30, 2013
(000) | | Purchases
at Cost
(000) | | | Sales
Proceeds
(000) | | | Market Value
September 30, 2014
(000) | | | Dividend
Income
(000) | |
| $ 199,507 | | $ | 1,527,901 | | | $ | 1,566,099 | | | $ | 161,309 | | | $ | 107 | |
| | |
| 64 | | • ALLIANCEBERNSTEIN GLOBAL BOND FUND |
Notes to Financial Statements
NOTE C
Distribution Services Agreement
The Fund has adopted a Distribution Services Agreement (the “Agreement”) pursuant to Rule 12b-1 under the Investment Company Act of 1940. Under the Agreement the Fund pays distribution and servicing fees to the Distributor at an annual rate of up to .30% of the Fund’s average daily net assets attributable to Class A shares, 1% of the Fund’s average daily net assets attributable to both Class B and Class C shares, .50% of the Fund’s average daily net assets attributable to Class R shares and .25% of the Fund’s average daily net assets attributable to Class K shares. For the period October 1, 2009 through July 1, 2012, with respect to Class K shares, payments to the Distributor were voluntarily limited to .10% of the average daily net assets attributable to Class K shares. There are no distribution and servicing fees on Advisor Class, Class I and Class Z shares. The fees are accrued daily and paid monthly. The Agreement provides that the Distributor will use such payments in their entirety for distribution assistance and promotional activities. Since the commencement of the Fund’s operations, the Distributor has incurred expenses in excess of the distribution costs reimbursed by the Fund in the amounts of $25,251,306, $13,556,941, $347,861 and $86,939 for Class B, Class C, Class R and Class K shares, respectively. While such costs may be recovered from the Fund in future periods so long as the Agreement is in effect, the rate of the distribution and servicing fees payable under the Agreement may not be increased without a shareholder vote. In accordance with the Agreement, there is no provision for recovery of unreimbursed distribution costs incurred by the Distributor beyond the current fiscal year for Class A shares. The Agreement also provides that the Adviser may use its own resources to finance the distribution of the Fund’s shares.
NOTE D
Investment Transactions
Purchases and sales of investment securities (excluding short-term investments) for the year ended September 30, 2014, were as follows:
| | | | | | | | |
| | | Purchases | | | Sales | |
Investment securities (excluding
U.S. government securities) | | $ | 2,509,839,414 | | | $ | 2,322,607,124 | |
U.S. government securities | | | 2,990,503,126 | | | | 3,002,623,110 | |
The cost of investments for federal income tax purposes, gross unrealized appreciation and unrealized depreciation (excluding foreign currency exchange contracts, swaps and futures) are as follows:
| | | | |
Cost | | $ | 3,652,186,675 | |
| | | | |
Gross unrealized appreciation | | $ | 107,941,405 | |
Gross unrealized depreciation | | | (56,878,681 | ) |
| | | | |
Net unrealized appreciation | | $ | 51,062,724 | |
| | | | |
| | | | |
| ALLIANCEBERNSTEIN GLOBAL BOND FUND • | | | 65 | |
Notes to Financial Statements
1. Derivative Financial Instruments
The Fund may use derivatives in an effort to earn income and enhance returns, to replace more traditional direct investments, to obtain exposure to otherwise inaccessible markets (collectively, “investment purposes”), or to hedge or adjust the risk profile of its portfolio.
The principal types of derivatives utilized by the Fund, as well as the methods in which they may be used are:
| | • | | Forward Currency Exchange Contracts |
The Fund may enter into forward currency exchange contracts in order to hedge its exposure to changes in foreign currency exchange rates on its foreign portfolio holdings, to hedge certain firm purchase and sales commitments denominated in foreign currencies and for non-hedging purposes as a means of making direct investments in foreign currencies, as described below under “Currency Transactions”.
A forward currency exchange contract is a commitment to purchase or sell a foreign currency at a future date at a negotiated forward rate. The gain or loss arising from the difference between the original contract and the closing of such contract would be included in net realized gain or loss on foreign currency transactions. Fluctuations in the value of open forward currency exchange contracts are recorded for financial reporting purposes as unrealized appreciation and/or depreciation by the Fund. Risks may arise from the potential inability of a counterparty to meet the terms of a contract and from unanticipated movements in the value of a foreign currency relative to the U.S. dollar.
During the year ended September 30, 2014, the Fund held forward currency exchange contracts for hedging and non-hedging purposes.
The Fund may buy or sell futures for investment purposes or for the purpose of hedging its portfolio against adverse effects of potential movements in the market. The Fund bears the market risk that arises from changes in the value of these instruments and the imperfect correlation between movements in the price of the futures and movements in the price of the assets, reference rates or indices which they are designed to track. Among other things, the Fund may purchase or sell futures for foreign currencies or options thereon for non-hedging purposes as a means of making direct investment in foreign currencies, as described below under “Currency Transactions”.
At the time the Fund enters into a future, the Fund deposits and maintains as collateral an initial margin with the broker, as required by the exchange on which the transaction is effected. Pursuant to the contract, the Fund agrees to receive from or pay to the broker an amount of cash equal to the
| | |
| 66 | | • ALLIANCEBERNSTEIN GLOBAL BOND FUND |
Notes to Financial Statements
daily fluctuation in the value of the contract. Such receipts or payments are known as variation margin and are recorded by the Fund as unrealized gains or losses. Risks may arise from the potential inability of a counterparty to meet the terms of the contract. The credit/counterparty risk for exchange-traded futures is generally less than privately negotiated futures, since the clearinghouse, which is the issuer or counterparty to each exchange-traded future, has robust risk mitigation standards, including the requirement to provide initial and variation margin. When the contract is closed, the Fund records a realized gain or loss equal to the difference between the value of the contract at the time it was opened and the time it was closed.
Use of long futures subjects the Fund to risk of loss in excess of the amounts shown on the statement of assets and liabilities, up to the notional value of the futures. Use of short futures subjects the Fund to unlimited risk of loss. Under some circumstances, futures exchanges may establish daily limits on the amount that the price of a future can vary from the previous day’s settlement price, which could effectively prevent liquidation of unfavorable positions.
During the year ended September 30, 2014, the Fund held futures for hedging purposes.
For hedging and investment purposes, the Fund may purchase and write (sell) put and call options on U.S. and foreign securities, including government securities, and foreign currencies that are traded on U.S. and foreign securities exchanges and over-the-counter markets. Among other things, the Fund may use options transactions for non-hedging purposes as a means of making direct investments in foreign currencies, as described below under “Currency Transactions” and may use options strategies involving the purchase and/or writing of various combinations of call and/or put options, for hedging and investment purposes.
The risk associated with purchasing an option is that the Fund pays a premium whether or not the option is exercised. Additionally, the Fund bears the risk of loss of the premium and change in market value should the counterparty not perform under the contract. Put and call options purchased are accounted for in the same manner as portfolio securities. The cost of securities acquired through the exercise of call options is increased by premiums paid. The proceeds from securities sold through the exercise of put options are decreased by the premiums paid.
When the Fund writes an option, the premium received by the Fund is recorded as a liability and is subsequently adjusted to the current market value of the option written. Premiums received from written options which expire unexercised are recorded by the Fund on the expiration date as
| | | | |
| ALLIANCEBERNSTEIN GLOBAL BOND FUND • | | | 67 | |
Notes to Financial Statements
realized gains from options written. The difference between the premium received and the amount paid on effecting a closing purchase transaction, including brokerage commissions, is also treated as a realized gain, or if the premium received is less than the amount paid for the closing purchase transaction, as a realized loss. If a call option is exercised, the premium received is added to the proceeds from the sale of the underlying security or currency in determining whether the Fund has realized a gain or loss. If a put option is exercised, the premium received reduces the cost basis of the security or currency purchased by the Fund. In writing an option, the Fund bears the market risk of an unfavorable change in the price of the security or currency underlying the written option. Exercise of an option written by the Fund could result in the Fund selling or buying a security or currency at a price different from the current market value.
The Fund may also invest in options on swaps, also called “swaptions”. A swaption is an option that gives the buyer the right, but not the obligation, to enter into a swap on a future date in exchange for paying a market-based “premium”. A receiver swaption gives the owner the right to receive the total return of a specified asset, reference rate, or index. A payer swaption gives the owner the right to pay the total return of a specified asset, reference rate, or index. Swaptions also include options that allow an existing swap to be terminated or extended by one of the counterparties.
During the year ended September 30, 2014, the Fund held purchased options for hedging purposes.
During the year ended September 30, 2014, the Fund held written options for hedging purposes.
For the year ended September 30, 2014, the Fund had the following transactions in written options:
| | | | | | | | |
| | | Number of
Contracts | | | Premiums
Received | |
Options written outstanding as of 9/30/13 | | | 376,900,000 | | | $ | 1,226,574 | |
Options written | | | 64,000,000 | | | | 170,229 | |
Options expired | | | – 0 | – | | | – 0 | – |
Options bought back | | | (440,900,000 | ) | | | (1,396,803 | ) |
Options exercised | | | – 0 | – | | | – 0 | – |
| | | | | | | | |
Options written outstanding as of 9/30/14 | | | – 0 | – | | $ | – 0 | – |
| | | | | | | | |
The Fund may enter into swaps to hedge its exposure to interest rates, credit risk, and currencies. The Fund may also enter into swaps for non-hedging purposes as a means of gaining market exposures including by making direct investments in foreign currencies, as described below under “Currency Transactions”. A swap is an agreement that obligates two parties to exchange a series of cash flows at specified intervals based upon
| | |
| 68 | | • ALLIANCEBERNSTEIN GLOBAL BOND FUND |
Notes to Financial Statements
or calculated by reference to changes in specified prices or rates for a specified amount of an underlying asset. The payment flows are usually netted against each other, with the difference being paid by one party to the other. In addition, collateral may be pledged or received by the Fund in accordance with the terms of the respective swaps to provide value and recourse to the Fund or its counterparties in the event of default, bankruptcy or insolvency by one of the parties to the swap.
Risks may arise as a result of the failure of the counterparty to the swap to comply with the terms of the swap. The loss incurred by the failure of a counterparty is generally limited to the net interim payment to be received by the Fund, and/or the termination value at the end of the contract. Therefore, the Fund considers the creditworthiness of each counterparty to a swap in evaluating potential counterparty risk. This risk is mitigated by having a netting arrangement between the Fund and the counterparty and by the posting of collateral by the counterparty to the Fund to cover the Fund’s exposure to the counterparty. Additionally, risks may arise from unanticipated movements in interest rates or in the value of the underlying securities. The Fund accrues for the interim payments on swaps on a daily basis, with the net amount recorded within unrealized appreciation/depreciation of swaps on the statement of assets and liabilities, where applicable. Once the interim payments are settled in cash, the net amount is recorded as realized gain/(loss) on swaps on the statement of operations, in addition to any realized gain/(loss) recorded upon the termination of swaps. Upfront premiums paid or received are recognized as cost or proceeds on the statement of assets and liabilities and are amortized on a straight line basis over the life of the contract. Amortized upfront premiums are included in net realized gain/(loss) from swaps on the statement of operations. Fluctuations in the value of swaps are recorded as a component of net change in unrealized appreciation/depreciation of swaps on the statement of operations.
Certain standardized swaps, including certain interest rate swaps and credit default swaps, are (or soon will be) subject to mandatory central clearing. Cleared swaps are transacted through futures commission merchants (“FCMs”) that are members of central clearinghouses, with the clearinghouse serving as central counterparty, similar to transactions in futures contracts. Centralized clearing will be required for additional categories of swaps on a phased-in basis based on requirements published by the Securities and Exchange Commission and Commodity Futures Trading Commission.
At the time the Fund enters into a centrally cleared swap, the Fund deposits and maintains as collateral an initial margin with the broker, as required by the exchange on which the transaction is effected. Such amount is shown as due from broker on the statement of assets and
| | | | |
| ALLIANCEBERNSTEIN GLOBAL BOND FUND • | | | 69 | |
Notes to Financial Statements
liabilities. Pursuant to the contract, the Fund agrees to receive from or pay to the broker an amount of cash equal to the daily fluctuation in the value of the contract.
Such receipts or payments are known as variation margin and are recorded by the Fund as unrealized gains or losses. Risks may arise from the potential inability of a counterparty to meet the terms of the contract. The credit/counterparty risk for swaps cleared through a central clearinghouse’s exchange is generally less than privately negotiated swaps, since the clearinghouse, which is the issuer or counterparty to each exchange-traded swap, has robust risk mitigation standards, including the requirement to provide initial and variation margin. When the contract is closed, the Fund records a realized gain or loss equal to the difference between the value of the contract at the time it was opened and the time it was closed.
Interest Rate Swaps:
The Fund is subject to interest rate risk exposure in the normal course of pursuing its investment objectives. Because the Fund holds fixed rate bonds, the value of these bonds may decrease if interest rates rise. To help hedge against this risk and to maintain its ability to generate income at prevailing market rates, the Fund may enter into interest rate swaps. Interest rate swaps are agreements between two parties to exchange cash flows based on a notional amount. The Fund may elect to pay a fixed rate and receive a floating rate, or, receive a fixed rate and pay a floating rate on a notional amount.
In addition, the Fund may also enter into interest rate swap transactions to preserve a return or spread on a particular investment or portion of its portfolio, or protecting against an increase in the price of securities the Fund anticipates purchasing at a later date. Interest rate swaps involve the exchange by a Fund with another party of their respective commitments to pay or receive interest (e.g., an exchange of floating rate payments for fixed rate payments) computed based on a contractually-based principal (or “notional”) amount. Interest rate swaps are entered into on a net basis (i.e., the two payment streams are netted out, with the Fund receiving or paying, as the case may be, only the net amount of the two payments).
During the year ended September 30, 2014, the Fund held interest rate swaps for hedging and non-hedging purposes.
Credit Default Swaps:
The Fund may enter into credit default swaps, including to manage its exposure to the market or certain sectors of the market, to reduce its risk exposure to defaults by corporate and sovereign issuers held by the Fund, or to create exposure to corporate or sovereign issuers to which it is not otherwise exposed. The Fund may purchase credit protection (“Buy Contract”) or provide credit protection (“Sale Contract”) on the
| | |
| 70 | | • ALLIANCEBERNSTEIN GLOBAL BOND FUND |
Notes to Financial Statements
referenced obligation of the credit default swap. During the term of the swap, the Fund receives/(pays) fixed payments from/(to) the respective counterparty, calculated at the agreed upon interest rate applied to the notional amount. If the Fund is a buyer/(seller) of protection and a credit event occurs, as defined under the terms of the swap, the Fund will either (i) receive from the seller/(pay to the buyer) of protection an amount equal to the notional amount of the swap (the “Maximum Payout Amount”) and deliver/(take delivery of) the referenced obligation or (ii) receive/(pay) a net settlement amount in the form of cash or securities equal to the notional amount of the swap less the recovery value of the referenced obligation.
In certain circumstances Maximum Payout Amounts may be partially offset by recovery values of the respective referenced obligations, upfront premium received upon entering into the agreement, or net amounts received from settlement of buy protection credit default swaps entered into by the Fund for the same reference obligation with the same counterparty. As of September 30, 2014, the Fund did not have Buy Contracts outstanding for the same referenced obligation with the same counterparty for its Sale Contracts outstanding.
Credit default swaps may involve greater risks than if the Fund had invested in the referenced obligation directly. Credit default swaps are subject to general market risk, liquidity risk, counterparty risk and credit risk. If the Fund is a buyer of protection and no credit event occurs, it will lose its investment. If the Fund is a seller of protection and a credit event occurs, the value of the referenced obligation received by the Fund coupled with the periodic payments previously received may be less than the Maximum Payout Amount it pays to the buyer, resulting in a net loss to the Fund.
Implied credit spreads over Treasuries of comparable maturity utilized in determining the market value of credit default swaps on issuers as of period end are disclosed in the consolidated portfolio of investments. The implied spreads serve as an indicator of the current status of the payment/performance risk and typically reflect the market’s assessment of the likelihood of default by the issuer on the referenced obligation. The implied credit spread of a particular reference entity reflects the cost of buying/selling protection and may include upfront payments required to be made to enter into the agreement. Widening credit spreads typically represent a deterioration of the referenced entity’s credit soundness and greater likelihood of default or other credit event occurring as defined under the terms of the agreement. A credit spread identified as “Defaulted” indicates a credit event has occurred for the referenced entity or obligation.
| | | | |
| ALLIANCEBERNSTEIN GLOBAL BOND FUND • | | | 71 | |
Notes to Financial Statements
During the year ended September 30, 2014, the Fund held credit default swaps for non-hedging purposes.
Variance Swaps:
The Fund may enter into variance swaps to hedge equity market risk or adjust exposure to the equity markets. Variance swaps are contracts in which two parties agree to exchange cash payments based on the difference between the stated level of variance and the actual variance realized on underlying asset(s) or index(es). Actual “variance” as used here is defined as the sum of the square of the returns on the reference asset(s) or index(es) (which in effect is a measure of its “volatility”) over the length of the contract term. So the parties to a variance swap can be said to exchange actual volatility for a contractually stated rate of volatility.
During the year ended September 30, 2014, the Fund held variance swaps for hedging purposes.
The Fund typically enters into International Swaps and Derivatives Association, Inc. Master Agreements (“ISDA Master Agreement”) or similar master agreements (collectively, “Master Agreements”) with its OTC derivative contract counterparties in order to, among other things, reduce its credit risk to counterparties. ISDA Master Agreements include provisions for general obligations, representations, collateral and events of default or termination. Under an ISDA Master Agreement, the Fund typically may offset with the counterparty certain derivative financial instrument’s payables and/or receivables with collateral held and/or posted and create one single net payment (close-out netting) in the event of default or termination.
Various master agreements govern the terms of certain transactions with counterparties, including transactions such as exchange-traded derivative transactions, repurchase and reverse repurchase agreements. These Master Agreements typically attempt to reduce the counterparty risk associated with such transactions by specifying credit protection mechanisms and providing standardization that improves legal certainty. Cross-termination provisions under Master Agreements typically provide that a default in connection with one transaction between the Fund and a counterparty gives the non-defaulting party the right to terminate any other transactions in place with the defaulting party to create one single net payment due to/due from the defaulting party. In the event of a default by a Master Agreements counterparty, the return of collateral with market value in excess of the Fund’s net liability, held by the defaulting party, may be delayed or denied.
The Fund’s Master Agreements may contain provisions for early termination of OTC derivative transactions in the event the net assets of the Fund decline below specific levels (“net asset contingent features”). If these levels are triggered, the Fund’s counterparty has the right to
| | |
| 72 | | • ALLIANCEBERNSTEIN GLOBAL BOND FUND |
Notes to Financial Statements
terminate such transaction and require the Fund to pay or receive a settlement amount in connection with the terminated transaction. For additional details, please refer to netting arrangements by counterparty tables below.
At September 30, 2014 the Fund had entered into the following derivatives:
| | | | | | | | | | | | |
| | | Asset Derivatives | | | Liability Derivatives | |
Derivative Type | | Statement of
Assets and
Liabilities
Location | | Fair Value | | | Statement of
Assets and
Liabilities
Location | | Fair Value | |
Interest rate contracts | | Receivable/Payable for variation margin on exchange-traded derivatives | | $ | 7,947,389 | * | | Receivable/Payable for variation margin on exchange-traded derivatives | | $ | 5,205,511 | * |
| | | | |
Foreign exchange contracts | | Unrealized appreciation on forward currency exchange contracts | | | 60,344,918 | | | Unrealized depreciation on forward currency exchange contracts | | | 1,111,203 | |
| | | | |
Credit contracts | | Unrealized appreciation on credit default swaps | | | 228,176 | | | Unrealized depreciation on credit default swaps | | | 89,970 | |
| | | | | | | | | | | | |
Total | | | | $ | 68,520,483 | | | | | $ | 6,406,684 | |
| | | | | | | | | | | | |
| * | | Only variation margin receivable/payable at period end is reported within the statement of assets and liabilities. This amount reflects cumulative appreciation/(depreciation) of exchange-traded derivatives as reported in the portfolio of investments. |
The effect of derivative instruments on the statement of operations for the year ended September 30, 2014:
| | | | | | | | | | |
Derivative Type | | Location of Gain
or (Loss) on
Derivatives | | Realized Gain
or (Loss) on
Derivatives | | | Change in
Unrealized
Appreciation or
(Depreciation) | |
Interest rate contracts | | Net realized gain/(loss) on swaps; Net change in unrealized appreciation/ depreciation of swaps | | $ | (2,244,828 | ) | | $ | 492,189 | |
| | | |
Interest rate contracts | | Net realized gain/(loss) on futures; Net change in unrealized appreciation/ depreciation of futures | | | (32,976,851 | ) | | | 9,584,362 | |
Foreign exchange contracts | | Net realized gain/(loss) on swaps; Net change in unrealized appreciation/ depreciation of swaps | | | (3,614,300 | ) | | | – 0 | – |
| | | | |
| ALLIANCEBERNSTEIN GLOBAL BOND FUND • | | | 73 | |
Notes to Financial Statements
| | | | | | | | | | |
Derivative Type | | Location of Gain
or (Loss) on
Derivatives | | Realized Gain
or (Loss) on
Derivatives | | | Change in
Unrealized
Appreciation or
(Depreciation) | |
| | | |
Foreign exchange contracts | | Net realized gain/(loss) on foreign currency transactions; Net change in unrealized appreciation/depreciation of foreign currency denominated assets and liabilities | | $ | 16,670,057 | | | $ | 74,912,081 | |
| | | |
Foreign exchange contracts | | Net realized gain/(loss) on investment transactions; Net change in unrealized appreciation/depreciation of investment transactions | | | (854,833 | ) | | | 853,385 | |
| | | |
Foreign exchange contracts | | Net realized gain/(loss) on options written; Net change in unrealized appreciation/depreciation of options written | | | 1,151,086 | | | | (686,865 | ) |
| | | |
Credit contracts | | Net realized gain/(loss) on swaps; Net change in unrealized appreciation/ depreciation of swaps | | | (1,662,898 | ) | | | 138,206 | |
| | | | | | | | | | |
Total | | | | $ | (23,532,567 | ) | | $ | 85,293,358 | |
| | | | | | | | | | |
The following table represents the volume of the Fund’s derivative transactions during the year ended September 30, 2014:
| | | | |
Centrally Cleared Credit Default Swaps: | | | | |
Average notional amount | | $ | 6,614,035 | (a) |
| |
Centrally Cleared Interest Rate Swaps: | | | | |
Average notional amount | | $ | 785,707,887 | |
| |
Credit Default Swaps: | | | | |
Average notional amount of buy contracts | | $ | 21,006,250 | (b) |
Average notional amount of sale contracts | | $ | 13,038,714 | (c) |
| |
Foreign Exchange Contracts: | | | | |
Average principal amount of buy contracts | | $ | 146,790,467 | |
Average principal amount of sale contracts | | $ | 1,642,432,869 | |
| |
Futures: | | | | |
Average original value of buy contracts | | $ | 44,561,837 | |
Average original value of sale contracts | | $ | 387,598,478 | |
| | |
| 74 | | • ALLIANCEBERNSTEIN GLOBAL BOND FUND |
Notes to Financial Statements
| | | | |
Interest Rate Swaps: | | | | |
Average notional amount | | $ | 33,147,686 | (a) |
| |
Variance Swaps: | | | | |
Average notional amount | | $ | 12,380,952 | (d) |
| |
Purchased Options Contracts: | | | | |
Average cost. | | $ | 1,007,165 | (e) |
| (a) | | Positions were open for less than one month during the year. |
| (b) | | Positions were open for eight months during the year. |
| (c) | | Positions were open for six months during the year. |
| (d) | | Positions were open for one month during the year. |
| (e) | | Positions were open for three months during the year. |
For financial reporting purposes, the Fund does not offset derivative assets and derivative liabilities that are subject to netting arrangements in the statement of assets and liabilities.
All derivatives held at period end were subject to netting arrangements. The following tables present the Fund’s derivative assets and liabilities by counterparty net of amounts available for offset under Master Agreements (“MA”) and net of the related collateral received/pledged by the Fund as of September 30, 2014:
| | | | | | | | | | | | | | | | | | | | |
Counterparty | | Derivative
Assets
Subject
to a MA | | | Derivatives
Available
for Offset | | | Cash
Collateral
Received* | | | Security
Collateral
Received* | | | Net Amount of
Derivatives
Assets | |
Exchange-Traded Derivatives: | | | | | | | | | | | | | |
Goldman Sachs & Co.** | | $ | 871,393 | | | $ | – 0 | – | | $ | – 0 | – | | $ | – 0 | – | | $ | 871,393 | |
Morgan Stanley & Co. LLC** | | | 46,537 | | | | – 0 | – | | | – 0 | – | | | – 0 | – | | | 46,537 | |
| | | | | | | | | | | | | | | | | | | | |
Total | | $ | 917,930 | | | $ | – 0 | – | | $ | – 0 | – | | $ | – 0 | – | | $ | 917,930 | |
| | | | | | | | | | | | | | | | | | | | |
OTC Derivatives: | | | | | | | | | | | | | |
Barclays Bank PLC | | $ | 31,027,891 | | | $ | (67,970 | ) | | $ | – 0 | – | | $ | – 0 | – | | $ | 30,959,921 | |
BNP Paribas SA | | | 989,067 | | | | (106,138 | ) | | | – 0 | – | | | – 0 | – | | | 882,929 | |
Brown Brothers Harriman & Co. | | | 3,469,952 | | | | – 0 | – | | | – 0 | – | | | – 0 | – | | | 3,469,952 | |
Citibank, NA | | | 1,402,231 | | | | – 0 | – | | | – 0 | – | | | (816,850 | ) | | | 585,381 | |
Credit Suisse International. | | | 9,673,441 | | | | (4,943 | ) | | | – 0 | – | | | – 0 | – | | | 9,668,498 | |
Deutsche Bank AG | | | 1,315,429 | | | | – 0 | – | | | – 0 | – | | | – 0 | – | | | 1,315,429 | |
Goldman Sachs Bank USA | | | 6,078,566 | | | | (937,095 | ) | | | (4,150,000 | ) | | | – 0 | – | | | 991,471 | |
| | | | |
| ALLIANCEBERNSTEIN GLOBAL BOND FUND • | | | 75 | |
Notes to Financial Statements
| | | | | | | | | | | | | | | | | | | | |
Counterparty | | Derivative
Assets
Subject
to a MA | | | Derivatives
Available
for Offset | | | Cash
Collateral
Received* | | | Security
Collateral
Received* | | | Net Amount of
Derivatives
Assets | |
Morgan Stanley Capital Services LLC | | $ | 2,427,307 | | | $ | – 0 | – | | $ | – 0 | – | | $ | – 0 | – | | $ | 2,427,307 | |
Royal Bank of Scotland PLC | | | 5,861,277 | | | | – 0 | – | | | – 0 | – | | | – 0 | – | | | 5,861,277 | |
UBS AG. | | | 144,710 | | | | – 0 | – | | | – 0 | – | | | – 0 | – | | | 144,710 | |
| | | | | | | | | | | | | | | | | | | | |
Total | | $ | 62,389,871 | | | $ | (1,116,146 | ) | | $ | (4,150,000 | ) | | $ | (816,850 | ) | | $ | 56,306,875 | ^ |
| | | | | | | | | | | | | | | | | | | | |
| | | | | |
Counterparty | | Derivative
Liabilities
Subject
to a MA | | | Derivatives
Available
for Offset | | | Cash
Collateral
Pledged* | | | Security
Collateral
Pledged* | | | Net Amount of
Derivatives
Liabilities | |
OTC Derivatives: | | | | | | | | | | | | | |
Barclays Bank PLC | | $ | 67,970 | | | $ | (67,970 | ) | | $ | – 0 | – | | $ | – 0 | – | | $ | – 0 | – |
BNP Paribas SA | | | 106,138 | | | | (106,138 | ) | | | – 0 | – | | | – 0 | – | | | – 0 | – |
Credit Suisse International. | | | 4,943 | | | | (4,943 | ) | | | – 0 | – | | | – 0 | – | | | – 0 | – |
Goldman Sachs Bank USA | | | 937,095 | | | | (937,095 | ) | | | – 0 | – | | | – 0 | – | | | – 0 | – |
| | | | | | | | | | | | | | | | | | | | |
Total | | $ | 1,116,146 | | | $ | (1,116,146 | ) | | $ | – 0 | – | | $ | – 0 | – | | $ | – 0 | –^ |
| | | | | | | | | | | | | | | | | | | | |
| * | | The actual collateral received/pledged may be more than the amount reported due to overcollateralization. |
| ** | | Cash and securities have been posted for initial margin requirements for exchange-traded derivatives outstanding at September 30, 2014. |
| ^ | | Net amount represents the net receivable (payable) that would be due from/to the counterparty in the event of default or termination. The net amount from OTC financial derivative instruments can only be netted across transactions governed under the same master agreement with the same counterparty. |
| | | See Note D.4 for additional disclosure of netting arrangements regarding reverse repurchase agreements. |
2. Currency Transactions
The Fund may invest in non-U.S. dollar securities on a currency hedged or unhedged basis. The Fund may seek investment opportunities by taking long or short positions in currencies through the use of currency-related derivatives, including forward currency exchange contracts, futures and options on futures, swaps, and other options. The Fund may enter into transactions for investment opportunities when it anticipates that a foreign currency will appreciate or depreciate in value but securities denominated in that currency are not held by the Fund and do not present attractive investment opportunities. Such transactions may also be used when the Adviser believes that it may be more efficient than a direct investment in a foreign currency-denominated security. The Fund
| | |
| 76 | | • ALLIANCEBERNSTEIN GLOBAL BOND FUND |
Notes to Financial Statements
may also conduct currency exchange contracts on a spot basis (i.e., for cash at the spot rate prevailing in the currency exchange market for buying or selling currencies).
3. Dollar Rolls
The Fund may enter into dollar rolls. Dollar rolls involve sales by the Fund of securities for delivery in the current month and the Fund’s simultaneously contracting to repurchase substantially similar (same type and coupon) securities on a specified future date. During the roll period, the Fund forgoes principal and interest paid on the securities. The Fund is compensated by the difference between the current sales price and the lower forward price for the future purchase (often referred to as the “drop”) as well as by the interest earned on the cash proceeds of the initial sale. Dollar rolls involve the risk that the market value of the securities the Fund is obligated to repurchase under the agreement may decline below the repurchase price. Dollar rolls are speculative techniques and may be considered to be borrowings by the Fund. During the year ended September 30, 2014, the Fund did not engage in dollar rolls.
4. Reverse Repurchase Agreements
The Fund may enter into reverse repurchase transactions (“RVP”) in accordance with the terms of a Master Repurchase Agreement (“MRA”), under which the Fund sells securities and agrees to repurchase them at a mutually agreed upon date and price. At the time the Fund enters into a reverse repurchase agreement, it will establish a segregated account with the custodian containing liquid assets having a value comparable to the repurchase price. Under the MRA and other Master Agreements, the Fund is permitted to offset payables and/or receivables with collateral held and/or posted to the counterparty and create one single net payment due to or from the Fund in the event of a default. In the event of a default by a MRA counterparty, the Fund may be considered an unsecured creditor with respect to any excess collateral (collateral with a market value in excess of the repurchase price) held by and/or posted to the counterparty, and as such the return of such excess collateral may be delayed or denied. For the year ended September 30, 2014, the average amount of reverse repurchase agreements outstanding was $53,520,479 and the daily weighted average interest rate was (0.15)%. During the period, the Fund received net interest payments from counterparties. At September 30, 2014, the Fund had reverse repurchase agreements outstanding in the amount of $40,007,222 as reported in the statement of assets and liabilities.
| | | | |
| ALLIANCEBERNSTEIN GLOBAL BOND FUND • | | | 77 | |
Notes to Financial Statements
The following table presents the Fund’s RVP liabilities by counterparty net of the related collateral pledged by the Fund as of September 30, 2014:
| | | | | | | | | | | | |
Counterparty | | RVP Liabilities
Subject to a MRA | | | Securities
Collateral
Pledged† | | | Net Amount
of RVP
Liabilities | |
Barclays Capital, Inc. | | $ | 8,940,426 | | | $ | (8,827,130 | ) | | $ | 113,296 | |
Credit Suisse Securities (USA) LLC. | | | 3,028,556 | | | | (3,028,556 | )* | | | – 0 | – |
HSBC Securities (USA) Inc. | | | 20,801,127 | | | | (20,801,127 | )* | | | – 0 | – |
JPMorgan Chase Bank, N.A | | | 7,237,113 | | | | (7,237,113 | )* | | | – 0 | – |
| | | | | | | | | | | | |
Total | | $ | 40,007,222 | | | $ | (39,893,926 | ) | | $ | 113,296 | |
| | | | | | | | | | | | |
| † | | Including accrued interest. |
| * | | The actual collateral pledged may be more than the amount reported due to overcollateralization. |
5. Loan Participations and Assignments
The Fund may invest in direct debt instruments which are interests in amounts owed to lenders or lending syndicates by corporate, governmental, or other borrowers, either in the form of participations at the time the loan is originated (“Participations”) or by buying an interest in the loan in the secondary market from a financial institution or institutional investor (“Assignments”). A loan is often administered by a bank or other financial institution (the “Lender”) that acts as agent for all holders. The agent administers the term of the loan as specified in the loan agreement. When investing in Participations, the Fund generally has no right to enforce compliance with the terms of the loan agreement with the borrower. In addition, when investing in Participations, the Fund has the right to receive payments of principal, interest and any fees to which it is entitled only from the Lender and only upon receipt of payments by the Lender from the borrower. As a result, the Fund may be subject to the credit risk of both the borrower and the Lender. When the Fund purchases Assignments from Lenders, it will typically acquire direct rights against the borrower on the loan. These loans may include participations in “bridge loans”, which are loans taken out by borrowers for a short period (typically less than six months) pending arrangement of more permanent financing through, for example, the issuance of bonds, frequently high-yield bonds issued for the purpose of acquisitions. The Fund may also participate in unfunded loan commitments, which are contractual obligations for investing in future Participations, and receive a commitment fee based on the amount of the commitment. Under these arrangements, the Fund may receive a fixed rate commitment fee and, if and to the extent the borrower borrows under the facility, the Fund may receive an additional funding fee.
Unfunded loan commitments and funded loans are marked to market daily.
| | |
| 78 | | • ALLIANCEBERNSTEIN GLOBAL BOND FUND |
Notes to Financial Statements
As of September 30, 2014, the Fund had no unfunded loan commitments outstanding.
As of September 30, 2014, the Fund had no bridge loan commitments outstanding.
During the year ended September 30, 2014, the Fund received commitment fees or additional funding fees in the amount of $165,625.
NOTE E
Capital Stock
Each class consists of 3,000,000,000 authorized shares. Transactions in capital shares for each class were as follows:
| | | | | | | | | | | | | | | | | | | | |
| | | | | | | | | | | | | | | | | | | | |
| | | Shares | | | | | Amount | | | |
| | | Year Ended
September 30,
2014 | | | Year Ended
September 30,
2013 | | | | | Year Ended
September 30,
2014 | | | Year Ended
September 30,
2013 | | | |
| | | | | | |
| Class A | | | | | | | | | | | | | | | | | | | | |
Shares sold | | | 19,974,811 | | | | 34,668,794 | | | | | $ | 167,431,456 | | | $ | 296,290,675 | | | |
| | | |
Shares issued in reinvestment of dividends and distributions | | | 2,526,509 | | | | 4,272,518 | | | | | | 21,243,470 | | | | 36,525,357 | | | |
| | | |
Shares converted from Class B | | | 1,449,169 | | | | 830,992 | | | | | | 12,140,515 | | | | 7,084,270 | | | |
| | | |
Shares redeemed | | | (60,059,169 | ) | | | (60,302,711 | ) | | | | | (504,473,449 | ) | | | (511,778,567 | ) | | |
| | | |
Net decrease | | | (36,108,680 | ) | | | (20,530,407 | ) | | | | $ | (303,658,008 | ) | | $ | (171,878,265 | ) | | |
| | | |
| | | | | | | | | | | | | | | | | | | | |
| Class B | | | | | | | | | | | | | | | | | | | | |
Shares sold | | | 44,314 | | | | 119,224 | | | | | $ | 370,970 | | | $ | 1,021,558 | | | |
| | | |
Shares issued in reinvestment of dividends and distributions | | | 24,326 | | | | 78,544 | | | | | | 203,961 | | | | 673,277 | | | |
| | | |
Shares converted to Class A | | | (1,448,797 | ) | | | (830,933 | ) | | | | | (12,140,515 | ) | | | (7,084,270 | ) | | |
| | | |
Shares redeemed | | | (542,753 | ) | | | (1,018,830 | ) | | | | | (4,529,690 | ) | | | (8,679,980 | ) | | |
| | | |
Net decrease | | | (1,922,910 | ) | | | (1,651,995 | ) | | | | $ | (16,095,274 | ) | | $ | (14,069,415 | ) | | |
| | | |
| | | | | | | | | | | | | | | | | | | | |
| Class C | | | | | | | | | | | | | | | | | | | | |
Shares sold | | | 2,894,370 | | | | 5,389,706 | | | | | $ | 24,429,363 | | | $ | 46,424,036 | | | |
| | | |
Shares issued in reinvestment of dividends and distributions | | | 708,027 | | | | 1,358,067 | | | | | | 5,969,342 | | | | 11,662,048 | | | |
| | | |
Shares redeemed | | | (14,282,682 | ) | | | (19,899,628 | ) | | | | | (119,919,946 | ) | | | (169,542,933 | ) | | |
| | | |
Net decrease | | | (10,680,285 | ) | | | (13,151,855 | ) | | | | $ | (89,521,241 | ) | | $ | (111,456,849 | ) | | |
| | | |
| | | | |
| ALLIANCEBERNSTEIN GLOBAL BOND FUND • | | | 79 | |
Notes to Financial Statements
| | | | | | | | | | | | | | | | | | | | |
| | | | | | | | | | | | | | | | | | | | |
| | | Shares | | | | | Amount | | | |
| | | Year Ended
September 30,
2014 | | | Year Ended
September 30,
2013 | | | | | Year Ended
September 30,
2014 | | | Year Ended
September 30,
2013 | | | |
| | | | | | | | | | | | | | | | | | | | |
| Advisor Class | | | | | | | | | | | | | | | | | | | | |
Shares sold | | | 92,577,552 | | | | 76,435,030 | | | | | $ | 778,950,730 | | | $ | 649,972,225 | | | |
| | | |
Shares issued in reinvestment of dividends and distributions | | | 2,657,028 | | | | 3,194,715 | | | | | | 22,354,422 | | | | 27,249,660 | | | |
| | | |
Shares redeemed | | | (49,069,118 | ) | | | (53,459,031 | ) | | | | | (409,973,479 | ) | | | (451,037,530 | ) | | |
| | | |
Net increase | | | 46,165,462 | | | | 26,170,714 | | | | | $ | 391,331,673 | | | $ | 226,184,355 | | | |
| | | |
| | | | | | | | | | | | | | | | | | | | |
| Class R | | | | | | | | | | | | | | | | | | | | |
Shares sold | | | 2,205,181 | | | | 2,582,042 | | | | | $ | 18,474,763 | | | $ | 22,098,892 | | | |
| | | |
Shares issued in reinvestment of dividends and distributions | | | 134,747 | | | | 152,771 | | | | | | 1,132,889 | | | | 1,303,803 | | | |
| | | |
Shares redeemed | | | (1,568,432 | ) | | | (1,552,157 | ) | | | | | (13,122,446 | ) | | | (13,218,851 | ) | | |
| | | |
Net increase | | | 771,496 | | | | 1,182,656 | | | | | $ | 6,485,206 | | | $ | 10,183,844 | | | |
| | | |
| | | | | | | | | | | | | | | | | | | | |
| Class K | | | | | | | | | | | | | | | | | | | | |
Shares sold | | | 941,970 | | | | 795,160 | | | | | $ | 7,898,585 | | | $ | 6,794,826 | | | |
| | | |
Shares issued in reinvestment of dividends and distributions | | | 49,693 | | | | 47,572 | | | | | | 418,223 | | | | 405,737 | | | |
| | | |
Shares redeemed | | | (433,637 | ) | | | (316,648 | ) | | | | | (3,639,049 | ) | | | (2,688,167 | ) | | |
| | | |
Net increase | | | 558,026 | | | | 526,084 | | | | | $ | 4,677,759 | | | $ | 4,512,396 | | | |
| | | |
| | | | | | | | | | | | | | | | | | | | |
| Class I | | | | | | | | | | | | | | | | | | | | |
Shares sold | | | 36,717,642 | | | | 14,586,382 | | | | | $ | 308,156,066 | | | $ | 125,228,480 | | | |
| | | |
Shares issued in reinvestment of dividends and distributions | | | 1,407,528 | | | | 1,112,884 | | | | | | 11,857,715 | | | | 9,486,644 | | | |
| | | |
Shares redeemed | | | (9,239,760 | ) | | | (3,329,735 | ) | | | | | (77,704,219 | ) | | | (28,449,049 | ) | | |
| | | |
Net increase | | | 28,885,410 | | | | 12,369,531 | | | | | $ | 242,309,562 | | | $ | 106,266,075 | | | |
| | | |
| | | | | | | | | | | | | | | | | | | | |
| Class Z* | | | | | | | | | | | | | | | | | | | | |
Shares sold | | | 1,533,895 | | | | | | | | | $ | 13,012,770 | | | | | | | |
| | | |
Shares issued in reinvestment of dividends | | | 9,782 | | | | | | | | | | 83,291 | | | | | | | |
| | | |
Shares redeemed | | | (195,853 | ) | | | | | | | | | (1,664,832 | ) | | | | | | |
| | | |
Net increase | | | 1,347,824 | | | | | | | | | $ | 11,431,229 | | | | | | | |
| | | |
| * | | Commenced distributions on October 15, 2013. |
| | |
| 80 | | • ALLIANCEBERNSTEIN GLOBAL BOND FUND |
Notes to Financial Statements
For the year ended September 30, 2013, third party vendors reimbursed the Fund $347,309 for losses incurred due to a trade entry error. This amount is presented in the Fund’s statement of changes in net assets.
NOTE F
Risks Involved in Investing in the Fund
Interest Rate Risk and Credit Risk—Interest rate risk is the risk that changes in interest rates will affect the value of the Fund’s investments in fixed-income debt securities such as bonds or notes. Increases in interest rates may cause the value of the Fund’s investments to decline. Credit risk is the risk that the issuer or guarantor of a debt security, or the counterparty to a derivative contract, will be unable or unwilling to make timely principal and/or interest payments, or to otherwise honor its obligations. The degree of risk for a particular security may be reflected in its credit rating. Credit risk is greater for medium quality and lower-rated securities. Lower-rated debt securities and similar unrated securities (commonly known as “junk bonds”) have speculative elements or are predominantly speculative risks.
Duration Risk—Duration is a measure that relates the expected price volatility of a fixed-income security to changes in interest rates. The duration of a fixed-income security may be shorter than or equal to full maturity of a fixed-income security. Fixed-income securities with longer durations have more risk and will decrease in price as interest rates rise. For example, a fixed-income security with a duration of three years will decrease in value by approximately 3% if interest rates increase by 1%.
Foreign Securities Risk—Investing in securities of foreign companies or foreign governments involves special risks which include changes in foreign currency exchange rates and the possibility of future political and economic developments which could adversely affect the value of such securities. Moreover, securities of many foreign companies or foreign governments and their markets may be less liquid and their prices more volatile than those of comparable U.S. companies and the U.S. government.
Emerging Market Risk—Investments in emerging market countries may have more risk because the markets are less developed and less liquid as well as being subject to increased economic, political, regulatory or other uncertainties.
Inflation Risk—This is the risk that the value of assets or income from investments will be less in the future as inflation decreases the value of money. As inflation increases, the value of the Fund’s assets can decline as can the value of the Fund’s distributions. This risk is significantly greater if the Fund invests a significant portion of its assets in fixed-income securities with longer maturities.
Diversification Risk—The Fund may have more risk because it is “non-diversified”, meaning that it can invest more of its assets in a smaller number of
| | | | |
| ALLIANCEBERNSTEIN GLOBAL BOND FUND • | | | 81 | |
Notes to Financial Statements
issuers and that adverse changes in the value of one security could have a more significant effect on the Fund’s NAV.
Currency Risk—This is the risk that changes in foreign currency exchange rates may negatively affect the value of the Fund’s investments or reduce the returns of the Fund. For example, the value of the Fund’s investments in foreign currency-denominated securities or currencies may decrease if the U.S. dollar is strong (i.e., gaining value relative to other currencies) and other currencies are weak (i.e., losing value relative to the U.S. dollar). Currency markets are generally not as regulated as securities markets. Independent of the Fund’s investments in securities denominated in foreign currencies, the Fund’s positions in various foreign currencies may cause the Fund to experience investment losses due to the changes in exchange rates and interest rates.
Derivatives Risk—The Fund may enter into derivative transactions such as forwards, options, futures and swaps. Derivatives may be illiquid, difficult to price, and leveraged so that small changes may produce disproportionate losses for the Fund, and subject to counterparty risk to a greater degree than more traditional investments. Derivatives may result in significant losses, including losses that are far greater than the value of the derivatives reflected on the statement of assets and liabilities.
Leverage Risk—When the Fund borrows money or otherwise leverages its investments, its performance may be volatile because leverage tends to exaggerate the effect of any increase or decrease in the value of the Fund’s investments. The Fund may create leverage through the use of reverse repurchase arrangements, forward currency exchange contracts, forward commitments, dollar rolls or futures or by borrowing money. The use of derivative instruments by the Fund, such as forwards, futures, options and swaps, may also result in a form of leverage. Leverage may result in higher returns to the Fund than if the Fund were not leveraged, but may also adversely affect returns, particularly if the market is declining.
Indemnification Risk—In the ordinary course of business, the Fund enters into contracts that contain a variety of indemnifications. The Fund’s maximum exposure under these arrangements is unknown. However, the Fund has not had prior claims or losses pursuant to these indemnification provisions and expects the risk of loss thereunder to be remote. Therefore, the Fund has not accrued any liability in connection with these indemnification provisions.
NOTE G
Joint Credit Facility
A number of open-end mutual funds managed by the Adviser, including the Fund, participate in a $280 million revolving credit facility (the “Facility”) intended to provide short-term financing if necessary, subject to certain restrictions in connection with abnormal redemption activity. Commitment fees
| | |
| 82 | | • ALLIANCEBERNSTEIN GLOBAL BOND FUND |
Notes to Financial Statements
related to the Facility are paid by the participating funds and are included in miscellaneous expenses in the statement of operations. The Fund did not utilize the Facility during the year ended September 30, 2014.
NOTE H
Distributions to Shareholders
The tax character of distributions paid during the fiscal years ended September 30, 2014 and September 30, 2013 were as follows:
| | | | | | | | |
| | | 2014 | | | 2013 | |
Distributions paid from: | | | | | | | | |
Ordinary income | | $ | 87,144,558 | | | $ | 78,953,070 | |
Long-term capital gains | | | – 0 | – | | | 34,264,536 | |
| | | | | | | | |
Total distributions paid | | $ | 87,144,558 | | | $ | 113,217,606 | |
| | | | | | | | |
As of September, 30, 2014, the components of accumulated earnings/(deficit) on a tax basis were as follows:
| | | | |
Undistributed ordinary income | | $ | 97,721,983 | |
Undistributed long-term capital gains | | | 2,265,129 | |
Accumulated capital and other losses | | | (26,870,163 | )(a) |
Unrealized appreciation/(depreciation) | | | 51,373,641 | (b) |
| | | | |
Total accumulated earnings/(deficit) | | $ | 124,490,590 | (c) |
| | | | |
| (a) | | During the fiscal year ended September 30, 2014, the Fund utilized $45,837,818 of capital loss carryforwards to offset current year net realized gains. As of September 30, 2014, the cumulative deferred loss on straddles was $26,870,163. |
| (b) | | The differences between book-basis and tax-basis unrealized appreciation/(depreciation) are attributable primarily to the tax deferral of losses on wash sales, the tax treatment of swaps and Treasury inflation-protected securities, the realization for tax purposes of gains/losses on certain derivative instruments, and the tax treatment of partnership investments. |
| (c) | | The difference between book-basis and tax-basis components of accumulated earnings/(deficit) is attributable primarily to dividends payable. |
For tax purposes, net capital losses may be carried over to offset future capital gains, if any. Funds are permitted to carry forward capital losses incurred in taxable years beginning after December 22, 2010 for an indefinite period, and such losses will retain their character as either short-term or long-term capital losses. As of September 30, 2014, the Fund did not have any net capital loss carryforwards.
During the current fiscal year, permanent differences primarily due to the tax treatment of swaps, reclassifications of foreign currency, paydown gain/loss, and the tax treatment of consent fees and clearing fees resulted in a net increase in undistributed net investment income and a net decrease in accumulated net realized gain on investment and foreign currency transactions. These reclassifications had no effect on net assets.
| | | | |
| ALLIANCEBERNSTEIN GLOBAL BOND FUND • | | | 83 | |
Notes to Financial Statements
NOTE I
Subsequent Events
Management has evaluated subsequent events for possible recognition or disclosure in the financial statements through the date the financial statements are issued. Management has determined that there are no material events that would require disclosure in the Fund’s financial statements through this date.
| | |
| 84 | | • ALLIANCEBERNSTEIN GLOBAL BOND FUND |
Notes to Financial Statements
FINANCIAL HIGHLIGHTS
Selected Data For A Share Of Capital Stock Outstanding Throughout Each Period
| | | | | | | | | | | | | | | | | | | | |
| | | Class A | |
| | | Year Ended September 30, | |
| | | 2014 | | | 2013 | | | 2012 | | | 2011 | | | 2010 | |
| | | | |
| | | | | | | | | | | | | | | | | | | | |
Net asset value, beginning of period | | | $ 8.26 | | | | $ 8.64 | | | | $ 8.38 | | | | $ 8.50 | | | | $ 7.87 | |
| | | | |
Income From Investment Operations | | | | | | | | | | | | | | | | | | | | |
Net investment income(a) | | | .23 | | | | .19 | | | | .22 | (b) | | | .32 | (b) | | | .32 | (b) |
Net realized and unrealized gain (loss) on investment and foreign currency transactions | | | .25 | | | | (.29 | ) | | | .37 | | | | (.12 | ) | | | .63 | |
Contributions from Adviser | | | – 0 | – | | | – 0 | – | | | .00 | (c) | | | – 0 | – | | | – 0 | – |
| | | | |
Net increase (decrease) in net asset value from operations | | | .48 | | | | (.10 | ) | | | .59 | | | | .20 | | | | .95 | |
| | | | |
Less: Dividends and Distributions | | | | | | | | | | | | | | | | | | | | |
Dividends from net investment income | | | (.22 | ) | | | (.19 | ) | | | (.33 | ) | | | (.32 | ) | | | (.32 | ) |
Distributions from net realized gain on investment and foreign currency transactions | | | – 0 | – | | | (.09 | ) | | | – 0 | – | | | – 0 | – | | | – 0 | – |
| | | | |
Total dividends and distributions | | | (.22 | ) | | | (.28 | ) | | | (.33 | ) | | | (.32 | ) | | | (.32 | ) |
| | | | |
Net asset value, end of period | | | $ 8.52 | | | | $ 8.26 | | | | $ 8.64 | | | | $ 8.38 | | | | $ 8.50 | |
| | | | |
Total Return | | | | | | | | | | | | | | | | | | | | |
Total investment return based on net asset value(d) | | | 5.82 | % | | | (1.21 | )%* | | | 7.19 | % | | | 2.37 | % | | | 12.38 | % |
Ratios/Supplemental Data | | | | | | | | | | | | | | | | | | | | |
Net assets, end of period (000’s omitted) | | | $1,076,697 | | | | $1,341,874 | | | | $1,581,096 | | | | $1,624,399 | | | | $1,744,323 | |
Ratio to average net assets of: | | | | | | | | | | | | | | | | | | | | |
Expenses, net of waivers/reimbursements(e) | | | .93 | % | | | .94 | % | | | .92 | % | | | .91 | % | | | .98 | %(f) |
Expenses, before waivers/reimbursements(e) | | | .93 | % | | | .94 | % | | | .93 | % | | | .95 | % | | | 1.02 | %(f) |
Net investment income | | | 2.69 | % | | | 2.28 | % | | | 2.55 | %(b) | | | 3.80 | %(b) | | | 3.98 | %(b)(f) |
Portfolio turnover rate | | | 157 | % | | | 179 | % | | | 94 | % | | | 65 | % | | | 69 | % |
See footnote summary on page 93.
| | | | |
| ALLIANCEBERNSTEIN GLOBAL BOND FUND • | | | 85 | |
Financial Highlights
Selected Data For A Share Of Capital Stock Outstanding Throughout Each Period
| | | | | | | | | | | | | | | | | | | | |
| | | Class B | |
| | | Year Ended September 30, | |
| | | 2014 | | | 2013 | | | 2012 | | | 2011 | | | 2010 | |
| | | | |
| | | | | | | | | | | | | | | | | | | | |
Net asset value, beginning of period | | | $ 8.26 | | | | $ 8.64 | | | | $ 8.38 | | | | $ 8.51 | | | | $ 7.88 | |
| | | | |
Income From Investment Operations | | | | | | | | | | | | | | | | | | | | |
Net investment income(a) | | | .16 | | | | .14 | | | | .15 | (b) | | | .26 | (b) | | | .27 | (b) |
Net realized and unrealized gain (loss) on investment and foreign currency transactions | | | .26 | | | | (.30 | ) | | | .37 | | | | (.13 | ) | | | .63 | |
Contributions from Adviser | | | – 0 | – | | | – 0 | – | | | .00 | (c) | | | – 0 | – | | | – 0 | – |
| | | | |
Net increase (decrease) in net asset value from operations | | | .42 | | | | (.16 | ) | | | .52 | | | | .13 | | | | .90 | |
| | | | |
Less: Dividends and Distributions | | | | | | | | | | | | | | | | | | | | |
Dividends from net investment income | | | (.16 | ) | | | (.13 | ) | | | (.26 | ) | | | (.26 | ) | | | (.27 | ) |
Distributions from net realized gain on investment and foreign currency transactions | | | – 0 | – | | | (.09 | ) | | | – 0 | – | | | – 0 | – | | | – 0 | – |
| | | | |
Total dividends and distributions | | | (.16 | ) | | | (.22 | ) | | | (.26 | ) | | | (.26 | ) | | | (.27 | ) |
| | | | |
Net asset value, end of period | | | $ 8.52 | | | | $ 8.26 | | | | $ 8.64 | | | | $ 8.38 | | | | $ 8.51 | |
| | | | |
Total Return | | | | | | | | | | | | | | | | | | | | |
Total investment return based on net asset value(d) | | | 5.08 | % | | | (1.91 | )%* | | | 6.39 | % | | | 1.55 | % | | | 11.60 | % |
Ratios/Supplemental Data | | | | | | | | | | | | | | | | | | | | |
Net assets, end of period (000’s omitted) | | | $7,321 | | | | $22,978 | | | | $38,310 | | | | $54,784 | | | | $80,989 | |
Ratio to average net assets of: | | | | | | | | | | | | | | | | | | | | |
Expenses, net of waivers/reimbursements(e) | | | 1.64 | % | | | 1.65 | % | | | 1.64 | % | | | 1.61 | % | | | 1.68 | %(f) |
Expenses, before waivers/reimbursements(e) | | | 1.64 | % | | | 1.65 | % | | | 1.67 | % | | | 1.68 | % | | | 1.76 | %(f) |
Net investment income | | | 1.97 | % | | | 1.59 | % | | | 1.82 | %(b) | | | 3.11 | %(b) | | | 3.34 | %(b)(f) |
Portfolio turnover rate | | | 157 | % | | | 179 | % | | | 94 | % | | | 65 | % | | | 69 | % |
See footnote summary on page 93.
| | |
| 86 | | • ALLIANCEBERNSTEIN GLOBAL BOND FUND |
Financial Highlights
Selected Data For A Share Of Capital Stock Outstanding Throughout Each Period
| | | | | | | | | | | | | | | | | | | | |
| | | Class C | |
| | | Year Ended September 30, | |
| | | 2014 | | | 2013 | | | 2012 | | | 2011 | | | 2010 | |
| | | | |
| | | | | | | | | | | | | | | | | | | | |
Net asset value, beginning of period | | | $ 8.28 | | | | $ 8.66 | | | | $ 8.40 | | | | $ 8.53 | | | | $ 7.90 | |
| | | | |
Income From Investment Operations | | | | | | | | | | | | | | | | | | | | |
Net investment income(a) | | | .17 | | | | .14 | | | | .16 | (b) | | | .26 | (b) | | | .27 | (b) |
Net realized and unrealized gain (loss) on investment and foreign currency transactions | | | .25 | | | | (.30 | ) | | | .37 | | | | (.13 | ) | | | .63 | |
Contributions from Adviser | | | – 0 | – | | | – 0 | – | | | .00 | (c) | | | – 0 | – | | | – 0 | – |
| | | | |
Net increase (decrease) in net asset value from operations | | | .42 | | | | (.16 | ) | | | .53 | | | | .13 | | | | .90 | |
| | | | |
Less: Dividends and Distributions | | | | | | | | | | | | | | | | | | | | |
Dividends from net investment income | | | (.16 | ) | | | (.13 | ) | | | (.27 | ) | | | (.26 | ) | | | (.27 | ) |
Distributions from net realized gain on investment and foreign currency transactions | | | – 0 | – | | | (.09 | ) | | | – 0 | – | | | – 0 | – | | | – 0 | – |
| | | | |
Total dividends and distributions | | | (.16 | ) | | | (.22 | ) | | | (.27 | ) | | | (.26 | ) | | | (.27 | ) |
| | | | |
Net asset value, end of period | | | $ 8.54 | | | | $ 8.28 | | | | $ 8.66 | | | | $ 8.40 | | | | $ 8.53 | |
| | | | |
Total Return | | | | | | | | | | | | | | | | | | | | |
Total investment return based on net asset value(d) | | | 5.07 | % | | | (1.90 | )%* | | | 6.42 | % | | | 1.53 | % | | | 11.55 | % |
Ratios/Supplemental Data | | | | | | | | | | | | | | | | | | | | |
Net assets, end of period (000’s omitted) | | | $395,728 | | | | $472,068 | | | | $607,783 | | | | $616,000 | | | | $684,415 | |
Ratio to average net assets of: | | | | | | | | | | | | | | | | | | | | |
Expenses, net of waivers/reimbursements(e) | | | 1.63 | % | | | 1.64 | % | | | 1.63 | % | | | 1.61 | % | | | 1.67 | %(f) |
Expenses, before waivers/reimbursements(e) | | | 1.63 | % | | | 1.64 | % | | | 1.64 | % | | | 1.65 | % | | | 1.73 | %(f) |
Net investment income | | | 1.98 | % | | | 1.58 | % | | | 1.83 | %(b) | | | 3.09 | %(b) | | | 3.26 | %(b)(f) |
Portfolio turnover rate | | | 157 | % | | | 179 | % | | | 94 | % | | | 65 | % | | | 69 | % |
See footnote summary on page 93.
| | | | |
| ALLIANCEBERNSTEIN GLOBAL BOND FUND • | | | 87 | |
Financial Highlights
Selected Data For A Share Of Capital Stock Outstanding Throughout Each Period
| | | | | | | | | | | | | | | | | | | | |
| | | Advisor Class | |
| | | Year Ended September 30, | |
| | | 2014 | | | 2013 | | | 2012 | | | 2011 | | | 2010 | |
| | | | |
| | | | | | | | | | | | | | | | | | | | |
Net asset value, beginning of period | | | $ 8.25 | | | | $ 8.63 | | | | $ 8.37 | | | | $ 8.50 | | | | $ 7.87 | |
| | | | |
Income From Investment Operations | | | | | | | | | | | | | | | | | | | | |
Net investment income(a) | | | .25 | | | | .22 | | | | .24 | (b) | | | .34 | (b) | | | .34 | (b) |
Net realized and unrealized gain (loss) on investment and foreign currency transactions | | | .25 | | | | (.29 | ) | | | .37 | | | | (.13 | ) | | | .64 | |
Contributions from Adviser | | | – 0 | – | | | – 0 | – | | | .00 | (c) | | | – 0 | – | | | – 0 | – |
| | | | |
Net increase (decrease) in net asset value from operations | | | .50 | | | | (.07 | ) | | | .61 | | | | .21 | | | | .98 | |
| | | | |
Less: Dividends and Distributions | | | | | | | | | | | | | | | | | | | | |
Dividends from net investment income | | | (.24 | ) | | | (.22 | ) | | | (.35 | ) | | | (.34 | ) | | | (.35 | ) |
Distributions from net realized gain on investment and foreign currency transactions | | | – 0 | – | | | (.09 | ) | | | – 0 | – | | | – 0 | – | | | – 0 | – |
| | | | |
Total dividends and distributions | | | (.24 | ) | | | (.31 | ) | | | (.35 | ) | | | (.34 | ) | | | (.35 | ) |
| | | | |
Net asset value, end of period | | | $ 8.51 | | | | $ 8.25 | | | | $ 8.63 | | | | $ 8.37 | | | | $ 8.50 | |
| | | | |
Total Return | | | | | | | | | | | | | | | | | | | | |
Total investment return based on net asset value(d) | | | 6.14 | % | | | (0.92 | )%* | | | 7.51 | % | | | 2.55 | % | | | 12.71 | % |
Ratios/Supplemental Data | | | | | | | | | | | | | | | | | | | | |
Net assets, end of period (000’s omitted) | | | $1,504,432 | | | | $1,077,452 | | | | $901,342 | | | | $651,336 | | | | $457,794 | |
Ratio to average net assets of: | | | | | | | | | | | | | | | | | | | | |
Expenses, net of waivers/reimbursements(e) | | | .63 | % | | | .64 | % | | | .63 | % | | | .61 | % | | | .66 | %(f) |
Expenses, before waivers/reimbursements(e) | | | .63 | % | | | .64 | % | | | .64 | % | | | .65 | % | | | .72 | %(f) |
Net investment income | | | 2.98 | % | | | 2.57 | % | | | 2.86 | %(b) | | | 4.08 | %(b) | | | 4.21 | %(b)(f) |
Portfolio turnover rate | | | 157 | % | | | 179 | % | | | 94 | % | | | 65 | % | | | 69 | % |
See footnote summary on page 93.
| | |
| 88 | | • ALLIANCEBERNSTEIN GLOBAL BOND FUND |
Financial Highlights
Selected Data For A Share Of Capital Stock Outstanding Throughout Each Period
| | | | | | | | | | | | | | | | | | | | |
| | | Class R | |
| | | Year Ended September 30, | |
| | | 2014 | | | 2013 | | | 2012 | | | 2011 | | | 2010 | |
| | | | |
| | | | | | | | | | | | | | | | | | | | |
Net asset value, beginning of period | | | $ 8.25 | | | | $ 8.63 | | | | $ 8.37 | | | | $ 8.50 | | | | $ 7.87 | |
| | | | |
Income From Investment Operations | | | | | | | | | | | | | | | | | | | | |
Net investment income(a) | | | .20 | | | | .16 | | | | .19 | (b) | | | .30 | (b) | | | .30 | (b) |
Net realized and unrealized gain (loss) on investment and foreign currency transactions | | | .25 | | | | (.29 | ) | | | .37 | | | | (.13 | ) | | | .64 | |
Contributions from Adviser | | | – 0 | – | | | – 0 | – | | | .00 | (c) | | | – 0 | – | | | – 0 | – |
| | | | |
Net increase (decrease) in net asset value from operations | | | .45 | | | | (.13 | ) | | | .56 | | | | .17 | | | | .94 | |
| | | | |
Less: Dividends and Distributions | | | | | | | | | | | | | | | | | | | | |
Dividends from net investment income | | | (.19 | ) | | | (.16 | ) | | | (.30 | ) | | | (.30 | ) | | | (.31 | ) |
Distributions from net realized gain on investment and foreign currency transactions | | | – 0 | – | | | (.09 | ) | | | – 0 | – | | | – 0 | – | | | – 0 | – |
| | | | |
Total dividends and distributions | | | (.19 | ) | | | (.25 | ) | | | (.30 | ) | | | (.30 | ) | | | (.31 | ) |
| | | | |
Net asset value, end of period | | | $ 8.51 | | | | $ 8.25 | | | | $ 8.63 | | | | $ 8.37 | | | | $ 8.50 | |
| | | | |
Total Return | | | | | | | | | | | | | | | | | | | | |
Total investment return based on net asset value(d) | | | 5.48 | % | | | (1.56 | )%* | | | 6.82 | % | | | 2.05 | % | | | 12.15 | % |
Ratios/Supplemental Data | | | | | | | | | | | | | | | | | | | | |
Net assets, end of period (000’s omitted) | | | $54,550 | | | | $46,514 | | | | $38,450 | | | | $23,205 | | | | $11,857 | |
Ratio to average net assets of: | | | | | | | | | | | | | | | | | | | | |
Expenses, net of waivers/reimbursements(e) | | | 1.26 | % | | | 1.29 | % | | | 1.23 | % | | | 1.11 | % | | | 1.15 | %(f) |
Expenses, before waivers/reimbursements(e) | | | 1.26 | % | | | 1.29 | % | | | 1.28 | % | | | 1.29 | % | | | 1.35 | %(f) |
Net investment income | | | 2.36 | % | | | 1.93 | % | | | 2.26 | %(b) | | | 3.60 | %(b) | | | 3.66 | %(b)(f) |
Portfolio turnover rate | | | 157 | % | | | 179 | % | | | 94 | % | | | 65 | % | | | 69 | % |
See footnote summary on page 93.
| | | | |
| ALLIANCEBERNSTEIN GLOBAL BOND FUND • | | | 89 | |
Financial Highlights
Selected Data For A Share Of Capital Stock Outstanding Throughout Each Period
| | | | | | | | | | | | | | | | | | | | |
| | | Class K | |
| | | Year Ended September 30, | |
| | | 2014 | | | 2013 | | | 2012 | | | 2011 | | | 2010 | |
| | | | |
| | | | | | | | | | | | | | | | | | | | |
Net asset value, beginning of period | | | $ 8.25 | | | | $ 8.63 | | | | $ 8.37 | | | | $ 8.50 | | | | $ 7.87 | |
| | | | |
Income From Investment Operations | | | | | | | | | | | | | | | | | | | | |
Net investment income(a) | | | .23 | | | | .19 | | | | .23 | (g) | | | .33 | (b) | | | .32 | (b) |
Net realized and unrealized gain (loss) on investment and foreign currency transactions | | | .25 | | | | (.29 | ) | | | .37 | | | | (.14 | ) | | | .64 | |
Contributions from Adviser | | | – 0 | – | | | – 0 | – | | | .00 | (c) | | | – 0 | – | | | – 0 | – |
| | | | |
Net increase (decrease) in net asset value from operations | | | .48 | | | | (.10 | ) | | | .60 | | | | .19 | | | | .96 | |
| | | | |
Less: Dividends and Distributions | | | | | | | | | | | | | | | | | | | | |
Dividends from net investment income | | | (.22 | ) | | | (.19 | ) | | | (.34 | ) | | | (.32 | ) | | | (.33 | ) |
Distributions from net realized gain on investment and foreign currency transactions | | | – 0 | – | | | (.09 | ) | | | – 0 | – | | | – 0 | – | | | – 0 | – |
| | | | |
Total dividends and distributions | | | (.22 | ) | | | (.28 | ) | | | (.34 | ) | | | (.32 | ) | | | (.33 | ) |
| | | | |
Net asset value, end of period | | | $ 8.51 | | | | $ 8.25 | | | | $ 8.63 | | | | $ 8.37 | | | | $ 8.50 | |
| | | | |
Total Return | | | | | | | | | | | | | | | | | | | | |
Total investment return based on net asset value(d) | | | 5.83 | % | | | (1.22 | )%* | | | 7.30 | % | | | 2.32 | % | | | 12.46 | % |
Ratios/Supplemental Data | | | | | | | | | | | | | | | | | | | | |
Net assets, end of period (000’s omitted) | | | $19,039 | | | | $13,851 | | | | $9,949 | | | | $1,364 | | | | $1,261 | |
Ratio to average net assets of: | | | | | | | | | | | | | | | | | | | | |
Expenses, net of waivers/reimbursements(e) | | | .93 | % | | | .95 | % | | | .84 | % | | | .85 | % | | | .90 | %(f) |
Expenses, before waivers/reimbursements(e) | | | .93 | % | | | .95 | % | | | .95 | % | | | 1.00 | % | | | 1.06 | %(f) |
Net investment income | | | 2.69 | % | | | 2.26 | % | | | 2.70 | %(g) | | | 3.86 | %(b) | | | 3.88 | %(b)(f) |
Portfolio turnover rate | | | 157 | % | | | 179 | % | | | 94 | % | | | 65 | % | | | 69 | % |
See footnote summary on page 93.
| | |
| 90 | | • ALLIANCEBERNSTEIN GLOBAL BOND FUND |
Financial Highlights
Selected Data For A Share Of Capital Stock Outstanding Throughout Each Period
| | | | | | | | | | | | | | | | | | | | |
| | | Class I | |
| | | Year Ended September 30, | |
| | | 2014 | | | 2013 | | | 2012 | | | 2011 | | | 2010 | |
| | | | |
| | | | | | | | | | | | | | | | | | | | |
Net asset value, beginning of period | | | $ 8.25 | | | | $ 8.63 | | | | $ 8.37 | | | | $ 8.50 | | | | $ 7.87 | |
| | | | |
Income From Investment Operations | | | | | | | | | | | | | | | | | | | | |
Net investment income(a) | | | .26 | | | | .22 | | | | .24 | (b) | | | .34 | | | | .34 | (b) |
Net realized and unrealized gain (loss) on investment and foreign currency transactions | | | .24 | | | | (.29 | ) | | | .38 | | | | (.12 | ) | | | .64 | |
Contributions from Adviser | | | – 0 | – | | | – 0 | – | | | .00 | (c) | | | – 0 | – | | | – 0 | – |
| | | | |
Net increase (decrease) in net asset value from operations | | | .50 | | | | (.07 | ) | | | .62 | | | | .22 | | | | .98 | |
| | | | |
Less: Dividends and Distributions | | | | | | | | | | | | | | | | | | | | |
Dividends from net investment income | | | (.24 | ) | | | (.22 | ) | | | (.36 | ) | | | (.35 | ) | | | (.35 | ) |
Distributions from net realized gain on investment and foreign currency transactions | | | – 0 | – | | | (.09 | ) | | | – 0 | – | | | – 0 | – | | | – 0 | – |
| | | | |
Total dividends and distributions | | | (.24 | ) | | | (.31 | ) | | | (.36 | ) | | | (.35 | ) | | | (.35 | ) |
| | | | |
Net asset value, end of period | | | $ 8.51 | | | | $ 8.25 | | | | $ 8.63 | | | | $ 8.37 | | | | $ 8.50 | |
| | | | |
Total Return | | | | | | | | | | | | | | | | | | | | |
Total investment return based on net asset value(d) | | | 6.19 | % | | | (0.87 | )%* | | | 7.56 | % | | | 2.59 | % | | | 12.77 | % |
Ratios/Supplemental Data | | | | | | | | | | | | | | | | | | | | |
Net assets, end of period (000’s omitted) | | | $546,550 | | | | $291,554 | | | | $198,242 | | | | $158,050 | | | | $9,931 | |
Ratio to average net assets of: | | | | | | | | | | | | | | | | | | | | |
Expenses, net of waivers/reimbursements(e) | | | .59 | % | | | .59 | % | | | .60 | % | | | .59 | % | | | .63 | %(f) |
Expenses, before waivers/reimbursements(e) | | | .59 | % | | | .59 | % | | | .61 | % | | | .59 | % | | | .63 | %(f) |
Net investment income | | | 3.04 | % | | | 2.61 | % | | | 2.88 | %(b) | | | 4.03 | % | | | 4.17 | %(b)(f) |
Portfolio turnover rate | | | 157 | % | | | 179 | % | | | 94 | % | | | 65 | % | | | 69 | % |
See footnote summary on page 93.
| | | | |
| ALLIANCEBERNSTEIN GLOBAL BOND FUND • | | | 91 | |
Financial Highlights
Selected Data For A Share Of Capital Stock Outstanding Throughout Each Period
| | | | |
| | | Class Z | |
| | | October 15,
2013(h) to
September 30,
2014 | |
| | | | |
| | | | |
Net asset value, beginning of period | | | $ 8.23 | |
| | | | |
Income From Investment Operations | | | | |
Net investment income(a) | | | .25 | |
Net realized and unrealized gain on investment and foreign currency transactions | | | .27 | |
| | | | |
Net increase in net asset value from operations | | | .52 | |
| | | | |
Less: Dividends | | | | |
Dividends from net investment income | | | (.24 | ) |
| | | | |
Net asset value, end of period | | | $ 8.51 | |
| | | | |
Total Return | | | | |
Total investment return based on net asset value(d) | | | 6.38 | % |
Ratios/Supplemental Data | | | | |
Net assets, end of period (000’s omitted) | | | $11,472 | |
Ratio to average net assets of: | | | | |
Expenses, net of waivers/reimbursements(e) | | | .55 | %(i) |
Expenses, before waivers/reimbursements(e) | | | .55 | %(i) |
Net investment income | | | 3.05 | %(i) |
Portfolio turnover rate | | | 157 | % |
See footnote summary on page 93.
| | |
| 92 | | • ALLIANCEBERNSTEIN GLOBAL BOND FUND |
Financial Highlights
| (a) | | Based on average shares outstanding. |
| (b) | | Net of expenses waived/reimbursed by the Adviser. |
| (c) | | Amount represents less than $0.005. |
| (d) | | Total investment return is calculated assuming an initial investment made at the net asset value at the beginning of the period, reinvestment of all dividends and distributions at net asset value during the period, and redemption on the last day of the period. Initial sales charges or contingent deferred sales charges are not reflected in the calculation of total investment return. Total return does not reflect the deduction of taxes that a shareholder would pay on fund distributions or the redemption of fund shares. Total investment return calculated for a period of less than one year is not annualized. |
| (e) | | The expense ratios presented below exclude interest expense and term asset-backed securities loan facility administration fees, where applicable: |
| | | | | | | | | | | | | | | | | | | | | | | | |
| | | | | | Year Ended September 30, | |
| | | | | | 2014 | | | 2013 | | | 2012 | | | 2011 | | | 2010 | |
| | | | | | | | | | | | | | | | | | | | | | | | |
Class A | | | | | | | | | | | | | | | | | | | | | | | | |
Net of waivers/reimbursements | | | | | | | .93 | % | | | .93 | % | | | .90 | % | | | .90 | % | | | .90 | %(f) |
Before waivers/reimbursements | | | | | | | .93 | % | | | .93 | % | | | .91 | % | | | .94 | % | | | .95 | %(f) |
Class B | | | | | | | | | | | | | | | | | | | | | | | | |
Net of waivers/reimbursements . | | | | | | | 1.64 | % | | | 1.64 | % | | | 1.62 | % | | | 1.60 | % | | | 1.60 | %(f) |
Before waivers/reimbursements | | | | | | | 1.64 | % | | | 1.64 | % | | | 1.65 | % | | | 1.67 | % | | | 1.68 | %(f) |
Class C | | | | | | | | | | | | | | | | | | | | | | | | |
Net of waivers/reimbursements . | | | | | | | 1.63 | % | | | 1.63 | % | | | 1.61 | % | | | 1.60 | % | | | 1.60 | %(f) |
Before waivers/reimbursements | | | | | | | 1.63 | % | | | 1.63 | % | | | 1.62 | % | | | 1.64 | % | | | 1.65 | %(f) |
Advisor Class | | | | | | | | | | | | | | | | | | | | | | | | |
Net of waivers/reimbursements | | | | | | | .63 | % | | | .63 | % | | | .60 | % | | | .60 | % | | | .60 | %(f) |
Before waivers/reimbursements | | | | | | | .63 | % | | | .63 | % | | | .61 | % | | | .64 | % | | | .65 | %(f) |
Class R | | | | | | | | | | | | | | | | | | | | | | | | |
Net of waivers/reimbursements . | | | | | | | 1.26 | % | | | 1.28 | % | | | 1.20 | % | | | 1.10 | % | | | 1.10 | %(f) |
Before waivers/reimbursements | | | | | | | 1.26 | % | | | 1.28 | % | | | 1.25 | % | | | 1.28 | % | | | 1.29 | %(f) |
Class K | | | | | | | | | | | | | | | | | | | | | | | | |
Net of waivers/reimbursements | | | | | | | .93 | % | | | .94 | % | | | .81 | % | | | .84 | % | | | .85 | %(f) |
Before waivers/reimbursements | | | | | | | .93 | % | | | .94 | % | | | .92 | % | | | .99 | % | | | 1.01 | %(f) |
Class I | | | | | | | | | | | | | | | | | | | | | | | | |
Net of waivers/reimbursements | | | | | | | .58 | % | | | .58 | % | | | .58 | % | | | .58 | % | | | .57 | %(f) |
Before waivers/reimbursements | | | | | | | .58 | % | | | .58 | % | | | .59 | % | | | .58 | % | | | .57 | %(f) |
| | | | | | | | | | | | | | | | | | | | | | | | |
| | | October 15,
2013(h) to
September 30,
2014 | | | | | | | | | | | | | | | | |
Class Z | | | | | | | | | | | | | | | | | | | | | | | | |
Net of waivers/reimbursements | | | .55 | %(i) | | | | | | | | | | | | | | | | | | | | |
Before waivers/reimbursements | | | .55 | %(i) | | | | | | | | | | | | | | | | | | | | |
| (f) | | The ratio includes expenses attributable to costs of proxy solicitation. |
| (g) | | Net of expenses waived by the Distributor. |
| (h) | | Commencement of distribution. |
| * | | Includes the impact of proceeds received and credited to the Fund resulting from a third party vendor reimbursement, which enhanced the performance of each share class for the year ended September 30, 2013 by 0.01%. |
See notes to financial statements.
| | | | |
| ALLIANCEBERNSTEIN GLOBAL BOND FUND • | | | 93 | |
Financial Highlights
REPORT OF INDEPENDENT REGISTERED
PUBLIC ACCOUNTING FIRM
To the Board of Directors and Shareholders of
AllianceBernstein Global Bond Fund, Inc.
We have audited the accompanying statement of assets and liabilities, including the portfolio of investments, of AllianceBernstein Global Bond Fund, Inc. (the “Fund”) as of September 30, 2014, and the related statement of operations for the year then ended, the statements of changes in net assets for each of the two years in the period then ended, and the financial highlights for each of the periods indicated therein. These financial statements and financial highlights are the responsibility of the Fund’s management. Our responsibility is to express an opinion on these financial statements and financial highlights based on our audits.
We conducted our audits in accordance with the standards of the Public Company Accounting Oversight Board (United States). Those standards require that we plan and perform the audit to obtain reasonable assurance about whether the financial statements and financial highlights are free of material misstatement. We were not engaged to perform an audit of the Fund’s internal control over financial reporting. Our audits included consideration of internal control over financial reporting as a basis for designing audit procedures that are appropriate in the circumstances, but not for the purpose of expressing an opinion on the effectiveness of the Fund’s internal control over financial reporting. Accordingly, we express no such opinion. An audit also includes examining, on a test basis, evidence supporting the amounts and disclosures in the financial statements and financial highlights, assessing the accounting principles used and significant estimates made by management, and evaluating the overall financial statement presentation. Our procedures included confirmation of securities owned as of September 30, 2014 by correspondence with the custodian and others or by other appropriate auditing procedures where replies from others were not received. We believe that our audits provide a reasonable basis for our opinion.
In our opinion, the financial statements and financial highlights referred to above present fairly, in all material respects, the financial position of AllianceBernstein Global Bond Fund, Inc. at September 30, 2014, the results of its operations for the year then ended, the changes in its net assets for each of the two years in the period then ended, and the financial highlights for each of the periods indicated therein in conformity with U.S. generally accepted accounting principles.

New York, New York
November 26, 2014
| | |
| 94 | | • ALLIANCEBERNSTEIN GLOBAL BOND FUND |
Report of Independent Registered Public Accounting Firm
2014 FEDERAL TAX INFORMATION
(unaudited)
For Federal income tax purposes, the following information is furnished with respect to the distributions paid by the Fund during the taxable year ended September 30, 2014. For foreign shareholders, 29.73% of ordinary income dividends paid may be considered to be qualifying to be taxed as interest-related dividends.
Shareholders should not use the above information to prepare their income tax returns. The information necessary to complete your income tax returns will be included with your Form 1099-DIV which will be sent to you separately in January 2015.
| | | | |
| ALLIANCEBERNSTEIN GLOBAL BOND FUND • | | | 95 | |
2014 Federal Tax Information
BOARD OF DIRECTORS
Marshall C. Turner, Jr.(1), Chairman
John H. Dobkin(1)
Michael J. Downey(1)
William H. Foulk, Jr.(1)
D. James Guzy(1)
Nancy P. Jacklin(1)
Robert M. Keith, President and Chief Executive Officer
Garry L. Moody(1)
Earl D. Weiner(1)
OFFICERS
Philip L. Kirstein, Senior Vice President and Independent Compliance Officer
Paul J. DeNoon(2), Vice President
Scott A. DiMaggio(2), Vice President
Michael L. Mon(2), Vice President
Douglas J. Peebles(2), Vice President
Matthew S. Sheridan(2), Vice President
Emilie D. Wrapp, Secretary
Joseph J. Mantineo, Treasurer and Chief Financial Officer
Stephen M. Woetzel, Controller
Vincent S. Noto, Chief Compliance Officer
| | |
Custodian and Accounting Agent Brown Brothers Harriman & Co. 50 Post Office Square Boston, MA 02110 Principal Underwriter AllianceBernstein Investments, Inc. 1345 Avenue of the Americas New York, NY 10105 Legal Counsel Seward & Kissel LLP One Battery Park Plaza New York, NY 10004 | | Transfer Agent AllianceBernstein Investor Services, Inc. P.O. Box 786003 San Antonio, TX 78278-6003 Toll-Free (800) 221-5672 Independent Registered Public Accounting Firm Ernst & Young LLP 5 Times Square New York, NY 10036 |
| (1) | | Member of the Audit Committee, the Governance and Nominating Committee and the Independent Directors Committee. |
| (2) | | The day-to-day management of, and investment decisions for, the Fund’s portfolio are made by the Global Fixed Income Investment Team. Mr. Paul J. DeNoon, Mr. Scott A. DiMaggio, Mr. Michael L. Mon, Mr. Douglas J. Peebles and Mr. Matthew S. Sheridan are the investment professionals with the most significant responsibility for the day-to-day management of the Fund’s portfolio. |
| | |
| 96 | | • ALLIANCEBERNSTEIN GLOBAL BOND FUND |
Board of Directors
MANAGEMENT OF THE FUND
Board of Directors Information
The business and affairs of the Fund are managed under the direction of the Board of Directors. Certain information concerning the Fund’s Directors is set forth below.
| | | | | | | | |
NAME, ADDRESS*,
AND AGE
(YEAR FIRST ELECTED**) | | PRINCIPAL
OCCUPATION(S)
DURING PAST FIVE YEARS
AND OTHER RELEVANT
QUALIFICATIONS*** | | PORTFOLIOS
IN FUND
COMPLEX
OVERSEEN BY
DIRECTOR | | | OTHER
DIRECTORSHIPS
HELD BY
DIRECTOR IN THE
PAST FIVE YEARS |
| INTERESTED DIRECTOR | | | | | | |
Robert M. Keith, #
1345 Avenue of the Americas New York, NY 10105
54
(2010) | | Senior Vice President of AllianceBernstein L.P. (the “Adviser”) and the head of AllianceBernstein Investments, Inc. (“ABI”) since July 2008; Director of ABI and President of the AllianceBernstein Mutual Funds. Previously, he served as Executive Managing Director of ABI from December 2006 to June 2008. Prior to joining ABI in 2006, Executive Managing Director of Bernstein Global Wealth Management, and prior thereto, Senior Managing Director and Global Head of Client Service and Sales of the Adviser’s institutional investment management business since 2004. Prior thereto, he was Managing Director and Head of North American Client Service and Sales in the Adviser’s institutional investment management business, with which he had been associated since prior to 2004. | | | 104 | | | None |
| | | | | | | | |
| | | | |
| ALLIANCEBERNSTEIN GLOBAL BOND FUND • | | | 97 | |
Management of the Fund
| | | | | | | | |
NAME, ADDRESS*,
AND AGE
(YEAR FIRST ELECTED**) | | PRINCIPAL
OCCUPATION(S)
DURING PAST FIVE YEARS
AND OTHER RELEVANT
QUALIFICATIONS*** | | PORTFOLIOS
IN FUND
COMPLEX
OVERSEEN BY
DIRECTOR | | | OTHER
DIRECTORSHIPS
HELD BY
DIRECTOR IN THE
PAST FIVE YEARS |
| DISINTERESTED DIRECTORS | | | | | | |
Marshall C. Turner, Jr., ## Chairman of the Board
73
(2005) | | Private Investor since prior to 2009. Former CEO of Dupont Photomasks, Inc. (components of semi-conductor manufacturing), 2003-2006, and interim CEO 1999-2000. He has extensive operating and early-stage investment experience, including prior service as general partner of three institutional venture capital partnerships, and serves on the boards of three education and science-related non-profit organizations. He has served as a director of one AllianceBernstein fund since 1992, and director or trustee of multiple AllianceBernstein funds since 2005. He has been Chairman of the AllianceBernstein Funds since January 2014, and the Chairman of the Independent Directors Committees of such Funds since February 2014. | | | 104 | | | Xilinx, Inc. (programmable logic semi-conductors) and SunEdison, Inc. (semi-conductor substrates, solar materials and solar power plants) since prior to 2009 until July 2014 |
| | | | | | | | |
John H. Dobkin, ##
72
(1992) | | Independent Consultant since prior to 2009. Formerly, President of Save Venice, Inc. (preservation organization) from 2001–2002; Senior Advisor from June 1999-June 2000 and President of Historic Hudson Valley (historic preservation) from December 1989-May 1999. Previously, Director of the National Academy of Design. He has served as a director or trustee of various AllianceBernstein Funds since 1992, and as Chairman of the Audit Committees of a number of such Funds from 2001-2008. | | | 104 | | | None |
| | | | | | | | |
| | |
| 98 | | • ALLIANCEBERNSTEIN GLOBAL BOND FUND |
Management of the Fund
| | | | | | | | |
NAME, ADDRESS*,
AND AGE
(YEAR FIRST ELECTED**) | | PRINCIPAL
OCCUPATION(S)
DURING PAST FIVE YEARS
AND OTHER RELEVANT
QUALIFICATIONS*** | | PORTFOLIOS
IN FUND
COMPLEX
OVERSEEN BY
DIRECTOR | | | OTHER
DIRECTORSHIPS
HELD BY
DIRECTOR IN THE
PAST FIVE YEARS |
DISINTERESTED DIRECTORS
(continued) | | | | | | |
Michael J. Downey, ##
70
(2005) | | Private Investor since prior to 2009. Formerly, managing partner of Lexington Capital, LLC (investment advisory firm) from December 1997 until December 2003. From 1987 until 1993, Chairman and CEO of Prudential Mutual Fund Management, director of the Prudential mutual funds, and member of the Executive Committee of Prudential Securities Inc. He has served as a director or trustee of the AllianceBernstein Funds since 2005 and is a director and Chairman of one other registered investment company. | | | 104 | | | Asia Pacific Fund, Inc. (registered investment company) since prior to 2009, Prospect Acquisition Corp. (financial services) from 2007 until 2009, and The Merger Fund (registered investment company) since prior to 2009 until 2013 |
| | | | | | | | |
William H. Foulk, Jr., ##
82
(1992) | | Investment Adviser and an Independent Consultant since prior to 2009. Previously, he was Senior Manager of Barrett Associates, Inc., a registered investment adviser. He was formerly Deputy Comptroller and Chief Investment Officer of the State of New York and, prior thereto, Chief Investment Officer of the New York Bank for Savings. He has served as a director or trustee of various AllianceBernstein Funds since 1983, and was Chairman of the Independent Directors Committees of the AllianceBernstein Funds from 2003 until early February 2014. He served as Chairman of such Funds from 2003 through December 2013. He is also active in a number of mutual fund related organizations and committees. | | | 104 | | | None |
| | | | | | | | |
| | | | |
| ALLIANCEBERNSTEIN GLOBAL BOND FUND • | | | 99 | |
Management of the Fund
| | | | | | | | |
NAME, ADDRESS*,
AND AGE
(YEAR FIRST ELECTED**) | | PRINCIPAL
OCCUPATION(S)
DURING PAST FIVE YEARS
AND OTHER RELEVANT
QUALIFICATIONS*** | | PORTFOLIOS
IN FUND
COMPLEX
OVERSEEN BY
DIRECTOR | | | OTHER
DIRECTORSHIPS
HELD BY
DIRECTOR IN THE
PAST FIVE YEARS |
DISINTERESTED DIRECTORS
(continued) | | | | | | |
D. James Guzy, ##
78
(2005) | | Chairman of the Board of SRC Computers, Inc. (semi-conductors), with which he has been associated since prior to 2009. He served as Chairman of the Board of PLX Technology (semi-conductors) since prior to 2009 until November 2013. He was a director of Intel Corporation (semi-conductors) from 1969 until 2008, and served as Chairman of the Finance Committee of such company for several years until May 2008. He has served as a director or trustee of one or more of the AllianceBernstein Funds since 1982. | | | 104 | | | PLX Technology (semi-conductors) since prior to 2009 until November 2013 and Cirrus Logic Corporation (semi-conductors) since prior to 2009 until July 2011 |
| | | | | | | | |
| | |
| 100 | | • ALLIANCEBERNSTEIN GLOBAL BOND FUND |
Management of the Fund
| | | | | | | | |
NAME, ADDRESS*,
AND AGE
(YEAR FIRST ELECTED**) | | PRINCIPAL
OCCUPATION(S)
DURING PAST FIVE YEARS
AND OTHER RELEVANT
QUALIFICATIONS*** | | PORTFOLIOS
IN FUND
COMPLEX
OVERSEEN BY
DIRECTOR | | | OTHER
DIRECTORSHIPS
HELD BY
DIRECTOR IN THE
PAST FIVE YEARS |
DISINTERESTED DIRECTORS
(continued) | | | | | | |
Nancy P. Jacklin, ##
66
(2006) | | Professorial Lecturer at the Johns Hopkins School of Advanced International Studies since 2008. Formerly, U.S. Executive Director of the International Monetary Fund (which is responsible for ensuring the stability of the international monetary system), (December 2002-May 2006); Partner, Clifford Chance (1992-2002); Sector Counsel, International Banking and Finance, and Associate General Counsel, Citicorp (1985-1992); Assistant General Counsel (International), Federal Reserve Board of Governors (1982-1985); and Attorney Advisor, U.S. Department of the Treasury (1973-1982). Member of the Bar of the District of Columbia and of New York; and member of the Council on Foreign Relations. She has served as a director or trustee of the AllianceBernstein Funds since 2006 and has been Chairman of the Governance and Nominating Committees of the Funds since August 2014. | | | 104 | | | None |
| | | | |
| ALLIANCEBERNSTEIN GLOBAL BOND FUND • | | | 101 | |
Management of the Fund
| | | | | | | | |
NAME, ADDRESS*,
AND AGE
(YEAR FIRST ELECTED**) | | PRINCIPAL
OCCUPATION(S)
DURING PAST FIVE YEARS
AND OTHER RELEVANT
QUALIFICATIONS*** | | PORTFOLIOS
IN FUND
COMPLEX
OVERSEEN BY
DIRECTOR | | | OTHER
DIRECTORSHIPS
HELD BY
DIRECTOR IN THE
PAST FIVE YEARS |
DISINTERESTED DIRECTORS
(continued) | | | | | | |
Garry L. Moody, ##
62
(2008) | | Independent Consultant. Formerly, Partner, Deloitte & Touche LLP (1995-2008) where he held a number of senior positions, including Vice Chairman, and U.S. and Global Investment Management Practice Managing Partner; President, Fidelity Accounting and Custody Services Company (1993-1995); and Partner, Ernst & Young LLP (1975-1993), where he served as the National Director of Mutual Fund Tax Services and Managing Partner of its Chicago Office Tax department. He is a member of both the Governing Council of the Independent Directors Council (IDC), an organization of independent directors of mutual funds, and the Trustee Advisory Board of BoardIQ, a biweekly publication focused on issues and news affecting directors of mutual funds. He has served as a director or trustee, and as Chairman of the Audit Committees, of the AllianceBernstein Funds since 2008. | | | 104 | | | None |
| | | | | | | | |
Earl D. Weiner, ##
75
(2007) | | Of Counsel, and Partner prior to January 2007, of the law firm Sullivan & Cromwell LLP and is a former member of the ABA Federal Regulation of Securities Committee Task Force to draft editions of the Fund Director’s Guidebook. He also serves as a director or trustee of various non-profit organizations and has served as Chairman or Vice Chairman of a number of them. He has served as a director or trustee of the AllianceBernstein Funds since 2007 and served as Chairman of the Governance and Nominating Committees of the AllianceBernstein Funds from 2007 until August 2014. | | | 104 | | | None |
| | |
| 102 | | • ALLIANCEBERNSTEIN GLOBAL BOND FUND |
Management of the Fund
| * | | The address for each of the Fund’s disinterested Directors is c/o AllianceBernstein L.P., Attention: Philip L. Kirstein, 1345 Avenue of the Americas, New York, NY 10105. |
| ** | | There is no stated term of office for the Fund’s Directors. |
| *** | | The information above includes each Director’s principal occupation during the last five years and other information relating to the experience, attributes, and skills relevant to each Director’s qualifications to serve as a Director, which led to the conclusion that each Director should serve as a Director for the Fund. |
| # | | Mr. Keith is an "interested person" of the Fund, as defined in the 1940 Act, due to his position as a Senior Vice President of the Adviser. |
| ## | | Member of the Audit Committee, the Governance and Nominating Committee and the Independent Directors Committee. |
| | | | |
| ALLIANCEBERNSTEIN GLOBAL BOND FUND • | | | 103 | |
Management of the Fund
Officer Information
Certain information concerning the Fund’s Officers is listed below.
| | | | |
NAME, ADDRESS*
AND AGE | | POSITION(S)
HELD WITH FUND | | PRINCIPAL OCCUPATION
DURING PAST FIVE YEARS** |
Robert M. Keith,
54 | | President and Chief Executive Officer | | See biography above. |
| | | | |
Philip L. Kirstein,
69 | | Senior Vice President and Independent Compliance Officer | | Senior Vice President and Independent Compliance Officer of the AllianceBernstein Funds, with which he has been associated since October 2004. Prior thereto, he was Of Counsel to Kirkpatrick & Lockhart, LLP from October 2003 to October 2004, and General Counsel of Merrill Lynch Investment Managers, L.P. since prior to March 2003. |
| | | | |
Paul J. DeNoon,
52 | | Vice President | | Senior Vice President of the Adviser,** with which he has been associated since prior to 2009. |
| | | | |
Scott A. DiMaggio,
43 | | Vice President | | Senior Vice President of the Adviser,** with which he has been associated since prior to 2009. |
| | | | |
Michael L. Mon,
45 | | Vice President | | Senior Vice President of the Adviser,** with which he has been associated since prior to 2009. |
| | | | |
Douglas J. Peebles,
49 | | Vice President | | Senior Vice President of the Adviser,** with which he has been associated since prior to 2009. |
| | | | |
Matthew S. Sheridan,
39 | | Vice President | | Senior Vice President of the Adviser,** with which he has been associated since prior to 2009. |
| | | | |
Emilie D. Wrapp,
58 | | Secretary | | Senior Vice President, Assistant General Counsel and Assistant Secretary of ABI,** with which she has been associated since prior to 2009. |
| | | | |
Joseph J. Mantineo,
55 | | Treasurer and Chief Financial Officer | | Senior Vice President of ABIS,** with which he has been associated since prior to 2009. |
| | | | |
Stephen M. Woetzel,
43 | | Controller | | Vice President of ABIS,** with which he has been associated since prior to 2009. |
| | | | |
Vincent S. Noto
49 | | Chief Compliance Officer | | Vice President and Mutual Fund Chief Compliance Officer of the Adviser** since 2014. Prior thereto, he was Vice President and Director of Mutual Fund Compliance of the Adviser** since 2009. |
| * | The address for each of the Fund’s Officers is 1345 Avenue of the Americas, New York, NY 10105. |
| ** | The Adviser, ABI and ABIS are affiliates of the Fund. |
| | The Fund’s Statement of Additional Information (“SAI”) has additional information about the Fund’s Directors and Officers and is available without charge upon request. Contact your financial representative or AllianceBernstein at 1-800-227-4618, or visit www.alliancebernstein.com, for a free prospectus or SAI. |
| | |
| 104 | | • ALLIANCEBERNSTEIN GLOBAL BOND FUND |
Management of the Fund
THE FOLLOWING IS NOT PART OF THE SHAREHOLDER REPORT OR THE FINANCIAL STATEMENTS
SUMMARY OF SENIOR OFFICER’S EVALUATION OF INVESTMENT ADVISORY AGREEMENT1
The following is a summary of the evaluation of the Investment Advisory Agreement between AllianceBernstein L.P. (the “Adviser”) and The AllianceBernstein Global Bond Fund, Inc. (the “Fund”),2 prepared by Philip L. Kirstein, the Senior Officer of the Fund for the Directors of the Fund, as required by the August 2004 agreement between the Adviser and the New York State Attorney General (the “NYAG”). The Senior Officer’s evaluation of the Investment Advisory Agreement is not meant to diminish the responsibility or authority of the Board of Directors to perform its duties pursuant to Section 15 of the Investment Company Act of 1940 (the “40 Act”) and applicable state law. The purpose of the summary is to provide shareholders with a synopsis of the independent evaluation of the reasonableness of the advisory fees proposed to be paid by the Fund which was provided to the Directors in connection with their review of the proposed approval of the continuance of the Investment Advisory Agreement.
The Senior Officer’s evaluation considered the following factors:
| | 1. | Advisory fees charged to institutional and other clients of the Adviser for like services; |
| | 2. | Advisory fees charged by other mutual fund companies for like services; |
| | 3. | Costs to the Adviser and its affiliates of supplying services pursuant to the advisory agreement, excluding any intra-corporate profit; |
| | 4. | Profit margins of the Adviser and its affiliates from supplying such services; |
| | 5. | Possible economies of scale as the Fund grows larger; and |
| | 6. | Nature and quality of the Adviser’s services including the performance of the Fund. |
These factors, with the exception of the first factor, are generally referred to as the “Gartenberg factors,” which were articulated by the United States Court of Appeals for the Second Circuit in 1982. Gartenberg v. Merrill Lynch Asset Management, Inc., 694 F. 2d 923 (2d Cir. 1982). On March 30, 2010, the Supreme Court held the Gartenberg decision was correct in its basic formulation of what Section 36(b) requires: to face liability under Section 36(b), “an investment adviser must charge a fee that is so disproportionately large that it bears no
| 1 | | The information in the fee evaluation was completed on October 24, 2013 and discussed with the Board of Directors on November 5-7, 2013. |
| 2 | | Future references to the Fund do not include “AllianceBernstein.” References in the fee summary pertaining to performance and expense ratios refer to Class A shares of the Fund. |
| | | | |
| ALLIANCEBERNSTEIN GLOBAL BOND FUND • | | | 105 | |
reasonable relationship to the services rendered and could not have been the product of arm’s length bargaining.” Jones v. Harris Associates L.P., 130 S. Ct. 1418 (2010). In Jones, the Court stated the Gartenberg approach fully incorporates the correct understanding of fiduciary duty within the context of Section 36(b) and noted with approval that “Gartenberg insists that all relevant circumstances be taken into account” and “uses the range of fees that might result from arm’s length bargaining as the benchmark for reviewing challenged fees.”3
INVESTMENT ADVISORY FEES, NET ASSETS & EXPENSE RATIOS
The Adviser proposed that the Fund pays the advisory fee set forth in the table below for receiving the services to be provided pursuant to the Investment Advisory Agreement. The fee schedule below, implemented in January 2004 in consideration of the Adviser’s settlement with the NYAG in December 2003, is based on a master schedule that contemplates eight categories of funds with almost all funds in each category having the same advisory fee schedule.4 Also shown are the Fund’s net assets on September 30, 2013.
| | | | | | | | |
| Fund | | Category | | Advisory Fee Based on the
Fund’s Average Daily
Adjusted Total Assets5 | | September 30, 2013
Net Assets ($MM) | |
| Global Bond Fund, Inc. | | High Income | | 0.50% on 1st $2.5 billion 0.45% on next $2.5 billion 0.40% on the balance | | $ | 3,262.8 | |
The Fund’s Investment Advisory Agreement provides for the Adviser to be reimbursed for certain clerical, legal, accounting, administrative and other services provided to the Fund. During the Fund’s fiscal year ended September 30, 2013, the Adviser received $58,165 (0.002% of the Fund’s average daily net assets) for providing such services.
| 3 | | Jones v. Harris at 1427. |
| 4 | | Most of the AllianceBernstein Mutual Funds, which the Adviser manages, were affected by the Adviser’s settlement with the NYAG. |
| 5 | | Average daily value of total assets minus the sum of accrued liabilities other than the principal amount of money borrowed. |
| | |
| 106 | | • ALLIANCEBERNSTEIN GLOBAL BOND FUND |
Set forth below are the total expense ratios of the Fund for the most recent semi- annual period:6
| | | | | | | | |
| Fund | | Total Expense
Ratio7 | | | Fiscal Year |
| Global Bond Fund, Inc.8 | | Advisor Class A Class B Class C Class R Class K Class I | |
| 0.63
0.93 1.64 1.63 1.28 0.93 0.59 | %
% % % % % % | | Sept. 30
(ratios as of Mar. 31, 2013) |
| I. | ADVISORY FEES CHARGED TO INSTITUTIONAL AND OTHER CLIENTS |
The advisory fees charged to investment companies which the Adviser manages and sponsors are normally higher than those charged to similar sized institutional accounts, including pension plans and sub-advised investment companies. The fee differential reflects, among other things, different services provided to such clients, and different liabilities assumed. Services provided by the Adviser to the Fund that are not provided to non-investment company clients and sub-advised investment companies include providing office space and personnel to serve as Fund Officers, who among other responsibilities make the certifications required under the Sarbanes–Oxley Act of 2002, and coordinating with and monitoring the Fund’s third party service providers such as Fund counsel, auditors, custodians, transfer agents and pricing services. The accounting, administrative, legal and compliance requirements for the Fund are more costly than those for institutional assets due to the greater complexities and time required for investment companies, although as previously noted, the Adviser is reimbursed for providing such services. Also, retail mutual funds managed by the Adviser are widely held. Servicing the Fund’s investors is more time consuming and labor intensive compared to institutional clients since the Adviser needs to communicate with a more extensive network of financial intermediaries and shareholders. The Adviser also believes that it incurs substantial entrepreneurial risk when offering a new mutual fund since establishing a new mutual fund requires a large upfront investment and it may take a long time for the fund to achieve profitability since the fund must be priced to scale from inception in order to be competitive and assets are acquired one account at a time. In addition, managing the cash flow of an investment company may be more difficult than managing that of a stable pool of assets, such as an institutional account with little cash movement in either direction, particularly, if a fund is in net redemption and the Adviser is frequently forced to sell securities to raise cash for redemptions. However, managing a fund with positive cash flow may be easier at times than managing a stable pool of assets. Finally, in recent years, investment
| 6 | | Semi-annual total expense ratios are unaudited. |
| 8 | | The Fund’s gross expense ratios exclude interest expense of 0.02% for all share classes except Class I Shares, which excludes interest expense of less than 0.01%. |
| | | | |
| ALLIANCEBERNSTEIN GLOBAL BOND FUND • | | | 107 | |
advisers have been sued by institutional clients and have suffered reputational damage both by the attendant publicity and outcomes other than complete victories. Accordingly, the legal and reputational risks associated with institutional accounts are greater than previously thought, although still not equal to those related to the mutual fund industry.
Notwithstanding the Adviser’s view that managing an investment company is not comparable to managing other institutional accounts because the services provided are different, the Supreme Court has indicated consideration should be given to the advisory fees charged to institutional accounts with a similar investment style as the Fund.9 In addition to the AllianceBernstein Institutional fee schedule, set forth below is what would have been the effective advisory fee of the Fund had the AllianceBernstein Institutional fee schedule been applicable to the Fund based on September 30, 2013 net assets.10
| | | | | | | | | | |
| Fund | | Net Assets
9/30/13
($MM) | | AllianceBernstein
Institutional Fee Schedule | | Effective
AB Inst.
Adv. Fee (%) | | | Fund
Advisory
Fee (%) |
| Global Bond Fund, Inc. | | $3,262.8 | | Global Plus Fixed Income Schedule 0.50% on 1st $30 million 0.25% on the balance Minimum account size: $25 m | | | 0.252 | % | | 0.488% |
The Adviser also manages and sponsors retail mutual funds, which are organized in jurisdictions outside the United States, generally Luxembourg and Japan, and sold to non-United States resident investors. The Adviser charges the following fee for Global Plus Fixed Income, a Luxembourg fund that has a somewhat similar investment style as the Fund:
| | | | |
| Fund | | Luxembourg Fund | | Fee11 |
| Global Bond Fund, Inc. | | Global Plus Fixed Income Class A2 | | 1.10% |
| | Class I2 (Institutional) | | 0.55% |
| 9 | | The Supreme Court stated that “courts may give such comparisons the weight that they merit in light of the similarities and differences between the services that the clients in question require, but the courts must be wary of inapt comparisons.” Among the significant differences the Supreme Court noted that may exist between services provided to mutual funds and institutional accounts are “higher marketing costs.” Jones v. Harris at 1428. |
| 10 | | The Adviser has indicated that with respect to institutional accounts with assets greater than $300 million, it will negotiate a fee schedule. Discounts that are negotiated vary based upon each client relationship. |
| 11 | | Class A2 shares of the fund are charged an “all-in” fee, which includes investment advisory services and distribution related services, unlike Class I2 shares, whose fee is for investment advisory services only. |
| | |
| 108 | | • ALLIANCEBERNSTEIN GLOBAL BOND FUND |
The AllianceBernstein Investment Trust Management mutual funds (“ITM”), which are offered to investors in Japan, have an “all-in” fee to compensate the Adviser for investment advisory as well as fund accounting and administrative related services. The fee schedule of the ITM mutual fund that has a somewhat similar investment style as the Fund is as follows:
| | | | |
| Fund | | ITM Mutual Fund | | Fee |
| Global Bond Fund, Inc. | | Global Plus Bond Fund D/P (hedged) | | 0.10%12 |
The Adviser provides sub-advisory services to certain other investment companies managed by other fund families. The Adviser charges the fee set forth below for the sub-advisory relationships that have a somewhat similar investment style as the Fund. Also shown are the Fund’s advisory fees and what would have been the effective advisory fees of the Fund had the fee schedules of the sub-advisory relationships been applicable to the Fund based on September 30, 2013 net assets.
| | | | | | | | | | | | |
| Fund | | | | Fee Schedule | | Effective
Sub-Adv.
Fee(%) | | | Portfolio
Advisory
Fee(%) | |
| Global Bond Fund, Inc. | | Client #1 | | 0.15% of average daily net assets | | | 0.150% | | | | 0.488% | |
| | | | | | | | | | | | |
| | Client #2 | | 0.12% of average daily net assets | | | 0.120% | | | | 0.488% | |
It is fair to note that the services the Adviser provides pursuant to sub-advisory agreements are generally confined to the services related to the investment process; in other words, they are not as comprehensive as the services provided to the Fund by the Adviser.
While it appears that the sub-advisory relationships are paying a lower fee than the Fund, it is difficult to evaluate the relevance of such fees due to differences in terms of the services provided, risks involved and other competitive factors between the Fund and the sub-advisory relationships. There could be various business reasons why an investment adviser would be willing to provide a sub-advised relationship investment related services at a different fee level than an investment company it is sponsoring where the investment adviser is providing all the services, not just investment management service required by a registered investment company.
| 12 | | In addition to the fee shown above, the institutional client is charged the following fee: 0.33% on the first ¥3 billion, 0.08% thereafter. At the currency exchange rate shown in footnote 46, ¥3 billion would be equivalent to approximately $30.55 million. |
| | | | |
| ALLIANCEBERNSTEIN GLOBAL BOND FUND • | | | 109 | |
| II. | MANAGEMENT FEES CHARGED BY OTHER MUTUAL FUND COMPANIES FOR LIKE SERVICES. |
Lipper, Inc. (“Lipper”), an analytical service that is not affiliated with the Adviser, compared the fees charged to the Fund with fees charged to other investment companies for similar services offered by other investment advisers.13 Lipper’s analysis included the comparison of the Fund’s contractual management fee, estimated at the approximate current asset level of the Fund, to the median of the Fund’s Lipper Expense Group (“EG”)14 and the Fund’s contractual management fee ranking.15
Lipper describes an EG as a representative sample of comparable funds. Lipper’s standard methodology for screening funds to be included in an EG entails the consideration of several fund criteria, including fund type, investment classification/objective, load type and similar 12b-1/non-12b-1 service fees, asset (size) comparability, expense components and attributes. An EG will typically consist of seven to twenty funds.
| | | | | | | | | | |
| Fund | | Contractual
Management
Fee (%)16 | | | Lipper Exp.
Group
Median (%) | | | Lipper
Group
Rank |
| Global Bond Fund, Inc. | | | 0.487 | | | | 0.549 | | | 1/11 |
| 13 | | The Supreme Court cautioned against accepting mutual fund fee comparisons without careful scrutiny since “these comparisons are problematic because these fees, like those challenged, may not be the product of negotiations conducted at arm’s length.” Jones v. Harris at 1429. |
| 14 | | Lipper does not consider average account size when constructing EGs. Funds with relatively small average account sizes tend to have higher transfer agent expense ratio than comparable sized funds that have relatively large average account sizes. There are limitations to Lipper expense category data because different funds categorize expenses differently. |
| 15 | | The contractual management fee is calculated by Lipper using the Fund’s contractual management fee rate at a hypothetical asset level. The hypothetical asset level is based on the combined net assets of all classes of the Fund, rounded up to the next $25 million. Lipper’s total expense ratio information is based on the most recent annual report except as otherwise noted. A ranking of “1” would mean that Fund had the lowest effective fee rate in the Lipper peer group. |
| 16 | | The contractual management fee does not reflect any expense reimbursements made by the Fund to the Adviser for certain clerical, legal, accounting, administrative, and other services. In addition, the contractual management fee does not reflect any advisory fee waivers or expense reimbursements made by the Adviser that would effectively reduce the actual effective management fee. |
| | |
| 110 | | • ALLIANCEBERNSTEIN GLOBAL BOND FUND |
Lipper also compared the Fund’s total expense ratio to the medians of the Fund’s EG and Lipper Expense Universe (“EU”). The EU is a broader group compared to the EG, consisting of all funds that have the same investment classifications/objective and load type as the subject Fund.
| | | | | | | | | | | | | | | | |
| Fund | | Total
Expense
Ratio (%)17 | | | Lipper Exp.
Group
Median (%) | | | Lipper
Group
Rank | | Lipper Exp.
Universe
Median (%) | | | Lipper
Universe
Rank |
| Global Bond Fund, Inc. | | | 0.901 | | | | 1.034 | | | 2/11 | | | 1.084 | | | 2/21 |
Based on this analysis, the Fund has a more favorable ranking on a contractual
management fee basis than on a total expense ratio basis.
| III. | COSTS TO THE ADVISER AND ITS AFFILIATES OF SUPPLYING SERVICES PURSUANT TO THE MANAGEMENT FEE ARRANGEMENT, EXCLUDING ANY INTRA-CORPORATE PROFIT. |
The Adviser utilizes two profitability reporting systems, which operate independently but are aligned with each other, to estimate the Adviser’s profitability in connection with investment advisory services provided to the Fund. The Senior Officer has retained a consultant to provide independent advice regarding the alignment of the two profitability systems as well as the methodologies and allocations utilized by both profitability systems. See Section IV for additional discussion.
| IV. | PROFIT MARGINS OF THE ADVISER AND ITS AFFILIATES FOR SUPPLYING SUCH SERVICES. |
The Fund’s profitability information, prepared by the Adviser for the Board of Directors, was reviewed by the Senior Officer and the consultant. The Adviser’s profitability from providing investment advisory services to the Fund increased during calendar year 2012, relative to 2011.
In addition to the Adviser’s direct profits from managing the Fund, certain of the Adviser’s affiliates have business relationships with the Fund and may earn a profit from providing other services to the Fund. The courts have referred to this type of business opportunity as “fall-out benefits” to the Adviser and indicated that such benefits should be factored into the evaluation of the total relationship between the Fund and the Adviser. Neither case law nor common business practice precludes the Adviser’s affiliates from earning a reasonable profit on this type of relationship provided the affiliates’ charges and services are competitive and the relationship otherwise complies with the 40 Act restrictions. These affiliates provide transfer agent and distribution services to the Fund and receive transfer agent fees, Rule 12b-1 payments, front-end sales loads and contingent deferred sales charges (“CDSC”). During the Fund’s most recently completed fiscal year, ABI received from the Fund $81,171, $11,391,630 and $57,550 in front-end sales charges, Rule 12b-1 and CDSC fees, respectively.
| 17 | | Most recently completed fiscal year Class A share total expense ratio. |
| | | | |
| ALLIANCEBERNSTEIN GLOBAL BOND FUND • | | | 111 | |
AllianceBernstein Investments, Inc. (“ABI”), an affiliate of the Adviser, is the Fund’s principal underwriter. ABI and the Adviser have disclosed in the Fund’s prospectus that they may make revenue sharing payments from their own resources, in addition to resources derived from sales loads and Rule 12b-1 fees, to firms that sell shares of the Fund. In 2012, ABI paid approximately 0.05% of the average monthly assets of the AllianceBernstein Mutual Funds or approximately $19.0 million for distribution services and educational support (revenue sharing payments).
Fees and reimbursements for out of pocket expenses charged by AllianceBernstein Investor Services, Inc. (“ABIS”), the affiliated transfer agent for the Fund, are based on the level of the network account and the class of shares held by the account. ABIS also receives a fee per shareholder sub-account for each account maintained by an intermediary on an omnibus basis. ABIS received $1,105,517 in fees from the Fund during the Fund’s most recently completed fiscal year:
| V. | POSSIBLE ECONOMIES OF SCALE |
The Adviser has indicated that economies of scale are being shared with shareholders through pricing to scale, breakpoints, fee reductions/waivers and enhancement to services.
In May 2012, an independent consultant, retained by the Senior Officer, provided the Board of Directors information on the Adviser’s firm-wide average costs from 2005 through 2011 and the potential economies of scale. The independent consultant noted that from 2005 through 2007 the Adviser experienced significant growth in assets under management (“AUM”). During this period, operating expenses increased, in part to keep up with growth, and in part reflecting market returns. However, from 2008 through the first quarter of 2009, AUM rapidly and significantly decreased due to declines in market value and client withdrawals. When AUM rapidly decreased, some operating expenses categories, including base compensation and office space, adjusted more slowly during this period, resulting in an increase in average costs. Since 2009, AUM has experienced less significant changes. The independent consultant noted that changes in operating expenses reflect changes in business composition and business practices in response to changes in financial markets. Finally, the independent consultant concluded that the increase in average cost and the decline in net operating margin across the Adviser since late 2008 are inconsistent with the view that there are currently reductions in average costs due to economies of scale that can be shared with the AllianceBernstein Mutual Funds managed by the Adviser through lower fees.
| | |
| 112 | | • ALLIANCEBERNSTEIN GLOBAL BOND FUND |
Previously, in February 2008, the independent consultant provided the Board of Directors an update of the Deli18 study on advisory fees and various fund characteristics.19 The independent consultant first reiterated the results of his previous two dimensional comparison analysis (fund size and family size) with the Board of Directors.20 The independent consultant then discussed the results of the regression model that was utilized to study the effects of various factors on advisory fees. The regression model output indicated that the bulk of the variation in fees predicted were explained by various factors, but substantially by fund AUM, family AUM, index fund indicator and investment style. The independent consultant also compared the advisory fees of the AllianceBernstein Mutual Funds to similar funds managed by 19 other large asset managers, regardless of the fund size and each Adviser’s proportion of mutual fund assets to non-mutual fund assets.
| VI. | NATURE AND QUALITY OF THE ADVISER’S SERVICES, INCLUDING THE PERFORMANCE OF THE FUND |
With assets under management of approximately $445 billion as of September 30, 2013, the Adviser has the investment experience to manage and provide non-investment services (described in Section I) to the Fund.
The information prepared by Lipper shows the 1, 3, 5 and 10 year performance returns and rankings21 of the Fund relative to its Lipper Performance Group (“PG”) and Lipper Performance Universe (“PU”)22 for the periods ended July 31, 2013.23
| 18 | | The Deli study, originally published in 2002 based on 1997 data and updated for the February 2008 Presentation, may be of diminished value due to the age of the data used in the presentation and the changes experienced in the industry over the last four years. |
| 19 | | As mentioned previously, the Supreme Court cautioned against accepting mutual fund fee comparisons without careful scrutiny since the fees may not be the product of negotiations conducted at arm’s length. See Jones v. Harris at 1429. |
| 20 | | The two dimensional analysis showed patterns of lower advisory fees for funds with larger asset sizes and funds from larger family sizes compared to funds with smaller asset sizes and funds from smaller family sizes, which according to the independent consultant is indicative of a sharing of economies of scale and scope. However, in less liquid and active markets, such is not the case, as the empirical analysis showed potential for diseconomies of scale in those markets. The empirical analysis also showed diminishing economies of scale and scope as funds surpassed a certain high level of assets. |
| 21 | | The performance returns and rankings of the Fund are for the Fund’s Class A shares. The performance returns of the Fund were provided by Lipper. |
| 22 | | The Fund’s PG is identical to the Fund’s EG. The Fund’s PU is not identical to the Fund’s EU as the criteria for including/excluding a fund from a PU is somewhat different from that of an EU. |
| 23 | | The current Lipper investment classification/objective dictates the PG and PU throughout the life of the Fund even if a Fund had a different investment classification/objective at a different point in time. |
| | | | |
| ALLIANCEBERNSTEIN GLOBAL BOND FUND • | | | 113 | |
| | | | | | | | | | | | | | | | |
Global
Bond
Fund, Inc. | | Fund
Return (%) | | | PG Median (%) | | | PU Median (%) | | | PG Rank | | PU Rank |
1 year | | | 0.11 | | | | 1.27 | | | | 0.43 | | | 8/11 | | 18/32 |
3 year | | | 3.66 | | | | 3.48 | | | | 3.48 | | | 5/10 | | 12/24 |
5 year | | | 5.76 | | | | 5.40 | | | | 4.65 | | | 2/6 | | 6/18 |
10 year | | | 6.92 | | | | 5.79 | | | | 5.73 | | | 1/5 | | 1/15 |
Set forth below are the 1, 3, 5 and 10 year and since inception performance returns of the Fund (in bold)24 versus its benchmarks.25 Fund and benchmark volatility and reward-to-variability ratio (“Sharpe Ratio”) information is also shown.26
| | | | | | | | | | | | | | | | | | | | | | | | | | | | | | | | |
| | | Periods Ending July 31, 2013 | |
| | | Annualized Performance | | | Annualized | | | | |
| | | 1 Year
(%) | | | 3 Year
(%) | | | 5 Year
(%) | | | 10 Year
(%) | | | Since
Inception
(%) | | | Volatility
(%) | | | Sharpe
(%) | | | Risk
Period
(Year) | |
| Global Bond Fund, Inc. | | | 0.11 | | | | 3.66 | | | | 5.76 | | | | 6.92 | | | | 8.02 | | | | 6.01 | | | | 0.85 | | | | 10 | |
| Barclays Capital Global Aggregate Bond Index (USD hedged) | | | 0.74 | | | | 3.33 | | | | 4.94 | | | | 4.55 | | | | 6.20 | | | | 2.69 | | | | 1.03 | | | | 10 | |
| Barclays Capital Global Treasury Index (USD hedged)27 | | | 0.74 | | | | 2.96 | | | | 4.34 | | | | 4.28 | | | | 6.13 | | | | N/A | | | | N/A | | | | N/A | |
| Inception Date: March 27, 1992 | | | | | | | | | | | | | |
| 24 | | The performance returns and risk measures shown in the table are for the Class A shares of the Fund. |
| 25 | | The Adviser provided Fund and benchmark performance return information for periods through July 31, 2013. |
| 26 | | Fund and benchmark volatility and Sharpe Ratio information was obtained through Lipper LANA, a database maintained by Lipper. Volatility is a statistical measure of the tendency of a market price or yield to vary over time. A Sharpe Ratio is a risk adjusted measure of return that divides a fund’s return in excess of the riskless return by the fund’s standard deviation. A fund with a greater volatility would be viewed as more risky than a fund with equivalent performance but lower volatility; for that reason, a greater return would be demanded for the more risky fund. A fund with a higher Sharpe Ratio would be viewed as better performing than a fund with a lower Sharpe Ratio. |
| 27 | | Benchmark inception is the nearest month end after the Fund’s actual inception date. |
| | |
| 114 | | • ALLIANCEBERNSTEIN GLOBAL BOND FUND |
CONCLUSION:
Based on the factors discussed above the Senior Officer’s conclusion is that the proposed advisory fee for the Fund is reasonable and within the range of what would have been negotiated at arm’s length in light of all the surrounding circumstances. This conclusion in respect of the Fund is based on an evaluation of all of these factors and no single factor was dispositive.
Dated: December 5, 2013
| | | | |
| ALLIANCEBERNSTEIN GLOBAL BOND FUND • | | | 115 | |
THIS PAGE IS NOT PART OF THE SHAREHOLDER REPORT OR THE FINANCIAL STATEMENTS
ALLIANCEBERNSTEIN FAMILY OF FUNDS
US Equity
US Core
Core Opportunities Fund
Select US Equity Portfolio
US Growth
Concentrated Growth Fund
Discovery Growth Fund
Growth Fund
Large Cap Growth Fund
Small Cap Growth Portfolio
US Value
Discovery Value Fund
Equity Income Fund
Growth & Income Fund
Value Fund
International/Global Equity
International/Global Core
Global Equity & Covered Call Strategy Fund
Global Thematic Growth Fund
International Portfolio
Tax-Managed International Portfolio
International/Global Growth
International Growth Fund
International/Global Value
Global Value Fund
International Value Fund
Fixed Income
Municipal
High Income Municipal Portfolio
Intermediate California Portfolio
Intermediate Diversified Portfolio
Intermediate New York Portfolio
Municipal Bond Inflation Strategy
Tax-Aware Fixed Income Portfolio
National Portfolio
Arizona Portfolio
California Portfolio
Massachusetts Portfolio
Michigan Portfolio
Minnesota Portfolio
New Jersey Portfolio
New York Portfolio
Ohio Portfolio
Pennsylvania Portfolio
Virginia Portfolio
Fixed Income (continued)
Taxable
Bond Inflation Strategy
Global Bond Fund
High Income Fund
High Yield Portfolio
Intermediate Bond Portfolio
Limited Duration High Income Portfolio
Short Duration Portfolio
Alternatives
Credit Long/Short Portfolio
Dynamic All Market Fund
Global Real Estate Investment Fund
Global Risk Allocation Fund
Long/Short Multi-Manager Fund
Market Neutral Strategy-U.S.
Multi-Manager Alternative Strategies Fund
Real Asset Strategy
Select US Long/Short Portfolio
Unconstrained Bond Fund
Asset Allocation/Multi-Asset
Multi-Asset
Emerging Markets Multi-Asset Portfolio
Retirement Strategies
2000 Retirement Strategy
2005 Retirement Strategy
2010 Retirement Strategy
2015 Retirement Strategy
2020 Retirement Strategy
2025 Retirement Strategy
2030 Retirement Strategy
2035 Retirement Strategy
2040 Retirement Strategy
2045 Retirement Strategy
2050 Retirement Strategy
2055 Retirement Strategy
Wealth Strategies
Balanced Wealth Strategy
Conservative Wealth Strategy
Wealth Appreciation Strategy
Tax-Managed Balanced Wealth Strategy
Tax-Managed Conservative Wealth Strategy
Tax-Managed Wealth Appreciation Strategy
Closed-End Funds
Alliance California Municipal Income Fund
Alliance New York Municipal Income Fund
AllianceBernstein Global High Income Fund
AllianceBernstein Income Fund
AllianceBernstein National Municipal Income Fund
We also offer Exchange Reserves, which serves as the money market fund exchange vehicle for the AllianceBernstein mutual funds. An investment in Exchange Reserves is not a deposit in a bank and is not insured or guaranteed by the Federal Deposit Insurance Corporation or any other government agency. Although the Fund seeks to preserve the value of your investment at $1.00 per share, it is possible to lose money by investing in the Fund.
Investors should consider the investment objectives, risks, charges and expenses of the Fund carefully before investing. For copies of our prospectus or summary prospectus, which contain this and other information, visit us online at www.alliancebernstein.com or contact your AllianceBernstein investments representative. Please read the prospectus and/or summary prospectus carefully before investing.
| | |
| 116 | | • ALLIANCEBERNSTEIN GLOBAL BOND FUND |
AllianceBernstein Family of Funds
ALLIANCEBERNSTEIN GLOBAL BOND FUND
1345 Avenue of the Americas
New York, NY 10105
800.221.5672
| | |
| |
| GB-0151-0914 | |  |
(a) The registrant has adopted a code of ethics that applies to its principal executive officer, principal financial officer and principal accounting officer. A copy of the registrant’s code of ethics is filed herewith as Exhibit 12(a)(1).
(b) During the period covered by this report, no material amendments were made to the provisions of the code of ethics adopted in 2(a) above.
(c) During the period covered by this report, no implicit or explicit waivers to the provisions of the code of ethics adopted in 2(a) above were granted.
| ITEM 3. | AUDIT COMMITTEE FINANCIAL EXPERT. |
The registrant’s Board of Directors has determined that independent directors Garry L. Moody and William H. Foulk, Jr. qualify as audit committee financial experts.
| ITEM 4. | PRINCIPAL ACCOUNTANT FEES AND SERVICES. |
(a) - (c) The following table sets forth the aggregate fees billed by the independent registered public accounting firm Ernst & Young LLP, for the Fund’s last two fiscal years for professional services rendered for: (i) the audit of the Fund’s annual financial statements included in the Fund’s annual report to stockholders; (ii) assurance and related services that are reasonably related to the performance of the audit of the Fund’s financial statements and are not reported under (i), which include advice and education related to accounting and auditing issues and quarterly press release review (for those Funds which issue press releases), and preferred stock maintenance testing (for those Funds that issue preferred stock); and (iii) tax compliance, tax advice and tax return preparation.
| | | | | | | | | | | | | | | | |
| | | | | | Audit Fees | | | Audit - Related
Fees | | | Tax Fees | |
AB Global Bond Fund | | | 2013 | | | $ | 55,000 | | | $ | — | | | $ | 18,391 | |
| | | 2014 | | | $ | 88,855 | | | $ | — | | | $ | 21,565 | |
(d) Not applicable.
(e) (1) Beginning with audit and non-audit service contracts entered into on or after May 6, 2003, the Fund’s Audit Committee policies and procedures require the pre-approval of all audit and non-audit services provided to the Fund by the Fund’s independent registered public accounting firm. The Fund’s Audit Committee policies and procedures also require pre-approval of all audit and non-audit services provided to the Adviser and Service Affiliates to the extent that these services are directly related to the operations or financial reporting of the Fund.
(e) (2) All of the amounts for Audit Fees, Audit-Related Fees and Tax Fees in the table under Item 4 (a) – (c) are for services pre-approved by the Fund’s Audit Committee.
(f) Not applicable.
(g) The following table sets forth the aggregate non-audit services provided to the Fund, the Fund’s Adviser and entities that control, are controlled by or under common control with the Adviser that provide ongoing services to the Fund:
| | | | | | | | | | | | |
| | | | | | All Fees for
Non-Audit Services
Provided to the
Portfolio, the Adviser
and Service Affiliates | | | Pre-approved by the
Audit Committee
(Portion Comprised of
Audit Related Fees)
(Portion Comprised of
Tax Fees) | |
AB Global Bond Fund | | | 2013 | | | $ | 391,562 | | | $ | 18,391 | |
| | | | | | | | | | $ | — | |
| | | | | | | | | | $ | (18,391 | ) |
| | | 2014 | | | $ | 390,370 | | | $ | 21,565 | |
| | | | | | | | | | $ | — | |
| | | | | | | | | | $ | (21,565 | ) |
(h) The Audit Committee of the Fund has considered whether the provision of any non-audit services not pre-approved by the Audit Committee provided by the Fund’s independent registered public accounting firm to the Adviser and Service Affiliates is compatible with maintaining the auditor’s independence.
| ITEM 5. | AUDIT COMMITTEE OF LISTED REGISTRANTS. |
Not applicable to the registrant.
| ITEM 6. | SCHEDULE OF INVESTMENTS. |
Please see Schedule of Investments contained in the Report to Shareholders included under Item 1 of this Form N-CSR.
ITEM 7. DISCLOSURE OF PROXY VOTING POLICIES AND PROCEDURES FOR CLOSED-END MANAGEMENT INVESTMENT COMPANIES.
Not applicable to the registrant.
| ITEM 8. | PORTFOLIO MANAGERS OF CLOSED-END MANAGEMENT INVESTMENT COMPANIES. |
Not applicable to the registrant.
ITEM 9. PURCHASES OF EQUITY SECURITIES BY CLOSED-END MANAGEMENT INVESTMENT COMPANY AND AFFILIATED PURCHASERS.
Not applicable to the registrant.
| ITEM 10. | SUBMISSION OF MATTERS TO A VOTE OF SECURITY HOLDERS. |
There have been no material changes to the procedures by which shareholders may recommend nominees to the Fund’s Board of Directors since the Fund last provided disclosure in response to this item.
| ITEM 11. | CONTROLS AND PROCEDURES. |
(a) The registrant’s principal executive officer and principal financial officer have concluded that the registrant’s disclosure controls and procedures (as defined in Rule 30a-2(c) under the Investment Company Act of 1940, as amended) are effective at the reasonable assurance level based on their evaluation of these controls and procedures as of a date within 90 days of the filing date of this document.
(b) There were no changes in the registrant’s internal controls over financial reporting that occurred during the second fiscal quarter of the period that has materially affected, or is reasonably likely to materially affect, the registrant’s internal control over financial reporting.
The following exhibits are attached to this Form N-CSR:
| | |
EXHIBIT NO. | | DESCRIPTION OF EXHIBIT |
| |
| 12 (a) (1) | | Code of Ethics that is subject to the disclosure of Item 2 hereof |
| |
| 12 (b) (1) | | Certification of Principal Executive Officer Pursuant to Section 302 of the Sarbanes-Oxley Act of 2002 |
| |
| 12 (b) (2) | | Certification of Principal Financial Officer Pursuant to Section 302 of the Sarbanes-Oxley Act of 2002 |
| |
| 12 (c) | | Certification of Principal Executive Officer and Principal Financial Officer Pursuant to Section 906 of the Sarbanes-Oxley Act of 2002 |
SIGNATURES
Pursuant to the requirements of the Securities Exchange Act of 1934 and the Investment Company Act of 1940, the registrant has duly caused this report to be signed on its behalf by the undersigned, thereunto duly authorized.
(Registrant): AllianceBernstein Global Bond Fund, Inc.
| | |
| By: | | /s/ Robert M. Keith |
| | Robert M. Keith President |
| |
| Date: | | November 21, 2014 |
Pursuant to the requirements of the Securities Exchange Act of 1934 and the Investment Company Act of 1940, this report has been signed below by the following persons on behalf of the registrant and in the capacities and on the dates indicated.
| | |
| By: | | /s/ Robert M. Keith |
| | Robert M. Keith President |
| |
| Date: | | November 21, 2014 |
| | |
| By: | | /s/ Joseph J. Mantineo |
| | Joseph J. Mantineo Treasurer and Chief Financial Officer |
| |
| Date: | | November 21, 2014 |