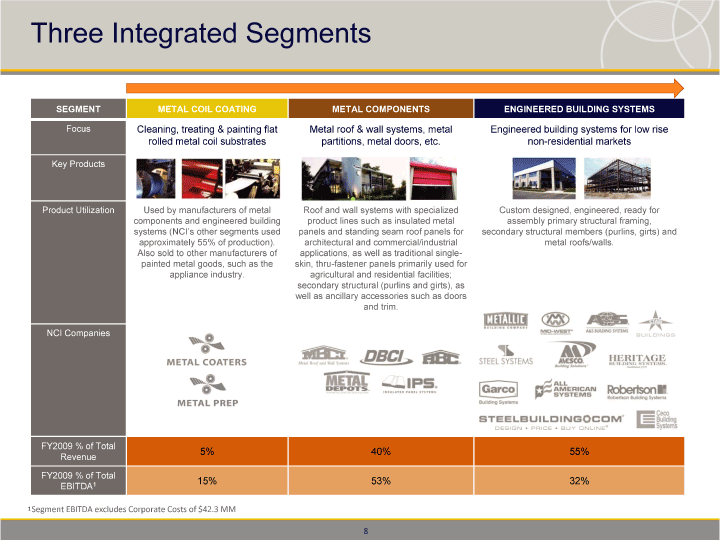
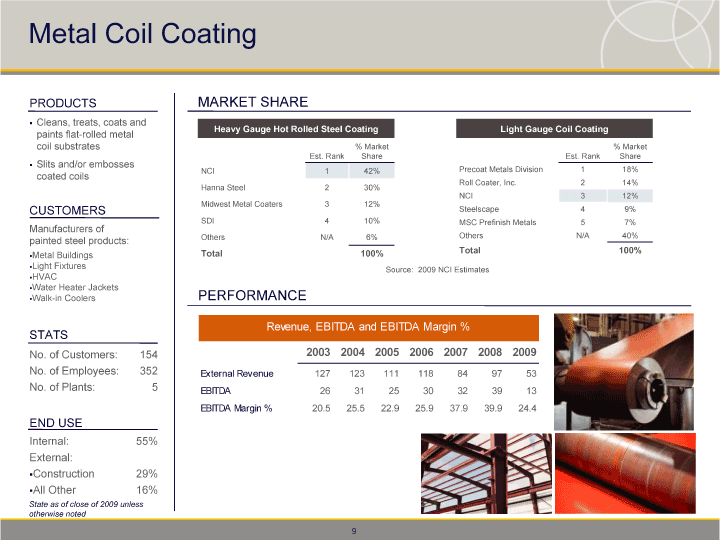
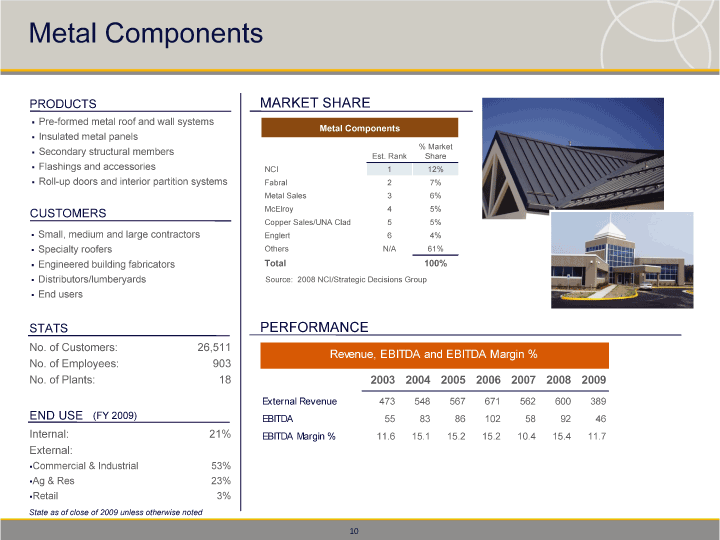
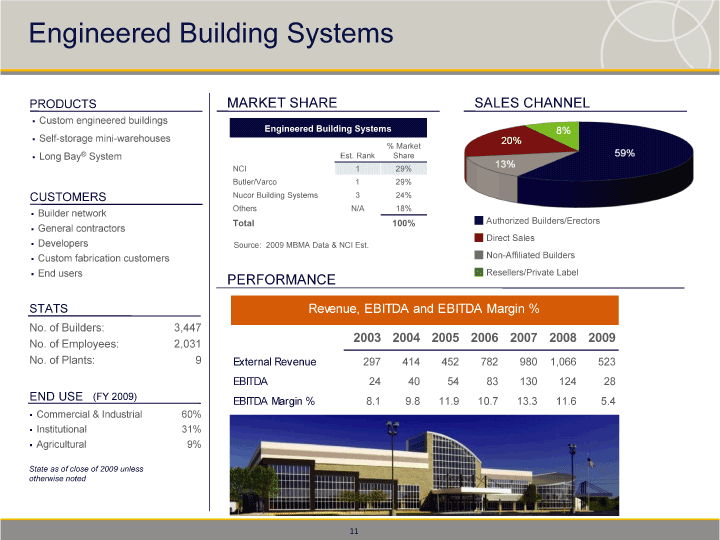
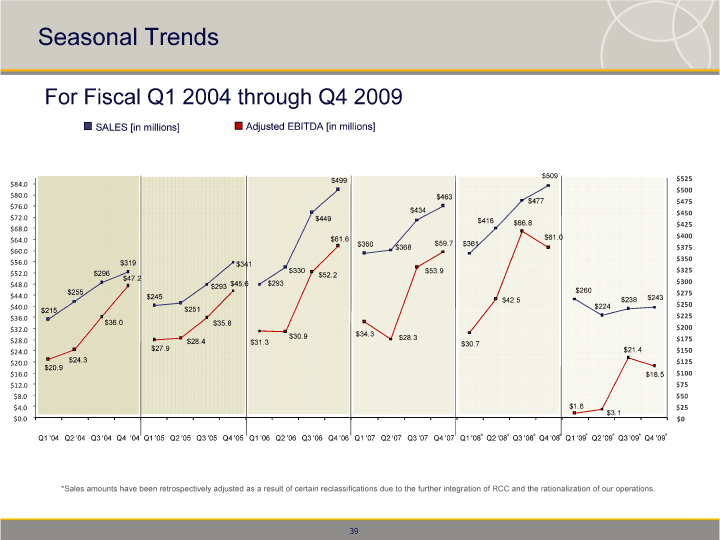
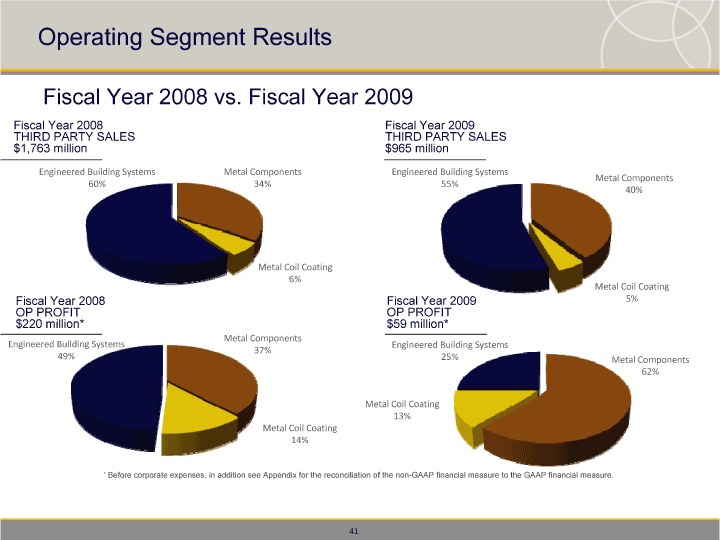
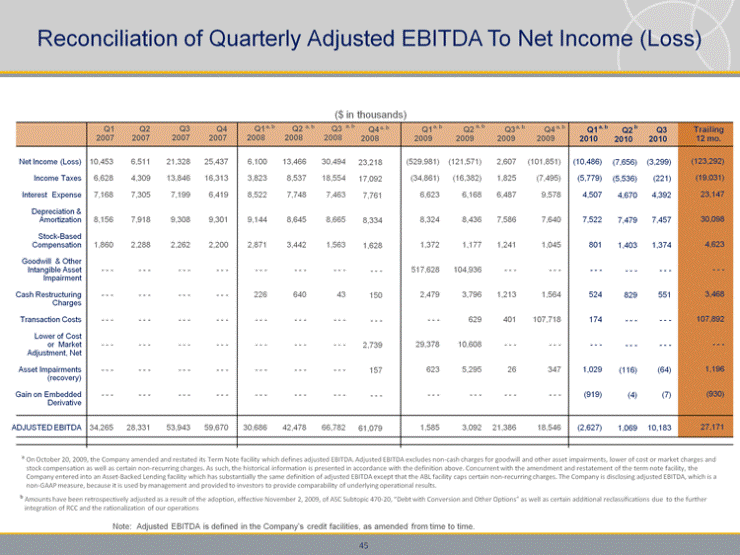
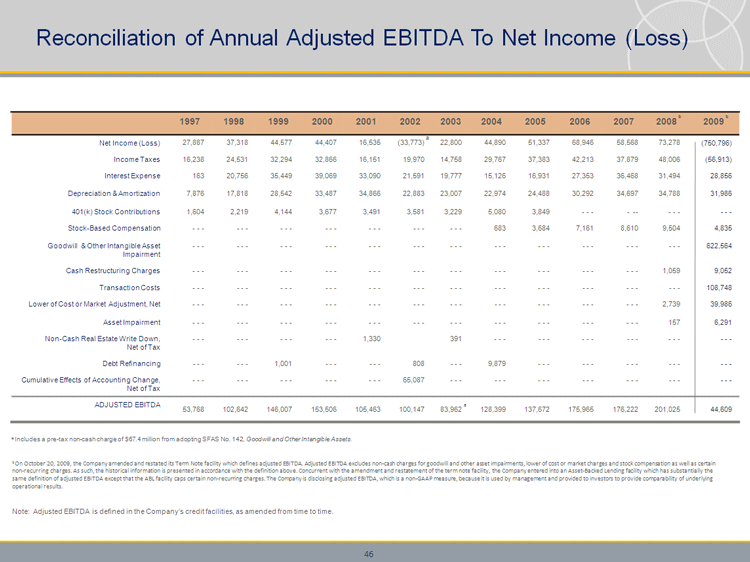
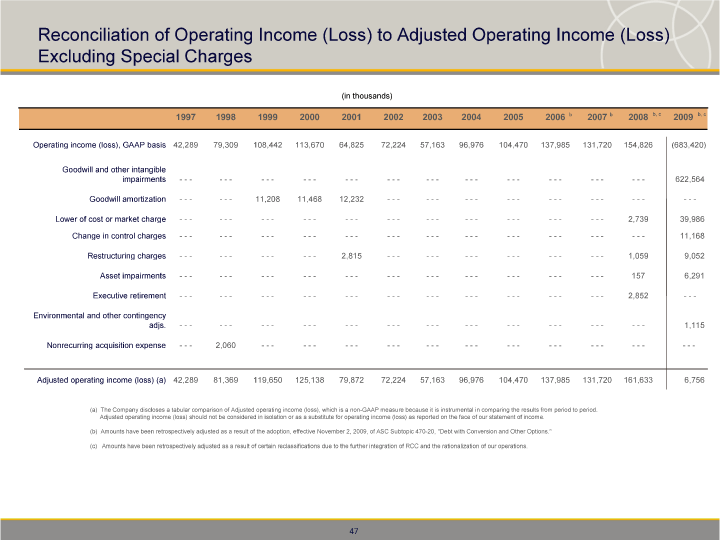
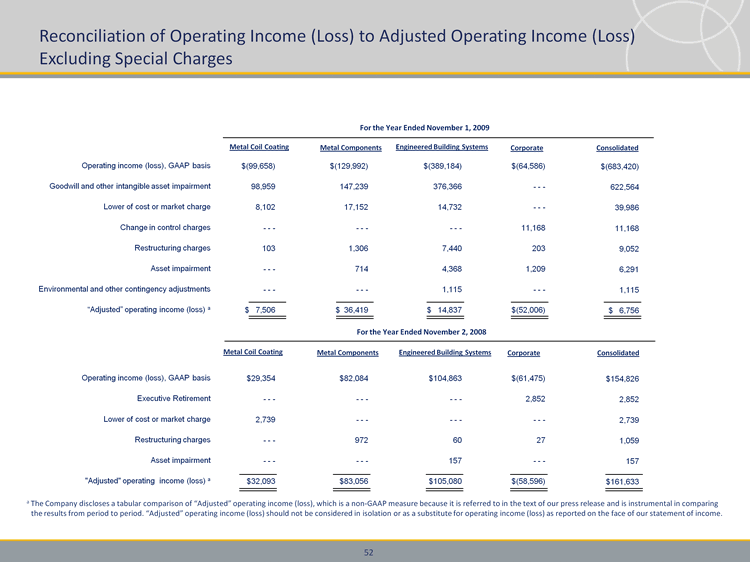
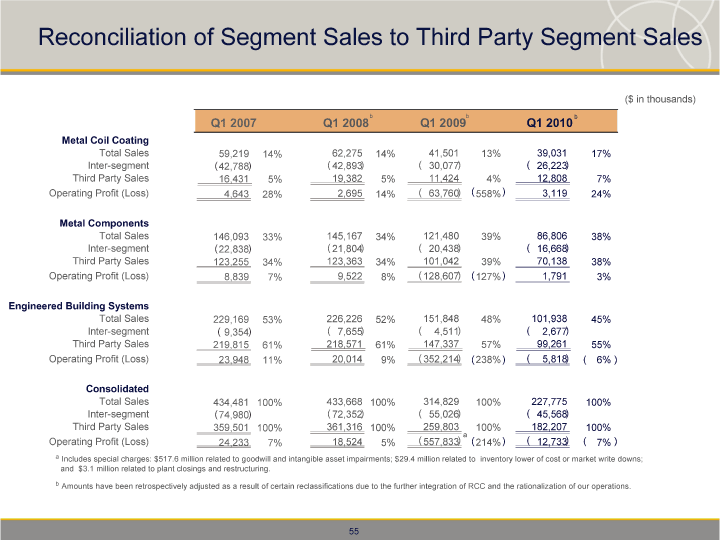
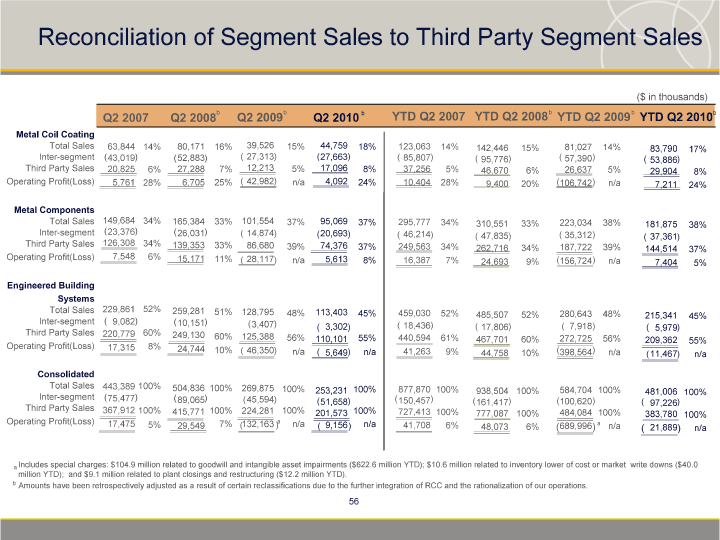
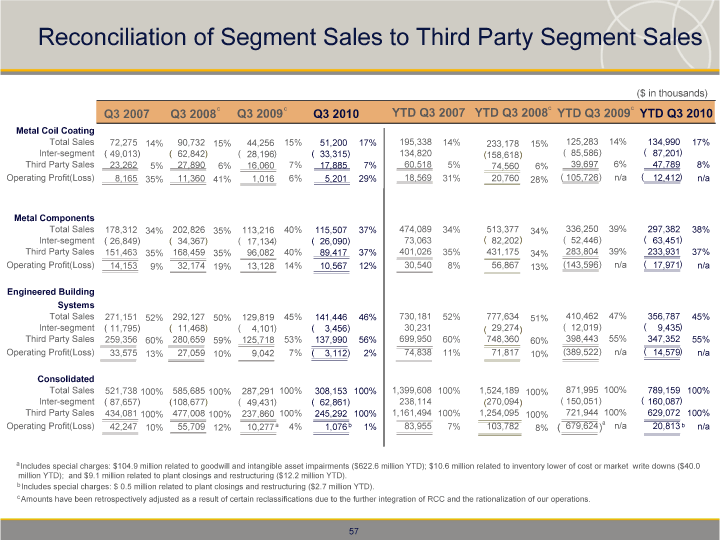
| Reconciliation of Segment Sales to Third Party Segment Sales ($ in thousands) Q3 2007 Q3 2008c Q3 2009c Q3 2010 YTD Q3 2007 YTD Q3 2008c YTD Q3 2009c YTD Q3 2010 Metal Coil Coating Total Sales 72,275 14% 90,732 15% 44,256 15% 51,200 17% 195,338 14% 233,178 15% 125,283 14% 134,990 17% Inter-segment ( 49,013) ( 62,842) ( 28,196) ( 33,315) 134,820 (158,618) ( 85,586) ( 87,201) Third Party Sales 23,262 5% 27,890 6% 16,060 7% 17,885 7% 60,518 5% 74,560 6% 39,697 6% 47,789 8% Operating Profit(Loss) 8,165 35% 11,360 41% 1,016 6% 5,201 29% 18,569 31% 20,760 28% ( 105,726) n/a ( 12,412) n/a Metal Components Total Sales 178,312 34% 202,826 35% 113,216 40% 115,507 37% 474,089 34% 513,377 34% 336,250 39% 297,382 38% Inter-segment ( 26,849) ( 34,367) ( 17,134) ( 26,090) 73,063 ( 82,202) ( 52,446) ( 63,451) Third Party Sales 151,463 35% 168,459 35% 96,082 40% 89,417 37% 401,026 35% 431,175 34% 283,804 39% 233,931 37% Operating Profit(Loss) 14,153 9% 32,174 19% 13,128 14% 10,567 12% 30,540 8% 56,867 13% (143,596) n/a ( 17,971) n/a Engineered Building Systems Total Sales 271,151 52% 292,127 50% 129,819 45% 141,446 46% 730,181 52% 777,634 51% 410,462 47% 356,787 45% Inter-segment ( 11,795) ( 11,468) ( 4,101) ( 3,456) 30,231 ( 29,274) ( 12,019) ( 9,435) Third Party Sales 259,356 60% 280,659 59% 125,718 53% 137,990 56% 699,950 60% 748,360 60% 398,443 55% 347,352 55% Operating Profit(Loss) 33,575 13% 27,059 10% 9,042 7% ( 3,112) 2% 74,838 11% 71,817 10% (389,522) n/a ( 14,579) n/a Consolidated Total Sales 521,738 100% 585,685 100% 287,291 100% 308,153 100% 1,399,608 100% 1,524,189 100% 871,995 100% 789,159 100% Inter-segment ( 87,657) (108,677) ( 49,431) ( 62,861) 238,114 (270,094) ( 150,051) ( 160,087) Third Party Sales 434,081 100% 477,008 100% 237,860 100% 245,292 100% 1,161,494 100% 1,254,095 100% 721,944 100% 629,072 100% Operating Profit(Loss) 42,247 55,709 10,277a 4% 1,076b 1% 83,955 7% 103,782 ( 679,624)a n/a 20,813 b n/a 10% 12% 8% a Includes special charges: $104.9 million related to goodwill and intangible asset impairments ($622.6 million YTD); $10.6 million related to inventory lower of cost or market write downs ($40.0 million YTD); and $9.1 million related to plant closings and restructuring ($12.2 million YTD). b Includes special charges: $0.5 million related to plant closings and restructuring ($2.7 million YTD). c Amounts have been retrospectively adjusted as a result of certain reclassifications due to the further integration of RCC and the rationalization of our operations. |
