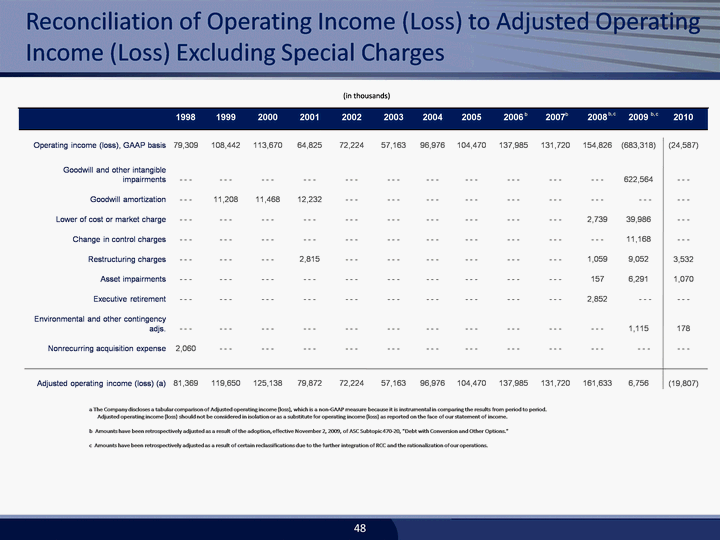
| Cash Flow 35 (750,796) 33,531 759,597 53,004 95,336 - - - - (21,657) 2,589 (19,068) (235,874) - - - - 250,000 (54,659) (451) (12,967) (53,951) (99) 22,218 a Includes $622.6 million for goodwill and other intangible asset impairment, $97.6 million debt extinguishment charge, $40 million lower of cost or market charge, $11.2 million change of control charges, $9.1 million restructuring charges and $6.3 million asset impairment. 2007 2005 2004 2003 2006 2008 44,890 22,974 10,029 (54,163) 23,730 - - - - (9,327) 3,316 (6,011) (243,750) 200,000 - - - - - - - - 20,049 (23,701) - - - - (5,982) 22,800 23,007 4,284 19,177 69,268 (4,310) (17,912) 3,891 (18,331) (48,550) - - - - - - - - (114) 2,401 (46,263) - - - - 4,674 51,337 24,488 14,540 27,902 118,267 (27,399) (19,524) 1,118 (45,805) (23,700) 180,000 - - - - (40,676) 4,408 120,032 - - - - 192,494 68,946 31,092 13,804 7,672 121,514 (366,598) (27,056) 308 (393,346) (78,511) 200,000 - - - - (37,572) 12,104 96,021 133 (175,678) 58,568 36,242 6,418 36,397 137,625 (20,086) (42,041) 5,764 (56,363) (91,447) 90,500 - - - - (36,122) 5,444 (31,625) 379 50,016 ($ in thousands) 2009 Net Income (Loss) Depreciation & Amortization Other Non-cash items Changes in Working Capital Operating Cash Flow Acquisitions Capital Expenditures Other Investing Cash Flow Debt Repayment Debt Issuance Convertible Preferred Stock Refinancing Costs Stock Repurchases Other Financing Cash Flow Exchange rate changes Net Increase (Decrease) in Cash Operating Cash Flow Investing Cash Flow Financing Cash Flow a a b 73,278 36,333 19,727 (89,144) 40,194 - - - - (24,803) 6,113 (18,690) (26,529) - - - - - - - - (2,226) (1) (28,756) 399 (6,853) b Includes ($13.0) million and ($10.1) million for restricted cash for cash collateralized letters of credit from fiscal 2009 and 2010, respectively. 2010 (26,877) 34,504 5,311 (6,632) 6,306 - - - - (14,030) 767 (13,263) (15,669) - - - - - - - - (125) (381) 10,140 (6,035) (8) (13,000) b |

