UNITED STATES
SECURITIES AND EXCHANGE COMMISSION
Washington, D.C. 20549
FORM N-CSR
CERTIFIED SHAREHOLDER REPORT OF REGISTERED
MANAGEMENT INVESTMENT COMPANIES
Investment Company Act file number: 811-06557
RidgeWorth Funds
(Exact name of registrant as specified in charter)
RidgeWorth Capital Management, Inc.
3333 Piedmont Road NE, Suite 1500
Atlanta, GA 30305
(Address of principal executive offices)(Zip code)
| (Name and Address of Agent for Service) | Copy to: | |
Julia Short RidgeWorth Funds 3333 Piedmont Road NE, Suite 1500 Atlanta, GA 30305 | Thomas Harman, Esq. Bingham McCutchen LLP 2020 K Street, NW Washington, DC 20006 |
Registrant’s telephone number, including area code: 1-888-784-3863
Date of fiscal year end: March 31
Date of reporting period: March 31, 2013
| Item 1. | Reports to Shareholders. |

Collective Strength. Individual Insight.®
2013 ANNUAL REPORT
EQUITY FUNDS
MARCH 31, 2013

RidgeWorth Investments® is the trade name of RidgeWorth Capital Management, Inc.
Collective Strength. Individual Insight.® is a federally registered service mark of RidgeWorth Investments.®
TABLE OF CONTENTS
RIDGEWORTH FUNDS March 31, 2013
RIDGEWORTH FUNDS March 31, 2013
Dear Valued Client,
We are pleased to report that both the economy and the broader markets continued to recover over the past year, despite persistent global economic and financial challenges. We are also pleased to report that RidgeWorth Funds maintained its strong long-term investment performance record. This update will discuss recent events and identify what we anticipate for both the broad economy and the capital markets in 2013.
Before we begin, we want to thank you, our valued RidgeWorth Funds’ shareholders, for your continued business and support. We focus all of our efforts on helping you achieve your investment goals, and we are grateful that you have placed your confidence in us. Our sole mission is to earn your trust through providing competitive investment performance and excellent client service. We sincerely hope we have met your expectations in both of these measures and we look forward to continuing as your asset manager in the future.
In last year’s letter, we discussed why we remained positive regarding our outlook for the economy and the markets: improving job growth, a continued recovery in housing, low interest rates, accommodative global monetary policy, and reasonable equity valuations. However, we cautioned that many of the challenges that affected the markets over the past several years would likely remain, including fiscal and financial strains in the European Union (“EU”), persistent unemployment, volatile energy prices, and record federal deficits. We also added to that list the growing political dysfunction in Washington and the potential damage that could result from going over the “fiscal cliff.” We suggested that the net effect of these forces would likely be continued, but slower than normal growth, and that this would persuade the Federal Reserve (“Fed”) to maintain its low interest rate policy.
Indeed, the economy experienced a soft growth patch at the beginning of the latest fiscal year that ended March 31, 2013. This sluggishness countered much of the unexpected strength early in 2012, and prompted many analysts to lower growth and earnings forecasts. While growth slowed noticeably, we believe it is important to note that employers did not use the environment to initiate a new round of corporate restructuring and effect widespread layoffs. Instead, they continued to leverage the improved efficiencies won during the painful recession and maintained cyclically solid profit margins, an important sign of stability. Moreover, underneath the surface strains in the economy, the consumer showed steady improvement as shown in increased auto purchases, higher home sales and prices, and falling loan delinquency rates. The steady, though only modest, growth in employment and incomes along with improving home values allowed the consumer to continue rebuilding his battered balance sheet and confidence.
While the consumer and business segments of the economy continue to recover, the federal government struggled with record budget deficits and unsustainable long-term spending commitments. The fiscal cliff battles resulted in higher payroll and income tax rates at the beginning of 2013, while efforts to reach a long-range budget compromise only resulted in a painful sequester fallback agreement that began on March 1, 2013. The effects on the economy of both of these events are only just beginning.
Against the generally improving domestic economic backdrop, the rest of the global economy experienced some weakness as shown in the recession in the EU and deceleration in the emerging market economies such as China and Brazil. With global economic growth still soft by historic standards, financial strains remained a key focus for central banks, and policy makers around the globe are feeling pressure to contain and alleviate the mounting stress. The banking failure in the tiny island nation of Cyprus in March 2013 reinforced the notion that the work to restore economic and financial stability is not over.
Despite worrisome events, strains, and crosswinds, both here and overseas, U.S. equity markets generated healthy returns and finished at record highs on the last day of March 2013. The benchmark S&P 500 Index returned just under 14% (13.96%) including dividends for the twelve months ended March 31, 2013, which was above the long-term average annual gain. The Russell Mid-Cap and the Russell 2000 (small cap) indices rose an even more impressive 17.30% and 16.30%, respectively. Defensive sectors such as Health Care, Consumer Staples, and Telecommunications outperformed during the 12 months, and the Value style bested the Growth style following an extended period of underperformance. Markets outside the U.S. improved but lagged domestic indices, with the MSCI EAFE and MSCI Emerging Markets indices up 11.27% and 1.96%, respectively.
Fixed income markets also shared in the advance during the past year, helped by the Fed’s decision to continue buying securities and from the global turmoil, supporting the belief that the U.S. Treasury market is the safest haven in the world. However, with Treasury yields hovering near record low levels, many investors preferred higher-yielding corporate and high yield bonds, which significantly outperformed the 3.77% gain in the Barclays Capital U.S. Aggregate Bond Index.
1
LETTER TO SHAREHOLDERS (concluded)
RIDGEWORTH FUNDS March 31, 2013
RidgeWorth Funds continued to maintain its record of strong long-term performance as 75% of our Funds beat their Lipper Peer Group medians for the 5-year period ended March 31, 20131. In addition, 75% of our Funds finished in the first or second quartile for the 10-year period1.
Looking ahead domestically, we expect the below-average growth and low inflation that characterized 2012 to continue in 2013, though we believe many of the economic headwinds of recent years, such as excess consumer leverage, may further dissipate. We anticipate modest job gains with less drag from the state and local governments and we believe housing will remain a neutral to positive influence on growth, wealth, and confidence. Corporate balance sheets are strong, cash positions are substantial, and inventories do not appear bloated, suggesting limited downside risk. Globally, we expect continued accommodative monetary policies and low interest rates. Valuations rose in the first quarter but they are still relatively attractive, in historical terms.
All that said, with the economy expanding the risks of setbacks should not be minimized. Key metrics we are following, in addition to those mentioned above, remain job growth, political, fiscal and monetary policy, EU stability efforts, income growth, housing prices, transportation data, stability in operating and net margins, consensus earnings, and cash flow estimates.
We believe the markets will continue to offer opportunities to investors, but they will be more selective and company-specific, an environment that fits well with RidgeWorth’s bottom-up approach to security selection. We at RidgeWorth wish to again thank you for the trust and confidence you have placed in us, and we look forward to another good year together.
Sincerely,

Ashi Parikh
Chairman, CEO, CIO
RidgeWorth Investments®
| 1 | For the period ended March 31, 2013, 50% (16/32), 56% (18/32), 75% (24/32) and 75% (21/28) of the RidgeWorth Funds (I Shares) beat their Lipper peer group medians for the 1-, 3-, 5- and 10-year periods, respectively. The Lipper rankings are as of March 31, 2013, for I Shares only, based on total returns and do not reflect a sales charge. ©2013 Lipper Leader, Reuters. All Rights Reserved. Lipper Ratings are according to Lipper, a Thomson Reuters Company. Past performance is not indicative of future results. |
2
Portfolio Managers
| Ÿ | Nancy Zevenbergen, CFA, CIC |
| Ÿ | Brooke de Boutray, CFA, CIC |
| Ÿ | Leslie Tubbs, CFA, CIC |
INVESTMENT CONCERNS
Equity securities (stocks) are more volatile and carry more risk than other forms of investments, including investments in high-grade fixed income securities. The net asset value per share of this Fund will fluctuate as the value of the securities in the portfolio changes. Common stocks, and funds investing in common stocks, generally provide greater return potential when compared with other types of investments.
Small- and Mid-capitalization funds typically carry additional risks since smaller companies generally have a higher risk of failure.
MANAGEMENT DISCUSSIONOF FUND PERFORMANCE
How did the Fund perform against its benchmark for the fiscal year ended March 31, 2013?
With fiscal cliff and sequester headwinds addressed in a relatively undisruptive manner, equity markets were free to run in first quarter 2013, but the preceding nine months were difficult for active managers to deliver alpha in the face of consistently high equity correlations. Though growth strategies advanced, value was clearly favored for the entire year. Early Fund underperformance (primarily May 2012) was unable to be made up over the balance of the year (despite a rebound in first quarter 2013), and the RidgeWorth Aggressive Growth Stock Fund I Shares underperformed the Russell 3000® Growth Index (the Fund’s benchmark), 1.84% versus 10.42% for the fiscal year.
What factors influenced the Fund’s performance for the fiscal year ended March 31, 2013?
Stock selection within Technology and Health Care accounted for nearly 75% of relative underperformance for the period.
Shares of specific Information Technology holdings such as VeriFone Systems, Inc., a secure electronic payment solutions company and F5 Networks, Inc., a network-application delivery equipment company remained dis-favored by investors who believed the capex/investment cycle would further pressure hardware average selling prices and erode competitive advantages. Though equipment prices were not affected, both companies experienced delayed order development due to macro concerns. In conjunction with VeriFone’s reduced forward guidance and unexpected executive management changes, the position was sold during first quarter 2013.
Fund Health Care holding, MAKO Surgical was buffeted by lower than expected system sales and procedures. Management changes, sales compensation adjustments and continued lukewarm adoption of the RIO® system, a robotic arm technology for hip procedures, led us to use the position as a source of funds towards the purchase of other Health Care holdings that added value over the fiscal year.
Financials was the only sector to post annual relative outperformance. Portfolio Recovery Associates, Inc. (outsourced receivables management) reported four sequential quarters of revenue and earnings that exceeded expectations in testament to the company’s ability to recover “uncollectable” assets.
Though Consumer Discretionary holdings experienced modest relative underperformance, the Fund’s top two aggregate contributors hailed from the sector. Netflix, Inc. capped a turbulent year with shares gaining more than 64% for the period. Continued improvements to programming and user experience are driving higher retention and subscriber growth for domestic video streaming. Amazon.com, Inc. continues to benefit from online purchasing experience and demand for digital content. Aggressive investments and innovation by the company make it a disruptor in retail, cloud services, mobile devices, media and digital content. Rapidly growing smartphone and tablet users (proven to have higher propensity to spend online) should also provide a tailwind to revenues.
How do you plan to position the Fund, based on market conditions?
Despite four straight years of significant equity market returns, U.S. stocks still present an appealing risk-reward proposition for the years ahead. A broad-based push to reduce risk and volatility through over diversification provides more reason to believe in individual equity opportunities than any time in recent memory. Volatility creates opportunity. Valuations become extremely distorted when negativity rules. Embracing risk has allowed us to be opportunistic, tune out the noise during difficult environments and take a long-term ownership perspective. Stock specific risk is the lowest it’s been in the last 25 years, which alone could lead to fundamentally based stock selection as a winning strategy in coming years.
3
AGGRESSIVE GROWTH STOCK FUND
Growth of a $10,000 Investment (as of March 31, 2013)
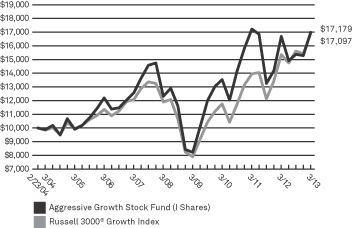 | This chart assumes an initial hypothetical investment of $10,000 made on 2/23/04 (the inception date). Total return is based on net change in the Net Asset Value (“NAV”) assuming reinvestment of distributions. Returns shown on this page include reinvestment of all dividends and other distributions.
The Fund’s performance is compared to the Russell 3000® Growth Index, which measures the performance of the broad growth segment of the U.S. equity universe. It includes those Russell 3000® companies with higher price-to-book ratios and higher forecasted growth values. The Index is unmanaged and does not reflect the deduction of fees, such as investment and fund accounting fees, associated with a mutual fund. Investors cannot invest directly in an index. |
| Average Annual Total Returns as of 3/31/13 | ||||||||||||||||||||
| Aggressive Growth Stock Fund | Inception Date | 1 Year | 3 Year | 5 Year | Since Inception | |||||||||||||||
A Shares | without sales charge | 2/23/2004 | 1.63% | 7.76% | 6.48% | 5.81% | ||||||||||||||
| with sales charge* | –4.22% | 5.66% | 5.23% | 5.13% | ||||||||||||||||
I Shares | 2/23/2004 | 1.84% | 8.07% | 6.78% | 6.13% | |||||||||||||||
| Russell 3000® Growth Index | 10.42% | 13.19% | 7.44% | 6.08% | ** | |||||||||||||||
| Prospectus Expense Ratio1 | Gross | |||||||||||||||||||
| A Shares | 1.41% | |||||||||||||||||||
| I Shares | 1.03% | |||||||||||||||||||
Because equity markets may be volatile in the short-term, resulting in unusually high or low performance, investors should evaluate long-term performance before making an investment.
Past performance does not guarantee future results. The performance data quoted represents past performance and current returns may be lower or higher. Total return figures include change in share price, reinvestment of dividends and capital gains and do not reflect taxes that a shareholder would pay on fund distributions or on the redemption of fund shares. The investment return and principal value will fluctuate so that an investor’s shares, when redeemed, may be worth more or less than the original cost. For performance data current to the most recent month end, visit our website at www.ridgeworth.com.
| * | Class A Share performance reflects the maximum front-end sales charge of 5.75%. |
| ** | The performance return and the hypothetical $10,000 investment for the Russell 3000® Growth Index is for the period from 2/29/04 to 3/31/13. |
| 1 | This information is included in the most current prospectus available to current and prospective shareholders of the Fund. Additional information pertaining to the 3/31/13 expense ratios can be found in the financial highlights. |
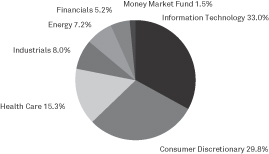
Sector Weightings (as of March 31, 2013)
as a percentage of investments
4
Portfolio Manager
| Ÿ | Chad Deakins, CFA |
INVESTMENT CONCERNS
International investing involves increased risk and volatility due to interest rate, currency exchange rate, economic, and political risks.
Equity securities (stocks) are more volatile and carry more risk than other forms of investments, including investments in high-grade fixed income securities. The net asset value per share of this Fund will fluctuate as the value of the securities in the portfolio changes.
MANAGEMENT DISCUSSION OF FUND PERFORMANCE
How did the Fund perform against its benchmark for the fiscal year ended March 31, 2013?
The MSCI EAFE Index (the Fund’s benchmark) had an 11.27% net return for the one-year period ended March 31, 2013. The Belgian market led other international markets with a return of 27.69%. New Zealand, Australia and Switzerland followed with returns of 22.71%, 22.20% and 21.65% respectively. Italy and Israel lagged other markets with negative returns for the year, -6.81% and -6.09% respectively. MSCI EAFE Growth stocks led versus MSCI EAFE Value stocks marginally. Large caps beat small caps and developed markets led emerging markets.
The RidgeWorth International Equity Fund I Shares returned 10.38% for the fiscal year ended March 31, 2013.
What factors influenced the fund’s performance for the fiscal year ended March 31, 2013?
The Fund’s attention to the business cycle, strategic allocation and risk control resulted in an uneven outcome this year as the global economic recovery, while intact, softened. The Fund maintained an overweighting in cyclical sectors with the belief that the global economic recovery will continue. The global equity markets continue to rise. However, the defensive sectors such as Health Care and Consumer Staples led other sectors with returns of 26.24% and 20.96%, respectively.
How do you plan to position the Fund, based on market conditions?
As the global economic expansion matures, it remains clear that economic and fiscal health varies from country to country. While such an incident as a banking crisis in Cyprus could still emerge, central banks around the world have shown the resolve that they will act in a crisis and stimulate the economy in weakness. Global equity markets have priced in some positive trends in the global economy as markets are trading close to historic averages in terms of valuations. We are selective and await the earnings momentum improvements, which should support market trends while keeping valuations in check.
5
INTERNATIONAL EQUITY FUND
Growth of a $10,000 Investment (as of March 31, 2013)
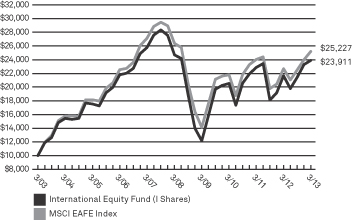 | This chart assumes an initial hypothetical investment of $10,000 made on 3/31/03. Total return is based on net change in the Net Asset Value (“NAV”) assuming reinvestment of distributions. Returns shown on this page include reinvestment of all dividends and other distributions.
The Fund’s performance is compared to the Morgan Stanley Capital International Europe, Australasia and Far East (“MSCI EAFE”) Index, which is a free float-adjusted market capitalization index that is designed to measure the equity market performance of developed markets, excluding the U.S. & Canada. The MSCI EAFE Index consists of 21 developed market country indices. EAFE performance data is calculated in U.S. dollars and in local currency. The Index is unmanaged and does not reflect the deduction of fees, such as investment and fund accounting fees, associated with a mutual fund. Investors cannot invest directly in an index. |
| Average Annual Total Returns as of 3/31/13 | ||||||||||||||||
| International Equity Fund | 1 Year | 3 Year | 5 Year | 10 Year | ||||||||||||
A Shares | without sales charge | 9.95% | 4.87% | –0.96% | 8.76% | |||||||||||
| with sales charge* | 3.62% | 2.81% | –2.12% | 8.11% | ||||||||||||
I Shares | 10.38% | 5.19% | –0.64% | 9.11% | ||||||||||||
| MSCI EAFE Index | 11.27% | 5.01% | –0.88% | 9.70% | ||||||||||||
| Prospectus Expense Ratio1 | Gross | |||||||||||||||
| A Shares | 1.40% | |||||||||||||||
| I Shares | 1.07% | |||||||||||||||
Because equity markets may be volatile in the short-term, resulting in unusually high or low performance, investors should evaluate long-term performance before making an investment.
Past performance does not guarantee future results. The performance data quoted represents past performance and current returns may be lower or higher. Total return figures include change in share price, reinvestment of dividends and capital gains and do not reflect taxes that a shareholder would pay on fund distributions or on the redemption of fund shares. The investment return and principal value will fluctuate so that an investor’s shares, when redeemed, may be worth more or less than the original cost. For performance data current to the most recent month end, visit our website at www.ridgeworth.com.
| * | Class A Share performance reflects the maximum front-end sales charge of 5.75%. |
| 1 | This information is included in the most current prospectus available to current and prospective shareholders of the Fund. Additional information pertaining to the 3/31/13 expense ratios can be found in the financial highlights. |
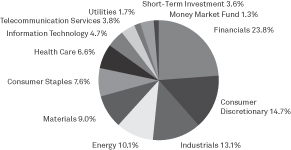
Sector Weightings (as of March 31, 2013)
as a percentage of investments
6
INTERNATIONAL EQUITY INDEX FUND
Portfolio Managers
| Ÿ | Chad Deakins, CFA |
INVESTMENT CONCERNS
International investing involves increased risk and volatility due to interest rate, currency exchange rate, economic, and political risks.
Equity securities (stocks) are more volatile and carry more risk than other forms of investments, including investments in high-grade fixed income securities. The net asset value per share of this Fund will fluctuate as the value of the securities in the portfolio changes.
Small- and Mid-capitalization funds typically carry additional risks since smaller companies generally have a higher risk of failure.
It is important to remember that there are risks associated with index investing, including the potential risk of market decline, as well as the risks associated with investing in specific companies.
MANAGEMENT DISCUSSIONOF FUND PERFORMANCE
How did the Fund perform against its benchmark for the fiscal year ended March 31, 2013?
The MSCI EAFE GDP Weighted Index Net Dividend (the Fund’s benchmark) had a 9.40% net return for the one-year period ended March 31, 2013. The Belgian market led other international markets with a return of 27.69%. New Zealand, Australia and Switzerland followed with returns of 22.71%, 22.20% and 21.65%, respectively. Italy and Israel lagged other markets with negative returns for the year, -6.81% and -6.09%, respectively. MSCI EAFE Growth stocks led versus MSCI EAFE Value stocks marginally. Large caps beat small caps and developed markets led emerging markets.
The RidgeWorth International Equity Index Fund I Shares returned 8.62 % for the fiscal year ended March 31, 2013.
What factors influenced the fund’s performance for the fiscal year ended March 31, 2013?
The Fund’s stratified sampling methodology and efficient management of cash flows allowed the Fund to perform as expected, in line with the index on a gross performance basis. The underperformance relative to the benchmark is a result of expenses incurred by the Fund.
How do you plan to position the Fund, based on market conditions?
As the global economic expansion matures, it remains clear that economic and fiscal health varies from country to country. While such an incident as a banking crisis in Cyprus could still emerge, central banks around the world have shown the resolve that they will act in a crisis and stimulate the economy in weakness. Global equity markets have priced in some positive trends in the global economy as markets are trading close to historic averages in terms of valuations. We await the earnings momentum improvements, which should support market trends while keeping valuations in check.
7
INTERNATIONAL EQUITY INDEX FUND
Growth of a $10,000 Investment (as of March 31, 2013)
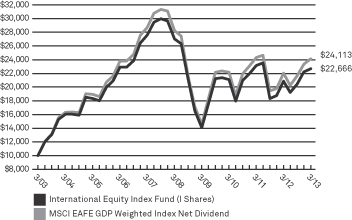 | This chart assumes an initial hypothetical investment of $10,000 made on 3/31/03. Total return is based on net change in the Net Asset Value (“NAV”) assuming reinvestment of distributions. Returns shown on this page include reinvestment of all dividends and other distributions.
The Fund’s performance is compared to the Morgan Stanley Europe Australasia and Far East (“MSCI EAFE”) GDP Weighted Index Net Dividend, which is a market capitalization index that measures market equity performance based upon indices from foreign and developed countries. The country weighting of the Index is calculated using the gross domestic product of each of the various countries and then with respect of the market capitalization of the various companies operating in each country. The Index is unmanaged and does not reflect the deduction of fees, such as investment and fund accounting fees, associated with a mutual fund. Investors cannot invest directly in an index. |
| Average Annual Total Returns as of 3/31/13 | ||||||||||||||||
| International Equity Index Fund | 1 Year | 3 Year | 5 Year | 10 Year | ||||||||||||
A Shares | without sales charge | 8.33% | 2.10% | –3.74% | 8.17% | |||||||||||
| with sales charge* | 2.08% | 0.10% | –4.87% | 7.54% | ||||||||||||
I Shares | 8.62% | 2.40% | –3.45% | 8.53% | ||||||||||||
| MSCI EAFE GDP Weighted Index Net Dividend | 9.40% | 2.88% | –3.11% | 9.20% | ||||||||||||
| Prospectus Expense Ratio1 | Gross | |||||||||||||||
| A Shares | 1.04% | |||||||||||||||
| I Shares | 0.78% | |||||||||||||||
Because equity markets may be volatile in the short-term, resulting in unusually high or low performance, investors should evaluate long-term performance before making an investment.
Past performance does not guarantee future results. The performance data quoted represents past performance and current returns may be lower or higher. Total return figures include change in share price, reinvestment of dividends and capital gains and do not reflect taxes that a shareholder would pay on fund distributions or on the redemption of fund shares. The investment return and principal value will fluctuate so that an investor’s shares, when redeemed, may be worth more or less than the original cost. For performance data current to the most recent month end, visit our website at www.ridgeworth.com.
| * | Class A Share performance reflects the maximum front-end sales charge of 5.75%. |
| 1 | This information is included in the most current prospectus available to current and prospective shareholders of the Fund. Additional information pertaining to the 3/31/13 expense ratios can be found in the financial highlights. |
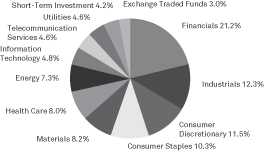
Sector Weightings (as of March 31, 2013)
as a percentage of investments
8
Portfolio Managers
| Ÿ | Christopher Guinther |
| Ÿ | Joe Ransom, CFA |
| Ÿ | Michael A. Sansoterra |
| Ÿ | Sandeep Bhatia, PhD, CFA |
INVESTMENT CONCERNS
Equity securities (stocks) are more volatile and carry more risk than other forms of investments, including investments in high-grade fixed income securities. The net asset value per share of this Fund will fluctuate as the value of the securities in the portfolio changes. Common stocks, and funds investing in common stocks, generally provide greater return potential when compared with other types of investments.
Small- and Mid-capitalization funds typically carry additional risks since smaller companies generally have a higher risk of failure.
Large cap stock can perform differently from other segments of the equity market or the equity market as a whole. Large capitalization companies may be less flexible in evolving markets or unable to implement change as quickly as smaller capitalization companies.
MANAGEMENT DISCUSSION OF FUND PERFORMANCE
How did the Fund perform against its benchmark for the fiscal year ended March 31, 2013?
For the fiscal year ended March 31, 2013, the RidgeWorth Large Cap Growth Stock Fund I Shares returned 3.64% while the Russell 1000® Growth Index (“benchmark”) returned 10.09%. The Fund underperformed the benchmark for the fiscal year as the defensive sectors of the benchmark performed well. Three of the Fund’s economic sectors lagged the returns for their comparable sectors within the Russell 1000® Growth Index—Health Care, Consumer Staples and Consumer Discretionary. The bright spot for the last 12 months was good stock selection within the Industrials sector.
What factors influenced the Fund’s performance for the fiscal year ended March 31, 2013?
The S&P 500 Index reached an all-time new high on the final trading day of March, while the Russell 1000® Growth Index broke out to the upside earlier during the fiscal year. Better than expected economic news coupled with reasonable valuations, steady job growth, rising home prices, monetary stimulus and improving global economic momentum propelled the market to a new high. While the new record for the market is good news, the power behind the move came mostly from the defensive sectors of the market—Health Care, Utilities and Consumer Staples. The pro-cyclical sectors dramatically lagged the broader market giving further evidence that investors are still nervous and climbing “the wall of worry”.
Problematic stock selection within the Consumer area of the market hampered short term results. Monster Beverage Corp., a Consumer Staples company selling energy drinks, declined in a rising market due to the product’s safety concerns and worries over slowing growth. Investors have been punishing the stock since the company reported disappointing earnings in November 2012. Green Mountain Coffee Roasters Inc., another Consumer Staples holding, also declined after reporting weaker than expected sales and earnings. Within the Consumer Discretionary sector, Coach Inc., a designer, marketer and distributor of handbags and accessories has been losing market share to a new competitor. Investors punished the stock fearing that the future growth will be less than expected. Several of the Fund’s Health Care holdings also lost value. Intuitive Surgical Inc., a robotic surgical systems company, declined by more than 10% as the company made cautionary remarks about the European Union’s macroeconomic weakness negatively impacting European procedure growth. In addition, several biotechnology stocks within the benchmark that were not owned in the Fund rallied causing additional relative underperformance.
How do you plan to position the Fund, based on market conditions?
The portfolio management team does not attempt to position the Fund based on predictions of macroeconomic conditions. The strategy utilizes a balanced approach to stock selection. This balanced approach, combined with multi-dimensional risk decomposition tools, allows the portfolio managers to control active risk through portfolio construction. The portfolio managers actively monitor the components of the systematic risk and aim to ensure that most of the risk relative to the index is derived from non-systematic (stock specific) risk. Sector rotation and tactical sector allocations are generally not utilized. The portfolio will be relatively sector and characteristic neutral to the index as the investment team attempts to generate alpha through superior, bottom-up stock selection. The team believes that its investment strategy is objective, balanced and designed to enable outperformance in most market cycles.
9
LARGE CAP GROWTH STOCK FUND
The Fund will invest in companies with reasonable valuations and improving fundamentals. Generally, the companies invested in will have shown year-over- year increases in operating margins, growth in revenues and exhibit improving financial returns as measured by return on incremental invested capital. By combining the income statement, balance sheet and cash flow metrics to evaluate earnings quality, capital efficiency and relative valuations, the portfolio managers avoid concentrating on a single attribute. Therefore, the team seeks to eliminate investment results that are directly attributed to market conditions and add alpha through stock selection.
Growth of a $10,000 Investment (as of March 31, 2013)
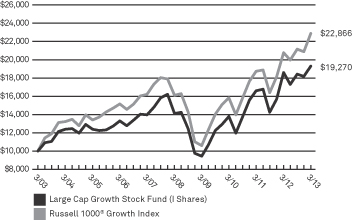 | This chart assumes an initial hypothetical investment of $10,000 made on 3/31/03. Total return is based on net change in the Net Asset Value (“NAV”) assuming reinvestment of distributions. Returns shown on this page include reinvestment of all dividends and other distributions.
The Fund’s performance is compared to the Russell 1000® Growth Index, which measures the performance of the large-cap growth segment of the U.S. equity universe. It includes those Russell 1000® companies with higher price-to-book ratios and higher forecasted growth values. The Index is unmanaged and does not reflect the deduction of fees, such as investment and fund accounting fees, associated with a mutual fund. Investors cannot invest directly in an index. |
| Average Annual Total Returns as of 3/31/13 | ||||||||||||||||
| Large Cap Growth Stock Fund | 1 Year | 3 Year | 5 Year | 10 Year | ||||||||||||
A Shares | without sales charge | 3.43% | 11.56% | 6.17% | 6.37% | |||||||||||
| with sales charge* | –2.52% | 9.39% | 4.91% | 5.75% | ||||||||||||
C Shares | without CDSC | 2.69% | 10.81% | 5.44% | 5.70% | |||||||||||
| with CDSC* | 2.15% | 10.81% | 5.44% | 5.70% | ||||||||||||
I Shares | 3.64% | 11.87% | 6.47% | 6.78% | ||||||||||||
| Russell 1000® Growth Index | 10.09% | 13.06% | 7.30% | 8.62% | ||||||||||||
| Prospectus Expense Ratio1 | Gross | |||||||||||||||
| A Shares | 1.22% | |||||||||||||||
| C Shares | 1.80% | |||||||||||||||
| I Shares | 0.83% | |||||||||||||||
Because equity markets may be volatile in the short-term, resulting in unusually high or low performance, investors should evaluate long-term performance before making an investment.
Past performance does not guarantee future results. The performance data quoted represents past performance and current returns may be lower or higher. Total return figures include change in share price, reinvestment of dividends and capital gains and do not reflect taxes that a shareholder would pay on fund distributions or on the redemption of fund shares. The investment return and principal value will fluctuate so that an investor’s shares, when redeemed, may be worth more or less than the original cost. For performance data current to the most recent month end, visit our website at www.ridgeworth.com.
| * | Class A Share performance reflects the maximum front-end sales charge of 5.75% and Class C Shares reflect the maximum CDSC (contingent deferred sales charge) of 1.00% in year one only. |
| 1 | This information is included in the most current prospectus available to current and prospective shareholders of the Fund. Additional information pertaining to the 3/31/13 expense ratios can be found in the financial highlights. |
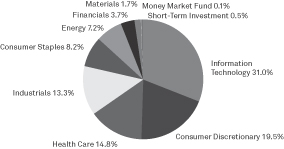
Sector Weightings (as of March 31, 2013)
as a percentage of investments
10
Portfolio Manager
| Ÿ | Mills Riddick, CFA |
INVESTMENT CONCERNS
Equity securities (stocks) are more volatile and carry more risk than other forms of investments, including investments in high-grade fixed income securities. The net asset value per share of this Fund will fluctuate as the value of the securities in the portfolio changes.
Value-based investments are subject to the risk that the broad market may not recognize their intrinsic value.
MANAGEMENT DISCUSSION OF FUND PERFORMANCE
How did the Fund perform against its benchmark for the fiscal year ended March 31, 2013?
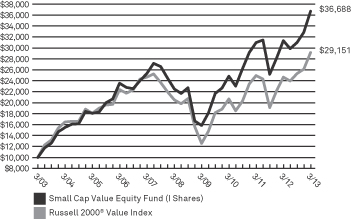
For the fiscal year ended March 31, 2013, the RidgeWorth Large Cap Value Equity Fund I Shares returned 16.24% compared to a 18.77% return for the Russell 1000® Value Index (“benchmark”).
What factors influenced the Fund’s performance for the fiscal year ended March 31, 2013?
The primary reasons for underperformance relative to the benchmark was stock selection in the Information Technology, Telecommunication Services and Energy sectors. In Information Technology, Hewlett-Packard Co. detracted from performance owing to worse than expected personal computer sales as Windows 8 was not the catalyst analysts anticipated. In Telecommunication Services, Windstream Corp. detracted from performance following the announcement that the company was discontinuing certain segments of business from its Paetec acquisition. As a result, investors feared that the company would have to cut its dividend, as similar companies had already cut their dividends. This put pressure on the company’s share price, leading to its underperformance. In Energy, Occidental Petroleum Corp. detracted from performance as returns deteriorated due to cost inflation. Management has since initiated a cost reduction plan.
Positive contributors to performance were stock selection and our underweight positions in the Utilities and Financials sectors. Stock selection in the Consumer Staples sector was also a positive contributor to performance. In Utilities, PG&E Corp. outperformed as risks surrounding the San Bruno fire began to dissipate. In Financials, BlackRock Inc. outperformed, beating first quarter earnings expectations and experienced increased asset growth in its active and passive funds. Additionally, BlackRock increased its quarterly dividend and share repurchase program. In Consumer Staples, ConAgra Foods Inc. positively contributed to performance as investor sentiment benefited from (1) the accretive realization of the Ralcorp. acquisition, plus (2) overall packaged food industry dynamics turning favorable given earlier elevated input costs which ultimately declined. Consequently, volumes improved on less pricing being necessary.
How do you plan to position the Fund, based on market conditions?
We believe that rising home prices, strong corporate balance sheets, accommodative fiscal and monetary policies and stabilizing global economic momentum will continue to drive equity markets. We take into account a number of near-term risks which include the perennial Eurozone crisis, rising geopolitical risks, specifically Iran and North Korea, the impact of a stronger dollar on corporate profits and the potential impact inflation may have if/when China’s economic growth accelerates. Defensive sectors have outperformed recently, primarily in the Health Care and Utilities sectors, but we believe mid to late stage cyclical stocks will drive near term performance and our Fund is positioned accordingly. As a result, our Fund is overweight Industrials and underweight the Financials and Utilities sectors.
11
LARGE CAP VALUE EQUITY FUND
Growth of a $10,000 Investment (as of March 31, 2013)
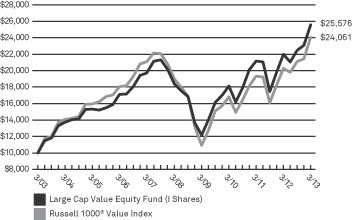 | This chart assumes an initial hypothetical investment of $10,000 made on 3/31/03. Total return is based on net change in the Net Asset Value (“NAV”) assuming reinvestment of distributions. Returns shown on this page include reinvestment of all dividends and other distributions. The Fund’s performance is compared to the Russell 1000® Value Index, which measures the performance of the large-cap value segment of the U.S. equity universe. It includes those Russell 1000® companies with lower price-to-book ratios and lower expected growth values. The Index is unmanaged and does not reflect the deduction of fees, such as investment and fund accounting fees, associated with a mutual fund. Investors cannot invest directly in an index. |
| Average Annual Total Returns as of 3/31/13 | ||||||||||||||||
| Large Cap Value Equity Fund | 1 Year | 3 Year | 5 Year | 10 Year | ||||||||||||
A Shares | without sales charge | 15.93% | 11.80% | 6.56% | 9.50% | |||||||||||
| with sales charge* | 9.23% | 9.62% | 5.31% | 8.85% | ||||||||||||
C Shares | without CDSC | 15.25% | 11.05% | 5.82% | 8.74% | |||||||||||
| with CDSC* | 14.25% | 11.05% | 5.82% | 8.74% | ||||||||||||
I Shares | 16.24% | 12.12% | 6.87% | 9.85% | ||||||||||||
| Russell 1000® Value Index | 18.77% | 12.74% | 4.85% | 9.18% | ||||||||||||
| Prospectus Expense Ratio1 | Gross | |||||||||||||||
| A Shares | 1.40% | |||||||||||||||
| C Shares | 1.73% | |||||||||||||||
| I Shares | 0.89% | |||||||||||||||
Because equity markets may be volatile in the short-term, resulting in unusually high or low performance, investors should evaluate long-term performance before making an investment.
Past performance does not guarantee future results. The performance data quoted represents past performance and current returns may be lower or higher. Total return figures include change in share price, reinvestment of dividends and capital gains and do not reflect taxes that a shareholder would pay on fund distributions or on the redemption of fund shares. The investment return and principal value will fluctuate so that an investor’s shares, when redeemed, may be worth more or less than the original cost. For performance data current to the most recent month end, visit our website at www.ridgeworth.com.
| * | Class A Share performance reflects the maximum front-end sales charge of 5.75% and Class C Shares reflect the maximum CDSC (contingent deferred sales charge) of 1.00% in year one only. |
| 1 | This information is included in the most current prospectus available to current and prospective shareholders of the Fund. Additional information pertaining to the 3/31/13 expense ratios can be found in the financial highlights. |
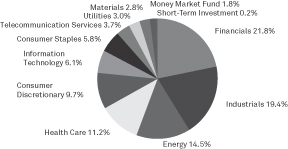
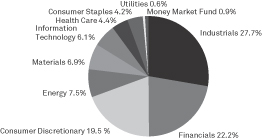
Sector Weightings (as of March 31, 2013)
as a percentage of investments
12
Portfolio Manager
| Ÿ | Don Wordell, CFA |
INVESTMENT CONCERNS
Equity securities (stocks) are more volatile and carry more risk than other forms of investments, including investments in high-grade fixed income securities. The net asset value per share of this Fund will fluctuate as the value of the securities in the portfolio changes.
Mid-capitalization funds typically carry additional risks since smaller companies generally have a higher risk of failure.
Value-based investments are subject to the risk that the broad market may not recognize their intrinsic value.
MANAGEMENT DISCUSSION OF FUND PERFORMANCE
How did the Fund perform against its benchmark for the fiscal year ended March 31, 2013?
The RidgeWorth Mid-Cap Value Equity Fund I Shares appreciated 19.73% for the fiscal year ended March 31, 2013, underperforming the Russell Midcap® Value Index which returned 21.49% for the period.
What factors influenced the Fund’s performance for the fiscal year ended March 31, 2013?
Relative results during the period lagged due primarily to stock selection in the Materials and Energy sectors. In Materials, Cabot Corp. underperformed due to weak demand and modest pricing erosion in their business that serves the tires end market, as well as lower accretion estimates for their recent acquisition. In Energy, CARBO Ceramics Inc. detracted from performance as a result of declining drilling activity in the second half of 2012 and high inventories of competing products. This led to lower volumes and pricing pressure for their products.
Positive contributors to performance were stock selection in the Financials, Industrials and Utilities sectors. In Financials, Hartford Financial Services Group Inc. outperformed owing to several catalysts occurring in the back half of 2012 as the company sold off non-core business segments in an effort to transition to a group and property/casualty centric insurer. In Industrials, Cummins Inc. outperformed as investors were more optimistic about the Chinese economy and U.S. industrial destocking neared completion. In Utilities, NRG Energy Inc. contributed to performance due to improving sentiment in the stock from the execution of the GenOn acquisition and improvement in forward electricity prices.
How do you plan to position the Fund, based on market conditions?
We believe that rising home prices, strong corporate balance sheets, accommodative fiscal and monetary policies, and stabilizing global economic momentum will continue to drive equity markets. We take into account a number of near-term risks which include the perennial Eurozone crisis, rising geopolitical risks, specifically Iran and North Korea, the impact of a stronger dollar on corporate profits and the potential impact inflation may have if/when China’s economic growth accelerates. Defensive sectors have outperformed recently, primarily in the Health Care and Utilities sectors, but we believe mid to late stage cyclical stocks will drive near-term performance and our Fund is positioned accordingly. As a result, our Fund is overweight Industrials, Materials and Energy and underweight Utilities.
13
MID-CAP VALUE EQUITY FUND
Growth of a $10,000 Investment (as of March 31, 2013)
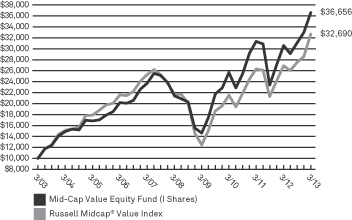 | This chart assumes an initial hypothetical investment of $10,000 made on 3/31/03. Total return is based on net change in the Net Asset Value (“NAV”) assuming reinvestment of distributions. Returns shown on this page include reinvestment of all dividends and other distributions.
The Fund’s performance is compared to the Russell Midcap® Value Index, which measures the performance of the mid-cap value segment of the U.S. equity universe. It includes those Russell Midcap Index companies with lower price-to-book ratios and lower forecasted growth values. The Index is unmanaged and does not reflect the deduction of fees, such as investment and fund accounting fees, associated with a mutual fund. Investors cannot invest directly in an index. |
| Average Annual Total Returns as of 3/31/13 | ||||||||||||||||||||||||
| Mid-Cap Value Equity Fund | Inception Date | 1 Year | 3 Year | 5 Year | 10 Year | Since Inception | ||||||||||||||||||
A Shares | without sales charge | 10/27/03 | 19.43% | 12.23% | 11.06% | N/A | 11.50% | |||||||||||||||||
| with sales charge* | 12.56% | 10.03% | 9.76% | N/A | 10.80% | |||||||||||||||||||
C Shares | without CDSC | 18.75% | 11.49% | 10.33% | 12.86% | N/A | ||||||||||||||||||
| with CDSC* | 17.75% | 11.49% | 10.33% | 12.86% | N/A | |||||||||||||||||||
I Shares | 19.73% | 12.54% | 11.37% | 13.87% | N/A | |||||||||||||||||||
| Russell Midcap® Value Index | 21.49% | 14.96% | 8.53% | 12.57% | 10.20% | ** | ||||||||||||||||||
| Prospectus Expense Ratio1 | Gross | |||||||||||||||||||||||
| A Shares | 1.45% | |||||||||||||||||||||||
| C Shares | 1.80% | |||||||||||||||||||||||
| I Shares | 1.07% | |||||||||||||||||||||||
Because equity markets may be volatile in the short-term, resulting in unusually high or low performance, investors should evaluate long-term performance before making an investment.
Past performance does not guarantee future results. The performance data quoted represents past performance and current returns may be lower or higher. Total return figures include change in share price, reinvestment of dividends and capital gains and do not reflect taxes that a shareholder would pay on fund distributions or on the redemption of fund shares. The investment return and principal value will fluctuate so that an investor’s shares, when redeemed, may be worth more or less than the original cost. For performance data current to the most recent month end, visit our website at www.ridgeworth.com.
| * | Class A Share performance reflects the maximum front-end sales charge of 5.75% and Class C Shares reflect the maximum CDSC (contingent deferred sales charge) of 1.00% in year one only. |
| ** | The performance return for the Russell Midcap® Value Index is for the period from 10/27/03 to 3/31/13. |
| 1 | This information is included in the most current prospectus available to current and prospective shareholders of the Fund. Additional information pertaining to the 3/31/13 expense ratios can be found in the financial highlights. |
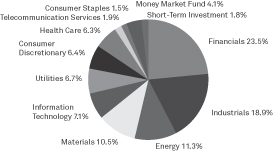
Sector Weightings (as of March 31, 2013)
as a percentage of investments
14
SELECT LARGE CAP GROWTH STOCK FUND
Portfolio Managers
| Ÿ | Christopher Guinther |
| Ÿ | Joe Ransom, CFA |
| Ÿ | Michael A. Sansoterra |
| Ÿ | Sandeep Bhatia, PhD, CFA |
INVESTMENT CONCERNS
Equity securities (stocks) are more volatile and carry more risk than other forms of investments, including investments in high-grade fixed income securities. The net asset value per share of this Fund will fluctuate as the value of the securities in the portfolio changes.
Small- and Mid-capitalization funds typically carry additional risks since smaller companies generally have a higher risk of failure.
Large cap stock can perform differently from other segments of the equity market or the equity market as a whole. Large capitalization companies may be less flexible in evolving markets or unable to implement change as quickly as smaller capitalization companies.
MANAGEMENT DISCUSSION OF FUND PERFORMANCE
How did the Fund perform against its benchmark for the fiscal year ended March 31, 2013?
For the fiscal year ended March 31, 2013 the RidgeWorth Select Large Cap Growth Stock Fund I Shares returned 0.37% while the Russell 1000® Growth Index (“benchmark”) returned 10.09%. The Fund underperformed the benchmark for the fiscal year as the defensive sectors of the benchmark performed well. Three of the Fund’s economic sectors lagged the returns for their comparable sectors within the Russell 1000 Growth Index – Health Care, Consumer Staples and Consumer Discretionary.
What factors influenced the Fund’s performance for the fiscal year ended March 31, 2013?
The S&P 500 Index reached an all-time new high on the final trading day of March, while the Russell 1000® Growth Index broke out to the upside earlier during the fiscal year. Better than expected economic news coupled with reasonable valuations, steady job growth, rising home prices, monetary stimulus and improving global economic momentum propelled the market to a new high. While the new record for the market is good news, the power behind the move came mostly from the defensive sectors of the market – Health Care, Utilities and Consumer Staples. The pro-cyclical sectors dramatically lagged the broader market giving further evidence that investors are still nervous and climbing “the wall of worry”.
Problematic stock selection within the Consumer area of the market hampered short term results. Monster Beverage Corp., a Consumer Staples company selling energy drinks, declined in a rising market due to the product’s safety concerns and worries over slowing growth. Investors have been punishing the stock since the company reported disappointing earnings in November 2012. Mead Johnson Nutrition LLC, another Consumer Staples holding, also declined after Chinese authorities questioned product safety relating to tainted baby formula. The claim was without merit. Within the Consumer Discretionary sector, Coach Inc., a designer, marketer and distributor of handbags and accessories has been losing market share to a new competitor. Investors punished the stock fearing that the future growth will be less than expected. BorgWarner Inc. and Priceline.com Inc., Consumer Discretionary holdings, also declined over the previous 12 months. Several of the Fund’s Health Care holdings also lost value. Intuitive Surgical Inc., a robotic surgical systems company, declined by more than 10% as the company made cautionary remarks about the European Union’s macroeconomic weakness negatively impacting European procedure growth. Agilent Technologies Inc. and Alexion Pharmaceuticals Inc. also negatively impacted relative performance.
How do you plan to position the Fund, based on market conditions?
The portfolio management team does not attempt to position the Fund based on predictions of macroeconomic conditions. The strategy utilizes a balanced approach to stock selection. This balanced approach, combined with multi-dimensional risk decomposition tools allows the portfolio managers to control active risk through portfolio construction. The portfolio managers actively monitor the components of the systematic risk and aim to ensure that most of the risk relative to the index is derived from non-systematic (stock specific) risk. Sector rotation and tactical sector allocations are generally not utilized. The portfolio will be relatively sector and characteristic neutral to the index as the investment team attempts to generate alpha through superior, bottom-up stock selection. The team believes that its investment strategy is objective, balanced and designed to enable outperformance in most market cycles.
15
SELECT LARGE CAP GROWTH STOCK FUND
The Fund will invest in companies with reasonable valuations and improving fundamentals. Generally, the companies invested in will have shown year-over- year increases in operating margins, growth in revenues and exhibit improving financial returns as measured by return on incremental invested capital. By combining the income statement, balance sheet and cash flow metrics to evaluate earnings quality, capital efficiency and relative valuations, the portfolio managers avoid concentrating on a single attribute. Therefore, the team seeks to eliminate investment results that are directly attributed to market conditions and add alpha through stock selection.
Growth of a $10,000 Investment (as of March 31, 2013)
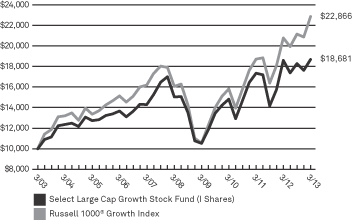 | This chart assumes an initial hypothetical investment of $10,000 made on 3/31/03. Total return is based on net change in the Net Asset Value (“NAV”) assuming reinvestment of distributions. Returns shown on this page include reinvestment of all dividends and other distributions.
The Fund’s performance is compared to the Russell 1000® Growth Index, which measures the performance of the large-cap growth segment of the U.S. equity universe. It includes those Russell 1000® companies with higher price-to-book ratios and higher forecasted growth values. The Index is unmanaged and does not reflect the deduction of fees, such as investment and fund accounting fees, associated with a mutual fund. Investors cannot invest directly in an index. |
| Average Annual Total Returns as of 3/31/13 | ||||||||||||||||
| Select Large Cap Growth Stock Fund | 1 Year | 3 Year | 5 Year | 10 Year | ||||||||||||
A Shares* | without sales charge | 0.13% | 7.70% | 4.14% | 6.15% | |||||||||||
| with sales charge** | –5.63% | 5.59% | 2.92% | 5.53% | ||||||||||||
C Shares | without CDSC | –0.58% | 6.96% | 3.41% | 5.39% | |||||||||||
| with CDSC** | –1.33% | 6.96% | 3.41% | 5.39% | ||||||||||||
I Shares | 0.37% | 8.01% | 4.43% | 6.45% | ||||||||||||
| Russell 1000® Growth Index | 10.09% | 13.06% | 7.30% | 8.62% | ||||||||||||
| Prospectus Expense Ratio1 | Gross | |||||||||||||||
| A Shares | 1.23% | |||||||||||||||
| C Shares | 1.91% | |||||||||||||||
| I Shares | 0.96% | |||||||||||||||
Because equity markets may be volatile in the short-term, resulting in unusually high or low performance, investors should evaluate long-term performance before making an investment.
Past performance does not guarantee future results. The performance data quoted represents past performance and current returns may be lower or higher. Total return figures include change in share price, reinvestment of dividends and capital gains and do not reflect taxes that a shareholder would pay on fund distributions or on the redemption of fund shares. The investment return and principal value will fluctuate so that an investor’s shares, when redeemed, may be worth more or less than the original cost. For performance data current to the most recent month end, visit our website at www.ridgeworth.com.
| * | Class A Shares were offered beginning on 10/14/03. The performance shown prior to such date is based on the performance of the I Shares of the Fund, and has not been adjusted to reflect A Share expenses. If it had been, performance would have been lower. |
| ** | Class A Share performance reflects the maximum front-end sales charge of 5.75% and Class C Shares reflect the maximum CDSC (contingent deferred sales charge) of 1.00% in year one only. |
| 1 | This information is included in the most current prospectus available to current and prospective shareholders of the Fund. Additional information pertaining to the 3/31/13 expense ratios can be found in the financial highlights. |
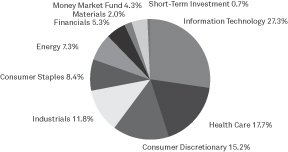
Sector Weightings (as of March 31, 2013)
as a percentage of investments
16
Portfolio Managers
| Ÿ | Christopher Guinther |
| Ÿ | Joe Ransom, CFA |
| Ÿ | Michael A. Sansoterra |
| Ÿ | Sandeep Bhatia, PhD, CFA |
INVESTMENT CONCERNS
Equity securities (stocks) are more volatile and carry more risk than other forms of investments, including investments in high-grade fixed income securities. The net asset value per share of this Fund will fluctuate as the value of the securities in the portfolio changes.
Small capitalization funds typically carry additional risks since smaller companies generally have a higher risk of failure.
MANAGEMENT DISCUSSION OF FUND PERFORMANCE
How did the Fund perform against its benchmark for the fiscal year ended March 31, 2013?
For the fiscal year ended March 31, 2013 the RidgeWorth Small Cap Growth Stock Fund I Shares returned 14.20% while the Russell 2000® Growth Index (“benchmark”) returned 14.52%. The Fund slightly underperformed the benchmark by 0.32%. The Fund had particularly good stock selection in Health Care, Technology and the Telecommunication sectors relative the Russell 2000® Growth Index.
What factors influenced the Fund’s performance for the fiscal year ended March 31, 2013?
The S&P 500 Index reached an all-time new high on the final trading day of March. Better than expected economic news coupled with reasonable valuations, steady job growth, rising home prices, monetary stimulus and improving global economic momentum propelled the market to a new high. While the new record for the broader market is good news, the power behind the move came in the final quarter and mostly from the defensive sectors of the market—Health Care, Utilities and Staples. The pro-cyclical sectors dramatically lagged giving further evidence that investors are still nervous as the market climbs “the wall of worry”. Additionally, small cap growth stocks continue to rally strongly from their 2008 lows exceeding the broader market as measured by the S&P 500 Index.
Fund investments within cloud based services and high speed internet access companies lead to a positive 55% return within the Telecommunication Services sector, beating the benchmark sector by 44%. In addition, the Fund’s Health Care stocks averaged more than 26% return during the year while the average Health Care stock within the Russell 2000® Growth Index was up nearly 17%. Stock selection was especially strong within the Health Care sector; 16 stocks rose more than 25% during the year. For example, Onyx Pharmaceuticals Inc., a biotechnology company, rose 94% during the year after a Food and Drug Administration panel voted to approve a cancer drug for multiple myeloma. Positions within the medical device and pharmaceutical industries also reported strong operating results which lead to market value appreciation. The Fund also benefited from several Technology holdings which were acquired at very large premiums. For example, the acquisition of Ariba Inc., a cloud based technology company rose more than 35% on the offer.
How do you plan to position the Fund, based on market conditions?
The portfolio management team does not attempt to position the Fund based on predictions of macroeconomic conditions. The strategy utilizes a balanced approach to stock selection. This balanced approach, combined with multi-dimensional risk decomposition tools allows the portfolio managers to control active risk through portfolio construction. The portfolio managers actively monitor the components of the systematic risk and aim to ensure that most of the risk relative to the index is derived from non-systematic (stock specific) risk. Sector rotation and tactical sector allocations are deemphasized. The portfolio will be relatively sector and characteristic neutral relative to the Russell 2000 Growth index as the investment team attempts to generate alpha through bottom-up stock selection. The team believes that its investment strategy is objective, balanced and designed to enable outperformance in most market cycles.
The Fund will invest in companies with reasonable valuations and improving fundamentals. Generally, the companies invested in will have shown year-over- year increases in operating margins, growth in revenues and exhibit improving financial returns as measured by return on incremental invested capital. By combining the income statement, balance sheet and cash flow metrics to evaluate earnings quality, capital efficiency and relative valuations, the portfolio managers avoid concentrating on a single attribute. Therefore, the team seeks to eliminate investment results that are directly attributed to market conditions and add alpha through stock selection.
17
SMALL CAP GROWTH STOCK FUND
Growth of a $10,000 Investment (as of March 31, 2013)
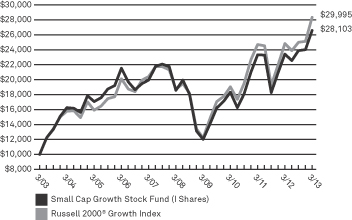 | This chart assumes an initial hypothetical investment of $10,000 made on 3/31/03. Total return is based on net change in the Net Asset Value (“NAV”) assuming reinvestment of distributions. Returns shown on this page include reinvestment of all dividends and other distributions.
The Fund’s performance is compared to the Russell 2000® Growth Index, which measures the performance of the small-cap growth segment of the U.S. equity universe. It includes those Russell 2000® companies with higher price-to-book ratios and higher forecasted growth values. The Index is unmanaged and does not reflect the deduction of fees, such as investment and fund accounting fees, associated with a mutual fund. Investors cannot invest directly in an index. |
| Average Annual Total Returns as of 3/31/13 | ||||||||||||||||
| Small Cap Growth Stock Fund | 1 Year | 3 Year | 5 Year | 10 Year | ||||||||||||
A Shares | without sales charge | 14.07% | 13.60% | 7.46% | 10.55% | |||||||||||
| with sales charge* | 7.49% | 11.37% | 6.19% | 9.90% | ||||||||||||
C Shares | without CDSC | 13.30% | 12.80% | 6.73% | 9.81% | |||||||||||
| with CDSC* | 12.45% | 12.80% | 6.73% | 9.81% | ||||||||||||
I Shares | 14.20% | 13.85% | 7.75% | 10.89% | ||||||||||||
| Russell 2000® Growth Index | 14.52% | 14.75% | 9.04% | 11.61% | ||||||||||||
| Prospectus Expense Ratio1 | Gross | |||||||||||||||
| A Shares | 1.29% | |||||||||||||||
| C Shares | 1.94% | |||||||||||||||
| I Shares | 1.16% | |||||||||||||||
Because equity markets may be volatile in the short-term, resulting in unusually high or low performance, investors should evaluate long-term performance before making an investment.
Past performance does not guarantee future results. The performance data quoted represents past performance and current returns may be lower or higher. Total return figures include change in share price, reinvestment of dividends and capital gains and do not reflect taxes that a shareholder would pay on fund distributions or on the redemption of fund shares. The investment return and principal value will fluctuate so that an investor’s shares, when redeemed, may be worth more or less than the original cost. For performance data current to the most recent month end, visit our website at www.ridgeworth.com.
| * | Class A Share performance reflects the maximum front-end sales charge of 5.75% and Class C Shares reflect the maximum CDSC (contingent deferred sales charge) of 1.00% in year one only. |
| 1 | This information is included in the most current prospectus available to current and prospective shareholders of the Fund. Additional information pertaining to the 3/31/13 expense ratios can be found in the financial highlights. |
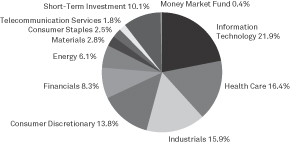
Sector Weightings (as of March 31, 2013)
as a percentage of investments
18
Portfolio Manager
| Ÿ | Brett Barner, CFA |
INVESTMENT CONCERNS
Equity securities (stocks) are more volatile and carry more risk than other forms of investments, including investments in high-grade fixed income securities. The net asset value per share of this Fund will fluctuate as the value of the securities in the portfolio changes.
Small capitalization funds typically carry additional risks since smaller companies generally have a higher risk of failure.
Value-based investments are subject to the risk that the broad market may not recognize their intrinsic value.
MANAGEMENT DISCUSSION OF FUND PERFORMANCE
How did the Fund perform against its benchmark for the fiscal year ended March 31, 2013?
For the fiscal year ended March 31, 2013, the RidgeWorth Small Cap Value Equity Fund I Shares returned 17.07% versus 18.09% for the benchmark, the Russell 2000® Value Index.
What factors influenced the Fund’s performance for the fiscal year ended March 31, 2013?
The primary reason for underperformance relative to the index was stock selection in the Materials, Financials and Consumer Discretionary sectors. In Materials, Cabot Corp. underperformed due to weak demand and modest pricing erosion in their business that serves the tires end market, as well as, lower accretion estimates for their recent acquisition. In Financials, Hancock Holding Co. detracted from performance on muted investor enthusiasm after management guided to higher than expected non-interest expenses. In Consumer Discretionary, Guess? Inc. negatively contributed as investor sentiment worsened due to challenges at its North American and European Union businesses.
Positive contributors to performance were stock selection in the Industrials, Information Technology and Health Care sectors. In Industrials, A.O. Smith Corp. outperformed owing to strong residential construction data in the U.S. and high single digit growth in Chinese water heater demand. In Information Technology, Booz Allen Hamilton Holding Corp. outperformed on the announcement of several large one time dividends in the second half of 2012. In Health Care, Teleflex Inc. contributed to performance when new management continued to execute on their plan of increasing pricing and expanding margins.
How do you plan to position the Fund, based on market conditions?
We believe that rising home prices, strong corporate balance sheets, accommodative fiscal and monetary policies, and stabilizing global economic momentum will continue to drive equity markets. We take into account a number of near term risks which include the perennial Eurozone crisis, rising geopolitical risks, specifically Iran and North Korea, the impact of a stronger dollar on corporate profits and the potential impact inflation may have if/when China’s economic growth accelerates. Defensive sectors have outperformed recently, primarily in the Health Care and Utilities sectors, but we believe mid to late stage cyclical stocks will drive near-term performance and our Fund is positioned accordingly. As a result, our Fund is overweight Industrials and underweight the Financials and Utilities sectors.
The Fund utilizes a bottom-up approach to stock selection. The process seeks dividend-paying stocks trading at the lower end of historical trading ranges which display characteristics of financial strength and possess an identifiable catalyst to assist in realizing true value. The Fund does not make active sector allocations but allows the process to define sector weights.
19
SMALL CAP VALUE EQUITY FUND
Growth of a $10,000 Investment (as of March 31, 2013)
 | This chart assumes an initial hypothetical investment of $10,000 made on 3/31/03. Total return is based on net change in the Net Asset Value (“NAV”) assuming reinvestment of distributions. Returns shown on this page include reinvestment of all dividends and other distributions.
The Fund’s performance is compared to the Russell 2000® Value Index, which measures the performance of the small-cap value segment of the U.S. equity universe. It includes those Russell 2000® companies with lower price-to-book ratios and lower forecasted growth values. The Index is unmanaged and does not reflect the deduction of fees, such as investment and fund accounting fees, associated with a mutual fund. Investors cannot invest directly in an index. |
| Average Annual Total Returns as of 3/31/13 | ||||||||||||||||
| Small Cap Value Equity Fund | 1 Year | 3 Year | 5 Year | 10 Year | ||||||||||||
A Shares* | without sales charge | 16.77% | 13.56% | 9.99% | 13.55% | |||||||||||
| with sales charge** | 10.05% | 11.33% | 8.70% | 12.88% | ||||||||||||
C Shares | without CDSC | 16.17% | 12.83% | 9.31% | 13.11% | |||||||||||
| with CDSC** | 15.17% | 12.83% | 9.31% | 13.11% | ||||||||||||
I Shares | 17.07% | 13.87% | 10.31% | 13.88% | ||||||||||||
| Russell 2000® Value Index | 18.09% | 12.12% | 7.29% | 11.29% | ||||||||||||
| Prospectus Expense Ratio1 | Gross | |||||||||||||||
| A Shares | 1.53% | |||||||||||||||
| C Shares | 1.91% | |||||||||||||||
| I Shares | 1.20% | |||||||||||||||
Because equity markets may be volatile in the short-term, resulting in unusually high or low performance, investors should evaluate long-term performance before making an investment.
Past performance does not guarantee future results. The performance data quoted represents past performance and current returns may be lower or higher. Total return figures include change in share price, reinvestment of dividends and capital gains and do not reflect taxes that a shareholder would pay on fund distributions or on the redemption of fund shares. The investment return and principal value will fluctuate so that an investor’s shares, when redeemed, may be worth more or less than the original cost. For performance data current to the most recent month end, visit our website at www.ridgeworth.com.
| * | Class A Shares were offered beginning 10/9/03. The performance shown prior to such date is based on the performance of the I Shares of the Fund, and has not been adjusted to reflect A Share expenses. If it had been, performance would have been lower. |
| ** | Class A Share performance reflects the maximum front-end sales charge of 5.75% and Class C Shares reflect the maximum CDSC (contingent deferred sales charge) of 1.00% in year one only. |
| 1 | This information is included in the most current prospectus available to current and prospective shareholders of the Fund. Additional information pertaining to the 3/31/13 expense ratios can be found in the financial highlights. |
Sector Weightings (as of March 31, 2013)
as a percentage of investments
20
AGGRESSIVE GROWTH ALLOCATION STRATEGY
Portfolio Manager
| Ÿ | Alan Gayle |
INVESTMENT CONCERNS
Stocks are more volatile and carry more risk and return potential than other forms of investments. Bonds offer a relatively stable level of income, although bond prices will fluctuate, providing the potential for principal gain or loss. Cash equivalents offer low risk and low return potential.
MANAGEMENT DISCUSSION OF FUND PERFORMANCE
How did the Fund perform against its benchmark for the fiscal year ended March 31, 2013?
The RidgeWorth Aggressive Growth Allocation Strategy I Shares returned 6.45% for the fiscal year ended March 31, 2013, behind the 11.97% return for the hybrid benchmark (80% S&P 500 Index / 20% Barclays Capital U.S. Aggregate Bond Index) and behind the Lipper Mixed-Asset Target Allocation–Growth Classification Index return of 9.96% in the same period, placing it in the 96th percentile.
What factors influenced the Fund’s performance for the fiscal year ended March 31, 2013?
The RidgeWorth Aggressive Growth Allocation Strategy I Shares relative performance benefitted modestly against its benchmark due to its overweight to equities versus its target weighting of 80%, as equities broadly outperformed fixed income mandates in the quarter. It also benefitted from outperformance by several selected RidgeWorth funds, notably large cap and mid cap value funds. Similar to the broader S&P 500 Index, in which Value style mandates outperformed Growth style mandates, the Fund’s exposure to growth securities was a detractor, as were exposures to alternative securities in gold miners and to international markets, which collectively lagged in the quarter. All in, several underlying equity funds lagged the S&P 500 Index, which led to an aggregate lagging performance in the equity space. In the fixed income space, the Fund’s exposure to longer duration, corporate fixed income oriented securities, as well as to the high yield funds, was additive to relative fixed income performance. However, the shorter-duration fixed-income and cash positions lagged the benchmark. Despite some positive relative returns in both the equity and fixed income spaces, the strategy experienced subpar relative total returns versus its hybrid benchmark and its Lipper category.
How do you plan to position the Fund, based on market conditions?
Although the economy is experiencing a quite sluggish 2% to 2.5% growth rate, the broad S&P 500 Index still trades slightly below its 10 and 15 year medians on key valuation metrics. Moreover, given the “Global Fed’s” (Federal Reserve, Bank of China, Bank of Japan, European Central Bank, et al) stimulus, there appears to be increased confidence that the current expansion is relatively sustainable with limited downside risks.
As long as ample accommodation continues, and inflation stays at the low end of the Fed comfort zone, equities have at least a modicum of tailwinds. Equity index valuations were more compelling last year, but vigorous fundamental stock picking and sector rotations should return into vogue.
As a consequence, we believe that when headwinds dissipate and 2013 metrics are recalibrated, the equity market indeed has the potential for further improvement; however, we would not be surprised to see at least a small amount of consolidation in the short run, or at least until economic traction becomes more visible.
21
AGGRESSIVE GROWTH ALLOCATION STRATEGY
Growth of a $10,000 Investment (as of March 31, 2013)
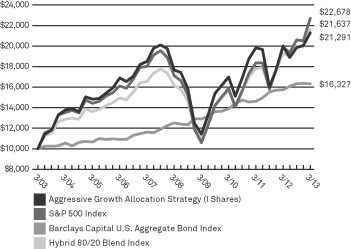 | This chart assumes an initial hypothetical investment of $10,000 made on 3/31/03. Total return is based on net change in the Net Asset Value (“NAV”) assuming reinvestment of distributions. Returns shown on this page include reinvestment of all dividends and other distributions.
Effective September 30, 2012, the benchmark index for the Fund changed from the Standard & Poors 500 Index (“S&P 500 Index”) to the Hybrid 80/20 Blend Index. The Fund’s performance is compared to the Hybrid 80/20 Blend Index.
The S&P 500 Index is widely regarded as a gauge of the U.S. equities market. This index includes 500 leading companies in leading industries of the U.S. economy. Although the S&P 500 Index focuses on the large cap segment of the market, with approximately 75% coverage of U.S. equities, it is also an ideal proxy for the total market. The Barclays Capital U.S. Aggregate Bond Index is a measure of the overall performance of the U.S. bond market. These indices are unmanaged and do not reflect the deduction of fees, such as investment and fund accounting fees, associated with a mutual fund. Investors cannot invest directly in an index. |
| Average Annual Total Returns as of 3/31/13 | ||||||||||||||||
| Aggressive Growth Allocation Strategy | 1 Year | 3 Year | 5 Year | 10 Year | ||||||||||||
A Shares* | without sales charge | 6.30% | 7.53% | 3.49% | 7.54% | |||||||||||
| with sales charge** | 0.24% | 5.43% | 2.27% | 6.91% | ||||||||||||
C Shares* | without CDSC | 5.47% | 6.79% | 2.77% | 7.00% | |||||||||||
| with CDSC** | 4.47% | 6.79% | 2.77% | 7.00% | ||||||||||||
I Shares | 6.45% | 7.83% | 3.80% | 7.85% | ||||||||||||
| Hybrid 80/20 Blend Index (80% of the S&P 500 Index, 20% of the Barclays Capital U.S. Aggregate Bond Index) | 11.97% | 11.44% | 6.05% | 8.02% | ||||||||||||
| S&P 500 Index | 13.96% | 12.67% | 5.81% | 8.53% | ||||||||||||
| Barclays Capital U.S. Aggregate Bond Index | 3.77% | 5.52% | 5.47% | 5.02% | ||||||||||||
| Prospectus Expense Ratio1 | Gross | |||||||||||||||
| A Shares | 1.69% | |||||||||||||||
| C Shares | 2.34% | |||||||||||||||
| I Shares | 1.69% | |||||||||||||||
Because equity markets may be volatile in the short-term, resulting in unusually high or low performance, investors should evaluate long-term performance before making an investment.
The Adviser has contractually agreed to waive fees and reimburse expenses until at least August 1, 2013 in order to keep total operating expenses (excluding underlying fund fees and expenses) from exceeding 0.70%, 1.30% and 0.50% for A, C and I Shares, respectively. Without these fee waivers, performance would have been lower. The indirect expenses of the Fund, which represent a pro-rata share of the expenses of the underlying funds in which the Fund invests, totaled 0.89% of net assets and are included in the expense ratios listed in the table above.
Past performance does not guarantee future results. The performance data quoted represents past performance and current returns may be lower or higher. Total return figures include change in share price, reinvestment of dividends and capital gains and do not reflect taxes that a shareholder would pay on fund distributions or on the redemption of fund shares. The investment return and principal value will fluctuate so that an investor’s shares, when redeemed, may be worth more or less than the original cost. For performance data current to the most recent month end, visit our website at www.ridgeworth.com.
| * | Class A Shares and C Shares were offered beginning on 10/16/03 and 4/1/05, respectively. The performance shown prior to such dates is based on performance of the I Shares of the Fund, and has not been adjusted to reflect A Share or C Share expenses. If it had been, performance would have been lower. |
| ** | Class A Share performance reflects the maximum front-end sales charge of 5.75% and Class C Shares reflect the maximum CDSC (contingent deferred sales charge) of 1.00% in year one only. |
| 1 | This information is included in the most current prospectus available to current and prospective shareholders of the Fund. Additional information pertaining to the 3/31/13 expense ratios can be found in the financial highlights. |
Sector Weightings (as of March 31, 2013)
as a percentage of investments
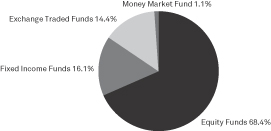
22
CONSERVATIVE ALLOCATION STRATEGY
Portfolio Manager
| Ÿ | Alan Gayle |
INVESTMENT CONCERNS
Stocks are more volatile and carry more risk and return potential than other forms of investments. Bonds offer a relatively stable level of income, although bond prices will fluctuate, providing the potential for principal gain or loss. Cash equivalents offer low risk and low return potential.
MANAGEMENT DISCUSSION OF FUND PERFORMANCE
How did the Fund perform against its benchmark for the fiscal year ended March 31, 2013?
The RidgeWorth Conservative Allocation Strategy I Shares returned 5.55% for the fiscal year ended March 31, 2013, behind the 6.88% return for the hybrid benchmark (30% S&P 500 / 70% Barclays Capital U.S. Aggregate Bond Index) and behind the Lipper Mixed-Asset Target Allocation–Conservative Classification return of 7.34% in the same period, placing it in the 84th percentile.
What factors influenced the Fund’s performance for the fiscal year ended March 31, 2013?
The RidgeWorth Conservative Allocation Strategy I Shares relative performance benefitted modestly against its benchmark due to its overweight to equities versus its target weighting of 30%, as equities broadly outperformed fixed income mandates for the year. It also benefitted from outperformance by several selected RidgeWorth funds, notably large cap and mid cap value funds. Similar to the broader S&P 500 Index, in which Value style mandates outperformed Growth style mandates, the Fund’s exposure to growth securities was a detractor, as were exposures to alternative securities in gold miners and to international markets, which collectively lagged in the quarter. All in, several underlying equity funds lagged the S&P 500 Index, which led to an aggregate lagging performance in the equity space. In the fixed income space the Fund’s exposure to longer duration, corporate fixed income oriented securities, as well as to the high yield funds, was additive to relative fixed-income performance. However, the shorter-duration fixed-income and cash positions lagged the benchmark. Despite some positive relative returns in both the equity and fixed income spaces, the strategy experienced subpar relative total returns versus its hybrid benchmark and its Lipper category.
How do you plan to position the Fund, based on market conditions?
Although the economy is experiencing a quite sluggish 2% to 2.5% growth rate, the broad S&P 500 Index still trades slightly below its 10 and 15 year medians on key valuation metrics. Moreover, given the “Global Fed’s” (Federal Reserve, Bank of China, Bank of Japan, European Central Bank, et al) stimulus, there appears to be increased confidence that the current expansion is relatively sustainable with limited downside risks.
As long as ample accommodation continues, and inflation stays at the low-end of the Fed comfort zone, equities have at least a modicum of tailwinds. Equity index valuations were more compelling last year, but vigorous fundamental stock picking and sector rotations should return to vogue.
As a consequence, we believe that when headwinds dissipate and 2013 metrics are recalibrated, the equity market indeed has the potential for further improvement; however, we would not be surprised to see at least a small amount of consolidation in the short run, or at least until economic traction becomes more visible.
23
CONSERVATIVE ALLOCATION STRATEGY
Growth of a $10,000 Investment (as of March 31, 2013)
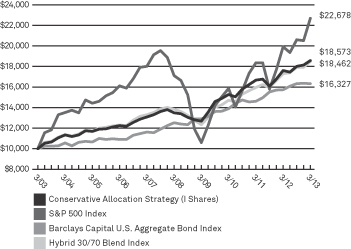 | This chart assumes an initial hypothetical investment of $10,000 made on 3/31/03. Total return is based on net change in the Net Asset Value (“NAV”) assuming reinvestment of distributions. Returns shown on this page include reinvestment of all dividends and other distributions.
The Fund’s performance is compared to the Hybrid 30/70 Blend Index. The Standard & Poors 500 Index (“S&P 500 Index”) is widely regarded as a gauge of the U.S. equities market. This index includes 500 leading companies in leading industries of the U.S. economy. Although the S&P 500 Index focuses on the large cap segment of the market, with approximately 75% coverage of U.S. equities, it is also an ideal proxy for the total market. The Barclays Capital U.S. Aggregate Bond Index is a measure of the overall performance of the U.S. bond market. These indices are unmanaged and do not reflect the deduction of fees, such as investment and fund accounting fees, associated with a mutual fund. Investors cannot invest directly in an index. |
| Average Annual Total Returns as of 3/31/13 | ||||||||||||||||
| Conservative Allocation Strategy | 1 Year | 3 Year | 5 Year | 10 Year | ||||||||||||
A Shares* | without sales charge | 5.29% | 6.44% | 6.29% | 6.09% | |||||||||||
| with sales charge** | 0.30% | 4.73% | 5.27% | 5.57% | ||||||||||||
C Shares* | without CDSC | 4.58% | 5.73% | 5.55% | 5.57% | |||||||||||
| with CDSC** | 3.58% | 5.73% | 5.55% | 5.57% | ||||||||||||
I Shares* | 5.55% | 6.76% | 6.61% | 6.39% | ||||||||||||
| Hybrid 30/70 Blend Index (30% of the S&P 500 Index, 70% of the Barclays Capital U.S. Aggregate Bond Index) | 6.88% | 7.91% | 5.97% | 6.32% | ||||||||||||
| S&P 500 Index | 13.96% | 12.67% | 5.81% | 8.53% | ||||||||||||
| Barclays Capital U.S. Aggregate Bond Index | 3.77% | 5.52% | 5.47% | 5.02% | ||||||||||||
| Prospectus Expense Ratio1 | Gross | |||||||||||||||
| A Shares | 1.37% | |||||||||||||||
| C Shares | 1.99% | |||||||||||||||
| I Shares | 1.04% | |||||||||||||||
Because equity markets may be volatile in the short-term, resulting in unusually high or low performance, investors should evaluate long-term performance before making an investment.
The Adviser has contractually agreed to waive fees and reimburse expenses until at least August 1, 2013 in order to keep total operating expenses (excluding underlying fund fees and expenses) from exceeding 0.60%, 1.30% and 0.30% for A, C and I Shares, respectively. Without these fee waivers, performance would have been lower. The indirect expenses of the Fund, which represent a pro-rata share of the expenses of the underlying funds in which the Fund invests, totaled 0.59% of net assets and are included in the expense ratios listed in the table above.
Past performance does not guarantee future results. The performance data quoted represents past performance and current returns may be lower or higher. Total return figures include change in share price, reinvestment of dividends and capital gains and do not reflect taxes that a shareholder would pay on fund distributions or on the redemption of fund shares. The investment return and principal value will fluctuate so that an investor’s shares, when redeemed, may be worth more or less than the original cost. For performance data current to the most recent month end, visit our website at www.ridgeworth.com.
| * | Class A Shares, C Shares and I Shares were offered beginning on 11/11/03, 4/1/05, and 11/6/03, respectively. The performance shown prior to such dates is based on performance of the B Shares of the Fund, and has not been adjusted to reflect A Share, C Share or I Share expenses. If it had been, performance for C Shares would have been lower. Effective close of business on 7/16/10, B Shares converted into A Shares. |
| ** | Class A Share performance reflects the maximum front-end sales charge of 4.75% and Class C Shares reflect the maximum CDSC (contingent deferred sales charge) of 1.00% in year one only. |
| 1 | This information is included in the most current prospectus available to current and prospective shareholders of the Fund. Additional information pertaining to the 3/31/13 expense ratios can be found in the financial highlights. |
Sector Weightings (as of March 31, 2013)
as a percentage of investments
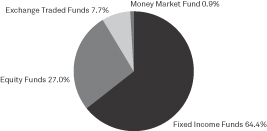
24
Portfolio Manager
| Ÿ | Alan Gayle |
INVESTMENT CONCERNS
Stocks are more volatile and carry more risk and return potential than other forms of investments. Bonds offer a relatively stable level of income, although bond prices will fluctuate, providing the potential for principal gain or loss. Cash equivalents offer low risk and low return potential.
MANAGEMENT DISCUSSION OF FUND PERFORMANCE
How did the Fund perform against its benchmark for the fiscal year ended March 31, 2013?
The RidgeWorth Growth Allocation Strategy I Shares returned 7.52% for the fiscal year ended March 31, 2013, behind the 10.96% return for the hybrid benchmark (70% S&P 500 Index / 30% Barclays Capital U.S. Aggregate Bond Index) and behind the Lipper Mixed-Asset Target Allocation–Growth Classification return of 9.96% in the same period, placing it in the 87th percentile.
What factors influenced the Fund’s performance for the fiscal year ended March 31, 2013?
The RidgeWorth Growth Allocation Strategy I Shares relative performance benefitted modestly against its benchmark due to its overweight to equities versus its target weighting of 70%, as equities broadly outperformed fixed income mandates for the year. It also benefitted from outperformance by several selected RidgeWorth funds, notably large cap and mid cap value funds. Similar to the broader S&P 500 Index, in which Value style mandates outperformed Growth style mandates, the Fund’s exposure to growth securities was a detractor, as were exposures to alternative securities in gold miners and to international markets, which collectively lagged in the quarter. All in, several underlying equity funds lagged the S&P 500 Index, which led to an aggregate lagging performance in the equity space. In the fixed income space the Fund’s exposure to longer duration, corporate fixed income oriented securities, as well as to the high yield funds, was additive to relative fixed-income performance. However, the shorter-duration fixed-income and cash positions lagged the benchmark. Despite some positive relative returns in both the equity and fixed income spaces, the strategy experienced subpar relative total returns versus its hybrid benchmark and its Lipper category.
How do you plan to position the Fund, based on market conditions?
Although the economy is experiencing a quite sluggish 2% to 2.5% growth rate, the broad S&P 500 Index still trades slightly below its 10 and 15 year medians on key valuation metrics. Moreover, given the “Global Fed’s” (Federal Reserve, Bank of China, Bank of Japan, European Central Bank, et al) stimulus, there appears to be increased confidence that the current expansion is relatively sustainable with limited downside risks.
As long as ample accommodation continues, and inflation stays at the low-end of the Fed comfort zone, equities have at least a modicum of tailwinds. Equity index valuations were more compelling last year, but vigorous fundamental stock picking and sector rotations should return to vogue.
As a consequence, we believe that when headwinds dissipate and 2013 metrics are recalibrated, the equity market indeed has the potential for further improvement; however, we would not be surprised to see at least a small amount of consolidation in the short run, or at least until economic traction becomes more visible.
25
GROWTH ALLOCATION STRATEGY
Growth of a $10,000 Investment (as of March 31, 2013)
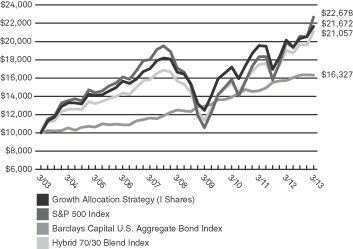 | This chart assumes an initial hypothetical investment of $10,000 made on 3/31/03. Total return is based on net change in the Net Asset Value (“NAV”) assuming reinvestment of distributions. Returns shown on this page include reinvestment of all dividends and other distributions.
The Fund’s performance is compared to the Hybrid 70/30 Blend Index. The Standard & Poors 500 Index (“S&P 500 Index”) is widely regarded as a gauge of the U.S. equities market. This index includes 500 leading companies in leading industries of the U.S. economy. Although the S&P 500 Index focuses on the large cap segment of the market, with approximately 75% coverage of U.S. equities, it is also an ideal proxy for the total market. The Barclays Capital U.S. Aggregate Bond Index is a measure of the overall performance of the U.S. bond market. These indices are unmanaged and do not reflect the deduction of fees, such as investment and fund accounting fees, associated with a mutual fund. Investors cannot invest directly in an index. |
| Average Annual Total Returns as of 3/31/13 | ||||||||||||||||||
| Growth Allocation Strategy | 1 Year | 3 Year | 5 Year | 10 Year | ||||||||||||||
A Shares* | without sales charge | 7.16% | 7.67% | 5.11% | 7.73% | |||||||||||||
| with sales charge** | 0.98% | 5.56% | 3.87% | 7.10% | ||||||||||||||
C Shares* | without CDSC | 6.55% | 6.94% | 4.36% | 7.13% | |||||||||||||
| with CDSC** | 5.55% | 6.94% | 4.36% | 7.13% | ||||||||||||||
I Shares | 7.52% | 7.97% | 5.42% | 8.04% | ||||||||||||||
| Hybrid 70/30 Blend Index (70% of the S&P 500 Index, 30% of the Barclays Capital U.S. Aggregate Bond Index) | 10.96% | 10.78% | 6.11% | 7.73% | ||||||||||||||
| S&P 500 Index | 13.96% | 12.67% | 5.81% | 8.53% | ||||||||||||||
| Barclays Capital U.S. Aggregate Bond Index | 3.77% | 5.52% | 5.47% | 5.02% | ||||||||||||||
| Prospectus Expense Ratio1 | Gross | |||||||||||||||||
| A Shares | 1.40% | |||||||||||||||||
| C Shares | 2.03% | |||||||||||||||||
| I Shares | 1.41% | |||||||||||||||||
Because equity markets may be volatile in the short-term, resulting in unusually high or low performance, investors should evaluate long-term performance before making an investment.
The Adviser has contractually agreed to waive fees and reimburse expenses until at least August 1, 2013 in order to keep total operating expenses (excluding underlying fund fees and expenses) from exceeding 0.70%, 1.30% and 0.50% for the A, C and I Shares, respectively. Without these fee waivers, performance would have been lower. The indirect expenses of the Fund, which represent a pro-rata share of the expenses of the underlying funds in which the Fund invests, totaled 0.77% of net assets and are included in the expense ratios listed in the table above.
Past performance does not guarantee future results. The performance data quoted represents past performance and current returns may be lower or higher. Total return figures include change in share price, reinvestment of dividends and capital gains and do not reflect taxes that a shareholder would pay on fund distributions or on the redemption of fund shares. The investment return and principal value will fluctuate so that an investor’s shares, when redeemed, may be worth more or less than the original cost. For performance data current to the most recent month end, visit our website at www.ridgeworth.com.
| * | Class A Shares and C Shares were offered beginning on 11/05/03 and 4/05/05, respectively. The performance shown prior to such dates is based on performance of the I Shares of the Fund, and has not been adjusted to reflect A Share and C Share expenses. If it had been, performance would have been lower. |
| ** | Class A Share performance reflects the maximum front-end sales charge of 5.75% and Class C Shares reflect the maximum CDSC (contingent deferred sales charge) of 1.00% in year one only. |
| 1 | This information is included in the most current prospectus available to current and prospective shareholders of the Fund. Additional information pertaining to the 3/31/13 expense ratios can be found in the financial highlights. |
Sector Weightings (as of March 31, 2013)
as a percentage of investments
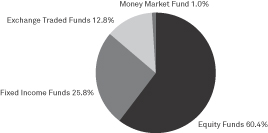
26
Portfolio Manager
| Ÿ | Alan Gayle |
INVESTMENT CONCERNS
Stocks are more volatile and carry more risk and return potential than other forms of investments. Bonds offer a relatively stable level of income, although bond prices will fluctuate, providing the potential for principal gain or loss. Cash equivalent offer low risk and low return potential.
MANAGEMENT DISCUSSION OF FUND PERFORMANCE
How did the Fund perform against its benchmark for the fiscal year ended March 31, 2013?
The RidgeWorth Moderate Allocation Strategy I Shares returned 6.60% for the fiscal year ended March 31, 2013, behind the 8.93% return for the hybrid benchmark (50% S&P 500 / 50% Barclays Capital U.S. Aggregate Bond Index) and behind the Lipper Mixed-Asset Target Allocation–Moderate Classification return of 9.11% in the same period, placing it in the 88th percentile.
What factors influenced the Fund’s performance for the fiscal year ended March 31, 2013?
The RidgeWorth Moderate Allocation Strategy I Shares’ relative performance benefitted modestly against its benchmark due to its overweight to equities versus its target weighting of 50%, as equities broadly outperformed fixed income mandates for the year. It also benefitted from outperformance by several selected RidgeWorth funds, notably large cap and mid cap value funds. Similar to the broader S&P 500 Index, in which Value style mandates outperformed Growth style mandates, the Fund’s exposure to growth securities was a detractor, as were exposures to alternative securities in gold miners and to international markets, which collectively lagged in the quarter. All in, several underlying equity funds lagged the S&P 500 Index, which led to an aggregate lagging performance in the equity space. In the fixed income space the Fund’s exposure to longer duration, corporate fixed income oriented securities, as well as to the high yield funds, was additive to relative fixed-income performance. However, the shorter-duration fixed-income and cash positions lagged the benchmark. Despite some positive relative returns in both the equity and fixed income spaces, the strategy experienced subpar relative total returns versus its hybrid benchmark and its Lipper category.
How do you plan to position the Fund, based on market conditions?
Although the economy is experiencing a quite sluggish 2% to 2.5% growth rate, the broad S&P 500 Index still trades slightly below its 10 and 15 year medians on key valuation metrics. Moreover, given the “Global Fed’s” (Federal Reserve, Bank of China, Bank of Japan, European Central Bank, et al) stimulus, there appears to be increased confidence that the current expansion is relatively sustainable with limited downside risks.
As long as ample accommodation continues, and inflation stays at the low-end of the Fed comfort zone, equities have at least a modicum of tailwinds. Equity index valuations were more compelling last year, but vigorous fundamental stock picking and sector rotations should return into vogue.
As a consequence, we believe that when headwinds dissipate and 2013 metrics are recalibrated, the equity market indeed has the potential for further improvement; however, we would not be surprised to see at least a small amount of consolidation in the short run, or at least until economic traction becomes more visible.
27
MODERATE ALLOCATION STRATEGY
Growth of a $10,000 Investment (as of March 31, 2013)
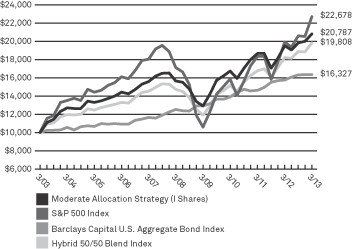 | This chart assumes an initial hypothetical investment of $10,000 made on 3/31/03. Total return is based on net change in the Net Asset Value (“NAV”) assuming reinvestment of distributions. Returns shown on this page include reinvestment of all dividends and other distributions.
The Fund’s performance is compared to the Hybrid 50/50 Blend Index. The Standard & Poors 500 Index (“S&P 500 Index”) is widely regarded as a guage of the U.S. equities market. This index includes 500 leading companies in leading industries of the U.S. economy. Although the S&P 500 Index focuses on the large cap segment of the market, with approximately 75% coverage of U.S. equities, it is also an ideal proxy for the total market. The Barclays Capital U.S. Aggregate Bond Index is a measure of the overall performance of the U.S. bond market. These indices are unmanaged and do not reflect the deduction of fees, such as investment and fund accounting fees, associated with a mutual fund. Investors cannot invest directly in an index. |
| Average Annual Total Returns as of 3/31/13 | ||||||||||||||||
| Moderate Allocation Strategy | 1 Year | 3 Year | 5 Year | 10 Year | ||||||||||||
A Shares* | without sales charge | 6.36% | 7.23% | 5.57% | 7.30% | |||||||||||
| with sales charge** | 0.21% | 5.13% | 4.33% | 6.67% | ||||||||||||
C Shares* | without CDSC | 5.69% | 6.49% | 4.82% | 6.71% | |||||||||||
| with CDSC** | 4.69% | 6.49% | 4.82% | 6.71% | ||||||||||||
I Shares | 6.60% | 7.52% | 5.87% | 7.59% | ||||||||||||
| Hybrid 50/50 Blend Index (50% of the Barclays Capital U.S. Aggregate Bond Index, 50% of the S&P 500 Index ) | 8.93% | 9.39% | 6.12% | 7.08% | ||||||||||||
| S&P 500 Index | 13.96% | 12.67% | 5.81% | 8.53% | ||||||||||||
| Barclays Capital U.S. Aggregate Bond Index | 3.77% | 5.52% | 5.47% | 5.02% | ||||||||||||
| Prospectus Expense Ratio1 | Gross | |||||||||||||||
| A Shares | 1.30% | |||||||||||||||
| C Shares | 1.90% | |||||||||||||||
| I Shares | 1.24% | |||||||||||||||
Because equity markets may be volatile in the short-term, resulting in unusually high or low performance, investors should evaluate long-term performance before making an investment.
The Adviser has contractually agreed to waive fees and reimburse expenses until at least August 1, 2013 in order to keep total operating expenses (excluding underlying fund fees and expenses) from exceeding 0.70%, 1.30% and 0.50% for A, C and I Shares, respectively. Without these fee waivers, performance would have been lower. The indirect expenses of the Fund, which represent a pro-rata share of the expenses of the underlying funds in which the Fund invests, totaled 0.68% of net assets and are included in the expense ratios listed in the table above.
Past performance does not guarantee future results. The performance data quoted represents past performance and current returns may be lower or higher. Total return figures include change in share price, reinvestment of dividends and capital gains and do not reflect taxes that a shareholder would pay on fund distributions or on the redemption of fund shares. The investment return and principal value will fluctuate so that an investor’s shares, when redeemed, may be worth more or less than the original cost. For performance data current to the most recent month end, visit our website at www.ridgeworth.com.
| * | Class A Shares and C Shares were offered beginning on 10/10/03 and 4/5/05, respectively. The performance shown prior to such |
| dates is based on performance of the I Shares of the Fund, and has not been adjusted to reflect A Share and C Share expenses. If it had been, performance would have been lower. |
| ** | Class A Share performance reflects the maximum front-end sales charge of 5.75% and Class C Shares reflect the maximum CDSC (contingent deferred sales charge) of 1.00% in year one only. |
| 1 | This information is included in the most current prospectus available to current and prospective shareholders of the Fund. Additional information pertaining to the 3/31/13 expense ratios can be found in the financial highlights. |
Sector Weightings (as of March 31, 2013)
as a percentage of investments
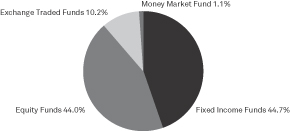
28
SCHEDULES OF PORTFOLIO INVESTMENTS
RIDGEWORTH FUNDS March 31, 2013
Aggressive Growth Stock Fund
| Shares | Value($) | |||||||
| Common Stocks 98.8% | ||||||||
Consumer Discretionary 29.9% | ||||||||
Amazon.com, Inc.* | 3,700 | 986,013 | ||||||
Chipotle Mexican Grill, Inc.* | 1,800 | 586,566 | ||||||
Deckers Outdoor Corp.* | 6,600 | 367,554 | ||||||
HomeAway, Inc.* | 5,900 | 191,750 | ||||||
Lululemon Athletica, Inc.* | 10,000 | 623,500 | ||||||
Michael Kors Holdings Ltd.* | 5,500 | 312,345 | ||||||
Netflix, Inc.* | 3,900 | 738,699 | ||||||
Nordstrom, Inc. | 5,900 | 325,857 | ||||||
Priceline.com, Inc.* | 1,100 | 756,723 | ||||||
Tesla Motors, Inc.* | 18,700 | 708,543 | ||||||
Vera Bradley, Inc.* | 9,000 | 212,670 | ||||||
|
| |||||||
| 5,810,220 | ||||||||
|
| |||||||
Energy 7.2% | ||||||||
Atwood Oceanics, Inc.* | 300 | 15,762 | ||||||
Dresser-Rand Group, Inc.* | 5,550 | 342,213 | ||||||
Energy XXI Bermuda Ltd. | 4,800 | 130,656 | ||||||
FMC Technologies, Inc.* | 7,900 | 429,681 | ||||||
Pioneer Natural Resources Co. | 3,900 | 484,575 | ||||||
|
| |||||||
| 1,402,887 | ||||||||
|
| |||||||
Financials 5.2% | ||||||||
BlackRock, Inc. | 400 | 102,752 | ||||||
Financial Engines, Inc. | 8,900 | 322,358 | ||||||
Portfolio Recovery Associates, Inc.* | 4,600 | 583,832 | ||||||
|
| |||||||
| 1,008,942 | ||||||||
|
| |||||||
Health Care 15.4% | ||||||||
Catamaran Corp.* | 16,000 | 848,480 | ||||||
Celgene Corp.* | 3,600 | 417,276 | ||||||
HMS Holdings Corp.* | 14,100 | 382,815 | ||||||
Intuitive Surgical, Inc.* | 1,050 | 515,750 | ||||||
IPC The Hospitalist Co.* | 3,000 | 133,440 | ||||||
Medidata Solutions, Inc.* | 1,800 | 104,364 | ||||||
Salix Pharmaceuticals Ltd.* | 6,600 | 337,788 | ||||||
Vertex Pharmaceuticals, Inc.* | 4,500 | 247,410 | ||||||
|
| |||||||
| 2,987,323 | ||||||||
|
| |||||||
Industrials 8.0% | ||||||||
BE Aerospace, Inc.* | 6,800 | 409,972 | ||||||
Chart Industries, Inc.* | 500 | 40,005 | ||||||
PACCAR, Inc. | 6,400 | 323,584 | ||||||
Precision Castparts Corp. | 4,100 | 777,442 | ||||||
|
| |||||||
| 1,551,003 | ||||||||
|
| |||||||
| Shares | Value($) | |||||||
Information Technology 33.1% | ||||||||
Alliance Data Systems Corp.* | 1,900 | 307,591 | ||||||
Apple, Inc. | 680 | 300,988 | ||||||
Cognizant Technology Solutions Corp., Cl A* | 7,900 | 605,219 | ||||||
F5 Networks, Inc.* | 6,200 | 552,296 | ||||||
Facebook, Inc., Cl A* | 28,000 | 716,240 | ||||||
Fusion-io, Inc.* | 6,800 | 111,316 | ||||||
Google, Inc., Cl A* | 1,000 | 794,030 | ||||||
LinkedIn Corp., Cl A* | 4,500 | 792,270 | ||||||
MercadoLibre, Inc. | 8,000 | 772,480 | ||||||
Mitek Systems, Inc.* | 44,700 | 209,196 | ||||||
QUALCOMM, Inc. | 9,000 | 602,550 | ||||||
Skyworks Solutions, Inc.* | 2,200 | 48,466 | ||||||
Splunk, Inc.* | 2,200 | 88,066 | ||||||
Zillow, Inc.* | 9,600 | 524,832 | ||||||
|
| |||||||
| 6,425,540 | ||||||||
|
| |||||||
Total Common Stocks | 19,185,915 | |||||||
|
| |||||||
Money Market Fund 1.5% | ||||||||
State Street Institutional Liquid Reserves Fund, Institutional Class, 0.13%(a) | 293,510 | 293,510 | ||||||
|
| |||||||
Total Money Market Fund | 293,510 | |||||||
|
| |||||||
Total Investments | 19,479,425 | |||||||
Liabilities in excess of other assets — (0.3)% | (59,634 | ) | ||||||
|
| |||||||
Net Assets — 100.0% | $ | 19,419,791 | ||||||
|
| |||||||
| * | Non-income producing security. |
| (a) | Rate disclosed, the 7 day net yield, is as of March 31, 2013. |
See Notes to Financial Statements.
29
SCHEDULES OF PORTFOLIO INVESTMENTS
RIDGEWORTH FUNDS March 31, 2013
International Equity Fund
| Shares | Value($) | |||||||
| Common Stocks 96.0% | ||||||||
Australia 1.2% | ||||||||
Australia & New Zealand Banking Group Ltd. | 109,424 | 3,250,333 | ||||||
|
| |||||||
Austria 3.2% | ||||||||
OMV AG | 97,879 | 4,162,344 | ||||||
Raiffeisen Bank International AG(a) | 91,979 | 3,126,207 | ||||||
Voestalpine AG | 55,368 | 1,700,171 | ||||||
|
| |||||||
| 8,988,722 | ||||||||
|
| |||||||
Belgium 3.1% | ||||||||
Ageas | 97,635 | 3,302,175 | ||||||
Anheuser-Busch InBev NV | 53,812 | 5,328,624 | ||||||
|
| |||||||
| 8,630,799 | ||||||||
|
| |||||||
Canada 0.2% | ||||||||
Potash Corp. of Saskatchewan, Inc. | 15,988 | 627,529 | ||||||
|
| |||||||
France 13.4% | ||||||||
AXA SA | 251,059 | 4,315,609 | ||||||
BNP Paribas | 107,939 | 5,540,002 | ||||||
Cap Gemini SA | 48,260 | 2,196,105 | ||||||
Compagnie Generale des Etablissements Michelin | 17,800 | 1,488,806 | ||||||
Publicis Groupe SA | 63,602 | 4,264,744 | ||||||
Renault SA | 53,345 | 3,342,089 | ||||||
Sanofi-Aventis | 28,261 | 2,871,665 | ||||||
Total SA | 118,862 | 5,691,533 | ||||||
Valeo SA | 41,527 | 2,247,164 | ||||||
Vinci SA | 58,147 | 2,619,560 | ||||||
Vivendi SA | 125,954 | 2,601,835 | ||||||
|
| |||||||
| 37,179,112 | ||||||||
|
| |||||||
Germany 13.1% | ||||||||
Adidas AG | 32,940 | 3,417,624 | ||||||
BASF SE | 53,893 | 4,719,736 | ||||||
Continental AG | 16,641 | 1,989,568 | ||||||
Deutsche Lufthansa AG | 157,814 | 3,081,949 | ||||||
Deutsche Post AG | 182,638 | 4,208,211 | ||||||
Fresenius SE | 22,949 | 2,832,582 | ||||||
Hannover Rueckversicherung AG | 34,998 | 2,745,119 | ||||||
Infineon Technologies AG | 190,454 | 1,503,863 | ||||||
Muenchener Rueckversicherungs AG | 20,316 | 3,799,540 | ||||||
SAP AG | 43,349 | 3,472,934 | ||||||
Siemens AG | 43,469 | 4,682,216 | ||||||
|
| |||||||
| 36,453,342 | ||||||||
|
| |||||||
Hong Kong 1.8% | ||||||||
Digital China Holdings Ltd. | 3,632,000 | 4,903,461 | ||||||
|
| |||||||
Hungary 0.8% | ||||||||
OTP Bank PLC | 124,832 | 2,252,708 | ||||||
|
| |||||||
| Shares | Value($) | |||||||
India 0.3% | ||||||||
Grasim Industries Ltd. | 15,097 | 780,266 | ||||||
|
| |||||||
Indonesia 1.9% | ||||||||
Bank Mandiri Persero Tbk PT | 2,625,500 | 2,701,826 | ||||||
Bank Rakyat Indonesia Persero Tbk PT | 2,919,000 | 2,628,377 | ||||||
|
| |||||||
| 5,330,203 | ||||||||
|
| |||||||
Italy 0.9% | ||||||||
Intesa Sanpaolo SpA | 468,429 | 685,721 | ||||||
Saipem SpA | 60,861 | 1,871,573 | ||||||
|
| |||||||
| 2,557,294 | ||||||||
|
| |||||||
Japan 19.0% | ||||||||
Astellas Pharma, Inc. | 42,400 | 2,279,110 | ||||||
Daicel Corp. | 351,000 | 2,733,128 | ||||||
Honda Motor Co. Ltd. | 94,088 | 3,598,203 | ||||||
ITOCHU Corp. | 628,580 | 7,672,369 | ||||||
JX Holdings, Inc. | 352,400 | 1,972,856 | ||||||
LINTEC Corp. | 58,000 | 1,102,884 | ||||||
Marubeni Corp. | 484,000 | 3,681,351 | ||||||
Miraca Holdings, Inc. | 23,000 | 1,101,928 | ||||||
Mitsubishi UFJ Financial Group, Inc. | 793,202 | 4,752,387 | ||||||
Mitsui & Co. Ltd. | 76,500 | 1,071,089 | ||||||
Nidec Corp.(a) | 34,000 | 2,029,851 | ||||||
Nippon Telegraph & Telephone Corp. | 12,216 | 532,061 | ||||||
Sekisui Chemical Co. Ltd. | 229,000 | 2,520,253 | ||||||
Sumitomo Corp. | 465,244 | 5,846,748 | ||||||
Sumitomo Mitsui Financial Group, Inc. | 112,205 | 4,577,120 | ||||||
Toyota Motor Corp. | 97,400 | 4,992,352 | ||||||
Unipres Corp. | 100,000 | 2,239,337 | ||||||
|
| |||||||
| 52,703,027 | ||||||||
|
| |||||||
Netherlands 4.5% | ||||||||
ING Groep NV* | 242,027 | 1,717,813 | ||||||
Koninklijke Ahold NV | 283,994 | 4,352,073 | ||||||
LyondellBasell Industries NV, Cl A | 46,469 | 2,941,023 | ||||||
Royal Dutch Shell PLC ADR | 50,961 | 3,405,214 | ||||||
|
| |||||||
| 12,416,123 | ||||||||
|
| |||||||
Norway 2.3% | ||||||||
Telenor ASA | 181,061 | 3,958,651 | ||||||
Yara International ASA | 51,959 | 2,353,867 | ||||||
|
| |||||||
| 6,312,518 | ||||||||
|
| |||||||
Russia 1.2% | ||||||||
Sberbank of Russia SP ADR | 254,954 | 3,268,510 | ||||||
|
| |||||||
Singapore 0.8% | ||||||||
Indofood Agri Resources Ltd. | 2,157,000 | 2,147,696 | ||||||
|
| |||||||
See Notes to Financial Statements.
30
SCHEDULES OF PORTFOLIO INVESTMENTS
RIDGEWORTH FUNDS March 31, 2013
International Equity Fund — concluded
| Shares | Value($) | |||||||
South Korea 3.2% | ||||||||
Celltrion, Inc. | 35,621 | 1,703,251 | ||||||
Hyundai Motor Co. | 6,787 | 1,363,378 | ||||||
Korea Electric Power Corp.* | 177,780 | 4,865,541 | ||||||
Silicon Works Co. Ltd. | 40,677 | 850,028 | ||||||
|
| |||||||
| 8,782,198 | ||||||||
|
| |||||||
Sweden 2.3% | ||||||||
Swedbank AB, Cl A | 195,116 | 4,437,347 | ||||||
Volvo AB, Cl B | 126,495 | 1,839,225 | ||||||
|
| |||||||
| 6,276,572 | ||||||||
|
| |||||||
Switzerland 3.3% | ||||||||
Roche Holding AG | 15,487 | 3,605,422 | ||||||
Transocean Ltd.* | 35,214 | 1,829,720 | ||||||
Xstrata PLC | 224,933 | 3,650,150 | ||||||
|
| |||||||
| 9,085,292 | ||||||||
|
| |||||||
Taiwan 0.2% | ||||||||
Advanced Semiconductor Engineering, Inc. | 695,000 | 562,461 | ||||||
|
| |||||||
Thailand 1.7% | ||||||||
Kasikornbank | 185,900 | 1,320,376 | ||||||
Krung Thai Bank (Foreign Registered) | 1,622,700 | 1,374,183 | ||||||
Siam Commercial Bank (Foreign Registered) | 324,200 | 1,965,016 | ||||||
|
| |||||||
| 4,659,575 | ||||||||
|
| |||||||
Turkey 2.1% | ||||||||
Koc Holding AS | 107,750 | 625,311 | ||||||
Tofas Turk Otomobil Fabrikasi AS | 138,516 | 999,079 | ||||||
Turkiye Halk Bankasi AS | 394,252 | 4,216,424 | ||||||
|
| |||||||
| 5,840,814 | ||||||||
|
| |||||||
United Kingdom 15.5% | ||||||||
AstraZeneca PLC | 84,943 | 4,258,553 | ||||||
Barclays PLC | 1,262,302 | 5,584,270 | ||||||
BP PLC SP ADR | 140,366 | 5,944,500 | ||||||
British American Tobacco PLC | 108,097 | 5,793,025 | ||||||
BT Group PLC | 1,324,010 | 5,592,711 | ||||||
Rio Tinto PLC SP ADR(a) | 104,285 | 4,909,737 | ||||||
Royal Dutch Shell PLC, Cl A | 71,034 | 2,297,885 | ||||||
SABMiller PLC | 75,851 | 3,992,322 | ||||||
Subsea 7 SA | 64,414 | 1,505,374 | ||||||
WPP PLC | 202,224 | 3,223,254 | ||||||
|
| |||||||
| 43,101,631 | ||||||||
|
| |||||||
Total Common Stocks (Cost $224,890,729) | 266,110,186 | |||||||
|
| |||||||
| Shares | Value($) | |||||||
| Preferred Stocks 1.5% | ||||||||
Brazil 0.2% | ||||||||
Telefonica Brasil SA, 4.78% | 23,406 | 624,894 | ||||||
|
| |||||||
Germany 1.3% | ||||||||
Volkswagen AG, 2.02% | 17,926 | 3,561,661 | ||||||
|
| |||||||
Total Preferred Stocks (Cost $3,460,175) | 4,186,555 | |||||||
|
| |||||||
Short-Term Investment 3.7% | ||||||||
RidgeWorth Funds Securities Lending Joint Account(b) | 10,253,825 | 10,253,825 | ||||||
|
| |||||||
Total Short-Term Investment (Cost $10,253,825) | 10,253,825 | |||||||
|
| |||||||
Money Market Fund 1.3% | ||||||||
State Street Institutional Liquid Reserves Fund, Institutional Class, 0.13%(c) | 3,597,807 | 3,597,807 | ||||||
|
| |||||||
Total Money Market Fund (Cost $3,597,807) | 3,597,807 | |||||||
|
| |||||||
Total Investments (Cost $242,202,536) —102.5% | 284,148,373 | |||||||
Liabilities in excess of other assets — (2.5)% | (7,031,019 | ) | ||||||
|
| |||||||
Net Assets — 100.0% | $ | 277,117,354 | ||||||
|
| |||||||
| * | Non-income producing security. |
| (a) | The security or a partial position of the security was on loan as of March 31, 2013. The total value of securities on loan as of March 31, 2013 was $9,880,422. |
| (b) | Purchased with cash collateral held from securities lending. The value of the collateral could include collateral held for securities that were sold on or before March 31, 2013 (See Note 2(h)). |
| (c) | Rate disclosed, the 7 day net yield, is as of March 31, 2013. |
Investment Abbreviations
| ADR | — | American Depositary Receipt | ||
| SP ADR | — | Sponsored American Depositary Receipt |
See Notes to Financial Statements.
31
SCHEDULES OF PORTFOLIO INVESTMENTS
RIDGEWORTH FUNDS March 31, 2013
International Equity Index Fund
| Shares | Value($) | |||||||
| Common Stocks 95.6% | ||||||||
Australia 5.8% | ||||||||
AGL Energy Ltd. | 5,746 | 94,882 | ||||||
ALS Ltd. | 3,744 | 40,813 | ||||||
Alumina Ltd.* | 30,564 | 35,322 | ||||||
Amcor Ltd. | 15,236 | 147,208 | ||||||
AMP Ltd. | 35,260 | 191,264 | ||||||
Arrium Ltd. | 16,233 | 14,704 | ||||||
Asciano Ltd. | 13,991 | 81,428 | ||||||
ASX Ltd. | 2,188 | 82,442 | ||||||
Aurizon Holdings Ltd. | 21,032 | 88,247 | ||||||
Australia & New Zealand Banking Group Ltd. | 35,567 | 1,056,483 | ||||||
Bendigo and Adelaide Bank Ltd. | 4,664 | 49,870 | ||||||
BGP Holdings PLC*(a)(b) | 737,041 | — | ||||||
BHP Billiton Ltd. | 42,774 | 1,458,939 | ||||||
BlueScope Steel Ltd.* | 4,242 | 22,127 | ||||||
Boral Ltd. | 8,972 | 45,865 | ||||||
Brambles Ltd. | 17,960 | 158,381 | ||||||
Caltex Australia Ltd. | 1,708 | 37,966 | ||||||
Coca-Cola Amatil Ltd. | 6,991 | 106,123 | ||||||
Cochlear Ltd. | 709 | 50,233 | ||||||
Commonwealth Bank of Australia | 21,180 | 1,499,727 | ||||||
Computershare Ltd. | 5,505 | 58,462 | ||||||
Crown Ltd. | 5,589 | 71,574 | ||||||
CSL Ltd. | 6,857 | 422,853 | ||||||
Dexus Property Group REIT | 60,661 | 65,683 | ||||||
Echo Entertainment Group Ltd. | 6,599 | 23,910 | ||||||
Fairfax Media Ltd.(c) | 27,857 | 18,272 | ||||||
Fortescue Metals Group Ltd.(c) | 15,524 | 63,681 | ||||||
Goodman Group | 14,144 | 70,390 | ||||||
GPT Group REIT | 19,408 | 74,967 | ||||||
Harvey Norman Holdings Ltd.(c) | 6,595 | 18,745 | ||||||
Iluka Resources Ltd. | 5,073 | 49,384 | ||||||
Incitec Pivot Ltd. | 19,864 | 63,906 | ||||||
Insurance Australia Group Ltd. | 26,210 | 155,818 | ||||||
Leighton Holdings Ltd. | 1,883 | 40,268 | ||||||
Lend Lease Group | 6,653 | 70,653 | ||||||
Lynas Corp. Ltd.*(c) | 21,275 | 12,404 | ||||||
Macquarie Group Ltd. | 4,274 | 165,313 | ||||||
Metcash Ltd. | 9,515 | 41,013 | ||||||
Mirvac Group REIT | 42,589 | 71,833 | ||||||
National Australia Bank Ltd. | 27,867 | 894,784 | ||||||
Newcrest Mining Ltd. | 9,607 | 200,547 | ||||||
Orica Ltd. | 4,536 | 115,469 | ||||||
Origin Energy Ltd. | 13,169 | 182,081 | ||||||
OZ Minerals Ltd. | 4,030 | 22,364 | ||||||
Paladin Energy Ltd.* | 8,668 | 8,934 | ||||||
Qantas Airways Ltd.* | 14,166 | 26,327 | ||||||
QBE Insurance Group Ltd. | 13,013 | 183,040 | ||||||
Ramsay Health Care Ltd. | 1,615 | 54,311 | ||||||
Rio Tinto Ltd. | 5,420 | 322,782 | ||||||
Santos Ltd. | 10,729 | 138,849 | ||||||
| Shares | Value($) | |||||||
Australia—continued | ||||||||
Shopping Centres Australasia Property Group REIT* | 3,013 | 5,192 | ||||||
Sims Metal Management Ltd. | 2,055 | 21,460 | ||||||
Sonic Healthcare Ltd. | 4,590 | 66,570 | ||||||
SP Ausnet | 17,329 | 21,560 | ||||||
Stockland REIT | 29,711 | 112,908 | ||||||
Suncorp Group Ltd. | 15,975 | 196,595 | ||||||
Sydney Airport | 5,287 | 18,055 | ||||||
TABCORP Holdings Ltd. | 8,539 | 28,716 | ||||||
Tatts Group Ltd. | 16,004 | 52,820 | ||||||
Telstra Corp. Ltd. | 55,016 | 258,332 | ||||||
Toll Holdings Ltd. | 8,221 | 50,757 | ||||||
Transurban Group | 16,588 | 110,186 | ||||||
Wesfarmers Ltd. | 10,683 | 447,129 | ||||||
Wesfarmers Ltd. PPS | 1,896 | 80,540 | ||||||
Westfield Group REIT | 27,380 | 309,298 | ||||||
Westfield Retail Trust REIT | 36,590 | 115,049 | ||||||
Westpac Banking Corp. | 40,469 | 1,296,052 | ||||||
Woodside Petroleum Ltd. | 7,812 | 291,341 | ||||||
Woolworths Ltd. | 15,065 | 529,994 | ||||||
WorleyParsons Ltd. | 2,412 | 62,003 | ||||||
|
| |||||||
| 13,045,198 | ||||||||
|
| |||||||
Austria 1.5% | ||||||||
Andritz AG(c) | 8,359 | 560,823 | ||||||
Erste Group Bank AG* | 24,893 | 693,385 | ||||||
Immofinanz AG* | 94,456 | 357,787 | ||||||
OMV AG | 16,628 | 707,112 | ||||||
Raiffeisen Bank International AG(c) | 4,935 | 167,732 | ||||||
Telekom Austria AG | 25,772 | 169,111 | ||||||
Verbund AG(c) | 6,744 | 146,184 | ||||||
Vienna Insurance Group | 3,843 | 186,110 | ||||||
Voestalpine AG | 13,048 | 400,661 | ||||||
|
| |||||||
| 3,388,905 | ||||||||
|
| |||||||
Belgium 2.2% | ||||||||
Ageas | 8,867 | 299,896 | ||||||
Anheuser-Busch InBev NV | 28,583 | 2,830,374 | ||||||
Belgacom SA | 6,128 | 152,351 | ||||||
Colruyt SA | 3,047 | 147,346 | ||||||
Delhaize Group SA | 4,133 | 225,452 | ||||||
Dexia SA*(c) | 24,959 | 1,600 | ||||||
Groupe Bruxelles Lambert SA | 2,902 | 221,894 | ||||||
KBC Groep NV | 6,379 | 219,714 | ||||||
Mobistar SA | 1,204 | 27,039 | ||||||
Solvay SA | 2,120 | 287,106 | ||||||
UCB SA | 4,050 | 258,537 | ||||||
Umicore | 4,558 | 214,105 | ||||||
|
| |||||||
| 4,885,414 | ||||||||
|
| |||||||
Cayman Islands 0.1% | ||||||||
Sands China Ltd. | 16,487 | 85,487 | ||||||
Veripos, Inc* | 1,325 | 4,991 | ||||||
See Notes to Financial Statements.
32
SCHEDULES OF PORTFOLIO INVESTMENTS
RIDGEWORTH FUNDS March 31, 2013
International Equity Index Fund — continued
| Shares | Value($) | |||||||
Cayman Islands—continued | ||||||||
Wynn Macau Ltd.* | 11,416 | 30,369 | ||||||
|
| |||||||
| 120,847 | ||||||||
|
| |||||||
Denmark 1.3% | ||||||||
A.P. Moller—Maersk A/S, Cl B | 32 | 249,777 | ||||||
A.P. Moller—Maersk A/S, Cl A | 15 | 112,131 | ||||||
Carlsberg A/S, Cl B(c) | 2,204 | 214,474 | ||||||
Coloplast A/S, Cl B | 3,061 | 164,670 | ||||||
Danske Bank A/S* | 13,494 | 241,279 | ||||||
DSV A/S(c) | 5,059 | 122,204 | ||||||
Novo Nordisk A/S, Cl B(c) | 8,496 | 1,380,359 | ||||||
Novozymes A/S, Cl B | 5,524 | 187,286 | ||||||
Pandora A/S | 1,434 | 39,447 | ||||||
TDC A/S | 8,863 | 68,098 | ||||||
Tryg A/S | 604 | 48,745 | ||||||
William Demant Holding A/S* | 555 | 46,498 | ||||||
|
| |||||||
| 2,874,968 | ||||||||
|
| |||||||
Finland 0.9% | ||||||||
Elisa Oyj(c) | 2,717 | 50,466 | ||||||
Fortum Oyj | 11,487 | 231,471 | ||||||
Kesko Oyj, Cl B | 1,286 | 40,173 | ||||||
Kone Oyj, Cl B | 4,090 | 321,644 | ||||||
Metso Oyj(c) | 2,419 | 102,915 | ||||||
Neste Oil Oyj(c) | 2,485 | 35,039 | ||||||
Nokia Oyj(c) | 96,565 | 312,426 | ||||||
Nokian Renkaat Oyj | 2,046 | 91,006 | ||||||
Orion Oyj, Cl B(c) | 1,778 | 46,699 | ||||||
Outokumpu Oyj* | 2,962 | 2,252 | ||||||
Pohjola Bank PLC | 2,639 | 38,361 | ||||||
Rautaruukki Oyj | 1,602 | 10,169 | ||||||
Sampo Oyj, Cl A | 10,948 | 421,011 | ||||||
Sanoma Oyj(c) | 1,560 | 14,308 | ||||||
Stora Enso Oyj | 11,006 | 71,034 | ||||||
UPM-Kymmene Oyj | 9,871 | 110,146 | ||||||
Wartsila Oyj | 3,166 | 142,245 | ||||||
|
| |||||||
| 2,041,365 | ||||||||
|
| |||||||
France 10.0% | ||||||||
Accor SA | 3,124 | 108,522 | ||||||
Aeroports de Paris | 739 | 62,682 | ||||||
Air France-KLM* | 2,935 | 27,690 | ||||||
Air Liquide SA | 2,419 | 293,894 | ||||||
Air Liquide SA(a)(b) | 6,113 | 742,692 | ||||||
Alstom | 4,344 | 176,796 | ||||||
Arkema SA | 1,187 | 107,985 | ||||||
Atos Origin SA | 1,075 | 73,984 | ||||||
AXA SA | 40,308 | 692,879 | ||||||
BNP Paribas | 21,955 | 1,126,847 | ||||||
Bouygues SA | 5,083 | 137,871 | ||||||
Bureau Veritas SA | 1,193 | 148,490 | ||||||
Cap Gemini SA | 3,172 | 144,344 | ||||||
Carrefour SA | 12,411 | 339,738 | ||||||
Casino Guichard-Perrachon SA | 1,188 | 124,842 | ||||||
| Shares | Value($) | |||||||
France—continued | ||||||||
Christian Dior SA | 1,174 | 194,733 | ||||||
CNP Assurances | 3,140 | 43,088 | ||||||
Compagnie de Saint—Gobain | 8,534 | 316,365 | ||||||
Compagnie Generale d’Optique Essilor International SA | 4,301 | 478,274 | ||||||
Compagnie Generale de Geophysique-Veritas* | 3,019 | 67,994 | ||||||
Compagnie Generale des Etablissements Michelin | 3,719 | 311,060 | ||||||
Credit Agricole SA* | 20,774 | 171,119 | ||||||
Danone SA | 12,451 | 866,326 | ||||||
Dassault Systemes SA | 1,267 | 146,462 | ||||||
Edenred | 3,389 | 110,907 | ||||||
Electricite de France | 5,130 | 98,375 | ||||||
Eramet | 113 | 12,228 | ||||||
Eurazeo | 691 | 35,032 | ||||||
European Aeronautic Defence and Space Co. | 8,651 | 440,245 | ||||||
Eutelsat Communications | 2,122 | 74,816 | ||||||
Fonciere Des Regions | 593 | 46,429 | ||||||
France Telecom SA | 39,903 | 403,571 | ||||||
GDF SUEZ | 26,390 | 508,097 | ||||||
Gecina SA | 471 | 54,652 | ||||||
Groupe Eurotunnel SA | 11,183 | 89,077 | ||||||
ICADE REIT | 500 | 43,724 | ||||||
Iliad SA | 409 | 87,004 | ||||||
Imerys | 728 | 47,397 | ||||||
JCDecaux SA | 1,427 | 39,108 | ||||||
Klepierre | 2,237 | 87,875 | ||||||
L’Oreal SA | 5,113 | 810,743 | ||||||
Lafarge SA(b) | 6,229 | 413,844 | ||||||
Lagardere SCA | 2,548 | 93,820 | ||||||
Legrand SA | 4,281 | 186,688 | ||||||
LVMH Moet Hennessy Louis Vuitton SA | 5,869 | 1,007,354 | ||||||
Metropole Television SA | 1,250 | 19,428 | ||||||
Natixis | 18,754 | 71,206 | ||||||
Pernod-Ricard SA | 4,838 | 602,857 | ||||||
Peugeot SA*(c) | 3,203 | 23,198 | ||||||
PPR | 1,630 | 358,126 | ||||||
Publicis Groupe SA | 4,036 | 270,628 | ||||||
Remy Cointreau SA | 516 | 59,635 | ||||||
Renault SA | 4,090 | 256,240 | ||||||
Safran SA | 5,208 | 232,287 | ||||||
Sanofi-Aventis | 26,976 | 2,741,094 | ||||||
Schneider Electric SA | 11,935 | �� | 872,037 | |||||
Scor SE | 3,612 | 103,713 | ||||||
Societe BIC SA | 619 | 71,880 | ||||||
Societe Generale* | 15,883 | 521,818 | ||||||
Sodexo | 2,006 | 186,940 | ||||||
Suez Environnement SA | 5,686 | 72,514 | ||||||
Technip SA | 2,073 | 212,529 | ||||||
See Notes to Financial Statements.
33
SCHEDULES OF PORTFOLIO INVESTMENTS
RIDGEWORTH FUNDS March 31, 2013
International Equity Index Fund — continued
| Shares | Value($) | |||||||
France—continued | ||||||||
Thales SA | 2,136 | 90,341 | ||||||
Total SA | 48,574 | 2,325,895 | ||||||
Unibail-Rodamco | 1,953 | 454,878 | ||||||
Vallourec SA | 2,365 | 113,684 | ||||||
Veolia Environnement SA | 7,392 | 93,219 | ||||||
Vinci SA | 9,454 | 425,909 | ||||||
Vivendi SA | 27,232 | 562,532 | ||||||
Wendel SA | 697 | 73,763 | ||||||
Zodiac Aerospace | 780 | 90,886 | ||||||
|
| |||||||
| 22,502,900 | ||||||||
|
| |||||||
Germany 12.5% | ||||||||
Adidas AG | 6,686 | 693,693 | ||||||
Allianz SE | 14,473 | 1,965,608 | ||||||
Axel Springer AG | 1,289 | 55,856 | ||||||
BASF SE | 29,044 | 2,543,559 | ||||||
Bayer AG | 26,515 | 2,735,036 | ||||||
Bayerische Motoren Werke AG | 10,414 | 898,534 | ||||||
Beiersdorf AG | 3,246 | 299,750 | ||||||
Brenntag AG | 1,725 | 269,323 | ||||||
Celesio AG | 2,789 | 52,375 | ||||||
Commerzbank AG* | 118,005 | 173,198 | ||||||
Continental AG | 2,547 | 304,515 | ||||||
Daimler AG | 29,327 | 1,595,628 | ||||||
Deutsche Bank AG | 30,099 | 1,173,485 | ||||||
Deutsche Boerse AG | 6,352 | 384,684 | ||||||
Deutsche Lufthansa AG | 7,448 | 145,452 | ||||||
Deutsche Post AG | 27,211 | 626,976 | ||||||
Deutsche Telekom AG | 90,426 | 955,816 | ||||||
E.ON AG | 57,482 | 1,003,567 | ||||||
Fraport AG | 1,187 | 66,530 | ||||||
Fresenius Medical Care AG | 6,252 | 421,944 | ||||||
Fresenius SE | 3,617 | 446,444 | ||||||
GEA Group AG | 5,461 | 179,975 | ||||||
Hannover Rueckversicherung AG | 1,926 | 151,069 | ||||||
Heidelberg Cement AG | 4,522 | 324,953 | ||||||
Henkel AG & Co. KGaA | 4,214 | 332,746 | ||||||
Hochtief AG* | 1,353 | 88,001 | ||||||
Hugo Boss AG | 849 | 95,138 | ||||||
Infineon Technologies AG | 35,489 | 280,228 | ||||||
K+S AG | 5,497 | 255,676 | ||||||
Kabel Deutschland Holding AG | 2,351 | 216,921 | ||||||
Lanxess AG | 2,662 | 188,768 | ||||||
Linde AG | 5,994 | 1,114,479 | ||||||
MAN SE | 1,473 | 158,361 | ||||||
Merck KGaA | 2,105 | 317,589 | ||||||
Metro AG | 4,181 | 118,872 | ||||||
Muenchener Rueckversicherungs AG | 5,817 | 1,087,907 | ||||||
RWE AG | 16,098 | 599,970 | ||||||
Salzgitter AG | 1,256 | 50,417 | ||||||
SAP AG | 29,528 | 2,365,656 | ||||||
| Shares | Value($) | |||||||
Germany—continued | ||||||||
Siemens AG | 26,193 | 2,821,351 | ||||||
Suedzucker AG | 2,126 | 89,796 | ||||||
ThyssenKrupp AG* | 10,565 | 214,856 | ||||||
United Internet AG | 3,610 | 87,783 | ||||||
Volkswagen AG | 924 | 173,815 | ||||||
Wacker Chemie AG | 497 | 35,568 | ||||||
|
| |||||||
| 28,161,868 | ||||||||
|
| |||||||
Greece 1.6% | ||||||||
Alpha Bank AE* | 2,054 | 1,869 | ||||||
Coca-Cola Hellenic Bottling Co. SA | 104,249 | 2,792,902 | ||||||
National Bank of Greece SA* | 1,536 | 1,305 | ||||||
OPAP SA | 115,458 | 911,680 | ||||||
|
| |||||||
| 3,707,756 | ||||||||
|
| |||||||
Guernsey 0.0%(d) | ||||||||
Resolution Ltd. | 12,277 | 50,833 | ||||||
|
| |||||||
Hong Kong 1.1% | ||||||||
AIA Group Ltd. | 52,481 | 229,191 | ||||||
ASM Pacific Technology Ltd. | 1,540 | 16,932 | ||||||
Bank of East Asia Ltd. | 10,630 | 41,835 | ||||||
BOC Hong Kong Holdings Ltd. | 25,528 | 85,339 | ||||||
Cathay Pacific Airways Ltd. | 9,843 | 16,839 | ||||||
Cheung Kong (Holdings) Ltd. | 10,239 | 151,160 | ||||||
Cheung Kong Infrastructure Holdings Ltd. | 5,854 | 40,120 | ||||||
CLP Holdings Ltd. | 13,366 | 117,086 | ||||||
Esprit Holdings Ltd. | 8,401 | 10,087 | ||||||
Foxconn International Holdings Ltd.* | 15,624 | 5,837 | ||||||
Galaxy Entertainment Group Ltd.* | 10,803 | 45,091 | ||||||
Hang Lung Properties Ltd. | 16,935 | 63,376 | ||||||
Hang Seng Bank Ltd. | 5,224 | 83,651 | ||||||
Henderson Land Development Co. Ltd. | 9,358 | 63,954 | ||||||
HKT Trust / HKT Ltd. | 2,296 | 2,298 | ||||||
Hong Kong & China Gas Co. Ltd. (The) | 35,828 | 104,310 | ||||||
Hong Kong Electric Holdings Ltd. | 10,200 | 96,119 | ||||||
Hong Kong Exchanges & Clearing Ltd. | 7,039 | 119,968 | ||||||
Hopewell Holdings Ltd. | 4,581 | 18,589 | ||||||
Hutchison Whampoa Ltd. | 15,113 | 157,603 | ||||||
Hysan Development Co. Ltd. | 6,257 | 31,718 | ||||||
Kerry Properties Ltd. | 5,507 | 24,511 | ||||||
Li & Fung Ltd. | 39,707 | 54,733 | ||||||
Lifestyle International Holdings Ltd. | 4,893 | 10,804 | ||||||
Link REIT (The) | 15,576 | 85,078 | ||||||
MTR Corp. | 10,121 | 40,223 | ||||||
See Notes to Financial Statements.
34
SCHEDULES OF PORTFOLIO INVESTMENTS
RIDGEWORTH FUNDS March 31, 2013
International Equity Index Fund — continued
| Shares | Value($) | |||||||
Hong Kong—continued | ||||||||
New World Development Ltd. | 25,251 | 42,809 | ||||||
Newton Resources Ltd.* | 391 | 42 | ||||||
Noble Group Ltd. | 41,598 | 40,748 | ||||||
NWS Holdings Ltd. | 10,372 | 18,573 | ||||||
Orient Overseas International Ltd. | 3,031 | 20,499 | ||||||
PCCW Ltd. | 27,824 | 12,832 | ||||||
Shangri-La Asia Ltd. | 14,968 | 29,425 | ||||||
Sino Land Co. Ltd. | 21,602 | 36,622 | ||||||
SJM Holdings Ltd. | 12,210 | 30,515 | ||||||
Sun Hung Kai Properties Ltd. | 10,664 | 143,422 | ||||||
Swire Pacific Ltd. | 5,132 | 65,484 | ||||||
Swire Properties Ltd. | 3,392 | 12,060 | ||||||
Wharf Holdings Ltd. (The) | 11,197 | 100,033 | ||||||
Wheelock & Co. Ltd. | 8,192 | 43,901 | ||||||
Wing Hang Bank Ltd. | 2,364 | 25,125 | ||||||
Yue Yuen Industrial (Holdings) Ltd. | 5,544 | 18,105 | ||||||
|
| |||||||
| 2,356,647 | ||||||||
|
| |||||||
Ireland 0.8% | ||||||||
CRH PLC | 36,426 | 804,048 | ||||||
Elan Corp. PLC* | 27,363 | 314,590 | ||||||
Experian PLC | 8,532 | 147,789 | ||||||
Irish Bank Resolution Corp. Ltd.*(a)(c) | 8,839 | — | ||||||
Irish Bank Resolution Corp. Ltd.*(a)(b) | 131,459 | — | ||||||
James Hardie Industries SE | 5,355 | 55,810 | ||||||
Kerry Group PLC, Cl A | 7,848 | 467,638 | ||||||
Prothena Corp. PLC* | 668 | 4,469 | ||||||
Ryanair Holdings PLC | 10,474 | 79,885 | ||||||
|
| |||||||
| 1,874,229 | ||||||||
|
| |||||||
Israel 0.8% | ||||||||
Bank Hapoalim BM* | 27,470 | 124,457 | ||||||
Bank Leumi Le-Israel BM* | 30,974 | 109,166 | ||||||
Bezeq Israeli Telecommunication Corp. Ltd. | 43,887 | 60,809 | ||||||
Cellcom Israel Ltd. | 1,392 | 11,661 | ||||||
Delek Group Ltd. | 123 | 34,525 | ||||||
Elbit Systems Ltd. | 617 | 26,054 | ||||||
Israel Chemicals Ltd. | 11,343 | 146,565 | ||||||
Israel Corp. Ltd. (The) | 61 | 46,285 | ||||||
Mellanox Technologies Ltd.* | 946 | 52,275 | ||||||
Mizrahi Tefahot Bank Ltd.* | 3,169 | 33,803 | ||||||
NICE Systems Ltd.* | 1,617 | 59,435 | ||||||
Partner Communications Co. Ltd. | 2,170 | 13,375 | ||||||
Teva Pharmaceutical Industries Ltd. | 27,571 | 1,085,422 | ||||||
Teva Pharmaceutical Industries Ltd. SP ADR | 31 | 1,230 | ||||||
|
| |||||||
| 1,805,062 | ||||||||
|
| |||||||
| Shares | Value($) | |||||||
Italy 7.2% | ||||||||
A2A SpA | 2,285 | 1,357 | ||||||
Assicurazioni Generali SpA | 91,388 | 1,422,150 | ||||||
Atlantia SpA(c) | 26,139 | 412,798 | ||||||
Banca Monte dei Paschi di Siena SpA*(c) | 328,254 | 77,843 | ||||||
Banco Popolare Scarl* | 111,673 | 140,786 | ||||||
Enel Green Power SpA | 110,129 | 206,530 | ||||||
Enel SpA | 520,443 | 1,698,514 | ||||||
Eni SpA | 197,173 | 4,430,644 | ||||||
Exor SpA | 3,941 | 110,078 | ||||||
Fiat Industrial SpA | 68,566 | 770,807 | ||||||
Fiat SpA* | 70,795 | 376,607 | ||||||
Finmeccanica SpA* | 25,109 | 120,697 | ||||||
Intesa Sanpaolo SpA | 778,901 | 1,140,213 | ||||||
Intesa Sanpaolo SpA—RSP | 58,700 | 74,003 | ||||||
Luxottica Group SpA | 9,235 | 462,980 | ||||||
Mediobanca SpA | 33,487 | 170,414 | ||||||
Pirelli & C SpA | 14,592 | 153,098 | ||||||
Prysmian SpA | 16,053 | 330,270 | ||||||
Saipem SpA | 21,171 | 651,042 | ||||||
Snam Rete Gas SpA | 125,888 | 573,830 | ||||||
Telecom Italia SpA | 731,770 | 516,849 | ||||||
Telecom Italia SpA | 471,774 | 290,277 | ||||||
Terna SpA | 100,908 | 417,797 | ||||||
UniCredit SpA* | 318,672 | 1,360,272 | ||||||
Unione di Banche Italiane ScpA | 66,927 | 246,562 | ||||||
|
| |||||||
| 16,156,418 | ||||||||
|
| |||||||
Japan 23.1% | ||||||||
ABC-Mart, Inc. | 823 | 31,343 | ||||||
ADVANTEST Corp. | 3,556 | 49,864 | ||||||
AEON Co. Ltd. | 12,105 | 156,368 | ||||||
AEON Credit Service Co. Ltd.(c) | 1,994 | 56,387 | ||||||
AEON Mall Co. Ltd. | 1,844 | 56,103 | ||||||
Air Water, Inc. | 5,830 | 81,007 | ||||||
Aisin Seiki Co. Ltd. | 4,617 | 168,965 | ||||||
Ajinomoto Co., Inc. | 13,926 | 204,300 | ||||||
Alfresa Holdings Corp. | 1,029 | 55,858 | ||||||
All Nippon Airways Co. Ltd.(c) | 21,235 | 43,763 | ||||||
Amada Co. Ltd. | 10,807 | 71,293 | ||||||
Aozora Bank Ltd. | 14,660 | 41,269 | ||||||
Asahi Breweries Ltd. | 7,821 | 186,853 | ||||||
Asahi Glass Co. Ltd. | 24,262 | 167,786 | ||||||
Asahi Kasei Corp. | 26,287 | 176,764 | ||||||
ASICS Corp. | 3,621 | 59,545 | ||||||
Astellas Pharma, Inc. | 9,029 | 485,332 | ||||||
Bank of Kyoto Ltd. (The) | 9,469 | 92,442 | ||||||
Bank of Yokohama Ltd. (The) | 25,660 | 148,287 | ||||||
Benesse Holdings, Inc. | 1,686 | 71,642 | ||||||
Bridgestone Corp. | 13,194 | 441,505 | ||||||
Brother Industries Ltd. | 5,798 | 59,560 | ||||||
Canon, Inc. | 22,805 | 835,792 | ||||||
Casio Computer Co. Ltd. | 5,695 | 44,345 | ||||||
See Notes to Financial Statements.
35
SCHEDULES OF PORTFOLIO INVESTMENTS
RIDGEWORTH FUNDS March 31, 2013
International Equity Index Fund — continued
| Shares | Value($) | |||||||
Japan—continued | ||||||||
Central Japan Railway Co. | 3,100 | 326,680 | ||||||
Chiba Bank Ltd. (The) | 15,999 | 114,892 | ||||||
Chiyoda Corp. | 6,179 | 68,922 | ||||||
Chubu Electric Power Co., Inc. | 13,050 | 158,593 | ||||||
Chugai Pharmaceutical Co. Ltd. | 5,363 | 119,184 | ||||||
Chugoku Bank Ltd. (The) | 6,135 | 98,932 | ||||||
Chugoku Electric Power Co., Inc. (The) | 7,289 | 95,008 | ||||||
Chuo Mitsui Trust Holdings, Inc. | 62,910 | 297,391 | ||||||
Citizen Holdings Co. Ltd. | 6,286 | 31,986 | ||||||
Coca-Cola West Co. Ltd. | 1,485 | 25,840 | ||||||
Cosmo Oil Co. Ltd.* | 15,080 | 31,719 | ||||||
Credit Saison Co. Ltd. | 3,625 | 90,264 | ||||||
Dai Nippon Printing Co. Ltd. | 15,230 | 144,801 | ||||||
Dai-ichi Life Insurance Co. Ltd. (The) | 172 | 229,126 | ||||||
Daicel Corp. | 8,771 | 68,297 | ||||||
Daido Steel Co. Ltd. | 7,950 | 42,142 | ||||||
Daihatsu Motor Co. Ltd. | 3,899 | 80,685 | ||||||
Daiichi Sankyo Co. Ltd. | 13,474 | 259,074 | ||||||
Daikin Industries Ltd. | 5,385 | 210,801 | ||||||
Dainippon Sumitomo Pharma Co. Ltd. | 3,683 | 65,025 | ||||||
Daito Trust Construction Co. Ltd. | 1,563 | 133,827 | ||||||
Daiwa House Industry Co. Ltd. | 11,232 | 218,949 | ||||||
Daiwa Securities Group, Inc. | 34,323 | 241,375 | ||||||
DeNa Co. Ltd. | 2,463 | 66,981 | ||||||
Denki Kagaku Kogyo Kabushiki Kaisha | 12,384 | 44,466 | ||||||
DENSO Corp. | 9,893 | 417,748 | ||||||
Dentsu, Inc. | 4,319 | 128,375 | ||||||
East Japan Railway Co. | 6,772 | 556,090 | ||||||
Eisai Co. Ltd. | 5,077 | 226,789 | ||||||
Electric Power Development Co. Ltd. | 2,820 | 71,687 | ||||||
Elpida Memory, Inc.*(a)(b) | 7,744 | 82 | ||||||
FamilyMart Co. Ltd. | 1,562 | 71,268 | ||||||
FANUC Ltd. | 3,924 | 599,844 | ||||||
Fast Retailing Co. Ltd. | 1,154 | 366,912 | ||||||
Fuji Electric Holdings Co. Ltd. | 15,146 | 44,247 | ||||||
Fuji Heavy Industries Ltd. | 15,518 | 244,635 | ||||||
FUJIFILM Holdings Corp. | 9,393 | 184,996 | ||||||
Fujitsu Ltd. | 37,204 | 154,531 | ||||||
Fukuoka Financial Group, Inc. | 20,254 | 101,125 | ||||||
Furukawa Electric Co. Ltd. | 15,334 | 33,719 | ||||||
Gree, Inc.(c) | 2,198 | 27,599 | ||||||
GS Yuasa Corp. | 10,321 | 42,979 | ||||||
Gunma Bank Ltd. (The) | 10,490 | 62,404 | ||||||
Hachijuni Bank Ltd. (The) | 11,268 | 67,152 | ||||||
Hakuhodo DY Holdings, Inc. | 558 | 42,798 | ||||||
Hamamatsu Photonics K.K. | 1,620 | 63,933 | ||||||
Hankyu Hanshin Holdings, Inc. | 22,000 | 132,512 | ||||||
| Shares | Value($) | |||||||
Japan—continued | ||||||||
Hino Motors Ltd. | 7,909 | 85,362 | ||||||
Hirose Electric Co. Ltd. | 995 | 130,750 | ||||||
Hiroshima Bank Ltd. (The) | 713 | 3,439 | ||||||
Hisamitsu Pharmaceutical Co., Inc. | 1,580 | 85,265 | ||||||
Hitachi Chemical Co. Ltd. | 2,586 | 39,394 | ||||||
Hitachi Construction Machinery Co. Ltd. | 2,593 | 55,367 | ||||||
Hitachi High-Technologies Corp. | 1,538 | 32,056 | ||||||
Hitachi Ltd. | 91,314 | 529,638 | ||||||
Hitachi Metals Ltd. | 6,549 | 62,405 | ||||||
Hokkaido Electric Power Co., Inc.* | 4,612 | 47,034 | ||||||
Hokuriku Electric Power Co. | 4,346 | 53,508 | ||||||
Honda Motor Co. Ltd. | 33,211 | 1,270,087 | ||||||
Hoya Corp. | 8,760 | 164,340 | ||||||
Ibiden Co. Ltd. | 2,934 | 45,692 | ||||||
Idemitsu Kosan Co. Ltd. | 824 | 71,515 | ||||||
IHI Corp. | 32,016 | 96,931 | ||||||
Inpex Corp. | 46 | 246,285 | ||||||
Isetan Mitsukoshi Holdings Ltd. | 8,983 | 129,303 | ||||||
Isuzu Motors Ltd. | 24,565 | 147,961 | ||||||
ITOCHU Corp. | 29,219 | 356,643 | ||||||
Itochu Techno-Solutions Corp. | 855 | 42,235 | ||||||
Iyo Bank Ltd. (The) | 8,423 | 77,935 | ||||||
J. Front Retailing Co. Ltd. | 12,755 | 99,184 | ||||||
Japan Petroleum Exploration Co. | 822 | 32,265 | ||||||
Japan Prime Realty Investment Corp. REIT | 16 | 61,784 | ||||||
Japan Real Estate Investment Corp. REIT | 12 | 165,847 | ||||||
Japan Retail Fund Investment Corp. REIT | 39 | 96,532 | ||||||
Japan Steel Works Ltd. (The)(c) | 9,640 | 50,793 | ||||||
Japan Tobacco, Inc. | 17,800 | 568,216 | ||||||
JFE Holdings, Inc. | 9,344 | 179,167 | ||||||
JGC Corp. | 5,708 | 145,891 | ||||||
Joyo Bank Ltd. (The) | 15,592 | 86,627 | ||||||
JS Group Corp. | 5,412 | 107,625 | ||||||
JSR Corp. | 4,357 | 88,866 | ||||||
JTEKT Corp. | 5,346 | 50,260 | ||||||
Jupiter Telecommunications Co. Ltd. | 43 | 56,322 | ||||||
JX Holdings, Inc. | 45,607 | 255,324 | ||||||
Kajima Corp. | 21,502 | 58,246 | ||||||
Kamigumi Co. Ltd. | 7,563 | 69,335 | ||||||
Kaneka Corp. | 8,076 | 46,499 | ||||||
Kansai Electric Power Co., Inc. (The)* | 14,917 | 141,191 | ||||||
Kansai Paint Co. Ltd. | 7,377 | 81,658 | ||||||
Kao Corp. | 10,039 | 324,200 | ||||||
Kawasaki Heavy Industries Ltd. | 35,674 | 112,174 | ||||||
Kawasaki Kisen Kaisha Ltd.* | 17,829 | 37,880 | ||||||
See Notes to Financial Statements.
36
SCHEDULES OF PORTFOLIO INVESTMENTS
RIDGEWORTH FUNDS March 31, 2013
International Equity Index Fund — continued
| Shares | Value($) | |||||||
Japan—continued | ||||||||
KDDI Corp. | 10,600 | 441,972 | ||||||
Keikyu Corp. | 11,975 | 124,794 | ||||||
Keio Corp. | 15,210 | 130,392 | ||||||
Keisei Electric Railway Co. Ltd. | 7,824 | 82,450 | ||||||
Keyence Corp. | 986 | 301,660 | ||||||
Kikkoman Corp. | 6,267 | 109,182 | ||||||
Kinden Corp. | 6,098 | 39,904 | ||||||
Kintetsu Corp.(c) | 33,601 | 156,342 | ||||||
Kirin Holdings Co. Ltd. | 17,518 | 281,189 | ||||||
Kobe Steel Ltd.* | 60,382 | 70,558 | ||||||
Koito Manufacturing Co. Ltd. | 4,484 | 76,928 | ||||||
Komatsu Ltd. | 18,441 | 437,444 | ||||||
Konami Corp. | 2,216 | 44,139 | ||||||
Konica Minolta Holdings, Inc. | 11,881 | 86,455 | ||||||
Kubota Corp. | 22,348 | 322,394 | ||||||
Kuraray Co. Ltd. | 8,202 | 115,099 | ||||||
Kurita Water Industries Ltd. | 2,831 | 62,644 | ||||||
Kyocera Corp. | 3,169 | 289,177 | ||||||
Kyowa Hakko Kirin Co. Ltd. | 8,038 | 90,853 | ||||||
Kyushu Electric Power Co., Inc.* | 9,961 | 101,372 | ||||||
Lawson, Inc. | 1,510 | 115,814 | ||||||
Mabuchi Motor Co. Ltd. | 773 | 41,551 | ||||||
Makita Corp. | 2,800 | 124,035 | ||||||
Marubeni Corp. | 34,541 | 262,722 | ||||||
Marui Group Co. Ltd. | 5,394 | 55,754 | ||||||
Maruichi Steel Tube Ltd. | 1,262 | 29,346 | ||||||
Mazda Motor Corp.* | 36,162 | 105,641 | ||||||
McDonald’s Holdings Co. (Japan) Ltd. | 1,625 | 43,743 | ||||||
Medipal Holdings Corp. | 3,520 | 49,247 | ||||||
Meiji Holdings Co. Ltd. | 1,708 | 78,111 | ||||||
Miraca Holdings, Inc. | 1,493 | 71,529 | ||||||
Mitsubishi Chemical Holdings Corp. | 27,151 | 128,638 | ||||||
Mitsubishi Corp. | 28,063 | 524,681 | ||||||
Mitsubishi Electric Corp. | 39,627 | 320,350 | ||||||
Mitsubishi Estate Co. Ltd. | 25,440 | 716,433 | ||||||
Mitsubishi Gas Chemical Co., Inc. | 10,246 | 67,483 | ||||||
Mitsubishi Heavy Industries Ltd. | 61,624 | 354,812 | ||||||
Mitsubishi Logistics Corp. | 5,298 | 97,704 | ||||||
Mitsubishi Materials Corp. | 28,417 | 79,997 | ||||||
Mitsubishi Motors Corp.* | 93,041 | 96,861 | ||||||
Mitsubishi Tanabe Pharma Corp. | 5,366 | 82,085 | ||||||
Mitsubishi UFJ Financial Group, Inc. | 260,424 | 1,560,303 | ||||||
Mitsubishi UFJ Lease & Finance Co. Ltd. | 13,940 | 72,710 | ||||||
Mitsui & Co. Ltd. | 35,069 | 491,007 | ||||||
Mitsui Chemicals, Inc. | 20,183 | 43,739 | ||||||
Mitsui Fudosan Co. Ltd. | 16,236 | 460,855 | ||||||
Mitsui O.S.K. Lines Ltd.* | 27,908 | 91,609 | ||||||
Mizuho Financial Group, Inc. | 451,713 | 964,512 | ||||||
| Shares | Value($) | |||||||
Japan—continued | ||||||||
MS&AD Insurance Group Holdings, Inc. | 10,355 | 229,133 | ||||||
Murata Manufacturing Co. Ltd. | 4,186 | 314,834 | ||||||
Nabtesco Corp. | 2,254 | 46,021 | ||||||
Namco Bandai Holdings, Inc. | 4,703 | 82,934 | ||||||
NEC Corp. | 64,648 | 171,690 | ||||||
NGK Insulators Ltd. | 7,762 | 82,374 | ||||||
NGK Spark Plug Co. Ltd. | 6,568 | 100,263 | ||||||
NHK Spring Co. Ltd. | 3,613 | 37,575 | ||||||
Nidec Corp.(c) | 2,239 | 133,672 | ||||||
Nikon Corp. | 6,932 | 162,374 | ||||||
Nintendo Co. Ltd. | 2,251 | 242,712 | ||||||
Nippon Building Fund, Inc. REIT | 15 | 209,699 | ||||||
Nippon Electric Glass Co. Ltd. | 10,541 | 52,293 | ||||||
Nippon Express Co. Ltd. | 22,069 | 105,498 | ||||||
Nippon Meat Packers, Inc. | 7,001 | 112,822 | ||||||
Nippon Paper Group, Inc.*(c) | 2,420 | 37,688 | ||||||
Nippon Sheet Glass Co. Ltd.* | 22,197 | 24,523 | ||||||
Nippon Steel Corp. | 164,450 | 415,776 | ||||||
Nippon Telegraph & Telephone Corp. | 8,684 | 378,227 | ||||||
Nippon Yusen Kabushiki Kaisha | 35,966 | 92,078 | ||||||
Nishi-Nippon City Bank Ltd. (The) | 16,627 | 51,222 | ||||||
Nissan Motor Co. Ltd. | 48,218 | 464,585 | ||||||
Nisshin Seifun Group, Inc. | 5,238 | 68,998 | ||||||
Nisshin Steel Holdings Co. Ltd.* | 1,700 | 13,382 | ||||||
Nissin Foods Holdings Co. Ltd. | 1,507 | 69,078 | ||||||
Nitori Holdings Co. Ltd. | 912 | 70,240 | ||||||
Nitto Denko Corp. | 3,446 | 206,097 | ||||||
NKSJ Holdings, Inc. | 7,600 | 158,967 | ||||||
NOK Corp. | 2,540 | 36,507 | ||||||
Nomura Holdings, Inc. | 74,284 | 457,691 | ||||||
Nomura Real Estate Holdings, Inc. | 2,259 | 50,395 | ||||||
Nomura Real Estate Office Fund, Inc. REIT | 8 | 58,809 | ||||||
Nomura Research Institute Ltd. | 2,408 | 62,109 | ||||||
NSK Ltd. | 11,323 | 85,763 | ||||||
NTN Corp. | 11,962 | 31,895 | ||||||
NTT Data Corp. | 31 | 101,923 | ||||||
NTT DoCoMo, Inc. | 303 | 449,342 | ||||||
NTT Urban Development Corp. | 28 | 33,552 | ||||||
Obayashi Corp. | 15,583 | 74,327 | ||||||
Odakyu Electric Railway Co. Ltd. | 13,207 | 164,149 | ||||||
OJI Paper Co. Ltd. | 21,651 | 80,960 | ||||||
Olympus Corp.* | 5,084 | 120,113 | ||||||
Omron Corp. | 4,800 | 120,848 | ||||||
Ono Pharmaceutical Co. Ltd. | 1,655 | 102,146 | ||||||
Oracle Corp. Japan | 1,085 | 48,813 | ||||||
Oriental Land Co. Ltd. | 1,038 | 169,811 | ||||||
ORIX Corp. | 21,200 | 269,349 | ||||||
See Notes to Financial Statements.
37
SCHEDULES OF PORTFOLIO INVESTMENTS
RIDGEWORTH FUNDS March 31, 2013
International Equity Index Fund — continued
| Shares | Value($) | |||||||
Japan—continued | ||||||||
Osaka Gas Co. Ltd. | 38,408 | 167,692 | ||||||
Otsuka Corp. | 642 | 69,768 | ||||||
Otsuka Holdings Co. Ltd. | 6,095 | 211,400 | ||||||
Panasonic Corp. | 43,644 | 326,397 | ||||||
Rakuten, Inc. | 14,700 | 150,068 | ||||||
Resona Holdings, Inc. | 36,139 | 190,033 | ||||||
Ricoh Co. Ltd. | 14,418 | 155,920 | ||||||
Rinnai Corp. | 1,000 | 71,068 | ||||||
Rohm Co. Ltd. | 2,387 | 82,538 | ||||||
Sankyo Co. Ltd. | 1,448 | 67,681 | ||||||
Sanrio Co. Ltd.(c) | 1,200 | 53,094 | ||||||
Santen Pharmaceutical Co. Ltd. | 1,865 | 86,281 | ||||||
SBI Holdings, Inc. | 4,840 | 42,675 | ||||||
Secom Co. Ltd. | 4,366 | 224,712 | ||||||
Sega Sammy Holdings, Inc. | 4,030 | 80,698 | ||||||
Seiko Epson Corp.(c) | 3,156 | 30,509 | ||||||
Sekisui Chemical Co. Ltd. | 11,187 | 123,118 | ||||||
Sekisui House Ltd. | 11,975 | 162,194 | ||||||
Seven & I Holdings Co. Ltd. | 14,858 | 491,663 | ||||||
Seven Bank Ltd. | 12,700 | 40,744 | ||||||
Sharp Corp.*(c) | 23,876 | 67,974 | ||||||
Shikoku Electric Power Co., Inc.* | 4,545 | 64,601 | ||||||
Shimadzu Corp. | 7,922 | 56,132 | ||||||
Shimamura Co. Ltd. | 730 | 85,148 | ||||||
Shimano, Inc. | 1,562 | 127,436 | ||||||
Shimizu Corp. | 14,779 | 48,355 | ||||||
Shin-Etsu Chemical Co. Ltd. | 8,164 | 538,572 | ||||||
Shinsei Bank Ltd. | 34,015 | 77,689 | ||||||
Shionogi & Co. Ltd. | 7,253 | 146,470 | ||||||
Shiseido Co. Ltd. | 8,603 | 120,361 | ||||||
Shizuoka Bank Ltd. (The) | 12,227 | 137,551 | ||||||
Showa Denko Kabushiki Kaisha | 35,496 | 53,168 | ||||||
Showa Shell Sekiyu Kabushiki Kaisha | 4,569 | 32,277 | ||||||
SMC Corp. | 1,215 | 234,649 | ||||||
Softbank Corp. | 17,845 | 818,934 | ||||||
Sojitz Corp. | 30,890 | 48,237 | ||||||
Sony Corp.(c) | 20,293 | 350,307 | ||||||
Sony Financial Holdings, Inc. | 4,301 | 63,966 | ||||||
Square Enix Holdings Co. Ltd. | 1,579 | 16,891 | ||||||
Stanley Electric Co. Ltd. | 3,490 | 60,172 | ||||||
Sumco Corp. | 2,801 | 31,540 | ||||||
Sumitomo Chemical Co. Ltd. | 37,076 | 115,795 | ||||||
Sumitomo Corp. | 21,868 | 274,816 | ||||||
Sumitomo Electric Industries Ltd. | 15,185 | 185,346 | ||||||
Sumitomo Heavy Industries Ltd. | 14,687 | 57,884 | ||||||
Sumitomo Metal Mining Co. Ltd. | 11,703 | 165,099 | ||||||
Sumitomo Mitsui Financial Group, Inc. | 26,516 | 1,081,653 | ||||||
Sumitomo Realty & Development Co. Ltd. | 8,736 | 338,267 | ||||||
| Shares | Value($) | |||||||
Japan—continued | ||||||||
Sumitomo Rubber Industries Ltd. | 4,168 | 69,515 | ||||||
Suruga Bank Ltd. | 6,451 | 103,274 | ||||||
Suzuken Co. Ltd. | 1,764 | 63,806 | ||||||
Suzuki Motor Corp. | 8,199 | 182,819 | ||||||
Sysmex Corp. | 1,732 | 105,243 | ||||||
T&D Holdings, Inc. | 11,700 | 139,080 | ||||||
Taisei Corp. | 25,704 | 71,267 | ||||||
Taisho Pharmaceutical Holdings Co. Ltd. | 1,000 | 70,643 | ||||||
Taiyo Nippon Sanso Corp. | 8,064 | 55,853 | ||||||
Takashimaya Co. Ltd. | 8,513 | 84,104 | ||||||
Takeda Pharmaceutical Co. Ltd. | 15,878 | 866,977 | ||||||
TDK Corp. | 2,568 | 89,615 | ||||||
Teijin Ltd. | 22,202 | 51,180 | ||||||
Terumo Corp. | 3,155 | 134,901 | ||||||
THK Co. Ltd. | 2,848 | 56,152 | ||||||
Tobu Railway Co. Ltd. | 23,830 | 136,446 | ||||||
Toho Co. Ltd. | 2,841 | 59,274 | ||||||
Toho Gas Co. Ltd. | 10,843 | 68,881 | ||||||
Tohoku Electric Power Co., Inc.* | 11,313 | 89,893 | ||||||
Tokio Marine Holdings, Inc. | 14,315 | 411,194 | ||||||
Tokyo Electric Power Co., Inc. (The)* | 36,259 | 89,362 | ||||||
Tokyo Electron Ltd. | 3,585 | 151,954 | ||||||
Tokyo Gas Co. Ltd. | 50,126 | 270,505 | ||||||
Tokyu Corp. | 27,940 | 206,281 | ||||||
Tokyu Land Corp. | 10,984 | 102,915 | ||||||
TonenGeneral Sekiyu Kabushiki Kaisha | 8,223 | 81,326 | ||||||
Toppan Printing Co. Ltd. | 15,351 | 110,238 | ||||||
Toray Industries, Inc. | 31,003 | 209,464 | ||||||
Toshiba Corp. | 76,922 | 388,961 | ||||||
Tosoh Corp. | 12,787 | 36,404 | ||||||
TOTO Ltd. | 8,861 | 79,258 | ||||||
Toyo Seikan Kaisha Ltd. | 3,673 | 50,490 | ||||||
Toyo Suisan Kaisha Ltd. | 2,080 | 64,078 | ||||||
Toyoda Gosei Co. Ltd. | 1,528 | 36,538 | ||||||
Toyota Boshoku Corp. | 1,577 | 22,180 | ||||||
Toyota Industries Corp. | 3,406 | 124,647 | ||||||
Toyota Motor Corp. | 55,426 | 2,840,925 | ||||||
Toyota Tsusho Corp. | 5,075 | 129,281 | ||||||
Trend Micro, Inc. | 2,519 | 70,404 | ||||||
Tsumura & Co. | 1,480 | 54,005 | ||||||
Ube Industries Ltd. | 24,321 | 47,797 | ||||||
Uni-Charm Corp. | 2,452 | 139,876 | ||||||
Ushio, Inc. | 2,550 | 25,978 | ||||||
USS Co. Ltd. | 534 | 61,265 | ||||||
West Japan Railway Co. | 3,500 | 168,056 | ||||||
Yahoo Japan Corp. | 352 | 161,725 | ||||||
Yakult Honsha Co. Ltd. | 2,410 | 97,030 | ||||||
Yamada Denki Co. Ltd. | 1,949 | 89,028 | ||||||
Yamaguchi Financial Group, Inc. | 7,991 | 79,541 | ||||||
See Notes to Financial Statements.
38
SCHEDULES OF PORTFOLIO INVESTMENTS
RIDGEWORTH FUNDS March 31, 2013
International Equity Index Fund — continued
| Shares | Value($) | |||||||
Japan—continued | ||||||||
Yamaha Corp. | 3,711 | 35,953 | ||||||
Yamaha Motor Co. Ltd. | 6,618 | 89,004 | ||||||
Yamato Holdings Co. Ltd. | 7,593 | 137,285 | ||||||
Yamato Kogyo Co. Ltd. | 1,065 | 29,042 | ||||||
Yamazaki Baking Co. Ltd. | 5,602 | 73,793 | ||||||
Yaskawa Electric Corp. | 8,063 | 80,600 | ||||||
Yokogawa Electric Corp. | 4,982 | 49,749 | ||||||
|
| |||||||
| 52,153,864 | ||||||||
|
| |||||||
Jersey 0.1% | ||||||||
Petrofac Ltd. | 2,256 | 49,122 | ||||||
Randgold Resources Ltd. | 794 | 68,526 | ||||||
Shire PLC | 4,954 | 150,848 | ||||||
|
| |||||||
| 268,496 | ||||||||
|
| |||||||
Luxembourg 0.6% | ||||||||
ArcelorMittal | 18,226 | 234,798 | ||||||
Millicom International Cellular SA | 902 | 72,046 | ||||||
SES | 6,374 | 199,769 | ||||||
Tenaris SA | 37,133 | 754,444 | ||||||
|
| |||||||
| 1,261,057 | ||||||||
|
| |||||||
Mauritius 0.0%(d) | ||||||||
Essar Energy PLC* | 2,825 | 5,923 | ||||||
Golden Agri-Resources Ltd. | 74,525 | 34,849 | ||||||
|
| |||||||
| 40,772 | ||||||||
|
| |||||||
Netherlands 3.3% | ||||||||
Aegon NV | 44,830 | 269,570 | ||||||
Akzo Nobel NV | 6,016 | 381,879 | ||||||
ASML Holding NV | 8,652 | 581,922 | ||||||
Corio NV REIT | 1,566 | 73,059 | ||||||
DE Master Blenders 1753 NV* | 15,995 | 247,064 | ||||||
Delta Lloyd NV | 2,609 | 44,747 | ||||||
Fugro NV | 1,742 | 96,420 | ||||||
Gemalto | 1,902 | 165,911 | ||||||
Heineken Holding NV | 3,025 | 193,841 | ||||||
Heineken NV | 6,081 | 458,342 | ||||||
ING Groep NV* | 99,666 | 707,390 | ||||||
Koninklijke Ahold NV | 23,815 | 364,954 | ||||||
Koninklijke Boskalis Westminster NV | 1,837 | 72,974 | ||||||
Koninklijke DSM NV | 4,005 | 233,126 | ||||||
Koninklijke KPN NV(c) | 26,160 | 87,991 | ||||||
Koninklijke Philips Electronics NV | 25,956 | 768,078 | ||||||
Koninklijke Vopak NV | 1,835 | 110,624 | ||||||
QIAGEN NV* | 7,542 | 157,197 | ||||||
Randstad Holding NV | 3,067 | 125,570 | ||||||
Reed Elsevier NV | 17,805 | 305,034 | ||||||
TNT Express NV | 9,485 | 69,522 | ||||||
Unilever NV | 42,526 | 1,741,931 | ||||||
Wolters Kluwer NV | 7,813 | 170,607 | ||||||
|
| |||||||
| 7,427,753 | ||||||||
|
| |||||||
| Shares | Value($) | |||||||
New Zealand 0.6% | ||||||||
Auckland International Airport Ltd. | 91,521 | 225,515 | ||||||
Contact Energy Ltd. | 34,954 | 166,702 | ||||||
Fletcher Building Ltd. | 64,278 | 460,907 | ||||||
Sky City Entertainment Group Ltd. | 57,345 | 211,594 | ||||||
Telecom Corp. of New Zealand Ltd. | 183,187 | 358,658 | ||||||
|
| |||||||
| 1,423,376 | ||||||||
|
| |||||||
Norway 1.6% | ||||||||
Aker Solutions ASA | 6,347 | 118,013 | ||||||
DnB NOR ASA | 37,696 | 552,782 | ||||||
Gjensidige Forsikring ASA | 7,704 | 127,087 | ||||||
Kvaerner ASA | 6,347 | 13,149 | ||||||
Norsk Hydro ASA(c) | 35,833 | 154,847 | ||||||
Orkla ASA | 29,588 | 236,572 | ||||||
Renewable Energy Corp. ASA*(c) | 19,629 | 3,858 | ||||||
Seadrill Ltd. | 13,596 | 492,792 | ||||||
StatoilHydro ASA | 42,528 | 1,028,113 | ||||||
Telenor ASA | 27,340 | 597,752 | ||||||
Yara International ASA | 7,142 | 323,550 | ||||||
|
| |||||||
| 3,648,515 | ||||||||
|
| |||||||
Portugal 0.9% | ||||||||
Banco Espirito Santo SA* | 207,949 | 212,981 | ||||||
EDP—Energias de Portugal SA | 207,370 | 638,494 | ||||||
Galp Energia SGPS SA | 24,950 | 390,822 | ||||||
Jeronimo Martins SGPS SA | 21,820 | 425,004 | ||||||
Portugal Telecom SGPS SA | 67,462 | 334,144 | ||||||
|
| |||||||
| 2,001,445 | ||||||||
|
| |||||||
Singapore 1.0% | ||||||||
Ascendas REIT | 20,653 | 43,293 | ||||||
CapitaLand Ltd. | 28,395 | 80,811 | ||||||
CapitaMall Trust REIT | 21,901 | 36,903 | ||||||
CapitaMalls Asia Ltd. | 15,618 | 25,813 | ||||||
City Developments Ltd. | 7,673 | 70,089 | ||||||
ComfortDelGro Corp. Ltd. | 21,404 | 32,960 | ||||||
Cosco Corp. (Singapore) Ltd. | 12,348 | 9,059 | ||||||
DBS Group Holdings Ltd. | 20,475 | 264,119 | ||||||
Fraser and Neave Ltd.(a) | 10,484 | 79,791 | ||||||
Genting Singapore PLC | 66,031 | 79,588 | ||||||
Global Logistic Properties Ltd. | 21,512 | 45,440 | ||||||
Jardine Cycle & Carriage Ltd. | 2,240 | 92,338 | ||||||
Keppel Corp. Ltd. | 15,216 | 137,396 | ||||||
Keppel Land Ltd. | 9,331 | 29,640 | ||||||
Neptune Orient Lines Ltd.* | 10,505 | 10,036 | ||||||
Olam International Ltd.(c) | 15,369 | 21,312 | ||||||
Oversea-Chinese Banking Corp. Ltd. | 27,697 | 237,815 | ||||||
SembCorp Industries Ltd. | 11,678 | 48,864 | ||||||
SembCorp Marine Ltd. | 10,764 | 38,445 | ||||||
Singapore Airlines Ltd. | 8,241 | 72,221 | ||||||
See Notes to Financial Statements.
39
SCHEDULES OF PORTFOLIO INVESTMENTS
RIDGEWORTH FUNDS March 31, 2013
International Equity Index Fund — continued
| Shares | Value($) | |||||||
Singapore—continued | ||||||||
Singapore Exchange Ltd. | 10,207 | 63,364 | ||||||
Singapore Press Holdings Ltd. | 16,433 | 59,354 | ||||||
Singapore Technologies Engineering Ltd. | 17,124 | 59,503 | ||||||
Singapore Telecommunications Ltd. | 87,345 | 252,807 | ||||||
StarHub Ltd. | 7,593 | 26,629 | ||||||
United Overseas Bank Ltd. | 14,857 | 244,113 | ||||||
UOL Group Ltd. | 7,866 | 44,266 | ||||||
Wilmar International Ltd. | 21,895 | 60,900 | ||||||
Yangzijiang Shipbuilding Holdings Ltd. | 21,380 | 16,720 | ||||||
|
| |||||||
| 2,283,589 | ||||||||
|
| |||||||
Spain 5.5% | ||||||||
Abertis Infraestructuras SA | 12,609 | 211,895 | ||||||
Acciona SA | 858 | 46,776 | ||||||
Acerinox SA(c) | 3,405 | 34,918 | ||||||
Actividades de Construccion y Servicios SA | 4,784 | 111,640 | ||||||
Amadeus IT Holding SA, Cl A | 13,941 | 376,616 | ||||||
Banco Bilbao Vizcaya Argentaria SA | 223,783 | 1,940,010 | ||||||
Banco de Sabadell SA*(c) | 119,961 | 220,202 | ||||||
Banco Popular Espanol SA | 235,395 | 174,406 | ||||||
Banco Santander SA | 410,054 | 2,755,342 | ||||||
Bankia SA*(c) | 34,489 | 7,295 | ||||||
Criteria Caixacorp SA | 28,878 | 97,726 | ||||||
Distribuidora Internacional de Alimentacion SA | 27,234 | 188,374 | ||||||
Enagas | 6,067 | 141,269 | ||||||
Ferrovial SA | 17,638 | 279,903 | ||||||
Fomento de Construcciones y Contratas SA(c) | 1,745 | 16,642 | ||||||
Gas Natural SDG SA | 14,435 | 255,533 | ||||||
Grifols SA* | 6,624 | 245,601 | ||||||
Iberdrola SA | 170,656 | 794,739 | ||||||
Inditex SA | 9,557 | 1,266,717 | ||||||
Mapfre SA | 25,493 | 78,787 | ||||||
Red Electrica Corporacion SA | 3,658 | 184,044 | ||||||
Repsol YPF SA | 33,804 | 686,807 | ||||||
Telefonica SA | 169,233 | 2,275,611 | ||||||
Zardoya Otis SA | 4,797 | 64,134 | ||||||
|
| |||||||
| 12,454,987 | ||||||||
|
| |||||||
Sweden 2.0% | ||||||||
Alfa Laval AB | 3,975 | 91,559 | ||||||
Assa Abloy AB, Cl B | 3,658 | 149,373 | ||||||
Atlas Copco AB, Cl A | 7,862 | 223,196 | ||||||
Atlas Copco AB, Cl B | 4,565 | 115,306 | ||||||
Boliden AB | 3,285 | 52,880 | ||||||
Electrolux AB, Cl B | 2,891 | 73,555 | ||||||
Elekta AB, B SHS | 6,277 | 95,313 | ||||||
| Shares | Value($) | |||||||
Sweden—continued | ||||||||
Getinge AB | 2,345 | 71,611 | ||||||
Hennes & Mauritz AB, Cl B | 12,177 | 435,390 | ||||||
Hexagon AB, Cl B | 2,994 | 81,552 | ||||||
Holmen AB | 620 | 18,439 | ||||||
Husqvarna AB, Cl B | 5,277 | 31,144 | ||||||
Industrivarden AB, Cl C | 1,385 | 25,207 | ||||||
Investor AB, Cl B | 5,360 | 154,798 | ||||||
Kinnevik Investment AB, Cl B | 2,444 | 59,220 | ||||||
Lundin Petroleum AB* | 2,784 | 60,238 | ||||||
Modern Times Group AB, Cl B | 572 | 22,760 | ||||||
Nordea Bank AB | 31,311 | 354,597 | ||||||
Ratos AB, B Shares | 2,273 | 24,015 | ||||||
Sandvik AB | 11,929 | 183,423 | ||||||
Scania AB | 3,758 | 78,602 | ||||||
Securitas AB, Cl B | 3,709 | 34,918 | ||||||
Skandinaviska Enskilda Banken AB, Cl A(c) | 16,741 | 168,141 | ||||||
Skanska AB, Cl B | 4,735 | 85,595 | ||||||
SKF AB, Cl B | 4,595 | 112,045 | ||||||
SSAB AB, A Shares | 1,868 | 14,235 | ||||||
Svenska Cellulosa AB, Cl B | 6,858 | 176,803 | ||||||
Svenska Handelsbanken AB, Cl A | 5,839 | 249,543 | ||||||
Swedbank AB, Cl A(c) | 9,589 | 218,074 | ||||||
Swedish Match AB | 2,634 | 81,770 | ||||||
Tele2 AB, Cl B | 3,753 | 65,309 | ||||||
Telefonaktiebolaget LM Ericsson, Cl B | 35,153 | 438,027 | ||||||
TeliaSonera AB(c) | 25,724 | 183,677 | ||||||
Volvo AB, Cl B | 16,191 | 235,416 | ||||||
|
| |||||||
| 4,465,731 | ||||||||
|
| |||||||
Switzerland 2.7% | ||||||||
ABB Ltd.* | 11,238 | 253,456 | ||||||
Actelion Ltd.* | 573 | 31,116 | ||||||
Adecco SA* | 683 | 37,413 | ||||||
Aryzta AG* | 444 | 26,215 | ||||||
Baloise Holding AG | 247 | 23,131 | ||||||
Compagnie Financiere Richemont SA, Cl A | 2,712 | 212,835 | ||||||
Credit Suisse Group AG* | 5,900 | 154,818 | ||||||
GAM Holding AG* | 1,109 | 18,750 | ||||||
Geberit AG* | 202 | 49,729 | ||||||
Givaudan SA* | 45 | 55,272 | ||||||
Glencore International PLC(c) | 28,844 | 156,068 | ||||||
Holcim Ltd.* | 1,274 | 101,525 | ||||||
Julius Baer Group Ltd.* | 1,080 | 41,992 | ||||||
Kuehne + Nagel International AG | 281 | 30,637 | ||||||
Lindt & Spruengli AG PC* | 7 | 26,937 | ||||||
Lindt & Spruengli AG RS* | 1 | 45,128 | ||||||
Lonza Group AG* | 262 | 17,001 | ||||||
Nestle SA | 18,127 | 1,310,880 | ||||||
Novartis AG | 12,200 | 866,839 | ||||||
Pargesa Holding SA | 139 | 9,437 | ||||||
See Notes to Financial Statements.
40
SCHEDULES OF PORTFOLIO INVESTMENTS
RIDGEWORTH FUNDS March 31, 2013
International Equity Index Fund — continued
| Shares | Value($) | |||||||
Switzerland—continued | ||||||||
Roche Holding AG | 3,681 | 856,948 | ||||||
Schindler Holding AG PC | 250 | 36,632 | ||||||
Schindler Holding AG RS | 110 | 15,689 | ||||||
SGS SA | 29 | 71,118 | ||||||
Sika AG | 12 | 29,150 | ||||||
Sonova Holding AG* | 257 | 30,836 | ||||||
STMicroelectronics NV | 13,638 | 104,891 | ||||||
Straumann Holding AG | 41 | 5,524 | ||||||
Sulzer AG | 125 | 21,358 | ||||||
Swatch Group AG (The) BS | 162 | 94,200 | ||||||
Swatch Group AG (The) RS | 227 | 23,040 | ||||||
Swiss Life Holding AG* | 158 | 23,418 | ||||||
Swiss Re Ltd. | 1,826 | 148,496 | ||||||
Swisscom AG | 124 | 57,369 | ||||||
Syngenta AG | 485 | 202,317 | ||||||
Transocean Ltd. | 1,630 | 84,531 | ||||||
UBS AG* | 18,850 | 288,915 | ||||||
Wolseley PLC | 2,314 | 115,079 | ||||||
Xstrata PLC | 16,036 | 260,228 | ||||||
Zurich Insurance Group AG* | 755 | 210,124 | ||||||
|
| |||||||
| 6,149,042 | ||||||||
|
| |||||||
United Kingdom 8.4% | ||||||||
3i Group PLC | 8,602 | 41,302 | ||||||
Admiral Group PLC | 1,763 | 35,681 | ||||||
Aggreko PLC | 2,312 | 62,601 | ||||||
AMEC PLC | 2,866 | 45,986 | ||||||
Anglo American PLC | 10,162 | 261,256 | ||||||
Antofagasta PLC | 3,383 | 50,581 | ||||||
ARM Holdings PLC | 11,810 | 165,271 | ||||||
Associated British Foods PLC | 3,125 | 90,265 | ||||||
AstraZeneca PLC | 9,545 | 478,531 | ||||||
Aviva PLC | 24,397 | 109,801 | ||||||
Babcock International Group PLC | 3,132 | 51,777 | ||||||
BAE Systems PLC | 24,300 | 145,586 | ||||||
Balfour Beatty PLC | 5,881 | 20,981 | ||||||
Barclays PLC | 88,881 | 393,199 | ||||||
BG Group PLC | 25,538 | 438,094 | ||||||
BHP Billiton PLC | 16,316 | 474,754 | ||||||
BP PLC | 146,402 | 1,023,050 | ||||||
British American Tobacco PLC | 15,115 | 810,028 | ||||||
British Land Co. PLC (The) REIT | 7,383 | 60,970 | ||||||
British Sky Broadcasting Group PLC | 9,983 | 133,939 | ||||||
BT Group PLC | 59,636 | 251,907 | ||||||
Bunzl PLC | 2,876 | 56,591 | ||||||
Burberry Group PLC | 3,744 | 75,604 | ||||||
Capita Group PLC | 5,441 | 74,323 | ||||||
Capital Shopping Centres Group PLC REIT | 4,860 | 24,686 | ||||||
Carnival PLC | 1,604 | 56,153 | ||||||
Centrica PLC | 39,792 | 222,319 | ||||||
| Shares | Value($) | |||||||
United Kingdom—continued | ||||||||
Cobham PLC | 10,066 | 37,166 | ||||||
Compass Group PLC | 16,233 | 207,311 | ||||||
Diageo PLC | 19,360 | 610,393 | ||||||
Eurasian Natural Resources Corp. | 2,269 | 8,485 | ||||||
Fresnillo PLC | 1,550 | 31,936 | ||||||
G4S PLC | 12,427 | 55,023 | ||||||
GlaxoSmithKline PLC | 38,324 | 895,890 | ||||||
Hammerson PLC REIT | 6,155 | 46,004 | ||||||
Home Retail Group PLC | 8,292 | 19,554 | ||||||
HSBC Holdings PLC | 139,161 | 1,485,423 | ||||||
ICAP PLC | 4,914 | 21,683 | ||||||
Imperial Tobacco Group PLC | 7,714 | 269,467 | ||||||
Inmarsat PLC | 4,085 | 43,604 | ||||||
InterContinental Hotels Group PLC | 2,353 | 71,756 | ||||||
International Consolidated Airlines Group SA* | 31,899 | 122,669 | ||||||
Intertek Group PLC | 1,399 | 72,125 | ||||||
Invensys PLC | 7,095 | 37,818 | ||||||
Investec PLC | 4,225 | 29,466 | ||||||
ITV PLC | 32,686 | 64,266 | ||||||
J Sainsbury PLC | 10,783 | 62,014 | ||||||
Johnson Matthey PLC | 1,774 | 61,997 | ||||||
Kazakhmys PLC | 1,862 | 11,102 | ||||||
Kingfisher PLC | 20,780 | 90,870 | ||||||
Land Securities Group PLC REIT | 6,671 | 84,029 | ||||||
Legal & General Group PLC | 50,978 | 133,771 | ||||||
Lloyds Banking Group PLC* | 365,406 | 270,335 | ||||||
London Stock Exchange Group PLC | 1,312 | 26,035 | ||||||
Lonmin PLC* | 1,415 | 6,254 | ||||||
Man Group PLC | 16,623 | 22,517 | ||||||
Marks & Spencer Group PLC | 14,078 | 83,424 | ||||||
National Grid PLC | 27,335 | 317,736 | ||||||
Next PLC | 1,586 | 105,214 | ||||||
Old Mutual PLC | 41,329 | 127,290 | ||||||
Pearson PLC | 6,998 | 125,896 | ||||||
Prudential PLC | 19,624 | 317,558 | ||||||
Reckitt Benckiser Group PLC | 5,370 | 384,963 | ||||||
Reed Elsevier PLC | 10,653 | 126,418 | ||||||
Rexam PLC | 6,885 | 55,184 | ||||||
Rio Tinto PLC | 10,146 | 475,594 | ||||||
Rolls-Royce Holdings PLC* | 14,465 | 248,361 | ||||||
Royal Bank of Scotland Group PLC* | 15,545 | 65,073 | ||||||
Royal Dutch Shell PLC, Cl A | 28,229 | 913,182 | ||||||
Royal Dutch Shell PLC, Cl B | 20,184 | 670,108 | ||||||
RSA Insurance Group PLC | 30,625 | 54,165 | ||||||
SABMiller PLC | 7,382 | 388,542 | ||||||
Sage Group PLC (The) | 11,440 | 59,570 | ||||||
Schroders PLC | 1,003 | 32,126 | ||||||
Scottish & Southern Energy PLC | 8,036 | 181,201 | ||||||
See Notes to Financial Statements.
41
SCHEDULES OF PORTFOLIO INVESTMENTS
RIDGEWORTH FUNDS March 31, 2013
International Equity Index Fund — continued
| Shares | Value($) | |||||||
United Kingdom—continued | ||||||||
Segro PLC | 6,468 | 24,992 | ||||||
Serco Group PLC | 4,362 | 41,557 | ||||||
Severn Trent PLC | 2,065 | 53,717 | ||||||
Smith & Nephew PLC | 7,805 | 90,131 | ||||||
Smiths Group PLC | 3,494 | 66,734 | ||||||
Standard Chartered PLC | 18,508 | 479,058 | ||||||
Standard Life PLC | 19,927 | 110,606 | ||||||
Subsea 7 SA | 10,808 | 252,586 | ||||||
Tate & Lyle PLC | 4,378 | 56,543 | ||||||
Tesco PLC | 61,992 | 359,396 | ||||||
TUI Travel PLC | 4,513 | 22,327 | ||||||
Tullow Oil PLC | 7,672 | 143,500 | ||||||
Unilever PLC | 8,590 | 363,370 | ||||||
United Utilities Group PLC | 5,916 | 63,688 | ||||||
Vedanta Resources PLC | 1,041 | 15,897 | ||||||
Vodafone Group PLC | 382,347 | 1,084,066 | ||||||
Weir Group PLC (The) | 1,768 | 60,793 | ||||||
Whitbread PLC | 1,538 | 60,012 | ||||||
WM Morrison Supermarkets PLC | 19,785 | 83,032 | ||||||
WPP PLC | 10,941 | 174,389 | ||||||
|
| |||||||
| 18,892,198 | ||||||||
|
| |||||||
Total Common Stocks | 215,443,235 | |||||||
|
| |||||||
| Preferred Stocks 0.9% | ||||||||
Germany 0.9% | ||||||||
Bayerische Motoren Werke AG, 4.47% | 1,671 | 106,745 | ||||||
Henkel AG & Co. KGaA, 1.12% | 5,693 | 547,975 | ||||||
Porsche AG, 1.30% | 4,866 | 355,661 | ||||||
ProSiebenSat.1 Media AG, 4.19% | 2,447 | 87,357 | ||||||
RWE AG, 7.52% | 1,258 | 45,120 | ||||||
Volkswagen AG, 2.02% | 4,554 | 904,820 | ||||||
|
| |||||||
Total Preferred Stocks | 2,047,678 | |||||||
|
| |||||||
| Rights 0.0%(d) | ||||||||
Austria 0.0%(a)(b)(d)(e) | ||||||||
IMMOEAST AG* | 175,419 | — | ||||||
|
| |||||||
Total Rights | — | |||||||
|
| |||||||
Exchange Traded Funds 3.1% | ||||||||
iShares MSCI Australia Index Fund | 9,726 | 262,991 | ||||||
iShares MSCI Austria Investable Market Index Fund | 5,912 | 101,686 | ||||||
iShares MSCI Belgium Investable Market Index Fund | 4,475 | 63,456 | ||||||
iShares MSCI EAFE Index Fund | 38,163 | 2,250,854 | ||||||
iShares MSCI EMU Index Fund(c) | 57,070 | 1,863,336 | ||||||
| Shares | Value($) | |||||||
Exchange Traded Funds—continued |
| |||||||
iShares MSCI Germany Index Fund(c) | 12,186 | 298,191 | ||||||
iShares MSCI Italy Index Fund(c) | 33,503 | 395,335 | ||||||
iShares MSCI Japan Index Fund(c) | 112,587 | 1,215,940 | ||||||
iShares MSCI Netherlands Investable Market Index Fund | 1,464 | 30,144 | ||||||
iShares MSCI Singapore Index Fund | 2,026 | 28,283 | ||||||
iShares MSCI Spain Index Fund(c) | 7,190 | 203,477 | ||||||
iShares MSCI Sweden Index Fund | 3,081 | 100,163 | ||||||
iShares MSCI United Kingdom Index Fund(c) | 9,304 | 169,984 | ||||||
|
| |||||||
Total Exchange Traded Funds | 6,983,840 | |||||||
|
| |||||||
| Trust 0.0%(d) | ||||||||
Singapore 0.0%(d) | ||||||||
Hutchison Port Holdings Trust | 59,590 | 50,651 | ||||||
|
| |||||||
Total Trust | 50,651 | |||||||
|
| |||||||
Short-Term Investment 4.4% | ||||||||
RidgeWorth Funds Securities Lending Joint Account(f) | 9,873,673 | 9,873,673 | ||||||
|
| |||||||
Total Short-Term Investment (Cost $9,873,673) | 9,873,673 | |||||||
|
| |||||||
| Money Market Fund 0.0%(d) | ||||||||
State Street Institutional Liquid Reserves Fund, Institutional Class, 0.13%(g) | 13,093 | 13,093 | ||||||
|
| |||||||
Total Money Market Fund | 13,093 | |||||||
|
| |||||||
Total Investments | 234,412,170 | |||||||
Liabilities in excess of other assets — (4.0)% | (8,952,217 | ) | ||||||
|
| |||||||
Net Assets — 100.0% | $ | 225,459,953 | ||||||
|
| |||||||
| * | Non-income producing security. |
| (a) | Valued at fair value using procedures approved by the Board of Trustees (See Note 2(a)). |
| (b) | The Fund’s investment adviser/subadviser has deemed this security to be illiquid based upon procedures approved by the Board of Trustees. |
| (c) | The security or a partial position of the security was on loan as of March 31, 2013. The total value of securities on loan as of March 31, 2013 was $9,463,727. |
See Notes to Financial Statements.
42
SCHEDULES OF PORTFOLIO INVESTMENTS
RIDGEWORTH FUNDS March 31, 2013
International Equity Index Fund — concluded
| (d) | Less than 0.05% of Net Assets. |
| (e) | Escrowed rights that are not tradable. |
| (f) | Purchased with cash collateral held from securities lending. The value of the collateral could include collateral held for securities that were sold on or before March 31, 2013 (See Note 2(h)). |
| (g) | Rate disclosed, the 7 day net yield, is as of March 31, 2013. |
Investment Abbreviations
| BS | — | Bearer Shares | ||||
| MSCI | — | Morgan Stanley Capital International | ||||
| PC | — | Participation Certificate | ||||
| PPS | — | Partially Protected Shares | ||||
| REIT | — | Real Estate Investment Trust | ||||
| RSP | — | Retirement Savings Plan | ||||
| SP ADR | — | Sponsored American Depositary Receipt |
See Notes to Financial Statements.
43
SCHEDULES OF PORTFOLIO INVESTMENTS
RIDGEWORTH FUNDS March 31, 2013
Large Cap Growth Stock Fund
| Shares | Value($) | |||||||
| Common Stocks 100.0% | ||||||||
Consumer Discretionary 19.6% | ||||||||
Amazon.com, Inc.* | 20,720 | 5,521,673 | ||||||
BorgWarner, Inc.* | 39,523 | 3,056,709 | ||||||
Chipotle Mexican Grill, Inc.* | 5,621 | 1,831,715 | ||||||
DR Horton, Inc. | 120,983 | 2,939,887 | ||||||
Home Depot, Inc. (The) | 17,735 | 1,237,548 | ||||||
Las Vegas Sands Corp. | 72,554 | 4,088,418 | ||||||
Macy’s, Inc. | 92,373 | 3,864,886 | ||||||
Michael Kors Holdings Ltd.* | 47,624 | 2,704,567 | ||||||
Priceline.com, Inc.* | 7,194 | 4,948,969 | ||||||
Scripps Networks Interactive, Cl A | 43,336 | 2,788,238 | ||||||
Starbucks Corp. | 88,221 | 5,025,068 | ||||||
Under Armour, Inc., Cl A* | 50,891 | 2,605,619 | ||||||
VF Corp. | 18,064 | 3,030,236 | ||||||
Viacom, Inc., Cl B | 45,717 | 2,814,796 | ||||||
Yum! Brands, Inc. | 52,883 | 3,804,403 | ||||||
|
| |||||||
| 50,262,732 | ||||||||
|
| |||||||
Consumer Staples 8.3% | ||||||||
Colgate-Palmolive Co. | 39,954 | 4,715,770 | ||||||
Costco Wholesale Corp. | 43,970 | 4,665,657 | ||||||
Estee Lauder Cos., Inc. (The), Cl A | 61,379 | 3,930,097 | ||||||
Philip Morris International, Inc. | 85,015 | 7,881,741 | ||||||
|
| |||||||
| 21,193,265 | ||||||||
|
| |||||||
Energy 7.2% | ||||||||
Cameron International Corp.* | 61,123 | 3,985,220 | ||||||
EOG Resources, Inc. | 34,393 | 4,404,712 | ||||||
National Oilwell Varco, Inc. | 25,312 | 1,790,824 | ||||||
Phillips 66 | 30,684 | 2,146,959 | ||||||
Schlumberger Ltd. | 82,011 | 6,141,804 | ||||||
|
| |||||||
| 18,469,519 | ||||||||
|
| |||||||
Financials 3.8% | ||||||||
Discover Financial Services | 58,777 | 2,635,561 | ||||||
Morgan Stanley | 131,892 | 2,898,986 | ||||||
T. Rowe Price Group, Inc. | 54,829 | 4,105,047 | ||||||
|
| |||||||
| 9,639,594 | ||||||||
|
| |||||||
Health Care 14.8% | ||||||||
Alexion Pharmaceuticals, Inc.* | 61,140 | 5,633,440 | ||||||
Allergan, Inc. | 43,757 | 4,884,594 | ||||||
Biogen Idec, Inc.* | 29,608 | 5,711,679 | ||||||
Cerner Corp.* | 32,802 | 3,107,989 | ||||||
Express Scripts Holding Co.* | 83,587 | 4,818,791 | ||||||
Gilead Sciences, Inc.* | 98,988 | 4,843,483 | ||||||
Intuitive Surgical, Inc.* | 7,644 | 3,754,656 | ||||||
Mylan, Inc.* | 182,185 | 5,272,434 | ||||||
|
| |||||||
| 38,027,066 | ||||||||
|
| |||||||
Industrials 13.4% | ||||||||
BE Aerospace, Inc.* | 42,544 | 2,564,978 | ||||||
Cummins, Inc. | 31,391 | 3,635,392 | ||||||
Fluor Corp. | 50,235 | 3,332,087 | ||||||
| Shares | Value($) | |||||||
Industrials—continued | ||||||||
Fortune Brands Home & Security, Inc.* | 57,658 | 2,158,139 | ||||||
Honeywell International, Inc. | 80,955 | 6,099,959 | ||||||
J.B. Hunt Transport Services, Inc. | 43,653 | 3,251,275 | ||||||
Precision Castparts Corp. | 18,624 | 3,531,483 | ||||||
Textron, Inc. | 51,032 | 1,521,264 | ||||||
Union Pacific Corp. | 27,390 | 3,900,610 | ||||||
United Parcel Service, Inc., Cl B | 49,100 | 4,217,690 | ||||||
|
| |||||||
| 34,212,877 | ||||||||
|
| |||||||
Information Technology 31.2% | ||||||||
Analog Devices, Inc. | 74,492 | 3,463,133 | ||||||
Apple, Inc. | 37,450 | 16,576,494 | ||||||
ARM Holdings PLC SP ADR | 71,233 | 3,018,142 | ||||||
ASML Holding NV NYS(a) | 18,371 | 1,249,412 | ||||||
Broadcom Corp., Cl A | 82,707 | 2,867,452 | ||||||
Cognizant Technology Solutions Corp., Cl A* | 38,058 | 2,915,623 | ||||||
EMC Corp.* | 192,578 | 4,600,688 | ||||||
F5 Networks, Inc.* | 30,754 | 2,739,566 | ||||||
Google, Inc., Cl A* | 12,650 | 10,044,480 | ||||||
International Business Machines Corp. | 8,413 | 1,794,493 | ||||||
NetApp, Inc.* | 86,364 | 2,950,194 | ||||||
Oracle Corp. | 227,878 | 7,369,575 | ||||||
QUALCOMM, Inc. | 103,883 | 6,954,967 | ||||||
Red Hat, Inc.* | 34,947 | 1,766,920 | ||||||
Salesforce.com, Inc.* | 16,534 | 2,956,775 | ||||||
Visa, Inc., Cl A | 34,469 | 5,854,215 | ||||||
Xilinx, Inc. | 74,759 | 2,853,551 | ||||||
|
| |||||||
| 79,975,680 | ||||||||
|
| |||||||
Materials 1.7% | ||||||||
Monsanto Co. | 41,647 | 4,399,173 | ||||||
|
| |||||||
Total Common Stocks (Cost $186,458,184) | 256,179,906 | |||||||
|
| |||||||
Short-Term Investment 0.5% | ||||||||
RidgeWorth Funds Securities Lending Joint Account(b) | 1,226,275 | 1,226,275 | ||||||
|
| |||||||
Total Short-Term Investment (Cost $1,226,275) | 1,226,275 | |||||||
|
| |||||||
Money Market Fund 0.1% | ||||||||
State Street Institutional Liquid Reserves Fund, Institutional Class, 0.13%(c) | 271,009 | 271,009 | ||||||
|
| |||||||
Total Money Market Fund (Cost $271,009) | 271,009 | |||||||
|
| |||||||
Total Investments (Cost $187,955,468) — 100.6% | 257,677,190 | |||||||
Liabilities in excess of other assets — (0.6)% | (1,655,052 | ) | ||||||
|
| |||||||
Net Assets — 100.0% | $ | 256,022,138 | ||||||
|
| |||||||
See Notes to Financial Statements.
44
SCHEDULES OF PORTFOLIO INVESTMENTS
RIDGEWORTH FUNDS March 31, 2013
Large Cap Growth Stock Fund — concluded
| * | Non-income producing security. |
| (a) | The security or a partial position of the security was on loan as of March 31, 2013. The total value of securities on loan as of March 31, 2013 was $1,199,306. |
| (b) | Purchased with cash collateral held from securities lending. The value of the collateral could include collateral held for securities that were sold on or before March 31, 2013 (See Note 2(h)). |
| (c) | Rate disclosed, the 7 day net yield, is as of March 31, 2013. |
Investment Abbreviations
| NYS | — | New York Registered Shares | ||
| SP ADR | — | Sponsored American Depositary Receipt |
See Notes to Financial Statements.
45
SCHEDULES OF PORTFOLIO INVESTMENTS
RIDGEWORTH FUNDS March 31, 2013
Large Cap Value Equity Fund
| Shares | Value($) | |||||||
Common Stocks 98.1% | ||||||||
Consumer Discretionary 9.8% | ||||||||
Comcast Corp., Cl A | 651,650 | 27,375,816 | ||||||
Johnson Controls, Inc. | 744,100 | 26,095,587 | ||||||
Lowe’s Cos., Inc. | 442,900 | 16,794,768 | ||||||
Pearson PLC SP ADR(a) | 1,074,300 | 19,326,657 | ||||||
Time Warner Cable, Inc. | 230,550 | 22,146,633 | ||||||
Viacom, Inc., Cl B | 192,050 | 11,824,519 | ||||||
Walt Disney Co. (The) | 260,650 | 14,804,920 | ||||||
Wynn Resorts Ltd. | 257,900 | 32,278,764 | ||||||
|
| |||||||
| 170,647,664 | ||||||||
|
| |||||||
Consumer Staples 5.8% | ||||||||
ConAgra Foods, Inc. | 763,950 | 27,357,050 | ||||||
Mondelez International, Inc., Cl A | 1,141,750 | 34,948,967 | ||||||
Procter & Gamble Co. (The) | 504,450 | 38,872,917 | ||||||
|
| |||||||
| 101,178,934 | ||||||||
|
| |||||||
Energy 14.5% | ||||||||
Baker Hughes, Inc. | 595,500 | 27,637,155 | ||||||
Chevron Corp. | 449,100 | 53,362,062 | ||||||
ConocoPhillips | 623,450 | 37,469,345 | ||||||
Exxon Mobil Corp. | 653,950 | 58,927,434 | ||||||
National Oilwell Varco, Inc. | 384,250 | 27,185,688 | ||||||
Occidental Petroleum Corp. | 615,950 | 48,272,001 | ||||||
|
| |||||||
| 252,853,685 | ||||||||
|
| |||||||
Financials 21.8% | ||||||||
American Tower Corp., REIT | 289,750 | 22,287,570 | ||||||
Ameriprise Financial, Inc. | 216,100 | 15,915,765 | ||||||
Aon PLC | 485,650 | 29,867,475 | ||||||
BlackRock, Inc. | 110,450 | 28,372,396 | ||||||
Comerica, Inc. | 491,950 | 17,685,603 | ||||||
Equity Residential, REIT | 331,350 | 18,244,131 | ||||||
Franklin Resources, Inc. | 153,000 | 23,073,930 | ||||||
JPMorgan Chase & Co. | 963,950 | 45,749,067 | ||||||
MetLife, Inc. | 670,700 | 25,500,014 | ||||||
Progressive Corp. (The) | 523,700 | 13,233,899 | ||||||
Prudential Financial, Inc. | 215,800 | 12,730,042 | ||||||
Simon Property Group, Inc., REIT | 110,450 | 17,512,952 | ||||||
Travelers Cos., Inc. (The) | 264,800 | 22,293,512 | ||||||
U.S. Bancorp | 1,418,150 | 48,117,829 | ||||||
Wells Fargo & Co. | 1,096,800 | 40,570,632 | ||||||
|
| |||||||
| 381,154,817 | ||||||||
|
| |||||||
Health Care 11.2% | ||||||||
Agilent Technologies, Inc. | 682,450 | 28,642,427 | ||||||
Cigna Corp. | 698,150 | 43,543,615 | ||||||
Johnson & Johnson | 468,000 | 38,156,040 | ||||||
Medtronic, Inc. | 186,950 | 8,779,172 | ||||||
Merck & Co., Inc. | 885,750 | 39,176,723 | ||||||
Pfizer, Inc. | 1,278,650 | 36,901,839 | ||||||
|
| |||||||
| 195,199,816 | ||||||||
|
| |||||||
| Shares | Value($) | |||||||
Industrials 19.4% | ||||||||
ADT Corp. (The) | 104,500 | 5,114,230 | ||||||
Caterpillar, Inc. | 305,300 | 26,551,941 | ||||||
CSX Corp. | 957,700 | 23,588,151 | ||||||
Cummins, Inc. | 264,700 | 30,654,907 | ||||||
Emerson Electric Co. | 160,000 | 8,939,200 | ||||||
Flowserve Corp. | 53,200 | 8,922,172 | ||||||
Fluor Corp. | 293,600 | 19,474,488 | ||||||
General Dynamics Corp. | 204,200 | 14,398,142 | ||||||
General Electric Co. | 2,182,050 | 50,448,996 | ||||||
Joy Global, Inc. | 449,600 | 26,760,192 | ||||||
Pentair Ltd. | 246,400 | 12,997,600 | ||||||
Republic Services, Inc. | 414,350 | 13,673,550 | ||||||
Rockwell Automation, Inc. | 140,800 | 12,158,080 | ||||||
Rockwell Collins, Inc. | 290,100 | 18,311,112 | ||||||
Stanley Black & Decker, Inc. | 107,750 | 8,724,518 | ||||||
United Parcel Service, Inc., Cl B | 325,550 | 27,964,745 | ||||||
United Technologies Corp. | 328,150 | 30,659,054 | ||||||
|
| |||||||
| 339,341,078 | ||||||||
|
| |||||||
Information Technology 6.1% | ||||||||
Cisco Systems, Inc. | 1,418,350 | 29,657,698 | ||||||
Microchip Technology, Inc.(a) | 398,600 | 14,652,536 | ||||||
Microsoft Corp. | 942,400 | 26,962,064 | ||||||
Motorola Solutions, Inc. | 77,450 | 4,959,124 | ||||||
Texas Instruments, Inc. | 864,400 | 30,668,912 | ||||||
|
| |||||||
| 106,900,334 | ||||||||
|
| |||||||
Materials 2.8% | ||||||||
Air Products & Chemicals, Inc. | 193,950 | 16,896,924 | ||||||
Ashland, Inc. | 221,150 | 16,431,445 | ||||||
Celanese Corp., Cl A | 343,400 | 15,126,770 | ||||||
|
| |||||||
| 48,455,139 | ||||||||
|
| |||||||
Telecommunication Services 3.7% |
| |||||||
AT&T, Inc. | 1,193,950 | 43,806,025 | ||||||
Verizon Communications, Inc. | 441,150 | 21,682,523 | ||||||
|
| |||||||
| 65,488,548 | ||||||||
|
| |||||||
Utilities 3.0% | ||||||||
PG&E Corp. | 599,500 | 26,695,735 | ||||||
PPL Corp. | 831,350 | 26,029,569 | ||||||
|
| |||||||
| 52,725,304 | ||||||||
|
| |||||||
Total Common Stocks | 1,713,945,319 | |||||||
|
| |||||||
Short-Term Investment 0.2% |
| |||||||
RidgeWorth Funds Securities Lending Joint Account(b) | 2,876,625 | 2,876,625 | ||||||
|
| |||||||
Total Short-Term Investment | 2,876,625 | |||||||
|
| |||||||
See Notes to Financial Statements.
46
SCHEDULES OF PORTFOLIO INVESTMENTS
RIDGEWORTH FUNDS March 31, 2013
Large Cap Value Equity Fund — concluded
| Shares | Value($) | |||||||
Money Market Fund 1.8% | ||||||||
State Street Institutional Liquid Reserves Fund, Institutional Class, 0.13%(c) | 31,897,441 | 31,897,441 | ||||||
|
| |||||||
Total Money Market Fund | 31,897,441 | |||||||
|
| |||||||
Total Investments |
| 1,748,719,385 | ||||||
Liabilities in excess of other assets — (0.1)% | (2,213,931 | ) | ||||||
|
| |||||||
Net Assets — 100.0% | $ | 1,746,505,454 | ||||||
|
| |||||||
| (a) | The security or a partial position of the security was on loan as of March 31, 2013. The total value of securities on loan as of March 31, 2013 was $2,818,450. |
| (b) | Purchased with cash collateral held from securities lending. The value of the collateral could include collateral held for securities that were sold on or before March 31, 2013 (See Note 2(h)). |
| (c) | Rate disclosed, the 7 day net yield, is as of March 31, 2013. |
Investment Abbreviations
| REIT | — | Real Estate Investment Trust | ||
| SP ADR | — | Sponsored American Depositary Receipt |
See Notes to Financial Statements.
47
SCHEDULES OF PORTFOLIO INVESTMENTS
RIDGEWORTH FUNDS March 31, 2013
Mid-Cap Value Equity Fund
| Shares | Value($) | |||||||
| Common Stocks 95.1% | ||||||||
Consumer Discretionary 6.5% |
| |||||||
Coach, Inc. | 615,000 | 30,743,850 | ||||||
Guess?, Inc. | 800,000 | 19,864,000 | ||||||
Johnson Controls, Inc. | 1,925,000 | 67,509,750 | ||||||
Wynn Resorts Ltd. | 460,000 | 57,573,600 | ||||||
|
| |||||||
| 175,691,200 | ||||||||
|
| |||||||
Consumer Staples 1.5% | ||||||||
ConAgra Foods, Inc. | 1,165,000 | 41,718,650 | ||||||
|
| |||||||
Energy 11.5% | ||||||||
Baker Hughes, Inc. | 1,200,000 | 55,692,000 | ||||||
CARBO Ceramics, Inc.(a) | 380,000 | 34,606,600 | ||||||
Energy XXI Bermuda Ltd. | 1,000,000 | 27,220,000 | ||||||
Noble Energy, Inc. | 235,000 | 27,180,100 | ||||||
QEP Resources, Inc. | 2,075,000 | 66,068,000 | ||||||
Seadrill Ltd. | 1,100,000 | 40,931,000 | ||||||
Tidewater, Inc. | 1,170,000 | 59,085,000 | ||||||
|
| |||||||
| 310,782,700 | ||||||||
|
| |||||||
Financials 23.8% | ||||||||
American Campus Communities, Inc., REIT | 635,000 | 28,790,900 | ||||||
American Capital Agency Corp., REIT | 900,000 | 29,502,000 | ||||||
American Realty Capital Properties, Inc., REIT | 801,700 | 11,768,956 | ||||||
Ameriprise Financial, Inc. | 630,000 | 46,399,500 | ||||||
Aon PLC | 720,000 | 44,280,000 | ||||||
BB&T Corp. | 1,355,000 | 42,533,450 | ||||||
Boston Properties, Inc., REIT | 270,000 | 27,286,200 | ||||||
Chubb Corp. (The) | 308,500 | 27,003,005 | ||||||
Comerica, Inc. | 1,115,000 | 40,084,250 | ||||||
Equity Residential, REIT | 750,000 | 41,295,000 | ||||||
Hancock Holding Co. | 850,000 | 26,282,000 | ||||||
Hanover Insurance Group, Inc. (The) | 600,000 | 29,808,000 | ||||||
Hartford Financial Services Group, Inc. (The) | 1,975,000 | 50,955,000 | ||||||
Invesco Ltd. | 1,715,000 | 49,666,400 | ||||||
Lazard Ltd., Cl A | 1,630,000 | 55,631,900 | ||||||
MB Financial, Inc. | 485,000 | 11,722,450 | ||||||
Mid-America Apartment Communities, Inc., REIT | 299,600 | 20,690,376 | ||||||
Progressive Corp. (The) | 750,000 | 18,952,500 | ||||||
Regions Financial Corp. | 5,200,000 | 42,588,000 | ||||||
|
| |||||||
| 645,239,887 | ||||||||
|
| |||||||
Health Care 6.3% | ||||||||
Agilent Technologies, Inc. | 1,210,000 | 50,783,700 | ||||||
Cigna Corp. | 1,250,000 | 77,962,500 | ||||||
STERIS Corp. | 1,045,000 | 43,482,450 | ||||||
|
| |||||||
| 172,228,650 | ||||||||
|
| |||||||
| Shares | Value($) | |||||||
Industrials 19.1% | ||||||||
Con-way, Inc. | 225,000 | 7,922,250 | ||||||
Crane Co. | 450,000 | 25,137,000 | ||||||
CSX Corp. | 1,125,000 | 27,708,750 | ||||||
Cummins, Inc. | 480,000 | 55,588,800 | ||||||
Fluor Corp. | 505,000 | 33,496,650 | ||||||
General Dynamics Corp. | 590,000 | 41,600,900 | ||||||
Herman Miller, Inc. | 350,000 | 9,684,500 | ||||||
Joy Global, Inc. | 1,375,000 | 81,840,000 | ||||||
Kennametal, Inc. | 875,000 | 34,160,000 | ||||||
Parker Hannifin Corp. | 140,000 | 12,821,200 | ||||||
Pentair Ltd. | 250,000 | 13,187,500 | ||||||
Republic Services, Inc. | 525,000 | 17,325,000 | ||||||
Rockwell Automation, Inc. | 210,000 | 18,133,500 | ||||||
Rockwell Collins, Inc. | 825,000 | 52,074,000 | ||||||
SPX Corp. | 250,000 | 19,740,000 | ||||||
Stanley Black & Decker, Inc. | 225,000 | 18,218,250 | ||||||
Titan International, Inc.(a) | 965,000 | 20,342,200 | ||||||
Towers Watson & Co., Cl A | 410,000 | 28,421,200 | ||||||
|
| |||||||
| 517,401,700 | ||||||||
|
| |||||||
Information Technology 7.2% |
| |||||||
Harris Corp. | 735,000 | 34,059,900 | ||||||
Intersil Corp., Cl A | 7,550,000 | 65,760,500 | ||||||
Microchip Technology, Inc.(a) | 980,000 | 36,024,800 | ||||||
Motorola Solutions, Inc. | 200,000 | 12,806,000 | ||||||
SAIC, Inc. | 3,475,000 | 47,086,250 | ||||||
|
| |||||||
| 195,737,450 | ||||||||
|
| |||||||
Materials 10.6% | ||||||||
Allegheny Technologies, Inc. | 2,125,000 | 67,383,750 | ||||||
Ashland, Inc. | 900,000 | 66,870,000 | ||||||
Cabot Corp. | 2,050,000 | 70,110,000 | ||||||
Celanese Corp., Cl A | 475,000 | 20,923,750 | ||||||
Martin Marietta Materials, Inc.(a) | 280,000 | 28,565,600 | ||||||
Scotts Miracle-Gro Co. (The), Cl A | 775,000 | 33,511,000 | ||||||
|
| |||||||
| 287,364,100 | ||||||||
|
| |||||||
Telecommunication Services 1.9% |
| |||||||
CenturyLink, Inc. | 1,450,000 | 50,938,500 | ||||||
|
| |||||||
Utilities 6.7% | ||||||||
American Water Works Co., Inc. | 750,000 | 31,080,000 | ||||||
CenterPoint Energy, Inc. | 1,925,000 | 46,123,000 | ||||||
NRG Energy, Inc. | 1,575,000 | 41,721,750 | ||||||
PG&E Corp. | 1,115,000 | 49,650,950 | ||||||
PPL Corp. | 450,000 | 14,089,500 | ||||||
|
| |||||||
| 182,665,200 | ||||||||
|
| |||||||
Total Common Stocks | 2,579,768,037 | |||||||
|
| |||||||
See Notes to Financial Statements.
48
SCHEDULES OF PORTFOLIO INVESTMENTS
RIDGEWORTH FUNDS March 31, 2013
Mid-Cap Value Equity Fund — concluded
| Shares | Value($) | |||||||
Short-Term Investment 1.8% |
| |||||||
RidgeWorth Funds Securities Lending Joint Account(b) | 48,345,725 | 48,345,725 | ||||||
|
| |||||||
Total Short-Term Investment |
| 48,345,725 | ||||||
|
| |||||||
Money Market Fund 4.1% |
| |||||||
State Street Institutional Liquid Reserves Fund, Institutional Class, 0.13%(c) | 112,247,598 | 112,247,598 | ||||||
|
| |||||||
Total Money Market Fund | 112,247,598 | |||||||
|
| |||||||
Total Investments |
| 2,740,361,360 | ||||||
Liabilities in excess of other assets — (1.0)% | (27,877,069 | ) | ||||||
|
| |||||||
Net Assets — 100.0% | $ | 2,712,484,291 | ||||||
|
| |||||||
| (a) | The security or a partial position of the security was on loan as of March 31, 2013. The total value of securities on loan as of March 31, 2013 was $47,183,569. |
| (b) | Purchased with cash collateral held from securities lending. The value of the collateral could include collateral held for securities that were sold on or before March 31, 2013 (See Note 2(h)). |
| (c) | Rate disclosed, the 7 day net yield, is as of March 31, 2013. |
Investment Abbreviations
REIT — Real Estate Investment Trust
See Notes to Financial Statements.
49
SCHEDULES OF PORTFOLIO INVESTMENTS
RIDGEWORTH FUNDS March 31, 2013
Select Large Cap Growth Stock Fund
| Shares | Value($) | |||||||
| Common Stocks 98.0% | ||||||||
Consumer Discretionary 15.7% | ||||||||
Amazon.com, Inc.* | 4,615 | 1,229,851 | ||||||
Las Vegas Sands Corp. | 16,737 | 943,130 | ||||||
Lowe’s Cos., Inc. | 22,041 | 835,795 | ||||||
Macy’s, Inc. | 21,858 | 914,539 | ||||||
Priceline.com, Inc.* | 1,246 | 857,161 | ||||||
VF Corp. | 3,544 | 594,506 | ||||||
|
| |||||||
| 5,374,982 | ||||||||
|
| |||||||
Consumer Staples 8.7% | ||||||||
Estee Lauder Cos., Inc. (The), Cl A | 11,234 | 719,313 | ||||||
Mead Johnson Nutrition Co. | 7,658 | 593,112 | ||||||
Philip Morris International, Inc. | 11,299 | 1,047,531 | ||||||
Whole Foods Market, Inc. | 7,123 | 617,920 | ||||||
|
| |||||||
| 2,977,876 | ||||||||
|
| |||||||
Energy 7.5% | ||||||||
Cameron International Corp.* | 14,350 | 935,620 | ||||||
EOG Resources, Inc. | 6,996 | 895,978 | ||||||
Halliburton Co. | 18,664 | 754,212 | ||||||
|
| |||||||
| 2,585,810 | ||||||||
|
| |||||||
Financials 5.5% | ||||||||
American Express Co. | 17,066 | 1,151,272 | ||||||
Morgan Stanley | 33,078 | 727,055 | ||||||
|
| |||||||
| 1,878,327 | ||||||||
|
| |||||||
Health Care 18.3% | ||||||||
Agilent Technologies, Inc. | 14,436 | 605,879 | ||||||
Alexion Pharmaceuticals, Inc.* | 10,433 | 961,297 | ||||||
Allergan, Inc. | 5,507 | 614,746 | ||||||
Biogen Idec, Inc.* | 6,960 | 1,342,654 | ||||||
Catamaran Corp.* | 11,309 | 599,716 | ||||||
Gilead Sciences, Inc.* | 20,870 | 1,021,169 | ||||||
Intuitive Surgical, Inc.* | 1,485 | 729,417 | ||||||
Mylan, Inc.* | 13,452 | 389,301 | ||||||
|
| |||||||
| 6,264,179 | ||||||||
|
| |||||||
Industrials 12.2% | ||||||||
Cummins, Inc. | 5,866 | 679,342 | ||||||
Fluor Corp. | 13,251 | 878,939 | ||||||
Precision Castparts Corp. | 4,176 | 791,853 | ||||||
United Parcel Service, Inc., Cl B | 8,906 | 765,025 | ||||||
W.W. Grainger, Inc. | 4,693 | 1,055,831 | ||||||
|
| |||||||
| 4,170,990 | ||||||||
|
| |||||||
Information Technology 28.1% | ||||||||
Analog Devices, Inc. | 14,622 | 679,777 | ||||||
Apple, Inc. | 3,988 | 1,765,208 | ||||||
| Shares | Value($) | |||||||
Information Technology—continued |
| |||||||
ARM Holdings PLC SP ADR | 14,174 | 600,552 | ||||||
ASML Holding NV NYS(a) | 7,393 | 502,798 | ||||||
eBay, Inc.* | 8,327 | 451,490 | ||||||
F5 Networks, Inc.* | 6,303 | 561,471 | ||||||
Google, Inc., Cl A* | 2,319 | 1,841,356 | ||||||
QUALCOMM, Inc. | 18,110 | 1,212,465 | ||||||
Teradata Corp.* | 8,375 | 490,021 | ||||||
Visa, Inc., Cl A | 8,987 | 1,526,352 | ||||||
|
| |||||||
| 9,631,490 | ||||||||
|
| |||||||
Materials 2.0% | ||||||||
Monsanto Co. | 6,591 | 696,207 | ||||||
|
| |||||||
Total Common Stocks | 33,579,861 | |||||||
|
| |||||||
Short-Term Investment 0.8% | ||||||||
RidgeWorth Funds Securities Lending Joint Account(b) | 257,450 | 257,450 | ||||||
|
| |||||||
Total Short-Term Investment | 257,450 | |||||||
|
| |||||||
Money Market Fund 4.4% | ||||||||
State Street Institutional Liquid Reserves Fund, Institutional Class, 0.13%(c) | 1,504,823 | 1,504,823 | ||||||
|
| |||||||
Total Money Market Fund | 1,504,823 | |||||||
|
| |||||||
Total Investments | �� | 35,342,134 | ||||||
Liabilities in excess of other assets —(3.2)% | (1,088,946 | ) | ||||||
|
| |||||||
Net Assets — 100.0% | $ | 34,253,188 | ||||||
|
| |||||||
| * | Non-income producing security. |
| (a) | The security or a partial position of the security was on loan as of March 31, 2013. The total value of securities on loan as of March 31, 2013 was $251,788. |
| (b) | Purchased with cash collateral held from securities lending. The value of the collateral could include collateral held for securities that were sold on or before March 31, 2013 (See Note 2(h)). |
| (c) | Rate disclosed, the 7 day net yield, is as of March 31, 2013. |
Investment Abbreviations
| NYS | — | New York Registered Shares | ||
| SP ADR | — | Sponsored American Depositary Receipt |
See Notes to Financial Statements.
50
SCHEDULES OF PORTFOLIO INVESTMENTS
RIDGEWORTH FUNDS March 31, 2013
Small Cap Growth Stock Fund
| Shares | Value($) | |||||||
| Common Stocks 98.2% | ||||||||
Consumer Discretionary 15.1% | ||||||||
Asbury Automotive Group, Inc.* | 36,930 | 1,354,962 | ||||||
Belo Corp., Cl A | 104,198 | 1,024,266 | ||||||
Body Central Corp.* | 63,701 | 598,789 | ||||||
Buffalo Wild Wings, Inc.* | 24,228 | 2,120,677 | ||||||
Chico’s FAS, Inc. | 55,453 | 931,610 | ||||||
Coinstar, Inc.*(a) | 22,319 | 1,303,876 | ||||||
Domino’s Pizza, Inc. | 26,189 | 1,347,162 | ||||||
Express, Inc.* | 53,349 | 950,146 | ||||||
G-III Apparel Group Ltd.* | 21,038 | 843,834 | ||||||
Hibbett Sports, Inc.* | 28,663 | 1,612,867 | ||||||
HomeAway, Inc.* | 22,960 | 746,200 | ||||||
HSN, Inc. | 20,930 | 1,148,220 | ||||||
KB Home(a) | 72,621 | 1,580,959 | ||||||
Lions Gate Entertainment Corp.*(a) | 84,847 | 2,016,813 | ||||||
Modine Manufacturing Co.* | 78,626 | 715,497 | ||||||
Multimedia Games Holding Co., Inc.* | 89,139 | 1,860,331 | ||||||
Ryland Group, Inc. (The) | 40,447 | 1,683,404 | ||||||
Standard Pacific Corp.*(a) | 151,265 | 1,306,930 | ||||||
Steven Madden Ltd.* | 39,928 | 1,722,494 | ||||||
Vitamin Shoppe, Inc.* | 16,924 | 826,737 | ||||||
|
| |||||||
| 25,695,774 | ||||||||
|
| |||||||
Consumer Staples 2.7% | ||||||||
Hain Celestial Group, Inc. (The)* | 29,877 | 1,824,887 | ||||||
Nu Skin Enterprises, Inc., Cl A | 25,557 | 1,129,620 | ||||||
United Natural Foods, Inc.* | 34,281 | 1,686,625 | ||||||
|
| |||||||
| 4,641,132 | ||||||||
|
| |||||||
Energy 6.7% | ||||||||
Basic Energy Services, Inc.*(a) | 104,524 | 1,428,843 | ||||||
Gulfport Energy Corp.* | 42,061 | 1,927,656 | ||||||
Halcon Resources Corp.* | 170,770 | 1,330,298 | ||||||
Hornbeck Offshore Services, Inc.* | 30,487 | 1,416,426 | ||||||
Kodiak Oil & Gas Corp.* | 222,121 | 2,019,080 | ||||||
Lufkin Industries, Inc. | 29,846 | 1,981,476 | ||||||
Mitcham Industries, Inc.* | 51,956 | 879,096 | ||||||
Stone Energy Corp.* | 19,895 | 432,716 | ||||||
|
| |||||||
| 11,415,591 | ||||||||
|
| |||||||
Financials 9.2% | ||||||||
Cardtronics, Inc.* | 48,679 | 1,336,725 | ||||||
Cathay General Bancorp | 101,848 | 2,049,182 | ||||||
Encore Capital Group, Inc.* | 68,059 | 2,048,576 | ||||||
MB Financial, Inc. | 70,225 | 1,697,338 | ||||||
Portfolio Recovery Associates, Inc.* | 20,552 | 2,608,460 | ||||||
Radian Group, Inc.(a) | 131,455 | 1,407,883 | ||||||
Stifel Financial Corp.* | 55,068 | 1,909,207 | ||||||
World Acceptance Corp.*(a) | 28,701 | 2,464,555 | ||||||
|
| |||||||
| 15,521,926 | ||||||||
|
| |||||||
| Shares | Value($) | |||||||
Health Care 18.0% | ||||||||
ABIOMED, Inc.*(a) | 58,477 | 1,091,766 | ||||||
Acadia Healthcare Co., Inc.* | 67,274 | 1,977,183 | ||||||
Air Methods Corp. | 31,771 | 1,532,633 | ||||||
Align Technology, Inc.* | 35,488 | 1,189,203 | ||||||
AVANIR Pharmaceuticals, Inc.*(a) | 257,668 | 706,010 | ||||||
Cubist Pharmaceuticals, Inc.* | 44,299 | 2,074,079 | ||||||
Endologix, Inc.* | 98,246 | 1,586,673 | ||||||
Exelixis, Inc.*(a) | 171,637 | 792,963 | ||||||
HealthSouth Corp.* | 52,885 | 1,394,577 | ||||||
HeartWare International, Inc.*(a) | 13,940 | 1,232,714 | ||||||
HMS Holdings Corp.* | 66,364 | 1,801,783 | ||||||
ICON PLC* | 46,464 | 1,500,323 | ||||||
Impax Laboratories, Inc.* | 63,120 | 974,573 | ||||||
LifePoint Hospitals, Inc.* | 18,163 | 880,179 | ||||||
Medicines Co. (The)* | 51,121 | 1,708,464 | ||||||
Medidata Solutions, Inc.* | 31,772 | 1,842,141 | ||||||
Neogen Corp.* | 19,487 | 965,971 | ||||||
NPS Pharmaceuticals, Inc.* | 118,171 | 1,204,162 | ||||||
NuVasive, Inc.* | 46,381 | 988,379 | ||||||
Questcor Pharmaceuticals, Inc.(a) | 40,228 | 1,309,019 | ||||||
Seattle Genetics, Inc.*(a) | 31,340 | 1,112,883 | ||||||
Team Health Holdings, Inc.* | 48,359 | 1,759,300 | ||||||
Vocera Communications, Inc.* | 41,197 | 947,531 | ||||||
|
| |||||||
| 30,572,509 | ||||||||
|
| |||||||
Industrials 17.5% | ||||||||
AAR Corp. | 45,254 | 832,221 | ||||||
Acacia Research—Acacia Technologies* | 43,597 | 1,315,321 | ||||||
Alaska Air Group, Inc.* | 25,559 | 1,634,754 | ||||||
Corporate Executive Board Co. (The) | 23,263 | 1,352,976 | ||||||
H&E Equipment Services, Inc. | 86,806 | 1,770,842 | ||||||
Hexcel Corp.* | 61,785 | 1,792,383 | ||||||
Hub Group, Inc., Cl A* | 37,752 | 1,451,942 | ||||||
InnerWorkings, Inc.*(a) | 114,913 | 1,739,783 | ||||||
Kforce, Inc. | 98,583 | 1,613,804 | ||||||
MasTec, Inc.* | 24,703 | 720,092 | ||||||
Mistras Group, Inc.* | 29,252 | 708,191 | ||||||
Mueller Water Products, Inc., Cl A | 159,259 | 944,406 | ||||||
MYR Group, Inc.* | 56,386 | 1,384,840 | ||||||
Polypore International, Inc.*(a) | 17,461 | 701,583 | ||||||
Powell Industries, Inc.* | 16,942 | 890,641 | ||||||
Ryder System, Inc. | 17,102 | 1,021,844 | ||||||
Simpson Manufacturing Co., Inc. | 19,687 | 602,619 | ||||||
Terex Corp.* | 26,472 | 911,166 | ||||||
Titan Machinery, Inc.*(a) | 52,077 | 1,445,137 | ||||||
Trimas Corp.* | 27,382 | 889,094 | ||||||
See Notes to Financial Statements.
51
SCHEDULES OF PORTFOLIO INVESTMENTS
RIDGEWORTH FUNDS March 31, 2013
Small Cap Growth Stock Fund — concluded
| Shares | Value($) | |||||||
Industrials—continued | ||||||||
Triumph Group, Inc. | 10,875 | 853,688 | ||||||
TrueBlue, Inc.* | 81,137 | 1,715,236 | ||||||
US Airways Group, Inc.*(a) | 61,273 | 1,039,803 | ||||||
Valmont Industries, Inc. | 7,033 | 1,106,080 | ||||||
Woodward, Inc. | 29,848 | 1,186,756 | ||||||
|
| |||||||
| 29,625,202 | ||||||||
|
| |||||||
Information Technology 24.1% | ||||||||
Aruba Networks, Inc.*(a) | 96,013 | 2,375,362 | ||||||
Aspen Technology, Inc.* | 65,410 | 2,112,089 | ||||||
Bottomline Technologies, Inc.* | 53,182 | 1,516,219 | ||||||
BroadSoft, Inc.*(a) | 49,988 | 1,323,182 | ||||||
Cirrus Logic, Inc.* | 60,502 | 1,376,421 | ||||||
CommVault Systems, Inc.* | 26,498 | 2,172,306 | ||||||
Cornerstone OnDemand, Inc.* | 39,029 | 1,330,889 | ||||||
Euronet Worldwide, Inc.* | 102,694 | 2,704,960 | ||||||
ExactTarget, Inc.* | 67,341 | 1,567,025 | ||||||
Heartland Payment Systems, Inc. | 79,456 | 2,619,664 | ||||||
Infoblox, Inc.* | 64,659 | 1,403,100 | ||||||
Ixia* | 38,889 | 841,558 | ||||||
Jive Software, Inc.*(a) | 99,684 | 1,515,197 | ||||||
NETGEAR, Inc.* | 49,429 | 1,656,366 | ||||||
OpenTable, Inc.* | 27,083 | 1,705,687 | ||||||
Procera Networks, Inc.* | 56,365 | 670,180 | ||||||
PROS Holdings, Inc.* | 53,400 | 1,450,878 | ||||||
QLIK Technologies, Inc.* | 99,938 | 2,581,399 | ||||||
Semtech Corp.* | 90,805 | 3,213,589 | ||||||
Sourcefire, Inc.* | 26,274 | 1,556,209 | ||||||
Stratasys Ltd.*(a) | 14,819 | 1,099,866 | ||||||
Tangoe, Inc.* | 72,547 | 898,857 | ||||||
Ultimate Software Group, Inc.* | 21,940 | 2,285,270 | ||||||
Universal Display Corp.*(a) | 27,862 | 818,864 | ||||||
|
| |||||||
| 40,795,137 | ||||||||
|
| |||||||
Materials 3.0% | ||||||||
Flotek Industries, Inc.*(a) | 108,883 | 1,780,237 | ||||||
Haynes International, Inc. | 25,590 | 1,415,127 | ||||||
Headwaters, Inc.* | 81,176 | 884,819 | ||||||
LSB Industries, Inc.* | 28,908 | 1,005,420 | ||||||
|
| |||||||
| 5,085,603 | ||||||||
|
| |||||||
| Shares | Value($) | |||||||
Telecommunication Services 1.9% |
| |||||||
8x8, Inc.*(a) | 204,587 | 1,401,421 | ||||||
Cogent Communications Group, Inc. | 69,290 | 1,829,256 | ||||||
|
| |||||||
| 3,230,677 | ||||||||
|
| |||||||
Total Common Stocks (Cost $125,472,419) | 166,583,551 | |||||||
|
| |||||||
Short-Term Investment 11.1% | ||||||||
RidgeWorth Funds Securities Lending Joint Account(b) | 18,787,977 | 18,787,977 | ||||||
|
| |||||||
Total Short-Term Investment (Cost $18,787,977) | 18,787,977 | |||||||
|
| |||||||
Money Market Fund 0.4% | ||||||||
State Street Institutional Liquid Reserves Fund, Institutional Class, 0.13%(c) | 784,973 | 784,973 | ||||||
|
| |||||||
Total Money Market Fund (Cost $784,973) | 784,973 | |||||||
|
| |||||||
Total Investments (Cost $145,045,369) — 109.7% | 186,156,501 | |||||||
Liabilities in excess of other | (16,499,471 | ) | ||||||
|
| |||||||
Net Assets — 100.0% | $ | 169,657,030 | ||||||
|
| |||||||
| * | Non-income producing security. |
| (a) | The security or a partial position of the security was on loan as of March 31, 2013. The total value of securities on loan as of March 31, 2013 was $18,271,783. |
| (b) | Purchased with cash collateral held from securities lending. The value of the collateral could include collateral held for securities that were sold on or before March 31, 2013 (See Note 2(h)). |
| (c) | Rate disclosed, the 7 day net yield, is as of March 31, 2013. |
See Notes to Financial Statements.
52
SCHEDULES OF PORTFOLIO INVESTMENTS
RIDGEWORTH FUNDS March 31, 2013
Small Cap Value Equity Fund
| Shares | Value($) | |||||||
| Common Stocks 99.1% | ||||||||
Consumer Discretionary 19.5% | ||||||||
Arcos Dorados Holdings, Inc., Cl A | 2,540,000 | 33,528,000 | ||||||
Brunswick Corp. | 651,600 | 22,297,752 | ||||||
Destination Maternity Corp. | 170,029 | 3,978,679 | ||||||
Einstein Noah Restaurant Group, Inc. | 197,400 | 2,927,442 | ||||||
Guess?, Inc. | 1,774,754 | 44,067,142 | ||||||
HSN, Inc. | 1,030,300 | 56,522,258 | ||||||
Lithia Motors, Inc., Cl A | 358,100 | 17,002,588 | ||||||
Meredith Corp. | 773,000 | 29,574,980 | ||||||
NutriSystem, Inc. | 761,150 | 6,454,552 | ||||||
Oxford Industries, Inc. | 15,141 | 803,987 | ||||||
Scholastic Corp. | 739,000 | 19,694,350 | ||||||
Sonic Automotive, Inc., Cl A | 816,100 | 18,084,776 | ||||||
Sotheby’s | 1,145,500 | 42,853,155 | ||||||
Thor Industries, Inc. | 527,300 | 19,399,367 | ||||||
|
| |||||||
| 317,189,028 | ||||||||
|
| |||||||
Consumer Staples 4.2% | ||||||||
Casey’s General Stores, Inc. | 232,200 | 13,537,260 | ||||||
Harris Teeter Supermarkets, Inc. | 595,700 | 25,442,347 | ||||||
WD-40 Co. | 532,550 | 29,167,764 | ||||||
|
| |||||||
| 68,147,371 | ||||||||
|
| |||||||
Energy 7.5% | ||||||||
Berry Petroleum Co., Cl A | 321,200 | 14,868,348 | ||||||
Bristow Group, Inc. | 601,900 | 39,689,286 | ||||||
CARBO Ceramics, Inc. | 468,700 | 42,684,509 | ||||||
Patterson-UTI Energy, Inc. | 1,061,100 | 25,296,624 | ||||||
|
| |||||||
| 122,538,767 | ||||||||
|
| |||||||
Financials 22.2% | ||||||||
Banco Latinoamericano de Expectaciones SA, Cl E | 259,050 | 6,408,897 | ||||||
Bank of Hawaii Corp. | 105,400 | 5,355,374 | ||||||
Campus Crest Communities, Inc. REIT | 766,300 | 10,651,570 | ||||||
Cash America International, Inc. | 973,150 | 51,061,180 | ||||||
Evercore Partners, Inc., Cl A | 571,350 | 23,768,160 | ||||||
Hancock Holding Co. | 723,174 | 22,360,540 | ||||||
Hanover Insurance Group, Inc. (The) | 720,750 | 35,806,860 | ||||||
HCC Insurance Holdings, Inc. | 1,116,400 | 46,922,292 | ||||||
Horace Mann Educators Corp. | 559,900 | 11,673,915 | ||||||
JMP Group, Inc. | 582,300 | 4,023,693 | ||||||
Mid-America Apartment Communities, Inc., REIT | 155,200 | 10,718,112 | ||||||
Monmouth Real Estate Investment Corp., Cl A REIT | 111,000 | 1,237,650 | ||||||
National Retail Properties, Inc. REIT | 469,150 | 16,969,156 | ||||||
| Shares | Value($) | |||||||
Financials—continued | ||||||||
Oppenheimer Holdings, Inc., Cl A | 196,100 | 3,818,067 | ||||||
Protective Life Corp. | 577,100 | 20,660,180 | ||||||
StanCorp Financial Group, Inc. | 1,015,800 | 43,435,608 | ||||||
Starwood Property Trust, Inc., REIT | 491,100 | 13,632,936 | ||||||
Tower Group International Ltd. | 320,242 | 5,908,465 | ||||||
Trust Co Bank Corp. NY | 411,000 | 2,293,380 | ||||||
UMB Financial Corp. | 482,350 | 23,668,914 | ||||||
|
| |||||||
| 360,374,949 | ||||||||
|
| |||||||
Health Care 4.4% | ||||||||
Ensign Group, Inc. | 323,700 | 10,811,580 | ||||||
Landauer, Inc. | 197,000 | 11,106,860 | ||||||
STERIS Corp. | 626,357 | 26,062,715 | ||||||
Teleflex, Inc. | 287,100 | 24,262,821 | ||||||
|
| |||||||
| 72,243,976 | ||||||||
|
| |||||||
Industrials 27.6% | ||||||||
A.O. Smith Corp. | 1,047,275 | 77,048,022 | ||||||
ABM Industries, Inc. | 613,000 | 13,633,120 | ||||||
Barnes Group, Inc. | 149,100 | 4,313,463 | ||||||
China Yuchai International Ltd. | 132,600 | 2,120,274 | ||||||
CLARCOR, Inc. | 492,200 | 25,781,436 | ||||||
Corrections Corp. of America | 481,100 | 18,796,577 | ||||||
EMCOR Group, Inc. | 394,400 | 16,718,616 | ||||||
Great Lakes Dredge & Dock Corp. | 888,400 | 5,978,932 | ||||||
Grupo Aeroportuario del Pacifico SA de CV SP ADR | 261,476 | 15,325,108 | ||||||
Grupo Aeroportuario del Sureste SAB de CV ADR | 59,300 | 8,104,531 | ||||||
Harsco Corp. | 485,200 | 12,018,404 | ||||||
Herman Miller, Inc. | 894,300 | 24,745,281 | ||||||
Interface, Inc. | 2,348,771 | 45,143,379 | ||||||
Kennametal, Inc. | 175,400 | 6,847,616 | ||||||
Knoll, Inc. | 803,500 | 14,567,455 | ||||||
Lennox International, Inc. | 582,800 | 37,001,972 | ||||||
Mine Safety Appliances Co. | 427,300 | 21,202,626 | ||||||
Progressive Waste Solutions Ltd. | 1,950,424 | 41,251,467 | ||||||
Ritchie Bros Auctioneers, Inc. | 465,800 | 10,107,860 | ||||||
Ryder System, Inc. | 44,000 | 2,629,000 | ||||||
Sun Hydraulics Corp. | 91,400 | 2,971,414 | ||||||
Tennant Co. | 153,800 | 7,468,528 | ||||||
Titan International, Inc. | 950,500 | 20,036,540 | ||||||
Viad Corp. | 523,000 | 14,466,180 | ||||||
|
| |||||||
| 448,277,801 | ||||||||
|
| |||||||
Information Technology 6.1% | ||||||||
Black Box Corp. | 251,350 | 5,481,944 | ||||||
Booz Allen Hamilton Holding Corp. | 472,800 | 6,354,432 | ||||||
See Notes to Financial Statements.
53
SCHEDULES OF PORTFOLIO INVESTMENTS
RIDGEWORTH FUNDS March 31, 2013
Small Cap Value Equity Fund — concluded
| Shares | Value($) | |||||||
Information Technology—continued |
| |||||||
DST Systems, Inc. | 147,800 | 10,533,706 | ||||||
FEI Co. | 344,400 | 22,231,020 | ||||||
FLIR Systems, Inc. | 1,058,900 | 27,541,989 | ||||||
Plantronics, Inc. | 621,350 | 27,457,456 | ||||||
|
| |||||||
| 99,600,547 | ||||||||
|
| |||||||
Materials 6.9% | ||||||||
A. Schulman, Inc. | 473,300 | 14,937,348 | ||||||
Buckeye Technologies, Inc. | 387,300 | 11,599,635 | ||||||
Cabot Corp. | 818,100 | 27,979,020 | ||||||
Carpenter Technology Corp. | 356,400 | 17,566,956 | ||||||
Compass Minerals International, Inc. | 127,300 | 10,043,970 | ||||||
Globe Specialty Metals, Inc. | 648,700 | 9,029,904 | ||||||
Haynes International, Inc. | 165,900 | 9,174,270 | ||||||
Olin Corp. | 494,100 | 12,461,202 | ||||||
|
| |||||||
| 112,792,305 | ||||||||
|
| |||||||
Utilities 0.7% | ||||||||
Avista Corp. | 60,550 | 1,659,070 | ||||||
California Water Service Group | 442,400 | 8,803,760 | ||||||
|
| |||||||
| 10,462,830 | ||||||||
|
| |||||||
Total Common Stocks | 1,611,627,574 | |||||||
|
| |||||||
| Shares | Value($) | |||||||
Money Market Fund 0.9% | ||||||||
State Street Institutional Liquid Reserves Fund, Institutional Class, 0.13%(a) | 14,870,383 | 14,870,383 | ||||||
|
| |||||||
Total Money Market Fund | 14,870,383 | |||||||
|
| |||||||
Total Investments |
| 1,626,497,957 | ||||||
Liabilities in excess of other assets — (0.0)%(b) | (577,244 | ) | ||||||
|
| |||||||
Net Assets — 100.0% | $ | 1,625,920,713 | ||||||
|
| |||||||
| (a) | Rate disclosed, the 7 day net yield, is as of March 31, 2013. |
| (b) | Less than 0.05% of Net Assets. |
Investment Abbreviations
| ADR | — | American Depositary Receipt | ||
| REIT | — | Real Estate Investment Trust | ||
| SP ADR | — | Sponsored American Depositary Receipt |
See Notes to Financial Statements.
54
SCHEDULES OF PORTFOLIO INVESTMENTS
RIDGEWORTH FUNDS March 31, 2013
Aggressive Growth Allocation Strategy
| Shares | Value($) | |||||||
| Equity Funds 68.6%(a) | ||||||||
RidgeWorth Aggressive Growth Stock Fund* | 2,828 | 44,110 | ||||||
RidgeWorth International Equity Fund | 118,661 | 1,381,209 | ||||||
RidgeWorth International Equity Index Fund | 2,272 | 27,354 | ||||||
RidgeWorth Large Cap Growth Stock Fund | 554,025 | 4,603,948 | ||||||
RidgeWorth Large Cap Value Equity Fund | 303,311 | 4,780,176 | ||||||
RidgeWorth Mid-Cap Value Equity Fund | 150,309 | 1,963,033 | ||||||
RidgeWorth Select Large Cap Growth Stock Fund* | 58,949 | 1,586,308 | ||||||
RidgeWorth Small Cap Growth Stock Fund* | 52,549 | 822,910 | ||||||
RidgeWorth Small Cap Value Equity Fund | 53,752 | 830,471 | ||||||
|
| |||||||
Total Equity Funds | 16,039,519 | |||||||
|
| |||||||
Fixed Income Funds 16.1%(a) | ||||||||
RidgeWorth Corporate Bond Fund | 848 | 7,886 | ||||||
RidgeWorth High Income Fund | 35,463 | 259,590 | ||||||
RidgeWorth Intermediate Bond Fund | 15,418 | 158,960 | ||||||
RidgeWorth Seix Floating Rate High Income Fund | 17,638 | 159,802 | ||||||
RidgeWorth Seix High Yield Fund | 26,407 | 270,932 | ||||||
RidgeWorth Total Return Bond Fund | 253,200 | 2,732,023 | ||||||
RidgeWorth U.S. Government Securities Ultra-Short Bond Fund | 18,000 | 183,062 | ||||||
|
| |||||||
Total Fixed Income Funds | 3,772,255 | |||||||
|
| |||||||
Exchange Traded Funds 14.4% | ||||||||
Consumer Discretionary Select Sector SPDR Fund | 1,181 | 62,546 | ||||||
Consumer Staples Select Sector SPDR Fund | 1,015 | 40,356 | ||||||
Energy Select Sector SPDR Fund | 891 | 70,674 | ||||||
Financial Select Sector SPDR Fund | 4,619 | 84,020 | ||||||
Health Care Select Sector SPDR Fund | 1,761 | 80,918 | ||||||
| Shares | Value($) | |||||||
Exchange Traded Funds—continued |
| |||||||
Industrial Select Sector SPDR Fund | 1,500 | 62,595 | ||||||
iShares Barclays 20+ Year Treasury Bond Fund | 1,163 | 136,955 | ||||||
iShares Barclays U.S. Treasury Inflation Protected Securities Fund | 29 | 3,516 | ||||||
iShares Dow Jones U.S. Real Estate Index Fund | 5,299 | 368,174 | ||||||
iShares MSCI Emerging Markets Index Fund | 10,788 | 461,511 | ||||||
iShares Russell 2000 Index Fund | 311 | 29,315 | ||||||
iShares Core S&P 500 Fund | 10,326 | 1,624,589 | ||||||
Market Vectors Gold Miners Fund | 5,140 | 194,549 | ||||||
Materials Select Sector SPDR Fund | 571 | 22,372 | ||||||
Technology Select Sector SPDR Fund | 4,132 | 125,076 | ||||||
Utilities Select Sector SPDR Fund | 116 | 4,530 | ||||||
|
| |||||||
Total Exchange Traded Funds | 3,371,696 | |||||||
|
| |||||||
Money Market Fund 1.1% | ||||||||
State Street Institutional Treasury Money Market Fund, Institutional Class, 0.00%(b) | 256,581 | 256,581 | ||||||
Total Money Market Fund | 256,581 | |||||||
|
| |||||||
Total Investments | 23,440,051 | |||||||
Liabilities in excess of other | (48,966 | ) | ||||||
|
| |||||||
Net Assets — 100.0% | $ | 23,391,085 | ||||||
|
| |||||||
| * | Non-income producing security. |
| (a) | Affiliated investment. Investment is in each Fund’s I Shares. |
| (b) | Rate disclosed, the 7 day net yield, is as of March 31, 2013. |
Investment Abbreviations
| MSCI | — | Morgan Stanley Capital International | ||
| SPDR | — | Standard & Poor’s Depositary Receipt |
See Notes to Financial Statements.
55
SCHEDULES OF PORTFOLIO INVESTMENTS
RIDGEWORTH FUNDS March 31, 2013
Conservative Allocation Strategy
| Shares | Value($) | |||||||
Equity Funds 27.1%(a) | ||||||||
RidgeWorth Aggressive Growth Stock Fund* | 2,596 | 40,493 | ||||||
RidgeWorth International Equity Fund | 115,672 | 1,346,426 | ||||||
RidgeWorth International Equity Index Fund | 3,727 | 44,872 | ||||||
RidgeWorth Large Cap Growth Stock Fund | 580,122 | 4,820,812 | ||||||
RidgeWorth Large Cap Value Equity Fund | 308,743 | 4,865,788 | ||||||
RidgeWorth Mid-Cap Value Equity Fund | 150,552 | 1,966,211 | ||||||
RidgeWorth Select Large Cap Growth Stock Fund* | 53,272 | 1,433,559 | ||||||
RidgeWorth Small Cap Growth Stock Fund* | 52,478 | 821,805 | ||||||
RidgeWorth Small Cap Value Equity Fund | 53,578 | 827,775 | ||||||
|
| |||||||
Total Equity Funds | 16,167,741 | |||||||
|
| |||||||
Fixed Income Funds 64.4%(a) | ||||||||
RidgeWorth Corporate Bond Fund | 9,381 | 87,240 | ||||||
RidgeWorth High Income Fund | 322,284 | 2,359,120 | ||||||
RidgeWorth Intermediate Bond Fund | 151,145 | 1,558,300 | ||||||
RidgeWorth Seix Floating Rate High Income Fund | 179,449 | 1,625,811 | ||||||
RidgeWorth Seix High Yield Fund | 256,212 | 2,628,730 | ||||||
RidgeWorth Total Return Bond Fund | 2,604,637 | 28,104,035 | ||||||
RidgeWorth U.S. Government Securities Ultra-Short Bond Fund | 207,684 | 2,112,151 | ||||||
|
| |||||||
Total Fixed Income Funds | 38,475,387 | |||||||
|
| |||||||
Exchange Traded Funds 7.7% | ||||||||
Consumer Discretionary Select Sector SPDR Fund | 953 | 50,471 | ||||||
Consumer Staples Select Sector SPDR Fund | 823 | 32,722 | ||||||
Energy Select Sector SPDR Fund | 746 | 59,173 | ||||||
Financial Select Sector SPDR Fund | 3,907 | 71,068 | ||||||
Health Care Select Sector SPDR Fund | 1,481 | 68,052 | ||||||
| Shares | Value($) | |||||||
Exchange Traded Funds—continued |
| |||||||
Industrial Select Sector SPDR Fund | 1,227 | 51,203 | ||||||
iShares Barclays 20+ Year Treasury Bond Fund | 12,247 | 1,442,207 | ||||||
iShares Barclays U.S. Treasury Inflation Protected Securities Fund | 309 | 37,466 | ||||||
iShares Dow Jones U.S. Real Estate Index Fund | 5,439 | 377,902 | ||||||
iShares MSCI Emerging Markets Index Fund | 11,641 | 498,002 | ||||||
iShares Russell 2000 Index Fund | 528 | 49,769 | ||||||
iShares Core S&P 500 Fund | 9,826 | 1,545,924 | ||||||
Market Vectors Gold Miners Fund | 5,207 | 197,085 | ||||||
Materials Select Sector SPDR Fund | 456 | 17,866 | ||||||
Technology Select Sector SPDR Fund | 3,495 | 105,794 | ||||||
Utilities Select Sector SPDR Fund | 133 | 5,194 | ||||||
|
| |||||||
Total Exchange Traded Funds | 4,609,898 | |||||||
|
| |||||||
Money Market Fund 0.9% | ||||||||
State Street Institutional Treasury Money Market Fund, Institutional Class, 0.00%(b) | 551,274 | 551,274 | ||||||
|
| |||||||
Total Money Market Fund | 551,274 | |||||||
|
| |||||||
Total Investments | 59,804,300 | |||||||
Liabilities in excess of other | (66,849 | ) | ||||||
|
| |||||||
Net Assets — 100.0% | $ | 59,737,451 | ||||||
|
| |||||||
| * | Non-income producing security. |
| (a) | Affiliated investment. Investment is in each Fund’s I Shares. |
| (b) | Rate disclosed, the 7 day net yield, is as of March 31, 2013. |
Investment Abbreviations
| MSCI | — | Morgan Stanley Capital International | ||
| SPDR | — | Standard & Poor’s Depositary Receipt |
See Notes to Financial Statements.
56
SCHEDULES OF PORTFOLIO INVESTMENTS
RIDGEWORTH FUNDS March 31, 2013
Growth Allocation Strategy
| Shares | Value($) | |||||||
Equity Funds 60.5%(a) | ||||||||
RidgeWorth Aggressive Growth Stock Fund* | 5,072 | 79,121 | ||||||
RidgeWorth International Equity Fund | 303,884 | 3,537,211 | ||||||
RidgeWorth International Equity Index Fund | 3,790 | 45,629 | ||||||
RidgeWorth Large Cap Growth Stock Fund | 1,376,930 | 11,442,285 | ||||||
RidgeWorth Large Cap Value Equity Fund | 774,279 | 12,202,644 | ||||||
RidgeWorth Mid-Cap Value Equity Fund | 378,910 | 4,948,568 | ||||||
RidgeWorth Select Large Cap Growth Stock Fund* | 148,432 | 3,994,315 | ||||||
RidgeWorth Small Cap Growth Stock Fund* | 131,660 | 2,061,798 | ||||||
RidgeWorth Small Cap Value Equity Fund | 134,781 | 2,082,360 | ||||||
|
| |||||||
Total Equity Funds (Cost $34,550,812) | 40,393,931 | |||||||
|
| |||||||
Fixed Income Funds 25.8%(a) | ||||||||
RidgeWorth Corporate Bond Fund | 3,934 | 36,587 | ||||||
RidgeWorth High Income Fund | 188,708 | 1,381,342 | ||||||
RidgeWorth Intermediate Bond Fund | 66,503 | 685,642 | ||||||
RidgeWorth Seix Floating Rate High Income Fund | 79,556 | 720,775 | ||||||
RidgeWorth Seix High Yield Fund | 137,247 | 1,408,156 | ||||||
RidgeWorth Total Return Bond Fund | 1,149,972 | 12,408,201 | ||||||
RidgeWorth U.S. Government Securities Ultra-Short Bond Fund | 59,269 | 602,763 | ||||||
|
| |||||||
Total Fixed Income Funds (Cost $16,532,592) | 17,243,466 | |||||||
|
| |||||||
Exchange Traded Funds 12.8% | ||||||||
Consumer Discretionary Select Sector SPDR Fund | 3,513 | 186,049 | ||||||
Consumer Staples Select Sector SPDR Fund | 3,208 | 127,550 | ||||||
Energy Select Sector SPDR Fund | 2,766 | 219,399 | ||||||
Financial Select Sector SPDR Fund | 14,521 | 264,137 | ||||||
Health Care Select Sector SPDR Fund | 5,560 | 255,482 | ||||||
| Shares | Value($) | |||||||
Exchange Traded Funds—continued |
| |||||||
Industrial Select Sector SPDR Fund | 4,662 | 194,545 | ||||||
iShares Barclays 20+ Year Treasury Bond Fund | 4,524 | 532,746 | ||||||
iShares Barclays U.S. Treasury Inflation Protected Securities Fund | 352 | 42,680 | ||||||
iShares Dow Jones U.S. Real Estate Index Fund | 13,757 | 955,836 | ||||||
iShares MSCI Emerging Markets Index Fund | 27,081 | 1,158,525 | ||||||
iShares Russell 2000 Index Fund | 1,309 | 123,386 | ||||||
iShares Core S&P 500 Fund | 22,392 | 3,522,933 | ||||||
Market Vectors Gold Miners Fund | 12,940 | 489,779 | ||||||
Materials Select Sector SPDR Fund | 1,615 | 63,276 | ||||||
Technology Select Sector SPDR Fund | 12,931 | 391,422 | ||||||
Utilities Select Sector SPDR Fund | 469 | 18,315 | ||||||
|
| |||||||
Total Exchange Traded Funds (Cost $7,396,476) | 8,546,060 | |||||||
|
| |||||||
Money Market Fund 1.0% | ||||||||
State Street Institutional Treasury Money Market Fund, Institutional Class, 0.00%(b) | 714,276 | 714,276 | ||||||
|
| |||||||
Total Money Market Fund (Cost $714,276) | 714,276 | |||||||
|
| |||||||
Total Investments | 66,897,733 | |||||||
Liabilities in excess of other | (98,321 | ) | ||||||
|
| |||||||
Net Assets — 100.0% | $ | 66,799,412 | ||||||
|
| |||||||
| * | Non-income producing security. |
| (a) | Affiliated investment. Investment is in each Fund’s I Shares. |
| (b) | Rate disclosed, the 7 day net yield, is as of March 31, 2013. |
Investment Abbreviations
| MSCI | — | Morgan Stanley Capital International | ||
| SPDR | — | Standard & Poor’s Depositary Receipt |
See Notes to Financial Statements.
57
SCHEDULES OF PORTFOLIO INVESTMENTS
RIDGEWORTH FUNDS March 31, 2013
Moderate Allocation Strategy
| Shares | Value($) | |||||||
| Equity Funds 44.1%(a) | ||||||||
RidgeWorth International Equity Fund | 555,833 | 6,469,892 | ||||||
RidgeWorth International Equity Index Fund | 18,046 | 217,272 | ||||||
RidgeWorth Large Cap Growth Stock Fund | 2,626,241 | 21,824,059 | ||||||
RidgeWorth Large Cap Value Equity Fund | 1,480,871 | 23,338,522 | ||||||
RidgeWorth Mid-Cap Value Equity Fund | 727,258 | 9,497,992 | ||||||
RidgeWorth Select Large Cap Growth Stock Fund* | 275,025 | 7,400,915 | ||||||
RidgeWorth Small Cap Growth Stock Fund* | 246,656 | 3,862,625 | ||||||
RidgeWorth Small Cap Value Equity Fund | 252,549 | 3,901,875 | ||||||
|
| |||||||
Total Equity Funds | 76,513,152 | |||||||
|
| |||||||
Fixed Income Funds 44.8%(a) | ||||||||
RidgeWorth Corporate Bond Fund | 19,956 | 185,588 | ||||||
RidgeWorth High Income Fund | 816,510 | 5,976,854 | ||||||
RidgeWorth Intermediate Bond Fund | 129,271 | 1,332,785 | ||||||
RidgeWorth Seix Floating Rate High Income Fund | 362,831 | 3,287,250 | ||||||
RidgeWorth Seix High Yield Fund | 579,165 | 5,942,234 | ||||||
RidgeWorth Total Return Bond Fund | 5,397,450 | 58,238,486 | ||||||
RidgeWorth U.S. Government Securities Ultra-Short Bond Fund | 281,047 | 2,858,252 | ||||||
|
| |||||||
Total Fixed Income Funds | 77,821,449 | |||||||
|
| |||||||
Exchange Traded Funds 10.2% | ||||||||
Consumer Discretionary Select Sector SPDR Fund | 4,850 | 256,856 | ||||||
Consumer Staples Select Sector SPDR Fund | 4,368 | 173,672 | ||||||
Energy Select Sector SPDR Fund | 3,922 | 311,093 | ||||||
Financial Select Sector SPDR Fund | 20,417 | 371,385 | ||||||
Health Care Select Sector SPDR Fund | 7,729 | 355,148 | ||||||
| Shares | Value($) | |||||||
Exchange Traded Funds—continued |
| |||||||
Industrial Select Sector SPDR Fund | 6,535 | 272,706 | ||||||
iShares Barclays 20+ Year Treasury Bond Fund | 20,809 | 2,450,468 | ||||||
iShares Barclays U.S. Treasury Inflation Protected Securities Fund | 1,274 | 154,472 | ||||||
iShares Dow Jones U.S. Real Estate Index Fund | 25,995 | 1,806,133 | ||||||
iShares MSCI Emerging Markets Index Fund | 53,535 | 2,290,227 | ||||||
iShares Russell 2000 Index Fund | 3,194 | 301,066 | ||||||
iShares Core S&P 500 Fund | 46,835 | 7,368,550 | ||||||
Market Vectors Gold Miners Fund | 24,968 | 945,039 | ||||||
Materials Select Sector SPDR Fund | 2,509 | 98,303 | ||||||
Technology Select Sector SPDR Fund | 18,260 | 552,730 | ||||||
Utilities Select Sector SPDR Fund | 517 | 20,189 | ||||||
|
| |||||||
Total Exchange Traded Funds | 17,728,037 | |||||||
|
| |||||||
Money Market Fund 1.1% | ||||||||
State Street Institutional Treasury Money Market Fund, Institutional Class, 0.00%(b) | 1,864,534 | 1,864,534 | ||||||
|
| |||||||
Total Money Market Fund | 1,864,534 | |||||||
|
| |||||||
Total Investments | 173,927,172 | |||||||
Liabilities in excess of other | (286,510 | ) | ||||||
|
| |||||||
Net Assets — 100.0% | $ | 173,640,662 | ||||||
|
| |||||||
| * | Non-income producing security. |
| (a) | Affiliated investment. Investment is in each Fund’s I Shares. |
| (b) | Rate disclosed, the 7 day net yield, is as of March 31, 2013. |
Investment Abbreviations
| MSCI | — | Morgan Stanley Capital International | ||
| SPDR | — | Standard & Poor’s Depositary Receipt |
See Notes to Financial Statements.
58
STATEMENTS OF ASSETS AND LIABILITIES
RIDGEWORTH FUNDS March 31, 2013
| Aggressive Growth Stock Fund | International Equity Fund | International Equity Index Fund | Large Cap Growth Stock Fund | Large Cap Value Equity Fund | ||||||||||||||||
Assets: | ||||||||||||||||||||
Total Investments, at Cost | $8,989,909 | $242,202,536 | $140,027,375 | $187,955,468 | $1,385,693,388 | |||||||||||||||
|
|
|
|
|
|
|
|
|
| |||||||||||
Total Investments, at Value* | $19,479,425 | $284,148,373 | $234,412,170 | $257,677,190 | $1,748,719,385 | |||||||||||||||
Cash | — | — | — | 28,233 | 176,039 | |||||||||||||||
Dividends Receivable | 1,888 | 1,176,342 | 742,997 | 137,475 | 3,174,620 | |||||||||||||||
Securities Lending Income Receivable | — | 32,036 | 9,150 | 994 | 437 | |||||||||||||||
Foreign Currency, at Value (Cost $—, $3,018,670, $90,309, $— and $—, respectively) | — | 3,025,803 | 90,344 | — | — | |||||||||||||||
Receivable for Capital Shares Issued | 19,822 | 10,367 | 45,584 | 50,990 | 1,341,546 | |||||||||||||||
Receivable for Investment Securities Sold | 247,775 | 781,551 | 217,128 | 1,282,001 | — | |||||||||||||||
Reclaims Receivable | — | 169,138 | 143,450 | — | — | |||||||||||||||
Receivable from Investment Adviser | — | — | 70,056 | 6,604 | — | |||||||||||||||
Prepaid Expenses and Other Assets | 13,878 | 17,957 | 16,969 | 81,458 | 45,097 | |||||||||||||||
|
|
|
|
|
|
|
|
|
| |||||||||||
Total Assets | 19,762,788 | 289,361,567 | 235,747,848 | 259,264,945 | 1,753,457,124 | |||||||||||||||
|
|
|
|
|
|
|
|
|
| |||||||||||
Liabilities: | ||||||||||||||||||||
Payable for Investment Securities Purchased | 79,992 | 1,257,239 | — | 1,547,061 | — | |||||||||||||||
Payable for Capital Shares Redeemed | 215,683 | 428,529 | 91,240 | 195,021 | 2,187,793 | |||||||||||||||
Payable Upon Return of Securities Loaned | — | 10,253,825 | 9,873,673 | 1,226,275 | 2,876,625 | |||||||||||||||
Investment Advisory Fees Payable | 14,130 | 214,780 | 87,668 | 132,404 | 1,003,106 | |||||||||||||||
Compliance and Fund Services Fees Payable | 1,137 | 4,807 | 4,982 | 5,135 | 30,705 | |||||||||||||||
Distribution and Service Fees Payable | 909 | 1,206 | 672 | 41,112 | 86,455 | |||||||||||||||
Other Accrued Expenses | 31,146 | 83,827 | 229,660 | 95,799 | 766,986 | |||||||||||||||
|
|
|
|
|
|
|
|
|
| |||||||||||
Total Liabilities | 342,997 | 12,244,213 | 10,287,895 | 3,242,807 | 6,951,670 | |||||||||||||||
|
|
|
|
|
|
|
|
|
| |||||||||||
Total Net Assets | $19,419,791 | $277,117,354 | $225,459,953 | $256,022,138 | $1,746,505,454 | |||||||||||||||
|
|
|
|
|
|
|
|
|
| |||||||||||
Net Assets Consist of: | ||||||||||||||||||||
Capital | $12,574,997 | $529,038,550 | $120,648,942 | $174,831,478 | $1,308,429,205 | |||||||||||||||
Accumulated Net Investment Income (Loss) | (95,143 | ) | 1,158,581 | (1,530,587 | ) | 7,574 | 5,925,183 | |||||||||||||
Accumulated Net Realized Gain (Loss) from Investments and Foreign Currency Transactions | (3,549,579 | ) | (295,043,044 | ) | 11,961,911 | 11,461,364 | 69,125,069 | |||||||||||||
Net Unrealized Appreciation on Investments and Foreign Currencies | 10,489,516 | 41,963,267 | 94,379,687 | 69,721,722 | 363,025,997 | |||||||||||||||
|
|
|
|
|
|
|
|
|
| |||||||||||
Net Assets | $19,419,791 | $277,117,354 | $225,459,953 | $256,022,138 | $1,746,505,454 | |||||||||||||||
|
|
|
|
|
|
|
|
|
| |||||||||||
Net Assets: | ||||||||||||||||||||
I Shares | $15,839,912 | $272,552,198 | $222,839,031 | $167,886,606 | $1,442,154,365 | |||||||||||||||
A Shares | 3,579,879 | 4,565,156 | 2,620,922 | 56,510,759 | 287,956,799 | |||||||||||||||
C Shares | — | — | — | 31,624,773 | 16,394,290 | |||||||||||||||
Shares Outstanding (unlimited number of shares authorized, no par value) | ||||||||||||||||||||
I Shares | 1,015,151 | 23,424,031 | 18,514,224 | 20,209,072 | 91,535,832 | |||||||||||||||
A Shares | 236,204 | 396,676 | 219,510 | 7,775,253 | 18,375,562 | |||||||||||||||
C Shares | — | — | — | 5,540,033 | 1,063,051 | |||||||||||||||
Net Asset Value and Redemption Price Per Share: | ||||||||||||||||||||
I Shares | $15.60 | $11.64 | $12.04 | $8.31 | $15.76 | |||||||||||||||
A Shares | 15.16 | 11.51 | 11.94 | 7.27 | 15.67 | |||||||||||||||
C Shares(a) | — | — | — | 5.71 | 15.42 | |||||||||||||||
Offering Price Per Share (100%/(100%-maximum sales charge x net asset value) of net asset value adjusted to the nearest cent): | ||||||||||||||||||||
A Shares | $16.08 | $12.21 | $12.67 | $7.71 | $16.63 | |||||||||||||||
Maximum Sales Charge — A Shares | 5.75 | % | 5.75 | % | 5.75 | % | 5.75 | % | 5.75 | % | ||||||||||
| * | Investments include securities on loan of $—, $9,880,422, $9,463,727, $1,199,306 and $2,818,450, respectively. |
| (a) | Redemption price per share varies based on length of time shares are held. |
See Notes to Financial Statements.
59
STATEMENTS OF ASSETS AND LIABILITIES
RIDGEWORTH FUNDS March 31, 2013
| Mid-Cap Value Equity Fund | Select Large Cap Growth Stock Fund | Small Cap Growth Stock Fund | Small Cap Value Equity Fund | |||||||||||||
Assets: | ||||||||||||||||
Total Investments, at Cost | $2,427,039,646 | $27,781,051 | $145,045,369 | $1,298,681,394 | ||||||||||||
|
|
|
|
|
|
|
| |||||||||
Total Investments, at Value* | $2,740,361,360 | $35,342,134 | $186,156,501 | $1,626,497,957 | ||||||||||||
Cash | 1,104,913 | 6,294 | 17,494 | 425,779 | ||||||||||||
Dividends Receivable | 4,163,096 | 21,227 | 9,677 | 1,978,937 | ||||||||||||
Securities Lending Income Receivable | 16,756 | 274 | 18,413 | — | ||||||||||||
Receivable for Capital Shares Issued | 3,604,331 | 281 | 216,450 | 1,591,796 | ||||||||||||
Receivable for Investment Securities Sold | 29,585,079 | — | 2,802,875 | — | ||||||||||||
Reclaims Receivable | — | — | — | 126,090 | ||||||||||||
Prepaid Expenses and Other Assets | 56,107 | 30,339 | 25,567 | 56,181 | ||||||||||||
|
|
|
|
|
|
|
| |||||||||
Total Assets | 2,778,891,642 | 35,400,549 | 189,246,977 | 1,630,676,740 | ||||||||||||
|
|
|
|
|
|
|
| |||||||||
Liabilities: | ||||||||||||||||
Payable for Investment Securities Purchased | 9,405,146 | 430,860 | — | — | ||||||||||||
Payable for Capital Shares Redeemed | 5,150,601 | 406,410 | 503,317 | 2,493,058 | ||||||||||||
Payable Upon Return of Securities Loaned | 48,345,725 | 257,450 | 18,787,977 | — | ||||||||||||
Investment Advisory Fees Payable | 1,573,465 | 21,388 | 121,021 | 1,101,493 | ||||||||||||
Compliance and Fund Services Fees Payable | 41,790 | 634 | 3,926 | 26,279 | ||||||||||||
Distribution and Service Fees Payable | 168,158 | 11,791 | 8,246 | 76,802 | ||||||||||||
Other Accrued Expenses | 1,722,466 | 18,828 | 165,460 | 1,058,395 | ||||||||||||
|
|
|
|
|
|
|
| |||||||||
Total Liabilities | 66,407,351 | 1,147,361 | 19,589,947 | 4,756,027 | ||||||||||||
|
|
|
|
|
|
|
| |||||||||
Total Net Assets | $2,712,484,291 | $34,253,188 | $169,657,030 | $1,625,920,713 | ||||||||||||
|
|
|
|
|
|
|
| |||||||||
Net Assets Consist of: | ||||||||||||||||
Capital | $2,242,601,522 | $24,917,614 | $123,459,803 | $1,266,523,766 | ||||||||||||
Accumulated Net Investment Income (Loss) | 5,566,759 | (37,016 | ) | — | — | |||||||||||
Accumulated Net Realized Gain from Investments and Foreign Currency Transactions | 150,994,296 | 1,811,507 | 5,086,095 | 31,580,205 | ||||||||||||
Net Unrealized Appreciation on Investments and Foreign Currencies | 313,321,714 | 7,561,083 | 41,111,132 | 327,816,742 | ||||||||||||
|
|
|
|
|
|
|
| |||||||||
Net Assets | $2,712,484,291 | $34,253,188 | $169,657,030 | $1,625,920,713 | ||||||||||||
|
|
|
|
|
|
|
| |||||||||
Net Assets: | ||||||||||||||||
I Shares | $2,168,210,366 | $19,813,254 | $152,674,017 | $1,408,597,115 | ||||||||||||
A Shares | 490,381,279 | 765,309 | 10,225,887 | 181,308,445 | ||||||||||||
C Shares | 53,892,646 | 13,674,625 | 6,757,126 | 36,015,153 | ||||||||||||
Shares Outstanding (unlimited number of shares authorized, no par value) | ||||||||||||||||
I Shares | 165,999,174 | 736,238 | 9,748,617 | 91,154,587 | ||||||||||||
A Shares | 37,851,952 | 29,192 | 707,397 | 11,937,229 | ||||||||||||
C Shares | 4,219,448 | 604,078 | 574,323 | 2,488,432 | ||||||||||||
Net Asset Value and Redemption Price Per Share: | ||||||||||||||||
I Shares | $13.06 | $26.91 | $15.66 | $15.45 | ||||||||||||
A Shares | 12.96 | 26.22 | 14.46 | 15.19 | ||||||||||||
C Shares(a) | 12.77 | 22.64 | 11.77 | 14.47 | ||||||||||||
Offering Price Per Share (100%/(100%-maximum sales charge x net asset value) of net asset value adjusted to the nearest cent): | ||||||||||||||||
A Shares | $13.75 | $27.82 | $15.34 | $16.12 | ||||||||||||
Maximum Sales Charge — A Shares | 5.75 | % | 5.75 | % | 5.75 | % | 5.75 | % | ||||||||
| * | Investments include securities on loan of $47,183,569, $251,788, $18,271,783 and $—, respectively. |
| (a) | Redemption price per share varies based on length of time shares are held. |
See Notes to Financial Statements.
60
STATEMENTS OF ASSETS AND LIABILITIES
RIDGEWORTH FUNDS March 31, 2013
| Aggressive Growth Allocation Strategy | Conservative Allocation Strategy | Growth Allocation Strategy | Moderate Allocation Strategy | |||||||||||||
Assets: | ||||||||||||||||
Total Investments, at Cost | $20,686,498 | $57,628,486 | $59,194,156 | $159,358,367 | ||||||||||||
|
|
|
|
|
|
|
| |||||||||
Investments, at Value | $3,628,277 | $5,161,172 | $9,260,336 | $19,592,571 | ||||||||||||
Investments in Affiliates, at Value | 19,811,774 | 54,643,128 | 57,637,397 | 154,334,601 | ||||||||||||
|
|
|
|
|
|
|
| |||||||||
Total Investments | 23,440,051 | 59,804,300 | 66,897,733 | 173,927,172 | ||||||||||||
|
|
|
|
|
|
|
| |||||||||
Dividends Receivable | 17,608 | 77,422 | 57,388 | 199,867 | ||||||||||||
Receivable for Capital Shares Issued | 8,066 | 151,928 | 29,806 | 83,116 | ||||||||||||
Receivable for Investment Securities Sold | — | — | — | 4,017,700 | ||||||||||||
Receivable from Investment Adviser | 11,273 | 3,975 | 6,804 | — | ||||||||||||
Prepaid Expenses and Other Assets | 20,027 | 22,965 | 21,855 | 30,217 | ||||||||||||
|
|
|
|
|
|
|
| |||||||||
Total Assets | 23,497,025 | 60,060,590 | 67,013,586 | 178,258,072 | ||||||||||||
|
|
|
|
|
|
|
| |||||||||
Liabilities: | ||||||||||||||||
Payable for Investment Securities Purchased | 6,760 | 67,661 | 32,373 | 146,057 | ||||||||||||
Payable for Capital Shares Redeemed | 63,461 | 203,367 | 94,735 | 4,283,536 | ||||||||||||
Investment Advisory Fees Payable | 1,975 | 5,098 | 5,637 | 15,038 | ||||||||||||
Compliance and Fund Services Fees Payable | 384 | 1,057 | 1,124 | 2,980 | ||||||||||||
Distribution and Service Fees Payable | 1,671 | 17,507 | 4,536 | 16,980 | ||||||||||||
Other Accrued Expenses | 31,689 | 28,449 | 75,769 | 152,819 | ||||||||||||
|
|
|
|
|
|
|
| |||||||||
Total Liabilities | 105,940 | 323,139 | 214,174 | 4,617,410 | ||||||||||||
|
|
|
|
|
|
|
| |||||||||
Total Net Assets | $23,391,085 | $59,737,451 | $66,799,412 | $173,640,662 | ||||||||||||
|
|
|
|
|
|
|
| |||||||||
Net Assets Consist of: | ||||||||||||||||
Capital | $19,104,066 | $55,441,847 | $54,633,702 | $150,027,037 | ||||||||||||
Accumulated Net Investment Income | 5,342 | 165,131 | 85,158 | 435,223 | ||||||||||||
Accumulated Net Realized Gain from Investments and Foreign Currency Transactions | 1,528,124 | 1,954,659 | 4,376,975 | 8,609,597 | ||||||||||||
Net Unrealized Appreciation on Investments and Foreign Currencies | 2,753,553 | 2,175,814 | 7,703,577 | 14,568,805 | ||||||||||||
|
|
|
|
|
|
|
| |||||||||
Net Assets | $23,391,085 | $59,737,451 | $66,799,412 | $173,640,662 | ||||||||||||
|
|
|
|
|
|
|
| |||||||||
Net Assets: | ||||||||||||||||
I Shares | $18,577,323 | $27,387,419 | $55,221,675 | $139,912,381 | ||||||||||||
A Shares | 4,110,069 | 16,939,910 | 8,975,303 | 19,622,484 | ||||||||||||
C Shares | 703,693 | 15,410,122 | 2,602,434 | 14,105,797 | ||||||||||||
Shares Outstanding (unlimited number of shares authorized, no par value) | ||||||||||||||||
I Shares | 2,075,956 | 2,183,823 | 4,896,814 | 12,597,422 | ||||||||||||
A Shares | 463,014 | 1,351,984 | 798,935 | 1,770,814 | ||||||||||||
C Shares | 80,932 | 1,241,045 | 234,924 | 1,281,920 | ||||||||||||
Net Asset Value and Redemption Price Per Share: | ||||||||||||||||
I Shares | $8.95 | $12.54 | $11.28 | $11.11 | ||||||||||||
A Shares | 8.88 | 12.53 | 11.23 | 11.08 | ||||||||||||
C Shares(a) | 8.69 | 12.42 | 11.08 | 11.00 | ||||||||||||
Offering Price Per Share (100%/(100%-maximum sales charge x net asset value) of net asset value adjusted to the nearest cent): | ||||||||||||||||
A Shares | $9.42 | $13.15 | $11.92 | $11.76 | ||||||||||||
Maximum Sales Charge — A Shares | 5.75 | % | 4.75 | % | 5.75 | % | 5.75 | % | ||||||||
| (a) | Redemption price per share varies based on length of time shares are held. |
See Notes to Financial Statements.
61
RIDGEWORTH FUNDS For the Year Ended March 31, 2013
| Aggressive Growth Stock Fund | International Equity Fund | International Equity Index Fund | Large Cap Growth Stock Fund | Large Cap Value Equity Fund | ||||||||||||||||
Investment Income: | ||||||||||||||||||||
Interest Income | $— | $653 | $2,282 | $— | $— | |||||||||||||||
Dividend Income | 126,779 | 8,681,269 | 11,039,690 | 3,125,882 | 48,119,008 | |||||||||||||||
Net Income from Securities Lending | 20,694 | 314,223 | 476,184 | 8,052 | 32,358 | |||||||||||||||
Less: Foreign Taxes Withheld | — | (800,003 | ) | (1,015,650 | ) | (9,150 | ) | (31,848 | ) | |||||||||||
|
|
|
|
|
|
|
|
|
| |||||||||||
Total Investment Income | 147,473 | 8,196,142 | 10,502,506 | 3,124,784 | 48,119,518 | |||||||||||||||
|
|
|
|
|
|
|
|
|
| |||||||||||
Expenses: | ||||||||||||||||||||
Investment Advisory Fees | 627,923 | 2,547,920 | 1,391,805 | 2,134,961 | 12,675,718 | |||||||||||||||
Administration Fees | 5,995 | 23,707 | 27,109 | 24,260 | 166,489 | |||||||||||||||
Fund Accounting Fees | 7,227 | 48,037 | 57,426 | 26,635 | 177,525 | |||||||||||||||
Transfer Agency Fees | 30,211 | 15,665 | 14,219 | 101,973 | 138,035 | |||||||||||||||
Compliance & Fund Services Fees | 5,355 | 18,184 | 21,274 | 19,027 | 127,890 | |||||||||||||||
Distribution and Service Fees — A Shares | 14,520 | 14,976 | 7,212 | 129,752 | 754,389 | |||||||||||||||
Distribution and Service Fees — C Shares | — | — | — | 169,819 | 156,638 | |||||||||||||||
Shareholder Servicing Fees — I Shares | 36,592 | 14,771 | 196,388 | 51,240 | 2,136,004 | |||||||||||||||
Shareholder Servicing Fees — A Shares | 3,387 | 1,320 | 763 | 703 | 542,806 | |||||||||||||||
Custodian Fees | 21,263 | 157,301 | 421,298 | 16,429 | 43,731 | |||||||||||||||
Printing Fees | 6,308 | 11,112 | 9,790 | 12,335 | 78,529 | |||||||||||||||
Registration Fees | 37,781 | 31,610 | 33,254 | 43,145 | 58,924 | |||||||||||||||
Trustee Fees | 3,485 | 12,288 | 14,439 | 13,226 | 87,371 | |||||||||||||||
Other Fees | 12,091 | 41,077 | 74,668 | 30,130 | 147,277 | |||||||||||||||
|
|
|
|
|
|
|
|
|
| |||||||||||
Total Expenses | 812,138 | 2,937,968 | 2,269,645 | 2,773,635 | 17,291,326 | |||||||||||||||
Less: Investment Advisory Fees Waived/Expenses Reimbursed | (7,685 | ) | — | (83,256 | ) | (373 | ) | (275,540 | ) | |||||||||||
Less: Custodian Credits (Note 3) | — | — | — | — | (54 | ) | ||||||||||||||
|
|
|
|
|
|
|
|
|
| |||||||||||
Net Expenses | 804,453 | 2,937,968 | 2,186,389 | 2,773,262 | 17,015,732 | |||||||||||||||
|
|
|
|
|
|
|
|
|
| |||||||||||
Net Investment Income (Loss) | (656,980 | ) | 5,258,174 | 8,316,117 | 351,522 | 31,103,786 | ||||||||||||||
|
|
|
|
|
|
|
|
|
| |||||||||||
Net Realized and Unrealized Gain (Loss) on Investments and Foreign Currencies: | ||||||||||||||||||||
Net Realized Gain from: | ||||||||||||||||||||
Investment and Foreign Currency Transactions | 26,221,386 | 4,518,774 | 32,128,718 | 86,033,018 | 154,363,603 | |||||||||||||||
Net Change in Unrealized Appreciation (Depreciation) on: | ||||||||||||||||||||
Investments and Foreign Currencies | (29,063,146 | ) | 16,755,641 | (15,314,641 | ) | (79,684,004 | ) | 51,750,179 | ||||||||||||
|
|
|
|
|
|
|
|
|
| |||||||||||
Net Realized and Unrealized Gain (Loss) on Investments and Foreign Currencies | (2,841,760 | ) | 21,274,415 | 16,814,077 | 6,349,014 | 206,113,782 | ||||||||||||||
|
|
|
|
|
|
|
|
|
| |||||||||||
Change in Net Assets from Operations | $(3,498,740 | ) | $26,532,589 | $25,130,194 | $6,700,536 | $237,217,568 | ||||||||||||||
|
|
|
|
|
|
|
|
|
| |||||||||||
See Notes to Financial Statements.
62
STATEMENTS OF OPERATIONS
RIDGEWORTH FUNDS For the Year Ended March 31, 2013
| Mid-Cap Value Equity Fund | Select Large Cap Growth Stock Fund | Small Cap Growth Stock Fund | Small Cap Value Equity Fund | |||||||||||||
Investment Income: | ||||||||||||||||
Dividend Income | $51,987,230 | $450,788 | $1,094,261 | $38,266,524 | ||||||||||||
Net Income from Securities Lending | 3,429,787 | 2,059 | 581,903 | — | ||||||||||||
Less: Foreign Taxes Withheld | (82,679 | ) | (2,099 | ) | — | (243,566 | ) | |||||||||
|
|
|
|
|
|
|
| |||||||||
Total Investment Income | 55,334,338 | 450,748 | 1,676,164 | 38,022,958 | ||||||||||||
|
|
|
|
|
|
|
| |||||||||
Expenses: | ||||||||||||||||
Investment Advisory Fees | 17,008,118 | 308,592 | 2,288,677 | 12,972,151 | ||||||||||||
Administration Fees | 200,166 | 3,720 | 21,737 | 131,223 | ||||||||||||
Fund Accounting Fees | 204,139 | 3,894 | 23,936 | 136,614 | ||||||||||||
Transfer Agency Fees | 734,155 | 30,091 | 43,926 | 339,802 | ||||||||||||
Compliance & Fund Services Fees | 151,830 | 2,851 | 17,307 | 100,090 | ||||||||||||
Distribution and Service Fees — A Shares | 1,282,383 | 2,270 | 28,545 | 505,713 | ||||||||||||
Distribution and Service Fees — C Shares | 440,764 | 143,993 | 69,009 | 358,164 | ||||||||||||
Shareholder Servicing Fees — I Shares | 3,688,119 | 8,226 | 352,839 | 2,588,085 | ||||||||||||
Shareholder Servicing Fees — A Shares | 923,522 | 100 | 2,466 | 347,897 | ||||||||||||
Custodian Fees | 54,481 | 11,432 | 22,338 | 61,314 | ||||||||||||
Printing Fees | 235,140 | 4,757 | 10,260 | 227,526 | ||||||||||||
Registration Fees | 101,141 | 41,418 | 42,145 | 91,539 | ||||||||||||
Trustee Fees | 102,532 | 1,975 | 11,796 | 67,585 | ||||||||||||
Other Fees | 187,221 | 9,449 | 26,189 | 120,323 | ||||||||||||
|
|
|
|
|
|
|
| |||||||||
Total Expenses | 25,313,711 | 572,768 | 2,961,170 | 18,048,026 | ||||||||||||
Less: Investment Advisory Fees Waived/Expenses Reimbursed | (174,546 | ) | (71 | ) | (24 | ) | (2,051 | ) | ||||||||
Less: Custodian Credits (Note 3) | (131 | ) | — | (14 | ) | (148 | ) | |||||||||
|
|
|
|
|
|
|
| |||||||||
Net Expenses | 25,139,034 | 572,697 | 2,961,132 | 18,045,827 | ||||||||||||
|
|
|
|
|
|
|
| |||||||||
Net Investment Income (Loss) | 30,195,304 | (121,949 | ) | (1,284,968 | ) | 19,977,131 | ||||||||||
|
|
|
|
|
|
|
| |||||||||
Net Realized and Unrealized Gain (Loss) on Investments and Foreign Currencies: | ||||||||||||||||
Net Realized Gain from: | ||||||||||||||||
Investment and Foreign Currency Transactions | 217,650,368 | 6,410,373 | 51,688,731 | 28,098,118 | ||||||||||||
Net Change in Unrealized Appreciation (Depreciation) on: | ||||||||||||||||
Investments and Foreign Currencies | 166,437,032 | (6,845,136 | ) | (23,401,388 | ) | 198,175,851 | ||||||||||
|
|
|
|
|
|
|
| |||||||||
Net Realized and Unrealized Gain (Loss) on Investments and Foreign Currencies | 384,087,400 | (434,763 | ) | 28,287,343 | 226,273,969 | |||||||||||
|
|
|
|
|
|
|
| |||||||||
Change in Net Assets from Operations | $414,282,704 | $(556,712 | ) | $27,002,375 | $246,251,100 | |||||||||||
|
|
|
|
|
|
|
| |||||||||
See Notes to Financial Statements.
63
STATEMENTS OF OPERATIONS
RIDGEWORTH FUNDS For the Year Ended March 31, 2013
| Aggressive Growth Allocation Strategy | Conservative Allocation Strategy | Growth Allocation Strategy | Moderate Allocation Strategy | |||||||||||||
Investment Income: | ||||||||||||||||
Dividend Income | $74,454 | $99,445 | $196,694 | $403,242 | ||||||||||||
Dividend Income from Affiliated Investment Companies | 193,109 | 1,063,158 | 785,674 | 2,670,913 | ||||||||||||
|
|
|
|
|
|
|
| |||||||||
Total Investment Income | 267,563 | 1,162,603 | 982,368 | 3,074,155 | ||||||||||||
|
|
|
|
|
|
|
| |||||||||
Expenses: | ||||||||||||||||
Investment Advisory Fees | 22,997 | 59,025 | 68,104 | 173,682 | ||||||||||||
Administration Fees | 2,093 | 5,371 | 6,197 | 15,805 | ||||||||||||
Fund Accounting Fees | 20,000 | 20,000 | 20,000 | 20,000 | ||||||||||||
Transfer Agency Fees | 15,933 | 38,638 | 17,573 | 45,113 | ||||||||||||
Compliance & Fund Services Fees | 1,619 | 4,101 | 4,780 | 12,060 | ||||||||||||
Distribution and Service Fees — A Shares | 12,916 | 60,883 | 30,235 | 59,244 | ||||||||||||
Distribution and Service Fees — C Shares | 7,536 | 140,021 | 25,924 | 141,823 | ||||||||||||
Shareholder Servicing Fees — I Shares | 45,081 | 10,549 | 148,808 | 307,315 | ||||||||||||
Shareholder Servicing Fees — A Shares | 1,885 | 7,328 | 6,393 | 15,674 | ||||||||||||
Custodian Fees | 9,712 | 9,729 | 10,266 | 11,193 | ||||||||||||
Printing Fees | 3,279 | 7,538 | 5,150 | 12,150 | ||||||||||||
Registration Fees | 43,937 | 48,353 | 44,864 | 43,751 | ||||||||||||
Trustee Fees | 1,091 | 2,771 | 3,236 | 8,150 | ||||||||||||
Other Fees | 7,957 | 10,217 | 10,994 | 18,085 | ||||||||||||
|
|
|
|
|
|
|
| |||||||||
Total Expenses | 196,036 | 424,524 | 402,524 | 884,045 | ||||||||||||
Less: Investment Advisory Fees Waived/Expenses Reimbursed | (87,752 | ) | (65,489 | ) | (86,203 | ) | (36,646 | ) | ||||||||
|
|
|
|
|
|
|
| |||||||||
Net Expenses | 108,284 | 359,035 | 316,321 | 847,399 | ||||||||||||
|
|
|
|
|
|
|
| |||||||||
Net Investment Income (Loss) | 159,279 | 803,568 | 666,047 | 2,226,756 | ||||||||||||
|
|
|
|
|
|
|
| |||||||||
Net Realized and Unrealized Gain (Loss) on Investments: | ||||||||||||||||
Net Realized Gain (Loss) from: | ||||||||||||||||
Investment and Foreign Currency Transactions | 533,759 | (563,716 | ) | 509,243 | 193,025 | |||||||||||
Capital Gain Received from Investments in Affiliated Investment Companies | 2,398,661 | 3,290,127 | 6,241,378 | 12,906,187 | ||||||||||||
Net Change in Unrealized Depreciation on: | ||||||||||||||||
Investments and Foreign Currencies | (1,765,997 | ) | (574,940 | ) | (2,763,305 | ) | (4,143,403 | ) | ||||||||
|
|
|
|
|
|
|
| |||||||||
Net Realized and Unrealized Gain on Investments and Foreign Currencies | 1,166,423 | 2,151,471 | 3,987,316 | 8,955,809 | ||||||||||||
|
|
|
|
|
|
|
| |||||||||
Change in Net Assets from Operations | $1,325,702 | $2,955,039 | $4,653,363 | $11,182,565 | ||||||||||||
|
|
|
|
|
|
|
| |||||||||
See Notes to Financial Statements.
64
STATEMENTS OF CHANGES IN NET ASSETS
RIDGEWORTH FUNDS For the Periods Indicated
| Aggressive Growth Stock Fund | International Equity Fund | International Equity Index Fund | ||||||||||||||||||||||
| 04/01/12- 03/31/13 | 04/01/11- 03/31/12 | 04/01/12- 03/31/13 | 04/01/11- 03/31/12 | 04/01/12- 03/31/13 | 04/01/11- 03/31/12 | |||||||||||||||||||
Operations: | ||||||||||||||||||||||||
Net Investment Income (Loss) | $ | (656,980 | ) | $ | (1,065,649 | ) | $ | 5,258,174 | $ | 5,491,214 | $ | 8,316,117 | $ | 12,830,572 | ||||||||||
Net Realized Gain | 26,221,386 | 12,724,489 | 4,518,774 | 7,105,640 | 32,128,718 | 35,204,059 | ||||||||||||||||||
Net Change in Unrealized Appreciation (Depreciation) | (29,063,146 | ) | (21,443,486 | ) | 16,755,641 | (25,565,671 | ) | (15,314,641 | ) | (92,859,978 | ) | |||||||||||||
|
|
|
|
|
|
|
|
|
|
|
| |||||||||||||
Change in Net Assets from Operations | (3,498,740 | ) | (9,784,646 | ) | 26,532,589 | (12,968,817 | ) | 25,130,194 | (44,825,347 | ) | ||||||||||||||
|
|
|
|
|
|
|
|
|
|
|
| |||||||||||||
Dividends and Distributions to Shareholders: | ||||||||||||||||||||||||
Net Investment Income: | ||||||||||||||||||||||||
I Shares | — | — | (4,944,920 | ) | (5,045,919 | ) | (10,474,532 | ) | (14,901,009 | ) | ||||||||||||||
A Shares | — | — | (80,358 | ) | (110,840 | ) | (78,605 | ) | (94,609 | ) | ||||||||||||||
Net Realized Gains: | ||||||||||||||||||||||||
I Shares | (1,864,677 | ) | — | — | — | (6,082,841 | ) | — | ||||||||||||||||
A Shares | (144,714 | ) | — | — | — | (49,337 | ) | — | ||||||||||||||||
|
|
|
|
|
|
|
|
|
|
|
| |||||||||||||
Total Dividends and Distributions | (2,009,391 | ) | — | (5,025,278 | ) | (5,156,759 | ) | (16,685,315 | ) | (14,995,618 | ) | |||||||||||||
|
|
|
|
|
|
|
|
|
|
|
| |||||||||||||
Change in Net Assets from Capital Transactions | (67,006,289 | ) | (36,442,563 | ) | (11,450,962 | ) | 25,707,419 | (125,277,294 | ) | (80,568,430 | ) | |||||||||||||
|
|
|
|
|
|
|
|
|
|
|
| |||||||||||||
Change in Net Assets | (72,514,420 | ) | (46,227,209 | ) | 10,056,349 | 7,581,843 | (116,832,415 | ) | (140,389,395 | ) | ||||||||||||||
|
|
|
|
|
|
|
|
|
|
|
| |||||||||||||
Net Assets: | ||||||||||||||||||||||||
Beginning of Period | 91,934,211 | 138,161,420 | 267,061,005 | 259,479,162 | 342,292,368 | 482,681,763 | ||||||||||||||||||
|
|
|
|
|
|
|
|
|
|
|
| |||||||||||||
End of Period | $ | 19,419,791 | $ | 91,934,211 | $ | 277,117,354 | $ | 267,061,005 | $ | 225,459,953 | $ | 342,292,368 | ||||||||||||
|
|
|
|
|
|
|
|
|
|
|
| |||||||||||||
Accumulated Net Investment Income (Loss), End of Period | $ | (95,143 | ) | $ | (223,004 | ) | $ | 1,158,581 | $ | 1,010,397 | $ | (1,530,587 | ) | $ | (133,144 | ) | ||||||||
|
|
|
|
|
|
|
|
|
|
|
| |||||||||||||
See Notes to Financial Statements.
65
STATEMENTS OF CHANGES IN NET ASSETS (continued)
RIDGEWORTH FUNDS For the Periods Indicated
| Large Cap Growth Stock Fund | Large Cap Value Equity Fund | Mid-Cap Value Equity Fund | ||||||||||||||||||||||
| 04/01/12- 03/31/13 | 04/01/11- 03/31/12 | 04/01/12- 03/31/13 | 04/01/11- 03/31/12 | 04/01/12- 03/31/13 | 04/01/11- 03/31/12 | |||||||||||||||||||
Operations: | ||||||||||||||||||||||||
Net Investment Income (Loss) | $ | 351,522 | $ | (928,107 | ) | $ | 31,103,786 | $ | 29,894,827 | $ | 30,195,304 | $ | 30,594,776 | |||||||||||
Net Realized Gain (Loss) | 86,033,018 | 64,077,070 | 154,363,603 | (16,071,295 | ) | 217,650,368 | (71,339,425 | ) | ||||||||||||||||
Net Change in Unrealized Appreciation (Depreciation) | (79,684,004 | ) | (33,065,228 | ) | 51,750,179 | 114,627,191 | 166,437,032 | (24,071,656 | ) | |||||||||||||||
|
|
|
|
|
|
|
|
|
|
|
| |||||||||||||
Change in Net Assets from Operations | 6,700,536 | 30,083,735 | 237,217,568 | 128,450,723 | 414,282,704 | (64,816,305 | ) | |||||||||||||||||
|
|
|
|
|
|
|
|
|
|
|
| |||||||||||||
Dividends and Distributions to Shareholders: | ||||||||||||||||||||||||
Net Investment Income: | ||||||||||||||||||||||||
I Shares | (172,924 | ) | — | (22,686,220 | ) | (26,417,003 | ) | (20,301,518 | ) | (24,420,905 | ) | |||||||||||||
A Shares | — | — | (3,331,162 | ) | (2,211,917 | ) | (4,157,336 | ) | (4,738,614 | ) | ||||||||||||||
C Shares | — | — | (136,410 | ) | (102,279 | ) | (267,995 | ) | (209,525 | ) | ||||||||||||||
Net Realized Gains: | ||||||||||||||||||||||||
I Shares | (83,174,333 | ) | — | — | — | (4,946,664 | ) | (134,564,441 | ) | |||||||||||||||
A Shares | (19,396,131 | ) | — | — | — | (1,207,086 | ) | (34,877,118 | ) | |||||||||||||||
C Shares | (8,448,313 | ) | — | — | — | (128,159 | ) | (3,269,801 | ) | |||||||||||||||
|
|
|
|
|
|
|
|
|
|
|
| |||||||||||||
Total Dividends and Distributions | (111,191,701 | ) | — | (26,153,792 | ) | (28,731,199 | ) | (31,008,758 | ) | (202,080,404 | ) | |||||||||||||
|
|
|
|
|
|
|
|
|
|
|
| |||||||||||||
Change in Net Assets from Capital Transactions | 36,206,330 | (175,832,011 | ) | (700,801,676 | ) | 688,821,039 | 174,020,747 | 434,814,980 | ||||||||||||||||
|
|
|
|
|
|
|
|
|
|
|
| |||||||||||||
Change in Net Assets | (68,284,835 | ) | (145,748,276 | ) | (489,737,900 | ) | 788,540,563 | 557,294,693 | 167,918,271 | |||||||||||||||
|
|
|
|
|
|
|
|
|
|
|
| |||||||||||||
Net Assets: | ||||||||||||||||||||||||
Beginning of Period | 324,306,973 | 470,055,249 | 2,236,243,354 | 1,447,702,791 | 2,155,189,598 | 1,987,271,327 | ||||||||||||||||||
|
|
|
|
|
|
|
|
|
|
|
| |||||||||||||
End of Period | $ | 256,022,138 | $ | 324,306,973 | $ | 1,746,505,454 | $ | 2,236,243,354 | $ | 2,712,484,291 | $ | 2,155,189,598 | ||||||||||||
|
|
|
|
|
|
|
|
|
|
|
| |||||||||||||
Accumulated Net Investment Income (Loss), End of Period | $ | 7,574 | $ | (228,630 | ) | $ | 5,925,183 | $ | 1,136,349 | $ | 5,566,759 | $ | 939,982 | |||||||||||
|
|
|
|
|
|
|
|
|
|
|
| |||||||||||||
See Notes to Financial Statements.
66
STATEMENTS OF CHANGES IN NET ASSETS (continued)
RIDGEWORTH FUNDS For the Periods Indicated
| Select Large Cap Growth Stock Fund | Small Cap Growth Stock Fund | Small Cap Value Equity Fund | ||||||||||||||||||||||
| 04/01/12- 03/31/13 | 04/01/11- 03/31/12 | 04/01/12- 03/31/13 | 04/01/11- 03/31/12 | 04/01/12- 03/31/13 | 04/01/11- 03/31/12 | |||||||||||||||||||
Operations: | ||||||||||||||||||||||||
Net Investment Income (Loss) | $ | (121,949 | ) | $ | (245,626 | ) | $ | (1,284,968 | ) | $ | (2,337,801 | ) | $ | 19,977,131 | $ | 9,989,332 | ||||||||
Net Realized Gain | 6,410,373 | 15,888,479 | 51,688,731 | 51,132,665 | 28,098,118 | 83,216,802 | ||||||||||||||||||
Net Change in Unrealized Appreciation (Depreciation) | (6,845,136 | ) | (15,058,416 | ) | (23,401,388 | ) | (58,542,582 | ) | 198,175,851 | (67,407,464 | ) | |||||||||||||
|
|
|
|
|
|
|
|
|
|
|
| |||||||||||||
Change in Net Assets from Operations | (556,712 | ) | 584,437 | 27,002,375 | (9,747,718 | ) | 246,251,100 | 25,798,670 | ||||||||||||||||
|
|
|
|
|
|
|
|
|
|
|
| |||||||||||||
Dividends and Distributions to Shareholders: | ||||||||||||||||||||||||
Net Investment Income: | ||||||||||||||||||||||||
I Shares | — | — | — | — | (19,941,813 | ) | (8,676,320 | ) | ||||||||||||||||
A Shares | — | — | — | — | (2,324,205 | ) | (766,570 | ) | ||||||||||||||||
C Shares | — | — | — | — | (373,428 | ) | (54,101 | ) | ||||||||||||||||
Net Realized Gains: | ||||||||||||||||||||||||
I Shares | (5,021,063 | ) | (1,072,604 | ) | (47,793,289 | ) | — | (35,626,220 | ) | (51,278,812 | ) | |||||||||||||
A Shares | (160,162 | ) | (17,670 | ) | (2,175,730 | ) | — | (4,786,603 | ) | (6,993,709 | ) | |||||||||||||
C Shares | (3,312,715 | ) | (447,150 | ) | (1,768,606 | ) | — | (1,033,131 | ) | (1,734,291 | ) | |||||||||||||
|
|
|
|
|
|
|
|
|
|
|
| |||||||||||||
Total Dividends and Distributions | (8,493,940 | ) | (1,537,424 | ) | (51,737,625 | ) | — | (64,085,400 | ) | (69,503,803 | ) | |||||||||||||
|
|
|
|
|
|
|
|
|
|
|
| |||||||||||||
Change in Net Assets from Capital Transactions | (8,043,600 | ) | (47,318,677 | ) | (91,461,953 | ) | (134,668,157 | ) | 67,455,286 | 282,560,720 | ||||||||||||||
|
|
|
|
|
|
|
|
|
|
|
| |||||||||||||
Change in Net Assets | (17,094,252 | ) | (48,271,664 | ) | (116,197,203 | ) | (144,415,875 | ) | 249,620,986 | 238,855,587 | ||||||||||||||
|
|
|
|
|
|
|
|
|
|
|
| |||||||||||||
Net Assets: | ||||||||||||||||||||||||
Beginning of Period | 51,347,440 | 99,619,104 | 285,854,233 | 430,270,108 | 1,376,299,727 | 1,137,444,140 | ||||||||||||||||||
|
|
|
|
|
|
|
|
|
|
|
| |||||||||||||
End of Period | $ | 34,253,188 | $ | 51,347,440 | $ | 169,657,030 | $ | 285,854,233 | $ | 1,625,920,713 | $ | 1,376,299,727 | ||||||||||||
|
|
|
|
|
|
|
|
|
|
|
| |||||||||||||
Accumulated Net Investment Income (Loss), End of Period | $ | (37,016 | ) | $ | (64,435 | ) | $ | — | $ | (413,414 | ) | $ | — | $ | 529,817 | |||||||||
|
|
|
|
|
|
|
|
|
|
|
| |||||||||||||
See Notes to Financial Statements.
67
STATEMENTS OF CHANGES IN NET ASSETS (continued)
RIDGEWORTH FUNDS For the Periods Indicated
| Aggressive Growth Allocation Strategy | Conservative Allocation Strategy | |||||||||||||||
| 04/01/12- 03/31/13 | 04/01/11- 03/31/12 | 04/01/12- 03/31/13 | 04/01/11- 03/31/12 | |||||||||||||
Operations: | ||||||||||||||||
Net Investment Income | $ | 159,279 | $ | 225,879 | $ | 803,568 | $ | 723,326 | ||||||||
Net Realized Gain(a) | 2,932,420 | 817,896 | 2,726,411 | 1,230,143 | ||||||||||||
Net Change in Unrealized Appreciation (Depreciation)(a) | (1,765,997 | ) | (969,411 | ) | (574,940 | ) | 820,083 | |||||||||
|
|
|
|
|
|
|
| |||||||||
Change in Net Assets from Operations | 1,325,702 | 74,364 | 2,955,039 | 2,773,552 | ||||||||||||
|
|
|
|
|
|
|
| |||||||||
Dividends and Distributions to Shareholders: | ||||||||||||||||
Net Investment Income: | ||||||||||||||||
I Shares | (189,120 | ) | (343,349 | ) | (561,768 | ) | (490,584 | ) | ||||||||
A Shares | (36,669 | ) | (55,256 | ) | (382,735 | ) | (301,614 | ) | ||||||||
C Shares | (3,554 | ) | (7,756 | ) | (222,281 | ) | (190,595 | ) | ||||||||
Net Realized Gains: | ||||||||||||||||
I Shares | — | — | (262,970 | ) | (173,316 | ) | ||||||||||
A Shares | — | — | (196,244 | ) | (114,739 | ) | ||||||||||
C Shares | — | — | (152,923 | ) | (102,235 | ) | ||||||||||
|
|
|
|
|
|
|
| |||||||||
Total Dividends and Distributions | (229,343 | ) | (406,361 | ) | (1,778,921 | ) | (1,373,083 | ) | ||||||||
|
|
|
|
|
|
|
| |||||||||
Change in Net Assets from Capital Transactions | (2,490,846 | ) | (3,120,637 | ) | 207,365 | 28,380,350 | ||||||||||
|
|
|
|
|
|
|
| |||||||||
Change in Net Assets | (1,394,487 | ) | (3,452,634 | ) | 1,383,483 | 29,780,819 | ||||||||||
|
|
|
|
|
|
|
| |||||||||
Net Assets: | ||||||||||||||||
Beginning of Period | 24,785,572 | 28,238,206 | 58,353,968 | 28,573,149 | ||||||||||||
|
|
|
|
|
|
|
| |||||||||
End of Period | $ | 23,391,085 | $ | 24,785,572 | $ | 59,737,451 | $ | 58,353,968 | ||||||||
|
|
|
|
|
|
|
| |||||||||
Accumulated Net Investment Income (Loss), End of Period | $ | 5,342 | $ | 16,945 | $ | 165,131 | $ | 139,542 | ||||||||
|
|
|
|
|
|
|
| |||||||||
| (a) | Net realized gain (loss) from investment transactions and net change in unrealized appreciation (depreciation) on investments for the Allocation Strategy Funds are primarily attributable to the underlying investments in affiliated investment companies. |
See Notes to Financial Statements.
68
STATEMENTS OF CHANGES IN NET ASSETS (concluded)
RIDGEWORTH FUNDS For the Periods Indicated
| Growth Allocation Strategy | Moderate Allocation Strategy | |||||||||||||||
| 04/01/12- 03/31/13 | 04/01/11- 03/31/12 | 04/01/12- 03/31/13 | 04/01/11- 03/31/12 | |||||||||||||
Operations: | ||||||||||||||||
Net Investment Income | $ | 666,047 | $ | 953,611 | $ | 2,226,756 | $ | 2,803,134 | ||||||||
Net Realized Gain(a) | 6,750,621 | 2,801,141 | 13,099,212 | 5,801,325 | ||||||||||||
Net Change in Unrealized Depreciation(a) | (2,763,305 | ) | (1,708,870 | ) | (4,143,403 | ) | (1,699,827 | ) | ||||||||
|
|
|
|
|
|
|
| |||||||||
Change in Net Assets from Operations | 4,653,363 | 2,045,882 | 11,182,565 | 6,904,632 | ||||||||||||
|
|
|
|
|
|
|
| |||||||||
Dividends and Distributions to Shareholders: | ||||||||||||||||
Net Investment Income: | ||||||||||||||||
I Shares | (737,505 | ) | (1,157,474 | ) | (2,342,232 | ) | (3,317,278 | ) | ||||||||
A Shares | (120,331 | ) | (193,469 | ) | (305,300 | ) | (387,451 | ) | ||||||||
C Shares | (19,640 | ) | (34,327 | ) | (151,501 | ) | (248,498 | ) | ||||||||
Net Realized Gains: | ||||||||||||||||
I Shares | — | — | (2,159,304 | ) | (194,113 | ) | ||||||||||
A Shares | — | — | (307,003 | ) | (25,588 | ) | ||||||||||
C Shares | — | — | (220,428 | ) | (23,095 | ) | ||||||||||
|
|
|
|
|
|
|
| |||||||||
Total Dividends and Distributions | (877,476 | ) | (1,385,270 | ) | (5,485,768 | ) | (4,196,023 | ) | ||||||||
|
|
|
|
|
|
|
| |||||||||
Change in Net Assets from Capital Transactions | (7,939,350 | ) | 972,762 | (831,115 | ) | 13,594,481 | ||||||||||
|
|
|
|
|
|
|
| |||||||||
Change in Net Assets | (4,163,463 | ) | 1,633,374 | 4,865,682 | 16,303,090 | |||||||||||
|
|
|
|
|
|
|
| |||||||||
Net Assets: | ||||||||||||||||
Beginning of Period | 70,962,875 | 69,329,501 | 168,774,980 | 152,471,890 | ||||||||||||
|
|
|
|
|
|
|
| |||||||||
End of Period | $ | 66,799,412 | $ | 70,962,875 | $ | 173,640,662 | $ | 168,774,980 | ||||||||
|
|
|
|
|
|
|
| |||||||||
Accumulated Net Investment Income (Loss), End of Period | $ | 85,158 | $ | 91,146 | $ | 435,223 | $ | 212,972 | ||||||||
|
|
|
|
|
|
|
| |||||||||
| (a) | Net realized gain (loss) from investment transactions and net change in unrealized appreciation (depreciation) on investments for the Allocation Strategy Funds are primarily attributable to the underlying investments in affiliated investment companies. |
See Notes to Financial Statements.
69
RIDGEWORTH FUNDS Selected Data For a Share of Beneficial Interest Outstanding Throughout the Periods Indicated.
| Net Asset Value, Beginning of Period | Net Investment Income (Loss) | Net Realized and Unrealized Gains (Losses) on Investments | Total from Operations | Dividends from Net Investment Income | Distributions from Tax Return of Capital | Distributions from Realized Capital Gains | Total Dividends and Distributions | Net Asset Value, End of Period | Net Assets End of Period (000) | Total Return(a) | Ratio of Net Expenses to Average Net Assets | Ratio of Expenses to Average Net Assets (Excluding Waivers and Reimbursements) | Ratio of Net Investment Income to Average Net Assets | Portfolio Turnover Rate | ||||||||||||||||||||||||||||||||||||||||||||||
Aggressive Growth Stock Fund | ||||||||||||||||||||||||||||||||||||||||||||||||||||||||||||
I Shares | ||||||||||||||||||||||||||||||||||||||||||||||||||||||||||||
Year Ended March 31, 2013 | $ | 15.94 | $ | (0.14 | )(b) | $ | 0.42 | $ | 0.28 | $ | — | $ | — | $ | (0.62 | ) | $ | (0.62 | ) | $ | 15.60 | $ | 15,840 | 1.84 | % | 1.20 | % | 1.21 | % | (0.98 | )% | 24 | % | |||||||||||||||||||||||||||
Year Ended March 31, 2012 | 16.45 | (0.15 | )(b) | (0.36 | ) | (0.51 | ) | — | — | — | — | 15.94 | 88,132 | (3.16 | ) | 1.22 | 1.22 | (0.98 | ) | 30 | ||||||||||||||||||||||||||||||||||||||||
Year Ended March 31, 2011 | 12.86 | (0.12 | )(b) | 3.71 | 3.59 | — | — | — | — | 16.45 | 134,643 | 27.99 | 1.19 | 1.19 | (0.89 | ) | 53 | |||||||||||||||||||||||||||||||||||||||||||
Year Ended March 31, 2010 | 7.73 | (0.08 | )(b) | 5.21 | 5.13 | — | — | — | — | 12.86 | 108,754 | 66.36 | 1.21 | 1.21 | (0.77 | ) | 27 | |||||||||||||||||||||||||||||||||||||||||||
Year Ended March 31, 2009 | 12.03 | (0.09 | ) | (3.99 | ) | (4.08 | ) | — | — | (0.22 | ) | (0.22 | ) | 7.73 | 152,030 | (33.89 | ) | 1.16 | 1.16 | (0.72 | ) | 27 | ||||||||||||||||||||||||||||||||||||||
A Shares | ||||||||||||||||||||||||||||||||||||||||||||||||||||||||||||
Year Ended March 31, 2013 | 15.54 | (0.18 | )(b) | 0.42 | 0.24 | — | — | (0.62 | ) | (0.62 | ) | 15.16 | 3,580 | 1.63 | 1.49 | 1.53 | (1.24 | ) | 24 | |||||||||||||||||||||||||||||||||||||||||
Year Ended March 31, 2012 | 16.10 | (0.18 | )(b) | (0.38 | ) | (0.56 | ) | — | — | — | — | 15.54 | 3,803 | (3.48 | ) | 1.53 | 1.53 | (1.28 | ) | 30 | ||||||||||||||||||||||||||||||||||||||||
Year Ended March 31, 2011 | 12.62 | (0.16 | )(b) | 3.64 | 3.48 | — | — | — | — | 16.10 | 3,519 | 27.58 | 1.49 | 1.49 | (1.19 | ) | 53 | |||||||||||||||||||||||||||||||||||||||||||
Year Ended March 31, 2010 | 7.61 | (0.13 | )(b) | 5.14 | 5.01 | — | — | — | — | 12.62 | 2,502 | 65.83 | 1.52 | 1.52 | (1.12 | ) | 27 | |||||||||||||||||||||||||||||||||||||||||||
Year Ended March 31, 2009 | 11.88 | (0.12 | ) | (3.93 | ) | (4.05 | ) | — | — | (0.22 | ) | (0.22 | ) | 7.61 | 416 | (34.06 | ) | 1.46 | 1.46 | (1.01 | ) | 27 | ||||||||||||||||||||||||||||||||||||||
International Equity Fund | ||||||||||||||||||||||||||||||||||||||||||||||||||||||||||||
I Shares | ||||||||||||||||||||||||||||||||||||||||||||||||||||||||||||
Year Ended March 31, 2013 | 10.74 | 0.22 | (b) | 0.89 | 1.11 | (0.21 | ) | — | — | (0.21 | ) | 11.64 | 272,552 | 10.38 | 1.12 | 1.12 | 2.02 | 52 | ||||||||||||||||||||||||||||||||||||||||||
Year Ended March 31, 2012 | 11.62 | 0.25 | (b) | (0.90 | ) | (0.65 | ) | (0.23 | ) | — | — | (0.23 | ) | 10.74 | 261,561 | (5.24 | ) | 1.29 | 1.29 | 2.33 | 78 | |||||||||||||||||||||||||||||||||||||||
Year Ended March 31, 2011 | 10.71 | 0.16 | (b) | 1.02 | 1.18 | (0.27 | ) | — | — | (0.27 | ) | 11.62 | 252,253 | 11.29 | 1.27 | 1.27 | 1.49 | 80 | ||||||||||||||||||||||||||||||||||||||||||
Year Ended March 31, 2010 | 6.38 | 0.11 | (b) | 4.28 | 4.39 | (0.06 | ) | — | — | (0.06 | ) | 10.71 | 273,819 | 68.80 | 1.25 | 1.30 | 1.17 | 95 | ||||||||||||||||||||||||||||||||||||||||||
Year Ended March 31, 2009 | 13.77 | 0.35 | (7.28 | ) | (6.93 | ) | (0.25 | ) | — | (0.21 | ) | (0.46 | ) | 6.38 | 185,862 | (50.68 | ) | 1.24 | 1.25 | 2.93 | 193 | |||||||||||||||||||||||||||||||||||||||
A Shares | ||||||||||||||||||||||||||||||||||||||||||||||||||||||||||||
Year Ended March 31, 2013 | 10.63 | 0.18 | (b) | 0.87 | 1.05 | (0.17 | ) | — | — | (0.17 | ) | 11.51 | 4,565 | 9.95 | 1.45 | 1.45 | 1.73 | 52 | ||||||||||||||||||||||||||||||||||||||||||
Year Ended March 31, 2012 | 11.49 | 0.21 | (b) | (0.87 | ) | (0.66 | ) | (0.20 | ) | — | — | (0.20 | ) | 10.63 | 5,500 | (5.48 | ) | 1.59 | 1.59 | 2.02 | 78 | |||||||||||||||||||||||||||||||||||||||
Year Ended March 31, 2011 | 10.59 | 0.13 | (b) | 1.01 | 1.14 | (0.24 | ) | — | — | (0.24 | ) | 11.49 | 7,227 | 10.98 | 1.57 | 1.57 | 1.24 | 80 | ||||||||||||||||||||||||||||||||||||||||||
Year Ended March 31, 2010 | 6.32 | 0.09 | (b) | 4.22 | 4.31 | (0.04 | ) | — | — | (0.04 | ) | 10.59 | 8,104 | 68.22 | 1.55 | 1.59 | 0.68 | 95 | ||||||||||||||||||||||||||||||||||||||||||
Year Ended March 31, 2009 | 13.61 | 0.33 | (7.21 | ) | (6.88 | ) | (0.20 | ) | — | (0.21 | ) | (0.41 | ) | 6.32 | 3,580 | (50.84 | ) | 1.54 | 1.54 | 2.71 | 193 | |||||||||||||||||||||||||||||||||||||||
International Equity Index Fund | ||||||||||||||||||||||||||||||||||||||||||||||||||||||||||||
I Shares | ||||||||||||||||||||||||||||||||||||||||||||||||||||||||||||
Year Ended March 31, 2013 | 11.68 | 0.32 | (b) | 0.67 | 0.99 | (0.40 | ) | — | (0.23 | ) | (0.63 | ) | 12.04 | 222,839 | 8.62 | 0.73 | 0.76 | 2.79 | 24 | |||||||||||||||||||||||||||||||||||||||||
Year Ended March 31, 2012 | 13.52 | 0.38 | (b) | (1.77 | ) | (1.39 | ) | (0.45 | ) | — | — | (0.45 | ) | 11.68 | 339,763 | (9.78 | ) | 0.72 | 0.72 | 3.15 | 31 | |||||||||||||||||||||||||||||||||||||||
Year Ended March 31, 2011 | 12.72 | 0.33 | (b) | 0.86 | 1.19 | (0.39 | ) | — | — | (0.39 | ) | 13.52 | 478,223 | 9.55 | 0.66 | 0.66 | 2.65 | 43 | ||||||||||||||||||||||||||||||||||||||||||
Year Ended March 31, 2010 | 8.75 | 0.34 | 4.03 | 4.37 | (0.40 | ) | — | — | (0.40 | ) | 12.72 | 839,582 | 49.93 | 0.64 | 0.64 | 2.46 | 36 | |||||||||||||||||||||||||||||||||||||||||||
Year Ended March 31, 2009 | 17.82 | 0.60 | (9.05 | ) | (8.45 | ) | (0.62 | ) | — | — | (0.62 | ) | 8.75 | 726,931 | (47.89 | ) | 0.61 | 0.61 | 3.63 | 47 | ||||||||||||||||||||||||||||||||||||||||
A Shares | ||||||||||||||||||||||||||||||||||||||||||||||||||||||||||||
Year Ended March 31, 2013 | 11.59 | 0.27 | (b) | 0.68 | 0.95 | (0.37 | ) | — | (0.23 | ) | (0.60 | ) | 11.94 | 2,621 | 8.33 | 0.99 | 1.04 | 2.42 | 24 | |||||||||||||||||||||||||||||||||||||||||
Year Ended March 31, 2012 | 13.40 | 0.38 | (b) | (1.79 | ) | (1.41 | ) | (0.40 | ) | — | — | (0.40 | ) | 11.59 | 2,529 | (10.05 | ) | 1.02 | 1.02 | 3.11 | 31 | |||||||||||||||||||||||||||||||||||||||
Year Ended March 31, 2011 | 12.61 | 0.28 | (b) | 0.86 | 1.14 | (0.35 | ) | — | — | (0.35 | ) | 13.40 | 4,459 | 9.23 | 0.92 | 0.92 | 2.25 | 43 | ||||||||||||||||||||||||||||||||||||||||||
Year Ended March 31, 2010 | 8.69 | 0.25 | 4.05 | 4.30 | (0.38 | ) | — | — | (0.38 | ) | 12.61 | 5,998 | 49.46 | 0.94 | 0.94 | 1.72 | 36 | |||||||||||||||||||||||||||||||||||||||||||
Year Ended March 31, 2009 | 17.67 | 0.52 | (8.93 | ) | (8.41 | ) | (0.57 | ) | — | — | (0.57 | ) | 8.69 | 2,533 | (48.04 | ) | 0.91 | 0.91 | 3.48 | 47 | ||||||||||||||||||||||||||||||||||||||||
See Notes to Financial Statements.
70
FINANCIAL HIGHLIGHTS
RIDGEWORTH FUNDS Selected Data For a Share of Beneficial Interest Outstanding Throughout the Periods Indicated.
| Net Asset Value, Beginning of Period | Net Investment Income (Loss) | Net Realized and Unrealized Gains (Losses) on Investments | Total from Operations | Dividends from Net Investment Income | Distributions from Tax Return of Capital | Distributions from Realized Capital Gains | Total Dividends and Distributions | Net Asset Value, End of Period | Net Assets End of Period (000) | Total Return(a) | Ratio of Net Expenses to Average Net Assets | Ratio of Expenses to Average Net Assets (Excluding Waivers and Reimbursements) | Ratio of Net Investment Income to Average Net Assets | Portfolio Turnover Rate | ||||||||||||||||||||||||||||||||||||||||||||||
Large Cap Growth Stock Fund |
| |||||||||||||||||||||||||||||||||||||||||||||||||||||||||||
I Shares | ||||||||||||||||||||||||||||||||||||||||||||||||||||||||||||
Year Ended March 31, 2013 | $ | 12.95 | $ | 0.03 | (b) | $ | 0.24 | $ | 0.27 | $ | (0.01 | ) | $ | — | $ | (4.90 | ) | $ | (4.91 | ) | $ | 8.31 | $ | 167,887 | 3.64 | % | 0.94 | % | 0.94 | % | 0.23 | % | 40 | % | ||||||||||||||||||||||||||
Year Ended March 31, 2012 | 11.55 | (0.02 | )(b) | 1.42 | 1.40 | — | — | — | — | 12.95 | 261,090 | 12.12 | 1.07 | 1.07 | (0.17 | ) | 19 | |||||||||||||||||||||||||||||||||||||||||||
Year Ended March 31, 2011 | 9.59 | 0.01 | (b) | 1.95 | 1.96 | — | (c) | — | — | — | 11.55 | 406,017 | 20.48 | 1.04 | 1.06 | 0.06 | 30 | |||||||||||||||||||||||||||||||||||||||||||
Year Ended March 31, 2010 | 6.57 | 0.01 | 3.02 | 3.03 | (0.01 | ) | — | — | (0.01 | ) | 9.59 | 443,918 | 46.20 | 0.99 | 1.04 | 0.19 | 62 | |||||||||||||||||||||||||||||||||||||||||||
Year Ended March 31, 2009 | 9.95 | 0.04 | (3.33 | ) | (3.29 | ) | (0.04 | ) | — | (0.05 | ) | (0.09 | ) | 6.57 | 439,356 | (33.16 | ) | 0.99 | 1.03 | 0.54 | 85 | |||||||||||||||||||||||||||||||||||||||
A Shares | ||||||||||||||||||||||||||||||||||||||||||||||||||||||||||||
Year Ended March 31, 2013 | 11.96 | — | (b)(c) | 0.21 | 0.21 | — | — | (4.90 | ) | (4.90 | ) | 7.27 | 56,511 | 3.43 | 1.20 | 1.20 | (0.01 | ) | 40 | |||||||||||||||||||||||||||||||||||||||||
Year Ended March 31, 2012 | 10.70 | (0.05 | )(b) | 1.31 | 1.26 | — | — | — | — | 11.96 | 45,854 | 11.78 | 1.37 | 1.37 | (0.45 | ) | 19 | |||||||||||||||||||||||||||||||||||||||||||
Year Ended March 31, 2011 | 8.91 | (0.02 | )(b) | 1.81 | 1.79 | — | — | — | — | 10.70 | 46,358 | 20.09 | 1.34 | 1.36 | (0.24 | ) | 30 | |||||||||||||||||||||||||||||||||||||||||||
Year Ended March 31, 2010 | 6.11 | (0.01 | ) | 2.81 | 2.80 | — | — | — | — | 8.91 | 44,994 | 45.90 | 1.29 | 1.34 | (0.11 | ) | 62 | |||||||||||||||||||||||||||||||||||||||||||
Year Ended March 31, 2009 | 9.27 | 0.02 | (3.11 | ) | (3.09 | ) | (0.02 | ) | — | (0.05 | ) | (0.07 | ) | 6.11 | 35,431 | (33.40 | ) | 1.30 | 1.33 | 0.19 | 85 | |||||||||||||||||||||||||||||||||||||||
C Shares | ||||||||||||||||||||||||||||||||||||||||||||||||||||||||||||
Year Ended March 31, 2013 | 10.52 | (0.06 | )(b) | 0.15 | 0.09 | — | — | (4.90 | ) | (4.90 | ) | 5.71 | 31,625 | 2.69 | 1.89 | 1.89 | (0.70 | ) | 40 | |||||||||||||||||||||||||||||||||||||||||
Year Ended March 31, 2012 | 9.48 | (0.11 | )(b) | 1.15 | 1.04 | — | — | — | — | 10.52 | 17,363 | 10.97 | 2.07 | 2.07 | (1.15 | ) | 19 | |||||||||||||||||||||||||||||||||||||||||||
Year Ended March 31, 2011 | 7.94 | (0.08 | )(b) | 1.62 | 1.54 | — | — | — | — | 9.48 | 17,680 | 19.40 | 2.04 | 2.06 | (0.94 | ) | 30 | |||||||||||||||||||||||||||||||||||||||||||
Year Ended March 31, 2010 | 5.49 | (0.06 | ) | 2.51 | 2.45 | — | — | — | — | 7.94 | 17,516 | 44.63 | 1.99 | 2.04 | (0.81 | ) | 62 | |||||||||||||||||||||||||||||||||||||||||||
Year Ended March 31, 2009 | 8.37 | (0.04 | ) | (2.78 | ) | (2.82 | ) | (0.01 | ) | — | (0.05 | ) | (0.06 | ) | 5.49 | 14,046 | (33.77 | ) | 2.00 | 2.03 | (0.52 | ) | 85 | |||||||||||||||||||||||||||||||||||||
Large Cap Value Equity Fund | ||||||||||||||||||||||||||||||||||||||||||||||||||||||||||||
I Shares | ||||||||||||||||||||||||||||||||||||||||||||||||||||||||||||
Year Ended March 31, 2013 | 13.77 | 0.24 | (b) | 1.97 | 2.21 | (0.22 | ) | — | — | (0.22 | ) | 15.76 | 1,442,154 | 16.24 | 0.89 | 0.89 | 1.74 | 78 | ||||||||||||||||||||||||||||||||||||||||||
Year Ended March 31, 2012 | 13.47 | 0.22 | (b) | 0.28 | 0.50 | (0.20 | ) | — | — | (0.20 | ) | 13.77 | 1,985,434 | 3.92 | 0.82 | 0.82 | 1.74 | 110 | ||||||||||||||||||||||||||||||||||||||||||
Year Ended March 31, 2011 | 11.71 | 0.18 | (b) | 1.75 | 1.93 | (0.17 | ) | — | — | (0.17 | ) | 13.47 | 1,348,969 | 16.69 | 0.83 | 0.83 | 1.48 | 134 | ||||||||||||||||||||||||||||||||||||||||||
Year Ended March 31, 2010 | 7.99 | 0.17 | 3.72 | 3.89 | (0.17 | ) | — | — | (0.17 | ) | 11.71 | 1,288,962 | 49.03 | 0.81 | 0.82 | 1.67 | 105 | |||||||||||||||||||||||||||||||||||||||||||
Year Ended March 31, 2009 | 12.35 | 0.25 | (4.36 | ) | (4.11 | ) | (0.25 | ) | — | — | (0.25 | ) | 7.99 | 998,608 | (33.65 | ) | 0.82 | 0.82 | 2.50 | 114 | ||||||||||||||||||||||||||||||||||||||||
A Shares | ||||||||||||||||||||||||||||||||||||||||||||||||||||||||||||
Year Ended March 31, 2013 | 13.70 | 0.21 | (b) | 1.95 | 2.16 | (0.19 | ) | — | — | (0.19 | ) | 15.67 | 287,957 | 15.93 | 1.16 | 1.26 | 1.48 | 78 | ||||||||||||||||||||||||||||||||||||||||||
Year Ended March 31, 2012 | 13.41 | 0.19 | (b) | 0.27 | 0.46 | (0.17 | ) | — | — | (0.17 | ) | 13.70 | 233,782 | 3.58 | 1.12 | 1.12 | 1.50 | 110 | ||||||||||||||||||||||||||||||||||||||||||
Year Ended March 31, 2011 | 11.66 | 0.15 | (b) | 1.74 | 1.89 | (0.14 | ) | — | — | (0.14 | ) | 13.41 | 80,048 | 16.37 | 1.13 | 1.13 | 1.20 | 134 | ||||||||||||||||||||||||||||||||||||||||||
Year Ended March 31, 2010 | 7.96 | 0.14 | 3.71 | 3.85 | (0.15 | ) | — | — | (0.15 | ) | 11.66 | 33,805 | 48.59 | 1.11 | 1.12 | 1.37 | 105 | |||||||||||||||||||||||||||||||||||||||||||
Year Ended March 31, 2009 | 12.30 | 0.24 | (4.36 | ) | (4.12 | ) | (0.22 | ) | — | — | (0.22 | ) | 7.96 | 24,385 | (33.83 | ) | 1.12 | 1.12 | 2.17 | 114 | ||||||||||||||||||||||||||||||||||||||||
C Shares | ||||||||||||||||||||||||||||||||||||||||||||||||||||||||||||
Year Ended March 31, 2013 | 13.50 | 0.12 | (b) | 1.92 | 2.04 | (0.12 | ) | — | — | (0.12 | ) | 15.42 | 16,394 | 15.25 | 1.75 | 1.75 | 0.89 | 78 | ||||||||||||||||||||||||||||||||||||||||||
Year Ended March 31, 2012 | 13.21 | 0.08 | (b) | 0.29 | 0.37 | (0.08 | ) | — | — | (0.08 | ) | 13.50 | 17,027 | 2.86 | 1.82 | 1.82 | 0.68 | 110 | ||||||||||||||||||||||||||||||||||||||||||
Year Ended March 31, 2011 | 11.49 | 0.06 | (b) | 1.72 | 1.78 | (0.06 | ) | — | — | (0.06 | ) | 13.21 | 18,686 | 15.53 | 1.83 | 1.83 | 0.48 | 134 | ||||||||||||||||||||||||||||||||||||||||||
Year Ended March 31, 2010 | 7.87 | 0.07 | 3.65 | 3.72 | (0.10 | ) | — | — | (0.10 | ) | 11.49 | 19,823 | 47.43 | 1.81 | 1.82 | 0.67 | 105 | |||||||||||||||||||||||||||||||||||||||||||
Year Ended March 31, 2009 | 12.16 | 0.16 | (4.31 | ) | (4.15 | ) | (0.14 | ) | — | — | (0.14 | ) | 7.87 | 15,410 | (34.28 | ) | 1.82 | 1.82 | 1.46 | 114 | ||||||||||||||||||||||||||||||||||||||||
Mid-Cap Value Equity Fund | ||||||||||||||||||||||||||||||||||||||||||||||||||||||||||||
I Shares | ||||||||||||||||||||||||||||||||||||||||||||||||||||||||||||
Year Ended March 31, 2013 | 11.07 | 0.16 | (b) | 2.00 | 2.16 | (0.14 | ) | — | (0.03 | ) | (0.17 | ) | 13.06 | 2,168,210 | 19.73 | 1.08 | 1.08 | 1.44 | 123 | |||||||||||||||||||||||||||||||||||||||||
Year Ended March 31, 2012 | 12.70 | 0.17 | (b) | (0.66 | ) | (0.49 | ) | (0.17 | ) | — | (0.97 | ) | (1.14 | ) | 11.07 | 1,679,244 | (2.33 | ) | 1.04 | 1.04 | 1.56 | 182 | ||||||||||||||||||||||||||||||||||||||
Year Ended March 31, 2011 | 11.17 | 0.10 | (b) | 2.26 | 2.36 | (0.09 | ) | — | (0.74 | ) | (0.83 | ) | 12.70 | 1,710,610 | 21.89 | 1.04 | 1.04 | 0.91 | 170 | |||||||||||||||||||||||||||||||||||||||||
Year Ended March 31, 2010 | 6.45 | 0.11 | 4.73 | 4.84 | (0.12 | ) | — | — | (0.12 | ) | 11.17 | 803,168 | 75.36 | 1.03 | 1.04 | 1.11 | 195 | |||||||||||||||||||||||||||||||||||||||||||
Year Ended March 31, 2009 | 9.58 | 0.14 | (b) | (3.13 | ) | (2.99 | ) | (0.14 | ) | — | — | (0.14 | ) | 6.45 | 231,035 | (31.46 | ) | 1.07 | 1.07 | 1.76 | 213 | |||||||||||||||||||||||||||||||||||||||
See Notes to Financial Statements.
71
FINANCIAL HIGHLIGHTS
RIDGEWORTH FUNDS Selected Data For a Share of Beneficial Interest Outstanding Throughout the Periods Indicated.
| Net Asset Value, Beginning of Period | Net Investment Income (Loss) | Net Realized and Unrealized Gains (Losses) on Investments | Total from Operations | Dividends from Net Investment Income | Distributions from Tax Return of Capital | Distributions from Realized Capital Gains | Total Dividends and Distributions | Net Asset Value, End of Period | Net Assets End of Period (000) | Total Return(a) | Ratio of Net Expenses to Average Net Assets | Ratio of Expenses to Average Net Assets (Excluding Waivers and Reimbursements) | Ratio of Net Investment Income to Average Net Assets | Portfolio Turnover Rate | ||||||||||||||||||||||||||||||||||||||||||||||
A Shares | ||||||||||||||||||||||||||||||||||||||||||||||||||||||||||||
Year Ended March 31, 2013 | $ | 10.99 | $ | 0.13 | (b) | $ | 1.98 | $ | 2.11 | $ | (0.11 | ) | $ | — | $ | (0.03 | ) | $ | (0.14 | ) | $ | 12.96 | $ | 490,381 | 19.43 | % | 1.34 | % | 1.38 | % | 1.17 | % | 123 | % | ||||||||||||||||||||||||||
Year Ended March 31, 2012 | 12.62 | 0.15 | (b) | (0.67 | ) | (0.52 | ) | (0.14 | ) | — | (0.97 | ) | (1.11 | ) | 10.99 | 433,674 | (2.63 | ) | 1.34 | 1.34 | 1.40 | 182 | ||||||||||||||||||||||||||||||||||||||
Year Ended March 31, 2011 | 11.11 | 0.08 | (b) | 2.24 | 2.32 | (0.07 | ) | — | (0.74 | ) | (0.81 | ) | 12.62 | 252,165 | 21.55 | 1.35 | 1.35 | 0.70 | 170 | |||||||||||||||||||||||||||||||||||||||||
Year Ended March 31, 2010 | 6.42 | 0.09 | 4.70 | 4.79 | (0.10 | ) | — | — | (0.10 | ) | 11.11 | 36,756 | 74.87 | 1.32 | 1.34 | 0.70 | 195 | |||||||||||||||||||||||||||||||||||||||||||
Year Ended March 31, 2009 | 9.53 | 0.12 | (b) | (3.12 | ) | (3.00 | ) | (0.11 | ) | — | — | (0.11 | ) | 6.42 | 2,912 | (31.64 | ) | 1.37 | 1.37 | 1.36 | 213 | |||||||||||||||||||||||||||||||||||||||
C Shares | ||||||||||||||||||||||||||||||||||||||||||||||||||||||||||||
Year Ended March 31, 2013 | 10.85 | 0.07 | (b) | 1.95 | 2.02 | (0.07 | ) | — | (0.03 | ) | (0.10 | ) | 12.77 | 53,893 | 18.75 | 1.86 | 1.86 | 0.65 | 123 | |||||||||||||||||||||||||||||||||||||||||
Year Ended March 31, 2012 | 12.48 | 0.07 | (b) | (0.66 | ) | (0.59 | ) | (0.07 | ) | — | (0.97 | ) | (1.04 | ) | 10.85 | 42,272 | (3.32 | ) | 2.04 | 2.04 | 0.65 | 182 | ||||||||||||||||||||||||||||||||||||||
Year Ended March 31, 2011 | 11.02 | — | (b) | 2.21 | 2.21 | (0.01 | ) | — | (0.74 | ) | (0.75 | ) | 12.48 | 24,496 | 20.71 | 2.04 | 2.04 | (0.04 | ) | 170 | ||||||||||||||||||||||||||||||||||||||||
Year Ended March 31, 2010 | 6.38 | 0.02 | 4.67 | 4.69 | (0.05 | ) | — | — | (0.05 | ) | 11.02 | 5,853 | 73.71 | 2.03 | 2.04 | 0.13 | 195 | |||||||||||||||||||||||||||||||||||||||||||
Year Ended March 31, 2009 | 9.47 | 0.06 | (b) | (3.10 | ) | (3.04 | ) | (0.05 | ) | — | — | (0.05 | ) | 6.38 | 1,949 | (32.09 | ) | 2.07 | 2.07 | 0.72 | 213 | |||||||||||||||||||||||||||||||||||||||
Select Large Cap Growth Stock Fund | ||||||||||||||||||||||||||||||||||||||||||||||||||||||||||||
I Shares | ||||||||||||||||||||||||||||||||||||||||||||||||||||||||||||
Year Ended March 31, 2013 | 33.89 | 0.01 | (b) | (0.26 | ) | (0.25 | ) | — | — | (6.73 | ) | (6.73 | ) | 26.91 | 19,813 | 0.37 | 1.06 | 1.06 | 0.04 | 57 | ||||||||||||||||||||||||||||||||||||||||
Year Ended March 31, 2012 | 32.51 | (0.04 | )(b) | 2.24 | 2.20 | — | — | (0.82 | ) | (0.82 | ) | 33.89 | 34,499 | 7.31 | 1.05 | 1.05 | (0.13 | ) | 66 | |||||||||||||||||||||||||||||||||||||||||
Year Ended March 31, 2011 | 27.79 | 0.02 | (b) | 4.70 | 4.72 | — | — | — | — | 32.51 | 80,589 | 16.98 | 0.99 | 0.99 | 0.07 | 72 | ||||||||||||||||||||||||||||||||||||||||||||
Year Ended March 31, 2010 | 19.74 | 0.04 | 8.03 | 8.07 | (0.02 | ) | — | (c) | — | (0.02 | ) | 27.79 | 114,100 | 40.93 | 0.96 | 0.96 | 0.18 | 65 | ||||||||||||||||||||||||||||||||||||||||||
Year Ended March 31, 2009 | 28.32 | 0.09 | (8.60 | ) | (8.51 | ) | (0.06 | ) | (0.01 | ) | — | (0.07 | ) | 19.74 | 95,540 | (30.06 | ) | 0.95 | 0.96 | 0.45 | 65 | |||||||||||||||||||||||||||||||||||||||
A Shares | ||||||||||||||||||||||||||||||||||||||||||||||||||||||||||||
Year Ended March 31, 2013 | 33.28 | (0.06 | )(b) | (0.27 | ) | (0.33 | ) | — | — | (6.73 | ) | (6.73 | ) | 26.22 | 765 | 0.13 | 1.33 | 1.33 | (0.21 | ) | 57 | |||||||||||||||||||||||||||||||||||||||
Year Ended March 31, 2012 | 32.04 | (0.13 | )(b) | 2.19 | 2.06 | — | — | (0.82 | ) | (0.82 | ) | 33.28 | 796 | 6.98 | 1.36 | 1.36 | (0.43 | ) | 66 | |||||||||||||||||||||||||||||||||||||||||
Year Ended March 31, 2011 | 27.47 | (0.06 | )(b) | 4.63 | 4.57 | — | — | — | — | 32.04 | 698 | 16.64 | 1.29 | 1.29 | (0.21 | ) | 72 | |||||||||||||||||||||||||||||||||||||||||||
Year Ended March 31, 2010 | 19.54 | (0.03 | ) | 7.97 | 7.94 | (0.01 | ) | — | (c) | — | (0.01 | ) | 27.47 | 244 | 40.65 | 1.25 | 1.26 | (0.10 | ) | 65 | ||||||||||||||||||||||||||||||||||||||||
Year Ended March 31, 2009 | 28.06 | 0.02 | (8.52 | ) | (8.50 | ) | (0.01 | ) | (0.01 | ) | — | (0.02 | ) | 19.54 | 175 | (30.28 | ) | 1.25 | 1.25 | 0.04 | 65 | |||||||||||||||||||||||||||||||||||||||
C Shares | ||||||||||||||||||||||||||||||||||||||||||||||||||||||||||||
Year Ended March 31, 2013 | 29.90 | (0.24 | )(b) | (0.29 | ) | (0.53 | ) | — | — | (6.73 | ) | (6.73 | ) | 22.64 | 13,675 | (0.58 | ) | 2.02 | 2.02 | (0.91 | ) | 57 | ||||||||||||||||||||||||||||||||||||||
Year Ended March 31, 2012 | 29.08 | (0.31 | )(b) | 1.95 | 1.64 | — | — | (0.82 | ) | (0.82 | ) | 29.90 | 16,053 | 6.24 | 2.06 | 2.06 | (1.13 | ) | 66 | |||||||||||||||||||||||||||||||||||||||||
Year Ended March 31, 2011 | 25.10 | (0.23 | )(b) | 4.21 | 3.98 | — | — | — | — | 29.08 | 18,332 | 15.86 | 1.99 | 1.99 | (0.92 | ) | 72 | |||||||||||||||||||||||||||||||||||||||||||
Year Ended March 31, 2010 | 17.99 | (0.19 | ) | 7.30 | 7.11 | — | — | (c) | — | — | 25.10 | 19,040 | 39.52 | 1.96 | 1.96 | (0.81 | ) | 65 | ||||||||||||||||||||||||||||||||||||||||||
Year Ended March 31, 2009 | 25.98 | (0.14 | ) | (7.85 | ) | (7.99 | ) | — | — | — | — | 17.99 | 15,237 | (30.75 | ) | 1.95 | 1.95 | (0.59 | ) | 65 | ||||||||||||||||||||||||||||||||||||||||
Small Cap Growth Stock Fund |
| |||||||||||||||||||||||||||||||||||||||||||||||||||||||||||
I Shares | ||||||||||||||||||||||||||||||||||||||||||||||||||||||||||||
Year Ended March 31, 2013 | 17.21 | (0.08 | )(b) | 2.19 | 2.11 | — | — | (3.66 | ) | (3.66 | ) | 15.66 | 152,674 | 14.20 | 1.21 | 1.21 | (0.50 | ) | 50 | |||||||||||||||||||||||||||||||||||||||||
Year Ended March 31, 2012 | 17.17 | (0.10 | )(b) | 0.14 | (d) | 0.04 | — | — | — | — | 17.21 | 267,694 | 0.23 | 1.23 | 1.23 | (0.62 | ) | 71 | ||||||||||||||||||||||||||||||||||||||||||
Year Ended March 31, 2011 | 13.32 | (0.11 | )(b) | 3.96 | 3.85 | — | — | — | — | 17.17 | 408,399 | 28.90 | 1.23 | 1.23 | (0.81 | ) | 112 | |||||||||||||||||||||||||||||||||||||||||||
Year Ended March 31, 2010 | 8.52 | (0.09 | ) | 4.89 | 4.80 | — | — | — | — | 13.32 | 358,947 | 56.34 | 1.22 | 1.22 | (0.76 | ) | 103 | |||||||||||||||||||||||||||||||||||||||||||
Year Ended March 31, 2009 | 13.53 | (0.04 | ) | (4.97 | ) | (5.01 | ) | — | — | — | — | 8.52 | 273,548 | (37.03 | ) | 1.21 | 1.21 | (0.30 | ) | 157 | ||||||||||||||||||||||||||||||||||||||||
A Shares | ||||||||||||||||||||||||||||||||||||||||||||||||||||||||||||
Year Ended March 31, 2013 | 16.18 | (0.11 | )(b) | 2.05 | 1.94 | — | — | (3.66 | ) | (3.66 | ) | 14.46 | 10,226 | 14.07 | 1.37 | 1.37 | (0.69 | ) | 50 | |||||||||||||||||||||||||||||||||||||||||
Year Ended March 31, 2012 | 16.19 | (0.14 | )(b) | 0.13 | (d) | (0.01 | ) | — | — | — | — | 16.18 | 10,032 | (0.06 | ) | 1.54 | 1.54 | (0.91 | ) | 71 | ||||||||||||||||||||||||||||||||||||||||
Year Ended March 31, 2011 | 12.59 | (0.15 | )(b) | 3.75 | 3.60 | — | — | — | — | 16.19 | 12,235 | 28.59 | 1.53 | 1.53 | (1.11 | ) | 112 | |||||||||||||||||||||||||||||||||||||||||||
Year Ended March 31, 2010 | 8.08 | (0.12 | ) | 4.63 | 4.51 | — | — | — | — | 12.59 | 11,517 | 55.82 | 1.52 | 1.52 | (1.06 | ) | 103 | |||||||||||||||||||||||||||||||||||||||||||
Year Ended March 31, 2009 | 12.88 | (0.08 | ) | (4.72 | ) | (4.80 | ) | — | — | — | — | 8.08 | 8,294 | (37.27 | ) | 1.51 | 1.51 | (0.60 | ) | 157 | ||||||||||||||||||||||||||||||||||||||||
See Notes to Financial Statements.
72
FINANCIAL HIGHLIGHTS
RIDGEWORTH FUNDS Selected Data For a Share of Beneficial Interest Outstanding Throughout the Periods Indicated.
| Net Asset Value, Beginning of Period | Net Investment Income (Loss) | Net Realized and Unrealized Gains (Losses) on Investments | Total from Operations | Dividends from Net Investment Income | Distributions from Tax Return of Capital | Distributions from Realized Capital Gains | Total Dividends and Distributions | Net Asset Value, End of Period | Net Assets End of Period (000) | Total Return(a) | Ratio of Net Expenses to Average Net Assets | Ratio of Expenses to Average Net Assets (Excluding Waivers and Reimbursements) | Ratio of Net Investment Income to Average Net Assets | Portfolio Turnover Rate | ||||||||||||||||||||||||||||||||||||||||||||||
C Shares | ||||||||||||||||||||||||||||||||||||||||||||||||||||||||||||
Year Ended March 31, 2013 | $ | 13.91 | $ | (0.18 | )(b) | $ | 1.70 | $ | 1.52 | $ | — | $ | — | $ | (3.66 | ) | $ | (3.66 | ) | $ | 11.77 | $ | 6,757 | 13.30 | % | 2.05 | % | 2.05 | % | (1.39 | )% | 50 | % | |||||||||||||||||||||||||||
Year Ended March 31, 2012 | 14.01 | (0.21 | )(b) | 0.11 | (d) | (0.10 | ) | — | — | — | — | 13.91 | 8,129 | (0.71 | ) | 2.24 | 2.24 | (1.61 | ) | 71 | ||||||||||||||||||||||||||||||||||||||||
Year Ended March 31, 2011 | 10.98 | (0.21 | )(b) | 3.24 | 3.03 | — | — | — | — | 14.01 | 9,636 | 27.60 | 2.23 | 2.23 | (1.81 | ) | 112 | |||||||||||||||||||||||||||||||||||||||||||
Year Ended March 31, 2010 | 7.10 | (0.17 | ) | 4.05 | 3.88 | — | — | — | — | 10.98 | 8,827 | 54.65 | 2.22 | 2.22 | (1.76 | ) | 103 | |||||||||||||||||||||||||||||||||||||||||||
Year Ended March 31, 2009 | 11.38 | (0.15) | (4.13 | ) | (4.28 | ) | — | — | — | — | 7.10 | 6,567 | (37.61 | ) | 2.21 | 2.21 | (1.30 | ) | 157 | |||||||||||||||||||||||||||||||||||||||||
Small Cap Value Equity Fund |
| |||||||||||||||||||||||||||||||||||||||||||||||||||||||||||
I Shares | ||||||||||||||||||||||||||||||||||||||||||||||||||||||||||||
Year Ended March 31, 2013 | 13.80 | 0.20 | (b) | 2.08 | 2.28 | (0.23 | ) | — | (0.40 | ) | (0.63 | ) | 15.45 | 1,408,597 | 17.07 | 1.20 | 1.20 | 1.44 | 27 | |||||||||||||||||||||||||||||||||||||||||
Year Ended March 31, 2012 | 14.54 | 0.12 | (b) | (0.07 | )(d) | 0.05 | (0.12 | ) | — | (0.67 | ) | (0.79 | ) | 13.80 | 1,169,093 | 1.15 | 1.20 | 1.20 | 0.92 | 46 | ||||||||||||||||||||||||||||||||||||||||
Year Ended March 31, 2011 | 11.76 | 0.10 | (b) | 2.79 | 2.89 | (0.11 | ) | — | — | (0.11 | ) | 14.54 | 1,002,005 | 24.68 | 1.21 | 1.21 | 0.82 | 72 | ||||||||||||||||||||||||||||||||||||||||||
Year Ended March 31, 2010 | 7.57 | 0.11 | 4.20 | 4.31 | (0.12 | ) | — | — | (0.12 | ) | 11.76 | 612,490 | 57.15 | 1.21 | 1.21 | 1.29 | 62 | |||||||||||||||||||||||||||||||||||||||||||
Year Ended March 31, 2009 | 11.17 | 0.16 | (3.44 | ) | (3.28 | ) | (0.16 | ) | — | (0.16 | ) | (0.32 | ) | 7.57 | 316,142 | (29.61 | ) | 1.21 | 1.22 | 1.61 | 71 | |||||||||||||||||||||||||||||||||||||||
A Shares | ||||||||||||||||||||||||||||||||||||||||||||||||||||||||||||
Year Ended March 31, 2013 | 13.58 | 0.15 | (b) | 2.05 | 2.20 | (0.19 | ) | — | (0.40 | ) | (0.59 | ) | 15.19 | 181,308 | 16.77 | 1.50 | 1.50 | 1.14 | 27 | |||||||||||||||||||||||||||||||||||||||||
Year Ended March 31, 2012 | 14.33 | 0.08 | (b) | (0.08 | )(d) | — | (0.08 | ) | — | (0.67 | ) | (0.75 | ) | 13.58 | 169,100 | 0.81 | 1.50 | 1.50 | 0.63 | 46 | ||||||||||||||||||||||||||||||||||||||||
Year Ended March 31, 2011 | 11.59 | 0.06 | (b) | 2.75 | 2.81 | (0.07 | ) | — | — | (0.07 | ) | 14.33 | 103,365 | 24.38 | 1.52 | 1.52 | 0.48 | 72 | ||||||||||||||||||||||||||||||||||||||||||
Year Ended March 31, 2010 | 7.47 | 0.07 | 4.15 | 4.22 | (0.10 | ) | — | — | (0.10 | ) | 11.59 | 17,826 | 56.66 | 1.50 | 1.50 | 1.00 | 62 | |||||||||||||||||||||||||||||||||||||||||||
Year Ended March 31, 2009 | 11.03 | 0.13 | (3.40 | ) | (3.27 | ) | (0.13 | ) | — | (0.16 | ) | (0.29 | ) | 7.47 | 2,243 | (29.83 | ) | 1.49 | 1.50 | 1.34 | 71 | |||||||||||||||||||||||||||||||||||||||
C Shares | ||||||||||||||||||||||||||||||||||||||||||||||||||||||||||||
Year Ended March 31, 2013 | 12.98 | 0.08 | (b) | 1.95 | 2.03 | (0.14 | ) | — | (0.40 | ) | (0.54 | ) | 14.47 | 36,015 | 16.17 | 1.99 | 1.99 | 0.65 | 27 | |||||||||||||||||||||||||||||||||||||||||
Year Ended March 31, 2012 | 13.76 | (0.01 | )(b) | (0.08 | )(d) | (0.09 | ) | (0.02 | ) | — | (0.67 | ) | (0.69 | ) | 12.98 | 38,107 | 0.12 | 2.20 | 2.20 | (0.08 | ) | 46 | ||||||||||||||||||||||||||||||||||||||
Year Ended March 31, 2011 | 11.15 | (0.02 | )(b) | 2.64 | 2.62 | (0.01 | ) | — | — | (0.01 | ) | 13.76 | 32,074 | 23.51 | 2.21 | 2.21 | (0.18 | ) | 72 | |||||||||||||||||||||||||||||||||||||||||
Year Ended March 31, 2010 | 7.20 | 0.02 | 3.97 | 3.99 | (0.04 | ) | — | — | (0.04 | ) | 11.15 | 17,601 | 55.48 | 2.21 | 2.21 | 0.30 | 62 | |||||||||||||||||||||||||||||||||||||||||||
Year Ended March 31, 2009 | 10.65 | 0.09 | (3.28 | ) | (3.19 | ) | (0.10 | ) | — | (0.16 | ) | (0.26 | ) | 7.20 | 11,091 | (30.14 | ) | 1.89 | 1.89 | 0.94 | 71 | |||||||||||||||||||||||||||||||||||||||
Aggressive Growth Allocation Strategy(e) | ||||||||||||||||||||||||||||||||||||||||||||||||||||||||||||
I Shares | ||||||||||||||||||||||||||||||||||||||||||||||||||||||||||||
Year Ended March 31, 2013 | 8.50 | 0.06 | (b) | 0.48 | 0.54 | (0.09 | ) | — | — | (0.09 | ) | 8.95 | 18,577 | 6.45 | 0.40 | 0.81 | 0.77 | 35 | ||||||||||||||||||||||||||||||||||||||||||
Year Ended March 31, 2012 | 8.57 | 0.08 | (b) | (0.02 | ) | 0.06 | (0.13 | ) | — | — | (0.13 | ) | 8.50 | 18,993 | 0.89 | 0.20 | 0.45 | 0.98 | 55 | |||||||||||||||||||||||||||||||||||||||||
Year Ended March 31, 2011 | 7.43 | 0.05 | (b) | 1.18 | 1.23 | (0.09 | ) | — | — | (0.09 | ) | 8.57 | 22,524 | 16.73 | 0.20 | 0.52 | 0.71 | 19 | ||||||||||||||||||||||||||||||||||||||||||
Year Ended March 31, 2010 | 5.06 | 0.10 | 2.36 | 2.46 | (0.09 | ) | — | — | (0.09 | ) | 7.43 | 22,335 | 48.74 | — | 0.33 | 1.41 | 23 | |||||||||||||||||||||||||||||||||||||||||||
Year Ended March 31, 2009 | 10.37 | 0.11 | (3.68 | ) | (3.57 | ) | (0.13 | ) | — | (c) | (1.61 | ) | (1.74 | ) | 5.06 | 13,411 | (35.39 | ) | 0.20 | 0.23 | 1.32 | 25 | ||||||||||||||||||||||||||||||||||||||
A Shares | ||||||||||||||||||||||||||||||||||||||||||||||||||||||||||||
Year Ended March 31, 2013 | 8.43 | 0.04 | (b) | 0.49 | 0.53 | (0.08 | ) | — | — | (0.08 | ) | 8.88 | 4,110 | 6.30 | 0.63 | 0.90 | 0.51 | 35 | ||||||||||||||||||||||||||||||||||||||||||
Year Ended March 31, 2012 | 8.52 | 0.05 | (b) | (0.03 | ) | 0.02 | (0.11 | ) | — | — | (0.11 | ) | 8.43 | 4,982 | 0.42 | 0.50 | 0.75 | 0.61 | 55 | |||||||||||||||||||||||||||||||||||||||||
Year Ended March 31, 2011 | 7.38 | 0.04 | (b) | 1.17 | 1.21 | (0.07 | ) | — | — | (0.07 | ) | 8.52 | 4,655 | 16.48 | 0.50 | 0.84 | 0.51 | 19 | ||||||||||||||||||||||||||||||||||||||||||
Year Ended March 31, 2010 | 5.04 | 0.07 | 2.34 | 2.41 | (0.07 | ) | — | — | (0.07 | ) | 7.38 | 2,438 | 48.02 | — | 0.63 | 1.03 | 23 | |||||||||||||||||||||||||||||||||||||||||||
Year Ended March 31, 2009 | 10.33 | 0.09 | (3.66 | ) | (3.57 | ) | (0.11 | ) | — | (c) | (1.61 | ) | (1.72 | ) | 5.04 | 1,815 | (35.50 | ) | 0.50 | 0.53 | 1.07 | 25 | ||||||||||||||||||||||||||||||||||||||
C Shares | ||||||||||||||||||||||||||||||||||||||||||||||||||||||||||||
Year Ended March 31, 2013 | 8.28 | (0.01 | )(b) | 0.46 | 0.45 | (0.04 | ) | — | — | (0.04 | ) | 8.69 | 704 | 5.47 | 1.27 | 1.56 | (0.10 | ) | 35 | |||||||||||||||||||||||||||||||||||||||||
Year Ended March 31, 2012 | 8.39 | (0.01 | )(b) | (0.02 | ) | (0.03 | ) | (0.08 | ) | — | — | (0.08 | ) | 8.28 | 811 | (0.21 | ) | 1.20 | 1.45 | (0.12 | ) | 55 | ||||||||||||||||||||||||||||||||||||||
Year Ended March 31, 2011 | 7.30 | (0.02 | )(b) | 1.16 | 1.14 | (0.05 | ) | — | — | (0.05 | ) | 8.39 | 1,059 | 15.70 | 1.20 | 1.52 | (0.33 | ) | 19 | |||||||||||||||||||||||||||||||||||||||||
Year Ended March 31, 2010 | 5.00 | 0.03 | 2.32 | 2.35 | (0.05 | ) | — | — | (0.05 | ) | 7.30 | 1,554 | 47.14 | — | 1.33 | 0.37 | 23 | |||||||||||||||||||||||||||||||||||||||||||
Year Ended March 31, 2009 | 10.29 | 0.03 | (3.65 | ) | (3.62 | ) | (0.06 | ) | — | (c) | (1.61 | ) | (1.67 | ) | 5.00 | 1,076 | (36.04 | ) | 1.20 | 1.23 | 0.39 | 25 | ||||||||||||||||||||||||||||||||||||||
See Notes to Financial Statements.
73
FINANCIAL HIGHLIGHTS
RIDGEWORTH FUNDS Selected Data For a Share of Beneficial Interest Outstanding Throughout the Periods Indicated.
| Net Asset Value, Beginning of Period | Net Investment Income (Loss) | Net Realized and Unrealized Gains (Losses) on Investments | Total from Operations | Dividends from Net Investment Income | Distributions from Tax Return of Capital | Distributions from Realized Capital Gains | Total Dividends and Distributions | Net Asset Value, End of Period | Net Assets End of Period (000) | Total Return(a) | Ratio of Net Expenses to Average Net Assets | Ratio of Expenses to Average Net Assets (Excluding Waivers and Reimbursements) | Ratio of Net Investment Income to Average Net Assets | Portfolio Turnover Rate | ||||||||||||||||||||||||||||||||||||||||||||||
Conservative Allocation Strategy(e) | ||||||||||||||||||||||||||||||||||||||||||||||||||||||||||||
I Shares | ||||||||||||||||||||||||||||||||||||||||||||||||||||||||||||
Year Ended March 31, 2013 | $ | 12.27 | $ | 0.21 | (b) | $ | 0.46 | $ | 0.67 | $ | (0.27 | ) | $ | — | $ | (0.13 | ) | $ | (0.40 | ) | $ | 12.54 | $ | 27,387 | 5.55 | % | 0.27 | % | 0.39 | % | 1.72 | % | 40 | % | ||||||||||||||||||||||||||
Year Ended March 31, 2012 | 12.07 | 0.27 | (b) | 0.38 | 0.65 | (0.34 | ) | — | (0.11 | ) | (0.45 | ) | 12.27 | 21,585 | 5.61 | 0.20 | 0.40 | 2.24 | 28 | |||||||||||||||||||||||||||||||||||||||||
Year Ended March 31, 2011 | 11.51 | 0.28 | (b) | 0.75 | 1.03 | (0.46 | ) | — | (0.01 | ) | (0.47 | ) | 12.07 | 12,897 | 9.15 | 0.20 | 0.66 | 2.41 | 28 | |||||||||||||||||||||||||||||||||||||||||
Year Ended March 31, 2010 | 9.81 | 0.27 | 1.72 | 1.99 | (0.28 | ) | — | (0.01 | ) | (0.29 | ) | 11.51 | 6,310 | 20.51 | 0.20 | 0.53 | 2.61 | 29 | ||||||||||||||||||||||||||||||||||||||||||
Year Ended March 31, 2009 | 11.11 | 0.44 | (1.10 | ) | (0.66 | ) | (0.50 | ) | — | (0.14 | ) | (0.64 | ) | 9.81 | 3,778 | (6.06 | ) | 0.20 | 0.36 | 4.08 | 48 | |||||||||||||||||||||||||||||||||||||||
A Shares | ||||||||||||||||||||||||||||||||||||||||||||||||||||||||||||
Year Ended March 31, 2013 | 12.26 | 0.17 | (b) | 0.47 | 0.64 | (0.24 | ) | — | (0.13 | ) | (0.37 | ) | 12.53 | 16,940 | 5.29 | 0.56 | 0.68 | 1.37 | 40 | |||||||||||||||||||||||||||||||||||||||||
Year Ended March 31, 2012 | 12.06 | 0.22 | (b) | 0.39 | 0.61 | (0.30 | ) | — | (0.11 | ) | (0.41 | ) | 12.26 | 24,322 | 5.32 | 0.50 | 0.70 | 1.83 | 28 | |||||||||||||||||||||||||||||||||||||||||
Year Ended March 31, 2011 | 11.51 | 0.28 | (b) | 0.71 | 0.99 | (0.43 | ) | — | (0.01 | ) | (0.44 | ) | 12.06 | 8,371 | 8.73 | 0.50 | 0.96 | 2.35 | 28 | |||||||||||||||||||||||||||||||||||||||||
Year Ended March 31, 2010 | 9.81 | 0.23 | 1.74 | 1.97 | (0.26 | ) | — | (0.01 | ) | (0.27 | ) | 11.51 | 3,137 | 20.25 | 0.50 | 0.89 | 2.27 | 29 | ||||||||||||||||||||||||||||||||||||||||||
Year Ended March 31, 2009 | 11.12 | 0.41 | (1.11 | ) | (0.70 | ) | (0.47 | ) | — | (0.14 | ) | (0.61 | ) | 9.81 | 584 | (6.42 | ) | 0.50 | 0.67 | 3.81 | 48 | |||||||||||||||||||||||||||||||||||||||
C Shares | ||||||||||||||||||||||||||||||||||||||||||||||||||||||||||||
Year Ended March 31, 2013 | 12.18 | 0.09 | (b) | 0.47 | 0.56 | (0.19 | ) | — | (0.13 | ) | (0.32 | ) | 12.42 | 15,410 | 4.58 | 1.27 | 1.35 | 0.73 | 40 | |||||||||||||||||||||||||||||||||||||||||
Year Ended March 31, 2012 | 11.99 | 0.15 | (b) | 0.38 | 0.53 | (0.23 | ) | — | (0.11 | ) | (0.34 | ) | 12.18 | 12,447 | 4.56 | 1.20 | 1.40 | 1.27 | 28 | |||||||||||||||||||||||||||||||||||||||||
Year Ended March 31, 2011 | 11.44 | 0.17 | (b) | 0.74 | 0.91 | (0.35 | ) | — | (0.01 | ) | (0.36 | ) | 11.99 | 7,305 | 8.07 | 1.20 | 1.65 | 1.47 | 28 | |||||||||||||||||||||||||||||||||||||||||
Year Ended March 31, 2010 | 9.77 | 0.16 | 1.71 | 1.87 | (0.19 | ) | — | (0.01 | ) | (0.20 | ) | 11.44 | 4,294 | 19.29 | 1.20 | 1.52 | 1.61 | 29 | ||||||||||||||||||||||||||||||||||||||||||
Year Ended March 31, 2009 | 11.09 | 0.31 | (1.08 | ) | (0.77 | ) | (0.41 | ) | — | (0.14 | ) | (0.55 | ) | 9.77 | 1,973 | (7.08 | ) | 1.20 | 1.37 | 3.17 | 48 | |||||||||||||||||||||||||||||||||||||||
Growth Allocation Strategy(e) | ||||||||||||||||||||||||||||||||||||||||||||||||||||||||||||
I Shares | ||||||||||||||||||||||||||||||||||||||||||||||||||||||||||||
Year Ended March 31, 2013 | 10.64 | 0.11 | (b) | 0.68 | 0.79 | (0.15 | ) | — | — | (0.15 | ) | 11.28 | 55,222 | 7.52 | 0.40 | 0.55 | 1.04 | 20 | ||||||||||||||||||||||||||||||||||||||||||
Year Ended March 31, 2012 | 10.56 | 0.15 | (b) | 0.15 | 0.30 | (0.22 | ) | — | — | (0.22 | ) | 10.64 | 57,078 | 3.06 | 0.20 | 0.26 | 1.53 | 49 | ||||||||||||||||||||||||||||||||||||||||||
Year Ended March 31, 2011 | 9.52 | 0.14 | (b) | 1.13 | 1.27 | (0.23 | ) | — | — | (0.23 | ) | 10.56 | 55,332 | 13.58 | 0.20 | 0.31 | 1.44 | 25 | ||||||||||||||||||||||||||||||||||||||||||
Year Ended March 31, 2010 | 7.02 | 0.15 | 2.50 | 2.65 | (0.15 | ) | — | — | (0.15 | ) | 9.52 | 54,407 | 37.92 | 0.19 | 0.24 | 1.70 | 21 | |||||||||||||||||||||||||||||||||||||||||||
Year Ended March 31, 2009 | 11.31 | 0.23 | (2.99 | ) | (2.76 | ) | (0.26 | ) | — | (1.27 | ) | (1.53 | ) | 7.02 | 40,472 | (25.01 | ) | 0.20 | 0.21 | 2.41 | 28 | |||||||||||||||||||||||||||||||||||||||
A Shares | ||||||||||||||||||||||||||||||||||||||||||||||||||||||||||||
Year Ended March 31, 2013 | 10.61 | 0.09 | (b) | 0.66 | 0.75 | (0.13 | ) | — | — | (0.13 | ) | 11.23 | 8,975 | 7.16 | 0.61 | 0.64 | 0.84 | 20 | ||||||||||||||||||||||||||||||||||||||||||
Year Ended March 31, 2012 | 10.53 | 0.12 | (b) | 0.15 | 0.27 | (0.19 | ) | — | — | (0.19 | ) | 10.61 | 11,092 | 2.76 | 0.50 | 0.56 | 1.22 | 49 | ||||||||||||||||||||||||||||||||||||||||||
Year Ended March 31, 2011 | 9.48 | 0.13 | (b) | 1.12 | 1.25 | (0.20 | ) | — | — | (0.20 | ) | 10.53 | 10,934 | 13.35 | 0.50 | 0.61 | 1.35 | 25 | ||||||||||||||||||||||||||||||||||||||||||
Year Ended March 31, 2010 | 7.00 | 0.13 | 2.48 | 2.61 | (0.13 | ) | — | — | (0.13 | ) | 9.48 | 3,638 | 37.46 | 0.49 | 0.54 | 1.39 | 21 | |||||||||||||||||||||||||||||||||||||||||||
Year Ended March 31, 2009 | 11.28 | 0.20 | (2.98 | ) | (2.78 | ) | (0.23 | ) | — | (1.27 | ) | (1.50 | ) | 7.00 | 2,776 | (25.21 | ) | 0.49 | 0.50 | 2.07 | 28 | |||||||||||||||||||||||||||||||||||||||
C Shares | ||||||||||||||||||||||||||||||||||||||||||||||||||||||||||||
Year Ended March 31, 2013 | 10.48 | 0.02 | (b) | 0.66 | 0.68 | (0.08 | ) | — | — | (0.08 | ) | 11.08 | 2,602 | 6.55 | 1.25 | 1.28 | 0.22 | 20 | ||||||||||||||||||||||||||||||||||||||||||
Year Ended March 31, 2012 | 10.41 | 0.05 | (b) | 0.15 | 0.20 | (0.13 | ) | — | — | (0.13 | ) | 10.48 | 2,793 | 2.03 | 1.20 | 1.26 | 0.50 | 49 | ||||||||||||||||||||||||||||||||||||||||||
Year Ended March 31, 2011 | 9.38 | 0.04 | (b) | 1.12 | 1.16 | (0.13 | ) | — | — | (0.13 | ) | 10.41 | 3,063 | 12.50 | 1.20 | 1.31 | 0.43 | 25 | ||||||||||||||||||||||||||||||||||||||||||
Year Ended March 31, 2010 | 6.94 | 0.07 | 2.46 | 2.53 | (0.09 | ) | — | — | (0.09 | ) | 9.38 | 3,234 | 36.53 | 1.19 | 1.24 | 0.69 | 21 | |||||||||||||||||||||||||||||||||||||||||||
Year Ended March 31, 2009 | 11.22 | 0.14 | (2.98 | ) | (2.84 | ) | (0.17 | ) | — | (1.27 | ) | (1.44 | ) | 6.94 | 2,844 | (25.88 | ) | 1.19 | 1.20 | 1.37 | 28 | |||||||||||||||||||||||||||||||||||||||
Moderate Allocation Strategy(e) | ||||||||||||||||||||||||||||||||||||||||||||||||||||||||||||
I Shares | ||||||||||||||||||||||||||||||||||||||||||||||||||||||||||||
Year Ended March 31, 2013 | 10.77 | 0.15 | (b) | 0.54 | 0.69 | (0.18 | ) | — | (0.17 | ) | (0.35 | ) | 11.11 | 139,912 | 6.60 | 0.40 | 0.43 | 1.37 | 29 | |||||||||||||||||||||||||||||||||||||||||
Year Ended March 31, 2012 | 10.60 | 0.20 | (b) | 0.27 | 0.47 | (0.28 | ) | — | (0.02 | ) | (0.30 | ) | 10.77 | 133,382 | 4.63 | 0.20 | 0.22 | 1.96 | 38 | |||||||||||||||||||||||||||||||||||||||||
Year Ended March 31, 2011 | 9.84 | 0.20 | (b) | 0.90 | 1.10 | (0.34 | ) | — | — | (0.34 | ) | 10.60 | 122,804 | 11.45 | 0.20 | 0.23 | 2.00 | 33 | ||||||||||||||||||||||||||||||||||||||||||
Year Ended March 31, 2010 | 7.76 | 0.20 | 2.09 | 2.29 | (0.21 | ) | — | — | (0.21 | ) | 9.84 | 125,016 | 29.66 | 0.19 | 0.21 | 2.22 | 21 | |||||||||||||||||||||||||||||||||||||||||||
Year Ended March 31, 2009 | 10.38 | 0.29 | (2.07 | ) | (1.78 | ) | (0.34 | ) | — | (0.50 | ) | (0.84 | ) | 7.76 | 103,606 | (17.47 | ) | 0.20 | 0.21 | 3.11 | 31 | |||||||||||||||||||||||||||||||||||||||
See Notes to Financial Statements.
74
FINANCIAL HIGHLIGHTS
RIDGEWORTH FUNDS Selected Data For a Share of Beneficial Interest Outstanding Throughout the Periods Indicated.
| Net Asset Value, Beginning of Period | Net Investment Income (Loss) | Net Realized and Unrealized Gains (Losses) on Investments | Total from Operations | Dividends from Net Investment Income | Distributions from Tax Return of Capital | Distributions from Realized Capital Gains | Total Dividends and Distributions | Net Asset Value, End of Period | Net Assets End of Period (000) | Total Return(a) | Ratio of Net Expenses to Average Net Assets | Ratio of Expenses to Average Net Assets (Excluding Waivers and Reimbursements) | Ratio of Net Investment Income to Average Net Assets | Portfolio Turnover Rate | ||||||||||||||||||||||||||||||||||||||||||||||
A Shares | ||||||||||||||||||||||||||||||||||||||||||||||||||||||||||||
Year Ended March 31, 2013 | $ | 10.75 | $ | 0.13 | (b) | $ | 0.54 | $ | 0.67 | $ | (0.17 | ) | $ | — | $ | (0.17 | ) | $ | (0.34 | ) | $ | 11.08 | $ | 19,622 | 6.36 | % | 0.58 | % | 0.59 | % | 1.19 | % | 29 | % | ||||||||||||||||||||||||||
Year Ended March 31, 2012 | 10.58 | 0.18 | (b) | 0.26 | 0.44 | (0.25 | ) | — | (0.02 | ) | (0.27 | ) | 10.75 | 20,366 | 4.33 | 0.50 | 0.52 | 1.70 | 38 | |||||||||||||||||||||||||||||||||||||||||
Year Ended March 31, 2011 | 9.82 | 0.18 | (b) | 0.89 | 1.07 | (0.31 | ) | — | — | (0.31 | ) | 10.58 | 14,416 | 11.11 | 0.50 | 0.53 | 1.79 | 33 | ||||||||||||||||||||||||||||||||||||||||||
Year Ended March 31, 2010 | 7.75 | 0.17 | 2.08 | 2.25 | (0.18 | ) | — | — | (0.18 | ) | 9.82 | 8,615 | 29.23 | 0.49 | 0.51 | 1.91 | 21 | |||||||||||||||||||||||||||||||||||||||||||
Year Ended March 31, 2009 | 10.37 | 0.25 | (2.06 | ) | (1.81 | ) | (0.31 | ) | — | (0.50 | ) | (0.81 | ) | 7.75 | 5,845 | (17.72 | ) | 0.50 | 0.51 | 2.81 | 31 | |||||||||||||||||||||||||||||||||||||||
C Shares | ||||||||||||||||||||||||||||||||||||||||||||||||||||||||||||
Year Ended March 31, 2013 | 10.69 | 0.06 | (b) | 0.54 | 0.60 | (0.12 | ) | — | (0.17 | ) | (0.29 | ) | 11.00 | 14,106 | 5.69 | 1.20 | 1.21 | 0.56 | 29 | |||||||||||||||||||||||||||||||||||||||||
Year Ended March 31, 2012 | 10.52 | 0.10 | (b) | 0.27 | 0.37 | (0.18 | ) | — | (0.02 | ) | (0.20 | ) | 10.69 | 15,028 | 3.60 | 1.20 | 1.22 | 0.95 | 38 | |||||||||||||||||||||||||||||||||||||||||
Year Ended March 31, 2011 | 9.77 | 0.09 | (b) | 0.90 | 0.99 | (0.24 | ) | — | — | (0.24 | ) | 10.52 | 15,252 | 10.29 | 1.20 | 1.23 | 0.95 | 33 | ||||||||||||||||||||||||||||||||||||||||||
Year Ended March 31, 2010 | 7.72 | 0.11 | 2.07 | 2.18 | (0.13 | ) | — | — | (0.13 | ) | 9.77 | 15,431 | 28.31 | 1.19 | 1.21 | 1.21 | 21 | |||||||||||||||||||||||||||||||||||||||||||
Year Ended March 31, 2009 | 10.34 | 0.20 | (2.07 | ) | (1.87 | ) | (0.25 | ) | — | (0.50 | ) | (0.75 | ) | 7.72 | 12,405 | (18.34 | ) | 1.20 | 1.20 | 2.08 | 31 | |||||||||||||||||||||||||||||||||||||||
| (a) | Total return excludes sales charge. Not annualized for periods less than one year. |
| (b) | Per share data calculated using average shares outstanding method. |
| (c) | Rounds to less than $0.005 per share. |
| (d) | Realized and unrealized gain (loss) per share does not correlate to the aggregate of the net realized and unrealized gain (loss) in the Statements of Operations for the year ended March 31, 2012, primarily due to the timing of the sales and repurchases of the Fund’s shares in relation to fluctuating market values for the Fund’s portfolio. |
| (e) | The Fund and its shareholders indirectly bear a pro rata share of the fees and expenses incurred by the underlying funds in which the Fund is invested. The expense ratios do not include such expense. |
See Notes to Financial Statements.
75
RIDGEWORTH FUNDS March 31, 2013
| 1. | Organization |
The RidgeWorth Funds (the “Trust”) is organized as a Massachusetts business trust and is registered under the Investment Company Act of 1940, as amended (the “1940 Act”), as an open-end management investment company. The Trust is authorized to issue an unlimited number of shares without par value. The financial statements presented herein are those of the Aggressive Growth Stock Fund, International Equity Fund, International Equity Index Fund, Large Cap Growth Stock Fund, Large Cap Value Equity Fund, Mid-Cap Value Equity Fund, Select Large Cap Growth Stock Fund, Small Cap Growth Stock Fund, Small Cap Value Equity Fund, Aggressive Growth Allocation Strategy, Conservative Allocation Strategy, Growth Allocation Strategy and Moderate Allocation Strategy (each, a “Fund” and collectively, the “Funds”).
The Aggressive Growth Stock Fund, International Equity Fund and International Equity Index Fund offer I Shares and A Shares. The Large Cap Growth Stock Fund, Large Cap Value Equity Fund, Mid-Cap Value Equity Fund, Select Large Cap Growth Stock Fund, Small Cap Growth Stock Fund, Small Cap Value Equity Fund, Aggressive Growth Allocation Strategy, Conservative Allocation Strategy, Growth Allocation Strategy and Moderate Allocation Strategy offer I Shares, A Shares and C Shares.
The assets of each Fund are segregated and a shareholder’s interest is limited to the Fund in which shares are held. Each class of shares has identical rights and privileges except with respect to fees paid under the Distribution and Service Plan, voting rights on matters affecting a single class of shares and sales charges. The A Shares of the Funds (except Conservative Allocation Strategy) have a maximum sales charge on purchases of 5.75% as a percentage of original purchase price. Conservative Allocation Strategy A Shares have a maximum sales charge on purchases of 4.75% as a percentage of original purchase price. Certain purchases of A Shares will not be subject to a front-end sales charge but will be subject to a contingent deferred sales charge (“CDSC”) of 0.75%, if redeemed within two years of purchase. The deferred sales charge may be waived from time to time for certain broker-dealers that waive payment of compensation to them. The C Shares have a maximum CDSC of 1.00% as a percentage of either the original purchase price or the next calculated price after the Funds receive a redemption request, whichever is less, if shares are redeemed within one year of purchase. There is no sales charge on purchases of I Shares.
The Trust’s officers and trustees are indemnified against certain liabilities arising out of the performance of their duties to the Trust. In addition, in the normal course of business, the Trust enters into contracts with its vendors and others that provide for general indemnifications. The Trust’s maximum exposure under these arrangements is unknown as this would involve future claims that may be made against the Trust. However, based on experience, the Trust expects that risk of loss to be remote.
| 2. | Significant Accounting Policies |
The following are significant accounting policies consistently followed by the Funds which are in conformity with accounting principles generally accepted in the U.S. (“GAAP”). Estimates and assumptions are required to be made regarding assets, liabilities and changes in net assets resulting from operations when financial statements are prepared. Changes in the economic environment, financial markets and any other parameters used in determining these estimates could cause actual results to differ.
(a) Investment Valuation — Equity securities for which market quotations are available are valued at the last reported sales price or official closing price on the primary market or exchange on which they trade. The prices are provided by independent pricing vendors approved by the Board of Trustees of the Trust (the “Board”).
The Funds, in accordance with GAAP, have adopted Financial Accounting Standards Board Codification Topic 820 (“ASC Topic 820”). ASC Topic 820 establishes a single definition of fair value, creates a three-tier hierarchy as a framework for measuring fair value based on inputs used to value the Funds’ investments, and requires additional disclosure about fair value. The hierarchy of inputs is summarized below:
| Ÿ | Level 1 — Investments whose values are based on quoted market prices in active markets, and whose values are therefore classified as Level 1 prices, include active listed equities. Investments in underlying funds are valued at their NAV daily and are classified as Level 1 prices. |
76
NOTES TO FINANCIAL STATEMENTS (continued)
RIDGEWORTH FUNDS March 31, 2013
| Ÿ | Level 2 — Investments that trade in markets that are not considered to be active, but whose values are based on quoted market prices, dealer quotations or valuations provided by alternative pricing sources supported by observable inputs are classified as Level 2 prices. These generally include U.S. government and sovereign obligations, most government agency securities, investment-grade corporate bonds, certain mortgage products, less liquid listed equities, and state, municipal and provincial obligations. |
| Ÿ | Level 3 — Investments whose values are classified as Level 3 prices have significant unobservable inputs, as they may trade infrequently or not at all. When observable prices are not available for these securities, the funds use one or more valuation techniques for which sufficient and reliable data is available. The inputs used by the funds in estimating the value of Level 3 prices may include the original transaction price, quoted prices for similar securities or assets in active markets, completed or pending third-party transactions in the underlying investment or comparable issuers, and changes in financial ratios or cash flows. Level 3 prices may also be adjusted to reflect illiquidity and/or non-transferability, with the amount of such discount estimated by the funds in the absence of market information. Assumptions used by the funds due to the lack of observable inputs may significantly impact the resulting fair value and therefore the funds’ results of operations. |
The inputs or methodology used for valuing securities are not necessarily an indication of the risk associated with investing in those securities.
The Funds use valuation techniques to measure fair value that are consistent with the market approach and/or income approach, depending on the type of security and the particular circumstance. The market approach uses prices and other relevant information generated by market transactions involving identical or comparable securities. The income approach uses valuation techniques to discount estimated future cash flows to present value.
When reliable prices are not readily available, such as when the value of a security has been significantly affected by events after the close of the exchange or market on which the security is principally traded, but before each Fund calculates its net asset value, each of the Funds values these securities in accordance with the Pricing and Valuation Procedures approved by the Board. The Pricing and Valuation Procedures are performed and monitored by a Valuation Committee (the “Committee”) designated by the Board. Some of the more common reasons which may necessitate that a security be fair valued in accordance with the Pricing and Valuation Procedures include, but are not limited to: the security’s trading has been halted or suspended; the security has been de-listed from a national exchange; the security’s primary trading market is temporarily closed at a time when under normal conditions it would be open; or the security’s primary pricing source is not able or willing to provide a price. When a security is fair valued in accordance with the Pricing and Valuation Procedures, the Committee determines the value after taking into consideration relevant information reasonably available to the Committee. Under the Pricing and Valuation Procedures, such securities may be considered Level 2 or Level 3 in the fair value hierarchy. Short-term obligations with maturities of 60 days or less are valued at amortized cost, which approximates fair value and such securities are considered Level 2 in the fair value hierarchy. Certain Funds hold securities or other assets that are denominated in a foreign currency. The Funds will normally use the currency exchange rates as of 4:00 p.m. (Eastern Time) when valuing such assets.
The assets of Aggressive Growth Allocation Strategy, Conservative Allocation Strategy, Growth Allocation Strategy and Moderate Allocation Strategy (the “Allocation Strategies”) consist of investments in other funds including affiliated funds (See Note 7), which are valued at their respective daily net asset values. Recognition of net investment income by the Allocation Strategies is affected by the timing of the declaration of dividends by the other Funds in which the Allocation Strategies invest. Also, in addition to the Allocation Strategies’ direct expenses, shareholders bear a proportionate share of the underlying Funds’ expenses.
77
NOTES TO FINANCIAL STATEMENTS (continued)
RIDGEWORTH FUNDS March 31, 2013
The following is a summary of the inputs used in valuing the Funds’ assets and liabilities carried at fair value as of March 31, 2013:
| Level 1 - Quoted Prices | Level 2 - Other Significant Observable Inputs | Level 3 - Significant Unobservable Inputs | Total | |||||||||||||
Aggressive Growth Stock Fund | ||||||||||||||||
Common Stocks1 | $19,185,915 | $— | $— | $19,185,915 | ||||||||||||
Money Market Fund | 293,510 | — | — | 293,510 | ||||||||||||
|
|
|
|
|
|
|
| |||||||||
Total Investments | 19,479,425 | — | — | 19,479,425 | ||||||||||||
|
|
|
|
|
|
|
| |||||||||
International Equity Fund | ||||||||||||||||
Common Stocks1 | 266,110,186 | — | — | 266,110,186 | ||||||||||||
Preferred Stocks1 | 4,186,555 | — | — | 4,186,555 | ||||||||||||
Short-Term Investment | — | 10,253,825 | — | 10,253,825 | ||||||||||||
Money Market Fund | 3,597,807 | — | — | 3,597,807 | ||||||||||||
|
|
|
|
|
|
|
| |||||||||
Total Investments | 273,894,548 | 10,253,825 | — | 284,148,373 | ||||||||||||
|
|
|
|
|
|
|
| |||||||||
International Equity Index Fund | ||||||||||||||||
Common Stocks1 | 214,620,670 | 822,565 | 0 | 2 | 215,443,235 | |||||||||||
Preferred Stocks1 | 2,047,678 | — | — | 2,047,678 | ||||||||||||
Rights1 | — | — | 0 | 2 | 0 | 2 | ||||||||||
Exchange Traded Funds | 6,983,840 | — | — | 6,983,840 | ||||||||||||
Trust | 50,651 | — | — | 50,651 | ||||||||||||
Short-Term Investment | — | 9,873,673 | — | 9,873,673 | ||||||||||||
Money Market Fund | 13,093 | — | — | 13,093 | ||||||||||||
|
|
|
|
|
|
|
| |||||||||
Total Investments | �� | 223,715,932 | 10,696,238 | 0 | 2 | 234,412,170 | ||||||||||
|
|
|
|
|
|
|
| |||||||||
Large Cap Growth Stock Fund | ||||||||||||||||
Common Stocks1 | 256,179,906 | — | — | 256,179,906 | ||||||||||||
Short-Term Investment | — | 1,226,275 | — | 1,226,275 | ||||||||||||
Money Market Fund | 271,009 | — | — | 271,009 | ||||||||||||
|
|
|
|
|
|
|
| |||||||||
Total Investments | 256,450,915 | 1,226,275 | — | 257,677,190 | ||||||||||||
|
|
|
|
|
|
|
| |||||||||
Large Cap Value Equity Fund | ||||||||||||||||
Common Stocks1 | 1,713,945,319 | — | — | 1,713,945,319 | ||||||||||||
Short-Term Investment | — | 2,876,625 | — | 2,876,625 | ||||||||||||
Money Market Fund | 31,897,441 | — | — | 31,897,441 | ||||||||||||
|
|
|
|
|
|
|
| |||||||||
Total Investments | 1,745,842,760 | 2,876,625 | — | 1,748,719,385 | ||||||||||||
|
|
|
|
|
|
|
| |||||||||
Mid-Cap Value Equity Fund | ||||||||||||||||
Common Stocks1 | 2,579,768,037 | — | — | 2,579,768,037 | ||||||||||||
Short-Term Investment | — | 48,345,725 | — | 48,345,725 | ||||||||||||
Money Market Fund | 112,247,598 | — | — | 112,247,598 | ||||||||||||
|
|
|
|
|
|
|
| |||||||||
Total Investments | 2,692,015,635 | 48,345,725 | — | 2,740,361,360 | ||||||||||||
|
|
|
|
|
|
|
| |||||||||
Select Large Cap Growth Stock Fund | ||||||||||||||||
Common Stocks1 | 33,579,861 | — | — | 33,579,861 | ||||||||||||
Short-Term Investment | — | 257,450 | — | 257,450 | ||||||||||||
Money Market Fund | 1,504,823 | — | — | 1,504,823 | ||||||||||||
|
|
|
|
|
|
|
| |||||||||
Total Investments | 35,084,684 | 257,450 | — | 35,342,134 | ||||||||||||
|
|
|
|
|
|
|
| |||||||||
Small Cap Growth Stock Fund | ||||||||||||||||
Common Stocks1 | 166,583,551 | — | — | 166,583,551 | ||||||||||||
Short-Term Investment | — | 18,787,977 | — | 18,787,977 | ||||||||||||
Money Market Fund | 784,973 | — | — | 784,973 | ||||||||||||
|
|
|
|
|
|
|
| |||||||||
Total Investments | 167,368,524 | 18,787,977 | — | 186,156,501 | ||||||||||||
|
|
|
|
|
|
|
| |||||||||
Small Cap Value Equity Fund | ||||||||||||||||
Common Stocks1 | 1,611,627,574 | — | — | 1,611,627,574 | ||||||||||||
Money Market Fund | 14,870,383 | — | — | 14,870,383 | ||||||||||||
|
|
|
|
|
|
|
| |||||||||
Total Investments | 1,626,497,957 | — | — | 1,626,497,957 | ||||||||||||
|
|
|
|
|
|
|
| |||||||||
78
NOTES TO FINANCIAL STATEMENTS (continued)
RIDGEWORTH FUNDS March 31, 2013
| Level 1 - Quoted Prices | Level 2 - Other Significant Observable Inputs | Level 3 - Significant Unobservable Inputs | Total | |||||||||||||
Aggressive Growth Allocation Strategy | ||||||||||||||||
Equity Funds | $16,039,519 | $— | $— | $16,039,519 | ||||||||||||
Fixed Income Funds | 3,772,255 | — | — | 3,772,255 | ||||||||||||
Exchange Traded Funds | 3,371,696 | — | — | 3,371,696 | ||||||||||||
Money Market Fund | 256,581 | — | — | 256,581 | ||||||||||||
|
|
|
|
|
|
|
| |||||||||
Total Investments | 23,440,051 | — | — | 23,440,051 | ||||||||||||
|
|
|
|
|
|
|
| |||||||||
Conservative Allocation Strategy | ||||||||||||||||
Equity Funds | 16,167,741 | — | — | 16,167,741 | ||||||||||||
Fixed Income Funds | 38,475,387 | — | — | 38,475,387 | ||||||||||||
Exchange Traded Funds | 4,609,898 | — | — | 4,609,898 | ||||||||||||
Money Market Fund | 551,274 | — | — | 551,274 | ||||||||||||
|
|
|
|
|
|
|
| |||||||||
Total Investments | 59,804,300 | — | — | 59,804,300 | ||||||||||||
|
|
|
|
|
|
|
| |||||||||
Growth Allocation Strategy | ||||||||||||||||
Equity Funds | 40,393,931 | — | — | 40,393,931 | ||||||||||||
Fixed Income Funds | 17,243,466 | — | — | 17,243,466 | ||||||||||||
Exchange Traded Funds | 8,546,060 | — | — | 8,546,060 | ||||||||||||
Money Market Fund | 714,276 | — | — | 714,276 | ||||||||||||
|
|
|
|
|
|
|
| |||||||||
Total Investments | 66,897,733 | — | — | 66,897,733 | ||||||||||||
|
|
|
|
|
|
|
| |||||||||
Moderate Allocation Strategy | ||||||||||||||||
Equity Funds | 76,513,152 | — | — | 76,513,152 | ||||||||||||
Fixed Income Funds | 77,821,449 | — | — | 77,821,449 | ||||||||||||
Exchange Traded Funds | 17,728,037 | — | — | 17,728,037 | ||||||||||||
Money Market Fund | 1,864,534 | — | — | 1,864,534 | ||||||||||||
|
|
|
|
|
|
|
| |||||||||
Total Investments | $173,927,172 | $— | $— | $173,927,172 | ||||||||||||
|
|
|
|
|
|
|
| |||||||||
| 1 | Please see the Schedules of Portfolio Investments for Sector or Country Classifications. |
| 2 | As of March 31, 2013, the securities designated as Level 3 were fair valued using significant unobservable inputs under procedures adopted by the Board. Such valuations were based on a review of inputs such as, but not limited to, values of similar securities, company specific financial information, and company specific news. For each of these securities there were no changes in the valuation techniques used since the March 31, 2012 annual report. The Level 3 securities comprised less than 0.05% of net assets of the Fund. As such, the Level 3 roll forward and change in unrealized appreciation (depreciation) of Level 3 securities held at year end have not been presented. |
The Funds’ policy is to disclose transfers between levels based on valuations at the end of the reporting period. Each portfolio may hold securities which are periodically fair valued in accordance with the Pricing and Valuation Procedures. This may result in movements between Level 1 and Level 2 throughout the period. At March 31, 2013, securities valued at $79,873 were transferred from Level 1 to Level 2 pursuant to the Pricing and Valuation Procedures for International Equity Index Fund.
(b) Security Transactions and Investment Income — Security transactions are accounted for on a trade date basis. Interest income, adjusted for amortization of premium and accretion of discount over the life of the securities, is recorded on the accrual basis. Dividend income is recorded on the ex-dividend date or as soon as practicable after the Funds determine the existence of a dividend declaration after exercising due diligence. Foreign dividend income is recorded on the ex-dividend date or as soon as practicable after the Funds determine the existence of a dividend declaration after exercising reasonable due diligence. The cost of investments sold is determined by use of the specific identification method. To the extent any issuer defaults or a credit event occurs that impacts the issuer, the Funds may halt any additional interest income accruals and consider the Funds’ ability to realize interest accrued up to the date of default or credit event.
(c) Distributions to Shareholders — Distributions from net investment income of each of the Funds are declared quarterly to shareholders of record, and are paid quarterly, except for the International Equity Fund and the International Equity Index Fund for which distributions are declared and paid annually. Distributions of net realized capital gains, if any, are declared at least annually. Distributions to shareholders from each of the Funds are recorded on the ex-dividend date and are determined in accordance with income tax regulations, which may differ from GAAP.
79
NOTES TO FINANCIAL STATEMENTS (continued)
RIDGEWORTH FUNDS March 31, 2013
(d) Expenses and Share Class Accounting — Expenses that are directly related to a specific Fund are charged to that Fund. Other operating expenses of the Trust are allocated pro-rata to the Funds on the basis of relative net assets or another appropriate basis. Investment income, common expenses, and realized/unrealized capital gains (losses) on investments are allocated to the various share classes of the Funds on the basis of relative daily net assets of each share class. Fees relating to a specific share class are charged directly to the share class.
(e) Foreign Currency Translation — Investment securities and other assets and liabilities denominated in foreign currencies are translated into U.S. dollar amounts based upon prevailing exchange rates, as of the close of regular trading on the New York Stock Exchange (usually 4:00 p.m. Eastern Time), on the date of valuation. Purchases and sales of investment securities and income and expense items denominated in foreign currencies are translated into U.S. dollar amounts based upon prevailing exchange rates on the respective dates of such transactions.
The Funds do not isolate that portion of the results of operations resulting from fluctuations in foreign exchange rates on investments from the fluctuations arising from changes in market prices of securities held. Such fluctuations are included with the net realized and unrealized gain or loss on investments and foreign currencies.
Net realized foreign exchange gains or losses arise from sales of foreign currencies, including gains and losses on forward foreign currency contracts, currency gains or losses realized between the trade and settlement dates on securities transactions, and the difference between the amounts of dividends, interest and foreign withholding taxes recorded and the amount actually received.
(f) Derivative Instruments — Certain Funds may enter into derivative contracts for the purposes of pursuing their investment objectives, to use as a substitute for a purchase or sale of a position in the underlying assets and/or as part of a strategy designed to reduce exposure to other risks. The Funds did not hold any derivative instruments during the year ended March 31, 2013.
(g) Forward Foreign Currency Contracts — Certain Funds may enter into forward foreign currency contracts to hedge against foreign currency exchange rate risk on non-U.S. dollar denominated securities or to facilitate settlement of a foreign currency denominated portfolio transaction. A forward foreign currency contract is an agreement between two parties to buy and sell a currency at a set price with delivery and settlement at a future date. The contract is marked-to-market daily and the change in value is recorded by the Fund as an unrealized gain or loss. When a forward foreign currency contract is closed, through either delivery or offset by entering into another forward foreign currency contract, the Fund recognizes a realized gain or loss equal to the difference between the value of the contract at the time it was opened and the value of the contract at the time it is closed.
Forward foreign currency contracts involve elements of market risk in excess of the amounts reflected on the Statements of Assets and Liabilities. The Funds bear the risk of an unfavorable change in the foreign exchange rate underlying the forward foreign currency contract. Risks may also arise upon entering into these contracts from the potential inability of the counterparties to meet the terms of their contracts. The Funds did not hold any forward foreign currency contracts during the year ended March 31, 2013.
(h) Securities Lending — Each Fund may lend portfolio securities to brokers, dealers and other financial organizations that meet capital and other credit requirements or other criteria established by the Board. These loans may not exceed either (i) 50% of the sum of the market value of all securities of a Fund and the market value of securities purchased with cash collateral or (ii) 33.33% of the total market value of all securities of a Fund. No Fund will lend portfolio securities to its investment adviser, subadviser, or its affiliates unless it has applied for and received specific authority to do so from the Securities and Exchange Commission. Loans of portfolio securities are required to be fully collateralized by cash, letters of credit or U.S. government securities. The initial value of the collateral must be at least 102% of the market value of the securities loaned, if the securities loaned are U.S. securities (105% for non-U.S. securities); and maintained in an amount equal to at least 100% (103% for non-U.S. securities) thereafter. However, due to market fluctuations during the day, the value of securities loaned on a particular day may exceed the value of collateral. On each business day, the amount of collateral is adjusted based on the prior day’s market fluctuations and the current day’s lending activity. Income from lending activity is determined by the amount of interest earned on collateral, less any amounts payable to the borrowers of the securities and the lending agent. Lending securities involves certain risks, including the risk that a Fund may be delayed or prevented from recovering the collateral if the borrower fails to return the securities. A fee will be obtained from the borrower if letters of credit or U.S. government securities are used as collateral.
80
NOTES TO FINANCIAL STATEMENTS (continued)
RIDGEWORTH FUNDS March 31, 2013
The cash collateral received is aggregated in a joint account by the Funds, providing RidgeWorth Investments a pool of cash to invest in short-term investments that have a remaining maturity of 397 days or less. The Funds are joint participants with other affiliated funds of the Trust that are not presented in this report. At March 31, 2013, the cash collateral received by the Funds was pooled and invested in the following securities. Each of the Funds participating in securities lending at March 31, 2013 owned a pro-rata portion of the assets and liabilities listed below:
| Shares | Value | |||||||
JPMorgan U.S. Government Money Market Fund, Capital Shares, 0.01% | 93,304,017 | $93,304,017 | ||||||
State Street Institutional U.S. Government Money Market Fund, Institutional Class, 0.01% | 222,355,346 | 222,355,346 | ||||||
|
| |||||||
Total Investments (Cost $315,659,363) | 315,659,363 | |||||||
Amount due to Lending Agent | (26,873 | ) | ||||||
|
| |||||||
Net Investment Value | $315,632,490 | |||||||
|
| |||||||
The following Funds paid securities lending fees to the lending agent during the year ended March 31, 2013, which have been netted against Income from Securities Lending on the Statements of Operations. These fees are presented below:
Fund | Fee | |||
Aggressive Growth Stock Fund | $3,614 | |||
International Equity Fund | 55,062 | |||
International Equity Index Fund | 84,253 | |||
Large Cap Growth Stock Fund | 1,432 | |||
Large Cap Value Equity Fund | 5,678 | |||
Mid-Cap Value Equity Fund | 602,883 | |||
Select Large Cap Growth Stock Fund | 367 | |||
Small Cap Growth Stock Fund | 102,469 | |||
(i) Real Estate Investment Trusts — Certain Funds may own shares of real estate investment trusts (“REITs”) which report information on the source of their distributions annually. The Funds re-characterize distributions received from REIT investments based on information provided by the REITs into the following categories: ordinary income, long-term capital gains, and return of capital. If information is not available on a timely basis from the REITs, the re-characterization will be estimated based on available information which may include the previous year’s allocation. If new or additional information becomes available from the REITs at a later date, a re-characterization will be made in the following year. The Funds record as dividend income the amount re-characterized as ordinary income and as realized gain the amount re-characterized as long-term capital gain in the Statements of Operations, and the amount re-characterized as a return of capital as a reduction to the cost of investments in the Statements of Assets and Liabilities and in the Schedules of Portfolio Investments. These re-characterizations are reflected in the accompanying financial statements.
(j) Restricted Securities — Certain Funds�� investments are restricted as to resale. All of these restricted securities have been deemed liquid by the Funds’ Investment Adviser based upon procedures approved by the Board unless stated otherwise in the Funds’ Schedules of Portfolio Investments. As of March 31, 2013, the Funds’ did not have any restricted securities.
(k) Foreign Investment Risks — Certain Funds may invest in securities of foreign issuers in various countries. Investments in securities of foreign issuers carry certain risks not ordinarily associated with investments in securities of U.S. issuers. These risks include future political and economic developments, and the possible imposition of exchange controls or other foreign governmental laws and restrictions. In addition, with respect to certain countries, there is a possibility of expropriation of assets, confiscatory taxation, political or social instability or diplomatic developments, which could adversely affect investments in those countries. Emerging market countries are countries that the World Bank or the United Nations considers to be emerging or developing. Emerging markets may be more likely to experience political turmoil or rapid changes in market or economic conditions than more developed countries. In addition, the financial stability of issuers, including governments, in emerging market countries may be more precarious than in other countries. As a result, there may to be an increased risk of price volatility associated with a Fund’s investments in emerging market countries, which may be magnified by currency fluctuations relative to the U.S. dollar. Please refer to each Fund’s prospectus for additional risk that may be associated with the Funds.
81
NOTES TO FINANCIAL STATEMENTS (continued)
RIDGEWORTH FUNDS March 31, 2013
(l) Federal and Other Taxes — It is the Funds’ policy to comply with the federal income and excise tax requirements of the Internal Revenue Code of 1986 (the “Code”), as amended, applicable to regulated investment companies. Accordingly, the Funds intend to distribute taxable income and net realized gains, if any, to shareholders in accordance with timing requirements imposed by the Code. Therefore, no federal or state income tax provision is required in the Funds’ financial statements.
Management has analyzed the Funds’ tax positions taken on income tax returns for all open tax years and has concluded that as of March 31, 2013, no provision for income tax is required in the Funds’ financial statements. The Funds’ federal and state income and federal excise tax returns for tax years for which the applicable statutes of limitations have not expired are subject to examination by the Internal Revenue Service and state departments of revenue.
Under the applicable foreign tax laws, a withholding tax may be imposed on interest, dividends and capital gains at various rates.
(m) Reclassification — GAAP requires that certain components of net assets be reclassified to reflect permanent differences between financial and tax reporting. These reclassifications have no effect on net assets or net asset value per share.
| 3. | Investment Adviser and Other Service Providers |
Investment Adviser — RidgeWorth Investments (“Investment Adviser”), a majority-owned subsidiary of SunTrust Banks, Inc. (“SunTrust”), serves as the investment adviser to the Funds. The Trust and the Investment Adviser have entered into an investment advisory agreement (“Advisory Agreement”). The Investment Adviser is a money–management holding company with multiple style-focused investment boutiques (“Subadvisers”). The Subadvisers for each of the Funds, other than the Allocation Strategies which are not subadvised, are as follows: Ceredex Value Advisors LLC serves as the Subadviser for the Large Cap Value Equity Fund, Mid-Cap Value Equity Fund and Small Cap Value Equity Fund; Certium Asset Management LLC serves as the Subadviser for the International Equity Fund and International Equity Index Fund; Silvant Capital Management LLC serves as the Subadviser for the Large Cap Growth Stock Fund, Select Large Cap Growth Stock Fund and Small Cap Growth Stock Fund; and Zevenbergen Capital Investments LLC serves as the Subadviser for the Aggressive Growth Stock Fund. Zevenbergen Capital Investments LLC is a minority-owned subsidiary of the Investment Adviser. Each of the other Subadvisers is a wholly-owned subsidiary of the Investment Adviser. The Investment Adviser pays the Subadvisers out of the investment advisory fees it receives from the Funds.
Under the terms of the Advisory Agreement, the Funds are charged annual advisory fees, which are computed daily and paid monthly based upon average daily net assets. Effective August 1, 2012 the investment advisory fees changed as described in the table below. Breakpoints are used in computing the overall annual advisory fee. The maximum annual advisory fee is charged on average daily net assets of each Fund up to $500 million. A discount of 5% applies on the next $500 million, and a discount of 10% applies on amounts over $1 billion. Fee rates for the year ended March 31, 2013 were as follows:
Fund | Maximum Annual Advisory Fee prior to August 1, 2012 | Maximum Annual Advisory Fee as of August 1, 2012 | Discounted Annual Advisory Fee | Advisory Fees Waived/ Expense Reimbursed | Net Annual Fees Paid* | |||||||||||||||
Aggressive Growth Stock Fund | 1.10 | % | 0.85 | % | 0.95 | % | (0.01 | )% | 0.94 | % | ||||||||||
International Equity Fund | 1.15 | 0.90 | 0.98 | — | 0.98 | |||||||||||||||
International Equity Index Fund | 0.50 | 0.45 | 0.47 | (0.03 | ) | 0.44 | ||||||||||||||
Large Cap Growth Stock Fund | 0.97 | 0.70 | 0.80 | — | 0.80 | |||||||||||||||
Large Cap Value Equity Fund | 0.80 | 0.70 | 0.69 | (0.02 | ) | 0.67 | ||||||||||||||
Mid-Cap Value Equity Fund | 1.00 | 0.75 | 0.77 | (0.01 | ) | 0.76 | ||||||||||||||
Select Large Cap Growth Stock Fund | 0.85 | 0.70 | 0.75 | — | 0.75 | |||||||||||||||
Small Cap Growth Stock Fund | 1.15 | 0.85 | 0.96 | — | 0.96 | |||||||||||||||
Small Cap Value Equity Fund | 1.15 | 0.85 | 0.90 | — | 0.90 | |||||||||||||||
Aggressive Growth Allocation Strategy | 0.10 | 0.10 | 0.10 | (0.38 | ) | — | ||||||||||||||
Conservative Allocation Strategy | 0.10 | 0.10 | 0.10 | (0.11 | ) | — | ||||||||||||||
Growth Allocation Strategy | 0.10 | 0.10 | 0.10 | (0.13 | ) | — | ||||||||||||||
Moderate Allocation Strategy | 0.10 | 0.10 | 0.10 | (0.02 | ) | 0.08 | ||||||||||||||
| * | Aggregate annual fees paid to the Investment Adviser, who pays the applicable Subadviser a portion of the fees for its services to the Funds. |
Amounts designated as “—” are 0%.
82
NOTES TO FINANCIAL STATEMENTS (continued)
RIDGEWORTH FUNDS March 31, 2013
The Investment Adviser and the applicable Subadviser have contractually agreed, until at least August 1, 2013, to waive fees and/or reimburse expenses for each of the following Funds to the extent necessary to maintain each Fund’s Total Annual Fund Operating Expenses (excluding, as applicable, taxes, brokerage commissions, substitute dividend expenses on securities sold short, interest expense, extraordinary expenses and indirect expenses attributable to the Fund’s investment in other funds), expressed as a percentage of average daily net assets, as noted below:
| Contractual Expense Limitations August 1, 2012 – March 31, 2013 | ||||||||||||
Fund | I Shares | A Shares | C Shares | |||||||||
Aggressive Growth Stock Fund | 1.29 | % | 1.50 | % | — | % | ||||||
International Equity Fund | 1.37 | 1.67 | — | |||||||||
International Equity Index Fund | 0.76 | 1.02 | — | |||||||||
Large Cap Growth Stock Fund | 1.16 | 1.40 | 2.10 | |||||||||
Large Cap Value Equity Fund | 0.93 | 1.18 | 1.88 | |||||||||
Mid-Cap Value Equity Fund | 1.14 | 1.35 | 1.95 | |||||||||
Select Large Cap Growth Stock Fund | 1.09 | 1.39 | 2.09 | |||||||||
Small Cap Growth Stock Fund | 1.33 | 1.60 | 2.25 | |||||||||
Small Cap Value Equity Fund | 1.31 | 1.55 | 2.15 | |||||||||
Aggressive Growth Allocation Strategy | 0.50 | 0.70 | 1.30 | |||||||||
Conservative Allocation Strategy | 0.30 | 0.60 | 1.30 | |||||||||
Growth Allocation Strategy | 0.50 | 0.70 | 1.30 | |||||||||
Moderate Allocation Strategy | 0.50 | 0.70 | 1.30 | |||||||||
For the period April 1, 2012 to July 31, 2012 the Contractual Expense Limitations were as follows:
Fund | I Shares | A Shares | C Shares | |||||||||
Aggressive Growth Allocation Strategy | 0.20 | 0.50 | 1.20 | |||||||||
Conservative Allocation Strategy | 0.20 | 0.50 | 1.20 | |||||||||
Growth Allocation Strategy | 0.20 | 0.50 | 1.20 | |||||||||
Moderate Allocation Strategy | 0.20 | 0.50 | 1.20 | |||||||||
Under the Expense Limitation Agreement, the Investment Adviser may retain the difference between the Contractual Expense Limitation identified above and the actual total expenses to recapture any of its prior contractual waivers or reimbursements at a date not to exceed three years from the date of such waivers or reimbursements. Such repayments shall be made monthly, but only to the extent that such repayments would not cause the annualized total expense ratio to exceed the contractual expense limitation in place at that time. During the year ended March 31, 2013, the Investment Adviser did not recapture any of its prior contractual waivers or reimbursements. As of March 31, 2013, the cumulative potential recoupments recoverable pursuant to this agreement are as follows:
| Expires | ||||||||||||
Fund | 2014 | 2015 | 2016 | |||||||||
Aggressive Growth Stock Fund | $— | $— | $7,685 | |||||||||
International Equity Index Fund | — | — | 83,256 | |||||||||
Large Cap Growth Stock Fund | — | — | 373 | |||||||||
Large Cap Value Equity Fund | — | — | 275,540 | |||||||||
Mid-Cap Value Equity Fund | — | — | 174,546 | |||||||||
Select Large Cap Growth Stock Fund | — | — | 71 | |||||||||
Small Cap Growth Stock Fund | — | — | 24 | |||||||||
Small Cap Value Equity Fund | — | — | 2,051 | |||||||||
Aggressive Growth Allocation Strategy | 88,530 | 63,460 | 87,752 | |||||||||
Conservative Allocation Strategy | 93,778 | 75,713 | 65,489 | |||||||||
Growth Allocation Strategy | 73,522 | 42,458 | 86,203 | |||||||||
Moderate Allocation Strategy | 43,102 | 34,791 | 36,646 | |||||||||
Amounts designated as “—” are $0.
83
NOTES TO FINANCIAL STATEMENTS (continued)
RIDGEWORTH FUNDS March 31, 2013
Fund Accounting, Custody, Administration, and Transfer Agency — State Street Bank and Trust Company (“State Street Bank”) serves as the fund accounting agent and custodian for the Trust pursuant to a Master Custodian Agreement. The custodian is responsible for the safekeeping of the assets of the Funds and the fund accounting agent is responsible for calculating the Funds’ net asset values. State Street Bank, as the Funds’ custodian and fund accounting agent, is paid on the basis of net assets and transaction costs of the Funds. State Street Bank also serves as the administrator for the Trust pursuant to an Administration Agreement. State Street Bank, as the Funds’ administrator, is paid on the basis of net assets of the RidgeWorth Funds which are allocated among the series of the Trust, on the basis of relative net assets.
Boston Financial Data Services, Inc. (“BFDS”) serves as the transfer agent to the Trust pursuant to a Transfer Agency and Service Agreement. BFDS is paid on the basis of net assets, per account fees and certain transaction costs.
Custodian Credits — The Funds have an agreement with their custodian under which custody fees may be reduced by balance credits. These credits, if any, are shown as a reduction of total expenses on the Statements of Operations.
Distribution — The Trust and RidgeWorth Distributors LLC (the “Distributor”) are parties to a Distribution Agreement.
In addition, with respect to the A Shares and C Shares, the Distributor receives amounts, pursuant to a Distribution and Service Plan, based upon average daily net assets of each respective class, which are computed daily and paid monthly. For the year ended March 31, 2013, the Distributor did not retain any of the front end sales charges assessed on the sale of Class A Shares. For the year ended March 31, 2013, the Distributor did not retain any commissions from contingent deferred sales charges assessed on the redemption of Class C Shares. These fees, expressed as a percentage of average daily net assets, for the year ended March 31, 2013, were as follows:
Fund | A Share Distribution and Service Fee | C Share Distribution and Service Fee | ||||||
Aggressive Growth Stock Fund | 0.30 | % | N/A | % | ||||
International Equity Fund | 0.30 | N/A | ||||||
International Equity Index Fund | 0.30 | N/A | ||||||
Large Cap Growth Stock Fund | 0.30 | 1.00 | ||||||
Large Cap Value Equity Fund | 0.30 | 1.00 | ||||||
Mid-Cap Value Equity Fund | 0.30 | 1.00 | ||||||
Select Large Cap Growth Stock Fund | 0.30 | 1.00 | ||||||
Small Cap Growth Stock Fund | 0.30 | 1.00 | ||||||
Small Cap Value Equity Fund | 0.30 | 1.00 | ||||||
Aggressive Growth Allocation Strategy | 0.30 | 1.00 | ||||||
Conservative Allocation Strategy | 0.30 | 1.00 | ||||||
Growth Allocation Strategy | 0.30 | 1.00 | ||||||
Moderate Allocation Strategy | 0.30 | 1.00 | ||||||
Shareholder Servicing Fees — Effective August 1, 2012, the Funds have adopted a shareholder services fee for the I Shares and A Shares. Each of these Funds (or class thereof, as the case may be) may pay to financial institutions that provide certain services to the Funds a services fee. The services may include, among others, providing general shareholder liaison services (including responding to shareholder inquiries), providing information on shareholder investments, and establishing and maintaining shareholder accounts and records. Prior to August 1, 2012, the
84
NOTES TO FINANCIAL STATEMENTS (continued)
RIDGEWORTH FUNDS March 31, 2013
International Equity Index Fund had adopted a shareholder services fee for I Shares and A Shares paying a rate of up to 0.15% of the average daily net assets of the classes. The Funds may pay a shareholder services fee up to an annual rate of average daily net assets of a Fund’s I Shares or A Shares as follows:
Fund | Maximum Shareholder Servicing Fee for I Shares and A Shares Effective August 1, 2012 | |||
Aggressive Growth Stock Fund | 0.40 | % | ||
International Equity Fund | 0.40 | |||
International Equity Index Fund | 0.40 | |||
Large Cap Growth Stock Fund | 0.40 | |||
Large Cap Value Equity Fund | 0.40 | |||
Mid-Cap Value Equity Fund | 0.40 | |||
Select Large Cap Growth Stock Fund | 0.40 | |||
Small Cap Growth Stock Fund | 0.40 | |||
Small Cap Value Equity Fund | 0.40 | |||
Aggressive Growth Allocation Strategy | 0.40 | |||
Conservative Allocation Strategy | 0.20 | |||
Growth Allocation Strategy | 0.40 | |||
Moderate Allocation Strategy | 0.40 | |||
Other Fees — The Investment Adviser provides compliance and certain administrative services to the Trust to ensure compliance with applicable laws and regulations. For the year ended March 31, 2013, the Investment Adviser was paid $1,475,865 for these services. Foreside Compliance Services, LLC (“FCS”), an affiliate of the Distributor, provided Chief Compliance Officer Support Services until May 31, 2012. FCS continues to provide an Anti-Money Laundering Officer/ Identity Theft Prevention Officer (“AML Officer”) to the Trust. Foreside Management Services, LLC (“FMS”), an affiliate of the Distributor, provided a Principal Financial Officer (“PFO”) and Treasurer to the Trust until August 30, 2012. Fees paid to FCS and FMS pursuant to these agreements are reflected on the Statements of Operations as a component of the caption “Other Fees”.
Neither FCS nor FMS, nor any of their officers or employees who serve as an officer of the Trust, has any role in determining the Funds’ investment policies or which securities are to be purchased or sold by the Trust or its Funds. Certain officers or employees of FCS and FMS are also officers of the Trust.
Certain officers of the Trust are also officers or employees of the Investment Adviser, FCS, FMS and/or the Administrator. Such officers receive no fees from the Trust for serving as officers of the Trust.
Each of the Trustees receives an annual retainer and an additional fee for each meeting attended, plus reimbursement for certain expenses incurred. Trustees receive an additional fee for attendance at committee meetings. Information on the aggregate remuneration paid to the Trustees can be found on the Statements of Operations.
| 4. | Capital Stock Transactions |
Transactions in capital shares and dollars for the years ended March 31 were as follows:
| Shares Issued | Shares Issued- Merger | Shares Reinvested | Shares Redeemed | Net Increase (Decrease) in Shares Outstanding | Proceeds from Shares Issued | Issued- Merger | Dividends Reinvested | Cost of Shares Redeemed | Change in Net Assets from Capital Transactions | |||||||||||||||||||||||||||||||
Aggressive Growth Stock Fund | ||||||||||||||||||||||||||||||||||||||||
I Shares | ||||||||||||||||||||||||||||||||||||||||
3/31/2013 | 788,384 | 557,942 | 33,966 | (5,894,902 | ) | (4,514,610 | ) | $11,308,991 | $8,812,408 | $516,966 | $(87,762,071 | ) | $(67,123,706 | ) | ||||||||||||||||||||||||||
3/31/2012 | 1,626,118 | — | — | (4,278,976 | ) | (2,652,858 | ) | 24,729,051 | — | — | (61,567,383 | ) | (36,838,332 | ) | ||||||||||||||||||||||||||
A Shares | ||||||||||||||||||||||||||||||||||||||||
3/31/2013 | 59,421 | 211,048 | 8,544 | (287,462 | ) | (8,449 | ) | 850,407 | 3,249,658 | 126,281 | (4,108,929 | ) | 117,417 | |||||||||||||||||||||||||||
3/31/2012 | 96,875 | — | — | (70,855 | ) | 26,020 | 1,408,939 | — | — | (1,013,170 | ) | 395,769 | ||||||||||||||||||||||||||||
85
NOTES TO FINANCIAL STATEMENTS (continued)
RIDGEWORTH FUNDS March 31, 2013
| Shares Issued | Shares Issued- Merger | Shares Reinvested | Shares Redeemed | Net Increase (Decrease) in Shares Outstanding | Proceeds from Shares Issued | Issued- Merger | Dividends Reinvested | Cost of Shares Redeemed | Change in Net Assets from Capital Transactions | |||||||||||||||||||||||||||||||
International Equity Fund |
| |||||||||||||||||||||||||||||||||||||||
I Shares | ||||||||||||||||||||||||||||||||||||||||
3/31/2013 | 304,538 | — | 416,386 | (1,649,890 | ) | (928,966 | ) | $3,324,959 | $— | $4,701,003 | $(18,175,126 | ) | $(10,149,164 | ) | ||||||||||||||||||||||||||
3/31/2012 | 5,596,283 | — | 496,938 | (3,450,251 | ) | 2,642,970 | 58,713,472 | — | 4,596,680 | (36,444,961 | ) | 26,865,191 | ||||||||||||||||||||||||||||
A Shares | ||||||||||||||||||||||||||||||||||||||||
3/31/2013 | 46,148 | — | 6,677 | (173,706 | ) | (120,881 | ) | 456,522 | — | 74,655 | (1,832,975 | ) | (1,301,798 | ) | ||||||||||||||||||||||||||
3/31/2012 | 16,937 | — | 11,129 | (139,420 | ) | (111,354 | ) | 190,384 | — | 101,939 | (1,450,095 | ) | (1,157,772 | ) | ||||||||||||||||||||||||||
International Equity Index Fund |
| |||||||||||||||||||||||||||||||||||||||
I Shares | ||||||||||||||||||||||||||||||||||||||||
3/31/2013 | 4,332,693 | — | 1,348,589 | (16,251,788 | ) | (10,570,506 | ) | 48,282,851 | — | 15,845,914 | (189,428,895 | ) | (125,300,130 | ) | ||||||||||||||||||||||||||
3/31/2012 | 6,420,490 | — | 1,268,810 | (13,983,334 | ) | (6,294,034 | ) | 76,107,924 | — | 12,916,486 | (168,138,240 | ) | (79,113,830 | ) | ||||||||||||||||||||||||||
A Shares | ||||||||||||||||||||||||||||||||||||||||
3/31/2013 | 40,234 | — | 9,776 | (48,644 | ) | 1,366 | 462,359 | — | 114,083 | (553,606 | ) | 22,836 | ||||||||||||||||||||||||||||
3/31/2012 | 8,711 | — | 8,483 | (131,926 | ) | (114,732 | ) | 101,387 | — | 85,763 | (1,641,750 | ) | (1,454,600 | ) | ||||||||||||||||||||||||||
Large Cap Growth Stock Fund |
| |||||||||||||||||||||||||||||||||||||||
I Shares | ||||||||||||||||||||||||||||||||||||||||
3/31/2013 | 8,762,312 | 3,492,724 | 6,542,464 | (18,751,521 | ) | 45,979 | 79,445,415 | 28,329,532 | 60,617,967 | (182,678,497 | ) | (14,285,583 | ) | |||||||||||||||||||||||||||
3/31/2012 | 5,811,589 | — | — | (20,795,612 | ) | (14,984,023 | ) | 64,833,009 | — | — | (233,393,457 | ) | (168,560,448 | ) | ||||||||||||||||||||||||||
A Shares | ||||||||||||||||||||||||||||||||||||||||
3/31/2013 | 158,522 | 2,081,782 | 2,317,669 | (616,140 | ) | 3,941,833 | 1,681,719 | 14,767,859 | 18,358,150 | (6,317,343 | ) | 28,490,385 | ||||||||||||||||||||||||||||
3/31/2012 | 88,664 | — | — | (587,259 | ) | (498,595 | ) | 942,481 | — | — | (6,211,143 | ) | (5,268,662 | ) | ||||||||||||||||||||||||||
C Shares | ||||||||||||||||||||||||||||||||||||||||
3/31/2013 | 132,952 | 2,887,824 | 1,226,477 | (358,038 | ) | 3,889,215 | 1,079,328 | 16,103,232 | 7,826,769 | (3,007,801 | ) | 22,001,528 | ||||||||||||||||||||||||||||
3/31/2012 | 25,221 | — | — | (240,228 | ) | (215,007 | ) | 231,204 | — | — | (2,234,105 | ) | (2,002,901 | ) | ||||||||||||||||||||||||||
Large Cap Value Equity Fund |
| |||||||||||||||||||||||||||||||||||||||
I Shares | ||||||||||||||||||||||||||||||||||||||||
3/31/2013 | 25,077,003 | — | 1,207,277 | (78,972,114 | ) | (52,687,834 | ) | 354,165,533 | — | 16,765,852 | (1,086,885,991 | ) | (715,954,606 | ) | ||||||||||||||||||||||||||
3/31/2012 | 69,828,153 | — | 1,587,865 | (27,326,887 | ) | 44,089,131 | 879,686,571 | — | 19,627,732 | (347,454,062 | ) | 551,860,241 | ||||||||||||||||||||||||||||
A Shares | ||||||||||||||||||||||||||||||||||||||||
3/31/2013 | 5,227,404 | — | 233,944 | (4,154,538 | ) | 1,306,810 | 72,308,180 | — | 3,234,975 | (57,728,124 | ) | 17,815,031 | ||||||||||||||||||||||||||||
3/31/2012 | 13,741,624 | — | 176,882 | (2,820,367 | ) | 11,098,139 | 171,860,902 | — | 2,178,699 | (35,196,794 | ) | 138,842,807 | ||||||||||||||||||||||||||||
C Shares | ||||||||||||||||||||||||||||||||||||||||
3/31/2013 | 27,761 | — | 9,206 | (235,035 | ) | (198,068 | ) | 386,924 | — | 125,947 | (3,174,972 | ) | (2,662,101 | ) | ||||||||||||||||||||||||||
3/31/2012 | 108,014 | — | 7,922 | (269,169 | ) | (153,233 | ) | 1,371,194 | — | 95,112 | (3,348,315 | ) | (1,882,009 | ) | ||||||||||||||||||||||||||
Mid-Cap Value Equity Fund |
| |||||||||||||||||||||||||||||||||||||||
I Shares | ||||||||||||||||||||||||||||||||||||||||
3/31/2013 | 62,732,655 | — | 1,925,608 | (50,367,052 | ) | 14,291,211 | 719,919,716 | — | 22,073,312 | (555,762,209 | ) | 186,230,819 | ||||||||||||||||||||||||||||
3/31/2012 | 85,512,061 | 1,410,657 | 14,126,079 | (84,002,281 | ) | 17,046,516 | 959,791,303 | 18,547,460 | 135,070,674 | (920,320,239 | ) | 193,089,198 | ||||||||||||||||||||||||||||
A Shares | ||||||||||||||||||||||||||||||||||||||||
3/31/2013 | 11,406,198 | — | 461,060 | (13,492,122 | ) | (1,624,864 | ) | 129,440,290 | — | 5,246,696 | (150,886,423 | ) | (16,199,437 | ) | ||||||||||||||||||||||||||
3/31/2012 | 38,483,179 | 428,187 | 4,089,224 | (23,508,479 | ) | 19,492,111 | 421,347,757 | 5,590,801 | 38,636,252 | (245,373,665 | ) | 220,201,145 | ||||||||||||||||||||||||||||
C Shares | ||||||||||||||||||||||||||||||||||||||||
3/31/2013 | 995,372 | — | 28,006 | (701,152 | ) | 322,226 | 11,399,374 | — | 318,911 | (7,728,920 | ) | 3,989,365 | ||||||||||||||||||||||||||||
3/31/2012 | 1,858,431 | 299,574 | 314,555 | (538,556 | ) | 1,934,004 | 20,487,726 | 3,865,760 | 2,918,706 | (5,747,555 | ) | 21,524,637 | ||||||||||||||||||||||||||||
Select Large Cap Growth Stock Fund |
| |||||||||||||||||||||||||||||||||||||||
I Shares | ||||||||||||||||||||||||||||||||||||||||
3/31/2013 | 37,628 | — | 190,215 | (509,604 | ) | (281,761 | ) | 1,203,212 | — | 4,850,470 | (15,353,795 | ) | (9,300,113 | ) | ||||||||||||||||||||||||||
3/31/2012 | 178,231 | — | 30,988 | (1,670,169 | ) | (1,460,950 | ) | 5,493,891 | — | 859,924 | (51,071,793 | ) | (44,717,978 | ) | ||||||||||||||||||||||||||
A Shares | ||||||||||||||||||||||||||||||||||||||||
3/31/2013 | 83 | — | 6,442 | (1,257 | ) | 5,268 | 2,453 | — | 160,161 | (33,901 | ) | 128,713 | ||||||||||||||||||||||||||||
3/31/2012 | 2,726 | — | 648 | (1,223 | ) | 2,151 | 81,352 | — | 17,670 | (35,232 | ) | 63,790 | ||||||||||||||||||||||||||||
C Shares | ||||||||||||||||||||||||||||||||||||||||
3/31/2013 | 4,832 | — | 140,854 | (78,515 | ) | 67,171 | 135,280 | — | 3,029,774 | (2,037,254 | ) | 1,127,800 | ||||||||||||||||||||||||||||
3/31/2012 | 3,845 | — | 16,543 | (113,852 | ) | (93,464 | ) | 105,263 | — | 406,292 | (3,176,044 | ) | (2,664,489 | ) | ||||||||||||||||||||||||||
86
NOTES TO FINANCIAL STATEMENTS (continued)
RIDGEWORTH FUNDS March 31, 2013
| Shares Issued | Shares Issued- Merger | Shares Reinvested | Shares Redeemed | Net Increase (Decrease) in Shares Outstanding | Proceeds from Shares Issued | Issued- Merger | Dividends Reinvested | Cost of Shares Redeemed | Change in Net Assets from Capital Transactions | |||||||||||||||||||||||||||||||
Small Cap Growth Stock Fund |
| |||||||||||||||||||||||||||||||||||||||
I Shares | ||||||||||||||||||||||||||||||||||||||||
3/31/2013 | 2,798,661 | — | 2,789,975 | (11,396,095 | ) | (5,807,459 | ) | $45,926,399 | $— | $42,259,903 | $(180,400,770 | ) | $(92,214,468 | ) | ||||||||||||||||||||||||||
3/31/2012 | 6,885,739 | — | — | (15,121,362 | ) | (8,235,623 | ) | 112,609,048 | — | — | (243,856,993 | ) | (131,247,945 | ) | ||||||||||||||||||||||||||
A Shares | ||||||||||||||||||||||||||||||||||||||||
3/31/2013 | 60,266 | — | 149,202 | (122,170 | ) | 87,298 | 903,912 | — | 2,088,761 | (1,867,429 | ) | 1,125,244 | ||||||||||||||||||||||||||||
3/31/2012 | 46,254 | — | — | (182,012 | ) | (135,758 | ) | 696,531 | — | — | (2,724,957 | ) | (2,028,426 | ) | ||||||||||||||||||||||||||
C Shares | ||||||||||||||||||||||||||||||||||||||||
3/31/2013 | 4,954 | — | 143,157 | (158,324 | ) | (10,213 | ) | 64,955 | — | 1,652,832 | (2,090,516 | ) | (372,729 | ) | ||||||||||||||||||||||||||
3/31/2012 | 36,444 | — | — | (139,651 | ) | (103,207 | ) | 462,006 | — | — | (1,853,792 | ) | (1,391,786 | ) | ||||||||||||||||||||||||||
Small Cap Value Equity Fund |
| |||||||||||||||||||||||||||||||||||||||
I Shares | ||||||||||||||||||||||||||||||||||||||||
3/31/2013 | 29,517,746 | — | 3,934,578 | (27,033,313 | ) | 6,419,011 | 394,490,003 | — | 54,130,475 | (368,373,204 | ) | 80,247,274 | ||||||||||||||||||||||||||||
3/31/2012 | 37,845,538 | — | 4,784,661 | (26,796,563 | ) | 15,833,636 | 502,225,850 | — | 57,746,278 | (354,015,396 | ) | 205,956,732 | ||||||||||||||||||||||||||||
A Shares | ||||||||||||||||||||||||||||||||||||||||
3/31/2013 | 2,673,326 | — | 502,626 | (3,692,806 | ) | (516,854 | ) | 36,010,599 | — | 6,803,700 | (49,797,465 | ) | (6,983,166 | ) | ||||||||||||||||||||||||||
3/31/2012 | 6,644,955 | — | 624,588 | (2,029,258 | ) | 5,240,285 | 88,266,630 | — | 7,388,778 | (26,759,201 | ) | 68,896,207 | ||||||||||||||||||||||||||||
C Shares | ||||||||||||||||||||||||||||||||||||||||
3/31/2013 | 242,514 | — | 96,752 | (786,699 | ) | (447,433 | ) | 3,113,186 | — | 1,253,054 | (10,175,062 | ) | (5,808,822 | ) | ||||||||||||||||||||||||||
3/31/2012 | 867,408 | — | 143,037 | (405,163 | ) | 605,282 | 11,163,851 | — | 1,616,134 | (5,072,204 | ) | 7,707,781 | ||||||||||||||||||||||||||||
Aggressive Growth Allocation Strategy |
| |||||||||||||||||||||||||||||||||||||||
I Shares | ||||||||||||||||||||||||||||||||||||||||
3/31/2013 | 350,315 | — | 21,814 | (531,727 | ) | (159,598 | ) | 2,953,940 | — | 182,013 | (4,430,143 | ) | (1,294,190 | ) | ||||||||||||||||||||||||||
3/31/2012 | 775,231 | — | 45,062 | (1,212,010 | ) | (391,717 | ) | 6,050,805 | — | 332,307 | (9,645,702 | ) | (3,262,590 | ) | ||||||||||||||||||||||||||
A Shares | ||||||||||||||||||||||||||||||||||||||||
3/31/2013 | 31,340 | — | 4,364 | (163,451 | ) | (127,747 | ) | 259,482 | — | 36,257 | (1,351,281 | ) | (1,055,542 | ) | ||||||||||||||||||||||||||
3/31/2012 | 139,029 | — | 7,235 | (102,089 | ) | 44,175 | 1,123,365 | — | 52,911 | (805,786 | ) | 370,490 | ||||||||||||||||||||||||||||
C Shares | ||||||||||||||||||||||||||||||||||||||||
3/31/2013 | 4,422 | — | 431 | (21,962 | ) | (17,109 | ) | 35,875 | — | 3,554 | (180,543 | ) | (141,114 | ) | ||||||||||||||||||||||||||
3/31/2012 | 4,171 | — | 1,016 | (33,429 | ) | (28,242 | ) | 32,250 | — | 7,268 | (268,055 | ) | (228,537 | ) | ||||||||||||||||||||||||||
Conservative Allocation Strategy |
| |||||||||||||||||||||||||||||||||||||||
I Shares | ||||||||||||||||||||||||||||||||||||||||
3/31/2013 | 1,022,598 | — | 50,141 | (648,506 | ) | 424,233 | 12,555,695 | — | 613,108 | (7,992,721 | ) | 5,176,082 | ||||||||||||||||||||||||||||
3/31/2012 | 1,479,451 | — | 41,087 | (829,810 | ) | 690,728 | 17,650,865 | — | 480,880 | (9,940,112 | ) | 8,191,633 | ||||||||||||||||||||||||||||
A Shares | ||||||||||||||||||||||||||||||||||||||||
3/31/2013 | 275,304 | — | 45,505 | (952,163 | ) | (631,354 | ) | 3,384,054 | — | 556,374 | (11,592,246 | ) | (7,651,818 | ) | ||||||||||||||||||||||||||
3/31/2012 | 1,571,627 | — | 32,743 | (314,989 | ) | 1,289,381 | 18,713,370 | — | 383,291 | (3,788,403 | ) | 15,308,258 | ||||||||||||||||||||||||||||
C Shares | ||||||||||||||||||||||||||||||||||||||||
3/31/2013 | 399,970 | — | 26,155 | (206,682 | ) | 219,443 | 4,893,645 | — | 317,879 | (2,528,423 | ) | 2,683,101 | ||||||||||||||||||||||||||||
3/31/2012 | 530,270 | — | 17,513 | (135,393 | ) | 412,390 | 6,296,542 | — | 202,612 | (1,618,695 | ) | 4,880,459 | ||||||||||||||||||||||||||||
Growth Allocation Strategy |
| |||||||||||||||||||||||||||||||||||||||
I Shares | ||||||||||||||||||||||||||||||||||||||||
3/31/2013 | 1,299,488 | — | 69,802 | (1,834,564 | ) | (465,274 | ) | 13,790,952 | — | 737,347 | (19,498,083 | ) | (4,969,784 | ) | ||||||||||||||||||||||||||
3/31/2012 | 1,698,468 | — | 119,766 | (1,695,316 | ) | 122,918 | 17,146,643 | — | 1,156,952 | (17,156,100 | ) | 1,147,495 | ||||||||||||||||||||||||||||
A Shares | ||||||||||||||||||||||||||||||||||||||||
3/31/2013 | 58,650 | — | 11,031 | (316,332 | ) | (246,651 | ) | 624,908 | — | 116,319 | (3,380,801 | ) | (2,639,574 | ) | ||||||||||||||||||||||||||
3/31/2012 | 202,080 | — | 19,155 | (214,430 | ) | 6,805 | 2,051,893 | — | 183,884 | (2,141,808 | ) | 93,969 | ||||||||||||||||||||||||||||
C Shares | ||||||||||||||||||||||||||||||||||||||||
3/31/2013 | 19,707 | — | 1,761 | (53,088 | ) | (31,620 | ) | 207,384 | — | 18,512 | (555,888 | ) | (329,992 | ) | ||||||||||||||||||||||||||
3/31/2012 | 21,820 | — | 3,521 | (53,175 | ) | (27,834 | ) | 222,213 | — | 33,212 | (524,127 | ) | (268,702 | ) | ||||||||||||||||||||||||||
Moderate Allocation Strategy |
| |||||||||||||||||||||||||||||||||||||||
I Shares | ||||||||||||||||||||||||||||||||||||||||
3/31/2013 | 3,122,940 | — | 413,981 | (3,326,842 | ) | 210,079 | 33,410,361 | — | 4,414,077 | (36,008,340 | ) | 1,816,098 | ||||||||||||||||||||||||||||
3/31/2012 | 3,726,374 | — | 341,449 | (3,265,148 | ) | 802,675 | 38,576,165 | — | 3,435,555 | (33,442,177 | ) | 8,569,543 | ||||||||||||||||||||||||||||
A Shares | ||||||||||||||||||||||||||||||||||||||||
3/31/2013 | 98,860 | — | 54,504 | (277,543 | ) | (124,179 | ) | 1,059,492 | — | 580,399 | (2,975,776 | ) | (1,335,885 | ) | ||||||||||||||||||||||||||
3/31/2012 | 812,948 | — | 38,473 | (318,697 | ) | 532,724 | 8,378,039 | — | 386,242 | (3,275,586 | ) | 5,488,695 | ||||||||||||||||||||||||||||
C Shares | ||||||||||||||||||||||||||||||||||||||||
3/31/2013 | 74,145 | — | 32,577 | (230,845 | ) | (124,123 | ) | 792,237 | — | 345,909 | (2,449,474 | ) | (1,311,328 | ) | ||||||||||||||||||||||||||
3/31/2012 | 145,884 | — | 25,304 | (214,543 | ) | (43,355 | ) | 1,498,055 | — | 251,332 | (2,213,144 | ) | (463,757 | ) | ||||||||||||||||||||||||||
87
NOTES TO FINANCIAL STATEMENTS (continued)
RIDGEWORTH FUNDS March 31, 2013
| 5. | Investment Transactions |
The cost of security purchases and the proceeds from sales and maturities of securities, excluding securities maturing less than one year from acquisition and U.S. government securities, for the year ended March 31, 2013 were as follows:
Fund | Purchases | Sales and Maturities | ||||||
Aggressive Growth Stock Fund | $15,397,932 | 97,753,294 | ||||||
International Equity Fund | 133,981,825 | 147,566,974 | ||||||
International Equity Index Fund | 72,372,234 | 205,230,932 | ||||||
Large Cap Growth Stock Fund | 105,286,467 | 228,021,432 | ||||||
Large Cap Value Equity Fund | 1,401,069,758 | 1,608,377,480 | ||||||
Mid-Cap Value Equity Fund | 2,871,809,792 | 2,631,050,358 | ||||||
Select Large Cap Growth Stock Fund | 22,996,772 | 38,605,398 | ||||||
Small Cap Growth Stock Fund | 117,939,620 | 260,821,053 | ||||||
Small Cap Value Equity Fund | 461,902,750 | 386,000,725 | ||||||
Aggressive Growth Allocation Strategy | 7,798,872 | 9,586,681 | ||||||
Conservative Allocation Strategy | 23,410,309 | 23,519,576 | ||||||
Growth Allocation Strategy | 13,253,670 | 20,972,168 | ||||||
Moderate Allocation Strategy | 49,876,771 | 52,128,519 | ||||||
| 6. | Federal Income Tax Information |
The following information is presented on an income tax basis and takes into consideration differences between amounts for financial statement and income tax purposes. These “book/tax” differences are either considered temporary or permanent in nature. To the extent these differences are permanent in nature (i.e., foreign currency transactions and return of capital on securities) such amounts are reclassified within the composition of net assets based on their U.S. federal tax-basis treatment; temporary differences do not require reclassification.
The cost of investments and aggregate gross unrealized appreciation and depreciation for securities held by the Funds at March 31, 2013 were as follows:
Fund | Tax Cost | Aggregate Gross Unrealized Appreciation | Aggregate Gross Unrealized (Depreciation) | Net Unrealized Appreciation (Depreciation) | ||||||||||||
Aggressive Growth Stock Fund | $9,459,961 | $10,165,303 | $(145,839 | ) | $10,019,464 | |||||||||||
International Equity Fund | 245,963,832 | 43,247,861 | (5,063,320 | ) | 38,184,541 | |||||||||||
International Equity Index Fund | 155,305,689 | 87,813,556 | (8,707,075 | ) | 79,106,481 | |||||||||||
Large Cap Growth Stock Fund | 189,826,719 | 68,700,710 | (850,239 | ) | 67,850,471 | |||||||||||
Large Cap Value Equity Fund | 1,397,180,335 | 353,283,956 | (1,744,906 | ) | 351,539,050 | |||||||||||
Mid-Cap Value Equity Fund | 2,443,545,277 | 320,483,635 | (23,667,552 | ) | 296,816,083 | |||||||||||
Select Large Cap Growth Stock Fund | 28,023,883 | 7,521,147 | (202,896 | ) | 7,318,251 | |||||||||||
Small Cap Growth Stock Fund | 146,762,413 | 43,685,510 | (4,291,422 | ) | 39,394,088 | |||||||||||
Small Cap Value Equity Fund | 1,300,012,448 | 356,469,337 | (29,983,828 | ) | 326,485,509 | |||||||||||
Aggressive Growth Allocation Strategy | 21,454,842 | 2,824,211 | (839,002 | ) | 1,985,209 | |||||||||||
Conservative Allocation Strategy | 58,001,959 | 2,882,601 | (1,080,260 | ) | 1,802,341 | |||||||||||
Growth Allocation Strategy | 60,723,811 | 8,165,297 | (1,991,375 | ) | 6,173,922 | |||||||||||
Moderate Allocation Strategy | 161,689,721 | 16,673,596 | (4,436,145 | ) | 12,237,451 | |||||||||||
88
NOTES TO FINANCIAL STATEMENTS (continued)
RIDGEWORTH FUNDS March 31, 2013
The tax character of distributions paid to shareholders during the year ended March 31, 2013 was as follows:
| Distributions paid from | ||||||||||||||||
Fund | Net Investment Income** | Net Long Term Capital Gains | Return of Capital | Total Distributions Paid* | ||||||||||||
Aggressive Growth Stock Fund | $— | $2,009,391 | $— | $2,009,391 | ||||||||||||
International Equity Fund | 5,025,278 | — | — | 5,025,278 | ||||||||||||
International Equity Index Fund | 10,553,137 | 6,132,178 | — | 16,685,315 | ||||||||||||
Large Cap Growth Stock Fund | 1,385,081 | 109,806,620 | — | 111,191,701 | ||||||||||||
Large Cap Value Equity Fund | 26,153,792 | — | — | 26,153,792 | ||||||||||||
Mid-Cap Value Equity Fund | 31,008,758 | — | — | 31,008,758 | ||||||||||||
Select Large Cap Growth Stock Fund | — | 8,493,940 | — | 8,493,940 | ||||||||||||
Small Cap Growth Stock Fund | — | 51,737,625 | — | 51,737,625 | ||||||||||||
Small Cap Value Equity Fund | 23,854,316 | 40,231,084 | — | 64,085,400 | ||||||||||||
Aggressive Growth Allocation Strategy | 229,343 | — | — | 229,343 | ||||||||||||
Conservative Allocation Strategy | 1,277,134 | 501,787 | — | 1,778,921 | ||||||||||||
Growth Allocation Strategy | 877,476 | — | — | 877,476 | ||||||||||||
Moderate Allocation Strategy | 2,799,033 | 2,686,735 | — | 5,485,768 | ||||||||||||
| * | Total distributions paid are recognized on a when declared basis for the year ended March 31, 2013. |
| ** | Net Investment income includes taxable market discount income and net short-term capital gains, if any. |
Amounts designated as “—” are $0 or have been rounded to $0.
The tax character of distributions paid to shareholders during the year ended March 31, 2012 were as follows:
| Distributions paid from | ||||||||||||||||
Fund | Net Investment Income** | Net Long Term Capital Gains | Return of Capital | Total Distributions Paid* | ||||||||||||
International Equity Fund | $5,156,759 | $— | $— | $5,156,759 | ||||||||||||
International Equity Index Fund | 14,995,618 | — | — | 14,995,618 | ||||||||||||
Large Cap Value Equity Fund | 28,731,199 | — | — | 28,731,199 | ||||||||||||
Mid-Cap Value Equity Fund | 176,422,446 | 25,657,958 | — | 202,080,404 | ||||||||||||
Select Large Cap Growth Stock Fund | — | 1,537,424 | — | 1,537,424 | ||||||||||||
Small Cap Value Equity Fund | 23,492,580 | 46,011,223 | — | 69,503,803 | ||||||||||||
Aggressive Growth Allocation Strategy | 406,361 | — | — | 406,361 | ||||||||||||
Conservative Allocation Strategy | 1,030,834 | 342,249 | — | 1,373,083 | ||||||||||||
Growth Allocation Strategy | 1,385,270 | — | — | 1,385,270 | ||||||||||||
Moderate Allocation Strategy | 3,953,227 | 242,796 | — | 4,196,023 | ||||||||||||
| * | Total distributions paid are recognized on a when declared basis for the year ended March 31, 2012. |
| ** | Net investment income includes taxable market discount income and net short-term capital gains, if any. |
Amounts designated as “—” are $0 or have been rounded to $0.
As of March 31, 2013, the components of distributable earnings (accumulated losses) on a federal income tax basis were as follows:
Fund | Undistributed Ordinary Income | Undistributed Long Term Capital Gains | Net Unrealized Appreciation** | Loss Carryforwards And Deferrals | Total | |||||||||||||||
Aggressive Growth Stock Fund | $ — | $911,947 | $10,019,464 | $(4,086,617 | ) | $6,844,794 | ||||||||||||||
International Equity Fund | 1,108,983 | — | 38,201,971 | (291,232,150 | ) | (251,921,196 | ) | |||||||||||||
International Equity Index Fund | 2,880,222 | 22,829,404 | 79,101,385 | — | 104,811,011 | |||||||||||||||
Large Cap Growth Stock Fund | 432,258 | 19,467,426 | 67,850,471 | (6,559,495 | ) | 81,190,660 | ||||||||||||||
Large Cap Value Equity Fund | 11,719,010 | 74,818,189 | 351,539,050 | — | 438,076,249 | |||||||||||||||
Mid-Cap Value Equity Fund | 160,740,166 | 12,326,520 | 296,816,083 | — | 469,882,769 | |||||||||||||||
Select Large Cap Growth Stock Fund | — | 2,189,121 | 7,318,252 | (171,799 | ) | 9,335,574 | ||||||||||||||
Small Cap Growth Stock Fund | 2,718,205 | 4,084,933 | 39,394,089 | — | 46,197,227 | |||||||||||||||
Small Cap Value Equity Fund | 8,510,324 | 24,400,936 | 326,485,688 | — | 359,396,948 | |||||||||||||||
89
NOTES TO FINANCIAL STATEMENTS (continued)
RIDGEWORTH FUNDS March 31, 2013
Fund | Undistributed Ordinary Income | Undistributed Long Term Capital Gains | Net Unrealized Appreciation** | Loss Carryforwards And Deferrals | Total | |||||||||||||||
Aggressive Growth Allocation Strategy | $5,342 | $2,296,470 | $1,985,209 | $— | $4,287,021 | |||||||||||||||
Conservative Allocation Strategy | 141,819 | 2,351,443 | 1,802,341 | — | 4,295,603 | |||||||||||||||
Growth Allocation Strategy | 56,060 | 5,935,728 | 6,173,922 | — | 12,165,710 | |||||||||||||||
Moderate Allocation Strategy | 310,429 | 11,065,744 | 12,237,451 | — | 23,613,624 | |||||||||||||||
| ** | The differences between book-basis and tax-basis unrealized appreciation is attributable primarily to: tax deferral of losses on wash sales, the realization for tax purposes of unrealized gains/losses on investments in passive foreign investment companies, return of capital adjustments, forward contracts marked to market and partnership basis adjustments. |
The Funds utilize the provisions of the federal income tax laws that provide for the carryforward of capital losses from prior years, offsetting such losses against any future realized capital gains. Under the Regulated Investment Company Modernization Act of 2010 (the “Act”), net capital losses recognized in taxable years beginning after December 22, 2010 (“post-enactment”), may be carried forward indefinitely, and their character is retained as short-term and/or long-term losses. Previously, net capital losses were carried forward for eight years and treated as short-term losses (“pre-enactment”). The Act requires that post-enactment net capital losses be used before pre-enactment net capital losses.
As of March 31, 2013, the post-enactment accumulated short-term and long-term capital loss carryforwards were as follows:
Fund | Short Term | Long Term | Total | |||||||||
Aggressive Growth Stock Fund* | $2,132,646 | $— | $2,132,646 | |||||||||
International Equity Fund | 2,478,067 | — | 2,478,067 | |||||||||
| * | Of the $2,750,901 of capital loss carryforwards acquired on April 27, 2012, in the merger with the RidgeWorth Emerging Growth Stock Fund and subject to limitations as a result of this acquisition, $618,255 of capital loss carryforward was utilized. The remaining $2,132,646 has no expiration date. |
As of March 31, 2013, the pre-enactment accumulated capital loss carryforwards and expiration dates were as follows:
| Expires | ||||||||||||
Fund | 2017 | 2018 | Total | |||||||||
Aggressive Growth Stock Fund* | $1,857,837 | $— | $1,857,837 | |||||||||
International Equity Fund | 57,407,718 | 231,346,365 | 288,754,083 | |||||||||
Large Cap Growth Stock Fund** | 6,559,495 | — | 6,559,495 | |||||||||
| * | Of the $20,295,452 of capital loss carryforwards acquired on April 27, 2012, in the merger with the RidgeWorth Emerging Growth Stock Fund and subject to limitations as a result of this acquisition, $18,437,615 was written off as capital loss carryforward lost unused. The remaining $1,857,837 will expire in 2017. |
| ** | Of the $136,363,735 of capital loss carryforwards acquired on March 1, 2013, in the merger with the RidgeWorth Large Cap Core Growth Stock Fund and subject to limitations as a result of this acquisition, $129,669,456 was written off as capital loss carryforward lost unused, $134,784 was utilized, and the remaining $6,559,495, will expire in 2017. |
Amounts designated as “—” are $0.
During the year ended March 31, 2013, the following Funds utilized capital loss carryforwards as follows:
Fund | Amount | |||
Aggressive Growth Stock Fund | $20,867,404 | |||
Large Cap Growth Stock Fund | 134,784 | |||
Large Cap Value Equity Fund | 71,161,454 | |||
Mid-Cap Value Equity Fund | 57,099,581 | |||
Aggressive Growth Allocation Strategy | 365,462 | |||
Growth Allocation Strategy | 579,855 | |||
Net capital losses incurred after October 31, and within the taxable year, are deemed to arise on the first business day of the Funds’ next taxable year. During the year ended March 31, 2013, the following Funds had net capital losses:
Fund | Short Term | |||
Select Large Cap Growth Stock Fund | $134,783 | |||
90
NOTES TO FINANCIAL STATEMENTS (continued)
RIDGEWORTH FUNDS March 31, 2013
Pursuant to federal income tax rules applicable to regulated investment companies, the Funds may elect to treat certain capital losses between November 1 and March 31 and late year ordinary losses, (i) ordinary losses between January 1 and March 31, and (ii) specified ordinary and currency losses between November 1 and March 31, as occurring on the first day of the following tax year. For the year ended March 31, 2013, any amount of losses elected within the tax return will not be recognized for federal income tax purposes until April 1, 2013.
For the year ended March 31, 2013 the following Funds had net realized loss attributed to redemption in-kind transactions:
Fund | Amount | |||
Large Cap Value Equity Fund | $5,949,499 | |||
Mid-Cap Value Equity Fund | 15,523,169 | |||
Small Cap Value Equity Fund | 8,248,498 | |||
| 7. | Investments in Affiliated Issuers |
Affiliated holdings are holdings in mutual funds which are managed by the Investment Adviser or an affiliate of the Investment Adviser or which are distributed by an affiliate of the Funds’ distributor. With respect to each Fund, the Investment Adviser was paid an investment advisory fee by the affiliated investments listed beneath its name below. Investments in affiliated issuers at March 31, 2013 were as follows:
Name of Affiliated Issuer | Share Balance at March 31, 2012 | Purchases | Sales | Share Balance at March 31, 2013 | Value at March 31, 2013 | Dividend Income | Realized Gain Distributions | Net Realized Gain (Loss) | ||||||||||||||||||||||||
Aggressive Growth Allocation Strategy | ||||||||||||||||||||||||||||||||
RidgeWorth Aggressive Growth Stock Fund | 58,984 | 1,659 | 57,815 | 2,828 | $44,110 | $— | $1,679 | $258,708 | ||||||||||||||||||||||||
RidgeWorth Corporate Bond Fund | — | 37,409 | 36,561 | 848 | 7,886 | 4,769 | 10,709 | (11,340 | ) | |||||||||||||||||||||||
RidgeWorth High Income Fund | — | 35,463 | — | 35,463 | 259,590 | 9,608 | — | — | ||||||||||||||||||||||||
RidgeWorth Intermediate Bond Fund | — | 121,240 | 105,822 | 15,418 | 158,960 | 9,471 | 31,236 | (29,992 | ) | |||||||||||||||||||||||
RidgeWorth International Equity Fund | 134,752 | 15,426 | 31,517 | 118,661 | 1,381,209 | 23,148 | — | (45,151 | ) | |||||||||||||||||||||||
RidgeWorth International Equity Index Fund | 42,588 | 230 | 40,546 | 2,272 | 27,354 | 861 | 500 | 112,272 | ||||||||||||||||||||||||
RidgeWorth Large Cap Core Growth Stock Fund* | 19,637 | 546 | 20,183 | — | — | 402 | — | 94,268 | ||||||||||||||||||||||||
RidgeWorth Large Cap Growth Stock Fund* | 312,005 | 300,062 | 58,042 | 554,025 | 4,603,948 | 3,077 | 1,713,364 | 27,974 | ||||||||||||||||||||||||
RidgeWorth Large Cap Value Equity Fund | 365,675 | 21,182 | 83,546 | 303,311 | 4,780,176 | 69,179 | — | 77,695 | ||||||||||||||||||||||||
RidgeWorth Mid-Cap Value Equity Fund | 186,519 | 11,660 | 47,870 | 150,309 | 1,963,033 | 21,739 | 4,895 | 19,289 | ||||||||||||||||||||||||
RidgeWorth Seix Floating Rate High Income Fund | — | 17,638 | — | 17,638 | 159,802 | 3,023 | — | — | ||||||||||||||||||||||||
RidgeWorth Seix High Yield Fund | — | 26,407 | — | 26,407 | 270,932 | 10,360 | — | — | ||||||||||||||||||||||||
RidgeWorth Select Large Cap Growth Stock Fund | 72,234 | 18,517 | 31,802 | 58,949 | 1,586,308 | — | 423,761 | (7,351 | ) | |||||||||||||||||||||||
RidgeWorth Small Cap Growth Stock Fund | 65,338 | 12,661 | 25,450 | 52,549 | 822,910 | — | 160,345 | 71,344 | ||||||||||||||||||||||||
RidgeWorth Small Cap Value Equity Fund | 80,398 | 4,897 | 31,543 | 53,752 | 830,471 | 12,968 | 20,586 | 33,020 | ||||||||||||||||||||||||
RidgeWorth Total Return Bond Fund | — | 253,200 | — | 253,200 | 2,732,023 | 23,512 | 31,586 | — | ||||||||||||||||||||||||
RidgeWorth U.S. Government Securities Ultra-Short Bond Fund | — | 22,902 | 4,902 | 18,000 | 183,062 | 992 | — | 98 | ||||||||||||||||||||||||
|
|
|
|
|
|
|
| |||||||||||||||||||||||||
Total | $19,811,774 | $193,109 | $2,398,661 | $600,834 | ||||||||||||||||||||||||||||
|
|
|
|
|
|
|
| |||||||||||||||||||||||||
91
NOTES TO FINANCIAL STATEMENTS (continued)
RIDGEWORTH FUNDS March 31, 2013
Name of Affiliated Issuer | Share Balance at March 31, 2012 | Purchases | Sales | Share Balance at March 31, 2013 | Value at March 31, 2013 | Dividend Income | Realized Gain Distributions | Net Realized Gain (Loss) | ||||||||||||||||||||||||
Conservative Allocation Strategy | ||||||||||||||||||||||||||||||||
RidgeWorth Aggressive Growth Stock Fund | 34,502 | 304 | 32,210 | 2,596 | $40,493 | $— | $1,542 | $27,128 | ||||||||||||||||||||||||
RidgeWorth Corporate Bond Fund | 399,052 | 24,651 | 414,322 | 9,381 | 87,240 | 93,293 | 129,916 | (69,433 | ) | |||||||||||||||||||||||
RidgeWorth High Income Fund | 312,910 | 34,960 | 25,586 | 322,284 | 2,359,120 | 137,489 | — | (14,378 | ) | |||||||||||||||||||||||
RidgeWorth Intermediate Bond Fund | 1,283,517 | 53,885 | 1,186,257 | 151,145 | 1,558,300 | 179,800 | 361,231 | (358,153 | ) | |||||||||||||||||||||||
RidgeWorth International Equity Fund | 119,564 | 17,202 | 21,094 | 115,672 | 1,346,426 | 23,195 | — | (23,928 | ) | |||||||||||||||||||||||
RidgeWorth International Equity Index Fund | 34,303 | 222 | 30,798 | 3,727 | 44,872 | 1,412 | 820 | 18,212 | ||||||||||||||||||||||||
RidgeWorth Large Cap Core Growth Stock Fund* | 14,086 | 143 | 14,229 | — | — | 363 | 1,951,091 | 54,970 | ||||||||||||||||||||||||
RidgeWorth Large Cap Growth Stock Fund* | 340,816 | 295,553 | 56,247 | 580,122 | 4,820,812 | 3,703 | — | (12,116 | ) | |||||||||||||||||||||||
RidgeWorth Large Cap Value Equity Fund | 303,899 | 59,765 | 54,921 | 308,743 | 4,865,788 | 63,277 | — | (29,545 | ) | |||||||||||||||||||||||
RidgeWorth Mid-Cap Value Equity Fund | 171,419 | 3,814 | 24,681 | 150,552 | 1,966,211 | 21,792 | 5,277 | (31,468 | ) | |||||||||||||||||||||||
RidgeWorth Seix Floating Rate High Income Fund | 95,875 | 91,396 | 7,822 | 179,449 | 1,625,811 | 46,180 | — | (4,146 | ) | |||||||||||||||||||||||
RidgeWorth Seix High Yield Fund | 228,754 | 46,175 | 18,717 | 256,212 | 2,628,730 | 148,705 | — | (12,439 | ) | |||||||||||||||||||||||
RidgeWorth Select Large Cap Growth Stock Fund | 46,118 | 22,203 | 15,049 | 53,272 | 1,433,559 | — | 345,187 | (81,178 | ) | |||||||||||||||||||||||
RidgeWorth Small Cap Growth Stock Fund | 53,100 | 11,583 | 12,205 | 52,478 | 821,805 | — | 168,287 | (2,412 | ) | |||||||||||||||||||||||
RidgeWorth Small Cap Value Equity Fund | 65,426 | 3,020 | 14,868 | 53,578 | 827,775 | 12,386 | 21,535 | (4,447 | ) | |||||||||||||||||||||||
RidgeWorth Total Return Bond Fund | 988,955 | 1,706,666 | 90,984 | 2,604,637 | 28,104,035 | 312,025 | 305,241 | (5,942 | ) | |||||||||||||||||||||||
RidgeWorth U.S. Government Securities Ultra-Short Bond Fund | 261,098 | 2,090 | 55,504 | 207,684 | 2,112,151 | 19,538 | — | 2,201 | ||||||||||||||||||||||||
|
|
|
|
|
|
|
| |||||||||||||||||||||||||
Total | $54,643,128 | $1,063,158 | $3,290,127 | $(547,074 | ) | |||||||||||||||||||||||||||
|
|
|
|
|
|
|
| |||||||||||||||||||||||||
Growth Allocation Strategy | ||||||||||||||||||||||||||||||||
RidgeWorth Aggressive Growth Stock Fund | 129,023 | 418 | 124,369 | 5,072 | $79,121 | $— | $3,012 | $579,085 | ||||||||||||||||||||||||
RidgeWorth Corporate Bond Fund | 131,474 | 12,272 | 139,812 | 3,934 | 36,587 | 32,215 | 27,537 | (24,828 | ) | |||||||||||||||||||||||
RidgeWorth High Income Fund | 173,470 | 15,238 | — | 188,708 | 1,381,342 | 81,210 | — | — | ||||||||||||||||||||||||
RidgeWorth Intermediate Bond Fund | 651,423 | 23,313 | 608,233 | 66,503 | 685,642 | 91,324 | 141,813 | (138,046 | ) | |||||||||||||||||||||||
RidgeWorth International Equity Fund | 302,580 | 26,240 | 24,936 | 303,884 | 3,537,211 | 57,986 | 834 | (33,710 | ) | |||||||||||||||||||||||
RidgeWorth International Equity Index Fund | 98,718 | 226 | 95,154 | 3,790 | 45,629 | 1,436 | — | 169,001 | ||||||||||||||||||||||||
92
NOTES TO FINANCIAL STATEMENTS (continued)
RIDGEWORTH FUNDS March 31, 2013
Name of Affiliated Issuer | Share Balance at March 31, 2012 | Purchases | Sales | Share Balance at March 31, 2013 | Value at March 31, 2013 | Dividend Income | Realized Gain Distributions | Net Realized Gain (Loss) | ||||||||||||||||||||||||
RidgeWorth Large Cap Core Growth Stock Fund* | 36,529 | 171 | 36,700 | — | $— | $809 | $— | $180,719 | ||||||||||||||||||||||||
RidgeWorth Large Cap Growth Stock Fund* | 739,646 | 730,413 | 93,129 | 1,376,930 | 11,442,285 | 7,930 | 4,378,350 | (6,180 | ) | |||||||||||||||||||||||
RidgeWorth Large Cap Value Equity Fund | 856,761 | 46,583 | 129,065 | 774,279 | 12,202,644 | 170,370 | — | 131,031 | ||||||||||||||||||||||||
RidgeWorth Mid-Cap Value Equity Fund | 380,007 | 6,871 | 7,968 | 378,910 | 4,948,568 | 52,101 | 12,599 | 8,723 | ||||||||||||||||||||||||
RidgeWorth Seix Floating Rate High Income Fund | 51,439 | 28,117 | — | 79,556 | 720,775 | 24,378 | — | — | ||||||||||||||||||||||||
RidgeWorth Seix High Yield Fund | 123,150 | 14,097 | — | 137,247 | 1,408,156 | 83,062 | — | — | ||||||||||||||||||||||||
RidgeWorth Select Large Cap Growth Stock Fund | 156,674 | 42,007 | 50,249 | 148,432 | 3,994,315 | — | 1,058,431 | (185,217 | ) | |||||||||||||||||||||||
RidgeWorth Small Cap Growth Stock Fund | 136,340 | 27,879 | 32,559 | 131,660 | 2,061,798 | — | 414,698 | 38,075 | ||||||||||||||||||||||||
RidgeWorth Small Cap Value Equity Fund | 167,652 | 6,700 | 39,571 | 134,781 | 2,082,360 | 31,449 | 53,224 | 5,882 | ||||||||||||||||||||||||
RidgeWorth Total Return Bond Fund | 425,766 | 742,759 | 18,553 | 1,149,972 | 12,408,201 | 148,568 | 150,880 | (5,949 | ) | |||||||||||||||||||||||
RidgeWorth U.S. Government Securities Ultra-Short Bond Fund | 32,860 | 26,409 | — | 59,269 | 602,763 | 2,836 | — | — | ||||||||||||||||||||||||
|
|
|
|
|
|
|
| |||||||||||||||||||||||||
Total | $57,637,397 | $785,674 | 6,241,378 | $1,089,020 | ||||||||||||||||||||||||||||
|
|
|
|
|
|
|
| |||||||||||||||||||||||||
Moderate Allocation Strategy | ||||||||||||||||||||||||||||||||
RidgeWorth Aggressive Growth Stock Fund | 225,271 | 6,537 | 231,808 | — | $ — | $ — | $7,330 | $1,018,274 | ||||||||||||||||||||||||
RidgeWorth Corporate Bond Fund | 572,586 | 46,314 | 598,944 | 19,956 | 185,588 | 145,632 | 164,077 | (137,311 | ) | |||||||||||||||||||||||
RidgeWorth High Income Fund | 781,935 | 71,232 | 36,657 | 816,510 | 5,976,854 | 357,656 | — | (7,698 | ) | |||||||||||||||||||||||
RidgeWorth Intermediate Bond Fund | 2,703,723 | 170,717 | 2,745,169 | 129,271 | 1,332,785 | 402,379 | 738,993 | (879,933 | ) | |||||||||||||||||||||||
RidgeWorth International Equity Fund | 521,778 | 55,532 | 21,477 | 555,833 | 6,469,892 | 111,809 | — | (15,893 | ) | |||||||||||||||||||||||
RidgeWorth International Equity Index Fund | 173,746 | 1,404 | 157,104 | 18,046 | 217,272 | 6,839 | 3,971 | 246,680 | ||||||||||||||||||||||||
RidgeWorth Large Cap Core Growth Stock Fund* | 63,307 | 1,986 | 65,293 | — | — | 1,839 | — | 275,641 | ||||||||||||||||||||||||
RidgeWorth Large Cap Growth Stock Fund* | 1,325,098 | 1,301,143 | — | 2,626,241 | 21,824,059 | 16,744 | 8,821,533 | — | ||||||||||||||||||||||||
RidgeWorth Large Cap Value Equity Fund | 1,496,149 | 130,795 | 146,073 | 1,480,871 | 23,338,522 | 332,130 | — | 111,287 | ||||||||||||||||||||||||
RidgeWorth Mid-Cap Value Equity Fund | 668,249 | 74,869 | 15,860 | 727,258 | 9,497,992 | 98,443 | 24,200 | 17,188 | ||||||||||||||||||||||||
RidgeWorth Seix Floating Rate High Income Fund | 259,639 | 103,192 | — | 362,831 | 3,287,250 | 122,208 | — | — | ||||||||||||||||||||||||
RidgeWorth Seix High Yield Fund | 554,601 | 50,552 | 25,988 | 579,165 | 5,942,234 | 358,480 | — | (7,521 | ) | |||||||||||||||||||||||
RidgeWorth Select Large Cap Growth Stock Fund | 255,580 | 71,224 | 51,779 | 275,025 | 7,400,915 | — | 1,624,912 | (91,221 | ) | |||||||||||||||||||||||
RidgeWorth Small Cap Growth Stock Fund | 230,143 | 59,630 | 43,117 | 246,656 | 3,862,625 | — | 798,999 | 20,531 | ||||||||||||||||||||||||
RidgeWorth Small Cap Value Equity Fund | 283,014 | 20,241 | 50,706 | 252,549 | 3,901,875 | 59,527 | 103,632 | 17,191 | ||||||||||||||||||||||||
93
NOTES TO FINANCIAL STATEMENTS (continued)
RIDGEWORTH FUNDS March 31, 2013
Name of Affiliated Issuer | Share Balance at March 31, 2012 | Purchases | Sales | Share Balance at March 31, 2013 | Value at March 31, 2013 | Dividend Income | Realized Gain Distributions | Net Realized Gain (Loss) | ||||||||||||||||||||||||
RidgeWorth Total Return Bond Fund | 2,029,716 | 3,367,734 | — | 5,397,450 | $58,238,486 | $640,335 | $618,540 | $— | ||||||||||||||||||||||||
RidgeWorth U.S. Government Securities Ultra-Short Bond Fund | 196,300 | 104,394 | 19,647 | 281,047 | 2,858,252 | 16,892 | — | 974 | ||||||||||||||||||||||||
|
|
|
|
|
|
|
| |||||||||||||||||||||||||
Total | $154,334,601 | $2,670,913 | $12,906,187 | $568,189 | ||||||||||||||||||||||||||||
|
|
|
|
|
|
|
| |||||||||||||||||||||||||
| * | On March 1, 2013, RidgeWorth Large Cap Core Growth Stock Fund reorganized into the RidgeWorth Large Cap Growth Stock Fund. |
| 8. | Reorganizations |
On March 1, 2012, the Board approved the reorganization of the RidgeWorth Emerging Growth Stock Fund (the “Target Fund”) into the RidgeWorth Aggressive Growth Stock Fund (the “Acquiring Fund”), a separate series of the Trust. On April 27, 2012, the Acquiring Fund acquired all of the net assets of the Target Fund in a tax-free exchange of shares. The purpose of the transaction was to combine two portfolios with comparable investment objectives and strategies.
Target Fund | Shares Prior to Reorganization | Shares Issued by the Acquiring Fund | Appreciation/ (Depreciation) Prior to Reorganization | Net Assets Prior to Reorganization | ||||||||||||
I Shares | 648,340 | 557,942 | $3,917,300 | $8,812,408 | ||||||||||||
A Shares | 245,671 | 211,048 | (490,875 | ) | 3,249,658 | |||||||||||
The combined net assets of the Acquiring Fund immediately after the reorganization were $96,324,650.
Assuming the acquisition had been completed on April 1, 2012, the beginning of the reporting period of the Acquiring Fund, the Acquiring Fund’s pro forma results of operations for the year ended March 31, 2013, were as follows:
Net Investment Income (Loss) | $(669,132) | |||
Net Realized and Unrealized Gains/Losses on Investments | $(3,193,533) | |||
Net Increase/Decrease in Net Assets resulting from Operations | $(3,862,665) |
Because the combined investment portfolios have been managed as a single integrated portfolio since the acquisition was completed, it is not practicable to separate the amounts of revenue and earnings of the Target Fund that has been included in the Acquiring Fund’s Statement of Operations as of March 31, 2013.
On November 15, 2012, the Board approved the reorganization of the RidgeWorth Large Cap Core Growth Stock Fund (the “Target Fund”) into the RidgeWorth Large Cap Growth Stock Fund (the “Acquiring Fund”), a separate series of the Trust. On March 1, 2013, the Acquiring Fund acquired all of the net assets of the Target Fund in a tax-free exchange of shares. The purpose of the transaction was to combine two portfolios with comparable investment objectives and strategies.
Target Fund | Shares Prior to Reorganization | Shares Issued by the Acquiring Fund | Appreciation/ (Depreciation) Prior to Reorganization | Net Assets Prior to Reorganization | ||||||||||||
I Shares | 1,821,8212 | 3,492,724 | $1,320,267 | $28,329,532 | ||||||||||||
A Shares | 941,421 | 2,081,782 | 5,571,278 | 14,767,859 | ||||||||||||
C Shares | 1,066,645 | 2,887,824 | (868,310 | ) | 16,103,232 | |||||||||||
The combined net assets of the Acquiring Fund immediately after the reorganization were $199,407,507.
94
NOTES TO FINANCIAL STATEMENTS (concluded)
RIDGEWORTH FUNDS March 31, 2013
Assuming the acquisition had been completed on April 1, 2012, the beginning of the reporting period of the Acquiring Fund, the Acquiring Fund’s pro forma results of operations for the year ended March 31, 2013, were as follows:
Net Investment Income (Loss) | $ 676,967 | |||
Net Realized and Unrealized Gains/Losses on Investments | $8,895,676 | |||
Net Increase/Decrease in Net Assets resulting from Operations | $9,572,643 |
Because the combined investment portfolios have been managed as a single integrated portfolio since the acquisition was completed, it is not practicable to separate the amounts of revenue and earnings of the Target Fund that has been included in the Acquiring Fund’s Statement of Operations as of March 31, 2013.
| 9. | Recent Accounting Pronouncements |
In December 2011, Accounting Standards Update (“ASU”) No.2011-11, “Disclosures about Offsetting Assets and Liabilities,” was issued and is effective for interim and annual periods beginning after January 1, 2013. The ASU enhances disclosure requirements with respect to an entity’s rights of setoff and related arrangements associated with its financial and derivative instruments. Management is currently evaluating the impact the adoption of ASU No.2011-11 may have on the Funds’ financial statement disclosures.
| 10. | Subsequent Events |
Management has evaluated subsequent events through the date these financial statements were issued. Management has determined that, except as set forth below, there are no material events that would require disclosure in the Funds’ financial statements through this date.
Management was notified of SunTrust’s intent to liquidate their pension positions in the International Equity Fund and the International Equity Index Fund. As of March 31, 2013, these amounts were $247,972,106 and $163,368,013, respectively. This redemption is anticipated to occur in late May, 2013.
95
REPORT OF INDEPENDENT REGISTERED PUBLIC ACCOUNTING FIRM
RIDGEWORTH FUNDS March 31, 2013
To the Board of Trustees and Shareholders of
RidgeWorth Funds:
In our opinion, the accompanying statements of assets and liabilities, including the schedules of portfolio investments, and the related statements of operations and of changes in net assets and the financial highlights present fairly, in all material respects, the financial position of Aggressive Growth Stock Fund, International Equity Fund, International Equity Index Fund, Large Cap Growth Stock Fund, Large Cap Value Equity Fund, Mid-Cap Value Equity Fund, Select Large Cap Growth Stock Fund, Small Cap Growth Stock Fund, Small Cap Value Equity Fund, Aggressive Growth Allocation Strategy, Conservative Allocation Strategy, Growth Allocation Strategy, and Moderate Allocation Strategy (thirteen of the funds constituting RidgeWorth Funds, collectively the “Funds”) at March 31, 2013, the results of their operations for the year then ended, the changes in their net assets for each of the two years in the period then ended and the financial highlights for each of the five years in the period then ended, in conformity with accounting principles generally accepted in the United States of America. These financial statements and financial highlights (hereafter referred to as “financial statements”) are the responsibility of the Funds’ management; our responsibility is to express an opinion on these financial statements based on our audits. We conducted our audits of these financial statements in accordance with the standards of the Public Company Accounting Oversight Board (United States). Those standards require that we plan and perform the audits to obtain reasonable assurance about whether the financial statements are free of material misstatement. An audit includes examining, on a test basis, evidence supporting the amounts and disclosures in the financial statements, assessing the accounting principles used and significant estimates made by management, and evaluating the overall financial statement presentation. We believe that our audits, which included confirmation of securities at March 31, 2013 by correspondence with the custodian and brokers, and application of alternative auditing procedures where securities purchased had not been received, provide a reasonable basis for our opinion.
PricewaterhouseCoopers LLP
May 24, 2013
Boston, Massachusetts
96
RIDGEWORTH FUNDS March 31, 2013
(Unaudited)
The following Funds have designated long term capital gain distributions as follows:
Fund | Amount | |||
Aggressive Growth Stock Fund | $2,009,391 | |||
International Equity Index Fund | 6,132,178 | |||
Large Cap Growth Stock Fund | 109,806,620 | |||
Select Large Cap Growth Stock Fund | 8,493,940 | |||
Small Cap Growth Stock Fund | 51,737,625 | |||
Small Cap Value Equity Fund | 40,231,084 | |||
Conservative Allocation Strategy | 501,787 | |||
Moderate Allocation Strategy | 2,686,735 | |||
For corporate shareholders, the following percentages of the total ordinary income distributions paid by the following Funds during the year ended March 31, 2013 qualify for the corporate dividends received deduction:
Fund | Dividends Received Deduction | |||
Large Cap Growth Stock Fund | 100.00 | % | ||
Large Cap Value Equity Fund | 100.00 | |||
Mid-Cap Value Equity Fund | 22.47 | |||
Small Cap Value Equity Fund | 98.71 | |||
Aggressive Growth Allocation Strategy | 61.62 | |||
Conservative Allocation Strategy | 10.83 | |||
Growth Allocation Strategy | 33.58 | |||
Moderate Allocation Strategy | 21.82 | |||
In addition, the Funds may elect to pass through foreign taxes paid by the Funds to shareholders under Section 853 of the Internal Revenue Code. For the year ended March 31, 2013, International Equity Fund and International Equity Index Fund elected to pass through foreign taxes of $289,152 and $404,226 respectively.
For the year ended March 31, 2013, the following Funds paid qualified dividend income:
Fund | Qualified Dividend Income | |||
International Equity Fund | 91.89 | % | ||
International Equity Index Fund | 59.48 | |||
Large Cap Growth Stock Fund | 100.00 | |||
Large Cap Value Equity Fund | 100.00 | |||
Mid-Cap Value Equity Fund | 22.61 | |||
Small Cap Value Equity Fund | 99.15 | |||
Aggressive Growth Allocation Strategy | 75.63 | |||
Conservative Allocation Strategy | 13.41 | |||
Growth Allocation Strategy | 42.00 | |||
Moderate Allocation Strategy | 26.47 | |||
The RidgeWorth International Equity Fund and International Equity Index Fund intend to elect to pass through to shareholders the income tax credit for taxes paid to foreign countries.
Fund | Foreign Source Income | Foreign Tax Expense | ||||||
International Equity Fund | $8,675,528 | $289,152 | ||||||
International Equity Index Fund | 10,713,291 | 404,226 | ||||||
The pass-through of the foreign tax credit will only affect those persons who are shareholders on the dividend record dates. These shareholders will receive more detailed information with their 2013 Form 1099-DIV.
97
TRUSTEES AND OFFICERS OF THE RIDGEWORTH FUNDS
RIDGEWORTH FUNDS March 31, 2013
(Unaudited)
Set forth below are the names, age, position with the Trust, length of term of office, and the principal occupations and other directorships held during at least the last five years of each of the persons currently serving as a Trustee of the Trust. Unless otherwise noted, the address of each Trustee and officer is c/o RidgeWorth Investments®, 3333 Piedmont Road, Suite 1500, Atlanta, Georgia 30305.
| Name and Age | Position Held with the Trust | Term of Office and Length of Time Served | Principal Occupation(s) During the Past 5 Years | Number of Portfolios in the RidgeWorth Complex Overseen by Trustees | Other Directorships Held By Trustee During the Past 5 Years | |||||||
Tim E. Bentsen Age: 59 | Trustee | Indefinite; since 2012 | Retired. Audit Partner and Account Executive (1993-2012); Lead Area Managing Partner (2005-2009); Office Managing Partner (2003-2009), KPMG LLP. | 33 | None | |||||||
Jeffrey M. Biggar Age: 63 | Trustee | Indefinite; since 2007 | Managing Director, Little Mountain Group, LLC (an independent Registered Investment Advisor consulting firm) (since 2011); Chief Operating Officer, Cedar Brook Financial Partners LLC (2008-2010); Chief Executive Officer and Senior Managing Director, Sterling (National City Corp.) (2000-2006). | 33 | GenSpring Trust | |||||||
George C. Guynn Age: 70 | Trustee | Indefinite; since 2008 | Retired. President (1996-2006) and Chief Executive Officer (1995-2006) Federal Reserve Bank of Atlanta. | 33 | Genuine Parts Company; Oxford Industries; John Wieland Homes and Neighborhoods Inc.; Acuity Brands Inc.; GenSpring Trust | |||||||
Sidney E. Harris Age: 63 | Trustee | Indefinite; since 2004 | Professor (since 1997), Dean (1997-2004), J. Mack Robinson College of Business, Georgia State University. | 33 | Total System Services, Inc.; GenSpring Trust | |||||||
Warren Y. Jobe Age: 72 | Trustee | Indefinite; since 2004 | Retired. Executive Vice President and Chief Financial Officer, Georgia Power Company (1982-1998) and Senior Vice President, Southern Company (1998-2001). | 33 | WellPoint, Inc; UniSource Energy Corp. | |||||||
Connie D. McDaniel Age: 55 | Trustee | Indefinite; since 2005 | Vice President, Chief of Internal Audit, Corporate Audit Department (since 2009); Vice President Global Finance Transformation (2007-2009); Vice President and Controller (1999-2007), The Coca-Cola Company. | 33 | None | |||||||
98
TRUSTEES AND OFFICERS OF THE RIDGEWORTH FUNDS (concluded)
RIDGEWORTH FUNDS March 31, 2013
(Unaudited)
| Name, Address and Age | Position(s) Held with the Trust | Term of Office and Length of Time Served | Principal Occupation(s) During the Past 5 Years | |||
Julia R. Short RidgeWorth Investments 3333 Piedmont Road, NE Suite 1500 Atlanta, GA 30305 Age: 40 | President and Chief Executive Officer | One year; since 2007 | Managing Director, Product Manager, RidgeWorth Investments (since 2004). | |||
Joseph M. O’Donnell RidgeWorth Investments 3333 Piedmont Road, NE Suite 1500 Atlanta, GA 30305 Age: 58 | Executive Vice President and Chief Compliance Officer | One year; since 2011 | Managing Director of Fund Compliance, RidgeWorth Investments (since 2011); Executive Vice President and Chief Compliance Officer of the ING Funds (2004-2011); Chief Compliance Officer of ING Investments, LLC (2006-2008 and October 2009-2011); and Investment Advisor Chief Compliance Officer, Directed Services LLC (2006-2008 and 2009-2011). | |||
Denise R. Lewis RidgeWorth Investments 3333 Piedmont Road, NE Suite 1500 Atlanta, GA 30305 Age: 49 | Treasurer and Chief Financial Officer | One year; since August 2012 | Director of Fund Administration, RidgeWorth Investments (since 2012); Vice President of Fund Analysis and Reporting, ING Investments Management, LLC (2006-2012). | |||
Benjamin H. Lowe RidgeWorth Investments 3333 Piedmont Road, NE Suite 1500 Atlanta, GA 30305 Age: 35 | Assistant Treasurer | One year; since March 2012 | Director of Fund Administration, RidgeWorth Investments (since 2011); Fund Controller, ALPS Fund Services, Inc. (2005-2011). | |||
James Bacik State Street Bank and Trust Co. 4 Copley Place, 5th Fl. Boston, MA 02116 Age: 38 | Assistant Treasurer | One year; since 2010 | Assistant Vice President, State Street Bank and Trust Company (since 2001).1 | |||
James M. Atwood Foreside Compliance Services, LLC Three Canal Plaza, Suite 100 Portland, ME 04101 Age: 47 | Anti-Money Laundering Officer and Identity Theft Prevention Officer | One year; since 2010 | Compliance Analyst, Foreside Compliance Services, LLC (since 2007); personal sabbatical (2004-2007); Attorney, Pierce Atwood (law firm) (2001-2004). | |||
Francine S. Hayes State Street Bank and Trust Company Mailstop CPH 0326 4 Copley Place Boston, MA 02116 Age: 45 | Secretary and Chief Legal Officer | One year; since August 2012 | Vice President and Managing Counsel, State Street Bank and Trust Company (since 1995).1 | |||
Julie Tedesco State Street Bank and Trust Company Mailstop CPH 0326 4 Copley Place Boston, MA 02116 Age: 55 | Assistant Secretary | One year; since 2010 | Senior Vice President and Senior Managing Counsel, State Street Bank and Trust Company (since 2000).1 |
| 1 | During the year indicated the Officer has held various positions at State Street Bank and Trust Company and has provided his or her current title. |
99
RIDGEWORTH FUNDS March 31, 2013
(Unaudited)
ANNUAL APPROVAL OF INVESTMENT ADVISORY AND SUBADVISORY AGREEMENTS
The continuance of the Trust’s investment advisory agreement with RidgeWorth Capital Management, Inc. (the “Adviser”) and subadvisory agreements between the Adviser and each of Ceredex Value Advisors LLC, Certium Asset Management LLC, Silvant Capital Management LLC, and Zevenbergen Capital Investments LLC (collectively, the “Subadvisers”) must be specifically approved at least annually by (i) the vote of the Trustees or a vote of the shareholders of the Funds and (ii) the vote of a majority of the Trustees who are not parties to the agreements or “interested persons” of any party thereto (the “Independent Trustees”), as defined in the Investment Company Act of 1940, cast in person at a meeting called for the purpose of voting on such approval. New advisory agreements for the Trust are also subject to such approval initially and annually after their initial term is complete.
Each year, the Board of Trustees calls and holds a meeting to decide whether to approve and/or renew the Trust’s agreements for the upcoming year. In preparation for the meeting, the Board requests and reviews a wide variety of information from the Adviser and Subadvisers. The Trustees use this information, as well as other information that the Adviser, Subadvisers, and other service providers may submit to the Board, to help them decide whether to approve and/or renew the agreements.
In considering the renewal of the agreements with the Adviser and Subadvisers, the Board requested and received material from the Adviser and Subadvisers in preparation for a special meeting of the Board held on October 11, 2012, and requested and reviewed additional material from the Adviser and Subadvisers in preparation for its quarterly meeting held on November 15, 2012, at which it specifically considered the renewal of the agreements. Such material included, among other things, information about: (a) the quality of the Adviser’s and Subadvisers’ investment management and other services; (b) the Adviser’s and Subadvisers’ investment management personnel; (c) the Adviser’s and Subadvisers’ operations and financial condition; (d) the Adviser’s and Subadvisers’ brokerage practices (including any soft dollar arrangements) and investment strategies; (e) the level of the advisory fees that the Adviser and Subadvisers charge the Funds compared with the fees they charge to comparable mutual funds or accounts; (f) the Funds’ overall fees and operating expenses compared with similar mutual funds; (g) the level of the Adviser’s and Subadvisers’ profitability from their Fund-related operations; (h) the Adviser’s and Subadvisers’ compliance systems; (i) the Adviser’s and Subadvisers’ policies and procedures for personal securities transactions; (j) the Adviser’s and Subadvisers’ reputation, expertise, and resources in domestic financial markets; and (k) the Funds’ performance compared with similar mutual funds. The Board also received a memorandum from fund counsel regarding the responsibilities of the Trustees in connection with their consideration of the agreements.
At the meetings, representatives from the Adviser and Subadvisers presented additional oral and written information to the Board to help the Board evaluate the Adviser’s and Subadvisers’ fees and other aspects of the agreements. The Board also considered information presented by the Adviser, Subadvisers, and other service providers at meetings held throughout the year. The Trustees discussed the written materials, oral presentations, and any other information that the Board received, and considered the approval of the agreements in light of this information.
Based on the Board’s deliberations and evaluation of the information it received, the Board, all of whose members are Independent Trustees, approved the renewal of the agreements with the Adviser and Subadvisers and determined that the compensation under the agreements is fair and reasonable in light of the services to be performed. The Board considered the following specific factors, none of which was controlling, and made the following conclusions:
Nature, Extent, and Quality of Services
The Board received and considered information regarding the nature, extent, and quality of services to be provided to the Funds by the Adviser and Subadvisers. In this regard, the Trustees evaluated, among other things, the Adviser’s and Subadvisers’ personnel, experience, track record, and compliance program. The Board considered the background and experience of the Adviser’s and Subadvisers’ senior management and the expertise of, and amount of attention expected to be given to the Funds by, their portfolio management teams. The Board reviewed the qualifications, backgrounds, and responsibilities of the portfolio managers responsible for the day-to-day management of the Funds. The Board also reviewed information pertaining to the Adviser’s and Subadvisers’ organizational structure, senior management, investment operations, and other relevant information. The Board
100
ADDITIONAL INFORMATION (continued)
RIDGEWORTH FUNDS March 31, 2013
(Unaudited)
concluded that, within the context of its full deliberations, the nature, extent, and quality of the services to be provided to the Funds by the Adviser and Subadvisers supported the approval of the agreements.
Performance
The Board considered the investment performance of each Fund, including any periods of outperformance and underperformance, both on an absolute basis and a comparative basis to indices and other funds within the same investment categories. Specifically, the Board considered each Fund’s performance relative to its peer group and appropriate benchmarks in light of total return, yield, and market trends. As part of this review, the Board considered the composition of the peer group and selection criteria, as well as market risk and shareholder risk expectations. The Board considered the Adviser’s and Subadvisers’ explanations regarding specific performance issues. The Board concluded that, within the context of its full deliberations, the performance of the Funds, the Adviser, and the Subadvisers supported the approval of the agreements.
Fund Expenses
With respect to advisory fees, the Board considered the rate of compensation under the agreements and each Fund’s net operating expense ratio in comparison to those of comparable mutual funds. The Trustees also considered information about average expense ratios of comparable mutual funds in each Fund’s peer group. Finally, the Trustees considered the effect of the Adviser’s and Subadvisers’ waiver and reimbursement of fees and expenses, where applicable, to prevent total expenses from exceeding a specified amount and that, due to these waivers and reimbursements, net operating expenses have been maintained at competitive levels. The Board concluded that, within the context of its full deliberations, the expenses of the Funds are reasonable and supported the approval of the agreements.
Profitability
The Board reviewed information about the profitability of the Funds to the Adviser and Subadvisers and considered whether the level of profitability was reasonable and justified in light of the quality of the services rendered to the Funds. The Board concluded that, within the context of its full deliberations, the profitability of the Adviser and Subadvisers is within the range the Board considered reasonable.
Economies of Scale
The Board considered the existence of economies of scale and whether they were passed along to Fund shareholders through a graduated advisory fee schedule or other means, including any fee and expense waivers and reimbursements by the Adviser and Subadvisers. The Board concluded that, within the context of its full deliberations, the Funds obtain reasonable benefit from economies of scale.
101
ADDITIONAL INFORMATION (continued)
RIDGEWORTH FUNDS March 31, 2013
(Unaudited)
Shareholder Meeting Results
A special meeting of shareholders (“Meeting”) of the RidgeWorth Large Cap Core Growth Stock Fund (“Fund”) was held on February 11, 2013.
The Meeting was held to consider and act on the following proposal: To approve an Amendment to the Distribution and Service Plan for A Shares to increase the 12b-1 fee applicable to A Shares of the Fund.
The number of shares outstanding on the record date (December 17, 2012), the number of shares represented at the Meeting, and the details of the voting with respect to the Proposal is shown below. The Proposal received the required number of affirmative votes for approval.
Shares Outstanding | Shares Represented | Affirmative Votes | Objecting Votes | Abstaining Votes | ||||
| 967,859 | 492,039 | 415,738 | 19,741 | 56,560 |
102
ADDITIONAL INFORMATION (continued)
RIDGEWORTH FUNDS March 31, 2013
(Unaudited)
Expense Examples
As a shareholder of the RidgeWorth Funds, you incur two types of costs: (1) transaction costs, including sales charges (loads) on purchases; and (2) ongoing costs, including management fees, 12b-1 distribution and/or service fees, and other Fund expenses. These examples are intended to help you understand your ongoing costs (in dollars) of investing in the RidgeWorth Funds and to compare these costs with the ongoing costs of investing in other mutual funds.
These examples are based on an investment of $1,000 invested at the beginning of the period and held for the entire period from October 1, 2012 through March 31, 2013.
Actual Expenses
The table below provides information about actual account values and actual expenses. You may use the information below, together with the amount you invested, to estimate the expenses that you paid over the period. Simply divide your account value by $1,000 (for example, an $8,600 account value divided by $1,000 = 8.6), then multiply the result by the number in the table under the heading entitled “Expenses Paid During Period” to estimate the expenses you paid on your account during this period.
Fund | Class | Beginning Account Value 10/01/12 | Ending Account Value 03/31/13 | Expenses Paid During Period* 10/01/12-03/31/13 | Expense Ratio During Period** 10/01/12-03/31/13 | |||||||||||||||
Aggressive Growth Stock Fund | I Shares | $1,000.00 | $1,106.60 | $6.14 | 1.17 | % | ||||||||||||||
| A Shares | 1,000.00 | 1,106.00 | 7.40 | 1.41 | ||||||||||||||||
International Equity Fund | I Shares | 1,000.00 | 1,117.30 | 5.54 | 1.05 | |||||||||||||||
| A Shares | 1,000.00 | 1,115.30 | 7.28 | 1.38 | ||||||||||||||||
International Equity Index Fund | I Shares | 1,000.00 | 1,109.00 | 3.89 | �� | 0.74 | ||||||||||||||
| A Shares | 1,000.00 | 1,107.20 | 5.20 | 0.99 | ||||||||||||||||
Large Cap Growth Stock Fund | I Shares | 1,000.00 | 1,047.00 | 4.34 | 0.85 | |||||||||||||||
| A Shares | 1,000.00 | 1,046.59 | 5.46 | 1.07 | ||||||||||||||||
| C Shares | 1,000.00 | 1,042.81 | 9.17 | 1.80 | ||||||||||||||||
Large Cap Value Equity Fund | I Shares | 1,000.00 | 1,139.40 | 5.01 | 0.94 | |||||||||||||||
| A Shares | 1,000.00 | 1,137.90 | 6.29 | 1.18 | ||||||||||||||||
| C Shares | 1,000.00 | 1,134.70 | 9.10 | 1.71 | ||||||||||||||||
Mid-Cap Value Equity Fund | I Shares | 1,000.00 | 1,178.40 | 5.97 | 1.10 | |||||||||||||||
| A Shares | 1,000.00 | 1,177.30 | 7.27 | 1.34 | ||||||||||||||||
| C Shares | 1,000.00 | 1,174.50 | 9.65 | 1.78 | ||||||||||||||||
Select Large Cap Growth Stock Fund | I Shares | 1,000.00 | 1,021.80 | 5.14 | 1.02 | |||||||||||||||
| A Shares | 1,000.00 | 1,020.60 | 6.55 | 1.30 | ||||||||||||||||
| C Shares | 1,000.00 | 1,017.00 | 9.96 | 1.98 | ||||||||||||||||
Small Cap Growth Stock Fund | I Shares | 1,000.00 | 1,118.64 | 6.23 | 1.18 | |||||||||||||||
| A Shares | 1,000.00 | 1,119.22 | 6.71 | 1.27 | ||||||||||||||||
| C Shares | 1,000.00 | 1,115.33 | 10.18 | 1.93 | ||||||||||||||||
Small Cap Value Equity Fund | I Shares | 1,000.00 | 1,183.78 | 6.59 | 1.21 | |||||||||||||||
| A Shares | 1,000.00 | 1,182.72 | 8.16 | 1.50 | ||||||||||||||||
| C Shares | 1,000.00 | 1,179.35 | 10.32 | 1.90 | ||||||||||||||||
Aggressive Growth Allocation Strategy | I Shares | 1,000.00 | 1,072.70 | 2.58 | 0.50 | |||||||||||||||
| A Shares | 1,000.00 | 1,072.00 | 3.62 | 0.70 | ||||||||||||||||
| C Shares | 1,000.00 | 1,067.60 | 6.70 | 1.30 | ||||||||||||||||
Conservative Allocation Strategy | I Shares | 1,000.00 | 1,031.90 | 1.52 | 0.30 | |||||||||||||||
| A Shares | 1,000.00 | 1,030.40 | 3.04 | 0.60 | ||||||||||||||||
| C Shares | 1,000.00 | 1,027.40 | 6.57 | 1.30 | ||||||||||||||||
Growth Allocation Strategy | I Shares | 1,000.00 | 1,065.90 | 2.58 | 0.50 | |||||||||||||||
| A Shares | 1,000.00 | 1,064.10 | 3.50 | 0.68 | ||||||||||||||||
| C Shares | 1,000.00 | 1,061.80 | 6.58 | 1.28 | ||||||||||||||||
Moderate Allocation Strategy | I Shares | 1,000.00 | 1,049.10 | 2.55 | 0.50 | |||||||||||||||
| A Shares | 1,000.00 | 1,048.50 | 3.22 | 0.63 | ||||||||||||||||
| C Shares | 1,000.00 | 1,044.60 | 6.17 | 1.21 | ||||||||||||||||
| * | Expenses are equal to the average account value times the Fund’s annualized expense ratio multiplied by the number of days (182) in the most recent fiscal half-year divided by the number of days in the fiscal year (365). |
| ** | Annualized. |
103
ADDITIONAL INFORMATION (continued)
RIDGEWORTH FUNDS March 31, 2013
(Unaudited)
Hypothetical Example
The table below provides information about hypothetical account values and hypothetical expenses based on each RidgeWorth Fund’s actual expense ratio and an assumed rate of return of 5% per year before expenses, which is not the Fund’s actual return. The hypothetical account values and expenses may not be used to estimate the actual ending account balance or expenses you paid for the period. You may use this information to compare this 5% hypothetical example with the 5% hypothetical examples that appear in the shareholder reports of other funds.
Please note that the expenses shown in the table are meant to highlight your ongoing costs only and do not reflect any transactional costs, such as sales charges (loads) or redemption fees. Therefore, the table is useful in comparing ongoing costs only, and will not help you determine the relative total costs of owning different funds. In addition, if these transactional costs were included, your costs would have been higher.
Fund | Class | Beginning Account Value 10/01/12 | Ending Account Value 03/31/13 | Expenses Paid During Period* 10/01/12-03/31/13 | Expense Ratio During Period** 10/01/12-03/31/13 | |||||||||||||||
Aggressive Growth Stock Fund | I Shares | $1,000.00 | $1,019.10 | $5.89 | 1.17 | % | ||||||||||||||
| A Shares | 1,000.00 | 1,017.90 | 7.09 | 1.41 | ||||||||||||||||
International Equity Fund | I Shares | 1,000.00 | 1,019.70 | 5.29 | 1.05 | |||||||||||||||
| A Shares | 1,000.00 | 1,018.05 | 6.94 | 1.38 | ||||||||||||||||
International Equity Index Fund | I Shares | 1,000.00 | 1,021.24 | 3.73 | 0.74 | |||||||||||||||
| A Shares | 1,000.00 | 1,020.00 | 4.99 | 0.99 | ||||||||||||||||
Large Cap Growth Stock Fund | I Shares | 1,000.00 | 1,020.69 | 4.28 | 0.85 | |||||||||||||||
| A Shares | 1,000.00 | 1,019.60 | 5.39 | 1.07 | ||||||||||||||||
| C Shares | 1,000.00 | 1,015.96 | 9.05 | 1.80 | ||||||||||||||||
Large Cap Value Equity Fund | I Shares | 1,000.00 | 1,020.24 | 4.73 | 0.94 | |||||||||||||||
| A Shares | 1,000.00 | 1,019.05 | 5.94 | 1.18 | ||||||||||||||||
| C Shares | 1,000.00 | 1,016.40 | 8.60 | 1.71 | ||||||||||||||||
Mid-Cap Value Equity Fund | I Shares | 1,000.00 | 1,019.45 | 5.54 | 1.10 | |||||||||||||||
| A Shares | 1,000.00 | 1,018.25 | 6.74 | 1.34 | ||||||||||||||||
| C Shares | 1,000.00 | 1,016.06 | 8.95 | 1.78 | ||||||||||||||||
Select Large Cap Growth Stock Fund | I Shares | 1,000.00 | 1,019.85 | 5.14 | 1.02 | |||||||||||||||
| A Shares | 1,000.00 | 1,018.45 | 6.54 | 1.30 | ||||||||||||||||
| C Shares | 1,000.00 | 1,015.06 | 9.95 | 1.98 | ||||||||||||||||
Small Cap Growth Stock Fund | I Shares | 1,000.00 | 1,019.05 | 5.94 | 1.18 | |||||||||||||||
| A Shares | 1,000.00 | 1,018.60 | 6.39 | 1.27 | ||||||||||||||||
| C Shares | 1,000.00 | 1,015.31 | 9.70 | 1.93 | ||||||||||||||||
Small Cap Value Equity Fund | I Shares | 1,000.00 | 1,018.90 | 6.09 | 1.21 | |||||||||||||||
| A Shares | 1,000.00 | 1,017.45 | 7.54 | 1.50 | ||||||||||||||||
| C Shares | 1,000.00 | 1,015.46 | 9.55 | 1.90 | ||||||||||||||||
Aggressive Growth Allocation Strategy | I Shares | 1,000.00 | 1,022.44 | 2.52 | 0.50 | |||||||||||||||
| A Shares | 1,000.00 | 1,021.44 | 3.53 | 0.70 | ||||||||||||||||
| C Shares | 1,000.00 | 1,018.45 | 6.54 | 1.30 | ||||||||||||||||
Conservative Allocation Strategy | I Shares | 1,000.00 | 1,023.44 | 1.51 | 0.30 | |||||||||||||||
| A Shares | 1,000.00 | 1,021.94 | 3.02 | 0.60 | ||||||||||||||||
| C Shares | 1,000.00 | 1,018.45 | 6.54 | 1.30 | ||||||||||||||||
Growth Allocation Strategy | I Shares | 1,000.00 | 1,022.44 | 2.52 | 0.50 | |||||||||||||||
| A Shares | 1,000.00 | 1,021.54 | 3.43 | 0.68 | ||||||||||||||||
| C Shares | 1,000.00 | 1,018.55 | 6.44 | 1.28 | ||||||||||||||||
Moderate Allocation Strategy | I Shares | 1,000.00 | 1,022.44 | 2.52 | 0.50 | |||||||||||||||
| A Shares | 1,000.00 | 1,021.79 | 3.18 | 0.63 | ||||||||||||||||
| C Shares | 1,000.00 | 1,018.90 | 6.09 | 1.21 | ||||||||||||||||
| * | Expenses are equal to the average account value times the Fund’s annualized expense ratio multiplied by the number of days (182) in the most recent fiscal half-year divided by the number of days in the fiscal year (365). |
| ** | Annualized. |
Proxy Voting Information
Information regarding the policies and procedures that the Funds use to determine how to vote proxies relating to portfolio securities is available without charge, upon request, by calling 1-888-784-3863. The information also is included in the Funds’ Statement of Additional Information, which is available on the Funds’ website at www.ridgeworth.com and on the Securities and Exchange Commission’s (“SEC”) website at www.sec.gov.
104
ADDITIONAL INFORMATION (concluded)
RIDGEWORTH FUNDS March 31, 2013
(Unaudited)
Information relating to how each Fund voted proxies relating to portfolio securities held during the most recent twelve months ended June 30 is available on the Funds’ website at www.ridgeworth.com and on the SEC’s website at www.sec.gov.
Quarterly Portfolio Holdings Information
The Funds file their complete schedule of portfolio holdings with the SEC for the first and third quarters of each fiscal year on Form N-Q. The Funds’ Forms N-Q are available free of charge on the SEC’s website at www.sec.gov. You may also review or, for a fee, copy those documents by visiting the SEC’s Public Reference Room in Washington, D.C. Information on the operation of the Public Reference Room may be obtained by calling the SEC at 1-800-SEC-0330.
105
INVESTMENT ADVISER:
RidgeWorth Investments®
3333 Piedmont Road, NE, Suite 1500
Atlanta, Georgia 30305
www.ridgeworth.com
INVESTMENT SUBADVISERS:
Ceredex Value Advisors LLC
Lincoln Plaza, Suite 1600
300 South Orange Avenue
Orlando, Florida 32801
www.ceredexvalue.com
Certium Asset Management LLC
3333 Piedmont Road, NE, Suite 1500
Atlanta, Georgia 30305
www.certiumllc.com
Silvant Capital Management LLC
3333 Piedmont Road, NE, Suite 1500
Atlanta, Georgia 30305
www.silvantcapital.com
Zevenbergen Capital Investments LLC
601 Union Street, Suite 4600
Seattle, Washington 98101
www.zci.com
This information must be preceded or accompanied by a current prospectus for each Fund described. An investor should consider the Fund’s investment objectives, risks, charges and expenses carefully before investing or sending money. This and other important information about RidgeWorth Funds can be found in the Fund’s prospectus. For additional information, please call 1-888-784-3863, or visit www.ridgeworth.com. Please read the prospectus carefully before investing.
DISTRIBUTOR:
RIDGEWORTH DISTRIBUTORS LLC
Not FDIC Insured • No Bank Guarantee • May Lose Value

RFAR-EQ-0313


Collective Strength. Individual Insight.®
2013 ANNUAL REPORT
FIXED INCOME FUNDS
MARCH 31, 2013

RidgeWorth Investments® is the trade name of RidgeWorth Capital Management, Inc.
Collective Strength. Individual Insight.® is a federally registered service mark of RidgeWorth Investments.®
TABLE OF CONTENTS
RIDGEWORTH FUNDS March 31, 2013
| Letter to Shareholders | 1 | |||
| Management Discussion of Fund Performance | ||||
| Fixed Income Funds: | ||||
| 3 | ||||
| 5 | ||||
| 7 | ||||
| 9 | ||||
| 11 | ||||
| 13 | ||||
| 15 | ||||
| 17 | ||||
| 19 | ||||
| 21 | ||||
| 23 | ||||
| 25 | ||||
| 27 | ||||
| 29 | ||||
| 31 | ||||
| 33 | ||||
| 35 | ||||
| 37 | ||||
| 39 | ||||
| 41 | ||||
| Schedules of Portfolio Investments | 43 | |||
| Statements of Assets and Liabilities | 148 | |||
| Statements of Operations | 152 | |||
| Statements of Changes in Net Assets | 156 | |||
| Financial Highlights | 163 | |||
| Notes to Financial Statements | 171 | |||
| Report of Independent Registered Public Accounting Firm | 196 | |||
| Other Federal Tax Information | 197 | |||
| Trustees and Officers of the RidgeWorth Funds | 198 | |||
| Additional Information | 200 | |||
RIDGEWORTH FUNDS March 31, 2013
Dear Valued Client,
We are pleased to report that both the economy and the broader markets continued to recover over the past year, despite persistent global economic and financial challenges. We are also pleased to report that RidgeWorth Funds maintained its strong long-term investment performance record. This update will discuss recent events and identify what we anticipate for both the broad economy and the capital markets in 2013.
Before we begin, we want to thank you, our valued RidgeWorth Funds’ shareholders, for your continued business and support. We focus all of our efforts on helping you achieve your investment goals, and we are grateful that you have placed your confidence in us. Our sole mission is to earn your trust through providing competitive investment performance and excellent client service. We sincerely hope we have met your expectations in both of these measures and we look forward to continuing as your asset manager in the future.
In last year’s letter, we discussed why we remained positive regarding our outlook for the economy and the markets: improving job growth, a continued recovery in housing, low interest rates, accommodative global monetary policy, and reasonable equity valuations. However, we cautioned that many of the challenges that affected the markets over the past several years would likely remain, including fiscal and financial strains in the European Union (“EU”), persistent unemployment, volatile energy prices, and record federal deficits. We also added to that list the growing political dysfunction in Washington and the potential damage that could result from going over the “fiscal cliff.” We suggested that the net effect of these forces would likely be continued, but slower than normal growth, and that this would persuade the Federal Reserve (“Fed”) to maintain its low interest rate policy.
Indeed, the economy experienced a soft growth patch at the beginning of the latest fiscal year that ended March 31, 2013. This sluggishness countered much of the unexpected strength early in 2012, and prompted many analysts to lower growth and earnings forecasts. While growth slowed noticeably, we believe it is important to note that employers did not use the environment to initiate a new round of corporate restructuring and effect widespread layoffs. Instead, they continued to leverage the improved efficiencies won during the painful recession and maintained cyclically solid profit margins, an important sign of stability. Moreover, underneath the surface strains in the economy, the consumer showed steady improvement as shown in increased auto purchases, higher home sales and prices, and falling loan delinquency rates. The steady, though only modest, growth in employment and incomes along with improving home values allowed the consumer to continue rebuilding his battered balance sheet and confidence.
While the consumer and business segments of the economy continue to recover, the federal government struggled with record budget deficits and unsustainable long-term spending commitments. The fiscal cliff battles resulted in higher payroll and income tax rates at the beginning of 2013, while efforts to reach a long-range budget compromise only resulted in a painful sequester fallback agreement that began on March 1, 2013. The effects on the economy of both of these events are only just beginning.
Against the generally improving domestic economic backdrop, the rest of the global economy experienced some weakness as shown in the recession in the EU and deceleration in the emerging market economies such as China and Brazil. With global economic growth still soft by historic standards, financial strains remained a key focus for central banks, and policy makers around the globe are feeling pressure to contain and alleviate the mounting stress. The banking failure in the tiny island nation of Cyprus in March 2013 reinforced the notion that the work to restore economic and financial stability is not over.
Despite worrisome events, strains, and crosswinds, both here and overseas, U.S. equity markets generated healthy returns and finished at record highs on the last day of March 2013. The benchmark S&P 500 Index returned just under 14% (13.96%) including dividends for the twelve months ended March 31, 2013, which was above the long-term average annual gain. The Russell Mid-Cap and the Russell 2000 (small cap) indices rose an even more impressive 17.30% and 16.30%, respectively. Defensive sectors such as Health Care, Consumer Staples, and Telecommunications outperformed during the 12 months, and the Value style bested the Growth style following an extended period of underperformance. Markets outside the U.S. improved but lagged domestic indices, with the MSCI EAFE and MSCI Emerging Markets indices up 11.27% and 1.96%, respectively.
Fixed income markets also shared in the advance during the past year, helped by the Fed’s decision to continue buying securities and from the global turmoil, supporting the belief that the U.S. Treasury market is the safest haven in the world. However, with Treasury yields hovering near record low levels, many investors preferred higher-yielding corporate and high yield bonds, which significantly outperformed the 3.77% gain in the Barclays Aggregate Bond Index.
1
LETTER TO SHAREHOLDERS (concluded)
RIDGEWORTH FUNDS March 31, 2013
RidgeWorth Funds continued to maintain its record of strong long-term performance as 75% of our Funds beat their Lipper Peer Group medians for the 5-year period ended March 31, 20131. In addition, 75% of our Funds finished in the first or second quartile for the 10-year period1.
Looking ahead domestically, we expect the below-average growth and low inflation that characterized 2012 to continue in 2013, though we believe many of the economic headwinds of recent years, such as excess consumer leverage, may further dissipate. We anticipate modest job gains with less drag from the state and local governments and we believe housing will remain a neutral to positive influence on growth, wealth, and confidence. Corporate balance sheets are strong, cash positions are substantial, and inventories do not appear bloated, suggesting limited downside risk. Globally, we expect continued accommodative monetary policies and low interest rates. Valuations rose in the first quarter but they are still relatively attractive, in historical terms.
All that said, with the economy expanding the risks of setbacks should not be minimized. Key metrics we are following, in addition to those mentioned above, remain job growth, political, fiscal and monetary policy, EU stability efforts, income growth, housing prices, transportation data, stability in operating and net margins, consensus earnings, and cash flow estimates.
We believe the markets will continue to offer opportunities to investors, but they will be more selective and company-specific, an environment that fits well with RidgeWorth’s bottom-up approach to security selection. We at RidgeWorth wish to again thank you for the trust and confidence you have placed in us, and we look forward to another good year together.
Sincerely,

Ashi Parikh
Chairman, CEO, CIO
RidgeWorth Investments®
| 1 | For the period ended March 31, 2013, 50% (16/32), 56% (18/32), 75% (24/32) and 75% (21/28) of the RidgeWorth Funds (I Shares) beat their Lipper peer group medians for the 1-, 3-, 5- and 10-year periods, respectively. The Lipper rankings are as of March 31, 2013, for I Shares only, based on total returns and do not reflect a sales charge. ©2013 Lipper Leader, Reuters. All Rights Reserved. Lipper Ratings are according to Lipper, a Thomson Reuters Company. Past performance is not indicative of future results. |
2
Portfolio Managers
| Ÿ | James F. Keegan |
| Ÿ | Adrien Webb, CFA |
| Ÿ | Perry Troisi |
| Ÿ | Michael Rieger |
INVESTMENT CONCERNS
Mutual fund investing involves risk, including possible loss of principal. Bonds offer a relatively stable level of income, although bond prices will fluctuate providing the potential for principal gain or loss. Intermediate-term, higher-quality bonds generally offer less risk than longer-term bonds and a lower rate of return.
The Fund is subject to the risk that principal value reacts in opposition to the movement of interest rates and that a rising interest rate environment increases the risk of loss of principal.
Mortgage-backed investments involve risk of loss due to prepayments and, like any bond, due to default. Because of the sensitivity of mortgage-related securities to changes in interest rates, the Fund’s performance may be more volatile than if it did not hold these securities.
Debt securities will generally lose value if interest rates increase and vice versa. Interest rate risk is generally higher for investments with longer maturities or durations. Debt securities are subject to the risk that an issuer will fail to make timely payments of interest or principal or go bankrupt, reducing the Fund’s return. The lower the rating of a debt security, the higher its credit risk.
MANAGEMENT DISCUSSION OF FUND PERFORMANCE
How did the Fund perform against its benchmark for the fiscal year ended March 31, 2013?
For the fiscal year ended March 31, 2013, the Core Bond Fund returned 3.53% (I Shares) versus 3.77% for the Barclays Capital U.S. Aggregate Bond Index. For longer-time periods, performance of the Fund has exceeded the index at 5.65% versus 5.52% over 3 years and 6.39% versus 5.47% over 5 years.
What factors influenced the Fund’s performance for the fiscal year ended March 31, 2013?
Given the generosity of central banks globally, the fiscal year was marked by a broad “risk rally” that rewarded nearly all spread sectors, with the lower rated, higher beta segments of the market benefitting the most and providing robust excess returns. With that backdrop, the Fund’s overweight in spread product (all fixed income securities that trade at a spread over a comparable U.S. Treasury Security) was a positive contributor to performance. Security selection within corporate bonds was a modest drag as positioning was fairly defensive, while mortgage-backed security (MBS) selection contributed to the Fund’s return via several off-index allocations (collateralized mortgage obligations [CMOs] and delegated underwriting and servicing [DUS] bonds). A void in government-related risk was also a drag on performance. Strategic yield curve positioning was not a part of performance this year.
How do you plan to position the Fund, based on market conditions?
Current valuations are hyper inflated over the intermediate and long term. Juxtaposing these valuations against the fragile and challenged macroeconomic environment that persists, we find comfort in remaining defensive and less exposed to risk markets/spread sectors relative to positioning at earlier points in the recovery. An overabundance of complacency exists globally and warrants caution.
The Fund is currently at an index weighting in corporate bonds, down slightly from 1.2x the index weight at the beginning of the fiscal year. This is a low in corporate bond exposure compared to the last several years. The positioning remains defensive, focusing on industrial exposure while maintaining a longstanding underweight in money center bank exposure. While still overweight residential mortgage-backed securities (RMBS), we have reduced the weighting versus the index from 1.3x to 1.1x over the course of the fiscal year. Positioning within RMBS continues to be overweight 15-year collateral and the usage of structure (CMOs) for prepayment protection and convexity. A modest overweight in commercial mortgage-backed securities (CMBS) persists and the exposure remains near the top of the capital structure. The Fund is void the government-related sector, as the spread offered does not adequately compensate for the risk.
3
CORE BOND FUND
Growth of a $10,000 Investment (as of March 31, 2013)
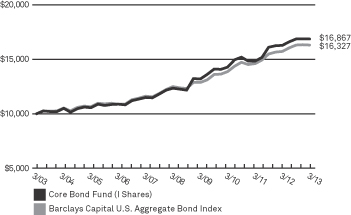 | This chart assumes an initial hypothetical investment of $10,000 made on 3/31/03. Total return is based on net change in the Net Asset Value (“NAV”) assuming reinvestment of distributions. Returns shown on this page include reinvestment of all dividends and other distributions.
The Fund’s performance is compared to the Barclays Capital U.S. Aggregate Bond Index, which covers the U.S. dollar-denominated, investment-grade, fixed-rate, taxable bond market of SEC-registered securities. The Index includes bonds from the Treasury, Government-Related, Corporate, MBS (agency fixed-rate and hybrid ARM pass-throughs), ABS and CMBS sectors. The Index is unmanaged and does not reflect the deduction of fees, such as investment management and fund accounting fees associated with a mutual fund. Investors cannot invest directly in an index. |
| Average Annual Total Returns as of 3/31/13 | ||||||||||||||||||||
| Core Bond Fund | 1 Year | 3 Year | 5 Year | 10 Year | ||||||||||||||||
A Shares | without sales charge | 3.20% | 5.33% | 6.07% | 5.02% | |||||||||||||||
| with sales charge* | -1.67% | 3.63% | 5.03% | 4.51% | ||||||||||||||||
R Shares^ | 3.15% | 5.10% | 5.69% | 4.51% | ||||||||||||||||
I Shares | 3.53% | 5.65% | 6.39% | 5.37% | ||||||||||||||||
| Barclays Capital U.S. Aggregate Bond Index | 3.77% | 5.52% | 5.47% | 5.02% | ||||||||||||||||
| Prospectus Expense Ratio1 | Gross | |||||||||||||||||||
| A Shares | 0.71% | |||||||||||||||||||
| R Shares | 1.03% | |||||||||||||||||||
| I Shares | 0.39% | |||||||||||||||||||
Past performance does not guarantee future results. The performance data quoted represents past performance and current returns may be lower or higher. Total return figures include change in share price, reinvestment of dividends and capital gains and do not reflect taxes that a shareholder would pay on fund distributions or on the redemption of fund shares. The investment return and principal value will fluctuate so that an investor’s shares, when redeemed, may be worth more or less than the original cost. For performance data current to the most recent month end, visit our website at www.ridgeworth.com.
| * | Class A Share performance reflects the maximum front-end sales charge of 4.75%. |
| ^ | Effective at the close of business on 7/31/09, C Shares converted to R Shares and C Shares are no longer available for purchase. The performance shown prior to such date is based on the performance of the C Shares of the Fund and has not been adjusted to reflect R Shares expenses. |
| 1 | This information is included in the most current prospectus available to current and prospective shareholders of the Fund. Additional information pertaining to the 3/31/13 expense ratios can be found in the financial highlights. |
Investment Weightings (as of March 31, 2013)
as a percentage of investments
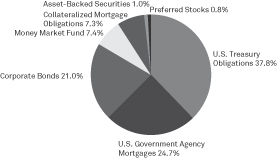
4
Portfolio Managers
| Ÿ | James F. Keegan |
| Ÿ | Adrien Webb, CFA |
| Ÿ | Perry Troisi |
INVESTMENT CONCERNS
Mutual fund investing involves risk, including possible loss of principal. Bonds offer a relatively stable level of income, although bond prices will fluctuate providing the potential for principal gain or loss. Intermediate-term, higher-quality bonds generally offer less risk than longer-term bonds and a lower rate of return.
U.S. Government guarantees apply only to the underlying securities of the Fund’s portfolio and not the Fund’s shares.
Although the Fund’s yield may be higher than that of fixed income funds that purchase higher-rated securities, the potentially higher yield is a function of the greater risk that the Fund’s share price will decline.
International investing involves increased risk and volatility.
The Fund is subject to the risk that principal value reacts in opposition to the movement of interest rates and that a rising interest rate environment increases the risk of loss of principal.
Mortgage-backed investments involve risk of loss due to prepayments and, like any bond, due to default. Because of the sensitivity of mortgage-related securities to changes in interest rates, the Fund’s performance may be more volatile than if it did not hold these securities.
Debt securities will generally lose value if interest rates increase and vice versa. Interest rate risk is generally higher for investments with longer maturities or durations. Debt securities are subject to the risk that an issuer will fail to make timely payments of interest or principal or go bankrupt, reducing the Fund’s return. The lower the rating of a debt security, the higher its credit risk.
MANAGEMENT DISCUSSION OF FUND PERFORMANCE
How did the Fund perform against its benchmark for the fiscal year ended March 31, 2013?
For the fiscal year ended March 31, 2013, the Corporate Bond Fund returned 6.71% (I Shares) versus 7.47% for the Barclays Capital U.S. Corporate Index.
What factors influenced the Fund’s performance for the fiscal year ended March 31, 2013?
Given the generosity of central banks globally, the fiscal year was marked by a broad “risk rally” that rewarded nearly all spread sectors, with the higher beta segments of the market benefitting the most and providing robust excess returns. The Fund’s defensive positioning amidst this long “risk on” period was the driver of underperformance.
How do you plan to position the Fund, based on market conditions?
Current valuations are hyper inflated over the intermediate and long term. Juxtaposing these valuations against the fragile and challenged macroeconomic environment that persists, we find comfort in remaining defensive and less exposed to higher beta sectors relative to positioning at earlier points in the recovery. An overabundance of complacency exists globally and warrants caution.
We remain defensively positioned, overweighting the industrial sector while maintaining a longstanding underweight in money center bank exposure. Money center bank balance sheets remain opaque, leverage ratios remain elevated and profitability going forward will be dictated more by cost-cutting than expanding market share or new lines of business. Spreads fail to reflect this new operating environment, never mind the massive regulatory overhaul that is already underway.
5
CORPORATE BOND FUND
Growth of a $10,000 Investment (as of March 31, 2013)
| ||
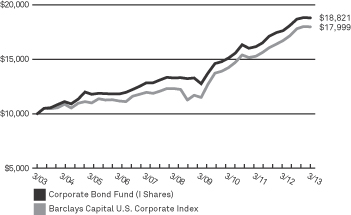 | This chart assumes an initial hypothetical investment of $10,000 made on 3/31/03. Total return is based on net change in the Net Asset Value (“NAV”) assuming reinvestment of distributions. Returns shown on this page include reinvestment of all dividends and other distributions.
The Fund’s performance is compared to the Barclays Capital U.S. Corporate Index, which covers U.S. dollar-denominated, investment grade, fixed-rate, taxable securities sold by industrial, utility and financial issuers. The Index includes publicly issued U.S. corporate and foreign debentures and secured notes that meet specified maturity, liquidity, and quality requirements. The Index is unmanaged and does not reflect the deduction of fees, such as investment management and fund accounting fees associated with a mutual fund. Investors cannot invest directly in an index. | |
| Average Annual Total Returns as of 3/31/13 | ||||||||||||||||||||||||
| Corporate Bond Fund | Inception Date | 1 Year | 3 Year | 5 Year | 10 Year | Since Inception | ||||||||||||||||||
A Shares | without sales charge | 10/08/03 | 6.39% | 7.27% | 6.86% | N/A | 6.02% | |||||||||||||||||
| with sales charge* | 1.32% | 5.55% | 5.83% | N/A | 5.47% | |||||||||||||||||||
C Shares | without CDSC | 11/30/01 | 5.67% | 6.52% | 6.11% | 5.59% | N/A | |||||||||||||||||
| with CDSC* | 4.68% | 6.52% | 6.11% | 5.59% | N/A | |||||||||||||||||||
I Shares | 11/30/01 | 6.71% | 7.56% | 7.18% | 6.53% | N/A | ||||||||||||||||||
| Barclays Capital U.S. Corporate Index | 7.47% | 8.12% | 7.88% | 6.05% | 6.02% | |||||||||||||||||||
| Prospectus Expense Ratio1 | Gross | |||||||||||||||||||||||
| A Shares | 0.89% | |||||||||||||||||||||||
| C Shares | 1.58% | |||||||||||||||||||||||
| I Shares | 0.63% | |||||||||||||||||||||||
Past performance does not guarantee future results. The performance data quoted represents past performance and current returns may be lower or higher. Total return figures include change in share price, reinvestment of dividends and capital gains and do not reflect taxes that a shareholder would pay on fund distributions or on the redemption of fund shares. The investment return and principal value will fluctuate so that an investor’s shares, when redeemed, may be worth more or less than the original cost. For performance data current to the most recent month end, visit our website at www.ridgeworth.com.
| * | Class A Share performance reflects the maximum front-end sales charge of 4.75% and Class C Shares reflect the maximum CDSC (contingent deferred sales charge) of 1.00% in year one only. |
| 1 | This information is included in the most current prospectus available to current and prospective shareholders of the Fund. Additional information pertaining to the 3/31/13 expense ratios can be found in the financial highlights. |
Investment Weightings (as of March 31, 2013)
as a percentage of investments
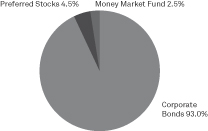
6
Portfolio Manager
| Ÿ | Chris Carter, CFA |
INVESTMENT CONCERNS
Mutual fund investing involves risk, including possible loss of principal. Bonds offer a relatively stable level of income, although bond prices will fluctuate providing the potential for principal gain or loss. Intermediate-term, higher-quality bonds generally offer less risk than longer-term bonds and a lower rate of return.
The geographical concentration of portfolio holdings in the Fund may involve increased risk.
The Fund’s income may be subject to certain state and local taxes and, depending on your tax status, the federal alternative minimum tax.
The Fund is subject to the risk that principal value reacts in opposition to the movement of interest rates and that a rising interest rate environment increases the risk of loss of principal.
Debt securities will generally lose value if interest rates increase and vice versa. Interest rate risk is generally higher for investments with longer maturities or durations. Debt securities are subject to the risk that an issuer will fail to make timely payments of interest or principal or go bankrupt, reducing the Fund’s return. The lower the rating of a debt security, the higher its credit risk.
MANAGEMENT DISCUSSION OF FUND PERFORMANCE
How did the Fund perform against its benchmark for the fiscal year ended March 31, 2013?
For the fiscal year ended March 31, 2013, the Fund’s I Shares had a total return of 5.44% versus an average return of 5.17% for the Lipper Georgia Municipal Debt Objective and a 5.25% total return for the Barclays Capital U.S. Municipal Bond Index (the “Index”). The long end of the municipal yield curve, defined as 22-year and longer maturities, provided the greatest total return during the period, with total returns generally increasing out of the curve (according to Barclays Capital). Relative to the Index, the Fund maintains a higher allocation to the cash equivalent, 7-year, 10-year, 20-year, and long bond sectors and a lower allocation to all other maturity sectors, as of March 31, 2013. Additionally, relative to the Index, the Fund maintained a higher allocation to securities rated AAA and A, and a lower allocation to securities in the AA and BAA rating categories. Standard & Poor’s rates securities from AAA (highest quality) to C (lowest quality) with BBB and above being called investment grade securities. BB and below are considered below investment grade securities. Trading activity and portfolio events during the period resulted in exposure to the less than 1-year, 1-year, 3-year, and 10-year sectors being increased, and exposure to the 5-year, 20-year, and long bond sectors being reduced. The 5, 10, and 30-year generic AAA rated municipal bond yields declined 0.14%, 0.20% and 0.30%, respectively, over the 12 months (according to Municipal Market Data Line).
What factors influenced the Fund’s performance for the fiscal year ended March 31, 2013?
Yield curve positioning contributed to the Fund’s outperformance for the period. Although the Fund reduced exposure to bonds with final maturities of 17 years and longer, the Fund still maintains a small overweight of this maturity range relative to the Index. The long bond sector outperformed the 5-year sector by 4.22% for the fiscal year ended March 31, 2013 (according to Barclays Capital).
How do you plan to position the Fund, based on market conditions?
With municipal supply likely to remain manageable again this year, further investor flight-to-quality would likely increase the attractiveness of municipal bonds. Municipals as an asset class are relatively secure while offering among the highest after-tax returns over the past decade for top income earners. We continue to carefully watch the political environment in Washington, an impactful factor for all asset classes. The Fund’s present duration posture, yield curve positioning, and sector allocations seem appropriate given our forecasts for the economy and financial markets. We will continue to make tactical adjustments to the Fund, periodically, as part of an active portfolio management process. All activity will occur within an investment grade construct and the average credit quality of the Fund’s holdings should remain high relative to its peers.
7
GEORGIA TAX-EXEMPT BOND FUND
Growth of a $10,000 Investment (as of March 31, 2013)
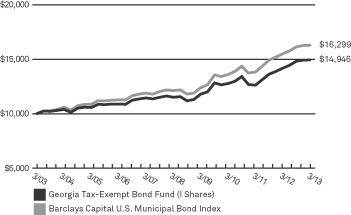 | This chart assumes an initial hypothetical investment of $10,000 made on 3/31/03. Total return is based on net change in the Net Asset Value (“NAV”) assuming reinvestment of distributions. Returns shown on this page include reinvestment of all dividends and other distributions.
The Fund’s performance is compared to the Barclays Capital U.S. Municipal Bond Index, which covers the U.S. dollar-denominated long-term tax-exempt bond market. The Index has four main sectors: state and local general obligation bonds, revenue bonds, insured bonds, and prerefunded bonds. The Index is unmanaged and does not reflect the deduction of fees such as investment management and fund accounting fees associated with a mutual fund. Investors cannot invest directly in an index. |
| Average Annual Total Returns as of 3/31/13 | ||||||||||||||||||
| Georgia Tax-Exempt Bond Fund | 1 Year | 3 Year | 5 Year | 10 Year | ||||||||||||||
A Shares | without sales charge | 5.27% | 5.25% | 5.20% | 3.93% | |||||||||||||
| with sales charge* | 0.25% | 3.56% | 4.17% | 3.42% | ||||||||||||||
I Shares | 5.44% | 5.38% | 5.36% | 4.10% | ||||||||||||||
| Barclays Capital U.S. Municipal Bond Index | 5.25% | 6.23% | 6.10% | 5.01% | ||||||||||||||
| Prospectus Expense Ratio1 | Gross | |||||||||||||||||
| A Shares | 0.74% | |||||||||||||||||
| I Shares | 0.58% | |||||||||||||||||
Past performance does not guarantee future results. The performance data quoted represents past performance and current returns may be lower or higher. Total return figures include change in share price, reinvestment of dividends and capital gains and do not reflect taxes that a shareholder would pay on fund distributions or on the redemption of fund shares. The investment return and principal value will fluctuate so that an investor’s shares, when redeemed, may be worth more or less than the original cost. For performance data current to the most recent month end, visit our website at www.ridgeworth.com.
| * | Class A Share performance reflects the maximum front-end sales charge of 4.75%. |
| 1 | This information is included in the most current prospectus available to current and prospective shareholders of the Fund. Additional information pertaining to the 3/31/13 expense ratios can be found in the financial highlights. |
Investment Weightings (as of March 31, 2013)
as a percentage of investments
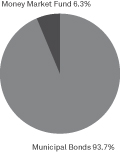
8
HIGH GRADE MUNICIPAL BOND FUND
Portfolio Manager
| Ÿ | Ronald Schwartz, CFA |
INVESTMENT CONCERNS
Mutual fund investing involves risk, including possible loss of principal. Bonds offer a relatively stable level of income, although bond prices will fluctuate providing the potential for principal gain or loss. Intermediate-term, higher-quality bonds generally offer less risk than longer-term bonds and a lower rate of return.
The Fund is subject to the risk that principal value reacts in opposition to the movement of interest rates and that a rising interest rate environment increases the risk of loss of principal.
The geographical concentration of portfolio holdings in the Fund may involve increased risk.
The Fund’s income may be subject to certain state and local taxes and, depending on your tax status, the federal alternative minimum tax.
Debt securities will generally lose value if interest rates increase and vice versa. Interest rate risk is generally higher for investments with longer maturities or durations. Debt securities are subject to the risk that an issuer will fail to make timely payments of interest or principal or go bankrupt, reducing the Fund’s return. The lower the rating of a debt security, the higher its credit risk.
MANAGEMENT DISCUSSION OF FUND PERFORMANCE
How did the Fund perform against its benchmark for the fiscal year ended March 31, 2013?
For the fiscal year ended March 31, 2013, the Fund’s I Shares had a total return of 7.12% versus an average return of 6.31% for the Lipper General & Insured Municipal Debt Objective and 5.25% total return for the Barclays Capital U.S. Municipal Bond Index (the “Index”). The long end of the municipal yield curve, defined as 22-year and longer maturities, provided the greatest total return during the period, with total returns generally increasing out of the curve (according to Barclays Capital). Relative to the Index the Fund maintained a higher allocation to the cash equivalent, 6-8 years, 17-22 years, and long (22+ years) maturity buckets as of March 31, 2013. Additionally, relative to the Index, the Fund maintains an overweight to AAA and A rated securities while underweight the lower rated investment grade paper. The 5, 10, and 30-year generic AAA rated municipal bond yields declined 0.14%, 0.20% and 0.30%, respectively, over the fiscal year (according to Municipal Market Data Line).
What factors influenced the Fund’s performance for the fiscal year ended March 31, 2013?
Yield curve positioning contributed to the Fund’s outperformance for the period versus the Index. The long bond sector outperformed the10-year sector by 2.05% for the fiscal year ended March 31, 2013 (according to Barclays Capital). Overweights of the hospital, education, leasing and transportation sectors also contributed to the Fund’s outperformance. The Fund’s high quality bias was a drag on performance versus both the Index and the peer group. Barclays BBB-rated Index returned 6.50% for the fiscal year ended March 31, 2013, versus the AAA Index return of 3.78% for the same period.
How do you plan to position the Fund, based on market conditions?
With municipal supply likely to remain manageable again this year, further investor flight-to-quality would likely increase the attractiveness of municipal bonds. Municipals as an asset class are relatively secure while offering among the highest after-tax returns over the past decade for top income earners. We continue to carefully watch the political environment in Washington, an impactful factor for all asset classes. The Fund’s present duration posture, yield curve positioning, and sector allocations seem appropriate given our forecasts for the economy and financial markets. We will continue to make tactical adjustments to the Fund, periodically, as part of an active portfolio management process. All activity will occur within an investment grade construct and the average credit quality of the Fund’s holdings should remain high relative to its peers.
9
HIGH GRADE MUNICIPAL BOND FUND
Growth of a $10,000 Investment (as of March 31, 2013)
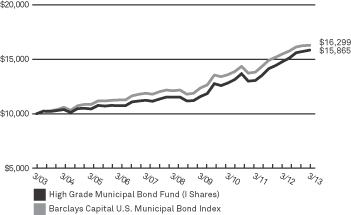 | This chart assumes an initial hypothetical investment of $10,000 made on 3/31/03. Total return is based on net change in the Net Asset Value (“NAV”) assuming reinvestment of distributions. Returns shown on this page include reinvestment of all dividends and other distributions.
The Fund’s performance is compared to the Barclays Capital U.S. Municipal Bond Index, which covers the U.S. dollar-denominated long-term tax-exempt bond market. The Index has four main sectors: state and local general obligation bonds, revenue bonds, insured bonds, and prerefunded bonds. The Index is unmanaged and does not reflect the deduction of fees such as investment management and fund accounting fees associated with a mutual fund. Investors cannot invest directly in an index. |
| Average Annual Total Returns as of 3/31/13 | ||||||||||||||||||
| High Grade Municipal Bond Fund | 1 Year | 3 Year | 5 Year | 10 Year | ||||||||||||||
A Shares | without sales charge | 6.97% | 7.22% | 6.45% | 4.56% | |||||||||||||
| with sales charge* | 1.86% | 5.49% | 5.42% | 4.05% | ||||||||||||||
I Shares | 7.12% | 7.35% | 6.59% | 4.72% | ||||||||||||||
| Barclays Capital U.S. Municipal Bond Index | 5.25% | 6.23% | 6.10% | 5.01% | ||||||||||||||
| Prospectus Expense Ratio1 | Gross | |||||||||||||||||
| A Shares | 0.79% | |||||||||||||||||
| I Shares | 0.65% | |||||||||||||||||
Past performance does not guarantee future results. The performance data quoted represents past performance and current returns may be lower or higher. Total return figures include change in share price, reinvestment of dividends and capital gains and do not reflect taxes that a shareholder would pay on fund distributions or on the redemption of fund shares. The investment return and principal value will fluctuate so that an investor’s shares, when redeemed, may be worth more or less than the original cost. For performance data current to the most recent month end, visit our website at www.ridgeworth.com.
| * | Class A Share performance reflects the maximum front-end sales charge of 4.75%. |
| 1 | This information is included in the most current prospectus available to current and prospective shareholders of the Fund. Additional information pertaining to the 3/31/13 expense ratios can be found in the financial highlights. |
Investment Weightings (as of March 31, 2013)
as a percentage of investments
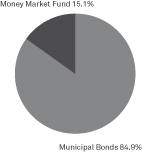
10
Portfolio Managers
| Ÿ | Brian Nold, M.D. |
INVESTMENT CONCERNS
Mutual fund investing involves risk, including possible loss of principal. Bonds offer a relatively stable level of income, although bond prices will fluctuate providing the potential for principal gain or loss. Intermediate-term, higher-quality bonds generally offer less risk than longer-term bonds and a lower rate of return.
Although the Fund’s yield may be higher than that of fixed income funds that purchase higher-rated securities, the potentially higher yield is a function of the greater risk that the Fund’s share price will decline.
The Fund is subject to the risk that principal value reacts in opposition to the movement of interest rates and that a rising interest rate environment increases the risk of loss of principal.
Debt securities will generally lose value if interest rates increase and vice versa. Interest rate risk is generally higher for investments with longer maturities or durations. Debt securities are subject to the risk that an issuer will fail to make timely payments of interest or principal or go bankrupt, reducing the Fund’s return. The lower the rating of a debt security, the higher its credit risk.
MANAGEMENT DISCUSSIONOF FUND PERFORMANCE
How did the Fund perform against its benchmark for the fiscal year ended March 31, 2013?
The 13.17% return of the High Income Fund (I Shares) for the fiscal year ended March 31, 2013 was 0.04% ahead of the 13.13% return of the Barclays Capital U.S. Corporate High Yield Bond Index.
What factors influenced the Fund’s performance for the fiscal year ended March 31, 2013?
The Fund’s positive return can be attributed to beneficial security selection in a number of industries, including Finance, Energy, Health Care, Telecommunications and Media as well as an overweighting in Telecommunications. Partially offsetting the positive factors was unfavorable security selection in Technology and Gaming as well as the modest holding of cash in a rising market.
How do you plan to position the Fund, based on market conditions?
Given the double digit returns for the fiscal year ended March 31, 2013, we have generally worked to increase protection against interest rate and default risk. The Fund is overweighed in B-rated bonds that are less sensitive to changes in interest rates compared to BB-rated bonds. Over the past twelve months, we lowered exposure to CCC rated bonds so that the Fund is less exposed to a possible spike in defaults that could be linked to a downturn in the economy. We are maintaining the Fund’s underweighting in cyclical sectors, such as Chemicals, Construction and Paper, as well as non-US issuers, especially European banks. The Fund is overweighed the benchmark in non-cyclical Food and Service sectors as well as in industries with solid asset coverage, including Broadcasting, Energy and Telecommunications. Energy and Telecommunications. Cash is being made available from calls as well as strategic sales when positions reach their target returns. Proceeds are being reinvested primarily in opportunities provided through the new issue market.
11
HIGH INCOME FUND
Growth of a $10,000 Investment (as of March 31, 2013)
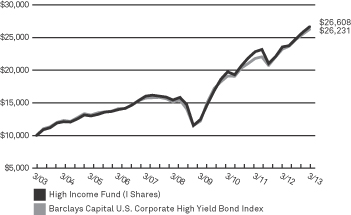 | This chart assumes an initial hypothetical investment of $10,000 made on 3/31/03. Total return is based on net change in the Net Asset Value (“NAV”) assuming reinvestment of distributions. Returns shown on this page include reinvestment of all dividends and other distributions.
The Fund’s performance is compared to the Barclays Capital U.S. Corporate High Yield Bond Index, which covers the U.S. dollar-denominated, non-investment grade, fixed-rate, taxable corporate bond market. Securities are classified as high yield if the middle rating of Moody’s, Fitch, and S&P is Ba1/BB+/BB+ or below. The Index excludes Emerging Markets debt. The Index is unmanaged and does not reflect the deduction of fees, such as investment management and fund accounting fees associated with a mutual fund. Investors cannot invest directly in an index. |
| Average Annual Total Returns as of 3/31/13 | ||||||||||||||||||||||||
| High Income Fund | Inception Date | 1 Year | 3 Year | 5 Year | 10 Year | Since Inception | ||||||||||||||||||
A Shares | without sales charge | 10/27/03 | 12.88% | 10.22% | 11.22% | N/A | 9.16% | |||||||||||||||||
| with sales charge* | 7.57% | 8.44% | 10.14% | N/A | 8.60% | |||||||||||||||||||
R Shares^ | 05/04/94 | 12.61% | 9.83% | 10.79% | 9.44% | N/A | ||||||||||||||||||
I Shares | 10/03/01 | 13.17% | 10.54% | 11.55% | 10.28% | N/A | ||||||||||||||||||
| Barclays Capital U.S. Corporate High Yield Bond Index | 13.13% | 11.24% | 11.65% | 10.12% | 9.12% | |||||||||||||||||||
| Prospectus Expense Ratio1 | Gross | |||||||||||||||||||||||
| A Shares | 1.01% | |||||||||||||||||||||||
| R Shares | 1.31% | |||||||||||||||||||||||
| I Shares | 0.81% | |||||||||||||||||||||||
Past performance does not guarantee future results. The performance data quoted represents past performance and current returns may be lower or higher. Total return figures include change in share price, reinvestment of dividends and capital gains and do not reflect taxes that a shareholder would pay on fund distributions or on the redemption of fund shares. The investment return and principal value will fluctuate so that an investor’s shares, when redeemed, may be worth more or less than the original cost. For performance data current to the most recent month end, visit our website at www.ridgeworth.com.
| * | Class A Share performance reflects the maximum front-end sales charge of 4.75%. |
| ^ | Effective at the close of business on 7/31/09, C Shares converted to R Shares and C Shares are no longer available for purchase. The performance shown prior to such date is based on the performance of the C Shares of the Fund and has not been adjusted to reflect R Share expenses. |
| 1 | This information is included in the most current prospectus available to current and prospective shareholders of the Fund. Additional information pertaining to the 3/31/13 expense ratios can be found in the financial highlights. |
Investment Weightings (as of March 31, 2013)
as a percentage of investments
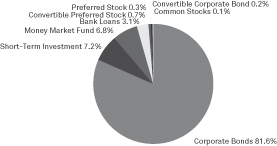
12
Portfolio Managers
| Ÿ | James F. Keegan |
| Ÿ | Adrien Webb, CFA |
| Ÿ | Perry Troisi |
| Ÿ | Michael Rieger |
| Ÿ | Seth Antiles, Ph.D |
INVESTMENT CONCERNS
Mutual fund investing involves risk, including possible loss of principal. Bond funds will tend to experience smaller fluctuations in value than stock funds. However, investors in any bond fund should anticipate fluctuations in price, especially for longer-term issues and in environments of rising interest rates.
Mortgage-backed investments involve risk of loss due to prepayments and, like any bond, due to default. Because of the sensitivity of mortgage-related securities to changes in interest rates, the Fund’s performance may be more volatile than if it did not hold these securities.
Debt securities will generally lose value if interest rates increase and vice versa. Interest rate risk is generally higher for investments with longer maturities or durations. Debt securities are subject to the risk that an issuer will fail to make timely payments of interest or principal or go bankrupt, reducing the Fund’s return. The lower the rating of a debt security, the higher its credit risk.
MANAGEMENT DISCUSSION OF FUND PERFORMANCE
How did the Fund perform against its benchmark for the fiscal year ended March 31, 2013?
For the fiscal year ended March 31, 2013, the Intermediate Bond Fund returned 3.24% (I Shares) versus 3.53% for the Barclays Capital Intermediate U.S. Government/Credit Bond Index (the “Index”). For a 5-year period, performance of the Fund has exceeded the Index at 5.26% versus 4.61%.
What factors influenced the Fund’s performance for the fiscal year ended March 31, 2013?
Given the generosity of central banks globally, the fiscal year was marked by a broad “risk rally” that rewarded nearly all spread sectors, with the lower rated, higher beta segments of the market benefitting the most and providing robust excess returns. With that backdrop, the Fund’s overweight in spread product (all fixed income securities that trade at a spread over a comparable U.S. Treasury Security) was a positive contributor to performance. Security selection within corporate bonds was a modest drag as positioning was fairly defensive. A void in government-related risk was also a drag on performance. Opportunistic exposure to agency-only residential mortgage-backed securities (RMBS) again contributed positively to the Fund’s performance. Strategic yield curve positioning was not a part of performance this year.
How do you plan to position the Fund, based on market conditions?
Current valuations are hyper inflated over the intermediate and long term. Juxtaposing these valuations against the fragile and challenged macroeconomic environment that persists, we find comfort in remaining defensive and less exposed to risk markets/spread sectors relative to positioning at earlier points in the recovery. An overabundance of complacency exists globally and warrants caution.
The Fund is currently at an index weighting in corporate bonds, down slightly from 1.2x the index weight at the beginning of the fiscal year. This is a low in corporate bond exposure compared to the last several years. The positioning remains defensive, focusing on industrial exposure while maintaining a longstanding underweight in money center bank exposure. The Fund continues to have an opportunistic overweight in agency—only residential mortgage-backed securities (RMBS). The RMBS exposure is primarily 15-year collateral. The Fund is void the government-related sector, as the spread offered does not adequately compensate for the risk.
13
INTERMEDIATE BOND FUND
Growth of a $10,000 Investment (as of March 31, 2013)
 | This chart assumes an initial hypothetical investment of $10,000 made on 3/31/03. Total return is based on net change in the Net Asset Value (“NAV”) assuming reinvestment of distributions. Returns shown on this page include reinvestment of all dividends and other distributions.
The Fund’s performance is compared to the Barclays Capital Intermediate U.S. Government/Credit Bond Index, which measures the performance of U.S. dollar-denominated U.S. Treasuries, government-related (the U.S. and foreign agencies, sovereign, supranational and local authority debt), and investment-grade credit securities that have a remaining maturity of greater than or equal to 1 year and less than 10 years, and have $250 million or more of outstanding face value. In addition, the securities must be fixed rate and non-convertible. The Index is unmanaged and does not reflect the deduction of fees, such as investment management and fund accounting fees associated with a mutual fund. Investors cannot invest directly in an index. |
| Average Annual Total Returns as of 3/31/13 | ||||||||||||||||||||
| Intermediate Bond Fund | Inception Date† | 1 Year | 3 Year | 5 Year | 10 Year | |||||||||||||||
A Shares | without sales charge | 06/30/99 | 2.85% | 4.19% | 4.98% | 4.56% | ||||||||||||||
| with sales charge* | –2.02% | 2.50% | 3.97% | 4.06% | ||||||||||||||||
R Shares | 06/30/99 | 2.58% | 3.77% | 4.52% | 4.12% | |||||||||||||||
I Shares | 06/30/99 | 3.24% | 4.47% | 5.26% | 4.81% | |||||||||||||||
| Barclays Capital Intermediate U.S. Government/Credit Bond Index | 3.53% | 4.75% | 4.61% | 4.49% | ||||||||||||||||
| Prospectus Expense Ratio1 | Gross | |||||||||||||||||||
| A Shares | 0.63% | |||||||||||||||||||
| R Shares | 1.04% | |||||||||||||||||||
| I Shares | 0.35% | |||||||||||||||||||
Past performance does not guarantee future results. The performance data quoted represents past performance and current returns may be lower or higher. Total return figures include change in share price, reinvestment of dividends and capital gains and do not reflect taxes that a shareholder would pay on fund distributions or on the redemption of fund shares. The investment return and principal value will fluctuate so that an investor’s shares, when redeemed, may be worth more or less than the original cost. For performance data current to the most recent month end, visit our website at www.ridgeworth.com.
| * | Class A Share performance reflects the maximum front-end sales charge of 4.75%. |
| † | A Shares and R Shares were offered beginning on 10/11/04. The performance shown prior to such date for A Shares and R Shares is based on the performance of the Class I Shares of the Seix Intermediate Bond Fund, an open-end investment company that was the predecessor fund to the Intermediate Bond Fund and performance is based on the performance of I Shares. During the period 10/16/07 through 1/17/08, R Shares did not have any shareholders. Historical performance based on the predecessor fund or on the I Shares has not been adjusted to reflect A Share or R Share expenses. If it had been, the performance would have been lower. |
| 1 | This information is included in the most current prospectus available to current and prospective shareholders of the Fund. Additional information pertaining to the 3/31/13 expense ratios can be found in the financial highlights. |
Investment Weightings (as of March 31, 2013)
as a percentage of investments
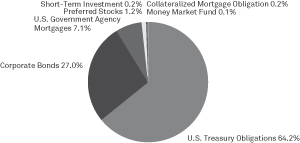
14
INVESTMENT GRADE TAX-EXEMPT BOND FUND
Portfolio Manager
| Ÿ | Ronald Schwartz, CFA |
INVESTMENT CONCERNS
Mutual fund investing involves risk, including possible loss of principal. Bonds offer a relatively stable level of income, although bond prices will fluctuate providing the potential for principal gain or loss. Intermediate-term, higher-quality bonds generally offer less risk than longer-term bonds and a lower rate of return.
The Fund’s income may be subject to certain state and local taxes and, depending on your tax status, the federal alternative minimum tax.
The Fund is subject to the risk that principal value reacts in opposition to the movement of interest rates and that a rising interest rate environment increases the risk of loss of principal.
Debt securities will generally lose value if interest rates increase and vice versa. Interest rate risk is generally higher for investments with longer maturities or durations. Debt securities are subject to the risk that an issuer will fail to make timely payments of interest or principal or go bankrupt, reducing the Fund’s return. The lower the rating of a debt security, the higher its credit risk.
MANAGEMENT DISCUSSIONOF FUND PERFORMANCE
How did the Fund perform against its benchmark for the fiscal year ended March 31, 2013?
For the fiscal year ended March 31, 2013, the Fund’s I Shares had a total return of 4.87% versus an average return of 4.28% for the Lipper Intermediate Municipal Debt Objective and 4.19% total return for the Barclays Capital U.S. 1-15 Year Municipal Bond Index (the “Index”). The long end of the municipal yield curve, defined as 22-year and longer maturities, provided the greatest total return during the period, with total returns generally increasing out of the curve (according to Barclays Capital). Relative to the Index the Fund maintained a higher allocation to the cash equivalent, 6-8 years, 8-12 years, 17-22 years, and long (22+ years) maturity buckets as of March 31, 2013. Additionally, relative to the Index, the Fund maintains an overweight to AAA rated securities while underweight the lower rated investment grade paper. 5, 10, and 30-year generic AAA rated municipal bond yields declined 0.14%, 0.20% and 0.30%, respectively, over the fiscal year (according to Municipal Market Data Line).
What factors influenced the Fund’s performance for the fiscal year ended March 31, 2013?
Yield curve positioning contributed to the Fund’s outperformance for the period versus the Index. The long bond sector outperformed the 5-year sector by 4.28% for the fiscal year ended March 31, 2013 (according to Barclays Capital). Overweights of the hospital, education, special tax, and water/sewer sectors also contributed to the Fund’s outperformance. The Fund’s high quality bias was a drag on performance versus both the Index and the peer group. Barclays BBB-rated Index returned 6.50% for the fiscal year ended March 31, 2013, versus the AAA Index return of 3.78% for the same period.
How do you plan to position the Fund, based on market conditions?
With municipal supply likely to remain manageable again this year, further investor flight-to-quality would likely increase the attractiveness of municipal bonds. Municipals as an asset class are relatively secure while offering among the highest after-tax returns over the past decade for top income earners. We continue to carefully watch the political environment in Washington, an impactful factor for all asset classes. The Fund’s present duration posture, yield curve positioning, and sector allocations seem appropriate given our forecasts for the economy and financial markets. We will continue to make tactical adjustments to the Fund, periodically, as a part of an active portfolio management process. All activity will occur within an investment grade construct and the average credit quality of the Fund’s holdings should remain high relative to its peers.
15
INVESTMENT GRADE TAX-EXEMPT BOND FUND
Growth of a $10,000 Investment (as of March 31, 2013)
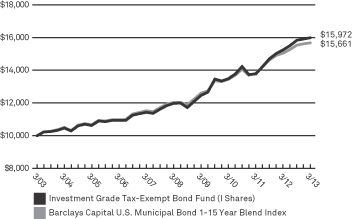 | This chart assumes an initial hypothetical investment of $10,000 made on 3/31/03. Total return is based on net change in the Net Asset Value (“NAV”) assuming reinvestment of distributions. Returns shown on this page include reinvestment of all dividends and other distributions.
The Barclays Capital U.S. Municipal Bond 1-15 Year Blend Index is composed of tax-exempt bonds with maturities ranging between 1 and 15 years. The Index is unmanaged and does not reflect the deduction of fees, such as investment management and fund accounting fees associated with a mutual fund. Investors cannot invest directly in an index. |
| Average Annual Total Returns as of 3/31/13 | ||||||||||||||||||||
| Investment Grade Tax-Exempt Bond Fund | 1 Year | 3 Year | 5 Year | 10 Year | ||||||||||||||||
A Shares | without sales charge | 4.75% | 5.61% | 5.69% | 4.47% | |||||||||||||||
| with sales charge* | –0.20% | 3.91% | 4.66% | 3.96% | ||||||||||||||||
I Shares | 4.87% | 5.85% | 5.96% | 4.79% | ||||||||||||||||
| Barclays Capital U.S. Municipal Bond 1-15 Year Blend Index | 4.19% | 5.26% | 5.43% | 4.59% | ||||||||||||||||
| Prospectus Expense Ratio1 | Gross | |||||||||||||||||||
| A Shares | 0.91% | |||||||||||||||||||
| I Shares | 0.66% | |||||||||||||||||||
Past performance does not guarantee future results. The performance data quoted represents past performance and current returns may be lower or higher. Total return figures include change in share price, reinvestment of dividends and capital gains and do not reflect taxes that a shareholder would pay on fund distributions or on the redemption of fund shares. The investment return and principal value will fluctuate so that an investor’s shares, when redeemed, may be worth more or less than the original cost. For performance data current to the most recent month end, visit our website at www.ridgeworth.com.
| * | Class A Share performance reflects the maximum front-end sales charge of 4.75%. |
| 1 | This information is included in the most current prospectus available to current and prospective shareholders of the Fund. Additional information pertaining to the 3/31/13 expense ratios can be found in the financial highlights. |
Investment Weightings (as of March 31, 2013)
as a percentage of investments
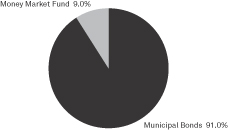
16
Portfolio Managers
| Ÿ | James F. Keegan |
| Ÿ | Adrien Webb, CFA |
| Ÿ | Perry Troisi |
| Ÿ | Michael Rieger |
| Ÿ | Seth Antiles, Ph.D |
INVESTMENT CONCERNS
Mutual fund investing involves risk, including possible loss of principal. Bond funds will tend to experience smaller fluctuations in value than stock funds. However, investors in any bond fund should anticipate fluctuations in price, especially for longer-term issues and in environments of rising interest rates.
Mortgage-backed investments involve risk of loss due to prepayments and, like any bond, due to default. Because of the sensitivity of mortgage-related securities to changes in interest rates, the Fund’s performance may be more volatile than if it did not hold these securities.
Debt securities will generally lose value if interest rates increase and vice versa. Interest rate risk is generally higher for investments with longer maturities or durations. Debt securities are subject to the risk that an issuer will fail to make timely payments of interest or principal or go bankrupt, reducing the Fund’s return. The lower the rating of a debt security, the higher its credit risk.
MANAGEMENT DISCUSSIONOF FUND PERFORMANCE
How did the Fund perform against its benchmark for the fiscal year ended March 31, 2013?
For the fiscal year ended March 31, 2013, the Limited Duration Fund returned 1.08% (I Shares) versus 0.08% for the Bank of America Merrill Lynch 3-Month U.S. Treasury Bill Index.
What factors influenced the Fund’s performance for the fiscal year ended March 31, 2013?
Income was the performance driver as the Fund was invested in various short average life securitized assets that offer income at a reasonable price.
How do you plan to position the Fund, based on market conditions?
Current valuations are hyper inflated over the intermediate and long term. Juxtaposing these valuations against the fragile and challenged macroeconomic environment that persists, we find reason for caution. In our view, central bank aggression has fostered an overabundance of complacency globally.
Floating rate agency collateralized mortgage obligations (CMOs) make up the majority of the Fund’s allocation, in addition to several high quality asset-backed security floaters that make up the balance of the holdings. The conservative nature of the Fund is consistent with our “income at a reasonable price” theme we have relied on for most of this economic crisis.
17
LIMITED DURATION FUND
Growth of a $10,000 Investment (as of March 31, 2013)
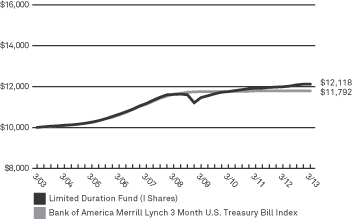 | This chart assumes an initial hypothetical investment of $10,000 made on 3/31/03. Total return is based on net change in the Net Asset Value (“NAV”) assuming reinvestment of distributions. Returns shown on this page include reinvestment of all dividends and other distributions.
The Fund’s performance is compared to the Bank of America Merrill Lynch 3 Month U.S. Treasury Bill Index, which tracks the monthly price-only and total return performance of a three-month Treasury bill, based on monthly average auction rates. The Index is unmanaged and does not reflect the deduction of fees, such as investment management and fund accounting fees associated with a mutual fund. Investors cannot invest directly in an index. |
| Average Annual Total Returns as of 3/31/13 | ||||||||||||||||||||
| Limited Duration Fund | Inception Date† | 1 Year | 3 Year | 5 Year | 10 Year | |||||||||||||||
I Shares | 10/25/02 | 1.08% | 1.01% | 0.86% | 1.94% | |||||||||||||||
| Bank of America Merrill Lynch 3 Month U.S. Treasury Bill Index | 0.08% | 0.09% | 0.29% | 1.66% | ||||||||||||||||
| Prospectus Expense Ratio1 | Gross | |||||||||||||||||||
| I Shares | 0.28% | |||||||||||||||||||
Past performance does not guarantee future results. The performance data quoted represents past performance and current returns may be lower or higher. Total return figures include change in share price, reinvestment of dividends and capital gains and do not reflect taxes that a shareholder would pay on fund distributions or on the redemption of fund shares. The investment return and principal value will fluctuate so that an investor’s shares, when redeemed, may be worth more or less than the original cost. For performance data current to the most recent month end, visit our website at www.ridgeworth.com.
| † | I Shares were offered beginning on 10/11/04. The performance shown prior to such date is based on the performance of the Seix Limited Duration Fund, an open-end investment company that was the predecessor fund to the Limited Duration Fund |
| 1 | This information is included in the most current prospectus available to current and prospective shareholders of the Fund. Additional information pertaining to the 3/31/13 expense ratios can be found in the financial highlights. |
Investment Weightings (as of March 31, 2013)
as a percentage of investments
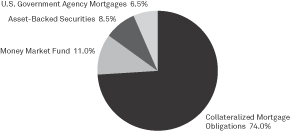
18
LIMITED-TERM FEDERAL MORTGAGE SECURITIES FUND
Portfolio Managers
| Ÿ | James F. Keegan |
| Ÿ | Perry Troisi |
| Ÿ | Adrien Webb, CFA |
| Ÿ | Michael Rieger |
| Ÿ | Seth Antiles, Ph.D |
INVESTMENT CONCERNS
Mutual fund investing involves risk, including possible loss of principal. Bonds offer a relatively stable level of income, although bond prices will fluctuate providing the potential for principal gain or loss. Intermediate-term, higher-quality bonds generally offer less risk than longer-term bonds and a lower rate of return.
U.S. Government guarantees apply only to the underlying securities of the Fund’s portfolio and not the Fund’s shares.
The Fund is subject to the risk that principal value reacts in opposition to the movement of interest rates and that a rising interest rate environment increases the risk of loss of principal.
Mortgage-backed investments involve risk of loss due to prepayments and, like any bond, due to default. Because of the sensitivity of mortgage-related securities to changes in interest rates, the Fund’s performance may be more volatile than if it did not hold these securities.
Debt securities will generally lose value if interest rates increase and vice versa. Interest rate risk is generally higher for investments with longer maturities or durations. Debt securities are subject to the risk that an issuer will fail to make timely payments of interest or principal or go bankrupt, reducing the Fund’s return. The lower the rating of a debt security, the higher its credit risk.
MANAGEMENT DISCUSSION OF FUND PERFORMANCE
How did the Fund perform against its benchmark for the fiscal year ended March 31, 2013?
For the fiscal year ended March 31, 2013, the Limited-Term Federal Mortgage Securities Fund returned 2.26% (I Shares) versus 1.97% for the Barclays Capital U.S. Mortgage Backed Securities Index. For a 3-year period, performance of the Fund has exceeded the index at 4.65% versus 4.17%.
What factors influenced the Fund’s performance for the fiscal year ended March 31, 2013?
Over the last year, performance was driven by the Fund’s usage of structure in lieu of 30-year current coupon pass-through exposure. Additionally, a significant overweight in 15-year collateral as well as a consistent allocation to commercial mortgage-backed securities (CMBS) also added to performance. This diversification and off-index allocation provided a significant convexity advantage while remaining underweight the most negatively convex portion of the index.
How do you plan to position the Fund, based on market conditions?
Current valuations are hyper inflated over the intermediate and long term. Juxtaposing these valuations against the fragile and challenged macroeconomic environment that persists, we find comfort in remaining defensive and less negatively convex relative to the benchmark. In our view, an overabundance of complacency exists globally.
We remain overweight 15-year collateral, structure (collateralized mortgage obligations [CMOs]) and commercial mortgage-backed securities (CMBS) exposure. We still prefer this more convex, or defensive posture, until a more symmetric risk reward profile exerts itself. The Federal Reserve remains the 800-pound gorilla in the mortgage market, but we find more value outside their current operational focus (30-year current coupon collateral).
19
LIMITED-TERM FEDERAL MORTGAGE SECURITIES FUND
Growth of a $10,000 Investment (as of March 31, 2013)
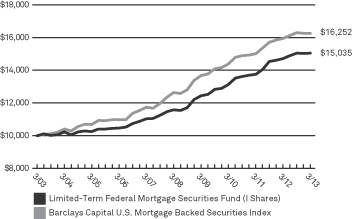 | This chart assumes an initial hypothetical investment of $10,000 made on 3/31/03. Total return is based on net change in the Net Asset Value (“NAV”) assuming reinvestment of distributions. Returns shown on this page include reinvestment of all dividends and other distributions.
The Fund’s performance is compared to the Barclays Capital U.S. Mortgage Backed Securities Index, which covers agency pass-through securities (both fixed-rate and hybrid ARM) issued by Ginnie Mae (GNMA), Fannie Mae (FNMA), and Freddie Mac (FHLMC). The Index is unmanaged and does not reflect the deduction of fees, such as investment management and fund accounting fees associated with a mutual fund. Investors cannot invest directly in an index. |
| Average Annual Total Returns as of 3/31/13 | ||||||||||||||||||
| Limited-Term Federal Mortgage Securities Fund | 1 Year | 3 Year | 5 Year | 10 Year | ||||||||||||||
A Shares | without sales charge | 2.06% | 4.45% | 5.16% | 3.94% | |||||||||||||
| with sales charge* | –0.46% | 3.55% | 4.64% | 3.68% | ||||||||||||||
C Shares | without CDSC | 1.25% | 3.61% | 4.32% | 3.21% | |||||||||||||
| with CDSC* | 0.25% | 3.61% | 4.32% | 3.21% | ||||||||||||||
I Shares | 2.26% | 4.65% | 5.36% | 4.16% | ||||||||||||||
| Barclays Capital U.S. Mortgage Backed Securities Index | 1.97% | 4.17% | 5.15% | 4.98% | ||||||||||||||
| Prospectus Expense Ratio1 | Gross | |||||||||||||||||
| A Shares | 0.94% | |||||||||||||||||
| C Shares | 1.72% | |||||||||||||||||
| I Shares | 0.74% | |||||||||||||||||
Past performance does not guarantee future results. The performance data quoted represents past performance and current returns may be lower or higher. Total return figures include change in share price, reinvestment of dividends and capital gains and do not reflect taxes that a shareholder would pay on fund distributions or on the redemption of fund shares. The investment return and principal value will fluctuate so that an investor’s shares, when redeemed, may be worth more or less than the original cost. For performance data current to the most recent month end, visit our website at www.ridgeworth.com.
| * | Class A Share performance reflects the maximum front-end sales charge of 2.50% and Class C Shares reflect the maximum CDSC (contingent deferred sales charge) of 1.00% in year one only. |
| 1 | This information is included in the most current prospectus available to current and prospective shareholders of the Fund. Additional information pertaining to the 3/31/13 expense ratios can be found in the financial highlights. |
Investment Weightings (as of March 31, 2013)
as a percentage of investments
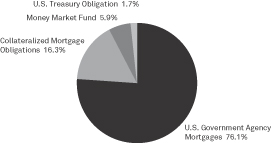
20
NORTH CAROLINA TAX-EXEMPT BOND FUND
Portfolio Manager
| Ÿ | Chris Carter, CFA |
INVESTMENT CONCERNS
Mutual fund investing involves risk, including possible loss of principal. Bonds offer a relatively stable level of income, although bond prices will fluctuate providing the potential for principal gain or loss. Intermediate-term, higher-quality bonds generally offer less risk than longer-term bonds and a lower rate of return.
The geographical concentration of portfolio holdings in this Fund may involve increased risk.
The Fund’s income may be subject to certain state and local taxes and, depending on your tax status, the federal alternative minimum tax.
The Fund is subject to the risk that principal value reacts in opposition to the movement of interest rates and that a rising interest rate environment increases the risk of loss of principal.
Debt securities will generally lose value if interest rates increase and vice versa. Interest rate risk is generally higher for investments with longer maturities or durations. Debt securities are subject to the risk that an issuer will fail to make timely payments of interest or principal or go bankrupt, reducing the Fund’s return. The lower the rating of a debt security, the higher its credit risk.
MANAGEMENT DISCUSSIONOF FUND PERFORMANCE
How did the Fund perform against its benchmark for the fiscal year ended March 31, 2013?
For the fiscal year ended March 31, 2013, the Fund’s I Shares had a total return of 4.88% versus an average return of 5.09% for the Lipper North Carolina Municipal Debt Objective and a 5.25% total return for the Barclays Capital U.S. Municipal Bond Index (the “Index”). The long end of the municipal yield curve, defined as 22-year and longer maturities, provided the greatest total return during the period, with total returns generally increasing out of the curve (according to Barclays Capital). Relative to the Index the Fund maintained a higher allocation to the cash equivalent, 1-year, 7-year, and 20-year sectors, and a lower allocation to all other maturity sectors, as of March 31, 2013. Additionally, relative to the Index the Fund maintains a higher allocation to securities rated AAA and BAA, and a lower allocation to securities in the AA and A rating categories. Trading activity and portfolio events during the period resulted in exposure to the 1-year, 7-year, and 15-year sectors being increased, and exposure to the 3-year, 20-year, and long bond sectors being reduced. The 5, 10, and 30-year generic AAA rated municipal bond yields declined 0.14%, 0.20% and 0.30%, respectively, over the fiscal year (according to Municipal Market Data Line).
What factors influenced the Fund’s performance for the fiscal year ended March 31, 2013?
The Fund’s more conservative approach was punitive during the period and led to modest underperformance. Over the past fiscal year, the Fund reduced exposure to bonds with final maturities of 17 years and longer. The Fund still maintains an overweight of the 20-year sector. The long bond sector outperformed the 5-year sector by 4.22% for the fiscal year ended March 31, 2013 (according to Barclays Capital). Many peers had a greater level of exposure to longer maturities. In addition, the Fund holds fewer BAA-rated bonds than many of its peers. BAA-rated securities outperformed AAA-rated securities by 2.83% during the period (according to Barclays Capital).
How do you plan to position the Fund, based on market conditions?
With municipal supply likely to remain manageable again this year, further investor flight-to-quality would likely increase the attractiveness of municipal bonds. Municipals as an asset class are relatively secure while offering among the highest after-tax returns over the past decade for top income earners. We continue to carefully watch the political environment in Washington, an impactful factor for all asset classes. The Fund’s present duration posture, yield curve positioning, and sector allocations seem appropriate given our forecasts for the economy and financial markets. We will continue to make tactical adjustments to the Fund, periodically, as a part of an active portfolio management process. All activity will occur within an investment grade construct and the average credit quality of the Fund’s holdings should remain high relative to its peers.
21
NORTH CAROLINA TAX-EXEMPT BOND FUND
Growth of $10,000 Investment (as of March 31, 2013)
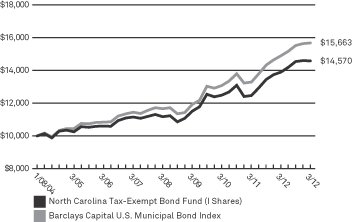 | This chart assumes an initial hypothetical investment of $10,000 made on 1/8/04 (inception date). Total return is based on net change in the Net Asset Value (“NAV”) assuming reinvestment of distributions. Returns shown on this page include reinvestment of all dividends and other distributions.
The Fund’s performance is compared to the Barclays Capital U.S. Municipal Bond Index, which covers the U.S. dollar-denominated long-term tax-exempt bond market. The Index has four main sectors: state and local general obligation bonds, revenue bonds, insured bonds, and prerefunded bonds. The Index is unmanaged and does not reflect the deduction of fees, such as investment management and fund accounting fees associated with a mutual fund. Investors cannot invest directly in an index. |
| Average Annual Total Returns as of 3/31/13 | ||||||||||||||||||||
| North Carolina Tax-Exempt Bond Fund | Inception Date† | 1 Year | 3 Year | 5 Year | Since Inception | |||||||||||||||
A Shares | without sales charge | 01/08/04 | 4.63% | 5.16% | 5.31% | 4.08% | ||||||||||||||
| with sales charge* | –0.33% | 3.47% | 4.29% | 3.53% | ||||||||||||||||
I Shares | 01/08/04 | 4.88% | 5.31% | 5.45% | 4.16% | |||||||||||||||
| Barclays Capital U.S. Municipal Bond Index | 5.25% | 6.23% | 6.10% | 4.97% | 1 | |||||||||||||||
| Prospectus Expense Ratio2 | Gross | |||||||||||||||||||
| A Shares | 0.77% | |||||||||||||||||||
| I Shares | 0.62% | |||||||||||||||||||
Past performance does not guarantee future results. The performance data quoted represents past performance and current returns may be lower or higher. Total return figures include change in share price, reinvestment of dividends and capital gains and do not reflect taxes that a shareholder would pay on fund distributions or on the redemption of fund shares. The investment return and principal value will fluctuate so that an investor’s shares, when redeemed, may be worth more or less than the original cost. For performance data current to the most recent month end, visit our website at www.ridgeworth.com.
| * | Class A Share performance reflects the maximum front-end sales charge of 4.75% . |
| † | I Shares and A Shares were offered beginning on 3/21/05. The performance shown prior to such date for I Shares and A Shares is based on the performance of the CCMI Tax-Exempt North Carolina Bond Fund, the predecessor fund. Historical performance has not been adjusted to reflect A Share expenses. If it had been, the performance would have been lower. |
| 1 | The performance return and the hypothetical $10,000 investment for the Barclays Capital U.S. Municipal Bond Index is for the period from 12/31/03 to 3/31/13. |
| 2 | This information is included in the most current prospectus available to current and prospective shareholders of the Fund. Additional information pertaining to the 3/31/13 expense ratios can be found in the financial highlights |
Investment Weightings (as of March 31, 2013)
as a percentage of investments
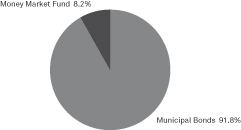
22
SEIX FLOATING RATE HIGH INCOME FUND
Portfolio Managers
| Ÿ | George Goudelias |
INVESTMENT CONCERNS
Mutual fund investing involves risk, including possible loss of principal. Bond funds will tend to experience smaller fluctuations in value than stock funds. However, investors in any bond fund should anticipate fluctuations in price, especially for longer-term issues and in environments of rising interest rates.
Although the Fund’s yield may be higher than that of fixed income funds that purchase higher-rated securities, the potentially higher yield is a function of the greater risk that the Fund’s share price will decline.
Floating rate loans are typically senior and secured, in contrast to other below-investment grade securities. However, there is no guarantee that the value of the collateral will not decline, causing a loan to be substantially unsecured. Loans generally are subject to restrictions on resale, and they sometimes trade infrequently in the secondary market. Certain types of loans may limit the ability of the Fund to enforce its rights and may involve assuming additional credit risks.
Debt securities will generally lose value if interest rates increase and vice versa. Interest rate risk is generally higher for investments with longer maturities or durations. Debt securities are subject to the risk that an issuer will fail to make timely payments of interest or principal or go bankrupt, reducing the Fund’s return. The lower the rating of a debt security, the higher its credit risk.
MANAGEMENT DISCUSSIONOF FUND PERFORMANCE
How did the Fund perform against its benchmark for the fiscal year ended March 31, 2013?
The 7.67% net return of the Seix Floating Rate High Income Fund (I Shares) for the fiscal year ended March 31, 2013 was 0.11% ahead of the 7.56% return of the Credit Suisse First Boston (“CSFB”) Institutional Leveraged Loan Index.
What factors influenced the Fund’s performance for the fiscal year ended March 31, 2013?
The Fund’s outperformance can be attributed to beneficial security selection in a number of industries, including Telecommunications, Media, Utilities, Health Care and Finance. Partially offsetting the positive factors was unfavorable security selection in Energy and the modest cash holding in a rising market.
How do you plan to position the Fund, based on market conditions?
We focus on higher quality, BB-rated instruments as well as the few remaining short maturity, discount loans that we expect will be called by the end of the 2013 and 2014. Bond exposure has been reduced as relative value currently favors loans. The Fund remains underweighted in non-US issuers, especially European companies, because we believe that European Central Bank countries will continue to struggle to generate growth and employment. We are concentrating on non-cyclical, defensive issuers with strong balance sheets to add protection against the negative impact of a possible economic slowdown.
23
SEIX FLOATING RATE HIGH INCOME FUND
Growth of a $10,000 Investment (as of March 31, 2013)
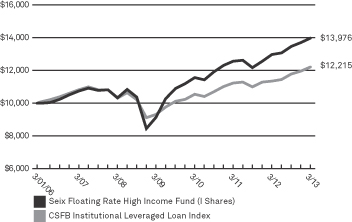 | This chart assumes an initial hypothetical investment of $10,000 made on 3/1/06 (inception date). Total return is based on net change in the Net Asset Value (“NAV”) assuming reinvestment of distributions. Returns shown on this page include reinvestment of all dividends and other distributions.
The CSFB Institutional Leveraged Loan Index is a market value-weighted index designed to represent the investable universe of the U.S. Dollar-denominated leveraged loan market. The Index reflects reinvestment of all distributions and changes to market prices. CSFB Institutional Leveraged Loan Index is a sub index of the CSFB Leveraged Loan Index which contains only institutional loan facilities priced above 90, excluding Term Loan and Term Loan-A facilities and loans rated CC, C or in default. It is designed to more closely reflect the investment criteria of institutional investments. These indices are unmanaged and do not reflect the deduction of fees, such as investment management and fund accounting fees associated with a mutual fund. Investors cannot invest directly in an index. |
| Average Annual Total Returns as of 3/31/13 | ||||||||||||||||||||
| Seix Floating Rate High Income Fund | Inception Date† | 1 Year | 3 Year | 5 Year | Since Inception | |||||||||||||||
A Shares | without sales charge | 03/01/06 | 7.39% | 6.22% | 5.91% | 4.54% | ||||||||||||||
| with sales charge* | 4.67% | 5.31% | 5.38% | 4.16% | ||||||||||||||||
C Shares | without CDSC | 03/01/06 | 6.69% | 5.48% | 5.21% | 4.04% | ||||||||||||||
| with CDSC* | 5.69% | 5.48% | 5.21% | 4.04% | ||||||||||||||||
I Shares | 03/01/06 | 7.67% | 6.51% | 6.22% | 4.84% | |||||||||||||||
| CSFB Institutional Leveraged Loan Index | 7.56% | 5.87% | 3.98% | 3.22% | ** | |||||||||||||||
| Prospectus Expense Ratio1 | Gross | |||||||||||||||||||
| A Shares | 0.87% | |||||||||||||||||||
| C Shares | 1.52% | |||||||||||||||||||
| I Shares | 0.65% | |||||||||||||||||||
Past performance does not guarantee future results. The performance data quoted represents past performance and current returns may be lower or higher. Total return figures include change in share price, reinvestment of dividends and capital gains and do not reflect taxes that a shareholder would pay on fund distributions or on the redemption of fund shares. The investment return and principal value will fluctuate so that an investor’s shares, when redeemed, may be worth more or less than the original cost. For performance data current to the most recent month end, visit our website at www.ridgeworth.com.
| * | Class A Share performance reflects the maximum front-end sales charge of 2.50% and Class C Shares reflect the maximum CDSC (contingent deferred sales charge) of 1.00% in year one only. |
| † | The A Shares and C Shares were offered beginning on 5/8/06 and 8/2/07, respectively. The performance shown prior to such dates is based on the performance of the I Shares of the Fund, and has not been adjusted to reflect A Share or C Share expenses. If it had been, the performance would have been lower. |
| ** | The performance return and the hypothetical $10,000 investment for the CSFB Institutional Leveraged Loan Index is for the period from 2/28/06 to 3/31/13. |
| 1 | This information is included in the most current prospectus available to current and prospective shareholders of the Fund. Additional information pertaining to the 3/31/13 expense ratios can be found in the financial highlights. |
Investment Weightings (as of March 31, 2013)
as a percentage of investments
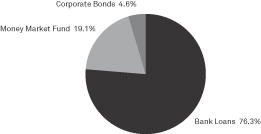
24
Portfolio Managers
| Ÿ | Michael Kirkpatrick |
| Ÿ | Brian Nold, M.D. |
INVESTMENT CONCERNS
Mutual fund investing involves risk, including possible loss of principal. Bond funds will tend to experience smaller fluctuations in value than stock funds. However, investors in any bond fund should anticipate fluctuations in price, especially for longer-term issues and in environments of rising interest rates.
Although the Fund’s yield may be higher than that of fixed income funds that purchase higher-rated securities, the potentially higher yield is a function of the greater risk that the Fund’s share price will decline.
Debt securities will generally lose value if interest rates increase and vice versa. Interest rate risk is generally higher for investments with longer maturities or durations. Debt securities are subject to the risk that an issuer will fail to make timely payments of interest or principal or go bankrupt, reducing the Fund’s return. The lower the rating of a debt security, the higher its credit risk.
MANAGEMENT DISCUSSION OF FUND PERFORMANCE
How did the Fund perform against its benchmark for the fiscal year ended March 31, 2013?
The 12.80% net return of the Seix High Yield Fund (I Shares) for the fiscal year ended March 31, 2013 was 0.48% ahead of the 12.32% return of the Bank of America Merrill Lynch BB-B U.S. High Yield Constrained Index.
What factors influenced the Fund’s performance for the fiscal year ended March 31, 2013?
The Fund’s outperformance can be attributed to beneficial security selection in a number of industries, including Finance, Energy, Healthcare, Retail and Mining as well as an overweighting in Telecommunications and an underweighting in Food. Partially offsetting the positive factors were unfavorable security selection in Technology and the modest cash position in a rising market.
How do you plan to position the Fund, based on market conditions?
Given the double digit returns for the year ended March 31, 2013 we have generally worked to reduce both interest rate and default risk. The Fund is overweighed in B-rated bonds that are less sensitive to changes in interest rates compared to BB-rated bonds and less exposed to a possible recession linked spike in defaults compared to CCC-rated bond. We are maintaining the fund’s underweighting in cyclical sectors and non-US issuers, especially European banks. The Fund is overweighted in specialty finance companies and industries with solid asset coverage, including Cable and Utilities. Cash is being made available from calls as well as strategic sales when positions reach their target returns. Proceeds are being reinvested primarily in opportunities provided through the new issue market.
25
SEIX HIGH YIELD FUND
Growth of a $10,000 Investment (as of March 31, 2013)
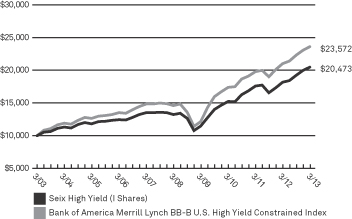 | This chart assumes an initial hypothetical investment of $10,000 made on 3/31/03. Total return is based on net change in the Net Asset Value (“NAV”) assuming reinvestment of distributions. Returns shown on this page include reinvestment of all dividends and other distributions.
The Fund’s performance is compared to the Bank of America Merrill Lynch BB-B U.S. High Yield Constrained Index, which tracks the performance of BB1 through B3 U.S. Dollar-denominated corporate bonds publicly issued in the U.S. domestic market and is restricted to a maximum of 2% per issuer. This Index is unmanaged and does not reflect the deduction of fees, such as investment management and fund accounting fees associated with a mutual fund. Investors cannot invest directly in an index. |
| Average Annual Total Returns as of 3/31/13 | ||||||||||||||||||||
| Seix High Yield Fund | Inception Date† | 1 Year1 | 3 Year | 5 Year | 10 Year | |||||||||||||||
A Shares | without sales charge | 12/29/00 | 12.56% | 10.13% | 9.03% | 7.26% | ||||||||||||||
| with sales charge* | 7.23% | 8.36% | 7.97% | 6.74% | ||||||||||||||||
R Shares^ | 12/29/00 | 12.36% | 9.76% | 8.45% | 6.72% | |||||||||||||||
I Shares | 12/29/00 | 12.80% | 10.37% | 9.19% | 7.43% | |||||||||||||||
| Bank of America Merrill Lynch BB-B U.S. High Yield Constrained Index | 12.32% | 10.67% | 10.09% | 8.95% | ||||||||||||||||
| Prospectus Expense Ratio1 | Gross | |||||||||||||||||||
| A Shares | 0.79% | |||||||||||||||||||
| R Shares | 1.19% | |||||||||||||||||||
| I Shares | 0.57% | |||||||||||||||||||
Past performance does not guarantee future results. The performance data quoted represents past performance and current returns may be lower or higher. Total return figures include change in share price, reinvestment of dividends and capital gains and do not reflect taxes that a shareholder would pay on fund distributions or on the redemption of fund shares. The investment return and principal value will fluctuate so that an investor’s shares, when redeemed, may be worth more or less than the original cost. For performance data current to the most recent month end, visit our website at www.ridgeworth.com.
| * | Class A Share performance reflects the maximum front-end sales charge of 4.75%. |
| † | The I Shares, A Shares and R Shares were offered beginning on 10/11/04. The performance shown prior to such date is based on the performance of the Class I Shares of the Seix High Yield Fund, an open-end investment company that was the predecessor fund to the Seix High Yield Fund. The historical performance has not been adjusted to reflect A Share or R Share expenses. If it had been, the performance would have been lower. |
| ^ | Effective at the close of business on 7/31/09, C Shares converted to R Shares and C Shares are no longer available for purchase. The performance shown prior to such date is based on the performance of the C Shares of the Fund and has not been adjusted to reflect R Share expenses. |
| 1 | This information is included in the most current prospectus available to current and prospective shareholders of the Fund. Additional information pertaining to the 3/31/13 expense ratios can be found in the financial highlights. |
Investment Weightings (as of March 31, 2013)
as a percentage of investments
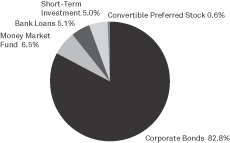
26
Portfolio Managers
| Ÿ | H. Rick Nelson |
| Ÿ | Chad K. Stephens |
INVESTMENT CONCERNS
Mutual fund investing involves risk, including possible loss of principal. Bonds offer a relatively stable level of income, although bond prices will fluctuate providing the potential for principal gain or loss. Intermediate-term, higher-quality bonds generally offer less risk than longer-term bonds and a lower rate of return.
The Fund is subject to the risk that principal value reacts in opposition to the movement of interest rates and that a rising interest rate environment increases the risk of loss of principal.
Mortgage-backed investments involve risk of loss due to prepayments and, like any bond, due to default. Because of the sensitivity of mortgage-related securities to changes in interest rates, the Fund’s performance may be more volatile than if it did not hold these securities.
Debt securities will generally lose value if interest rates increase and vice versa. Interest rate risk is generally higher for investments with longer maturities or durations. Debt securities are subject to the risk that an issuer will fail to make timely payments of interest or principal or go bankrupt, reducing the Fund’s return. The lower the rating of a debt security, the higher its credit risk.
MANAGEMENT DISCUSSION OF FUND PERFORMANCE
How did the Fund perform against its benchmark for the fiscal year ended March 31, 2013?
The Fund outperformed its benchmark index, the Barclays Capital 1-3 Year Government/Credit Index. The Fund (I Shares) generated a return of 1.65% for the fiscal year ended March 31, 2013 while the benchmark index return was 1.10% over the same period.
What factors influenced the Fund’s performance for the fiscal year ended March 31, 2013?
Total return of the Fund was driven both by income and price appreciation. Interest rates declined slightly over the past fiscal year with the two year Treasury yields declining 0.09% from 0.33% to 0.24% as March 31, 2013.
Holdings of U.S. Treasury and U.S. Government Agency debentures remained low for the fiscal year ended March 31, 2013 while spread products (all fixed income securities that trade at a spread over a comparable U.S. Treasury Security) consisting of investment grade corporate credit and securitized assets contributed to the Fund’s performance.
Corporate credit spreads widened during the second quarter of 2012 before tightening over the next three quarters ending March 31, 2013. The financial sector was the most volatile stemming from continued fears of the European sovereign debt crisis, as well as an unclear regulatory environment as Dodd Frank rules are still being written. Yet when the results of the Federal Reserve’s (Fed) second annual stress tests were released, the majority of the largest commercial banks were shown to have historically strong capital ratios, improving asset quality and healthy levels of liquidity. Credit spreads on financials tightened during the last three quarters. The Fund held no European based financial credits since 2011.
For one year period ended March 31, 2013, in securitized assets, U.S. Government Agency residential mortgage-backed securities performed well, benefiting primarily from the Fed’s quantitative easing 3 program and low interest rate volatility. Agency commercial mortgage-backed securities also had a great year due to better market liquidity and increasing market demand for high quality, more predictable cash flow products. Non-agency residential mortgage-backed securities outperformed all other types of non-agency securitized assets in the period ended March 31, 2013, driven by limited supply and investors search for higher yielding securities. Spreads on commercial mortgage-backed securities continued to tighten during the period. Spread tightening was driven partially by market demand for yield and partially driven by improving market fundamentals. Mezzanine tranches outperformed senior tranches given less call risk from refinancing or liquidation. High quality asset backed securities (auto and credit card backed securities) were stable performers. The spread remained tight range bound for most of the last fiscal year.
How do you plan to position the Fund, based on market conditions?
We look to keep a short to neutral duration stance as risks remain higher for longer duration assets in a rising rate environment. We also feel that a neutral, laddered position is warranted given that shifts and twists in the curve may be short-lived and range-bound over the coming months.
We look to maintain limited exposure to U.S. Treasuries. As historically low rates linger, investors are only offered asymmetrical return potential; limited upside along with little coupon to insulate against the potential of rising rates. We will continue with our bias towards lower beta corporate credits such as non-cyclical industrials and companies with transparent and consistent earnings potential. Within securitized assets, we continue to overweight Agency and non-Agency mortgage credits, which aided performance in the quarter. Securitized assets could face a headwind should interest rates begin to rise. We continue to seek lower premium, lower coupon and floating rate mortgage-backed securities credits to provide protection from rising rates and refinancing risk.
27
SHORT-TERM BOND FUND
Growth of a $10,000 Investment (as of March 31, 2013)
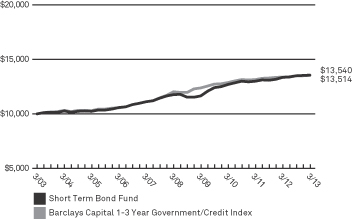 | This chart assumes an initial hypothetical investment of $10,000 made on 3/31/03. Total return is based on net change in the Net Asset Value (“NAV”) assuming reinvestment of distributions. Returns shown on this page include reinvestment of all dividends and other distributions.
The Fund’s performance is compared to the Barclays Capital 1-3 Year Government/Credit Index. The Barclays Capital 1-3 Year Government/Credit Index (‘‘Barclays Index’’) is the 1-3 year component of the U.S. Government/Credit Index. The Barclays Index includes securities in the Barclays Capital Government and Credit Indices. The Government Index includes treasuries (i.e., public obligations of the U.S. Treasury that have remaining maturities of more than one year) and agencies (i.e., publicly issued debt of U.S. Government agencies, quasi-federal corporations, and corporate or foreign debt guaranteed by the U.S. Government). The Barclays Index includes publicly issued U.S. corporate and foreign debentures and secured notes that meet specified maturity, liquidity, and quality requirements. The Index is unmanaged and does not reflect the deduction of fees, such as investment management and fund accounting fees associated with a mutual fund. Investors cannot invest directly in an index. |
| Average Annual Total Returns as of 3/31/13 | ||||||||||||||||||||
| Short-Term Bond Fund | 1 Year | 3 Year | 5 Year | 10 Year | ||||||||||||||||
A Shares | without sales charge | 1.40% | 1.97% | 2.68% | 2.85% | |||||||||||||||
| with sales charge* | –1.16% | 1.09% | 2.17% | 2.58% | ||||||||||||||||
C Shares | without CDSC | 0.65% | 1.16% | 1.88% | 2.15% | |||||||||||||||
| with CDSC* | –0.36% | 1.16% | 1.88% | 2.15% | ||||||||||||||||
I Shares | 1.65% | 2.18% | 2.90% | 3.08% | ||||||||||||||||
| Barclays Capital 1-3 Year Government/Credit Index | 1.10% | 1.65% | 2.37% | 3.06% | ||||||||||||||||
| Prospectus Expense Ratio1 | Gross | |||||||||||||||||||
| A Shares | 0.76% | |||||||||||||||||||
| C Shares | 1.48% | |||||||||||||||||||
| I Shares | 0.48% | |||||||||||||||||||
Past performance does not guarantee future results. The performance data quoted represents past performance and current returns may be lower or higher. Total return figures include change in share price, reinvestment of dividends and capital gains and do not reflect taxes that a shareholder would pay on fund distributions or on the redemption of fund shares. The investment return and principal value will fluctuate so that an investor’s shares, when redeemed, may be worth more or less than the original cost. For performance data current to the most recent month end, visit our website at www.ridgeworth.com.
| * | Class A Share performance reflects the maximum front-end sales charge of 2.50% and Class C Shares reflect the maximum CDSC (contingent deferred sales charge) of 1.00% in year one only. |
| 1 | This information is included in the most current prospectus available to current and prospective shareholders of the Fund. Additional information pertaining to the 3/31/13 expense ratios can be found in the financial highlights. |
Investment Weightings (as of March 31, 2013)
as a percentage of investments
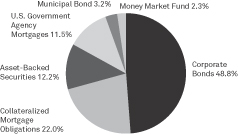
28
SHORT-TERM MUNICIPAL BOND FUND
Portfolio Manager
• Ronald Schwartz, CFA
• Dusty L. Self
INVESTMENT CONCERNS
Mutual fund investing involves risk, including possible loss of principal. Bonds offer a relatively stable level of income, although bond prices will fluctuate providing the potential for principal gain or loss. Intermediate-term, higher-quality bonds generally offer less risk than longer-term bonds and a lower rate of return.
The geographical concentration of portfolio holdings in this fund may involve increased risk.
The Fund’s income may be subject to certain state and local taxes and, depending on your tax status, the federal alternative minimum tax.
The Fund is subject to the risk that principal value reacts in opposition to the movement of interest rates and that a rising interest rate environment increases the risk of loss of principal.
Debt securities will generally lose value if interest rates increase and vice versa. Interest rate risk is generally higher for investments with longer maturities or durations. Debt securities are subject to the risk that an issuer will fail to make timely payments of interest or principal or go bankrupt, reducing the Fund’s return. The lower the rating of a debt security, the higher its credit risk.
MANAGEMENT DISCUSSION OF FUND PERFORMANCE
How did the Fund perform against its benchmark for the fiscal year ended March 31, 2013?
For the fiscal year ended March 31, 2013, the Fund’s I Shares had a total return of 3.01% versus an average return of 1.27% for the Lipper Short Municipal Debt Objective and 1.68% total return for the Barclays Capital 1-5 Year Municipal Bond Index (the “Index”). Relative to the Index the Fund maintained a higher allocation to the cash equivalent, 1-year, 6-8 years, and 8-12 years maturity buckets as of March 31, 2013. Additionally, relative to the Index the Fund maintains an overweight to AAA and A rated securities while underweight the lower rated investment grade paper. The 3, 5, and 10-year generic AAA rated municipal bond yields declined 0.07%, 0.14% and 0.20%, respectively, over the 12 months (according to Municipal Market Data Line).
What factors influenced the Fund’s performance for the fiscal year ended March 31, 2013?
Yield curve positioning contributed to the Fund’s outperformance for the period versus the Index. The 5 year bond sector outperformed the 1-year sector by 2.43% for the fiscal year ended March 31, 2013 (according to Barclays Capital). Overweights of the education, local general obligations, special tax, and transportation sectors also contributed to the Fund’s outperformance. The Fund’s high quality bias was a drag on performance versus both the Index and the peer group. Barclays BBB-rated Index returned 6.50% for the fiscal year ended March 31, 2013, versus AAA Index return of 3.78% for the same period.
How do you plan to position the Fund, based on market conditions?
With municipal supply likely to remain manageable again this year, further investor flight-to-quality would likely increase the attractiveness of municipal bonds. Municipals as an asset class are relatively secure while offering among the highest after-tax returns over the past decade for top income earners. We continue to carefully watch the political environment in Washington, an impactful factor for all asset classes. The Fund’s present duration posture, yield curve positioning, and sector allocations seem appropriate given our forecasts for the economy and financial markets. We will continue to make tactical adjustments to the Fund, periodically, as a part of an active portfolio management process. All activity will occur within an investment grade construct and the average credit quality of the Fund’s holdings should remain high relative to its peers.
29
SHORT-TERM MUNICIPAL BOND FUND
Growth of a $10,000 Investment (as of March 31, 2013)
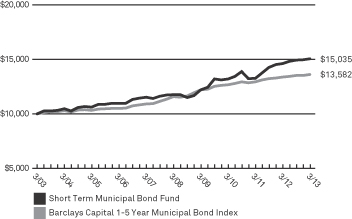 | This chart assumes an initial hypothetical investment of $10,000 made on 3/31/03. Total return is based on net change in the Net Asset Value (“NAV”) assuming reinvestment of distributions. Returns shown on this page include reinvestment of all dividends and other distributions.
The Fund’s performance is compared to the Barclays Capital 1-5 Year Municipal Bond Index, which covers investment grade tax-exempt municipal bonds with maturities of 1-6 years. The Index is unmanaged and does not reflect the deduction of fees, such as investment management and fund accounting fees associated with a mutual fund. Investors cannot invest directly in an index. |
| Average Annual Total Returns as of 3/31/13 | ||||||||||||||||||||
| Short-Term Municipal Bond Fund | 1 Year | 3 Year | 5 Year | 10 Year | ||||||||||||||||
A Shares* | without sales charge | 2.86% | 4.33% | 4.96% | 4.11% | |||||||||||||||
| with sales charge** | 0.24% | 3.45% | 4.43% | 3.85% | ||||||||||||||||
I Shares | 3.01% | 4.49% | 5.07% | 4.16% | ||||||||||||||||
| Barclays Capital 1-5 Year Municipal Bond Index | 1.68% | 2.42% | 3.28% | 3.11% | ||||||||||||||||
| Prospectus Expense Ratio1 | Gross | |||||||||||||||||||
| A Shares | 0.79% | |||||||||||||||||||
| I Shares | 0.60% | |||||||||||||||||||
Past performance does not guarantee future results. The performance data quoted represents past performance and current returns may be lower or higher. Total return figures include change in share price, reinvestment of dividends and capital gains and do not reflect taxes that a shareholder would pay on fund distributions or on the redemption of fund shares. The investment return and principal value will fluctuate so that an investor’s shares, when redeemed, may be worth more or less than the original cost. For performance data current to the most recent month end, visit our website at www.ridgeworth.com.
| * | Prior to August 1, 2009, there were no assets in Class A Shares. The performance shown prior to such date is based on the performance of the I Shares of the Fund and has not been adjusted to reflect A Shares expenses. If it had been, performance would have been lower. |
| ** | Class A Shares performance reflects the maximum front-end sales charge of 2.50%. |
| 1 | This information is included in the most current prospectus available to current and prospective shareholders of the Fund. Additional information pertaining to the 3/31/13 expense ratios can be found in the financial highlights. |
Investment Weightings (as of March 31, 2013)
as a percentage of investments
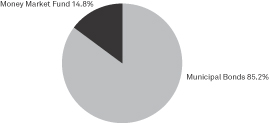
30
SHORT-TERM U.S. TREASURY SECURITIES FUND
Portfolio Managers
| Ÿ | H. Rick Nelson |
| Ÿ | Chad K. Stephens |
INVESTMENT CONCERNS
Mutual fund investing involves risk, including possible loss of principal. Bonds offer a relatively stable level of income, although bond prices will fluctuate providing the potential for principal gain or loss. Intermediate-term, higher-quality bonds generally offer less risk than longer-term bonds and a lower rate of return.
U.S. Government guarantees apply only to the underlying securities of the Fund’s portfolio and not the Fund’s shares.
The Fund is subject to the risk that principal value reacts in opposition to the movement of interest rates and that a rising interest rate environment increases the risk of loss of principal.
Debt securities will generally lose value if interest rates increase and vice versa. Interest rate risk is generally higher for investments with longer maturities or durations. Debt securities are subject to the risk that an issuer will fail to make timely payments of interest or principal or go bankrupt, reducing the Fund’s return. The lower the rating of a debt security, the higher its credit risk.
MANAGEMENT DISCUSSIONOF FUND PERFORMANCE
How did the Fund perform against its benchmark for the fiscal year ended March 31, 2013?
The Fund underperformed its benchmark index, the Barclays Capital 1-3 Year U.S. Treasury Bond Index. The Fund (I Shares) generated a return of 0.15% for the fiscal year ended March 31, 2013 while the benchmark index return was 0.64% over the same period.
What factors influenced the Fund’s performance for the fiscal year ended March 31, 2013?
Interest rates declined slightly over the past twelve months with the two year Treasury yields declining 0.09% from 0.33% to 0.24% as of March 31, 2013. The shorter than benchmark duration contributed to the Fund’s underperformance.
How do you plan to position the Fund, based on market conditions?
With rates at low levels, we maintained our short-to-neutral duration during the fiscal year. Given the balance of positive and negative influences on the U.S. economy, a “wait and see” approach toward interest rate strategy seems prudent. Similarly, we also maintained our laddered yield curve positioning, a neutral approach we believe is appropriate given the Fed’s ongoing quantitative easing. Looking ahead, we believe rate volatility remains unpredictable and prone to directional changes as improving U.S. economic data clash with a challenging federal fiscal policy. In addition events abroad can quickly create flight-to-quality scenarios that alter the slope of the yield curve. We will continue to tactically allocate along the ladder as rates rise and fall in the coming year.
31
SHORT-TERM U.S. TREASURY SECURITIES FUND
Growth of a $10,000 Investment (as of March 31, 2013)
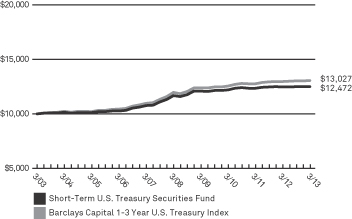 | This chart assumes an initial hypothetical investment of $10,000 made on 3/31/03. Total return is based on net change in the Net Asset Value (“NAV”) assuming reinvestment of distributions. Returns shown on this page include reinvestment of all dividends and other distributions.
The Fund’s performance is compared to the Barclays Capital 1-3 Year U.S. Treasury Index. The Barclays Capital 1-3 Year U.S. Treasury Index is the 1-3 year component of the Barclays Capital U.S. Treasury Index. It includes securities in the Treasury Index (i.e., public obligations of the U.S. Treasury) with a maturity from one up to (but not including) 3 years. The Index is unmanaged and does not reflect the deduction of fees, such as investment management and fund accounting fees associated with a mutual fund. Investors cannot invest directly in an index. |
| �� | Average Annual Total Returns as of 3/31/13 | |||||||||||||||||||
| Short-Term U.S. Treasury Securities Fund | 1 Year | 3 Year | 5 Year | 10 Year | ||||||||||||||||
A Shares | without sales charge | –0.03% | 0.58% | 1.17% | 2.05% | |||||||||||||||
| with sales charge* | –2.57% | –0.26% | 0.67% | 1.80% | ||||||||||||||||
C Shares | without CDSC | –0.33% | –0.03% | 0.46% | 1.42% | |||||||||||||||
| with CDSC* | –1.32% | –0.03% | 0.46% | 1.42% | ||||||||||||||||
I Shares | 0.15% | 0.76% | 1.35% | 2.23% | ||||||||||||||||
| Barclays Capital 1-3 Year U.S. Treasury Index | 0.64% | 1.26% | 1.76% | 2.68% | ||||||||||||||||
| Prospectus Expense Ratio1 | Gross | |||||||||||||||||||
| A Shares | 0.89% | |||||||||||||||||||
| C Shares | 1.19% | |||||||||||||||||||
| I Shares | 0.73% | |||||||||||||||||||
Past performance does not guarantee future results. The performance data quoted represents past performance and current returns may be lower or higher. Total return figures include change in share price, reinvestment of dividends and capital gains and do not reflect taxes that a shareholder would pay on fund distributions or on the redemption of fund shares. The investment return and principal value will fluctuate so that an investor’s shares, when redeemed, may be worth more or less than the original cost. For performance data current to the most recent month end, visit our website at www.ridgeworth.com.
| * | Class A Share performance reflects the maximum front-end sales charge of 2.50% and Class C Shares reflect the maximum CDSC (contingent deferred sales charge) of 1.00% in year one only. |
| 1 | This information is included in the most current prospectus available to current and prospective shareholders of the Fund. Additional information pertaining to the 3/31/13 expense ratios can be found in the financial highlights. |
Investment Weightings (as of March 31, 2013)
as a percentage of investments
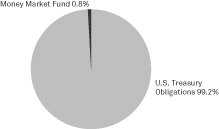
32
Portfolio Managers
| Ÿ | James F. Keegan |
| Ÿ | Adrien Webb, CFA |
| Ÿ | Perry Troisi |
INVESTMENT CONCERNS
Bonds offer a relatively stable level of income, although bond prices will fluctuate providing the potential for principal gain or loss. Intermediate-term, higher-quality bonds generally offer less risk than longer-term bonds and a lower rate of return.
Mortgage-backed investments involve risk of loss due to prepayments and, like any bond, due to default. Because of the sensitivity of mortgage-related securities to changes in interest rates, the Fund’s performance may be more volatile than if it did not hold these securities.
Debt securities will generally lose value if interest rates increase and vice versa. Interest rate risk is generally higher for investments with longer maturities or durations. Debt securities are subject to the risk that an issuer will fail to make timely payments of interest or principal or go bankrupt, reducing the Fund’s return. The lower the rating of a debt security, the higher its credit risk.
MANAGEMENT DISCUSSIONOF FUND PERFORMANCE
How did the Fund perform against its benchmark for the fiscal year ended March 31, 2013?
For the fiscal year ended March 31, 2013, the Total Return Bond Fund returned 4.01% (I Shares) versus 3.77% for the Barclays Capital U.S. Aggregate Bond Index (the “Index”). For longer time periods, performance of the Fund has exceeded the Index at 6.24% versus 5.52% over 3 years and 6.76% versus 5.47% over 5 years.
What factors influenced the Fund’s performance for the fiscal year ended March 31, 2013?
Given the generosity of central banks globally, the fiscal year was marked by a broad “risk rally” that rewarded nearly all spread sectors, with the lower rated, higher beta segments of the market benefitting the most and providing robust excess returns. With that backdrop, the Fund’s overweight in spread product (all fixed income securities that trade at a spread over a comparable U.S. Treasury Security) was a positive contributor to performance. Security selection within corporate bonds was a modest drag as positioning was fairly defensive, while mortgage-backed security (MBS) selection contributed to the Fund’s return via several off-index allocations (collateralized mortgage obligations [CMOs] and delegated underwriting and servicing [DUS] bonds). A void in government-related risk was also a drag on performance. Strategic yield curve positioning was not a part of performance this year. Several global strategies that opportunistically took advantage of excessive volatility, particularly in Europe, also contributed to performance.
How do you plan to position the Fund, based on market conditions?
Current valuations are hyper inflated over the intermediate and long term. Juxtaposing these valuations against the fragile and challenged macroeconomic environment that persists, we find comfort in remaining defensive and less exposed to risk markets/spread sectors relative to positioning at earlier points in the recovery. An overabundance of complacency exists globally.
The Fund is currently at an index weighting in corporate bonds, down slightly from 1.3x the index weight at the beginning of the fiscal year. This is a low in corporate bond exposure compared to the last several years. The positioning remains defensive, focusing on industrial exposure while maintaining a longstanding underweight in money center bank exposure. While still overweight residential mortgage-backed securities (RMBS), we have reduced the weighting versus the index from 1.3x to 1.1x over the course of the fiscal year. Positioning within RMBS continues to overweight 15-year collateral and the usage of structure (CMOs) for prepayment protection and convexity. A modest overweight in commercial mortgage-backed securities (CMBS) persists and the exposure remains near the top of the capital structure. The Fund is void the government-related sector, as the spread offered does not adequately compensate for the risk.
The Fund’s exposure to high yield was switched to bank loans at the beginning of the fiscal year. Offsetting this long bank loan exposure is a tactical short position in high yield bonds currently. The Fund continues to utilize tactical global strategies in various foreign rate and currency markets.
33
TOTAL RETURN BOND FUND
Growth of a $10,000 Investment (as of March 31, 2013)
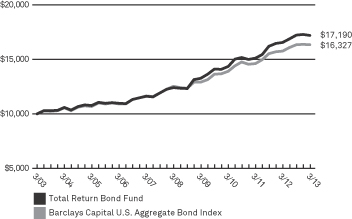 | This chart assumes an initial hypothetical investment of $10,000 made on 3/31/03. Total return is based on net change in the Net Asset Value (“NAV”) assuming reinvestment of distributions. Returns shown on this page include reinvestment of all dividends and other distributions.
The Fund’s performance is compared to the Barclays Capital U.S. Aggregate Bond Index, which covers the U.S. dollar-denominated, investment-grade, fixed-rate, taxable bond market of SEC-registered securities. The Index includes bonds from the Treasury, Government-Related, Corporate, MBS (agency fixed-rate and hybrid ARM pass-through), ABS and CMBS sectors. The Index is unmanaged and does not reflect the deduction of fees, such as investment management and fund accounting fees associated with a mutual fund. Investors cannot invest directly in an index. |
| Average Annual Total Returns as of 3/31/13 | ||||||||||||||||||
| Total Return Bond Fund | Inception Date† | 1 Year | 3 Year | 5 Year | 10 Year | |||||||||||||
A Shares | without sales charge | 12/30/1997 | 3.76% | 5.97% | 6.43% | 5.23% | ||||||||||||
| with sales charge* | –1.13% | 4.28% | 5.40% | 4.72% | ||||||||||||||
R Shares† | 12/30/1997 | 3.34% | 5.67% | 6.10% | 4.91% | |||||||||||||
I Shares† | 12/30/1997 | 4.01% | 6.24% | 6.76% | 5.57% | |||||||||||||
| Barclays Capital U.S. Aggregate Bond Index | 3.77% | 5.52% | 5.47% | 5.02% | ||||||||||||||
| Prospectus Expense Ratio1 | Gross | |||||||||||||||||
| A Shares | 0.67% | |||||||||||||||||
| R Shares | 0.90% | |||||||||||||||||
| I Shares | 0.39% | |||||||||||||||||
Past performance does not guarantee future results. The performance data quoted represents past performance and current returns may be lower or higher. Total return figures include change in share price, reinvestment of dividends and capital gains and do not reflect taxes that a shareholder would pay on fund distributions or on the redemption of fund shares. The investment return and principal value will fluctuate so that an investor’s shares, when redeemed, may be worth more or less than the original cost. For performance data current to the most recent month end, visit our website at www.ridgeworth.com.
| * | Class A Share performance reflects the maximum front-end sales charge of 4.75%. |
| † | The I Shares and R Shares were offered beginning on 10/11/04. The performance shown prior to such date is based on the performance of the Class I Shares of the Seix Core Bond Fund, the predecessor fund to the Total Return Bond Fund. The A Shares were offered beginning on 10/11/04. The performance shown from 1/25/02 to such date is based on the performance of the Class P Shares of the Seix Core Bond Fund. The performance shown prior to 1/25/02 is based on the performance of the Class I Shares of the Seix Core Bond Fund. The historical performance |
| has not been adjusted to reflect A Share or R Share expenses. If it had been, the performance would have been lower |
| 1 | This information is included in the most current prospectus available to current and prospective shareholders of the Fund. Additional information pertaining to the 3/31/13 expense ratios can be found in the financial highlights. |
Investment Weightings (as of March 31, 2013)
as a percentage of investments

34
Portfolio Managers
| Ÿ | H. Rick Nelson |
| Ÿ | Chad K. Stephens |
INVESTMENT CONCERNS
Bonds offer a relatively stable level of income, although bond prices will fluctuate providing the potential for principal gain or loss. Intermediate-term, higher-quality bonds generally offer less risk than longer-term bonds and a lower rate of return.
U.S. Government guarantees apply only to the underlying securities of the Fund’s portfolio and not the Fund’s shares.
Mortgage-backed investments involve risk of loss due to prepayments and, like any bond, due to default. Because of the sensitivity of mortgage-related securities to changes in interest rates, the Fund’s performance may be more volatile than if it did not hold these securities.
Debt securities will generally lose value if interest rates increase and vice versa. Interest rate risk is generally higher for investments with longer maturities or durations. Debt securities are subject to the risk that an issuer will fail to make timely payments of interest or principal or go bankrupt, reducing the Fund’s return. The lower the rating of a debt security, the higher its credit risk.
MANAGEMENT DISCUSSIONOF FUND PERFORMANCE
How did the Fund perform against its benchmark for the fiscal year ended March 31, 2013?
The Fund outperformed its benchmark index, the Barclays Capital 3-6 Month U.S. Treasury Bill Index. The Fund (I Shares) generated a return of 1.39% for the fiscal year ended March 31, 2013 while the benchmark index return was 0.18% over the same period.
What factors influenced the Fund’s performance for the fiscal year ended March 31, 2013?
Total return of the Fund was driven both by income and price appreciation. Interest rates declined over the past twelve months with the one year Treasury yields declining 0.05% from 0.17% to 0.12% as March 31, 2013.
Holdings of U.S. Treasury and U.S. Government Agency debentures remained low for the period ended March 31, 2013 while spread products (all fixed income securities that trade at a spread over a comparable U.S. Treasury Security) consisting of investment grade corporate credit and securitized assets contributed to the Fund’s performance.
Corporate credit spreads widened during the second quarter of 2012 before tightening over the next three quarters ending March 31, 2013. The financial sector was the most volatile stemming from continued fears of the European sovereign debt crisis, as well as an unclear regulatory environment as Dodd Frank rules are still being written. Yet when the results of the Federal Reserve’s (Fed) second annual stress tests were released, the majority of the largest commercial banks were shown to have historically strong capital ratios, improving asset quality and healthy levels of liquidity. Credit spreads on financials tightened during the last three quarters. The Fund held no European based financial credits since 2011.
In securitized assets, U.S. Government Agency residential mortgage-backed securities performed well, benefiting primarily from the Fed’s quantitative easing 3 program and low interest rate volatility. Agency commercial mortgage-backed securities also had a great year due to better market liquidity and increasing market demand for high quality and more predictable cash flow products. Non-agency residential mortgage-backed securities (MBS) outperformed all other types of non-agency securitized assets in the fiscal year ended March 31, 2013, driven by limited supply and investors search for higher for yielding securities. Spreads on commercial mortgage-backed securities continued to tighten in the period. Spread tightening was driven partially by market demand for yield and partially driven by improving market fundamentals. Mezzanine tranches outperformed senior tranches given less call risk from refinancing or liquidation. High quality asset backed securities (auto and credit card backed securities) were stable performers. The spread remained tight range bound for most of the last 12 months.
How do you plan to position the Fund, based on market conditions?
We look to keep a short to neutral duration stance as risks remain higher for longer duration assets in a rising rate environment. We also feel that a neutral, laddered position is warranted given that shifts and twists in the curve may be short-lived and range-bound over the coming months.
We look to maintain limited exposure to U.S. Treasuries. As historically low rates linger, investors are only offered asymmetrical return potential; limited upside along with little coupon to insulate against the potential of rising rates. We will continue with our bias towards lower beta corporate credits such as non-cyclical industrials and companies with transparent and consistent earnings potential. Within securitized assets, we continue to overweight Agency and non-Agency mortgage credits, which aided performance in the quarter. Securitized assets could face a headwind should interest rates begin to rise. We continue to seek lower-premium, lower-coupon and floating rate MBS credits to provide protection from rising rates and refinancing risk.
35
ULTRA-SHORT BOND FUND
Growth of a $10,000 Investment (as of March 31, 2013)
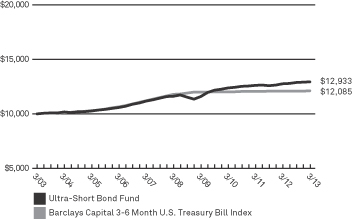 | This chart assumes an initial hypothetical investment of $10,000 made on 3/31/03. Total return is based on net change in the Net Asset Value (“NAV”) assuming reinvestment of distributions. Returns shown on this page include reinvestment of all dividends and other distributions.
The Fund’s performance is compared to the Barclays Capital 3-6 Month U.S. Treasury Bill Index. The Barclays Capital 3-6 Month U.S. Treasury Bill Index (“Index”) is the 3-6 month component of the Barclays Capital U.S. Treasury Bills Index, which includes U.S. Treasury bills with a remaining maturity from 1 up to (but not including) 12 months. It excludes zero coupon strips. The Index is unmanaged and does not reflect the deduction of fees, such as investment management and fund accounting fees associated with a mutual fund. Investors cannot invest directly in an index. |
| Average Annual Total Returns as of 3/31/13 | ||||||||||||||||
| Ultra-Short Bond Fund | 1 Year | 3 Year | 5 Year | 10 Year | ||||||||||||
I Shares | 1.39% | 1.50% | 2.21% | 2.61% | ||||||||||||
| Barclays Capital 3-6 Month U.S. Treasury Bill Index | 0.18% | 0.19% | 0.53% | 1.91% | ||||||||||||
| Prospectus Expense Ratio1 | Gross | |||||||||||||||
| I Shares | 0.34% | |||||||||||||||
Past performance does not guarantee future results. The performance data quoted represents past performance and current returns may be lower or higher. Total return figures include change in share price, reinvestment of dividends and capital gains and do not reflect taxes that a shareholder would pay on fund distributions or on the redemption of fund shares. The investment return and principal value will fluctuate so that an investor’s shares, when redeemed, may be worth more or less than the original cost. For performance data current to the most recent month end, visit our website at www.ridgeworth.com.
| 1 | This information is included in the most current prospectus available to current and prospective shareholders of the Fund. Additional information pertaining to the 3/31/13 expense ratios can be found in the financial highlights. |
Investment Weightings (as of March 31, 2013)
as a percentage of investments
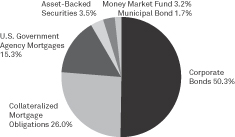
36
U.S. GOVERNMENT SECURITIES FUND
Portfolio Managers
| Ÿ | James F. Keegan |
| Ÿ | Adrien Webb, CFA |
| Ÿ | Perry Troisi |
| Ÿ | Michael Rieger |
| Ÿ | Seth Antiles, Ph.D |
INVESTMENT CONCERNS
Mutual fund investing involves risk, including possible loss of principal. Bonds offer a relatively stable level of income, although bond prices will fluctuate providing the potential for principal gain or loss. Intermediate-term, higher-quality bonds generally offer less risk than longer-term bonds and a lower rate of return.
U.S. Government guarantees apply only to the underlying securities of the Fund’s portfolio and not the Fund’s shares.
The Fund is subject to the risk that principal value reacts in opposition to the movement of interest rates and that a rising interest rate environment increases the risk of loss of principal.
Mortgage-backed investments involve risk of loss due to prepayments and, like any bond, due to default. Because of the sensitivity of mortgage-related securities to changes in interest rates, the Fund’s performance may be more volatile than if it did not hold these securities.
Debt securities will generally lose value if interest rates increase and vice versa. Interest rate risk is generally higher for investments with longer maturities or durations. Debt securities are subject to the risk that an issuer will fail to make timely payments of interest or principal or go bankrupt, reducing the Fund’s return. The lower the rating of a debt security, the higher its credit risk.
MANAGEMENT DISCUSSION OF FUND PERFORMANCE
How did the Fund perform against its benchmark for the fiscal year ended March 31, 2013?
For the fiscal year ended March 31, 2013, the U.S. Government Securities Fund returned 2.19% (I Shares) versus 3.01% for the Barclays Capital U.S. Government Index.
What factors influenced the Fund’s performance for the fiscal year ended March 31, 2013?
Given the generosity of central banks globally, the fiscal year was marked by a broad “risk rally” that rewarded nearly all spread sectors, even higher-quality sectors like the government-related exposure found in many competitor funds. The Fund was positioned in Treasury exposure only and the Fund’s void in agency debentures detracted from performance as the sector produced positive excess returns over the fiscal year. Strategic yield curve positioning was not a part of performance this year.
How do you plan to position the Fund, based on market conditions?
Current valuations are hyper inflated over the intermediate and long term. Juxtaposing these valuations against the fragile and challenged macroeconomic environment that persists, we find comfort in remaining defensive and in a Treasury only portfolio until risk assets re-price to reflect this challenged fundamental backdrop. Aggressive central bank intervention has supported excessive risk taking while offering little support to the economic recovery. An overabundance of complacency exists globally and warrants caution.
37
U.S. GOVERNMENT SECURITIES FUND
Growth of a $10,000 Investment (as of March 31, 2013)
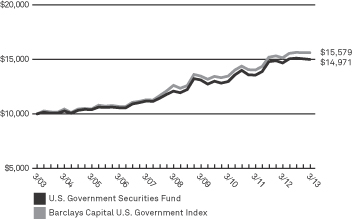 | This chart assumes an initial hypothetical investment of $10,000 made on 3/31/03. Total return is based on net change in the Net Asset Value (“NAV”) assuming reinvestment of distributions. Returns shown on this page include reinvestment of all dividends and other distributions.
The Fund’s performance is compared to the Barclays Capital U.S. Government Index (“Index”), which is composed of the Barclays Capital U.S. Treasury and U.S. Agency indices. The Index includes Treasuries (public obligations of the U.S. Treasury that have remaining maturities of more than one year) and U.S. agency debentures (publicly issued debt of U.S. Government agencies, quasi federal corporations, and corporate or foreign debt guaranteed by the U.S. Government). The Index is unmanaged and does not reflect the deduction of fees, such as investment management and fund accounting fees associated with a mutual fund. Investors cannot invest directly in an index. |
| Average Annual Total Returns as of 3/31/13 | ||||||||||||||||||||
| U.S. Government Securities Fund | 1 Year | 3 Year | 5 Year | 10 Year | ||||||||||||||||
A Shares | without sales charge | 1.97% | 4.68% | 4.12% | 3.80% | |||||||||||||||
| with sales charge* | –2.84% | 2.98% | 3.11% | 3.29% | ||||||||||||||||
C Shares | without CDSC | 1.72% | 4.14% | 3.51% | 3.17% | |||||||||||||||
| with CDSC* | 0.75% | 4.14% | 3.51% | 3.17% | ||||||||||||||||
I Shares | 2.19% | 4.96% | 4.41% | 4.12% | ||||||||||||||||
| Barclays Capital U.S. Government Index | 3.01% | 5.04% | 4.36% | 4.53% | ||||||||||||||||
| Prospectus Expense Ratio1 | Gross | |||||||||||||||||||
| A Shares | 1.00% | |||||||||||||||||||
| C Shares | 1.67% | |||||||||||||||||||
| I Shares | 0.79% | |||||||||||||||||||
Past performance does not guarantee future results. The performance data quoted represents past performance and current returns may be lower or higher. Total return figures include change in share price, reinvestment of dividends and capital gains and do not reflect taxes that a shareholder would pay on fund distributions or on the redemption of fund shares. The investment return and principal value will fluctuate so that an investor’s shares, when redeemed, may be worth more or less than the original cost. For performance data current to the most recent month end, visit our website at www.ridgeworth.com.
| * | Class A Share performance reflects the maximum front-end sales charge of 4.75% and Class C Shares reflect the maximum CDSC (contingent deferred sales charge) of 1.00% in year one only. |
| 1 | This information is included in the most current prospectus available to current and prospective shareholders of the Fund. Additional information pertaining to the 3/31/13 expense ratios can be found in the financial highlights. |
Investment Weightings (as of March 31, 2013)
as a percentage of investments

38
U.S. GOVERNMENT SECURITIES ULTRA-SHORT BOND FUND
Portfolio Managers
| Ÿ | H. Rick Nelson |
| Ÿ | Chad K. Stephens |
INVESTMENT CONCERNS
Bonds offer a relatively stable level of income, although bond prices will fluctuate providing the potential for principal gain or loss. Intermediate-term, higher-quality bonds generally offer less risk than longer-term bonds and a lower rate of return.
U.S. Government guarantees apply only to the underlying securities of the Fund’s portfolio and not the Fund’s shares.
The Fund is subject to the risk that principal value reacts in opposition to the movement of interest rates and that a rising interest rate environment increases the risk of loss of principal.
Mortgage-backed investments involve risk of loss due to prepayments and, like any bond, due to default. Because of the sensitivity of mortgage-related securities to changes in interest rates, the Fund’s performance may be more volatile than if it did not hold these securities.
Debt securities will generally lose value if interest rates increase and vice versa. Interest rate risk is generally higher for investments with longer maturities or durations. Debt securities are subject to the risk that an issuer will fail to make timely payments of interest or principal or go bankrupt, reducing the Fund’s return. The lower the rating of a debt security, the higher its credit risk.
MANAGEMENT DISCUSSION OF FUND PERFORMANCE
How did the Fund perform against its benchmark for the fiscal year ended March 31, 2013?
The Fund outperformed its benchmark index, the Barclays Capital 3-6 Month U.S. Treasury Bill Index. The Fund generated a return of 1.10% for the fiscal year ended March 31, 2013 while the benchmark index return was 0.18% over the same period.
What factors influenced the Fund’s performance for the fiscal year ended March 31, 2013?
The Fund benefited from its allocation to U.S. Government Agency securitized assets as spreads on residential and multi-family securities tightened relative to U.S. Treasuries over the period. The allocation to adjustable-rate mortgages (ARMs) drove performance and total return. The Fund’s allocation to floating rate collateralized mortgage obligations (CMOs) contributed modestly to total return while reducing duration and hence interest rate risk in the Fund. Once more, the allocation to floating rate securities in the Fund reduced the weighted average dollar price thereby reducing prepayment risk inherent in securitized assets. The Fund also added exposure to Agency commercial mortgage-backed securities (CMBS) which benefited the Fund over the fiscal year as credit spreads tightened and the yield curve flattened.
How do you plan to position the Fund, based on market conditions?
We look to keep a relatively short duration stance as risks remain higher for longer duration assets in a rising rate environment. We also feel that a neutral, laddered position is warranted given that shifts and twists in the curve may be short-lived and range-bound over the coming months.
We also look to maintain limited exposure to U.S. Treasuries. As historically low rates linger, investors are subject to asymmetrical return potential; limited upside along with little coupon income to insulate against potential rising interest rates.
We will attempt to minimize the risks associated with rising longer-term rates by focusing on securities with shorter and well-defined principal payment periods. For example, we will look for CMOs that offer structural protections to investors. We will likely emphasize securities with floating rate coupons that offer investors more protection from rising interest rates or a steepening yield curve.
39
U.S. GOVERNMENT SECURITIES ULTRA-SHORT BOND FUND
Growth of a $10,000 Investment (as of March 31, 2013)
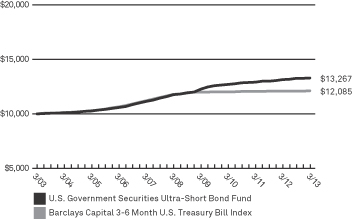 | This chart assumes an initial hypothetical investment of $10,000 made on 3/31/03. Total return is based on net change in the Net Asset Value (“NAV”) assuming reinvestment of distributions. Returns shown on this page include reinvestment of all dividends and other distributions.
The Fund’s performance is compared to the Barclays Capital 3-6 Month U.S. Treasury Bill Index (‘‘Index’’). The Index is the 3-6 month component of the Barclays Capital U.S. Treasury Bills Index, which includes U.S. Treasury bills with a remaining maturity from 1 up to (but not including) 12 months. It excludes zero coupon strips. The Index is unmanaged and does not reflect the deduction of fees, such as investment management and fund accounting fees associated with a mutual fund. Investors cannot invest directly in an index. |
| Average Annual Total Returns as of 3/31/13 | ||||||||||||||||||||
| U.S. Government Securities Ultra-Short Bond Fund | 1 Year | 3 Year | 5 Year | 10 Year | ||||||||||||||||
I Shares | 1.10% | 1.49% | 2.47% | 2.87% | ||||||||||||||||
| Barclays Capital 3-6 Month U.S. Treasury Bill Index | 0.18% | 0.19% | 0.53% | 1.91% | ||||||||||||||||
| Prospectus Expense Ratio1 | Gross | |||||||||||||||||||
| I Shares | 0.39% | |||||||||||||||||||
Past performance does not guarantee future results. The performance data quoted represents past performance and current returns may be lower or higher. Total return figures include change in share price, reinvestment of dividends and capital gains and do not reflect taxes that a shareholder would pay on fund distributions or on the redemption of fund shares. The investment return and principal value will fluctuate so that an investor’s shares, when redeemed, may be worth more or less than the original cost. For performance data current to the most recent month end, visit our website at www.ridgeworth.com.
| 1 | This information is included in the most current prospectus available to current and prospective shareholders of the Fund. Additional information pertaining to the March 31, 2013 expense ratios can be found in the financial highlights |
Investment Weightings (as of March 31, 2013)
as a percentage of investments
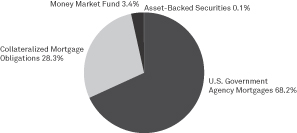
40
VIRGINIA INTERMEDIATE MUNICIPAL BOND FUND
Portfolio Manager
| Ÿ | Chris Carter, CFA |
INVESTMENT CONCERNS
The geographical concentration of portfolio holdings in this Fund may involve increased risk.
Mutual fund investing involves risk, including possible loss of principal. Bonds offer a relatively stable level of income, although bond prices will fluctuate providing the potential for principal gain or loss. Intermediate-term, higher-quality bonds generally offer less risk than longer-term bonds and a lower rate of return.
The Fund’s income may be subject to certain state and local taxes and, depending on your tax status, the federal alternative minimum tax.
The Fund is subject to the risk that principal value reacts in opposition to the movement of interest rates and that a rising interest rate environment increases the risk of loss of principal.
Debt securities will generally lose value if interest rates increase and vice versa. Interest rate risk is generally higher for investments with longer maturities or durations. Debt securities are subject to the risk that an issuer will fail to make timely payments of interest or principal or go bankrupt, reducing the Fund’s return. The lower the rating of a debt security, the higher its credit risk.
MANAGEMENT DISCUSSIONOF FUND PERFORMANCE
How did the Fund perform against its benchmark for the fiscal year ended March 31, 2013?
For the fiscal year ended March 31, 2013, the Fund’s I Shares had a total return of 3.70% versus an average return of 3.53% for the Lipper Other States Intermediate Debt Objective and a 4.19% total return for the Barclays Capital U.S. Municipal Bond 1-15 Year Blend Index (the “Index”). The long end of the municipal yield curve, defined as 22-year and longer maturities, provided the greatest total return during the period, with total returns generally increasing out of the curve (according to Barclays Capital). Relative to the Index the Fund maintains a higher allocation to the cash equivalent, 5-year, 7-year, 20-year, and long bond sectors, and a lower allocation to all other maturity sectors, as of March 31, 2013. Additionally, relative to the Index the Fund maintains a higher allocation to securities rated AAA and non-rated bonds, an approximately neutral allocation to securities rated AA, and a lower allocation to securities in all other rating categories. Trading activity and portfolio events during the period resulted in exposure to the less than 1-year, 1-year, 5-year, 7-year, and long bond sectors being increased and exposure to the 3-year, 10-year, and 15-year sectors being reduced. The 5, 10, and 30-year generic AAA rated municipal bond yields declined 0.14%, 0.20% and 0.30%, respectively, over the fiscal year (according to Municipal Market Data Line).
What factors influenced the Fund’s performance for the fiscal year ended March 31, 2013?
Yield curve positioning contributed to the Fund’s outperformance for the period. The Fund maintained an overweight of bonds with final maturities of 17 years and longer. The 20-year sector outperformed the 5-year sector by 3.50% for the 12 months ended March 31, 2013 (according to Barclays Capital).
How do you plan to position the Fund, based on market conditions?
With municipal supply likely to remain manageable again this year, further investor flight-to-quality would likely increase the attractiveness of municipal bonds. Municipals as an asset class are relatively secure while offering among the highest after-tax returns over the past decade for top income earners. We continue to carefully watch the political environment in Washington, an impactful factor for all asset classes. The Fund’s present duration posture, yield curve positioning, and sector allocations seem appropriate given our forecasts for the economy and financial markets. We will continue to make tactical adjustments to the Fund, periodically, as a part of an active portfolio management process. All activity will occur within an investment grade construct and the average credit quality the Fund’s holdings should remain high relative to its peers.
41
VIRGINIA INTERMEDIATE MUNICIPAL BOND FUND
Growth of a $10,000 Investment (as of March 31, 2013)
 | This chart assumes an initial hypothetical investment of $10,000 made on 3/31/03. Total return is based on net change in the Net Asset Value (“NAV”) assuming reinvestment of distributions. Returns shown on this page include reinvestment of all dividends and other distributions.
The Fund’s performance is compared to the Barclays Capital U.S. Municipal Bond 1-15 Year Blend Index (“Index”) which is an index of tax-exempt bonds with maturities ranging between 1 and 15 years. The Index is unmanaged and does not reflect the deduction of fees, such as investment management and fund accounting fees associated with a mutual fund. Investors cannot invest directly in an index. |
| Average Annual Total Returns as of 3/31/13 | ||||||||||||||||||||
| Virginia Intermediate Municipal Bond Fund | 1 Year | 3 Year | 5 Year | 10 Year | ||||||||||||||||
A Shares | without sales charge | 3.45% | 4.57% | 4.80% | 3.94% | |||||||||||||||
| with sales charge* | –1.46% | 2.89% | 3.79% | 3.44% | ||||||||||||||||
I Shares | 3.70% | 4.76% | 4.98% | 4.09% | ||||||||||||||||
| Barclays Capital U.S. Municipal Bond 1-15 Year Blend Index | 4.19% | 5.26% | 5.43% | 4.59% | ||||||||||||||||
| Prospectus Expense Ratio1 | Gross | |||||||||||||||||||
| A Shares | 0.74% | |||||||||||||||||||
| I Shares | 0.58% | |||||||||||||||||||
Past performance does not guarantee future results. The performance data quoted represents past performance and current returns may be lower or higher. Total return figures include change in share price, reinvestment of dividends and capital gains and do not reflect taxes that a shareholder would pay on fund distributions or on the redemption of fund shares. The investment return and principal value will fluctuate so that an investor’s shares, when redeemed, may be worth more or less than the original cost. For performance data current to the most recent month end, visit our website at www.ridgeworth.com.
| * | Class A Share performance reflects the maximum front-end sales charge of 4.75%. |
| 1 | This information is included in the most current prospectus available to current and prospective shareholders of the Fund. Additional information pertaining to the 3/31/13 expense ratios can be found in the financial highlights. |
Investment Weightings (as of March 31, 2013)
as a percentage of investments
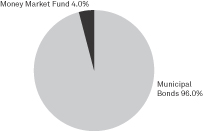
42
SCHEDULES OF PORTFOLIO INVESTMENTS
RIDGEWORTH FUNDS March 31, 2013
Core Bond Fund
| Shares or Principal Amount($) | Value($) | |||||||
Asset-Backed Securities 1.1% |
| |||||||
Home Equity 0.5% | ||||||||
Ameriquest Mortgage Securities, Inc., Series 2005-R5, Cl M1, 0.634%, 07/25/35(a) | 1,857,000 | 1,811,687 | ||||||
|
| |||||||
Other 0.6% | ||||||||
Domino’s Pizza Master Issuer LLC, Series 2012-1A, Cl A2, 5.216%, 01/25/42(b) | 2,272,395 | 2,550,168 | ||||||
|
| |||||||
Total Asset-Backed Securities (Cost $4,020,134) | 4,361,855 | |||||||
|
| |||||||
| Collateralized Mortgage Obligations 7.7% | ||||||||
Agency Collateralized Mortgage Obligations 5.4% |
| |||||||
Federal Home Loan Mortgage Corporation | ||||||||
Series 3768, Cl CB, 3.500%, 12/15/25 | 36,000 | 38,720 | ||||||
Series 3774, Cl EW, 3.500%, 12/15/25 | 39,000 | 42,045 | ||||||
Series 3788, Cl YB, 3.500%, 01/15/26 | 9,765,488 | 10,526,337 | ||||||
Series 3800, Cl CB, 3.500%, 02/15/26 | 42,000 | 45,262 | ||||||
Series 3806, Cl L, 3.500%, 02/15/26 | 399,000 | 427,683 | ||||||
Series 3825, Cl CB, REMIC, 3.500%, 03/15/26 | 23,000 | 24,744 | ||||||
Series 3829, Cl BE, 3.500%, 03/15/26 | 58,000 | 62,565 | ||||||
Series 3877, Cl LM, 3.500%, 06/15/26 | 26,000 | 28,156 | ||||||
Series 3907, Cl MD, 3.500%, 08/15/26 | 2,818,475 | 2,999,077 | ||||||
Series 3950, Cl YB, 3.000%, 11/15/26 | 626,000 | 659,071 | ||||||
Series 3980, Cl LG, 3.000%, 01/15/27 | 2,536,000 | 2,670,565 | ||||||
Series 4065, Cl CL, 3.000%, 06/15/27 | 838,000 | 886,569 | ||||||
Series 4077, Cl B, 3.000%, 07/15/27 | 731,000 | 774,312 | ||||||
|
| |||||||
| 19,185,106 | ||||||||
|
| |||||||
Federal National Mortgage Association | ||||||||
Series 2011-44, Cl EB, | 154,000 | 162,623 | ||||||
Series 2012-100, Cl EW, REMIC, 3.000%, 09/25/27 | 500,941 | 519,237 | ||||||
| Shares or Principal Amount($) | Value($) | |||||||
Agency Collateralized Mortgage Obligations—continued |
| |||||||
Series 2012-17, Cl BC, 3.500%, 03/25/27 | 1,379,000 | 1,485,317 | ||||||
|
| |||||||
| 2,167,177 | ||||||||
|
| |||||||
| 21,352,283 | ||||||||
|
| |||||||
| Commercial Mortgage Backed Securities 2.3% | ||||||||
Extended Stay America Trust | ||||||||
Series 2013-ESH7, Cl A27, 2.958%, 12/05/31(b) | 800,000 | 809,105 | ||||||
|
| |||||||
GS Mortgage Securities Corp. II | ||||||||
Series 2012-ALOH, Cl A, 3.551%, 04/10/34(b) | 1,746,000 | 1,835,945 | ||||||
Series 2012-BWTR, Cl A, 2.954%, 11/05/34(b) | 1,069,000 | 1,064,923 | ||||||
Series 2012-BWTR, Cl B, 3.255%, 11/05/34(b) | 1,195,000 | 1,196,762 | ||||||
|
| |||||||
| 4,097,630 | ||||||||
|
| |||||||
JPMorgan Chase Commercial Mortgage Securities Corp. | ||||||||
Series 2005-LDP3, Cl A4B, 4.996%, 08/15/42(a) | 2,295,000 | 2,500,251 | ||||||
|
| |||||||
Merrill Lynch Mortgage Trust | ||||||||
Series 2005-LC1, Cl AM, 5.312%, 01/12/44(a) | 1,146,000 | 1,263,777 | ||||||
|
| |||||||
Wachovia Bank Commercial Mortgage Trust | ||||||||
Series 2005-C21, Cl AM, 5.241%, 10/15/44(a) | 391,000 | 430,682 | ||||||
|
| |||||||
| 9,101,445 | ||||||||
|
| |||||||
Total Collateralized Mortgage Obligations | 30,453,728 | |||||||
|
| |||||||
Corporate Bonds 22.2% | ||||||||
Aerospace/Defense 0.3% | ||||||||
United Technologies Corp., 3.100%, 06/01/22 | 962,000 | 1,008,254 | ||||||
|
| |||||||
Auto Manufacturers 0.3% | ||||||||
Daimler Finance N.A. LLC, 3.875%, 09/15/21(b) | 434,000 | 469,599 | ||||||
Volkswagen International Finance, 2.375%, 03/22/17(b) | 690,000 | 715,303 | ||||||
|
| |||||||
| 1,184,902 | ||||||||
|
| |||||||
Banks 1.6% | ||||||||
Fifth Third Bank, 1.450%, 02/28/18 | 1,285,000 | 1,284,692 | ||||||
HSBC Bank PLC, 3.100%, 05/24/16(b) | 407,000 | 432,793 | ||||||
See Notes to Financial Statements.
43
SCHEDULES OF PORTFOLIO INVESTMENTS
RIDGEWORTH FUNDS March 31, 2013
Core Bond Fund — continued
| Shares or Principal Amount($) | Value($) | |||||||
Banks—continued |
| |||||||
HSBC Bank PLC, 3.500%, 06/28/15(b) | 783,000 | 828,358 | ||||||
KeyBank NA, 1.650%, 02/01/18 | 831,000 | 838,523 | ||||||
PNC Bank NA, 0.800%, 01/28/16 | 2,017,000 | 2,016,772 | ||||||
Wells Fargo & Co., 1.250%, 02/13/15, MTN | 1,099,000 | 1,111,667 | ||||||
|
| |||||||
| 6,512,805 | ||||||||
|
| |||||||
Beverages 0.5% | ||||||||
Anheuser-Busch InBev Worldwide, Inc., 2.500%, 07/15/22 | 1,237,000 | 1,215,880 | ||||||
SABMiller Holdings, Inc., 2.450%, 01/15/17(b) | 683,000 | 710,998 | ||||||
|
| |||||||
| 1,926,878 | ||||||||
|
| |||||||
Biotechnology 0.2% | ||||||||
Life Technologies Corp., 5.000%, 01/15/21 | 286,000 | 309,427 | ||||||
Life Technologies Corp., 6.000%, 03/01/20 | 422,000 | 473,460 | ||||||
|
| |||||||
| 782,887 | ||||||||
|
| |||||||
Chemicals 0.3% | ||||||||
Dow Chemical Co. (The), 4.375%, 11/15/42 | 513,000 | 492,006 | ||||||
Praxair, Inc., 4.625%, 03/30/15 | 773,000 | 835,052 | ||||||
|
| |||||||
| 1,327,058 | ||||||||
|
| |||||||
Commercial Services 0.8% | ||||||||
ERAC USA Finance LLC, 2.750%, 03/15/17(b) | 615,000 | 640,644 | ||||||
ERAC USA Finance LLC, 5.250%, 10/01/20(b) | 952,000 | 1,105,272 | ||||||
ERAC USA Finance LLC, 5.600%, 05/01/15(b) | 1,099,000 | 1,203,263 | ||||||
|
| |||||||
| 2,949,179 | ||||||||
|
| |||||||
Computers 0.5% | ||||||||
IBM Corp., 0.875%, 10/31/14 | 1,459,000 | 1,470,652 | ||||||
IBM Corp., 4.000%, 06/20/42 | 629,000 | 631,131 | ||||||
|
| |||||||
| 2,101,783 | ||||||||
|
| |||||||
Diversified Financial Services 2.4% |
| |||||||
American Express Credit Corp., 2.375%, 03/24/17, MTN | 604,000 | 631,587 | ||||||
CME Group, Inc., 5.400%, 08/01/13 | 573,000 | 582,158 | ||||||
CME Group, Inc., 5.750%, 02/15/14 | 384,000 | 400,630 | ||||||
| Shares or Principal Amount($) | Value($) | |||||||
Diversified Financial Services—continued |
| |||||||
Ford Motor Credit Co. LLC, 5.000%, 05/15/18 | 1,142,000 | 1,257,810 | ||||||
General Electric Capital Corp., Series A, 7.125%(a)(c) | 500,000 | 581,533 | ||||||
General Electric Capital Corp., Series B, 6.250%(a)(c) | 1,464,000 | 1,606,788 | ||||||
John Deere Capital Corp., 1.250%, 12/02/14, MTN | 601,000 | 609,194 | ||||||
Lazard Group LLC, 7.125%, 05/15/15 | 719,000 | 795,354 | ||||||
MassMutual Global Funding LLC, 2.000%, 04/05/17(b) | 576,000 | 590,437 | ||||||
NASDAQ OMX Group, Inc. (The), 5.550%, 01/15/20 | 287,000 | 309,487 | ||||||
PACCAR Financial Corp., 1.550%, 09/29/14, MTN | 796,000 | 809,384 | ||||||
Toyota Motor Credit Corp., 3.200%, 06/17/15, MTN | 338,000 | 356,872 | ||||||
Woodside Finance Ltd., 4.600%, 05/10/21(b) | 908,000 | 1,011,168 | ||||||
|
| |||||||
| 9,542,402 | ||||||||
|
| |||||||
Electric 0.8% | ||||||||
Alabama Power Co., 5.800%, 11/15/13 | 553,000 | 570,732 | ||||||
Dominion Resources, Inc., 1.950%, 08/15/16 | 315,000 | 324,839 | ||||||
Duke Energy Carolinas LLC, 4.300%, 06/15/20 | 310,000 | 356,259 | ||||||
Exelon Generation Co. LLC, 6.200%, 10/01/17 | 529,000 | 620,194 | ||||||
Georgia Power Co., 6.000%, 11/01/13 | 313,000 | 322,673 | ||||||
MidAmerican Energy Holdings Co., 6.125%, 04/01/36 | 422,000 | 524,510 | ||||||
Southern California Edison Co., 5.750%, 03/15/14 | 578,000 | 605,587 | ||||||
|
| |||||||
| 3,324,794 | ||||||||
|
| |||||||
Electronics 0.1% | ||||||||
Thermo Fisher Scientific, Inc., 2.250%, 08/15/16 | 255,000 | 264,030 | ||||||
|
| |||||||
Food 0.1% | ||||||||
Kroger Co. (The), 7.500%, 01/15/14 | 427,000 | 449,824 | ||||||
|
| |||||||
Healthcare-Products 0.2% | ||||||||
Becton Dickinson and Co., 3.250%, 11/12/20 | 252,000 | 267,550 | ||||||
Covidien International Finance SA, 6.000%, 10/15/17 | 554,000 | 664,612 | ||||||
|
| |||||||
| 932,162 | ||||||||
|
| |||||||
See Notes to Financial Statements.
44
SCHEDULES OF PORTFOLIO INVESTMENTS
RIDGEWORTH FUNDS March 31, 2013
Core Bond Fund — continued
| Shares or Principal Amount($) | Value($) | |||||||
Household Products/Wares 0.1% |
| |||||||
Clorox Co. (The), 3.050%, 09/15/22 | 401,000 | 404,570 | ||||||
|
| |||||||
Insurance 1.0% | ||||||||
Berkshire Hathaway, Inc., 3.200%, 02/11/15 | 965,000 | 1,012,765 | ||||||
Berkshire Hathaway, Inc., 4.600%, 05/15/13 | 738,000 | 741,936 | ||||||
Fairfax Financial Holdings Ltd., 5.800%, 05/15/21(b) | 531,000 | 562,328 | ||||||
Nationwide Financial Services, Inc., 5.375%, 03/25/21(b) | 1,396,000 | 1,540,122 | ||||||
|
| |||||||
| 3,857,151 | ||||||||
|
| |||||||
Internet 0.1% | ||||||||
eBay, Inc., 2.600%, 07/15/22 | 461,000 | 460,651 | ||||||
|
| |||||||
Machinery-Diversified 0.2% | ||||||||
Deere & Co., 3.900%, 06/09/42 | 897,000 | 886,166 | ||||||
|
| |||||||
Media 0.9% | ||||||||
Comcast Corp., 3.125%, 07/15/22 | 651,000 | 666,083 | ||||||
Comcast Corp., 4.650%, 07/15/42 | 678,000 | 689,972 | ||||||
Thomson Reuters Corp., 5.950%, 07/15/13 | 178,000 | 180,778 | ||||||
Time Warner Cable, Inc., 4.000%, 09/01/21 | 1,147,000 | 1,223,855 | ||||||
Time Warner Cable, Inc., 8.250%, 02/14/14 | 519,000 | 552,091 | ||||||
Time Warner, Inc., 6.200%, 03/15/40 | 216,000 | 251,293 | ||||||
|
| |||||||
| 3,564,072 | ||||||||
|
| |||||||
Mining 1.3% | ||||||||
Barrick (PD) Australia Finance Property Ltd., 4.950%, 01/15/20 | 310,000 | 344,047 | ||||||
Barrick (PD) Australia Finance Property Ltd., 5.950%, 10/15/39 | 376,000 | 408,332 | ||||||
Barrick International Barbados Corp., 6.350%, 10/15/36(b) | 794,000 | 912,382 | ||||||
BHP Billiton Finance USA Ltd., 1.125%, 11/21/14 | 622,000 | 628,865 | ||||||
Kinross Gold Corp., 5.125%, 09/01/21 | 1,971,000 | 2,059,999 | ||||||
Newmont Mining Corp., 6.250%, 10/01/39 | 621,000 | 713,228 | ||||||
|
| |||||||
| 5,066,853 | ||||||||
|
| |||||||
| Shares or Principal Amount($) | Value($) | |||||||
Miscellaneous Manufacturer 0.9% |
| |||||||
3M Co., 1.375%, 09/29/16 | 418,000 | 428,087 | ||||||
General Electric Co., 4.125%, 10/09/42 | 462,000 | 463,176 | ||||||
General Electric Co., 5.250%, 12/06/17 | 390,000 | 456,841 | ||||||
Illinois Tool Works, Inc., 6.250%, 04/01/19 | 1,007,000 | 1,258,282 | ||||||
Siemens Financieringsmaatschappij NV, 6.125%, 08/17/26(b) | 829,000 | 1,082,715 | ||||||
|
| |||||||
| 3,689,101 | ||||||||
|
| |||||||
Oil & Gas 0.7% | ||||||||
BP Capital Markets PLC, 2.248%, 11/01/16 | 716,000 | 744,910 | ||||||
Ensco PLC, 4.700%, 03/15/21 | 572,000 | 638,645 | ||||||
Shell International Finance BV, 3.625%, 08/21/42 | 1,217,000 | 1,177,365 | ||||||
Statoil ASA, 3.125%, 08/17/17 | 265,000 | 287,312 | ||||||
|
| |||||||
| 2,848,232 | ||||||||
|
| |||||||
Oil & Gas Services 0.5% | ||||||||
Baker Hughes, Inc., 5.125%, 09/15/40 | 453,000 | 526,593 | ||||||
Schlumberger Investment SA, 3.300%, 09/14/21(b) | 693,000 | 739,933 | ||||||
Weatherford International Ltd., 5.125%, 09/15/20 | 413,000 | 445,456 | ||||||
Weatherford International Ltd., 6.500%, 08/01/36 | 365,000 | 392,035 | ||||||
|
| |||||||
| 2,104,017 | ||||||||
|
| |||||||
Pharmaceuticals 0.8% | ||||||||
Express Scripts Holding Co., 2.650%, 02/15/17 | 641,000 | 671,421 | ||||||
GlaxoSmithKline Capital, Inc., 5.650%, 05/15/18 | 621,000 | 750,699 | ||||||
Novartis Capital Corp., 3.700%, 09/21/42 | 242,000 | 233,563 | ||||||
Novartis Securities Investment Ltd., 5.125%, 02/10/19 | 383,000 | 457,308 | ||||||
Zoetis, Inc., 3.250%, 02/01/23(b) | 948,000 | 961,351 | ||||||
|
| |||||||
| 3,074,342 | ||||||||
|
| |||||||
Pipelines 2.0% | ||||||||
El Paso Natural Gas Co., 5.950%, 04/15/17 | 621,000 | 720,692 | ||||||
Energy Transfer Partners LP, 6.050%, 06/01/41 | 363,000 | 393,037 | ||||||
See Notes to Financial Statements.
45
SCHEDULES OF PORTFOLIO INVESTMENTS
RIDGEWORTH FUNDS March 31, 2013
Core Bond Fund — continued
| Shares or Principal Amount($) | Value($) | |||||||
Pipelines—continued |
| |||||||
Energy Transfer Partners LP, 6.625%, 10/15/36 | 394,000 | 449,261 | ||||||
Enterprise Products Operating LLC, 5.250%, 01/31/20 | 1,189,000 | 1,392,217 | ||||||
Enterprise Products Operating LLC, Series J, 5.750%, 03/01/35 | 472,000 | 541,435 | ||||||
Kinder Morgan Energy Partners LP, 5.000%, 08/15/42 | 1,568,000 | 1,589,563 | ||||||
Southern Natural Gas Co., 5.900%, 04/01/17(b) | 413,000 | 481,366 | ||||||
TC Pipelines LP, 4.650%, 06/15/21 | 600,000 | 644,115 | ||||||
TransCanada PipeLines Ltd., 6.100%, 06/01/40 | 490,000 | 618,493 | ||||||
Transcontinental Gas Pipe Line Co. LLC, 6.050%, 06/15/18 | 394,000 | 478,831 | ||||||
Williams Partners LP, 4.125%, 11/15/20 | 655,000 | 706,723 | ||||||
|
| |||||||
| 8,015,733 | ||||||||
|
| |||||||
Real Estate Investment Trust 1.2% |
| |||||||
American Tower Corp., 3.500%, 01/31/23 | 691,000 | 685,339 | ||||||
Digital Realty Trust LP, 4.500%, 07/15/15 | 1,248,000 | 1,326,023 | ||||||
Digital Realty Trust LP, 5.875%, 02/01/20 | 257,000 | 292,783 | ||||||
Healthcare Realty Trust, Inc., 6.500%, 01/17/17 | 2,010,000 | 2,313,369 | ||||||
|
| |||||||
| 4,617,514 | ||||||||
|
| |||||||
Retail 0.9% | ||||||||
AutoZone, Inc., 3.700%, 04/15/22 | 556,000 | 573,749 | ||||||
Macy’s Retail Holdings, Inc., 4.300%, 02/15/43 | 787,000 | 721,363 | ||||||
Walgreen Co., 4.875%, 08/01/13 | 528,000 | 535,400 | ||||||
Wesfarmers Ltd., 6.998%, 04/10/13(b) | 1,668,000 | 1,669,807 | ||||||
|
| |||||||
| 3,500,319 | ||||||||
|
| |||||||
Semiconductors 0.9% | ||||||||
Analog Devices, Inc., 3.000%, 04/15/16 | 212,000 | 224,284 | ||||||
Intel Corp., 1.950%, 10/01/16 | 485,000 | 502,412 | ||||||
Intel Corp., 4.250%, 12/15/42 | 234,000 | 228,578 | ||||||
Intel Corp., 4.800%, 10/01/41 | 1,481,000 | 1,564,242 | ||||||
| Shares or Principal Amount($) | Value($) | |||||||
Semiconductors—continued | ||||||||
TSMC Global Ltd., 1.625%, 04/03/18(b)(d) | 857,000 | 855,749 | ||||||
|
| |||||||
| 3,375,265 | ||||||||
|
| |||||||
| Software 0.4% | ||||||||
Fiserv, Inc., 4.750%, 06/15/21 | 493,000 | 534,417 | ||||||
Oracle Corp., 5.750%, 04/15/18 | 869,000 | 1,048,572 | ||||||
|
| |||||||
| 1,582,989 | ||||||||
|
| |||||||
| Telecommunication Services 2.1% | ||||||||
AT&T, Inc., 0.900%, 02/12/16 | 609,000 | 608,587 | ||||||
AT&T, Inc., 4.350%, 06/15/45(b) | 436,000 | 405,322 | ||||||
AT&T, Inc., 5.550%, 08/15/41 | 578,000 | 637,107 | ||||||
CC Holdings GS V LLC, 3.849%, 04/15/23(b) | 1,692,000 | 1,704,628 | ||||||
Cellco Partnership/Verizon Wireless Capital LLC, 5.550%, 02/01/14 | 508,000 | 527,992 | ||||||
Cisco Systems, Inc., 5.500%, 02/22/16 | 423,000 | 480,725 | ||||||
Cisco Systems, Inc., 5.500%, 01/15/40 | 737,000 | 879,451 | ||||||
Juniper Networks, Inc., 3.100%, 03/15/16 | 172,000 | 180,247 | ||||||
Rogers Communications, Inc., 7.500%, 03/15/15 | 579,000 | 652,359 | ||||||
SBA Tower Trust, 2.933%, 12/15/42(b) | 1,200,000 | 1,253,172 | ||||||
Verizon Communications, Inc., 5.250%, 04/15/13 | 557,000 | 557,907 | ||||||
Verizon Communications, Inc., 5.550%, 02/15/16 | 471,000 | 531,350 | ||||||
|
| |||||||
| 8,418,847 | ||||||||
|
| |||||||
| Transportation 0.1% | ||||||||
United Parcel Service, Inc., 3.125%, 01/15/21 | 363,000 | 387,455 | ||||||
|
| |||||||
Total Corporate Bonds (Cost $83,071,213) | 88,160,235 | |||||||
|
| |||||||
U.S. Government Agency Mortgages 26.2% |
| |||||||
Federal Home Loan Mortgage Corporation | ||||||||
Pool #J18446, 3.000%, 03/01/27 | 2,748,327 | 2,895,985 | ||||||
Pool #J18800, 3.000%, 04/01/27 | 1,231,378 | 1,297,535 | ||||||
Pool #J19132, 3.000%, 05/01/27 | 1,395,323 | 1,470,289 | ||||||
Pool #J19310, 3.000%, 06/01/27 | 411,154 | 431,175 | ||||||
See Notes to Financial Statements.
46
SCHEDULES OF PORTFOLIO INVESTMENTS
RIDGEWORTH FUNDS March 31, 2013
Core Bond Fund — continued
| Shares or Principal Amount($) | Value($) | |||||||
U.S. Government Agency Mortgages—continued |
| |||||||
Pool #G14517, 2.500%, 07/01/27 | 1,555,891 | 1,618,568 | ||||||
Pool #J19776, 3.000%, 07/01/27 | 286,619 | 304,615 | ||||||
Pool #J20257, 3.000%, 08/01/27 | 2,231,854 | 2,350,368 | ||||||
Pool #J20729, 2.500%, 10/01/27 | 213,694 | 222,303 | ||||||
Pool #J20738, 2.500%, 10/01/27 | 3,431,830 | 3,560,694 | ||||||
Pool #J20922, 2.500%, 10/01/27 | 722,252 | 750,219 | ||||||
Pool #J21113, 2.500%, 11/01/27 | 1,175,946 | 1,221,480 | ||||||
Pool #J21155, 2.500%, 11/01/27 | 773,744 | 802,798 | ||||||
Pool #J21295, 2.500%, 12/01/27 | 789,625 | 820,200 | ||||||
Pool #J22029, 3.000%, 01/01/28 | 1,414,233 | 1,489,331 | ||||||
Pool #J22137, 2.500%, 02/01/28 | 834,784 | 866,130 | ||||||
Pool #J22255, 2.500%, 02/01/28(d) | 385,636 | 401,171 | ||||||
Pool #J22529, 2.500%, 02/01/28 | 1,301,620 | 1,353,648 | ||||||
Pool #J22728, 2.500%, 03/01/28(d) | 297,000 | 308,686 | ||||||
Pool #J22831, 2.500%, 03/01/28 | 1,651,000 | 1,716,993 | ||||||
Pool #J22873, 2.500%, 03/01/28 | 492,000 | 511,512 | ||||||
Pool #D99439, 3.500%, 06/01/32 | 313,721 | 336,063 | ||||||
Pool #G30614, 3.500%, 12/01/32 | 2,119,524 | 2,259,418 | ||||||
Pool #A12413, 5.000%, 08/01/33 | 322,187 | 349,761 | ||||||
Pool #G05052, 5.000%, 10/01/33 | 188,804 | 204,963 | ||||||
Pool #G01797, 5.500%, 12/01/33 | 6,803,097 | 7,436,086 | ||||||
Pool #G01779, 5.000%, 04/01/35 | 379,120 | 409,671 | ||||||
Pool #G01837, 5.000%, 07/01/35 | 2,633,388 | 2,842,304 | ||||||
Pool #G02162, 5.500%, 05/01/36 | 1,288,426 | 1,399,046 | ||||||
Pool #G02252, 5.500%, 07/01/36 | 546,046 | 592,928 | ||||||
| Shares or Principal Amount($) | Value($) | |||||||
U.S. Government Agency Mortgages—continued |
| |||||||
Pool #Z40004, 6.000%, 08/01/36 | 451,454 | 492,894 | ||||||
Pool #G02424, 5.500%, 12/01/36 | 629,438 | 683,479 | ||||||
Pool #G04997, 5.000%, 01/01/37 | 107,397 | 115,917 | ||||||
Pool #G05254, 5.000%, 01/01/37 | 1,113,574 | 1,201,918 | ||||||
Pool #G03296, 6.000%, 09/01/37 | 704,536 | 781,538 | ||||||
Pool #G05326, 5.000%, 02/01/38 | 533,084 | 575,375 | ||||||
Pool #G03871, 5.500%, 02/01/38 | 1,846,243 | 2,032,276 | ||||||
Pool #G04337, 5.500%, 04/01/38 | 126,786 | 137,315 | ||||||
Pool #G06079, 6.000%, 07/01/39 | 2,714,232 | 2,971,017 | ||||||
Pool #A93996, 4.500%, 09/01/40 | 536,424 | 574,203 | ||||||
2.500%, TBA, 15 Year Maturity(d) | 6,758,000 | 6,996,642 | ||||||
|
| |||||||
| 56,786,514 | ||||||||
|
| |||||||
Federal National Mortgage Association | ||||||||
Pool #AM3173, 2.050%, 06/01/20(d) | 522,000 | 527,810 | ||||||
Pool #AM2137, 1.950%, 08/01/20 | 549,000 | 550,664 | ||||||
Pool #AM2920, 1.980%, 11/01/20(d) | 649,000 | 649,610 | ||||||
Pool #AM1003, 2.150%, 12/01/20 | 607,274 | 612,453 | ||||||
Pool #AM0418, 2.720%, 08/01/22 | 889,155 | 923,152 | ||||||
Pool #AJ1910, 2.500%, 05/01/27 | 1,599,863 | 1,662,547 | ||||||
Pool #AO3012, 2.500%, 05/01/27 | 917,868 | 954,476 | ||||||
Pool #AL3274, 3.000%, 05/01/27 | 1,290,000 | 1,357,644 | ||||||
Pool #AP4725, 3.000%, 08/01/27 | 416,589 | 440,387 | ||||||
Pool #AP1220, 2.500%, 09/01/27 | 1,485,249 | 1,543,443 | ||||||
Pool #AI9132, 3.000%, 09/01/27 | 341,470 | 359,909 | ||||||
Pool #AP7520, 3.000%, 09/01/27 | 772,442 | 818,499 | ||||||
Pool #AP1221, 2.500%, 10/01/27 | 911,386 | 947,095 | ||||||
See Notes to Financial Statements.
47
SCHEDULES OF PORTFOLIO INVESTMENTS
RIDGEWORTH FUNDS March 31, 2013
Core Bond Fund — continued
| Shares or Principal Amount($) | Value($) | |||||||
U.S. Government Agency Mortgages—continued |
| |||||||
Pool #AP9774, 2.500%, 10/01/27 | 3,259,305 | 3,389,300 | ||||||
Pool #AM1589, 2.420%, 12/01/27 | 542,043 | 545,483 | ||||||
Pool #AR1215, 3.000%, 01/01/28 | 541,199 | 569,917 | ||||||
Pool #AQ1273, 3.000%, 01/01/28 | 221,603 | 233,362 | ||||||
Pool #MA0949, 3.500%, 01/01/32 | 1,523,826 | 1,627,256 | ||||||
Pool #AB4168, 3.500%, 01/01/32(d) | 2,037,392 | 2,175,680 | ||||||
Pool #MA0976, 3.500%, 02/01/32 | 508,890 | 542,398 | ||||||
Pool #AP9592, 3.500%, 10/01/32 | 1,326,550 | 1,416,589 | ||||||
Pool #AB7691, 3.500%, 01/01/33 | 703,552 | 751,305 | ||||||
Pool #AB8428, 3.500%, 02/01/33 | 1,456,799 | 1,557,500 | ||||||
Pool #725773, 5.500%, 09/01/34 | 79,130 | 87,299 | ||||||
Pool #735036, 5.500%, 12/01/34 | 299,787 | 330,737 | ||||||
Pool #827943, 5.000%, 05/01/35 | 379,233 | 412,777 | ||||||
Pool #735500, 5.500%, 05/01/35 | 1,626,034 | 1,783,743 | ||||||
Pool #357829, 6.000%, 06/01/35 | 818,557 | 887,696 | ||||||
Pool #888344, 5.000%, 10/01/35 | 1,947,484 | 2,114,764 | ||||||
Pool #888632, 5.000%, 04/01/36 | 127,787 | 139,003 | ||||||
Pool #878094, 6.000%, 04/01/36 | 2,356,214 | 2,621,559 | ||||||
Pool #190370, 6.000%, 06/01/36 | 1,445,620 | 1,587,185 | ||||||
Pool #AI7951, 4.500%, 08/01/36 | 523,463 | 564,233 | ||||||
Pool #889505, 6.000%, 08/01/36 | 690,823 | 762,791 | ||||||
Pool #AD0784, 6.000%, 05/01/37 | 755,721 | 829,727 | ||||||
Pool #995082, 5.500%, 08/01/37 | 1,133,166 | 1,250,153 | ||||||
Pool #889529, 6.000%, 03/01/38 | 57,701 | 64,473 | ||||||
Pool #995724, 6.000%, 04/01/39 | 232,551 | 259,844 | ||||||
Pool #AD0439, 6.000%, 07/01/39 | 530,988 | 585,243 | ||||||
| Shares or Principal Amount($) | Value($) | |||||||
U.S. Government Agency Mortgages—continued |
| |||||||
Pool #AD7136, 5.000%, 07/01/40 | 1,142,393 | 1,254,800 | ||||||
Pool #AB1343, 4.500%, 08/01/40 | 1,091,766 | 1,191,693 | ||||||
Pool #AL0005, 4.500%, 01/01/41 | 559,601 | 603,710 | ||||||
Pool #AB2694, 4.500%, 04/01/41 | 495,339 | 541,659 | ||||||
Pool #AL1627, 4.500%, 09/01/41 | 1,746,404 | 1,916,806 | ||||||
Pool #AQ2197, 4.500%, 11/01/42 | 415,459 | 452,881 | ||||||
3.000%, TBA, 15 Year Maturity(d) | 2,058,000 | 2,163,714 | ||||||
|
| |||||||
| 46,562,969 | ||||||||
|
| |||||||
Government National Mortgage Association | ||||||||
Pool #AA6933, 3.000%, 11/15/27 | 287,668 | 306,077 | ||||||
|
| |||||||
Total U.S. Government Agency Mortgages (Cost $102,211,507) | 103,655,560 | |||||||
|
| |||||||
U.S. Treasury Obligations 40.0% |
| |||||||
| U.S. Treasury Bond 4.2% | ||||||||
2.750%, 11/15/42 | 17,854,000 | 16,548,426 | ||||||
|
| |||||||
| U.S. Treasury Notes 35.8% | ||||||||
0.500%, 05/31/13(e) | 19,518,000 | 19,532,482 | ||||||
0.375%, 11/15/15 | 38,997,000 | 39,057,913 | ||||||
1.750%, 05/31/16(e) | 9,411,000 | 9,810,968 | ||||||
1.000%, 03/31/17 | 18,743,000 | 19,069,541 | ||||||
0.625%, 08/31/17 | 31,000,000 | 30,968,504 | ||||||
0.750%, 02/28/18 | 2,457,000 | 2,457,575 | ||||||
2.000%, 02/15/23 | 21,026,000 | 21,292,105 | ||||||
|
| |||||||
| 142,189,088 | ||||||||
|
| |||||||
Total U.S. Treasury Obligations (Cost $157,618,740) | 158,737,514 | |||||||
|
| |||||||
Preferred Stocks 0.9% | ||||||||
| Banks 0.6% | ||||||||
PNC Financial Services Group, Inc., Series P, 6.125%(a)(c) | 23,575 | 652,320 | ||||||
US Bancorp, Series F, 6.500%(a)(c) | 22,025 | 657,667 | ||||||
US Bancorp, Series G, 6.000%(a)(c) | 36,775 | 1,023,816 | ||||||
|
| |||||||
| 2,333,803 | ||||||||
|
| |||||||
Insurance 0.3% | ||||||||
Arch Capital Group Ltd., Series C, 6.750%(c) | 14,800 | 412,180 | ||||||
See Notes to Financial Statements.
48
SCHEDULES OF PORTFOLIO INVESTMENTS
RIDGEWORTH FUNDS March 31, 2013
Core Bond Fund — concluded
| Shares or Principal Amount($) | Value($) | |||||||
Insurance—continued | ||||||||
Reinsurance Group of America, Inc., 6.200%(a) | 20,950 | 570,468 | ||||||
|
| |||||||
| 982,648 | ||||||||
|
| |||||||
Real Estate Investment Trust 0.0%(f) |
| |||||||
Public Storage, | 6,500 | 167,505 | ||||||
|
| |||||||
Total Preferred Stocks (Cost $3,173,970) | 3,483,956 | |||||||
|
| |||||||
| Money Market Fund 7.8% | ||||||||
State Street Institutional Treasury Money Market Fund, Institutional Class, 0.00%(g) | 30,909,791 | 30,909,791 | ||||||
|
| |||||||
Total Money Market Fund (Cost $30,909,791) | 30,909,791 | |||||||
|
| |||||||
Total Investments (Cost $410,204,247) — 105.9% | 419,762,639 | |||||||
Liabilities in excess of other assets — (5.9)% | (23,486,114 | ) | ||||||
|
| |||||||
Net Assets — 100.0% | $ | 396,276,525 | ||||||
|
| |||||||
| (a) | Variable or floating rate security. Rate disclosed is as of March 31, 2013. |
| (b) | Rule 144A, Section 4(2) or other security which is restricted as to resale to institutional investors. The Fund’s investment adviser/subadviser has deemed this security to be liquid based upon procedures approved by the Board of Trustees. These securities represent 6.9% of net assets as of March 31, 2013. |
| (c) | Security is perpetual in nature and has no stated maturity. |
| (d) | All or a portion of this security has been purchased on a when-issued or delayed-delivery basis. |
| (e) | All or a portion of this security has been segregated, or otherwise earmarked, in connection with obligations for when-issued or delayed-delivery purchase commitments. |
| (f) | Less than 0.05% of Net Assets. |
| (g) | Rate disclosed, the 7 day net yield, is as of March 31, 2013. |
Investment Abbreviations
| MTN | — | Medium Term Note | ||
| REMIC | — | Real Estate Mortgage Investment Conduit | ||
| TBA | — | To Be Announced. Securities purchased on a forward commitment basis with an appropriate principal amount and no definitive maturity date. The actual principal and maturity date will be determined upon settlement date. |
See Notes to Financial Statements.
49
SCHEDULES OF PORTFOLIO INVESTMENTS
RIDGEWORTH FUNDS March 31, 2013
Corporate Bond Fund
| Shares or Principal Amount($) | Value($) | |||||||
| Corporate Bonds 93.6% | ||||||||
Aerospace/Defense 1.0% | ||||||||
United Technologies Corp., 4.500%, 06/01/42 | 648,000 | 690,682 | ||||||
|
| |||||||
Auto Manufacturers 1.1% | ||||||||
Volkswagen International Finance, 2.375%, 03/22/17(a) | 791,000 | 820,008 | ||||||
|
| |||||||
Banks 7.6% | ||||||||
Fifth Third Bank, 1.450%, 02/28/18 | 1,149,000 | 1,148,724 | ||||||
HSBC Bank PLC, 3.100%, 05/24/16(a) | 416,000 | 442,364 | ||||||
HSBC Bank PLC, 3.500%, 06/28/15(a) | 585,000 | 618,888 | ||||||
KeyBank NA, 1.650%, 02/01/18 | 592,000 | 597,359 | ||||||
PNC Bank NA, 0.800%, 01/28/16 | 1,402,000 | 1,401,842 | ||||||
Wells Fargo & Co., 1.250%, 02/13/15, MTN | 1,176,000 | 1,189,555 | ||||||
|
| |||||||
| 5,398,732 | ||||||||
|
| |||||||
Beverages 2.3% | ||||||||
Anheuser-Busch InBev Worldwide, Inc., 2.500%, 07/15/22 | 654,000 | 642,834 | ||||||
SABMiller Holdings, Inc., | 978,000 | 1,018,091 | ||||||
|
| |||||||
| 1,660,925 | ||||||||
|
| |||||||
Biotechnology 0.9% | ||||||||
Life Technologies Corp., 5.000%, 01/15/21 | 361,000 | 390,570 | ||||||
Life Technologies Corp., 6.000%, 03/01/20 | 195,000 | 218,779 | ||||||
|
| |||||||
| 609,349 | ||||||||
|
| |||||||
Chemicals 0.6% | ||||||||
Dow Chemical Co. (The), 4.375%, 11/15/42 | 479,000 | 459,398 | ||||||
|
| |||||||
Commercial Services 1.7% | ||||||||
ERAC USA Finance LLC, 2.750%, 03/15/17(a) | 611,000 | 636,477 | ||||||
ERAC USA Finance LLC, 5.250%, 10/01/20(a) | 518,000 | 601,398 | ||||||
|
| |||||||
| 1,237,875 | ||||||||
|
| |||||||
Cosmetics/Personal Care 0.4% | ||||||||
Colgate-Palmolive Co., 0.600%, 11/15/14, MTN | 319,000 | 320,048 | ||||||
|
| |||||||
Diversified Financial Services 16.6% |
| |||||||
American Express Credit Corp., 2.375%, 03/24/17, MTN | 691,000 | 722,561 | ||||||
| Shares or Principal Amount($) | Value($) | |||||||
Diversified Financial Services—continued |
| |||||||
CME Group, Inc., 5.750%, 02/15/14 | 1,176,000 | 1,226,929 | ||||||
Ford Motor Credit Co. LLC, 5.000%, 05/15/18 | 1,070,000 | 1,178,509 | ||||||
General Electric Capital Corp., Series A, 7.125%(b)(c) | 600,000 | 697,839 | ||||||
General Electric Capital Corp., Series B, 6.250%(b)(c) | 1,700,000 | 1,865,806 | ||||||
John Deere Capital Corp., 1.250%, 12/02/14, MTN | 633,000 | 641,630 | ||||||
Lazard Group LLC, 6.850%, 06/15/17 | 810,000 | 931,291 | ||||||
Lazard Group LLC, 7.125%, 05/15/15 | 269,000 | 297,566 | ||||||
MassMutual Global Funding LLC, 2.000%, 04/05/17(a) | 650,000 | 666,292 | ||||||
NASDAQ OMX Group, Inc. (The), 5.550%, 01/15/20 | 329,000 | 354,777 | ||||||
PACCAR Financial Corp., 1.550%, 09/29/14, MTN | 938,000 | 953,771 | ||||||
Toyota Motor Credit Corp., 3.200%, 06/17/15, MTN | 724,000 | 764,425 | ||||||
Woodside Finance Ltd., | 1,389,000 | 1,546,820 | ||||||
|
| |||||||
| 11,848,216 | ||||||||
|
| |||||||
Electric 1.3% | ||||||||
Alabama Power Co., 5.800%, 11/15/13 | 81,000 | 83,597 | ||||||
Dominion Resources, Inc., 1.950%, 08/15/16 | 299,000 | 308,339 | ||||||
Exelon Generation Co. LLC, 6.200%, 10/01/17 | 429,000 | 502,955 | ||||||
|
| |||||||
| 894,891 | ||||||||
|
| |||||||
Electronics 0.4% | ||||||||
Thermo Fisher Scientific, Inc., 2.250%, 08/15/16 | 279,000 | 288,880 | ||||||
|
| |||||||
Healthcare-Products 1.2% | ||||||||
Covidien International Finance SA, 3.200%, 06/15/22 | 852,000 | 888,668 | ||||||
|
| |||||||
Healthcare-Services 0.6% | ||||||||
UnitedHealth Group, Inc., 1.400%, 10/15/17 | 400,000 | 402,900 | ||||||
|
| |||||||
Household Products/Wares 0.7% | ||||||||
Clorox Co. (The), 3.050%, 09/15/22 | 480,000 | 484,273 | ||||||
|
| |||||||
Insurance 3.2% | ||||||||
Allied World Assurance Co. Holdings Ltd., 5.500%, 11/15/20 | 300,000 | 339,393 | ||||||
See Notes to Financial Statements.
50
SCHEDULES OF PORTFOLIO INVESTMENTS
RIDGEWORTH FUNDS March 31, 2013
Corporate Bond Fund — continued
| Shares or Principal Amount($) | Value($) | |||||||
Insurance—continued | ||||||||
Berkshire Hathaway, Inc., 3.200%, 02/11/15 | 1,282,000 | 1,345,456 | ||||||
Fairfax Financial Holdings Ltd., 5.800%, 05/15/21(a) | 532,000 | 563,387 | ||||||
|
| |||||||
| 2,248,236 | ||||||||
|
| |||||||
Internet 0.8% | ||||||||
eBay, Inc., 2.600%, 07/15/22 | 571,000 | 570,567 | ||||||
|
| |||||||
Machinery-Construction & Mining 0.3% |
| |||||||
Caterpillar, Inc., 3.803%, 08/15/42 | 203,000 | 192,420 | ||||||
|
| |||||||
Machinery-Diversified 0.5% | ||||||||
Deere & Co., 3.900%, 06/09/42 | 356,000 | 351,700 | ||||||
|
| |||||||
Media 4.4% | ||||||||
Comcast Corp., 3.125%, 07/15/22 | 558,000 | 570,928 | ||||||
Comcast Corp., 4.650%, 07/15/42 | 843,000 | 857,886 | ||||||
Thomson Reuters Corp., 5.950%, 07/15/13 | 24,000 | 24,374 | ||||||
Time Warner Cable, Inc., 4.000%, 09/01/21 | 612,000 | 653,007 | ||||||
Time Warner, Inc., 6.200%, 03/15/40 | 377,000 | 438,600 | ||||||
Walt Disney Co. (The), 3.750%, 06/01/21, MTN | 532,000 | 586,631 | ||||||
|
| |||||||
| 3,131,426 | ||||||||
|
| |||||||
Mining 6.1% | ||||||||
Barrick (PD) Australia Finance Property Ltd., 5.950%, 10/15/39 | 444,000 | 482,180 | ||||||
Barrick International Barbados Corp., 6.350%, 10/15/36(a) | 753,000 | 865,269 | ||||||
BHP Billiton Finance USA Ltd., 1.125%, 11/21/14 | 661,000 | 668,295 | ||||||
Kinross Gold Corp., 5.125%, 09/01/21 | 1,272,000 | 1,329,436 | ||||||
Newmont Mining Corp., 6.250%, 10/01/39 | 910,000 | 1,045,150 | ||||||
|
| |||||||
| 4,390,330 | ||||||||
|
| |||||||
Miscellaneous Manufacturer 2.1% |
| |||||||
3M Co., 1.375%, 09/29/16 | 417,000 | 427,063 | ||||||
General Electric Co., 4.125%, 10/09/42 | 551,000 | 552,402 | ||||||
General Electric Co., 5.250%, 12/06/17 | 455,000 | 532,982 | ||||||
|
| |||||||
| 1,512,447 | ||||||||
|
| |||||||
Oil & Gas 3.6% | ||||||||
BP Capital Markets PLC, 2.248%, 11/01/16 | 839,000 | 872,877 | ||||||
| Shares or Principal Amount($) | Value($) | |||||||
Oil & Gas—continued | ||||||||
Ensco PLC, 4.700%, 03/15/21 | 748,000 | 835,151 | ||||||
Shell International Finance BV, 2.375%, 08/21/22 | 359,000 | 356,185 | ||||||
Shell International Finance BV, 3.625%, 08/21/42 | 503,000 | 486,618 | ||||||
|
| |||||||
| 2,550,831 | ||||||||
|
| |||||||
Oil & Gas Services 2.2% | ||||||||
Baker Hughes, Inc., 5.125%, 09/15/40 | 642,000 | 746,298 | ||||||
Weatherford International Ltd., 5.125%, 09/15/20 | 273,000 | 294,454 | ||||||
Weatherford International Ltd., 6.500%, 08/01/36 | 499,000 | 535,960 | ||||||
|
| |||||||
| 1,576,712 | ||||||||
|
| |||||||
Pharmaceuticals 1.9% | ||||||||
Express Scripts Holding Co., 2.650%, 02/15/17 | 659,000 | 690,275 | ||||||
Zoetis, Inc., 3.250%, 02/01/23(a) | 677,000 | 686,534 | ||||||
|
| |||||||
| 1,376,809 | ||||||||
|
| |||||||
Pipelines 8.8% | ||||||||
El Paso Natural Gas Co., 5.950%, 04/15/17 | 329,000 | 381,816 | ||||||
El Paso Pipeline Partners Operating Co. LLC, 6.500%, 04/01/20 | 355,000 | 430,151 | ||||||
Enbridge Energy Partners LP, 5.500%, 09/15/40 | 431,000 | 447,202 | ||||||
Energy Transfer Partners LP, 6.050%, 06/01/41 | 260,000 | 281,514 | ||||||
Energy Transfer Partners LP, 6.625%, 10/15/36 | 583,000 | 664,770 | ||||||
Kinder Morgan Energy Partners LP, 5.000%, 08/15/42 | 1,601,000 | 1,623,017 | ||||||
Southern Natural Gas Co., 5.900%, 04/01/17(a) | 39,000 | 45,456 | ||||||
TC Pipelines LP, 4.650%, 06/15/21 | 712,000 | 764,350 | ||||||
TransCanada PipeLines Ltd., 6.100%, 06/01/40 | 805,000 | 1,016,095 | ||||||
Transcontinental Gas Pipe Line Co. LLC, 6.050%, 06/15/18 | 65,000 | 78,995 | ||||||
Williams Partners LP, 4.125%, 11/15/20 | 509,000 | 549,194 | ||||||
|
| |||||||
| 6,282,560 | ||||||||
|
| |||||||
Real Estate Investment Trust 3.9% |
| |||||||
American Tower Corp., 3.500%, 01/31/23 | 925,000 | 917,422 | ||||||
See Notes to Financial Statements.
51
SCHEDULES OF PORTFOLIO INVESTMENTS
RIDGEWORTH FUNDS March 31, 2013
Corporate Bond Fund — concluded
| Shares or Principal Amount($) | Value($) | |||||||
Real Estate Investment Trust—continued |
| |||||||
Digital Realty Trust LP, 5.875%, 02/01/20 | 890,000 | 1,013,918 | ||||||
Healthcare Realty Trust, Inc., 6.500%, 01/17/17 | 735,000 | 845,934 | ||||||
|
| |||||||
| 2,777,274 | ||||||||
|
| |||||||
Retail 4.1% | ||||||||
AutoZone, Inc., 3.700%, 04/15/22 | 522,000 | 538,664 | ||||||
Macy’s Retail Holdings, Inc., 4.300%, 02/15/43 | 678,000 | 621,454 | ||||||
Wesfarmers Ltd., 1.874%, 03/20/18(a) | 658,000 | 663,659 | ||||||
Wesfarmers Ltd., 6.998%, 04/10/13(a) | 1,102,000 | 1,103,193 | ||||||
|
| |||||||
| 2,926,970 | ||||||||
|
| |||||||
Semiconductors 4.4% | ||||||||
Analog Devices, Inc., 3.000%, 04/15/16 | 237,000 | 250,732 | ||||||
Intel Corp., 1.950%, 10/01/16 | 497,000 | 514,843 | ||||||
Intel Corp., 4.250%, 12/15/42 | 1,243,000 | 1,214,201 | ||||||
Intel Corp., 4.800%, 10/01/41 | 402,000 | 424,595 | ||||||
TSMC Global Ltd., 1.625%, 04/03/18(a)(d) | 731,000 | 729,933 | ||||||
|
| |||||||
| 3,134,304 | ||||||||
|
| |||||||
Telecommunication Services 10.9% |
| |||||||
AT&T, Inc., 0.900%, 02/12/16 | 1,309,000 | 1,308,112 | ||||||
AT&T, Inc., 4.350%, 06/15/45(a) | 411,000 | 382,081 | ||||||
AT&T, Inc., 5.550%, 08/15/41 | 636,000 | 701,038 | ||||||
CC Holdings GS V LLC, 3.849%, 04/15/23(a) | 1,186,000 | 1,194,851 | ||||||
Cellco Partnership/Verizon Wireless Capital LLC, 5.550%, 02/01/14 | 784,000 | 814,854 | ||||||
Cisco Systems, Inc., 5.500%, 02/22/16 | 605,000 | 687,562 | ||||||
Cisco Systems, Inc., 5.500%, 01/15/40 | 846,000 | 1,009,519 | ||||||
Juniper Networks, Inc., 4.600%, 03/15/21 | 247,000 | 265,018 | ||||||
Verizon Communications, Inc., 5.550%, 02/15/16 | 1,155,000 | 1,302,991 | ||||||
Verizon Communications, Inc., 5.850%, 09/15/35 | 120,000 | 137,737 | ||||||
|
| |||||||
| 7,803,763 | ||||||||
|
| |||||||
Total Corporate Bonds | 66,831,194 | |||||||
|
| |||||||
| Shares or Principal Amount($) | Value($) | |||||||
| Preferred Stocks 4.6% | ||||||||
| Banks 2.7% | ||||||||
PNC Financial Services Group, Inc., Series P, 6.125%(b)(c) | 19,150 | 529,880 | ||||||
US Bancorp, Series F, 6.500%(b)(c) | 29,250 | 873,405 | ||||||
US Bancorp, Series G, 6.000%(b)(c) | 17,850 | 496,944 | ||||||
|
| |||||||
| 1,900,229 | ||||||||
|
| |||||||
| Insurance 1.6% | ||||||||
Arch Capital Group Ltd., Series C, 6.750%(c) | 16,650 | 463,703 | ||||||
Reinsurance Group of America, Inc., 6.200%(b) | 25,275 | 688,238 | ||||||
|
| |||||||
| 1,151,941 | ||||||||
|
| |||||||
| Real Estate Investment Trust 0.3% | ||||||||
Public Storage, Series U, 5.625%(c) | 7,875 | 202,939 | ||||||
|
| |||||||
Total Preferred Stocks (Cost $2,923,001) | 3,255,109 | |||||||
|
| |||||||
| Money Market Fund 2.5% | ||||||||
State Street Institutional Treasury Money Market Fund, Institutional Class, 0.00%(f) | 1,785,944 | 1,785,944 | ||||||
|
| |||||||
Total Money Market Fund | 1,785,944 | |||||||
|
| |||||||
Total Investments | 71,872,247 | |||||||
Liabilities in excess of other | (464,882 | ) | ||||||
|
| |||||||
Net Assets — 100.0% | $ | 71,407,365 | ||||||
|
| |||||||
| (a) | Rule 144A, Section 4(2) or other security which is restricted as to resale to institutional investors. The Fund’s investment adviser/subadviser has deemed this security to be liquid based upon procedures approved by the Board of Trustees. These securities represent 17.6% of net assets as of March 31, 2013. |
| (b) | Variable or floating rate security. Rate disclosed is as of March 31, 2013. |
| (c) | Security is perpetual in nature and has no stated maturity. |
| (d) | All or a portion of this security has been purchased on a when-issued or delayed-delivery basis. |
| (e) | All or a portion of this security has been segregated, or otherwise earmarked, in connection with obligations for when-issued or delayed-delivery purchase commitments. |
| (f) | Rate disclosed, the 7 day net yield, is as of March 31, 2013. |
Investment Abbreviations
MTN — Medium Term Note
See Notes to Financial Statements.
52
SCHEDULES OF PORTFOLIO INVESTMENTS
RIDGEWORTH FUNDS March 31, 2013
Georgia Tax-Exempt Bond Fund
| Shares or Principal Amount($) | Value($) | |||||||
| Municipal Bonds 96.0% | ||||||||
Alabama 0.4% | ||||||||
Birmingham, Series A, GO, 0.000%, 03/01/32(a)(b) | 640,000 | 591,283 | ||||||
|
| |||||||
California 2.6% | ||||||||
California State, GO, 5.000%, 02/01/20 | 1,910,000 | 2,310,088 | ||||||
California State, GO, 5.000%, 02/01/38 | 1,435,000 | 1,588,889 | ||||||
|
| |||||||
| 3,898,977 | ||||||||
|
| |||||||
Florida 1.4% | ||||||||
Miami-Dade County FL Aviation Revenue, Series A, AMT, RB, 5.000%, 10/01/21 | 1,750,000 | 2,089,360 | ||||||
|
| |||||||
Georgia 83.6% | ||||||||
Association County Commissioners of Georgia Leasing Program, Georgia Public Purpose Project, COP, 5.250%, 04/01/21, Pre-refunded 04/01/2014 @ 102, XLCA | 2,680,000 | 2,867,761 | ||||||
Athens-Clarke County Unified Government Development Authority, RB, 5.250%, 07/01/27 | 1,885,000 | 2,200,624 | ||||||
Athens-Clarke County Unified Government Development Authority, RB, 5.250%, 07/01/29 | 1,690,000 | 1,955,533 | ||||||
Athens-Clarke County Unified Government Development Authority, Catholic Health East, RB, 6.250%, 11/15/32 | 1,455,000 | 1,674,850 | ||||||
Athens-Clarke County Unified Government Water & Sewerage, RB, 5.500%, 01/01/38(c) | 4,000,000 | 4,644,360 | ||||||
Athens-Clarke County Unified Government Water & Sewerage, RB, 5.625%, 01/01/33(c) | 3,000,000 | 3,527,910 | ||||||
Atlanta Airport Passenger Facility Charge, Series B, RB, 5.000%, 01/01/21 | 2,000,000 | 2,388,640 | ||||||
Atlanta Airport Project, Series B, RB, 5.000%, 01/01/42 | 5,235,000 | 5,781,063 | ||||||
Atlanta GA Department of Aviation, Series B, RB, 5.000%, 01/01/20 | 1,500,000 | 1,813,665 | ||||||
| Shares or Principal Amount($) | Value($) | |||||||
Georgia—continued | ||||||||
Atlanta GA Department of Aviation, Series C, AMT, RB, 5.000%, 01/01/30 | 1,500,000 | 1,664,805 | ||||||
Atlanta GA Department of Aviation, Series C, AMT, RB, 5.000%, 01/01/31 | 1,000,000 | 1,105,900 | ||||||
Burke County Development Authority, Georgia Power Company, RB, 1.400%, 11/01/48(d) | 1,890,000 | 1,918,237 | ||||||
Carroll County Water Authority, Water & Sewerage, RB, 5.250%, 07/01/22, Pre-refunded 07/01/2015 @ 100, AGM | 150,000 | 166,158 | ||||||
Carroll County Water Authority, Water & Sewerage, RB, 5.250%, 07/01/22, AGM | 850,000 | 928,251 | ||||||
Cherokee County Board of Education, GO, 5.000%, 08/01/33, State Aid Withholding | 2,000,000 | 2,314,860 | ||||||
Cherokee County Georgia Resource Recovery Development Authority, Solid Waste Disposal, RB, 5.000%, 07/01/37, AMBAC/County Guaranteed, AMT | 1,000,000 | 1,062,580 | ||||||
Clarke County Hospital Authority, Athens Regional Medical Center, RB, 5.000%, 01/01/32 | 1,180,000 | 1,336,244 | ||||||
Cobb County Hospital Authority, RB, 5.250%, 04/01/21, Pre-refunded 04/01/2013 @ 103, AMBAC | 1,000,000 | 1,025,420 | ||||||
Cobb County Kennestone Hospital Authority, RB, 5.250%, 04/01/41 | 1,000,000 | 1,108,040 | ||||||
DeKalb Private Hospital Authority, Children’s Healthcare of Atlanta, Inc., RB, 5.000%, 11/15/29(c) | 6,300,000 | 7,084,098 | ||||||
DeKalb Private Hospital Authority, Children’s Healthcare of Atlanta, Inc., RB, 5.250%, 11/15/39(c) | 3,000,000 | 3,351,990 | ||||||
Douglas County, GO, 5.000%, 08/01/13 | 5,565,000 | 5,656,377 | ||||||
See Notes to Financial Statements.
53
SCHEDULES OF PORTFOLIO INVESTMENTS
RIDGEWORTH FUNDS March 31, 2013
Georgia Tax-Exempt Bond Fund — continued
| Shares or Principal Amount($) | Value($) | |||||||
Georgia—continued | ||||||||
Douglasville-Douglas County Water & Sewer Authority, RB, 5.625%, 06/01/15, AMBAC | 475,000 | 492,784 | ||||||
Downtown Smyrna Development Authority, RB, 5.250%, 02/01/28 | 1,000,000 | 1,209,700 | ||||||
Forsyth County, GO, 5.000%, 03/01/25(c) | 6,825,000 | 8,135,536 | ||||||
Forsyth County School District, GO, 5.000%, 02/01/23, NATL-RE | 3,000,000 | 3,240,390 | ||||||
Forsyth County Water & Sewerage Authority, RB, 5.000%, 04/01/31, County Guaranteed | 645,000 | 769,853 | ||||||
Fulton County Development Authority, Georgia Tech Athletic Association, RB, 5.000%, 10/01/42(c) | 5,025,000 | 5,523,480 | ||||||
Fulton County Development Authority, Molecular Science Building Project, RB, 5.250%, 05/01/22, NATL-RE(c) | 2,370,000 | 2,485,822 | ||||||
Fulton County Development Authority, Robert Woodruff Arts Center, Inc., Series B, RB, 5.250%, 03/15/24 | 1,300,000 | 1,465,581 | ||||||
Georgia State, Series F, GO, 5.000%, 12/01/15 | 1,030,000 | 1,156,371 | ||||||
Georgia State, Series G, GO, 5.000%, 11/01/16 | 1,500,000 | 1,737,645 | ||||||
Georgia State, Series I, GO, 5.000%, 07/01/21 | 2,625,000 | 3,322,069 | ||||||
Georgia State Higher Education Facilities Authority, USG Real Estate Foundation I LLC, RB, 6.000%, 06/15/34 | 1,065,000 | 1,237,903 | ||||||
Glynn-Brunswick Memorial Hospital Authority, SouthEast Health System, Series A, RB, 5.500%, 08/01/28 | 1,800,000 | 2,005,452 | ||||||
Glynn-Brunswick Memorial Hospital Authority, SouthEast Health System, Series A, RB, 5.625%, 08/01/34 | 2,000,000 | 2,232,160 | ||||||
Greene County Development Authority, RB, 5.000%, 11/15/37 | 555,000 | 605,461 | ||||||
| Shares or Principal Amount($) | Value($) | |||||||
Georgia—continued | ||||||||
Gwinnett County Development Authority, Public Schools Project, COP, 5.250%, 01/01/21, Pre-refunded 01/01/2014 @ 100, NATL-RE | 2,910,000 | 3,020,609 | ||||||
Gwinnett County School District, GO, 5.000%, 02/01/20 | 1,235,000 | 1,530,079 | ||||||
Habersham County School District, GO, 5.000%, 04/01/20, State Aid Withholding | 1,520,000 | 1,861,331 | ||||||
Henry County Water & Sewerage Authority, RB, 6.150%, 02/01/20, AMBAC | 2,100,000 | 2,661,981 | ||||||
Houston County School District, Sales Tax, GO, 4.000%, 09/01/14, State Aid Withholding | 985,000 | 1,037,304 | ||||||
Lincoln County School District, GO, 5.500%, 04/01/37, State Aid Withholding | 1,000,000 | 1,154,340 | ||||||
Milledgeville & Baldwin County Development Authority, Georgia College & State University Foundation, RB, 6.000%, 09/01/33, Pre-refunded 09/01/2014 @ 101 | 2,355,000 | 2,567,609 | ||||||
Municipal Electric Authority of Georgia, RB, 5.000%, 01/01/30 | 2,115,000 | 2,439,504 | ||||||
Municipal Electric Authority of Georgia, Series A, RB, 5.000%, 01/01/21 | 2,030,000 | 2,465,577 | ||||||
Municipal Electric Authority of Georgia, Series B, RB, 4.000%, 01/01/16 | 755,000 | 822,074 | ||||||
Private Colleges & Universities Authority, Emory University, Series C, RB, 5.250%, 09/01/39 | 3,500,000 | 4,040,120 | ||||||
Richmond County Hospital Authority, University Health Services, Inc. Project, RB, 5.250%, 01/01/29 | 2,250,000 | 2,468,362 | ||||||
Thomasville Hospital Authority, John D. Archhold Memorial Hospital, RB, 5.375%, 11/01/40 | 2,510,000 | 2,752,893 | ||||||
See Notes to Financial Statements.
54
SCHEDULES OF PORTFOLIO INVESTMENTS
RIDGEWORTH FUNDS March 31, 2013
Georgia Tax-Exempt Bond Fund — concluded
| Shares or Principal Amount($) | Value($) | |||||||
Georgia—continued | ||||||||
Valdosta Board of Education, Sales Tax, GO, 3.000%, 02/01/15, State Aid Withholding | 1,180,000 | 1,234,681 | ||||||
Valdosta Board of Education, Sales Tax, GO, 4.000%, 02/01/16, State Aid Withholding | 2,340,000 | 2,560,405 | ||||||
Walton County School District, GO, 4.000%, 08/01/16, State Aid Withholding | 980,000 | 1,086,036 | ||||||
Walton County School District, Series A, GO, 5.000%, 08/01/21, Pre-refunded 08/01/2015 @ 100, NATL-RE(c) | 2,575,000 | 2,847,074 | ||||||
|
| |||||||
| 127,747,552 | ||||||||
|
| |||||||
New Jersey 0.7% | ||||||||
New Jersey Economic Development Authority, RB, 5.000%, 03/01/28 | 1,000,000 | 1,140,130 | ||||||
|
| |||||||
North Carolina 0.7% | ||||||||
North Carolina State Capital Facilities Finance Agency, Educational Facilities, RB, 5.000%, 05/01/32 | 970,000 | 1,042,702 | ||||||
|
| |||||||
Puerto Rico 2.4% | ||||||||
Puerto Rico Commonwealth Highway & Transportation Authority Highway, Series CC, RB, 5.500%, 07/01/30 | 2,560,000 | 2,559,770 | ||||||
Puerto Rico Electric Power Authority, RB, 5.125%, 07/01/29, Pre-refunded 07/01/2013 @ 100 | 1,100,000 | 1,113,926 | ||||||
Puerto Rico Sales Tax Financing Corp., Sales Tax Revenue, Series A, RB, 5.500%, 08/01/28, Pre-refunded 08/01/2019 @ 100 | 20,000 | 25,387 | ||||||
|
| |||||||
| 3,699,083 | ||||||||
|
| |||||||
Texas 2.5% | ||||||||
Plano, GO, 5.000%, 09/01/22(b) | 3,000,000 | 3,772,500 | ||||||
|
| |||||||
| Shares or Principal Amount($) | Value($) | |||||||
Virginia 1.7% | ||||||||
Virginia Small Business Financing Authority, AMT, RB, 5.000%, 07/01/34 | 1,770,000 | 1,820,445 | ||||||
Virginia Small Business Financing Authority, AMT, RB, 5.000%, 01/01/40 | 735,000 | 753,279 | ||||||
|
| |||||||
| 2,573,724 | ||||||||
|
| |||||||
Total Municipal Bonds (Cost $137,942,679) | 146,555,311 | |||||||
|
| |||||||
Money Market Fund 6.4% | ||||||||
Federated Tax-Free Obligations Fund, Institutional Shares, 0.01%(e) | 9,819,881 | 9,819,881 | ||||||
|
| |||||||
Total Money Market Fund | 9,819,881 | |||||||
|
| |||||||
Total Investments | 156,375,192 | |||||||
Liabilities in excess of other | (3,655,748 | ) | ||||||
|
| |||||||
Net Assets — 100.0% | $ | 152,719,444 | ||||||
|
| |||||||
| (a) | Step bond. The rate shown is the rate in effect as of March 31, 2013. |
| (b) | All or a portion of this security has been purchased on a when-issued or delayed-delivery basis. |
| (c) | All or a portion of this security has been segregated, or otherwise earmarked, in connection with obligations for when-issued or delayed-delivery purchase commitments. |
| (d) | Variable or floating rate security. Rate disclosed is as of March 31, 2013. |
| (e) | Rate disclosed, the 7 day net yield, is as of March 31, 2013. |
Investment Abbreviations
| AGM | — | Security guaranteed by Assured Guaranty Municipal Corporation | ||
| AMBAC | — | Security guaranteed by American Municipal Bond Assurance Corporation | ||
| AMT | — | Income subject to Alternative Minimum Tax | ||
| COP | — | Certificate of Participation | ||
| GO | — | General Obligation | ||
| NATL-RE | — | Reinsurance provided by National Public Finance Guarantee Corporation | ||
| RB | — | Revenue Bond | ||
| XLCA | — | Security guaranteed by XL Capital Assurance, Inc. |
See Notes to Financial Statements.
55
SCHEDULES OF PORTFOLIO INVESTMENTS
RIDGEWORTH FUNDS March 31, 2013
High Grade Municipal Bond Fund
| Shares or Principal Amount($) | Value($) | |||||||
| Municipal Bonds 86.6% | ||||||||
Alabama 6.3% | ||||||||
Birmingham, Series A, GO, 0.000%, 03/01/37(a)(b) | 2,000,000 | 1,798,520 | ||||||
Birmingham Special Care Facilities Financing Authority Health Care Facilities, Children’s Hospital of Alabama, RB, 6.000%, 06/01/39, AGC | 2,000,000 | 2,349,360 | ||||||
|
| |||||||
| 4,147,880 | ||||||||
|
| |||||||
Alaska 3.7% | ||||||||
Matanuska-Susitna Borough Lease, Goose Creek Correctional Center, RB, 6.000%, 09/01/28, AGC(c) | 2,000,000 | 2,467,840 | ||||||
|
| |||||||
California 16.2% | ||||||||
California State, GO, 5.000%, 02/01/43 | 2,000,000 | 2,197,160 | ||||||
California State, GO, 5.250%, 03/01/30 | 1,225,000 | 1,433,715 | ||||||
California State, GO, | 2,000,000 | 2,477,740 | ||||||
San Diego County Regional Airport Authority, Series B, AMT, RB, 5.000%, 07/01/43 | 2,000,000 | 2,170,320 | ||||||
Ventura County Public Financing Authority, Series A, 5.000%, 11/01/38 | 2,250,000 | 2,482,380 | ||||||
|
| |||||||
| 10,761,315 | ||||||||
|
| |||||||
District of Columbia 3.7% | ||||||||
District of Columbia, Income Tax, Series A, RB, 5.500%, 12/01/30 | 2,000,000 | 2,436,700 | ||||||
|
| |||||||
Georgia 5.9% | ||||||||
Fulton County Development Authority, Georgia Tech Athletic Association, RB, 5.750%, 10/01/36 | 1,250,000 | 1,445,888 | ||||||
Georgia State, Series A, GO, 5.000%, 01/01/20 | 2,000,000 | 2,480,180 | ||||||
|
| |||||||
| 3,926,068 | ||||||||
|
| |||||||
Idaho 4.4% | ||||||||
Idaho Health Facilities Authority, Series A, RB, 6.750%, 11/01/37 | 2,500,000 | 2,928,675 | ||||||
|
| |||||||
Illinois 5.3% | ||||||||
Chicago IL O’Hare International Airport Revenue, Series A, AMT, RB, 5.000%, 01/01/20 | 2,000,000 | 2,352,580 | ||||||
| Shares or Principal Amount($) | Value($) | |||||||
Illinois—continued | ||||||||
University of Illinois, Auxiliary Facilities System, Series A, RB, 5.750%, 04/01/38 | 1,000,000 | 1,126,160 | ||||||
|
| |||||||
| 3,478,740 | ||||||||
|
| |||||||
Indiana 2.3% | ||||||||
Indiana Finance Authority, RB, 5.000%, 07/01/40 | 1,500,000 | 1,557,225 | ||||||
|
| |||||||
Kansas 2.7% | ||||||||
Kansas State Development Finance Authority, Adventist Bolingbrook Hospital, RB, 5.750%, 11/15/38(c) | 1,500,000 | 1,760,520 | ||||||
|
| |||||||
Maine 4.6% | ||||||||
Maine State Turnpike Authority, RB, 6.000%, 07/01/38(c) | 2,500,000 | 3,044,325 | ||||||
|
| |||||||
Maryland 1.7% | ||||||||
Baltimore County, GO, 5.000%, 08/01/15 | 1,000,000 | 1,107,970 | ||||||
|
| |||||||
Nevada 2.5% | ||||||||
Las Vegas Valley Water District, Series B, GO, 5.000%, 06/01/37 | 1,500,000 | 1,677,705 | ||||||
|
| |||||||
New Jersey 3.5% | ||||||||
New Jersey State Transportation Trust Fund Authority, Transportation System, Series A, RB, 6.000%, 12/15/38 | 1,955,000 | 2,323,322 | ||||||
|
| |||||||
New York 1.8% | ||||||||
Erie County Industrial Development Agency, City School District Buffalo, Series A, RB, 5.750%, 05/01/29, BHAC | 1,000,000 | 1,176,100 | ||||||
|
| |||||||
North Carolina 2.8% | ||||||||
North Carolina Municipal Power Agency No 1, Series B, RB, 5.000%, 01/01/23 | 1,550,000 | 1,876,105 | ||||||
|
| |||||||
Texas 13.8% | ||||||||
Austin, Series 2005, GO, 5.000%, 09/01/19, NATL-RE | 1,000,000 | 1,087,250 | ||||||
Dallas Independent School District, GO, 6.375%, 02/15/34, PSF-GTD(c) | 4,000,000 | 4,916,000 | ||||||
See Notes to Financial Statements.
56
SCHEDULES OF PORTFOLIO INVESTMENTS
RIDGEWORTH FUNDS March 31, 2013
High Grade Municipal Bond Fund — concluded
| Shares or Principal Amount($) | Value($) | |||||||
Texas—continued | ||||||||
Harris County Health Facilities Development Authority, Memorial Hermann Healthcare System, Series B, RB, 7.125%, 12/01/31 | 1,000,000 | 1,326,610 | ||||||
Lower Colorado River Authority, Series A, RB, 5.000%, 05/15/24 | 1,500,000 | 1,781,760 | ||||||
|
| |||||||
| 9,111,620 | ||||||||
|
| |||||||
Washington 5.4% | ||||||||
Central Puget Sound Regional Transit Authority, Series A, RB, 5.000%, 11/01/23, Pre-refunded 05/01/2015 @ 100, AMBAC | 1,500,000 | 1,646,220 | ||||||
Seattle Washington Municipal Light & Power, RB, 5.750%, 04/01/29, BHAC(c) | 1,635,000 | 1,939,764 | ||||||
|
| |||||||
| 3,585,984 | ||||||||
|
| |||||||
Total Municipal Bonds | 57,368,094 | |||||||
|
| |||||||
Money Market Fund 15.4% | ||||||||
Federated Tax-Free Obligations Fund, Institutional Shares, 0.01%(d) | 10,187,447 | 10,187,447 | ||||||
|
| |||||||
Total Money Market Fund | 10,187,447 | |||||||
|
| |||||||
Total Investments | 67,555,541 | |||||||
Liabilities in excess of other | (1,301,390 | ) | ||||||
|
| |||||||
Net Assets — 100.0% | $ | 66,254,151 | ||||||
|
| |||||||
| (a) | All or a portion of this security has been purchased on a when-issued or delayed-delivery basis. |
| (b) | Step bond. The rate shown is the rate in effect as of March 31, 2013. |
| (c) | All or a portion of this security has been segregated, or otherwise earmarked, in connection with obligations for when-issued or delayed-delivery purchase commitments. |
| (d) | Rate disclosed, the 7 day net yield, is as of March 31, 2013. |
Investment Abbreviations
| AGC | — | Security guaranteed by Assured Guaranty Corporation | ||
| AMBAC | — | Security guaranteed by American Municipal Bond Assurance Corporation | ||
| AMT | — | Income subject to Alternative Minimum Tax | ||
| BHAC | — | Security guaranteed by Berkshire Hathaway Assurance Corporation | ||
| GO | — | General Obligation | ||
| NATL-RE | — | Reinsurance provided by National Public Finance Guarantee Corporation | ||
| PSF-GTD | — | Security guaranteed by Permanent School Fund Guarantee Program | ||
| RB | — | Revenue Bond |
See Notes to Financial Statements.
57
SCHEDULES OF PORTFOLIO INVESTMENTS
RIDGEWORTH FUNDS March 31, 2013
High Income Fund
| Shares or Principal Amount($) | Value($) | |||||||
Bank Loans 3.3% | ||||||||
Commercial Services 0.1% | ||||||||
ABC Supply, Bridge Term Loan, 03/28/14(a)(b)(c) | 330,000 | 330,000 | ||||||
Walter Energy, Inc., Term Loan B, 5.750%, 04/02/18(a)(d) | 953,846 | 958,882 | ||||||
|
| |||||||
| 1,288,882 | ||||||||
|
| |||||||
Energy 0.4% | ||||||||
Aventine Renewable Energy Holdings, Inc., Term Loan B, 15.000%, 12/21/15(a)(d)(e)(f) | 5,227,518 | 3,920,638 | ||||||
|
| |||||||
Food 0.2% | ||||||||
HJ Heinz Co., 2nd Lien Bridge Term Loan, 02/14/14(a)(b)(c) | 2,305,000 | 2,305,000 | ||||||
|
| |||||||
Health Care 0.0%(g) | ||||||||
Community Health Systems, Inc., Extended Term Loan, 3.784%-3.787%, 01/25/17(a)(d) | 105,909 | 106,932 | ||||||
|
| |||||||
Media 0.6% | ||||||||
Nielsen Holdings NV, Bridge Term Loan, 02/21/14(a)(b)(c) | 2,395,000 | 2,395,000 | ||||||
Tribune Co., Exit Term Loan, 4.000%, 12/31/19(a)(d) | 2,937,638 | 2,961,139 | ||||||
|
| |||||||
| 5,356,139 | ||||||||
|
| |||||||
Mining 0.1% | ||||||||
FMG America Finance, Inc., Term Loan, 5.250%, 10/18/17(a)(d) | 447,750 | 452,827 | ||||||
|
| |||||||
Oil & Gas 0.3% | ||||||||
Energy Transfer Equity, L.P., New Term Loan B, 3.750%, 03/24/17(a)(d) | 2,705,000 | 2,713,467 | ||||||
|
| |||||||
Packaging & Containers 0.3% | ||||||||
Berry Plastics Holding Corp., Term Loan D, 3.500%, 02/04/20(a)(b)(d) | 2,840,000 | 2,832,247 | ||||||
|
| |||||||
Retail 0.2% | ||||||||
Toys ‘R’ Us-Delaware, Inc., New Term Loan, 6.000%, 09/01/16(a)(d) | 1,850,256 | 1,810,161 | ||||||
|
| |||||||
Semiconductors 0.4% | ||||||||
Freescale Semiconductor, Inc., Term Loan B4, 03/02/20(a)(b)(c) | 3,880,000 | 3,888,497 | ||||||
|
| |||||||
| Shares or Principal Amount($) | Value($) | |||||||
Telecommunication Services 0.7% |
| |||||||
Alcatel-Lucent USA, Inc., USD Term Loan C, 01/31/19(a)(b)(c) | 1,291,763 | 1,310,274 | ||||||
Cequel Communications LLC, Term Loan B, 4.000%, 02/14/19(a)(d) | 1,539,450 | 1,552,920 | ||||||
Level 3 Financing, Inc., 2019 Term Loan B, 5.250%, 08/01/19(a)(d) | 965,000 | 977,304 | ||||||
Virgin Media Investment Holdings Ltd., USD Term Loan B, 02/17/20(a)(b)(c) | 2,585,000 | 2,572,566 | ||||||
|
| |||||||
| 6,413,064 | ||||||||
|
| |||||||
Total Bank Loans (Cost $32,159,492) | 31,087,854 | |||||||
|
| |||||||
Corporate Bonds 86.9% | ||||||||
Advertising 0.2% | ||||||||
MDC Partners, Inc., | 1,885,000 | 1,903,850 | ||||||
|
| |||||||
Aerospace/Defense 1.0% | ||||||||
BE Aerospace, Inc., 5.250%, 04/01/22 | 4,295,000 | 4,429,219 | ||||||
GenCorp, Inc., 7.125%, 03/15/21(a) | 1,675,000 | 1,767,125 | ||||||
Silver II Borrower/Silver II US Holdings LLC, 7.750%, 12/15/20(a) | 2,620,000 | 2,790,300 | ||||||
|
| |||||||
| 8,986,644 | ||||||||
|
| |||||||
Airlines 1.5% | ||||||||
Air Canada, Inc., | 13,135,000 | 13,988,775 | ||||||
|
| |||||||
Apparel 0.5% | ||||||||
Wolverine World Wide, Inc., 6.125%, 10/15/20(a) | 4,410,000 | 4,680,112 | ||||||
|
| |||||||
Auto Manufacturers 0.0%(a)(g) | ||||||||
General Motors Co. Escrow, | 17,182,000 | — | ||||||
General Motors Co. Escrow, | 36,800,000 | — | ||||||
|
| |||||||
| — | ||||||||
|
| |||||||
Auto Parts & Equipment 0.7% | ||||||||
Delphi Corp., 5.000%, 02/15/23 | 3,275,000 | 3,463,312 | ||||||
Lear Corp., 4.750%, 01/15/23(a) | 2,820,000 | 2,749,500 | ||||||
|
| |||||||
| 6,212,812 | ||||||||
|
| |||||||
See Notes to Financial Statements.
58
SCHEDULES OF PORTFOLIO INVESTMENTS
RIDGEWORTH FUNDS March 31, 2013
High Income Fund — continued
| Shares or Principal Amount($) | Value($) | |||||||
Banks 1.8% | ||||||||
Ally Financial, Inc., 7.500%, 09/15/20(k) | 4,490,000 | 5,477,800 | ||||||
Ally Financial, Inc., 8.000%, 11/01/31(k) | 7,345,000 | 9,291,425 | ||||||
Provident Funding Associates LP/PFG Finance Corp., 10.125%, 02/15/19(a) | 1,645,000 | 1,793,050 | ||||||
|
| |||||||
| 16,562,275 | ||||||||
|
| |||||||
Building Materials 1.1% | ||||||||
Cemex Finance LLC, | 2,825,000 | 3,284,063 | ||||||
Gibraltar Industries, Inc., 6.250%, 02/01/21(a) | 1,270,000 | 1,346,200 | ||||||
Masco Corp., 5.950%, 03/15/22 | 2,640,000 | 2,969,559 | ||||||
USG Corp., 8.375%, 10/15/18(a) | 855,000 | 944,775 | ||||||
USG Corp., 9.750%, 01/15/18 | 1,135,000 | 1,344,975 | ||||||
|
| |||||||
| 9,889,572 | ||||||||
|
| |||||||
Chemicals 0.9% | ||||||||
Ineos Finance PLC, | 3,985,000 | 4,338,669 | ||||||
Kinove German Bondco GmbH, | 988,000 | 1,099,150 | ||||||
Nufarm Australia Ltd., | 1,630,000 | 1,670,750 | ||||||
PetroLogistics LP/PetroLogistics Finance Corp., 6.250%, 04/01/20(a) | 1,600,000 | 1,610,000 | ||||||
|
| |||||||
| 8,718,569 | ||||||||
|
| |||||||
Coal 0.4% | ||||||||
Peabody Energy Corp., 6.250%, 11/15/21(h) | 3,005,000 | 3,125,200 | ||||||
Walter Energy, Inc., | 1,075,000 | 1,101,875 | ||||||
|
| |||||||
| 4,227,075 | ||||||||
|
| |||||||
Commercial Services 4.9% | ||||||||
Avis Budget Car Rental LLC/Avis Budget Finance, Inc., 9.625%, 03/15/18(h) | 660,000 | 744,982 | ||||||
Cenveo Corp., 11.500%, 05/15/17(h) | 5,815,000 | 5,044,512 | ||||||
FTI Consulting, Inc., | 2,045,000 | 2,162,588 | ||||||
Harland Clarke Holdings Corp., 9.750%, 08/01/18(a)(h) | 12,520,000 | 13,271,200 | ||||||
Lender Processing Services, Inc., 5.750%, 04/15/23 | 2,835,000 | 2,955,488 | ||||||
| Shares or Principal Amount($) | Value($) | |||||||
Commercial Services—continued |
| |||||||
Live Nation Entertainment, Inc., 7.000%, 09/01/20(a) | 1,245,000 | 1,338,375 | ||||||
Monitronics International, Inc., 9.125%, 04/01/20 | 3,755,000 | 3,970,912 | ||||||
Prospect Medical Holdings, Inc., 8.375%, 05/01/19(a) | 4,577,000 | 4,874,505 | ||||||
ServiceMaster Co., 8.000%, 02/15/20(h) | 3,545,000 | 3,802,012 | ||||||
United Rentals North America, Inc., 7.375%, 05/15/20 | 4,315,000 | 4,789,650 | ||||||
United Rentals North America, Inc., 7.625%, 04/15/22 | 2,135,000 | 2,385,863 | ||||||
|
| |||||||
| 45,340,087 | ||||||||
|
| |||||||
Computers 1.3% | ||||||||
Brocade Communications Systems, Inc., 4.625%, 01/15/23(a) | 815,000 | 788,513 | ||||||
j2 Global, Inc., 8.000%, 08/01/20 | 4,020,000 | 4,281,300 | ||||||
NCR Corp., 4.625%, 02/15/21(a) | 4,505,000 | 4,482,475 | ||||||
NCR Corp., 5.000%, 07/15/22(a)(h) | 2,285,000 | 2,290,712 | ||||||
|
| |||||||
| 11,843,000 | ||||||||
|
| |||||||
Diversified Financial Services 4.8% |
| |||||||
Aircastle Ltd.,6.750%, 04/15/17 | 3,090,000 | 3,399,000 | ||||||
Aircastle Ltd.,7.625%, 04/15/20 | 3,055,000 | 3,536,162 | ||||||
CNG Holdings, Inc., 9.375%, 05/15/20(a) | 2,740,000 | 2,688,625 | ||||||
Community Choice Financial, Inc., 10.750%, 05/01/19 | 2,585,000 | 2,449,288 | ||||||
Icahn Enterprises Finance Corp., 8.000%, 01/15/18 | 4,630,000 | 4,954,100 | ||||||
International Lease Finance Corp., 6.250%, 05/15/19 | 4,335,000 | 4,746,825 | ||||||
International Lease Finance Corp., 8.250%, 12/15/20 | 1,405,000 | 1,721,125 | ||||||
International Lease Finance Corp., 8.750%, 03/15/17 | 7,430,000 | 8,739,537 | ||||||
Jefferies Finance LLC/JFIN Co-Issuer Corp., 7.375%, 04/01/20(a) | 2,610,000 | 2,655,675 | ||||||
Nationstar Mortgage LLC/Nationstar Capital Corp., 7.875%, 10/01/20(a) | 1,910,000 | 2,110,550 | ||||||
See Notes to Financial Statements.
59
SCHEDULES OF PORTFOLIO INVESTMENTS
RIDGEWORTH FUNDS March 31, 2013
High Income Fund — continued
| Shares or Principal Amount($) | Value($) | |||||||
Diversified Financial Services—continued |
| |||||||
Nationstar Mortgage LLC/Nationstar Capital Corp., 9.625%, 05/01/19(a) | 1,645,000 | 1,875,300 | ||||||
Oxford Finance LLC/Oxford Finance Co-Issuer, Inc., 7.250%, 01/15/18(a) | 1,655,000 | 1,717,063 | ||||||
Serta Simmons Holdings LLC, 8.125%, 10/01/20(a) | 3,420,000 | 3,552,525 | ||||||
|
| |||||||
| 44,145,775 | ||||||||
|
| |||||||
Electric 1.9% | ||||||||
Calpine Corp., 7.250%, 10/15/17(a) | 1,895,000 | 2,008,700 | ||||||
Energy Future Intermediate Holding Co. LLC/EFIH Finance, Inc., 10.000%, 12/01/20(a) | 2,145,000 | 2,413,125 | ||||||
GenOn Energy, Inc., | 3,630,000 | 4,274,325 | ||||||
GenOn Energy, Inc., 9.875%, 10/15/20 | 810,000 | 927,450 | ||||||
Midwest Generation LLC, Series B, 8.560%, 01/02/16(e)(h) | 5,312,265 | 5,206,020 | ||||||
NRG Energy, Inc., 7.625%, 05/15/19 | 2,375,000 | 2,565,000 | ||||||
|
| |||||||
| 17,394,620 | ||||||||
|
| |||||||
Electrical Components & Equipment 0.4% |
| |||||||
General Cable Corp., | 1,830,000 | 1,866,600 | ||||||
GrafTech International Ltd., 6.375%, 11/15/20(a) | 1,450,000 | 1,500,750 | ||||||
|
| |||||||
| 3,367,350 | ||||||||
|
| |||||||
Electronics 1.2% | ||||||||
313 Group, Inc., 6.375%, 12/01/19(a)(h) | 7,670,000 | 7,612,475 | ||||||
313 Group, Inc., 8.750%, 12/01/20(a)(h) | 3,445,000 | 3,483,756 | ||||||
|
| |||||||
| 11,096,231 | ||||||||
|
| |||||||
Energy-Alternate Sources 0.2% |
| |||||||
First Wind Capital LLC, 10.250%, 06/01/18(a) | 1,600,000 | 1,700,000 | ||||||
|
| |||||||
Engineering & Construction 0.5% |
| |||||||
Aguila 3 SA, 7.875%, 01/31/18(a) | 4,190,000 | 4,493,775 | ||||||
|
| |||||||
Entertainment 2.0% | ||||||||
Carmike Cinemas, Inc., 7.375%, 05/15/19 | 1,310,000 | 1,437,725 | ||||||
| Shares or Principal Amount($) | Value($) | |||||||
Entertainment—continued | ||||||||
Cedar Fair LP/Canada’s Wonderland Co./Magnum Management Corp., 5.250%, 03/15/21(a) | 1,935,000 | 1,922,906 | ||||||
Cinemark USA, Inc., | 795,000 | 798,975 | ||||||
Diamond Resorts Corp., 12.000%, 08/15/18(k) | 11,325,000 | 12,514,125 | ||||||
Pinnacle Entertainment, Inc., 7.750%, 04/01/22 | 1,170,000 | 1,256,287 | ||||||
Pinnacle Entertainment, Inc., 8.750%, 05/15/20(h) | 750,000 | 824,063 | ||||||
|
| |||||||
| 18,754,081 | ||||||||
|
| |||||||
Environmental Control 0.9% | ||||||||
Clean Harbors, Inc., | 1,100,000 | 1,126,125 | ||||||
Clean Harbors, Inc., 5.250%, 08/01/20 | 2,155,000 | 2,225,037 | ||||||
Heckmann Corp., 9.875%, 04/15/18(a) | 1,435,000 | 1,522,894 | ||||||
Heckmann Corp., 9.875%, 04/15/18(h) | 3,720,000 | 3,975,750 | ||||||
|
| |||||||
| 8,849,806 | ||||||||
|
| |||||||
Food 3.1% | ||||||||
Hawk Acquisition Sub, Inc., 4.250%, 10/15/20(a)(b) | 25,080,000 | 25,111,350 | ||||||
Post Holdings, Inc., 7.375%, 02/15/22 | 3,445,000 | 3,767,969 | ||||||
|
| |||||||
| 28,879,319 | ||||||||
|
| |||||||
Forest Products & Paper 0.6% | ||||||||
Verso Paper Holdings LLC/Verso Paper, Inc., 11.750%, 01/15/19(h) | 6,625,000 | 5,366,250 | ||||||
|
| |||||||
Gas 0.4% | ||||||||
Sabine Pass LNG LP, 6.500%, 11/01/20(a) | 2,230,000 | 2,347,075 | ||||||
Sabine Pass LNG LP, 7.500%, 11/30/16 | 1,565,000 | 1,729,325 | ||||||
|
| |||||||
| 4,076,400 | ||||||||
|
| |||||||
Hand/Machine Tools 0.3% | ||||||||
Milacron LLC/Mcron Finance Corp., 7.750%, 02/15/21(a) | 2,619,000 | 2,707,391 | ||||||
|
| |||||||
Healthcare-Products 1.6% | ||||||||
Biomet, Inc., 6.500%, 08/01/20(a) | 4,750,000 | 5,040,937 | ||||||
Kinetic Concepts, Inc./KCI USA, Inc., 10.500%, 11/01/18 | 2,205,000 | 2,386,913 | ||||||
See Notes to Financial Statements.
60
SCHEDULES OF PORTFOLIO INVESTMENTS
RIDGEWORTH FUNDS March 31, 2013
High Income Fund — continued
| Shares or Principal Amount($) | Value($) | |||||||
Healthcare-Products—continued |
| |||||||
Physio-Control International, Inc., 9.875%, 01/15/19(a) | 6,450,000 | 7,272,375 | ||||||
|
| |||||||
| 14,700,225 | ||||||||
|
| |||||||
Healthcare-Services 2.1% | ||||||||
CDRT Holding Corp., PIK, 9.250%, 10/01/17(a) | 4,530,000 | 4,699,875 | ||||||
CHS/Community Health Systems, Inc., 5.125%, 08/15/18 | 4,275,000 | 4,478,063 | ||||||
HCA, Inc., 6.250%, 02/15/21 | 5,145,000 | 5,485,856 | ||||||
MedImpact Holdings, Inc., 10.500%, 02/01/18(a) | 4,375,000 | 4,878,125 | ||||||
|
| |||||||
| 19,541,919 | ||||||||
|
| |||||||
Holding Companies-Diversified 0.9% |
| |||||||
MMI International Ltd., 8.000%, 03/01/17(a) | 3,440,000 | 3,526,000 | ||||||
WaveDivision Escrow LLC/WaveDivision Escrow Corp., 8.125%, 09/01/20(a) | 4,285,000 | 4,477,825 | ||||||
|
| |||||||
| 8,003,825 | ||||||||
|
| |||||||
Home Builders 0.1% | ||||||||
KB Home, 7.500%, 09/15/22 | 850,000 | 954,125 | ||||||
|
| |||||||
Household Products/Wares 0.7% |
| |||||||
Reynolds Group Issuer, Inc./Reynolds Group Issuer LLC/Reynolds Group Issuer Luxembourg I SA, 7.875%, 08/15/19(h) | 4,875,000 | 5,374,687 | ||||||
Spectrum Brands Escrow Corp., 6.375%, 11/15/20(a) | 710,000 | 762,363 | ||||||
Spectrum Brands Escrow Corp., 6.625%, 11/15/22(a)(h) | 710,000 | 770,350 | ||||||
|
| |||||||
| 6,907,400 | ||||||||
|
| |||||||
Housewares 0.7% | ||||||||
Libbey Glass, Inc., 6.875%, 05/15/20 | 6,125,000 | 6,607,344 | ||||||
|
| |||||||
Insurance 1.0% | ||||||||
Assured Guaranty Municipal Holdings, Inc., 6.400%, 12/15/66(a)(d) | 3,060,000 | 2,769,300 | ||||||
Assured Guaranty US Holdings, Inc., Series A, 6.400%, 12/15/66(d)(h) | 2,370,000 | 2,215,950 | ||||||
Genworth Financial, Inc., 6.150%, 11/15/66(d) | 1,975,000 | 1,807,125 | ||||||
MBIA, Inc., 6.625%, 10/01/28(h) | 2,650,000 | 2,093,500 | ||||||
|
| |||||||
| 8,885,875 | ||||||||
|
| |||||||
| Shares or Principal Amount($) | Value($) | |||||||
Internet 1.2% | ||||||||
CyrusOne LP/CyrusOne Finance Corp., 6.375%, 11/15/22(a) | 790,000 | 827,525 | ||||||
Equinix, Inc., 4.875%, 04/01/20 | 2,240,000 | 2,256,800 | ||||||
Equinix, Inc., 5.375%, 04/01/23 | 1,105,000 | 1,118,813 | ||||||
Mood Media Corp., | 2,355,000 | 2,572,837 | ||||||
Zayo Escrow Corp., | 4,175,000 | 4,676,000 | ||||||
|
| |||||||
| 11,451,975 | ||||||||
|
| |||||||
Iron/Steel 0.2% | ||||||||
JMC Steel Group, | 1,610,000 | 1,706,600 | ||||||
|
| |||||||
Leisure Time 0.3% | ||||||||
ClubCorp Club Operations, Inc., 10.000%, 12/01/18 | 640,000 | 723,200 | ||||||
Viking Cruises Ltd., 8.500%, 10/15/22(a) | 1,505,000 | 1,655,500 | ||||||
|
| |||||||
| 2,378,700 | ||||||||
|
| |||||||
Lodging 1.5% | ||||||||
Caesars Entertainment Operating Co., Inc., 8.500%, 02/15/20 | 3,930,000 | 3,880,875 | ||||||
Chester Downs & Marina LLC, 9.250%, 02/01/20(a)(h) | 595,000 | 568,225 | ||||||
Downstream Development Authority of the Quapaw Tribe of Oklahoma, 10.500%, 07/01/19(a) | 4,490,000 | 4,983,900 | ||||||
MGM Resorts International, 6.750%, 10/01/20(a) | 1,640,000 | 1,738,400 | ||||||
MGM Resorts International, 7.625%, 01/15/17 | 2,325,000 | 2,580,750 | ||||||
|
| |||||||
| 13,752,150 | ||||||||
|
| |||||||
Machinery-Diversified 0.1% | ||||||||
Manitowoc Co., Inc. (The), 8.500%, 11/01/20 | 790,000 | 892,700 | ||||||
|
| |||||||
Media 5.7% | ||||||||
Block Communications, Inc., 7.250%, 02/01/20(a) | 2,690,000 | 2,925,375 | ||||||
CCO Holdings LLC/Cap Corp., 5.125%, 02/15/23 | 2,870,000 | 2,783,900 | ||||||
CCO Holdings LLC/Cap Corp., 5.250%, 09/30/22 | 5,400,000 | 5,305,500 | ||||||
CCO Holdings LLC/Cap Corp., 7.375%, 06/01/20 | 585,000 | 648,619 | ||||||
See Notes to Financial Statements.
61
SCHEDULES OF PORTFOLIO INVESTMENTS
RIDGEWORTH FUNDS March 31, 2013
High Income Fund — continued
| Shares or Principal Amount($) | Value($) | |||||||
Media—continued | ||||||||
Cequel Communications Holdings I LLC, 6.375%, 09/15/20(a) | 1,200,000 | 1,245,000 | ||||||
Clear Channel Worldwide Holdings, Inc., Series A, 6.500%, 11/15/22(a) | 2,560,000 | 2,668,800 | ||||||
Clear Channel Worldwide Holdings, Inc., Series B, 6.500%, 11/15/22(a) | 6,930,000 | 7,311,150 | ||||||
Clear Channel Worldwide Holdings, Inc., Series B, 7.625%, 03/15/20 | 1,895,000 | 1,977,906 | ||||||
DISH DBS Corp., 5.875%, 07/15/22 | 6,365,000 | 6,675,294 | ||||||
Entravision Communications Corp., 8.750%, 08/01/17 | 5,667,000 | 6,148,695 | ||||||
LIN Television Corp., 6.375%, 01/15/21(a) | 1,195,000 | 1,272,675 | ||||||
McGraw-Hill Global Education Holdings LLC/McGraw-Hill Global Education Finance, 9.750%, 04/01/21(a) | 1,675,000 | 1,658,250 | ||||||
Mediacom Broadband LLC/Mediacom Broadband Corp., 6.375%, 04/01/23(a) | 3,675,000 | 3,812,812 | ||||||
Sirius XM Radio, Inc., 5.250%, 08/15/22(a)(h) | 2,005,000 | 2,050,113 | ||||||
Univision Communications, Inc., 6.750%, 09/15/22(a) | 4,340,000 | 4,687,200 | ||||||
Videotron Ltd., 5.000%, 07/15/22 | 1,985,000 | 2,014,775 | ||||||
|
| |||||||
| 53,186,064 | ||||||||
|
| |||||||
Mining 3.2% | ||||||||
FMG Resources August 2006 Pty Ltd., 8.250%, 11/01/19(a)(h) | 7,880,000 | 8,500,550 | ||||||
HudBay Minerals, Inc., 9.500%, 10/01/20 | 2,850,000 | 3,113,625 | ||||||
Inmet Mining Corp., | 6,525,000 | 7,063,312 | ||||||
Inmet Mining Corp., | 7,945,000 | 8,818,950 | ||||||
New Gold, Inc., 6.250%, 11/15/22(a) | 1,265,000 | 1,325,088 | ||||||
Vulcan Materials Co., 7.500%, 06/15/21 | 940,000 | 1,106,850 | ||||||
|
| |||||||
| 29,928,375 | ||||||||
|
| |||||||
Miscellaneous Manufacturer 1.1% |
| |||||||
Bombardier, Inc., 4.250%, 01/15/16(a) | 2,915,000 | 3,024,313 | ||||||
| Shares or Principal Amount($) | Value($) | |||||||
Miscellaneous Manufacturer—continued |
| |||||||
Bombardier, Inc., 5.750%, 03/15/22(a) | 1,065,000 | 1,092,956 | ||||||
Bombardier, Inc., 6.125%, 01/15/23(a) | 5,830,000 | 6,048,625 | ||||||
|
| |||||||
| 10,165,894 | ||||||||
|
| |||||||
Oil & Gas 10.4% | ||||||||
Atlas Energy Holdings Operating Co. LLC/Atlas Resource Finance Corp., 7.750%, 01/15/21(a) | 8,250,000 | 7,920,000 | ||||||
Chesapeake Energy Corp., 6.625%, 08/15/20(h) | 2,935,000 | 3,206,488 | ||||||
CITGO Petroleum Corp., 11.500%, 07/01/17(a) | 4,155,000 | 4,762,669 | ||||||
EP Energy LLC/Everest Acquisition Finance, Inc., 6.875%, 05/01/19 | 1,775,000 | 1,943,625 | ||||||
EP Energy LLC/Everest Acquisition Finance, Inc., 7.750%, 09/01/22(h) | 790,000 | 872,950 | ||||||
Halcon Resources Corp., 8.875%, 05/15/21(a)(h) | 6,355,000 | 6,847,512 | ||||||
Hercules Offshore, Inc., 7.125%, 04/01/17(a) | 4,954,000 | 5,337,935 | ||||||
Linn Energy LLC/Finance Corp., 8.625%, 04/15/20 | 855,000 | 942,638 | ||||||
MEG Energy Corp., | 2,880,000 | 2,995,200 | ||||||
Oasis Petroleum, Inc., 6.875%, 01/15/23 | 2,470,000 | 2,717,000 | ||||||
Offshore Group Investment Ltd., 7.125%, 04/01/23(a) | 3,175,000 | 3,246,437 | ||||||
Offshore Group Investment Ltd., 7.500%, 11/01/19(a)(h) | 3,925,000 | 4,160,500 | ||||||
Plains Exploration & Production Co., 6.125%, 06/15/19 | 4,395,000 | 4,812,525 | ||||||
Plains Exploration & Production Co., 6.625%, 05/01/21 | 3,330,000 | 3,663,000 | ||||||
Plains Exploration & Production Co., 6.875%, 02/15/23 | 12,160,000 | 13,771,200 | ||||||
Range Resources Corp., 5.000%, 03/15/23(a) | 3,270,000 | 3,343,575 | ||||||
SandRidge Energy, Inc., 7.500%, 03/15/21 | 6,430,000 | 6,687,200 | ||||||
Seadrill Ltd., 5.625%, 09/15/17(a) | 2,000,000 | 2,020,000 | ||||||
United Refining Co., | 13,204,000 | 14,920,520 | ||||||
See Notes to Financial Statements.
62
SCHEDULES OF PORTFOLIO INVESTMENTS
RIDGEWORTH FUNDS March 31, 2013
High Income Fund — continued
| Shares or Principal Amount($) | Value($) | |||||||
Oil & Gas—continued | ||||||||
WPX Energy, Inc., 6.000%, 01/15/22 | 2,000,000 | 2,095,000 | ||||||
|
| |||||||
| 96,265,974 | ||||||||
|
| |||||||
Oil & Gas Services 1.5% | ||||||||
American Petroleum Tankers LLC, 10.250%, 05/01/15 | 453,000 | 467,723 | ||||||
Cie Generale de Geophysique-Veritas, 6.500%, 06/01/21 | 5,100,000 | 5,355,000 | ||||||
Exterran Partners LP/EXLP Finance Corp., 6.000%, 04/01/21(a) | 1,865,000 | 1,858,006 | ||||||
Hornbeck Offshore Services, Inc., 5.000%, 03/01/21(a) | 1,960,000 | 1,945,300 | ||||||
Oil States International, Inc., 5.125%, 01/15/23(a) | 2,375,000 | 2,375,000 | ||||||
Oil States International, Inc., 6.500%, 06/01/19 | 2,140,000 | 2,289,800 | ||||||
|
| |||||||
| 14,290,829 | ||||||||
|
| |||||||
Packaging & Containers 0.8% | ||||||||
Crown Americas LLC/Crown Americas Capital Corp. IV, 4.500%, 01/15/23(a) | 4,140,000 | 4,015,800 | ||||||
Sealed Air Corp., 5.250%, 04/01/23(a) | 2,235,000 | 2,243,381 | ||||||
Sealed Air Corp., 6.500%, 12/01/20(a) | 970,000 | 1,062,150 | ||||||
|
| |||||||
| 7,321,331 | ||||||||
|
| |||||||
Pharmaceuticals 1.1% | ||||||||
ConvaTec Healthcare, 10.500%, 12/15/18(a)(k) | 8,920,000 | 9,923,500 | ||||||
Valeant Pharmaceuticals International, 6.500%, 07/15/16(a) | 275,000 | 287,031 | ||||||
|
| |||||||
| 10,210,531 | ||||||||
|
| |||||||
Pipelines 1.3% | ||||||||
Atlas Pipeline Partners LP/Atlas Pipeline Finance Corp., 5.875%, 08/01/23(a) | 1,955,000 | 1,945,225 | ||||||
Eagle Rock Energy Partners LP/Eagle Rock Energy Finance Corp., 8.375%, 06/01/19 | 2,405,000 | 2,537,275 | ||||||
Sabine Pass Liquefaction LLC, 5.625%, 02/01/21(a)(h) | 7,165,000 | 7,433,687 | ||||||
|
| |||||||
| 11,916,187 | ||||||||
|
| |||||||
Real Estate 0.7% | ||||||||
CBRE Services, Inc., 5.000%, 03/15/23 | 6,540,000 | 6,613,575 | ||||||
|
| |||||||
| Shares or Principal Amount($) | Value($) | |||||||
Real Estate Investment Trust 0.3% |
| |||||||
Felcor Lodging LP, 5.625%, 03/01/23(a)(h) | 2,395,000 | 2,439,906 | ||||||
Host Hotels & Resorts LP, 3.750%, 10/15/23 | 760,000 | 762,972 | ||||||
|
| |||||||
| 3,202,878 | ||||||||
|
| |||||||
Retail 3.4% | ||||||||
Bon-Ton Department Stores, Inc. (The), | 2,650,000 | 2,653,313 | ||||||
Claire’s Stores, Inc., | 1,410,000 | 1,593,300 | ||||||
Coinstar, Inc., 6.000%, 03/15/19(a) | 1,540,000 | 1,574,650 | ||||||
Dufry Finance SCA, 5.500%, 10/15/20(a) | 825,000 | 855,966 | ||||||
Landry’s Holdings II, Inc., 10.250%, 01/01/18(a)(h) | 2,720,000 | 2,849,200 | ||||||
Landry’s, Inc., 9.375%, 05/01/20(a) | 4,205,000 | 4,530,887 | ||||||
Limited Brands, Inc., 5.625%, 02/15/22 | 1,800,000 | 1,908,000 | ||||||
Party City Holdings, Inc., 8.875%, 08/01/20(a)(h) | 2,905,000 | 3,188,238 | ||||||
Sally Holdings LLC/Sally Capital, Inc., 5.750%, 06/01/22 | 5,675,000 | 5,923,281 | ||||||
Sears Holdings Corp., 6.625%, 10/15/18(h) | 4,200,000 | 4,089,750 | ||||||
Toys R Us, Inc., 7.375%, 10/15/18 | 1,400,000 | 1,235,500 | ||||||
Toys R Us, Inc., 10.375%, 08/15/17 | 1,175,000 | 1,191,156 | ||||||
|
| |||||||
| 31,593,241 | ||||||||
|
| |||||||
Semiconductors 0.4% | ||||||||
Advanced Micro Devices, Inc., 7.500%, 08/15/22(a) | 805,000 | 730,538 | ||||||
Advanced Micro Devices, Inc., 7.750%, 08/01/20 | 825,000 | 759,000 | ||||||
NXP BV/NXP Funding LLC, 5.750%, 03/15/23(a) | 2,325,000 | 2,371,500 | ||||||
|
| |||||||
| 3,861,038 | ||||||||
|
| |||||||
Shipbuilding 0.4% | ||||||||
Huntington Ingalls Industries, Inc., 6.875%, 03/15/18 | 1,425,000 | 1,549,688 | ||||||
Huntington Ingalls Industries, Inc., 7.125%, 03/15/21 | 2,300,000 | 2,501,250 | ||||||
|
| |||||||
| 4,050,938 | ||||||||
|
| |||||||
Software 0.6% | ||||||||
First Data Corp., 6.750%, 11/01/20(a) | 5,065,000 | 5,280,262 | ||||||
|
| |||||||
See Notes to Financial Statements.
63
SCHEDULES OF PORTFOLIO INVESTMENTS
RIDGEWORTH FUNDS March 31, 2013
High Income Fund — continued
| Shares or Principal Amount($) | Value($) | |||||||
Storage/Warehousing 0.7% | ||||||||
Niska Gas Storage US LLC/Niska Gas Storage Canada ULC, 8.875%, 03/15/18 | 5,995,000 | 6,249,787 | ||||||
|
| |||||||
Telecommunication Services 12.9% |
| |||||||
CenturyLink, Inc., 5.625%, 04/01/20 | 4,160,000 | 4,253,600 | ||||||
Frontier Communications Corp., 7.625%, 04/15/24(b) | 295,000 | 303,481 | ||||||
Intelsat Jackson Holdings SA, 7.250%, 10/15/20 | 4,280,000 | 4,702,650 | ||||||
Intelsat Luxembourg SA, 7.750%, 06/01/21(a)(b) | 4,000,000 | 4,070,000 | ||||||
Level 3 Financing, Inc., 8.125%, 07/01/19(h) | 5,985,000 | 6,583,500 | ||||||
Level 3 Financing, Inc., 8.625%, 07/15/20 | 3,855,000 | 4,298,325 | ||||||
Lynx I Corp., 5.375%, 04/15/21(a) | 1,925,000 | 2,002,000 | ||||||
Lynx II Corp., 6.375%, 04/15/23(a) | 3,625,000 | 3,797,187 | ||||||
MetroPCS Wireless, Inc., 6.250%, 04/01/21(a) | 3,740,000 | 3,805,450 | ||||||
MetroPCS Wireless, Inc., 6.625%, 04/01/23(a) | 4,250,000 | 4,335,000 | ||||||
NII Capital Corp., 7.625%, 04/01/21 | 3,995,000 | 2,876,400 | ||||||
NII International Telecom S.A.R.L., 11.375%, 08/15/19(a) | 3,705,000 | 3,871,725 | ||||||
Nortel Networks Ltd., 10.750%, 07/15/16(e)(h)(k) | 8,580,000 | 9,802,650 | ||||||
Sable International Finance Ltd., 8.750%, 02/01/20(a)(h) | 1,770,000 | 2,000,100 | ||||||
Satmex Escrow SA de CV, 9.500%, 05/15/17(h)(k) | 8,770,000 | 9,296,200 | ||||||
SBA Telecommunications, Inc., 5.750%, 07/15/20(a) | 4,415,000 | 4,591,600 | ||||||
Sprint Capital Corp., 6.875%, 11/15/28 | 3,545,000 | 3,624,763 | ||||||
Sprint Capital Corp., | 10,364,000 | 11,374,490 | ||||||
Sprint Nextel Corp., | 4,175,000 | 4,592,500 | ||||||
Trilogy International Partners LLC, 10.250%, 08/15/16(a)(h) | 7,855,000 | 7,697,900 | ||||||
Tw telecom holdings, Inc., 5.375%, 10/01/22 | 3,985,000 | 4,154,362 | ||||||
UPCB Finance V Ltd., 7.250%, 11/15/21(a) | 3,300,000 | 3,646,500 | ||||||
| Shares or Principal Amount($) | Value($) | |||||||
Telecommunication Services—continued |
| |||||||
US West Capital Funding, Inc., 6.875%, 07/15/28 | 1,490,000 | 1,436,256 | ||||||
ViaSat, Inc., 6.875%, 06/15/20 | 3,945,000 | 4,231,012 | ||||||
West Corp., 7.875%, 01/15/19 | 755,000 | 804,075 | ||||||
Wind Acquisition Finance Holdings, PIK, 12.250%, 07/15/17(a)(h) | 3,055,951 | 3,099,159 | ||||||
Wind Acquisition Finance SA, 7.250%, 02/15/18(a) | 1,775,000 | 1,848,219 | ||||||
Windstream Corp., | 2,865,000 | 2,843,513 | ||||||
|
| |||||||
| 119,942,617 | ||||||||
|
| |||||||
Transportation 1.1% | ||||||||
Bristow Group, Inc., 6.250%, 10/15/22 | 2,005,000 | 2,165,400 | ||||||
CHC Helicopter SA, 9.250%, 10/15/20 | 5,675,000 | 6,033,234 | ||||||
Martin Midstream Partners LP/Martin Midstream Finance Corp., 7.250%, 02/15/21(a) | 1,920,000 | 1,939,200 | ||||||
|
| |||||||
| 10,137,834 | ||||||||
|
| |||||||
Trucking & Leasing 0.3% | ||||||||
Aviation Capital Group Corp., 4.625%, 01/31/18(a) | 3,005,000 | 3,100,195 | ||||||
|
| |||||||
Total Corporate Bonds (Cost $761,699,001) | 806,284,157 | |||||||
|
| |||||||
| Convertible Corporate Bond 0.2% | ||||||||
Auto Parts & Equipment 0.2% | ||||||||
Meritor, Inc., 4.625%, 03/01/26(d)(h) | 2,145,000 | 2,080,650 | ||||||
|
| |||||||
Total Convertible Corporate Bond | 2,080,650 | |||||||
|
| |||||||
| Preferred Stock 0.4% | ||||||||
Diversified Financial Services 0.4% |
| |||||||
GMAC Capital Trust I, Series 2, | 121,110 | 3,294,192 | ||||||
|
| |||||||
Total Preferred Stock | 3,294,192 | |||||||
|
| |||||||
| Convertible Preferred Stock 0.8% | ||||||||
Auto Manufacturers 0.8% | ||||||||
General Motors Co., Series B, 4.750%, 12/01/13(h) | 166,615 | 7,154,448 | ||||||
|
| |||||||
Total Convertible Preferred Stock | 7,154,448 | |||||||
|
| |||||||
See Notes to Financial Statements.
64
SCHEDULES OF PORTFOLIO INVESTMENTS
RIDGEWORTH FUNDS March 31, 2013
High Income Fund — concluded
| Shares or Principal Amount($) | Value($) | |||||||
| Common Stock 0.1% | ||||||||
Energy-Alternate Sources 0.1% |
| |||||||
Aventine Renewable Energy Holdings, Inc.*(e)(f) | 52,974 | 794,610 | ||||||
|
| |||||||
Total Common Stock | 794,610 | |||||||
|
| |||||||
Short-Term Investment 7.6% | ||||||||
RidgeWorth Funds Securities Lending Joint Account(l) | 70,317,458 | 70,317,458 | ||||||
|
| |||||||
Total Short-Term Investment (Cost $70,317,458) | 70,317,458 | |||||||
|
| |||||||
Money Market Fund 7.2% | ||||||||
State Street Institutional Treasury Money Market Fund, Institutional Class, 0.00%(m) | 67,039,336 | 67,039,336 | ||||||
|
| |||||||
Total Money Market Fund | 67,039,336 | |||||||
|
| |||||||
Total Investments |
| 988,052,705 | ||||||
Liabilities in excess of other assets — (6.5)% | (60,220,913 | ) | ||||||
|
| |||||||
Net Assets — 100.0% | $ | 927,831,792 | ||||||
|
| |||||||
| * | Non-income producing security. |
| (a) | Rule 144A, Section 4(2) or other security which is restricted as to resale to institutional investors. The Fund’s investment adviser/subadviser has deemed this security to be liquid based upon procedures approved by the Board of Trustees. These securities represent 47.9% of net assets as of March 31, 2013. |
| (b) | All or a portion of this security has been purchased on a when-issued or delayed-delivery basis. |
| (c) | The security does not have a stated settlement date and will receive a rate upon settling with the custodian. |
| (d) | Variable or floating rate security. Rate disclosed is as of March 31, 2013. |
| (e) | Security is in default. |
| (f) | The Fund’s investment adviser/subadviser has deemed this security to be illiquid based upon procedures approved by the Board of Trustees. |
| (g) | Less than 0.05% of Net Assets. |
| (h) | The security or a partial position of the security was on loan as of March 31, 2013. The total value of securities on loan as of March 31, 2013 was $68,530,873. |
| (i) | Valued at fair value using procedures approved by the Board of Trustees. (See Note 2(a)) |
| (j) | Security is perpetual in nature and has no stated maturity. |
| (k) | All or a portion of this security has been segregated, or otherwise earmarked, in connection with obligations for when-issued or delayed-delivery purchase commitments. |
| (l) | Purchased with cash collateral held from securities lending. The value of the collateral could include collateral held for securities that were sold on or before March 31, 2013 (See Note 2(k)). |
| (m) | Rate disclosed, the 7 day net yield, is as of March 31, 2013. |
Investment Abbreviations
| PIK | — | Payment in-kind | ||
| ULC | — | Unlimited Liability Company |
See Notes to Financial Statements.
65
SCHEDULES OF PORTFOLIO INVESTMENTS
RIDGEWORTH FUNDS March 31, 2013
Intermediate Bond Fund
| Shares or Principal Amount($) | Value($) | |||||||
| Collateralized Mortgage Obligation 0.2% | ||||||||
Commercial Mortgage Backed Securities 0.2% |
| |||||||
LB-UBS Commercial Mortgage Trust | ||||||||
Series 2005-C7, Cl A3, 5.455%, 11/15/30(a) | 1,753,000 | 1,814,795 | ||||||
|
| |||||||
Total Collateralized Mortgage Obligation | 1,814,795 | |||||||
|
| |||||||
| Corporate Bonds 26.8% | ||||||||
Aerospace/Defense 0.4% | ||||||||
United Technologies Corp., 3.100%, 06/01/22 | 3,330,000 | 3,490,110 | ||||||
|
| |||||||
Auto Manufacturers 0.4% | ||||||||
Daimler Finance N.A. LLC, 3.875%, 09/15/21(b) | 1,640,000 | 1,774,521 | ||||||
Volkswagen International Finance, 2.375%, 03/22/17(b) | 2,175,000 | 2,254,762 | ||||||
|
| |||||||
| 4,029,283 | ||||||||
|
| |||||||
Banks 1.9% | ||||||||
Fifth Third Bank, 1.450%, 02/28/18 | 4,337,000 | 4,335,959 | ||||||
HSBC Bank PLC, 3.100%, 05/24/16(b) | 1,271,000 | 1,351,549 | ||||||
HSBC Bank PLC, 3.500%, 06/28/15(b) | 1,729,000 | 1,829,159 | ||||||
KeyBank NA, 1.650%, 02/01/18 | 2,136,000 | 2,155,337 | ||||||
Northern Trust Corp., 4.625%, 05/01/14 | 667,000 | 697,527 | ||||||
PNC Bank NA, 0.800%, 01/28/16 | 5,178,000 | 5,177,415 | ||||||
Wells Fargo & Co., 1.250%, 02/13/15, MTN | 2,770,000 | 2,801,927 | ||||||
|
| |||||||
| 18,348,873 | ||||||||
|
| |||||||
Beverages 0.6% | ||||||||
Anheuser-Busch InBev Worldwide, Inc., 2.500%, 07/15/22 | 3,158,000 | 3,104,080 | ||||||
SABMiller Holdings, Inc., 2.450%, 01/15/17(b) | 2,696,000 | 2,806,517 | ||||||
|
| |||||||
| 5,910,597 | ||||||||
|
| |||||||
Biotechnology 0.2% | ||||||||
Life Technologies Corp., 5.000%, 01/15/21 | 848,000 | 917,462 | ||||||
Life Technologies Corp., 6.000%, 03/01/20 | 1,242,000 | 1,393,452 | ||||||
|
| |||||||
| 2,310,914 | ||||||||
|
| |||||||
| Shares or Principal Amount($) | Value($) | |||||||
Chemicals 0.4% | ||||||||
Dow Chemical Co. (The), 3.000%, 11/15/22 | 1,597,000 | 1,569,535 | ||||||
Praxair, Inc., 4.625%, 03/30/15 | 1,768,000 | 1,909,924 | ||||||
|
| |||||||
| 3,479,459 | ||||||||
|
| |||||||
Commercial Services 0.6% | ||||||||
ERAC USA Finance LLC, 2.750%, 03/15/17(b) | 1,853,000 | 1,930,265 | ||||||
ERAC USA Finance LLC, 5.250%, 10/01/20(b) | 1,603,000 | 1,861,083 | ||||||
ERAC USA Finance LLC, 5.600%, 05/01/15(b) | 1,401,000 | 1,533,914 | ||||||
|
| |||||||
| 5,325,262 | ||||||||
|
| |||||||
Computers 0.9% | ||||||||
IBM Corp., 0.875%, 10/31/14 | 4,501,000 | 4,536,945 | ||||||
IBM Corp., 1.250%, 02/06/17 | 3,710,000 | 3,746,963 | ||||||
|
| |||||||
| 8,283,908 | ||||||||
|
| |||||||
Diversified Financial Services 3.6% |
| |||||||
American Express Credit Corp., 2.375%, 03/24/17, MTN | 1,622,000 | 1,696,083 | ||||||
CME Group, Inc., 5.400%, 08/01/13 | 2,135,000 | 2,169,124 | ||||||
CME Group, Inc., 5.750%, 02/15/14 | 2,074,000 | 2,163,819 | ||||||
Ford Motor Credit Co. LLC, 5.000%, 05/15/18 | 3,506,000 | 3,861,543 | ||||||
General Electric Capital Corp., Series A, 7.125%,(a)(c) | 1,305,000 | 1,517,800 | ||||||
General Electric Capital Corp., Series B, 6.250%,(a)(c) | 4,900,000 | 5,377,912 | ||||||
John Deere Capital Corp., 1.250%, 12/02/14, MTN | 1,686,000 | 1,708,987 | ||||||
Lazard Group LLC, 6.850%, 06/15/17 | 405,000 | 465,645 | ||||||
Lazard Group LLC, 7.125%, 05/15/15 | 1,673,000 | 1,850,664 | ||||||
MassMutual Global Funding LLC, 2.000%, 04/05/17(b) | 1,766,000 | 1,810,263 | ||||||
NASDAQ OMX Group, Inc. (The), 5.550%, 01/15/20 | 822,000 | 886,404 | ||||||
PACCAR Financial Corp., 1.550%, 09/29/14, MTN | 2,384,000 | 2,424,085 | ||||||
Toyota Motor Credit Corp., 3.200%, 06/17/15, MTN | 1,019,000 | 1,075,896 | ||||||
Woodside Finance Ltd., 4.600%, 05/10/21(b) | 3,318,000 | 3,694,994 | ||||||
Woodside Finance Ltd., 8.125%, 03/01/14(b) | 3,118,000 | 3,317,580 | ||||||
|
| |||||||
| 34,020,799 | ||||||||
|
| |||||||
See Notes to Financial Statements.
66
SCHEDULES OF PORTFOLIO INVESTMENTS
RIDGEWORTH FUNDS March 31, 2013
Intermediate Bond Fund — continued
| Shares or Principal Amount($) | Value($) | |||||||
Electric 1.3% | ||||||||
Alabama Power Co., 5.800%, 11/15/13 | 1,994,000 | 2,057,939 | ||||||
Dominion Resources, Inc., 1.950%, 08/15/16 | 948,000 | 977,611 | ||||||
Duke Energy Carolinas LLC, 4.300%, 06/15/20 | 628,000 | 721,713 | ||||||
Exelon Generation Co. LLC, 6.200%, 10/01/17 | 1,465,000 | 1,717,550 | ||||||
Georgia Power Co., 6.000%, 11/01/13 | 1,442,000 | 1,486,563 | ||||||
MidAmerican Energy Holdings Co., 5.000%, 02/15/14 | 2,682,000 | 2,782,881 | ||||||
Southern California Edison Co., 5.750%, 03/15/14 | 2,151,000 | 2,253,663 | ||||||
|
| |||||||
| 11,997,920 | ||||||||
|
| |||||||
Electronics 0.1% | ||||||||
Thermo Fisher Scientific, Inc., 2.250%, 08/15/16 | 882,000 | 913,233 | ||||||
|
| |||||||
Food 0.1% | ||||||||
Kroger Co. (The), 7.500%, 01/15/14 | 1,302,000 | 1,371,596 | ||||||
|
| |||||||
Healthcare-Products 0.2% | ||||||||
Becton Dickinson and Co., 3.250%, 11/12/20 | 734,000 | 779,293 | ||||||
Covidien International Finance SA, 6.000%, 10/15/17 | 1,322,000 | 1,585,950 | ||||||
|
| |||||||
| 2,365,243 | ||||||||
|
| |||||||
Household Products/Wares 0.1% |
| |||||||
Clorox Co. (The), 3.050%, 09/15/22 | 1,108,000 | 1,117,863 | ||||||
|
| |||||||
Insurance 1.1% | ||||||||
Berkshire Hathaway, Inc., 3.200%, 02/11/15 | 2,757,000 | 2,893,466 | ||||||
Berkshire Hathaway, Inc., 4.600%, 05/15/13 | 2,330,000 | 2,342,426 | ||||||
Fairfax Financial Holdings Ltd., 5.800%, 05/15/21(b) | 1,594,000 | 1,688,043 | ||||||
Nationwide Financial Services, Inc., 5.375%, 03/25/21(b) | 3,260,000 | 3,596,559 | ||||||
|
| |||||||
| 10,520,494 | ||||||||
|
| |||||||
Internet 0.1% | ||||||||
eBay, Inc., 2.600%, 07/15/22 | 1,344,000 | 1,342,981 | ||||||
|
| |||||||
Machinery-Diversified 0.4% | ||||||||
Deere & Co., 2.600%, 06/08/22 | 3,708,000 | 3,734,838 | ||||||
|
| |||||||
| Shares or Principal Amount($) | Value($) | |||||||
Media 1.2% | ||||||||
Comcast Corp., 3.125%, 07/15/22 | 1,724,000 | 1,763,943 | ||||||
Comcast Corp., 4.950%, 06/15/16 | 1,004,000 | 1,130,473 | ||||||
NBCUniversal Media LLC, 4.375%, 04/01/21 | 2,250,000 | 2,531,590 | ||||||
Thomson Reuters Corp., 5.950%, 07/15/13 | 526,000 | 534,208 | ||||||
Time Warner Cable, Inc., 4.000%, 09/01/21 | 2,570,000 | 2,742,203 | ||||||
Time Warner Cable, Inc., 8.250%, 02/14/14 | 2,112,000 | 2,246,659 | ||||||
Time Warner, Inc., 4.875%, 03/15/20 | 439,000 | 502,452 | ||||||
|
| |||||||
| 11,451,528 | ||||||||
|
| |||||||
Mining 1.3% | ||||||||
Barrick (PD) Australia Finance Property Ltd., 4.950%, 01/15/20 | 1,974,000 | 2,190,802 | ||||||
Barrick International Barbados Corp., 5.750%, 10/15/16(b) | 1,447,000 | 1,643,189 | ||||||
BHP Billiton Finance USA Ltd., 1.125%, 11/21/14 | 1,755,000 | 1,774,370 | ||||||
Kinross Gold Corp., 5.125%, 09/01/21(d) | 3,576,000 | 3,737,471 | ||||||
Newmont Mining Corp., 3.500%, 03/15/22 | 2,557,000 | 2,574,428 | ||||||
|
| |||||||
| 11,920,260 | ||||||||
|
| |||||||
Miscellaneous Manufacturer 1.1% |
| |||||||
3M Co., 1.375%, 09/29/16 | 976,000 | 999,552 | ||||||
General Electric Co., 2.700%, 10/09/22 | 2,569,000 | 2,569,208 | ||||||
General Electric Co., 5.250%, 12/06/17 | 944,000 | 1,105,791 | ||||||
Illinois Tool Works, Inc., 6.250%, 04/01/19 | 2,483,000 | 3,102,595 | ||||||
Siemens Financieringsmaatschappij NV, 5.750%, 10/17/16(b) | 1,976,000 | 2,282,320 | ||||||
|
| |||||||
| 10,059,466 | ||||||||
|
| |||||||
Oil & Gas 0.5% | ||||||||
BP Capital Markets PLC, 2.248%, 11/01/16 | 2,066,000 | 2,149,421 | ||||||
Ensco PLC, 4.700%, 03/15/21 | 1,989,000 | 2,220,743 | ||||||
Statoil ASA, 3.125%, 08/17/17 | 627,000 | 679,790 | ||||||
|
| |||||||
| 5,049,954 | ||||||||
|
| |||||||
See Notes to Financial Statements.
67
SCHEDULES OF PORTFOLIO INVESTMENTS
RIDGEWORTH FUNDS March 31, 2013
Intermediate Bond Fund — continued
| Shares or Principal Amount($) | Value($) | |||||||
Oil & Gas Services 0.5% | ||||||||
Schlumberger Investment SA, 3.300%, 09/14/21(b) | 1,645,000 | 1,756,406 | ||||||
Weatherford International Ltd., 4.950%, 10/15/13 | 1,160,000 | 1,183,516 | ||||||
Weatherford International Ltd., 5.125%, 09/15/20 | 1,362,000 | 1,469,035 | ||||||
|
| |||||||
| 4,408,957 | ||||||||
|
| |||||||
Pharmaceuticals 0.8% | ||||||||
Express Scripts Holding Co., 2.650%, 02/15/17 | 1,507,000 | 1,578,519 | ||||||
GlaxoSmithKline Capital, Inc., 5.650%, 05/15/18 | 1,549,000 | 1,872,517 | ||||||
Novartis Securities Investment Ltd., 5.125%, 02/10/19 | 1,105,000 | 1,319,389 | ||||||
Zoetis, Inc., 3.250%, 02/01/23(b) | 2,450,000 | 2,484,503 | ||||||
|
| |||||||
| 7,254,928 | ||||||||
|
| |||||||
Pipelines 2.8% | ||||||||
El Paso Natural Gas Co., 5.950%, 04/15/17 | 597,000 | 692,839 | ||||||
El Paso Pipeline Partners Operating Co. LLC, 6.500%, 04/01/20 | 942,000 | 1,141,415 | ||||||
Energy Transfer Partners LP, 4.650%, 06/01/21 | 1,263,000 | 1,374,731 | ||||||
Energy Transfer Partners LP, 6.700%, 07/01/18 | 2,867,000 | 3,459,190 | ||||||
Enterprise Products Operating LLC, 5.250%, 01/31/20 | 4,158,000 | 4,868,661 | ||||||
Enterprise Products Operating LLC, Series G, 5.600%, 10/15/14 | 2,202,000 | 2,360,434 | ||||||
Kinder Morgan Energy Partners LP, 3.450%, 02/15/23 | 5,616,000 | 5,676,136 | ||||||
Southern Natural Gas Co., 5.900%, 04/01/17(b) | 374,000 | 435,910 | ||||||
TC Pipelines LP, 4.650%, 06/15/21 | 1,724,000 | 1,850,757 | ||||||
TransCanada PipeLines Ltd., 3.800%, 10/01/20 | 1,504,000 | 1,648,828 | ||||||
Transcontinental Gas Pipe Line Co. LLC, 6.050%, 06/15/18 | 1,074,000 | 1,305,239 | ||||||
Williams Partners LP, 4.125%, 11/15/20 | 2,024,000 | 2,183,829 | ||||||
|
| |||||||
| 26,997,969 | ||||||||
|
| |||||||
| Shares or Principal Amount($) | Value($) | |||||||
Real Estate Investment Trust 1.2% |
| |||||||
American Tower Corp., 3.500%, 01/31/23 | 2,057,000 | 2,040,149 | ||||||
Digital Realty Trust LP, 4.500%, 07/15/15 | 3,350,000 | 3,559,435 | ||||||
Digital Realty Trust LP, 5.875%, 02/01/20 | 758,000 | 863,539 | ||||||
Healthcare Realty Trust, Inc., 6.500%, 01/17/17 | 4,150,000 | 4,776,360 | ||||||
|
| |||||||
| 11,239,483 | ||||||||
|
| |||||||
Retail 1.5% | ||||||||
AutoZone, Inc., 3.700%, 04/15/22 | 1,593,000 | 1,643,853 | ||||||
Macy’s Retail Holdings, Inc., 2.875%, 02/15/23 | 7,523,000 | 7,280,752 | ||||||
Walgreen Co., 4.875%, 08/01/13 | 2,042,000 | 2,070,619 | ||||||
Wesfarmers Ltd., 6.998%, 04/10/13(b) | 3,403,000 | 3,406,685 | ||||||
|
| |||||||
| 14,401,909 | ||||||||
|
| |||||||
Semiconductors 1.3% | ||||||||
Analog Devices, Inc., 3.000%, 04/15/16 | 692,000 | 732,096 | ||||||
Intel Corp., 1.950%, 10/01/16 | 1,136,000 | 1,176,784 | ||||||
Intel Corp., 2.700%, 12/15/22 | 7,455,000 | 7,386,242 | ||||||
TSMC Global Ltd., 1.625%, 04/03/18(b)(e) | 2,742,000 | 2,737,997 | ||||||
|
| |||||||
| 12,033,119 | ||||||||
|
| |||||||
Software 0.6% | ||||||||
Fiserv, Inc., 4.750%, 06/15/21 | 1,795,000 | 1,945,798 | ||||||
Oracle Corp., 5.750%, 04/15/18 | 3,309,000 | 3,992,778 | ||||||
|
| |||||||
| 5,938,576 | ||||||||
|
| |||||||
Telecommunication Services 1.5% |
| |||||||
AT&T, Inc., 0.900%, 02/12/16 | 1,695,000 | 1,693,851 | ||||||
AT&T, Inc., 3.875%, 08/15/21 | 1,683,000 | 1,819,815 | ||||||
CC Holdings GS V LLC, 3.849%, 04/15/23(b) | 4,294,000 | 4,326,046 | ||||||
Cellco Partnership/Verizon Wireless Capital LLC, 5.550%, 02/01/14 | 1,591,000 | 1,653,612 | ||||||
Cisco Systems, Inc., 5.500%, 02/22/16 | 990,000 | 1,125,101 | ||||||
Juniper Networks, Inc., 3.100%, 03/15/16 | 665,000 | 696,886 | ||||||
See Notes to Financial Statements.
68
SCHEDULES OF PORTFOLIO INVESTMENTS
RIDGEWORTH FUNDS March 31, 2013
Intermediate Bond Fund — continued
| Shares or Principal Amount($) | Value($) | |||||||
Telecommunication Services—continued |
| |||||||
Rogers Communications, Inc., 7.500%, 03/15/15 | 1,045,000 | 1,177,402 | ||||||
Verizon Communications, Inc., 5.250%, 04/15/13 | 2,264,000 | 2,267,688 | ||||||
|
| |||||||
| 14,760,401 | ||||||||
|
| |||||||
Transportation 0.1% | ||||||||
United Parcel Service, Inc., 3.125%, 01/15/21 | 1,099,000 | 1,173,037 | ||||||
|
| |||||||
Total Corporate Bonds | 255,252,960 | |||||||
|
| |||||||
U.S. Government Agency Mortgages 7.1% |
| |||||||
Federal Home Loan Mortgage Corporation | ||||||||
Pool #J18984, 3.000%, 04/01/27 | 4,116,320 | 4,335,417 | ||||||
Pool #J18800, 3.000%, 04/01/27 | 2,253,915 | 2,375,010 | ||||||
Pool #J19310, 3.000%, 06/01/27 | 4,380,238 | 4,593,526 | ||||||
Pool #J19417, 3.000%, 06/01/27 | 14,957,652 | 15,761,273 | ||||||
Pool #J19597, 3.000%, 07/01/27 | 835,043 | 879,385 | ||||||
Pool #J22996, 3.000%, 03/01/28 | 4,739,723 | 4,991,409 | ||||||
|
| |||||||
| 32,936,020 | ||||||||
|
| |||||||
Federal National Mortgage Association | ||||||||
Pool #AM0067, 2.740%, 08/01/22 | 6,521,000 | 6,761,924 | ||||||
Pool #AP1217, 2.500%, 07/01/27 | 4,363,526 | 4,534,493 | ||||||
Pool #AB5887, 2.500%, 08/01/27 | 11,116,455 | 11,558,955 | ||||||
Pool #AM2100, 2.250%, 01/01/28 | 11,705,608 | 11,610,548 | ||||||
|
| |||||||
| 34,465,920 | ||||||||
|
| |||||||
Total U.S. Government Agency Mortgages | 67,401,940 | |||||||
|
| |||||||
U.S. Treasury Obligations 63.6% |
| |||||||
U.S. Treasury Notes 63.6% | ||||||||
0.500%, 10/15/14 | 85,619,000 | 85,980,226 | ||||||
0.375%, 03/15/15 | 146,997,000 | 147,347,294 | ||||||
0.375%, 11/15/15 | 58,444,000 | 58,535,289 | ||||||
1.750%, 05/31/16 | 54,692,000 | 57,016,410 | ||||||
1.000%, 03/31/17(f) | 76,454,000 | 77,785,982 | ||||||
0.625%, 08/31/17 | 112,651,000 | 112,536,547 | ||||||
| Shares or Principal Amount($) | Value($) | |||||||
U.S. Treasury Notes—continued |
| |||||||
2.125%, 08/15/21 | 15,392,000 | 16,084,640 | ||||||
2.000%, 02/15/23 | 49,814,000 | 50,444,446 | ||||||
|
| |||||||
Total U.S. Treasury Obligations | 605,730,834 | |||||||
|
| |||||||
| Preferred Stocks 1.2% | ||||||||
Banks 0.8% | ||||||||
PNC Financial Services Group, Inc., Series P, 6.125%(a)(c) | 83,550 | 2,311,829 | ||||||
US Bancorp, Series G, 6.000%(c) | 202,200 | 5,629,248 | ||||||
|
| |||||||
| 7,941,077 | ||||||||
|
| |||||||
Insurance 0.3% |
| |||||||
Arch Capital Group Ltd., Series C, 6.750%(c) | 45,625 | 1,270,656 | ||||||
Reinsurance Group of America, Inc., 6.200%(a) | 73,900 | 2,012,297 | ||||||
|
| |||||||
| 3,282,953 | ||||||||
|
| |||||||
Real Estate Investment Trust 0.1% |
| |||||||
Public Storage, Series U, 5.625%(c) | 19,025 | 490,274 | ||||||
|
| |||||||
Total Preferred Stocks | 11,714,304 | |||||||
|
| |||||||
Short-Term Investment 0.2% |
| |||||||
RidgeWorth Funds Securities Lending Joint Account(g) | 2,034,885 | 2,034,885 | ||||||
|
| |||||||
Total Short-Term Investment | 2,034,885 | |||||||
|
| |||||||
Money Market Fund 0.1% |
| |||||||
State Street Institutional Treasury Money Market Fund, Institutional Class, 0.00%(h) | 931,089 | 931,089 | ||||||
|
| |||||||
Total Money Market Fund | 931,089 | |||||||
|
| |||||||
Total Investments | 944,880,807 | |||||||
Other assets in excess of liabilities — 0.8% | 7,745,070 | |||||||
|
| |||||||
Net Assets — 100.0% | $ | 952,625,877 | ||||||
|
| |||||||
| (a) | Variable or floating rate security. Rate disclosed is as of March 31, 2013. |
| (b) | Rule 144A, Section 4(2) or other security which is restricted as to resale to institutional investors. The Fund’s investment adviser/subadviser has deemed this security to be liquid based |
See Notes to Financial Statements.
69
SCHEDULES OF PORTFOLIO INVESTMENTS
RIDGEWORTH FUNDS March 31, 2013
Intermediate Bond Fund — concluded
| upon procedures approved by the Board of Trustees. These securities represent 5.1% of net assets as of March 31, 2013. |
| (c) | Security is perpetual in nature and has no stated maturity. |
| (d) | The security or a partial position of the security was on loan as of March 31, 2013. The total value of securities on loan as of March 31, 2013 was $1,990,752. |
| (e) | All or a portion of this security has been purchased on a when-issued or delayed-delivery basis. |
| (f) | All or a portion of this security has been segregated, or otherwise earmarked, in connection with obligations for when-issued or delayed-delivery purchase commitments. |
| (g) | Purchased with cash collateral held from securities lending. The value of the collateral could include collateral held for securities that were sold on or before March 31, 2013 (See Note 2(k)). |
| (h) | Rate disclosed, the 7 day net yield, is as of March 31, 2013. |
Investment Abbreviations
MTN — Medium Term Note
See Notes to Financial Statements.
70
SCHEDULES OF PORTFOLIO INVESTMENTS
RIDGEWORTH FUNDS March 31, 2013
Investment Grade Tax-Exempt Bond Fund
| Shares or Principal Amount($) | Value($) | |||||||
| Municipal Bonds 92.3% | ||||||||
Alabama 1.5% | ||||||||
Birmingham, Series A, GO, 0.000%, 03/01/27(a)(b) | 2,500,000 | 2,380,700 | ||||||
Birmingham, Series A, GO, 0.000%, 03/01/37(a)(b) | 3,000,000 | 2,697,780 | ||||||
Birmingham Special Care Facilities Financing Authority Health Care Facilities, Children’s Hospital of Alabama, RB, 6.000%, 06/01/39, AGC(c) | 9,000,000 | 10,572,120 | ||||||
|
| |||||||
| 15,650,600 | ||||||||
|
| |||||||
Alaska 4.9% | ||||||||
Matanuska-Susitna Borough Lease, Goose Creek Correctional Center, RB, 5.500%, 09/01/23, AGC(c) | 18,000,000 | 21,820,320 | ||||||
Matanuska-Susitna Borough Lease, Goose Creek Correctional Center, RB, 6.000%, 09/01/28, AGC(c) | 15,500,000 | 19,125,760 | ||||||
Matanuska-Susitna Borough Lease, Goose Creek Correctional Center, RB, 6.000%, 09/01/32, AGC | 7,250,000 | 8,793,887 | ||||||
|
| |||||||
| 49,739,967 | ||||||||
|
| |||||||
Arizona 0.5% | ||||||||
City Of Mesa, Excise Tax Revenue, RB, 5.000%, 07/01/32(a) | 5,000,000 | 5,627,500 | ||||||
|
| |||||||
California 18.7% | ||||||||
California Health Facilities Financing Authority, Series C, RB, 6.250%, 10/01/24 | 3,500,000 | 4,275,460 | ||||||
California Health Facilities Financing Authority, Series C, RB, 6.500%, 10/01/33 | 6,500,000 | 7,820,865 | ||||||
California Health Facilities Financing Authority, Series C, RB, 6.500%, 10/01/38(c) | 5,400,000 | 6,497,334 | ||||||
California State, GO, 5.000%, 09/01/19 | 5,375,000 | 6,531,592 | ||||||
California State, GO, 5.000%, 02/01/21 | 10,000,000 | 12,189,700 | ||||||
| Shares or Principal Amount($) | Value($) | |||||||
California—continued | ||||||||
California State, GO, 5.000%, 09/01/21 | 10,340,000 | 12,686,353 | ||||||
California State, GO, 5.000%, 03/01/24 | 3,030,000 | 3,570,431 | ||||||
California State, GO, 5.000%, 09/01/25 | 2,410,000 | 2,776,923 | ||||||
California State, GO, 5.000%, 09/01/26 | 4,000,000 | 4,587,320 | ||||||
California State, GO, 5.000%, 09/01/27 | 7,720,000 | 8,871,206 | ||||||
California State, GO, 5.000%, 02/01/38 | 4,000,000 | 4,428,960 | ||||||
California State, GO, 5.250%, 03/01/30(c) | 15,000,000 | 17,555,700 | ||||||
California State, GO, 6.500%, 04/01/33(c) | 24,500,000 | 30,352,315 | ||||||
California State Department of Water Resources, RB, 5.000%, 12/01/20 | 2,000,000 | 2,511,080 | ||||||
California State Department of Water Resources, RB, 5.000%, 12/01/22 | 6,880,000 | 8,777,573 | ||||||
Contra Costa Transportation Authority, Series B, RB, 5.000%, 03/01/24 | 1,500,000 | 1,823,055 | ||||||
Los Angeles California Community College District, Series A, GO, 6.000%, 08/01/33(c) | 10,000,000 | 12,244,100 | ||||||
Los Angeles California Wastewater System, Series A, RB, 5.750%, 06/01/34 | 5,000,000 | 6,038,700 | ||||||
San Francisco City & County Airports Commission, AMT, RB, 5.750%, 05/01/24, AGM | 5,000,000 | 5,839,450 | ||||||
University of California, Series AG, RB, 0.180%, 05/15/14 | 8,720,000 | 8,688,957 | ||||||
University of California, Series O, RB, 5.750%, 05/15/27 | 3,000,000 | 3,673,140 | ||||||
University of California, Series O, RB, 5.750%, 05/15/28(c) | 10,000,000 | 12,243,800 | ||||||
University of California, Series O, RB, 5.750%, 05/15/29(c) | 5,095,000 | 6,224,969 | ||||||
|
| |||||||
| 190,208,983 | ||||||||
|
| |||||||
See Notes to Financial Statements.
71
SCHEDULES OF PORTFOLIO INVESTMENTS
RIDGEWORTH FUNDS March 31, 2013
Investment Grade Tax-Exempt Bond Fund — continued
| Shares or Principal Amount($) | Value($) | |||||||
District of Columbia 1.0% | ||||||||
District of Columbia, Income Tax, Series A, RB, 5.500%, 12/01/30(c) | 8,000,000 | 9,746,800 | ||||||
|
| |||||||
Florida 3.0% | ||||||||
Florida State, Series B, GO, 5.000%, 06/01/22 | 5,050,000 | 6,333,306 | ||||||
Florida State Board of Education, Capital Outlay, Public Education Project, GO, 9.125%, 06/01/14, ETM(c) | 950,000 | 1,036,184 | ||||||
Florida State Board of Education, Lottery Revenue, Capital Outlay, Public Education Project, Series A, GO, 5.000%, 06/01/20, NATL-RE/FGIC | 5,320,000 | 5,888,229 | ||||||
Florida State Board of Governors, Series A, RB, 5.000%, 10/01/20 | 2,285,000 | 2,757,515 | ||||||
Florida State Board of Governors, Series A, RB, 5.000%, 10/01/21 | 2,410,000 | 2,925,379 | ||||||
Highlands County Health Facilities Authority, Adventist Health, Series G, RB, 5.125%, 11/15/18(d) | 2,900,000 | 3,290,311 | ||||||
Miami-Dade County, Building Better Communities Program, Series B, GO, 6.000%, 07/01/23 | 2,000,000 | 2,432,020 | ||||||
Miami-Dade County, Building Better Communities Program, Series B, GO, 6.125%, 07/01/25 | 3,000,000 | 3,643,230 | ||||||
Polk County School District Sales Tax Authority, RB, 5.250%, 10/01/15, AGM | 2,000,000 | 2,123,820 | ||||||
|
| |||||||
| 30,429,994 | ||||||||
|
| |||||||
Georgia 2.3% | ||||||||
Fulton County Water & Sewer Revenue, RB, 5.000%, 01/01/19 | 3,500,000 | 4,214,000 | ||||||
Georgia State, Series A, GO, 5.000%, 01/01/19 | 8,080,000 | 9,858,731 | ||||||
Georgia State, Series B, GO, 5.000%, 07/01/17(c) | 5,000,000 | 5,515,350 | ||||||
| Shares or Principal Amount($) | Value($) | |||||||
Georgia—continued | ||||||||
Henry County School District, GO, 5.000%, 08/01/13, NATL-RE/FGIC | 4,030,000 | 4,095,730 | ||||||
|
| |||||||
| 23,683,811 | ||||||||
|
| |||||||
Illinois 2.2% | ||||||||
Chicago IL O’ Hare International Airport Revenue, Series D, RB, 5.250%, 01/01/19, NATL-RE, AMT(c) | 7,680,000 | 8,289,485 | ||||||
Chicago IL O’Hare International Airport Revenue, Series A, AMT, RB, 5.000%, 01/01/20 | 3,000,000 | 3,528,870 | ||||||
Grundy Kendall & Will Counties Community School District No. 201, GO, 5.750%, 10/15/21, AGC | 4,340,000 | 5,224,101 | ||||||
Illinois State Sales Tax, First Series, RB, 5.000%, 06/15/22(c) | 2,975,000 | 3,003,590 | ||||||
University of Illinois, Auxiliary Facilities System, Series A, RB, 5.750%, 04/01/38 | 2,000,000 | 2,252,320 | ||||||
|
| |||||||
| 22,298,366 | ||||||||
|
| |||||||
Indiana 0.1% | ||||||||
Indiana Finance Authority, AMT, RB, 5.000%, 07/01/35 | 1,000,000 | 1,055,810 | ||||||
|
| |||||||
Kansas 3.2% | ||||||||
Kansas State Development Finance Authority, Adventist Bolingbrook Hospital, RB, 5.750%, 11/15/38(c) | 26,090,000 | 30,621,311 | ||||||
Kansas State Development Finance Authority, Adventist Bolingbrook Hospital, Series D, RB, 5.000%, 11/15/22 | 2,000,000 | 2,276,880 | ||||||
|
| |||||||
| 32,898,191 | ||||||||
|
| |||||||
Maryland 3.4% | ||||||||
Baltimore County, GO, 5.000%, 08/01/15 | 2,810,000 | 3,113,396 | ||||||
Maryland State Department of Transportation, Consolidated Transportation, RB, 5.000%, 05/01/17, Pre-refunded 05/01/2014 @ 100 | 4,500,000 | 4,731,705 | ||||||
See Notes to Financial Statements.
72
SCHEDULES OF PORTFOLIO INVESTMENTS
RIDGEWORTH FUNDS March 31, 2013
Investment Grade Tax-Exempt Bond Fund — continued
| Shares or Principal Amount($) | Value($) | |||||||
Maryland—continued | ||||||||
Maryland State Department of Transportation, RB, 5.000%, 02/15/19 | 9,000,000 | 10,658,610 | ||||||
Washington Suburban Sanitary Commission, GO, 5.000%, 06/01/21 | 12,500,000 | 15,801,250 | ||||||
|
| |||||||
| 34,304,961 | ||||||||
|
| |||||||
Massachusetts 2.8% | ||||||||
Commonwealth of Massachusetts, Series B, GO, 5.000%, 06/01/24(c) | 11,990,000 | 14,629,958 | ||||||
Massachusetts School Building Authority, Series A, RB, 5.000%, 08/15/22, Pre-refunded 08/15/2015 @ 100, AGM | 5,000,000 | 5,550,050 | ||||||
Massachusetts State, Consolidated Lien, Series C, GO, 5.000%, 01/01/15 | 2,000,000 | 2,165,080 | ||||||
Massachusetts State, Consolidated Lien, Series C, GO, 5.000%, 09/01/18 | 5,310,000 | 5,888,896 | ||||||
|
| |||||||
| 28,233,984 | ||||||||
|
| |||||||
Michigan 2.2% | ||||||||
Michigan Finance Authority, RB, 5.000%, 07/01/21 | 10,000,000 | 11,891,900 | ||||||
Michigan Municipal Bond Authority, RB, 5.000%, 10/01/17(c) | 9,270,000 | 10,313,431 | ||||||
|
| |||||||
| 22,205,331 | ||||||||
|
| |||||||
Minnesota 3.2% | ||||||||
Minnesota State, Series A, GO, 5.000%, 08/01/21 | 19,000,000 | 24,005,170 | ||||||
Minnesota State, Series B, RB, 5.000%, 03/01/20 | 7,190,000 | 8,852,040 | ||||||
|
| |||||||
| 32,857,210 | ||||||||
|
| |||||||
Missouri 3.0% | ||||||||
Missouri State Board of Public Buildings, Series A, RB, 5.000%, 10/01/21 | 18,875,000 | 23,375,744 | ||||||
Missouri State Highways & Transit Commission State Road, Second Lien, RB, 5.250%, 05/01/20 | 6,500,000 | 7,641,920 | ||||||
|
| |||||||
| 31,017,664 | ||||||||
|
| |||||||
New Jersey 8.4% | ||||||||
New Jersey Economic Development Authority, RB, 5.000%, 09/01/20, ST APPROP | 4,000,000 | 4,829,040 | ||||||
| Shares or Principal Amount($) | Value($) | |||||||
New Jersey—continued | ||||||||
New Jersey Economic Development Authority, RB, 5.000%, 03/01/25 | 9,000,000 | 10,580,670 | ||||||
New Jersey Higher Education Student Assistance Authority, AMT, RB, 4.000%, 12/01/17 | 3,100,000 | 3,367,096 | ||||||
New Jersey Higher Education Student Assistance Authority, AMT, Series 1A, RB, 4.000%, 12/01/19 | 5,000,000 | 5,387,800 | ||||||
New Jersey Higher Education Student Assistance Authority, AMT, Series 1A, RB, 5.000%, 12/01/20 | 9,775,000 | 11,173,705 | ||||||
New Jersey State Transportation Trust Fund Authority, Transportation System, Series A, RB, 6.000%, 12/15/38 | 7,710,000 | 9,162,564 | ||||||
New Jersey State Transportation Trust Fund Authority, Transportation System, Series D, RB, 5.000%, 06/15/19, AGM(c) | 13,125,000 | 14,351,531 | ||||||
New Jersey State Turnpike Authority, Series A, RB, 5.000%, 01/01/30(a) | 3,000,000 | 3,396,180 | ||||||
New Jersey Transportation Trust Fund Authority, Series A, RB, 6.000%, 06/15/35, ST APPROP | 5,305,000 | 6,408,493 | ||||||
New Jersey Transportation Trust Fund Authority, Series B, RB, 5.250%, 12/15/17, NATL-RE/FGIC(c) | 15,000,000 | 16,902,450 | ||||||
|
| |||||||
| 85,559,529 | ||||||||
|
| |||||||
New Mexico 0.6% | ||||||||
New Mexico Finance Authority, Public Project Revolving Fund, Series C, RB, 5.000%, 06/01/21, AMBAC | 5,595,000 | 5,886,444 | ||||||
|
| |||||||
See Notes to Financial Statements.
73
SCHEDULES OF PORTFOLIO INVESTMENTS
RIDGEWORTH FUNDS March 31, 2013
Investment Grade Tax-Exempt Bond Fund — continued
| Shares or Principal Amount($) | Value($) | |||||||
New York 10.8% | ||||||||
Erie County Industrial Development Agency, City School District Buffalo, Series A, RB, 5.750%, 05/01/29, BHAC | 5,340,000 | 6,280,374 | ||||||
Erie County Industrial Development Agency, RB, 5.000%, 05/01/19, State Aid Withholding | 2,000,000 | 2,399,720 | ||||||
New York City, GO, 5.000%, 08/01/23 | 5,000,000 | 6,015,850 | ||||||
New York City, GO, 5.000%, 08/15/23, Pre-refunded 08/15/2014 @ 100 | 13,730,000 | 14,626,294 | ||||||
New York City Municipal Water Finance Authority, Water & Sewer System, Series A, RB, 5.750%, 06/15/40(c) | 15,330,000 | 18,099,978 | ||||||
New York City Transitional Finance Authority, Building Aid, Series S-2, RB, 6.000%, 07/15/38, State Aid Withholding(c) | 7,500,000 | 8,854,050 | ||||||
New York City Transitional Finance Authority Future Tax Secured Revenue, RB, 5.000%, 02/01/28 | 5,000,000 | 5,785,350 | ||||||
New York City Transitional Finance Authority Future Tax Secured Revenue, RB, 5.000%, 02/01/30(a) | 10,000,000 | 11,721,000 | ||||||
New York Municipal Bond Bank Agency, RB, 5.000%, 12/01/20, State Aid Withholding | 2,950,000 | 3,615,284 | ||||||
New York State Thruway Authority, Series B, RB, 5.000%, 04/01/18, AMBAC | 5,700,000 | 6,323,466 | ||||||
Port Authority of New York & New Jersey, AMT, RB, 3.000%, 10/01/14, GO of Authority | 4,765,000 | 4,953,694 | ||||||
Port Authority of New York & New Jersey, AMT, RB, 5.000%, 07/15/20 | 3,575,000 | 4,353,671 | ||||||
Port Authority of New York & New Jersey, AMT, RB, 5.000%, 07/15/21 | 5,235,000 | 6,407,640 | ||||||
| Shares or Principal Amount($) | Value($) | |||||||
New York—continued | ||||||||
Port Authority of New York & New Jersey, AMT, RB, 5.000%, 07/15/22 | 5,515,000 | 6,781,244 | ||||||
Port Authority of New York & New Jersey, AMT, RB, 5.000%, 07/15/23 | 2,900,000 | 3,553,863 | ||||||
|
| |||||||
| 109,771,478 | ||||||||
|
| |||||||
North Carolina 3.8% | ||||||||
North Carolina State, Series A, GO, 5.000%, 03/01/17 | 3,000,000 | 3,510,120 | ||||||
North State Carolina, Series A, RB, 5.000%, 05/01/20 | 3,040,000 | 3,750,235 | ||||||
North State Carolina, Series D, GO, 4.000%, 06/01/20 | 20,250,000 | 23,912,213 | ||||||
Raleigh, Series B, GO, 5.000%, 04/01/20 | 4,700,000 | 5,854,132 | ||||||
University of North Carolina, Chapel Hill, Series A, RB, 5.000%, 02/01/14 | 1,885,000 | 1,950,428 | ||||||
|
| |||||||
| 38,977,128 | ||||||||
|
| |||||||
Ohio 0.2% | ||||||||
Ohio State, RB, 5.000%, 12/15/20 | 2,000,000 | 2,481,420 | ||||||
|
| |||||||
Oregon 1.7% | ||||||||
Oregon State Department of Transportation, Highway User Tax, Series B, RB, 5.000%, 11/15/17, Pre-refunded 11/15/2014 @ 100 | 2,500,000 | 2,690,550 | ||||||
Portland Community College District, GO, 5.000%, 06/15/21 | 7,560,000 | 9,462,852 | ||||||
Tri-County Metropolitan Transportation District, Refunding Limited Tax Pledge, Series A, RB, 5.000%, 09/01/20, AGM | 5,170,000 | 5,707,163 | ||||||
|
| |||||||
| 17,860,565 | ||||||||
|
| |||||||
Pennsylvania 5.3% | ||||||||
Allegheny County Port Authority, RB, 5.750%, 03/01/29 | 7,500,000 | 8,783,400 | ||||||
Easton Area School District, Series 2006, GO, 7.750%, 04/01/25, AGM | 3,980,000 | 4,703,325 | ||||||
See Notes to Financial Statements.
74
SCHEDULES OF PORTFOLIO INVESTMENTS
RIDGEWORTH FUNDS March 31, 2013
Investment Grade Tax-Exempt Bond Fund — continued
| Shares or Principal Amount($) | Value($) | |||||||
Pennsylvania—continued | ||||||||
Pennsylvania Economic Development Financing Authority, RB, 5.000%, 07/01/21 | 7,500,000 | 8,837,025 | ||||||
Pennsylvania Economic Development Financing Authority, RB, 5.000%, 01/01/22 | 3,000,000 | 3,485,370 | ||||||
Pennsylvania Economic Development Financing Authority, RB, 5.000%, 07/01/22 | 14,485,000 | 16,398,034 | ||||||
University of Pittsburgh, Commonwealth System of Higher Education, Series B, RB, 5.500%, 09/15/23, GO of University | 6,750,000 | 8,312,490 | ||||||
University of Pittsburgh, Commonwealth System of Higher Education, Series B, RB, 5.500%, 09/15/24, GO of University | 2,500,000 | 3,069,075 | ||||||
|
| |||||||
| 53,588,719 | ||||||||
|
| |||||||
South Carolina 0.2% | ||||||||
South Carolina State Public Service Authority, Series A, RB, 5.000%, 01/01/17, Pre-refunded 01/01/2014 @ 100, AGM | 2,300,000 | 2,383,421 | ||||||
|
| |||||||
Texas 6.1% | ||||||||
Austin, Series 2005, GO, 5.000%, 09/01/19, NATL-RE | 5,000,000 | 5,436,250 | ||||||
Dallas Independent School District, GO, 6.375%, 02/15/34, PSF-GTD(c) | 6,000,000 | 7,374,000 | ||||||
Harris County Health Facilities Development Authority, Memorial Hermann Healthcare System, Series B, RB, 7.125%, 12/01/31 | 5,550,000 | 7,362,685 | ||||||
Houston Higher Education Finance Corp., Series A, RB, 4.000%, 02/15/22 | 1,000,000 | 1,051,510 | ||||||
Lower Colorado River Authority, Series A, RB, 5.875%, 05/15/15, AGM | 1,185,000 | 1,190,427 | ||||||
North Harris County Regional Water Authority, RB, 5.250%, 12/15/18, NATL-RE | 2,690,000 | 2,892,611 | ||||||
| Shares or Principal Amount($) | Value($) | |||||||
Texas—continued | ||||||||
San Antonio Electric & Gas, RB, 5.000%, 02/01/24, Pre-refunded 02/01/2015 @ 100 | 1,875,000 | 2,034,000 | ||||||
Texas State, RB, 2.500%, 08/30/13 | 20,240,000 | 20,438,959 | ||||||
Texas State Public Finance Authority, Unemployment Comp., Series A, RB, 5.000%, 01/01/15 | 5,000,000 | 5,405,350 | ||||||
Texas State Public Finance Authority, Charter School Finance Corp., Series A, RB, 6.200%, 02/15/40 | 2,850,000 | 3,362,202 | ||||||
Texas State University Systems Financing, RB, 5.000%, 03/15/18, AGM | 5,035,000 | 5,475,563 | ||||||
|
| |||||||
| 62,023,557 | ||||||||
|
| |||||||
Virginia 0.9% | ||||||||
Norfolk, Series C, GO, 5.000%, 04/01/23 | 1,875,000 | 2,176,987 | ||||||
Virginia State, Series D, GO, 5.000%, 06/01/18 | 5,540,000 | 6,695,866 | ||||||
|
| |||||||
| 8,872,853 | ||||||||
|
| |||||||
Washington 2.3% | ||||||||
Central Puget Sound Regional Transit Authority, Series A, RB, 5.000%, 11/01/23, Pre-refunded 05/01/2015 @ 100, AMBAC(c) | 6,000,000 | 6,584,880 | ||||||
Pierce County School District No. 10, Tacoma, GO, 5.000%, 12/01/16, Pre-refunded 12/01/2013 @ 100, NATL-RE/FGIC | 5,200,000 | 5,368,012 | ||||||
Washington State, Series A, GO, 5.000%, 07/01/19, Pre-refunded 07/01/2014 @ 100 | 2,855,000 | 3,026,015 | ||||||
Washington State, Series A, GO, 5.000%, 07/01/20, Pre-refunded 07/01/2015 @ 100, AGM | 7,700,000 | 8,510,194 | ||||||
|
| |||||||
| 23,489,101 | ||||||||
|
| |||||||
Total Municipal Bonds | 940,853,387 | |||||||
|
| |||||||
See Notes to Financial Statements.
75
SCHEDULES OF PORTFOLIO INVESTMENTS
RIDGEWORTH FUNDS March 31, 2013
Investment Grade Tax-Exempt Bond Fund — concluded
| Shares or Principal Amount($) | Value($) | |||||||
Money Market Fund 9.1% | ||||||||
Federated Tax-Free Obligations Fund, Institutional Shares, 0.01%(e) | 92,683,724 | 92,683,724 | ||||||
|
| |||||||
Total Money Market Fund | 92,683,724 | |||||||
|
| |||||||
Total Investments |
| 1,033,537,111 | ||||||
Liabilities in excess of other assets — (1.4)% | (14,408,057 | ) | ||||||
|
| |||||||
Net Assets — 100.0% | $ | 1,019,129,054 | ||||||
|
| |||||||
| (a) | All or a portion of this security has been purchased on a when-issued or delayed-delivery basis. |
| (b) | Step bond. The rate shown is the rate in effect as of March 31, 2013. |
| (c) | All or a portion of this security has been segregated, or otherwise earmarked, in connection with obligations for when-issued or delayed-delivery purchase commitments. |
| (d) | Variable or floating rate security. Rate disclosed is as of March 31, 2013. |
| (e) | Rate disclosed, the 7 day net yield, is as of March 31, 2013. |
Investment Abbreviations
| AGC | — | Security guaranteed by Assured Guaranty Corporation | ||
| AGM | — | Security guaranteed by Assured Guaranty Municipal Corporation | ||
| AMBAC | — | Security guaranteed by American Municipal Bond Assurance Corporation | ||
| AMT | — | Income subject to Alternative Minimum Tax | ||
| BHAC | — | Security guaranteed by Berkshire Hathaway Assurance Corporation | ||
| ETM | — | Escrowed to maturity | ||
| FGIC | — | Security guaranteed by Financial Guaranty Insurance Company | ||
| GO | — | General Obligation | ||
| NATL-RE | — | Reinsurance provided by National Public Finance Guarantee Corporation | ||
| PSF-GTD | — | Security guaranteed by Permanent School Fund Guarantee Program | ||
| RB | — | Revenue Bond | ||
| ST APPROP | — | State Appropriation |
See Notes to Financial Statements.
76
SCHEDULES OF PORTFOLIO INVESTMENTS
RIDGEWORTH FUNDS March 31, 2013
Limited Duration Fund
| Shares or Principal Amount($) | Value($) | |||||||
| Asset-Backed Securities 8.5% | ||||||||
Automobiles 4.2% | ||||||||
Nissan Master Owner Trust Receivables, Series 2013-A, Cl A, 0.503%, 02/15/18(a) | 400,000 | 400,000 | ||||||
|
| |||||||
Credit Card 4.3% | ||||||||
Discover Card Master Trust, Series 2013-A1, Cl A1, 0.503%, 08/17/20(a) | 400,000 | 400,000 | ||||||
|
| |||||||
Total Asset-Backed Securities (Cost $800,000) | 800,000 | |||||||
|
| |||||||
Collateralized Mortgage Obligations 74.0% |
| |||||||
Agency Collateralized Mortgage Obligations 74.0% |
| |||||||
Federal Home Loan Mortgage Corporation | ||||||||
Series 2589, Cl F, 0.403%, 03/17/33(a) | 851,450 | 848,847 | ||||||
Series 2806, Cl FV, REMIC, 0.643%, 11/15/33(a) | 1,396,315 | 1,398,543 | ||||||
|
| |||||||
| 2,247,390 | ||||||||
|
| |||||||
Federal National Mortgage Association | ||||||||
Series 2004-79, Cl FM, 0.504%, 11/25/24(a) | 1,482,241 | 1,486,494 | ||||||
Series 2010-90, Cl MF, 0.604%, 04/25/28(a) | 941,729 | 944,213 | ||||||
Series 2011-98, Cl FL, 0.504%, 10/25/26(a) | 2,242,982 | 2,247,901 | ||||||
|
| |||||||
| 4,678,608 | ||||||||
|
| |||||||
Total Collateralized Mortgage Obligations | 6,925,998 | |||||||
|
| |||||||
| Shares or Principal Amount($) | Value($) | |||||||
U.S. Government Agency Mortgages 6.5% |
| |||||||
Academic Loan Funding Trust | ||||||||
Series 2012-1A, Cl A1, 1.004%, 12/27/22(a)(b) | 386,794 | 391,273 | ||||||
|
| |||||||
SLC Student Loan Trust 2005-3 | ||||||||
Series 2005-3, Cl A1, 0.290%, 06/15/20(a) | 216,908 | 216,768 | ||||||
|
| |||||||
Total U.S. Government Agency Mortgages | 608,041 | |||||||
|
| |||||||
Money Market Fund 11.0% | ||||||||
State Street Institutional Treasury Money Market Fund, Institutional Class, 0.00%(c) | 1,026,778 | 1,026,778 | ||||||
|
| |||||||
Total Money Market Fund (Cost $1,026,778) | 1,026,778 | |||||||
|
| |||||||
Total Investments (Cost $9,318,898) — 100.0% | 9,360,817 | |||||||
Liabilities in excess of other assets — (0.0)%(d) | (3,408 | ) | ||||||
|
| |||||||
Net Assets — 100.0% | $9,357,409 | |||||||
|
| |||||||
| (a) | Variable or floating rate security. Rate disclosed is as of March 31, 2013. |
| (b) | Rule 144A, Section 4(2) or other security which is restricted as to resale to institutional investors. The Fund’s investment adviser/subadviser has deemed this security to be liquid based upon procedures approved by the Board of Trustees. These securities represent 4.2% of net assets as of March 31, 2013. |
| (c) | Rate disclosed, the 7 day net yield, is as of March 31, 2013. |
| (d) | Less than 0.05% of Net Assets. |
See Notes to Financial Statements.
77
SCHEDULES OF PORTFOLIO INVESTMENTS
RIDGEWORTH FUNDS March 31, 2013
Limited-Term Federal Mortgage Securities Fund
| Shares or Principal Amount($) | Value($) | |||||||
Collateralized Mortgage Obligations 17.1% |
| |||||||
Agency Collateralized Mortgage Obligations 12.6% |
| |||||||
Federal Home Loan Mortgage Corporation | ||||||||
Series 3774, Cl EW, 3.500%, 12/15/25 | 559,000 | 602,644 | ||||||
Series 3800, Cl CB, 3.500%, 02/15/26 | 159,000 | 171,349 | ||||||
Series 3909, Cl UB, REMIC, 3.500%, 08/15/26(a) | 800,000 | 870,683 | ||||||
|
| |||||||
| 1,644,676 | ||||||||
|
| |||||||
Federal National Mortgage Association | ||||||||
Series 2011-36, Cl DB, 3.000%, 05/25/26 | 499,000 | 526,293 | ||||||
|
| |||||||
| 2,170,969 | ||||||||
|
| |||||||
Commercial Mortgage Backed Securities 4.5% |
| |||||||
Extended Stay America Trust | ||||||||
Series 2013-ESH7, Cl A27, 2.958%, 12/05/31(b) | 250,000 | 252,845 | ||||||
|
| |||||||
GS Mortgage Securities Corp. II |
| |||||||
Series 2012-ALOH, Cl A, 3.551%, 04/10/34(b) | 250,000 | 262,879 | ||||||
Series 2012-BWTR, Cl A, 2.954%, 11/05/34(b) | 250,000 | 249,047 | ||||||
|
| |||||||
| 511,926 | ||||||||
|
| |||||||
| 764,771 | ||||||||
|
| |||||||
Total Collateralized Mortgage Obligations | 2,935,740 | |||||||
|
| |||||||
U.S. Government Agency Mortgages 79.7% |
| |||||||
Federal Home Loan Mortgage Corporation | ||||||||
Pool #J19132, 3.000%, 05/01/27 | 350,804 | 369,652 | ||||||
Pool #J20738, 2.500%, 10/01/27 | 142,586 | 147,940 | ||||||
Pool #J22284, 2.500%, 03/01/28(a) | 598,290 | 621,831 | ||||||
Pool #C91404, 3.500%, 10/01/31 | 257,886 | 274,343 | ||||||
Pool #C01785, 5.000%, 02/01/34(a) | 866,007 | 940,123 | ||||||
Pool #G02163, 5.000%, 04/01/36 | 183,140 | 197,669 | ||||||
Pool #G03092, 5.500%, 07/01/37 | 356,678 | 387,953 | ||||||
Pool #G04337, 5.500%, 04/01/38(a) | 777,266 | 841,813 | ||||||
Pool #G06079, 6.000%, 07/01/39 | 429,211 | 469,817 | ||||||
TBA, 2.500%, 15 year Maturity(c) | 500,000 | 517,656 | ||||||
|
| |||||||
| 4,768,797 | ||||||||
|
| |||||||
| Shares or Principal Amount($) | Value($) | |||||||
U.S. Government Agency Mortgages—continued |
| |||||||
Federal National Mortgage Association |
| |||||||
Pool #AM2137, 1.950%, 08/01/20 | 634,000 | 635,921 | ||||||
Pool #AJ1910, 2.500%, 05/01/27 | 350,951 | 364,702 | ||||||
Pool #AP7520, 3.000%, 09/01/27 | 932,962 | 988,590 | ||||||
Pool #AP6649, 3.000%, 10/01/27 | 594,885 | 628,868 | ||||||
Pool #AR6681, 2.500%, 02/01/28 | 230,669 | 239,869 | ||||||
Pool #MA0919, 3.500%, 12/01/31 | 393,502 | 420,211 | ||||||
Pool #MA0949, 3.500%, 01/01/32 | 177,257 | 189,288 | ||||||
Pool #MA0976, 3.500%, 02/01/32 | 349,911 | 372,951 | ||||||
Pool #655219, 3.500%, 08/01/32 | 125,677 | 134,286 | ||||||
Pool #AB8428, 3.500%, 02/01/33 | 186,948 | 199,870 | ||||||
Pool #730727, 5.000%, 08/01/33 | 283,467 | 315,434 | ||||||
Pool #725773, 5.500%, 09/01/34 | 565,252 | 623,608 | ||||||
Pool #AE0115, 5.500%, 12/01/35 | 424,700 | 468,906 | ||||||
Pool #AI7951, 4.500%, 08/01/36 | 147,822 | 159,335 | ||||||
Pool #995082, 5.500%, 08/01/37 | 152,759 | 168,530 | ||||||
Pool #889529, 6.000%, 03/01/38 | 508,470 | 568,146 | ||||||
Pool #995724, 6.000%, 04/01/39 | 455,917 | 509,426 | ||||||
Pool #AA9840, 4.500%, 06/01/39 | 283,955 | 305,982 | ||||||
Pool #AB1343, 4.500%, 08/01/40 | 151,600 | 165,476 | ||||||
Pool #AC4624, 3.500%, 10/01/40 | 287,380 | 306,886 | ||||||
Pool #AL0005, 4.500%, 01/01/41 | 79,296 | 85,546 | ||||||
Pool #AB2694, 4.500%, 04/01/41 | 84,241 | 92,119 | ||||||
Pool #AL1627, 4.500%, 09/01/41 | 246,720 | 270,793 | ||||||
|
| |||||||
| 8,214,743 | ||||||||
|
| |||||||
Government National Mortgage Association | ||||||||
Pool #798919, 3.500%, 04/15/27 | 378,168 | 405,447 | ||||||
See Notes to Financial Statements.
78
SCHEDULES OF PORTFOLIO INVESTMENTS
RIDGEWORTH FUNDS March 31, 2013
Limited-Term Federal Mortgage Securities Fund — concluded
| Shares or Principal Amount($) | Value($) | |||||||
U.S. Government Agency Mortgages—continued |
| |||||||
Pool #AB1393, 3.000%, 08/15/27 | 22,796 | 24,319 | ||||||
Pool #711679, 3.000%, 10/15/27 | 244,562 | 260,594 | ||||||
|
| |||||||
| 690,360 | ||||||||
|
| |||||||
Total U.S. Government Agency Mortgages | 13,673,900 | |||||||
|
| |||||||
U.S. Treasury Obligation 1.7% | ||||||||
U.S. Treasury Note 1.7% | ||||||||
2.000%, 02/15/23 | 300,000 | 303,797 | ||||||
|
| |||||||
Total U.S. Treasury Obligation (Cost $303,785) | 303,797 | |||||||
|
| |||||||
Money Market Fund 6.1% | ||||||||
State Street Institutional Treasury Money Market Fund, Institutional Class, | 1,044,967 | 1,044,967 | ||||||
|
| |||||||
Total Money Market Fund (Cost $1,044,967) | 1,044,967 | |||||||
|
| |||||||
Total Investments | 17,958,404 | |||||||
Liabilities in excess of other | (796,550 | ) | ||||||
|
| |||||||
Net Assets — 100.0% | $ | 17,161,854 | ||||||
|
| |||||||
| (a) | All or a portion of this security has been segregated, or otherwise earmarked, in connection with obligations for when-issued or delayed-delivery purchase commitments. |
| (b) | Rule 144A, Section 4(2) or other security which is restricted as to resale to institutional investors. The Fund’s investment adviser/subadviser has deemed this security to be liquid based upon procedures approved by the Board of Trustees. These securities represent 4.5% of net assets as of March 31, 2013. |
| (c) | All or a portion of this security has been purchased on a when-issued or delayed-delivery basis. |
| (d) | Rate disclosed, the 7 day net yield, is as of March 31, 2013. |
Investment Abbreviations
| REMIC | — | Real Estate Mortgage Investment Conduit | ||
| TBA | — | To Be Announced. Securities purchased on a forward commitment basis with an appropriate principal amount and no definitive maturity date. The actual principal and maturity date will be determined upon settlement date. |
See Notes to Financial Statements.
79
SCHEDULES OF PORTFOLIO INVESTMENTS
RIDGEWORTH FUNDS March 31, 2013
North Carolina Tax-Exempt Bond Fund
| Shares or Principal Amount($) | Value($) | |||||||
| Municipal Bonds 91.6% | ||||||||
Alabama 0.4% | ||||||||
Birmingham, Series A, GO, 0.000%, 03/01/32(a)(b) | 215,000 | 198,634 | ||||||
|
| |||||||
California 3.6% | ||||||||
California State, GO, 5.000%, 02/01/20 | 645,000 | 780,108 | ||||||
California State, GO, 5.000%, 02/01/38 | 1,000,000 | 1,107,240 | ||||||
|
| |||||||
| 1,887,348 | ||||||||
|
| |||||||
Georgia 1.6% | ||||||||
Municipal Electric Authority of Georgia, RB, 5.000%, 01/01/30 | 730,000 | 842,004 | ||||||
|
| |||||||
New Jersey 0.8% | ||||||||
New Jersey Economic Development Authority, RB, 5.000%, 03/01/28 | 340,000 | 387,644 | ||||||
|
| |||||||
North Carolina 82.0% | ||||||||
Charlotte NC Water & Sewer System Revenue, Series B, RB, 5.000%, 07/01/19 | 1,045,000 | 1,285,831 | ||||||
Charlotte Water & Sewer System, RB, 5.000%, 07/01/21 | 1,080,000 | 1,292,836 | ||||||
Durham, Series A, GO, 4.000%, 07/01/16 | 710,000 | 789,719 | ||||||
Guilford County, GO, 4.000%, 10/01/14 | 1,825,000 | 1,926,397 | ||||||
Guilford County, Series A, GO, 5.000%, 02/01/18 | 1,135,000 | 1,358,425 | ||||||
Iredell County School Project, COP, 5.125%, 06/01/27, AGM | 1,000,000 | 1,104,040 | ||||||
Nash Health Care Systems Health Care Facilities, RB, 5.000%, 11/01/41(c) | 1,650,000 | 1,779,888 | ||||||
New Hanover County Hospital, New Hanover Regional Medical Center, Series B, RB, 5.125%, 10/01/31, AGM(c) | 2,000,000 | 2,193,800 | ||||||
North Carolina Capital Facilities Finance Agency, RB, 5.250%, 03/01/33(c) | 2,000,000 | 2,193,920 | ||||||
North Carolina Eastern Municipal Power Agency, Series D, RB, 5.000%, 01/01/16 | 750,000 | 839,692 | ||||||
North Carolina Infrastructure Finance Corp., Series A, COP, 5.000%, 02/01/15 | 1,000,000 | 1,082,390 | ||||||
North Carolina Medical Care Commission, Series A, RB, 5.000%, 10/01/38 | 2,890,000 | 3,162,151 | ||||||
| Shares or Principal Amount($) | Value($) | |||||||
North Carolina—continued | ||||||||
North Carolina Medical Care Commission Health Care Facilities, Series A, RB, 6.125%, 10/01/39, Pre-refunded 10/01/2014 @ 100 | 750,000 | 816,172 | ||||||
North Carolina Medical Care Commission Health Care Facilities, University Health Systems, Series D, RB, 6.000%, 12/01/29 | 750,000 | 884,310 | ||||||
North Carolina Medical Care Commission Health Care Facilities, University Health Systems, Series D, RB, 6.250%, 12/01/33(c) | 2,000,000 | 2,388,360 | ||||||
North Carolina Medical Care Commission Health Care Facilities, Wake County Hospital System, Series A, RB, 5.625%, 10/01/29, Pre-refunded 10/01/2014 @ 100, AGM | 500,000 | 540,355 | ||||||
North Carolina Medical Care Commission Health Care Facilities, Wake County Hospital System, Series A, RB, 5.875%, 10/01/38, Pre-refunded 10/01/2014 @ 100, AGM | 500,000 | 542,235 | ||||||
North Carolina Municipal Power Agency, No. 1 Catawba Electric, RB, ETM, 5.000%, 01/01/20 | 1,600,000 | 1,971,328 | ||||||
North Carolina Municipal Power Agency, No. 1 Catawba Electric, Series A, RB, 5.000%, 01/01/30(c) | 3,000,000 | 3,335,130 | ||||||
North Carolina Municipal Power Agency, No. 1 Catawba Electric, Series A, RB, 5.250%, 01/01/15 | 1,000,000 | 1,084,520 | ||||||
North Carolina State, Series A, GO, 5.000%, 03/01/16 | 1,000,000 | 1,087,710 | ||||||
North Carolina State, Series C, GO, 5.000%, 05/01/20 | 1,000,000 | 1,247,340 | ||||||
North Carolina State Ports Authority Facilities, Series A, RB, 5.250%, 02/01/40(c) | 1,500,000 | 1,666,995 | ||||||
North Carolina State University at Raleigh, Series A, RB, 5.000%, 10/01/37 | 2,000,000 | 2,328,820 | ||||||
See Notes to Financial Statements.
80
SCHEDULES OF PORTFOLIO INVESTMENTS
RIDGEWORTH FUNDS March 31, 2013
North Carolina Tax-Exempt Bond Fund — concluded
| Shares or Principal Amount($) | Value($) | |||||||
North Carolina—continued | ||||||||
North State Carolina, Series A, RB, 5.000%, 05/01/14 | 1,000,000 | 1,052,120 | ||||||
North State Carolina, Series C, GO, 5.000%, 05/01/21 | 1,980,000 | 2,499,988 | ||||||
Town of Cary NC Combined Utility Systems Revenue, RB, 5.000%, 12/01/28 | 700,000 | 842,870 | ||||||
Union County NC, Series A, GO, 5.000%, 03/01/22 | 1,000,000 | 1,258,140 | ||||||
|
| |||||||
| 42,555,482 | ||||||||
|
| |||||||
Puerto Rico 1.4% | ||||||||
Puerto Rico Commonwealth Highway & Transportation Authority Highway, Series CC, RB, 5.500%, 07/01/30 | 720,000 | 719,935 | ||||||
|
| |||||||
Virginia 1.8% | ||||||||
Virginia Small Business Financing Authority, AMT, RB, 5.000%, 07/01/34 | 630,000 | 647,955 | ||||||
Virginia Small Business Financing Authority, AMT, RB, 5.000%, 01/01/40 | 265,000 | 271,591 | ||||||
|
| |||||||
| 919,546 | ||||||||
|
| |||||||
Total Municipal Bonds |
| 47,510,593 | ||||||
|
| |||||||
| Shares or Principal Amount($) | Value($) | |||||||
Money Market Fund 8.1% | ||||||||
Federated Tax-Free Obligations Fund, Institutional Shares, 0.01%(d) | 4,219,295 | 4,219,295 | ||||||
|
| |||||||
Total Money Market Fund |
| 4,219,295 | ||||||
|
| |||||||
Total Investments | 51,729,888 | |||||||
Other assets in excess of liabilities — 0.3% | 171,331 | |||||||
|
| |||||||
Net Assets — 100.0% | $ | 51,901,219 | ||||||
|
| |||||||
| (a) | Step bond. The rate shown is the rate in effect as of March 31, 2013. |
| (b) | All or a portion of this security has been purchased on a when-issued or delayed-delivery basis. |
| (c) | All or a portion of this security has been segregated, or otherwise earmarked, in connection with obligations for when-issued or delayed-delivery purchase commitments. |
| (d) | Rate disclosed, the 7 day net yield, is as of March 31, 2013. |
Investment Abbreviations
| AGM | — | Security guaranteed by Assured Guaranty Municipal Corporation | ||
| AMT | — | Income subject to Alternative Minimum Tax | ||
| COP | — | Certificate of Participation | ||
| ETM | — | Escrowed to Maturity | ||
| GO | — | General Obligation | ||
| RB | — | Revenue Bond |
See Notes to Financial Statements.
81
SCHEDULES OF PORTFOLIO INVESTMENTS
RIDGEWORTH FUNDS March 31, 2013
Seix Floating Rate High Income Fund
| Shares or Principal Amount($) | Value($) | |||||||
| Bank Loans 87.0% | ||||||||
Aerospace/Defense 2.3% |
| |||||||
AM General LLC, Term Loan B, 03/22/18(a)(b)(c) | 22,955,000 | 22,495,900 | ||||||
AWAS Finance Luxembourg 2012 S.A., New Term Loan, 4.750%, 07/16/18(c)(d) | 4,565,508 | 4,582,629 | ||||||
DAE Aviation Holdings, Inc., Term Loan B, 6.250%, 10/29/18(c)(d) | 12,669,134 | 12,859,171 | ||||||
DAE Aviation Holdings, Inc., New Term Loan B2, 6.250%, 11/02/18(c)(d) | 5,743,341 | 5,829,491 | ||||||
DigitalGlobe, Inc., New Term Loan B, 3.750%, 01/24/20(c)(d) | 19,265,000 | 19,511,785 | ||||||
Huntington Ingalls Industries, Inc., Term Loan A, 2.750%, 03/30/16(c)(d) | 11,548,781 | 11,548,781 | ||||||
LMI Aerospace, Inc., Term Loan, 5.500%, 12/28/18(c)(d) | 1,995,000 | 2,019,937 | ||||||
Silver II US Holdings LLC, Term Loan, 4.000%, 12/05/19(c)(d) | 9,201,938 | 9,269,204 | ||||||
Six3 Systems, Inc., Term Loan B, 7.000%, 10/04/19(c)(d) | 7,361,550 | 7,398,358 | ||||||
TASC, Inc., New Term Loan B, | 9,974,619 | 9,993,371 | ||||||
Transdigm, Inc., Term Loan C, 3.750%, 02/28/20(c)(d) | 13,720,613 | 13,892,120 | ||||||
WESCO Distribution, Inc., Term Loan B, 4.500%-5.750%, 12/12/19(c)(d) | 6,324,150 | 6,392,641 | ||||||
WP CPP Holdings LLC, 1st Lien Term Loan, 4.750%, 12/27/19(c)(d) | 9,935,100 | 9,955,765 | ||||||
|
| |||||||
| 135,749,153 | ||||||||
|
| |||||||
Auto Manufacturers 0.5% |
| |||||||
Navistar International Corp., Term Loan B, 7.000%, 07/16/14(b)(c)(d) | 9,493,725 | 9,586,289 | ||||||
Remy International, Inc., New Term Loan B, 4.250%, 03/05/20(c)(d) | 6,669,881 | 6,728,242 | ||||||
| Shares or Principal Amount($) | Value($) | |||||||
Auto Manufacturers—continued |
| |||||||
TI Group Automotive Systems LLC, Term Loan B, 03/14/18(a)(b)(c) | 3,500,000 | 3,526,250 | ||||||
Wabash National Corp., Term Loan B, 6.000%, 05/02/19(c)(d) | 10,073,759 | 10,193,435 | ||||||
|
| |||||||
| 30,034,216 | ||||||||
|
| |||||||
Auto Parts & Equipment 0.7% |
| |||||||
Allison Transmission, Inc., Term Loan B2, 3.210%, 08/07/17(c)(d) | 5,019,549 | 5,058,600 | ||||||
Allison Transmission, Inc., Term Loan B3, 4.250%, 08/23/19(c)(d) | 17,984,600 | 18,226,853 | ||||||
Metaldyne Co. LLC, Term Loan B, 5.000%, 12/18/18(c) | 2,000,000 | 2,021,000 | ||||||
Tomkins LLC, Term Loan B2, 3.750%, 09/29/16(c)(d) | 15,736,857 | 15,904,140 | ||||||
|
| |||||||
| 41,210,593 | ||||||||
|
| |||||||
Chemicals 1.9% |
| |||||||
AI Chem & Cy S.C.A., Term Loan B1, 08/30/19(a)(b)(c) | 3,000,000 | 3,033,750 | ||||||
Ascend Performance Materials LLC, Term Loan B, 6.750%, 04/10/18(c)(d) | 3,986,436 | 4,061,181 | ||||||
Eagle Spinco, Inc., Term Loan 1, 01/27/17(a)(b)(c) | 4,588,940 | 4,588,940 | ||||||
Houghton International, Inc., New Term Loan B, 5.250%, 12/20/19(c)(d) | 1,995,000 | 2,024,925 | ||||||
Huntsman International LLC, Extended Term Loan B, 2.743%, 04/19/17(c)(d) | 11,106,918 | 11,172,893 | ||||||
Ineos US Finance LLC, 6 year Term Loan, 6.500%, 05/04/18(c)(d)(e) | 43,390,540 | 44,072,206 | ||||||
Nexeo Solutions LLC, Term Loan B, 5.000%, 09/08/17(c)(d) | 5,075,242 | 5,072,095 | ||||||
PQ Corp., Term Loan, 4.500%, 08/07/17(c)(d) | 6,403,950 | 6,472,024 | ||||||
Taminco NV, USD Term Loan B2, 4.250%, 02/15/19(c)(d) | 4,529,336 | 4,559,048 | ||||||
See Notes to Financial Statements.
82
SCHEDULES OF PORTFOLIO INVESTMENTS
RIDGEWORTH FUNDS March 31, 2013
Seix Floating Rate High Income Fund — continued
| Shares or Principal Amount($) | Value($) | |||||||
Chemicals—continued |
| |||||||
U.S. Coatings Acquisition, Inc., Term Loan, 4.750%, 02/03/20(c)(d) | 15,840,000 | 16,044,653 | ||||||
Univar, Inc., Term Loan B, 5.000%, 06/30/17(c)(d) | 8,739,971 | 8,819,767 | ||||||
|
| |||||||
| 109,921,482 | ||||||||
|
| |||||||
Commercial Services 3.7% |
| |||||||
ABC Supply, Bridge Term Loan, 03/28/14(a)(b)(c) | 3,850,000 | 3,850,000 | ||||||
ADS Waste Holdings, Inc., New Term Loan B, 4.250%, 10/09/19(c)(d) | 27,296,588 | 27,575,286 | ||||||
AlixPartners LLP, Refinance Term Loan B2, 4.500%, 06/28/19(c)(d) | 8,649,746 | 8,709,170 | ||||||
Corporate Executive Board Co. (The), Term Loan B, 5.000%, 07/02/19(c)(d) | 3,725,663 | 3,762,919 | ||||||
Dematic S.A., Term Loan, 5.250%, 12/27/19(c)(d) | 10,837,838 | 10,946,216 | ||||||
Genpact International, Inc., Term Loan B, 4.250%, 08/30/19(c)(d) | 13,974,775 | 14,166,928 | ||||||
Harland Clarke Holdings Corp., Extended Term Loan B2, 5.454%, 06/30/17(b)(c)(d) | 44,629,861 | 44,071,988 | ||||||
Hertz Corp. (The), Term Loan B, 3.750%, 03/09/18(c)(d) | 11,652,372 | 11,662,044 | ||||||
Hertz Corp. (The), Add-On Term Loan B, 3.750%, 03/11/18(c)(d) | 15,850,275 | 16,048,404 | ||||||
Infor (US), Inc., Term Loan B2, 5.250%, 04/05/18(c)(d) | 21,098,876 | 21,420,633 | ||||||
Instant Web, Inc., Term Loan B, 3.579%, 08/07/14(c)(d) | 9,768,190 | 6,837,733 | ||||||
Merrill Communications, LLC, 1st Lien Term Loan, 7.250%, 03/08/18(c)(d) | 18,425,000 | 18,411,181 | ||||||
Moneygram International, Inc., New Term Loan B, 03/20/20(a)(b)(c) | 6,170,000 | 6,220,162 | ||||||
| Shares or Principal Amount($) | Value($) | |||||||
Commercial Services—continued |
| |||||||
Vertafore, Inc., Term Loan, 5.250%, 07/29/16(c)(d) | 5,789,097 | 5,851,793 | ||||||
Walter Energy, Inc., Term Loan B, 5.750%, 04/02/18(c)(d) | 4,609,717 | 4,634,056 | ||||||
West Corp., Term Loan B8, 4.250%, 06/29/18(c)(d) | 12,282,688 | 12,477,123 | ||||||
|
| |||||||
| 216,645,636 | ||||||||
|
| |||||||
Consumer Discretionary 0.5% |
| |||||||
Collective Brands Finance, Inc., Term Loan, 7.250%, 10/09/19(c)(d) | 9,077,250 | 9,196,434 | ||||||
Revlon, Inc., Term Loan B, 4.000%, 11/19/17(c)(d) | 4,585,000 | 4,650,611 | ||||||
Spectrum Brands, Inc., New Term Loan, 4.500%, 12/17/19(c)(d) | 3,625,913 | 3,675,769 | ||||||
Sun Products Corp. (The), New Term Loan, 5.500%, 03/18/20(c)(d) | 11,040,000 | 11,136,600 | ||||||
|
| |||||||
| 28,659,414 | ||||||||
|
| |||||||
Consumer Staples 0.6% |
| |||||||
Serta Simmons Holdings LLC, Term Loan, 5.000%-6.000%, 10/01/19(c)(d)(e) | 37,200,000 | 37,683,600 | ||||||
|
| |||||||
Diversified Financial Services 4.7% |
| |||||||
Acosta, Inc., Term Loan D, 5.000%, 03/02/18(c)(d) | 7,166,871 | 7,254,236 | ||||||
Affinion Group, Inc., Term Loan B, 6.500%, 10/10/16(c)(d) | 14,847,615 | 14,510,426 | ||||||
American Capital Holdings, Inc., New Term Loan, 5.500%, 08/22/16(c)(d) | 10,300,000 | 10,454,500 | ||||||
Asset Acceptance Capital Corp., New Term Loan B, 8.750%, 11/14/17(c)(d) | 2,343,750 | 2,358,398 | ||||||
BNY ConvergEx Group LLC, Eze Term Loan, 5.250%, 12/16/16(b)(c)(d) | 5,136,725 | 5,107,856 | ||||||
BNY ConvergEx Group LLC, Top Borrower Term Loan, 5.250%, 12/19/16(b)(c)(d) | 11,346,986 | 11,283,216 | ||||||
See Notes to Financial Statements.
83
SCHEDULES OF PORTFOLIO INVESTMENTS
RIDGEWORTH FUNDS March 31, 2013
Seix Floating Rate High Income Fund — continued
| Shares or Principal Amount($) | Value($) | |||||||
Diversified Financial Services—continued |
| |||||||
Clipper Acquisitions Corp., Term Loan B, 4.000%, 02/06/20(c)(d) | 8,124,638 | 8,205,884 | ||||||
Delos Aircraft Inc., Term Loan 2, 4.750%, 04/12/16(c)(d) | 9,330,000 | 9,376,650 | ||||||
Duff & Phelps Investment Management Co., Term Loan B, 03/14/20(a)(b)(c)(e) | 5,080,000 | 5,127,650 | ||||||
First Data Corp., Extended 2018 Term Loan B, 4.204%, 03/23/18(b)(c)(d)(e) | 44,219,924 | 44,026,683 | ||||||
First Data Corp., Extended 2017 US Term Loan, 5.204%, 03/24/17(c)(d) | 2,890,325 | 2,909,835 | ||||||
First Data Corp., 2018 Add-on Term Loan, 5.204%, 09/24/18(c)(d) | 14,145,000 | 14,237,367 | ||||||
Getty Images, Inc., Term Loan B, 4.750%, 10/18/19(c)(d) | 7,870,275 | 7,972,589 | ||||||
Interactive Data Corp., New Term Loan B, 3.750%, 02/11/18(c)(d) | 11,338,572 | 11,459,101 | ||||||
Lawson Software, Inc., Term Loan B1, 5.750%, 10/18/16(c)(d) | 5,516,500 | 5,575,140 | ||||||
MIP Delaware LLC, Term Loan, 07/12/18(a)(b)(c) | 6,905,000 | 6,951,056 | ||||||
Nuveen Investments, Inc., New Term Loan, 5.204%, 05/13/17(c)(d) | 16,525,000 | 16,823,111 | ||||||
Oberthur Technologies Holding SAS, Term Loan B, 6.252%, 03/30/19(c)(d) | 7,377,925 | 7,331,813 | ||||||
Springleaf Financial Funding Co., Term Loan, 5.500%, 05/10/17(c)(d)(e) | 43,330,000 | 43,555,749 | ||||||
SunGard Data Systems, Inc., Term Loan C, 3.955%, 02/28/17(c)(d) | 4,638,736 | 4,658,033 | ||||||
SunGard Data Systems, Inc., Term Loan E, 4.000%, 03/08/20(c)(d) | 20,730,000 | 20,917,814 | ||||||
SunGard Data Systems, Inc., Term Loan D, 4.500%, 01/31/20(c)(d) | 18,064,725 | 18,275,540 | ||||||
| Shares or Principal Amount($) | Value($) | |||||||
Diversified Financial Services—continued |
| |||||||
Transfirst Holdings, Inc., 1st Lien Term Loan, 6.250%, 12/27/17(c)(d) | 1,995,000 | 2,021,813 | ||||||
|
| |||||||
| 280,394,460 | ||||||||
|
| |||||||
Electric 1.2% |
| |||||||
Calpine Corp., Term Loan B1, 4.000%, 04/02/18(c)(d) | 14,307,457 | 14,474,425 | ||||||
Calpine Corp., Term Loan B2, 4.000%, 04/02/18(c)(d) | 1,881,488 | 1,903,445 | ||||||
Calpine Corp., Term Loan B3, 4.000%, 10/09/19(c)(d) | 21,253,200 | 21,518,865 | ||||||
NRG Energy, Inc., New Term Loan B, 3.250%, 07/02/18(c)(d) | 7,827,087 | 7,924,925 | ||||||
Texas Competitive Electric Holdings Co. LLC, Non-Extended Term Loan, 3.702%-3.792%, 10/10/14(c)(d) | 3,930,000 | 2,879,825 | ||||||
Texas Competitive Electric Holdings Co. LLC, Extended Term Loan, 4.702%-4.792%, 10/10/17(c)(d)(e) | 32,671,642 | 23,137,731 | ||||||
|
| |||||||
| 71,839,216 | ||||||||
|
| |||||||
Electronics 0.3% | ||||||||
Blackboard, Inc., Term Loan B2, 6.250%, 10/04/18(b)(c)(d) | 9,311,663 | 9,439,698 | ||||||
Ceridian Corp, Extended Canadian Term Loan, 5.953%, 05/09/17(c)(d) | 1,081,000 | 1,076,946 | ||||||
Ceridian Corp., Extended Term Loan, 5.953%, 05/09/17(c)(d) | 5,986,866 | 6,089,481 | ||||||
|
| |||||||
| 16,606,125 | ||||||||
|
| |||||||
Energy 1.8% | ||||||||
Aventine Renewable Energy Holdings, Inc., Term Loan B, 15.000%, 12/21/15(c)(d)(f)(g) | 6,812,661 | 5,109,496 | ||||||
Chesapeake Energy Corp., New Unsecured Term Loan, 5.750%, 12/01/17(c)(d)(e) | 54,430,000 | 56,056,368 | ||||||
See Notes to Financial Statements.
84
SCHEDULES OF PORTFOLIO INVESTMENTS
RIDGEWORTH FUNDS March 31, 2013
Seix Floating Rate High Income Fund — continued
| Shares or Principal Amount($) | Value($) | |||||||
Energy—continued | ||||||||
Glenn Pool Oil & Gas Trust, Term Loan, 4.500%, 05/02/16(c)(d) | 37,829,680 | 37,829,680 | ||||||
Progressive Waste Solutions Ltd., Term Loan B, 3.500%, 10/24/19(c)(d) | 6,962,550 | 7,045,265 | ||||||
|
| |||||||
| 106,040,809 | ||||||||
|
| |||||||
Entertainment 1.6% | ||||||||
AMC Networks Inc., Term Loan A, 1.952%, 06/30/17(c)(d) | 8,000,000 | 7,990,000 | ||||||
Barrington Broadcasting Group LLC, Term Loan B, 7.500%, 06/14/17(c)(d) | 2,350,053 | 2,365,728 | ||||||
Cedar Fair, L.P., New Term Loan B, 3.250%, 03/06/20(c)(d) | 9,185,000 | 9,294,118 | ||||||
Cinemark USA, Inc., New Term Loan, 3.210%-5.250%, 12/18/19(c)(d) | 8,398,950 | 8,472,441 | ||||||
Delta 2 (LUX) S.A.R.L., Extended Term Loan B2, 6.000%, 04/30/19(c)(d) | 7,584,761 | 7,698,532 | ||||||
Hubbard Radio, LLC, Term Loan B, 4.500%, 04/28/17(c)(d) | 5,125,141 | 5,169,986 | ||||||
IMG Worldwide, Inc., New Term Loan B, 5.500%, 06/16/16(d)(g) | 14,464,270 | 14,500,430 | ||||||
Kasima LLC, Term Loan B, 5.000%, 03/31/17(c)(d) | 11,760,000 | 11,818,800 | ||||||
Live Nation Entertainment, Inc., Term Loan B, 4.500%, 11/07/16(c)(d) | 5,061,116 | 5,094,014 | ||||||
Regent Seven Seas Cruises, Inc., Refinance Term Loan B, 4.750%, 12/21/18(c)(d) | 7,076,438 | 7,156,047 | ||||||
SeaWorld Parks & Entertainment, Inc., Term Loan B, 4.000%, 08/17/17(c)(d) | 10,680,042 | 10,720,092 | ||||||
WaveDivision Holdings LLC, Term Loan B, 4.000%, 10/15/19(c)(d) | 3,705,713 | 3,745,104 | ||||||
|
| |||||||
| 94,025,292 | ||||||||
|
| |||||||
| Shares or Principal Amount($) | Value($) | |||||||
Food 4.3% | ||||||||
AdvancePierre Foods, Inc., Term Loan, 5.750%, 07/10/17(c)(d) | 4,638,375 | 4,697,514 | ||||||
Aramark Corp., Non-Extended Synthetic Letter of Credit, 2.084%, 01/27/14(c)(d) | 484,590 | 488,346 | ||||||
Aramark Corp., Extended Term Loan C, 3.704%-3.784%, 07/26/16(b)(c)(d) | 22,594,049 | 22,702,275 | ||||||
Aramark Corp., Term Loan D, 4.000%, 09/09/19(c)(d) | 11,460,000 | 11,560,161 | ||||||
Blue Buffalo Co., Ltd., Term Loan B2, 4.750%, 08/08/19(c)(d) | 8,228,702 | 8,341,846 | ||||||
Brasa Holdings, Inc., 1st Lien Term Loan, 7.500%, 07/19/19(c)(d) | 4,114,325 | 4,124,611 | ||||||
Burger King Corp., New Term Loan B, 3.750%, 09/27/19(c)(d) | 4,074,525 | 4,121,097 | ||||||
Del Monte Foods Co., Term Loan, 4.000%, 03/08/18(c)(d) | 6,369,038 | 6,421,773 | ||||||
Dunkin’ Brands, Inc., Term Loan B3, 3.750%-5.000%, 02/14/20(c)(d) | 15,797,011 | 15,965,723 | ||||||
HJ Heinz Co., 2nd Lien Bridge Term Loan, 02/14/14(a)(b)(c) | 10,875,000 | 10,875,000 | ||||||
HJ Heinz Co., Term Loan B1, 03/27/19(a)(b)(c) | 20,000,000 | 20,080,000 | ||||||
HJ Heinz Co., Term Loan B2, 03/27/20(a)(b)(c) | 96,990,000 | 97,811,505 | ||||||
Hostess Brands, Inc., Term Loan, 03/06/20(a)(b) | 3,000,000 | 3,067,500 | ||||||
ISS Holdings A/S, Term Loan B12, 03/15/18(a)(b)(c) | 10,680,000 | 10,693,350 | ||||||
Landry’s, Inc., Term Loan B, 4.750%, 04/24/18(c)(d) | 19,266,991 | 19,411,493 | ||||||
OSI Restaurant Partners LLC, New Term Loan B, 4.750%, 10/24/19(c)(d) | 3,558,750 | 3,604,017 | ||||||
See Notes to Financial Statements.
85
SCHEDULES OF PORTFOLIO INVESTMENTS
RIDGEWORTH FUNDS March 31, 2013
Seix Floating Rate High Income Fund — continued
| Shares or Principal Amount($) | Value($) | |||||||
Food—continued | ||||||||
Pinnacle Foods Finance LLC, Term Loan E, 4.750%, 10/17/18(c)(d) | 3,672,900 | 3,708,490 | ||||||
Wendy’s International, Inc., Term Loan B, 4.750%, 05/15/19(c)(d) | 9,178,875 | 9,266,809 | ||||||
|
| |||||||
| 256,941,510 | ||||||||
|
| |||||||
Health Care 7.8% | ||||||||
American Renal Holdings, Inc., 1st Lien Term Loan, 4.500%, 09/22/19(c)(d) | 6,420,000 | 6,432,070 | ||||||
Aptalis Pharma, Inc., Term Loan B, 5.500%, 02/10/17(c)(d) | 10,642,624 | 10,717,122 | ||||||
Aptalis Pharma, Inc., Term Loan B2, 5.500%, 02/10/17(c)(d) | 10,297,225 | 10,369,306 | ||||||
Ardent Medical Services, Inc., Term Loan, 6.750%, 07/02/18(c)(d) | 10,882,725 | 11,064,140 | ||||||
Bausch & Lomb, Inc., Term Loan B, 5.250%, 05/17/19(c)(d) | 23,930,170 | 24,147,934 | ||||||
Biomet, Inc., Extended Term Loan B, 3.954%-4.034%, 07/25/17(c)(d) | 4,522,275 | 4,571,251 | ||||||
Community Health Systems, Inc., Extended Term Loan, 3.784%-3.787%, 01/25/17(c)(d) | 10,881,212 | 10,986,325 | ||||||
Convatec, Inc., Term Loan, 5.000%, 12/22/16(c)(d) | 8,709,339 | 8,833,447 | ||||||
DaVita, Inc., Term Loan A3, 2.710%, 09/02/17(c)(d) | 296,250 | 296,203 | ||||||
DaVita, Inc., Term Loan B2, 4.000%, 11/01/19(c)(d) | 28,358,925 | 28,620,394 | ||||||
Drumm Investors LLC, Term Loan, 5.000%, 05/04/18(c)(d) | 14,230,698 | 13,746,000 | ||||||
HCA, Inc., Extended Term Loan B3, 3.454%, 05/01/18(c)(d)(e) | 36,840,135 | 37,148,487 | ||||||
HCA, Inc., Extended Term Loan B2, 3.534%, 03/31/17(c)(d) | 12,000,000 | 12,098,280 | ||||||
| Shares or Principal Amount($) | Value($) | |||||||
Health Care—continued | ||||||||
Health Management Associates, Inc., Term Loan B, 11/16/18(a)(b)(c) | 4,403,677 | 4,440,360 | ||||||
Hologic, Inc., New Term Loan A, 2.203%, 07/17/17(c)(d) | 4,694,625 | 4,693,170 | ||||||
Hologic, Inc., Term Loan B, 4.500%, 08/01/19(c)(d) | 13,920,050 | 14,094,051 | ||||||
Iasis Healthcare LLC, Term Loan B2, 4.500%, 05/03/18(c)(d)(e) | 19,875,445 | 20,115,540 | ||||||
IMS Health, Inc., USD Term Loan B1, 3.750%, 08/25/17(c)(d) | 6,087,696 | 6,147,051 | ||||||
Inc Research, Inc., Refinance Term Loan B, 6.000%, 07/12/18(c)(d) | 17,183,783 | 17,334,141 | ||||||
Lifepoint Hospitals, Inc., Term Loan B, 2.710%, 07/24/17(c)(d) | 6,369,038 | 6,416,805 | ||||||
MedAssets, Inc., Term Loan B, 4.000%, 12/13/19(c)(d) | 2,368,750 | 2,394,404 | ||||||
Nusil Technology LLC, New Term Loan, 5.000%, 04/07/17(c)(d) | 997,275 | 1,003,199 | ||||||
Onex Carestream Finance LP, Term Loan B, 5.000%, 02/25/17(c)(d) | 23,826,899 | 23,899,333 | ||||||
Patheon, Inc., Term Loan, 7.250%, 12/06/18(c)(d) | 9,032,363 | 9,167,848 | ||||||
RPI Finance Trust, New Term Loan Tranche 2, 3.500%, 05/09/18(c)(d)(e) | 68,950,824 | 69,942,337 | ||||||
RPI Finance Trust, Incremental Tranche 2, 4.000%, 11/09/18(c)(d) | 7,272,644 | 7,336,280 | ||||||
Sage Products, Inc., Refinance Term Loan B, 4.250%, 12/13/19(c)(d) | 4,525,000 | 4,553,281 | ||||||
Select Medical Corp., New Incremental Term Loan B, 3.540%-5.500%, 02/13/16(c)(d) | 4,299,225 | 4,299,225 | ||||||
See Notes to Financial Statements.
86
SCHEDULES OF PORTFOLIO INVESTMENTS
RIDGEWORTH FUNDS March 31, 2013
Seix Floating Rate High Income Fund — continued
| Shares or Principal Amount($) | Value($) | |||||||
Health Care—continued | ||||||||
Universal Health Services, Inc., New Term Loan B, 3.750%, 11/15/16(c)(d) | 5,605,921 | 5,660,243 | ||||||
Vanguard Health Holding Co. II LLC, Refinance Term Loan B, 3.750%, 01/29/16(c)(d) | 5,528,246 | 5,592,761 | ||||||
Warner Chilcott Co. LLC, New Term Loan B2, 4.250%, 03/15/18(c)(d) | 1,363,804 | 1,384,548 | ||||||
Warner Chilcott Corp., Incremental Term Loan B1, 4.250%, 03/15/18(c)(d) | 1,675,390 | 1,700,873 | ||||||
Warner Chilcott Corp., New Term Loan B1, 4.250%, 03/15/18(c)(d) | 3,848,756 | 3,907,295 | ||||||
WC Luxco S.A.R.L., New Term Loan B3, 4.250%, 03/15/18(c)(d) | 3,032,864 | 3,078,994 | ||||||
WP Prism, Inc., PIK Term Loan, 05/31/18(a)(b)(c) | 65,000,000 | 64,512,500 | ||||||
|
| |||||||
| 460,705,198 | ||||||||
|
| |||||||
Healthcare-Services 0.8% | ||||||||
Bright Horizons Family Solutions, Inc., New Term Loan B, 4.000%-5.250%, 01/16/20(c)(d) | 3,670,800 | 3,698,331 | ||||||
Par Pharmaceutical Cos., Inc., Refinance Term Loan B, 4.250%, 09/30/19(c)(d) | 15,840,500 | 15,985,598 | ||||||
Regionalcare Hospital Partners, Inc., Refinance Term Loan, 7.000%, 11/04/18(c)(d) | 9,163,593 | 9,278,138 | ||||||
Valeant Pharmaceuticals International, Inc., Refinance Term Loan D1, 3.500%, 02/13/19(c)(d) | 4,538,625 | 4,588,051 | ||||||
Valeant Pharmaceuticals International, Inc., Refinance Term Loan C1, 3.500%, 12/11/19(c)(d) | 16,438,800 | 16,616,832 | ||||||
|
| |||||||
| 50,166,950 | ||||||||
|
| |||||||
| Shares or Principal Amount($) | Value($) | |||||||
Information Technology 1.7% |
| |||||||
CDW LLC, Extended Term Loan, 4.000%, 07/14/17(c)(d) | 20,251,553 | 20,327,496 | ||||||
CompuCom Systems, Inc., New Term Loan, 6.500%, 10/04/18(c)(d) | 9,281,738 | 9,455,770 | ||||||
DataPipe, Inc., 1st Lien Term Loan, 5.750%, 03/06/20(c)(d) | 4,605,000 | 4,639,537 | ||||||
Edwards (Cayman Islands II) Ltd., New Term Loan B, 03/26/20(a)(b)(c) | 3,530,000 | 3,530,000 | ||||||
Flextronics International Ltd., Senior Term Loan Tranche A DD A-2, 2.454%, 10/01/14(c)(d) | 107,115 | 107,216 | ||||||
Flextronics International Ltd., Term Loan A, 2.454%, 10/01/14(c)(d) | 1,667,529 | 1,669,096 | ||||||
Flextronics International Ltd., Delayed Draw A-1A Term Loan, 2.454%, 10/01/14(c)(d) | 64,553 | 64,614 | ||||||
Presidio, Inc., New Term Loan B, 5.750%, 03/31/17(c)(d) | 11,775,825 | 11,834,704 | ||||||
Riverbed Technology, Inc., Term Loan, 4.000%, 12/18/19(c)(d) | 8,322,142 | 8,392,381 | ||||||
Shield Finance Co. S.A.R.L., New Term Loan B, 6.500%, 05/10/19(c)(d) | 9,269,950 | 9,351,062 | ||||||
Southern Graphics, Inc., Term Loan, 5.000%, 10/17/19(c)(d) | 7,261,800 | 7,334,418 | ||||||
SS&C Technologies, Inc., Term Loan B-1, 5.000%, 06/07/19(c)(d) | 5,575,831 | 5,652,499 | ||||||
SS&C Technologies, Inc., Term Loan B-2, 5.000%, 06/07/19(c)(d) | 576,810 | 584,741 | ||||||
STG-Fairway Acquisitions, Term Loan B, 6.250%, 02/28/19(c)(d) | 11,465,000 | 11,443,560 | ||||||
Verint Systems, Inc., New Term Loan B, 4.000%, 09/06/19(c)(d) | 4,507,297 | 4,533,575 | ||||||
|
| |||||||
| 98,920,669 | ||||||||
|
| |||||||
See Notes to Financial Statements.
87
SCHEDULES OF PORTFOLIO INVESTMENTS
RIDGEWORTH FUNDS March 31, 2013
Seix Floating Rate High Income Fund — continued
| Shares or Principal Amount($) | Value($) | |||||||
Insurance 2.3% | ||||||||
Alliance Data Systems Corp., Term Loan A, 05/24/16(a)(b)(c) | 38,250,000 | 38,202,187 | ||||||
Asurion LLC, New Term Loan B1, 4.500%, 05/24/19(c)(d)(e) | 42,470,096 | 42,889,700 | ||||||
Asurion LLC, Term Loan B1, 4.750%, 07/18/17(c)(d) | 3,750,000 | 3,780,488 | ||||||
CNO Financial Group, Inc., New Term Loan B1, 4.250%, 09/28/16(c)(d) | 3,397,500 | 3,427,228 | ||||||
Compass Investors, Inc., Term Loan, 5.250%, 12/27/19(c)(d) | 12,643,313 | 12,769,746 | ||||||
Lonestar Intermediate Super Holdings LLC, Term Loan B, 11.000%, 09/02/19(c)(d) | 27,625,000 | 29,576,154 | ||||||
Sedgwick CMS Holdings, Inc., Term Loan B2, 4.000%, 12/30/16(c)(d) | 6,890,884 | 6,925,269 | ||||||
|
| |||||||
| 137,570,772 | ||||||||
|
| |||||||
Leisure Time 0.2% |
| |||||||
Bombardier Recreational Products, Inc., New Term Loan B, 5.000%, 01/22/19(c)(d) | 6,360,000 | 6,422,455 | ||||||
ClubCorp Club Operations, Inc., Term Loan B, 5.000%, 11/30/16(c)(d) | 3,483,501 | 3,544,463 | ||||||
|
| |||||||
| 9,966,918 | ||||||||
|
| |||||||
Lodging 3.0% |
| |||||||
Caesars Entertainment Operating Co., Extended Term Loan B6, 5.454%, 01/26/18(b)(c)(d) | 39,178,691 | 36,262,229 | ||||||
CCM Merger, Inc., New Term Loan B, 6.000%, 03/01/17(c)(d) | 7,107,944 | 7,161,253 | ||||||
Las Vegas Sands LLC, Term Loan B, 1.710%, 05/23/14(c)(d) | 12,502,327 | 12,503,952 | ||||||
Las Vegas Sands LLC, Delayed Draw Term Loan, 1.710%, 05/23/14(c)(d) | 2,613,041 | 2,613,381 | ||||||
| Shares or Principal Amount($) | Value($) | |||||||
Lodging—continued |
| |||||||
Las Vegas Sands LLC, Extended Delayed Draw Term Loan 2, 2.710%, 11/23/15(c)(d) | 3,951,936 | 3,955,650 | ||||||
Las Vegas Sands LLC, Extended Delayed Draw Term Loan, 2.710%, 11/23/16(c)(d) | 2,693,622 | 2,696,154 | ||||||
Las Vegas Sands LLC, Extended Term Loan B, 2.710%, 11/23/16(c)(d) | 13,402,096 | 13,414,694 | ||||||
MGM Resorts International, Term Loan B, 4.250%, 12/20/19(c)(d) | 9,142,088 | 9,283,790 | ||||||
MGM Resorts International, Term Loan A, 3.284%, 12/20/17(c)(d) | 27,790,350 | 27,838,983 | ||||||
Peninsula Gaming LLC, Term Loan, 5.750%, 11/20/17(c)(d) | 5,660,813 | 5,752,801 | ||||||
Penn National Gaming, Inc., New Term Loan B, 3.750%, 07/16/18(c)(d) | 4,168,894 | 4,200,119 | ||||||
ROC Finance LLC, Term Loan, 03/28/19(a)(b)(c) | 3,560,000 | 3,575,593 | ||||||
Seminole Tribe of Florida, Delayed Draw Term Loan B1, 1.784%, 03/05/14(b)(c)(d) | 3,088,796 | 3,088,209 | ||||||
Seminole Tribe of Florida, Delayed Draw Term Loan B2, 1.784%, 03/05/14(b)(c)(d) | 14,816,659 | 14,813,843 | ||||||
Seminole Tribe of Florida, Delayed Draw Term Loan B3, 1.784%, 03/05/14(b)(c)(d) | 3,512,324 | 3,511,657 | ||||||
Station Casinos, Inc., New Term Loan B, 5.000%, 02/13/20(c)(d) | 23,170,000 | 23,420,931 | ||||||
Twin River Management Group, Inc., Term Loan B, 09/27/18(a)(b)(c) | 3,565,000 | 3,591,737 | ||||||
|
| |||||||
| 177,684,976 | ||||||||
|
| |||||||
Machinery-Diversified 1.2% |
| |||||||
Alliance Laundry Systems LLC, Refinance Term Loan, 4.500%, 12/07/18(c)(d) | 5,407,481 | 5,442,630 | ||||||
See Notes to Financial Statements.
88
SCHEDULES OF PORTFOLIO INVESTMENTS
RIDGEWORTH FUNDS March 31, 2013
Seix Floating Rate High Income Fund — continued
| Shares or Principal Amount($) | Value($) | |||||||
Machinery-Diversified—continued |
| |||||||
Alliance Laundry Systems LLC, 2nd Lien Term Loan, 9.500%, 12/10/19(c)(d) | 2,454,545 | 2,509,773 | ||||||
Apex Tool Group, LLC, Term Loan B, 4.500%, 01/28/20(c)(d) | 7,270,000 | 7,362,911 | ||||||
Brand Energy & Infrastructure Services, Inc., USD Term Loan B2, 5.750%, 10/16/16(c)(d) | 5,510,127 | 5,541,149 | ||||||
Brand Energy & Infrastructure Services, Inc., Term Loan 2 Canadian, 5.750%, 10/16/16(c)(d) | 1,322,431 | 1,329,876 | ||||||
Brand Energy & Infrastructure Services, Inc., USD Term Loan B1, 6.250%, 10/16/18(c)(d) | 5,145,026 | 5,190,045 | ||||||
Brand Energy & Infrastructure Services, Inc., Term Loan 1 Canadian, 6.250%, 10/23/18(c)(d) | 1,234,806 | 1,245,611 | ||||||
Milacron LLC, New Term Loan, 03/28/20(a)(b)(c) | 5,295,000 | 5,328,094 | ||||||
NACCO Materials Handling Group, Inc., Term Loan B, 5.000%, 12/12/17(c)(d) | 6,038,500 | 6,068,692 | ||||||
Schaeffler AG, USD Term Loan C, 4.250%, 01/27/17(c)(d) | 24,055,000 | 24,315,516 | ||||||
Total Safety US, Inc., 1st Lien Term Loan, 5.750%, 02/21/20(c)(d) | 4,605,000 | 4,635,715 | ||||||
|
| |||||||
| 68,970,012 | ||||||||
|
| |||||||
Media 7.3% |
| |||||||
CCO Holdings LLC, 3rd Lien Term Loan, 2.704%, 09/05/14(c)(d)(e) | 38,974,084 | 39,014,228 | ||||||
Charter Communications Operating LLC, Term Loan D, 4.000%, 05/15/19(c)(d) | 2,937,295 | 2,960,382 | ||||||
Clear Channel Communications, Inc., Term Loan C, 3.854%, 01/29/16(b)(c)(d)(e) | 66,088,288 | 57,567,525 | ||||||
| Shares or Principal Amount($) | Value($) | |||||||
Media—continued |
| |||||||
Clear Channel Communications, Inc., Term Loan B, 3.854%, 01/29/16(c)(d) | 11,541,222 | 10,222,637 | ||||||
EMI Music Publishing Ltd., Term Loan B, 4.250%, 06/29/18(c)(d) | 9,248,525 | 9,338,698 | ||||||
Encompass Digital Media, Inc., New Term Loan B1, 6.750%, 08/10/17(c)(d) | 6,872,775 | 6,915,730 | ||||||
McGraw-Hill Global Education Holdings, LLC, Term Loan, 9.000%, 03/22/19(c)(d) | 17,660,000 | 17,030,951 | ||||||
Mediacom Broadband LLC, Term Loan F, 4.500%, 10/23/17(c)(d) | 4,526,988 | 4,551,524 | ||||||
Mediacom Communications Corp., Term Loan G, 4.000%, 01/08/20(c)(d) | 26,188,400 | 26,352,078 | ||||||
Mediacom Illinois LLC, Term Loan C, 1.680%, 01/30/15(c)(d) | 5,261,132 | 5,245,770 | ||||||
Nielsen Holdings NV, Bridge Term Loan, 02/21/14(a)(b)(c) | 10,625,000 | 10,625,000 | ||||||
Nine Entertainment Group Ltd., Term Loan B, 3.500%, 01/17/20(c)(d) | 10,945,000 | 10,958,681 | ||||||
Radio One, Inc., Term Loan B, 7.500%, 03/31/16(c)(d) | 11,801,084 | 12,079,235 | ||||||
Salem Communications Corp., Term Loan B, 4.500%, 03/15/20(c)(d) | 4,605,000 | 4,660,628 | ||||||
San Juan Cable Holdings LLC, New Term Loan B, 6.000%, 06/09/17(c)(d) | 7,177,163 | 7,266,877 | ||||||
San Juan Cable Holdings LLC, New 2nd Lien Term Loan, 8.784%, 06/08/18(c)(d) | 11,745,000 | 11,968,860 | ||||||
Syniverse Holdings, Inc., Delayed Draw Term Loan, 2.000%, 04/23/19(c)(d) | 22,900,000 | 22,947,632 | ||||||
Syniverse Holdings, Inc., Term Loan, 5.000%, 04/23/19(c)(d) | 13,636,950 | 13,735,818 | ||||||
See Notes to Financial Statements.
89
SCHEDULES OF PORTFOLIO INVESTMENTS
RIDGEWORTH FUNDS March 31, 2013
Seix Floating Rate High Income Fund — continued
| Shares or Principal Amount($) | Value($) | |||||||
Media—continued |
| |||||||
Tribune Co., Exit Term Loan, 4.000%, 12/31/19(c)(d) | 46,987,238 | 47,363,135 | ||||||
Univision Communications, Inc., Initial Term Loan, 2.204%, 09/29/14(c)(d) | 8,535,105 | 8,544,749 | ||||||
Univision Communications, Inc., Extended Term Loan, 4.454%, 03/31/17(c)(d) | 2,635,611 | 2,646,812 | ||||||
Univision Communications, Inc., Refinance Term Loan C2, 4.750%, 02/21/20(c)(d) | 21,550,000 | 21,652,363 | ||||||
Van Wagner Communications LLC, New Term Loan B, 8.250%, 08/03/18(c)(d) | 15,840,400 | 16,038,405 | ||||||
Village Roadshow Films (BVI) Ltd., Term Loan B, 4.750%, 11/21/17(c)(d) | 38,225,000 | 38,702,813 | ||||||
Weather Channel, Refinance Term Loan B, 3.500%, 02/07/17(c)(d) | 3,908,932 | 3,958,497 | ||||||
WideOpenWest Finance LLC, Term Loan B, 03/26/19(a)(b)(c) | 10,580,000 | 10,670,353 | ||||||
WideOpenWest Finance LLC, 1st Lien Term Loan, 6.250%, 07/17/18(c)(d) | 8,275,783 | 8,357,217 | ||||||
|
| |||||||
| 431,376,598 | ||||||||
|
| |||||||
Metals 0.3% |
| |||||||
Arch Coal, Inc., Term Loan B, 5.750%, 05/16/18(c)(d) | 9,115,439 | 9,264,749 | ||||||
Atlas Iron Ltd., Term Loan B, 8.750%, 12/07/17(b)(c)(d) | 7,915,163 | 7,934,951 | ||||||
|
| |||||||
| 17,199,700 | ||||||||
|
| |||||||
Mining 3.7% |
| |||||||
Ameriforge Group, Inc., 1st Lien Term Loan, 6.000%, 12/19/19(c)(d) | 3,625,913 | 3,672,759 | ||||||
FMG America Finance, Inc., Term Loan, 5.250%, 10/18/17(c)(d)(e) | 105,977,450 | 107,179,234 | ||||||
| Shares or Principal Amount($) | Value($) | |||||||
Mining—continued |
| |||||||
Freeport McMoran Copper & Gold, Inc., Term Loan A, 02/12/18(a)(b)(c) | 91,165,000 | 90,823,131 | ||||||
Novelis, Inc., New Term Loan, 3.750%, 03/10/17(c)(d) | 18,998,393 | 19,235,873 | ||||||
|
| |||||||
| 220,910,997 | ||||||||
|
| |||||||
Miscellaneous Manufacturer 1.4% |
| |||||||
Boomerang Tube LLC, Term Loan, 11.000%, 10/02/17(c)(d) | 18,227,625 | 18,409,901 | ||||||
Clarke American Corp., Non Extended Term Loan B1, 2.704%, 06/30/14(b)(c)(d) | 41,747,043 | 41,479,445 | ||||||
Manitowoc Co., Inc. (The), New Term Loan B, 4.250%, 11/13/17(c)(d) | 842,997 | 852,127 | ||||||
QS0001 Corp., 1st Lien Term Loan, 5.000%, 11/09/18(c)(d) | 4,553,588 | 4,614,287 | ||||||
Sensata Technologies Finance Co. LLC, Term Loan, 3.750%, 05/11/18(c)(d) | 14,968,388 | 15,124,807 | ||||||
|
| |||||||
| 80,480,567 | ||||||||
|
| |||||||
Oil & Gas 5.2% |
| |||||||
Alon USA Energy, Inc., Master Limited Partnership Term Loan, 9.250%, 11/26/18(c)(d) | 6,553,021 | 6,798,759 | ||||||
Citgo Petroleum Corp., Term Loan B, 8.000%, 06/24/15(c)(d) | 1,862,857 | 1,876,829 | ||||||
Citgo Petroleum Corp., Term Loan C, 9.000%, 06/23/17(c)(d) | 3,404,286 | 3,472,371 | ||||||
EMG Utica LLC, Term Loan, 03/31/20(a)(b)(c) | 6,170,000 | 6,193,137 | ||||||
Energy Transfer Equity, LP, New Term Loan B, 3.750%, 03/24/17(c)(d)(e) | 71,975,000 | 72,200,282 | ||||||
EP Energy LLC, Incremental Term Loan, 4.500%, 04/26/19(c)(d) | 18,460,000 | 18,682,997 | ||||||
See Notes to Financial Statements.
90
SCHEDULES OF PORTFOLIO INVESTMENTS
RIDGEWORTH FUNDS March 31, 2013
Seix Floating Rate High Income Fund — continued
| Shares or Principal Amount($) | Value($) | |||||||
Oil & Gas—continued |
| |||||||
Frac Tech International LLC, Term Loan B, 8.500%, 05/06/16(c)(d)(e) | 25,262,896 | 23,859,289 | ||||||
MEG Energy Corp., Refinance Term Loan, 3.750%, 03/31/20(c)(d) | 27,440,557 | 27,701,243 | ||||||
NFR Energy LLC, 2nd Lien Term Loan, 8.750%, 12/31/18(c)(d) | 4,520,000 | 4,624,548 | ||||||
Obsidian Holdings LLC, Tranche A, 6.750%, 11/02/15(c)(d) | 2,267,975 | 2,256,635 | ||||||
Obsidian Natural Gas Trust, Term Loan, 7.000%, 11/02/15(b)(c)(d) | 23,422,840 | 23,539,954 | ||||||
Plains Exploration & Production, 7 Year Term Loan, 4.000%, 11/30/19(c)(d)(e) | 36,515,000 | 36,551,515 | ||||||
Ruby Western Pipeline Holdings, LLC, Term Loan B, 03/27/20(a)(b)(c) | 12,365,000 | 12,504,106 | ||||||
Samson Investment Co., 2nd Lien Term Loan, 09/25/18(a)(b)(c) | 7,638,908 | 7,724,846 | ||||||
Saxon Energy Services, Inc., Term Loan B, 5.500%, 01/22/19(c)(d) | 6,415,000 | 6,441,750 | ||||||
Tesoro Corp., Term Loan B, 01/30/16(a)(b)(c) | 12,720,000 | 12,863,100 | ||||||
TPF Generation Holdings LLC, Synthetic Letter of Credit, 2.284%, 12/13/13(c)(d) | 1,230,023 | 1,226,948 | ||||||
Vantage Drilling Co., Term Loan B, 03/22/19(a)(b)(c) | 12,360,000 | 12,406,350 | ||||||
Vantage Drilling Co., Term Loan, 6.250%, 10/26/17(c)(d) | 27,217,125 | 27,387,232 | ||||||
|
| |||||||
| 308,311,891 | ||||||||
|
| |||||||
Packaging & Containers 3.1% |
| |||||||
Berlin Packaging LLC, 1st Lien Term Loan, 03/25/19(a)(b)(c) | 3,530,000 | 3,512,350 | ||||||
Berry Plastics Holding Corp., Term Loan C, 2.204%, 04/03/15(c)(d)(e) | 13,395,635 | 13,438,902 | ||||||
| Shares or Principal Amount($) | Value($) | |||||||
Packaging & Containers—continued |
| |||||||
Berry Plastics Holding Corp., Term Loan D, 3.500%, 02/04/20(c)(d) | 116,260,000 | 115,942,610 | ||||||
BWAY Corp., Term Loan B, 4.500%-5.500%, 08/07/17(c)(d) | 5,441,363 | 5,498,497 | ||||||
Consolidated Container Co. LLC, Term Loan Reprice, 5.000%, 07/03/19(c)(d) | 4,567,050 | 4,616,785 | ||||||
Reynolds Group Holdings, Inc., New Dollar Term Loan, 4.750%, 09/28/18(c)(d) | 18,407,500 | 18,662,444 | ||||||
Sealed Air Corp., New Term Loan, 4.000%, 10/03/18(c)(d) | 2,684,125 | 2,718,455 | ||||||
Tronox, Inc., Term Loan, 03/13/20(a)(b)(c) | 18,615,000 | 18,863,138 | ||||||
|
| |||||||
| 183,253,181 | ||||||||
|
| |||||||
Real Estate 2.1% | ||||||||
Alliant Holdings I, Inc., New Term Loan B, 5.000%, 12/20/19(c)(d) | 10,842,825 | 10,969,361 | ||||||
CB Richard Ellis Services, Inc., New Term Loan B, 03/29/21(a)(b)(c) | 19,400,000 | 19,497,000 | ||||||
General Growth Properties, Inc., Debtor in Possession Term Loan, 07/11/16(a)(b)(c) | 17,888,152 | 17,530,389 | ||||||
Istar Financial, Inc., Term Loan, 4.500%, 09/28/17(c)(d) | 56,402,678 | 56,843,182 | ||||||
Istar Financial, Inc., Add on Term Loan A2, 7.000%, 03/17/17(c)(d) | 5,590,000 | 5,951,617 | ||||||
Realogy Corp., Letter of Credit, 3.228%, 10/10/13(c)(d) | 155,119 | 154,925 | ||||||
Realogy Corp., Extended Letter of Credit, 4.459%, 10/10/16(c)(d) | 755,357 | 765,116 | ||||||
Realogy Corp., Extended Term Loan, 4.500%, 03/05/20(c)(d) | 12,860,000 | 13,026,151 | ||||||
|
| |||||||
| 124,737,741 | ||||||||
|
| |||||||
See Notes to Financial Statements.
91
SCHEDULES OF PORTFOLIO INVESTMENTS
RIDGEWORTH FUNDS March 31, 2013
Seix Floating Rate High Income Fund — continued
| Shares or Principal Amount($) | Value($) | |||||||
Retail 4.6% | ||||||||
Academy Ltd., Term Loan, 4.750%, 08/03/18(c)(d) | 6,363,025 | 6,446,954 | ||||||
Albertson’s, LLC, Term Loan, 5.750%, 03/21/16(c)(d) | 22,005,000 | 22,362,581 | ||||||
BJ’s Wholesale Club, Inc., Replacement Term Loan, 4.250%, 09/26/19(c)(d) | 8,250,000 | 8,320,455 | ||||||
Capital Automotive LP, Term Loan B, 5.250%, 03/10/17(c)(d)(e) | 55,097,436 | 55,218,099 | ||||||
Evergreen Acqco 1 LP, New Term Loan, 5.000%, 07/09/19(c)(d) | 6,412,775 | 6,486,907 | ||||||
Gymboree Co. ( The), Initial Term Loan, 5.000%, 02/23/18(c)(d) | 9,100,000 | 8,807,526 | ||||||
Harbor Freight Tools USA, Inc., Term Loan B, 5.500%, 11/14/17(c)(d) | 4,552,125 | 4,603,336 | ||||||
HMK Intermediate Holdings LLC, Term Loan, 7.250%, 03/29/19(c)(d) | 9,177,300 | 9,246,130 | ||||||
J Crew Group, Inc., Term Loan B1, 4.000%, 03/07/18(c)(d) | 7,295,681 | 7,371,410 | ||||||
Jo-Ann Stores, Inc., Term Loan, 4.000%, 03/16/18(c)(d) | 9,756,448 | 9,846,695 | ||||||
Michaels Stores, Inc., New Term Loan, 3.750%, 01/28/20(c)(d) | 12,725,000 | 12,843,343 | ||||||
NBTY, Inc., Term Loan B2, 3.500%, 10/01/17(c)(d) | 9,075,518 | 9,177,618 | ||||||
Ollie’s Bargain Outlet, Inc., Term Loan, 5.250%-6.250%, 09/27/19(c)(d) | 5,500,000 | 5,527,500 | ||||||
Party City Holdings, Inc., Refinance Term Loan B, 4.250%, 07/29/19(b)(c)(d) | 18,787,800 | 18,914,054 | ||||||
Petco Animal Supplies, Inc., New Term Loan, 4.000%, 11/24/17(c)(d) | 12,637,280 | 12,793,729 | ||||||
Phillips-Van Heusen Corp., Term Loan B, 3.250%, 12/19/19(c)(d) | 17,745,000 | 17,920,676 | ||||||
| Shares or Principal Amount($) | Value($) | |||||||
Retail—continued | ||||||||
Pilot Travel Centers LLC, Term Loan B2, 4.250%, 08/07/19(c)(d) | 5,572,000 | 5,632,958 | ||||||
Rite Aid Corp., Term Loan 6, 4.000%, 02/21/20(c)(d) | 18,310,000 | 18,508,297 | ||||||
Rite Aid Corp., 2nd Lien Term Loan, 5.750%, 08/21/20(c)(d) | 10,985,000 | 11,369,475 | ||||||
Supervalu, Inc., New Term Loan B, 6.250%, 03/21/19(c)(d) | 7,415,000 | 7,536,309 | ||||||
Toys ‘R’ Us-Delaware, Inc., Term Loan B3, 5.250%, 05/25/18(c)(d) | 4,122,516 | 3,923,274 | ||||||
Toys ‘R’ Us-Delaware, Inc., New Term Loan, 6.000%, 09/01/16(c)(d) | 10,444,195 | 10,217,869 | ||||||
|
| |||||||
| 273,075,195 | ||||||||
|
| |||||||
Semiconductors 2.2% | ||||||||
Freescale Semiconductor, Inc., Term Loan B3, 4.250%, 12/01/16(c)(d) | 3,000,000 | 3,021,240 | ||||||
Freescale Semiconductor, Inc., Term Loan B4, 5.000%, 03/02/20(c)(d)(e) | 64,190,000 | 64,330,576 | ||||||
Microsemi Corp., Repriced Term Loan, 3.750%, 02/19/20(c)(d) | 14,645,000 | 14,769,483 | ||||||
ON Semiconductor Corp., Term Loan A, 01/02/18(a)(b)(c) | 46,990,000 | 45,345,350 | ||||||
Semtech Corp., Term Loan B, 4.250%, 03/20/17(c)(d) | 3,692,100 | 3,729,021 | ||||||
|
| |||||||
| 131,195,670 | ||||||||
|
| |||||||
Software 0.6% | ||||||||
Eze Castle Software, Inc., 1st Lien Term Loan, 02/22/20(a)(b)(c) | 3,000,000 | 3,042,510 | ||||||
Genesys Telecom Holdings, US, Inc., Senior Debt B, 4.000%, 01/25/20(c)(d) | 2,858,571 | 2,872,864 | ||||||
Sophia, LP, New Term Loan B, 4.500%, 07/19/18(c)(d) | 10,315,981 | 10,455,247 | ||||||
See Notes to Financial Statements.
92
SCHEDULES OF PORTFOLIO INVESTMENTS
RIDGEWORTH FUNDS March 31, 2013
Seix Floating Rate High Income Fund — continued
| Shares or Principal Amount($) | Value($) | |||||||
Software—continued | ||||||||
SurveyMonkey.com, LLC, Term Loan B, 5.500%, 02/05/19(c)(d) | 15,965,000 | 16,164,563 | ||||||
VeriFone, Inc., Term Loan A, 12/28/16(a)(b)(c) | 3,676,371 | 3,671,775 | ||||||
VeriFone, Inc., New Term Loan B, 4.250%, 12/28/18(c)(d) | 1,136,764 | 1,137,901 | ||||||
|
| |||||||
| 37,344,860 | ||||||||
|
| |||||||
Telecommunication Services 11.4% |
| |||||||
Alcatel-Lucent USA, Inc., USD Term Loan B, 6.250%, 07/29/16(c)(d) | 2,270,000 | 2,299,987 | ||||||
Alcatel-Lucent USA, Inc., USD Term Loan C, 7.250%, 01/31/19(b)(c)(d)(e) | 41,002,238 | 41,589,800 | ||||||
Arris Group, Inc., Term Loan B, 02/07/20(a)(b)(c) | 29,315,000 | 29,351,644 | ||||||
Atlantic Broadband Finance, LLC, New Term Loan B, | 3,298,425 | 3,341,305 | ||||||
Avaya, Inc., Extended Term Loan B3, 4.788%, 10/26/17(b)(c)(d) | 17,410,053 | 16,413,328 | ||||||
Avaya, Inc., Term Loan B5, 8.000%, 03/30/18(c)(d) | 11,023,114 | 11,085,174 | ||||||
BBHI Acquisition LLC, Term Loan B, 4.500%, 12/14/17(c)(d) | 4,600,578 | 4,628,182 | ||||||
Cequel Communications LLC, Term Loan B, 4.000%, 02/14/19(c)(d)(e) | 38,639,303 | 38,977,397 | ||||||
Consolidated Communications, Inc., Term Loan B3, 5.250%, 12/31/18(c)(d) | 7,710,675 | 7,791,637 | ||||||
Cricket Communications, Inc., Term Loan C, 02/21/20(a)(b)(c) | 13,775,000 | 13,847,319 | ||||||
Cricket Communications, Inc., Term Loan, 4.750%, 10/10/19(c)(d) | 4,598,475 | 4,618,616 | ||||||
Crown Castle International Corp., Term Loan B, 4.000%, 01/31/19(c)(d) | 22,045,744 | 22,275,460 | ||||||
CSC Holdings, Inc., Extended Term Loan A4, 2.454%, 12/30/16(c)(d) | 780,125 | 778,822 | ||||||
| Shares or Principal Amount($) | Value($) | |||||||
Telecommunication Services—continued |
| |||||||
Cumulus Media Holdings Inc., 1st Lien Term Loan, 4.500%, 09/17/18(c)(d) | 27,743,063 | 28,084,025 | ||||||
Cumulus Media Holdings Inc., 2nd Lien Term Loan, 7.500%, 09/16/19(c)(d) | 13,680,000 | 14,079,046 | ||||||
Entercom Radio, LLC, Term Loan B, | 4,082,386 | 4,147,459 | ||||||
Gray Television, Inc., New Term Loan B, 4.750%, 10/15/19(c)(d) | 16,662,117 | 16,842,568 | ||||||
Integra Telecom, Inc., Refinance Term Loan, 6.000%, 02/15/19(c)(d) | 18,340,000 | 18,572,184 | ||||||
Integra Telecom, Inc., Refinance 2nd Lien Term Loan, 9.750%, 02/15/20(c)(d) | 7,530,000 | 7,721,413 | ||||||
Intelsat Jackson Holdings Ltd., Term Loan, 3.205%, 02/03/14(b)(c)(d) | 26,265,000 | 26,225,602 | ||||||
Intelsat Jackson Holdings Ltd., Term Loan B1, 4.500%, 04/02/18(c)(d)(e) | 59,452,696 | 60,255,308 | ||||||
Kabel Deutschland GMBH, Term Loan F1, 3.250%, 02/01/19(c)(d) | 17,285,000 | 17,450,590 | ||||||
Level 3 Financing, Inc., Term Loan, 4.750%, 08/01/19(c)(d)(e) | 74,405,000 | 75,226,431 | ||||||
Level 3 Financing, Inc., 2019 Term Loan B, 5.250%, 08/01/19(c)(d) | 29,765,000 | 30,144,504 | ||||||
LIN Television Corp., Term Loan B, 4.000%, 12/21/18(c)(d) | 5,407,646 | 5,458,369 | ||||||
MCC Iowa LLC, Term Loan D2, 1.930%, 01/30/15(c)(d) | 736,237 | 733,476 | ||||||
MetroPCS Wireless, Inc., New Term Loan B3, 4.000%, 03/16/18(c)(d) | 13,832,976 | 13,865,068 | ||||||
Mission Broadcasting, Inc., Mission Term Loan B, 1.750%-4.500%, 12/03/19(c)(d) | 809,714 | 822,370 | ||||||
See Notes to Financial Statements.
93
SCHEDULES OF PORTFOLIO INVESTMENTS
RIDGEWORTH FUNDS March 31, 2013
Seix Floating Rate High Income Fund — continued
| Shares or Principal Amount($) | Value($) | |||||||
Telecommunication Services—continued |
| |||||||
NEP Supershooters, LP, 2nd Lien Term Loan, 9.500%, 08/18/20(c)(d) | 1,142,857 | 1,188,571 | ||||||
Nexstar Broadcasting, Inc., Term Loan, 4.500%, 12/03/19(c)(d) | 1,915,286 | 1,945,222 | ||||||
Peak Ten, Inc., New Term Loan B, 7.250%, 10/25/18(c)(d) | 9,226,875 | 9,307,610 | ||||||
Telx Group, Inc., Term Loan B, 6.250%, 09/26/17(c)(d) | 7,378,298 | 7,439,759 | ||||||
UPC Financing Partnership, Term Loan T, 3.704%, 12/30/16(c)(d) | 220,210 | 221,311 | ||||||
Virgin Media Investment Holdings Ltd., USD Term Loan B, 02/17/20(a)(b)(c) | 68,835,000 | 68,503,904 | ||||||
WMG Acquisition Corp., Term Loan, 5.250%, 11/01/18(c)(d) | 6,394,063 | 6,486,009 | ||||||
Zayo Group LLC, New Term Loan B, 4.500%-4.750%, 07/02/19(c)(d)(e) | 61,684,248 | 62,265,930 | ||||||
|
| |||||||
| 673,985,400 | ||||||||
|
| |||||||
Telecommunications 1.8% | ||||||||
Lightsquared LP, Term Loan B, 0.000%, 10/01/14(c)(d)(f)(h) | 7,236,851 | 6,778,541 | ||||||
SBA Finance, Add on Term Loan, 3.750%, 09/27/19(c)(d) | 4,638,375 | 4,693,479 | ||||||
Vodafone Americas Finance 2, PIK Term Loan B, 6.250%, 07/11/16(d)(g) | 47,906,719 | 49,224,153 | ||||||
Vodafone Americas Finance 2, PIK Term Loan, 6.875%, 08/11/15(d)(g) | 30,445,923 | 31,054,842 | ||||||
Windstream Corp., Term Loan B4, 3.500%, 01/23/20(c)(d) | 10,832,850 | 10,934,462 | ||||||
Windstream Corp., Term Loan B3, 4.000%, 08/08/19(c)(d) | 5,558,000 | 5,630,977 | ||||||
|
| |||||||
| 108,316,454 | ||||||||
|
| |||||||
| Shares or Principal Amount($) | Value($) | |||||||
Textiles 0.0%(i) | ||||||||
Wolverine Worldwide, Inc., Term Loan B, 4.000%-5.250%, 07/31/19(c)(d) | 2,449,063 | 2,470,493 | ||||||
|
| |||||||
Transportation 1.5% | ||||||||
American Petroleum Tankers LLC, Term Loan B, 09/30/19(a)(b)(c) | 11,905,000 | 11,845,475 | ||||||
August LuxUK Holding Co., S.A.R.L., Luxco Term Loan, 6.250%, 04/27/18(c)(d) | 2,617,910 | 2,650,634 | ||||||
August LuxUK Holding Co., S.A.R.L., Luxco 2nd Lien Term Loan, 10.500%, 04/29/19(c)(d) | 1,130,000 | 1,141,300 | ||||||
August U.S. Holding Co., Inc., Term Loan B, 6.250%, 04/27/18(c)(d) | 2,013,815 | 2,038,988 | ||||||
August U.S. Holding Co., Inc., 2nd Lien Term Loan, 10.500%, 04/29/19(c)(d) | 870,000 | 878,700 | ||||||
Avis Budget Car Rental, LLC, New Term Loan, 3.750%, 03/15/19(c)(d) | 9,319,035 | 9,414,182 | ||||||
Commercial Barge Line Co., 1st Lien Term Loan, 7.500%, 09/23/19(c)(d) | 13,245,000 | 13,245,000 | ||||||
Delta Air Lines, Inc., Term Loan B1, 5.250%, 10/18/18(c)(d) | 13,690,000 | 13,901,784 | ||||||
FleetPride Corp., 1st Lien Term Loan, 5.250%, 11/20/19(c)(d) | 7,256,813 | 7,334,823 | ||||||
Goodyear Tire & Rubber Co. (The), New 2nd Lien Term Loan, 4.750%, 04/30/19(c)(d) | 2,805,000 | 2,827,188 | ||||||
Sabre, Inc., Term Loan C, 4.000%-5.250%, 02/19/18(c)(d) | 11,030,250 | 11,087,387 | ||||||
Sabre, Inc., Term Loan B, 5.250%-6.250%, 02/19/19(c)(d) | 6,857,813 | 6,943,467 | ||||||
United Airlines, Inc., New Term Loan B, 03/22/19(a)(b)(c) | 4,860,000 | 4,904,566 | ||||||
|
| |||||||
| 88,213,494 | ||||||||
|
| |||||||
See Notes to Financial Statements.
94
SCHEDULES OF PORTFOLIO INVESTMENTS
RIDGEWORTH FUNDS March 31, 2013
Seix Floating Rate High Income Fund — continued
| Shares or Principal Amount($) | Value($) | |||||||
Utilities 0.7% |
| |||||||
AES Corp., Refinance Term Loan B, 3.750%, 06/01/18(c)(d) | 20,524,147 | 20,789,935 | ||||||
Astoria Generating Co. Acquisitions, LLC, New Term Loan, 8.500%, 10/26/17(c)(d) | 6,475,000 | 6,693,531 | ||||||
NGPL PipeCo LLC, Term Loan B, 6.750%, 09/15/17(c)(d) | 11,551,250 | 11,700,492 | ||||||
|
| |||||||
| 39,183,958 | ||||||||
|
| |||||||
Total Bank Loans (Cost $5,079,422,715) | 5,149,793,200 | |||||||
|
| |||||||
Corporate Bonds 5.2% |
| |||||||
Auto Manufacturers 0.0%(i) |
| |||||||
General Motors Co. Escrow, 7.200%(f)(g)(j)(k) | 10,000,000 | — | ||||||
General Motors Co. Escrow, 8.375%(f)(g)(j)(k) | 10,000,000 | — | ||||||
|
| |||||||
| — | ||||||||
|
| |||||||
Commercial Services 0.2% |
| |||||||
Ceridian Corp., 11.250%, 11/15/15 | 10,000,000 | 10,325,000 | ||||||
Harland Clarke Holdings Corp., 9.750%, 08/01/18(c) | 3,715,000 | 3,937,900 | ||||||
|
| |||||||
| 14,262,900 | ||||||||
|
| |||||||
Diversified Financial Services 0.2% |
| |||||||
International Lease Finance Corp., 3.875%, 04/15/18 | 9,890,000 | 9,865,275 | ||||||
|
| |||||||
Electric 0.7% |
| |||||||
General Cable Corp., 2.659%, 04/01/15(d)(e) | 6,031,000 | 5,963,151 | ||||||
Glenn Pool Oil & Gas Trust, 6.000%, 08/02/21(c) | 35,354,147 | 36,591,542 | ||||||
|
| |||||||
| 42,554,693 | ||||||||
|
| |||||||
Entertainment 0.0%(i) |
| |||||||
Diamond Resorts Corp., 12.000%, 08/15/18 | 1,000,000 | 1,105,000 | ||||||
|
| |||||||
Food 0.2% |
| |||||||
Hawk Acquisition Sub, Inc., 4.250%, 10/15/20(b)(c) | 13,100,000 | 13,116,375 | ||||||
|
| |||||||
| Shares or Principal Amount($) | Value($) | |||||||
Hand/Machine Tools 0.0%(i) |
| |||||||
Milacron LLC/Mcron Finance Corp., 7.750%, 02/15/21(c) | 200,000 | 206,750 | ||||||
|
| |||||||
Holding Companies-Diversified 0.0%(i) |
| |||||||
WaveDivision Escrow LLC/WaveDivision Escrow Corp., 8.125%, 09/01/20(c) | 2,195,000 | 2,293,775 | ||||||
|
| |||||||
Internet 0.1% |
| |||||||
Zayo Escrow Corp., 8.125%, 01/01/20 | 1,475,000 | 1,652,000 | ||||||
Zayo Escrow Corp., 10.125%, 07/01/20 | 2,365,000 | 2,784,788 | ||||||
|
| |||||||
| 4,436,788 | ||||||||
|
| |||||||
Media 0.6% |
| |||||||
Clear Channel Communications, Inc., 9.000%, 12/15/19(c) | 10,353,000 | 9,951,821 | ||||||
Clear Channel Communications, Inc., 11.250%, 03/01/21(c) | 1,185,000 | 1,214,625 | ||||||
LIN Television Corp., 8.375%, 04/15/18 | 17,555,000 | 19,113,006 | ||||||
McGraw-Hill Global Education Holdings LLC/McGraw-Hill Global Education Finance, 9.750%, 04/01/21(c) | 1,585,000 | 1,569,150 | ||||||
Univision Communications, Inc., 6.875%, 05/15/19(c) | 1,925,000 | 2,059,750 | ||||||
|
| |||||||
| 33,908,352 | ||||||||
| �� | |||||||
Mining 0.0%(i) |
| |||||||
Inmet Mining Corp., 8.750%, 06/01/20(c) | 1,170,000 | 1,298,700 | ||||||
|
| |||||||
Miscellaneous Manufacturer 0.3% |
| |||||||
Bombardier, Inc., 4.250%, 01/15/16(c) | 15,000,000 | 15,562,500 | ||||||
|
| |||||||
Oil & Gas 0.2% |
| |||||||
Chesapeake Energy Corp., 3.250%, 03/15/16(b) | 10,000,000 | 10,112,500 | ||||||
Offshore Group Investment Ltd., 7.125%, 04/01/23(c) | 800,000 | 818,000 | ||||||
Range Resources Corp., 5.000%, 03/15/23(c) | 1,960,000 | 2,004,100 | ||||||
| �� |
|
| ||||||
| 12,934,600 | ||||||||
|
| |||||||
See Notes to Financial Statements.
95
SCHEDULES OF PORTFOLIO INVESTMENTS
RIDGEWORTH FUNDS March 31, 2013
Seix Floating Rate High Income Fund — continued
| Shares or Principal Amount($) | Value($) | |||||||
Oil & Gas Services 0.0%(i) |
| |||||||
Hornbeck Offshore Services, Inc., 5.000%, 03/01/21(c) | 160,000 | 158,800 | ||||||
|
| |||||||
Packaging & Containers 0.1% |
| |||||||
Crown Americas LLC/Crown Americas Capital Corp. IV, 4.500%, 01/15/23(c) | 5,000,000 | 4,850,000 | ||||||
|
| |||||||
Real Estate 0.0%(i) |
| |||||||
CBRE Services, Inc., 5.000%, 03/15/23 | 1,935,000 | 1,956,769 | ||||||
|
| |||||||
Telecommunication Services 2.6% |
| |||||||
CenturyLink, Inc., 5.625%, 04/01/20 | 1,345,000 | 1,375,263 | ||||||
Cricket Communications, Inc., 7.750%, 05/15/16(e) | 3,000,000 | 3,131,250 | ||||||
Frontier Communications Corp., 7.625%, 04/15/24(b) | 80,000 | 82,300 | ||||||
Intelsat Bermuda Ltd. PIK, 11.500%, 02/04/17(e) | 25,645,017 | 27,235,008 | ||||||
Intelsat Jackson Holdings SA, 7.250%, 10/15/20 | 3,750,000 | 4,120,313 | ||||||
Intelsat Jackson Holdings SA, 7.500%, 04/01/21 | 1,250,000 | 1,390,625 | ||||||
Intelsat Luxembourg SA, 7.750%, 06/01/21(b)(c) | 2,285,000 | 2,324,988 | ||||||
iPCS, Inc., 2.424%, 05/01/13(d)(e) | 10,318,000 | 10,305,618 | ||||||
Level 3 Communications, Inc., 11.875%, 02/01/19 | 3,000,000 | 3,517,500 | ||||||
Level 3 Financing, Inc., 8.125%, 07/01/19 | 4,065,000 | 4,471,500 | ||||||
Level 3 Financing, Inc., 10.000%, 02/01/18(e) | 3,440,000 | 3,801,200 | ||||||
Lynx II Corp., 6.375%, 04/15/23(c) | 1,600,000 | 1,676,000 | ||||||
MetroPCS Wireless, Inc., 6.250%, 04/01/21(c) | 6,445,000 | 6,557,787 | ||||||
MetroPCS Wireless, Inc., 6.625%, 04/01/23(c) | 5,375,000 | 5,482,500 | ||||||
NII International Telecom S.A.R.L., 11.375%, 08/15/19(c) | 2,560,000 | 2,675,200 | ||||||
Satmex Escrow SA de CV, 9.500%, 05/15/17 | 6,000,000 | 6,360,000 | ||||||
| Shares or Principal Amount($) | Value($) | |||||||
Telecommunication Services—continued |
| |||||||
Sprint Capital Corp., 6.875%, 11/15/28 | 2,000,000 | 2,045,000 | ||||||
Sprint Capital Corp., 8.750%, 03/15/32(e) | 1,700,000 | 2,027,250 | ||||||
Sprint Nextel Corp., 7.000%, 08/15/20 | 5,680,000 | 6,248,000 | ||||||
Sprint Nextel Corp., 11.500%, 11/15/21 | 2,280,000 | 3,192,000 | ||||||
Trilogy International Partners LLC, 10.250%, 08/15/16(c) | 12,958,000 | 12,698,840 | ||||||
Wind Acquisition Finance Holdings, PIK, 12.250%, 07/15/17(c) | 24,390,842 | 24,735,701 | ||||||
Wind Acquisition Finance SA, 7.250%, 02/15/18(c) | 9,940,000 | 10,350,025 | ||||||
Windstream Holding of the Midwest, Inc., 6.750%, 04/01/28(e) | 4,750,000 | 4,927,797 | ||||||
|
| |||||||
| 150,731,665 | ||||||||
|
| |||||||
Total Corporate Bonds | 309,242,942 | |||||||
|
| |||||||
Preferred Stock 0.1% |
| |||||||
Diversified Financial Services 0.1% |
| |||||||
GMAC Capital Trust I, | 94,025 | 2,557,480 | ||||||
|
| |||||||
Total Preferred Stock | 2,557,480 | |||||||
|
| |||||||
Common Stock 0.0%(i) |
| |||||||
Energy-Alternate Sources 0.0%(i) |
| |||||||
Aventine Renewable Energy Holdings, Inc.*(f)(g) | 69,037 | 1,035,555 | ||||||
|
| |||||||
Total Common Stock | 1,035,555 | |||||||
|
| |||||||
Money Market Fund 21.8% |
| |||||||
State Street Institutional U.S. Government Money Market Fund, Institutional Class, 0.01%(l) | 1,290,295,065 | 1,290,295,065 | ||||||
|
| |||||||
Total Money Market Fund | 1,290,295,065 | |||||||
|
| |||||||
Total Investments |
| 6,752,924,242 | ||||||
Liabilities in excess of other assets — (14.1)% | (832,544,501 | ) | ||||||
|
| |||||||
Net Assets — 100.0% | $ | 5,920,379,741 | ||||||
|
| |||||||
See Notes to Financial Statements.
96
SCHEDULES OF PORTFOLIO INVESTMENTS
RIDGEWORTH FUNDS March 31, 2013
Seix Floating Rate High Income Fund — concluded
| * | Non-income producing security. |
| (a) | The security does not have a stated settlement date and will receive a rate upon settling with the custodian. |
| (b) | All or a portion of this security has been purchased on a when-issued or delayed-delivery basis. |
| (c) | Rule 144A, Section 4(2) or other security which is restricted as to resale to institutional investors. The Fund’s investment adviser/subadviser has deemed this security to be liquid based upon procedures approved by the Board of Trustees. These securities represent 88.1% of net assets as of March 31, 2013. |
| (d) | Variable or floating rate security. Rate disclosed is as of March 31, 2013. |
| (e) | All or a portion of this security has been segregated, or otherwise earmarked, in connection with obligations for when-issued or delayed-delivery purchase commitments. |
| (f) | Security is in default. |
| (g) | The Fund’s investment adviser/subadviser has deemed this security to be illiquid based upon procedures approved by the Board of Trustees. |
| (h) | Bankrupt issuer. |
| (i) | Less than 0.05% of Net Assets. |
| (j) | Valued at fair value using procedures approved by the Board of Trustees. (See Note 2(a)) |
| (k) | Security is perpetual in nature and has no stated maturity. |
| (l) | Rate disclosed, the 7 day net yield, is as of March 31, 2013. |
Investment Abbreviations
| ADS | — | American Depositary Shares | ||
| PIK | — | Payment in-kind |
As of March 31, 2013, the Fund had the following unfunded loan commitment:
| Borrower | Unfunded Commitments | Unrealized Appreciation | ||||||
Syniverse Holdings | $22,900,000 | $136,999 | ||||||
The commitments are available until the maturity date of the respective security.
See Notes to Financial Statements.
97
SCHEDULES OF PORTFOLIO INVESTMENTS
RIDGEWORTH FUNDS March 31, 2013
Seix High Yield Fund
| Shares or Principal Amount($) | Value($) | |||||||
| Bank Loans 5.5% | ||||||||
Commercial Services 0.3% | ||||||||
ABC Supply, Bridge Term Loan, 03/28/14(a)(b)(c)(d) | 665,000 | 665,000 | ||||||
Walter Energy, Inc., Term Loan B, 5.750%, 04/02/18(a)(d) | 4,670,176 | 4,694,834 | ||||||
|
| |||||||
| 5,359,834 | ||||||||
|
| |||||||
Food 0.3% | ||||||||
HJ Heinz Co., 2nd Lien Bridge Term Loan, 02/14/14(a)(b)(c)(d) | 4,685,000 | 4,685,000 | ||||||
|
| |||||||
Health Care 0.0%(e) | ||||||||
Community Health Systems, Inc., Extended Term Loan, 3.784%-3.787%, 01/25/17(a)(d) | 845,273 | 853,439 | ||||||
|
| |||||||
Information Technology 0.6% |
| |||||||
CDW LLC, Extended Term Loan, 4.000%, 07/14/17(a)(d) | 10,467,790 | 10,507,044 | ||||||
|
| |||||||
Insurance 0.1% | ||||||||
Asurion LLC, New Term Loan B1, 4.500%, 05/24/19(a)(d) | 1,376,550 | 1,390,150 | ||||||
|
| |||||||
Media 0.9% | ||||||||
Charter Communications Operating LLC, Term Loan D, 4.000%, 05/15/19(a)(d) | 4,692,600 | 4,729,484 | ||||||
Nielsen Holdings NV, Bridge Term Loan, 02/21/14(a)(b)(c)(d) | 4,915,000 | 4,915,000 | ||||||
Tribune Co., Exit Term Loan, 4.000%, 12/31/19(a)(d) | 6,643,350 | 6,696,497 | ||||||
|
| |||||||
| 16,340,981 | ||||||||
|
| |||||||
Mining 0.1% | ||||||||
FMG America Finance, Inc., Term Loan, 5.250%, 10/18/17(a)(d) | 1,114,400 | 1,127,037 | ||||||
|
| |||||||
Oil & Gas 0.6% | ||||||||
Energy Transfer Equity, L.P., New Term Loan B, 3.750%, 03/24/17(a)(d) | 10,890,000 | 10,924,086 | ||||||
|
| |||||||
Packaging & Containers 0.3% |
| |||||||
Berry Plastics Holding Corp., Term Loan D, 3.500%, 02/04/20(a)(b)(d) | 5,835,000 | 5,819,070 | ||||||
|
| |||||||
| Shares or Principal Amount($) | Value($) | |||||||
Retail 0.2% | ||||||||
Toys ‘R’ Us-Delaware, Inc., New Term Loan, 6.000%, 09/01/16(a)(d) | 4,224,169 | 4,132,631 | ||||||
|
| |||||||
Semiconductors 0.4% | ||||||||
Freescale Semiconductor, Inc., Term Loan B4, 03/02/20(a)(b)(c)(d) | 7,955,000 | 7,972,422 | ||||||
|
| |||||||
Telecommunication Services 1.7% |
| |||||||
Alcatel-Lucent USA, Inc., USD Term Loan C, 01/31/19(a)(b)(c)(d) | 2,638,388 | 2,676,195 | ||||||
Cequel Communications LLC, Term Loan B, 4.000%, 02/14/19(a)(d) | 11,939,400 | 12,043,870 | ||||||
Crown Castle International Corp., Term Loan B, 4.000%, 01/31/19(a)(d) | 5,939,850 | 6,001,743 | ||||||
Level 3 Financing, Inc., 2019 Term Loan B, 5.250%, 08/01/19(a)(d) | 6,605,000 | 6,689,214 | ||||||
Virgin Media Investment Holdings Ltd., USD Term Loan B, 02/17/20(a)(b)(c)(d) | 5,305,000 | 5,279,483 | ||||||
|
| |||||||
| 32,690,505 | ||||||||
|
| |||||||
Total Bank Loans | 101,802,199 | |||||||
|
| |||||||
| Corporate Bonds 88.3% | ||||||||
Advertising 0.4% | ||||||||
Affinion Group, Inc., 7.875%, 12/15/18(f) | 5,435,000 | 4,293,650 | ||||||
MDC Partners, Inc., 6.750%, 04/01/20(a) | 3,690,000 | 3,726,900 | ||||||
|
| |||||||
| 8,020,550 | ||||||||
|
| |||||||
Aerospace/Defense 0.6% | ||||||||
BE Aerospace, Inc., 5.250%, 04/01/22 | 4,915,000 | 5,068,594 | ||||||
Ducommun, Inc., 9.750%, 07/15/18 | 3,230,000 | 3,553,000 | ||||||
GenCorp, Inc., 7.125%, 03/15/21(a) | 3,140,000 | 3,312,700 | ||||||
|
| |||||||
| 11,934,294 | ||||||||
|
| |||||||
Airlines 0.8% | ||||||||
Air Canada, Inc., 9.250%, 08/01/15(a)(f) | 11,740,000 | 12,503,100 | ||||||
See Notes to Financial Statements.
98
SCHEDULES OF PORTFOLIO INVESTMENTS
RIDGEWORTH FUNDS March 31, 2013
Seix High Yield Fund — continued
| Shares or Principal Amount($) | Value($) | |||||||
Airlines—continued | ||||||||
Continental Airlines Pass Thru Certificate, Series 2012-B, C1 B, 6.250%, 04/11/20, Series B | 1,960,000 | 2,058,000 | ||||||
|
| |||||||
| 14,561,100 | ||||||||
|
| |||||||
Apparel 0.3% | ||||||||
Wolverine World Wide, Inc., 6.125%, 10/15/20(a) | 4,730,000 | 5,019,713 | ||||||
|
| |||||||
Auto Parts & Equipment 1.2% |
| |||||||
AFFINIA Group, Inc., 10.750%, 08/15/16(a) | 1,648,000 | 1,788,080 | ||||||
Cooper-Standard Automotive, Inc., 8.500%, 05/01/18 | 8,893,000 | 9,693,370 | ||||||
Delphi Corp., 5.000%, 02/15/23 | 4,475,000 | 4,732,312 | ||||||
Lear Corp., 4.750%, 01/15/23(a) | 6,540,000 | 6,376,500 | ||||||
|
| |||||||
| 22,590,262 | ||||||||
|
| |||||||
Banks 3.6% | ||||||||
Ally Financial, Inc., 7.500%, 09/15/20(g) | 13,841,000 | 16,886,020 | ||||||
Ally Financial, Inc., 8.000%, 11/01/31 | 13,755,000 | 17,400,075 | ||||||
CIT Group, Inc., 4.250%, 08/15/17 | 7,205,000 | 7,529,225 | ||||||
CIT Group, Inc., 5.000%, 05/15/17 | 6,425,000 | 6,890,812 | ||||||
CIT Group, Inc., 5.250%, 03/15/18 | 3,540,000 | 3,823,200 | ||||||
CIT Group, Inc., 6.625%, 04/01/18(a) | 6,630,000 | 7,558,200 | ||||||
Provident Funding Associates LP/PFG Finance Corp., 10.125%, 02/15/19(a) | 2,685,000 | 2,926,650 | ||||||
Provident Funding Association LP, 10.250%, 04/15/17(a)(f) | 3,455,000 | 3,852,325 | ||||||
|
| |||||||
| 66,866,507 | ||||||||
|
| |||||||
Beverages 0.1% | ||||||||
Cott Beverages, Inc., 8.125%, 09/01/18 | 1,500,000 | 1,638,750 | ||||||
|
| |||||||
Building Materials 2.1% | ||||||||
Building Materials Corp. of America, 6.750%, 05/01/21(a)(f) | 2,885,000 | 3,151,863 | ||||||
| Shares or Principal Amount($) | Value($) | |||||||
Building Materials—continued |
| |||||||
Cemex Finance LLC, 9.375%, 10/12/22(a) | 3,575,000 | 4,155,937 | ||||||
Cemex SAB de CV, 5.875%, 03/25/19(a) | 2,775,000 | 2,802,750 | ||||||
Gibraltar Industries, Inc., 6.250%, 02/01/21(a) | 3,180,000 | 3,370,800 | ||||||
Masco Corp., 5.950%, 03/15/22 | 5,540,000 | 6,231,575 | ||||||
USG Corp., 8.375%, 10/15/18(a) | 11,650,000 | 12,873,250 | ||||||
USG Corp., 9.750%, 08/01/14(a) | 5,845,000 | 6,341,825 | ||||||
|
| |||||||
| 38,928,000 | ||||||||
|
| |||||||
Chemicals 1.3% | ||||||||
Huntsman International LLC, 8.625%, 03/15/21 | 1,055,000 | 1,186,875 | ||||||
Ineos Finance PLC, 7.500%, 05/01/20(a) | 4,100,000 | 4,463,875 | ||||||
Ineos Finance PLC, 9.000%, 05/15/15(a) | 1,775,000 | 1,868,188 | ||||||
Kinove German Bondco GmbH, 9.625%, 06/15/18(a) | 3,647,000 | 4,057,287 | ||||||
LyondellBasell Industries, 6.000%, 11/15/21 | 2,025,000 | 2,399,625 | ||||||
Nova Chemicals Corp., 8.625%, 11/01/19 | 2,845,000 | 3,200,625 | ||||||
Nufarm Australia Ltd., 6.375%, 10/15/19(a) | 2,000,000 | 2,050,000 | ||||||
Oxea Finance & Cy SCA, 9.500%, 07/15/17(a) | 2,405,000 | 2,609,425 | ||||||
PetroLogistics LP/PetroLogistics Finance Corp., 6.250%, 04/01/20(a) | 3,218,000 | 3,238,112 | ||||||
|
| |||||||
| 25,074,012 | ||||||||
|
| |||||||
Coal 0.5% |
| |||||||
Peabody Energy Corp., 6.250%, 11/15/21 | 6,780,000 | 7,051,200 | ||||||
Walter Energy, Inc., 8.500%, 04/15/21(a) | 2,315,000 | 2,372,875 | ||||||
|
| |||||||
| 9,424,075 | ||||||||
|
| |||||||
Commercial Services 4.1% |
| |||||||
Avis Budget Car Rental LLC/Avis Budget Finance, Inc., 8.250%, 01/15/19 | 4,945,000 | 5,482,769 | ||||||
Avis Budget Car Rental LLC/Avis Budget Finance, Inc., 9.625%, 03/15/18 | 3,855,000 | 4,351,370 | ||||||
See Notes to Financial Statements.
99
SCHEDULES OF PORTFOLIO INVESTMENTS
RIDGEWORTH FUNDS March 31, 2013
Seix High Yield Fund — continued
| Shares or Principal Amount($) | Value($) | |||||||
Commercial Services—continued |
| |||||||
FTI Consulting, Inc., 6.000%, 11/15/22(a) | 3,750,000 | 3,965,625 | ||||||
Harland Clarke Holdings Corp., 9.750%, 08/01/18(a) | 12,180,000 | 12,910,800 | ||||||
Iron Mountain, Inc., 7.750%, 10/01/19 | 4,135,000 | 4,595,019 | ||||||
Iron Mountain, Inc., 8.000%, 06/15/20 | 1,515,000 | 1,586,963 | ||||||
Lender Processing Services, Inc., 5.750%, 04/15/23 | 3,760,000 | 3,919,800 | ||||||
Live Nation Entertainment, Inc., 7.000%, 09/01/20(a) | 2,475,000 | 2,660,625 | ||||||
Live Nation Entertainment, Inc., 8.125%, 05/15/18(a) | 3,465,000 | 3,768,187 | ||||||
National Money Mart Co., 10.375%, 12/15/16(f) | 2,720,000 | 2,998,800 | ||||||
Prospect Medical Holdings, Inc., 8.375%, 05/01/19(a) | 8,375,000 | 8,919,375 | ||||||
ServiceMaster Co., 8.000%, 02/15/20(g) | 11,365,000 | 12,188,962 | ||||||
United Rentals North America, Inc., 7.625%, 04/15/22 | 9,110,000 | 10,180,425 | ||||||
|
| |||||||
| 77,528,720 | ||||||||
|
| |||||||
Computers 1.4% |
| |||||||
Brocade Communications Systems, Inc., 4.625%, 01/15/23(a) | 3,855,000 | 3,729,713 | ||||||
j2 Global, Inc., 8.000%, 08/01/20 | 5,565,000 | 5,926,725 | ||||||
NCR Corp., 4.625%, 02/15/21(a) | 7,000,000 | 6,965,000 | ||||||
NCR Corp., 5.000%, 07/15/22(a) | 5,095,000 | 5,107,737 | ||||||
Seagate HDD Cayman, 6.875%, 05/01/20 | 1,610,000 | 1,730,750 | ||||||
Seagate HDD Cayman, 7.750%, 12/15/18(f) | 1,320,000 | 1,447,050 | ||||||
Seagate Technology International Co. Ltd., 10.000%, 05/01/14(a) | 532,000 | 562,590 | ||||||
SunGard Data Systems, Inc., 7.625%, 11/15/20 | 1,540,000 | 1,668,975 | ||||||
|
| |||||||
| 27,138,540 | ||||||||
|
| |||||||
Diversified Financial Services 4.5% |
| |||||||
Aircastle Ltd., 6.750%, 04/15/17 | 9,270,000 | 10,197,000 | ||||||
Aircastle Ltd., 7.625%, 04/15/20 | 9,545,000 | 11,048,337 | ||||||
| Shares or Principal Amount($) | Value($) | |||||||
Diversified Financial Services—continued |
| |||||||
CNG Holdings, Inc., 9.375%, 05/15/20(a) | 5,565,000 | 5,460,656 | ||||||
Community Choice Financial, Inc., 10.750%, 05/01/19 | 3,970,000 | 3,761,575 | ||||||
General Motors Financial Co., Inc., 6.750%, 06/01/18 | 1,185,000 | 1,342,013 | ||||||
Icahn Enterprises Finance Corp., 8.000%, 01/15/18 | 4,320,000 | 4,622,400 | ||||||
ILFC E-Capital Trust I, 4.680%, 12/21/65(a)(d)(f) | 12,420,000 | 10,867,500 | ||||||
ILFC E-Capital Trust II, 6.250%, 12/21/65(a)(d) | 2,490,000 | 2,346,825 | ||||||
International Lease Finance Corp., 5.650%, 06/01/14, MTN | 1,320,000 | 1,377,750 | ||||||
International Lease Finance Corp., 6.250%, 05/15/19 | 945,000 | 1,034,775 | ||||||
Jefferies Finance LLC/JFIN Co-Issuer Corp., 7.375%, 04/01/20(a) | 5,270,000 | 5,362,225 | ||||||
Nationstar Mortgage LLC/Nationstar Capital Corp., 6.500%, 07/01/21(a) | 4,000,000 | 4,170,000 | ||||||
Nationstar Mortgage LLC/Nationstar Capital Corp., 7.875%, 10/01/20(a) | 4,860,000 | 5,370,300 | ||||||
Nationstar Mortgage LLC/Nationstar Capital Corp., 9.625%, 05/01/19(a) | 2,965,000 | 3,394,925 | ||||||
Nationstar Mortgage LLC/Nationstar Capital Corp., 9.625%, 05/01/19(a) | 2,950,000 | 3,363,000 | ||||||
Oxford Finance LLC/Oxford Finance Co-Issuer, Inc., 7.250%, 01/15/18(a) | 3,850,000 | 3,994,375 | ||||||
SquareTwo Financial Corp., 11.625%, 04/01/17(f) | 5,570,000 | 5,667,475 | ||||||
|
| |||||||
| 83,381,131 | ||||||||
|
| |||||||
Electric 3.2% |
| |||||||
AES Corp. (The), 7.750%, 10/15/15 | 485,000 | 545,019 | ||||||
AES Corp. (The), 8.000%, 10/15/17 | 4,225,000 | 4,969,656 | ||||||
AES Corp. (The), 9.750%, 04/15/16 | 2,750,000 | 3,279,375 | ||||||
Calpine Corp., 7.500%, 02/15/21(a) | 4,140,000 | 4,543,650 | ||||||
See Notes to Financial Statements.
100
SCHEDULES OF PORTFOLIO INVESTMENTS
RIDGEWORTH FUNDS March 31, 2013
Seix High Yield Fund — continued
| Shares or Principal Amount($) | Value($) | |||||||
Electric—continued |
| |||||||
Calpine Corp., 7.875%, 01/15/23(a) | 5,679,000 | 6,303,690 | ||||||
Energy Future Intermediate Holding Co. LLC/EFIH Finance, Inc., 10.000%, 12/01/20(a) | 5,170,000 | 5,816,250 | ||||||
GenOn Energy, Inc., 9.500%, 10/15/18 | 490,000 | 576,975 | ||||||
GenOn Energy, Inc., 9.875%, 10/15/20 | 11,324,000 | 12,965,980 | ||||||
NRG Energy, Inc., 7.625%, 05/15/19 | 10,180,000 | 10,994,400 | ||||||
NRG Energy, Inc., 7.875%, 05/15/21 | 4,955,000 | 5,512,437 | ||||||
PPL Energy Supply LLC, 4.600%, 12/15/21 | 3,876,000 | 4,130,607 | ||||||
|
| |||||||
| 59,638,039 | ||||||||
|
| |||||||
Electrical Components & Equipment 0.5% |
| |||||||
General Cable Corp., 5.750%, 10/01/22(a) | 4,605,000 | 4,697,100 | ||||||
GrafTech International Ltd., 6.375%, 11/15/20(a) | 3,750,000 | 3,881,250 | ||||||
|
| |||||||
| 8,578,350 | ||||||||
|
| |||||||
Electronics 1.0% |
| |||||||
313 Group, Inc., 6.375%, 12/01/19(a) | 9,720,000 | 9,647,100 | ||||||
Flextronics International Ltd., 4.625%, 02/15/20(a) | 2,000,000 | 2,020,000 | ||||||
Flextronics International Ltd., 5.000%, 02/15/23(a) | 3,165,000 | 3,157,087 | ||||||
Jabil Circuit, Inc., 8.250%, 03/15/18 | 3,460,000 | 4,160,650 | ||||||
|
| |||||||
| 18,984,837 | ||||||||
|
| |||||||
Energy-Alternate Sources 0.3% |
| |||||||
First Wind Capital LLC, 10.250%, 06/01/18(a) | 5,075,000 | 5,392,188 | ||||||
|
| |||||||
Engineering & Construction 0.5% |
| |||||||
Aguila 3 SA, 7.875%, 01/31/18(a) | 4,275,000 | 4,584,937 | ||||||
Dycom Investments, Inc., 7.125%, 01/15/21 | 2,570,000 | 2,749,900 | ||||||
Weekley Homes LLC/Weekley Finance Corp., 6.000%, 02/01/23(a) | 2,775,000 | 2,858,250 | ||||||
|
| |||||||
| 10,193,087 | ||||||||
|
| |||||||
| Shares or Principal Amount($) | Value($) | |||||||
Entertainment 1.9% |
| |||||||
Carmike Cinemas, Inc., 7.375%, 05/15/19 | 2,960,000 | 3,248,600 | ||||||
Cedar Fair LP/Canada’s Wonderland Co./Magnum Management Corp., 5.250%, 03/15/21(a) | 3,895,000 | 3,870,656 | ||||||
Cinemark USA, Inc., 5.125%, 12/15/22(a) | 1,950,000 | 1,959,750 | ||||||
Diamond Resorts Corp., 12.000%, 08/15/18(g) | 16,349,000 | 18,065,645 | ||||||
Pinnacle Entertainment, Inc., 7.750%, 04/01/22(f) | 2,130,000 | 2,287,088 | ||||||
Pinnacle Entertainment, Inc., 8.750%, 05/15/20(f) | 3,780,000 | 4,153,275 | ||||||
Speedway Motorsports, Inc., 8.750%, 06/01/16 | 2,395,000 | 2,526,725 | ||||||
|
| |||||||
| 36,111,739 | ||||||||
|
| |||||||
Environmental Control 0.9% |
| |||||||
Clean Harbors, Inc., 5.125%, 06/01/21(a) | 2,595,000 | 2,656,631 | ||||||
Clean Harbors, Inc., 5.250%, 08/01/20 | 3,120,000 | 3,221,400 | ||||||
Covanta Holding Corp., 7.250%, 12/01/20 | 2,805,000 | 3,089,590 | ||||||
Darling International, Inc., 8.500%, 12/15/18 | 2,330,000 | 2,644,550 | ||||||
Heckmann Corp., 9.875%, 04/15/18(a) | 4,130,000 | 4,382,962 | ||||||
|
| |||||||
| 15,995,133 | ||||||||
|
| |||||||
Food 2.3% |
| |||||||
Hawk Acquisition Sub, Inc., 4.250%, 10/15/20(a)(b) | 30,810,000 | 30,848,513 | ||||||
Post Holdings, Inc., 7.375%, 02/15/22 | 6,135,000 | 6,710,156 | ||||||
Stater Brothers Holdings, Inc., 7.750%, 04/15/15(g) | 4,790,000 | 4,790,000 | ||||||
|
| |||||||
| 42,348,669 | ||||||||
|
| |||||||
Forest Products & Paper 0.2% |
| |||||||
Longview Fibre Paper & Packaging, Inc., 8.000%, 06/01/16(a)(f) | 3,575,000 | 3,744,813 | ||||||
|
| |||||||
Gas 0.5% |
| |||||||
Sabine Pass LNG LP, 6.500%, 11/01/20(a) | 5,775,000 | 6,078,188 | ||||||
Sabine Pass LNG LP, 7.500%, 11/30/16 | 2,385,000 | 2,635,425 | ||||||
|
| |||||||
| 8,713,613 | ||||||||
|
| |||||||
See Notes to Financial Statements.
101
SCHEDULES OF PORTFOLIO INVESTMENTS
RIDGEWORTH FUNDS March 31, 2013
Seix High Yield Fund — continued
| Shares or Principal Amount($) | Value($) | |||||||
Healthcare-Products 0.9% |
| |||||||
Biomet, Inc., 6.500%, 08/01/20(a) | 6,295,000 | 6,680,569 | ||||||
Kinetic Concepts, Inc./KCI USA, Inc., 10.500%, 11/01/18 | 6,700,000 | 7,252,750 | ||||||
Physio-Control International, Inc., 9.875%, 01/15/19(a) | 3,250,000 | 3,664,375 | ||||||
|
| |||||||
| 17,597,694 | ||||||||
|
| |||||||
Healthcare-Services 2.9% |
| |||||||
CHS/Community Health Systems, Inc., 5.125%, 08/15/18 | 4,755,000 | 4,980,863 | ||||||
CHS/Community Health Systems, Inc., 7.125%, 07/15/20(f) | 5,000,000 | 5,425,000 | ||||||
CHS/Community Health Systems, Inc., 8.000%, 11/15/19 | 695,000 | 769,713 | ||||||
DaVita, Inc., 5.750%, 08/15/22 | 5,450,000 | 5,661,187 | ||||||
Fresenius Medical Care US Finance II, Inc., 5.875%, 01/31/22(a)(g) | 3,115,000 | 3,477,119 | ||||||
HCA, Inc., 5.875%, 03/15/22 | 9,585,000 | 10,327,837 | ||||||
HCA, Inc., 6.250%, 02/15/21 | 2,740,000 | 2,921,525 | ||||||
HCA, Inc., 7.500%, 02/15/22(f) | 7,215,000 | 8,297,250 | ||||||
Tenet Healthcare Corp., 6.250%, 11/01/18(f) | 6,920,000 | 7,681,200 | ||||||
Vanguard Health Holding Co. II LLC/Vanguard Holding Co. II, Inc., 7.750%, 02/01/19(f) | 5,000,000 | 5,350,000 | ||||||
|
| |||||||
| 54,891,694 | ||||||||
|
| |||||||
Holding Companies-Diversified 0.3% |
| |||||||
MMI International Ltd., 8.000%, 03/01/17(a) | 5,445,000 | 5,581,125 | ||||||
|
| |||||||
Home Builders 0.9% |
| |||||||
Brookfield Residential Properties, Inc., 6.500%, 12/15/20(a) | 2,665,000 | 2,851,550 | ||||||
KB Home, 7.500%, 09/15/22 | 2,775,000 | 3,114,937 | ||||||
KB Home, 9.100%, 09/15/17 | 3,180,000 | 3,736,500 | ||||||
Standard Pacific Corp., 8.375%, 05/15/18(g) | 5,300,000 | 6,240,750 | ||||||
|
| |||||||
| 15,943,737 | ||||||||
|
| |||||||
| Shares or Principal Amount($) | Value($) | |||||||
Household Products/Wares 0.9% |
| |||||||
Jarden Corp., 7.500%, 01/15/20 | 4,450,000 | 4,844,938 | ||||||
Reynolds Group Holdings, 6.875%, 02/15/21 | 1,825,000 | 1,943,625 | ||||||
Reynolds Group Issuer, Inc./Reynolds Group Issuer LLC/Reynolds Group Issuer Luxembourg I SA, 7.875%, 08/15/19 | 7,845,000 | 8,649,112 | ||||||
Spectrum Brands Escrow Corp., 6.625%, 11/15/22(a) | 1,900,000 | 2,061,500 | ||||||
|
| |||||||
| 17,499,175 | ||||||||
|
| |||||||
Housewares 0.3% |
| |||||||
Libbey Glass, Inc., 6.875%, 05/15/20 | 4,525,000 | 4,881,344 | ||||||
|
| |||||||
Insurance 1.3% |
| |||||||
Assured Guaranty Municipal Holdings, Inc., 6.400%, 12/15/66(a)(d) | 4,350,000 | 3,936,750 | ||||||
Assured Guaranty US Holdings, Inc., Series A, 6.400%, 12/15/66(d) | 7,037,000 | 6,579,595 | ||||||
Genworth Financial, Inc., 6.150%, 11/15/66(d) | 4,605,000 | 4,213,575 | ||||||
Genworth Financial, Inc., 7.625%, 09/24/21(f) | 745,000 | 897,326 | ||||||
Liberty Mutual Group, Inc., 7.000%, 03/07/67(a)(d) | 2,730,000 | 2,811,900 | ||||||
White Mountains Re Group Ltd., 7.506%(a)(d)(h) | 5,270,000 | 5,577,821 | ||||||
|
| |||||||
| 24,016,967 | ||||||||
|
| |||||||
Internet 1.3% |
| |||||||
CyrusOne LP/CyrusOne Finance Corp., 6.375%, 11/15/22(a) | 2,045,000 | 2,142,138 | ||||||
Equinix, Inc., 4.875%, 04/01/20 | 3,320,000 | 3,344,900 | ||||||
Equinix, Inc., 5.375%, 04/01/23 | 1,500,000 | 1,518,750 | ||||||
Equinix, Inc., 7.000%, 07/15/21(f) | 3,130,000 | 3,474,300 | ||||||
Mood Media Corp., 9.250%, 10/15/20(a) | 5,775,000 | 6,309,187 | ||||||
Zayo Escrow Corp., 8.125%, 01/01/20 | 7,000,000 | 7,840,000 | ||||||
|
| |||||||
| 24,629,275 | ||||||||
|
| |||||||
See Notes to Financial Statements.
102
SCHEDULES OF PORTFOLIO INVESTMENTS
RIDGEWORTH FUNDS March 31, 2013
Seix High Yield Fund — continued
| Shares or Principal Amount($) | Value($) | |||||||
Iron/Steel 0.4% |
| |||||||
JMC Steel Group, 8.250%, 03/15/18(a) | 6,855,000 | 7,266,300 | ||||||
|
| |||||||
Leisure Time 0.5% |
| |||||||
ClubCorp Club Operations, Inc., 10.000%, 12/01/18 | 4,545,000 | 5,135,850 | ||||||
Viking Cruises Ltd., 8.500%, 10/15/22(a) | 4,015,000 | 4,416,500 | ||||||
|
| |||||||
| 9,552,350 | ||||||||
|
| |||||||
Lodging 1.2% |
| |||||||
Chester Downs & Marina LLC, 9.250%, 02/01/20(a)(f) | 2,195,000 | 2,096,225 | ||||||
Downstream Development Authority of the Quapaw Tribe of Oklahoma, 10.500%, 07/01/19(a) | 7,090,000 | 7,869,900 | ||||||
Harrahs Operating, Inc., 11.250%, 06/01/17 | 3,275,000 | 3,483,781 | ||||||
MGM Resorts International, 6.750%, 10/01/20(a) | 4,195,000 | 4,446,700 | ||||||
MGM Resorts International, 7.625%, 01/15/17 | 4,185,000 | 4,645,350 | ||||||
|
| |||||||
| 22,541,956 | ||||||||
|
| |||||||
Machinery-Diversified 0.3% |
| |||||||
Manitowoc Co., Inc. (The), 8.500%, 11/01/20 | 4,805,000 | 5,429,650 | ||||||
|
| |||||||
Media 5.2% |
| |||||||
Block Communications, Inc., 7.250%, 02/01/20(a) | 3,260,000 | 3,545,250 | ||||||
Cablevision Systems Corp., 7.750%, 04/15/18 | 1,180,000 | 1,323,075 | ||||||
Cablevision Systems Corp., 8.000%, 04/15/20 | 4,490,000 | 5,051,250 | ||||||
CCO Holdings LLC/Cap Corp., 5.125%, 02/15/23 | 4,170,000 | 4,044,900 | ||||||
CCO Holdings LLC/Cap Corp., 7.375%, 06/01/20(f) | 2,000,000 | 2,217,500 | ||||||
Clear Channel Worldwide Holdings, Inc., Series A, 6.500%, 11/15/22(a) | 6,395,000 | 6,666,787 | ||||||
Clear Channel Worldwide Holdings, Inc., Series B, 6.500%, 11/15/22(a)(g) | 13,255,000 | 13,984,025 | ||||||
Clear Channel Worldwide Holdings, Inc., Series B, 7.625%, 03/15/20, Series B | 3,365,000 | 3,512,219 | ||||||
| Shares or Principal Amount($) | Value($) | |||||||
Media—continued |
| |||||||
DISH DBS Corp., 5.875%, 07/15/22 | 9,585,000 | 10,052,269 | ||||||
Echostar DBS Corp., 7.750%, 05/31/15 | 3,430,000 | 3,807,300 | ||||||
Entravision Communications Corp., 8.750%, 08/01/17 | 4,054,000 | 4,398,590 | ||||||
LIN Television Corp., 6.375%, 01/15/21(a) | 2,375,000 | 2,529,375 | ||||||
McGraw-Hill Global Education Holdings LLC/McGraw-Hill Global Education Finance, 9.750%, 04/01/21(a) | 3,390,000 | 3,356,100 | ||||||
Mediacom Broadband LLC/Mediacom Broadband Corp., 6.375%, 04/01/23(a) | 7,235,000 | 7,506,312 | ||||||
Mediacom LLC/Capital Corp., 9.125%, 08/15/19(f) | 1,145,000 | 1,278,106 | ||||||
Sinclair Television Group, Inc., 9.250%, 11/01/17(a) | 2,690,000 | 2,915,288 | ||||||
Sirius XM Radio, Inc., 5.250%, 08/15/22(a)(f) | 3,870,000 | 3,957,075 | ||||||
Sirius XM Radio, Inc., 7.625%, 11/01/18(a) | 2,910,000 | 3,211,913 | ||||||
Univision Communications, Inc., 6.750%, 09/15/22(a) | 8,720,000 | 9,417,600 | ||||||
Videotron Ltd., 5.000%, 07/15/22 | 4,000,000 | 4,060,000 | ||||||
|
| |||||||
| 96,834,934 | ||||||||
|
| |||||||
Mining 3.2% |
| |||||||
FMG Resources August 2006 Pty Ltd., 8.250%, 11/01/19(a)(f) | 18,045,000 | 19,466,044 | ||||||
HudBay Minerals, Inc., 9.500%, 10/01/20 | 4,155,000 | 4,539,337 | ||||||
Inmet Mining Corp., 7.500%, 06/01/21(a) | 3,305,000 | 3,577,663 | ||||||
Inmet Mining Corp., 8.750%, 06/01/20(a) | 18,450,000 | 20,479,500 | ||||||
New Gold, Inc., 6.250%, 11/15/22(a) | 3,055,000 | 3,200,113 | ||||||
Novelis, Inc., 8.375%, 12/15/17 | 785,000 | 859,575 | ||||||
Novelis, Inc., 8.750%, 12/15/20 | 2,900,000 | 3,269,750 | ||||||
Vulcan Materials Co., 7.500%, 06/15/21 | 3,345,000 | 3,938,737 | ||||||
|
| |||||||
| 59,330,719 | ||||||||
|
| |||||||
See Notes to Financial Statements.
103
SCHEDULES OF PORTFOLIO INVESTMENTS
RIDGEWORTH FUNDS March 31, 2013
Seix High Yield Fund — continued
| Shares or Principal Amount($) | Value($) | |||||||
Miscellaneous Manufacturer 1.7% |
| |||||||
Amsted Industries, Inc., 8.125%, 03/15/18(a) | 3,935,000 | 4,230,125 | ||||||
Bombardier, Inc., 5.750%, 03/15/22(a) | 9,890,000 | 10,149,612 | ||||||
Bombardier, Inc., 6.125%, 01/15/23(a)(g) | 10,620,000 | 11,018,250 | ||||||
Bombardier, Inc., 7.750%, 03/15/20(a) | 1,180,000 | 1,357,000 | ||||||
Polymer Group, Inc., 7.750%, 02/01/19 | 5,260,000 | 5,733,400 | ||||||
|
| |||||||
| 32,488,387 | ||||||||
|
| |||||||
Oil & Gas 8.0% |
| |||||||
Antero Resources Finance Corp., 6.000%, 12/01/20(a) | 3,295,000 | 3,443,275 | ||||||
Chesapeake Energy Corp., 6.875%, 11/15/20 | 2,060,000 | 2,245,400 | ||||||
Chesapeake Energy Corp., 7.250%, 12/15/18 | 3,105,000 | 3,524,175 | ||||||
CITGO Petroleum Corp., 11.500%, 07/01/17(a) | 2,910,000 | 3,335,588 | ||||||
EP Energy LLC/Everest Acquisition Finance, Inc., 6.875%, 05/01/19 | 3,000,000 | 3,285,000 | ||||||
EP Energy LLC/Everest Acquisition Finance, Inc., 7.750%, 09/01/22(f) | 1,635,000 | 1,806,675 | ||||||
Hercules Offshore, Inc., 7.125%, 04/01/17(a) | 5,075,000 | 5,468,312 | ||||||
Linn Energy LLC/Finance Corp., 6.500%, 05/15/19 | 4,450,000 | 4,655,813 | ||||||
Linn Energy LLC/Finance Corp., 8.625%, 04/15/20 | 4,865,000 | 5,363,662 | ||||||
MEG Energy Corp., 6.375%, 01/30/23(a) | 7,000,000 | 7,280,000 | ||||||
Oasis Petroleum, Inc., 6.875%, 01/15/23 | 5,165,000 | 5,681,500 | ||||||
Offshore Group Investment Ltd., 7.125%, 04/01/23(a) | 5,785,000 | 5,915,162 | ||||||
Offshore Group Investment Ltd., 7.500%, 11/01/19(a)(f) | 9,315,000 | 9,873,900 | ||||||
Plains Exploration & Production Co., 6.125%, 06/15/19 | 6,630,000 | 7,259,850 | ||||||
Plains Exploration & Production Co., 6.625%, 05/01/21 | 8,685,000 | 9,553,500 | ||||||
Plains Exploration & Production Co., 6.875%, 02/15/23 | 15,650,000 | 17,723,625 | ||||||
| Shares or Principal Amount($) | Value($) | |||||||
Oil & Gas—continued |
| |||||||
Plains Exploration & Production Co., 7.625%, 06/01/18 | 2,510,000 | 2,622,950 | ||||||
Plains Exploration & Production Co., 8.625%, 10/15/19 | 2,095,000 | 2,377,825 | ||||||
Range Resources Corp., 5.000%, 08/15/22 | 2,880,000 | 2,937,600 | ||||||
Range Resources Corp., 5.000%, 03/15/23(a) | 6,570,000 | 6,717,825 | ||||||
Range Resources Corp., 7.250%, 05/01/18 | 2,130,000 | 2,215,200 | ||||||
RDS Ultra-Deepwater Ltd., 11.875%, 03/15/17(a) | 2,000,000 | 2,225,000 | ||||||
SandRidge Energy, Inc., 7.500%, 03/15/21 | 10,170,000 | 10,576,800 | ||||||
SandRidge Energy, Inc., 8.750%, 01/15/20 | 1,855,000 | 1,998,763 | ||||||
Seadrill Ltd., 5.625%, 09/15/17(a) | 2,675,000 | 2,701,750 | ||||||
United Refining Co., 10.500%, 02/28/18 | 8,670,000 | 9,797,100 | ||||||
WPX Energy, Inc., 6.000%, 01/15/22 | 7,735,000 | 8,102,412 | ||||||
|
| |||||||
| 148,688,662 | ||||||||
|
| |||||||
Oil & Gas Services 2.1% |
| |||||||
American Petroleum Tankers LLC, 10.250%, 05/01/15 | 3,571,000 | 3,687,058 | ||||||
Cie Generale de Geophysique - Veritas, 6.500%, 06/01/21 | 6,000,000 | 6,300,000 | ||||||
Exterran Partners LP/EXLP Finance Corp., 6.000%, 04/01/21(a) | 3,741,000 | 3,726,971 | ||||||
Hiland Partners LP/Hiland Partners Finance Corp., 7.250%, 10/01/20(a) | 3,190,000 | 3,485,075 | ||||||
Hornbeck Offshore Services, Inc., 5.000%, 03/01/21(a) | 3,935,000 | 3,905,487 | ||||||
Oil States International, Inc., 5.125%, 01/15/23(a) | 5,520,000 | 5,520,000 | ||||||
Oil States International, Inc., 6.500%, 06/01/19 | 11,185,000 | 11,967,950 | ||||||
|
| |||||||
| 38,592,541 | ||||||||
|
| |||||||
Packaging & Containers 2.5% |
| |||||||
Ball Corp., 5.000%, 03/15/22 | 13,210,000 | 13,738,400 | ||||||
See Notes to Financial Statements.
104
SCHEDULES OF PORTFOLIO INVESTMENTS
RIDGEWORTH FUNDS March 31, 2013
Seix High Yield Fund — continued
| Shares or Principal Amount($) | Value($) | |||||||
Packaging & Containers—continued |
| |||||||
Crown Americas LLC/Crown Americas Capital Corp. IV, 4.500%, 01/15/23(a) | 8,815,000 | 8,550,550 | ||||||
Graphic Packaging International, Inc., 9.500%, 06/15/17 | 2,175,000 | 2,310,937 | ||||||
Plastipak Holdings, Inc., 10.625%, 08/15/19(a) | 2,010,000 | 2,301,450 | ||||||
Sealed Air Corp., 5.250%, 04/01/23(a) | 4,585,000 | 4,602,194 | ||||||
Sealed Air Corp., 6.500%, 12/01/20(a)(f) | 3,025,000 | 3,312,375 | ||||||
Sealed Air Corp., 8.125%, 09/15/19(a) | 5,095,000 | 5,763,719 | ||||||
Sealed Air Corp., 8.375%, 09/15/21(a) | 5,060,000 | 5,793,700 | ||||||
|
| |||||||
| 46,373,325 | ||||||||
|
| |||||||
Pharmaceuticals 1.1% |
| |||||||
ConvaTec Healthcare, 10.500%, 12/15/18(a) | 2,850,000 | 3,170,625 | ||||||
Endo Pharmaceuticals Holdings, Inc., 7.000%, 07/15/19 | 3,195,000 | 3,414,656 | ||||||
Endo Pharmaceuticals Holdings, Inc., 7.000%, 12/15/20 | 2,610,000 | 2,786,175 | ||||||
Endo Pharmaceuticals Holdings, Inc., 7.250%, 01/15/22 | 2,460,000 | 2,644,500 | ||||||
Valeant Pharmaceuticals International, 6.500%, 07/15/16(a) | 4,000,000 | 4,175,000 | ||||||
Valeant Pharmaceuticals International, 7.000%, 10/01/20(a) | 3,900,000 | 4,202,250 | ||||||
|
| |||||||
| 20,393,206 | ||||||||
|
| |||||||
Pipelines 1.8% |
| |||||||
Access Midstream Partners LP/ACMP Finance Corp., 4.875%, 05/15/23 | 4,420,000 | 4,364,750 | ||||||
Atlas Pipeline Partners LP/Atlas Pipeline Finance Corp., 5.875%, 08/01/23(a) | 2,495,000 | 2,482,525 | ||||||
Atlas Pipeline Partners LP/Atlas Pipeline Finance Corp., 6.625%, 10/01/20(a) | 1,115,000 | 1,162,387 | ||||||
| Shares or Principal Amount($) | Value($) | |||||||
Pipelines—continued |
| |||||||
Eagle Rock Energy Partners LP/Eagle Rock Energy Finance Corp., 8.375%, 06/01/19 | 3,495,000 | 3,687,225 | ||||||
El Paso Corp., 6.500%, 09/15/20 | 6,885,000 | 7,606,569 | ||||||
Sabine Pass Liquefaction LLC, 5.625%, 02/01/21(a) | 14,040,000 | 14,566,500 | ||||||
|
| |||||||
| 33,869,956 | ||||||||
|
| |||||||
Real Estate 0.8% | ||||||||
CBRE Services, Inc., 5.000%, 03/15/23 | 12,255,000 | 12,392,869 | ||||||
Toys “R” Us Property Co. LLC, 10.750%, 07/15/17 | 3,280,000 | 3,530,100 | ||||||
|
| |||||||
| 15,922,969 | ||||||||
|
| |||||||
Real Estate Investment Trust 1.4% |
| |||||||
Felcor Lodging LP, 5.625%, 03/01/23(a) | 5,485,000 | 5,587,844 | ||||||
Host Hotels & Resorts LP, 3.750%, 10/15/23, Series D | 1,735,000 | 1,741,784 | ||||||
MPT Operating Partnership LP/MPT Finance Corp., 6.875%, 05/01/21 | 4,000,000 | 4,340,000 | ||||||
Reckson Operating Partnership LP, 7.750%, 03/15/20 | 6,005,000 | 7,372,104 | ||||||
Rouse Co. LP (The), 6.750%, 11/09/15 | 7,120,000 | 7,378,100 | ||||||
|
| |||||||
| 26,419,832 | ||||||||
|
| |||||||
Retail 3.6% | ||||||||
AutoNation, Inc., 5.500%, 02/01/20 | 4,636,000 | 5,030,060 | ||||||
Claire’s Stores, Inc., 9.000%, 03/15/19(a)(f) | 4,200,000 | 4,746,000 | ||||||
Coinstar, Inc., 6.000%, 03/15/19(a) | 3,355,000 | 3,430,488 | ||||||
Dufry Finance SCA, 5.500%, 10/15/20(a) | 2,175,000 | 2,256,636 | ||||||
JC Penney Corp., Inc., 6.375%, 10/15/36 | 4,135,000 | 3,101,250 | ||||||
Limited Brands, Inc., 5.625%, 02/15/22 | 7,220,000 | 7,653,200 | ||||||
Limited Brands, Inc., 6.625%, 04/01/21 | 2,900,000 | 3,277,000 | ||||||
Limited Brands, Inc., 7.000%, 05/01/20 | 2,520,000 | 2,923,200 | ||||||
Penske Automotive Group, Inc., 5.750%, 10/01/22(a) | 3,830,000 | 3,992,775 | ||||||
See Notes to Financial Statements.
105
SCHEDULES OF PORTFOLIO INVESTMENTS
RIDGEWORTH FUNDS March 31, 2013
Seix High Yield Fund — continued
| Shares or Principal Amount($) | Value($) | |||||||
Retail—continued | ||||||||
Phillips-Van Heusen Corp., 7.375%, 05/15/20 | 2,005,000 | 2,235,575 | ||||||
PVH Corp., 4.500%, 12/15/22 | 2,630,000 | 2,590,550 | ||||||
Rite Aid Corp., 7.500%, 03/01/17 | 4,000,000 | 4,115,000 | ||||||
Sally Holdings LLC/Sally Capital, Inc., 6.875%, 11/15/19 | 4,675,000 | 5,177,562 | ||||||
Sears Holdings Corp., 6.625%, 10/15/18(f) | 13,335,000 | 12,984,956 | ||||||
Toys R Us, Inc., 7.375%, 10/15/18 | 3,010,000 | 2,656,325 | ||||||
Toys R Us, Inc., 10.375%, 08/15/17 | 410,000 | 415,638 | ||||||
|
| |||||||
| 66,586,215 | ||||||||
|
| |||||||
Semiconductors 0.5% | ||||||||
Advanced Micro Devices, Inc., 7.500%, 08/15/22(a) | 1,580,000 | 1,433,850 | ||||||
Advanced Micro Devices, Inc., 7.750%, 08/01/20 | 1,650,000 | 1,518,000 | ||||||
Freescale Semiconductor, Inc., 9.250%, 04/15/18(a) | 1,335,000 | 1,465,163 | ||||||
NXP BV/NXP Funding LLC, 5.750%, 03/15/23(a) | 4,950,000 | 5,049,000 | ||||||
|
| |||||||
| 9,466,013 | ||||||||
|
| |||||||
Shipbuilding 0.3% | ||||||||
Huntington Ingalls Industries, Inc., 7.125%, 03/15/21 | 5,085,000 | 5,529,938 | ||||||
|
| |||||||
Software 0.3% | ||||||||
First Data Corp., 6.750%, 11/01/20(a) | 6,215,000 | 6,479,138 | ||||||
|
| |||||||
Storage/Warehousing 0.7% | ||||||||
Niska Gas Storage US LLC/Niska Gas Storage Canada ULC, 8.875%, 03/15/18 | 12,604,000 | 13,139,670 | ||||||
|
| |||||||
Telecommunication Services 10.1% |
| |||||||
CenturyLink, Inc., 5.625%, 04/01/20 | 5,075,000 | 5,189,188 | ||||||
Consolidated Communications Finance Co., 10.875%, 06/01/20(a) | 2,190,000 | 2,496,600 | ||||||
Cricket Communications, Inc., 7.750%, 05/15/16 | 1,535,000 | 1,602,156 | ||||||
Frontier Communications Corp., 7.625%, 04/15/24(b) | 600,000 | 617,250 | ||||||
| Shares or Principal Amount($) | Value($) | |||||||
Telecommunication Services—continued |
| |||||||
Hughes Satellite Systems Corp., 6.500%, 06/15/19 | 2,735,000 | 3,001,663 | ||||||
Hughes Satellite Systems Corp., 7.625%, 06/15/21 | 1,270,000 | 1,452,563 | ||||||
Intelsat Jackson Holdings SA, 7.250%, 04/01/19 | 4,000,000 | 4,370,000 | ||||||
Intelsat Jackson Holdings SA, 7.250%, 10/15/20 | 5,000,000 | 5,493,750 | ||||||
Intelsat Jackson Holdings SA, 7.500%, 04/01/21 | 4,340,000 | 4,828,250 | ||||||
Intelsat Jackson Holdings SA, 8.500%, 11/01/19 | 850,000 | 953,063 | ||||||
Level 3 Financing, Inc., 8.125%, 07/01/19 | 2,010,000 | 2,211,000 | ||||||
Level 3 Financing, Inc., 8.625%, 07/15/20 | 4,065,000 | 4,532,475 | ||||||
Lynx II Corp., 6.375%, 04/15/23(a) | 5,125,000 | 5,368,437 | ||||||
MetroPCS Wireless, Inc., 6.250%, 04/01/21(a) | 7,680,000 | 7,814,400 | ||||||
MetroPCS Wireless, Inc., 6.625%, 04/01/23(a) | 6,380,000 | 6,507,600 | ||||||
NII Capital Corp., 7.625%, 04/01/21(g) | 8,338,000 | 6,003,360 | ||||||
NII Capital Corp., 8.875%, 12/15/19(f) | 3,825,000 | 2,878,313 | ||||||
NII International Telecom S.A.R.L., 11.375%, 08/15/19(a) | 6,700,000 | 7,001,500 | ||||||
Sable International Finance Ltd., 8.750%, 02/01/20(a)(f) | 3,515,000 | 3,971,950 | ||||||
Satmex Escrow SA de CV, 9.500%, 05/15/17 | 2,075,000 | 2,199,500 | ||||||
SBA Telecommunications, Inc., 5.750%, 07/15/20(a) | 7,125,000 | 7,410,000 | ||||||
Sprint Capital Corp., 6.875%, 11/15/28(g) | 11,095,000 | 11,344,637 | ||||||
Sprint Capital Corp., 6.900%, 05/01/19(g) | 4,168,000 | 4,574,380 | ||||||
Sprint Capital Corp., 8.750%, 03/15/32(g) | 8,005,000 | 9,545,962 | ||||||
Sprint Nextel Corp., 6.000%, 12/01/16(g) | 6,000,000 | 6,510,000 | ||||||
Sprint Nextel Corp., 7.000%, 08/15/20(g) | 9,310,000 | 10,241,000 | ||||||
Sprint Nextel Corp., 8.375%, 08/15/17(g) | 4,000,000 | 4,655,000 | ||||||
Sprint Nextel Corp., 11.500%, 11/15/21 | 65,000 | 91,000 | ||||||
See Notes to Financial Statements.
106
SCHEDULES OF PORTFOLIO INVESTMENTS
RIDGEWORTH FUNDS March 31, 2013
Seix High Yield Fund — concluded
| Shares or Principal Amount($) | Value($) | |||||||
Telecommunication Services—continued |
| |||||||
Tw telecom holdings, Inc., 5.375%, 10/01/22 | 3,855,000 | 4,018,838 | ||||||
UPCB Finance V Ltd., 7.250%, 11/15/21(a) | 2,100,000 | 2,320,500 | ||||||
US West Capital Funding, Inc., | 5,940,000 | 5,725,744 | ||||||
US West Communications, 7.250%, 10/15/35 | 5,485,000 | 5,624,752 | ||||||
ViaSat, Inc., 6.875%, 06/15/20 | 9,260,000 | 9,931,350 | ||||||
West Corp., 8.625%, 10/01/18 | 2,690,000 | 2,918,650 | ||||||
Wind Acquisition Finance Holdings, PIK, 12.250%, 07/15/17(a)(f) | 8,532,556 | 8,653,197 | ||||||
Wind Acquisition Finance SA, 7.250%, 02/15/18(a) | 10,405,000 | 10,834,206 | ||||||
Windstream Corp., 6.375%, 08/01/23(a) | 5,100,000 | 5,061,750 | ||||||
|
| |||||||
| 187,953,984 | ||||||||
|
| |||||||
Transportation 1.3% |
| |||||||
Bristow Group, Inc., 6.250%, 10/15/22 | 3,325,000 | 3,591,000 | ||||||
CHC Helicopter SA, 9.250%, 10/15/20 | 16,450,000 | 17,488,406 | ||||||
Martin Midstream Partners LP/Martin Midstream Finance Corp., 7.250%, 02/15/21(a) | 3,965,000 | 4,004,650 | ||||||
|
| |||||||
| 25,084,056 | ||||||||
|
| |||||||
Trucking & Leasing 0.3% |
| |||||||
Aviation Capital Group Corp., 4.625%, 01/31/18(a) | 4,845,000 | 4,998,485 | ||||||
|
| |||||||
Total Corporate Bonds | 1,649,789,419 | |||||||
|
| |||||||
Convertible Preferred Stock 0.6% |
| |||||||
Auto Manufacturers 0.6% |
| |||||||
General Motors Co., Series B, 4.750%, 12/01/13 | 256,940 | 11,033,004 | ||||||
|
| |||||||
Total Convertible Preferred Stock | 11,033,004 | |||||||
|
| |||||||
| Shares or Principal Amount($) | Value($) | |||||||
Short-Term Investment 5.3% |
| |||||||
RidgeWorth Funds Securities Lending Joint Account(i) | 99,836,835 | 99,836,835 | ||||||
|
| |||||||
Total Short-Term Investment | 99,836,835 | |||||||
|
| |||||||
Money Market Fund 7.0% |
| |||||||
State Street Institutional Treasury Money Market Fund, Institutional Class, 0.00%(j) | 129,824,361 | 129,824,361 | ||||||
|
| |||||||
Total Money Market Fund | 129,824,361 | |||||||
|
| |||||||
Total Investments |
| 1,992,285,818 | ||||||
Liabilities in excess of other assets — (6.7)% | (124,430,417 | ) | ||||||
|
| |||||||
Net Assets — 100.0% | $ | 1,867,855,401 | ||||||
|
| |||||||
| (a) | Rule 144A, Section 4(2) or other security which is restricted as to resale to institutional investors. The Fund’s investment adviser/subadviser has deemed this security to be liquid based upon procedures approved by the Board of Trustees. These securities represent 44.9% of net assets as of March 31, 2013. |
| (b) | All or a portion of this security has been purchased on a when-issued or delayed-delivery basis. |
| (c) | The security does not have a stated settlement date and will receive a rate upon settling with the custodian. |
| (d) | Variable or floating rate security. Rate disclosed is as of March 31, 2013. |
| (e) | Less than 0.05% of Net Assets. |
| (f) | The security or a partial position of the security was on loan as of March 31, 2013. The total value of securities on loan as of March 31, 2013 was $97,487,700. |
| (g) | All or a portion of this security has been segregated, or otherwise earmarked, in connection with obligations for when-issued or delayed-delivery purchase commitments. |
| (h) | Security is perpetual in nature and has no stated maturity. |
| (i) | Purchased with cash collateral held from securities lending. The value of the collateral could include collateral held for securities that were sold on or before March 31, 2013 (See Note 2(k)). |
| (j) | Rate disclosed, the 7 day net yield, is as of March 31, 2013. |
Investment Abbreviations
| MTN | — | Medium Term Note | ||
| PIK | — | Payment in-kind | ||
| ULC | — | Unlimited Liability Company |
See Notes to Financial Statements.
107
SCHEDULES OF PORTFOLIO INVESTMENTS
RIDGEWORTH FUNDS March 31, 2013
Short-Term Bond Fund
| Shares or Principal Amount($) | Value($) | |||||||
| Asset-Backed Securities 12.2% | ||||||||
Automobiles 10.2% | ||||||||
Bank of America Auto Trust, Series 2012-1, Cl A3, 0.780%, 06/15/16 | 1,000,000 | 1,003,559 | ||||||
Ford Credit Auto Owner Trust, Series 2012-A, Cl A3, 0.840%, 08/15/16 | 1,525,000 | 1,531,166 | ||||||
Harley-Davidson Motorcycle Trust, Series 2011-2, Cl A3, 1.110%, 09/15/16(a) | 1,110,000 | 1,116,308 | ||||||
Hyundai Auto Receivables Trust, Series 2011-B, Cl A4, 1.650%, 02/15/17 | 1,180,000 | 1,200,067 | ||||||
Hyundai Auto Receivables Trust, Series 2011-C, Cl A4, 1.300%, 02/15/18(a) | 2,250,000 | 2,282,355 | ||||||
Volkswagen Auto Loan Enhanced Trust, Series 2012-1, Cl A3, 0.850%, 08/22/16 | 1,295,000 | 1,301,154 | ||||||
|
| |||||||
| 8,434,609 | ||||||||
|
| |||||||
Other 2.0% | ||||||||
GE Equipment Transportation LLC, Series 2011-1, Cl A3, 1.000%, 10/20/14(a) | 726,571 | 727,593 | ||||||
John Deere Owner Trust, Series 2011-A, Cl A3, 1.290%, 01/15/16 | 970,108 | 974,358 | ||||||
|
| |||||||
| 1,701,951 | ||||||||
|
| |||||||
Total Asset-Backed Securities (Cost $10,088,039) | 10,136,560 | |||||||
|
| |||||||
| Collateralized Mortgage Obligations 22.0% | ||||||||
Agency Collateralized Mortgage Obligations 5.5% |
| |||||||
Federal National Mortgage Association | ||||||||
Series 2009-37, Cl HA, 4.000%, 04/25/19 | 1,216,494 | 1,289,281 | ||||||
Series 2011-38, Cl AH, 2.750%, 05/25/20(a) | 3,181,338 | 3,287,888 | ||||||
|
| |||||||
| 4,577,169 | ||||||||
|
| |||||||
Commercial Mortgage Backed Securities 14.9% |
| |||||||
Banc of America Commercial Mortgage, Inc. | ||||||||
Series 2004-1, Cl A4, 4.760%, 11/10/39(a) | 1,264,673 | 1,292,599 | ||||||
Series 2005-2, Cl AM, 4.913%, 07/10/43(a)(b) | 1,605,000 | 1,732,410 | ||||||
|
| |||||||
| 3,025,009 | ||||||||
|
| |||||||
| Shares or Principal Amount($) | Value($) | |||||||
Commercial Mortgage Backed Securities—continued |
| |||||||
Citigroup Commercial Mortgage Trust | ||||||||
Series 2004-C1, Cl A3, 5.251%, 04/15/40(a)(b) | 370,530 | 370,327 | ||||||
|
| |||||||
COMM 2005-C6 Mortgage Trust | ||||||||
Series 2005-C6, Cl AJ, 5.209%, 06/10/44(b) | 335,000 | 358,418 | ||||||
|
| |||||||
CS First Boston Mortgage Securities Corp. | ||||||||
Series 2004-C5, Cl A3, 4.499%, 11/15/37(a) | 1,466,325 | 1,466,583 | ||||||
Series 2005-C5, Cl AM, 5.100%, 08/15/38(a)(b) | 1,595,000 | 1,726,926 | ||||||
|
| |||||||
| 3,193,509 | ||||||||
|
| |||||||
GE Capital Commercial Mortgage Corp. | ||||||||
Series 2004-C2, Cl A3, 4.641%, 03/10/40(a) | 160,031 | 160,878 | ||||||
Series 2005-C3, Cl A7A, 4.974%, 07/10/45(b) | 835,000 | 904,278 | ||||||
|
| |||||||
| 1,065,156 | ||||||||
|
| |||||||
JPMorgan Chase Commercial Mortgage Securities | ||||||||
Series 2005-LDP1, Cl A2, 4.625%, 03/15/46(a) | 376,925 | 380,306 | ||||||
|
| |||||||
JPMorgan Chase Commercial Mortgage Securities Corp. | ||||||||
Series 2005-LDP3, Cl A4A, 4.936%, 08/15/42(b) | 1,045,000 | 1,129,245 | ||||||
|
| |||||||
LB-UBS Commercial Mortgage Trust | ||||||||
Series 2004-C4, Cl A4, 5.513%, 06/15/29(a)(b) | 620,000 | 650,949 | ||||||
|
| |||||||
Wachovia Bank Commercial Mortgage Trust | ||||||||
Series 2005-C16, Cl A2, 4.380%, 10/15/41(a) | 479,565 | 479,498 | ||||||
Series 2005-C20, Cl A7, 5.118%, 07/15/42(b) | 370,000 | 400,896 | ||||||
Series 2005-C22, Cl A4, 5.283%, 12/15/44(b) | 1,175,000 | 1,290,105 | ||||||
|
| |||||||
| 2,170,499 | ||||||||
|
| |||||||
| 12,343,418 | ||||||||
|
| |||||||
Whole Loan Collateral Mortgage Obligations 1.6% |
| |||||||
FDIC Structured Sale Guaranteed Notes | ||||||||
Series 2010-L2A, Cl A, 3.000%, 09/30/19(a)(c) | 1,311,651 | 1,339,523 | ||||||
|
| |||||||
Total Collateralized Mortgage Obligations | 18,260,110 | |||||||
|
| |||||||
See Notes to Financial Statements.
108
SCHEDULES OF PORTFOLIO INVESTMENTS
RIDGEWORTH FUNDS March 31, 2013
Short-Term Bond Fund — continued
| Shares or Principal Amount($) | Value($) | |||||||
| Corporate Bonds 49.0% | ||||||||
Auto Manufacturers 1.5% |
| |||||||
Daimler Finance North America LLC, 1.250%, 01/11/16(c) | 750,000 | 752,569 | ||||||
Kia Motors Corp., 3.625%, 06/14/16(c) | 500,000 | 528,634 | ||||||
|
| |||||||
| 1,281,203 | ||||||||
|
| |||||||
Banks 14.7% |
| |||||||
American Express Centurion Bank, 0.875%, 11/13/15 | 835,000 | 834,977 | ||||||
Bank of America Corp., 3.625%, 03/17/16, MTN | 1,000,000 | 1,060,786 | ||||||
Bank of Montreal, 0.800%, 11/06/15, MTN | 640,000 | 639,082 | ||||||
Bank of Nova Scotia, 0.792%, 02/10/14(a) | 1,280,000 | 1,285,458 | ||||||
BB&T Corp., 2.150%, 03/22/17, MTN(a) | 700,000 | 720,462 | ||||||
Branch Banking & Trust Co., 0.600%, 09/13/16(b) | 630,000 | 622,988 | ||||||
Capital One Financial Corp., 6.750%, 09/15/17 | 345,000 | 416,809 | ||||||
Citigroup, Inc., 6.375%, 08/12/14 | 655,000 | 701,945 | ||||||
Commonwealth Bank of Australia, 1.950%, 03/16/15(a) | 800,000 | 818,951 | ||||||
Fifth Third Bank, 0.400%, 05/17/13(a)(b) | 1,405,000 | 1,404,978 | ||||||
Goldman Sachs Group, Inc. (The), 2.375%, 01/22/18 | 1,150,000 | 1,165,677 | ||||||
JPMorgan Chase & Co., 3.150%, 07/05/16 | 1,170,000 | 1,240,533 | ||||||
Wells Fargo & Co., 3.676%, 06/15/16(a)(c) | 1,195,000 | 1,292,169 | ||||||
|
| |||||||
| 12,204,815 | ||||||||
|
| |||||||
Beverages 1.6% | ||||||||
Anheuser-Busch InBev Worldwide, Inc., 3.625%, 04/15/15(a) | 945,000 | 1,001,379 | ||||||
Dr. Pepper Snapple Group, Inc., 2.900%, 01/15/16 | 340,000 | 358,512 | ||||||
|
| |||||||
| 1,359,891 | ||||||||
|
| |||||||
Chemicals 0.6% | ||||||||
Dow Chemical Co. (The), 5.900%, 02/15/15 | 420,000 | 459,060 | ||||||
|
| |||||||
Commercial Services 0.6% | ||||||||
ERAC USA Finance LLC, 1.400%, 04/15/16(c) | 335,000 | 336,950 | ||||||
| Shares or Principal Amount($) | Value($) | |||||||
Commercial Services—continued |
| |||||||
ERAC USA Finance LLC, 2.250%, 01/10/14(c) | 125,000 | 126,468 | ||||||
|
| |||||||
| 463,418 | ||||||||
|
| |||||||
Computers 1.0% | ||||||||
Hewlett-Packard Co., 1.250%, 09/13/13 | 860,000 | 861,689 | ||||||
|
| |||||||
Diversified Financial Services 4.9% |
| |||||||
Caterpillar Financial Services Corp., 4.625%, 06/01/15(a) | 990,000 | 1,072,098 | ||||||
General Electric Capital Corp., 1.625%, 04/02/18(d) | 1,250,000 | 1,244,634 | ||||||
Morgan Stanley, 4.200%, 11/20/14 | 810,000 | 847,820 | ||||||
TD AMERITRADE Holding Corp., 4.150%, 12/01/14 | 435,000 | 458,895 | ||||||
Woodside Finance Ltd., 4.500%, 11/10/14(c) | 395,000 | 416,885 | ||||||
|
| |||||||
| 4,040,332 | ||||||||
|
| |||||||
Electric 1.8% | ||||||||
Constellation Energy Group, Inc., 4.550%, 06/15/15 | 340,000 | 365,453 | ||||||
Duke Energy Corp., 3.950%, 09/15/14 | 395,000 | 413,217 | ||||||
NextEra Energy Capital Holdings, Inc., 1.611%, 06/01/14 | 405,000 | 408,806 | ||||||
Nisource Finance Corp., 5.400%, 07/15/14 | 280,000 | 295,681 | ||||||
|
| |||||||
| 1,483,157 | ||||||||
|
| |||||||
Food 1.4% | ||||||||
ConAgra Foods, Inc., 1.900%, 01/25/18 | 285,000 | 287,818 | ||||||
General Mills, Inc., 5.200%, 03/17/15 | 450,000 | 488,837 | ||||||
Kraft Foods Group, Inc., 1.625%, 06/04/15 | 410,000 | 416,317 | ||||||
|
| |||||||
| 1,192,972 | ||||||||
|
| |||||||
Healthcare-Services 1.0% | ||||||||
UnitedHealth Group, Inc., 0.412%, 08/28/14(b) | 465,000 | 464,845 | ||||||
UnitedHealth Group, Inc., 1.875%, 11/15/16 | 340,000 | 351,105 | ||||||
|
| |||||||
| 815,950 | ||||||||
|
| |||||||
Holding Companies-Diversified 0.5% |
| |||||||
EnCana Holdings Finance Corp., 5.800%, 05/01/14 | 395,000 | 415,508 | ||||||
|
| |||||||
See Notes to Financial Statements.
109
SCHEDULES OF PORTFOLIO INVESTMENTS
RIDGEWORTH FUNDS March 31, 2013
Short-Term Bond Fund — continued
| Shares or Principal Amount($) | Value($) | |||||||
Housewares 0.3% | ||||||||
Newell Rubbermaid, Inc., 2.050%, 12/01/17(a) | 210,000 | 211,163 | ||||||
|
| |||||||
Insurance 3.8% | ||||||||
Berkshire Hathaway, Inc., 1.900%, 01/31/17(a) | 1,005,000 | 1,036,749 | ||||||
MetLife, Inc., 6.750%, 06/01/16 | 880,000 | 1,034,516 | ||||||
Prudential Covered Trust 2012-1, 2.997%, 09/30/15(c) | 1,008,000 | 1,050,967 | ||||||
|
| |||||||
| 3,122,232 | ||||||||
|
| |||||||
Internet 1.0% | ||||||||
Amazon.com, Inc., 0.650%, 11/27/15(a) | 800,000 | 799,034 | ||||||
|
| |||||||
Media 2.7% | ||||||||
CBS Corp., 4.625%, 05/15/18 | 380,000 | 424,647 | ||||||
Comcast Corp., 5.900%, 03/15/16 | 510,000 | 583,521 | ||||||
DIRECTV Holdings LLC / DIRECTV Financing Co., Inc., 4.750%, 10/01/14 | 500,000 | 528,927 | ||||||
Viacom, Inc., 3.500%, 04/01/17(a) | 630,000 | 673,488 | ||||||
|
| |||||||
| 2,210,583 | ||||||||
|
| |||||||
Mining 1.7% | ||||||||
Freeport-McMoRan Copper & Gold, Inc., 2.375%, 03/15/18(c) | 430,000 | 431,797 | ||||||
Rio Tinto Alcan, Inc., 5.200%, 01/15/14(a) | 910,000 | 940,857 | ||||||
|
| |||||||
| 1,372,654 | ||||||||
|
| |||||||
Oil & Gas 1.4% | ||||||||
Devon Energy Corp., 1.875%, 05/15/17 | 390,000 | 393,791 | ||||||
Petrohawk Energy Corp., 7.250%, 08/15/18 | 695,000 | 777,667 | ||||||
|
| |||||||
| 1,171,458 | ||||||||
|
| |||||||
Oil & Gas Services 0.0%(e) | ||||||||
National Oilwell Varco, Inc., 1.350%, 12/01/17 | 10,000 | 10,043 | ||||||
|
| |||||||
Pharmaceuticals 1.4% | ||||||||
McKesson Corp., 0.950%, 12/04/15 | 305,000 | 305,835 | ||||||
McKesson Corp., 6.500%, 02/15/14 | 850,000 | 893,844 | ||||||
|
| |||||||
| 1,199,679 | ||||||||
|
| |||||||
| Shares or Principal Amount($) | Value($) | |||||||
Pipelines 2.7% |
| |||||||
Enterprise Products Operating LLC, Series M, 5.650%, 04/01/13 | 1,250,000 | 1,250,000 | ||||||
Kinder Morgan Energy Partners LP, 5.125%, 11/15/14 | 310,000 | 331,771 | ||||||
Spectra Energy Capital LLC, 5.500%, 03/01/14 | 345,000 | 359,354 | ||||||
Williams Partners LP, 3.800%, 02/15/15 | 260,000 | 273,795 | ||||||
|
| |||||||
| 2,214,920 | ||||||||
|
| |||||||
Semiconductors 1.1% |
| |||||||
Intel Corp., 1.350%, 12/15/17 | 895,000 | 898,047 | ||||||
|
| |||||||
Telecommunication Services 2.8% |
| |||||||
AT&T, Inc., 1.400%, 12/01/17 | 985,000 | 978,156 | ||||||
Cellco Partnership/Verizon Wireless Capital LLC, 5.550%, 02/01/14 | 1,260,000 | 1,309,586 | ||||||
|
| |||||||
| 2,287,742 | ||||||||
|
| |||||||
Transportation 0.5% |
| |||||||
Burlington Northern Santa Fe LLC, 7.000%, 02/01/14 | 420,000 | 441,991 | ||||||
|
| |||||||
Total Corporate Bonds (Cost $40,152,053) | 40,517,541 | |||||||
|
| |||||||
| Municipal Bond 3.2% | ||||||||
New Jersey 3.2% | ||||||||
New Jersey Economic Development Authority, RB, BAB, 1.280%, 06/15/13(a)(b) | 2,675,000 | 2,676,017 | ||||||
|
| |||||||
Total Municipal Bond (Cost $2,675,000) | 2,676,017 | |||||||
|
| |||||||
U.S. Government Agency Mortgages 11.5% |
| |||||||
Federal National Mortgage Association | ||||||||
Pool #725877, 5.249%, 09/01/14 | 291,145 | 300,933 | ||||||
Pool #466598, 2.180%, 11/01/15(a) | 2,055,000 | 2,126,850 | ||||||
Pool #462085, 5.315%, 11/01/15 | 1,656,084 | 1,826,152 | ||||||
Pool #745889, 5.970%, 08/01/16(a) | 4,700,499 | 5,298,570 | ||||||
|
| |||||||
Total U.S. Government Agency Mortgages | 9,552,505 | |||||||
|
| |||||||
See Notes to Financial Statements.
110
SCHEDULES OF PORTFOLIO INVESTMENTS
RIDGEWORTH FUNDS March 31, 2013
Short-Term Bond Fund — concluded
| Shares or Principal Amount($) | Value($) | |||||||
Money Market Fund 2.3% |
| |||||||
State Street Institutional U.S. Government Money Market Fund, Institutional Class, 0.01%(f) | 1,879,549 | 1,879,549 | ||||||
|
| |||||||
Total Money Market Fund | 1,879,549 | |||||||
|
| |||||||
Total Investments | 83,080,669 | |||||||
Liabilities in excess of other assets — (0.2)% | (199,715 | ) | ||||||
|
| |||||||
Net Assets — 100.0% | $ | 82,880,954 | ||||||
|
| |||||||
| (a) | All or a portion of this security has been segregated, or otherwise earmarked, in connection with obligations for when-issued or delayed-delivery purchase commitments. |
| (b) | Variable or floating rate security. Rate disclosed is as of March 31, 2013. |
| (c) | Rule 144A, Section 4(2) or other security which is restricted as to resale to institutional investors. The Fund’s investment adviser/subadviser has deemed this security to be liquid based upon procedures approved by the Board of Trustees. These securities represent 7.6% of net assets as of March 31, 2013. |
| (d) | All or a portion of this security has been purchased on a when-issued or delayed-delivery basis. |
| (e) | Less than 0.05% of Net Assets. |
| (f) | Rate disclosed, the 7 day net yield, is as of March 31, 2013. |
Investment Abbreviations
| BAB | — | Build America Bonds | ||
| MTN | — | Medium Term Note | ||
| RB | — | Revenue Bond |
See Notes to Financial Statements.
111
SCHEDULES OF PORTFOLIO INVESTMENTS
RIDGEWORTH FUNDS March 31, 2013
Short-Term Municipal Bond Fund
| Shares or Principal Amount($) | Value($) | |||||||
| Municipal Bonds 91.2% | ||||||||
Alabama 0.6% | ||||||||
Birmingham, Series A, GO, 0.000%, 03/01/22(a)(b) | 100,000 | 94,034 | ||||||
|
| |||||||
California 5.4% |
| |||||||
California State, GO, 5.000%, 02/01/20 | 250,000 | 302,367 | ||||||
University of California, Series AG, RB, 0.180%, 05/15/14 | 500,000 | 498,220 | ||||||
|
| |||||||
| 800,587 | ||||||||
|
| |||||||
Florida 11.2% |
| |||||||
Martin County Consolidated Utilities System Revenue, RB, 5.000%, 10/01/28, Pre-refunded 10/01/2013 @ 100, AMBAC(c) | 500,000 | 512,110 | ||||||
Miami-Dade County Expressway Authority, Series A, RB, 5.000%, 07/01/19(b) | 500,000 | 597,715 | ||||||
Miami-Dade County FL Aviation Revenue, Series B, AMT, RB, 5.000%, 10/01/18, XLCA | 500,000 | 549,680 | ||||||
|
| |||||||
| 1,659,505 | ||||||||
|
| |||||||
Georgia 3.3% |
| |||||||
Georgia State, Series A, GO, 5.000%, 01/01/20 | 400,000 | 496,036 | ||||||
|
| |||||||
Hawaii 3.0% |
| |||||||
Hawaii State, GO, 5.000%, 05/01/15 | 400,000 | 438,288 | ||||||
|
| |||||||
Kansas 3.4% |
| |||||||
Kansas Development Finance Authority, RB, 5.000%, 06/01/13 | 500,000 | 504,165 | ||||||
|
| |||||||
Louisiana 3.3% |
| |||||||
Louisiana State, Series A, RB, 5.000%, 06/15/20 | 400,000 | 491,292 | ||||||
|
| |||||||
Maryland 4.0% |
| |||||||
Maryland State Transportation Authority, Transportation Facilities Project, RB, 5.000%, 07/01/23(c) | 500,000 | 592,075 | ||||||
|
| |||||||
Massachusetts 3.0% |
| |||||||
Massachusetts Water Pollution Abatement Trust (The), RB, 5.000%, 08/01/13 | 440,000 | 447,282 | ||||||
|
| |||||||
| Shares or Principal Amount($) | Value($) | |||||||
Michigan 5.4% |
| |||||||
Michigan Finance Authority, Series B, RB, 5.000%, 07/01/23(c) | 750,000 | 792,525 | ||||||
|
| |||||||
Missouri 3.8% |
| |||||||
Missouri Highway & Transportation Commission, RB, 5.000%, 05/01/16 | 500,000 | 568,610 | ||||||
|
| |||||||
New Jersey 14.0% |
| |||||||
New Jersey Economic Development Authority, Series O, RB, 5.250%, 03/01/25, Pre-refunded 03/01/2015 @ 100 | 1,500,000 | 1,641,105 | ||||||
New Jersey Higher Education Student Assistance Authority, AMT, RB, 4.000%, 12/01/17 | 400,000 | 434,464 | ||||||
|
| |||||||
| 2,075,569 | ||||||||
|
| |||||||
New York 9.7% |
| |||||||
New York State Dormitory Authority, Series A, RB, 5.000%, 03/15/15 | 400,000 | 436,652 | ||||||
New York State Urban Development Corp., Series A, RB, 5.000%, 03/15/14 | 490,000 | 512,854 | ||||||
Port Authority of New York & New Jersey, AMT, RB, 5.000%, 07/15/20 | 400,000 | 487,124 | ||||||
|
| |||||||
| 1,436,630 | ||||||||
|
| |||||||
Ohio 6.7% |
| |||||||
Columbus, Series A, GO, 3.000%, 02/15/14(c) | 450,000 | 461,079 | ||||||
Ohio State Water Development Authority, RB, 4.750%, 12/01/22, Pre-refunded 06/01/2014 @ 100 | 500,000 | 526,400 | ||||||
|
| |||||||
| 987,479 | ||||||||
|
| |||||||
Oklahoma 2.9% |
| |||||||
Oklahoma City, GO, 4.000%, 03/01/15 | 400,000 | 427,696 | ||||||
|
| |||||||
Pennsylvania 3.4% |
| |||||||
Pennsylvania Economic Development Financing Authority, RB, 5.000%, 07/01/22 | 450,000 | 509,431 | ||||||
|
| |||||||
Tennessee 2.8% |
| |||||||
Hamilton County, Series A, GO, 4.000%, 01/01/14(c) | 400,000 | 411,544 | ||||||
|
| |||||||
See Notes to Financial Statements.
112
SCHEDULES OF PORTFOLIO INVESTMENTS
RIDGEWORTH FUNDS March 31, 2013
Short-Term Municipal Bond Fund — concluded
| Shares or Principal Amount($) | Value($) | |||||||
Texas 3.4% |
| |||||||
Lower Colorado River Authority, RB, 5.000%, 05/15/13 | 500,000 | 503,165 | ||||||
|
| |||||||
Virginia 1.9% |
| |||||||
Fairfax County, Series A, GO, 5.000%, 04/01/16, Pre-refunded 04/01/2014 @ 100, State Aid Withholding | 265,000 | 277,752 | ||||||
|
| |||||||
Total Municipal Bonds (Cost $13,391,615) | 13,513,665 | |||||||
|
| |||||||
| Money Market Fund 15.8% | ||||||||
Federated Tax-Free Obligations Fund, Institutional Shares, 0.01%(d) | 2,345,242 | 2,345,242 | ||||||
|
| |||||||
Total Money Market Fund | 2,345,242 | |||||||
|
| |||||||
Total Investments | 15,858,907 | |||||||
Liabilities in excess of other assets — (7.0)% | (1,043,350 | ) | ||||||
|
| |||||||
Net Assets — 100.0% | $ | 14,815,557 | ||||||
|
| |||||||
| (a) | Step bond. The rate shown is the rate in effect as of March 31, 2013. |
| (b) | All or a portion of this security has been purchased on a when-issued or delayed-delivery basis. |
| (c) | All or a portion of this security has been segregated, or otherwise earmarked, in connection with obligations for when-issued or delayed-delivery purchase commitments. |
| (d) | Rate disclosed, the 7 day net yield, is as of March 31, 2013. |
Investment Abbreviations
| AMBAC | — | Security guaranteed by American Municipal Bond Assurance Corporation | ||
| AMT | — | Income subject to Alternative Minimum Tax | ||
| GO | — | General Obligation | ||
| RB | — | Revenue Bond | ||
| XLCA | — | Security guaranteed by XL Capital Assurance, Inc. |
See Notes to Financial Statements.
113
SCHEDULES OF PORTFOLIO INVESTMENTS
RIDGEWORTH FUNDS March 31, 2013
Short-Term U.S. Treasury Securities Fund
| Shares or Principal Amount($) | Value($) | |||||||
| U.S. Treasury Obligations 98.3% | ||||||||
U.S. Treasury Notes 98.3% |
| |||||||
3.125%, 04/30/13 | 130,000 | 130,310 | ||||||
1.125%, 06/15/13 | 2,510,000 | 2,515,294 | ||||||
2.000%, 11/30/13 | 970,000 | 981,898 | ||||||
0.375%, 11/15/14 | 1,000,000 | 1,002,383 | ||||||
2.375%, 02/28/15 | 720,000 | 749,166 | ||||||
2.500%, 04/30/15 | 3,205,000 | 3,353,231 | ||||||
1.750%, 07/31/15 | 1,795,000 | 1,856,001 | ||||||
0.750%, 06/30/17 | 1,425,000 | 1,433,238 | ||||||
|
| |||||||
Total U.S. Treasury Obligations | 12,021,521 | |||||||
|
| |||||||
| Shares or Principal Amount($) | Value($) | |||||||
Money Market Fund 0.8% |
| |||||||
State Street Institutional Treasury Money Market Fund, Institutional Class, 0.00%(a) | 93,932 | 93,932 | ||||||
|
| |||||||
Total Money Market Fund | 93,932 | |||||||
|
| |||||||
Total Investments | 12,115,453 | |||||||
Other assets in excess of liabilities — 0.9% | 106,492 | |||||||
|
| |||||||
Net Assets — 100.0% | $ | 12,221,945 | ||||||
|
| |||||||
| (a) | Rate disclosed, the 7 day net yield, is as of March 31, 2013. |
See Notes to Financial Statements.
114
SCHEDULES OF PORTFOLIO INVESTMENTS
RIDGEWORTH FUNDS March 31, 2013
Total Return Bond Fund
| Shares or Principal Amount($) | Value($) | |||||||
| Asset-Backed Securities 1.4% | ||||||||
Home Equity 0.3% | ||||||||
Ameriquest Mortgage Securities, Inc., Series 2005-R5, Cl M1, 0.634%, 07/25/35(a) | 4,743,812 | 4,628,058 | ||||||
|
| |||||||
Manufactured Housing 0.4% |
| |||||||
Newcastle Investment Trust, Series 2010-MH1, Cl M1, 6.000%, 07/10/35(b) | 4,660,000 | 4,904,655 | ||||||
|
| |||||||
Other 0.7% |
| |||||||
Domino’s Pizza Master Issuer LLC, Series 2012-1A, Cl A2, 5.216%, 01/25/42(b) | 7,111,700 | 7,981,020 | ||||||
Nationstar Agency Advance Funding Trust 2013-T2A, Series 2013-T2A, Cl AT2, 1.892%, 02/18/48(b) | 1,665,000 | 1,676,505 | ||||||
|
| |||||||
| 9,657,525 | ||||||||
|
| |||||||
Total Asset-Backed Securities |
| 19,190,238 | ||||||
|
| |||||||
| Collateralized Mortgage Obligations 7.2% | ||||||||
Agency Collateralized Mortgage Obligations 4.7% |
| |||||||
Federal Home Loan Mortgage Corporation | ||||||||
Series 3768, Cl CB, 3.500%, 12/15/25 | 2,366,874 | 2,545,727 | ||||||
Series 3774, Cl EW, 3.500%, 12/15/25 | 2,443,855 | 2,634,659 | ||||||
Series 3775, Cl EM, 3.500%, 11/15/25 | 4,282,495 | 4,682,900 | ||||||
Series 3800, Cl CB, 3.500%, 02/15/26 | 2,820,000 | 3,039,013 | ||||||
Series 3806, Cl L, 3.500%, 02/15/26 | 8,118,442 | 8,702,052 | ||||||
Series 3825, Cl CB, REMIC, 3.500%, 03/15/26 | 133,000 | 143,084 | ||||||
Series 3829, Cl BE, 3.500%, 03/15/26 | 3,634,000 | 3,919,996 | ||||||
Series 3877, Cl LM, 3.500%, 06/15/26 | 1,412,000 | 1,529,086 | ||||||
Series 3909, Cl UB, REMIC, 3.500%, 08/15/26 | 3,156,000 | 3,434,845 | ||||||
Series 3942, Cl KB, 3.000%, 10/15/26 | 4,411,556 | 4,639,413 | ||||||
Series 3950, Cl YB, 3.000%, 11/15/26 | 1,418,603 | 1,493,548 | ||||||
| Shares or Principal Amount($) | Value($) | |||||||
Agency Collateralized Mortgage Obligations—continued |
| |||||||
Series 3978, Cl B, 3.000%, 12/15/26 | 4,636,000 | 4,884,819 | ||||||
Series 4034, Cl B, 3.500%, 04/15/27 | 1,653,521 | 1,747,702 | ||||||
Series 4065, Cl CL, 3.000%, 06/15/27 | 1,902,575 | 2,012,844 | ||||||
Series 4077, Cl B, 3.000%, 07/15/27 | 1,718,283 | 1,820,091 | ||||||
|
| |||||||
| 47,229,779 | ||||||||
|
| |||||||
Federal National Mortgage Association | ||||||||
Series 2011-124, Cl BC, 3.500%, 12/25/21 | 2,183,370 | 2,392,419 | ||||||
Series 2011-36, Cl DB, 3.000%, 05/25/26 | 2,095,000 | 2,209,588 | ||||||
Series 2011-44, Cl EB, 3.000%, 05/25/26 | 5,208,000 | 5,499,622 | ||||||
Series 2012-17, Cl BC, 3.500%, 03/25/27 | 4,687,240 | 5,048,612 | ||||||
|
| |||||||
| 15,150,241 | ||||||||
|
| |||||||
| 62,380,020 | ||||||||
|
| |||||||
Agency Collateralized Planned Amortization Class Mortgage Obligations 0.4% |
| |||||||
Federal Home Loan Mortgage Corporation | ||||||||
Series 3959, Cl PB, 3.000%, 11/15/26 | 4,683,638 | 4,984,660 | ||||||
Federal National Mortgage Association | ||||||||
Series 2011-89, Cl BT, 3.500%, 09/25/26 | 600,000 | 632,425 | ||||||
|
| |||||||
| 5,617,085 | ||||||||
|
| |||||||
Commercial Mortgage Backed Securities 2.1% |
| |||||||
Extended Stay America Trust | ||||||||
Series 2013-ESH5, Cl B5, 2.278%, 12/05/31(b) | 2,940,000 | 2,989,239 | ||||||
Series 2013-ESH7, Cl A27, 2.958%, 12/05/31(b) | 2,845,000 | 2,877,379 | ||||||
|
| |||||||
| 5,866,618 | ||||||||
|
| |||||||
GS Mortgage Securities Corp. II | ||||||||
Series 2012-ALOH, Cl A, 3.551%, 04/10/34(b) | 5,681,000 | 5,973,657 | ||||||
Series 2012-BWTR, Cl A, 2.954%, 11/05/34(b) | 1,574,000 | 1,567,997 | ||||||
Series 2012-BWTR, Cl B, 3.255%, 11/05/34(b) | 2,890,000 | 2,894,263 | ||||||
|
| |||||||
| 10,435,917 | ||||||||
|
| |||||||
See Notes to Financial Statements.
115
SCHEDULES OF PORTFOLIO INVESTMENTS
RIDGEWORTH FUNDS March 31, 2013
Total Return Bond Fund — continued
| Shares or Principal Amount($) | Value($) | |||||||
Commercial Mortgage Backed Securities—continued |
| |||||||
JPMorgan Chase Commercial Mortgage Securities Corp. | ||||||||
Series 2005-LDP3, Cl A4B, 4.996%, 08/15/42(a) | 1,796,000 | 1,956,623 | ||||||
Series 2010-C2, Cl C, 5.527%, 11/15/43(a)(b) | 2,247,000 | 2,600,930 | ||||||
|
| |||||||
| 4,557,553 | ||||||||
|
| |||||||
LB-UBS Commercial Mortgage Trust | ||||||||
Series 2005-C3, Cl AM, 4.794%, 07/15/40 | 2,100,000 | 2,264,199 | ||||||
|
| |||||||
Merrill Lynch Mortgage Trust | ||||||||
Series 2005-LC1, Cl AM, 5.312%, 01/12/44(a) | 391,000 | 431,184 | ||||||
|
| |||||||
Wachovia Bank Commercial Mortgage Trust | ||||||||
Series 2005-C21, Cl AM, 5.241%, 10/15/44(a) | 3,142,000 | 3,460,875 | ||||||
|
| |||||||
| 27,016,346 | ||||||||
|
| |||||||
Total Collateralized Mortgage Obligations | 95,013,451 | |||||||
|
| |||||||
| Bank Loans 6.1% | ||||||||
Aerospace/Defense 0.1% | ||||||||
AM General LLC, Term Loan B, 03/22/18(b)(c)(d) | 310,000 | 303,800 | ||||||
AWAS Finance Luxembourg 2012 S.A., New Term Loan, 4.750%, 07/16/18(a)(b) | 93,074 | 93,423 | ||||||
DAE Aviation Holdings, Inc., Term Loan B, 6.250%, 10/29/18(a)(b) | 133,503 | 135,506 | ||||||
DAE Aviation Holdings, Inc., New Term Loan B2, 6.250%, 11/02/18(a)(b) | 60,522 | 61,429 | ||||||
DigitalGlobe, Inc., New Term Loan B, 3.750%, 01/24/20(a)(b) | 325,000 | 329,163 | ||||||
Silver II US Holdings LLC, Term Loan, 4.000%, 12/05/19(a)(b) | 144,638 | 145,695 | ||||||
Six3 Systems, Inc., Term Loan B, 7.000%, 10/04/19(a)(b) | 144,638 | 145,361 | ||||||
Transdigm, Inc., Term Loan C, 3.750%, 02/28/20(a)(b) | 209,475 | 212,093 | ||||||
| Shares or Principal Amount($) | Value($) | |||||||
Aerospace/Defense—continued |
| |||||||
WESCO Distribution, Inc., Term Loan B, 4.500%-5.750%, 12/12/19(a)(b) | 114,713 | 115,955 | ||||||
WP CPP Holdings LLC, 1st Lien Term Loan, 4.750%, 12/27/19(a)(b) | 174,563 | 174,926 | ||||||
|
| |||||||
| 1,717,351 | ||||||||
|
| |||||||
Auto Manufacturers 0.0%(e) | ||||||||
Navistar International Corp., Term Loan B, 7.000%, 07/16/14(a)(b) | 129,675 | 130,939 | ||||||
Wabash National Corp., Term Loan B, 6.000%, 05/02/19(a)(b) | 217,602 | 220,187 | ||||||
|
| |||||||
| 351,126 | ||||||||
|
| |||||||
Auto Parts & Equipment 0.2% |
| |||||||
Allison Transmission, Inc., Term Loan B2, 3.210%, 08/07/17(a)(b) | 1,496,698 | 1,508,342 | ||||||
Tomkins LLC, Term Loan B2, 3.750%, 09/29/16(a)(b) | 494,937 | 500,198 | ||||||
|
| |||||||
| 2,008,540 | ||||||||
|
| |||||||
Chemicals 0.2% |
| |||||||
Ascend Performance Materials LLC, Term Loan B, 6.750%, 04/10/18(a)(b) | 62,548 | 63,720 | ||||||
Eagle Spinco, Inc., Term Loan 1, 01/27/17(b)(c)(d) | 64,773 | 64,773 | ||||||
Huntsman International LLC, Extended TL B, 2.743%, 04/19/17(a)(b) | 544,949 | 548,187 | ||||||
Ineos US Finance LLC, 6 year Term Loan, 6.500%, 05/04/18(a)(b) | 920,962 | 935,430 | ||||||
Nexeo Solutions LLC, Term Loan B, 5.000%, 09/08/17(a)(b) | 182,780 | 182,667 | ||||||
PQ Corp., Term Loan, 4.500%, 08/07/17(a)(b) | 94,763 | 95,770 | ||||||
Taminco NV, USD Term Loan B2, 4.250%, 02/15/19(a)(b) | 99,002 | 99,651 | ||||||
U.S. Coatings Acquisition, Inc., Term Loan, 4.750%, 02/03/20(a)(b) | 275,000 | 278,553 | ||||||
|
| |||||||
| 2,268,751 | ||||||||
|
| |||||||
See Notes to Financial Statements.
116
SCHEDULES OF PORTFOLIO INVESTMENTS
RIDGEWORTH FUNDS March 31, 2013
Total Return Bond Fund — continued
| Shares or Principal Amount($) | Value($) | |||||||
Commercial Services 0.3% |
| |||||||
ADS Waste Holdings, Inc., New Term Loan B, 4.250%, 10/09/19(a)(b) | 438,900 | 443,381 | ||||||
AlixPartners LLP, Refinance Term Loan B2, 4.500%, 06/28/19(a)(b) | 178,652 | 179,880 | ||||||
Corporate Executive Board Co. (The), Term Loan B, 5.000%, 07/02/19(a)(b) | 74,813 | 75,561 | ||||||
Dematic S.A., Term Loan, 5.250%, 12/27/19(a)(b) | 194,513 | 196,458 | ||||||
Genpact International, Inc., Term Loan B, 4.250%, 08/30/19(a)(b) | 283,575 | 287,474 | ||||||
Harland Clarke Holdings Corp., Extended Term Loan B2, 5.454%, 06/30/17(a)(b)(c) | 678,657 | 670,174 | ||||||
Hertz Corp. (The), Term Loan B, 3.750%, 03/09/18(a)(b) | 494,950 | 495,360 | ||||||
Hertz Corp. (The), Add-On Term Loan B, 3.750%, 03/11/18(a)(b) | 129,675 | 131,296 | ||||||
Infor (US), Inc., Term Loan B2, 5.250%, 04/05/18(a)(b) | 293,525 | 298,001 | ||||||
Merrill Communications, LLC, 1st Lien Term Loan, 7.250%, 03/08/18(a)(b) | 260,000 | 259,805 | ||||||
Moneygram International, Inc., New Term Loan B, 03/20/20(b)(d) | 80,000 | 80,650 | ||||||
Walter Energy, Inc., Term Loan B, 5.750%, 04/02/18(a)(b) | 366,864 | 368,801 | ||||||
|
| |||||||
| 3,486,841 | ||||||||
|
| |||||||
Consumer Discretionary 0.0%(e) |
| |||||||
Collective Brands Finance, Inc., Term Loan, 7.250%, 10/09/19(a)(b) | 179,550 | 181,907 | ||||||
Revlon, Inc., Term Loan B, 4.000%, 11/19/17(a)(b) | 70,000 | 71,002 | ||||||
Spectrum Brands, Inc., New Term Loan, 4.500%, 12/17/19(a)(b) | 69,825 | 70,785 | ||||||
Sun Products Corp. (The), New Term Loan, 5.500%, 03/18/20(a)(b) | 150,000 | 151,313 | ||||||
|
| |||||||
| 475,007 | ||||||||
|
| |||||||
| Shares or Principal Amount($) | Value($) | |||||||
Consumer Staples 0.0%(e) |
| |||||||
Serta Simmons Holdings LLC, Term Loan, 5.000%, 10/01/19(a)(b) | 385,000 | 390,005 | ||||||
|
| |||||||
Diversified Financial Services 0.3% |
| |||||||
Acosta, Inc., Term Loan D, 5.000%, 03/02/18(a)(b) | 54,863 | 55,531 | ||||||
Affinion Group, Inc., Term Loan B, 6.500%, 10/10/16(a)(b) | 494,907 | 483,667 | ||||||
American Capital Holdings, Inc., New Term Loan, 5.500%, 08/22/16(a)(b) | 210,000 | 213,150 | ||||||
Clipper Acquisitions Corp., Term Loan B, 4.000%, 02/06/20(a)(b) | 144,638 | 146,084 | ||||||
Duff & Phelps Investment Management Co., Term Loan B, 03/14/20(b)(c)(d) | 70,000 | 70,657 | ||||||
First Data Corp., Extended 2018 Term Loan B, 4.204%, 03/23/18(a)(b) | 640,000 | 637,203 | ||||||
First Data Corp., Extended 2017 US Term Loan, 5.204%, 03/24/17(a)(b) | 180,000 | 181,215 | ||||||
First Data Corp., 2018 Add-on Term Loan, 5.204%, 09/24/18(a)(b) | 130,000 | 130,849 | ||||||
Getty Images, Inc., Term Loan B, 4.750%, 10/18/19(a)(b) | 84,788 | 85,890 | ||||||
Interactive Data Corp., New Term Loan B, 3.750%, 02/11/18(a)(b) | 305,000 | 308,242 | ||||||
MIP Delaware LLC, Term Loan, 07/12/18(b)(c)(d) | 100,000 | 100,667 | ||||||
Nuveen Investments, Inc., New Term Loan, 5.204%, 05/13/17(a)(b) | 275,000 | 279,961 | ||||||
Springleaf Financial Funding Co., Term Loan, 5.500%, 05/10/17(a)(b) | 950,000 | 954,949 | ||||||
SunGard Data Systems, Inc., Term Loan E, 4.000%, 03/08/20(a)(b) | 295,000 | 297,673 | ||||||
SunGard Data Systems, Inc., Term Loan D, 4.500%, 01/31/20(a)(b) | 324,188 | 327,971 | ||||||
|
| |||||||
| 4,273,709 | ||||||||
|
| |||||||
See Notes to Financial Statements.
117
SCHEDULES OF PORTFOLIO INVESTMENTS
RIDGEWORTH FUNDS March 31, 2013
Total Return Bond Fund — continued
| Shares or Principal Amount($) | Value($) | |||||||
Electric 0.1% |
| |||||||
Calpine Corp., Term Loan B1, 4.000%, 04/02/18(a)(b) | 989,899 | 1,001,451 | ||||||
Calpine Corp., Term Loan B3, 4.000%, 10/09/19(a)(b) | 233,825 | 236,748 | ||||||
NRG Energy, Inc., New Term Loan B, 3.250%, 07/02/18(a)(b) | 494,962 | 501,149 | ||||||
|
| |||||||
| 1,739,348 | ||||||||
|
| |||||||
Electronics 0.0%(e) |
| |||||||
Blackboard, Inc., Term Loan B2, 10/04/18(a)(b)(c)(d) | 164,588 | 166,851 | ||||||
|
| |||||||
Energy 0.0%(e) |
| |||||||
Chesapeake Energy Corp., New Unsecured Term Loan, 5.750%, 12/01/17(a)(b) | 510,000 | 525,239 | ||||||
Progressive Waste Solutions Ltd., Term Loan B, 3.500%, 10/24/19(a)(b) | 49,875 | 50,467 | ||||||
|
| |||||||
| 575,706 | ||||||||
|
| |||||||
Entertainment 0.1% |
| |||||||
Cedar Fair, L.P., New Term Loan B, 3.250%, 03/06/20(a)(b) | 135,000 | 136,604 | ||||||
Cinemark USA, Inc., New Term Loan, 3.210%, 12/18/19(a)(b) | 149,625 | 150,934 | ||||||
Delta 2 (LUX) S.A.R.L., Extended Term Loan B2, 6.000%, 04/30/19(a)(b) | 157,708 | 160,073 | ||||||
Live Nation Entertainment, Inc., Term Loan B, 4.500%, 11/07/16(a)(b) | 34,732 | 34,958 | ||||||
Regent Seven Seas Cruises, Inc., Refinance Term Loan B, 4.750%, 12/21/18(a)(b) | 120,000 | 121,350 | ||||||
SeaWorld Parks & Entertainment, Inc., Term Loan B, 4.000%, 08/17/17(a)(b) | 480,052 | 481,852 | ||||||
WaveDivision Holdings LLC, Term Loan B, 4.000%, 10/15/19(a)(b) | 74,813 | 75,608 | ||||||
|
| |||||||
| 1,161,379 | ||||||||
|
| |||||||
| Shares or Principal Amount($) | Value($) | |||||||
Food 0.3% |
| |||||||
AdvancePierre Foods, Inc., Term Loan, 5.750%, 07/10/17(a)(b) | 49,875 | 50,511 | ||||||
Aramark Corp., Non-Extended Synthetic LOC, 2.084%, 01/27/14(a)(b) | 39,441 | 39,747 | ||||||
Aramark Corp., Extended Term Loan C, 3.704%-3.784%, 07/26/16(a)(b) | 460,559 | 462,765 | ||||||
Aramark Corp., Term Loan D, 4.000%, 09/09/19(a)(b) | 175,000 | 176,530 | ||||||
Blue Buffalo Co., Ltd., Term Loan B2, 4.750%, 08/08/19(a)(b) | 164,176 | 166,433 | ||||||
Brasa Holdings, Inc., 1st Lien Term Loan, 7.500%, 07/19/19(a)(b) | 79,600 | 79,799 | ||||||
Burger King Corp., New Term Loan B, 3.750%, 09/27/19(a)(b) | 79,600 | 80,510 | ||||||
Del Monte Foods Co., Term Loan, 4.000%, 03/08/18(a)(b) | 104,738 | 105,605 | ||||||
HJ Heinz Co., Term Loan B2, 03/27/20(a)(b)(c)(d) | 1,285,000 | 1,295,884 | ||||||
ISS Holdings A/S, Term Loan B12, 03/15/18(a)(b)(c)(d) | 145,000 | 145,181 | ||||||
Landry’s, Inc., Term Loan B, 4.750%, 04/24/18(a)(b) | 400,254 | 403,256 | ||||||
OSI Restaurant Partners LLC, New Term Loan B, 4.750%, 10/24/19(a)(b) | 68,250 | 69,118 | ||||||
Wendy’s International, Inc., Term Loan B, 4.750%, 05/15/19(a)(b) | 189,050 | 190,861 | ||||||
|
| |||||||
| 3,266,200 | ||||||||
|
| |||||||
Health Care 0.5% |
| |||||||
American Renal Holdings, Inc., 1st Lien Term Loan, 4.500%, 09/22/19(a)(b) | 100,000 | 100,188 | ||||||
Aptalis Pharma, Inc., Term Loan B, 5.500%, 02/10/17(a)(b) | 494,937 | 498,401 | ||||||
Ardent Medical Services, Inc., Term Loan, 6.750%, 07/02/18(a)(b) | 204,488 | 207,896 | ||||||
See Notes to Financial Statements.
118
SCHEDULES OF PORTFOLIO INVESTMENTS
RIDGEWORTH FUNDS March 31, 2013
Total Return Bond Fund — continued
| Shares or Principal Amount($) | Value($) | |||||||
Health Care—continued |
| |||||||
Bausch & Lomb, Inc., Term Loan B, 5.250%, 05/17/19(a)(b) | 510,727 | 515,375 | ||||||
Biomet, Inc., Extended Term Loan B, 3.954%-4.034%, 07/25/17(a)(b) | 79,600 | 80,462 | ||||||
Community Health Systems, Inc., Extended Term Loan, 3.787%, 01/25/17(a)(b) | 119,897 | 121,055 | ||||||
Convatec, Inc., Term Loan, 5.000%, 12/22/16(a)(b) | 30,000 | 30,428 | ||||||
DaVita, Inc., Term Loan B2, 4.000%, 11/01/19(a)(b) | 568,575 | 573,817 | ||||||
Drumm Investors LLC, Term Loan, 5.000%, 05/04/18(a)(b) | 380,719 | 367,752 | ||||||
HCA, Inc., Extended Term Loan B2, 3.534%, 03/31/17(a)(b) | 500,000 | 504,095 | ||||||
Health Management Associates, Inc., Term Loan B, 11/16/18(b)(c)(d) | 59,846 | 60,345 | ||||||
Hologic, Inc., New Term Loan A, 2.203%, 07/17/17(a)(b) | 97,500 | 97,470 | ||||||
Hologic, Inc., Term Loan B, 4.500%, 08/01/19(a)(b) | 278,600 | 282,082 | ||||||
Iasis Healthcare LLC, Term Loan B2, 4.500%, 05/03/18(a)(b) | 299,250 | 302,865 | ||||||
IMS Health, Inc., USD Term Loan B1, 3.750%, 08/25/17(a)(b) | 108,795 | 109,856 | ||||||
Inc Research, Inc., Refinance Term Loan B, 6.000%, 07/12/18(a)(b) | 390,244 | 393,658 | ||||||
Lifepoint Hospitals, Inc., Term Loan B, 2.710%, 07/24/17(a)(b) | 104,738 | 105,523 | ||||||
Onex Carestream Finance LP, Term Loan B, 5.000%, 02/25/17(a)(b) | 211,828 | 212,472 | ||||||
Patheon, Inc., Term Loan, 7.250%, 12/06/18(a)(b) | 164,588 | 167,056 | ||||||
RPI Finance Trust, New Term Loan Tranche 2, 3.500%, 05/09/18(a)(b) | 1,487,912 | 1,509,309 | ||||||
| Shares or Principal Amount($) | Value($) | |||||||
Health Care—continued |
| |||||||
RPI Finance Trust, Incremental Tranche 2, 4.000%, 11/09/18(a)(b) | 153,265 | 154,606 | ||||||
Sage Products, Inc., Refinance Term Loan B, 4.250%, 12/13/19(a)(b) | 80,000 | 80,500 | ||||||
Select Medical Corp., New Incremental Term Loan B, 3.540%-5.500%, 02/13/16(a)(b) | 64,838 | 64,838 | ||||||
Warner Chilcott Co. LLC, New Term Loan B2, 4.250%, 03/15/18(a)(b) | 64,383 | 65,362 | ||||||
Warner Chilcott Corp., New Term Loan B1, 4.250%, 03/15/18(a)(b) | 181,693 | 184,457 | ||||||
Warner Chilcott Corp., Incremental Term Loan B1, 4.250%, 03/15/18(a)(b) | 79,092 | 80,295 | ||||||
WC Luxco S.A.R.L., New Term Loan B3, 4.250%, 03/15/18(a)(b) | 143,176 | 145,354 | ||||||
|
| |||||||
| 7,015,517 | ||||||||
|
| |||||||
Healthcare-Services 0.0%(e) |
| |||||||
Bright Horizons Family Solutions, Inc., New Term Loan B, 4.000%-5.250%, 01/16/20(a)(b) | 59,850 | 60,299 | ||||||
Par Pharmaceutical Cos., Inc., Refinance Term Loan B, 4.250%, 09/30/19(a)(b) | 313,427 | 316,298 | ||||||
Valeant Pharmaceuticals International, Inc., Refinance Term Loan D1, 3.500%, 02/13/19(a)(b) | 89,775 | 90,752 | ||||||
Valeant Pharmaceuticals International, Inc., Refinance Term Loan C1, 3.500%, 12/11/19(a)(b) | 84,788 | 85,706 | ||||||
|
| |||||||
| 553,055 | ||||||||
|
| |||||||
Information Technology 0.2% |
| |||||||
CDW LLC, Extended Term Loan, 4.000%, 07/14/17(a)(b) | 1,015,138 | 1,018,945 | ||||||
CompuCom Systems, Inc., New Term Loan, 6.500%, 10/04/18(a)(b) | 94,763 | 96,539 | ||||||
See Notes to Financial Statements.
119
SCHEDULES OF PORTFOLIO INVESTMENTS
RIDGEWORTH FUNDS March 31, 2013
Total Return Bond Fund — continued
| Shares or Principal Amount($) | Value($) | |||||||
Information Technology—continued |
| |||||||
DataPipe, Inc., 1st Lien Term Loan, 5.750%, 03/06/20(a)(b) | 65,000 | 65,487 | ||||||
Edwards (Cayman Islands II) Ltd., New Term Loan B, 03/26/20(b)(c)(d) | 50,000 | 50,000 | ||||||
Flextronics International Ltd., Term Loan A, 2.454%, 10/01/14(a)(b) | 101,158 | 101,253 | ||||||
Riverbed Technology, Inc., Term Loan, 4.000%, 12/18/19(a)(b) | 146,083 | 147,315 | ||||||
Shield Finance Co. S.A.R.L., New Term Loan B, 6.500%, 05/10/19(a)(b) | 198,500 | 200,237 | ||||||
Southern Graphics, Inc., Term Loan, 5.000%, 10/17/19(a)(b) | 144,638 | 146,084 | ||||||
SS&C Technologies, Inc., Term Loan B-2, 5.000%, 06/07/19(a)(b) | 11,897 | 12,061 | ||||||
SS&C Technologies, Inc., Term Loan B-1, 5.000%, 06/07/19(a)(b) | 115,006 | 116,588 | ||||||
STG-Fairway Acquisitions, Term Loan B, 6.250%, 02/28/19(a)(b) | 175,000 | 174,673 | ||||||
|
| |||||||
| 2,129,182 | ||||||||
|
| |||||||
Insurance 0.1% |
| |||||||
Asurion LLC, New Term Loan B1, 4.500%, 05/24/19(a)(b) | 1,062,338 | 1,072,833 | ||||||
CNO Financial Group, Inc., New Term Loan B1, 4.250%, 09/28/16(a)(b) | 31,500 | 31,776 | ||||||
Compass Investors, Inc., Term Loan, 5.250%, 12/27/19(a)(b) | 224,438 | 226,682 | ||||||
|
| |||||||
| 1,331,291 | ||||||||
|
| |||||||
Leisure Time 0.0%(e) |
| |||||||
Bombardier Recreational Products, Inc., New Term Loan B, 5.000%, 01/22/19(a)(b) | 105,000 | 106,031 | ||||||
ClubCorp Club Operations, Inc., Term Loan B, 5.000%, 11/30/16(a)(b) | 67,083 | 68,257 | ||||||
|
| |||||||
| 174,288 | ||||||||
|
| |||||||
| Shares or Principal Amount($) | Value($) | |||||||
Lodging 0.1% |
| |||||||
Caesars Entertainment Operating Co., Extended Term Loan B6, 5.454%, 01/26/18(a)(b)(c) | 363,267 | 336,225 | ||||||
CCM Merger, Inc., New Term Loan B, 6.000%, 03/01/17(a)(b) | 146,702 | 147,802 | ||||||
Las Vegas Sands LLC, Term Loan B, 1.710%, 05/23/14(a)(b) | 78,234 | 78,244 | ||||||
Las Vegas Sands LLC, Delayed Draw Term Loan, 1.710%, 05/23/14(a)(b) | 16,050 | 16,052 | ||||||
MGM Resorts International, Term Loan B, 4.250%, 12/20/19(a)(b) | 164,588 | 167,139 | ||||||
MGM Resorts International, Term Loan A, 3.284%, 12/20/17(a)(b) | 493,763 | 494,627 | ||||||
Peninsula Gaming LLC, Term Loan, 5.750%, 11/20/17(a)(b) | 114,713 | 116,577 | ||||||
Penn National Gaming, Inc., New Term Loan B, 3.750%, 07/16/18(a)(b) | 44,773 | 45,109 | ||||||
ROC Finance LLC, Term Loan, | 45,000 | 45,197 | ||||||
Seminole Tribe of Florida, Delayed Draw Term Loan B1, 1.784%, 03/05/14(a)(b) | 9,646 | 9,644 | ||||||
Seminole Tribe of Florida, Delayed Draw Term Loan B2, 1.784%, 03/05/14(a)(b) | 34,881 | 34,875 | ||||||
Seminole Tribe of Florida, Delayed Draw Term Loan B3, 1.784%, 03/05/14(a)(b) | 11,442 | 11,439 | ||||||
Station Casinos, Inc., New Term Loan B, 5.000%, 02/13/20(a)(b) | 350,000 | 353,790 | ||||||
Twin River Management Group, Inc., Term Loan B, 9/27/18(b)(c)(d) | 50,000 | 50,375 | ||||||
|
| |||||||
| 1,907,095 | ||||||||
|
| |||||||
See Notes to Financial Statements.
120
SCHEDULES OF PORTFOLIO INVESTMENTS
RIDGEWORTH FUNDS March 31, 2013
Total Return Bond Fund — continued
| Shares or Principal Amount($) | Value($) | |||||||
Machinery-Diversified 0.1% |
| |||||||
Alliance Laundry Systems LLC, Refinance Term Loan, 4.500%, 12/07/18(a)(b) | 99,494 | 100,140 | ||||||
Apex Tool Group, LLC, Term Loan B, 4.500%, 01/28/20(a)(b) | 120,000 | 121,534 | ||||||
Brand Energy & Infrastructure Services, Inc., USD Term Loan B2, 5.750%, 10/16/16(a)(b) | 104,415 | 105,003 | ||||||
Brand Energy & Infrastructure Services, Inc., Term Loan 2 Canadian, 5.750%, 10/16/16(a)(b) | 25,060 | 25,201 | ||||||
Brand Energy & Infrastructure Services, Inc., USD Term Loan B1, 6.250%, 10/16/18(a)(b) | 96,391 | 97,234 | ||||||
Brand Energy & Infrastructure Services, Inc., Term Loan 1 Canadian, 6.250%, 10/23/18(a)(b) | 23,134 | 23,336 | ||||||
Milacron LLC, New Term Loan, 02/20/19(b)(c)(d) | 70,000 | 70,437 | ||||||
Schaeffler AG, USD Term Loan C, 01/27/17(b)(c)(d) | 1,000,000 | 1,010,830 | ||||||
Total Safety US, Inc., 1st Lien Term Loan, 5.750%, 02/21/20(a)(b) | 65,000 | 65,434 | ||||||
|
| |||||||
| 1,619,149 | ||||||||
|
| |||||||
Media 0.4% |
| |||||||
CCO Holdings LLC, 3rd Lien Term Loan, 2.704%, 09/05/14(a)(b) | 55,000 | 55,057 | ||||||
Encompass Digital Media, Inc., New Term Loan B1, 6.750%, 08/10/17(a)(b) | 99,750 | 100,373 | ||||||
McGraw-Hill Global Education Holdings, LLC, Term Loan, 9.000%, 03/22/19(a)(b) | 240,000 | 231,451 | ||||||
Mediacom Broadband LLC, Term Loan F, 4.500%, 10/23/17(a)(b) | 494,911 | 497,593 | ||||||
Mediacom Communications Corp., Term Loan G, 4.000%, 01/08/20(a)(b) | 527,350 | 530,646 | ||||||
| Shares or Principal Amount($) | Value($) | |||||||
Media—continued |
| |||||||
Mediacom Illinois LLC, Term Loan C, 1.680%, 01/30/15(a)(b) | 74,405 | 74,188 | ||||||
Nine Entertainment Group Ltd., Term Loan B, 3.500%, 01/17/20(a)(b) | 175,000 | 175,219 | ||||||
Salem Communications Corp., Term Loan B, 4.500%, 03/15/20(a)(b) | 65,000 | 65,785 | ||||||
San Juan Cable Holdings LLC, New Term Loan B, 6.000%, 06/09/17(a)(b) | 494,962 | 501,149 | ||||||
Syniverse Holdings, Inc., Delayed Draw Term Loan, 2.000%, 04/23/19(a)(b) | 355,000 | 355,738 | ||||||
Syniverse Holdings, Inc., Term Loan, 5.000%, 04/23/19(a)(b) | 282,863 | 284,913 | ||||||
Tribune Co., Exit Term Loan, 4.000%, 12/31/19(a)(b) | 842,888 | 849,631 | ||||||
Univision Communications, Inc., Initial Term Loan, 2.204%, 09/29/14(a)(b) | 238,301 | 238,570 | ||||||
Univision Communications, Inc., Refinance Term Loan C2, 4.750%, 02/21/20(a)(b) | 325,000 | 326,544 | ||||||
Van Wagner Communications LLC, New Term Loan B, 8.250%, 08/03/18(a)(b) | 318,400 | 322,380 | ||||||
Village Roadshow Films (BVI) Ltd., Term Loan B, 4.750%, 11/21/17(a)(b) | 710,000 | 718,875 | ||||||
WideOpenWest Finance LLC, Term Loan B, 03/26/19(a)(b)(c)(d) | 140,000 | 141,196 | ||||||
WideOpenWest Finance LLC, 1st Lien Term Loan, 6.250%, 07/17/18(a)(b) | 168,489 | 170,147 | ||||||
|
| |||||||
| 5,639,455 | ||||||||
|
| |||||||
Mining 0.3% |
| |||||||
Ameriforge Group, Inc., 1st Lien Term Loan, 6.000%, 12/19/19(a)(b) | 59,850 | 60,623 | ||||||
Arch Coal, Inc., Term Loan B, 5.750%, 05/16/18(a)(b) | 183,413 | 186,418 | ||||||
See Notes to Financial Statements.
121
SCHEDULES OF PORTFOLIO INVESTMENTS
RIDGEWORTH FUNDS March 31, 2013
Total Return Bond Fund — continued
| Shares or Principal Amount($) | Value($) | |||||||
Mining—continued |
| |||||||
Atlas Iron Ltd., Term Loan B, 8.750%, 12/07/17(a)(b) | 99,750 | 99,999 | ||||||
FMG America Finance, Inc., Term Loan, 5.250%, 10/18/17(a)(b) | 2,079,550 | 2,103,132 | ||||||
Novelis, Inc., New Term Loan, 3.750%, 03/10/17(a)(b) | 826,224 | 836,552 | ||||||
|
| |||||||
| 3,286,724 | ||||||||
|
| |||||||
Miscellaneous Manufacturer 0.1% |
| |||||||
Boomerang Tube LLC, Term Loan, 11.000%, 10/02/17(a)(b) | 151,125 | 152,636 | ||||||
Clarke American Corp., Non Extended Term Loan B1, 2.704%, 06/30/14(a)(b)(c) | 523,553 | 520,196 | ||||||
QS0001 Corp., 1st Lien Term Loan, 5.000%, 11/09/18(a)(b) | 84,788 | 85,918 | ||||||
Sensata Technologies Finance Co. LLC, Term Loan, 3.750%, 05/11/18(a)(b) | 494,962 | 500,135 | ||||||
|
| |||||||
| 1,258,885 | ||||||||
|
| |||||||
Oil & Gas 0.4% |
| |||||||
Alon USA Energy, Inc., MLP Term Loan, 9.250%, 11/26/18(a)(b) | 121,917 | 126,489 | ||||||
EMG Utica LLC, Term Loan, 03/31/20(b)(c)(d) | 80,000 | 80,300 | ||||||
Energy Transfer Equity, L.P., New Term Loan B, 3.750%, 03/24/17(a)(b) | 1,500,000 | 1,504,695 | ||||||
EP Energy LLC, Incremental Term Loan, 4.500%, 04/26/19(a)(b) | 225,000 | 227,718 | ||||||
Frac Tech International LLC, Term Loan B, 8.500%, 05/06/16(a)(b) | 792,253 | 748,236 | ||||||
MEG Energy Corp., Refinance Term Loan, 3.750%, 03/31/20(a)(b) | 413,952 | 417,885 | ||||||
NFR Energy LLC, 2nd Lien Term Loan, 7.500%, 12/31/18(a)(b) | 80,000 | 81,850 | ||||||
| Shares or Principal Amount($) | Value($) | |||||||
Oil & Gas—continued |
| |||||||
Plains Exploration & Production, 7 year Term Loan, 4.000%, 11/30/19(a)(b) | 685,000 | 685,685 | ||||||
Ruby Western Pipeline Holdings, LLC, Term Loan B, 03/27/20(b)(c)(d) | 165,000 | 166,856 | ||||||
Saxon Energy Services, Inc., Term Loan B, 5.500%, 01/22/19(a)(b) | 95,000 | 95,396 | ||||||
Tesoro Corp., Term Loan B, 01/30/16(a)(b)(c)(d) | 215,000 | 217,419 | ||||||
Vantage Drilling Co., Term Loan B, 03/22/19(b)(c)(d) | 170,000 | 170,638 | ||||||
Vantage Drilling Co., Term Loan, 6.250%, 10/26/17(a)(b) | 190,125 | 191,313 | ||||||
|
| |||||||
| 4,714,480 | ||||||||
|
| |||||||
Packaging & Containers 0.2% |
| |||||||
Berlin Packaging LLC, 1st Lien Term Loan, 03/25/19(a)(b)(c)(d) | 45,000 | 44,775 | ||||||
Berry Plastics Holding Corp., Term Loan D, 3.500%, 02/04/20(a)(b) | 1,865,000 | 1,859,909 | ||||||
BWAY Corp., Term Loan B, 4.500%-5.500%, 08/07/17(a)(b) | 99,750 | 100,797 | ||||||
Consolidated Container Co. LLC, Term Loan Reprice, 5.000%, 07/03/19(a)(b) | 94,525 | 95,554 | ||||||
Reynolds Group Holdings, Inc., New Dollar Term Loan, 4.750%, 09/28/18(a)(b) | 233,825 | 237,064 | ||||||
Sealed Air Corp., New Term Loan, 4.000%, 10/03/18(a)(b) | 49,250 | 49,880 | ||||||
Tronox, Inc., Term Loan, 03/13/20(b)(c)(d) | 265,000 | 268,532 | ||||||
|
| |||||||
| 2,656,511 | ||||||||
|
| |||||||
Real Estate 0.2% |
| |||||||
Alliant Holdings I, Inc., New Term Loan B, 5.000%, 12/20/19(a)(b) | 194,513 | 196,782 | ||||||
CB Richard Ellis Services, Inc., New Term Loan B, 03/26/21(b)(c)(d) | 260,000 | 261,300 | ||||||
See Notes to Financial Statements.
122
SCHEDULES OF PORTFOLIO INVESTMENTS
RIDGEWORTH FUNDS March 31, 2013
Total Return Bond Fund — continued
| Shares or Principal Amount($) | Value($) | |||||||
Real Estate—continued |
| |||||||
General Growth Properties, Inc., Debtor in Possession Term Loan, 07/11/16(b)(c)(d) | 264,477 | 259,188 | ||||||
Istar Financial, Inc., Term Loan, 4.500%, 09/28/17(a)(b) | 1,104,171 | 1,112,794 | ||||||
Istar Financial, Inc., Add on Term Loan A2, 7.000%, 03/17/17(a)(b) | 15,000 | 15,970 | ||||||
Realogy Corp., Extended Letter of Credit, 4.459%, 10/10/16(a)(b) | 18,074 | 18,308 | ||||||
Realogy Corp., Extended Term Loan, 4.500%, 03/05/20(a)(b) | 190,000 | 192,455 | ||||||
|
| |||||||
| 2,056,797 | ||||||||
|
| |||||||
Retail 0.4% |
| |||||||
Academy Ltd., Term Loan, 4.750%, 08/03/18(a)(b) | 119,400 | 120,975 | ||||||
Albertson’s, LLC, Term Loan, 5.750%, 03/21/16(a)(b) | 330,000 | 335,362 | ||||||
BJ’s Wholesale Club, Inc., Replacement Term Loan, 4.250%, 09/26/19(a)(b) | 120,000 | 121,025 | ||||||
Capital Automotive LP, Term Loan B, 5.250%, 03/10/17(a)(b) | 636,202 | 637,596 | ||||||
Evergreen Acqco 1 LP, New Term Loan, 5.000%, 07/09/19(a)(b) | 124,375 | 125,813 | ||||||
Gymboree Co. ( The), Initial Term Loan, 5.000%, 02/23/18(a)(b) | 155,000 | 150,018 | ||||||
Harbor Freight Tools USA, Inc., Term Loan B, 5.500%, 11/14/17(a)(b) | 99,500 | 100,619 | ||||||
J Crew Group, Inc., Term Loan B1, 4.000%, 03/07/18(a)(b) | 494,962 | 500,100 | ||||||
Jo-Ann Stores, Inc., Term Loan, 4.000%, 03/16/18(a)(b) | 400,590 | 404,296 | ||||||
Michaels Stores, Inc., New Term Loan, 3.750%, 01/28/20(a)(b) | 210,000 | 211,953 | ||||||
Ollie’s Bargain Outlet, Inc., Term Loan, 5.250%-6.250%, 09/27/19(a)(b) | 85,000 | 85,425 | ||||||
| Shares or Principal Amount($) | Value($) | |||||||
Retail—continued |
| |||||||
Party City Holdings, Inc., Refinance Term Loan B, 4.250%, 07/29/19(a)(b)(c) | 353,402 | 355,777 | ||||||
Petco Animal Supplies, Inc., New Term Loan, 4.000%, 11/24/17(a)(b) | 498,724 | 504,899 | ||||||
Pilot Travel Centers LLC, Term Loan B2, 4.250%, 08/07/19(a)(b) | 109,450 | 110,647 | ||||||
Rite Aid Corp., Term Loan 6, 4.000%, 02/21/20(a)(b) | 280,000 | 283,032 | ||||||
Rite Aid Corp., 2nd Lien Term Loan, 5.750%, 08/21/20(a)(b) | 170,000 | 175,950 | ||||||
Supervalu, Inc., New Term Loan B, 6.250%, 03/21/19(a)(b) | 115,000 | 116,881 | ||||||
Toys ‘R’ Us-Delaware, Inc., Term Loan B3, 5.250%, 05/25/18(a)(b) | 137,530 | 130,883 | ||||||
Toys ‘R’ Us-Delaware, Inc., New Term Loan, 6.000%, 09/01/16(a)(b) | 179,540 | 175,649 | ||||||
|
| |||||||
| 4,646,900 | ||||||||
|
| |||||||
Semiconductors 0.1% |
| |||||||
Freescale Semiconductor, Inc., Term Loan B4, 5.000%, 03/02/20(a)(b) | 965,000 | 967,113 | ||||||
Microsemi Corp., Repriced Term Loan, 3.750%, 02/19/20(a)(b) | 225,000 | 226,913 | ||||||
ON Semiconductor Corp., Term Loan A, 01/02/18(b)(c)(d) | 385,000 | 371,525 | ||||||
|
| |||||||
| 1,565,551 | ||||||||
|
| |||||||
Software 0.0%(e) |
| |||||||
SurveyMonkey.com, LLC, Term Loan B, 5.500%, 02/05/19(a)(b) | 255,000 | 258,188 | ||||||
|
| |||||||
Telecommunication Services 0.9% |
| |||||||
Alcatel-Lucent USA, Inc., USD Term Loan B, 6.250%, 07/29/16(a)(b) | 40,000 | 40,528 | ||||||
Alcatel-Lucent USA, Inc., USD Term Loan C, 7.250%, 01/31/19(a)(b) | 149,625 | 151,769 | ||||||
See Notes to Financial Statements.
123
SCHEDULES OF PORTFOLIO INVESTMENTS
RIDGEWORTH FUNDS March 31, 2013
Total Return Bond Fund — continued
| Shares or Principal Amount($) | Value($) | |||||||
Telecommunication Services—continued |
| |||||||
Arris Group, Inc., Term Loan B, | 455,000 | 455,569 | ||||||
Avaya, Inc., Extended Term Loan B3, 4.788%, 10/26/17(a)(b)(c) | 234,322 | 220,907 | ||||||
Avaya, Inc., Term Loan B5, 8.000%, 03/30/18(a)(b) | 154,553 | 155,423 | ||||||
Cequel Communications LLC, Term Loan B, 4.000%, 02/14/19(a)(b) | 1,084,273 | 1,093,761 | ||||||
Consolidated Communications, Inc., Term Loan B3, 5.250%, 12/31/18(a)(b) | 144,638 | 146,156 | ||||||
Cricket Communications, Inc., Term Loan C, 02/21/20(b)(c)(d) | 205,000 | 206,076 | ||||||
Cricket Communications, Inc., Term Loan, 4.750%, 10/10/19(a)(b) | 34,913 | 35,065 | ||||||
Crown Castle International Corp., Term Loan B, 4.000%, 01/31/19(a)(b) | 1,084,259 | 1,095,557 | ||||||
CSC Holdings, Inc., Incremental B-2 Term Loan, 1.954%, 03/29/16(a)(b) | 615,496 | 618,475 | ||||||
Gray Television, Inc., New Term Loan B, 4.750%, 10/15/19(a)(b) | 327,748 | 331,297 | ||||||
Integra Telecom, Inc., Refinance Term Loan, 6.000%, 02/15/19(a)(b) | 275,000 | 278,482 | ||||||
Intelsat Jackson Holdings Ltd., Term Loan, 3.205%, 02/03/14(a)(b) | 2,000,000 | 1,997,000 | ||||||
Intelsat Jackson Holdings Ltd., Term Loan B1, 4.500%, 04/02/18(a)(b) | 374,063 | 379,112 | ||||||
Level 3 Financing, Inc., Term Loan, 4.750%, 08/01/19(a)(b) | 380,000 | 384,195 | ||||||
Level 3 Financing, Inc., 2019 Term Loan B, 5.250%, 08/01/19(a)(b) | 1,610,000 | 1,630,527 | ||||||
LIN Television Corp., Term Loan B, 4.000%, 12/21/18(a)(b) | 94,522 | 95,408 | ||||||
| Shares or Principal Amount($) | Value($) | |||||||
Telecommunication Services—continued |
| |||||||
MetroPCS Wireless, Inc., New Term Loan B3, 4.000%, 03/16/18(a)(b) | 494,945 | 496,094 | ||||||
Mission Broadcasting, Inc., Mission Term Loan B, 1.750%-4.500%, 12/03/19(a)(b) | 14,857 | 15,089 | ||||||
Nexstar Broadcasting, Inc., Term Loan, 4.500%, 12/03/19(a)(b) | 35,143 | 35,692 | ||||||
Peak Ten, Inc., New Term Loan B, 7.250%, 10/25/18(a)(b) | 94,763 | 95,592 | ||||||
UPC Financing Partnership, Term Loan T, 3.704%, 12/30/16(a)(b) | 485,660 | 488,088 | ||||||
Virgin Media Investment Holdings Ltd., USD Term Loan B, | 1,035,000 | 1,030,022 | ||||||
WMG Acquisition Corp., Term Loan, 5.250%, 11/01/18(a)(b) | 69,125 | 70,119 | ||||||
Zayo Group LLC, New Term Loan B, 4.500%, 07/02/19(a)(b) | 383,070 | 386,683 | ||||||
|
| |||||||
| 11,932,686 | ||||||||
|
| |||||||
Telecommunications 0.3% |
| |||||||
SBA Finance, Add on Term Loan, 3.750%, 09/27/19(a)(b) | 44,888 | 45,421 | ||||||
Vodafone Americas Finance 2, PIK Term Loan, 6.875%, 08/11/15(a)(b)(f) | 3,000,000 | 3,060,000 | ||||||
Windstream Corp., Term Loan B4, 3.500%, 01/23/20(a)(b) | 189,525 | 191,303 | ||||||
Windstream Corp., Term Loan B3, 4.000%, 08/08/19(a)(b) | 109,175 | 110,608 | ||||||
|
| |||||||
| 3,407,332 | ||||||||
|
| |||||||
Transportation 0.1% |
| |||||||
American Petroleum Tankers LLC, Term Loan B, 09/30/19(a)(b)(c) | 160,000 | 159,200 | ||||||
See Notes to Financial Statements.
124
SCHEDULES OF PORTFOLIO INVESTMENTS
RIDGEWORTH FUNDS March 31, 2013
Total Return Bond Fund — continued
| Shares or Principal Amount($) | Value($) | |||||||
Transportation—continued |
| |||||||
August LuxUK Holding Co., S.A.R.L., Luxco Term Loan, 6.250%, 04/27/18(a)(b) | 56,239 | 56,942 | ||||||
August U.S. Holding Co., Inc., Term Loan B, 6.250%, 04/27/18(a)(b) | 43,261 | 43,802 | ||||||
Avis Budget Car Rental, LLC, New Term Loan, 3.750%, 03/15/19(a)(b) | 59,849 | 60,460 | ||||||
Commercial Barge Line Co., 1st Lien Term Loan, 7.500%, 09/23/19(a)(b) | 180,000 | 180,000 | ||||||
Delta Air Lines, Inc., Term Loan B1, 5.250%, 10/18/18(a)(b) | 255,000 | 258,945 | ||||||
FleetPride Corp., 1st Lien Term Loan, 5.250%, 11/20/19(a)(b) | 134,663 | 136,110 | ||||||
Sabre, Inc., Term Loan C, 4.000%, 02/19/18(a)(b) | 168,438 | 169,310 | ||||||
Sabre, Inc., Term Loan B, 5.250%-6.250%, 02/19/19(a)(b) | 104,738 | 106,046 | ||||||
United Airlines, Inc., New Term Loan B, 03/22/19(b)(c)(d) | 65,000 | 65,596 | ||||||
|
| |||||||
| 1,236,411 | ||||||||
|
| |||||||
Utilities 0.1% |
| |||||||
AES Corp., Refinance Term Loan B, 3.750%-5.000%, 06/01/18(a)(b) | 700,128 | 709,194 | ||||||
Astoria Generating Co. Acquisitions, LLC, New Term Loan, 8.500%, 10/26/17(a)(b) | 120,000 | 124,050 | ||||||
NGPL PipeCo LLC, Term Loan B, 6.750%, 09/15/17(a)(b) | 238,929 | 242,016 | ||||||
|
| |||||||
| 1,075,260 | ||||||||
|
| |||||||
Total Bank Loans (Cost $79,270,111) | 80,345,571 | |||||||
|
| |||||||
| Corporate Bonds 19.9% | ||||||||
Aerospace/Defense 0.3% |
| |||||||
United Technologies Corp., 3.100%, 06/01/22 | 3,331,000 | 3,491,158 | ||||||
|
| |||||||
Auto Manufacturers 0.3% |
| |||||||
Daimler Finance N.A. LLC, 3.875%, 09/15/21(b) | 1,932,000 | 2,090,472 | ||||||
| Shares or Principal Amount($) | Value($) | |||||||
Auto Manufacturers—continued |
| |||||||
Volkswagen International Finance, 2.375%, 03/22/17(b) | 2,282,000 | 2,365,686 | ||||||
|
| |||||||
| 4,456,158 | ||||||||
|
| |||||||
Banks 1.5% |
| |||||||
Fifth Third Bank, 1.450%, 02/28/18 | 4,970,000 | 4,968,807 | ||||||
HSBC Bank PLC, 3.100%, 05/24/16(b) | 1,206,000 | 1,282,429 | ||||||
HSBC Bank PLC, 3.500%, 06/28/15(b) | 2,196,000 | 2,323,212 | ||||||
KeyBank NA, 1.650%, 02/01/18 | 2,151,000 | 2,170,473 | ||||||
PNC Bank NA, 0.800%, 01/28/16 | 5,329,000 | 5,328,398 | ||||||
Wells Fargo & Co., 1.250%, 02/13/15, MTN | 3,679,000 | 3,721,404 | ||||||
|
| |||||||
| 19,794,723 | ||||||||
|
| |||||||
Beverages 0.6% |
| |||||||
Anheuser-Busch InBev Worldwide, Inc., 2.500%, 07/15/22 | 4,337,000 | 4,262,950 | ||||||
SABMiller Holdings, Inc., 2.450%, 01/15/17(b) | 3,215,000 | 3,346,793 | ||||||
|
| |||||||
| 7,609,743 | ||||||||
|
| |||||||
Biotechnology 0.2% |
| |||||||
Life Technologies Corp., 5.000%, 01/15/21 | 493,000 | 533,383 | ||||||
Life Technologies Corp., 6.000%, 03/01/20 | 1,669,000 | 1,872,521 | ||||||
|
| |||||||
| 2,405,904 | ||||||||
|
| |||||||
Chemicals 0.3% |
| |||||||
Dow Chemical Co. (The), 4.375%, 11/15/42 | 1,823,000 | 1,748,398 | ||||||
Praxair, Inc., 4.625%, 03/30/15 | 2,271,000 | 2,453,302 | ||||||
|
| |||||||
| 4,201,700 | ||||||||
|
| |||||||
Commercial Services 0.4% |
| |||||||
ERAC USA Finance LLC, 2.750%, 03/15/17(b) | 1,483,000 | 1,544,837 | ||||||
ERAC USA Finance LLC, 5.250%, 10/01/20(b) | 1,663,000 | 1,930,743 | ||||||
ERAC USA Finance LLC, 5.600%, 05/01/15(b) | 1,184,000 | 1,296,327 | ||||||
|
| |||||||
| 4,771,907 | ||||||||
|
| |||||||
Computers 0.6% |
| |||||||
IBM Corp., 0.875%, 10/31/14 | 6,104,000 | 6,152,747 | ||||||
See Notes to Financial Statements.
125
SCHEDULES OF PORTFOLIO INVESTMENTS
RIDGEWORTH FUNDS March 31, 2013
Total Return Bond Fund — continued
| Shares or Principal Amount($) | Value($) | |||||||
Computers—continued |
| |||||||
IBM Corp., 4.000%, 06/20/42 | 2,300,000 | 2,307,792 | ||||||
|
| |||||||
| 8,460,539 | ||||||||
|
| |||||||
Diversified Financial Services 2.3% |
| |||||||
American Express Credit Corp., 2.375%, 03/24/17, MTN | 2,003,000 | 2,094,485 | ||||||
CME Group, Inc., 5.400%, 08/01/13 | 1,230,000 | 1,249,659 | ||||||
CME Group, Inc., 5.750%, 02/15/14 | 1,428,000 | 1,489,842 | ||||||
Ford Motor Credit Co. LLC, 5.000%, 05/15/18 | 3,287,000 | 3,620,335 | ||||||
General Electric Capital Corp., Series A, 7.125%(a)(g) | 1,400,000 | 1,628,291 | ||||||
General Electric Capital Corp., Series B, 6.250%(a)(g) | 4,700,000 | 5,158,405 | ||||||
John Deere Capital Corp., 1.250%, 12/02/14, MTN | 2,195,000 | 2,224,927 | ||||||
Lazard Group LLC, 7.125%, 05/15/15 | 1,781,000 | 1,970,133 | ||||||
MassMutual Global Funding LLC, 2.000%, 04/05/17(b) | 1,894,000 | 1,941,471 | ||||||
NASDAQ OMX Group, Inc. (The), 5.550%, 01/15/20 | 1,119,000 | 1,206,674 | ||||||
PACCAR Financial Corp., 1.550%, 09/29/14, MTN | 2,900,000 | 2,948,761 | ||||||
Toyota Motor Credit Corp., 3.200%, 06/17/15, MTN | 970,000 | 1,024,160 | ||||||
Woodside Finance Ltd., 4.600%, 05/10/21(b) | 3,559,000 | 3,963,377 | ||||||
|
| |||||||
| 30,520,520 | ||||||||
|
| |||||||
Electric 0.6% |
| |||||||
Alabama Power Co., 5.800%, 11/15/13 | 1,240,000 | 1,279,762 | ||||||
Dominion Resources, Inc., 1.950%, 08/15/16 | 699,000 | 720,833 | ||||||
Duke Energy Carolinas LLC, 4.300%, 06/15/20 | 525,000 | 603,343 | ||||||
Exelon Generation Co. LLC, 6.200%, 10/01/17 | 1,601,000 | 1,876,995 | ||||||
Georgia Power Co., 6.000%, 11/01/13 | 704,000 | 725,756 | ||||||
MidAmerican Energy Holdings Co., 6.125%, 04/01/36 | 1,792,000 | 2,227,302 | ||||||
| Shares or Principal Amount($) | Value($) | |||||||
Electric—continued |
| |||||||
Southern California Edison Co., 5.750%, 03/15/14 | 1,083,000 | 1,134,689 | ||||||
|
| |||||||
| 8,568,680 | ||||||||
|
| |||||||
Electronics 0.1% |
| |||||||
Thermo Fisher Scientific, Inc., 2.250%, 08/15/16 | 925,000 | 957,755 | ||||||
|
| |||||||
Food 0.1% |
| |||||||
Kroger Co. (The), 7.500%, 01/15/14 | 763,000 | 803,785 | ||||||
|
| |||||||
Healthcare-Products 0.2% |
| |||||||
Becton Dickinson and Co., 3.250%, 11/12/20 | 573,000 | 608,358 | ||||||
Covidien International Finance SA, 6.000%, 10/15/17 | 2,189,000 | 2,626,056 | ||||||
|
| |||||||
| 3,234,414 | ||||||||
|
| |||||||
Household Products/Wares 0.1% |
| |||||||
Clorox Co. (The), 3.050%, 09/15/22 | 1,334,000 | 1,345,875 | ||||||
|
| |||||||
Insurance 0.8% |
| |||||||
Berkshire Hathaway, Inc., 3.200%, 02/11/15 | 3,848,000 | 4,038,468 | ||||||
Berkshire Hathaway, Inc., 4.600%, 05/15/13 | 1,601,000 | 1,609,538 | ||||||
Fairfax Financial Holdings Ltd., 5.800%, 05/15/21(b) | 1,189,000 | 1,259,149 | ||||||
Nationwide Financial Services, Inc., 5.375%, 03/25/21(b) | 2,977,000 | 3,284,343 | ||||||
|
| |||||||
| 10,191,498 | ||||||||
|
| |||||||
Internet 0.1% |
| |||||||
eBay, Inc., 2.600%, 07/15/22 | 1,502,000 | 1,500,861 | ||||||
|
| |||||||
Machinery-Diversified 0.2% |
| |||||||
Deere & Co., 3.900%, 06/09/42 | 3,171,000 | 3,132,701 | ||||||
|
| |||||||
Media 1.0% |
| |||||||
Comcast Corp., 3.125%, 07/15/22 | 2,312,000 | 2,365,567 | ||||||
Comcast Corp., 4.650%, 07/15/42 | 3,020,000 | 3,073,327 | ||||||
Thomson Reuters Corp., 5.950%, 07/15/13 | 293,000 | 297,572 | ||||||
Time Warner Cable, Inc., 4.000%, 09/01/21 | 4,758,000 | 5,076,810 | ||||||
Time Warner Cable, Inc., 8.250%, 02/14/14 | 1,468,000 | 1,561,598 | ||||||
See Notes to Financial Statements.
126
SCHEDULES OF PORTFOLIO INVESTMENTS
RIDGEWORTH FUNDS March 31, 2013
Total Return Bond Fund — continued
| Shares or Principal Amount($) | Value($) | |||||||
Media—continued |
| |||||||
Time Warner, Inc., 6.200%, 03/15/40 | 492,000 | 572,390 | ||||||
|
| |||||||
| 12,947,264 | ||||||||
|
| |||||||
Mining 1.0% |
| |||||||
Barrick (PD) Australia Finance Property Ltd., 4.950%, 01/15/20 | 721,000 | 800,187 | ||||||
Barrick (PD) Australia Finance Property Ltd., 5.950%, 10/15/39 | 1,708,000 | 1,854,871 | ||||||
Barrick International Barbados Corp., 6.350%, 10/15/36(b) | 1,083,000 | 1,244,471 | ||||||
BHP Billiton Finance USA Ltd., 1.125%, 11/21/14 | 2,260,000 | 2,284,943 | ||||||
Kinross Gold Corp., 5.125%, 09/01/21 | 3,194,000 | 3,338,222 | ||||||
Newmont Mining Corp., 6.250%, 10/01/39 | 3,075,000 | 3,531,687 | ||||||
|
| |||||||
| 13,054,381 | ||||||||
|
| |||||||
Miscellaneous Manufacturer 0.6% |
| |||||||
3M Co., 1.375%, 09/29/16 | 1,432,000 | 1,466,556 | ||||||
General Electric Co., 4.125%, 10/09/42 | 1,654,000 | 1,658,209 | ||||||
General Electric Co., 5.250%, 12/06/17 | 1,394,000 | 1,632,916 | ||||||
Illinois Tool Works, Inc., 6.250%, 04/01/19 | 1,865,000 | 2,330,383 | ||||||
Siemens Financieringsmaatschappij NV 6.125%, 08/17/26(b) | 1,091,000 | 1,424,901 | ||||||
|
| |||||||
| 8,512,965 | ||||||||
|
| |||||||
Oil & Gas 0.8% |
| |||||||
BP Capital Markets PLC, 2.248%, 11/01/16 | 3,026,000 | 3,148,184 | ||||||
Ensco PLC, 4.700%, 03/15/21 | 2,483,000 | 2,772,299 | ||||||
Shell International Finance BV, 3.625%, 08/21/42 | 4,476,000 | 4,330,226 | ||||||
Statoil ASA, 3.125%, 08/17/17 | 427,000 | 462,951 | ||||||
|
| |||||||
| 10,713,660 | ||||||||
|
| |||||||
Oil & Gas Services 0.6% |
| |||||||
Baker Hughes, Inc., 5.125%, 09/15/40 | 1,869,000 | 2,172,632 | ||||||
Schlumberger Investment SA, 3.300%, 09/14/21(b) | 2,234,000 | 2,385,295 | ||||||
Weatherford International Ltd., 5.125%, 09/15/20 | 1,527,000 | 1,647,002 | ||||||
| Shares or Principal Amount($) | Value($) | |||||||
Oil & Gas Services—continued |
| |||||||
Weatherford International Ltd., 6.500%, 08/01/36 | 1,465,000 | 1,573,510 | ||||||
|
| |||||||
| 7,778,439 | ||||||||
|
| |||||||
Pharmaceuticals 0.7% |
| |||||||
Express Scripts Holding Co., 2.650%, 02/15/17 | 2,101,000 | 2,200,709 | ||||||
GlaxoSmithKline Capital, Inc., 5.650%, 05/15/18 | 2,412,000 | 2,915,758 | ||||||
Novartis Capital Corp., 3.700%, 09/21/42 | 591,000 | 570,397 | ||||||
Novartis Securities Investment Ltd., 5.125%, 02/10/19 | 1,305,000 | 1,558,192 | ||||||
Zoetis, Inc., 3.250%, 02/01/23(b) | 2,468,000 | 2,502,757 | ||||||
|
| |||||||
| 9,747,813 | ||||||||
|
| |||||||
Pipelines 1.7% |
| |||||||
El Paso Natural Gas Co., 5.950%, 04/15/17 | 593,000 | 688,197 | ||||||
El Paso Pipeline Partners Operating Co. LLC, 6.500%, 04/01/20 | 961,000 | 1,164,437 | ||||||
Energy Transfer Partners LP, 6.050%, 06/01/41 | 1,081,000 | 1,170,449 | ||||||
Energy Transfer Partners LP, 6.625%, 10/15/36 | 1,299,000 | 1,481,194 | ||||||
Enterprise Products Operating LLC, 5.250%, 01/31/20 | 4,001,000 | 4,684,827 | ||||||
Enterprise Products Operating LLC, Series J, 5.750%, 03/01/35 | 1,187,000 | 1,361,618 | ||||||
Kinder Morgan Energy Partners LP, 5.000%, 08/15/42 | 5,022,000 | 5,091,063 | ||||||
Southern Natural Gas Co., 5.900%, 04/01/17(b) | 382,000 | 445,234 | ||||||
TC Pipelines LP, 4.650%, 06/15/21 | 1,639,000 | 1,759,507 | ||||||
TransCanada PipeLines Ltd., 6.100%, 06/01/40 | 1,811,000 | 2,285,899 | ||||||
Transcontinental Gas Pipe Line Co. LLC, 6.050%, 06/15/18 | 365,000 | 443,587 | ||||||
Williams Partners LP, 4.125%, 11/15/20 | 2,472,000 | 2,667,206 | ||||||
|
| |||||||
| 23,243,218 | ||||||||
|
| |||||||
Real Estate Investment Trust 0.8% |
| |||||||
American Tower Corp., 3.500%, 01/31/23 | 2,623,000 | 2,601,512 | ||||||
See Notes to Financial Statements.
127
SCHEDULES OF PORTFOLIO INVESTMENTS
RIDGEWORTH FUNDS March 31, 2013
Total Return Bond Fund — continued
| Shares or Principal Amount($) | Value($) | |||||||
Real Estate Investment Trust—continued |
| |||||||
Digital Realty Trust LP, 4.500%, 07/15/15 | 2,551,000 | 2,710,484 | ||||||
Digital Realty Trust LP, 5.875%, 02/01/20 | 667,000 | 759,869 | ||||||
Healthcare Realty Trust, Inc., 6.500%, 01/17/17 | 3,431,000 | 3,948,841 | ||||||
|
| |||||||
| 10,020,706 | ||||||||
|
| |||||||
Retail 0.6% |
| |||||||
AutoZone, Inc., 3.700%, 04/15/22 | 2,030,000 | 2,094,804 | ||||||
Macy’s Retail Holdings, Inc., 4.300%, 02/15/43 | 2,864,000 | 2,625,139 | ||||||
Walgreen Co., 4.875%, 08/01/13 | 1,196,000 | 1,212,762 | ||||||
Wesfarmers Ltd., 6.998%, 04/10/13(b) | 1,821,000 | 1,822,972 | ||||||
|
| |||||||
| 7,755,677 | ||||||||
|
| |||||||
Semiconductors 0.9% |
| |||||||
Analog Devices, Inc., 3.000%, 04/15/16 | 407,000 | 430,582 | ||||||
Intel Corp., 1.950%, 10/01/16 | 1,635,000 | 1,693,698 | ||||||
Intel Corp., 4.250%, 12/15/42 | 463,000 | 452,273 | ||||||
Intel Corp., 4.800%, 10/01/41 | 5,873,000 | 6,203,104 | ||||||
TSMC Global Ltd., 1.625%, 04/03/18(b)(c) | 2,920,000 | 2,915,737 | ||||||
|
| |||||||
| 11,695,394 | ||||||||
|
| |||||||
Software 0.5% |
| |||||||
Fiserv, Inc., 4.750%, 06/15/21 | 1,431,000 | 1,551,218 | ||||||
Oracle Corp., 5.750%, 04/15/18 | 3,705,000 | 4,470,609 | ||||||
|
| |||||||
| 6,021,827 | ||||||||
|
| |||||||
Telecommunication Services 1.9% |
| |||||||
AT&T, Inc., 0.900%, 02/12/16 | 2,400,000 | 2,398,373 | ||||||
AT&T, Inc., 4.350%, 06/15/45(b) | 1,525,000 | 1,417,697 | ||||||
AT&T, Inc., 5.550%, 08/15/41 | 2,238,000 | 2,466,860 | ||||||
CC Holdings GS V LLC, 3.849%, 04/15/23(b) | 4,298,000 | 4,330,076 | ||||||
Cellco Partnership/Verizon Wireless Capital LLC, 5.550%, 02/01/14 | 874,000 | 908,395 | ||||||
Cisco Systems, Inc., 5.500%, 02/22/16 | 1,582,000 | 1,797,889 | ||||||
| Shares or Principal Amount($) | Value($) | |||||||
Telecommunication Services—continued |
| |||||||
Cisco Systems, Inc., 5.500%, 01/15/40 | 3,302,000 | 3,940,227 | ||||||
Juniper Networks, Inc., 3.100%, 03/15/16 | 372,000 | 389,837 | ||||||
Rogers Communications, Inc., 7.500%, 03/15/15 | 1,470,000 | 1,656,249 | ||||||
SBA Tower Trust, 2.933%, 12/15/42(b) | 2,692,000 | 2,811,283 | ||||||
Verizon Communications, Inc., 5.250%, 04/15/13 | 1,325,000 | 1,327,158 | ||||||
Verizon Communications, Inc., 5.550%, 02/15/16 | 1,832,000 | 2,066,736 | ||||||
|
| |||||||
| 25,510,780 | ||||||||
|
| |||||||
Transportation 0.1% |
| |||||||
United Parcel Service, Inc., 3.125%, 01/15/21 | 1,447,000 | 1,544,481 | ||||||
|
| |||||||
Total Corporate Bonds | 263,994,526 | |||||||
|
| |||||||
U.S. Government Agency Mortgages 25.7% |
| |||||||
Federal Home Loan Mortgage Corporation | ||||||||
Pool #J18446, 3.000%, 03/01/27 | 6,195,957 | 6,528,844 | ||||||
Pool #J18800, 3.000%, 04/01/27 | 10,363,589 | 10,920,387 | ||||||
Pool #J19132, 3.000%, 05/01/27 | 5,099,997 | 5,374,002 | ||||||
Pool #J19300, 3.000%, 06/01/27 | 1,767,986 | 1,861,868 | ||||||
Pool #G14517, 2.500%, 07/01/27 | 3,611,643 | 3,757,135 | ||||||
Pool #J19776, 3.000%, 07/01/27 | 915,955 | 973,467 | ||||||
Pool #J21337, 2.500%, 08/01/27 | 1,020,455 | 1,058,773 | ||||||
Pool #J20257, 3.000%, 08/01/27 | 5,131,348 | 5,403,830 | ||||||
Pool #J20922, 2.500%, 10/01/27 | 1,696,909 | 1,762,616 | ||||||
Pool #J20729, 2.500%, 10/01/27 | 2,684,122 | 2,792,249 | ||||||
Pool #J20738, 2.500%, 10/01/27 | 7,969,504 | 8,268,756 | ||||||
Pool #J21113, 2.500%, 11/01/27 | 2,764,044 | 2,871,073 | ||||||
Pool #J21155, 2.500%, 11/01/27 | 1,819,778 | 1,888,110 | ||||||
Pool #J21368, 3.000%, 11/01/27 | 843,692 | 891,130 | ||||||
See Notes to Financial Statements.
128
SCHEDULES OF PORTFOLIO INVESTMENTS
RIDGEWORTH FUNDS March 31, 2013
Total Return Bond Fund — continued
| Shares or Principal Amount($) | Value($) | |||||||
U.S. Government Agency Mortgages—continued |
| |||||||
Pool #J21295, 2.500%, 12/01/27 | 1,856,295 | 1,928,173 | ||||||
Pool #J22029, 3.000%, 01/01/28 | 3,635,665 | 3,828,724 | ||||||
Pool #J22255, 2.500%, 02/01/28(c) | 1,236,981 | 1,286,812 | ||||||
Pool #J22529, 2.500%, 02/01/28 | 2,501,373 | 2,601,356 | ||||||
Pool #J22137, 2.500%, 02/01/28 | 2,039,219 | 2,115,791 | ||||||
Pool #J22728, 2.500%, 03/01/28(c) | 951,337 | 988,769 | ||||||
Pool #J22831, 2.500%, 03/01/28 | 5,300,774 | 5,512,654 | ||||||
Pool #J22873, 2.500%, 03/01/28 | 1,577,610 | 1,640,177 | ||||||
Pool #J22521, 2.500%, 03/01/28 | 3,992,112 | 4,150,436 | ||||||
Pool #D99439, 3.500%, 06/01/32 | 1,031,086 | 1,104,515 | ||||||
Pool #G30614, 3.500%, 12/01/32 | 6,876,073 | 7,329,912 | ||||||
Pool #A12413, 5.000%, 08/01/33 | 723,614 | 785,543 | ||||||
Pool #G05052, 5.000%, 10/01/33 | 416,381 | 452,016 | ||||||
Pool #G01797, 5.500%, 12/01/33 | 558,846 | 610,843 | ||||||
Pool #G01779, 5.000%, 04/01/35 | 829,987 | 896,870 | ||||||
Pool #G01837, 5.000%, 07/01/35 | 5,920,298 | 6,389,975 | ||||||
Pool #A39731, 5.000%, 11/01/35 | 1,449,439 | 1,564,428 | ||||||
Pool #G02162, 5.500%, 05/01/36 | 5,840,246 | 6,341,671 | ||||||
Pool #G02252, 5.500%, 07/01/36 | 1,060,576 | 1,151,634 | ||||||
Pool #Z40004, 6.000%, 08/01/36 | 1,342,070 | 1,465,265 | ||||||
Pool #G02424, 5.500%, 12/01/36 | 450,931 | 489,647 | ||||||
Pool #G04997, 5.000%, 01/01/37 | 1,888,479 | 2,038,299 | ||||||
Pool #G05521, 5.500%, 05/01/37 | 873,294 | 951,586 | ||||||
Pool #G03156, 5.500%, 08/01/37 | 63,335 | 68,595 | ||||||
Pool #G03551, 6.000%, 11/01/37 | 82,151 | 89,821 | ||||||
| Shares or Principal Amount($) | Value($) | |||||||
U.S. Government Agency Mortgages—continued |
| |||||||
Pool #G05326, 5.000%, 02/01/38 | 7,525,893 | 8,122,948 | ||||||
Pool #G04337, 5.500%, 04/01/38 | 1,076,365 | 1,165,751 | ||||||
Pool #G07135, 6.000%, 10/01/38 | 6,040,730 | 6,612,224 | ||||||
Pool #G06079, 6.000%, 07/01/39 | 3,769,987 | 4,126,654 | ||||||
Pool #A93996, 4.500%, 09/01/40 | 1,732,933 | 1,854,979 | ||||||
Pool #Q00291, 5.000%, 04/01/41 | 616,027 | 669,134 | ||||||
2.500%, TBA, 15 Year Maturity(c) | 29,471,000 | 30,511,695 | ||||||
|
| |||||||
| 163,199,137 | ||||||||
|
| |||||||
Federal National Mortgage Association | ||||||||
Pool #AM3173, 2.050%, 06/01/20(c) | 1,670,000 | 1,688,587 | ||||||
Pool #AM2137, 1.950%, 08/01/20 | 1,329,000 | 1,333,028 | ||||||
Pool #AM2920, 1.980%, 11/01/20(c) | 2,111,000 | 2,112,984 | ||||||
Pool #AM1003, 2.150%, 12/01/20 | 1,382,692 | 1,394,484 | ||||||
Pool #AM0392, 2.140%, 01/01/21 | 2,544,802 | 2,583,279 | ||||||
Pool #471235, 3.120%, 05/01/22 | 84,407 | 90,066 | ||||||
Pool #AM0418, 2.720%, 08/01/22 | 1,954,957 | 2,029,705 | ||||||
Pool #AM0463, 2.720%, 09/01/22 | 1,670,191 | 1,726,894 | ||||||
Pool #AM3033, 2.670%, 04/01/23(c) | 1,622,000 | 1,657,846 | ||||||
Pool #AM0061, 3.100%, 07/01/24 | 494,775 | 514,379 | ||||||
Pool #AK4110, 3.000%, 02/01/27 | 858,138 | 903,673 | ||||||
Pool #AO3012, 2.500%, 05/01/27 | 2,129,788 | 2,214,733 | ||||||
Pool #AL3274, 3.000%, 05/01/27 | 3,037,102 | 3,196,359 | ||||||
Pool #AO4398, 2.500%, 07/01/27 | 1,714,741 | 1,785,142 | ||||||
Pool #AK4136, 2.500%, 08/01/27 | 406,123 | 422,289 | ||||||
Pool #AP4725, 3.000%, 08/01/27 | 967,049 | 1,022,292 | ||||||
Pool #AP1220, 2.500%, 09/01/27 | 3,451,540 | 3,586,775 | ||||||
See Notes to Financial Statements.
129
SCHEDULES OF PORTFOLIO INVESTMENTS
RIDGEWORTH FUNDS March 31, 2013
Total Return Bond Fund — continued
| Shares or Principal Amount($) | Value($) | |||||||
U.S. Government Agency Mortgages—continued |
| |||||||
Pool #AI9132, 3.000%, 09/01/27 | 801,215 | 844,480 | ||||||
Pool #AP7520, 3.000%, 09/01/27 | 2,611,427 | 2,767,132 | ||||||
Pool #AP1221, 2.500%, 10/01/27 | 2,116,488 | 2,199,414 | ||||||
Pool #AP9774, 2.500%, 10/01/27 | 7,554,549 | 7,855,855 | ||||||
Pool #AI9138, 3.000%, 10/01/27 | 1,895,006 | 1,997,336 | ||||||
Pool #AQ7339, 2.500%, 11/01/27 | 3,927,174 | 4,081,044 | ||||||
Pool #AM1589, 2.420%, 12/01/27 | 1,270,690 | 1,278,755 | ||||||
Pool #AI9142, 2.500%, 12/01/27 | 3,324,859 | 3,453,052 | ||||||
Pool #AQ1273, 3.000%, 01/01/28 | 708,583 | 746,182 | ||||||
Pool #AR1215, 3.000%, 01/01/28 | 1,337,517 | 1,408,489 | ||||||
Pool #AR3823, 2.500%, 02/01/28 | 2,309,455 | 2,405,715 | ||||||
Pool #AB4168, 3.500%, 01/01/32(c) | 6,529,961 | 6,973,182 | ||||||
Pool #MA0949, 3.500%, 01/01/32 | 4,934,016 | 5,268,912 | ||||||
Pool #MA0976, 3.500%, 02/01/32 | 1,651,360 | 1,760,094 | ||||||
Pool #AP9592, 3.500%, 10/01/32 | 4,404,147 | 4,703,079 | ||||||
Pool #AB7691, 3.500%, 01/01/33 | 2,274,258 | 2,428,623 | ||||||
Pool #AB8428, 3.500%, 02/01/33 | 4,575,005 | 4,891,252 | ||||||
Pool #725773, 5.500%, 09/01/34 | 4,398,048 | 4,852,100 | ||||||
Pool #255458, 5.500%, 11/01/34 | 517,701 | 571,148 | ||||||
Pool #735036, 5.500%, 12/01/34 | 4,087,632 | 4,509,637 | ||||||
Pool #827943, 5.000%, 05/01/35 | 931,374 | 1,013,757 | ||||||
Pool #735500, 5.500%, 05/01/35 | 3,658,957 | 4,013,838 | ||||||
Pool #843434, 5.500%, 05/01/35 | 843,997 | 929,285 | ||||||
Pool #735578, 5.000%, 06/01/35 | 1,661,956 | 1,804,711 | ||||||
Pool #357829, 6.000%, 06/01/35 | 2,011,657 | 2,181,572 | ||||||
| Shares or Principal Amount($) | Value($) | |||||||
U.S. Government Agency Mortgages—continued |
| |||||||
Pool #357937, 6.000%, 07/01/35 | 3,097,183 | 3,420,404 | ||||||
Pool #888344, 5.000%, 10/01/35 | 4,888,062 | 5,307,926 | ||||||
Pool #190363, 5.500%, 11/01/35 | 3,879,943 | 4,256,257 | ||||||
Pool #AE0115, 5.500%, 12/01/35 | 4,709,622 | 5,199,842 | ||||||
Pool #745428, 5.500%, 01/01/36 | 6,074,146 | 6,651,419 | ||||||
Pool #190370, 6.000%, 06/01/36 | 7,308,643 | 8,024,357 | ||||||
Pool #AI7951, 4.500%, 08/01/36 | 1,688,645 | 1,820,166 | ||||||
Pool #888173, 5.500%, 11/01/36 | 1,735,416 | 1,903,734 | ||||||
Pool #888415, 5.000%, 12/01/36 | 1,381,992 | 1,500,699 | ||||||
Pool #995082, 5.500%, 08/01/37 | 2,769,825 | 3,055,781 | ||||||
Pool #995023, 5.500%, 08/01/37 | 266,904 | 292,791 | ||||||
Pool #889529, 6.000%, 03/01/38 | 2,459,879 | 2,748,582 | ||||||
Pool #995724, 6.000%, 04/01/39 | 4,044,601 | 4,519,294 | ||||||
Pool #AD0439, 6.000%, 07/01/39 | 1,798,041 | 1,981,759 | ||||||
Pool #AD7136, 5.000%, 07/01/40 | 1,008,185 | 1,107,386 | ||||||
Pool #AB1343, 4.500%, 08/01/40 | 3,535,523 | 3,859,122 | ||||||
Pool #AL0005, 4.500%, 01/01/41 | 1,806,242 | 1,948,616 | ||||||
Pool #AB2694, 4.500%, 04/01/41 | 1,604,009 | 1,754,000 | ||||||
Pool #AL1627, 4.500%, 09/01/41 | 5,639,184 | 6,189,416 | ||||||
Pool #AQ2197, 4.500%, 11/01/42 | 1,342,972 | 1,463,937 | ||||||
|
| |||||||
| 170,206,647 | ||||||||
|
| |||||||
Government National Mortgage Association | ||||||||
Pool #AB1392, 3.000%, 08/15/27 | 1,225,985 | 1,306,357 | ||||||
Pool #799709, 3.000%, 09/15/27 | 2,388,601 | 2,541,459 | ||||||
Pool #AA6920, 3.000%, 10/15/27 | 3,155,172 | 3,357,087 | ||||||
See Notes to Financial Statements.
130
SCHEDULES OF PORTFOLIO INVESTMENTS
RIDGEWORTH FUNDS March 31, 2013
Total Return Bond Fund — continued
| Shares or Principal Amount($) | Value($) | |||||||
U.S. Government Agency Mortgages—continued |
| |||||||
Pool #AA6933, 3.000%, 11/15/27 | 714,261 | 759,970 | ||||||
|
| |||||||
| 7,964,873 | ||||||||
|
| |||||||
Total U.S. Government Agency Mortgages (Cost $335,864,089) | 341,370,657 | |||||||
|
| |||||||
U.S. Treasury Obligations 38.2% |
| |||||||
U.S. Treasury Bond 4.1% |
| |||||||
2.750%, 11/15/42 | 58,358,000 | 54,090,571 | ||||||
|
| |||||||
U.S. Treasury Notes 34.1% |
| |||||||
0.375%, 11/15/15 | 134,629,000 | 134,839,291 | ||||||
1.750%, 05/31/16(h) | 90,540,000 | 94,387,950 | ||||||
1.000%, 03/31/17 | 68,155,000 | 69,342,396 | ||||||
0.625%, 08/31/17 | 81,330,000 | 81,247,369 | ||||||
2.000%, 02/15/23(i) | 71,724,000 | 72,631,739 | ||||||
|
| |||||||
| 452,448,745 | ||||||||
|
| |||||||
Total U.S. Treasury Obligations (Cost $501,703,944) | 506,539,316 | |||||||
|
| |||||||
Preferred Stocks 0.8% |
| |||||||
Banks 0.5% |
| |||||||
PNC Financial Services Group, Inc., Series P, 6.125%(g) | 84,825 | 2,347,107 | ||||||
US Bancorp, Series F, 6.500%(g) | 83,700 | 2,499,282 | ||||||
US Bancorp, Series G, 6.000%(g) | 85,175 | 2,371,272 | ||||||
|
| |||||||
| 7,217,661 | ||||||||
|
| |||||||
Insurance 0.3% | ||||||||
Arch Capital Group Ltd., Series C, 6.750%(g) | 48,575 | 1,352,814 | ||||||
Reinsurance Group of America, Inc., 6.200%(a) | 71,100 | 1,936,053 | ||||||
|
| |||||||
| 3,288,867 | ||||||||
|
| |||||||
Real Estate Investment Trust 0.0%(e) |
| |||||||
Public Storage, Series U, 5.625%(g) | 21,000 | 541,170 | ||||||
|
| |||||||
Total Preferred Stocks | 11,047,698 | |||||||
|
| |||||||
Short-Term Investment 3.9% |
| |||||||
RidgeWorth Funds Securities Lending Joint Account(j) | 51,812,500 | 51,812,500 | ||||||
|
| |||||||
Total Short-Term Investment | 51,812,500 | |||||||
|
| |||||||
| Shares or Principal Amount($) | Value($) | |||||||
Money Market Fund 6.2% |
| |||||||
State Street Institutional Treasury Money Market Fund, Institutional Class, 0.00%(k) | 82,480,896 | 82,480,896 | ||||||
|
| |||||||
Total Money Market Fund (Cost $82,480,896) | 82,480,896 | |||||||
|
| |||||||
Total Investments | 1,451,794,853 | |||||||
Liabilities in excess of other assets — (9.4)% | (124,591,501 | ) | ||||||
|
| |||||||
Net Assets — 100.0% | $ | 1,327,203,352 | ||||||
|
| |||||||
| (a) | Variable or floating rate security. Rate disclosed is as of March 31, 2013. |
| (b) | Rule 144A, Section 4(2) or other security which is restricted as to resale to institutional investors. The Fund’s investment adviser/subadviser has deemed this security to be liquid based upon procedures approved by the Board of Trustees. These securities represent 12.2% of net assets as of March 31, 2013. |
| (c) | All or a portion of this security has been purchased on a when-issued or delayed-delivery basis. |
| (d) | The security does not have a stated settlement date and will receive a rate upon settling with the custodian. |
| (e) | Less than 0.05% of Net Assets. |
| (f) | The Fund’s investment adviser/subadviser has deemed this security to be illiquid based upon procedures approved by the Board of Trustees. |
| (g) | Security is perpetual in nature and has no stated maturity. |
| (h) | All or a portion of this security has been segregated, or otherwise earmarked, in connection with obligations for when-issued or delayed-delivery purchase commitments. |
| (i) | The security or a partial position of the security was on loan as of March 31, 2013. The total value of securities on loan as of March 31, 2013 was $50,797,997. |
| (j) | Purchased with cash collateral held from securities lending. The value of the collateral could include collateral held for securities that were sold on or before March 31, 2013 (See Note 2(k)). |
| (k) | Rate disclosed, the 7 day net yield, is as of March 31, 2013. |
Investment Abbreviations
| MTN | — | Medium Term Note | ||
| REMIC | — | Real Estate Mortgage Investment Conduit | ||
| TBA | — | To Be Announced. Securities purchased on a forward commitment basis with an appropriate principal amount and no definitive maturity date. The actual principal and maturity date will be determined upon settlement date. |
See Notes to Financial Statements.
131
SCHEDULES OF PORTFOLIO INVESTMENTS
RIDGEWORTH FUNDS March 31, 2013
Total Return Bond Fund — concluded
Credit Default Swap Contracts — Buy Protection
At March 31, 2013, the Fund’s open credit default swap contracts were as follows:
Underlying Instrument | Counterparty | Notional Amount | Fixed Rate | Expiration Date | Implied Credit Spread* | Upfront Payments Made (Received) | Value | Unrealized Depreciation | ||||||||||||||||||||||
CDX.NA.HY.20 | CS First Boston | $66,000,000 | 5.000 | % | 06/20/18 | 4.310 | % | $(1,975,853 | ) | $(2,016,800 | ) | $(40,947 | ) | |||||||||||||||||
CDX.NA.HY.20 | JPMorgan | 66,000,000 | 5.000 | 06/20/18 | 4.310 | (1,934,689 | ) | (2,016,800 | ) | (82,111 | ) | |||||||||||||||||||
Quest Diagnostics Inc. | CS First Boston | 7,000,000 | 1.000 | 06/20/18 | 1.276 | 116,626 | 98,777 | (17,849 | ) | |||||||||||||||||||||
|
|
|
|
|
| |||||||||||||||||||||||||
| $(3,793,916 | ) | $(3,934,823 | ) | $(140,907 | ) | |||||||||||||||||||||||||
|
|
|
|
|
| |||||||||||||||||||||||||
As the buyer of protection, the Fund pays periodic fees in return for payment by the seller which is contingent upon an adverse credit event occurring in the underlying issuer or reference entity.
The value column indicates the impact each respective swap contract has on the Fund’s Net Assets at March 31, 2013.
| * | Implied credit spreads serve as an indicator of the current status of the payment/performance risk and represent the likelihood or risk of default for the credit derivative. The implied credit spread of a particular reference entity reflects the cost of buying/selling protection and may include upfront payments required to be made to enter into the agreement. Wider credit spreads represent a deterioration of the reference entity’s credit soundness and a greater likelihood or risk of default or other credit event occurring as defined under the terms of the agreement. |
Forward Foreign Currency Contracts
At March 31, 2013, the Fund’s open forward foreign currency contracts were as follows:
Currency | Counterparty | Delivery Date | Contract Amount in Local Currency | Contract Value in USD | Market Value | Unrealized Appreciation/ (Depreciation) | ||||||||||||||||
Short: | ||||||||||||||||||||||
Euro | JPMorgan | 05/07/13 | 22,258,393 | $ | 28,750,000 | $ | 28,538,364 | $ | 211,636 | |||||||||||||
New Zealand Dollar | JPMorgan | 05/20/13 | 8,040,811 | 6,620,000 | 6,706,748 | (86,748 | ) | |||||||||||||||
|
|
|
|
|
| |||||||||||||||||
Total Short Contracts | $ | 35,370,000 | $ | 35,245,112 | $ | 124,888 | ||||||||||||||||
|
|
|
|
|
| |||||||||||||||||
Long: | ||||||||||||||||||||||
Brazilian Real | JPMorgan | 05/03/13 | 13,351,000 | 6,688,878 | 6,583,932 | (104,946 | ) | |||||||||||||||
Chilean Peso | JPMorgan | 04/15/13 | 9,635,011,250 | 20,284,594 | 20,395,630 | 111,036 | ||||||||||||||||
Currency | Counterparty | Delivery Date | Contract Amount in Local Currency | Contract Value in USD | Market Value | Unrealized Appreciation/ (Depreciation) | ||||||||||||||||
Mexican Peso (new) | JPMorgan | 04/15/13 | 209,568,115 | $ | 16,386,361 | $ | 16,946,099 | $ | 559,738 | |||||||||||||
New Russian Ruble | JPMorgan | 04/15/13 | 203,857,550 | 6,723,756 | 6,541,888 | (181,868 | ) | |||||||||||||||
South African Rand | JPMorgan | 04/16/13 | 118,608,065 | 13,227,911 | 12,876,107 | (351,804 | ) | |||||||||||||||
Turkish Lira | JPMorgan | 04/08/13 | 29,296,302 | 16,256,757 | 16,178,314 | (78,443 | ) | |||||||||||||||
|
|
|
|
|
| |||||||||||||||||
Total Long Contracts | $ | 79,568,257 | $ | 79,521,970 | $ | (46,287 | ) | |||||||||||||||
|
|
|
|
|
| |||||||||||||||||
As of March 31, 2013, the Fund had the following unfunded loan commitment:
Borrower | Unfunded Commitments | Unrealized Appreciation | ||||||
Syniverse Holdings | $355,000 | $2,159 | ||||||
The commitments are available until the maturity date of the respective security.
See Notes to Financial Statements.
132
SCHEDULES OF PORTFOLIO INVESTMENTS
RIDGEWORTH FUNDS March 31, 2013
Ultra-Short Bond Fund
| Shares or Principal Amount($) | Value($) | |||||||
| Asset-Backed Securities 3.5% | ||||||||
Automobiles 3.5% |
| |||||||
Ford Credit Auto Owner Trust, Series 2011-A, Cl A4, 1.650%, 05/15/16 | 360,000 | 364,621 | ||||||
Ford Credit Auto Owner Trust, Series 2012-A, Cl A2, 0.620%, 09/15/14 | 121,949 | 121,999 | ||||||
Harley-Davidson Motorcycle Trust, Series 2011-2, Cl A2, 0.710%, 05/15/15 | 167,067 | 167,186 | ||||||
Harley-Davidson Motorcycle Trust, Series 2011-2, Cl A3, 1.110%, 09/15/16 | 555,000 | 558,154 | ||||||
Honda Auto Receivables Owner Trust, Series 2010-2, Cl A3, 1.340%, 03/18/14 | 13,950 | 13,967 | ||||||
Hyundai Auto Receivables Trust, Series 2011-B, Cl A4, 1.650%, 02/15/17 | 1,065,000 | 1,083,111 | ||||||
Hyundai Auto Receivables Trust, Series 2011-C, Cl A4, 1.300%, 02/15/18 | 975,000 | 989,021 | ||||||
Volkswagen Auto Loan Enhanced Trust, Series 2012-1, Cl A2, 0.610%, 10/20/14 | 282,930 | 283,136 | ||||||
World Omni Auto Receivables Trust, Series 2011-A, Cl A3, 1.110%, 05/15/15 | 302,606 | 303,529 | ||||||
|
| |||||||
Total Asset-Backed Securities | 3,884,724 | |||||||
|
| |||||||
Collateralized Mortgage Obligations 26.4% |
| |||||||
Agency Collateralized Mortgage Obligations 10.5% |
| |||||||
Federal Home Loan Mortgage Corporation | ||||||||
Series 3598, Cl DA, 2.750%, 11/15/14 | 186,953 | 187,920 | ||||||
Series 3792, Cl DF, REMIC, 0.603%, 11/15/40(a) | 2,107,064 | 2,119,660 | ||||||
|
| |||||||
| 2,307,580 | ||||||||
|
| |||||||
Federal National Mortgage Association | ||||||||
Series 2005-92, Cl UF, 0.554%, 10/25/25(a) | 290,813 | 291,450 | ||||||
Series 2007-109, Cl NF, 0.754%, 12/25/37(a) | 938,926 | 948,458 | ||||||
Series 2007-54, Cl KF, 0.514%, 06/25/37(a) | 553,269 | 552,791 | ||||||
Series 2009-37, Cl HA, 4.000%, 04/25/19 | 94,180 | 99,815 | ||||||
| Shares or Principal Amount($) | Value($) | |||||||
Agency Collateralized Mortgage Obligations—continued |
| |||||||
Series 2010-134, Cl BF, 0.634%, 10/25/40(a) | 1,424,034 | 1,430,177 | ||||||
Series 2011-M1, Cl FA, 0.654%, 06/25/21(a) | 2,262,569 | 2,286,969 | ||||||
Series 2012-M9, Cl ASQ2, 1.513%, 12/25/17 | 350,000 | 356,692 | ||||||
|
| |||||||
| 5,966,352 | ||||||||
|
| |||||||
Government National Mortgage Association | ||||||||
Series 2010-66, Cl A, 1.869%, 09/16/27 | 138,085 | 138,744 | ||||||
|
| |||||||
NCUA Guaranteed Notes | ||||||||
Series 2011-R1, Cl 1A, 0.653%, 01/08/20(a) | 836,754 | 839,240 | ||||||
Series 2011-R4, Cl 1A, 0.583%, 03/06/20(a) | 1,094,797 | 1,097,195 | ||||||
Series 2011-R6, Cl 1A, 0.583%, 05/07/20(a) | 1,066,951 | 1,072,286 | ||||||
|
| |||||||
| 3,008,721 | ||||||||
|
| |||||||
| 11,421,397 | ||||||||
|
| |||||||
Agency Collateralized Planned Amortization Class Mortgage Obligations 0.7% |
| |||||||
Federal Home Loan Mortgage Corporation | ||||||||
Series 3200, Cl FP, 0.403%, 08/15/36(a) | 533,131 | 531,394 | ||||||
|
| |||||||
Federal National Mortgage Association | ||||||||
Series 2005-42, Cl PF, 0.404%, 05/25/35(a) | 285,973 | 285,693 | ||||||
|
| |||||||
| 817,087 | ||||||||
|
| |||||||
Commercial Mortgage Backed Securities 14.6% |
| |||||||
Banc of America Commercial Mortgage, Inc. | ||||||||
Series 2004-1, Cl A4, 4.760%, 11/10/39 | 324,780 | 331,952 | ||||||
Series 2004-3, Cl A5, 5.563%, 06/10/39(a) | 1,287,975 | 1,340,382 | ||||||
Series 2004-6, Cl AJ, 4.870%, 12/10/42(a) | 1,535,000 | 1,622,730 | ||||||
Series 2005-2, Cl AM, 4.913%, 07/10/43(a) | 80,000 | 86,351 | ||||||
|
| |||||||
| 3,381,415 | ||||||||
|
| |||||||
Bear Stearns Commercial Mortgage Securities Trust | ||||||||
Series 2006-PW14, Cl A4, 5.201%, 12/11/38 | 550,000 | 619,162 | ||||||
|
| |||||||
See Notes to Financial Statements.
133
SCHEDULES OF PORTFOLIO INVESTMENTS
RIDGEWORTH FUNDS March 31, 2013
Ultra-Short Bond Fund — continued
| Shares or Principal Amount($) | Value($) | |||||||
Commercial Mortgage Backed Securities—continued |
| |||||||
Citigroup Commercial Mortgage Trust | ||||||||
Series 2004-C1, Cl A3, 5.251%, 04/15/40(a) | 137,468 | 137,393 | ||||||
|
| |||||||
COMM 2005-C6 Mortgage Trust | ||||||||
Series 2005-C6, Cl AJ, 5.209%, 06/10/44(a) | 405,000 | 433,312 | ||||||
|
| |||||||
Commercial Mortgage Asset Trust |
| |||||||
Series 1999-C1, Cl A4, 6.975%, 01/17/32(a) | 97,341 | 97,537 | ||||||
|
| |||||||
Series 1999-C1, Cl B, 7.230%, 01/17/32(a) | 1,460,000 | 1,468,220 | ||||||
|
| |||||||
| 1,565,757 | ||||||||
|
| |||||||
FDIC Structured Sale Guaranteed Notes | ||||||||
Series 2011-C1, Cl A, 1.840%, 04/25/31(a)(b) | 1,287,389 | 1,301,700 | ||||||
|
| |||||||
GE Capital Commercial Mortgage Corp. | ||||||||
Series 2005-C3, Cl A7A, 4.974%, 07/10/45(a) | 990,000 | 1,072,137 | ||||||
|
| |||||||
GMAC Commercial Mortgage Securities, Inc. | ||||||||
Series 2004-C3, Cl A4, 4.547%, 12/10/41 | 463,143 | 464,489 | ||||||
|
| |||||||
JPMorgan Chase Commercial Mortgage Securities Corp. | ||||||||
Series 2004-CB8, Cl A4, 4.404%, 01/12/39 | 1,508,126 | 1,547,529 | ||||||
|
| |||||||
JPMorgan Chase Commercial Mortgage Securities | ||||||||
Series 2004-C1, Cl A3, 4.719%, 01/15/38 | 835,000 | 852,047 | ||||||
Series 2004-CBX, Cl A5, 4.654%, 01/12/37 | 1,159,819 | 1,182,701 | ||||||
Series 2005-LDP1, Cl A2, 4.625%, 03/15/46 | 201,859 | 203,670 | ||||||
|
| |||||||
| 2,238,418 | ||||||||
|
| |||||||
JPMorgan Chase Commercial Mortgage Securities Corp. | ||||||||
Series 2005-LDP3, Cl A4A, 4.936%, 08/15/42(a) | 320,000 | 345,797 | ||||||
|
| |||||||
LB Commercial Mortgage Trust | ||||||||
Series 1998-C4, Cl G, 5.600%, 10/15/35(b) | 1,366,575 | 1,393,054 | ||||||
Morgan Stanley Capital I | ||||||||
Series 2004-IQ7, Cl A4, 5.419%, 06/15/38(a) | 1,382,605 | 1,434,292 | ||||||
|
| |||||||
| 15,934,455 | ||||||||
|
| |||||||
| Shares or Principal Amount($) | Value($) | |||||||
Whole Loan Collateral Mortgage Obligations 0.6% |
| |||||||
Banc of America Mortgage Securities, Inc. | ||||||||
Series 2003-F, Cl 1A1, 2.998%, 07/25/33(a) | 401,094 | 396,092 | ||||||
|
| |||||||
FDIC Structured Sale Guaranteed Notes | ||||||||
Series 2010-L2A, Cl A, 3.000%, 09/30/19(b) | 266,183 | 271,839 | ||||||
|
| |||||||
| 667,931 | ||||||||
|
| |||||||
Total Collateralized Mortgage Obligations | 28,840,870 | |||||||
|
| |||||||
Corporate Bonds 51.1% |
| |||||||
Auto Manufacturers 1.9% | ||||||||
Daimler Finance North America LLC, 1.000%, 05/24/13(b) | 350,000 | 349,825 | ||||||
Daimler Finance North America LLC, 1.250%, 01/11/16(b) | 550,000 | 551,883 | ||||||
Volkswagen International Finance, 0.889%, 11/20/14(a)(b) | 1,150,000 | 1,154,522 | ||||||
|
| |||||||
| 2,056,230 | ||||||||
|
| |||||||
Banks 14.3% |
| |||||||
American Express Centurion Bank, 0.743%, 11/13/15(a), Series FRN | 1,310,000 | 1,313,433 | ||||||
Bank of America Corp., 1.104%, 03/22/16, MTN(a) | 725,000 | 722,249 | ||||||
Bank of Montreal, 0.800%, 11/06/15, MTN | 345,000 | 344,505 | ||||||
Bank of Montreal, 0.751%, 09/11/15, MTN(a) | 1,395,000 | 1,403,091 | ||||||
Bank of New York Mellon Corp. (The), 5.125%, 08/27/13, MTN | 520,000 | 529,885 | ||||||
Bank of Nova Scotia, 0.792%, 02/10/14(a) | 405,000 | 406,727 | ||||||
BB&T Corp., 1.001%, 04/28/14(a) | 285,000 | 286,674 | ||||||
Branch Banking & Trust Co., 0.600%, 09/13/16(a) | 400,000 | 395,548 | ||||||
Capital One Financial Corp., 1.454%, 07/15/14(a), Series FRN | 690,000 | 697,498 | ||||||
Fifth Third Bank, 0.400%, 05/17/13(a) | 1,485,000 | 1,484,976 | ||||||
See Notes to Financial Statements.
134
SCHEDULES OF PORTFOLIO INVESTMENTS
RIDGEWORTH FUNDS March 31, 2013
Ultra-Short Bond Fund — continued
| Shares or Principal Amount($) | Value($) | |||||||
Banks—continued |
| |||||||
Goldman Sachs Group, Inc. (The), 1.289%, 11/21/14, MTN(a) | 1,250,000 | 1,256,125 | ||||||
Goldman Sachs Group, Inc. (The), 2.375%, 01/22/18 | 260,000 | 263,544 | ||||||
JPMorgan Chase & Co., 0.908%, 02/26/16(a) | 725,000 | 725,422 | ||||||
JPMorgan Chase & Co., 3.150%, 07/05/16 | 670,000 | 710,391 | ||||||
Morgan Stanley, 1.538%, 02/25/16(a) | 720,000 | 723,068 | ||||||
PNC Funding Corp., 5.400%, 06/10/14 | 1,365,000 | 1,441,035 | ||||||
Royal Bank of Canada, 1.002%, 10/30/14, MTN(a) | 625,000 | 630,479 | ||||||
Toronto-Dominion Bank (The), 0.605%, 07/14/14(a) | 255,000 | 255,667 | ||||||
US Bank NA, 0.585%, 10/14/14(a) | 560,000 | 561,201 | ||||||
Wells Fargo & Co., 3.676%, 06/15/16 | 1,340,000 | 1,448,959 | ||||||
|
| |||||||
| 15,600,477 | ||||||||
|
| |||||||
Beverages 2.1% |
| |||||||
Anheuser-Busch InBev Worldwide, Inc., 1.500%, 07/14/14 | 750,000 | 758,634 | ||||||
Coca-Cola Refreshments USA, Inc., 5.000%, 08/15/13 | 1,155,000 | 1,174,835 | ||||||
PepsiCo, Inc., 0.497%, 02/26/16(a) | 395,000 | 395,231 | ||||||
|
| |||||||
| 2,328,700 | ||||||||
|
| |||||||
Chemicals 1.7% |
| |||||||
Dow Chemical Co. (The), 5.900%, 02/15/15 | 405,000 | 442,665 | ||||||
Ecolab, Inc., 2.375%, 12/08/14 | 485,000 | 498,168 | ||||||
Sherwin-Williams Co. (The), 3.125%, 12/15/14 | 920,000 | 957,056 | ||||||
|
| |||||||
| 1,897,889 | ||||||||
|
| |||||||
Commercial Services 0.5% |
| |||||||
ERAC USA Finance LLC, 1.400%, 04/15/16(b) | 165,000 | 165,961 | ||||||
ERAC USA Finance LLC, 2.250%, 01/10/14(b) | 395,000 | 399,639 | ||||||
|
| |||||||
| 565,600 | ||||||||
|
| |||||||
Computers 0.6% |
| |||||||
Hewlett-Packard Co., 1.250%, 09/13/13 | 625,000 | 626,227 | ||||||
|
| |||||||
| Shares or Principal Amount($) | Value($) | |||||||
Diversified Financial Services 6.0% |
| |||||||
American Honda Finance Corp., 0.680%, 06/18/14(a)(b) | 975,000 | 978,345 | ||||||
Caterpillar Financial Services Corp., 4.625%, 06/01/15 | 675,000 | 730,976 | ||||||
Caterpillar Financial Services Corp., 6.125%, 02/17/14, MTN | 605,000 | 635,364 | ||||||
Citigroup, Inc., 5.500%, 04/11/13 | 762,000 | 762,888 | ||||||
General Electric Capital Corp., 0.505%, 01/08/16, MTN(a) | 1,250,000 | 1,241,450 | ||||||
Hyundai Capital America, 1.625%, 10/02/15(b) | 400,000 | 402,732 | ||||||
Merrill Lynch & Co., Inc., 5.300%, 09/30/15, Series B, MTN | 865,000 | 947,636 | ||||||
TD AMERITRADE Holding Corp., 4.150%, 12/01/14 | 310,000 | 327,029 | ||||||
Woodside Finance Ltd., 4.500%, 11/10/14(b) | 455,000 | 480,209 | ||||||
|
| |||||||
| 6,506,629 | ||||||||
|
| |||||||
Electric 2.6% |
| |||||||
Constellation Energy Group, Inc., 4.550%, 06/15/15 | 410,000 | 440,693 | ||||||
Duke Energy Corp., 3.950%, 09/15/14 | 480,000 | 502,137 | ||||||
NextEra Energy Capital Holdings, Inc., 1.611%, 06/01/14 | 285,000 | 287,678 | ||||||
NextEra Energy Capital Holdings, Inc., 2.550%, 11/15/13 | 500,000 | 506,047 | ||||||
Nisource Finance Corp., 5.400%, 07/15/14 | 360,000 | 380,161 | ||||||
South Carolina Electric & Gas Co., 7.125%, 06/15/13 | 690,000 | 699,106 | ||||||
|
| |||||||
| 2,815,822 | ||||||||
|
| |||||||
Food 1.7% |
| |||||||
ConAgra Foods, Inc., 1.300%, 01/25/16 | 540,000 | 544,267 | ||||||
General Mills, Inc., 5.200%, 03/17/15 | 485,000 | 526,858 | ||||||
Kraft Foods Group, Inc., 1.625%, 06/04/15 | 260,000 | 264,006 | ||||||
Mondelez International, Inc., 6.750%, 02/19/14 | 500,000 | 526,028 | ||||||
|
| |||||||
| 1,861,159 | ||||||||
|
| |||||||
Gas 0.4% |
| |||||||
Sempra Energy, 2.000%, 03/15/14 | 405,000 | 409,860 | ||||||
|
| |||||||
See Notes to Financial Statements.
135
SCHEDULES OF PORTFOLIO INVESTMENTS
RIDGEWORTH FUNDS March 31, 2013
Ultra-Short Bond Fund — continued
| Shares or Principal Amount($) | Value($) | |||||||
Healthcare-Products 0.7% |
| |||||||
St Jude Medical, Inc., 2.200%, 09/15/13 | 813,000 | 819,255 | ||||||
|
| |||||||
Healthcare-Services 1.5% |
| |||||||
UnitedHealth Group, Inc., 0.412%, 08/28/14(a) | 535,000 | 534,823 | ||||||
UnitedHealth Group, Inc., 4.875%, 04/01/13 | 560,000 | 560,000 | ||||||
WellPoint, Inc., 5.000%, 12/15/14 | 470,000 | 503,624 | ||||||
|
| |||||||
| 1,598,447 | ||||||||
|
| |||||||
Holding Companies-Diversified 0.5% |
| |||||||
EnCana Holdings Finance Corp., 5.800%, 05/01/14 | 560,000 | 589,074 | ||||||
|
| |||||||
Insurance 4.7% |
| |||||||
Allstate Corp. (The), 5.000%, 08/15/14 | 644,000 | 681,904 | ||||||
Allstate Life Global Funding Trusts, 5.375%, 04/30/13, MTN | 1,250,000 | 1,255,021 | ||||||
Assurant, Inc., 5.625%, 02/15/14 | 360,000 | 374,390 | ||||||
MetLife, Inc., 2.375%, 02/06/14 | 1,260,000 | 1,280,087 | ||||||
Metropolitan Life Global Funding I, 1.700%, 06/29/15(b) | 220,000 | 224,651 | ||||||
New York Life Global Funding, 4.650%, 05/09/13(b) | 120,000 | 120,524 | ||||||
Prudential Covered Trust 2012-1, 2.997%, 09/30/15(b) | 1,093,500 | 1,140,111 | ||||||
|
| |||||||
| 5,076,688 | ||||||||
|
| |||||||
Internet 0.4% |
| |||||||
Amazon.com, Inc., 0.650%, 11/27/15 | 480,000 | 479,421 | ||||||
|
| |||||||
Iron/Steel 0.2% |
| |||||||
Nucor Corp., 5.000%, 06/01/13 | 220,000 | 221,639 | ||||||
|
| |||||||
Media 2.8% |
| |||||||
Comcast Corp., 5.300%, 01/15/14 | 125,000 | 129,789 | ||||||
Comcast Corp., 5.900%, 03/15/16 | 440,000 | 503,430 | ||||||
DIRECTV Holdings LLC / DIRECTV Financing Co., Inc., 4.750%, 10/01/14 | 475,000 | 502,481 | ||||||
NBCUniversal Enterprise, Inc., 0.817%, 04/15/16(a)(b) | 400,000 | 399,724 | ||||||
Time Warner Cable, Inc., 6.200%, 07/01/13 | 305,000 | 309,065 | ||||||
| Shares or Principal Amount($) | Value($) | |||||||
Media—continued |
| |||||||
Time Warner Cable, Inc., 7.500%, 04/01/14 | 115,000 | 122,645 | ||||||
Time Warner Cable, Inc., 8.250%, 02/14/14 | 400,000 | 425,504 | ||||||
Viacom, Inc., 1.250%, 02/27/15 | 645,000 | 649,534 | ||||||
|
| |||||||
| 3,042,172 | ||||||||
|
| |||||||
Mining 1.8% |
| |||||||
BHP Billiton Finance USA Ltd., 1.000%, 02/24/15 | 225,000 | 227,175 | ||||||
Freeport-McMoRan Copper & Gold, Inc., 2.375%, 03/15/18(b) | 510,000 | 512,131 | ||||||
Rio Tinto Alcan, Inc., 5.200%, 01/15/14 | 1,230,000 | 1,271,708 | ||||||
|
| |||||||
| 2,011,014 | ||||||||
|
| |||||||
Oil & Gas 0.5% |
| |||||||
Devon Energy Corp., 5.625%, 01/15/14 | 500,000 | 519,536 | ||||||
|
| |||||||
Pharmaceuticals 1.0% |
| |||||||
McKesson Corp., 0.950%, 12/04/15 | 185,000 | 185,506 | ||||||
McKesson Corp., 6.500%, 02/15/14 | 865,000 | 909,618 | ||||||
|
| |||||||
| 1,095,124 | ||||||||
|
| |||||||
Pipelines 1.4% |
| |||||||
Enterprise Products Operating LLC, Series M, 5.650%, 04/01/13 | 750,000 | 750,000 | ||||||
Kinder Morgan Energy Partners LP, 5.125%, 11/15/14 | 365,000 | 390,634 | ||||||
Spectra Energy Capital LLC, 5.500%, 03/01/14 | 400,000 | 416,643 | ||||||
|
| |||||||
| 1,557,277 | ||||||||
|
| |||||||
Retail 0.6% |
| |||||||
Nordstrom, Inc., 6.750%, 06/01/14 | 615,000 | 658,049 | ||||||
|
| |||||||
Telecommunication Services 2.4% |
| |||||||
BellSouth Corp., 5.200%, 09/15/14 | 985,000 | 1,049,186 | ||||||
Cellco Partnership/Verizon Wireless Capital LLC, 5.550%, 02/01/14 | 1,480,000 | 1,538,244 | ||||||
|
| |||||||
| 2,587,430 | ||||||||
|
| |||||||
Transportation 0.8% |
| |||||||
Burlington Northern Santa Fe LLC, 4.300%, 07/01/13 | 435,000 | 439,108 | ||||||
See Notes to Financial Statements.
136
SCHEDULES OF PORTFOLIO INVESTMENTS
RIDGEWORTH FUNDS March 31, 2013
Ultra-Short Bond Fund — concluded
| Shares or Principal Amount($) | Value($) | |||||||
Transportation—continued |
| |||||||
Burlington Northern Santa Fe LLC, 7.000%, 02/01/14 | 390,000 | 410,421 | ||||||
|
| |||||||
| 849,529 | ||||||||
|
| |||||||
Total Corporate Bonds | 55,773,248 | |||||||
|
| |||||||
Municipal Bond 1.8% |
| |||||||
New Jersey 1.8% |
| |||||||
New Jersey Economic Development Authority, RB, BAB, 1.280%, 06/15/13(a) | 1,923,000 | 1,923,731 | ||||||
|
| |||||||
Total Municipal Bond | 1,923,731 | |||||||
|
| |||||||
U.S. Government Agency Mortgages 15.5% |
| |||||||
Federal Home Loan Mortgage Corporation | ||||||||
Pool #1Q1404, 2.703%, 01/01/37(a) | 999,475 | 1,065,889 | ||||||
Pool #848852, 2.869%, 08/01/37(a) | 1,639,461 | 1,749,695 | ||||||
|
| |||||||
| 2,815,584 | ||||||||
|
| |||||||
Federal National Mortgage Association | ||||||||
Pool #873590, 5.470%, 04/01/13 | 144,622 | 144,789 | ||||||
Pool #360500, 6.255%, 09/01/13 | 2,900,000 | 2,954,912 | ||||||
Pool #555910, 4.924%, 10/01/13 | 1,236,936 | 1,236,779 | ||||||
Pool #387206, 5.500%, 01/01/15 | 1,266,061 | 1,339,689 | ||||||
Pool #AD0172, 4.757%, 04/01/16 | 220,889 | 241,228 | ||||||
Pool #745935, 5.682%, 08/01/16 | 1,561,941 | 1,779,719 | ||||||
Pool #745889, 5.970%, 08/01/16 | 287,200 | 323,741 | ||||||
Pool #469408, 0.950%, 11/01/18(a) | 2,785,000 | 2,783,302 | ||||||
Pool #635082, 2.249%, 05/01/32(a) | 119,296 | 126,776 | ||||||
| Shares or Principal Amount($) | Value($) | |||||||
U.S. Government Agency Mortgages—continued |
| |||||||
Pool #995542, 2.632%, 02/01/36(a) | 559,936 | 596,490 | ||||||
Pool #AL0968, 2.741%, 12/01/36(a) | 482,923 | 516,851 | ||||||
Pool #AD0380, 2.683%, 10/01/37(a) | 670,021 | 713,182 | ||||||
Pool #AL0966, 2.633%, 11/01/37(a) | 508,022 | 540,481 | ||||||
Pool #AL0967, 2.696%, 04/01/38(a) | 748,389 | 799,937 | ||||||
|
| |||||||
| 14,097,876 | ||||||||
|
| |||||||
Total U.S. Government Agency Mortgages | 16,913,460 | |||||||
|
| |||||||
Money Market Fund 3.2% |
| |||||||
State Street Institutional U.S. Government Money Market Fund, Institutional Class, 0.01%(c) | 3,501,421 | 3,501,421 | ||||||
|
| |||||||
Total Money Market Fund | 3,501,421 | |||||||
|
| |||||||
Total Investments |
| 110,837,454 | ||||||
Liabilities in excess of other assets — (1.5)% | (1,613,160 | ) | ||||||
|
| |||||||
Net Assets — 100.0% | $ | 109,224,294 | ||||||
|
| |||||||
| (a) | Variable or floating rate security. Rate disclosed is as of March 31, 2013. |
| (b) | Rule 144A, Section 4(2) or other security which is restricted as to resale to institutional investors. The Fund’s investment adviser/subadviser has deemed this security to be liquid based upon procedures approved by the Board of Trustees. These securities represent 9.1% of net assets as of March 31, 2013. |
| (c) | Rate disclosed, the 7 day net yield, is as of March 31, 2013. |
Investment Abbreviations
| BAB | — | Build America Bonds | ||
| MTN | — | Medium Term Note | ||
| RB | — | Revenue Bond | ||
| REMIC | — | Real Estate Mortgage Investment Conduit |
See Notes to Financial Statements.
137
SCHEDULES OF PORTFOLIO INVESTMENTS
RIDGEWORTH FUNDS March 31, 2013
U.S. Government Securities Fund
| Shares or Principal Amount($) | Value($) | |||||||
| U.S. Treasury Obligations 98.7% | ||||||||
U.S. Treasury Bonds 15.5% |
| |||||||
7.125%, 02/15/23 | 1,281,000 | 1,905,887 | ||||||
6.000%, 02/15/26 | 296,000 | 421,338 | ||||||
4.500%, 02/15/36 | 1,565,000 | 1,987,794 | ||||||
2.750%, 11/15/42 | 1,972,000 | 1,827,797 | ||||||
|
| |||||||
| 6,142,816 | ||||||||
|
| |||||||
U.S. Treasury Notes 83.2% |
| |||||||
0.500%, 05/31/13 | 900,000 | 900,668 | ||||||
0.375%, 03/15/15 | 7,550,000 | 7,567,992 | ||||||
0.375%, 11/15/15 | 6,340,000 | 6,349,903 | ||||||
1.500%, 06/30/16 | 7,230,000 | 7,483,614 | ||||||
1.000%, 03/31/17 | 5,131,000 | 5,220,392 | ||||||
2.625%, 08/15/20 | 4,835,000 | 5,281,106 | ||||||
|
| |||||||
| 32,803,675 | ||||||||
|
| |||||||
Total U.S. Treasury Obligations | 38,946,491 | |||||||
|
| |||||||
| Shares or Principal Amount($) | Value($) | |||||||
Money Market Fund 1.7% |
| |||||||
State Street Institutional Treasury Money Market Fund, Institutional Class, 0.00%(a) | 647,958 | 647,958 | ||||||
|
| |||||||
Total Money Market Fund | 647,958 | |||||||
|
| |||||||
Total Investments | 39,594,449 | |||||||
Liabilities in excess of other assets — (0.4)% | (140,440 | ) | ||||||
|
| |||||||
Net Assets — 100.0% | $ | 39,454,009 | ||||||
|
| |||||||
| (a) | Rate disclosed, the 7 day net yield, is as of March 31, 2013. |
See Notes to Financial Statements.
138
SCHEDULES OF PORTFOLIO INVESTMENTS
RIDGEWORTH FUNDS March 31, 2013
U.S. Government Securities Ultra-Short Bond Fund
| Shares or Principal Amount($) | Value($) | |||||||
Asset-Backed Security 0.1% | ||||||||
Student Loan Asset Backed Securities 0.1% |
| |||||||
SMS Student Loan Trust, Series 1999-B, Cl A2, 0.541%, 04/30/29(a) | 2,184,874 | 2,180,961 | ||||||
|
| |||||||
Total Asset-Backed Security (Cost $2,179,527) | 2,180,961 | |||||||
|
| |||||||
Collateralized Mortgage Obligations 28.4% |
| |||||||
Agency Collateralized Mortgage Obligations 19.4% |
| |||||||
Federal Home Loan Bank | ||||||||
Series Y2-2015, Cl 1, 2.600%, 04/20/15 | 3,318,629 | 3,408,936 | ||||||
|
| |||||||
Federal Home Loan Mortgage Corporation | ||||||||
Series 2840, Cl LJ, 4.250%, 11/15/17 | 112,242 | 112,549 | ||||||
Series 3000, Cl FG, 0.503%, 07/15/25(a) | 3,772,556 | 3,778,332 | ||||||
Series 3065, Cl DF, REMIC, 0.583%, 04/15/35(a) | 43,083,600 | 43,274,547 | ||||||
Series 3135, Cl FC, 0.503%, 04/15/26(a) | 3,143,856 | 3,151,071 | ||||||
Series 3232, Cl KF, 0.653%, 10/15/36(a)(b) | 5,053,161 | 5,087,083 | ||||||
Series 3264, Cl FB, 0.573%, 01/15/37(a) | 2,925,169 | 2,936,018 | ||||||
Series 3320, Cl FC, 0.373%, 05/15/37(a)(b) | 7,650,940 | 7,641,537 | ||||||
Series 3450, Cl AF, 0.913%, 05/15/38(a)(b) | 2,980,594 | 3,004,338 | ||||||
Series 3511, Cl FA, 1.203%, 02/15/39(a)(b) | 12,274,559 | 12,421,657 | ||||||
Series 3574, Cl MA, 4.000%, 09/15/21 | 3,894,617 | 4,033,012 | ||||||
Series 3593, Cl F, 0.702%, 03/15/36(a) | 7,256,806 | 7,336,072 | ||||||
Series 3792, Cl DF, REMIC, 0.603%, 11/15/40(a) | 5,414,928 | 5,447,298 | ||||||
Series 3812, Cl BE, 2.750%, 09/15/18 | 8,170,907 | 8,444,420 | ||||||
|
| |||||||
| 106,667,934 | ||||||||
|
| |||||||
Federal National Mortgage Association | ||||||||
Series 2005-40, Cl FB, 0.454%, 05/25/35(a) | 2,776,566 | 2,778,090 | ||||||
Series 2005-92, Cl UF, 0.554%, 10/25/25(a) | 3,461,609 | 3,469,186 | ||||||
Series 2006-84, Cl FQ, 0.754%, 09/25/36(a)(b) | 5,883,792 | 5,936,134 | ||||||
Series 2007-102, Cl FA, 0.774%, 11/25/37(a)(b) | 7,147,365 | 7,204,379 | ||||||
Series 2007-109, Cl NF, 0.754%, 12/25/37(a)(b) | 12,873,220 | 13,003,909 | ||||||
| Shares or Principal Amount($) | Value($) | |||||||
Agency Collateralized Mortgage Obligations—continued |
| |||||||
Series 2007-2, Cl FM, 0.454%, 02/25/37(a) | 2,763,806 | 2,761,371 | ||||||
Series 2007-30, Cl WF, 0.444%, 04/25/37(a) | 16,062,605 | 16,071,151 | ||||||
Series 2007-4, Cl DF, 0.649%, 02/25/37(a)(b) | 2,179,225 | 2,184,283 | ||||||
Series 2007-54, Cl KF, 0.514%, 06/25/37(a) | 7,142,203 | 7,136,032 | ||||||
Series 2007-88, CI JF, 0.754%, 04/25/37(a)(b) | 9,545,992 | 9,666,634 | ||||||
Series 2008-18, Cl FE, 0.934%, 03/25/38(a)(b) | 4,475,112 | 4,505,301 | ||||||
Series 2009-37, Cl HA, 4.000%, 04/25/19 | 315,242 | 334,104 | ||||||
Series 2010-134, Cl BF, 0.634%, 10/25/40(a) | 15,299,318 | 15,365,319 | ||||||
Series 2010-42, Cl AF, 0.804%, 05/25/40(a) | 10,036,090 | 10,117,412 | ||||||
Series 2011-38, Cl AH, 2.750%, 05/25/20 | 6,146,993 | 6,352,868 | ||||||
Series 2011-M1, Cl FA, 0.654%, 06/25/21(a)(b) | 48,477,297 | 49,000,076 | ||||||
Series 2012-142, Cl AC, REMIC, 2.000%, 12/25/42 | 10,000,000 | 10,302,890 | ||||||
Series 2012-M11, Cl FA, 0.658%, 08/25/19(a) | 21,463,665 | 21,581,673 | ||||||
Series 2012-M9, Cl ASQ2, 1.513%, 12/25/17 | 6,770,081 | 6,899,518 | ||||||
|
| |||||||
| 194,670,330 | ||||||||
|
| |||||||
Government National Mortgage Association | ||||||||
Series 2010-66, Cl A, 1.869%, 09/16/27 | 4,585,082 | 4,606,975 | ||||||
Series 2010-97, Cl A, 2.321%, 01/16/32 | 1,749,325 | 1,771,414 | ||||||
|
| |||||||
| 6,378,389 | ||||||||
|
| |||||||
Mortgage-Linked Amortizing Notes | ||||||||
Series 2012-1, Cl A10, 2.060%, 01/15/22 | 17,089,797 | 17,462,987 | ||||||
|
| |||||||
NCUA Guaranteed Notes |
| |||||||
Series 2010-R1, Cl 1A, 0.653%, 10/07/20(a) | 13,562,807 | 13,605,259 | ||||||
Series 2010-R1, Cl 2A, 1.840%, 10/07/20 | 5,541,853 | 5,606,138 | ||||||
Series 2010-R2, Cl 1A, 0.573%, 11/06/17(a) | 12,575,717 | 12,626,774 | ||||||
Series 2011-C1, Cl 2A, 0.733%, 03/09/21(a)(b) | 27,783,715 | 27,857,926 | ||||||
Series 2011-R1, Cl 1A, 0.653%, 01/08/20(a) | 13,060,144 | 13,098,932 | ||||||
See Notes to Financial Statements.
139
SCHEDULES OF PORTFOLIO INVESTMENTS
RIDGEWORTH FUNDS March 31, 2013
U.S. Government Securities Ultra-Short Bond Fund — continued
| Shares or Principal Amount($) | Value($) | |||||||
Agency Collateralized Mortgage Obligations—continued |
| |||||||
Series 2011-R2, Cl 1A, 0.603%, 02/06/20(a) | 1,363,907 | 1,369,022 | ||||||
Series 2011-R4, Cl 1A, 0.583%, 03/06/20(a) | 32,947,924 | 33,020,080 | ||||||
Series 2011-R6, Cl 1A, 0.583%, 05/07/20(a) | 16,081,559 | 16,161,966 | ||||||
|
| |||||||
| 123,346,097 | ||||||||
|
| |||||||
| 451,934,673 | ||||||||
|
| |||||||
Agency Collateralized Planned Amortization Class Mortgage Obligations 3.5% |
| |||||||
Federal Home Loan Mortgage Corporation | ||||||||
Series 3200, Cl FP, 0.403%, 08/15/36(a)(b) | 7,895,848 | 7,870,116 | ||||||
Series 3925, Cl FD, REMIC, 0.653%, 07/15/40(a) | 4,128,004 | 4,155,570 | ||||||
Series 4080, Cl NF, REMIC, 0.453%, 05/15/32(a) | 15,829,113 | 15,875,065 | ||||||
|
| |||||||
| 27,900,751 | ||||||||
|
| |||||||
Federal National Mortgage Association | ||||||||
Series 2003-73, Cl DF, 0.654%, 10/25/32(a) | 4,097,390 | 4,115,967 | ||||||
Series 2005-42, Cl PF, 0.404%, 05/25/35(a) | 4,065,862 | 4,061,885 | ||||||
Series 2005-57, Cl EG, 0.504%, 03/25/35(a) | 3,624,676 | 3,627,906 | ||||||
Series 2006-123, Cl PF, 0.464%, 01/25/37(a)(b) | 10,306,814 | 10,308,947 | ||||||
Series 2006-79, Cl GF, 0.604%, 08/25/36(a)(b) | 22,805,560 | 22,970,626 | ||||||
Series 2008-24, Cl PF, REMIC, 0.854%, 02/25/38(a) | 4,544,932 | 4,597,872 | ||||||
|
| |||||||
| 49,683,203 | ||||||||
|
| |||||||
Government National Mortgage Association | ||||||||
Series 2009-69, Cl PV, REMIC, 4.000%, 08/20/39 | 2,688,723 | 2,851,536 | ||||||
|
| |||||||
| 80,435,490 | ||||||||
|
| |||||||
Commercial Mortgage Backed Securities 5.4% |
| |||||||
FDIC Structured Sale Guaranteed Notes | ||||||||
Series 2011-C1, Cl A, 1.840%, 04/25/31(a)(b)(c) | 27,246,074 | 27,548,941 | ||||||
|
| |||||||
Federal Home Loan Mortgage Corporation | ||||||||
Series K705, Cl A1, 1.626%, 07/25/18 | 3,164,809 | 3,240,375 | ||||||
| Shares or Principal Amount($) | Value($) | |||||||
Commercial Mortgage Backed Securities—continued |
| |||||||
Series K706, Cl A1, 1.691%, 06/25/18 | 2,389,694 | 2,452,075 | ||||||
Series KF01, Cl A, 0.554%, 04/25/19(a) | 18,589,719 | 18,625,950 | ||||||
|
| |||||||
| 24,318,400 | ||||||||
|
| |||||||
Federal National Mortgage Association | ||||||||
Series 2010-M4, Cl A1, 2.520%, 06/25/20 | 3,880,340 | 4,057,773 | ||||||
Series 2012-M13, Cl ASQ1, 1.012%, 08/25/17 | 4,259,909 | 4,290,461 | ||||||
Series 2012-M17, Cl ASQ2, 0.953%, 11/25/15 | 26,000,000 | 26,228,904 | ||||||
Series 2013-M1, Cl ASQ2, 1.074%, 11/25/16 | 20,000,000 | 20,194,800 | ||||||
Series 2013-M2, Cl AFL, 0.554%, 01/25/23(a) | 19,645,824 | 19,645,824 | ||||||
|
| |||||||
| 74,417,762 | ||||||||
|
| |||||||
| 126,285,103 | ||||||||
|
| |||||||
Whole Loan Collateral Mortgage Obligations 0.1% |
| |||||||
FDIC Structured Sale Guaranteed Notes | ||||||||
Series 2010-L2A, Cl A, 3.000%, 09/30/19(c) | 2,322,095 | 2,371,439 | ||||||
|
| |||||||
Total Collateralized Mortgage Obligations | 661,026,705 | |||||||
|
| |||||||
U.S. Government Agency Mortgages 68.4% |
| |||||||
Federal Home Loan Mortgage Corporation | ||||||||
Pool #G14516, 3.500%, 05/01/27(b) | 15,276,668 | 16,119,128 | ||||||
Pool #972122, 2.100%, 06/01/33(a) | 42,239 | 43,365 | ||||||
Pool #847615, 2.557%, 07/01/33(a)(b) | 7,029,974 | 7,525,109 | ||||||
Pool #781028, 2.349%, 11/01/33(a) | 4,225,648 | 4,500,735 | ||||||
Pool #1B8683, 2.901%, 04/01/34(a)(b) | 22,326,183 | 23,849,354 | ||||||
Pool #848744, 2.811%, 05/01/34(a) | 29,784,319 | 31,778,574 | ||||||
Pool #847308, 2.435%, 07/01/34(a) | 290,074 | 307,299 | ||||||
Pool #1B1889, 2.870%, 07/01/34(a)(b) | 29,263,011 | 31,215,464 | ||||||
Pool #848736, 2.772%, 05/01/35(a)(b) | 48,438,277 | 51,558,446 | ||||||
See Notes to Financial Statements.
140
SCHEDULES OF PORTFOLIO INVESTMENTS
RIDGEWORTH FUNDS March 31, 2013
U.S. Government Securities Ultra-Short Bond Fund — continued
| Shares or Principal Amount($) | Value($) | |||||||
U.S. Government Agency Mortgages—continued |
| |||||||
Pool #848797, 2.769%, 07/01/35(a) | 6,445,218 | 6,876,254 | ||||||
Pool #1L0256, 2.381%, 11/01/35(a)(b) | 6,126,464 | 6,532,197 | ||||||
Pool #1Q0025, 2.718%, 02/01/36(a) | 5,794,204 | 6,164,823 | ||||||
Pool #1H2602, 2.350%, 03/01/36(a) | 6,018,091 | 6,392,995 | ||||||
Pool #1N0169, 2.124%, 07/01/36(a) | 779,339 | 828,671 | ||||||
Pool #1Q1407, 2.399%, 07/01/36(a)(b) | 17,694,611 | 18,870,924 | ||||||
Pool #848747, 2.919%, 07/01/36(a) | 28,772,284 | 30,876,405 | ||||||
Pool #848795, 2.827%, 10/01/36(a) | 2,989,473 | 3,203,005 | ||||||
Pool #848569, 2.553%, 11/01/36(a)(b) | 24,122,916 | 25,585,272 | ||||||
Pool #848133, 3.597%, 11/01/36(a) | 2,225,216 | 2,375,709 | ||||||
Pool #1G2585, 3.199%, 12/01/36(a) | 176,247 | 188,596 | ||||||
Pool #1Q1404, 2.703%, 01/01/37(a) | 19,128,342 | 20,399,397 | ||||||
Pool #1J0331, 2.882%, 03/01/37(a) | 910,481 | 980,779 | ||||||
Pool #1Q1195, 2.629%, 05/01/37(a)(b) | 24,933,994 | 26,621,734 | ||||||
Pool #848796, 2.794%, 05/01/37(a)(b) | 47,846,052 | 51,089,376 | ||||||
Pool #1Q1282, 2.275%, 07/01/37(a) | 5,638,460 | 6,017,734 | ||||||
Pool #1N1664, 2.593%, 07/01/37(a) | 5,990,583 | 6,405,078 | ||||||
Pool #1J0533, 2.901%, 07/01/37(a) | 34,187 | 36,650 | ||||||
Pool #848852, 2.869%, 08/01/37(a) | 35,027,488 | 37,382,666 | ||||||
Pool #1Q0652, 2.378%, 02/01/38(a) | 2,966,511 | 3,152,214 | ||||||
Pool #1Q1405, 3.829%, 04/01/39(a) | 6,999,036 | 7,502,880 | ||||||
Pool #1Q1420, 3.394%, 09/01/39(a) | 27,058,996 | 28,918,469 | ||||||
Pool #1B4755, 3.512%, 06/01/40(a)(b) | 8,229,344 | 8,717,094 | ||||||
|
| |||||||
| 472,016,396 | ||||||||
|
| |||||||
Federal National Mortgage Association | ||||||||
Pool #555317, 4.804%, 04/01/13 | 310,977 | 311,324 | ||||||
| Shares or Principal Amount($) | Value($) | |||||||
U.S. Government Agency Mortgages—continued |
| |||||||
Pool #873590, 5.470%, 04/01/13 | 356,735 | 357,145 | ||||||
Pool #555505, 4.636%, 05/01/13 | 176,554 | 175,660 | ||||||
Pool #386287, 4.115%, 06/01/13 | 8,266,102 | 8,265,208 | ||||||
Pool #555648, 4.700%, 06/01/13 | 49,979 | 50,193 | ||||||
Pool #873612, 5.770%, 06/01/13 | 1,307,070 | 1,308,572 | ||||||
Pool #386424, 4.190%, 07/01/13 | 123,256 | 123,242 | ||||||
Pool #461110, 4.616%, 07/01/13 | 556,837 | 553,526 | ||||||
Pool #386441, 4.220%, 08/01/13 | 21,579 | 21,577 | ||||||
Pool #735065, 4.491%, 08/01/13 | 190,699 | 190,091 | ||||||
Pool #360500, 6.255%, 09/01/13 | 36,285,000 | 36,972,066 | ||||||
Pool #555910, 4.924%, 10/01/13(b) | 5,289,752 | 5,289,083 | ||||||
Pool #555806, 5.138%, 10/01/13 | 2,378,318 | 2,364,131 | ||||||
Pool #555850, 4.813%, 11/01/13 | 522,634 | 524,369 | ||||||
Pool #725324, 5.416%, 11/01/13 | 895,696 | 895,545 | ||||||
Pool #AD0192, 4.715%, 01/01/14 | 2,874,631 | 2,874,364 | ||||||
Pool #386742, 4.870%, 01/01/14 | 4,690,326 | 4,769,409 | ||||||
Pool #386802, 4.900%, 01/01/14 | 4,630,689 | 4,677,061 | ||||||
Pool #958216, 5.370%, 01/01/14 | 2,918,765 | 2,951,968 | ||||||
Pool #958368, 4.710%, 03/01/14 | 13,160,516 | 13,384,301 | ||||||
Pool #386925, 4.360%, 04/01/14 | 422,040 | 430,905 | ||||||
Pool #958806, 3.850%, 05/01/14 | 943,816 | 964,790 | ||||||
Pool #958789, 3.920%, 06/01/14 | 8,228,295 | 8,435,776 | ||||||
Pool #462846, 4.150%, 07/01/14 | 1,797,314 | 1,850,451 | ||||||
Pool #AD0173, 3.925%, 08/01/14 | 1,647,462 | 1,680,920 | ||||||
Pool #735028, 5.754%, 09/01/14 | 5,192,828 | 5,423,173 | ||||||
See Notes to Financial Statements.
141
SCHEDULES OF PORTFOLIO INVESTMENTS
RIDGEWORTH FUNDS March 31, 2013
U.S. Government Securities Ultra-Short Bond Fund — continued
| Shares or Principal Amount($) | Value($) | |||||||
U.S. Government Agency Mortgages—continued |
| |||||||
Pool #735387, 4.907%, 04/01/15 | 140,881 | 151,023 | ||||||
Pool #387352, 5.160%, 04/01/15 | 227,671 | 242,406 | ||||||
Pool #735953, 4.997%, 08/01/15 | 23,408 | 25,449 | ||||||
Pool #462011, 5.155%, 08/01/15 | 116,205 | 124,323 | ||||||
Pool #465949, 2.040%, 09/01/15 | 9,706,601 | 9,765,545 | ||||||
Pool #465821, 2.900%, 09/01/15 | 1,055,402 | 1,101,873 | ||||||
Pool #387590, 4.900%, 09/01/15 | 1,982,568 | 2,124,986 | ||||||
Pool #462018, 5.365%, 09/01/15 | 444,131 | 476,420 | ||||||
Pool #466111, 2.030%, 10/01/15 | 11,310,000 | 11,411,848 | ||||||
Pool #465952, 2.040%, 10/01/15 | 8,461,101 | 8,537,477 | ||||||
Pool #465951, 2.040%, 10/01/15 | 6,692,655 | 6,753,067 | ||||||
Pool #466109, 2.190%, 10/01/15 | 12,895,215 | 13,306,992 | ||||||
Pool #466534, 2.040%, 11/01/15 | 1,240,000 | 1,282,262 | ||||||
Pool #745100, 4.849%, 11/01/15 | 7,138,143 | 7,695,157 | ||||||
Pool #462085, 5.315%, 11/01/15 | 4,725,180 | 5,210,424 | ||||||
Pool #387740, 5.245%, 12/01/15 | 1,163,492 | 1,260,603 | ||||||
Pool #467123, 2.760%, 01/01/16 | 12,500,000 | 13,084,827 | ||||||
Pool #467141, 2.780%, 01/01/16 | 6,902,253 | 7,233,538 | ||||||
Pool #467080, 3.090%, 01/01/16 | 15,070,000 | 15,894,378 | ||||||
Pool #745504, 5.135%, 02/01/16(b) | 11,454,476 | 12,671,367 | ||||||
Pool #745530, 5.273%, 04/01/16 | 128,473 | 142,291 | ||||||
Pool #467607, 3.090%, 05/01/16 | 4,996,360 | 5,294,207 | ||||||
Pool #745727, 5.261%, 05/01/16 | 4,774,763 | 5,170,396 | ||||||
Pool #380240, 6.590%, 05/01/16 | 864,694 | 867,231 | ||||||
Pool #468647, 2.260%, 07/01/16(b) | 17,930,000 | 18,679,545 | ||||||
| Shares or Principal Amount($) | Value($) | |||||||
U.S. Government Agency Mortgages—continued |
| |||||||
Pool #462237, 5.525%, 07/01/16 | 158,730 | 174,576 | ||||||
Pool #745764, 5.724%, 07/01/16 | 459,040 | 516,384 | ||||||
Pool #468795, 2.470%, 08/01/16 | 15,200,000 | 15,948,693 | ||||||
Pool #463420, 4.050%, 09/01/16 | 6,396,318 | 6,670,257 | ||||||
Pool #888015, 5.540%, 11/01/16 | 528,739 | 585,347 | ||||||
Pool #469673, 2.080%, 12/01/16 | 5,135,000 | 5,342,316 | ||||||
Pool #470340, 2.090%, 01/01/17 | 4,569,536 | 4,757,299 | ||||||
Pool #735745, 4.992%, 01/01/17 | 79,332 | 83,847 | ||||||
Pool #874903, 5.520%, 05/01/17 | 977,896 | 1,079,084 | ||||||
Pool #888969, 5.933%, 11/01/17 | 3,092,976 | 3,510,020 | ||||||
Pool #467288, 2.800%, 03/01/18 | 1,081,486 | 1,159,052 | ||||||
Pool #469334, 0.630%, 10/01/18(a) | 12,790,000 | 12,782,537 | ||||||
Pool #469482, 1.030%, 10/01/18(a) | 13,420,000 | 13,411,915 | ||||||
Pool #469408, 0.950%, 11/01/18(a)(b) | 38,075,000 | 38,051,783 | ||||||
Pool #AM1828, 0.500%, 12/01/19(a) | 17,500,000 | 17,653,433 | ||||||
Pool #466804, 0.780%, 12/01/20(a) | 13,370,000 | 13,368,806 | ||||||
Pool #470556, 0.900%, 12/01/20(a) | 21,070,000 | 21,182,015 | ||||||
Pool #469386, 0.820%, 10/01/21(a)(b) | 30,015,000 | 30,052,297 | ||||||
Pool #469856, 0.990%, 12/01/21(a)(b) | 17,690,000 | 17,707,816 | ||||||
Pool #AM0400, 0.680%, 08/01/22(a) | 17,500,000 | 17,512,934 | ||||||
Pool #AM1102, 0.495%, 10/01/22(a) | 26,750,000 | 26,775,812 | ||||||
Pool #AM1444, 0.465%, 11/01/22(a) | 13,185,116 | 13,197,771 | ||||||
Pool #MA1241, 2.500%, 11/01/22 | 14,009,919 | 14,672,671 | ||||||
Pool #AM1796, 0.500%, 12/01/22(a) | 19,834,551 | 19,855,176 | ||||||
Pool #AM2224, 0.530%, 01/01/23(a) | 15,074,034 | 15,088,981 | ||||||
See Notes to Financial Statements.
142
SCHEDULES OF PORTFOLIO INVESTMENTS
RIDGEWORTH FUNDS March 31, 2013
U.S. Government Securities Ultra-Short Bond Fund — continued
| Shares or Principal Amount($) | Value($) | |||||||
U.S. Government Agency Mortgages—continued |
| |||||||
Pool #AM2292, 0.550%, 01/01/23(a) | 37,669,309 | 37,969,177 | ||||||
Pool #AP6765, 2.500%, 09/01/27 | 5,122,213 | 5,319,704 | ||||||
Pool #AP6769, 2.500%, 09/01/27 | 2,439,969 | 2,534,045 | ||||||
Pool #AP6771, 2.500%, 10/01/27 | 2,966,639 | 3,081,021 | ||||||
Pool #MA0949, 3.500%, 01/01/32 | 12,783,653 | 13,651,343 | ||||||
Pool #635082, 2.249%, 05/01/32(a) | 135,728 | 144,238 | ||||||
Pool #604921, 2.199%, 10/01/32(a) | 106,251 | 112,943 | ||||||
Pool #671993, 2.482%, 12/01/32(a) | 14,541 | 14,794 | ||||||
Pool #AE0044, 1.920%, 03/01/33(a) | 2,652,851 | 2,863,879 | ||||||
Pool #689966, 2.260%, 04/01/33(a) | 906,372 | 966,534 | ||||||
Pool #555468, 2.522%, 05/01/33(a) | 254,315 | 270,388 | ||||||
Pool #711466, 2.880%, 05/01/33(a) | 31,873 | 31,954 | ||||||
Pool #733703, 2.729%, 08/01/33(a) | 3,555,902 | 3,788,836 | ||||||
Pool #555756, 4.648%, 08/01/33(a) | 2,634,723 | 2,812,267 | ||||||
Pool #386320, 4.550%, 10/01/33 | 180,920 | 184,060 | ||||||
Pool #725126, 2.877%, 12/01/33(a) | 2,367,749 | 2,506,113 | ||||||
Pool #793025, 2.064%, 07/01/34(a) | 629,412 | 673,262 | ||||||
Pool #AL0222, 2.332%, 07/01/34(a) | 18,521,836 | 19,677,668 | ||||||
Pool #801510, 2.033%, 08/01/34(a) | 1,796,150 | 1,889,516 | ||||||
Pool #794939, 1.760%, 10/01/34(a) | 28,351 | 29,286 | ||||||
Pool #745707, 2.750%, 12/01/34(a) | 13,393,294 | 14,270,046 | ||||||
Pool #AD0064, 2.091%, 01/01/35(a) | 16,161,328 | 17,122,102 | ||||||
Pool #805338, 2.280%, 01/01/35(a) | 163,828 | 173,150 | ||||||
Pool #813718, 2.319%, 01/01/35(a) | 12,548,572 | 13,411,340 | ||||||
Pool #809384, 2.340%, 01/01/35(a) | 407,929 | 436,261 | ||||||
| Shares or Principal Amount($) | Value($) | |||||||
U.S. Government Agency Mortgages—continued |
| |||||||
Pool #809772, 2.334%, 02/01/35(a)(b) | 295,825 | 310,839 | ||||||
Pool #820598, 1.951%, 03/01/35(a) | 792,529 | 832,755 | ||||||
Pool #814686, 2.101%, 03/01/35(a) | 205,400 | 210,406 | ||||||
Pool #735545, 2.479%, 03/01/35(a) | 4,465,293 | 4,762,255 | ||||||
Pool #995609, 2.898%, 04/01/35(a) | 3,436,390 | 3,673,220 | ||||||
Pool #822302, 2.724%, 05/01/35(a) | 5,534,492 | 5,917,331 | ||||||
Pool #821373, 2.607%, 06/01/35(a) | 993,910 | 1,047,197 | ||||||
Pool #735766, 2.234%, 07/01/35(a) | 1,170,844 | 1,262,081 | ||||||
Pool #735810, 3.216%, 08/01/35(a) | 1,622,501 | 1,725,521 | ||||||
Pool #817467, 2.038%, 09/01/35(a) | 4,072,750 | 4,363,362 | ||||||
Pool #829334, 2.668%, 09/01/35(a) | 96,690 | 103,372 | ||||||
Pool #AL0505, 2.671%, 11/01/35(a) | 15,908,555 | 16,958,834 | ||||||
Pool #AD0377, 2.092%, 01/01/36(a) | 3,241,156 | 3,431,057 | ||||||
Pool #995540, 2.314%, 01/01/36(a)(b) | 10,902,479 | 11,626,786 | ||||||
Pool #888722, 2.561%, 01/01/36(a) | 3,184,144 | 3,347,921 | ||||||
Pool #995542, 2.632%, 02/01/36(a) | 6,629,640 | 7,062,438 | ||||||
Pool #AL2202, 2.718%, 06/01/36(a) | 15,537,264 | 16,600,262 | ||||||
Pool #AL0854, 2.746%, 06/01/36(a) | 9,834,418 | 10,476,715 | ||||||
Pool #AL1535, 2.938%, 06/01/36(a)(b) | 25,720,279 | 27,572,781 | ||||||
Pool #AE0329, 2.947%, 06/01/36(a) | 2,563,313 | 2,709,430 | ||||||
Pool #888859, 2.728%, 10/01/36(a)(b) | 1,193,135 | 1,261,094 | ||||||
Pool #745975, 2.270%, 11/01/36(a) | 3,631,769 | 3,877,225 | ||||||
Pool #903166, 2.417%, 11/01/36(a) | 3,329,159 | 3,557,114 | ||||||
Pool #AA3517, 2.597%, 11/01/36(a) | 9,200,871 | 9,787,465 | ||||||
Pool #917290, 2.684%, 11/01/36(a) | 4,205,299 | 4,481,435 | ||||||
See Notes to Financial Statements.
143
SCHEDULES OF PORTFOLIO INVESTMENTS
RIDGEWORTH FUNDS March 31, 2013
U.S. Government Securities Ultra-Short Bond Fund — concluded
| Shares or Principal Amount($) | Value($) | |||||||
U.S. Government Agency Mortgages—continued |
| |||||||
Pool #909313, 2.193%, 12/01/36(a) | 2,022,134 | 2,141,503 | ||||||
Pool #AL0968, 2.741%, 12/01/36(a) | 25,267,773 | 27,042,983 | ||||||
Pool #905857, 2.849%, 12/01/36(a) | 189,085 | 202,975 | ||||||
Pool #906216, 2.562%, 01/01/37(a) | 2,588,001 | 2,776,400 | ||||||
Pool #888180, 2.591%, 01/01/37(a) | 3,807,511 | 4,019,120 | ||||||
Pool #535990, 2.391%, 04/01/37(a) | 901,321 | 964,725 | ||||||
Pool #AA3518, 2.575%, 05/01/37(a) | 11,980,973 | 12,735,520 | ||||||
Pool #AL0872, 2.129%, 07/01/37(a) | 5,151,654 | 5,469,659 | ||||||
Pool #AL0960, 2.728%, 07/01/37(a)(b) | 26,062,843 | 27,795,500 | ||||||
Pool #995059, 2.819%, 08/01/37(a) | 2,433,721 | 2,608,101 | ||||||
Pool #AL1306, 2.728%, 09/01/37(a) | 10,828,412 | 11,545,416 | ||||||
Pool #AE0427, 2.638%, 10/01/37(a) | 9,537,731 | 10,203,293 | ||||||
Pool #AD0380, 2.683%, 10/01/37(a) | 12,745,703 | 13,566,749 | ||||||
Pool #AE0332, 2.579%, 11/01/37(a) | 8,603,638 | 9,135,054 | ||||||
Pool #AL0966, 2.633%, 11/01/37(a) | 8,063,834 | 8,579,060 | ||||||
Pool #AL0967, 2.696%, 04/01/38(a) | 23,712,703 | 25,346,008 | ||||||
Pool #AL0270, 3.227%, 08/01/38(a) | 19,918,713 | 20,972,136 | ||||||
Pool #AE0107, 3.482%, 10/01/38(a) | 4,864,398 | 5,218,978 | ||||||
Pool #AE0279, 3.151%, 11/01/38(a) | 2,054,401 | 2,199,566 | ||||||
Pool #AE0057, 3.245%, 02/01/39(a) | 8,141,545 | 8,705,124 | ||||||
Pool #AL1303, 3.395%, 02/01/39(a)(b) | 19,506,001 | 20,563,676 | ||||||
| Shares or Principal Amount($) | Value($) | |||||||
U.S. Government Agency Mortgages—continued |
| |||||||
Pool #AE0066, 2.294%, 09/01/39(a)(b) | 24,897,500 | 26,575,984 | ||||||
Pool #725874, 2.352%, 09/01/39(a) | 108,555 | 115,432 | ||||||
Pool #AM2923, 0.054%, 04/05/63(d) | 17,335,000 | 17,345,834 | ||||||
|
| |||||||
| 1,121,214,926 | ||||||||
|
| |||||||
NCUA Guaranteed Notes Trust 2010-A1 | ||||||||
Series 2010-A1, Cl A, 0.553%, 12/07/20(a) | 2,683,197 | 2,690,925 | ||||||
|
| |||||||
Total U.S. Government Agency Mortgages (Cost $1,570,273,617) | 1,595,922,247 | |||||||
|
| |||||||
Money Market Fund 3.4% | ||||||||
State Street Institutional U.S. Government Money Market Fund, Institutional Class, 0.01%(e) | 78,785,547 | 78,785,547 | ||||||
|
| |||||||
Total Money Market Fund (Cost $78,785,547) | 78,785,547 | |||||||
|
| |||||||
Total Investments (Cost $2,308,411,594) — 100.3% |
| 2,337,915,460 | ||||||
Liabilities in excess of other assets — (0.3)% | (6,002,391 | ) | ||||||
|
| |||||||
Net Assets — 100.0% | $ | 2,331,913,069 | ||||||
|
| |||||||
| (a) | Variable or floating rate security. Rate disclosed is as of March 31, 2013. |
| (b) | All or a portion of this security has been segregated, or otherwise earmarked, in connection with obligations for when-issued or delayed-delivery purchase commitments. |
| (c) | Rule 144A, Section 4(2) or other security which is restricted as to resale to institutional investors. The Fund’s investment adviser/subadviser has deemed this security to be liquid based upon procedures approved by the Board of Trustees. These securities represent 1.3% of net assets as of March 31, 2013. |
| (d) | All or a portion of this security has been purchased on a when-issued or delayed-delivery basis. |
| (e) | Rate disclosed, the 7 day net yield, is as of March 31, 2013. |
Investment Abbreviations
REMIC — Real Estate Mortgage Investment Conduit
Open Futures Contracts
At March 31, 2013, the Fund’s open futures contracts was as follows:
Description | Position | Notional Amount | Expiration Month | Contracts | Unrealized Depreciation | |||||||||||||
U.S. Treasury 5 Year Note | Short | $(24,720,632) | June 2013 | 200 | $(90,306 | ) | ||||||||||||
|
| |||||||||||||||||
See Notes to Financial Statements.
144
SCHEDULES OF PORTFOLIO INVESTMENTS
RIDGEWORTH FUNDS March 31, 2013
Virginia Intermediate Municipal Bond Fund
| Shares or Principal Amount($) | Value($) | |||||||
| Municipal Bonds 95.6% | ||||||||
Alabama 0.4% | ||||||||
Birmingham, Series A, GO, 0.000%, 03/01/32(a)(b) | 645,000 | 595,903 | ||||||
|
| |||||||
California 2.6% | ||||||||
California State, GO, 5.000%, 02/01/20 | 1,945,000 | 2,352,419 | ||||||
California State, GO, 5.000%, 02/01/38 | 1,460,000 | 1,616,571 | ||||||
|
| |||||||
| 3,968,990 | ||||||||
|
| |||||||
District of Columbia 4.9% | ||||||||
Metropolitan Washington D.C. Airports Authority, Airport System, Series A, RB, 5.000%, 10/01/29 | 2,500,000 | 2,888,725 | ||||||
Metropolitan Washington D.C. Airports Authority, Airport System, Series B, RB, 5.000%, 10/01/26, BHAC | 2,175,000 | 2,528,894 | ||||||
Washington D.C. Metropolitan Area Transit Authority, Gross Revenue, Series A, RB, 5.125%, 07/01/32 | 2,000,000 | 2,235,920 | ||||||
|
| |||||||
| 7,653,539 | ||||||||
|
| |||||||
Georgia 1.6% | ||||||||
Municipal Electric Authority of Georgia, RB, 5.000%, 01/01/30 | 2,155,000 | 2,485,642 | ||||||
|
| |||||||
New Jersey 0.7% | ||||||||
New Jersey Economic Development Authority, RB, 5.000%, 03/01/28 | 1,010,000 | 1,151,531 | ||||||
|
| |||||||
North Carolina 0.7% | ||||||||
North Carolina State Capital Facilities Finance Agency, Educational Facilities, RB, 5.000%, 05/01/32 | 1,030,000 | 1,107,198 | ||||||
|
| |||||||
Virginia 84.7% | ||||||||
Arlington County, GO, 5.000%, 03/15/15, State Aid Withholding(c) | 4,500,000 | 4,911,975 | ||||||
Bedford County Economic Development Authority, Public Facilities Lease, RB, 5.250%, 05/01/24, NATL-RE(c) | 1,890,000 | 2,123,264 | ||||||
Fairfax County, Series A, GO, 5.000%, 04/01/20, State Aid Withholding | 2,000,000 | 2,494,160 | ||||||
| Shares or Principal Amount($) | Value($) | |||||||
Virginia—continued | ||||||||
Fairfax County Economic Development Authority, 5.000%, 04/01/36 | 1,500,000 | 1,669,305 | ||||||
Fairfax County Economic Development Authority, RB, 5.000%, 08/01/22(c) | 3,700,000 | 4,420,871 | ||||||
Fairfax County Economic Development Authority, RB, 5.000%, 04/01/31 | 1,885,000 | 2,117,892 | ||||||
Fairfax County Economic Development Authority, RB, 5.000%, 04/01/32 | 1,840,000 | 2,062,401 | ||||||
Fairfax County Economic Development Authority, Lease Revenue, RB, 5.000%, 05/15/18 | 2,860,000 | 3,407,318 | ||||||
Fairfax County Industrial Development Authority, RB, 5.000%, 05/15/37 | 1,000,000 | 1,132,200 | ||||||
Fauquier County, GO, 5.000%, 07/01/19, Pre-refunded 07/01/2016 @ 100, NATL-RE | 2,100,000 | 2,403,555 | ||||||
Greater Richmond Convention Center Authority, Hotel Tax, RB, 5.000%, 06/15/16, NATL-RE | 2,855,000 | 3,099,788 | ||||||
Hampton Roads Sanitation District Wastewater, RB, 5.000%, 04/01/23 | 1,060,000 | 1,245,966 | ||||||
Hampton Roads Sanitation District Wastewater, RB, 5.000%, 04/01/24 | 2,425,000 | 2,836,353 | ||||||
Hanover County Development Authority, Regional Medical Care Project, RB, 6.375%, 08/15/18, NATL-RE(c) | 4,845,000 | 5,366,758 | ||||||
Henrico County Economic Development Authority, RB, 3.000%, 06/01/18 | 1,790,000 | 1,809,242 | ||||||
Henrico County Economic Development Authority, RB, 5.000%, 06/01/25 | 770,000 | 827,380 | ||||||
Henrico County Economic Development Authority, RB, 5.000%, 11/01/30(b) | 850,000 | 950,156 | ||||||
Henrico County VA Water & Sewer Revenue, RB, 5.000%, 05/01/20 | 1,945,000 | 2,426,076 | ||||||
See Notes to Financial Statements.
145
SCHEDULES OF PORTFOLIO INVESTMENTS
RIDGEWORTH FUNDS March 31, 2013
Virginia Intermediate Municipal Bond Fund — continued
| Shares or Principal Amount($) | Value($) | |||||||
Virginia—continued | ||||||||
Isle County Wight, GO, 5.000%, 07/01/37, State Aid Withholding | 1,200,000 | 1,385,364 | ||||||
James City County Economic Development Authority, Public Facility Project, RB, 5.000%, 06/15/21, AGM | 2,215,000 | 2,571,305 | ||||||
Loudoun County Industrial Development Authority, Series A, RB, 5.000%, 06/01/31 | 2,000,000 | 2,264,760 | ||||||
Loudoun County Sanitation Authority, Water & Sewage, RB, 5.000%, 01/01/21 | 2,460,000 | 3,084,225 | ||||||
New Kent County Economic Development Authority, School & Governmental Projects, RB, 5.000%, 02/01/18, AGM | 2,225,000 | 2,549,516 | ||||||
Newport News, GO, 5.250%, 07/01/15, State Aid Withholding(c) | 3,000,000 | 3,326,040 | ||||||
Norfolk Economic Development Authority, Health Care Facilities, Series B, RB, 5.000%, 11/01/25 | 1,000,000 | 1,183,730 | ||||||
Norfolk Economic Development Authority, Health Care Facilities, Series B, RB, 5.000%, 11/01/36 | 2,000,000 | 2,256,480 | ||||||
Pittsylvania County, GO, 5.000%, 03/01/21 | 1,000,000 | 1,201,760 | ||||||
Pittsylvania County, Series B, GO, 5.000%, 03/01/22 | 1,000,000 | 1,188,040 | ||||||
Portsmouth, Series D, GO, 5.000%, 07/15/23 | 1,250,000 | 1,499,363 | ||||||
Richmond, GO, 5.000%, 07/15/24, Pre-refunded 07/15/2016 @ 100, AGM | 1,435,000 | 1,646,304 | ||||||
Richmond, Series B, GO, 5.000%, 07/15/18 | 2,000,000 | 2,407,700 | ||||||
Richmond Industrial Development Authority, Government Facilities, RB, 5.000%, 07/15/18, AMBAC | 1,795,000 | 2,005,428 | ||||||
Roanoke, Series B, GO, 5.000%, 02/01/24, Pre-refunded 02/01/2015 @ 101, State Aid Withholding | 2,500,000 | 2,738,300 | ||||||
| Shares or Principal Amount($) | Value($) | |||||||
Virginia—continued | ||||||||
Roanoke Economic Development Authority, Hospital Revenue, RB, 5.000%, 07/01/27 | 1,000,000 | 1,137,190 | ||||||
Smyth County Industrial Development Authority, Mountain States Health Alliance, RB, 5.000%, 07/01/23 | 1,000,000 | 1,101,760 | ||||||
Tobacco Settlement Financing Corp., RB, 5.500%, 06/01/26, MSF(c) | 4,420,000 | 4,714,505 | ||||||
Virginia Beach, Public Improvement, Series C, GO, 5.000%, 09/15/16 | 2,325,000 | 2,680,190 | ||||||
Virginia College Building Authority, RB, 5.000%, 09/01/19 | 1,000,000 | 1,221,350 | ||||||
Virginia College Building Authority, Educational Facilities Project, Series B, RB, 5.000%, 03/01/21 | 1,250,000 | 1,550,125 | ||||||
Virginia College Building Authority, Educational Facilities Project, Washington & Lee University, RB, 5.375%, 01/01/21, MSF(c) | 3,950,000 | 4,729,137 | ||||||
Virginia College Building Authority, Public Higher Educational Financing Program, Series A, RB, 5.000%, 09/01/17, State Aid Withholding(c) | 3,000,000 | 3,427,800 | ||||||
Virginia College Building Authority, Public Higher Educational Financing Program, Series A, RB, 5.000%, 09/01/27(c) | 4,000,000 | 4,676,040 | ||||||
Virginia Commonwealth University, Health System Authority, RB, 5.000%, 07/01/30 | 1,460,000 | 1,658,399 | ||||||
Virginia Housing Development Authority, Commonwealth Mortgage, Series A-1, RB, 3.650%, 01/01/18, GO of Authority | 1,205,000 | 1,317,728 | ||||||
See Notes to Financial Statements.
146
SCHEDULES OF PORTFOLIO INVESTMENTS
RIDGEWORTH FUNDS March 31, 2013
Virginia Intermediate Municipal Bond Fund — concluded
| Shares or Principal Amount($) | Value($) | |||||||
Virginia—continued | ||||||||
Virginia Housing Development Authority, Commonwealth Mortgage, Series E, RB, 6.000%, 07/01/25, GO of Authority(c) | 2,310,000 | 2,618,223 | ||||||
Virginia Public Building Authority Facilities, Series A, RB, 5.000%, 08/01/26 | 2,500,000 | 2,994,500 | ||||||
Virginia Public Building Authority Facilities, Series B, RB, 5.000%, 08/01/20, ST APPROP(c) | 4,000,000 | 4,872,760 | ||||||
Virginia Public School Authority, School Financing, RB, 5.000%, 07/15/26, State Aid Withholding | 2,000,000 | 2,348,120 | ||||||
Virginia Resources Authority Clean Water, Revolving Fund, RB, 5.000%, 10/01/16 | 2,030,000 | 2,340,001 | ||||||
Virginia Resources Authority Infrastructure, Pooled Financing Program, Series A, RB, 5.000%, 11/01/18(c) | 2,775,000 | 3,375,982 | ||||||
Virginia Small Business Financing Authority, AMT, RB, 5.000%, 07/01/34 | 3,000,000 | 3,085,500 | ||||||
Virginia State, Series A, GO, 5.000%, 06/01/19, Pre-refunded 06/01/2014 @ 100(c) | 3,170,000 | 3,345,491 | ||||||
Winchester, GO, 5.000%, 11/01/18, Pre-refunded 11/01/2015 @ 100, NATL-RE/FGIC | 2,000,000 | 2,237,840 | ||||||
|
| |||||||
| 132,045,616 | ||||||||
|
| |||||||
Total Municipal Bonds (Cost $138,987,548) | 149,008,419 | |||||||
|
| |||||||
| Shares or Principal Amount($) | Value($) | |||||||
| Money Market Fund 4.0% | ||||||||
Federated Virginia Municipal Cash Trust, Institutional Share, 0.01%(d) | 6,207,605 | 6,207,605 | ||||||
|
| |||||||
Total Money Market Fund (Cost $6,207,605) | 6,207,605 | |||||||
|
| |||||||
Total Investments | 155,216,024 | |||||||
Other assets in excess of liabilities — 0.4% | 668,545 | |||||||
|
| |||||||
Net Assets — 100.0% | $ | 155,884,569 | ||||||
|
| |||||||
| (a) | Step bond. The rate shown is the rate in effect as of March 31, 2013. |
| (b) | All or a portion of this security has been purchased on a when-issued or delayed-delivery basis. |
| (c) | All or a portion of this security has been segregated, or otherwise earmarked, in connection with obligations for when-issued or delayed-delivery purchase commitments. |
| (d) | Rate disclosed, the 7 day net yield, is as of March 31, 2013. |
Investment Abbreviations
| AGM | — | Security guaranteed by Assured Guaranty Municipal Corporation | ||
| AMBAC | — | Security guaranteed by American Municipal Bond Assurance Corporation | ||
| AMT | — | Income subject to Alternative Minimum Tax | ||
| BHAC | — | Security guaranteed by Berkshire Hathaway Assurance Corporation | ||
| FGIC | — | Security guaranteed by Financial Guaranty Insurance Company | ||
| GO | — | General Obligation | ||
| MSF | — | Mandatory Sinking Fund | ||
| NATL-RE | — | Reinsurance provided by National Public Finance Guarantee Corporation | ||
| RB | — | Revenue Bond | ||
| ST APPROP | — | State Appropriation |
See Notes to Financial Statements.
147
STATEMENTS OF ASSETS AND LIABILITIES
RIDGEWORTH FUNDS March 31, 2013
| Core Bond Fund | Corporate Bond Fund | Georgia Tax-Exempt Bond Fund | High Grade Municipal Bond Fund | High Income Fund | ||||||||||||||||
Assets: | ||||||||||||||||||||
Total Investments, at Cost | $410,204,247 | $68,868,736 | $147,762,560 | $62,460,924 | $948,451,274 | |||||||||||||||
|
|
|
|
|
|
|
|
|
| |||||||||||
Total Investments, at Value* | $419,762,639 | $71,872,247 | $156,375,192 | $67,555,541 | $988,052,705 | |||||||||||||||
Cash | 9,043 | 10,136 | — | — | 4,984,845 | |||||||||||||||
Interest and Dividends Receivable | 1,865,735 | 681,427 | 1,613,315 | 720,214 | 14,849,042 | |||||||||||||||
Securities Lending Income Receivable | 3,346 | 4 | — | — | 12,222 | |||||||||||||||
Receivable for Capital Shares Issued | 378,319 | 96,975 | 72,801 | 205,468 | 1,171,205 | |||||||||||||||
Receivable for Investment Securities Sold | 760,017 | — | 2,522,781 | — | 27,558,131 | |||||||||||||||
Receivable for Investment Securities Sold on a When-issued Basis | — | — | — | 2,243,120 | 15,120,916 | |||||||||||||||
Receivable from Investment Adviser | — | 1,118 | — | 4,128 | 27,330 | |||||||||||||||
Prepaid Expenses and Other Assets | 30,163 | 25,985 | 9,675 | 17,402 | 39,303 | |||||||||||||||
|
|
|
|
|
|
|
|
|
| |||||||||||
Total Assets | 422,809,262 | 72,687,892 | 160,593,764 | 70,745,873 | 1,051,815,699 | |||||||||||||||
|
|
|
|
|
|
|
|
|
| |||||||||||
Liabilities: | ||||||||||||||||||||
Payable for Investment Securities Purchased | 11,030,099 | — | 3,045,614 | — | 182,869 | |||||||||||||||
Payable for Investment Securities Purchased on a When-issued Basis | 14,022,370 | 730,510 | 4,384,898 | 4,065,540 | 50,057,430 | |||||||||||||||
Payable for Capital Shares Redeemed | 1,105,206 | 465,643 | 31,656 | 287,164 | 1,975,983 | |||||||||||||||
Payable Upon Return of Securities Loaned | — | — | — | — | 70,317,458 | |||||||||||||||
Income Distributions Payable | 147,730 | 16,072 | 322,994 | 92,017 | 644,861 | |||||||||||||||
Investment Advisory Fees Payable | 82,709 | 24,569 | 64,888 | 27,624 | 422,456 | |||||||||||||||
Compliance and Fund Services Fees Payable | 8,292 | 1,275 | 2,577 | 1,032 | 15,660 | |||||||||||||||
Distribution and Service Fees Payable | 7,520 | 14,808 | 569 | 1,426 | 40,043 | |||||||||||||||
Other Accrued Expenses | 128,811 | 27,650 | 21,124 | 16,919 | 327,147 | |||||||||||||||
|
|
|
|
|
|
|
|
|
| |||||||||||
Total Liabilities | 26,532,737 | 1,280,527 | 7,874,320 | 4,491,722 | 123,983,907 | |||||||||||||||
|
|
|
|
|
|
|
|
|
| |||||||||||
Total Net Assets | $396,276,525 | $71,407,365 | $152,719,444 | $66,254,151 | $927,831,792 | |||||||||||||||
|
|
|
|
|
|
|
|
|
| |||||||||||
Net Assets Consist of: | ||||||||||||||||||||
Capital | $383,175,710 | $66,841,808 | $145,490,615 | $60,937,288 | $881,394,310 | |||||||||||||||
Accumulated Net Investment Income (Loss) | (562,821 | ) | (192,954 | ) | 190,650 | (7,143 | ) | (350,046 | ) | |||||||||||
Accumulated Net Realized Gain (Loss) from Investments and Swap Transactions | 4,105,244 | 1,755,000 | (1,574,453 | ) | 229,389 | 7,186,097 | ||||||||||||||
Net Unrealized Appreciation on Investments | 9,558,392 | 3,003,511 | 8,612,632 | 5,094,617 | 39,601,431 | |||||||||||||||
|
|
|
|
|
|
|
|
|
| |||||||||||
Net Assets | $396,276,525 | $71,407,365 | $152,719,444 | $66,254,151 | $927,831,792 | |||||||||||||||
|
|
|
|
|
|
|
|
|
| |||||||||||
Net Assets: | ||||||||||||||||||||
I Shares | $370,454,729 | $51,828,419 | $148,153,006 | $54,891,567 | $784,870,338 | |||||||||||||||
A Shares | 20,686,744 | 4,020,485 | 4,566,438 | 11,362,584 | 119,005,867 | |||||||||||||||
C Shares | — | 15,558,461 | — | — | — | |||||||||||||||
R Shares | 5,135,052 | — | — | — | 23,955,587 | |||||||||||||||
Shares Outstanding (unlimited number of shares authorized, no par value) | ||||||||||||||||||||
I Shares | 33,192,934 | 5,571,194 | 13,743,657 | 4,535,717 | 107,235,455 | |||||||||||||||
A Shares | 1,853,720 | 430,062 | 422,929 | 938,526 | 16,246,538 | |||||||||||||||
C Shares | — | 1,672,473 | — | — | — | |||||||||||||||
R Shares | 459,779 | — | — | — | 3,271,523 | |||||||||||||||
Net Asset Value and Redemption Price Per Share: | ||||||||||||||||||||
I Shares | $11.16 | $9.30 | $10.78 | $12.10 | $7.32 | |||||||||||||||
A Shares | 11.16 | 9.35 | 10.80 | 12.11 | 7.32 | |||||||||||||||
C Shares(a) | — | 9.30 | — | — | — | |||||||||||||||
R Shares | 11.17 | — | — | — | 7.32 | |||||||||||||||
Offering Price Per Share (100%/(100%-maximum sales charge x net asset value) of net asset value adjusted to the nearest cent): | ||||||||||||||||||||
A Shares | $11.72 | $9.82 | $11.34 | $12.71 | $7.69 | |||||||||||||||
Maximum Sales Charge — A Shares | 4.75 | % | 4.75 | % | 4.75 | % | 4.75 | % | 4.75 | % | ||||||||||
| * | Investments include securities on loan of $-, $-, $-, $-, $68,530,873, respectively. |
| (a) | Redemption price per share varies based on length of time shares are held. |
See Notes to Financial Statements.
148
STATEMENTS OF ASSETS AND LIABILITIES
RIDGEWORTH FUNDS March 31, 2013
| Intermediate Bond Fund | Investment Grade Tax-Exempt Bond Fund | Limited Duration Fund | Limited-Term Federal Mortgage Securities Fund | North Carolina Tax-Exempt Bond Fund | ||||||||||||||||
Assets: | ||||||||||||||||||||
Total Investments, at Cost | $925,739,489 | $978,753,499 | $9,318,898 | $17,540,584 | $49,546,412 | |||||||||||||||
|
|
|
|
|
|
|
|
|
| |||||||||||
Total Investments, at Value* | $944,880,807 | $1,033,537,111 | $9,360,817 | $17,958,404 | $51,729,888 | |||||||||||||||
Cash | 25,186 | — | — | — | — | |||||||||||||||
Interest and Dividends Receivable | 4,025,228 | 10,857,147 | 1,236 | 51,070 | 596,589 | |||||||||||||||
Securities Lending Income Receivable | 11,797 | — | — | — | — | |||||||||||||||
Receivable for Capital Shares Issued | 303,500 | 710,168 | — | 394 | 161 | |||||||||||||||
Receivable for Investment Securities Sold | 12,410,911 | 13,938,572 | — | — | 1,188,462 | |||||||||||||||
Receivable for Investment Securities Sold on a When-issued Basis | — | 12,629,087 | — | 1,130,414 | — | |||||||||||||||
Receivable from Investment Adviser | — | 1,668 | 38 | 4,038 | — | |||||||||||||||
Prepaid Expenses and Other Assets | 38,525 | 28,906 | 4,903 | 17,578 | 8,563 | |||||||||||||||
|
|
|
|
|
|
|
|
|
| |||||||||||
Total Assets | 961,695,954 | 1,071,702,659 | 9,366,994 | 19,161,898 | 53,523,663 | |||||||||||||||
|
|
|
|
|
|
|
|
|
| |||||||||||
Liabilities: | ||||||||||||||||||||
Payable for Investment Securities Purchased | — | 10,711,872 | — | 304,531 | 1,294,337 | |||||||||||||||
Payable for Investment Securities Purchased on a When-issued Basis | 2,740,163 | 38,384,624 | — | 1,643,670 | 195,639 | |||||||||||||||
Payable for Capital Shares Redeemed | 3,184,050 | 2,111,703 | — | 22,701 | 2,413 | |||||||||||||||
Payable Upon Return of Securities Loaned | 2,034,885 | — | — | — | — | |||||||||||||||
Income Distributions Payable | 676,083 | 642,520 | 1,318 | 3,101 | 95,379 | |||||||||||||||
Investment Advisory Fees Payable | 201,472 | 422,791 | 795 | 7,523 | 21,998 | |||||||||||||||
Compliance and Fund Services Fees Payable | 16,829 | 17,173 | 158 | 315 | 874 | |||||||||||||||
Distribution and Service Fees Payable | 2,147 | 9,409 | — | 5,530 | 116 | |||||||||||||||
Other Accrued Expenses | 214,448 | 273,513 | 7,314 | 12,673 | 11,688 | |||||||||||||||
|
|
|
|
|
|
|
|
|
| |||||||||||
Total Liabilities | 9,070,077 | 52,573,605 | 9,585 | 2,000,044 | 1,622,444 | |||||||||||||||
|
|
|
|
|
|
|
|
|
| |||||||||||
Total Net Assets | $952,625,877 | $1,019,129,054 | $9,357,409 | $17,161,854 | $51,901,219 | |||||||||||||||
|
|
|
|
|
|
|
|
|
| |||||||||||
Net Assets Consist of: | ||||||||||||||||||||
Capital | $920,060,378 | $959,176,509 | $10,775,285 | $29,015,517 | $48,593,963 | |||||||||||||||
Accumulated Net Investment (Loss) | (1,172,775 | ) | (227,700 | ) | (1,856 | ) | (19,256 | ) | (63,078 | ) | ||||||||||
Accumulated Net Realized Gain (Loss) from Investments Transactions | 14,596,956 | 5,396,633 | (1,457,939 | ) | (12,252,227 | ) | 1,186,858 | |||||||||||||
Net Unrealized Appreciation on Investments | 19,141,318 | 54,783,612 | 41,919 | 417,820 | 2,183,476 | |||||||||||||||
|
|
|
|
|
|
|
|
|
| |||||||||||
Net Assets | $952,625,877 | $1,019,129,054 | $9,357,409 | $17,161,854 | $51,901,219 | |||||||||||||||
|
|
|
|
|
|
|
|
|
| |||||||||||
Net Assets: | ||||||||||||||||||||
I Shares | $942,715,325 | $982,171,456 | $9,357,409 | $8,851,318 | $50,991,110 | |||||||||||||||
A Shares | 9,878,109 | 36,957,598 | — | 2,271,137 | 910,109 | |||||||||||||||
C Shares | — | — | — | 6,039,399 | — | |||||||||||||||
R Shares | 32,443 | — | — | — | — | |||||||||||||||
Shares Outstanding (unlimited number of shares authorized, no par value) | ||||||||||||||||||||
I Shares | 91,479,332 | 78,869,408 | 952,356 | 793,069 | 4,774,969 | |||||||||||||||
A Shares | 958,195 | 2,964,231 | — | 203,912 | 85,439 | |||||||||||||||
C Shares | — | — | — | 541,132 | — | |||||||||||||||
R Shares | 3,148 | — | — | — | — | |||||||||||||||
Net Asset Value and Redemption Price Per Share: | ||||||||||||||||||||
I Shares | $10.31 | $12.45 | $9.83 | $11.16 | $10.68 | |||||||||||||||
A Shares | 10.31 | 12.47 | — | 11.14 | 10.65 | |||||||||||||||
C Shares(a) | — | — | — | 11.16 | — | |||||||||||||||
R Shares | 10.30 | (b) | — | — | — | — | ||||||||||||||
Offering Price Per Share (100%/(100%-maximum sales charge x net asset value) of net asset value adjusted to the nearest cent): | ||||||||||||||||||||
A Shares | $10.82 | $13.09 | $— | $11.43 | $11.18 | |||||||||||||||
Maximum Sales Charge — A Shares | 4.75 | % | 4.75 | % | — | 2.50 | % | 4.75 | % | |||||||||||
| * | Investments include securities on loan of $1,990,752, $-, $-, $-, $-, respectively. |
| (a) | Redemption price per share varies based on length of time shares are held. |
| (b) | Net asset value calculations reflect fractional shares and dollar amounts. |
See Notes to Financial Statements.
149
STATEMENTS OF ASSETS AND LIABILITIES
RIDGEWORTH FUNDS March 31, 2013
| Seix Floating Rate High Income Fund | Seix High Yield Fund | Short-Term Bond Fund | Short-Term Municipal Bond Fund | Short-Term U.S. Treasury Securities Fund | ||||||||||||||||
Assets: | ||||||||||||||||||||
Total Investments, at Cost | $6,680,548,137 | $1,873,954,199 | $81,661,226 | $15,736,857 | $12,011,003 | |||||||||||||||
|
|
|
|
|
|
|
|
|
| |||||||||||
Total Investments, at Value* | $6,752,924,242 | $1,992,285,818 | $83,022,282 | $15,858,907 | $12,115,453 | |||||||||||||||
Cash | — | 6,851,076 | 174 | — | — | |||||||||||||||
Interest and Dividends Receivable | 21,615,559 | 30,226,228 | 406,108 | 135,686 | 60,952 | |||||||||||||||
Securities Lending Income Receivable | — | 18,359 | — | — | — | |||||||||||||||
Receivable for Capital Shares Issued | 26,779,440 | 2,431,253 | 39,467 | 284 | 46,688 | |||||||||||||||
Receivable for Investment Securities Sold | 5,462,581 | 6,627,398 | 1,444,886 | — | — | |||||||||||||||
Receivable for Investment Securities Sold on a When-issued Basis | 35,015,672 | 11,920,717 | — | — | — | |||||||||||||||
Receivable from Investment Adviser | — | — | — | 6,558 | 5,697 | |||||||||||||||
Prepaid Expenses and Other Assets | 78,042 | 61,568 | 29,420 | 16,276 | 24,375 | |||||||||||||||
|
|
|
|
|
|
|
|
|
| |||||||||||
Total Assets | 6,841,875,536 | 2,050,422,417 | 84,942,337 | 16,017,711 | 12,253,165 | |||||||||||||||
|
|
|
|
|
|
|
|
|
| |||||||||||
Liabilities: | ||||||||||||||||||||
Payable for Investment Securities Purchased | 23,047,095 | — | 419,099 | 498,268 | — | |||||||||||||||
Payable for Investment Securities Purchased on a When-issued Basis | 877,780,857 | 70,074,077 | 1,246,363 | 689,606 | — | |||||||||||||||
Payable for Capital Shares Redeemed | 7,578,683 | 5,396,642 | 263,514 | — | 12,931 | |||||||||||||||
Payable Upon Return of Securities Loaned | — | 99,836,835 | — | — | — | |||||||||||||||
Income Distributions Payable | 9,028,543 | 6,094,936 | 76,782 | 589 | 568 | |||||||||||||||
Investment Advisory Fees Payable | 1,964,642 | 673,381 | 29,372 | 4,287 | 3,660 | |||||||||||||||
Compliance and Fund Services Fees Payable | 81,439 | 35,126 | 2,039 | 224 | 221 | |||||||||||||||
Distribution and Service Fees Payable | 55,084 | 16,512 | 2,444 | 465 | 3,204 | |||||||||||||||
Other Accrued Expenses | 1,959,452 | 439,507 | 24,157 | 8,715 | 10,636 | |||||||||||||||
|
|
|
|
|
|
|
|
|
| |||||||||||
Total Liabilities | 921,495,795 | 182,567,016 | 2,063,770 | 1,202,154 | 31,220 | |||||||||||||||
|
|
|
|
|
|
|
|
|
| |||||||||||
Total Net Assets | $5,920,379,741 | $1,867,855,401 | $82,878,567 | $14,815,557 | $12,221,945 | |||||||||||||||
|
|
|
|
|
|
|
|
|
| |||||||||||
Net Assets Consist of: | ||||||||||||||||||||
Capital | $5,901,509,869 | $1,722,093,646 | $83,633,508 | $14,618,270 | $12,101,215 | |||||||||||||||
Accumulated Net Investment Income (Loss) | 23,943 | (407,000 | ) | (1,347 | ) | (1,452 | ) | (100 | ) | |||||||||||
Accumulated Net Realized Gain (Loss) from Investments, Futures and Swap Transactions | (53,530,176 | ) | 27,837,136 | (2,114,650 | ) | 76,689 | 16,380 | |||||||||||||
Net Unrealized Appreciation on Investments | 72,376,105 | 118,331,619 | 1,361,056 | 122,050 | 104,450 | |||||||||||||||
|
|
|
|
|
|
|
|
|
| |||||||||||
Net Assets | $5,920,379,741 | $1,867,855,401 | $82,878,567 | $14,815,557 | $12,221,945 | |||||||||||||||
|
|
|
|
|
|
|
|
|
| |||||||||||
Net Assets: | ||||||||||||||||||||
I Shares | $5,780,846,613 | $1,792,767,681 | $78,383,970 | $11,121,272 | $3,339,159 | |||||||||||||||
A Shares | 99,040,042 | 72,702,612 | 2,069,431 | 3,694,285 | 2,106,723 | |||||||||||||||
C Shares | 40,493,086 | — | 2,425,166 | — | 6,776,063 | |||||||||||||||
R Shares | — | 2,385,108 | — | — | — | |||||||||||||||
Shares Outstanding (unlimited number of shares authorized, no par value) | ||||||||||||||||||||
I Shares | 638,033,161 | 174,665,802 | 7,838,129 | 1,111,400 | 337,387 | |||||||||||||||
A Shares | 10,931,479 | 7,245,058 | 206,380 | 369,220 | 213,111 | |||||||||||||||
C Shares | 4,468,148 | — | 241,966 | — | 686,037 | |||||||||||||||
R Shares | — | 232,508 | — | — | — | |||||||||||||||
Net Asset Value and Redemption Price Per Share: | ||||||||||||||||||||
I Shares | $9.06 | $10.26 | $10.00 | $10.01 | $9.90 | |||||||||||||||
A Shares | 9.06 | 10.03 | 10.03 | 10.01 | 9.89 | |||||||||||||||
C Shares(a) | 9.06 | — | 10.02 | — | 9.88 | |||||||||||||||
R Shares | — | 10.26 | — | — | — | |||||||||||||||
Offering Price per Share (100%/(100%-maximum sales charge x net asset value) of net asset value adjusted to the nearest cent): | ||||||||||||||||||||
A Shares | $9.29 | $10.53 | $10.29 | $10.27 | $10.14 | |||||||||||||||
Maximum Sales Charge — A Shares | 2.50 | % | 4.75 | % | 2.50 | % | 2.50 | % | 2.50 | % | ||||||||||
| * | Investments include securities on loan of $-, $97,487,700, $ -, $ -, $-, respectively. |
| (a) | Redemption price per share varies based on length of time shares are held. |
See Notes to Financial Statements.
150
STATEMENTS OF ASSETS AND LIABILITIES
RIDGEWORTH FUNDS March 31, 2013
| Total Return Bond Fund | Ultra-Short Bond Fund | U.S. Government Securities Fund | U.S. Government Securities Ultra-Short Bond Fund | Virginia Intermediate Municipal Bond Fund | ||||||||||||||||
Assets: | ||||||||||||||||||||
Total Investments, at Cost | $1,421,442,228 | $110,251,450 | $38,696,024 | $2,308,411,594 | $145,195,153 | |||||||||||||||
|
|
|
|
|
|
|
|
|
| |||||||||||
Total Investments, at Value* | $1,451,794,853 | $110,837,454 | $39,594,449 | $2,337,915,460 | $155,216,024 | |||||||||||||||
Cash | 223,030 | 28 | — | — | — | |||||||||||||||
Cash Collateral on Deposit at Broker | — | — | — | 1,451,308 | — | |||||||||||||||
Interest and Dividends Receivable | 6,379,298 | 545,115 | 123,480 | 4,638,778 | 1,701,885 | |||||||||||||||
Appreciated Swap Contracts, at Value | 98,777 | — | — | — | — | |||||||||||||||
Securities Lending Income Receivable | 15,301 | — | — | — | — | |||||||||||||||
Receivable for Capital Shares Issued | 3,158,013 | 4,393 | 79,239 | 1,177,912 | 27,575 | |||||||||||||||
Receivable for Investment Securities Sold | 4,365,450 | 109,704 | — | 8,776,397 | — | |||||||||||||||
Receivable for Investment Securities Sold on a When-issued Basis | 1,657,312 | — | — | 93,463,281 | — | |||||||||||||||
Unrealized Appreciation on Forward Foreign Currency Contracts | 882,410 | — | — | — | — | |||||||||||||||
Receivable from Investment Adviser | 111,536 | — | 2,128 | — | — | |||||||||||||||
Prepaid Expenses and Other Assets | 65,955 | 16,387 | 17,661 | 106,292 | 9,842 | |||||||||||||||
|
|
|
|
|
|
|
|
|
| |||||||||||
Total Assets | 1,468,751,935 | 111,513,081 | 39,816,957 | 2,447,529,428 | 156,955,326 | |||||||||||||||
|
|
|
|
|
|
|
|
|
| |||||||||||
Liabilities: | ||||||||||||||||||||
Payable for Investment Securities Purchased | 24,998,168 | 1,807,376 | 290,420 | — | — | |||||||||||||||
Payable for Investment Securities Purchased on a When-issued Basis | 55,739,104 | — | — | 110,336,459 | 586,918 | |||||||||||||||
Payable for Credit Default Swap Contracts, at Value | 1,622,936 | — | — | — | — | |||||||||||||||
Depreciated Swap Contracts, at Value | 4,033,600 | — | — | — | — | |||||||||||||||
Payable for Capital Shares Redeemed | 1,383,103 | 394,672 | 28,673 | 3,676,550 | 63,620 | |||||||||||||||
Payable Upon Return of Securities Loaned | 51,812,500 | — | — | — | — | |||||||||||||||
Interest Payable On Open Swap Contracts | 222,333 | — | — | — | — | |||||||||||||||
Income Distributions Payable | 200,706 | 40,740 | 1,544 | 335,020 | 327,998 | |||||||||||||||
Unrealized Depreciation on Forward Foreign Currency Contracts | 803,809 | — | — | — | — | |||||||||||||||
Unrealized Depreciation on Futures Contracts | — | — | — | 90,306 | — | |||||||||||||||
Investment Advisory Fees Payable | 270,512 | 19,902 | 16,757 | 372,446 | 65,887 | |||||||||||||||
Compliance and Fund Services Fees Payable | 22,710 | 1,754 | 681 | 40,306 | 2,610 | |||||||||||||||
Distribution and Service Fees Payable | 41,034 | — | 2,063 | — | 1,389 | |||||||||||||||
Other Accrued Expenses | 398,068 | 24,343 | 22,810 | 765,272 | 22,335 | |||||||||||||||
|
|
|
|
|
|
|
|
|
| |||||||||||
Total Liabilities | 141,548,583 | 2,288,787 | 362,948 | 115,616,359 | 1,070,757 | |||||||||||||||
|
|
|
|
|
|
|
|
|
| |||||||||||
Total Net Assets | $1,327,203,352 | $109,224,294 | $39,454,009 | $2,331,913,069 | $155,884,569 | |||||||||||||||
|
|
|
|
|
|
|
|
|
| |||||||||||
Net Assets Consist of: | ||||||||||||||||||||
Capital | $1,293,845,555 | $111,898,069 | $38,558,361 | $2,316,317,772 | $144,459,051 | |||||||||||||||
Accumulated Net Investment Income (Loss) | (1,397,738 | ) | (2,449 | ) | (78 | ) | (3,259 | ) | 19,519 | |||||||||||
Accumulated Net Realized Gain (Loss) from Investments, Futures, Swap and Foreign Currency Transactions | 4,465,216 | (3,257,330 | ) | (2,699 | ) | (13,815,004 | ) | 1,385,128 | ||||||||||||
Net Unrealized Appreciation on Investments, Futures, Swaps and Foreign Currencies | 30,290,319 | 586,004 | 898,425 | 29,413,560 | 10,020,871 | |||||||||||||||
|
|
|
|
|
|
|
|
|
| |||||||||||
Net Assets | $1,327,203,352 | $109,224,294 | $39,454,009 | $2,331,913,069 | $155,884,569 | |||||||||||||||
|
|
|
|
|
|
|
|
|
| |||||||||||
Net Assets: | ||||||||||||||||||||
I Shares | $1,204,227,672 | $109,224,294 | $35,866,215 | $2,331,913,069 | $144,888,867 | |||||||||||||||
A Shares | 50,278,665 | — | 1,665,085 | — | 10,995,702 | |||||||||||||||
C Shares | — | — | 1,922,709 | — | — | |||||||||||||||
R Shares | 72,697,015 | — | — | — | — | |||||||||||||||
Shares Outstanding (unlimited number of shares authorized, no par value) | ||||||||||||||||||||
I Shares | 111,574,534 | 10,944,063 | 4,253,255 | 229,319,506 | 13,749,867 | |||||||||||||||
A Shares | 4,509,880 | — | 197,449 | — | 1,043,784 | |||||||||||||||
C Shares | — | — | 228,009 | — | — | |||||||||||||||
R Shares | 6,734,262 | — | — | — | — | |||||||||||||||
Net Asset Value and Redemption Price Per Share: | ||||||||||||||||||||
I Shares | $10.79 | $9.98 | $8.43 | $10.17 | $10.54 | |||||||||||||||
A Shares | 11.15 | — | 8.43 | — | 10.53 | |||||||||||||||
C Shares(a) | — | — | 8.43 | — | — | |||||||||||||||
R Shares | 10.80 | — | — | — | — | |||||||||||||||
Offering Price per Share (100%/(100%-maximum sales charge x net asset value) of net asset value adjusted to the nearest cent): | ||||||||||||||||||||
A Shares | $11.71 | $— | $8.85 | $— | $11.06 | |||||||||||||||
Maximum Sales Charge — A Shares | 4.75 | % | — | 4.75 | % | — | 4.75 | % | ||||||||||||
| * | Investments include securities on loan of $50,797,997, $-, $-, $-, $-, respectively. |
| (a) | Redemption price per share varies based on length of time shares are held. |
See Notes to Financial Statements.
151
RIDGEWORTH FUNDS For the Year Ended March 31, 2013
| Core Bond Fund | Corporate Bond Fund | Georgia Tax-Exempt Bond Fund | High Grade Municipal Bond Fund | High Income Fund | ||||||||||||||||
Investment Income: | ||||||||||||||||||||
Interest Income | $8,138,453 | $3,135,110 | $5,742,766 | $1,947,496 | $56,659,312 | |||||||||||||||
Dividend Income | 252,381 | 223,907 | 2,560 | 2,995 | 568,787 | |||||||||||||||
Net Income from Securities Lending | 4,791 | 21 | — | — | 250,780 | |||||||||||||||
|
|
|
|
|
|
|
|
|
| |||||||||||
Total Investment Income | 8,395,625 | 3,359,038 | 5,745,326 | 1,950,491 | 57,478,879 | |||||||||||||||
|
|
|
|
|
|
|
|
|
| |||||||||||
Expenses: | ||||||||||||||||||||
Investment Advisory Fees | 1,226,891 | 339,706 | 794,935 | 292,802 | 4,501,376 | |||||||||||||||
Administration Fees | 44,718 | 7,728 | 14,008 | 5,169 | 73,967 | |||||||||||||||
Fund Accounting Fees | 50,223 | 8,419 | 14,797 | 5,345 | 77,504 | |||||||||||||||
Transfer Agency Fees | 75,804 | 60,542 | 11,442 | 11,139 | 289,259 | |||||||||||||||
Compliance & Fund Services Fees | 34,584 | 5,969 | 10,767 | 3,948 | 56,097 | |||||||||||||||
Distribution and Service Fees — A Shares | 67,024 | 16,708 | 6,768 | 13,856 | 339,213 | |||||||||||||||
Distribution and Service Fees — C Shares | — | 181,369 | — | — | — | |||||||||||||||
Distribution and Service Fees — R Shares | 28,191 | — | — | — | 107,776 | |||||||||||||||
Shareholder Servicing Fees — I Shares | 259,981 | 17,192 | 1,589 | 10,028 | 471,479 | |||||||||||||||
Shareholder Servicing Fees — A Shares | 15,596 | 32 | 225 | 1,471 | 204,602 | |||||||||||||||
Shareholder Servicing Fees — R Shares | 836 | — | — | — | 16,455 | |||||||||||||||
Custodian Fees | 20,049 | 9,095 | 8,456 | 7,719 | 42,559 | |||||||||||||||
Printing Fees | 31,457 | 6,049 | 5,306 | 3,429 | 98,681 | |||||||||||||||
Registration Fees | 50,576 | 41,375 | 15,290 | 31,943 | 74,243 | |||||||||||||||
Trustee Fees | 23,414 | 3,967 | 7,216 | 2,613 | 37,804 | |||||||||||||||
Other Fees | 43,550 | 11,826 | 17,046 | 10,417 | 73,511 | |||||||||||||||
|
|
|
|
|
|
|
|
|
| |||||||||||
Total Expenses | 1,972,894 | 709,977 | 907,845 | 399,879 | 6,464,526 | |||||||||||||||
Less: Investment Advisory Fees Waived/Expenses Reimbursed | (1,227 | ) | (10,691 | ) | — | (17,205 | ) | (85,675 | ) | |||||||||||
Less: Custodian Credits (Note 3) | (82 | ) | (44 | ) | (24 | ) | — | (146 | ) | |||||||||||
|
|
|
|
|
|
|
|
|
| |||||||||||
Net Expenses | 1,971,585 | 699,242 | 907,821 | 382,674 | 6,378,705 | |||||||||||||||
|
|
|
|
|
|
|
|
|
| |||||||||||
Net Investment Income | 6,424,040 | 2,659,796 | 4,837,505 | 1,567,817 | 51,100,174 | |||||||||||||||
|
|
|
|
|
|
|
|
|
| |||||||||||
Net Realized and Unrealized Gain (Loss) on Investments and Swaps: | ||||||||||||||||||||
Net Realized Gain (Loss) from: | ||||||||||||||||||||
Investment Transactions | 9,783,817 | 4,214,550 | 4,725,574 | 1,043,022 | 9,713,834 | |||||||||||||||
Credit Default Swap Contracts | — | — | — | — | (5,555 | ) | ||||||||||||||
Net Change in Unrealized Appreciation (Depreciation) on: | ||||||||||||||||||||
Investments | (4,439 | ) | (1,384,022 | ) | (1,459,254 | ) | 1,055,712 | 41,072,116 | ||||||||||||
|
|
|
|
|
|
|
|
|
| |||||||||||
Net Realized and Unrealized Gain (Loss) on Investments and Swaps | 9,779,378 | 2,830,528 | 3,266,320 | 2,098,734 | 50,780,395 | |||||||||||||||
|
|
|
|
|
|
|
|
|
| |||||||||||
Change in Net Assets from Operations | $16,203,418 | $5,490,324 | $8,103,825 | $3,666,551 | $101,880,569 | |||||||||||||||
|
|
|
|
|
|
|
|
|
| |||||||||||
See Notes to Financial Statements.
152
STATEMENTS OF OPERATIONS
RIDGEWORTH FUNDS For the Year Ended March 31, 2013
| Intermediate Bond Fund | Investment Grade Tax-Exempt Bond Fund | Limited Duration Fund | Limited-Term Federal Mortgage Securities Fund | North Carolina Tax-Exempt Bond Fund | ||||||||||||||||
Investment Income: | ||||||||||||||||||||
Interest Income | $21,409,910 | $26,673,001 | $90,716 | $269,561 | $1,816,718 | |||||||||||||||
Dividend Income | 782,572 | 50,977 | — | 2 | 1,021 | |||||||||||||||
Net Income from Securities Lending | 37,575 | — | — | — | — | |||||||||||||||
|
|
|
|
|
|
|
|
|
| |||||||||||
Total Investment Income | 22,230,057 | 26,723,978 | 90,716 | 269,563 | 1,817,739 | |||||||||||||||
|
|
|
|
|
|
|
|
|
| |||||||||||
Expenses: | ||||||||||||||||||||
Investment Advisory Fees | 2,716,307 | 5,000,743 | 11,275 | 131,812 | 275,644 | |||||||||||||||
Administration Fees | 102,292 | 93,545 | 1,026 | 2,399 | 4,855 | |||||||||||||||
Fund Accounting Fees | 109,863 | 99,444 | 1,068 | 2,506 | 5,157 | |||||||||||||||
Transfer Agency Fees | 94,587 | 133,407 | 1,415 | 16,095 | 5,509 | |||||||||||||||
Compliance & Fund Services Fees | 78,331 | 71,435 | 816 | 1,893 | 3,713 | |||||||||||||||
Distribution and Service Fees — A Shares | 29,804 | 109,787 | — | 5,976 | 1,097 | |||||||||||||||
Distribution and Service Fees — C Shares | — | — | — | 66,827 | — | |||||||||||||||
Distribution and Service Fees — R Shares | 311 | — | — | — | — | |||||||||||||||
Shareholder Servicing Fees — I Shares | 541,075 | 761,582 | — | 5,839 | 364 | |||||||||||||||
Shareholder Servicing Fees — A Shares | 9,336 | 7,543 | — | 570 | 40 | |||||||||||||||
Shareholder Servicing Fees — R Shares | 656 | — | — | — | — | |||||||||||||||
Custodian Fees | 28,249 | 22,604 | 4,806 | 8,213 | 6,755 | |||||||||||||||
Printing Fees | 59,833 | 43,999 | 1,349 | 3,046 | 2,214 | |||||||||||||||
Registration Fees | 49,059 | 47,296 | 8,851 | 41,218 | 12,840 | |||||||||||||||
Trustee Fees | 53,074 | 47,943 | 547 | 1,294 | 2,484 | |||||||||||||||
Other Fees | 91,554 | 81,662 | 6,328 | 8,737 | 10,113 | |||||||||||||||
|
|
|
|
|
|
|
|
|
| |||||||||||
Total Expenses | 3,964,331 | 6,520,990 | 37,481 | 296,425 | 330,785 | |||||||||||||||
Less: Investment Advisory Fees Waived/Expenses Reimbursed | (580 | ) | (53,503 | ) | (3,221 | ) | (49,640 | ) | — | |||||||||||
Less: Custodian Credits (Note 3) | (33 | ) | (127 | ) | — | — | — | |||||||||||||
|
|
|
|
|
|
|
|
|
| |||||||||||
Net Expenses | 3,963,718 | 6,467,360 | 34,260 | 246,785 | 330,785 | |||||||||||||||
|
|
|
|
|
|
|
|
|
| |||||||||||
Net Investment Income | 18,266,339 | 20,256,618 | 56,456 | 22,778 | 1,486,954 | |||||||||||||||
|
|
|
|
|
|
|
|
|
| |||||||||||
Net Realized and Unrealized Gain (Loss) on Investments: | ||||||||||||||||||||
Net Realized Gain from: | ||||||||||||||||||||
Investment Transactions | 37,775,410 | 19,891,403 | 39,606 | 1,250,502 | 1,975,936 | |||||||||||||||
Net Change in Unrealized Appreciation (Depreciation) on: | ||||||||||||||||||||
Investments | (19,448,314 | ) | 8,822,011 | 19,238 | (599,719 | ) | (929,051 | ) | ||||||||||||
|
|
|
|
|
|
|
|
|
| |||||||||||
Net Realized and Unrealized Gain (Loss) on Investments | 18,327,096 | 28,713,414 | 58,844 | 650,783 | 1,046,885 | |||||||||||||||
|
|
|
|
|
|
|
|
|
| |||||||||||
Change in Net Assets from Operations | $36,593,435 | $48,970,032 | $115,300 | $673,561 | $2,533,839 | |||||||||||||||
|
|
|
|
|
|
|
|
|
| |||||||||||
See Notes to Financial Statements.
153
STATEMENTS OF OPERATIONS
RIDGEWORTH FUNDS For the Year Ended March 31, 2013
| Seix Floating Rate High Income Fund | Seix High Yield Fund | Short-Term Bond Fund | Short-Term Municipal Bond Fund | Short-Term U.S. Treasury Securities Fund | ||||||||||||||||
Investment Income: | ||||||||||||||||||||
Interest Income | $240,277,430 | $143,314,404 | $4,631,184 | $124,540 | $169,926 | |||||||||||||||
Dividend Income | 332,049 | 611,197 | 1,292 | 702 | — | |||||||||||||||
Net Income from Securities Lending | — | 496,932 | — | — | — | |||||||||||||||
|
|
|
|
|
|
|
|
|
| |||||||||||
Total Investment Income | 240,609,479 | 144,422,533 | 4,632,476 | 125,242 | 169,926 | |||||||||||||||
|
|
|
|
|
|
|
|
|
| |||||||||||
Expenses: | ||||||||||||||||||||
Investment Advisory Fees | 17,354,737 | 8,759,327 | 932,940 | 40,227 | 59,000 | |||||||||||||||
Administration Fees | 382,363 | 189,231 | 21,225 | 1,034 | 1,455 | |||||||||||||||
Fund Accounting Fees | 379,240 | 202,433 | 25,103 | 880 | 1,587 | |||||||||||||||
Transfer Agency Fees | 1,732,704 | 1,056,464 | 20,720 | 5,686 | 11,556 | |||||||||||||||
Compliance & Fund Services Fees | 289,357 | 146,293 | 16,521 | 847 | 1,143 | |||||||||||||||
Distribution and Service Fees — A Shares | 158,057 | 155,335 | 4,544 | 5,335 | 5,328 | |||||||||||||||
Distribution and Service Fees — C Shares | 322,765 | — | 26,269 | — | 43,152 | |||||||||||||||
Distribution and Service Fees — R Shares | — | 11,864 | — | — | — | |||||||||||||||
Shareholder Servicing Fees — I Shares | 2,538,587 | 309,125 | 7,375 | 716 | 4,368 | |||||||||||||||
Shareholder Servicing Fees — A Shares | 822,418 | 8,516 | 1,264 | 29 | 891 | |||||||||||||||
Shareholder Servicing Fees — R Shares | — | 182 | — | — | — | |||||||||||||||
Custodian Fees | 606,867 | 85,091 | 14,085 | 6,398 | 6,642 | |||||||||||||||
Printing Fees | 256,254 | 108,783 | 7,172 | 8,329 | 2,523 | |||||||||||||||
Registration Fees | 81,111 | 57,247 | 42,185 | 30,700 | 39,496 | |||||||||||||||
Trustee Fees | 192,042 | 99,052 | 11,766 | 527 | 764 | |||||||||||||||
Other Fees | 382,702 | 163,629 | 22,045 | 7,125 | 7,612 | |||||||||||||||
|
|
|
|
|
|
|
|
|
| |||||||||||
Total Expenses | 25,499,204 | 11,352,572 | 1,153,214 | 107,833 | 185,517 | |||||||||||||||
Less: Investment Advisory Fees Waived/Expenses Reimbursed | — | — | (2,491 | ) | (36,651 | ) | (56,666 | ) | ||||||||||||
Less: Custodian Credits (Note 3) | (1,031 | ) | (571 | ) | (92 | ) | (14 | ) | — | |||||||||||
|
|
|
|
|
|
|
|
|
| |||||||||||
Net Expenses | 25,498,173 | 11,352,001 | 1,150,631 | 71,168 | 128,851 | |||||||||||||||
|
|
|
|
|
|
|
|
|
| |||||||||||
Net Investment Income | 215,111,306 | 133,070,532 | 3,481,845 | 54,074 | 41,075 | |||||||||||||||
|
|
|
|
|
|
|
|
|
| |||||||||||
Net Realized and Unrealized Gain (Loss) on Investments, Futures and Swaps: | ||||||||||||||||||||
Net Realized Gain (Loss) from: | ||||||||||||||||||||
Investment Transactions | 18,424,010 | 54,792,401 | 4,753,708 | 585,879 | 36,023 | |||||||||||||||
Futures Contracts | — | — | (293,028 | ) | — | — | ||||||||||||||
Credit Default Swap Contracts | — | (1,169,396 | ) | — | — | — | ||||||||||||||
Net Change in Unrealized Appreciation (Depreciation) on: | ||||||||||||||||||||
Investments | 78,561,655 | 63,484,472 | (3,520,601 | ) | (323,208 | ) | (92,516 | ) | ||||||||||||
Futures Contracts | — | — | (94,925 | ) | — | — | ||||||||||||||
|
|
|
|
|
|
|
|
|
| |||||||||||
Net Realized and Unrealized Gain (Loss) on Investments, Futures and Swaps | 96,985,665 | 117,107,477 | 845,154 | 262,671 | (56,493 | ) | ||||||||||||||
|
|
|
|
|
|
|
|
|
| |||||||||||
Change in Net Assets from Operations | $312,096,971 | $250,178,009 | $4,326,999 | $316,745 | $(15,418 | ) | ||||||||||||||
|
|
|
|
|
|
|
|
|
| |||||||||||
See Notes to Financial Statements.
154
STATEMENTS OF OPERATIONS
RIDGEWORTH FUNDS For the Year Ended March 31, 2013
| Total Return Bond Fund | Ultra-Short Bond Fund | U.S. Government Securities Fund | U.S. Government Securities Ultra-Short Bond Fund | Virginia Intermediate Municipal Bond Fund | ||||||||||||||||
Investment Income: | ||||||||||||||||||||
Interest Income | $25,510,787 | $1,514,027 | $521,566 | $15,050,146 | $5,608,150 | |||||||||||||||
Dividend Income | 638,427 | 723 | 1 | 38,578 | 780 | |||||||||||||||
Net Income from Securities Lending | 24,949 | — | — | — | — | |||||||||||||||
|
|
|
|
|
|
|
|
|
| |||||||||||
Total Investment Income | 26,174,163 | 1,514,750 | 521,567 | 15,088,724 | 5,608,930 | |||||||||||||||
|
|
|
|
|
|
|
|
|
| |||||||||||
Expenses: | ||||||||||||||||||||
Investment Advisory Fees | 3,020,044 | 254,171 | 214,774 | 4,304,921 | 823,891 | |||||||||||||||
Administration Fees | 114,561 | 10,513 | 3,909 | 210,054 | 14,506 | |||||||||||||||
Fund Accounting Fees | 121,929 | 11,007 | 4,042 | 223,741 | 15,295 | |||||||||||||||
Transfer Agency Fees | 292,103 | 29,012 | 13,757 | 401,314 | 17,300 | |||||||||||||||
Compliance & Fund Services Fees | 87,127 | 8,063 | 3,044 | 160,534 | 11,143 | |||||||||||||||
Distribution and Service Fees — A Shares | 132,041 | — | 5,214 | — | 17,412 | |||||||||||||||
Distribution and Service Fees — C Shares | — | — | 22,059 | — | — | |||||||||||||||
Distribution and Service Fees — R Shares | 233,913 | — | — | — | — | |||||||||||||||
Shareholder Servicing Fees — I Shares | 906,628 | 3,545 | 43,792 | 2,514,443 | 2,197 | |||||||||||||||
Shareholder Servicing Fees — A Shares | 56,553 | — | 359 | — | 381 | |||||||||||||||
Shareholder Servicing Fees — R Shares | 106,621 | — | — | — | — | |||||||||||||||
Custodian Fees | 77,083 | 11,647 | 6,651 | 52,148 | 8,306 | |||||||||||||||
Printing Fees | 82,848 | 5,390 | 3,188 | 120,482 | 6,677 | |||||||||||||||
Registration Fees | 81,084 | 25,432 | 40,137 | 93,631 | 18,652 | |||||||||||||||
Trustee Fees | 58,070 | 5,503 | 2,026 | 107,430 | 7,471 | |||||||||||||||
Other Fees | 106,570 | 14,915 | 9,632 | 181,776 | 18,080 | |||||||||||||||
|
|
|
|
|
|
|
|
|
| |||||||||||
Total Expenses | 5,477,175 | 379,198 | 372,584 | 8,370,474 | 961,311 | |||||||||||||||
Less: Investment Advisory Fees Waived/Expenses Reimbursed | (134,555 | ) | — | (36,932 | ) | — | — | |||||||||||||
Less: Custodian Credits (Note 3) | (42 | ) | (42 | ) | — | (755 | ) | (39 | ) | |||||||||||
|
|
|
|
|
|
|
|
|
| |||||||||||
Net Expenses | 5,342,578 | 379,156 | 335,652 | 8,369,719 | 961,272 | |||||||||||||||
|
|
|
|
|
|
|
|
|
| |||||||||||
Net Investment Income | 20,831,585 | 1,135,594 | 185,915 | 6,719,005 | 4,647,658 | |||||||||||||||
|
|
|
|
|
|
|
|
|
| |||||||||||
Net Realized and Unrealized Gain (Loss) on Investments, Futures, Swaps and Foreign Currencies: | ||||||||||||||||||||
Net Realized Gain (Loss) from: | ||||||||||||||||||||
Investment and Foreign Currency Transactions | 21,622,183 | 607,189 | 767,150 | 17,304,857 | 3,083,203 | |||||||||||||||
Futures Contracts | — | (40,779 | ) | — | (2,321,948 | ) | — | |||||||||||||
Credit Default Swap Contracts | (6,213,713 | ) | — | — | — | — | ||||||||||||||
Forward Foreign Currency Contracts | 6,198,428 | — | — | — | — | |||||||||||||||
Net Change in Unrealized Appreciation (Depreciation) on: | ||||||||||||||||||||
Investments and Foreign Currencies | 2,432,638 | (6,011 | ) | 30,778 | 2,282,904 | (1,915,193 | ) | |||||||||||||
Futures Contracts | — | — | — | (90,306 | ) | — | ||||||||||||||
Credit Default Swap Contracts | (83,434 | ) | — | — | — | — | ||||||||||||||
Forward Foreign Currency Contracts | 214,851 | — | — | — | — | |||||||||||||||
|
|
|
|
|
|
|
|
|
| |||||||||||
Net Realized and Unrealized Gain (Loss) on Investments, Futures, Swaps and Foreign Currencies | 24,170,953 | 560,399 | 797,928 | 17,175,507 | 1,168,010 | |||||||||||||||
|
|
|
|
|
|
|
|
|
| |||||||||||
Change in Net Assets from Operations | $45,002,538 | $1,695,993 | $983,843 | $23,894,512 | $5,815,668 | |||||||||||||||
|
|
|
|
|
|
|
|
|
| |||||||||||
See Notes to Financial Statements.
155
STATEMENTS OF CHANGES IN NET ASSETS
RIDGEWORTH FUNDS For the Periods Indicated
| Core Bond Fund | Corporate Bond Fund | Georgia Tax-Exempt Bond Fund | ||||||||||||||||||||||
| 04/01/12- 03/31/13 | 04/01/11- 03/31/12 | 04/01/12- 03/31/13 | 04/01/11- 03/31/12 | 04/01/12- 03/31/13 | 04/01/11- 03/31/12 | |||||||||||||||||||
Operations: | ||||||||||||||||||||||||
Net Investment Income | $ | 6,424,040 | $ | 7,462,125 | $ | 2,659,796 | $ | 2,740,094 | $ | 4,837,505 | $ | 5,460,398 | ||||||||||||
Net Realized Gain | 9,783,817 | 24,110,179 | 4,214,550 | 4,073,160 | 4,725,574 | 1,263,832 | ||||||||||||||||||
Net Change in Unrealized Appreciation (Depreciation) | (4,439 | ) | (2,301,238 | ) | (1,384,022 | ) | (707,485 | ) | (1,459,254 | ) | 11,352,043 | |||||||||||||
|
|
|
|
|
|
|
|
|
|
|
| |||||||||||||
Change in Net Assets from Operations | 16,203,418 | 29,271,066 | 5,490,324 | 6,105,769 | 8,103,825 | 18,076,273 | ||||||||||||||||||
|
|
|
|
|
|
|
|
|
|
|
| |||||||||||||
Dividends and Distributions to Shareholders: | ||||||||||||||||||||||||
Net Investment Income: | ||||||||||||||||||||||||
I Shares | (8,053,233 | ) | (7,644,796 | ) | (2,056,712 | ) | (2,128,601 | ) | (4,702,696 | ) | (5,316,936 | ) | ||||||||||||
A Shares | (319,708 | ) | (400,767 | ) | (170,577 | ) | (95,460 | ) | (135,016 | ) | (143,422 | ) | ||||||||||||
C Shares | — | — | (433,099 | ) | (515,969 | ) | — | — | ||||||||||||||||
R Shares | (72,608 | ) | (107,688 | ) | — | — | — | — | ||||||||||||||||
Net Realized Gains: | ||||||||||||||||||||||||
I Shares | (5,872,395 | ) | (18,964,864 | ) | (2,186,344 | ) | (3,859,873 | ) | — | — | ||||||||||||||
A Shares | (259,548 | ) | (1,163,981 | ) | (191,370 | ) | (214,633 | ) | — | — | ||||||||||||||
C Shares | — | — | (646,870 | ) | (1,265,689 | ) | — | — | ||||||||||||||||
R Shares | (64,572 | ) | (357,204 | ) | — | — | — | — | ||||||||||||||||
|
|
|
|
|
|
|
|
|
|
|
| |||||||||||||
Total Dividends and Distributions | (14,642,064 | ) | (28,639,300 | ) | (5,684,972 | ) | (8,080,225 | ) | (4,837,712 | ) | (5,460,358 | ) | ||||||||||||
|
|
|
|
|
|
|
|
|
|
|
| |||||||||||||
Change in Net Assets from Capital Transactions | (71,898,387 | ) | 144,315,144 | (8,242,894 | ) | 296,786 | (629,852 | ) | (28,084,239 | ) | ||||||||||||||
|
|
|
|
|
|
|
|
|
|
|
| |||||||||||||
Change in Net Assets | (70,337,033 | ) | 144,946,910 | (8,437,542 | ) | (1,677,670 | ) | 2,636,261 | (15,468,324 | ) | ||||||||||||||
|
|
|
|
|
|
|
|
|
|
|
| |||||||||||||
Net Assets: | ||||||||||||||||||||||||
Beginning of Period | 466,613,558 | 321,666,648 | 79,844,907 | 81,522,577 | 150,083,183 | 165,551,507 | ||||||||||||||||||
|
|
|
|
|
|
|
|
|
|
|
| |||||||||||||
End of Period | $ | 396,276,525 | $ | 466,613,558 | $ | 71,407,365 | $ | 79,844,907 | $ | 152,719,444 | $ | 150,083,183 | ||||||||||||
|
|
|
|
|
|
|
|
|
|
|
| |||||||||||||
Accumulated Net Investment Income (Loss), End of Period | $ | (562,821 | ) | $ | (562,787 | ) | $ | (192,954 | ) | $ | (214,429 | ) | $ | 190,650 | $ | 190,857 | ||||||||
|
|
|
|
|
|
|
|
|
|
|
| |||||||||||||
See Notes to Financial Statements.
156
STATEMENTS OF CHANGES IN NET ASSETS
RIDGEWORTH FUNDS For the Periods Indicated
| High Grade Municipal Bond Fund | High Income Fund | Intermediate Bond Fund | ||||||||||||||||||||||
| 04/01/12- 03/31/13 | 04/01/11- 03/31/12 | 04/01/12- 03/31/13 | 04/01/11- 03/31/12 | 04/01/12- 03/31/13 | 04/01/11- 03/31/12 | |||||||||||||||||||
Operations: | ||||||||||||||||||||||||
Net Investment Income | $ | 1,567,817 | $ | 1,660,145 | $ | 51,100,174 | $ | 39,781,312 | $ | 18,266,339 | $ | 25,199,528 | ||||||||||||
Net Realized Gain (Loss) | 1,043,022 | 2,029,706 | 9,708,279 | (2,461,098 | ) | 37,775,410 | 50,404,145 | |||||||||||||||||
Net Change in Unrealized Appreciation (Depreciation) | 1,055,712 | 2,771,486 | 41,072,116 | (20,230,956 | ) | (19,448,314 | ) | 4,126,410 | ||||||||||||||||
|
|
|
|
|
|
|
|
|
|
|
| |||||||||||||
Change in Net Assets from Operations | 3,666,551 | 6,461,337 | 101,880,569 | 17,089,258 | 36,593,435 | 79,730,083 | ||||||||||||||||||
|
|
|
|
|
|
|
|
|
|
|
| |||||||||||||
Dividends and Distributions to Shareholders: | ||||||||||||||||||||||||
Net Investment Income: | ||||||||||||||||||||||||
I Shares | (1,324,687 | ) | (1,428,088 | ) | (42,786,055 | ) | (32,588,069 | ) | (18,296,426 | ) | (24,939,559 | ) | ||||||||||||
A Shares | (243,149 | ) | (232,314 | ) | (6,857,685 | ) | (6,489,630 | ) | (162,141 | ) | (231,737 | ) | ||||||||||||
R Shares | — | — | (1,256,539 | ) | (1,187,832 | ) | (698 | ) | (10,885 | ) | ||||||||||||||
Net Realized Gains: | ||||||||||||||||||||||||
I Shares | (1,469,635 | ) | (95,027 | ) | — | (4,443,437 | ) | (30,465,039 | ) | (37,936,794 | ) | |||||||||||||
A Shares | (275,382 | ) | (16,625 | ) | — | (874,159 | ) | (344,694 | ) | (412,228 | ) | |||||||||||||
R Shares | — | — | — | (178,289 | ) | (775 | ) | (22,701 | ) | |||||||||||||||
|
|
|
|
|
|
|
|
|
|
|
| |||||||||||||
Total Dividends and Distributions | (3,312,853 | ) | (1,772,054 | ) | (50,900,279 | ) | (45,761,416 | ) | (49,269,773 | ) | (63,553,904 | ) | ||||||||||||
|
|
|
|
|
|
|
|
|
|
|
| |||||||||||||
Change in Net Assets from Capital Transactions | 14,781,785 | (9,179,229 | ) | 180,698,581 | 243,912,524 | (240,973,715 | ) | (129,640,910 | ) | |||||||||||||||
|
|
|
|
|
|
|
|
|
|
|
| |||||||||||||
Change in Net Assets | 15,135,483 | (4,489,946 | ) | 231,678,871 | 215,240,366 | (253,650,053 | ) | (113,464,731 | ) | |||||||||||||||
|
|
|
|
|
|
|
|
|
|
|
| |||||||||||||
Net Assets: | ||||||||||||||||||||||||
Beginning of Period | 51,118,668 | 55,608,614 | 696,152,921 | 480,912,555 | 1,206,275,930 | 1,319,740,661 | ||||||||||||||||||
|
|
|
|
|
|
|
|
|
|
|
| |||||||||||||
End of Period | $ | 66,254,151 | $ | 51,118,668 | $ | 927,831,792 | $ | 696,152,921 | $ | 952,625,877 | $ | 1,206,275,930 | ||||||||||||
|
|
|
|
|
|
|
|
|
|
|
| |||||||||||||
Accumulated Net Investment Income (Loss), End of Period | $ | (7,143 | ) | $ | (7,124 | ) | $ | (350,046 | ) | $ | (351,835 | ) | $ | (1,172,775 | ) | $ | (1,845,583 | ) | ||||||
|
|
|
|
|
|
|
|
|
|
|
| |||||||||||||
See Notes to Financial Statements.
157
STATEMENTS OF CHANGES IN NET ASSETS
RIDGEWORTH FUNDS For the Periods Indicated
| Investment Grade Tax-Exempt Bond Fund | Limited Duration Fund | Limited-Term Federal Mortgage Securities Fund | ||||||||||||||||||||||
| 04/01/12- 03/31/13 | 04/01/11- 03/31/12 | 04/01/12- 03/31/13 | 04/01/11- 03/31/12 | 04/01/12- 03/31/13 | 04/01/11- 03/31/12 | |||||||||||||||||||
Operations: | ||||||||||||||||||||||||
Net Investment Income | $ | 20,256,618 | $ | 21,754,560 | $ | 56,456 | $ | 132,390 | $ | 22,778 | $ | 379,838 | ||||||||||||
Net Realized Gain | 19,891,403 | 31,174,794 | 39,606 | 27,008 | 1,250,502 | 1,648,219 | ||||||||||||||||||
Net Change in Unrealized Appreciation (Depreciation) | 8,822,011 | 38,646,859 | 19,238 | (61,977 | ) | (599,719 | ) | 830,750 | ||||||||||||||||
|
|
|
|
|
|
|
|
|
|
|
| |||||||||||||
Change in Net Assets from Operations | 48,970,032 | 91,576,213 | 115,300 | 97,421 | 673,561 | 2,858,807 | ||||||||||||||||||
|
|
|
|
|
|
|
|
|
|
|
| |||||||||||||
Dividends and Distributions to Shareholders: | ||||||||||||||||||||||||
Net Investment Income: | ||||||||||||||||||||||||
I Shares | (19,608,181 | ) | (21,017,875 | ) | (41,881 | ) | (112,879 | ) | (274,801 | ) | (664,764 | ) | ||||||||||||
A Shares | (651,933 | ) | (736,816 | ) | — | — | (42,708 | ) | (126,463 | ) | ||||||||||||||
C Shares | — | — | — | — | (41,189 | ) | (86,322 | ) | ||||||||||||||||
Net Realized Gains: | ||||||||||||||||||||||||
I Shares | (30,115,855 | ) | (6,670,907 | ) | — | — | — | — | ||||||||||||||||
A Shares | (1,134,849 | ) | (268,548 | ) | — | — | — | — | ||||||||||||||||
|
|
|
|
|
|
|
|
|
|
|
| |||||||||||||
Total Dividends and Distributions | (51,510,818 | ) | (28,694,146 | )�� | (41,881 | ) | (112,879 | ) | (358,698 | ) | (877,549 | ) | ||||||||||||
|
|
|
|
|
|
|
|
|
|
|
| |||||||||||||
Change in Net Assets from Capital Transactions | 33,200,723 | (173,273,979 | ) | (6,718,359 | ) | (5,865,103 | ) | (21,495,655 | ) | (4,458,707 | ) | |||||||||||||
|
|
|
|
|
|
|
|
|
|
|
| |||||||||||||
Change in Net Assets | 30,659,937 | (110,391,912 | ) | (6,644,940 | ) | (5,880,561 | ) | (21,180,792 | ) | (2,477,449 | ) | |||||||||||||
|
|
|
|
|
|
|
|
|
|
|
| |||||||||||||
Net Assets: | ||||||||||||||||||||||||
Beginning of Period | 988,469,117 | 1,098,861,029 | 16,002,349 | 21,882,910 | 38,342,646 | 40,820,095 | ||||||||||||||||||
|
|
|
|
|
|
|
|
|
|
|
| |||||||||||||
End of Period | $ | 1,019,129,054 | $ | 988,469,117 | $ | 9,357,409 | $ | 16,002,349 | $ | 17,161,854 | $ | 38,342,646 | ||||||||||||
|
|
|
|
|
|
|
|
|
|
|
| |||||||||||||
Accumulated Net Investment Income (Loss), End of Period | $ | (227,700 | ) | $ | (224,204 | ) | $ | (1,856 | ) | $ | (2,487 | ) | $ | (19,256 | ) | $ | (36,534 | ) | ||||||
|
|
|
|
|
|
|
|
|
|
|
| |||||||||||||
See Notes to Financial Statements.
158
STATEMENTS OF CHANGES IN NET ASSETS
RIDGEWORTH FUNDS For the Periods Indicated
| North Carolina Tax-Exempt Bond Fund | Seix Floating Rate High Income Fund | Seix High Yield Fund | ||||||||||||||||||||||
| 04/01/12- 03/31/13 | 04/01/11- 03/31/12 | 04/01/12- 03/31/13 | 04/01/11- 03/31/12 | 04/01/12- 03/31/13 | 04/01/11- 03/31/12 | |||||||||||||||||||
Operations: | ||||||||||||||||||||||||
Net Investment Income | $ | 1,486,954 | $ | 1,660,194 | $ | 215,111,306 | $ | 205,885,567 | $ | 133,070,532 | $ | 136,249,830 | ||||||||||||
Net Realized Gain (Loss) | 1,975,936 | 772,901 | 18,424,010 | (42,456,428 | ) | 53,623,005 | 14,340,890 | |||||||||||||||||
Net Change in Unrealized Appreciation (Depreciation) | (929,051 | ) | 3,150,616 | 78,561,655 | (72,504,487 | ) | 63,484,472 | (66,538,577 | ) | |||||||||||||||
|
|
|
|
|
|
|
|
|
|
|
| |||||||||||||
Change in Net Assets from Operations | 2,533,839 | 5,583,711 | 312,096,971 | 90,924,652 | 250,178,009 | 84,052,143 | ||||||||||||||||||
|
|
|
|
|
|
|
|
|
|
|
| |||||||||||||
Dividends and Distributions to Shareholders: | ||||||||||||||||||||||||
Net Investment Income: | ||||||||||||||||||||||||
I Shares | (1,467,922 | ) | (1,637,049 | ) | (198,173,277 | ) | (187,063,784 | ) | (128,076,933 | ) | (133,095,538 | ) | ||||||||||||
A Shares | (19,014 | ) | (23,345 | ) | (2,386,027 | ) | (3,160,271 | ) | (3,752,431 | ) | (2,350,113 | ) | ||||||||||||
C Shares | — | — | (1,259,361 | ) | (1,231,363 | ) | — | — | ||||||||||||||||
R Shares | — | — | — | — | (139,203 | ) | (182,095 | ) | ||||||||||||||||
|
|
|
|
|
|
|
|
|
|
|
| |||||||||||||
Total Dividends and Distributions | (1,486,936 | ) | (1,660,394 | ) | (201,818,665 | ) | (191,455,418 | ) | (131,968,567 | ) | (135,627,746 | ) | ||||||||||||
|
|
|
|
|
|
|
|
|
|
|
| |||||||||||||
Change in Net Assets from Capital Transactions | (190,751 | ) | (4,943,726 | ) | 2,309,433,271 | 430,833,930 | (414,422,342 | ) | 452,412,851 | |||||||||||||||
|
|
|
|
|
|
|
|
|
|
|
| |||||||||||||
Change in Net Assets | 856,152 | (1,020,409 | ) | 2,419,711,577 | 330,303,164 | (296,212,900 | ) | 400,837,248 | ||||||||||||||||
|
|
|
|
|
|
|
|
|
|
|
| |||||||||||||
Net Assets: | ||||||||||||||||||||||||
Beginning of Period | 51,045,067 | 52,065,476 | 3,500,668,164 | 3,170,365,000 | 2,164,068,301 | 1,763,231,053 | ||||||||||||||||||
|
|
|
|
|
|
|
|
|
|
|
| |||||||||||||
End of Period | $ | 51,901,219 | $ | 51,045,067 | $ | 5,920,379,741 | $ | 3,500,668,164 | $ | 1,867,855,401 | $ | 2,164,068,301 | ||||||||||||
|
|
|
|
|
|
|
|
|
|
|
| |||||||||||||
Accumulated Net Investment Income (Loss), End of Period | $ | (63,078 | ) | $ | (63,096 | ) | $ | 23,943 | $ | (1,832,220 | ) | $ | (407,000 | ) | $ | 174,549 | ||||||||
|
|
|
|
|
|
|
|
|
|
|
| |||||||||||||
See Notes to Financial Statements.
159
STATEMENTS OF CHANGES IN NET ASSETS
RIDGEWORTH FUNDS For the Periods Indicated
| Short-Term Bond Fund | Short-Term Municipal Bond Fund | Short-Term U.S. Treasury Securities Fund | ||||||||||||||||||||||
| 04/01/12- 03/31/13 | 04/01/11- 03/31/12 | 04/01/12- 03/31/13 | 04/01/11- 03/31/12 | 04/01/12- 03/31/13 | 04/01/11- 03/31/12 | |||||||||||||||||||
Operations: | ||||||||||||||||||||||||
Net Investment Income | $ | 3,481,845 | $ | 6,364,781 | $ | 54,074 | $ | 612,455 | $ | 41,075 | $ | 154,220 | ||||||||||||
Net Realized Gain | 4,460,680 | 749,215 | 585,879 | 1,614,041 | 36,023 | 276,128 | ||||||||||||||||||
Net Change in Unrealized Appreciation (Depreciation) | (3,615,526 | ) | 924,674 | (323,208 | ) | 96,893 | (92,516 | ) | (223,465 | ) | ||||||||||||||
|
|
|
|
|
|
|
|
|
|
|
| |||||||||||||
Change in Net Assets from Operations | 4,326,999 | 8,038,670 | 316,745 | 2,323,389 | (15,418 | ) | 206,883 | |||||||||||||||||
|
|
|
|
|
|
|
|
|
|
|
| |||||||||||||
Dividends and Distributions to Shareholders: | ||||||||||||||||||||||||
Net Investment Income: | ||||||||||||||||||||||||
I Shares | (3,498,056 | ) | (6,773,468 | ) | (40,271 | ) | (501,407 | ) | (29,693 | ) | (117,918 | ) | ||||||||||||
A Shares | (29,322 | ) | (66,609 | ) | (13,801 | ) | (111,048 | ) | (9,848 | ) | (31,254 | ) | ||||||||||||
C Shares | (14,318 | ) | (34,750 | ) | — | — | (1,520 | ) | (5,332 | ) | ||||||||||||||
Net Realized Gains: | ||||||||||||||||||||||||
I Shares | — | — | (703,504 | ) | (224,417 | ) | (12,659 | ) | (102,832 | ) | ||||||||||||||
A Shares | — | — | (317,101 | ) | (51,598 | ) | (6,894 | ) | (50,219 | ) | ||||||||||||||
C Shares | — | — | — | — | (17,222 | ) | (114,078 | ) | ||||||||||||||||
|
|
|
|
|
|
|
|
|
|
|
| |||||||||||||
Total Dividends and Distributions | (3,541,696 | ) | (6,874,827 | ) | (1,074,677 | ) | (888,470 | ) | (77,836 | ) | (421,633 | ) | ||||||||||||
|
|
|
|
|
|
|
|
|
|
|
| |||||||||||||
Change in Net Assets from Capital Transactions | (234,247,904 | ) | (40,311,907 | ) | 6,172,270 | (17,415,381 | ) | (7,571,951 | ) | (16,033,722 | ) | |||||||||||||
|
|
|
|
|
|
|
|
|
|
|
| |||||||||||||
Change in Net Assets | 2,333,462,601 | (39,148,064 | ) | 5,414,338 | (15,980,462 | ) | (7,665,205 | ) | (16,248,472 | ) | ||||||||||||||
|
|
|
|
|
|
|
|
|
|
|
| |||||||||||||
Net Assets: | ||||||||||||||||||||||||
Beginning of Period | 316,341,168 | 355,489,232 | 9,401,219 | 25,381,681 | 19,887,150 | 36,135,622 | ||||||||||||||||||
|
|
|
|
|
|
|
|
|
|
|
| |||||||||||||
End of Period | $ | 82,878,567 | $ | 316,341,168 | $ | 14,815,557 | $ | 9,401,219 | $ | 12,221,945 | $ | 19,887,150 | ||||||||||||
|
|
|
|
|
|
|
|
|
|
|
| |||||||||||||
Accumulated Net Investment Income (Loss), End of Period | $ | (1,347 | ) | $ | — | $ | (1,452 | ) | $ | (12,480 | ) | $ | (100 | ) | $ | (104 | ) | |||||||
|
|
|
|
|
|
|
|
|
|
|
| |||||||||||||
See Notes to Financial Statements.
160
STATEMENTS OF CHANGES IN NET ASSETS
RIDGEWORTH FUNDS For the Periods Indicated
| Total Return Bond Fund | Ultra-Short Bond Fund | U.S. Government Securities Fund | ||||||||||||||||||||||
| 04/01/12- 03/31/13 | 04/01/11- 03/31/12 | 04/01/12- 03/31/13 | 04/01/11- 03/31/12 | 04/01/12- 03/31/13 | 04/01/11- 03/31/12 | |||||||||||||||||||
Operations: | ||||||||||||||||||||||||
Net Investment Income | $ | 20,831,585 | $ | 18,574,714 | $ | 1,135,594 | $ | 1,246,231 | $ | 185,915 | $ | 568,029 | ||||||||||||
Net Realized Gain | 21,606,898 | 40,026,027 | 566,410 | 231,460 | 767,150 | 3,356,022 | ||||||||||||||||||
Net Change in Unrealized Appreciation (Depreciation) | 2,564,055 | 10,939,669 | (6,011 | ) | (5,941 | ) | 30,778 | 167,329 | ||||||||||||||||
|
|
|
|
|
|
|
|
|
|
|
| |||||||||||||
Change in Net Assets from Operations | 45,002,538 | 69,540,410 | 1,695,993 | 1,471,750 | 983,843 | 4,091,380 | ||||||||||||||||||
|
|
|
|
|
|
|
|
|
|
|
| |||||||||||||
Dividends and Distributions to Shareholders: | ||||||||||||||||||||||||
Net Investment Income: | ||||||||||||||||||||||||
I Shares | (21,920,205 | ) | (26,166,832 | ) | (1,236,755 | ) | (1,418,011 | ) | (181,707 | ) | (542,376 | ) | ||||||||||||
A Shares | (863,304 | ) | (818,195 | ) | — | — | (4,244 | ) | (18,362 | ) | ||||||||||||||
C Shares | — | — | — | — | — | (7,178 | ) | |||||||||||||||||
R Shares | (595,142 | ) | (198,714 | ) | — | — | — | — | ||||||||||||||||
Net Realized Gains: | ||||||||||||||||||||||||
I Shares | (22,724,839 | ) | (18,916,538 | ) | — | — | (1,742,333 | ) | (2,889,258 | ) | ||||||||||||||
A Shares | (979,427 | ) | (708,013 | ) | — | — | (77,637 | ) | (125,005 | ) | ||||||||||||||
C Shares | — | — | — | — | (96,769 | ) | (156,535 | ) | ||||||||||||||||
R Shares | (1,094,431 | ) | (190,664 | ) | — | — | — | — | ||||||||||||||||
|
|
|
|
|
|
|
|
|
|
|
| |||||||||||||
Total Dividends and Distributions | (48,177,348 | ) | (46,998,956 | ) | (1,236,755 | ) | (1,418,011 | ) | (2,102,690 | ) | (3,738,714 | ) | ||||||||||||
|
|
|
|
|
|
|
|
|
|
|
| |||||||||||||
Change in Net Assets from Capital Transactions | 269,491,980 | 332,979,324 | (3,851,548 | ) | (3,232,562 | ) | (4,378,712 | ) | (8,541,505 | ) | ||||||||||||||
|
|
|
|
|
|
|
|
|
|
|
| |||||||||||||
Change in Net Assets | 266,317,170 | 355,520,778 | (3,392,310 | ) | (3,178,823 | ) | (5,497,559 | ) | (8,188,839 | ) | ||||||||||||||
|
|
|
|
|
|
|
|
|
|
|
| |||||||||||||
Net Assets: | ||||||||||||||||||||||||
Beginning of Period | 1,060,886,182 | 705,365,404 | 112,616,604 | 115,795,427 | 44,951,568 | 53,140,407 | ||||||||||||||||||
|
|
|
|
|
|
|
|
|
|
|
| |||||||||||||
End of Period | $ | 1,327,203,352 | $ | 1,060,886,182 | $ | 109,224,294 | $ | 112,616,604 | $ | 39,454,009 | $ | 44,951,568 | ||||||||||||
|
|
|
|
|
|
|
|
|
|
|
| |||||||||||||
Accumulated Net Investment Income (Loss), End of Period | $ | (1,397,738 | ) | $ | (1,977,807 | ) | $ | (2,449 | ) | $ | — | $ | (78 | ) | $ | — | ||||||||
|
|
|
|
|
|
|
|
|
|
|
| |||||||||||||
See Notes to Financial Statements.
161
STATEMENTS OF CHANGES IN NET ASSETS
RIDGEWORTH FUNDS For the Periods Indicated
| U.S. Government Securities Ultra-Short Bond Fund | Virginia Intermediate Municipal Bond Fund | |||||||||||||||
| 04/01/12- 03/31/13 | 04/01/11- 03/31/12 | 04/01/12- 03/31/13 | 04/01/11- 03/31/12 | |||||||||||||
Operations: | ||||||||||||||||
Net Investment Income | $ | 6,719,005 | $ | 9,577,397 | $ | 4,647,658 | $ | 5,227,681 | ||||||||
Net Realized Gain | 14,982,909 | 7,237,726 | 3,083,203 | 2,209,535 | ||||||||||||
Net Change in Unrealized Appreciation (Depreciation) | 2,192,598 | 14,153,073 | (1,915,193 | ) | 6,562,584 | |||||||||||
|
|
|
|
|
|
|
| |||||||||
Change in Net Assets from Operations | 23,894,512 | 30,968,196 | 5,815,668 | 13,999,800 | ||||||||||||
|
|
|
|
|
|
|
| |||||||||
Dividends and Distributions to Shareholders: | ||||||||||||||||
Net Investment Income: | ||||||||||||||||
I Shares | (18,391,336 | ) | (18,399,183 | ) | (4,325,538 | ) | (4,852,332 | ) | ||||||||
A Shares | — | — | (322,474 | ) | (376,121 | ) | ||||||||||
Net Realized Gains: | ||||||||||||||||
I Shares | — | — | (2,258,696 | ) | (1,576,153 | ) | ||||||||||
A Shares | — | — | (170,718 | ) | (126,821 | ) | ||||||||||
|
|
|
|
|
|
|
| |||||||||
Total Dividends and Distributions | (18,391,336 | ) | (18,399,183 | ) | (7,077,426 | ) | (6,931,427 | ) | ||||||||
|
|
|
|
|
|
|
| |||||||||
Change in Net Assets from Capital Transactions | 292,644,954 | 372,403,213 | (2,961,697 | ) | (24,967,805 | ) | ||||||||||
|
|
|
|
|
|
|
| |||||||||
Change in Net Assets | 298,148,130 | 384,972,226 | (4,223,455 | ) | (17,899,432 | ) | ||||||||||
|
|
|
|
|
|
|
| |||||||||
Net Assets: | ||||||||||||||||
Beginning of Period | 2,033,764,939 | 1,648,792,713 | 160,108,024 | 178,007,456 | ||||||||||||
|
|
|
|
|
|
|
| |||||||||
End of Period | $ | 2,331,913,069 | $ | 2,033,764,939 | $ | 155,884,569 | $ | 160,108,024 | ||||||||
|
|
|
|
|
|
|
| |||||||||
Accumulated Net Investment Income (Loss), End of Period | $ | (3,259 | ) | $ | (1,812 | ) | $ | 19,519 | $ | 19,873 | ||||||
|
|
|
|
|
|
|
| |||||||||
See Notes to Financial Statements.
162
RIDGEWORTH FUNDS Selected Data For a Share of Beneficial Interest Outstanding Throughout the Periods Indicated.
| Net Asset Value, Beginning of Period | Net Investment Income (Loss) | Net Realized and Unrealized Gains (Losses) on Investments | Total from Operations | Dividends from Net Investment Income | Distributions from Tax Return of Capital | Distributions from Realized Capital Gains | Total Dividends and Distributions | Net Asset Value, End of Period | Net Assets End of Period (000) | Total Return(a) | Ratio of Net Expenses to Average Net Assets | Ratio of Expenses to Average Net Assets (Excluding Waivers and Reimbursements) | Ratio of Net Investment Income to Average Net Assets | Portfolio Turnover Rate | ||||||||||||||||||||||||||||||||||||||||||||||
Core Bond Fund | ||||||||||||||||||||||||||||||||||||||||||||||||||||||||||||
I Shares | ||||||||||||||||||||||||||||||||||||||||||||||||||||||||||||
Year Ended March 31, 2013 | $11.10 | $0.15 | (b) | $0.24 | $0.39 | $(0.20 | ) | $— | $(0.13 | ) | $(0.33 | ) | $11.16 | $370,455 | 3.53 | % | 0.38 | % | 0.38 | % | 1.33 | % | 151 | % | ||||||||||||||||||||||||||||||||||||
Year Ended March 31, 2012 | 11.00 | 0.24 | (b) | 0.81 | 1.05 | (0.27 | ) | — | (0.68 | ) | (0.95 | ) | 11.10 | 439,017 | 9.65 | 0.48 | 0.48 | 2.15 | 211 | |||||||||||||||||||||||||||||||||||||||||
Year Ended March 31, 2011 | 11.42 | 0.36 | (b) | 0.09 | 0.45 | (0.25 | ) | (0.10 | ) | (0.52 | ) | (0.87 | ) | 11.00 | 295,931 | 3.91 | 0.60 | 0.60 | 3.11 | 119 | (c) | |||||||||||||||||||||||||||||||||||||||
Year Ended March 31, 2010 | 10.93 | 0.43 | 0.46 | 0.89 | (0.39 | ) | — | (0.01 | ) | (0.40 | ) | 11.42 | 372,232 | 8.26 | 0.57 | 0.57 | 3.89 | 99 | ||||||||||||||||||||||||||||||||||||||||||
Year Ended March 31, 2009 | 10.74 | 0.46 | 0.24 | 0.70 | (0.51 | ) | — | — | (0.51 | ) | 10.93 | 389,205 | 6.78 | 0.56 | 0.56 | 4.38 | 208 | |||||||||||||||||||||||||||||||||||||||||||
A Shares | ||||||||||||||||||||||||||||||||||||||||||||||||||||||||||||
Year Ended March 31, 2013 | 11.10 | 0.11 | (b) | 0.24 | 0.35 | (0.16 | ) | — | (0.13 | ) | (0.29 | ) | 11.16 | 20,687 | 3.20 | 0.69 | 0.70 | 1.02 | 151 | |||||||||||||||||||||||||||||||||||||||||
Year Ended March 31, 2012 | 11.00 | 0.21 | (b) | 0.80 | 1.01 | (0.23 | ) | — | (0.68 | ) | (0.91 | ) | 11.10 | 21,644 | 9.29 | 0.82 | 0.82 | 1.84 | 211 | |||||||||||||||||||||||||||||||||||||||||
Year Ended March 31, 2011 | 11.42 | 0.35 | (b) | 0.06 | 0.41 | (0.21 | ) | (0.10 | ) | (0.52 | ) | (0.83 | ) | 11.00 | 19,087 | 3.61 | 0.87 | 0.87 | 3.03 | 119 | (c) | |||||||||||||||||||||||||||||||||||||||
Year Ended March 31, 2010 | 10.93 | 0.41 | 0.45 | 0.86 | (0.36 | ) | — | (0.01 | ) | (0.37 | ) | 11.42 | 26,790 | 7.91 | 0.89 | 0.89 | 3.59 | 99 | ||||||||||||||||||||||||||||||||||||||||||
Year Ended March 31, 2009 | 10.74 | 0.43 | 0.24 | 0.67 | (0.48 | ) | — | — | (0.48 | ) | 10.93 | 25,996 | 6.46 | 0.86 | 0.86 | 4.10 | 208 | |||||||||||||||||||||||||||||||||||||||||||
R Shares | ||||||||||||||||||||||||||||||||||||||||||||||||||||||||||||
Year Ended March 31, 2013 | 11.10 | 0.10 | (b) | 0.24 | 0.34 | (0.14 | ) | — | (0.13 | ) | (0.27 | ) | 11.17 | 5,135 | 3.15 | 0.84 | 0.84 | 0.87 | 151 | |||||||||||||||||||||||||||||||||||||||||
Year Ended March 31, 2012 | 11.01 | 0.18 | (b) | 0.78 | 0.96 | (0.19 | ) | — | (0.68 | ) | (0.87 | ) | 11.10 | 5,952 | 8.83 | 1.16 | 1.16 | 1.55 | 211 | |||||||||||||||||||||||||||||||||||||||||
Year Ended March 31, 2011 | 11.42 | 0.31 | (b) | 0.08 | 0.39 | (0.18 | ) | (0.10 | ) | (0.52 | ) | (0.80 | ) | 11.01 | 6,648 | 3.41 | 1.20 | 1.20 | 2.71 | 119 | (c) | |||||||||||||||||||||||||||||||||||||||
Year Ended March 31, 2010 | 10.93 | 0.37 | 0.45 | 0.82 | (0.32 | ) | — | (0.01 | ) | (0.33 | ) | 11.42 | 9,616 | 7.54 | 1.23 | 1.23 | 3.23 | 99 | ||||||||||||||||||||||||||||||||||||||||||
Year Ended March 31, 2009 | 10.75 | 0.37 | 0.22 | 0.59 | (0.41 | ) | — | — | (0.41 | ) | 10.93 | 11,268 | 5.62 | 1.55 | 1.55 | 3.37 | 208 | |||||||||||||||||||||||||||||||||||||||||||
Corporate Bond Fund | ||||||||||||||||||||||||||||||||||||||||||||||||||||||||||||
I Shares | ||||||||||||||||||||||||||||||||||||||||||||||||||||||||||||
Year Ended March 31, 2013 | 9.35 | 0.32 | (b) | 0.30 | 0.62 | (0.32 | ) | — | (0.35 | ) | (0.67 | ) | 9.30 | 51,828 | 6.71 | 0.60 | 0.61 | 3.36 | 58 | |||||||||||||||||||||||||||||||||||||||||
Year Ended March 31, 2012 | 9.59 | 0.39 | (b) | 0.46 | 0.85 | (0.39 | ) | — | (0.70 | ) | (1.09 | ) | 9.35 | 57,203 | 9.10 | 0.61 | 0.61 | 3.98 | 88 | |||||||||||||||||||||||||||||||||||||||||
Year Ended March 31, 2011 | 9.63 | 0.45 | (b) | 0.20 | 0.65 | (0.45 | ) | — | (0.24 | ) | (0.69 | ) | 9.59 | 63,132 | 6.92 | 0.52 | 0.52 | 4.56 | 45 | (c) | ||||||||||||||||||||||||||||||||||||||||
Year Ended March 31, 2010 | 8.53 | 0.46 | (b) | 1.09 | 1.55 | (0.45 | ) | — | — | (0.45 | ) | 9.63 | 157,739 | 18.49 | 0.50 | 0.50 | 4.86 | 75 | ||||||||||||||||||||||||||||||||||||||||||
Year Ended March 31, 2009 | 9.60 | 0.49 | (b) | (0.86 | ) | (0.37 | ) | (0.70 | ) | — | — | (0.70 | ) | 8.53 | 39,881 | (4.10 | ) | 0.73 | 0.74 | 5.29 | 357 | |||||||||||||||||||||||||||||||||||||||
A Shares | ||||||||||||||||||||||||||||||||||||||||||||||||||||||||||||
Year Ended March 31, 2013 | 9.40 | 0.29 | (b) | 0.30 | 0.59 | (0.29 | ) | — | (0.35 | ) | (0.64 | ) | 9.35 | 4,020 | 6.39 | 0.88 | 0.88 | 3.06 | 58 | |||||||||||||||||||||||||||||||||||||||||
Year Ended March 31, 2012 | 9.64 | 0.36 | (b) | 0.46 | 0.82 | (0.36 | ) | — | (0.70 | ) | (1.06 | ) | 9.40 | 4,325 | 8.78 | 0.88 | 0.88 | 3.68 | 88 | |||||||||||||||||||||||||||||||||||||||||
Year Ended March 31, 2011 | 9.67 | 0.42 | (b) | 0.21 | 0.63 | (0.42 | ) | — | (0.24 | ) | (0.66 | ) | 9.64 | 2,198 | 6.67 | 0.83 | 0.83 | 4.25 | 45 | (c) | ||||||||||||||||||||||||||||||||||||||||
Year Ended March 31, 2010 | 8.57 | 0.43 | (b) | 1.10 | 1.53 | (0.43 | ) | — | — | (0.43 | ) | 9.67 | 4,524 | 18.05 | 0.80 | 0.80 | 4.52 | 75 | ||||||||||||||||||||||||||||||||||||||||||
Year Ended March 31, 2009 | 9.64 | 0.45 | (b) | (0.85 | ) | (0.40 | ) | (0.67 | ) | — | — | (0.67 | ) | 8.57 | 2,181 | (4.37 | ) | 1.03 | 1.03 | 4.96 | 357 | |||||||||||||||||||||||||||||||||||||||
C Shares | ||||||||||||||||||||||||||||||||||||||||||||||||||||||||||||
Year Ended March 31, 2013 | 9.35 | 0.23 | (b) | 0.30 | 0.53 | (0.23 | ) | — | (0.35 | ) | (0.58 | ) | 9.30 | 15,558 | 5.67 | 1.57 | 1.58 | 2.39 | 58 | |||||||||||||||||||||||||||||||||||||||||
Year Ended March 31, 2012 | 9.59 | 0.29 | (b) | 0.46 | 0.75 | (0.29 | ) | — | (0.70 | ) | (0.99 | ) | 9.35 | 18,317 | 8.05 | 1.58 | 1.58 | 3.00 | 88 | |||||||||||||||||||||||||||||||||||||||||
Year Ended March 31, 2011 | 9.63 | 0.36 | (b) | 0.20 | 0.56 | (0.36 | ) | — | (0.24 | ) | (0.60 | ) | 9.59 | 16,193 | 5.87 | 1.50 | 1.50 | 3.64 | 45 | (c) | ||||||||||||||||||||||||||||||||||||||||
Year Ended March 31, 2010 | 8.53 | 0.36 | 1.10 | 1.46 | (0.36 | ) | — | — | (0.36 | ) | 9.63 | 18,885 | 17.32 | 1.50 | 1.50 | 3.89 | 75 | |||||||||||||||||||||||||||||||||||||||||||
Year Ended March 31, 2009 | 9.61 | 0.40 | (b) | (0.87 | ) | (0.47 | ) | (0.61 | ) | — | — | (0.61 | ) | 8.53 | 18,171 | (5.16 | ) | 1.73 | 1.74 | 4.32 | 357 | |||||||||||||||||||||||||||||||||||||||
Georgia Tax-Exempt Bond Fund |
| |||||||||||||||||||||||||||||||||||||||||||||||||||||||||||
I Shares | ||||||||||||||||||||||||||||||||||||||||||||||||||||||||||||
Year Ended March 31, 2013 | 10.55 | 0.34 | (b) | 0.23 | 0.57 | (0.34 | ) | — | — | (0.34 | ) | 10.78 | 148,153 | 5.44 | 0.59 | 0.59 | 3.15 | 50 | ||||||||||||||||||||||||||||||||||||||||||
Year Ended March 31, 2012 | 9.73 | 0.36 | (b) | 0.82 | 1.18 | (0.36 | ) | — | — | (0.36 | ) | 10.55 | 145,803 | 12.33 | 0.62 | 0.62 | 3.55 | 57 | ||||||||||||||||||||||||||||||||||||||||||
Year Ended March 31, 2011 | 10.23 | 0.39 | (b) | (0.50 | ) | (0.11 | ) | (0.39 | ) | — | — | (0.39 | ) | 9.73 | 159,996 | (1.19 | ) | 0.61 | 0.61 | 3.81 | 44 | |||||||||||||||||||||||||||||||||||||||
Year Ended March 31, 2010 | 9.81 | 0.39 | 0.42 | 0.81 | (0.39 | ) | — | — | (0.39 | ) | 10.23 | 205,856 | 8.32 | 0.60 | 0.60 | 3.80 | 45 | |||||||||||||||||||||||||||||||||||||||||||
Year Ended March 31, 2009* | 9.95 | 0.37 | (0.14 | ) | 0.23 | (0.37 | ) | — | — | (0.37 | ) | 9.81 | 163,761 | 2.43 | 0.67 | 0.68 | 3.82 | 63 | ||||||||||||||||||||||||||||||||||||||||||
See Notes to Financial Statements.
163
FINANCIAL HIGHLIGHTS
RIDGEWORTH FUNDS Selected Data For a Share of Beneficial Interest Outstanding Throughout the Periods Indicated.
| Net Asset Value, Beginning of Period | Net Investment Income (Loss) | Net Realized and Unrealized Gains (Losses) on Investments | Total from Operations | Dividends from Net Investment Income | Distributions from Tax Return of Capital | Distributions from Realized Capital Gains | Total Dividends and Distributions | Net Asset Value, End of Period | Net Assets End of Period (000) | Total Return(a) | Ratio of Net Expenses to Average Net Assets | Ratio of Expenses to Average Net Assets (Excluding Waivers and Reimbursements) | Ratio of Net Investment Income to Average Net Assets | Portfolio Turnover Rate | ||||||||||||||||||||||||||||||||||||||||||||||
A Shares | ||||||||||||||||||||||||||||||||||||||||||||||||||||||||||||
Year Ended March 31, 2013 | $10.57 | $0.32 | (b) | $0.23 | $0.55 | $(0.32 | ) | $— | $— | $(0.32 | ) | $10.80 | $4,566 | 5.27 | % | 0.74 | % | 0.74 | % | 2.99 | % | 50 | % | |||||||||||||||||||||||||||||||||||||
Year Ended March 31, 2012 | 9.75 | 0.35 | (b) | 0.82 | 1.17 | (0.35 | ) | — | — | (0.35 | ) | 10.57 | 4,280 | 12.14 | 0.77 | 0.77 | 3.39 | 57 | ||||||||||||||||||||||||||||||||||||||||||
Year Ended March 31, 2011 | 10.24 | 0.37 | (b) | (0.49 | ) | (0.12 | ) | (0.37 | ) | — | — | (0.37 | ) | 9.75 | 5,557 | (1.24 | ) | 0.76 | 0.76 | 3.64 | 44 | |||||||||||||||||||||||||||||||||||||||
Year Ended March 31, 2010 | 9.83 | 0.36 | 0.42 | 0.78 | (0.37 | ) | — | — | (0.37 | ) | 10.24 | 10,184 | 8.03 | 0.75 | 0.75 | 3.56 | 45 | |||||||||||||||||||||||||||||||||||||||||||
Year Ended March 31, 2009* | 9.97 | 0.37 | (0.15 | ) | 0.22 | (0.36 | ) | — | — | (0.36 | ) | 9.83 | 2,747 | 2.27 | 0.82 | 0.83 | 3.66 | 63 | ||||||||||||||||||||||||||||||||||||||||||
High Grade Municipal Bond Fund | ||||||||||||||||||||||||||||||||||||||||||||||||||||||||||||
I Shares | ||||||||||||||||||||||||||||||||||||||||||||||||||||||||||||
Year Ended March 31, 2013 | 11.96 | 0.34 | (b) | 0.50 | 0.84 | (0.34 | ) | — | (0.36 | ) | (0.70 | ) | 12.10 | 54,892 | 7.12 | 0.65 | 0.68 | 2.78 | 168 | |||||||||||||||||||||||||||||||||||||||||
Year Ended March 31, 2012 | 10.92 | 0.38 | (b) | 1.07 | 1.45 | (0.38 | ) | — | (0.03 | ) | (0.41 | ) | 11.96 | 42,963 | 13.43 | 0.64 | 0.66 | 3.29 | 218 | |||||||||||||||||||||||||||||||||||||||||
Year Ended March 31, 2011 | 11.15 | 0.44 | (b) | (0.23 | ) | 0.21 | (0.44 | ) | — | — | (0.44 | ) | 10.92 | 47,695 | 1.82 | 0.65 | 0.71 | 3.90 | 122 | |||||||||||||||||||||||||||||||||||||||||
Year Ended March 31, 2010 | 10.49 | 0.42 | 0.66 | 1.08 | (0.42 | ) | — | — | (0.42 | ) | 11.15 | 55,203 | 10.43 | 0.64 | 0.66 | 3.83 | 123 | |||||||||||||||||||||||||||||||||||||||||||
Year Ended March 31, 2009 | 10.80 | 0.38 | (0.31 | ) | 0.07 | (0.38 | ) | — | — | (0.38 | ) | 10.49 | 74,586 | 0.72 | 0.62 | 0.62 | 3.57 | 209 | ||||||||||||||||||||||||||||||||||||||||||
A Shares | ||||||||||||||||||||||||||||||||||||||||||||||||||||||||||||
Year Ended March 31, 2013 | 11.97 | 0.32 | (b) | 0.50 | 0.82 | (0.32 | ) | — | (0.36 | ) | (0.68 | ) | 12.11 | 11,363 | 6.97 | 0.80 | 0.83 | 2.63 | 168 | |||||||||||||||||||||||||||||||||||||||||
Year Ended March 31, 2012 | 10.92 | 0.36 | (b) | 1.08 | 1.44 | (0.36 | ) | — | (0.03 | ) | (0.39 | ) | 11.97 | 8,155 | 13.36 | 0.79 | 0.81 | 3.15 | 218 | |||||||||||||||||||||||||||||||||||||||||
Year Ended March 31, 2011 | 11.15 | 0.42 | (b) | (0.23 | ) | 0.19 | (0.42 | ) | — | — | (0.42 | ) | 10.92 | 7,914 | 1.66 | 0.80 | 0.87 | 3.72 | 122 | |||||||||||||||||||||||||||||||||||||||||
Year Ended March 31, 2010 | 10.49 | 0.40 | 0.66 | 1.06 | (0.40 | ) | — | — | (0.40 | ) | 11.15 | 5,605 | 10.26 | 0.79 | 0.81 | 3.66 | 123 | |||||||||||||||||||||||||||||||||||||||||||
Year Ended March 31, 2009 | 10.80 | 0.37 | (0.31 | ) | 0.06 | (0.37 | ) | — | — | (0.37 | ) | 10.49 | 1,900 | 0.56 | 0.78 | 0.78 | 3.47 | 209 | ||||||||||||||||||||||||||||||||||||||||||
High Income Fund | ||||||||||||||||||||||||||||||||||||||||||||||||||||||||||||
I Shares | ||||||||||||||||||||||||||||||||||||||||||||||||||||||||||||
Year Ended March 31, 2013 | 6.89 | 0.45 | (b) | 0.43 | 0.88 | (0.45 | ) | — | — | (0.45 | ) | 7.32 | 784,870 | 13.17 | 0.74 | 0.75 | 6.33 | 118 | ||||||||||||||||||||||||||||||||||||||||||
Year Ended March 31, 2012 | 7.29 | 0.51 | (b) | (0.32 | ) | 0.19 | (0.52 | ) | — | (0.07 | ) | (0.59 | ) | 6.89 | 576,626 | 3.04 | 0.71 | 0.71 | 7.37 | 148 | ||||||||||||||||||||||||||||||||||||||||
Year Ended March 31, 2011 | 6.77 | 0.50 | (b) | 0.54 | 1.04 | (0.50 | ) | — | (0.02 | ) | (0.52 | ) | 7.29 | 394,690 | 15.83 | 0.70 | 0.70 | 7.10 | 259 | (c) | ||||||||||||||||||||||||||||||||||||||||
Year Ended March 31, 2010 | 4.67 | 0.55 | 2.09 | 2.64 | (0.54 | ) | — | — | (0.54 | ) | 6.77 | 148,252 | 58.65 | 0.70 | 0.72 | 8.97 | 466 | |||||||||||||||||||||||||||||||||||||||||||
Year Ended March 31, 2009 | 6.40 | 0.54 | (1.74 | ) | (1.20 | ) | (0.53 | ) | — | — | (0.53 | ) | 4.67 | 23,995 | (19.40 | ) | 0.70 | 0.76 | 9.67 | 368 | ||||||||||||||||||||||||||||||||||||||||
A Shares | ||||||||||||||||||||||||||||||||||||||||||||||||||||||||||||
Year Ended March 31, 2013 | 6.90 | 0.43 | (b) | 0.42 | 0.85 | (0.43 | ) | — | — | (0.43 | ) | 7.32 | 119,006 | 12.72 | 0.99 | 0.99 | 6.09 | 118 | ||||||||||||||||||||||||||||||||||||||||||
Year Ended March 31, 2012 | 7.29 | 0.49 | (b) | (0.31 | ) | 0.18 | (0.50 | ) | — | (0.07 | ) | (0.57 | ) | 6.90 | 99,210 | 2.74 | 1.00 | 1.00 | 7.09 | 148 | ||||||||||||||||||||||||||||||||||||||||
Year Ended March 31, 2011 | 6.78 | 0.47 | (b) | 0.54 | 1.01 | (0.48 | ) | — | (0.02 | ) | (0.50 | ) | 7.29 | 70,552 | 15.47 | 1.00 | 1.00 | 6.62 | 259 | (c) | ||||||||||||||||||||||||||||||||||||||||
Year Ended March 31, 2010 | 4.68 | 0.53 | 2.09 | 2.62 | (0.52 | ) | — | — | (0.52 | ) | 6.78 | 3,822 | 58.07 | 0.99 | 1.01 | 8.67 | 466 | |||||||||||||||||||||||||||||||||||||||||||
Year Ended March 31, 2009 | 6.41 | 0.52 | (1.74 | ) | (1.22 | ) | (0.51 | ) | — | — | (0.51 | ) | 4.68 | 860 | (19.60 | ) | 0.99 | 1.04 | 8.33 | 368 | ||||||||||||||||||||||||||||||||||||||||
R Shares(d) |
| |||||||||||||||||||||||||||||||||||||||||||||||||||||||||||
Year Ended March 31, 2013 | 6.89 | 0.41 | (b) | 0.43 | 0.84 | (0.41 | ) | — | — | (0.41 | ) | 7.32 | 23,956 | 12.61 | 1.23 | 1.23 | 5.85 | 118 | ||||||||||||||||||||||||||||||||||||||||||
Year Ended March 31, 2012 | 7.29 | 0.47 | (b) | (0.33 | ) | 0.14 | (0.47 | ) | — | (0.07 | ) | (0.54 | ) | 6.89 | 20,317 | 2.25 | 1.35 | 1.35 | 6.76 | 148 | ||||||||||||||||||||||||||||||||||||||||
Year Ended March 31, 2011 | 6.78 | 0.45 | (b) | 0.53 | 0.98 | (0.45 | ) | — | (0.02 | ) | (0.47 | ) | 7.29 | 15,671 | 15.07 | 1.40 | 1.40 | 6.54 | 259 | (c) | ||||||||||||||||||||||||||||||||||||||||
Year Ended March 31, 2010 | 4.67 | 0.51 | 2.10 | 2.61 | (0.50 | ) | — | — | (0.50 | ) | 6.78 | 16,176 | 57.86 | 1.35 | 1.38 | 8.68 | 466 | |||||||||||||||||||||||||||||||||||||||||||
Year Ended March 31, 2009 | 6.40 | 0.49 | (1.74 | ) | (1.25 | ) | (0.48 | ) | — | — | (0.48 | ) | 4.67 | 12,249 | (20.20 | ) | 1.70 | 1.76 | 8.54 | 368 | ||||||||||||||||||||||||||||||||||||||||
Intermediate Bond Fund | ||||||||||||||||||||||||||||||||||||||||||||||||||||||||||||
I Shares | ||||||||||||||||||||||||||||||||||||||||||||||||||||||||||||
Year Ended March 31, 2013 | 10.45 | 0.17 | (b) | 0.16 | 0.33 | (0.17 | ) | — | (0.30 | ) | (0.47 | ) | 10.31 | 942,715 | 3.24 | 0.35 | 0.35 | 1.63 | 116 | |||||||||||||||||||||||||||||||||||||||||
Year Ended March 31, 2012 | 10.35 | 0.22 | (b) | 0.45 | 0.67 | (0.22 | ) | — | (0.35 | ) | (0.57 | ) | 10.45 | 1,194,207 | 6.45 | 0.35 | 0.35 | 2.04 | 139 | |||||||||||||||||||||||||||||||||||||||||
Year Ended March 31, 2011 | 10.53 | 0.29 | (b) | 0.11 | 0.40 | (0.25 | ) | (0.03 | ) | (0.30 | ) | (0.58 | ) | 10.35 | 1,305,914 | 3.75 | 0.34 | 0.34 | 2.73 | 127 | (c) | |||||||||||||||||||||||||||||||||||||||
Year Ended March 31, 2010 | 10.27 | 0.34 | (b) | 0.27 | 0.61 | (0.30 | ) | — | (0.05 | ) | (0.35 | ) | 10.53 | 1,559,191 | 6.08 | 0.31 | 0.31 | 3.24 | 122 | |||||||||||||||||||||||||||||||||||||||||
Year Ended March 31, 2009 | 10.29 | 0.43 | 0.24 | 0.67 | (0.46 | ) | — | (0.23 | ) | (0.69 | ) | 10.27 | 1,071,496 | 6.83 | 0.29 | 0.29 | 4.24 | 217 | ||||||||||||||||||||||||||||||||||||||||||
See Notes to Financial Statements.
164
FINANCIAL HIGHLIGHTS
RIDGEWORTH FUNDS Selected Data For a Share of Beneficial Interest Outstanding Throughout the Periods Indicated.
| Net Asset Value, Beginning of Period | Net Investment Income (Loss) | Net Realized and Unrealized Gains (Losses) on Investments | Total from Operations | Dividends from Net Investment Income | Distributions from Tax Return of Capital | Distributions from Realized Capital Gains | Total Dividends and Distributions | Net Asset Value, End of Period | Net Assets End of Period (000) | Total Return(a) | Ratio of Net Expenses to Average Net Assets | Ratio of Expenses to Average Net Assets (Excluding Waivers and Reimbursements) | Ratio of Net Investment Income to Average Net Assets | Portfolio Turnover Rate | ||||||||||||||||||||||||||||||||||||||||||||||
A Shares | ||||||||||||||||||||||||||||||||||||||||||||||||||||||||||||
Year Ended March 31, 2013 | $10.46 | $0.14 | (b) | $0.15 | $0.29 | $(0.14 | ) | $— | $(0.30 | ) | $(0.44 | ) | $10.31 | $9,878 | 2.85 | % | 0.63 | % | 0.63 | % | 1.34 | % | 116 | % | ||||||||||||||||||||||||||||||||||||
Year Ended March 31, 2012 | 10.35 | 0.19 | (b) | 0.46 | 0.65 | (0.19 | ) | — | (0.35 | ) | (0.54 | ) | 10.46 | 11,320 | 6.26 | 0.62 | 0.62 | 1.75 | 139 | |||||||||||||||||||||||||||||||||||||||||
Year Ended March 31, 2011 | 10.53 | 0.28 | (b) | 0.09 | 0.37 | (0.22 | ) | (0.03 | ) | (0.30 | ) | (0.55 | ) | 10.35 | 12,926 | 3.49 | 0.60 | 0.60 | 2.62 | 127 | (c) | |||||||||||||||||||||||||||||||||||||||
Year Ended March 31, 2010 | 10.27 | 0.31 | (b) | 0.28 | 0.59 | (0.28 | ) | — | (0.05 | ) | (0.33 | ) | 10.53 | 11,916 | 5.83 | 0.55 | 0.55 | 2.96 | 122 | |||||||||||||||||||||||||||||||||||||||||
Year Ended March 31, 2009 | 10.29 | 0.41 | (b) | 0.23 | 0.64 | (0.43 | ) | — | (0.23 | ) | (0.66 | ) | 10.27 | 2,624 | 6.54 | 0.54 | 0.54 | 3.89 | 217 | |||||||||||||||||||||||||||||||||||||||||
R Shares(e) | ||||||||||||||||||||||||||||||||||||||||||||||||||||||||||||
Year Ended March 31, 2013 | 10.45 | 0.11 | (b) | 0.15 | 0.26 | (0.11 | ) | — | (0.30 | ) | (0.41 | ) | 10.30 | 32 | 2.58 | 0.92 | 1.82 | 1.06 | 116 | |||||||||||||||||||||||||||||||||||||||||
Year Ended March 31, 2012 | 10.35 | 0.14 | (b) | 0.45 | 0.59 | (0.14 | ) | — | (0.35 | ) | (0.49 | ) | 10.45 | 749 | 5.72 | 1.04 | 1.04 | 1.36 | 139 | |||||||||||||||||||||||||||||||||||||||||
Year Ended March 31, 2011 | 10.53 | 0.23 | (b) | 0.09 | 0.32 | (0.17 | ) | (0.03 | ) | (0.30 | ) | (0.50 | ) | 10.35 | 901 | 3.03 | 1.10 | 1.10 | 2.13 | 127 | (c) | |||||||||||||||||||||||||||||||||||||||
Year Ended March 31, 2010 | 10.27 | 0.27 | (b) | 0.28 | 0.55 | (0.24 | ) | — | (0.05 | ) | (0.29 | ) | 10.53 | 1,068 | 5.47 | 0.91 | 0.91 | 2.56 | 122 | |||||||||||||||||||||||||||||||||||||||||
Year Ended March 31, 2009 | 10.29 | 0.36 | 0.22 | 0.58 | (0.37 | ) | — | (0.23 | ) | (0.60 | ) | 10.27 | 543 | 5.84 | 1.02 | 1.02 | 3.33 | 217 | ||||||||||||||||||||||||||||||||||||||||||
Investment Grade Tax-Exempt Bond Fund |
| |||||||||||||||||||||||||||||||||||||||||||||||||||||||||||
I Shares | ||||||||||||||||||||||||||||||||||||||||||||||||||||||||||||
Year Ended March 31, 2013 | 12.49 | 0.25 | (b) | 0.35 | 0.60 | (0.25 | ) | — | (0.39 | ) | (0.64 | ) | 12.45 | 982,171 | 4.87 | 0.62 | 0.63 | 1.98 | 151 | |||||||||||||||||||||||||||||||||||||||||
Year Ended March 31, 2012 | 11.65 | 0.29 | (b) | 0.93 | 1.22 | (0.29 | ) | — | (0.09 | ) | (0.38 | ) | 12.49 | 950,629 | 10.62 | 0.61 | 0.61 | 2.38 | 199 | |||||||||||||||||||||||||||||||||||||||||
Year Ended March 31, 2011 | 11.99 | 0.33 | (b) | (0.06 | ) | 0.27 | (0.33 | ) | — | (0.28 | ) | (0.61 | ) | 11.65 | 1,067,672 | 2.22 | 0.57 | 0.57 | 2.71 | 159 | ||||||||||||||||||||||||||||||||||||||||
Year Ended March 31, 2010 | 11.60 | 0.37 | 0.56 | 0.93 | (0.37 | ) | — | (0.17 | ) | (0.54 | ) | 11.99 | 1,037,972 | 8.15 | 0.55 | 0.56 | 3.08 | 169 | ||||||||||||||||||||||||||||||||||||||||||
Year Ended March 31, 2009 | 11.59 | 0.38 | 0.08 | 0.46 | (0.38 | ) | — | (0.07 | ) | (0.45 | ) | 11.60 | 817,297 | 4.12 | 0.54 | 0.55 | 3.30 | 221 | ||||||||||||||||||||||||||||||||||||||||||
A Shares | ||||||||||||||||||||||||||||||||||||||||||||||||||||||||||||
Year Ended March 31, 2013 | 12.50 | 0.23 | (b) | 0.36 | 0.59 | (0.23 | ) | — | (0.39 | ) | (0.62 | ) | 12.47 | 36,958 | 4.75 | 0.82 | 0.87 | 1.78 | 151 | |||||||||||||||||||||||||||||||||||||||||
Year Ended March 31, 2012 | 11.66 | 0.26 | (b) | 0.93 | 1.19 | (0.26 | ) | — | (0.09 | ) | (0.35 | ) | 12.50 | 37,840 | 10.33 | 0.87 | 0.87 | 2.12 | 199 | |||||||||||||||||||||||||||||||||||||||||
Year Ended March 31, 2011 | 12.00 | 0.29 | (b) | (0.06 | ) | 0.23 | (0.29 | ) | — | (0.28 | ) | (0.57 | ) | 11.66 | 31,189 | 1.93 | 0.85 | 0.85 | 2.42 | 159 | ||||||||||||||||||||||||||||||||||||||||
Year Ended March 31, 2010 | 11.61 | 0.34 | 0.56 | 0.90 | (0.34 | ) | — | (0.17 | ) | (0.51 | ) | 12.00 | 24,344 | 7.82 | 0.84 | 0.85 | 2.74 | 169 | ||||||||||||||||||||||||||||||||||||||||||
Year Ended March 31, 2009 | 11.60 | 0.34 | 0.08 | 0.42 | (0.34 | ) | — | (0.07 | ) | (0.41 | ) | 11.61 | 13,819 | 3.81 | 0.84 | 0.84 | 2.97 | 221 | ||||||||||||||||||||||||||||||||||||||||||
Limited Duration Fund |
| |||||||||||||||||||||||||||||||||||||||||||||||||||||||||||
I Shares | ||||||||||||||||||||||||||||||||||||||||||||||||||||||||||||
Year Ended March 31, 2013 | 9.76 | 0.05 | (b) | 0.06 | 0.11 | (0.04 | ) | — | — | (0.04 | ) | 9.83 | 9,357 | 1.08 | 0.30 | 0.33 | 0.50 | 56 | ||||||||||||||||||||||||||||||||||||||||||
Year Ended March 31, 2012 | 9.76 | 0.07 | (b) | (0.01 | ) | 0.06 | (0.06 | ) | — | — | (0.06 | ) | 9.76 | 16,002 | 0.58 | 0.28 | 0.28 | 0.68 | 58 | |||||||||||||||||||||||||||||||||||||||||
Year Ended March 31, 2011 | 9.71 | 0.10 | (b) | 0.03 | 0.13 | (0.08 | ) | — | — | (0.08 | ) | 9.76 | 21,883 | 1.37 | 0.22 | 0.22 | 1.11 | 74 | (c) | |||||||||||||||||||||||||||||||||||||||||
Year Ended March 31, 2010 | 9.52 | 0.08 | 0.18 | 0.26 | (0.07 | ) | — | — | (0.07 | ) | 9.71 | 22,482 | 2.69 | 0.23 | 0.23 | 0.82 | 124 | |||||||||||||||||||||||||||||||||||||||||||
Year Ended March 31, 2009 | 9.87 | 0.23 | (0.37 | ) | (0.14 | ) | (0.21 | ) | — | — | (0.21 | ) | 9.52 | 30,826 | (1.38 | ) | 0.19 | 0.19 | 2.43 | 44 | ||||||||||||||||||||||||||||||||||||||||
Limited-Term Federal Mortgage Securities Fund |
| |||||||||||||||||||||||||||||||||||||||||||||||||||||||||||
I Shares | ||||||||||||||||||||||||||||||||||||||||||||||||||||||||||||
Year Ended March 31, 2013 | 11.09 | 0.04 | (b) | 0.21 | 0.25 | (0.18 | ) | — | — | (0.18 | ) | 11.16 | 8,851 | 2.26 | 0.66 | 0.85 | 0.37 | 163 | ||||||||||||||||||||||||||||||||||||||||||
Year Ended March 31, 2012 | 10.59 | 0.12 | (b) | 0.62 | 0.74 | (0.24 | ) | — | — | (0.24 | ) | 11.09 | 24,688 | 7.01 | 0.66 | 0.72 | 1.06 | 299 | ||||||||||||||||||||||||||||||||||||||||||
Year Ended March 31, 2011 | 10.38 | 0.19 | (b) | 0.30 | 0.49 | (0.28 | ) | — | — | (0.28 | ) | 10.59 | 30,522 | 4.73 | 0.65 | 0.80 | 1.77 | 443 | (c) | |||||||||||||||||||||||||||||||||||||||||
Year Ended March 31, 2010 | 10.19 | 0.31 | 0.23 | 0.54 | (0.35 | ) | — | — | (0.35 | ) | 10.38 | 20,998 | 5.41 | 0.62 | 0.66 | 3.25 | 435 | |||||||||||||||||||||||||||||||||||||||||||
Year Ended March 31, 2009 | 9.93 | 0.43 | 0.29 | 0.72 | (0.46 | ) | — | — | (0.46 | ) | 10.19 | 39,135 | 7.48 | 0.60 | 0.60 | 4.34 | 337 | |||||||||||||||||||||||||||||||||||||||||||
See Notes to Financial Statements.
165
FINANCIAL HIGHLIGHTS
RIDGEWORTH FUNDS Selected Data For a Share of Beneficial Interest Outstanding Throughout the Periods Indicated.
| Net Asset Value, Beginning of Period | Net Investment Income (Loss) | Net Realized and Unrealized Gains (Losses) on Investments | Total from Operations | Dividends from Net Investment Income | Distributions from Tax Return of Capital | Distributions from Realized Capital Gains | Total Dividends and Distributions | Net Asset Value, End of Period | Net Assets End of Period (000) | Total Return(a) | Ratio of Net Expenses to Average Net Assets | Ratio of Expenses to Average Net Assets (Excluding Waivers and Reimbursements) | Ratio of Net Investment Income to Average Net Assets | Portfolio Turnover Rate | ||||||||||||||||||||||||||||||||||||||||||||||
A Shares | ||||||||||||||||||||||||||||||||||||||||||||||||||||||||||||
Year Ended March 31, 2013 | $11.07 | $0.02 | (b) | $0.21 | $0.23 | $(0.16 | ) | $— | $— | $(0.16 | ) | $11.14 | $2,271 | 2.06 | % | 0.86 | % | 1.05 | % | 0.15 | % | 163 | % | |||||||||||||||||||||||||||||||||||||
Year Ended March 31, 2012 | 10.57 | 0.09 | (b) | 0.62 | 0.71 | (0.21 | ) | — | — | (0.21 | ) | 11.07 | 6,279 | 6.81 | 0.86 | 0.93 | 0.78 | 299 | ||||||||||||||||||||||||||||||||||||||||||
Year Ended March 31, 2011 | 10.36 | 0.17 | (b) | 0.30 | 0.47 | (0.26 | ) | — | — | (0.26 | ) | 10.57 | 2,924 | 4.53 | 0.85 | 1.01 | 1.63 | 443 | (c) | |||||||||||||||||||||||||||||||||||||||||
Year Ended March 31, 2010 | 10.17 | 0.30 | 0.22 | 0.52 | (0.33 | ) | — | — | (0.33 | ) | 10.36 | 2,598 | 5.21 | 0.82 | 0.88 | 2.91 | 435 | |||||||||||||||||||||||||||||||||||||||||||
Year Ended March 31, 2009 | 9.91 | 0.41 | 0.29 | 0.70 | (0.44 | ) | — | — | (0.44 | ) | 10.17 | 2,143 | 7.29 | 0.81 | 0.81 | 4.14 | 337 | |||||||||||||||||||||||||||||||||||||||||||
C Shares | ||||||||||||||||||||||||||||||||||||||||||||||||||||||||||||
Year Ended March 31, 2013 | 11.09 | (0.07 | )(b) | 0.21 | 0.14 | (0.07 | ) | — | — | (0.07 | ) | 11.16 | 6,039 | 1.25 | 1.66 | 1.84 | (0.65 | ) | 163 | |||||||||||||||||||||||||||||||||||||||||
Year Ended March 31, 2012 | 10.59 | 0.01 | (b) | 0.62 | 0.63 | (0.13 | ) | — | — | (0.13 | ) | 11.09 | 7,376 | 5.94 | 1.66 | 1.71 | 0.06 | 299 | ||||||||||||||||||||||||||||||||||||||||||
Year Ended March 31, 2011 | 10.38 | 0.09 | (b) | 0.29 | 0.38 | (0.17 | ) | — | — | (0.17 | ) | 10.59 | 7,375 | 3.69 | 1.66 | 1.82 | 0.82 | 443 | (c) | |||||||||||||||||||||||||||||||||||||||||
Year Ended March 31, 2010 | 10.19 | 0.22 | 0.22 | 0.44 | (0.25 | ) | — | — | (0.25 | ) | 10.38 | 8,265 | 4.36 | 1.62 | 1.67 | 2.15 | 435 | |||||||||||||||||||||||||||||||||||||||||||
Year Ended March 31, 2009 | 9.93 | 0.33 | 0.29 | 0.62 | (0.36 | ) | — | — | (0.36 | ) | 10.19 | 8,556 | 6.42 | 1.60 | 1.60 | 3.33 | 337 | |||||||||||||||||||||||||||||||||||||||||||
North Carolina Tax-Exempt Bond Fund |
| |||||||||||||||||||||||||||||||||||||||||||||||||||||||||||
I Shares | ||||||||||||||||||||||||||||||||||||||||||||||||||||||||||||
Year Ended March 31, 2013 | 10.47 | 0.30 | (b) | 0.21 | 0.51 | (0.30 | ) | — | — | (0.30 | ) | 10.68 | 50,991 | 4.88 | 0.62 | 0.62 | 2.79 | 79 | ||||||||||||||||||||||||||||||||||||||||||
Year Ended March 31, 2012 | 9.70 | 0.33 | (b) | 0.77 | 1.10 | (0.33 | ) | — | — | (0.33 | ) | 10.47 | 50,412 | 11.51 | 0.67 | 0.67 | 3.27 | 39 | ||||||||||||||||||||||||||||||||||||||||||
Year Ended March 31, 2011 | 10.07 | 0.36 | (b) | (0.37 | ) | (0.01 | ) | (0.36 | ) | — | — | (0.36 | ) | 9.70 | 51,372 | (0.14 | ) | 0.64 | 0.64 | 3.61 | 49 | |||||||||||||||||||||||||||||||||||||||
Year Ended March 31, 2010 | 9.63 | 0.37 | 0.44 | 0.81 | (0.37 | ) | — | — | (0.37 | ) | 10.07 | 51,866 | 8.53 | 0.62 | 0.62 | 3.72 | 65 | |||||||||||||||||||||||||||||||||||||||||||
Year Ended March 31, 2009 | 9.71 | 0.35 | (0.08 | ) | 0.27 | (0.35 | ) | — | — | (0.35 | ) | 9.63 | 43,660 | 2.88 | 0.61 | 0.61 | 3.66 | 74 | ||||||||||||||||||||||||||||||||||||||||||
A Shares | ||||||||||||||||||||||||||||||||||||||||||||||||||||||||||||
Year Ended March 31, 2013 | 10.45 | 0.28 | (b) | 0.20 | 0.48 | (0.28 | ) | — | — | (0.28 | ) | 10.65 | 910 | 4.63 | 0.77 | 0.77 | 2.60 | 79 | ||||||||||||||||||||||||||||||||||||||||||
Year Ended March 31, 2012 | 9.67 | 0.32 | (b) | 0.78 | 1.10 | (0.32 | ) | — | — | (0.32 | ) | 10.45 | 633 | 11.47 | 0.82 | 0.82 | 3.11 | 39 | ||||||||||||||||||||||||||||||||||||||||||
Year Ended March 31, 2011 | 10.04 | 0.35 | (b) | (0.37 | ) | (0.02 | ) | (0.35 | ) | — | — | (0.35 | ) | 9.67 | 693 | (0.30 | ) | 0.79 | 0.79 | 3.47 | 49 | |||||||||||||||||||||||||||||||||||||||
Year Ended March 31, 2010 | 9.61 | 0.36 | 0.43 | 0.79 | (0.36 | ) | — | — | (0.36 | ) | 10.04 | 762 | 8.28 | 0.77 | 0.77 | 3.57 | 65 | |||||||||||||||||||||||||||||||||||||||||||
Year Ended March 31, 2009 | 9.68 | 0.33 | (0.06 | ) | 0.27 | (0.34 | ) | — | — | (0.34 | ) | 9.61 | 559 | 2.84 | 0.76 | 0.76 | 3.53 | 74 | ||||||||||||||||||||||||||||||||||||||||||
Seix Floating Rate High Income Fund |
| |||||||||||||||||||||||||||||||||||||||||||||||||||||||||||
I Shares | ||||||||||||||||||||||||||||||||||||||||||||||||||||||||||||
Year Ended March 31, 2013 | 8.83 | 0.46 | (b) | 0.20 | 0.66 | (0.43 | ) | — | — | (0.43 | ) | 9.06 | 5,780,847 | 7.67 | 0.60 | 0.60 | 5.13 | 70 | ||||||||||||||||||||||||||||||||||||||||||
Year Ended March 31, 2012 | 9.01 | 0.50 | (b) | (0.22 | ) | 0.28 | (0.46 | ) | — | — | (0.46 | ) | 8.83 | 3,419,351 | 3.31 | 0.60 | 0.60 | 5.69 | 72 | |||||||||||||||||||||||||||||||||||||||||
Year Ended March 31, 2011 | 8.80 | 0.59 | (b) | 0.15 | 0.74 | (0.53 | ) | — | — | (0.53 | ) | 9.01 | 3,078,972 | 8.64 | 0.51 | 0.51 | 6.62 | 98 | (c) | |||||||||||||||||||||||||||||||||||||||||
Year Ended March 31, 2010 | 7.37 | 0.53 | 1.40 | 1.93 | (0.50 | ) | — | — | (0.50 | ) | 8.80 | 1,173,308 | 26.68 | 0.50 | 0.50 | 7.08 | 117 | |||||||||||||||||||||||||||||||||||||||||||
Year Ended March 31, 2009 | 8.90 | 0.52 | (1.53 | ) | (1.01 | ) | (0.52 | ) | — | — | (0.52 | ) | 7.37 | 557,347 | (11.67 | ) | 0.49 | 0.49 | 6.31 | 226 | ||||||||||||||||||||||||||||||||||||||||
A Shares | ||||||||||||||||||||||||||||||||||||||||||||||||||||||||||||
Year Ended March 31, 2013 | 8.83 | 0.43 | (b) | 0.21 | 0.64 | (0.41 | ) | — | — | (0.41 | ) | 9.06 | 99,040 | 7.39 | 0.85 | 0.85 | 4.85 | 70 | ||||||||||||||||||||||||||||||||||||||||||
Year Ended March 31, 2012 | 9.01 | 0.48 | (b) | (0.22 | ) | 0.26 | (0.44 | ) | — | — | (0.44 | ) | 8.83 | 51,185 | 3.05 | 0.85 | 0.85 | 5.47 | 72 | |||||||||||||||||||||||||||||||||||||||||
Year Ended March 31, 2011 | 8.80 | 0.55 | (b) | 0.16 | 0.71 | (0.50 | ) | — | — | (0.50 | ) | 9.01 | 69,159 | 8.29 | 0.84 | 0.84 | 6.22 | 98 | (c) | |||||||||||||||||||||||||||||||||||||||||
Year Ended March 31, 2010 | 7.38 | 0.50 | 1.39 | 1.89 | (0.47 | ) | — | — | (0.47 | ) | 8.80 | 22,298 | 26.11 | 0.81 | 0.81 | 6.81 | 117 | |||||||||||||||||||||||||||||||||||||||||||
Year Ended March 31, 2009 | 8.90 | 0.50 | (1.52 | ) | (1.02 | ) | (0.50 | ) | — | — | (0.50 | ) | 7.38 | 5,513 | (11.82 | ) | 0.79 | 0.79 | 6.08 | 226 | ||||||||||||||||||||||||||||||||||||||||
C Shares | ||||||||||||||||||||||||||||||||||||||||||||||||||||||||||||
Year Ended March 31, 2013 | 8.83 | 0.38 | (b) | 0.20 | 0.58 | (0.35 | ) | — | — | (0.35 | ) | 9.06 | 40,493 | 6.69 | 1.51 | 1.51 | 4.22 | 70 | ||||||||||||||||||||||||||||||||||||||||||
Year Ended March 31, 2012 | 9.02 | 0.42 | (b) | (0.23 | ) | 0.19 | (0.38 | ) | — | — | (0.38 | ) | 8.83 | 30,132 | 2.26 | 1.52 | 1.52 | 4.77 | 72 | |||||||||||||||||||||||||||||||||||||||||
Year Ended March 31, 2011 | 8.81 | 0.50 | (b) | 0.15 | 0.65 | (0.44 | ) | — | — | (0.44 | ) | 9.02 | 22,234 | 7.57 | 1.50 | 1.50 | 5.65 | 98 | (c) | |||||||||||||||||||||||||||||||||||||||||
Year Ended March 31, 2010 | 7.37 | 0.45 | 1.41 | 1.86 | (0.42 | ) | — | — | (0.42 | ) | 8.81 | 7,402 | 25.59 | 1.49 | 1.49 | 6.35 | 117 | |||||||||||||||||||||||||||||||||||||||||||
Year Ended March 31, 2009 | 8.90 | 0.44 | (1.53 | ) | (1.09 | ) | (0.44 | ) | — | — | (0.44 | ) | 7.37 | 543 | (12.55 | ) | 1.49 | 1.49 | 5.27 | 226 | ||||||||||||||||||||||||||||||||||||||||
See Notes to Financial Statements.
166
FINANCIAL HIGHLIGHTS
RIDGEWORTH FUNDS Selected Data For a Share of Beneficial Interest Outstanding Throughout the Periods Indicated.
| Net Asset Value, Beginning of Period | Net Investment Income (Loss) | Net Realized and Unrealized Gains (Losses) on Investments | Total from Operations | Dividends from Net Investment Income | Distributions from Tax Return of Capital | Distributions from Realized Capital Gains | Total Dividends and Distributions | Net Asset Value, End of Period | Net Assets End of Period (000) | Total Return(a) | Ratio of Net Expenses to Average Net Assets | Ratio of Expenses to Average Net Assets (Excluding Waivers and Reimbursements) | Ratio of Net Investment Income to Average Net Assets | Portfolio Turnover Rate | ||||||||||||||||||||||||||||||||||||||||||||||
Seix High Yield Fund | ||||||||||||||||||||||||||||||||||||||||||||||||||||||||||||
I Shares | ||||||||||||||||||||||||||||||||||||||||||||||||||||||||||||
Year Ended March 31, 2013 | $9.69 | $0.64 | (b) | $0.56 | $1.20 | $(0.63 | ) | $— | $— | $(0.63 | ) | $10.26 | $1,792,768 | 12.80 | % | 0.54 | % | 0.54 | % | 6.41 | % | 79 | % | |||||||||||||||||||||||||||||||||||||
Year Ended March 31, 2012 | 10.07 | 0.70 | (b) | (0.38 | ) | 0.32 | (0.70 | ) | — | — | (0.70 | ) | 9.69 | 2,123,625 | 3.44 | 0.54 | 0.54 | 7.27 | 83 | |||||||||||||||||||||||||||||||||||||||||
Year Ended March 31, 2011 | 9.46 | 0.77 | (b) | 0.61 | 1.38 | (0.77 | ) | — | — | (0.77 | ) | 10.07 | 1,724,652 | 15.24 | 0.51 | 0.51 | 7.96 | 108 | (c) | |||||||||||||||||||||||||||||||||||||||||
Year Ended March 31, 2010 | 7.75 | 0.77 | 1.70 | 2.47 | (0.76 | ) | — | — | (0.76 | ) | 9.46 | 1,723,678 | 32.91 | 0.48 | 0.49 | 8.54 | 116 | |||||||||||||||||||||||||||||||||||||||||||
Year Ended March 31, 2009 | 9.77 | 0.78 | (2.03 | ) | (1.25 | ) | (0.77 | ) | — | — | (0.77 | ) | 7.75 | 786,029 | (13.15 | ) | 0.50 | 0.51 | 8.99 | 114 | ||||||||||||||||||||||||||||||||||||||||
A Shares | ||||||||||||||||||||||||||||||||||||||||||||||||||||||||||||
Year Ended March 31, 2013 | 9.47 | 0.59 | (b) | 0.56 | 1.15 | (0.59 | ) | — | — | (0.59 | ) | 10.03 | 72,703 | 12.56 | 0.79 | 0.79 | 6.09 | 79 | ||||||||||||||||||||||||||||||||||||||||||
Year Ended March 31, 2012 | 9.84 | 0.65 | (b) | (0.36 | ) | 0.29 | (0.66 | ) | — | — | (0.66 | ) | 9.47 | 38,016 | 3.21 | 0.78 | 0.78 | 6.91 | 83 | |||||||||||||||||||||||||||||||||||||||||
Year Ended March 31, 2011 | 9.25 | 0.73 | (b) | 0.60 | 1.33 | (0.74 | ) | — | — | (0.74 | ) | 9.84 | 35,238 | 14.99 | 0.77 | 0.77 | 7.74 | 108 | (c) | |||||||||||||||||||||||||||||||||||||||||
Year Ended March 31, 2010 | 7.58 | 0.74 | 1.67 | 2.41 | (0.74 | ) | — | — | (0.74 | ) | 9.25 | 28,378 | 32.81 | 0.75 | 0.75 | 8.51 | 116 | |||||||||||||||||||||||||||||||||||||||||||
Year Ended March 31, 2009 | 9.55 | 0.75 | (1.97 | ) | (1.22 | ) | (0.75 | ) | — | — | (0.75 | ) | 7.58 | 18,530 | (13.14 | ) | 0.76 | 0.77 | 8.84 | 114 | ||||||||||||||||||||||||||||||||||||||||
R Shares(d) | ||||||||||||||||||||||||||||||||||||||||||||||||||||||||||||
Year Ended March 31, 2013 | 9.68 | 0.59 | (b) | 0.57 | 1.16 | (0.58 | ) | — | — | (0.58 | ) | 10.26 | 2,385 | 12.36 | 1.03 | 1.03 | 5.92 | 79 | ||||||||||||||||||||||||||||||||||||||||||
Year Ended March 31, 2012 | 10.07 | 0.65 | (b) | (0.40 | ) | 0.25 | (0.64 | ) | — | — | (0.64 | ) | 9.68 | 2,427 | 2.69 | 1.18 | 1.18 | 6.68 | 83 | |||||||||||||||||||||||||||||||||||||||||
Year Ended March 31, 2011 | 9.45 | 0.71 | (b) | 0.62 | 1.33 | (0.71 | ) | — | — | (0.71 | ) | 10.07 | 3,341 | 14.61 | 1.20 | 1.20 | 7.43 | 108 | (c) | |||||||||||||||||||||||||||||||||||||||||
Year Ended March 31, 2010 | 7.75 | 0.71 | 1.69 | 2.40 | (0.70 | ) | — | — | (0.70 | ) | 9.45 | 6,347 | 31.92 | 1.14 | 1.14 | 7.92 | 116 | |||||||||||||||||||||||||||||||||||||||||||
Year Ended March 31, 2009 | 9.77 | 0.70 | (2.03 | ) | (1.33 | ) | (0.69 | ) | — | — | (0.69 | ) | 7.75 | 5,060 | (14.01 | ) | 1.50 | 1.50 | 7.90 | 114 | ||||||||||||||||||||||||||||||||||||||||
Short-Term Bond Fund |
| |||||||||||||||||||||||||||||||||||||||||||||||||||||||||||
I Shares | ||||||||||||||||||||||||||||||||||||||||||||||||||||||||||||
Year Ended March 31, 2013 | 9.99 | 0.15 | (b) | 0.01 | 0.16 | (0.15 | ) | — | — | (0.15 | ) | 10.00 | 78,383 | 1.65 | 0.48 | 0.48 | 1.51 | 128 | ||||||||||||||||||||||||||||||||||||||||||
Year Ended March 31, 2012 | 9.95 | 0.20 | (b) | 0.06 | 0.26 | (0.22 | ) | — | — | (0.22 | ) | 9.99 | 310,854 | 2.60 | 0.48 | 0.48 | 2.00 | 86 | ||||||||||||||||||||||||||||||||||||||||||
Year Ended March 31, 2011 | 9.94 | 0.21 | (b) | 0.02 | 0.23 | (0.22 | ) | — | — | (0.22 | ) | 9.95 | 350,162 | 2.28 | 0.48 | 0.48 | 2.12 | 150 | (c) | |||||||||||||||||||||||||||||||||||||||||
Year Ended March 31, 2010 | 9.40 | 0.30 | 0.53 | 0.83 | (0.29 | ) | — | — | (0.29 | ) | 9.94 | 489,413 | 8.91 | 0.46 | 0.46 | 3.00 | 122 | |||||||||||||||||||||||||||||||||||||||||||
Year Ended March 31, 2009 | 9.87 | 0.40 | (0.47 | ) | (0.07 | ) | (0.40 | ) | — | — | (0.40 | ) | 9.40 | 326,801 | (0.70 | ) | 0.46 | 0.46 | 4.20 | 122 | ||||||||||||||||||||||||||||||||||||||||
A Shares | ||||||||||||||||||||||||||||||||||||||||||||||||||||||||||||
Year Ended March 31, 2013 | 10.02 | 0.13 | (b) | 0.01 | 0.14 | (0.13 | ) | — | — | (0.13 | ) | 10.03 | 2,069 | 1.40 | 0.73 | 0.74 | 1.27 | 128 | ||||||||||||||||||||||||||||||||||||||||||
Year Ended March 31, 2012 | 9.98 | 0.17 | (b) | 0.06 | 0.23 | (0.19 | ) | — | — | (0.19 | ) | 10.02 | 2,478 | 2.32 | 0.76 | 0.76 | 1.75 | 86 | ||||||||||||||||||||||||||||||||||||||||||
Year Ended March 31, 2011 | 9.96 | 0.19 | (b) | 0.03 | 0.22 | (0.20 | ) | — | — | (0.20 | ) | 9.98 | 2,642 | 2.18 | 0.67 | 0.67 | 1.94 | 150 | (c) | |||||||||||||||||||||||||||||||||||||||||
Year Ended March 31, 2010 | 9.42 | 0.28 | 0.53 | 0.81 | (0.27 | ) | — | — | (0.27 | ) | 9.96 | 3,389 | 8.65 | 0.68 | 0.68 | 2.78 | 122 | |||||||||||||||||||||||||||||||||||||||||||
Year Ended March 31, 2009 | 9.89 | 0.38 | (0.47 | ) | (0.09 | ) | (0.38 | ) | — | — | (0.38 | ) | 9.42 | 2,715 | (0.90 | ) | 0.66 | 0.66 | 4.00 | 122 | ||||||||||||||||||||||||||||||||||||||||
C Shares | ||||||||||||||||||||||||||||||||||||||||||||||||||||||||||||
Year Ended March 31, 2013 | 10.01 | 0.05 | (b) | 0.01 | 0.06 | (0.05 | ) | — | — | (0.05 | ) | 10.02 | 2,425 | 0.65 | 1.48 | 1.48 | 0.52 | 128 | ||||||||||||||||||||||||||||||||||||||||||
Year Ended March 31, 2012 | 9.98 | 0.10 | (b) | 0.05 | 0.15 | (0.12 | ) | — | — | (0.12 | ) | 10.01 | 3,009 | 1.48 | 1.48 | 1.48 | 1.01 | 86 | ||||||||||||||||||||||||||||||||||||||||||
Year Ended March 31, 2011 | 9.96 | 0.11 | (b) | 0.03 | 0.14 | (0.12 | ) | — | — | (0.12 | ) | 9.98 | 2,685 | 1.36 | 1.47 | 1.47 | 1.12 | 150 | (c) | |||||||||||||||||||||||||||||||||||||||||
Year Ended March 31, 2010 | 9.42 | 0.20 | 0.53 | 0.73 | (0.19 | ) | — | — | (0.19 | ) | 9.96 | 2,754 | 7.81 | 1.46 | 1.46 | 2.03 | 122 | |||||||||||||||||||||||||||||||||||||||||||
Year Ended March 31, 2009 | 9.89 | 0.30 | (0.47 | ) | (0.17 | ) | (0.30 | ) | — | — | (0.30 | ) | 9.42 | 2,948 | (1.69 | ) | 1.45 | 1.46 | 3.20 | 122 | ||||||||||||||||||||||||||||||||||||||||
Short-Term Municipal Bond Fund | ||||||||||||||||||||||||||||||||||||||||||||||||||||||||||||
I Shares | ||||||||||||||||||||||||||||||||||||||||||||||||||||||||||||
Year Ended March 31, 2013 | 10.73 | 0.05 | (b) | 0.27 | 0.32 | (0.06 | ) | — | (0.98 | ) | (1.04 | ) | 10.01 | 11,121 | 3.01 | 0.58 | 0.91 | 0.52 | 199 | |||||||||||||||||||||||||||||||||||||||||
Year Ended March 31, 2012 | 10.16 | 0.32 | (b) | 0.70 | 1.02 | (0.31 | ) | — | (0.14 | ) | (0.45 | ) | 10.73 | 5,956 | 10.16 | 0.67 | 0.77 | 3.00 | 27 | |||||||||||||||||||||||||||||||||||||||||
Year Ended March 31, 2011 | 10.48 | 0.35 | (b) | (0.29 | ) | 0.06 | (0.35 | ) | — | (0.03 | ) | (0.38 | ) | 10.16 | 21,302 | 0.53 | 0.68 | 0.68 | 3.32 | 33 | ||||||||||||||||||||||||||||||||||||||||
Year Ended March 31, 2010 | 10.04 | 0.37 | 0.44 | 0.81 | (0.37 | ) | — | — | (0.37 | ) | 10.48 | 24,332 | 8.18 | 0.65 | 0.65 | 3.58 | 35 | |||||||||||||||||||||||||||||||||||||||||||
Year Ended March 31, 2009 | 10.04 | 0.37 | — | 0.37 | (0.37 | ) | — | — | (0.37 | ) | 10.04 | 26,064 | 3.79 | 0.63 | 0.63 | 3.71 | 26 | |||||||||||||||||||||||||||||||||||||||||||
See Notes to Financial Statements.
167
FINANCIAL HIGHLIGHTS
RIDGEWORTH FUNDS Selected Data For a Share of Beneficial Interest Outstanding Throughout the Periods Indicated.
| Net Asset Value, Beginning of Period | Net Investment Income (Loss) | Net Realized and Unrealized Gains (Losses) on Investments | Total from Operations | Dividends from Net Investment Income | Distributions from Tax Return of Capital | Distributions from Realized Capital Gains | Total Dividends and Distributions | Net Asset Value, End of Period | Net Assets End of Period (000) | Total Return(a) | Ratio of Net Expenses to Average Net Assets | Ratio of Expenses to Average Net Assets (Excluding Waivers and Reimbursements) | Ratio of Net Investment Income to Average Net Assets | Portfolio Turnover Rate | ||||||||||||||||||||||||||||||||||||||||||||||
A Shares | ||||||||||||||||||||||||||||||||||||||||||||||||||||||||||||
Year Ended March 31, 2013 | $10.73 | $0.04 | (b) | $0.26 | $0.30 | $(0.04 | ) | $— | $(0.98 | ) | $(1.02 | ) | $10.01 | $3,694 | 2.86 | % | 0.73 | % | 1.04 | % | 0.39 | % | 199 | % | ||||||||||||||||||||||||||||||||||||
Year Ended March 31, 2012 | 10.16 | 0.29 | (b) | 0.71 | 1.00 | (0.29 | ) | — | (0.14 | ) | (0.43 | ) | 10.73 | 3,445 | 10.00 | 0.82 | 0.97 | 2.77 | 27 | |||||||||||||||||||||||||||||||||||||||||
Year Ended March 31, 2011 | 10.48 | 0.33 | (b) | (0.29 | ) | 0.04 | (0.33 | ) | — | (0.03 | ) | (0.36 | ) | 10.16 | 4,081 | 0.38 | 0.83 | 0.83 | 3.18 | 33 | ||||||||||||||||||||||||||||||||||||||||
Period Ended March 31, 2010# | 10.29 | 0.24 | 0.19 | 0.43 | (0.24 | ) | — | — | (0.24 | ) | 10.48 | 5,200 | 4.18 | 0.81 | 0.81 | 3.38 | 35 | |||||||||||||||||||||||||||||||||||||||||||
Period Ended March 31, 2009## | 10.05 | 0.27 | (0.25 | ) | 0.02 | (0.27 | ) | — | — | (0.27 | ) | 9.80 | — | 0.22 | 0.78 | 0.78 | 3.58 | 26 | ||||||||||||||||||||||||||||||||||||||||||
Year Ended March 31, 2008 | 10.22 | 0.36 | (0.16 | ) | 0.20 | (0.36 | ) | — | (0.01 | ) | (0.37 | ) | 10.05 | 45 | 1.91 | 0.79 | 0.79 | 3.65 | 23 | |||||||||||||||||||||||||||||||||||||||||
Short-Term U.S. Treasury Securities Fund |
| |||||||||||||||||||||||||||||||||||||||||||||||||||||||||||
I Shares | ||||||||||||||||||||||||||||||||||||||||||||||||||||||||||||
Year Ended March 31, 2013 | 9.96 | 0.05 | (b) | (0.03 | ) | 0.02 | (0.05 | ) | — | (0.03 | ) | (0.08 | ) | 9.90 | 3,339 | 0.15 | 0.55 | 0.89 | 0.52 | 14 | ||||||||||||||||||||||||||||||||||||||||
Year Ended March 31, 2012 | 10.10 | 0.10 | (b) | — | (f) | 0.10 | (0.10 | ) | — | (0.14 | ) | (0.24 | ) | 9.96 | 8,502 | 0.96 | 0.55 | 0.74 | 1.01 | 31 | ||||||||||||||||||||||||||||||||||||||||
Year Ended March 31, 2011 | 10.27 | 0.13 | (b) | (0.01 | ) | 0.12 | (0.13 | ) | — | (0.16 | ) | (0.29 | ) | 10.10 | 22,875 | 1.16 | 0.53 | 0.62 | 1.23 | 36 | ||||||||||||||||||||||||||||||||||||||||
Year Ended March 31, 2010 | 10.33 | 0.14 | (0.03 | ) | 0.11 | (0.14 | ) | — | (0.03 | ) | (0.17 | ) | 10.27 | 33,504 | 1.03 | 0.49 | 0.54 | 1.29 | 147 | |||||||||||||||||||||||||||||||||||||||||
Year Ended March 31, 2009 | 10.26 | 0.28 | 0.07 | 0.35 | (0.28 | ) | — | — | (0.28 | ) | 10.33 | 61,692 | 3.50 | 0.48 | 0.48 | 2.74 | 144 | |||||||||||||||||||||||||||||||||||||||||||
A Shares |
| |||||||||||||||||||||||||||||||||||||||||||||||||||||||||||
Year Ended March 31, 2013 | 9.95 | 0.03 | (b) | (0.03 | ) | — | (0.03 | ) | — | (0.03 | ) | (0.06 | ) | 9.89 | 2,107 | (0.03 | ) | 0.73 | 1.04 | 0.33 | 14 | |||||||||||||||||||||||||||||||||||||||
Year Ended March 31, 2012 | 10.09 | 0.08 | (b) | — | (f) | 0.08 | (0.08 | ) | — | (0.14 | ) | (0.22 | ) | 9.95 | 3,455 | 0.78 | 0.73 | 0.94 | 0.80 | 31 | ||||||||||||||||||||||||||||||||||||||||
Year Ended March 31, 2011 | 10.26 | 0.11 | (b) | (0.01 | ) | 0.10 | (0.11 | ) | — | (0.16 | ) | (0.27 | ) | 10.09 | 5,562 | 0.98 | 0.71 | 0.80 | 1.05 | 36 | ||||||||||||||||||||||||||||||||||||||||
Year Ended March 31, 2010 | 10.32 | 0.12 | (0.03 | ) | 0.09 | (0.12 | ) | — | (0.03 | ) | (0.15 | ) | 10.26 | 5,839 | 0.85 | 0.67 | 0.71 | 1.20 | 147 | |||||||||||||||||||||||||||||||||||||||||
Year Ended March 31, 2009 | 10.25 | 0.26 | 0.07 | 0.33 | (0.26 | ) | — | — | (0.26 | ) | 10.32 | 16,854 | 3.31 | 0.65 | 0.66 | 2.30 | 144 | |||||||||||||||||||||||||||||||||||||||||||
C Shares | ||||||||||||||||||||||||||||||||||||||||||||||||||||||||||||
Year Ended March 31, 2013 | 9.94 | — | (b)(f) | (0.03 | ) | (0.03 | ) | — | (f) | — | (0.03 | ) | (0.03 | ) | 9.88 | 6,776 | (0.33 | ) | 1.04 | 1.42 | 0.02 | 14 | ||||||||||||||||||||||||||||||||||||||
Year Ended March 31, 2012 | 10.08 | 0.01 | (b) | — | (f) | 0.01 | (0.01 | ) | — | (0.14 | ) | (0.15 | ) | 9.94 | 7,931 | 0.07 | 1.44 | 1.74 | 0.07 | 31 | ||||||||||||||||||||||||||||||||||||||||
Year Ended March 31, 2011 | 10.25 | 0.02 | (b) | (0.01 | ) | 0.01 | (0.02 | ) | — | (0.16 | ) | (0.18 | ) | 10.08 | 7,699 | 0.16 | 1.53 | 1.62 | 0.21 | 36 | ||||||||||||||||||||||||||||||||||||||||
Year Ended March 31, 2010 | 10.31 | 0.03 | (0.03 | ) | — | (0.03 | ) | — | (0.03 | ) | (0.06 | ) | 10.25 | 6,426 | 0.04 | 1.49 | 1.55 | 0.33 | 147 | |||||||||||||||||||||||||||||||||||||||||
Year Ended March 31, 2009 | 10.25 | 0.18 | 0.06 | 0.24 | (0.18 | ) | — | — | (0.18 | ) | 10.31 | 7,113 | 2.38 | 1.48 | 1.48 | 1.79 | 144 | |||||||||||||||||||||||||||||||||||||||||||
Total Return Bond Fund | ||||||||||||||||||||||||||||||||||||||||||||||||||||||||||||
I Shares | ||||||||||||||||||||||||||||||||||||||||||||||||||||||||||||
Year Ended March 31, 2013 | 10.77 | 0.18 | (b) | 0.25 | 0.43 | (0.21 | ) | — | (0.20 | ) | (0.41 | ) | 10.79 | 1,204,228 | 4.01 | 0.39 | 0.40 | 1.69 | 139 | |||||||||||||||||||||||||||||||||||||||||
Year Ended March 31, 2012 | 10.40 | 0.25 | (b) | 0.73 | 0.98 | (0.36 | ) | — | (0.25 | ) | (0.61 | ) | 10.77 | 996,213 | 9.62 | 0.37 | 0.37 | 2.30 | 170 | |||||||||||||||||||||||||||||||||||||||||
Year Ended March 31, 2011 | 10.60 | 0.33 | (b) | 0.22 | 0.55 | (0.27 | ) | (0.08 | ) | (0.40 | ) | (0.75 | ) | 10.40 | 684,952 | 5.20 | 0.33 | 0.33 | 3.05 | 251 | (c) | |||||||||||||||||||||||||||||||||||||||
Year Ended March 31, 2010 | 10.26 | 0.40 | 0.43 | 0.83 | (0.36 | ) | — | (0.13 | ) | (0.49 | ) | 10.60 | 724,588 | 8.17 | 0.31 | 0.31 | 3.72 | 326 | ||||||||||||||||||||||||||||||||||||||||||
Year Ended March 31, 2009 | 10.10 | 0.49 | 0.18 | 0.67 | (0.51 | ) | — | — | (0.51 | ) | 10.26 | 602,267 | 6.89 | 0.30 | 0.30 | 4.85 | 199 | |||||||||||||||||||||||||||||||||||||||||||
A Shares | ||||||||||||||||||||||||||||||||||||||||||||||||||||||||||||
Year Ended March 31, 2013 | 11.12 | 0.16 | (b) | 0.25 | 0.41 | (0.18 | ) | — | (0.20 | ) | (0.38 | ) | 11.15 | 50,279 | 3.76 | 0.66 | 0.68 | 1.42 | 139 | |||||||||||||||||||||||||||||||||||||||||
Year Ended March 31, 2012 | 10.73 | 0.22 | (b) | 0.76 | 0.98 | (0.34 | ) | — | (0.25 | ) | (0.59 | ) | 11.12 | 44,359 | 9.31 | 0.65 | 0.65 | 1.95 | 170 | |||||||||||||||||||||||||||||||||||||||||
Year Ended March 31, 2011 | 10.92 | 0.33 | (b) | 0.21 | 0.54 | (0.25 | ) | (0.08 | ) | (0.40 | ) | (0.73 | ) | 10.73 | 17,589 | 4.93 | 0.58 | 0.58 | 2.94 | 251 | (c) | |||||||||||||||||||||||||||||||||||||||
Year Ended March 31, 2010 | 10.57 | 0.38 | 0.43 | 0.81 | (0.33 | ) | — | (0.13 | ) | (0.46 | ) | 10.92 | 8,540 | 7.75 | 0.55 | 0.55 | 3.14 | 326 | ||||||||||||||||||||||||||||||||||||||||||
Year Ended March 31, 2009 | 10.40 | 0.46 | 0.19 | 0.65 | (0.48 | ) | — | — | (0.48 | ) | 10.57 | 510 | 6.51 | 0.54 | 0.54 | 4.51 | 199 | |||||||||||||||||||||||||||||||||||||||||||
See Notes to Financial Statements.
168
FINANCIAL HIGHLIGHTS
RIDGEWORTH FUNDS Selected Data For a Share of Beneficial Interest Outstanding Throughout the Periods Indicated.
| Net Asset Value, Beginning of Period | Net Investment Income (Loss) | Net Realized and Unrealized Gains (Losses) on Investments | Total from Operations | Dividends from Net Investment Income | Distributions from Tax Return of Capital | Distributions from Realized Capital Gains | Total Dividends and Distributions | Net Asset Value, End of Period | Net Assets End of Period (000) | Total Return(a) | Ratio of Net Expenses to Average Net Assets | Ratio of Expenses to Average Net Assets (Excluding Waivers and Reimbursements) | Ratio of Net Investment Income to Average Net Assets | Portfolio Turnover Rate | ||||||||||||||||||||||||||||||||||||||||||||||
R Shares | ||||||||||||||||||||||||||||||||||||||||||||||||||||||||||||
Year Ended March 31, 2013(e) | $10.78 | $0.12 | (b) | $0.25 | $0.37 | $(0.15 | ) | $— | $(0.20 | ) | $(0.35 | ) | $10.80 | $72,697 | 3.43 | % | 0.96 | % | 1.05 | % | 1.11 | % | 139 | % | ||||||||||||||||||||||||||||||||||||
Year Ended March 31, 2012 | 10.40 | 0.18 | (b) | 0.76 | 0.94 | (0.31 | ) | — | (0.25 | ) | (0.56 | ) | 10.78 | 20,315 | 9.15 | 0.90 | 0.90 | 1.63 | 170 | |||||||||||||||||||||||||||||||||||||||||
Year Ended March 31, 2011 | 10.60 | 0.30 | (b) | 0.19 | 0.49 | (0.21 | ) | (0.08 | ) | (0.40 | ) | (0.69 | ) | 10.40 | 2,825 | 4.63 | 0.89 | 0.89 | 2.74 | 251 | (c) | |||||||||||||||||||||||||||||||||||||||
Year Ended March 31, 2010 | 10.26 | 0.35 | 0.42 | 0.77 | (0.30 | ) | — | (0.13 | ) | (0.43 | ) | 10.60 | 710 | 7.61 | 0.82 | 0.82 | 3.11 | 326 | ||||||||||||||||||||||||||||||||||||||||||
Year Ended March 31, 2009 | 10.10 | 0.39 | 0.19 | 0.58 | (0.42 | ) | — | — | (0.42 | ) | 10.26 | 325 | 5.90 | 1.10 | 1.10 | 4.01 | 199 | |||||||||||||||||||||||||||||||||||||||||||
Ultra-Short Bond Fund | ||||||||||||||||||||||||||||||||||||||||||||||||||||||||||||
I Shares | ||||||||||||||||||||||||||||||||||||||||||||||||||||||||||||
Year Ended March 31, 2013 | 9.95 | 0.10 | (b) | 0.04 | 0.14 | (0.11 | ) | — | — | (0.11 | ) | 9.98 | 109,224 | 1.39 | 0.33 | 0.33 | 0.98 | 127 | ||||||||||||||||||||||||||||||||||||||||||
Year Ended March 31, 2012 | 9.93 | 0.10 | (b) | 0.03 | 0.13 | (0.11 | ) | — | — | (0.11 | ) | 9.95 | 112,617 | 1.34 | 0.34 | 0.34 | 0.99 | 97 | ||||||||||||||||||||||||||||||||||||||||||
Year Ended March 31, 2011 | 9.91 | 0.13 | (b) | 0.04 | 0.17 | (0.15 | ) | — | — | (0.15 | ) | 9.93 | 115,795 | 1.76 | 0.32 | 0.32 | 1.31 | 229 | ||||||||||||||||||||||||||||||||||||||||||
Year Ended March 31, 2010 | 9.52 | 0.25 | 0.39 | 0.64 | (0.25 | ) | — | — | (0.25 | ) | 9.91 | 92,528 | 6.82 | 0.34 | 0.37 | 2.51 | 130 | |||||||||||||||||||||||||||||||||||||||||||
Year Ended March 31, 2009 | 9.91 | 0.39 | (0.40 | ) | (0.01 | ) | (0.38 | ) | — | — | (0.38 | ) | 9.52 | 55,088 | (0.13 | ) | 0.31 | 0.36 | 3.95 | 88 | ||||||||||||||||||||||||||||||||||||||||
U.S. Government Securities Fund |
| |||||||||||||||||||||||||||||||||||||||||||||||||||||||||||
I Shares | ||||||||||||||||||||||||||||||||||||||||||||||||||||||||||||
Year Ended March 31, 2013 | 8.69 | 0.04 | (b) | 0.15 | 0.19 | (0.04 | ) | — | (0.41 | ) | (0.45 | ) | 8.43 | 35,866 | 2.19 | 0.75 | 0.81 | 0.47 | 75 | |||||||||||||||||||||||||||||||||||||||||
Year Ended March 31, 2012 | 8.63 | 0.11 | (b) | 0.61 | 0.72 | (0.11 | ) | — | (0.55 | ) | (0.66 | ) | 8.69 | 40,754 | 8.27 | 0.73 | 0.73 | 1.18 | 94 | |||||||||||||||||||||||||||||||||||||||||
Year Ended March 31, 2011 | 8.76 | 0.18 | (b) | 0.22 | 0.40 | (0.18 | ) | — | (0.35 | ) | (0.53 | ) | 8.63 | 48,580 | 4.50 | 0.62 | 0.62 | 2.02 | 92 | |||||||||||||||||||||||||||||||||||||||||
Year Ended March 31, 2010 | 11.11 | 0.26 | (0.37 | ) | (0.11 | ) | (0.27 | ) | — | (1.97 | ) | (2.24 | ) | 8.76 | 71,910 | (1.07 | ) | 0.58 | 0.58 | 2.35 | 85 | |||||||||||||||||||||||||||||||||||||||
Year Ended March 31, 2009 | 10.59 | 0.33 | 0.56 | 0.89 | (0.34 | ) | — | (0.03 | ) | (0.37 | ) | 11.11 | 341,727 | 8.49 | 0.55 | 0.56 | 3.09 | 130 | ||||||||||||||||||||||||||||||||||||||||||
A Shares | ||||||||||||||||||||||||||||||||||||||||||||||||||||||||||||
Year Ended March 31, 2013 | 8.69 | 0.02 | (b) | 0.15 | 0.17 | (0.02 | ) | — | (0.41 | ) | (0.43 | ) | 8.43 | 1,665 | 1.97 | 0.97 | 1.02 | 0.24 | 75 | |||||||||||||||||||||||||||||||||||||||||
Year Ended March 31, 2012 | 8.63 | 0.08 | (b) | 0.61 | 0.69 | (0.08 | ) | — | (0.55 | ) | (0.63 | ) | 8.69 | 1,797 | 7.98 | 1.00 | 1.00 | 0.90 | 94 | |||||||||||||||||||||||||||||||||||||||||
Year Ended March 31, 2011 | 8.76 | 0.15 | (b) | 0.22 | 0.37 | (0.15 | ) | — | (0.35 | ) | (0.50 | ) | 8.63 | 2,089 | 4.18 | 0.93 | 0.93 | 1.71 | 92 | |||||||||||||||||||||||||||||||||||||||||
Year Ended March 31, 2010 | 11.11 | 0.21 | (0.35 | ) | (0.14 | ) | (0.24 | ) | — | (1.97 | ) | (2.21 | ) | 8.76 | 2,314 | (1.38 | ) | 0.89 | 0.89 | 1.98 | 85 | |||||||||||||||||||||||||||||||||||||||
Year Ended March 31, 2009 | 10.59 | 0.29 | 0.56 | 0.85 | (0.30 | ) | — | (0.03 | ) | (0.33 | ) | 11.11 | 2,954 | 8.17 | 0.85 | 0.86 | 2.78 | 130 | ||||||||||||||||||||||||||||||||||||||||||
C Shares | ||||||||||||||||||||||||||||||||||||||||||||||||||||||||||||
Year Ended March 31, 2013 | 8.69 | — | (b) | 0.15 | 0.15 | — | — | (0.41 | ) | (0.41 | ) | 8.43 | 1,923 | 1.72 | 1.22 | 1.70 | — | 75 | ||||||||||||||||||||||||||||||||||||||||||
Year Ended March 31, 2012 | 8.63 | 0.03 | (b) | 0.61 | 0.64 | (0.03 | ) | — | (0.55 | ) | (0.58 | ) | 8.69 | 2,401 | 7.32 | 1.61 | 1.67 | 0.28 | 94 | |||||||||||||||||||||||||||||||||||||||||
Year Ended March 31, 2011 | 8.76 | 0.09 | (b) | 0.22 | 0.31 | (0.09 | ) | — | (0.35 | ) | (0.44 | ) | 8.63 | 2,471 | 3.46 | 1.62 | 1.62 | 1.02 | 92 | |||||||||||||||||||||||||||||||||||||||||
Year Ended March 31, 2010 | 11.11 | 0.14 | (0.35 | ) | (0.21 | ) | (0.17 | ) | — | (1.97 | ) | (2.14 | ) | 8.76 | 3,038 | (2.05 | ) | 1.58 | 1.58 | 1.28 | 85 | |||||||||||||||||||||||||||||||||||||||
Year Ended March 31, 2009 | 10.59 | 0.22 | 0.56 | 0.78 | (0.23 | ) | — | (0.03 | ) | (0.26 | ) | 11.11 | 3,649 | 7.42 | 1.55 | 1.55 | 2.08 | 130 | ||||||||||||||||||||||||||||||||||||||||||
U.S. Government Securities Ultra-Short Bond Fund |
| |||||||||||||||||||||||||||||||||||||||||||||||||||||||||||
I Shares | ||||||||||||||||||||||||||||||||||||||||||||||||||||||||||||
Year Ended March 31, 2013 | 10.14 | 0.03 | (b) | 0.08 | 0.11 | (0.08 | ) | — | — | (0.08 | ) | 10.17 | 2,331,913 | 1.10 | 0.36 | 0.36 | 0.29 | 137 | ||||||||||||||||||||||||||||||||||||||||||
Year Ended March 31, 2012 | 10.07 | 0.06 | (b) | 0.12 | 0.18 | (0.11 | ) | — | — | (0.11 | ) | 10.14 | 2,033,765 | 1.76 | 0.36 | 0.36 | 0.55 | 70 | ||||||||||||||||||||||||||||||||||||||||||
Year Ended March 31, 2011 | 10.07 | 0.07 | (b) | 0.09 | 0.16 | (0.16 | ) | — | — | (0.16 | ) | 10.07 | 1,648,792 | 1.61 | 0.33 | 0.33 | 0.73 | 126 | (c) | |||||||||||||||||||||||||||||||||||||||||
Year Ended March 31, 2010 | 10.03 | 0.30 | 0.06 | 0.36 | (0.32 | ) | — | — | (0.32 | ) | 10.07 | 1,340,992 | 3.62 | 0.29 | 0.29 | 2.15 | 119 | |||||||||||||||||||||||||||||||||||||||||||
Year Ended March 31, 2009 | 10.03 | 0.41 | 0.01 | 0.42 | (0.42 | ) | — | — | (0.42 | ) | 10.03 | 90,675 | 4.29 | 0.28 | 0.32 | 4.00 | 92 | |||||||||||||||||||||||||||||||||||||||||||
See Notes to Financial Statements.
169
FINANCIAL HIGHLIGHTS
RIDGEWORTH FUNDS Selected Data For a Share of Beneficial Interest Outstanding Throughout the Periods Indicated.
| Net Asset Value, Beginning of Period | Net Investment Income (Loss) | Net Realized and Unrealized Gains (Losses) on Investments | Total from Operations | Dividends from Net Investment Income | Distributions from Tax Return of Capital | Distributions from Realized Capital Gains | Total Dividends and Distributions | Net Asset Value, End of Period | Net Assets End of Period (000) | Total Return(a) | Ratio of Net Expenses to Average Net Assets | Ratio of Expenses to Average Net Assets (Excluding Waivers and Reimbursements) | Ratio of Net Investment Income to Average Net Assets | Portfolio Turnover Rate | ||||||||||||||||||||||||||||||||||||||||||||||
Virginia Intermediate Municipal Bond Fund |
| |||||||||||||||||||||||||||||||||||||||||||||||||||||||||||
I Shares | ||||||||||||||||||||||||||||||||||||||||||||||||||||||||||||
Year Ended March 31, 2013 | $10.63 | $0.31 | (b) | $0.08 | $0.39 | $(0.31 | ) | $— | $(0.17 | ) | $(0.48 | ) | $10.54 | $144,889 | 3.70 | % | 0.59 | % | 0.59 | % | 2.93 | % | 33 | % | ||||||||||||||||||||||||||||||||||||
Year Ended March 31, 2012 | 10.21 | 0.33 | (b) | 0.53 | 0.86 | (0.33 | ) | — | (0.11 | ) | (0.44 | ) | 10.63 | 147,599 | 8.55 | 0.63 | 0.63 | 3.12 | 23 | |||||||||||||||||||||||||||||||||||||||||
Year Ended March 31, 2011 | 10.39 | 0.34 | (b) | (0.11 | ) | 0.23 | (0.34 | ) | — | (0.07 | ) | (0.41 | ) | 10.21 | 165,536 | 2.15 | 0.62 | 0.62 | 3.23 | 17 | ||||||||||||||||||||||||||||||||||||||||
Year Ended March 31, 2010 | 10.22 | 0.37 | 0.19 | 0.56 | (0.37 | ) | — | (0.02 | ) | (0.39 | ) | 10.39 | 191,537 | 5.58 | 0.61 | 0.61 | 3.56 | 33 | ||||||||||||||||||||||||||||||||||||||||||
Year Ended March 31, 2009 | 10.09 | 0.36 | 0.13 | 0.49 | (0.36 | ) | — | — | (0.36 | ) | 10.22 | 181,882 | 5.01 | 0.60 | 0.60 | 3.61 | 20 | |||||||||||||||||||||||||||||||||||||||||||
A Shares | ||||||||||||||||||||||||||||||||||||||||||||||||||||||||||||
Year Ended March 31, 2013 | 10.63 | 0.30 | (b) | 0.07 | 0.37 | (0.30 | ) | — | (0.17 | ) | (0.47 | ) | 10.53 | 10,996 | 3.45 | 0.74 | 0.74 | 2.78 | 33 | |||||||||||||||||||||||||||||||||||||||||
Year Ended March 31, 2012 | 10.21 | 0.31 | (b) | 0.53 | 0.84 | (0.31 | ) | — | (0.11 | ) | (0.42 | ) | 10.63 | 12,509 | 8.38 | 0.78 | 0.78 | 2.97 | 23 | |||||||||||||||||||||||||||||||||||||||||
Year Ended March 31, 2011 | 10.39 | 0.32 | (b) | (0.11 | ) | 0.21 | (0.32 | ) | — | (0.07 | ) | (0.39 | ) | 10.21 | 12,471 | 2.00 | 0.77 | 0.77 | 3.09 | 17 | ||||||||||||||||||||||||||||||||||||||||
Year Ended March 31, 2010 | 10.22 | 0.35 | 0.20 | 0.55 | (0.36 | ) | — | (0.02 | ) | (0.38 | ) | 10.39 | 14,236 | 5.44 | 0.75 | 0.75 | 3.35 | 33 | ||||||||||||||||||||||||||||||||||||||||||
Year Ended March 31, 2009 | 10.09 | 0.35 | 0.13 | 0.48 | (0.35 | ) | — | — | (0.35 | ) | 10.22 | 7,619 | 4.85 | 0.75 | 0.75 | 3.46 | 20 | |||||||||||||||||||||||||||||||||||||||||||
| (a) | Total return excludes sales charge. Not annualized for periods less than one year. |
| (b) | Per share data calculated using average shares outstanding method. |
| (c) | The amount previously reported has been adjusted to exclude an overstatement of mortgage-backed transactions and/or other corporate actions. |
| (d) | Effective at the close of business on July 31, 2009, C shares converted to R shares and C shares are no longer available for purchase. The data prior to such date reflects that of C shares. |
| (e) | Effective at the close of business on February 12, 2009, C shares converted to R shares and C shares are no longer available for purchase. The data prior to such date reflects that of C shares. |
| (f) | Rounds to less than $0.005 per share. |
| * | The Georgia Tax-Exempt Bond Fund’s net expense ratio and gross expense ratio includes interest expense of 0.09% incurred during the year ended March 31, 2009 with respect to investments in certain inverse floating rate securities. |
| # | Prior to August 1, 2009, there were no assets in Class A during the current period. Effective at the close of business July 31, 2009, Class A received assets from the conversion from Class C. The net asset value shown for the beginning of the period reflects the initial converted net asset value from Class C and the amounts shown thereafter reflect operations for Class A from August 1, 2009 through March 31, 2010. |
| ## | Class A was operational during a portion of the year only. Amounts reflect performance for the period of time the class had operations, which was 280 days during the period for Maryland Municipal Bond Fund. The net asset value, end of period, presented for Maryland Municipal Bond Fund A Shares was as of January 6, 2009, the last day the class had shareholders. |
Amounts designated as “—” are $0 or have rounded to $0.
See Notes to Financial Statements.
170
RIDGEWORTH FUNDS March 31, 2013
| 1. | Organization |
The RidgeWorth Funds (the “Trust”) is organized as a Massachusetts business trust and is registered under the Investment Company Act of 1940, as amended (the “1940 Act”), as an open-end management investment company. The Trust is authorized to issue an unlimited number of shares without par value. The financial statements presented herein are those of the Core Bond Fund, Corporate Bond Fund, Georgia Tax-Exempt Bond Fund, High Grade Municipal Bond Fund, High Income Fund, Intermediate Bond Fund, Investment Grade Tax-Exempt Bond Fund, Limited Duration Fund, Limited-Term Federal Mortgage Securities Fund, North Carolina Tax-Exempt Bond Fund, Seix Floating Rate High Income Fund, Seix High Yield Fund, Short-Term Bond Fund, Short-Term Municipal Bond Fund, Short-Term U.S. Treasury Securities Fund, Total Return Bond Fund, Ultra-Short Bond Fund, U.S. Government Securities Fund, U.S. Government Securities Ultra-Short Bond Fund and Virginia Intermediate Municipal Bond Fund (each, a “Fund” and collectively, the “Funds”).
The Limited Duration Fund, Ultra-Short Bond Fund and U.S. Government Securities Ultra-Short Bond Fund offer I Shares only. The Georgia Tax-Exempt Bond Fund, High Grade Municipal Bond Fund, Investment Grade Tax-Exempt Bond Fund, North Carolina Tax-Exempt Bond Fund, Short-Term Municipal Bond Fund, and Virginia Intermediate Bond Fund offer I Shares and A Shares. The Core Bond Fund, High Income Fund, Intermediate Bond Fund, Seix High Yield Fund and Total Return Bond Fund offer I Shares, A Shares and R Shares. The remaining Funds offer I Shares, A Shares and C Shares.
The assets of each Fund are segregated and a shareholder’s interest is limited to the Fund in which shares are held. Each class of shares has identical rights and privileges except with respect to the fees paid under the Distribution and Service Plan, voting rights on matters affecting a single class of shares and sales charges. The A Shares of the Funds (except Limited-Term Federal Mortgage Securities Fund, Seix Floating Rate High Income Fund, Short-Term Bond Fund, Short-Term Municipal Bond Fund and Short-Term U.S. Treasury Securities Fund) have a maximum sales charge on purchases of 4.75% as a percentage of original purchase price. The A Shares of the Limited-Term Federal Mortgage Securities Fund, Seix Floating Rate High Income Fund, Short-Term Bond Fund, Short-Term Municipal Bond and Short-Term U.S. Treasury Securities Fund have a maximum sales charge on purchases of 2.50% as a percentage of original purchase price. Certain purchases of A Shares will not be subject to a front-end sales charge but will be subject to a contingent deferred sales charge (“CDSC”) of 0.50%, if redeemed within two years of purchase. The deferred sale charges may be waived from time to time for certain broker-dealers that waive payment of compensation to them. The C Shares have a maximum CDSC of 1.00% as a percentage of either the original purchase price or the next calculated price after the Funds receive a redemption request, whichever is less, if shares are redeemed within one year of purchase. There is no sales charge on purchases of I or R Shares.
The Trust’s officers and trustees are indemnified against certain liabilities arising out of the performance of their duties to the Trust. In addition, in the normal course of business, the Trust enters into contracts with its vendors and others that provide for general indemnifications. The Trust’s maximum exposure under these arrangements is unknown as this would involve future claims that may be made against the Trust. However, based on experience, the Trust expects that risk of loss to be remote.
| 2. | Significant Accounting Policies |
The following are significant accounting policies consistently followed by the Funds which are in conformity with accounting principles generally accepted in the U.S. (“GAAP”). Estimates and assumptions are required to be made regarding assets, liabilities and changes in net assets resulting from operations when financial statements are prepared. Changes in the economic environment, financial markets and any other parameters used in determining these estimates could cause actual results to differ.
(a) Investment Valuation — Debt securities are valued at the last quoted bid price provided by independent pricing vendors approved by the Board of Trustees of the Trust (the “Board”) that are based on transactions in debt obligations, quotations from bond dealers, market transactions in comparable securities and various other relationships between securities.
The Funds, in accordance with GAAP, have adopted Financial Accounting Standards Board Codification Topic 820 (“ASC Topic 820”). ASC Topic 820 establishes a single definition of fair value, creates a three-tier hierarchy as a
171
NOTES TO FINANCIAL STATEMENTS (continued)
RIDGEWORTH FUNDS March 31, 2013
framework for measuring fair value based on inputs used to value the Funds’ investments, and requires additional disclosure about fair value. The hierarchy of inputs is summarized below:
| Ÿ | Level 1— Investments whose values are based on quoted market prices in active markets, and whose values are therefore classified as Level 1 prices, include active listed equities. Investments in underlying funds are valued at their NAV daily and are classified as Level 1 prices. |
| Ÿ | Level 2 — Investments that trade in markets that are not considered to be active, but whose values are based on quoted market prices, dealer quotations or valuations provided by alternative pricing sources supported by observable inputs are classified as Level 2 prices. These generally include U.S. government and sovereign obligations, most government agency securities, investment-grade corporate bonds, certain asset and mortgage backed products, less liquid listed equities, and state, municipal and provincial obligations. |
| Ÿ | Level 3 — Investments whose values are classified as Level 3 prices have significant unobservable inputs, as they may trade infrequently or not at all. When observable prices are not available for these securities, the funds use one or more valuation techniques for which sufficient and reliable data is available. The inputs used by the funds in estimating the value of Level 3 prices may include the original transaction price, quoted prices for similar securities or assets in active markets, completed or pending third-party transactions in the underlying investment or comparable issuers, and changes in financial ratios or cash flows. Level 3 prices may also be adjusted to reflect illiquidity and/or non-transferability, with the amount of such discount estimated by the funds in the absence of market information. Assumptions used by the funds due to the lack of observable inputs may significantly impact the resulting fair value and therefore the funds’ results of operations. |
The inputs or methodology used for valuing securities are not necessarily an indication of the risk associated with investing in those securities.
The Funds use valuation techniques to measure fair value that are consistent with the market approach and/or income approach, depending on the type of security and the particular circumstance. The market approach uses prices and other relevant information generated by market transactions involving identical or comparable securities. The income approach uses valuation techniques to discount estimated future cash flows to present value.
The independent pricing vendor may value debt securities at an evaluated bid price by employing methodologies that utilize actual market transactions, broker-supplied valuations, and/or other methodologies designed to identify the market value for such securities and such securities are considered Level 2 in the fair value hierarchy. Publicly-traded foreign government debt securities are typically traded internationally in the over-the-counter market and are valued at the bid prices as of the close of business of that market and such securities are considered Level 2 in the fair value hierarchy. Futures contracts are valued daily at the settlement price established by the board of trade or exchange on which they are traded and such securities may be considered Level 1 in the fair value hierarchy. Equity securities for which market quotations are available are valued at the last reported sales price or official closing price on the primary market or exchange on which they trade and such securities may be considered Level 1 in the fair value hierarchy.
When reliable prices are not readily available, such as when the value of a security has been significantly affected by events after the close of the exchange or market on which the security is principally traded, but before each Fund calculates its net asset value, each of the Funds values these securities in accordance with the Pricing and Valuation Procedures approved by the Board. The Pricing and Valuation Procedures are performed and monitored by a Valuation Committee (the “Committee”) designated by the Board. Some of the more common reasons which may necessitate that a security be fair valued in accordance with the Pricing and Valuation Procedures include, but are not limited to: if a subadviser determines that the valuation of a security does not reflect its fair value, the security’s primary trading market is temporarily closed at a time when under normal conditions it would be open; or the security’s primary pricing source is not able or willing to provide a price. When a security is fair valued in accordance with the Pricing and Valuation Procedures, the Committee determines the value after taking into consideration relevant information reasonably available to the Committee. Under the Pricing and Valuation Procedures, such securities may be considered Level 2 or Level 3 in the fair value hierarchy. Short-term obligations with maturities of 60 days or less are valued at amortized cost, which approximates fair value and such securities are considered Level 2 in the fair value hierarchy.
172
NOTES TO FINANCIAL STATEMENTS (continued)
RIDGEWORTH FUNDS March 31, 2013
The following is a summary of the inputs used in valuing the Funds’ assets and liabilities carried at fair value as of March 31, 2013:
Asset Valuation Inputs
| Level 1 - Quoted Prices | Level 2 - Other Significant Observable Inputs | Level 3 - Significant Unobservable Inputs | Total | |||||||||||||
Core Bond Fund | ||||||||||||||||
Asset-Backed Securities1 | $— | $4,361,855 | $— | $4,361,855 | ||||||||||||
Collateralized Mortgage Obligations1 | — | 30,453,728 | — | 30,453,728 | ||||||||||||
Corporate Bonds1 | — | 88,160,235 | — | 88,160,235 | ||||||||||||
U.S. Government Agency Mortgages1 | — | 103,655,560 | — | 103,655,560 | ||||||||||||
U.S. Treasury Obligations1 | — | 158,737,514 | — | 158,737,514 | ||||||||||||
Preferred Stocks1 | 3,483,956 | — | — | 3,483,956 | ||||||||||||
Money Market Fund | 30,909,791 | — | — | 30,909,791 | ||||||||||||
|
|
|
|
|
|
|
| |||||||||
Total Investments | 34,393,747 | 385,368,892 | — | 419,762,639 | ||||||||||||
|
|
|
|
|
|
|
| |||||||||
Corporate Bond Fund | ||||||||||||||||
Corporate Bonds1 | — | 66,831,194 | — | 66,831,194 | ||||||||||||
Preferred Stocks1 | 3,255,109 | — | — | 3,255,109 | ||||||||||||
Money Market Fund | 1,785,944 | — | — | 1,785,944 | ||||||||||||
|
|
|
|
|
|
|
| |||||||||
Total Investments | 5,041,053 | 66,831,194 | — | 71,872,247 | ||||||||||||
|
|
|
|
|
|
|
| |||||||||
Georgia Tax-Exempt Bond Fund | ||||||||||||||||
Municipal Bonds2 | — | 146,555,311 | — | 146,555,311 | ||||||||||||
Money Market Fund | 9,819,881 | — | — | 9,819,881 | ||||||||||||
|
|
|
|
|
|
|
| |||||||||
Total Investments | 9,819,881 | 146,555,311 | — | 156,375,192 | ||||||||||||
|
|
|
|
|
|
|
| |||||||||
High Grade Municipal Bond Fund | ||||||||||||||||
Municipal Bonds2 | — | 57,368,094 | — | 57,368,094 | ||||||||||||
Money Market Fund | 10,187,447 | — | — | 10,187,447 | ||||||||||||
|
|
|
|
|
|
|
| |||||||||
Total Investments | 10,187,447 | 57,368,094 | — | 67,555,541 | ||||||||||||
|
|
|
|
|
|
|
| |||||||||
High Income Fund | ||||||||||||||||
Bank Loans1 | — | 31,087,854 | — | 31,087,854 | ||||||||||||
Corporate Bonds1 | — | 806,284,157 | 0 | 4 | 806,284,157 | |||||||||||
Convertible Corporate Bond1 | — | 2,080,650 | — | 2,080,650 | ||||||||||||
Preferred Stock1 | 3,294,192 | — | — | 3,294,192 | ||||||||||||
Convertible Preferred Stock1 | 7,154,448 | — | — | 7,154,448 | ||||||||||||
Common Stock1 | — | 794,610 | — | 794,610 | ||||||||||||
Short-Term Investment | — | 70,317,458 | — | 70,317,458 | ||||||||||||
Money Market Fund | 67,039,336 | — | — | 67,039,336 | ||||||||||||
|
|
|
|
|
|
|
| |||||||||
Total Investments | 77,487,976 | 910,564,729 | 0 | 4 | 988,052,705 | |||||||||||
|
|
|
|
|
|
|
| |||||||||
Intermediate Bond Fund | ||||||||||||||||
Collateralized Mortgage Obligation1 | — | 1,814,795 | — | 1,814,795 | ||||||||||||
Corporate Bonds1 | — | 255,252,960 | — | 255,252,960 | ||||||||||||
U.S. Government Agency Mortgages1 | — | 67,401,940 | — | 67,401,940 | ||||||||||||
U.S. Treasury Obligations1 | — | 605,730,834 | — | 605,730,834 | ||||||||||||
Preferred Stocks1 | 11,714,304 | — | — | 11,714,304 | ||||||||||||
Short-Term Investment | — | 2,034,885 | — | 2,034,885 | ||||||||||||
Money Market Fund | 931,089 | — | — | 931,089 | ||||||||||||
|
|
|
|
|
|
|
| |||||||||
Total Investments | 12,645,393 | 932,235,414 | — | 944,880,807 | ||||||||||||
|
|
|
|
|
|
|
| |||||||||
Investment Grade Tax-Exempt Bond Fund | ||||||||||||||||
Municipal Bonds2 | — | 940,853,387 | — | 940,853,387 | ||||||||||||
Money Market Fund | 92,683,724 | — | — | 92,683,724 | ||||||||||||
|
|
|
|
|
|
|
| |||||||||
Total Investments | 92,683,724 | 940,853,387 | — | 1,033,537,111 | ||||||||||||
|
|
|
|
|
|
|
| |||||||||
173
NOTES TO FINANCIAL STATEMENTS (continued)
RIDGEWORTH FUNDS March 31, 2013
| Level 1 - Quoted Prices | Level 2 - Other Significant Observable Inputs | Level 3 - Significant Unobservable Inputs | Total | |||||||||||||
Limited Duration Fund | ||||||||||||||||
Asset-Backed Securities1 | $— | $800,000 | $— | $800,000 | ||||||||||||
Collateralized Mortgage Obligations1 | — | 6,925,998 | — | 6,925,998 | ||||||||||||
U.S. Government Agency Mortgages1 | — | 608,041 | — | 608,041 | ||||||||||||
Money Market Fund | 1,026,778 | — | — | 1,026,778 | ||||||||||||
|
|
|
|
|
|
|
| |||||||||
Total Investments | 1,026,778 | 8,334,039 | — | 9,360,817 | ||||||||||||
|
|
|
|
|
|
|
| |||||||||
Limited-Term Federal Mortgage Securities Fund | ||||||||||||||||
Collateralized Mortgage Obligations1 | — | 2,935,740 | — | 2,935,740 | ||||||||||||
U.S. Government Agency Mortgages1 | — | 13,673,900 | — | 13,673,900 | ||||||||||||
U.S. Treasury Obligation1 | — | 303,797 | — | 303,797 | ||||||||||||
Money Market Fund | 1,044,967 | — | — | 1,044,967 | ||||||||||||
|
|
|
|
|
|
|
| |||||||||
Total Investments | 1,044,967 | 16,913,437 | — | 17,958,404 | ||||||||||||
|
|
|
|
|
|
|
| |||||||||
North Carolina Tax-Exempt Bond Fund | ||||||||||||||||
Municipal Bonds2 | — | 47,510,593 | — | 47,510,593 | ||||||||||||
Money Market Fund | 4,219,295 | — | — | 4,219,295 | ||||||||||||
|
|
|
|
|
|
|
| |||||||||
Total Investments | 4,219,295 | 47,510,593 | — | 51,729,888 | ||||||||||||
|
|
|
|
|
|
|
| |||||||||
Seix Floating Rate High Income Fund | ||||||||||||||||
Bank Loans1 | — | 5,149,793,200 | — | 5,149,793,200 | ||||||||||||
Corporate Bonds1 | — | 309,242,942 | 0 | 4 | 309,242,942 | |||||||||||
Preferred Stocks1 | 2,557,480 | — | — | 2,557,480 | ||||||||||||
Common Stock1 | — | 1,035,555 | — | 1,035,555 | ||||||||||||
Money Market Fund | 1,290,295,065 | — | — | 1,290,295,065 | ||||||||||||
|
|
|
|
|
|
|
| |||||||||
Total Investments | 1,292,852,545 | 5,460,071,697 | 0 | 4 | 6,752,924,242 | |||||||||||
|
|
|
|
|
|
|
| |||||||||
Seix High Yield Fund | ||||||||||||||||
Bank Loans1 | — | 101,802,199 | — | 101,802,199 | ||||||||||||
Corporate Bonds1 | — | 1,649,789,419 | — | 1,649,789,419 | ||||||||||||
Convertible Preferred Stock1 | 11,033,004 | — | — | 11,033,004 | ||||||||||||
Short-Term Investment | — | 99,836,835 | — | 99,836,835 | ||||||||||||
Money Market Fund | 129,824,361 | — | — | 129,824,361 | ||||||||||||
|
|
|
|
|
|
|
| |||||||||
Total Investments | 140,857,365 | 1,851,428,453 | — | 1,992,285,818 | ||||||||||||
|
|
|
|
|
|
|
| |||||||||
Short-Term Bond Fund | ||||||||||||||||
Asset-Backed Securities1 | — | 10,136,560 | — | 10,136,560 | ||||||||||||
Collateralized Mortgage Obligations1 | — | 18,260,110 | — | 18,260,110 | ||||||||||||
Corporate Bonds1 | — | 40,575,928 | — | 40,575,928 | ||||||||||||
Municipal Bond2 | — | 2,676,017 | — | 2,676,017 | ||||||||||||
U.S. Government Agency Mortgages1 | — | 9,552,505 | — | 9,552,505 | ||||||||||||
Money Market Fund | 1,879,549 | — | — | 1,879,549 | ||||||||||||
|
|
|
|
|
|
|
| |||||||||
Total Investments | 1,879,549 | 81,201,120 | — | 83,080,669 | ||||||||||||
|
|
|
|
|
|
|
| |||||||||
Short-Term Municipal Bond Fund | ||||||||||||||||
Municipal Bonds2 | — | 13,513,665 | — | 13,513,665 | ||||||||||||
Money Market Fund | 2,345,242 | — | — | 2,345,242 | ||||||||||||
|
|
|
|
|
|
|
| |||||||||
Total Investments | 2,345,242 | 13,513,665 | — | 15,858,907 | ||||||||||||
|
|
|
|
|
|
|
| |||||||||
Short-Term U.S. Treasury Securities Fund | ||||||||||||||||
U.S. Treasury Obligations1 | — | 12,021,521 | — | 12,021,521 | ||||||||||||
Money Market Fund | 93,932 | — | — | 93,932 | ||||||||||||
|
|
|
|
|
|
|
| |||||||||
Total Investments | 93,932 | 12,021,521 | — | 12,115,453 | ||||||||||||
|
|
|
|
|
|
|
| |||||||||
174
NOTES TO FINANCIAL STATEMENTS (continued)
RIDGEWORTH FUNDS March 31, 2013
| Level 1 - Quoted Prices | Level 2 - Other Significant Observable Inputs | Level 3 - Significant Unobservable Inputs | Total | |||||||||||||
Total Return Bond Fund | ||||||||||||||||
Asset-Backed Securities1 | $— | $19,190,238 | $— | $19,190,238 | ||||||||||||
Collateralized Mortgage Obligations1 | — | 95,013,451 | — | 95,013,451 | ||||||||||||
Bank Loans1 | — | 80,345,571 | — | 80,345,571 | ||||||||||||
Corporate Bonds1 | — | 263,994,526 | — | 263,994,526 | ||||||||||||
U.S. Government Agency Mortgages1 | — | 341,370,657 | — | 341,370,657 | ||||||||||||
U.S. Treasury Obligations1 | — | 506,539,316 | — | 506,539,316 | ||||||||||||
Preferred Stocks1 | 11,047,698 | — | — | 11,047,698 | ||||||||||||
Short-Term Investment | — | 51,812,500 | — | 51,812,500 | ||||||||||||
Money Market Fund | 82,480,896 | — | — | 82,480,896 | ||||||||||||
|
|
|
|
|
|
|
| |||||||||
Total Investments | 93,528,594 | 1,358,266,259 | — | 1,451,794,853 | ||||||||||||
|
|
|
|
|
|
|
| |||||||||
Other Financial Instruments3 | ||||||||||||||||
Credit Default Swap Contracts – Buy Protection | ||||||||||||||||
Credit Risk | — | 98,777 | — | 98,777 | ||||||||||||
Forward Foreign Currency Contracts | ||||||||||||||||
Foreign Currency Risk | — | 882,410 | — | 882,410 | ||||||||||||
|
|
|
|
|
|
|
| |||||||||
Total Investments | 93,528,594 | 1,359,247,446 | — | 1,452,776,040 | ||||||||||||
|
|
|
|
|
|
|
| |||||||||
Ultra-Short Bond Fund | ||||||||||||||||
Asset-Backed Securities1 | — | 3,884,724 | — | 3,884,724 | ||||||||||||
Collateralized Mortgage Obligations1 | — | 28,840,870 | — | 28,840,870 | ||||||||||||
Corporate Bonds1 | — | 55,836,588 | — | 55,836,588 | ||||||||||||
Municipal Bonds2 | — | 1,923,731 | — | 1,923,731 | ||||||||||||
U.S. Government Agency Mortgages1 | — | 16,913,460 | — | 16,913,460 | ||||||||||||
Money Market Fund | 3,501,421 | — | — | 3,501,421 | ||||||||||||
|
|
|
|
|
|
|
| |||||||||
Total Investments | 3,501,421 | 107,399,373 | — | 110,900,794 | ||||||||||||
|
|
|
|
|
|
|
| |||||||||
U.S. Government Securities Fund | ||||||||||||||||
U.S. Treasury Obligations1 | — | 38,946,491 | — | 38,946,491 | ||||||||||||
Money Market Fund | 647,958 | — | — | 647,958 | ||||||||||||
|
|
|
|
|
|
|
| |||||||||
Total Investments | 647,958 | 38,946,491 | — | 39,594,449 | ||||||||||||
|
|
|
|
|
|
|
| |||||||||
U.S. Government Securities Ultra-Short Bond Fund | ||||||||||||||||
Asset-Backed Security1 | — | 2,180,961 | — | 2,180,961 | ||||||||||||
Collateralized Mortgage Obligations1 | — | 661,026,705 | — | 661,026,705 | ||||||||||||
U.S. Government Agency Mortgages1 | — | 1,595,922,247 | — | 1,595,922,247 | ||||||||||||
Money Market Fund | 78,785,547 | — | — | 78,785,547 | ||||||||||||
|
|
|
|
|
|
|
| |||||||||
Total Investments | 78,785,547 | 2,259,129,913 | — | 2,337,915,460 | ||||||||||||
|
|
|
|
|
|
|
| |||||||||
Virginia Intermediate Municipal Bond Fund | ||||||||||||||||
Municipal Bonds2 | — | 149,008,419 | — | 149,008,419 | ||||||||||||
Money Market Fund | 6,207,605 | — | — | 6,207,605 | ||||||||||||
|
|
|
|
|
|
|
| |||||||||
Total Investments | 6,207,605 | 149,008,419 | — | 155,216,024 | ||||||||||||
|
|
|
|
|
|
|
| |||||||||
| Liability Valuation Inputs | ||||||||||||||||
| Level 1 - Quoted Prices | Level 2 - Other Significant Observable Inputs | Level 3 - Significant Unobservable Inputs | Total | |||||||||||||
Total Return Bond Fund | ||||||||||||||||
Other Financial Instruments3 | ||||||||||||||||
Credit Default Swap Contracts – Buy Protection | ||||||||||||||||
Credit Risk | $— | $(4,033,600 | ) | $— | $(4,033,600 | ) | ||||||||||
Forward Foreign Currency Contracts | ||||||||||||||||
Foreign Currency Risk | — | (803,809 | ) | — | (803,809 | ) | ||||||||||
|
|
|
|
|
|
|
| |||||||||
Total Investments | — | (4,837,409 | ) | — | (4,837,409 | ) | ||||||||||
|
|
|
|
|
|
|
| |||||||||
175
NOTES TO FINANCIAL STATEMENTS (continued)
RIDGEWORTH FUNDS March 31, 2013
| Level 1 - Quoted Prices | Level 2 - Other Significant Observable Inputs | Level 3 - Significant Unobservable Inputs | Total | |||||||||||||
U.S. Government Securities Ultra-Short Bond Fund | ||||||||||||||||
Other Financial Instruments3 | ||||||||||||||||
Futures Contracts | ||||||||||||||||
Interest Rate Risk | $(90,306 | ) | $— | $— | $(90,306 | ) | ||||||||||
|
|
|
|
|
|
|
| |||||||||
Total Investments | (90,306 | ) | — | — | (90,306 | ) | ||||||||||
|
|
|
|
|
|
|
| |||||||||
| 1 | Please see the Schedules of Portfolio Investments for Sector or Country Classification. |
| 2 | Please see the Schedules of Portfolio Investments for State Classification. |
| 3 | Other Financial Instruments are derivative instruments not reflected in the value of Total Investments in the Schedules of Portfolio Investments, such as credit default swaps, forward foreign currency contracts and futures, which are valued at the unrealized appreciation (depreciation) on the instrument. |
| 4 | As of March 31, 2013, the securities designated as Level 3 were fair valued using significant unobservable inputs under procedures adopted by the Board. Such valuations were based on quotations from principal market makers. Level 3 roll forwards and change in unrealized appreciation (depreciation) of these Level 3 securities held at fiscal year end are presented below. |
The following is a reconciliation of investments as of March 31, 2013 in which significant unobservable inputs (Level 3) were used in determining fair value:
| Balance as of 3/31/2012 | Accrued Discounts (Premiums) | Realized Gain (Loss) | Change in Unrealized Appreciation (Depreciation) | Purchases | Sales | Transfers into Level 3 | Transfers out of Level 3 | Balance as of 3/31/2013 | Net Change in Unrealized Appreciation (Depreciation) from Investments Still Held as of 3/31/2013 | |||||||||||||||||||||||||||||||
High Income Fund |
| |||||||||||||||||||||||||||||||||||||||
Corporate Bonds | ||||||||||||||||||||||||||||||||||||||||
Auto Manufacturers | $539,820 | $— | $— | $(213,687 | ) | $— | $— | $— | $(326,133 | ) | $— | $(213,687 | ) | |||||||||||||||||||||||||||
|
|
|
|
|
|
|
|
|
|
|
|
|
|
|
|
|
|
|
| |||||||||||||||||||||
Seix Floating Rate High Income Fund |
| |||||||||||||||||||||||||||||||||||||||
Corporate Bonds | ||||||||||||||||||||||||||||||||||||||||
Auto Manufacturers | $200,000 | $— | $— | $(79,817 | ) | $— | $— | $— | $(120,183 | ) | $— | $(79,817 | ) | |||||||||||||||||||||||||||
|
|
|
|
|
|
|
|
|
|
|
|
|
|
|
|
|
|
|
| |||||||||||||||||||||
The Fund’s policy is to disclose transfers between levels based on valuations at the end of the reporting period. Each portfolio may hold securities which are periodically fair valued in accordance with the Pricing and Valuation Procedures. This may result in movements between Level 1 and Level 2 throughout the period. There were no transfers between Levels 1 or 2 as of March 31, 2013, based on the valuation input levels assigned to securities on March 31, 2012. Transfers out of Level 3 were due to a restructuring of the issuing company’s capital structure during the year.
(b) Security Transactions and Investment Income — Security transactions are accounted for on a trade date basis. Interest income, adjusted for amortization of premium and accretion of discount over the life of the securities, is recorded on the accrual basis. Dividend income is recorded on the ex-dividend date or as soon as practicable after the Funds determine the existence of a dividend declaration after exercising reasonable due diligence. Foreign dividend income is recorded on the ex-dividend date or as soon as practicable after the Funds determine the existence of a dividend declaration after exercising reasonable due diligence. The cost of investments sold is determined by use of the specific identification method. To the extent any issuer defaults or a credit event occurs that impacts the issuer, the Funds may halt any additional interest income accruals and consider the Funds’ ability to realize interest accrued up to the date of default or credit event.
(c) Distributions to Shareholders — Distributions from net investment income of each of the Funds are declared each business day to shareholders of record and are paid monthly. Distributions of net realized capital gains, if any, are declared at least annually. Distributions to shareholders from each of the Funds are recorded on the ex-dividend date and are determined in accordance with income tax regulations, which may differ from GAAP.
(d) Expense and Share Class Accounting — Expenses that are directly related to a specific Fund are charged to that Fund. Other operating expenses of the Trust are allocated pro-rata to the Funds on the basis of relative net assets
176
NOTES TO FINANCIAL STATEMENTS (continued)
RIDGEWORTH FUNDS March 31, 2013
or another appropriate basis. Investment income, common expenses and realized/unrealized capital gains (losses) on investments are allocated to the various classes of the Funds on the basis of relative daily net assets of each share class. Fees relating to a specific class are charged directly to that share class.
(e) Securities Traded on a To-Be-Announced Basis — Certain Funds may trade securities on a to-be-announced (“TBA”) basis. In a TBA transaction, the Fund commits to purchasing or selling securities which have not yet been issued by the issuer and for which specific information, such as the face amount, maturity date and underlying pool of investments in U.S. government agency mortgage pass-through securities, is not announced. Securities purchased on a TBA basis are not settled until they are delivered to the Fund. Beginning on the date the Fund enters into a TBA transaction, cash, U.S. government securities or other liquid high-grade debt obligations are segregated in an amount equal in value to the purchase price of the TBA security. These securities are subject to market fluctuations and their current value is determined in the same manner as for other securities.
(f) Derivative Instruments — Certain Funds may enter into derivative contracts for purposes of pursuing their investment objective, to use as a substitute for a purchase or sale of a position in the underlying assets and/or as part of a strategy designed to reduce exposure to other risks. Open derivative positions at March 31, 2013 are included on each Fund’s Schedule of Portfolio Investments.
(g) Forward Foreign Currency Contracts — Certain Funds may enter into forward foreign currency contracts to hedge against foreign currency exchange rate risk on non-U.S. dollar denominated securities or to facilitate settlement of a foreign currency denominated portfolio transaction. A forward foreign currency contract is an agreement between two parties to buy and sell a currency at a set price with delivery and settlement at a future date. The contract is marked-to-market daily and the change in value is recorded by the Fund as an unrealized gain or loss. When a forward foreign currency contract is closed, through either delivery or offset by entering into another forward foreign currency contract, the Fund recognizes a realized gain or loss equal to the difference between the value of the contract at the time it was opened and the value of the contract at the time it is closed.
Forward foreign currency contracts involve elements of market risk in excess of the amounts reflected on the Statements of Assets and Liabilities. The Funds bear the risk of an unfavorable change in the foreign exchange rate underlying the forward foreign currency contract. Risks may also arise upon entering into these contracts from the potential inability of the counterparties to meet the terms of their contracts.
(h) Futures Contracts — Certain Funds may enter into futures contracts to gain exposure to, or hedge against, changes in interest rates or gain exposure to, or hedge against, changes in certain asset classes. A futures contract represents a commitment for the future purchase or sale of an asset at a specified price on a specified date.
Upon entering into a futures contract, the Fund is required to deposit cash or cash equivalents with a broker in an amount equal to a certain percentage of the contract amount. This is known as the “initial margin” and subsequent payments (“variation margin”) are made or received by the Fund each day, depending on the daily fluctuation in the value of the contract. For certain futures, including foreign denominated futures, variation margin is not settled daily, but is recorded as a net variation margin payable or receivable. Futures contracts are valued daily at the settlement price established by the board of trade or exchange on which they are traded. The daily changes in contract value are recorded as unrealized gains or losses in the Statements of Operations and the Fund recognizes a realized gain or loss when the contract is closed.
Futures contracts involve, to varying degrees, risk of loss in excess of the amounts reflected in the Statements of Assets and Liabilities. In addition, there is the risk that the Funds may not be able to enter into a closing transaction because of an illiquid secondary market.
(i) Foreign Currency Translation — Investment securities and other assets and liabilities denominated in foreign currencies are translated into U.S. dollar amounts based upon prevailing exchange rates, as of the close of regular trading on the New York Stock Exchange (usually 4:00 p.m. Eastern Time), on the date of valuation. Purchases and sales of investment securities and income and expense items denominated in foreign currencies are translated into U.S. dollar amounts based upon prevailing exchange rates on the respective dates of such transactions.
The Funds do not isolate that portion of the results of operations resulting from fluctuations in foreign exchange rates on investments from the fluctuations arising from changes in market prices of securities held. Such fluctuations are included with the net realized and unrealized gain or loss on investments and foreign currencies.
177
NOTES TO FINANCIAL STATEMENTS (continued)
RIDGEWORTH FUNDS March 31, 2013
Net realized foreign exchange gains or losses arise from sales of foreign currencies, including gains and losses on forward foreign currency contracts, currency gains or losses realized between the trade and settlement dates on securities transactions, and the difference between the amounts of dividends, interest and foreign withholding taxes recorded and amount actual received.
(j) Swap Contracts — Certain Funds may invest in swap contracts for the purpose of managing exposure to interest rate, credit or market risk, or for other purposes. The use of swap contracts involves risks that are different from those associated with ordinary portfolio transactions.
Swap contracts are marked-to-market daily using an independent pricing vendor and changes in value are recorded as unrealized appreciation or depreciation in the Statements of Assets and Liabilities. Gains or losses are realized upon termination of the swap contract. Collateral, in the form of restricted cash or securities, may be required to be held in segregated accounts with the Funds’ custodian in compliance with the terms of the swap contracts. Securities posted as collateral for swap contracts are identified in the Schedules of Portfolio Investments and restricted cash, if any, is identified on the Statements of Assets and Liabilities. Risks may exceed amounts recorded in the Statements of Assets and Liabilities. These risks include changes in the returns of the underlying instruments, failure of the counterparties to perform under the contracts’ terms, and the possible lack of liquidity with respect to the swap contracts. Payments received or made at the beginning of the measurement period are reflected as a premium or deposit, respectively, on the Statements of Assets and Liabilities. These upfront payments are amortized over the life of the swap and are recognized as realized gain or loss in the Statements of Operations. Net periodic payments received or paid by the Fund are recognized as a realized gain or loss in the Statements of Operations.
Credit Default Swaps
Certain Funds enter into credit default swap (“CDS”) contracts for investment purposes, to manage its credit risk or to add leverage. CDS contracts involve one party making a stream of payments to another party in exchange for the right to receive a specified return in the event of a default by a third party, typically corporate or sovereign issuers, on a specified obligation, or in the event of a write-down, principal shortfall, interest shortfall or default of all or part of the referenced entities comprising a credit index. The Funds may use a CDS contract to provide protection against defaults of the issuers (i.e., to reduce risk where the Funds have exposure to an issuer), or to take an active long or short position with respect to the likelihood of a particular issuer’s default.
As a seller of protection, the Funds generally receive an upfront payment or a stream of payments throughout the term of the swap contract provided that there is no credit event. These amounts of potential payments will be partially offset by any recovery of values from the respective referenced obligations. As a seller of protection, a Fund effectively adds leverage to its portfolio because, in addition to its total net assets, a Fund is subject to investment exposure on the notional amount of the swap contract. As a buyer of protection, a Fund generally receives an amount up to the notional value of the swap contract if a credit event occurs.
The Funds’ maximum risk of loss from counterparty risk, as the protection buyer, is the fair value of the swap contract (this risk is mitigated by the posting of collateral by the counterparty to the Fund to cover the Funds’ exposure to the counterparty). As the protection seller, the Funds’ maximum risk is the notional amount of the contract. CDS contracts are considered to have credit risk-related contingent features since they require payment by the protection seller to the protection buyer upon the occurrence of a defined credit event.
Implied spreads are the theoretical prices a lender receives for credit default protection. When spreads rise, market perceived credit risk rises and when spreads fall, market perceived credit risk falls. The implied credit spread of a particular referenced entity reflects the cost of buying/selling protection and may include upfront payments required to enter into the contract. Wider credit spreads and decreasing market values, when compared to the notional amount of the swap, represent a deterioration of the referenced entity’s credit soundness and a greater likelihood or risk of default or other credit event occurring as defined under the terms of the contract. Credit spreads utilized in determining the period end market value of CDS contracts on corporate or sovereign issues are disclosed on the Schedules of Portfolio Investments and serve as an indicator of the current status of the payment/performance risk and represent the likelihood or risk of default for credit derivatives. For CDS contracts on asset-backed securities and credit indices, the quoted market prices and resulting values, particularly in relation to the notional amount of the contract as well as the annual payment rate, serve as an indication of the current status of the payment/performance risk.
178
NOTES TO FINANCIAL STATEMENTS (continued)
RIDGEWORTH FUNDS March 31, 2013
Entering into a CDS contract involves, to varying degrees, elements of credit, market and documentation risk in excess of the related amounts recognized on the Statements of Assets and Liabilities. Such risks involve the possibility that there will be no liquid market for these contracts, and that the counterparty to the contract may default on its obligation to perform or disagree as to the meaning of the contractual terms in the contract, and that there are unfavorable changes in net interest rates.
Interest Rate Swaps
Certain Funds may enter into interest rate swap (“IRS”) contracts to manage exposure to interest rate risk. IRS contracts are agreements between two parties to exchange cash flows based on a notional principal amount. The Fund may elect to pay a fixed rate and receive a floating rate, or, receive a fixed rate and pay a floating rate on a notional principal amount. IRS contracts are marked-to-market daily based upon quotations from market makers and the change, if any, is recorded as unrealized appreciation or depreciation in the Statements of Assets and Liabilities. When a swap contract is terminated early, the Fund records a realized gain or loss equal to the difference between the original cost and the settlement amount of the closing transaction.
The risks of IRS contracts include changes in market conditions that will affect the value of the contract or changes in the present value of the future cash flow streams and the possible inability of the counterparty to fulfill its obligations under the contract. The Fund’s maximum risk of loss from counterparty credit risk is the discounted net value of the cash flows to be received from the counterparty over the contract’s remaining life, to the extent that this amount is positive. This risk is mitigated by the posting of collateral by the counterparty to the Fund to cover the Fund’s exposure to the counterparty.
The fair value of derivative instruments not accounted for as hedging instruments on the Statements of Assets and Liabilities and the effect of derivative instruments not accounted for as hedging instruments, on the Statements of Operations as of March 31, 2013, is presented in the table below:
| Credit Risk | Foreign Exchange Risk | Interest Rate Risk | Total | |||||||||||||
| High Income Fund | ||||||||||||||||
Realized Gain (Loss)# | ||||||||||||||||
Swap Contracts | $ | (5,555 | ) | $ | — | $ | — | $ | (5,555 | ) | ||||||
|
|
|
|
|
|
|
| |||||||||
Total Realized Gain (Loss) | $ | (5,555 | ) | $ | — | $ | — | $ | (5,555 | ) | ||||||
|
|
|
|
|
|
|
| |||||||||
Number of Contracts, Notional Amounts or Shares† | ||||||||||||||||
Swap Contracts | $ | 10,000,000 | $ | — | $ | — | $ | 10,000,000 | ||||||||
|
|
|
|
|
|
|
| |||||||||
| Seix High Yield Fund | ||||||||||||||||
Realized Gain (Loss)# | ||||||||||||||||
Swap Contracts | $ | (1,169,396 | ) | $ | — | $ | — | $ | (1,169,396 | ) | ||||||
|
|
|
|
|
|
|
| |||||||||
Total Realized Gain (Loss) | $ | (1,169,396 | ) | $ | — | $ | — | $ | (1,169,396 | ) | ||||||
|
|
|
|
|
|
|
| |||||||||
Number of Contracts, Notional Amounts or Shares† | ||||||||||||||||
Swap Contracts | $ | 47,600,000 | $ | — | $ | — | $ | 47,600,000 | ||||||||
|
|
|
|
|
|
|
| |||||||||
| Short Term Bond Fund | ||||||||||||||||
Realized Gain (Loss)# | ||||||||||||||||
Futures Contracts | $ | — | $ | — | $ | (293,028 | ) | $ | (293,028 | ) | ||||||
|
|
|
|
|
|
|
| |||||||||
Total Realized Gain (Loss) | $ | — | $ | — | $ | (293,028 | ) | $ | (293,028 | ) | ||||||
|
|
|
|
|
|
|
| |||||||||
Change in Appreciation (Depreciation)## | ||||||||||||||||
Futures Contracts | $ | — | $ | — | $ | (94,925 | ) | $ | (94,925 | ) | ||||||
|
|
|
|
|
|
|
| |||||||||
Total Change in Appreciation (Depreciation) | $ | — | $ | — | $ | (94,925 | ) | $ | (94,925 | ) | ||||||
|
|
|
|
|
|
|
| |||||||||
Number of Contracts, Notional Amounts or Shares† | ||||||||||||||||
Futures Contracts | — | — | (75 | ) | (75 | ) | ||||||||||
|
|
|
|
|
|
|
| |||||||||
| Total Return Bond Fund | ||||||||||||||||
Asset Derivatives | ||||||||||||||||
Swap Contracts* | $ | 98,777 | $ | — | $ | — | $ | 98,777 | ||||||||
|
|
|
|
|
|
|
| |||||||||
Forward Foreign Currency Contracts* | — | 882,410 | — | 882,410 | ||||||||||||
|
|
|
|
|
|
|
| |||||||||
Total Value | $ | 98,777 | $ | 882,410 | $ | — | $ | 981,187 | ||||||||
|
|
|
|
|
|
|
| |||||||||
179
NOTES TO FINANCIAL STATEMENTS (continued)
RIDGEWORTH FUNDS March 31, 2013
| Credit Risk | Foreign Exchange Risk | Interest Rate Risk | Total | |||||||||||||
Liability Derivatives | ||||||||||||||||
Swap Agreements^ | $ | (4,033,600 | ) | $ | — | $ | — | $ | (4,033,600 | ) | ||||||
|
|
|
|
|
|
|
| |||||||||
Forward Foreign Currency Contracts^ | — | (803,809 | ) | — | (803,809 | ) | ||||||||||
|
|
|
|
|
|
|
| |||||||||
Total Value | $ | (4,033,600 | ) | $ | (803,809 | ) | $ | — | $ | (4,837,409 | ) | |||||
|
|
|
|
|
|
|
| |||||||||
Realized Gain (Loss)# | ||||||||||||||||
Forward Foreign Currency Contracts | $ | — | $ | 6,198,428 | $ | — | $ | 6,198,428 | ||||||||
|
|
|
|
|
|
|
| |||||||||
Swap Contracts | (6,213,713 | ) | — | — | (6,213,713 | ) | ||||||||||
|
|
|
|
|
|
|
| �� | ||||||||
Total Realized Gain (Loss) | $ | (6,213,713 | ) | $ | 6,198,428 | $ | — | $ | (15,285 | ) | ||||||
|
|
|
|
|
|
|
| |||||||||
Change in Appreciation (Depreciation)## | ||||||||||||||||
Forward Foreign Currency Contracts | $ | — | $ | 214,851 | $ | — | $ | 214,851 | ||||||||
|
|
|
|
|
|
|
| |||||||||
Swap Contracts | (83,434 | ) | — | — | (83,434 | ) | ||||||||||
|
|
|
|
|
|
|
| |||||||||
Total Change in Appreciation (Depreciation) | $ | (83,434 | ) | $ | 214,851 | $ | — | $ | 131,417 | |||||||
|
|
|
|
|
|
|
| |||||||||
Number of Contracts, Notional Amounts or Shares† | ||||||||||||||||
Forward Foreign Currency Contracts | $ | — | $ | 236,348,501 | $ | — | $ | 236,348,501 | ||||||||
|
|
|
|
|
|
|
| |||||||||
Swap Contracts | $ | 68,386,500 | $ | — | $ | — | $ | 68,386,500 | ||||||||
|
|
|
|
|
|
|
| |||||||||
| Ultra-Short Bond Fund | ||||||||||||||||
Realized Gain (Loss)# | ||||||||||||||||
Futures Contracts | $ | — | $ | — | $ | (40,779 | ) | $ | (40,779 | ) | ||||||
|
|
|
|
|
|
|
| |||||||||
Total Realized Gain (Loss) | $ | — | $ | — | $ | (40,779 | ) | $ | (40,779 | ) | ||||||
|
|
|
|
|
|
|
| |||||||||
Number of Contracts, Notional Amounts or Shares† | ||||||||||||||||
Futures Contracts | — | — | (42 | ) | (42 | ) | ||||||||||
|
|
|
|
|
|
|
| |||||||||
| U.S. Government Securities Ultra-Short Bond Fund | ||||||||||||||||
Liability Derivatives | ||||||||||||||||
Futures Contracts^^ | $ | — | $ | — | $ | (90,306 | ) | $ | (90,306 | ) | ||||||
|
|
|
|
|
|
|
| |||||||||
Total Value | $ | — | $ | — | $ | (90,306 | ) | $ | (90,306 | ) | ||||||
|
|
|
|
|
|
|
| |||||||||
Realized Gain (Loss)# | ||||||||||||||||
Futures Contracts | $ | — | $ | — | $ | (2,321,948 | ) | $ | (2,321,948 | ) | ||||||
|
|
|
|
|
|
|
| |||||||||
Total Realized Gain (Loss) | $ | — | $ | — | $ | (2,321,948 | ) | $ | (2,321,948 | ) | ||||||
|
|
|
|
|
|
|
| |||||||||
Change in Appreciation (Depreciation)## | ||||||||||||||||
Futures Contracts | $ | — | $ | — | $ | (90,306 | ) | $ | (90,306 | ) | ||||||
|
|
|
|
|
|
|
| |||||||||
Total Change in Appreciation (Depreciation) | $ | — | $ | — | $ | (90,306 | ) | $ | (90,306 | ) | ||||||
|
|
|
|
|
|
|
| |||||||||
Number of Contracts, Notional Amounts or Shares† | ||||||||||||||||
Futures Contracts | — | — | (621 | ) | (621 | ) | ||||||||||
|
|
|
|
|
|
|
| |||||||||
| # | Statements of Operations location: Amounts are included in net realized gain (loss) on investment transactions, futures contracts, swap contracts, or foreign currency transactions, as applicable. |
| † | Amount(s) disclosed represent the average number of contracts for futures contracts, notional amounts for forward currency contracts and swap contracts, which are indicative of volume of this derivative type, for the months that the Fund held such derivatives during the year ended March 31, 2013. |
| ## | Statements of Operations location: Amounts are included in net change in unrealized appreciation (depreciation) on investment transactions, foreign currency transactions, futures contracts, swap contracts, or translation of assets and liabilities in forward foreign currencies, as applicable. |
| * | Statements of Assets and Liabilities location: Investments, at value, Receivables from unrealized appreciation on forward foreign currency contracts, or appreciated swap contract at value, as applicable. |
| ^ | Statements of Assets and Liabilities location: Unrealized depreciation on forward foreign currency contracts, or depreciated swap contracts, at value, as applicable. |
| ^^ | Cumulative appreciation (depreciation) on futures contracts is reported in “Futures Contracts”. The outstanding variation margin, if any, is reported within the Statements of Assets and Liabilities. |
(k) Securities Lending — Each Fund may lend portfolio securities to brokers, dealers and other financial organizations that meet capital and other credit requirements or other criteria established by the Board. These loans may not exceed either (i) 50% of the sum of the market value of all securities of the Fund and the market
180
NOTES TO FINANCIAL STATEMENTS (continued)
RIDGEWORTH FUNDS March 31, 2013
value of securities purchased with cash collateral or (ii) 33.33% of the total market value of all securities of the Fund. No Fund will lend portfolio securities to its investment adviser, subadviser, or its affiliates unless it has applied for and received specific authority to do so from the Securities and Exchange Commission. Loans of portfolio securities are required to be fully collateralized by cash, letters of credit or U.S. government securities. The initial value of the collateral must be at least 102% of the market value of the securities loaned, if the securities loaned are U.S. securities (105% for non-U.S. securities); and maintained in an amount equal to at least 100% (103% for non-U.S. securities) thereafter. However, due to market fluctuations during the day, the value of securities loaned on a particular day may exceed the value of collateral. On each business day, the amount of collateral is adjusted based on the prior day’s market fluctuations and the current day’s lending activity. Income from lending activity is determined by the amount of interest earned on collateral, less any amounts payable to the borrowers of the securities and the lending agent. Lending securities involves certain risks, including the risk that a Fund may be delayed or prevented from recovering the collateral if the borrower fails to return the securities. A fee will be obtained from the borrower if letters of credit or U.S. government securities are used as collateral.
The cash collateral received is aggregated in a joint account by the Funds, providing RidgeWorth Investments a pool of cash to invest in short-term investments that have a remaining maturity of 397 days or less. The Funds are joint participants with other affiliated Funds of the Trust that are not presented in this report. At March 31, 2013, the cash collateral received by the Funds was pooled and invested in the following securities. Each of the Funds participating in securities lending at March 31, 2013 owned a pro-rata portion of the assets and liabilities listed below:
| Shares | Value | |||||||
JPMorgan U.S. Government Money Market Fund, Capital Shares, 0.01% | 93,304,017 | $ | 93,304,017 | |||||
State Street Institutional U.S. Government Money Market Fund, Institutional Class, 0.01% | 222,355,346 | 222,355,346 | ||||||
|
| |||||||
Total Investments (Cost $ 315,659,363) | 315,659,363 | |||||||
Amount due to Lending Agent | (26,873 | ) | ||||||
|
| |||||||
Net Investment Value | $ | 315,632,490 | ||||||
|
| |||||||
The following Funds paid securities lending fees to the lending agent during the year ended March 31, 2013, which have been netted against Income from Securities Lending on the Statements of Operations. These fees are presented below:
Fund | Fee | |||
Core Bond Fund | $832 | |||
High Income Fund | 44,416 | |||
Intermediate Bond Fund | 6,635 | |||
Seix High Yield Fund | 87,642 | |||
Total Return Bond Fund | 4,498 | |||
(l) When-Issued Securities and Forward Commitments — Delivery and payment for securities that have been purchased by a Fund on a forward commitment or when-issued basis can take place up to a month or more after the transaction date at a fixed price. During this period, such securities are subject to market fluctuations. The purchase of securities on a when-issued or forward commitment basis may increase the volatility of a Fund’s net asset value if the Fund makes such investments while remaining substantially fully invested. A Fund records when-issued securities on trade date and will segregate or earmark liquid assets in an amount at least equal in value to its commitments to purchase when-issued and forward commitment securities or engage in other appropriate measures to “cover” its obligation. When-issued securities and the segregated liquid assets associated with such investments are presented within the Funds’ Schedules of Portfolio Investments.
(m) Bank Loans — Certain Funds may invest in first and second lien senior floating-rate loans (“bank loans”). These loans are made by banks and other large financial institutions to various companies and are senior in the borrowing companies’ capital structure. Coupon rates are floating, not fixed, and are tied to a benchmark lending rate. A Fund records an investment when the borrower withdraws money and records the interest as earned. Some types of senior loans in which these Funds may invest require that an open loan for a specific amount be continually offered to a borrower. These types of senior loans, commonly referred to as revolvers, contractually obligate the lender (and therefore those with an interest in the loan) to fund the loan at the borrower’s discretion. A Fund will maintain, on a daily basis, high quality, liquid assets in an amount at least equal in value to its
181
NOTES TO FINANCIAL STATEMENTS (continued)
RIDGEWORTH FUNDS March 31, 2013
contractual obligation to fulfill the revolving senior loan. Therefore, a Fund must have funds sufficient to cover its contractual obligation. At March 31, 2013 Seix Floating Rate High Income Fund and Total Return Bond Fund had unfunded loan commitments.
(n) Restricted Securities — Certain Funds’ investments are restricted as to resale. As of March 31, 2013 all of these restricted securities have been deemed liquid by the Funds’ Investment Adviser based upon procedures approved by the Board unless stated otherwise in the Funds’ Schedules of Portfolio Investments.
(o) Credit and Market Risk — Certain Funds’ investments in securities that are collateralized by residential real estate mortgages are subject to certain credit and liquidity risks. When market conditions result in an increase in default rates of the underlying mortgages and the foreclosure values of underlying real estate properties are materially below the outstanding amount of these underlying mortgages, collection of the full amount of accrued interest and principal on these investments may be doubtful. Such market conditions may significantly impair the value and liquidity of these investments and may result in a lack of correlation between their credit ratings and values.
(p) Foreign Investment Risks — Certain Funds’ investments in foreign securities may involve risks not present in domestic investments. Since securities may be denominated in foreign currencies, may require settlement in foreign currencies or pay interest or dividends in foreign currencies, changes in the relationship of these foreign currencies to the U.S. dollar can significantly affect the value of the investments and earnings of the Fund. Foreign investments may also subject the Fund to foreign government exchange restrictions, expropriation, taxation or other political, social or economic developments, all of which affect the market and/or credit risk of the investments.
(q) Counterparty Risk and Credit-Risk-Related Contingent Features of Derivative Instruments — Certain Funds may invest in certain securities or engage in other transactions where the Funds are exposed to counterparty credit risk in addition to broader market risks. The Funds may invest in securities of issuers, which may also be considered counterparties as trading partners in other transactions. This may increase the risk of loss in the event of default or bankruptcy by the counterparty or if the counterparty otherwise fails to meet its contractual obligations. The Funds’ investment manager attempts to mitigate counterparty risk by (i) periodically assessing the creditworthiness of its trading partners, (ii) monitoring and/or limiting the amount of its net exposure to each individual counterparty based on its assessment and (iii) requiring collateral from the counterparty for certain transactions. Market events and changes in overall economic conditions may impact the assessment of such counterparty risk by the investment manager. In addition, declines in the values of underlying collateral received may expose the Funds to increased risk of loss.
(r) Other Risks — Certain Funds may invest in high yield corporate, government, and other debt instruments of U.S. and non-U.S. issuers. High yield securities involve greater risk of default or downgrade and are more volatile than investment grade securities. A Fund’s concentration of investments in securities of issuers located in a specific region or state, subjects that Fund to the economic and government policies of the region or state, and may increase risk versus that of a fund whose investments are more diversified. Please refer to each Fund’s prospectus for additional risks that made be associated with the Funds.
(s) Federal and Other Taxes — It is the Funds’ policy to comply with the federal income and excise tax requirements of the Internal Revenue Code of 1986 (the “Code”), as amended, applicable to regulated investment companies. Accordingly, the Funds intend to distribute taxable income and net realized gains, if any, to shareholders in accordance with timing requirements imposed by the Code. Therefore, no federal or state income tax provision is required in the Funds’ financial statements.
Management has analyzed the Funds’ tax positions taken on income tax returns for all open tax years and has concluded that as of March 31, 2013, no provision for income tax is required in the Funds’ financial statements. The Funds’ federal and state income and federal excise tax returns for tax years for which the applicable statutes of limitations have not expired are subject to examination by the Internal Revenue Service and state departments of revenue.
Under the applicable foreign tax laws, a withholding tax may be imposed on interest, dividends and capital gains at various rates.
182
NOTES TO FINANCIAL STATEMENTS (continued)
RIDGEWORTH FUNDS March 31, 2013
(t) Reclassification — GAAP requires that certain components of net assets be reclassified to reflect permanent differences between financial and tax reporting. These reclassifications have no effect on net assets or net asset value per share.
| 3. | Investment Adviser and Other Service Providers |
Investment Adviser — RidgeWorth Investments (“Investment Adviser”), a majority-owned subsidiary of SunTrust Banks, Inc. (“SunTrust”), serves as the investment adviser to the Funds. The Trust and the Investment adviser have entered into an investment advisory agreement (“Advisory Agreement”). The Investment Adviser is a money—management holding company with multiple style-focused investment boutiques (“Subadvisers”). The Subadvisers for each of the Funds are as follows: Seix Investment Advisors LLC (“Seix”) serves as the Subadviser for the Core Bond Fund, Corporate Bond Fund, High Income Fund, Intermediate Bond Fund, Limited Duration Fund, Limited-Term Federal Mortgage Securities Fund, Seix Floating Rate High Income Fund, Seix High Yield Fund, Total Return Bond Fund and U.S. Government Securities Fund; and StableRiver Capital Management LLC (“StableRiver”) serves as the Subadviser for the Georgia Tax-Exempt Bond Fund, High Grade Municipal Bond Fund, Investment Grade Tax-Exempt Bond Fund, North Carolina Tax-Exempt Bond Fund, Short-Term Bond Fund, Short-Term Municipal Bond Fund, Short-Term U.S. Treasury Securities Fund, Ultra-Short Bond Fund, U.S. Government Securities Ultra-Short Bond Fund, and Virginia Intermediate Municipal Bond Fund. Seix and StableRiver are each wholly-owned subsidiaries of the Investment Adviser. The Investment Adviser pays the Subadvisers out of the investment advisory fees it receives from the Funds.
Under the terms of the Advisory Agreement, the Funds are charged annual advisory fees, which are computed daily and paid monthly based upon average daily net assets. Effective August 1, 2012 the investment advisory fees changed as described in the table below. Breakpoints are used in computing the overall annual advisory fee. The maximum annual advisory fee is charged on average daily net assets of each Fund up to $500 million. A discount of 5% applies on the next $500 million, and a discount of 10% applies on amounts over $1 billion. Fee rates for the year ended March 31, 2013 were as follows:
Fund | Maximum Annual Advisory Fee prior to August 1, 2012 | Maximum Annual Advisory Fee as of August 1, 2012 | Discounted Annual Advisory Fee | Advisory Fees Waived/Expense Reimbursed | Net Annual Fees Paid* | |||||||||||||||
Core Bond Fund | 0.25 | % | 0.25 | % | 0.25 | % | — | % | 0.25 | % | ||||||||||
Corporate Bond Fund | 0.40 | 0.40 | 0.40 | (0.01 | ) | 0.39 | ||||||||||||||
Georgia Tax-Exempt Bond Fund | 0.55 | 0.50 | 0.52 | — | 0.52 | |||||||||||||||
High Grade Municipal Bond Fund | 0.55 | 0.50 | 0.52 | (0.03 | ) | 0.49 | ||||||||||||||
High Income Fund | 0.60 | 0.55 | 0.55 | (0.01 | ) | 0.54 | ||||||||||||||
Intermediate Bond Fund | 0.25 | 0.25 | 0.24 | — | 0.24 | |||||||||||||||
Investment Grade Tax-Exempt Bond Fund | 0.50 | 0.50 | 0.49 | (0.01 | ) | 0.48 | ||||||||||||||
Limited Duration Fund | 0.10 | 0.10 | 0.10 | (0.03 | ) | 0.07 | ||||||||||||||
Limited-Term Federal Mortgage Securities Fund | 0.50 | 0.50 | 0.50 | (0.19 | ) | 0.31 | ||||||||||||||
North Carolina Tax-Exempt Bond Fund | 0.55 | 0.50 | 0.52 | — | 0.52 | |||||||||||||||
Seix Floating Rate High Income Fund | 0.45 | 0.45 | 0.41 | — | 0.41 | |||||||||||||||
Seix High Yield Fund | 0.45 | 0.45 | 0.42 | — | 0.42 | |||||||||||||||
Short-Term Bond Fund | 0.40 | 0.40 | 0.40 | — | 0.40 | |||||||||||||||
Short-Term Municipal Bond Fund | 0.55 | 0.35 | 0.35 | (0.32 | ) | 0.03 | ||||||||||||||
Short-Term U.S. Treasury Securities Fund | 0.40 | 0.35 | 0.37 | (0.31 | ) | 0.06 | ||||||||||||||
Total Return Bond Fund | 0.25 | 0.25 | 0.24 | (0.01 | ) | 0.23 | ||||||||||||||
Ultra-Short Bond Fund | 0.22 | 0.22 | 0.22 | — | 0.22 | |||||||||||||||
U.S. Government Securities Fund | 0.50 | 0.50 | 0.50 | (0.06 | ) | 0.44 | ||||||||||||||
U.S. Government Securities Ultra-Short Bond Fund | 0.20 | 0.20 | 0.19 | — | 0.19 | |||||||||||||||
Virginia Intermediate Municipal Bond Fund | 0.55 | 0.50 | 0.52 | — | 0.52 | |||||||||||||||
| * | Aggregate annual fees paid to the Investment Adviser, who pays the applicable Subadviser a portion of the fees for its services to the Funds. Amounts designated as “—” are 0%. |
183
NOTES TO FINANCIAL STATEMENTS (continued)
RIDGEWORTH FUNDS March 31, 2013
The Investment Adviser and the applicable Subadviser have contractually agreed, until at least August 1, 2013, to waive fees and/or reimburse expenses for each of the following Funds to the extent necessary to maintain each Fund’s total annual fund operating expenses (excluding, as applicable, taxes, brokerage commissions, substitute dividend expenses on securities sold short, interest expense, extraordinary expenses and indirect expenses attributable to the Fund’s investment in other funds), expressed as a percentage of average daily net assets, as noted below:
| Contractual Expense Limitations August 1, 2012 to March 31, 2013 | ||||||||||||||||
Fund | I Shares | A Shares | C Shares | R Shares | ||||||||||||
Core Bond Fund | 0.45 | % | 0.72 | % | — | % | 1.05 | % | ||||||||
Corporate Bond Fund | 0.62 | 0.93 | 1.60 | — | ||||||||||||
Georgia Tax-Exempt Bond Fund | 0.65 | 0.80 | — | — | ||||||||||||
High Grade Municipal Bond Fund | 0.65 | 0.80 | — | — | ||||||||||||
High Income Fund | 0.76 | 1.06 | — | 1.46 | ||||||||||||
Intermediate Bond Fund | 0.44 | 0.70 | — | 1.20 | ||||||||||||
Investment Grade Tax-Exempt Bond Fund | 0.65 | 0.80 | — | — | ||||||||||||
Limited Duration Fund | 0.32 | — | — | — | ||||||||||||
Limited-Term Federal Mortgage Securities Fund | 0.66 | 0.86 | 1.66 | — | ||||||||||||
North Carolina Tax-Exempt Bond Fund | 0.65 | 0.80 | — | — | ||||||||||||
Seix Floating Rate High Income Fund | 0.62 | 0.95 | 1.61 | — | ||||||||||||
Seix High Yield Fund | 0.61 | 0.87 | 1.30 | — | ||||||||||||
Short-Term Bond Fund | 0.58 | 0.77 | — | 1.57 | ||||||||||||
Short-Term Municipal Bond Fund | 0.55 | 0.70 | — | — | ||||||||||||
Short-Term U.S. Treasury Securities Fund | 0.55 | 0.73 | 1.55 | — | ||||||||||||
Total Return Bond Fund | 0.43 | 0.68 | — | 0.99 | ||||||||||||
Ultra-Short Bond Fund | 0.42 | — | — | — | ||||||||||||
U.S. Government Securities Fund | 0.72 | 0.95 | 1.70 | — | ||||||||||||
U.S. Government Securities Ultra-Short Bond Fund | 0.43 | — | — | — | ||||||||||||
Virginia Intermediate Municipal Bond Fund | 0.65 | 0.80 | — | — | ||||||||||||
For the period April 1, 2012 to July 31, 2012 the Contractual Expense Limitations were as follows:
Fund | I Shares | A Shares | C Shares | |||||||||||
High Grade Municipal Bond Fund | 0.65 | % | 0.80 | % | — | % | ||||||||
Limited-Term Federal Mortgage Securities Fund | 0.66 | 0.86 | 1.66 | |||||||||||
Short-Term Municipal Bond Fund | 0.65 | 0.80 | — | |||||||||||
Short-Term U.S. Treasury Securities Fund | 0.55 | 0.73 | 1.55 | |||||||||||
Under the Expense Limitation Agreement, the Investment Adviser may retain the difference between the Contractual Expense Limitation identified above and the actual total expenses to recapture any of its prior contractual waivers or reimbursements at a date not to exceed three years from the date of such waivers or reimbursements. Such repayments shall be made monthly, but only to the extent that such repayments would not cause the annualized total expense ratio to exceed the contractual expense limitation in place at that time. During the year ended March 31, 2013, the Investment Adviser did not recapture any of its prior contractual waivers or reimbursements. As of March 31, 2013, the cumulative potential recoupments recoverable pursuant to this agreement are as follows:
| Expires | ||||||||||||
Fund | 2014 | 2015 | 2016 | |||||||||
Core Bond Fund | $— | $— | $1,227 | |||||||||
Corporate Bond Fund | — | — | 10,691 | |||||||||
High Grade Municipal Bond Fund | 32,038 | 11,057 | 17,205 | |||||||||
High Income Fund | — | — | 85,675 | |||||||||
Intermediate Bond Fund | — | — | 580 | |||||||||
184
NOTES TO FINANCIAL STATEMENTS (continued)
RIDGEWORTH FUNDS March 31, 2013
| Expires | ||||||||||||
Fund | 2014 | 2015 | 2016 | |||||||||
Investment Grade Tax-Exempt Bond Fund | $— | $— | $53,503 | |||||||||
Limited Duration Fund | — | — | 3,221 | |||||||||
Limited-Term Federal Mortgage Securities Fund | — | 26,833 | 49,640 | |||||||||
Short-Term Bond Fund | — | — | 2,491 | |||||||||
Short-Term Municipal Bond Fund | — | 22,692 | 36,571 | |||||||||
Short-Term U.S. Treasury Securities Fund | 18,813 | 44,910 | 49,079 | |||||||||
Total Return Bond Fund | — | — | 134,555 | |||||||||
U.S. Government Securities Fund | — | — | 26,551 | |||||||||
Amounts designated as “—” are $0.
During the year ended March 31, 2013, the Investment Adviser also voluntarily waived fees in certain Funds in order to maintain a more competitive expense ratio for shareholders. These voluntary waivers are not available to be recouped by the Investment Adviser in subsequent years.
The Investment Adviser has voluntarily undertaken to reduce and/or subsidize certain expenses of the Limited-Term Federal Mortgage Securities Fund, Short-Term Bond Fund, Short-Term U.S. Treasury Securities Fund and U.S. Government Securities Fund to the extent necessary to maintain a minimum annualized yield of 0.00% for each of the Fund’s share classes. This voluntary expense reduction and/or expense subsidy may be modified or discontinued at any time without prior notice. There can be no assurance that this fee reduction will be sufficient to avoid any loss. During the year ended March 31, 2013, Short-Term Municipal Bond Fund, Short-Term U.S. Securities Fund and U.S. Government Securities Fund had voluntary reimbursements in the amount of $7,587, $80 and $10,381, respectively.
Fund Accounting, Custody, Administration, and Transfer Agency — State Street Bank and Trust Company (“State Street Bank”) serves as the fund accounting agent and custodian for the Trust pursuant to a Master Custodian Agreement. The custodian is responsible for the safekeeping of the assets of the Funds and the fund accounting agent is responsible for calculating the Funds’ net asset values. State Street Bank, as the Funds’ custodian and fund accounting agent, is paid on the basis of net assets and transaction costs of the Funds. State Street Bank also serves as the administrator for the Trust pursuant to an Administration Agreement. State Street Bank, as the Funds’ administrator, is paid on the basis of net assets of the RidgeWorth investment company complex and fees are allocated among the series of the Trust, on the basis of relative net assets.
Boston Financial Data Services, Inc. (“BFDS”) serves as the transfer agent to the Trust pursuant to a Transfer Agency and Service Agreement. BFDS is paid on the basis of net assets, per account fees and certain transaction costs.
Custodian Credits —The Funds have an agreement with their custodian under which custody fees may be reduced by balance credits. These credits, if any, are shown as a reduction of total expenses on the Statements of Operations.
Distribution — The Trust and RidgeWorth Distributors LLC (the “Distributor”) are parties to a Distribution Agreement.
In addition, with respect to the A Shares, C Shares and R Shares, the Distributor receives amounts, pursuant to a Distribution and Service Plan, based upon average daily net assets of each respective class, which are computed daily and paid monthly. For the year ended March 31, 2013, the Distributor did not retain any of the front end sales charges assessed on the sale of Class A shares. For the year ended March 31, 2013, the Distributor did not retain any commissions from contingent deferred sales charges assessed on redemptions of Class C Shares. These fees, expressed as a percentage of average daily net assets, for the year ended March 31, 2013, were as follows:
Fund | A Share Distribution and Service Fee | C Share Distribution and Service Fee | R Share Distribution and Service Fee | |||||||||
Core Bond Fund | 0.30 | % | N/A | % | 0.50 | % | ||||||
Corporate Bond Fund | 0.30 | 1.00 | N/A | |||||||||
Georgia Tax-Exempt Bond Fund | 0.15 | N/A | N/A | |||||||||
High Grade Municipal Bond Fund | 0.15 | N/A | N/A | |||||||||
High Income Fund | 0.30 | N/A | 0.50 | |||||||||
185
NOTES TO FINANCIAL STATEMENTS (continued)
RIDGEWORTH FUNDS March 31, 2013
Fund | A Share Distribution and Service Fee | C Share Distribution and Service Fee | R Share Distribution and Service Fee | |||||||||
Intermediate Bond Fund | 0.25 | % | N/A | % | 0.50 | % | ||||||
Investment Grade Tax-Exempt Bond Fund | 0.30 | N/A | N/A | |||||||||
Limited-Term Federal Mortgage Securities Fund | 0.20 | 1.00 | N/A | |||||||||
North Carolina Tax-Exempt Bond Fund | 0.15 | N/A | N/A | |||||||||
Seix Floating Rate High Income Fund | 0.30 | 1.00 | N/A | |||||||||
Seix High Yield Fund | �� | 0.25 | N/A | 0.50 | ||||||||
Short-Term Bond Fund | 0.20 | 1.00 | N/A | |||||||||
Short-Term Municipal Bond Fund | 0.15 | N/A | N/A | |||||||||
Short-Term U.S. Treasury Securities Fund | 0.18 | 1.00 | N/A | |||||||||
Total Return Bond Fund | 0.25 | N/A | 0.50 | |||||||||
U.S. Government Securities Fund | 0.30 | 1.00 | N/A | |||||||||
Virginia Intermediate Municipal Bond Fund | 0.15 | N/A | N/A | |||||||||
Shareholder Servicing Fees — The Core Bond Fund, High Income Fund, Intermediate Bond Fund, Seix High Yield Fund, and Total Return Bond Fund have adopted a shareholder services fee for the R Shares. Each Fund pays specified benefit plans or other financial service firms for shareholder support services they provide, at a rate of up to 0.25% of the average daily net assets of R Shares. In addition, effective August 1, 2012, the Funds have adopted shareholder services fees for the I Shares and A Shares of such Funds. Each of these Funds (or class thereof, as the case may be) may pay to financial institutions that provide certain services to the Funds a services fee. The services may include, among others, providing general shareholder liaison services (including responding to shareholder inquiries) providing information on shareholder investments, and establishing and maintaining shareholder accounts and records. The Funds may pay a shareholder services fee up to an annual rate of average daily net assets of a Fund’s I Shares or A Shares as follows:
Fund | Maximum Shareholder Servicing Fee for I Shares and A Shares Prior to August 1, 2012 | Maximum Shareholder Servicing Fee for I Shares and A Shares Effective August 1, 2012 | ||||||
Core Bond Fund | 0.15 | % | 0.20 | % | ||||
Corporate Bond Fund | 0.15 | 0.20 | ||||||
Georgia Tax-Exempt Bond Fund | N/A | 0.20 | ||||||
High Grade Municipal Bond Fund | N/A | 0.20 | ||||||
High Income Fund | N/A | 0.20 | ||||||
Intermediate Bond Fund | 0.15 | 0.20 | ||||||
Investment Grade Tax-Exempt Bond Fund | 0.15 | 0.20 | ||||||
Limited Duration Fund | 0.15 | 0.20 | ||||||
Limited-Term Federal Mortgage Securities Fund | 0.15 | 0.20 | ||||||
North Carolina Tax-Exempt Bond Fund | N/A | 0.20 | ||||||
Seix Floating Rate High Income Fund | 0.15 | 0.20 | ||||||
Seix High Yield Fund | 0.15 | 0.20 | ||||||
Short-Term Bond Fund | 0.15 | 0.20 | ||||||
Short-Term Municipal Bond Fund | 0.15 | 0.20 | ||||||
Short-Term U.S. Treasury Securities Fund | 0.15 | 0.20 | ||||||
Total Return Bond Fund | 0.15 | 0.20 | ||||||
Ultra-Short Bond Fund | 0.15 | 0.20 | ||||||
U.S. Government Securities Fund | 0.15 | 0.20 | ||||||
U.S. Government Securities Ultra-Short Bond Fund | 0.15 | 0.20 | ||||||
Virginia Intermediate Municipal Bond Fund | N/A | 0.20 | ||||||
Other Fees — The Investment Adviser provides compliance and certain administrative services to the Trust to ensure compliance with applicable laws and regulations. For the year ended March 31, 2013, the Investment Adviser was paid $1,475,865 for these services. Foreside Compliance Services, LLC (“FCS”), an affiliate of the
186
NOTES TO FINANCIAL STATEMENTS (continued)
RIDGEWORTH FUNDS March 31, 2013
Distributor, provided Chief Compliance Officer services until May 31, 2012. FCS continues to provide an Anti-Money Laundering Officer/ Identity Theft Prevention Officer (“AML Officer”) to the Trust. Foreside Management Services, LLC (“FMS”), an affiliate of the Distributor, provided a Principal Financial Officer (“PFO”) and Treasurer to the Trust until August 30, 2012. Fees paid to FCS and FMS pursuant to these agreements are reflected on the Statements of Operations as a component of the caption “Other Fees”.
Neither FCS nor FMS, nor any of their officers or employees who serve as an officer of the Trust, has any role in determining the Funds’ investment policies or which securities are to be purchased or sold by the Trust or its Funds. Certain officers or employees of FCS and FMS are also officers of the Trust.
Certain officers of the Trust are also officers or employees of the Investment Adviser, FCS, FMS and/or the administrator. Such officers receive no fees from the Trust for serving as officers of the Trust.
Each of the Trustees receive an annual retainer and an additional fee for each meeting attended, plus reimbursement for certain expenses incurred. Trustees receive an additional fee for attendance at committee meetings. Information on the aggregate remuneration paid to the Trustees can be found on the Statements of Operations.
| 4. | Capital Stock Transactions |
Transactions in capital shares and dollars for the years ended March 31 were as follows:
| Shares Issued | Shares Reinvested | Shares Redeemed | Net Increase (Decrease) in Shares Outstanding | Proceeds from Shares Issued | Dividends Reinvested | Cost of Shares Redeemed | Change in Net Assets from Capital Transactions | |||||||||||||||||||||||||
Core Bond Fund | ||||||||||||||||||||||||||||||||
I Shares | ||||||||||||||||||||||||||||||||
3/31/2013 | 15,150,156 | 1,003,059 | (22,520,877 | ) | (6,367,662 | ) | $170,890,899 | $11,280,597 | $(252,118,768 | ) | $(69,947,272 | ) | ||||||||||||||||||||
3/31/2012 | 20,392,980 | 2,090,943 | (9,816,795 | ) | 12,667,128 | 230,213,597 | 23,374,153 | (110,968,103 | ) | 142,619,647 | ||||||||||||||||||||||
A Shares | ||||||||||||||||||||||||||||||||
3/31/2013 | 542,528 | 47,009 | (686,479 | ) | (96,942 | ) | 6,113,163 | 528,383 | (7,733,353 | ) | (1,091,807 | ) | ||||||||||||||||||||
3/31/2012 | 765,877 | 128,545 | (678,486 | ) | 215,936 | 8,751,020 | 1,436,036 | (7,725,376 | ) | 2,461,680 | ||||||||||||||||||||||
R Shares | ||||||||||||||||||||||||||||||||
3/31/2013 | 7,978 | 10,828 | (95,008 | ) | (76,202 | ) | 89,791 | 121,788 | (1,070,887 | ) | (859,308 | ) | ||||||||||||||||||||
3/31/2012 | 29,536 | 37,600 | (134,931 | ) | (67,795 | ) | 341,015 | 419,820 | (1,527,018 | ) | (766,183 | ) | ||||||||||||||||||||
Corporate Bond Fund |
| |||||||||||||||||||||||||||||||
I Shares | ||||||||||||||||||||||||||||||||
3/31/2013 | 1,982,956 | 434,731 | (2,962,851 | ) | (545,164 | ) | 18,861,172 | 4,110,294 | (28,188,098 | ) | (5,216,632 | ) | ||||||||||||||||||||
3/31/2012 | 2,239,751 | 547,019 | (3,251,132 | ) | (464,362 | ) | 21,709,020 | 5,159,258 | (31,426,786 | ) | (4,558,508 | ) | ||||||||||||||||||||
A Shares | ||||||||||||||||||||||||||||||||
3/31/2013 | 327,279 | 22,799 | (380,224 | ) | (30,146 | ) | 3,102,078 | 216,200 | (3,630,328 | ) | (312,050 | ) | ||||||||||||||||||||
3/31/2012 | 349,895 | 22,375 | (140,098 | ) | 232,172 | 3,388,655 | 211,520 | (1,348,793 | ) | 2,251,382 | ||||||||||||||||||||||
C Shares | ||||||||||||||||||||||||||||||||
3/31/2013 | 103,335 | 85,637 | (475,178 | ) | (286,206 | ) | 996,415 | 807,662 | (4,518,289 | ) | (2,714,212 | ) | ||||||||||||||||||||
3/31/2012 | 389,063 | 132,375 | (250,674 | ) | 270,764 | 3,786,500 | 1,246,228 | (2,428,816 | ) | 2,603,912 | ||||||||||||||||||||||
Georgia Tax-Exempt Bond Fund |
| |||||||||||||||||||||||||||||||
I Shares | ||||||||||||||||||||||||||||||||
3/31/2013 | 2,831,504 | 20,748 | (2,923,235 | ) | (70,983 | ) | 30,603,687 | 224,250 | (31,648,061 | ) | (820,124 | ) | ||||||||||||||||||||
3/31/2012 | 2,473,798 | 26,978 | (5,122,166 | ) | (2,621,390 | ) | 25,293,185 | 276,448 | (52,043,352 | ) | (26,473,719 | ) | ||||||||||||||||||||
A Shares | ||||||||||||||||||||||||||||||||
3/31/2013 | 54,802 | 6,860 | (43,641 | ) | 18,021 | 590,388 | 74,262 | (474,378 | ) | 190,272 | ||||||||||||||||||||||
3/31/2012 | 29,451 | 8,617 | (203,039 | ) | (164,971 | ) | 309,150 | 88,410 | (2,008,080 | ) | (1,610,520 | ) | ||||||||||||||||||||
High Grade Municipal Bond Fund |
| |||||||||||||||||||||||||||||||
I Shares | ||||||||||||||||||||||||||||||||
3/31/2013 | 2,956,341 | 62,484 | (2,074,029 | ) | 944,796 | 36,263,488 | 756,064 | (25,383,903 | ) | 11,635,649 | ||||||||||||||||||||||
3/31/2012 | 563,655 | 15,614 | (1,357,468 | ) | (778,199 | ) | 6,534,232 | 180,735 | (15,441,562 | ) | (8,726,595 | ) | ||||||||||||||||||||
A Shares | ||||||||||||||||||||||||||||||||
3/31/2013 | 369,896 | 24,900 | (137,597 | ) | 257,199 | 4,526,852 | 302,002 | (1,682,718 | ) | 3,146,136 | ||||||||||||||||||||||
3/31/2012 | 193,685 | 6,994 | (243,908 | ) | (43,229 | ) | 2,304,325 | 81,083 | (2,838,042 | ) | (452,634 | ) | ||||||||||||||||||||
187
NOTES TO FINANCIAL STATEMENTS (continued)
RIDGEWORTH FUNDS March 31, 2013
| Shares Issued | Shares Reinvested | Shares Redeemed | Net Increase (Decrease) in Shares Outstanding | Proceeds from Shares Issued | Dividends Reinvested | Cost of Shares Redeemed | Change in Net Assets from Capital Transactions | |||||||||||||||||||||||||
High Income Fund |
| |||||||||||||||||||||||||||||||
I Shares | ||||||||||||||||||||||||||||||||
3/31/2013 | 63,456,336 | 4,997,397 | (44,901,177 | ) | 23,552,556 | $447,059,168 | $35,281,125 | $(316,563,071 | ) | $165,777,222 | ||||||||||||||||||||||
3/31/2012 | 78,425,514 | 4,256,915 | (53,175,628 | ) | 29,506,801 | 541,743,152 | 29,132,881 | (367,671,391 | ) | 203,204,642 | ||||||||||||||||||||||
A Shares | ||||||||||||||||||||||||||||||||
3/31/2013 | 10,886,569 | 778,455 | (9,805,619 | ) | 1,859,405 | 76,434,488 | 5,495,991 | (69,328,992 | ) | 12,601,487 | ||||||||||||||||||||||
3/31/2012 | 23,049,111 | 834,723 | (19,173,869 | ) | 4,709,965 | 160,725,436 | 5,715,726 | (131,175,324 | ) | 35,265,838 | ||||||||||||||||||||||
R Shares | ||||||||||||||||||||||||||||||||
3/31/2013 | 1,008,470 | 136,362 | (820,532 | ) | 324,300 | 7,132,330 | 961,340 | (5,773,798 | ) | 2,319,872 | ||||||||||||||||||||||
3/31/2012 | 1,487,650 | 151,213 | (841,499 | ) | 797,364 | 10,293,014 | 1,031,373 | (5,882,343 | ) | 5,442,044 | ||||||||||||||||||||||
Intermediate Bond Fund |
| |||||||||||||||||||||||||||||||
I Shares | ||||||||||||||||||||||||||||||||
3/31/2013 | 16,739,307 | 2,522,665 | (42,042,210 | ) | (22,780,238 | ) | 175,567,635 | 26,162,518 | (440,706,666 | ) | (238,976,513 | ) | ||||||||||||||||||||
3/31/2012 | 23,738,365 | 3,266,983 | (38,971,896 | ) | (11,966,548 | ) | 250,996,340 | 34,290,444 | (413,099,514 | ) | (127,812,730 | ) | ||||||||||||||||||||
A Shares | ||||||||||||||||||||||||||||||||
3/31/2013 | 329,512 | 40,273 | (494,247 | ) | (124,462 | ) | 3,462,213 | 417,927 | (5,156,768 | ) | (1,276,628 | ) | ||||||||||||||||||||
3/31/2012 | 936,767 | 45,581 | (1,148,755 | ) | (166,407 | ) | 10,050,552 | 478,569 | (12,190,515 | ) | (1,661,394 | ) | ||||||||||||||||||||
R Shares | ||||||||||||||||||||||||||||||||
3/31/2013 | 5,295 | 132 | (73,924 | ) | (68,497 | ) | 55,307 | 1,373 | (777,254 | ) | (720,574 | ) | ||||||||||||||||||||
3/31/2012 | 10,373 | 3,200 | (29,012 | ) | (15,439 | ) | 109,961 | 33,577 | (310,324 | ) | (166,786 | ) | ||||||||||||||||||||
Investment Grade Tax-Exempt Bond Fund |
| |||||||||||||||||||||||||||||||
I Shares | ||||||||||||||||||||||||||||||||
3/31/2013 | 25,364,479 | 2,556,547 | (25,177,845 | ) | 2,743,181 | 321,422,608 | 31,929,508 | (319,378,757 | ) | 33,973,359 | ||||||||||||||||||||||
3/31/2012 | 26,410,054 | 1,311,551 | (43,232,605 | ) | (15,511,000 | ) | 323,474,282 | 16,073,453 | (517,156,994 | ) | (177,609,259 | ) | ||||||||||||||||||||
A Shares | ||||||||||||||||||||||||||||||||
3/31/2013 | 627,050 | 80,768 | (770,243 | ) | (62,425 | ) | 7,963,610 | 1,008,871 | (9,745,117 | ) | (772,636 | ) | ||||||||||||||||||||
3/31/2012 | 954,544 | 43,300 | (644,985 | ) | 352,859 | 11,646,090 | 531,390 | (7,842,200 | ) | 4,335,280 | ||||||||||||||||||||||
Limited Duration Fund |
| |||||||||||||||||||||||||||||||
I Shares | ||||||||||||||||||||||||||||||||
3/31/2013 | — | 1,795 | (688,748 | ) | (686,953 | ) | — | 17,573 | (6,735,932 | ) | (6,718,359 | ) | ||||||||||||||||||||
3/31/2012 | 4 | 7,646 | (609,652 | ) | (602,002 | ) | 37 | 74,630 | (5,939,770 | ) | (5,865,103 | ) | ||||||||||||||||||||
Limited-Term Federal Mortgage Securities Fund |
| |||||||||||||||||||||||||||||||
I Shares | ||||||||||||||||||||||||||||||||
3/31/2013 | 324,611 | 16,574 | (1,774,341 | ) | (1,433,156 | ) | 3,631,796 | 185,548 | (19,879,334 | ) | (16,061,990 | ) | ||||||||||||||||||||
3/31/2012 | 1,101,980 | 37,235 | (1,794,687 | ) | (655,472 | ) | 12,082,654 | 408,087 | (19,737,886 | ) | (7,247,145 | ) | ||||||||||||||||||||
A Shares | ||||||||||||||||||||||||||||||||
3/31/2013 | 12,930 | 2,717 | (378,991 | ) | (363,344 | ) | 144,522 | 30,356 | (4,222,167 | ) | (4,047,289 | ) | ||||||||||||||||||||
3/31/2012 | 889,986 | 5,928 | (605,230 | ) | 290,684 | 9,649,651 | 64,737 | (6,584,528 | ) | 3,129,860 | ||||||||||||||||||||||
C Shares | ||||||||||||||||||||||||||||||||
3/31/2013 | 19,025 | 2,933 | (145,883 | ) | (123,925 | ) | 212,895 | 32,830 | (1,632,101 | ) | (1,386,376 | ) | ||||||||||||||||||||
3/31/2012 | 41,588 | 6,307 | (79,032 | ) | (31,137 | ) | 457,164 | 69,020 | (867,606 | ) | (341,422 | ) | ||||||||||||||||||||
North Carolina Tax-Exempt Bond Fund |
| |||||||||||||||||||||||||||||||
I Shares | ||||||||||||||||||||||||||||||||
3/31/2013 | 814,545 | 4,249 | (856,799 | ) | (38,005 | ) | 8,700,825 | 45,645 | (9,203,531 | ) | (457,061 | ) | ||||||||||||||||||||
3/31/2012 | 765,775 | 4,554 | (1,254,105 | ) | (483,776 | ) | 7,789,791 | 46,418 | (12,663,761 | ) | (4,827,552 | ) | ||||||||||||||||||||
A Shares | ||||||||||||||||||||||||||||||||
3/31/2013 | 27,037 | 858 | (3,042 | ) | 24,853 | 289,648 | 9,177 | (32,515 | ) | 266,310 | ||||||||||||||||||||||
3/31/2012 | 2,986 | 1,170 | (15,166 | ) | (11,010 | ) | 29,769 | 11,937 | (157,880 | ) | (116,174 | ) | ||||||||||||||||||||
188
NOTES TO FINANCIAL STATEMENTS (continued)
RIDGEWORTH FUNDS March 31, 2013
| Shares Issued | Shares Reinvested | Shares Redeemed | Net Increase (Decrease) in Shares Outstanding | Proceeds from Shares Issued | Dividends Reinvested | Cost of Shares Redeemed | Change in Net Assets from Capital Transactions | |||||||||||||||||||||||||
Seix Floating Rate High Income Fund |
| |||||||||||||||||||||||||||||||
I Shares | ||||||||||||||||||||||||||||||||
3/31/2013 | 404,801,992 | 12,393,422 | (166,301,380 | ) | 250,894,034 | $3,623,676,264 | $110,642,663 | $1,480,951,289) | $2,253,367,638 | |||||||||||||||||||||||
3/31/2012 | 275,791,116 | 11,186,120 | (241,379,272 | ) | 45,597,964 | 2,441,753,739 | 98,106,958 | (2,102,029,721 | ) | 437,830,976 | ||||||||||||||||||||||
A Shares | ||||||||||||||||||||||||||||||||
3/31/2013 | 7,494,467 | 186,533 | (2,545,591 | ) | 5,135,409 | 67,443,345 | 1,664,277 | (22,575,703 | ) | 46,531,919 | ||||||||||||||||||||||
3/31/2012 | 4,099,882 | 202,165 | (6,179,275 | ) | (1,877,228 | ) | 36,377,294 | 1,775,951 | (53,634,785 | ) | (15,481,540 | ) | ||||||||||||||||||||
C Shares | ||||||||||||||||||||||||||||||||
3/31/2013 | 1,666,689 | 77,164 | (686,469 | ) | 1,057,384 | 14,952,802 | 688,547 | (6,107,635 | ) | 9,533,714 | ||||||||||||||||||||||
3/31/2012 | 1,550,277 | 72,348 | (677,658 | ) | 944,967 | 13,743,006 | 634,518 | (5,893,030 | ) | 8,484,494 | ||||||||||||||||||||||
Seix High Yield Fund |
| |||||||||||||||||||||||||||||||
I Shares | ||||||||||||||||||||||||||||||||
3/31/2013 | 87,306,757 | 4,448,330 | (136,305,874 | ) | (44,550,787 | ) | 862,445,636 | 44,104,060 | (1,351,388,077 | ) | (444,838,381 | ) | ||||||||||||||||||||
3/31/2012 | 151,932,100 | 5,859,596 | (109,808,875 | ) | 47,982,821 | 1,451,525,329 | 56,756,503 | (1,057,583,078 | ) | 450,698,754 | ||||||||||||||||||||||
A Shares | ||||||||||||||||||||||||||||||||
3/31/2013 | 7,150,408 | 299,831 | (4,219,958 | ) | 3,230,281 | 69,009,998 | 2,932,488 | (41,347,650 | ) | 30,594,836 | ||||||||||||||||||||||
3/31/2012 | 9,201,234 | 153,259 | (8,919,515 | ) | 434,978 | 85,104,817 | 1,457,762 | (84,049,601 | ) | 2,512,978 | ||||||||||||||||||||||
R Shares | ||||||||||||||||||||||||||||||||
3/31/2013 | 5,113 | 8,840 | (32,159 | ) | (18,206 | ) | 50,214 | 87,833 | (316,844 | ) | (178,797 | ) | ||||||||||||||||||||
3/31/2012 | 10,317 | 10,981 | (102,436 | ) | (81,138 | ) | 102,400 | 106,378 | (1,007,659 | ) | (798,881 | ) | ||||||||||||||||||||
Short-Term Bond Fund |
| |||||||||||||||||||||||||||||||
I Shares | ||||||||||||||||||||||||||||||||
3/31/2013 | 3,470,249 | 97,589 | (26,854,233 | ) | (23,286,395 | ) | 34,716,711 | 976,861 | (268,943,424 | ) | (233,249,852 | ) | ||||||||||||||||||||
3/31/2012 | 9,453,882 | 200,834 | (13,714,068 | ) | (4,059,352 | ) | 94,318,654 | 2,000,868 | (136,769,246 | ) | (40,449,724 | ) | ||||||||||||||||||||
A Shares | ||||||||||||||||||||||||||||||||
3/31/2013 | 26,407 | 2,368 | (69,779 | ) | (41,004 | ) | 264,900 | 23,770 | (699,939 | ) | (411,269 | ) | ||||||||||||||||||||
3/31/2012 | 218,321 | 5,547 | (241,210 | ) | (17,342 | ) | 2,179,023 | 55,369 | (2,410,875 | ) | (176,483 | ) | ||||||||||||||||||||
C Shares | ||||||||||||||||||||||||||||||||
3/31/2013 | 26,988 | 1,026 | (86,555 | ) | (58,541 | ) | 270,704 | 10,289 | (867,776 | ) | (586,783 | ) | ||||||||||||||||||||
3/31/2012 | 97,766 | 2,782 | (69,133 | ) | 31,415 | 977,290 | 27,760 | (690,750 | ) | 314,300 | ||||||||||||||||||||||
Short-Term Municipal Bond Fund |
| |||||||||||||||||||||||||||||||
I Shares | ||||||||||||||||||||||||||||||||
3/31/2013 | 558,184 | 59,062 | (60,939 | ) | 556,307 | 5,751,667 | 589,875 | (651,080 | ) | 5,690,462 | ||||||||||||||||||||||
3/31/2012 | 621,809 | 4,163 | (2,168,402 | ) | (1,542,430 | ) | 6,690,665 | 44,476 | (23,292,490 | ) | (16,557,349 | ) | ||||||||||||||||||||
A Shares | ||||||||||||||||||||||||||||||||
3/31/2013 | 50,302 | 28,732 | (30,895 | ) | 48,139 | 527,368 | 286,738 | (332,298 | ) | 481,808 | ||||||||||||||||||||||
3/31/2012 | 9,208 | 12,958 | (102,904 | ) | (80,738 | ) | 99,225 | 137,891 | (1,095,148 | ) | (858,032 | ) | ||||||||||||||||||||
Short-Term U.S. Treasury Securities Fund |
| |||||||||||||||||||||||||||||||
I Shares | ||||||||||||||||||||||||||||||||
3/31/2013 | 115,958 | 2,083 | (634,242 | ) | (516,201 | ) | 1,154,142 | 20,694 | (6,305,766 | ) | (5,130,930 | ) | ||||||||||||||||||||
3/31/2012 | 525,197 | 10,479 | (1,946,804 | ) | (1,411,128 | ) | 5,269,886 | 105,295 | (19,695,687 | ) | (14,320,506 | ) | ||||||||||||||||||||
A Shares | ||||||||||||||||||||||||||||||||
3/31/2013 | 6,636 | 921 | (141,657 | ) | (134,100 | ) | 65,903 | 9,130 | (1,405,325 | ) | (1,330,292 | ) | ||||||||||||||||||||
3/31/2012 | 60,014 | 3,939 | (267,935 | ) | (203,982 | ) | 605,128 | 39,509 | (2,709,304 | ) | (2,064,667 | ) | ||||||||||||||||||||
C Shares | ||||||||||||||||||||||||||||||||
3/31/2013 | 88,635 | 1,683 | (202,166 | ) | (111,848 | ) | 879,321 | 16,650 | (2,006,700 | ) | (1,110,729 | ) | ||||||||||||||||||||
3/31/2012 | 188,447 | 10,758 | (164,965 | ) | 34,240 | 1,902,642 | 107,432 | (1,658,623 | ) | 351,451 | ||||||||||||||||||||||
189
NOTES TO FINANCIAL STATEMENTS (continued)
RIDGEWORTH FUNDS March 31, 2013
| Shares Issued | Shares Reinvested | Shares Redeemed | Net Increase (Decrease) in Shares Outstanding | Proceeds from Shares Issued | Dividends Reinvested | Cost of Shares Redeemed | Change in Net Assets from Capital Transactions | |||||||||||||||||||||||||
Total Return Bond Fund |
| |||||||||||||||||||||||||||||||
I Shares | ||||||||||||||||||||||||||||||||
3/31/2013 | 53,695,087 | 3,450,575 | (38,033,874 | ) | 19,111,788 | $587,970,113 | $37,602,169 | $(415,117,943) | $210,454,339 | |||||||||||||||||||||||
3/31/2012 | 51,033,539 | 3,173,130 | (27,603,726 | ) | 26,602,943 | 552,395,915 | 34,158,638 | (297,254,825 | ) | 289,299,728 | ||||||||||||||||||||||
A Shares | ||||||||||||||||||||||||||||||||
3/31/2013 | 2,420,995 | 146,515 | (2,045,673 | ) | 521,837 | 27,388,217 | 1,649,647 | (23,091,925 | ) | 5,945,939 | ||||||||||||||||||||||
3/31/2012 | 3,135,704 | 131,126 | (918,414 | ) | 2,348,416 | 35,067,641 | 1,456,981 | (10,278,559 | ) | 26,246,063 | ||||||||||||||||||||||
R Shares | ||||||||||||||||||||||||||||||||
3/31/2013 | 5,860,073 | 153,477 | (1,164,359 | ) | 4,849,191 | 64,188,443 | 1,670,614 | (12,767,355 | ) | 53,091,702 | ||||||||||||||||||||||
3/31/2012 | 1,784,803 | 36,059 | (207,453 | ) | 1,613,409 | 19,283,630 | 388,424 | (2,238,521 | ) | 17,433,533 | ||||||||||||||||||||||
Ultra-Short Bond Fund |
| |||||||||||||||||||||||||||||||
I Shares | ||||||||||||||||||||||||||||||||
3/31/2013 | 10,370,480 | 75,875 | (10,825,088 | ) | (378,733 | ) | 103,337,932 | 756,107 | (107,945,587 | ) | (3,851,548 | ) | ||||||||||||||||||||
3/31/2012 | 8,026,217 | 80,910 | (8,441,065 | ) | (333,938 | ) | 79,641,461 | 802,231 | (83,676,254 | ) | (3,232,562 | ) | ||||||||||||||||||||
U.S. Government Securities Fund |
| |||||||||||||||||||||||||||||||
I Shares | ||||||||||||||||||||||||||||||||
3/31/2013 | 1,111,216 | 195,444 | (1,743,213 | ) | (436,553 | ) | 9,711,509 | 1,657,012 | (15,235,513 | ) | (3,866,992 | ) | ||||||||||||||||||||
3/31/2012 | 1,845,938 | 313,232 | (3,101,291 | ) | (942,121 | ) | 16,730,960 | 2,768,982 | (27,681,561 | ) | (8,181,619 | ) | ||||||||||||||||||||
A Shares | ||||||||||||||||||||||||||||||||
3/31/2013 | 14,273 | 8,436 | (31,982 | ) | (9,273 | ) | 122,865 | 71,433 | (280,206 | ) | (85,908 | ) | ||||||||||||||||||||
3/31/2012 | 198,829 | 13,277 | (247,574 | ) | (35,468 | ) | 1,862,883 | 117,305 | (2,255,734 | ) | (275,546 | ) | ||||||||||||||||||||
C Shares | ||||||||||||||||||||||||||||||||
3/31/2013 | 2,372 | 10,185 | (60,846 | ) | (48,289 | ) | 21,123 | 86,065 | (533,000 | ) | (425,812 | ) | ||||||||||||||||||||
3/31/2012 | 41,590 | 16,504 | (68,197 | ) | (10,103 | ) | 377,190 | 145,610 | (607,140 | ) | (84,340 | ) | ||||||||||||||||||||
U.S. Government Securities Ultra-Short Bond Fund |
| |||||||||||||||||||||||||||||||
I Shares | ||||||||||||||||||||||||||||||||
3/31/2013 | 175,905,609 | 1,420,235 | (148,517,021 | ) | 28,808,823 | 1,788,421,958 | 14,444,404 | (1,510,221,408 | ) | 292,644,954 | ||||||||||||||||||||||
3/31/2012 | 145,526,560 | 1,470,298 | (110,166,678 | ) | 36,830,180 | 1,470,590,379 | 14,858,009 | (1,113,045,175 | ) | 372,403,213 | ||||||||||||||||||||||
Virginia Intermediate Municipal Bond Fund |
| |||||||||||||||||||||||||||||||
I Shares | ||||||||||||||||||||||||||||||||
3/31/2013 | 1,419,812 | 107,996 | (1,663,125 | ) | (135,317 | ) | 15,183,825 | 1,144,606 | (17,855,818 | ) | (1,527,387 | ) | ||||||||||||||||||||
3/31/2012 | 1,336,273 | 84,751 | (3,744,900 | ) | (2,323,876 | ) | 14,125,962 | 898,136 | (39,516,640 | ) | (24,492,542 | ) | ||||||||||||||||||||
A Shares | ||||||||||||||||||||||||||||||||
3/31/2013 | 159,410 | 19,266 | (312,015 | ) | (133,339 | ) | 1,700,748 | 205,329 | (3,340,387 | ) | (1,434,310 | ) | ||||||||||||||||||||
3/31/2012 | 191,011 | 18,685 | (254,130 | ) | (44,434 | ) | 2,022,146 | 197,534 | (2,694,943 | ) | (475,263 | ) | ||||||||||||||||||||
| 5. | Management Ownership |
At March 31, 2013, 41.32% of the outstanding shares of Short-Term Municipal Bond Fund were held by the Adviser.
| 6. | Investment Transactions |
The cost of security purchases and the proceeds from sales and maturities of securities, excluding securities maturing less than one year from acquisition and U.S. government securities, for the year ended March 31, 2013 were as follows:
Fund | Purchases | Sales and Maturities | ||||||
Core Bond Fund | $51,830,514 | $95,717,507 | ||||||
Corporate Bond Fund | 46,789,363 | 55,496,060 | ||||||
Georgia Tax-Exempt Bond Fund | 73,040,669 | 81,522,794 | ||||||
High Grade Municipal Bond Fund | 98,852,333 | 84,233,346 | ||||||
High Income Fund | 1,035,504,584 | 870,498,483 | ||||||
Intermediate Bond Fund | 134,484,607 | 272,481,237 | ||||||
190
NOTES TO FINANCIAL STATEMENTS (continued)
RIDGEWORTH FUNDS March 31, 2013
Fund | Purchases | Sales and Maturities | ||||||
Investment Grade Tax-Exempt Bond Fund | $1,455,358,117 | $1,382,345,034 | ||||||
Limited Duration Fund | 2,034,940 | 5,161,143 | ||||||
Limited-Term Federal Mortgage Securities Fund | 1,131,420 | 1,076,563 | ||||||
North Carolina Tax-Exempt Bond Fund | 39,553,038 | 40,024,597 | ||||||
Seix Floating Rate High Income Fund | 4,741,634,036 | 2,832,460,511 | ||||||
Seix High Yield Fund | 1,516,186,612 | 1,888,395,070 | ||||||
Short-Term Bond Fund | 86,461,135 | 232,661,282 | ||||||
Short-Term Municipal Bond Fund | 21,707,808 | 18,655,046 | ||||||
Total Return Bond Fund | 309,715,520 | 252,961,855 | ||||||
Ultra-Short Bond Fund | 73,489,207 | 72,680,657 | ||||||
U.S. Government Securities Ultra-Short Bond Fund | 95,088,726 | 92,173,001 | ||||||
Virginia Intermediate Municipal Bond Fund | 51,217,215 | 57,085,653 | ||||||
The cost of security purchases and proceeds from sales and maturities of U.S. government securities, excluding short-term investments, for the year end March 31, 2013 were as follows:
Fund | Purchases | Sales and Maturities | ||||||
Core Bond Fund | $640,855,321 | $673,755,766 | ||||||
Intermediate Bond Fund | 1,115,559,234 | 1,148,802,977 | ||||||
Limited Duration Fund | 3,789,746 | 6,918,618 | ||||||
Limited-Term Federal Mortgage Securities Fund | 40,480,293 | 60,408,065 | ||||||
Short-Term Bond Fund | 197,465,577 | 278,094,083 | ||||||
Short-Term U.S. Treasury Securities Fund | 2,239,659 | 8,878,763 | ||||||
Total Return Bond Fund | 1,676,178,196 | 1,456,635,385 | ||||||
Ultra-Short Bond Fund | 63,580,753 | 70,647,647 | ||||||
U.S. Government Securities Fund | 29,494,607 | 32,603,450 | ||||||
U.S. Government Securities Ultra-Short Bond Fund | 3,386,857,012 | 3,038,005,335 | ||||||
| 7. | Federal Income Tax Information |
The following information is presented on an income tax basis and takes into consideration differences between amounts for financial statement and income tax purposes. These “book/tax” differences are either considered temporary or permanent in nature. To the extent these differences are permanent in nature (i.e., foreign currency transactions and return of capital on securities), such amounts are reclassified within the composition of net assets based on their U.S. federal tax-basis treatment; temporary differences do not require reclassification.
The cost of investments and aggregate gross unrealized appreciation and depreciation for securities held by the Funds at March 31, 2013 were as follows:
Fund | Tax Cost | Aggregate Gross Unrealized Appreciation | Aggregate Gross Unrealized (Depreciation) | Net Unrealized Appreciation (Depreciation) | ||||||||||||
Core Bond Fund | $410,298,523 | $9,839,289 | $(375,173 | ) | $9,464,116 | |||||||||||
Corporate Bond Fund | 68,868,736 | 3,309,521 | (306,010 | ) | 3,003,511 | |||||||||||
Georgia Tax-Exempt Bond Fund | 147,762,560 | 9,135,959 | (523,327 | ) | 8,612,632 | |||||||||||
High Grade Municipal Bond Fund | 62,460,924 | 5,234,380 | (139,763 | ) | 5,094,617 | |||||||||||
High Income Fund | 948,778,563 | 43,260,862 | (3,986,720 | ) | 39,274,142 | |||||||||||
Intermediate Bond Fund | 925,984,176 | 19,410,680 | (514,049 | ) | 18,896,631 | |||||||||||
Investment Grade Tax-Exempt Bond Fund | 978,753,499 | 55,748,872 | (965,260 | ) | 54,783,612 | |||||||||||
Limited Duration Fund | 9,318,898 | 42,003 | (84 | ) | 41,919 | |||||||||||
Limited-Term Federal Mortgage Securities Fund | 17,540,584 | 431,556 | (13,736 | ) | 417,820 | |||||||||||
North Carolina Tax-Exempt Bond Fund | 49,546,412 | 2,397,954 | (214,478 | ) | 2,183,476 | |||||||||||
191
NOTES TO FINANCIAL STATEMENTS (continued)
RIDGEWORTH FUNDS March 31, 2013
Fund | Tax Cost | Aggregate Gross Unrealized Appreciation | Aggregate Gross Unrealized (Depreciation) | Net Unrealized Appreciation (Depreciation) | ||||||||||||
Seix Floating Rate High Income Fund | $6,687,380,556 | $74,057,242 | $(8,513,556 | ) | $65,543,686 | |||||||||||
Seix High Yield Fund | 1,875,140,725 | 123,599,688 | (6,454,595 | ) | 117,145,093 | |||||||||||
Short-Term Bond Fund | 81,662,967 | 1,389,439 | (30,124 | ) | 1,359,315 | |||||||||||
Short-Term Municipal Bond Fund | 15,736,857 | 126,964 | (4,914 | ) | 122,050 | |||||||||||
Short-Term U.S. Treasury Securities Fund | 12,011,003 | 104,450 | — | 104,450 | ||||||||||||
Total Return Bond Fund | 1,421,617,044 | 31,615,814 | (1,438,005 | ) | 30,177,809 | |||||||||||
Ultra-Short Bond Fund | 110,252,260 | 611,537 | (26,343 | ) | 585,194 | |||||||||||
U.S. Government Securities Fund | 38,698,114 | 896,335 | — | 896,335 | ||||||||||||
U.S. Government Securities Ultra-Short Bond Fund | 2,308,411,594 | 29,992,542 | (488,676 | ) | 29,503,866 | |||||||||||
Virginia Intermediate Municipal Bond Fund | 145,195,153 | 10,332,109 | (311,238 | ) | 10,020,871 | |||||||||||
Amounts designated as “—” are $0.
The tax character of distributions paid to shareholders during the year ended March 31, 2013 was as follows:
| Distributions paid from | ||||||||||||||||||||
Fund | Net Investment Income* | Net Long Term Capital Gains | Tax-Exempt Distributions** | Return of Capital | Total Distributions Paid* | |||||||||||||||
Core Bond Fund | $13,062,342 | $1,579,722 | $ — | $— | $14,642,064 | |||||||||||||||
Corporate Bond Fund | 3,858,458 | 1,826,514 | — | — | 5,684,972 | |||||||||||||||
Georgia Tax-Exempt Bond Fund | 38 | — | 4,837,674 | — | 4,837,712 | |||||||||||||||
High Grade Municipal Bond Fund | 1,657,649 | 87,877 | 1,567,327 | — | 3,312,853 | |||||||||||||||
High Income Fund | 50,900,279 | — | — | — | 50,900,279 | |||||||||||||||
Intermediate Bond Fund | 30,286,567 | 18,983,206 | — | — | 49,269,773 | |||||||||||||||
Investment Grade Tax-Exempt Bond Fund | 26,205,811 | 5,046,345 | 20,258,662 | — | 51,510,818 | |||||||||||||||
Limited Duration Fund | 41,881 | — | — | — | 41,881 | |||||||||||||||
Limited-Term Federal Mortgage Securities Fund | 358,698 | — | — | — | 358,698 | |||||||||||||||
North Carolina Tax-Exempt Bond Fund | 782 | — | 1,486,154 | — | 1,486,936 | |||||||||||||||
Seix Floating Rate High Income Fund | 201,818,665 | — | — | — | 201,818,665 | |||||||||||||||
Seix High Yield Fund | 131,968,567 | — | — | — | 131,968,567 | |||||||||||||||
Short-Term Bond Fund | 3,541,696 | — | — | — | 3,541,696 | |||||||||||||||
Short-Term Municipal Bond Fund | 175,546 | 856,881 | 42,250 | — | 1,074,677 | |||||||||||||||
Short-Term U.S. Treasury Securities Fund | 42,985 | 34,851 | — | — | 77,836 | |||||||||||||||
Total Return Bond Fund | 38,738,671 | 9,438,677 | — | — | 48,177,348 | |||||||||||||||
Ultra-Short Bond Fund | 1,236,755 | — | — | — | 1,236,755 | |||||||||||||||
U.S. Government Securities Fund | 1,361,976 | 740,714 | — | — | 2,102,690 | |||||||||||||||
U.S. Government Securities Ultra-Short Bond Fund | 18,391,336 | — | — | — | 18,391,336 | |||||||||||||||
Virginia Intermediate Municipal Bond Fund | 474,292 | 1,955,122 | 4,648,012 | — | 7,077,426 | |||||||||||||||
| * | Net investment income includes taxable market discount income and net short-term capital gains, if any. |
| ** | The Funds hereby designate these amounts as Exempt Interest Dividends. |
Amounts designated as “—” are $0.
The tax character of distributions paid to shareholders during the year ended March 31, 2012 were as follows:
| Distributions paid from | ||||||||||||||||||||
Fund | Net Investment Income* | Net Long Term Capital Gains | Tax-Exempt Distributions** | Return of Capital | Total Distributions Paid* | |||||||||||||||
Core Bond Fund | $19,610,420 | $9,028,880 | $ — | $— | $28,639,300 | |||||||||||||||
Corporate Bond Fund | 2,928,703 | 5,151,522 | — | — | 8,080,225 | |||||||||||||||
Georgia Tax-Exempt Bond Fund | 233 | — | 5,460,125 | — | 5,460,358 | |||||||||||||||
High Grade Municipal Bond Fund | 45,667 | 83,915 | 1,642,472 | — | 1,772,054 | |||||||||||||||
192
NOTES TO FINANCIAL STATEMENTS (continued)
RIDGEWORTH FUNDS March 31, 2013
| Distributions paid from | ||||||||||||||||||||
Fund | Net Investment Income* | Net Long Term Capital Gains | Tax-Exempt Distributions** | Return of Capital | Total Distributions Paid* | |||||||||||||||
High Income Fund | $44,656,035 | $1,105,381 | $— | $— | $45,761,416 | |||||||||||||||
Intermediate Bond Fund | 42,998,138 | 20,555,766 | — | — | 63,553,904 | |||||||||||||||
Investment Grade Tax-Exempt Bond Fund | 1,439,202 | 5,529,959 | 21,724,985 | — | 28,694,146 | |||||||||||||||
Limited Duration Fund | 112,879 | — | — | — | 112,879 | |||||||||||||||
Limited-Term Federal Mortgage Securities Fund | 877,549 | — | — | — | 877,549 | |||||||||||||||
North Carolina Tax-Exempt Bond Fund | 3,417 | — | 1,656,977 | — | 1,660,394 | |||||||||||||||
Seix Floating Rate High Income Fund | 191,455,418 | — | — | — | 191,455,418 | |||||||||||||||
Seix High Yield Fund | 135,627,746 | — | — | — | 135,627,746 | |||||||||||||||
Short-Term Bond Fund | 6,874,827 | — | — | — | 6,874,827 | |||||||||||||||
Short-Term Municipal Bond Fund | 29,571 | 276,015 | 582,884 | — | 888,470 | |||||||||||||||
Short-Term U.S. Treasury Securities Fund | 172,092 | 249,541 | — | — | 421,633 | |||||||||||||||
Total Return Bond Fund | 37,241,446 | 9,757,510 | — | — | 46,998,956 | |||||||||||||||
Ultra-Short Bond Fund | 1,418,011 | — | — | — | 1,418,011 | |||||||||||||||
U.S. Government Securities Fund | 2,267,898 | 1,470,816 | — | — | 3,738,714 | |||||||||||||||
U.S. Government Securities Ultra-Short Bond Fund | 18,399,183 | — | — | — | 18,399,183 | |||||||||||||||
Virginia Intermediate Municipal Bond Fund | 160,219 | 1,542,755 | 5,228,453 | — | 6,931,427 | |||||||||||||||
| * | Net investment income includes taxable market discount income and net short-term capital gains, if any. |
| ** | The Funds hereby designate these amounts as Exempt Interest Dividends. |
Amounts designated as “—” are $0 or have been rounded to $0.
As of March 31, 2013, the components of distributable earnings (accumulated losses) on a federal income tax basis were as follows:
| Undistributed | Long Term Capital Gains | Net Unrealized Appreciation (Depreciation)* | Loss Carryforwards and Deferrals | |||||||||||||||||||||
Fund | Tax Exempt Income | Ordinary Income | Total | |||||||||||||||||||||
Core Bond Fund | $ — | $6,447 | $5,053,177 | $ 9,464,116 | $ (853,658 | ) | $13,670,082 | |||||||||||||||||
Corporate Bond Fund | — | 267,377 | 1,487,623 | 3,003,511 | — | 4,758,511 | ||||||||||||||||||
Georgia Tax-Exempt Bond Fund | — | 536,429 | — | 8,612,632 | (1,574,453 | ) | 7,574,608 | |||||||||||||||||
High Grade Municipal Bond Fund | 125,911 | 229,389 | — | 5,094,617 | — | 5,449,917 | ||||||||||||||||||
High Income Fund | — | 11,501,634 | — | 39,274,144 | — | 50,775,778 | ||||||||||||||||||
Intermediate Bond Fund | — | — | 14,841,641 | 18,896,631 | — | 33,738,272 | ||||||||||||||||||
Investment Grade Tax-Exempt Bond Fund | 1,333,611 | 5,096,050 | 300,583 | 54,783,612 | — | 61,513,856 | ||||||||||||||||||
Limited Duration Fund | — | — | — | 41,919 | (1,457,939 | ) | (1,416,020 | ) | ||||||||||||||||
Limited-Term Federal Mortgage Securities Fund | — | — | — | 417,820 | (12,252,227 | ) | (11,834,407 | ) | ||||||||||||||||
North Carolina Tax-Exempt Bond Fund | 37,433 | — | 1,186,858 | 2,183,476 | — | 3,407,767 | ||||||||||||||||||
Seix Floating Rate High Income Fund | — | 19,488,117 | — | 65,543,685 | (46,697,756 | ) | 38,334,046 | |||||||||||||||||
Seix High Yield Fund | — | 8,765,675 | 29,023,659 | 117,145,093 | — | 154,934,427 | ||||||||||||||||||
Short-Term Bond Fund | — | 114,335 | — | 1,359,315 | (2,112,909 | ) | (639,259 | ) | ||||||||||||||||
Short-Term Municipal Bond Fund | — | 76,689 | — | 122,050 | — | 198,739 | ||||||||||||||||||
Short-Term U.S. Treasury Securities Fund | — | 1,333 | 16,380 | 104,450 | — | 122,163 | ||||||||||||||||||
Total Return Bond Fund | — | — | 10,891,234 | 30,288,844 | (6,283,637 | ) | 34,896,441 | |||||||||||||||||
Ultra-Short Bond Fund | — | 98,912 | — | 585,194 | (3,256,520 | ) | (2,572,414 | ) | ||||||||||||||||
U.S. Government Securities Fund | — | 12,404 | 112,599 | 896,335 | (113,208 | ) | 908,130 | |||||||||||||||||
193
NOTES TO FINANCIAL STATEMENTS (continued)
RIDGEWORTH FUNDS March 31, 2013
| Undistributed | Long Term Capital Gains | Net Unrealized Appreciation (Depreciation)* | Loss Carryforwards and Deferrals | |||||||||||||||||||||
Fund | Tax Exempt Income | Ordinary Income | Total | |||||||||||||||||||||
U.S. Government Securities Ultra- Short Bond Fund | $— | $1,553,037 | $— | $29,503,865 | $(13,905,311 | ) | $17,151,591 | |||||||||||||||||
Virginia Intermediate Municipal Bond Fund | 379,200 | 342,328 | 1,042,800 | 10,020,871 | — | 11,785,199 | ||||||||||||||||||
| * | The differences between book-basis and tax basis unrealized appreciation (depreciation) is attributable primarily to tax deferral of losses on wash sales, futures contract mark to market, dividends payable, forward contracts mark to market 988(a)(1)(b), and mark to market on credit default swaps. |
Amounts designated as “—” are $0.
The Funds utilize the provisions of the federal income tax laws that provide for the carryforward of capital losses from prior years, offsetting such losses against any future realized capital gains. Under the Regulated Investment Company Modernization Act of 2010 (the “Act”), net capital losses recognized in taxable years beginning after December 22, 2010 (“post-enactment”), may be carried forward indefinitely, and their character is retained as short-term and/or long-term losses. Previously, net capital losses were carried forward for eight years and treated as short-term losses (“pre-enactment”). The Act requires that post-enactment net capital losses be used before pre-enactment net capital losses.
As of March 31, 2013, the pre-enactment accumulated capital loss carryforwards and expiration dates were as follows:
| Expires | ||||||||||||||||||||||||||||
Fund | 2014 | 2015 | 2016 | 2017 | 2018 | 2019 | Total | |||||||||||||||||||||
Georgia Tax-Exempt Bond Fund | $— | $— | $— | $119,406 | $1,455,047 | $— | $1,574,453 | |||||||||||||||||||||
Limited Duration Fund | — | — | — | 356,074 | 1,101,865 | — | 1,457,939 | |||||||||||||||||||||
Limited-Term Federal Mortgage Securities Fund | 5,208,560 | 4,062,767 | 2,980,391 | — | — | — | 12,251,718 | |||||||||||||||||||||
Seix Floating Rate High Income Fund | — | — | 17,710,411 | 28,987,345 | — | — | 46,697,756 | |||||||||||||||||||||
Short-Term Bond Fund | — | — | — | — | 2,112,909 | — | 2,112,909 | |||||||||||||||||||||
Ultra-Short Bond Fund | 572,772 | 667,058 | — | 202,726 | 1,362,740 | 451,224 | 3,256,520 | |||||||||||||||||||||
U.S. Government Securities Ultra-Short Bond Fund | — | — | — | — | — | 8,408,484 | 8,408,484 | |||||||||||||||||||||
Amounts designated as “—” are $0.
Capital loss carryforwards may be applied to offset future realized capital gains and may thus reduce future capital gain distributions.
During the year ended March 31, 2013 the following Funds utilized capital loss carryforwards as follows:
Fund | Amount | |||
Georgia Tax-Exempt Bond Fund | $4,725,574 | |||
Limited Duration Fund | 54,182 | |||
Limited-Term Federal Mortgage Securities Fund | 915,079 | |||
North Carolina Tax-Exempt Bond Fund | 789,078 | |||
Seix Floating Rate High Income Fund | 25,889,136 | |||
Seix High Yield Fund | 13,691,622 | |||
Short-Term Bond Fund | 4,308,532 | |||
Ultra-Short Bond Fund | 448,384 | |||
U.S. Government Securities Ultra-Short Bond Fund | 7,485,167 | |||
194
NOTES TO FINANCIAL STATEMENTS (concluded)
RIDGEWORTH FUNDS March 31, 2013
During the year ended March 31, 2013 the following Funds had capital loss carryforwards that expired in fiscal 2013 as follows:
Fund | Amount | |||
Limited-Term Federal Mortgage Securities Fund | $2,357,037 | |||
Ultra-Short Bond Fund | 100,049 | |||
Net capital losses incurred after October 31 and within the taxable year are deemed to arise on the first business day of the Funds’ next taxable year. During the year ended March 31, 2013, the following Funds had net capital losses:
Fund | Short Term | Long Term | Total | |||||||||
Core Bond Fund | $853,658 | $— | $853,658 | |||||||||
Limited-Term Federal Mortgage Securities Fund | 509 | — | 509 | |||||||||
Total Return Bond Fund | 6,283,637 | — | 6,283,637 | |||||||||
U.S. Government Securities Fund | 113,208 | — | 113,208 | |||||||||
U.S. Government Securities Ultra-Short-Bond Fund | 4,998,680 | 498,147 | 5,496,827 | |||||||||
Pursuant to federal income tax rules applicable to regulated investment companies, the Funds may elect to treat certain capital losses between November 1 and March 31 and late year ordinary losses, (i) ordinary losses between January 1 and March 31, and (ii) specified ordinary and currency losses between November 1 and March 31, as occurring on the first day of the following tax year. For the year ended March 31, 2013, any amount of losses elected within the tax return will not be recognized for federal income tax purposes until April 1, 2013.
| 8. | Recent Accounting Pronouncements |
In December 2011, Accounting Standards Update (“ASU”) No. 2011-11, “Disclosures about Offsetting Assets and Liabilities,” was issued and is effective for interim and annual periods beginning after January 1, 2013. The ASU enhances disclosure requirements with respect to an entity’s rights of setoff and related arrangements associated with its financial and derivative instruments. Management is currently evaluating the impact the adoption of ASU No. 2011-11 may have on the Funds’ financial statement disclosures.
| 9. | Subsequent Events |
Management has evaluated subsequent events through the date these financial statements were issued for purposes of recognition or disclosure in the financial statements. Management has determined there are no material events that would require disclosure in the Funds’ financial statements through this date.
195
REPORT OF INDEPENDENT REGISTERED PUBLIC ACCOUNTING FIRM
To the Board of Trustees and Shareholders of RidgeWorth Funds:
In our opinion, the accompanying statements of assets and liabilities, including the schedules of portfolio investments, and the related statements of operations and of changes in net assets and the financial highlights present fairly, in all material respects, the financial position of Core Bond Fund, Corporate Bond Fund, Georgia Tax-Exempt Bond Fund, High Grade Municipal Bond Fund, High Income Fund, Intermediate Bond Fund, Investment Grade Tax-Exempt Bond Fund, Limited Duration Fund, Limited-Term Federal Mortgage Securities Fund, North Carolina Tax-Exempt Bond Fund, Seix Floating Rate High Income Fund, Seix High Yield Fund, Short-Term Bond Fund, Short-Term Municipal Bond Fund, Short-Term U.S. Treasury Securities Fund, Total Return Bond Fund, Ultra-Short Bond Fund, U.S. Government Securities Fund, U.S. Government Securities Ultra-Short Bond Fund, and Virginia Intermediate Municipal Bond Fund (twenty of the funds constituting RidgeWorth Funds, collectively the “Funds”) at March 31, 2013, the results of their operations for the year then ended, the changes in their net assets for each of the two years in the period then ended and the financial highlights for each of the periods indicated, in conformity with accounting principles generally accepted in the United States of America. These financial statements and financial highlights (hereafter referred to as “financial statements”) are the responsibility of the Funds’ management; our responsibility is to express an opinion on these financial statements based on our audits. We conducted our audits of these financial statements in accordance with the standards of the Public Company Accounting Oversight Board (United States). Those standards require that we plan and perform the audits to obtain reasonable assurance about whether the financial statements are free of material misstatement. An audit includes examining, on a test basis, evidence supporting the amounts and disclosures in the financial statements, assessing the accounting principles used and significant estimates made by management, and evaluating the overall financial statement presentation. We believe that our audits, which included confirmation of securities at March 31, 2013 by correspondence with the custodian and brokers, and application of alternative auditing procedures where securities purchased had not been received, provide a reasonable basis for our opinion.
PricewaterhouseCoopers LLP
May 24, 2013
Boston, Massachusetts
196
RRIDGEWORTH FUNDS March 31, 2013
(Unaudited)
The following Funds hereby designate the following amounts as long term capital gain distributions:
Fund | Amount | |||
Core Bond Fund | $1,579,722 | |||
Corporate Bond Fund | 1,826,514 | |||
High Grade Municipal Bond Fund | 87,877 | |||
Intermediate Bond Fund | 18,983,206 | |||
Investment Grade Tax-Exempt Bond Fund | 5,046,345 | |||
Short-Term Municipal Bond Fund | 856,881 | |||
Short-Term U.S. Treasury Securities Fund | 34,851 | |||
Total Return Bond Fund | 9,438,677 | |||
U.S. Government Securities Fund | 740,714 | |||
Virginia Intermediate Municipal Bond Fund | 1,955,122 | |||
For corporate shareholders, the following percentages of the total ordinary income distributions paid by the following Funds during the fiscal year ended March 31, 2013 qualify for the corporate dividends received deduction:
Fund | Dividends Received Deduction | |||
Core Bond Fund | 1.54 | % | ||
Corporate Bond Fund | 4.29 | |||
High Income Fund | 0.61 | |||
Intermediate Bond Fund | 1.93 | |||
Seix Floating Rate High Income Fund | 0.11 | |||
Seix High Yield Fund | 0.07 | |||
Total Return Bond Fund | 1.32 | |||
For the year ended March 31, 2013, the following Funds paid qualified dividend income:
Fund | Qualified Dividend Income | |||
Core Bond Fund | 1.54 | % | ||
Corporate Bond Fund | 4.29 | |||
High Income Fund | 0.61 | |||
Intermediate Bond Fund | 1.93 | |||
Seix Floating Rate High Income Fund | 0.11 | |||
Seix High Yield Fund | 0.07 | |||
Total Return Bond Fund | 1.31 | |||
197
TRUSTEES AND OFFICERS OF THE RIDGEWORTH FUNDS
RIDGEWORTH FUNDS March 31, 2013
(Unaudited)
Set forth below are the names, age, position with the Trust, length of term of office, and the principal occupations and other directorships held during at least the last five years of each of the persons currently serving as a Trustee of the Trust. Unless otherwise noted, the address of each Trustee and officer is c/o RidgeWorth Investments®, 3333 Piedmont Road, Suite 1500, Atlanta, Georgia 30305.
| Name and Age | Position Held with the Trust | Term of Office and Length of Time Served | Principal Occupation(s) During the Past 5 Years | Number of by Trustees | Other Directorships 5 Years | |||||||
Tim E. Bentsen Age: 59 | Trustee | Indefinite; since 2012 | Retired. Audit Partner and Account Executive (1993 - 2012); Lead Area Managing Partner (2005 - 2009); Office Managing Partner (2003 - 2009), KPMG LLP. | 33 | None | |||||||
Jeffrey M. Biggar Age: 63 | Trustee | Indefinite; since 2007 | Managing Director, Little Mountain Group, LLC (an independent Registered Investment Advisor consulting firm) (since 2011); Chief Operating Officer, Cedar Brook Financial Partners LLC (2008 - 2010); Chief Executive Officer and Senior Managing Director, Sterling (National City Corp.) (2000 - 2006). | 33 | GenSpring Trust | |||||||
George C. Guynn Age: 70 | Trustee | Indefinite; since 2008 | Retired. President (1996 - 2006) and Chief Executive Officer (1995 - 2006) Federal Reserve Bank of Atlanta. | 33 | Genuine Parts Company; Oxford Industries; John Wieland Homes and Neighborhoods Inc.; Acuity Brands Inc.; GenSpring Trust | |||||||
Sidney E. Harris Age: 63 | Trustee | Indefinite; since 2004 | Professor (since 1997), Dean (1997 - 2004), J. Mack Robinson College of Business, Georgia State University. | 33 | Total System Services, Inc.; GenSpring Trust | |||||||
Warren Y. Jobe Age: 72 | Trustee | Indefinite; since 2004 | Retired. Executive Vice President and Chief Financial Officer, Georgia Power Company (1982 - 1998) and Senior Vice President, Southern Company (1998 - 2001). | 33 | WellPoint, Inc; UniSource Energy Corp. | |||||||
Connie D. McDaniel Age: 55 | Trustee | Indefinite; since 2005 | Vice President, Chief of Internal Audit, Corporate Audit Department (since 2009); Vice President Global Finance Transformation (2007 - 2009); Vice President and Controller (1999 - 2007), The Coca-Cola Company. | 33 | None | |||||||
Name, Address and Age | Position(s) Held with the Trust | Term of Office and Length of Time Served | Principal Occupation(s) During the Past 5 Years | |||
Julia R. Short RidgeWorth Investments 3333 Piedmont Road, NE Suite 1500 Atlanta, GA 30305 Age: 40 | President and Chief Executive Officer | One year; since 2007 | Managing Director, Product Manager, RidgeWorth Investments (since 2004). | |||
Joseph M. O’Donnell RidgeWorth Investments 3333 Piedmont Road, NE Suite 1500 Atlanta, GA 30305 Age: 58 | Executive Vice President and Chief Compliance Officer | One year; since 2011 | Managing Director of Fund Compliance, RidgeWorth Investments (since 2011); Executive Vice President and Chief Compliance Officer of the ING Funds (2004 - 2011); Chief Compliance Officer of ING Investments, LLC (2006 - 2008 and October 2009 - 2011); and Investment Advisor Chief Compliance Officer, Directed Services LLC (2006 - 2008 and 2009 - 2011). | |||
Denise R. Lewis RidgeWorth Investments 3333 Piedmont Road, NE Suite 1500 Atlanta, GA 30305 Age: 49 | Treasurer and Chief Financial Officer | One year; since August 2012 | Director of Fund Administration, RidgeWorth Investments (since 2012); Vice President of Fund Analysis and Reporting, ING Investments Management, LLC (2006 - 2012). |
198
TRUSTEES AND OFFICERS OF THE RIDGEWORTH FUNDS (concluded)
RIDGEWORTH FUNDS March 31, 2013
(Unaudited)
Name, Address and Age | Position(s) Held with the Trust | Term of Office and Length of Time Served | Principal Occupation(s) During the Past 5 Years | |||
Benjamin H. Lowe RidgeWorth Investments 3333 Piedmont Road, NE Suite 1500 Atlanta, GA 30305 Age: 35 | Assistant Treasurer | One year; since March 2012 | Director of Fund Administration, RidgeWorth Investments (since 2011); Fund Controller, ALPS Fund Services, Inc. (2005 - 2011). | |||
James Bacik State Street Bank and Trust Co. 4 Copley Place, 5th Fl. Boston, MA 02116 Age: 38 | Assistant Treasurer | One year; since 2010 | Assistant Vice President, State Street Bank and Trust Company (since 2001).1 | |||
James M. Atwood Foreside Compliance Services, LLC Three Canal Plaza, Suite 100 Portland, ME 04101 Age: 47 | Anti-Money Laundering Officer and Identity Theft Prevention Officer | One year; since 2010 | Compliance Analyst, Foreside Compliance Services, LLC (since 2007); personal sabbatical (2004 - 2007); Attorney, Pierce Atwood (law firm) (2001 - 2004). | |||
Francine S. Hayes State Street Bank and Trust Company Mailstop CPH 0326 4 Copley Place Boston, MA 02116 Age: 45 | Secretary and Chief Legal Officer | One year; since August 2012 | Vice President and Managing Counsel, State Street Bank and Trust Company (since1995).1 | |||
Julie Tedesco State Street Bank and Trust Company Mailstop CPH 0326 4 Copley Place Boston, MA 02116 Age: 55 | Assistant Secretary | One year; since 2010 | Senior Vice President and Senior Managing Counsel, State Street Bank and Trust Company (since 2000).1 |
| 1 | During the year indicated the Officer has held various positions at State Street Bank and Trust Company and has provided his or her current title. |
199
RIDGEWORTH FUNDS March 31, 2013
(Unaudited)
ANNUAL APPROVAL OF INVESTMENT ADVISORY AND SUBADVISORY AGREEMENTS
The continuance of the Trust’s investment advisory agreement with RidgeWorth Capital Management, Inc. (the “Adviser”) and subadvisory agreements between the Adviser and each of Seix Investment Advisors LLC and StableRiver Capital Management LLC (together, the “Subadvisers”) must be specifically approved at least annually by (i) the vote of the Trustees or a vote of the shareholders of the Funds and (ii) the vote of a majority of the Trustees who are not parties to the agreements or “interested persons” of any party thereto (the “Independent Trustees”), as defined in the Investment Company Act of 1940, cast in person at a meeting called for the purpose of voting on such approval. New advisory agreements for the Trust are also subject to such approval initially and annually after their initial term is complete.
Each year, the Board of Trustees calls and holds a meeting to decide whether to approve and/or renew the Trust’s agreements for the upcoming year. In preparation for the meeting, the Board requests and reviews a wide variety of information from the Adviser and Subadvisers. The Trustees use this information, as well as other information that the Adviser, Subadvisers, and other service providers may submit to the Board, to help them decide whether to approve and/or renew the agreements.
In considering the renewal of the agreements with the Adviser and Subadvisers, the Board requested and received material from the Adviser and Subadvisers in preparation for a special meeting of the Board held on October 11, 2012, and requested and reviewed additional material from the Adviser and Subadvisers in preparation for its quarterly meeting held on November 15, 2012, at which it specifically considered the renewal of the agreements. Such material included, among other things, information about: (a) the quality of the Adviser’s and Subadvisers’ investment management and other services; (b) the Adviser’s and Subadvisers’ investment management personnel; (c) the Adviser’s and Subadvisers’ operations and financial condition; (d) the Adviser’s and Subadvisers’ brokerage practices (including any soft dollar arrangements) and investment strategies; (e) the level of the advisory fees that the Adviser and Subadvisers charge the Funds compared with the fees they charge to comparable mutual funds or accounts; (f) the Funds’ overall fees and operating expenses compared with similar mutual funds; (g) the level of the Adviser’s and Subadvisers’ profitability from their Fund-related operations; (h) the Adviser’s and Subadvisers’ compliance systems; (i) the Adviser’s and Subadvisers’ policies and procedures for personal securities transactions; (j) the Adviser’s and Subadvisers’ reputation, expertise, and resources in domestic financial markets; and (k) the Funds’ performance compared with similar mutual funds. The Board also received a memorandum from fund counsel regarding the responsibilities of the Trustees in connection with their consideration of the agreements.
At the meetings, representatives from the Adviser and Subadvisers presented additional oral and written information to the Board to help the Board evaluate the Adviser’s and Subadvisers’ fees and other aspects of the agreements. The Board also considered information presented by the Adviser, Subadvisers, and other service providers at meetings held throughout the year. The Trustees discussed the written materials, oral presentations, and any other information that the Board received, and considered the approval of the agreements in light of this information.
Based on the Board’s deliberations and evaluation of the information it received, the Board, all of whose members are Independent Trustees, approved the renewal of the agreements with the Adviser and Subadvisers and determined that the compensation under the agreements is fair and reasonable in light of the services to be performed. The Board considered the following specific factors, none of which was controlling, and made the following conclusions:
Nature, Extent, and Quality of Services
The Board received and considered information regarding the nature, extent, and quality of services to be provided to the Funds by the Adviser and Subadvisers. In this regard, the Trustees evaluated, among other things, the Adviser’s and Subadvisers’ personnel, experience, track record, and compliance program. The Board considered the background and experience of the Adviser’s and Subadvisers’ senior management and the expertise of, and amount of attention expected to be given to the Funds by, their portfolio management teams. The Board reviewed the qualifications, backgrounds, and responsibilities of the portfolio managers responsible for the day-to-day management of the Funds. The Board also reviewed information pertaining to the Adviser’s and Subadvisers’
200
ADDITIONAL INFORMATION (continued)
RIDGEWORTH FUNDS March 31, 2013
(Unaudited)
ANNUAL APPROVAL OF INVESTMENT ADVISORY AND SUBADVISORY AGREEMENTS (concluded)
organizational structure, senior management, investment operations, and other relevant information. The Board concluded that, within the context of its full deliberations, the nature, extent, and quality of the services to be provided to the Funds by the Adviser and Subadvisers supported the approval of the agreements.
Performance
The Board considered the investment performance of each Fund, including any periods of outperformance and underperformance, both on an absolute basis and a comparative basis to indices and other funds within the same investment categories. Specifically, the Board considered each Fund’s performance relative to its peer group and appropriate benchmarks in light of total return, yield, and market trends. As part of this review, the Board considered the composition of the peer group and selection criteria, as well as market risk and shareholder risk expectations. The Board considered the Adviser’s and Subadvisers’ explanations regarding specific performance issues. The Board concluded that, within the context of its full deliberations, the performance of the Funds, the Adviser, and the Subadvisers supported the approval of the agreements.
Fund Expenses
With respect to advisory fees, the Board considered the rate of compensation under the agreements and each Fund’s net operating expense ratio in comparison to those of comparable mutual funds. The Trustees also considered information about average expense ratios of comparable mutual funds in each Fund’s peer group. Finally, the Trustees considered the effect of the Adviser’s and Subadvisers’ waiver and reimbursement of fees and expenses, where applicable, to prevent total expenses from exceeding a specified amount and that, due to these waivers and reimbursements, net operating expenses have been maintained at competitive levels. The Board concluded that, within the context of its full deliberations, the expenses of the Funds are reasonable and supported the approval of the agreements.
Profitability
The Board reviewed information about the profitability of the Funds to the Adviser and Subadvisers and considered whether the level of profitability was reasonable and justified in light of the quality of the services rendered to the Funds. The Board concluded that, within the context of its full deliberations, the profitability of the Adviser and Subadvisers is within the range the Board considered reasonable.
Economies of Scale
The Board considered the existence of economies of scale and whether they were passed along to Fund shareholders through a graduated advisory fee schedule or other means, including any fee and expense waivers and reimbursements by the Adviser and Subadvisers. The Board concluded that, within the context of its full deliberations, the Funds obtain reasonable benefit from economies of scale.
201
ADDITIONAL INFORMATION (continued)
RIDGEWORTH FUNDS March 31, 2013
(Unaudited)
Expense Examples
As a shareholder of the RidgeWorth Funds, you incur two types of costs: (1) transaction costs, including sales charges (loads) on purchases; and (2) ongoing costs, including management fees, 12b-1 distribution and/or service fees, and other Fund expenses. These examples are intended to help you understand your ongoing costs (in dollars) of investing in the RidgeWorth Funds and to compare these costs with the ongoing costs of investing in other mutual funds.
These examples are based on an investment of $1,000 invested at the beginning of the period and held for the entire period from October 1, 2012 through March 31, 2013.
Actual Expenses
The table below provides information about actual account values and actual expenses. You may use the information below, together with the amount you invested, to estimate the expenses that you paid over the period. Simply divide your account value by $1,000 (for example, an $8,600 account value divided by $1,000 = 8.6), then multiply the result by the number in the table under the heading entitled “Expenses Paid During Period” to estimate the expenses you paid on your account during this period.
Fund | Class | Beginning Account Value 10/01/12 | Ending Account Value 03/31/13 | Expenses Paid During Period* 10/01/12-03/31/13 | Expense Ratio During Period** 10/01/12-03/31/13 | |||||||||||||||
Core Bond Fund | I Shares | $1,000.00 | $999.80 | $1.99 | 0.40 | % | ||||||||||||||
| A Shares | 1,000.00 | 998.30 | 3.54 | 0.71 | ||||||||||||||||
| R Shares | 1,000.00 | 997.60 | 4.18 | 0.84 | ||||||||||||||||
Corporate Bond Fund | I Shares | 1,000.00 | 1,006.00 | 3.00 | 0.60 | |||||||||||||||
| A Shares | 1,000.00 | 1,004.50 | 4.55 | 0.91 | ||||||||||||||||
| C Shares | 1,000.00 | 1,001.00 | 7.93 | 1.59 | ||||||||||||||||
Georgia Tax-Exempt Bond Fund | I Shares | 1,000.00 | 1,008.30 | 2.85 | 0.57 | |||||||||||||||
| A Shares | 1,000.00 | 1,007.60 | 3.65 | 0.73 | ||||||||||||||||
High Grade Municipal Bond Fund | I Shares | 1,000.00 | 1,016.40 | 3.27 | 0.65 | |||||||||||||||
| A Shares | 1,000.00 | 1,016.40 | 4.02 | 0.80 | ||||||||||||||||
High Income Fund | I Shares | 1,000.00 | 1,072.60 | 3.93 | 0.76 | |||||||||||||||
| A Shares | 1,000.00 | 1,071.30 | 5.11 | 0.99 | ||||||||||||||||
| R Shares | 1,000.00 | 1,068.60 | 6.40 | 1.24 | ||||||||||||||||
Intermediate Bond Fund | I Shares | 1,000.00 | 1,004.14 | 1.75 | 0.35 | |||||||||||||||
| A Shares | 1,000.00 | 1,002.66 | 3.20 | 0.64 | ||||||||||||||||
| R Shares | 1,000.00 | 1,000.81 | 4.09 | 0.82 | ||||||||||||||||
Investment Grade Tax-Exempt Bond Fund | I Shares | 1,000.00 | 1,009.70 | 3.21 | 0.64 | |||||||||||||||
| A Shares | 1,000.00 | 1,008.90 | 4.01 | 0.80 | ||||||||||||||||
Limited Duration Fund | I Shares | 1,000.00 | 1,002.60 | 1.60 | 0.32 | |||||||||||||||
Limited-Term Federal Mortgage Securities Fund | I Shares | 1,000.00 | 999.30 | 3.29 | 0.66 | |||||||||||||||
| A Shares | 1,000.00 | 998.30 | 4.28 | 0.86 | ||||||||||||||||
| C Shares | 1,000.00 | 994.30 | 8.25 | 1.66 | ||||||||||||||||
North Carolina Tax-Exempt Bond Fund | I Shares | 1,000.00 | 1,002.70 | 3.05 | 0.61 | |||||||||||||||
| A Shares | 1,000.00 | 1,001.90 | 3.84 | 0.77 | ||||||||||||||||
Seix Floating Rate High Income Fund | I Shares | 1,000.00 | 1,038.30 | 3.00 | 0.59 | |||||||||||||||
| A Shares | 1,000.00 | 1,036.90 | 4.37 | 0.86 | ||||||||||||||||
| C Shares | 1,000.00 | 1,033.60 | 7.71 | 1.52 | ||||||||||||||||
Seix High Yield Fund | I Shares | 1,000.00 | 1,065.50 | 2.78 | 0.54 | |||||||||||||||
| A Shares | 1,000.00 | 1,063.80 | 4.12 | 0.80 | ||||||||||||||||
| R Shares | 1,000.00 | 1,062.90 | 5.35 | 1.04 | ||||||||||||||||
Short-Term Bond Fund | I Shares | 1,000.00 | 1,003.70 | 2.45 | 0.49 | |||||||||||||||
| A Shares | 1,000.00 | 1,002.80 | 3.35 | 0.67 | ||||||||||||||||
| C Shares | 1,000.00 | 998.70 | 7.37 | 1.48 | ||||||||||||||||
Short-Term Municipal Bond Fund | I Shares | 1,000.00 | 1,007.90 | 2.75 | 0.55 | |||||||||||||||
| A Shares | 1,000.00 | 1,007.10 | 3.50 | 0.70 | ||||||||||||||||
Short-Term U.S. Treasury Securities Fund | I Shares | 1,000.00 | 998.71 | 2.74 | 0.55 | |||||||||||||||
| A Shares | 1,000.00 | 997.84 | 3.64 | 0.73 | ||||||||||||||||
| C Shares | 1,000.00 | 996.57 | 4.88 | 0.98 | ||||||||||||||||
Total Return Bond Fund | I Shares | 1,000.00 | 998.70 | 2.04 | 0.41 | |||||||||||||||
| A Shares | 1,000.00 | 998.70 | 3.34 | 0.67 | ||||||||||||||||
| R Shares | 1,000.00 | 996.80 | 4.93 | 0.99 | ||||||||||||||||
202
ADDITIONAL INFORMATION (continued)
RIDGEWORTH FUNDS March 31, 2013
(Unaudited)
Fund | Class | Beginning Account Value 10/01/12 | Ending Account Value 03/31/13 | Expenses Paid During Period* 10/01/12-03/31/13 | Expense Ratio During Period** 10/01/12-03/31/13 | |||||||||||||||
Ultra-Short Bond Fund | I Shares | 1,000.00 | 1,005.13 | 1.60 | 0.32 | |||||||||||||||
U.S. Government Securities Fund | I Shares | 1,000.00 | 992.90 | 3.58 | 0.72 | |||||||||||||||
| A Shares | 1,000.00 | 991.80 | 4.72 | 0.95 | ||||||||||||||||
| C Shares | 1,000.00 | 991.00 | 5.56 | 1.12 | ||||||||||||||||
U.S. Government Securities Ultra-Short Bond Fund | I Shares | 1,000.00 | 1,000.70 | 1.85 | 0.37 | |||||||||||||||
Virginia Intermediate Municipal Bond Fund | I Shares | 1,000.00 | 1,003.80 | 2.90 | 0.58 | |||||||||||||||
| A Shares | 1,000.00 | 1,003.00 | 3.65 | 0.73 | ||||||||||||||||
| * | Expenses are equal to the average account value times the Fund’s annualized expense ratio multiplied by the number of days in the most recent fiscal half-year divided by the number of days in the fiscal year. |
| ** | Annualized. |
Hypothetical Example
The table below provides information about hypothetical account values and hypothetical expenses based on each RidgeWorth Fund’s actual expense ratio and an assumed rate of return of 5% per year before expenses, which is not the Fund’s actual return. The hypothetical account values and expenses may not be used to estimate the actual ending account balance or expenses you paid for the period. You may use this information to compare this 5% hypothetical example with the 5% hypothetical examples that appear in the shareholder reports of other funds.
Please note that the expenses shown in the table are meant to highlight your ongoing costs only and do not reflect any transactional costs, such as sales charges (loads) or redemption fees. Therefore, the table is useful in comparing ongoing costs only, and will not help you determine the relative total costs of owning different funds. In addition, if these transactional costs were included, your costs would have been higher.
Fund | Class | Beginning Account Value 10/01/12 | Ending Account Value 03/31/13 | Expenses Paid During Period* 10/01/12-03/31/13 | Expense Ratio During Period** 10/01/12-03/31/13 | |||||||||||||||
Core Bond Fund | I Shares | $1,000.00 | $1,022.94 | $2.02 | 0.40 | % | ||||||||||||||
| A Shares | 1,000.00 | 1,021.39 | 3.58 | 0.71 | ||||||||||||||||
| R Shares | 1,000.00 | 1,020.74 | 4.23 | 0.84 | ||||||||||||||||
Corporate Bond Fund | I Shares | 1,000.00 | 1,021.94 | 3.02 | 0.60 | |||||||||||||||
| A Shares | 1,000.00 | 1,020.39 | 4.58 | 0.91 | ||||||||||||||||
| C Shares | 1,000.00 | 1,017.00 | 8.00 | 1.59 | ||||||||||||||||
Georgia Tax-Exempt Bond Fund | I Shares | 1,000.00 | 1,022.09 | 2.87 | 0.57 | |||||||||||||||
| A Shares | 1,000.00 | 1,021.29 | 3.68 | 0.73 | ||||||||||||||||
High Grade Municipal Bond Fund | I Shares | 1,000.00 | 1,021.69 | 3.28 | 0.65 | |||||||||||||||
| A Shares | 1,000.00 | 1,020.94 | 4.03 | 0.80 | ||||||||||||||||
High Income Fund | I Shares | 1,000.00 | 1,021.14 | 3.83 | 0.76 | |||||||||||||||
| A Shares | 1,000.00 | 1,020.00 | 4.99 | 0.99 | ||||||||||||||||
| R Shares | 1,000.00 | 1,018.75 | 6.24 | 1.24 | ||||||||||||||||
Intermediate Bond Fund | I Shares | 1,000.00 | 1,023.19 | 1.77 | 0.35 | |||||||||||||||
| A Shares | 1,000.00 | 1,021.74 | 3.23 | 0.64 | ||||||||||||||||
| R Shares | 1,000.00 | 1,020.84 | 4.13 | 0.82 | ||||||||||||||||
Investment Grade Tax-Exempt Bond Fund | I Shares | 1,000.00 | 1,021.74 | 3.23 | 0.64 | |||||||||||||||
| A Shares | 1,000.00 | 1,020.94 | 4.03 | 0.80 | ||||||||||||||||
Limited Duration Fund | I Shares | 1,000.00 | 1,023.34 | 1.61 | 0.32 | |||||||||||||||
Limited-Term Federal Mortgage Securities Fund | I Shares | 1,000.00 | 1,021.64 | 3.33 | 0.66 | |||||||||||||||
| A Shares | 1,000.00 | 1,020.64 | 4.33 | 0.86 | ||||||||||||||||
| C Shares | 1,000.00 | 1,016.65 | 8.35 | 1.66 | ||||||||||||||||
North Carolina Tax-Exempt Bond Fund | I Shares | 1,000.00 | 1,021.89 | 3.07 | 0.61 | |||||||||||||||
| A Shares | 1,000.00 | 1,021.09 | 3.88 | 0.77 | ||||||||||||||||
Seix Floating Rate High Income Fund | I Shares | 1,000.00 | 1,021.99 | 2.97 | 0.59 | |||||||||||||||
| A Shares | 1,000.00 | 1,020.64 | 4.33 | 0.86 | ||||||||||||||||
| C Shares | 1,000.00 | 1,017.35 | 7.64 | 1.52 | ||||||||||||||||
Seix High Yield Fund | I Shares | 1,000.00 | 1,022.24 | 2.72 | 0.54 | |||||||||||||||
| A Shares | 1,000.00 | 1,020.94 | 4.03 | 0.80 | ||||||||||||||||
| R Shares | 1,000.00 | 1,019.75 | 5.24 | 1.04 | ||||||||||||||||
Short-Term Bond Fund | I Shares | 1,000.00 | 1,022.49 | 2.47 | 0.49 | |||||||||||||||
| A Shares | 1,000.00 | 1,021.59 | 3.38 | 0.67 | ||||||||||||||||
| C Shares | 1,000.00 | 1,017.55 | 7.44 | 1.48 | ||||||||||||||||
203
ADDITIONAL INFORMATION (concluded)
RIDGEWORTH FUNDS March 31, 2013
(Unaudited)
Fund | Class | Beginning Account Value 10/01/12 | Ending Account Value 03/31/13 | Expenses Paid During Period* 10/01/12-03/31/13 | Expense Ratio During Period** 10/01/12-03/31/13 | |||||||||||||||
Short-Term Municipal Bond Fund | I Shares | 1,000.00 | 1,022.19 | 2.77 | 0.55 | |||||||||||||||
| A Shares | 1,000.00 | 1,021.44 | 3.53 | 0.70 | ||||||||||||||||
Short-Term U.S. Treasury Securities Fund | I Shares | 1,000.00 | 1,022.19 | 2.77 | 0.55 | |||||||||||||||
| A Shares | 1,000.00 | 1,021.29 | 3.68 | 0.73 | ||||||||||||||||
| C Shares | 1,000.00 | 1,020.04 | 4.94 | 0.98 | ||||||||||||||||
Total Return Bond Fund | I Shares | 1,000.00 | 1,022.89 | 2.07 | 0.41 | |||||||||||||||
| A Shares | 1,000.00 | 1,021.59 | 3.38 | 0.67 | ||||||||||||||||
| R Shares | 1,000.00 | 1,020.00 | 4.99 | 0.99 | ||||||||||||||||
Ultra-Short Bond Fund | I Shares | 1,000.00 | 1,023.34 | 1.61 | 0.32 | |||||||||||||||
U.S. Government Securities Fund | I Shares | 1,000.00 | 1,021.34 | 3.63 | 0.72 | |||||||||||||||
| A Shares | 1,000.00 | 1,020.19 | 4.78 | 0.95 | ||||||||||||||||
| C Shares | 1,000.00 | 1,019.35 | 5.64 | 1.12 | ||||||||||||||||
U.S. Government Securities Ultra-Short Bond Fund | I Shares | 1,000.00 | 1,023.09 | 1.87 | 0.37 | |||||||||||||||
Virginia Intermediate Municipal Bond Fund | I Shares | 1,000.00 | 1,022.04 | 2.92 | 0.58 | |||||||||||||||
| A Shares | 1,000.00 | 1,021.29 | 3.68 | 0.73 | ||||||||||||||||
| * | Expenses are equal to the average account value times the Fund’s annualized expense ratio multiplied by the number of days in the most recent fiscal half-year divided by the number of days in the fiscal year. |
| ** | Annualized. |
Proxy Voting Information
Information regarding the policies and procedures that the Funds use to determine how to vote proxies relating to portfolio securities is available without charge, upon request, by calling 1-888-784-3863. The information also is included in the Funds’ Statement of Additional Information, which is available on the Funds’ website at www.ridgeworth.com and on the Securities and Exchange Commission’s (“SEC”) website at www.sec.gov. Information relating to how each Fund voted proxies relating to portfolio securities held during the most recent twelve months ended June 30 is available on the Funds’ website at www.ridgeworth.com and on the SEC’s website at www.sec.gov.
Quarterly Portfolio Holdings Information
The Funds file their complete schedule of portfolio holdings with the SEC for the first and third quarters of each fiscal year on Form N-Q. The Funds’ Forms N-Q are available free of charge on the SEC’s website at www.sec.gov. You may also review or, for a fee, copy those documents by visiting the SEC’s Public Reference Room in Washington, D.C. Information on the operation of the Public Reference Room may be obtained by calling the SEC at 1-800-SEC-0330.
204
INVESTMENT ADVISER:
RidgeWorth Investments®
3333 Piedmont Road, NE, Suite 1500
Atlanta, Georgia 30305
www.ridgeworth.com
INVESTMENT SUBADVISERS:
Seix Investment Advisors LLC
10 Mountainview Road, Suite C-200
Upper Saddle River, New Jersey 07458
www.seixadvisors.com
StableRiver Capital Management LLC
3333 Piedmont Road, NE, Suite 1500
Atlanta, Georgia 30305
www.stableriver.com
This information must be preceded or accompanied by a current prospectus for each Fund described. An investor should consider the Fund’s investment objectives, risks, charges and expenses carefully before investing or sending money. This and other important information about RidgeWorth Funds can be found in the Fund’s prospectus. For additional information, please call 1-888-784-3863, or visit www.ridgeworth.com. Please read the prospectus carefully before investing.
DISTRIBUTOR:
RIDGEWORTH DISTRIBUTORS LLC
Not FDIC Insured • No Bank Guarantee • May Lose Value

RFAR-FI-0313

| Item 2. | Code of Ethics. |
| (a) | RidgeWorth Funds (the “Registrant”) has adopted a Code of Ethics that applies to the Registrant’s principal executive officer and principal financial officer. |
| (b) | No disclosures are required by this Item 2(b). |
| (c) | The Registrant’s Code of Ethics was amended on February 27, 2013, to clarify when the waiver to the Code of Ethics will be granted, to include a document retention policy and make another non-material changes. |
| (d) | There have been no waivers granted by the Registrant to individuals covered by the Registrant’s Code of Ethics during the reporting period for this Form N-CSR. |
| (e) | Not applicable. |
| (f) | A copy of the Registrant’s Code of Ethics is attached as an exhibit to this Form N-CSR. |
| Item 3. | Audit Committee Financial Expert. |
| (a) | (1) | The Board of Trustees of the Registrant has determined that the Registrant has at least one member serving on the Registrant’s Audit Committee that possesses the attributes identified in Instruction 2(b) of Item 3 to Form N-CSR to qualify as “audit committee financial expert.” | ||
| (2) | The names of the audit committee financial expert are Connie McDaniel and Tim Bentsen. Each audit committee financial expert has been deemed to be “independent” as that term is defined in Item 3(a)(2) of Form N-CSR. | |||
| Item 4. | Principal Accountant Fees and Services. |
(a) Audit Fees - The aggregate fees billed for the last two fiscal years ended March 31 for professional services rendered by the principal accountant to the Registrant for the annual audit of the Registrant’s financial statements or services normally provided by the accountant in connection with statutory and regulatory filings or engagements for the those fiscal years are set forth below.
| March 31, 2013 | March 31, 2012 | |||||||
Audit Fees | $ | 487,140 | $ | 476,795 | ||||
(b) Audit Related Fees – The aggregate fees billed for the last two fiscal years ended March 31 for professional services rendered by the principal accountant to the Registrant for assurance and related services rendered by the principal accountant to the Registrant that are reasonably related to the performance of the audit of the Registrant’s financial statements and are not reported under paragraph (a) of this Item 4 are set forth below.
| March 31, 2013 | March 31, 2012 | |||||||
Audit-Related Fees | $ | 0 | $ | 0 | ||||
There were no fees billed for the last two fiscal years ended March 31 for assurance and related services rendered by the principal accountant to the investment adviser that are reasonably related to the performance of the audit of the Registrant’s financial statements that were required to be pre-approved by the Audit Committee as described in paragraph (e)(1) of this Item 4.
(c) Tax Fees—The aggregate fees billed for the last two fiscal years ended March 31 for professional services rendered by the principal accountant to the Registrant for tax compliance, tax advice and tax
planning are set forth below. PWC is engaged to review and sign the Federal Income and Excise returns, along with review excise distributions.
| March 31, 2013 | March 31, 2012 | |||||||
Tax Fees | $ | 174,635 | $ | 179,526 | ||||
There were no fees billed for the last two fiscal years ended March 31 for professional services rendered by the principal accountant to the investment adviser for tax compliance, tax advice and tax planning that were required to be pre-approved by the Audit Committee as described in paragraph (e)(1) of this Item 4.
(d) All Other Fees—The aggregate fees billed for the last two fiscal years ended March 31 for products and services provided by the principal accountant to the Registrant, other than the services reported in paragraph (a) – (c) of this Item 4 are set forth below.
| March 31, 2013 | March 31, 2012 | |||||||
All Other Fees | $ | 0 | $ | 0 | ||||
There were no fees billed for the last two fiscal years ended March 31 for products and services provided by the principal accountant to the investment adviser that were required to be pre-approved by the Audit Committee as described in paragraph (e)(1) of this Item 4.
(e)(1) Audit Committee’s Pre-Approval Policies and Procedures
RIDGEWORTH FUNDS
Audit and Non-Audit Services Pre-Approval Policy
I. Statement of Principles
As set forth in the chart below, the Sarbanes-Oxley Act of 2002 (the “Act”), and rules adopted by the Securities and Exchange Commission (“SEC”) require that the Audit Committee of the Board of Trustees pre-approve all audit services and non-audit services provided to RidgeWorth Funds (the “Trust”) and its portfolios (the “Funds”) by its independent accountant (“Auditor”), as well as non-audit services provided by the Auditor to the Funds’ investment adviser and to affiliates of the adviser that provide ongoing services to the Funds (“Service Affiliates”), listed on Appendix A, if the services directly impact the Funds’ operations and financial reporting.1
Where Pre-Approval is Required
Audit Service | Non-Audit Service | |||
Fund | Yes | Yes | ||
Adviser | No | Yes, if directly related to Fund operation and financial reporting | ||
Service Affiliate | No | Yes, if directly related to Fund operation and financial reporting |
| 1 | The Audit Committee also is permitted to ratify the provision of inadvertent non-audit services, but only if: |
| ¡ | the value of all such services do not exceed 5% of total revenues paid by the Trust and Service Affiliates to the Auditor in the fiscal year when services are provided; |
| ¡ | the services were not recognized as non-audit services at the time they were provided; and |
| ¡ | the services are promptly brought to the attention of the Audit Committee and approved prior to the completion of the audit. |
The following policies and procedures (except Section IX) govern the ways in which the Audit Committee will pre-approve audit and various types of non-audit services that the Auditor provides to the Trust and to Service Affiliates. These policies and procedures do not apply in the case of audit services that the Auditor provides to Service Affiliates, nor do they apply to services that an audit firm other than the Auditor provides to such entities.
These policies and procedures comply with the requirements for pre-approval, but also provide a mechanism by which management of the Trust may request and secure pre-approval of audit and non-audit services in an orderly manner with minimal disruption to normal business operations. Pre-approval of non-audit services by the Auditor may be achieved through a combination of the procedures described in Section VI below.
With respect to non-audit services that may be provided to the Trust by an accounting firm other than the Auditor, the Chairperson of the Audit Committee is authorized to pre-approve such services in accordance with the procedures described in Section IX below.
II. Audit Services
The annual audit services engagement scope and terms will be subject to the specific pre-approval of the Audit Committee. Audit services include the annual financial statement audit (including required rating agency reviews) and other procedures required to be performed by the independent auditor to be able to form an opinion on the Trust’s financial statements. The Audit Committee will monitor the audit services engagement throughout the year and will also approve, if necessary, any changes in terms and conditions resulting from changes in audit scope, Fund structure or other items. The Audit Committee will pre-approve all audit services for the Trust.
III. Audit-related Services
Audit-related services are assurance and related services that are reasonably related to the performance of the audit or review of the Trust’s financial statements or that are traditionally performed by the Auditor. The Audit Committee will pre-approve all audit-related services for the Trust.
IV. Tax Services
Tax services to the Trust include tax compliance, tax planning and tax advice. The Audit Committee will review all proposed tax related services to assure that their provision would not impair the independence of the Auditor. The Audit Committee will pre-approve all tax services for the Trust.
V. All Other Services
While the SEC’s rules prohibit the Auditor from providing specific non-audit services, as listed on Appendix A, certain other types of non-audit services are permitted. Accordingly, the Audit Committee believes it may pre-approve those permissible non-audit services classified as All Other Services that it believes would not impair the independence of the Auditor, and are consistent with the SEC’s rules on auditor independence. The Audit Committee will pre-approve all other services for the Trust.
VI. Procedures
| A. | Regular Pre-Approval Procedures |
The Audit Committee shall pre-approve at its regularly scheduled meetings the audit, audit-related, tax and other non-audit services to be rendered by the Auditor to the Trust and those non-audit services to be rendered by the Auditor to the Service Affiliates that require pre-approval by the Audit Committee. In connection with such pre-approvals, the Auditor, or the President and/or Treasurer with the assistance of the Auditor, shall provide the Audit Committee with a report containing
information about each type of service to be pre-approved at the meeting, an explanation of why the service is being performed, and projected fees.
The Auditor shall notify the President, Treasurer, and Chairperson of the Audit Committee as soon as practicable regarding its engagement to provide Fund-related non-audit services to Service Affiliates.
| B. | Interim Pre-Approval Procedures |
If, in the opinion of the President and/or Treasurer, a proposed engagement needs to commence before the next regularly scheduled Audit Committee meeting, the Chairperson of the Audit Committee (the “Chairperson”) is authorized to pre-approve the engagement so long as the amount to be paid to the Auditor would not exceed $50,000. The President and/or Treasurer will coordinate with the Chairperson and provide to the Chairperson, with the assistance of the Auditor, information about the service to be considered for pre-approval. The Auditor may not commence the engagement under consideration until the President and/or Treasurer has indicated that pre-approval has been obtained from the Chairperson. The Chairperson will report any interim pre-approval decisions to the Audit Committee at its next regularly scheduled meeting.
VII. Recordkeeping
The Trust shall maintain a written record of all decisions made by the Audit Committee or by the Chairperson of the Audit Committee pursuant to these procedures, together with appropriate supporting material. In connection with the ratification of any inadvertent non-audit services, a record shall be made indicating that each of the conditions for this exception to the pre-approval requirement has been satisfied.
VIII. Amendment
The Audit Committee may review and amend these policies and procedures from time to time as it deems appropriate.
IX. Interim Pre-Approval of Non-Audit Services By Other Accounting Firms
If, in the opinion of the President and/or Treasurer, a proposed engagement for non-audit services to the Trust by an accounting firm other than the Auditor needs to commence before the next regularly scheduled Audit Committee meeting, the Chairperson is authorized to pre-approve the engagement so long as the amount to be paid to the accounting firm would not exceed $50,000. The Chairperson will report any interim pre-approval decisions to the Audit Committee at its next regularly scheduled meeting.
Adopted: March 1, 2012
Amended
Appendix A
Service Affiliates Subject to Pre-Approval of Non-Audit Services
Including, but not limited to:
RidgeWorth Capital Management, Inc. and its subsidiaries.
Zevenbergen Capital Investments LLC
Prohibited Non-Audit Services
| • | Bookkeeping or other services related to the accounting records or financial statements of the audit client; |
| • | Financial information systems design and implementation; |
| • | Appraisal or valuation services, fairness opinions, or contribution-in-kind reports; |
| • | Actuarial services; |
| • | Internal audit outsourcing services; |
| • | Management functions or human resources; |
| • | Broker or dealer, investment adviser, or investment banking services; |
| • | Legal services and expert services unrelated to the audit. |
(e)(2) Percentage of Services—None of the services summarized in (b)-(d), above, were approved by the Audit Committee pursuant to Rule 2-01(c)(7)(i)(C) of Regulation S-X.
(f) No disclosures are required by this Item 4(f).
(g) The aggregate non-audit fees billed for the last two fiscal years ended March 31 for services rendered by the principal accountant to the Registrant are set forth below.
March 31, 2013 | March 31, 2012 | |||||||||
$174,635 | $179,526 |
The approximate aggregate non-audit fees billed for the last two fiscal years ended March 31 for services rendered by the Registrant’s principal accountant to the Registrant’s investment adviser, and any other entity controlling, controlled by, or under common control with the Registrant’s investment adviser that provides ongoing services to the Registrant are set forth below.
March 31, 2013 | March 31, 2012 | |||||||||
$53,100,000 | $17,100,000 |
Services for which the non-audit fees were billed relate principally to mortgage compliance reviews, general corporate and state and local tax assistance and accounting matters, and various strategic reporting consulting projects.
(h) In regards to Item 4 (g), the Audit Committee has considered that the provision of non-audit services that were rendered to the Registrant’s investment adviser (not including any sub-adviser whose role is primarily portfolio management and is subcontracted with or overseen by another investment adviser), and any entity controlling, controlled by, or under common control with the investment adviser that provides ongoing services to the Registrant that were not pre-approved pursuant to paragraph (c)(7)(ii) of Rule 2-01 of Regulation S-X is compatible with maintaining the principal accountant’s independence.
| Item 5. | Audit Committee of Listed Registrants. |
Not applicable.
| Item 6. | Schedule of Investments. |
| (a) | Schedule of Investments is included as a part of the reports to shareholders filed under Item 1 of this Form N-CSR. |
| (b) | Not applicable. |
| Item 7. | Disclosure of Proxy Voting Policies and Procedures for Closed-End Management Investment Companies. |
Not applicable.
| Item 8. | Portfolio Managers of Closed-End Investment Companies. |
Not applicable.
| Item 9. | Purchases of Equity Securities by Closed-End Management Investment Company and Affiliated Purchasers. |
Not applicable.
| Item 10. | Submission of Matters to a Vote of Security Holders. |
The Board of Trustees has not adopted formal procedures by which shareholders may recommend nominees to the Board of Trustees.
| Item 11. | Controls and Procedures. |
(a) The Registrant’s principal executive officer and principal financial officer have concluded, based on their evaluation of the Registrant’s disclosure controls and procedures as conducted within 90 days of the filing date of this report, that these disclosure controls and procedures are adequately designed and are operating effectively to ensure that information required to be disclosed by the Registrant on Form N-CSR is recorded, processed, summarized and reported within the time periods specified in the Securities and Exchange Commission’s rules and forms.
(b) There were no changes in the Registrant’s internal control over financial reporting that occurred during the second fiscal quarter of the period covered by this report that have materially affected or are reasonably likely to materially affect, the Registrant’s internal control over financial reporting.
| Item 12. | Exhibits. |
| (a) | (1) | Code of Ethics described in Item 2 is attached hereto. | ||
| (2) | The certifications required by Rule 30a-2(a) of the 1940 Act are attached hereto. | |||
| (3) | Not applicable. |
(b) The certifications required by Rule 30a-2(b) of the 1940 Act and Section 906 of the Sarbanes-Oxley Act of 2002 are attached hereto.
SIGNATURES
Pursuant to the requirements of the Securities Exchange Act of 1934 and the Investment Company Act of 1940, the Registrant has duly caused this report to be signed on its behalf by the undersigned, thereunto duly authorized.
| RIDGEWORTH FUNDS | ||
| By: | /s/ Julia R. Short | |
Julia R. Short President | ||
| Date: | June 7, 2013 | |
Pursuant to the requirements of the Securities Exchange Act of 1934 and the Investment Company Act of 1940, this report has been signed below by the following persons on behalf of the Registrant and in the capacities and on the dates indicated.
| By: | /s/ Julia R. Short | |
Julia R. Short President | ||
| Date: | June 7, 2013 | |
| By: | /s/ Denise R. Lewis | |
Denise R. Lewis Treasurer | ||
| Date: | June 7, 2013 | |