USA Truck

Forward-Looking Statement
This information and statements made at the Stephens Inc. Fall Investment Conference
may contain forward-looking statements within the meaning of Section 27A of the
Securities Act of 1933, as amended and Section 21E of the Securities Exchange Act of
1934, as amended. These statements generally may be identified by their use of terms
or phrases such as “expects,” “estimates,” “anticipates,” “projects,” “believes,”
“plans,” “intends,” “may,” “will,” “should,” “could,” “potential,” “continue,”
“future,” and terms or phrases of similar substance. Forward-looking statements are
based upon the current beliefs and expectations of our management and are inherently
subject to risks and uncertainties, some of which cannot be predicted or quantified,
which could cause future events and actual results to differ materially from those set
forth in, contemplated by, or underlying the forward-looking statements. Accordingly,
actual results may differ from those set forth in the forward-looking
statements. Readers should review and consider the factors that may affect future
results and other disclosures by the Company in its reports, Annual Report on Form
10-K, and other filings with the Securities and Exchange Commission. We disclaim
any obligation to update or revise any forward-looking statements to reflect actual
results or changes in the factors affecting the forward-looking information. In light of
these risks and uncertainties, the forward-looking events and circumstances discussed
at the Stephens Inc. Fall Investment Conference might not occur.
Our Stock is Under-Valued
As of November 10, 2008
Price to Book Multiples
Market Rejected Growth Strategy
USAK is the 2nd fastest growing name in TL Group*over past 10 years
(14.3% revenue CAGR), but…….
7th out of 9: EBITDA Growth CAGR
8th out of 9: Average ROCE and ROIC
2nd Largest Spread: Revenue CAGR and EBITDA CAGR (850 BPS)
2nd Largest Spread: Revenue CAGR and Net Income CAGR (500 BPS)
Largest Spread: Revenue CAGR and ROCE (930 BPS)
Largest Spread: Revenue CAGR and ROIC (950 BPS)
USAK has the 8th ranked 10-year Stock Price CAGR (1.0%)
*CLDN, CVTI, HTLD, JBHT, KNX, MRTN, PTSI, USAK and WERN
Source: SEC Documents and Stephens Inc.

ROC Drives Stock!
Copeland’s Value Mountain
Revenue Growth vs. Stock Price: Low Correlation + 27%
Operating Ratio vs. Stock Price: Lowest Correlation - 2%
EBIT Growth vs. Stock Price: High Correlation + 74%
ROCE vs. Stock Price: Highest Correlation + 79%
Stock Performance Drivers
Lane’s Value Mountain
*SEC Documents and Stephens Inc.
Applied to T&L Industry
Confirms Copeland’s Theory
Divergent Business Models
1,190 BPS
270 BPS
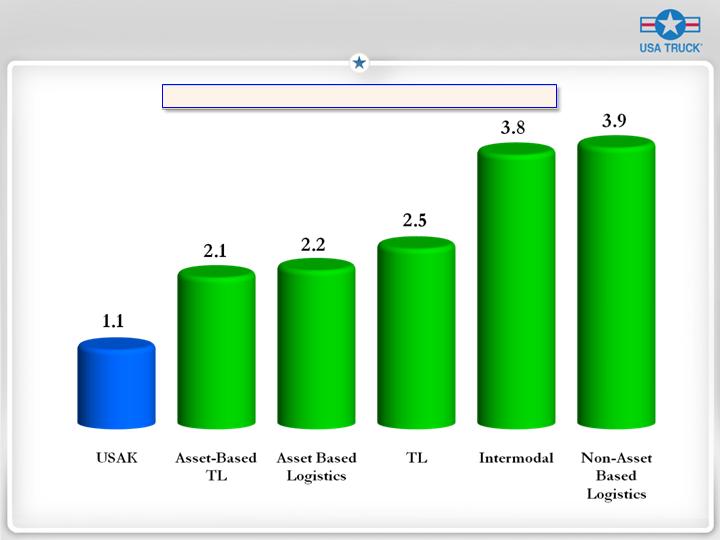
Operating Margin Comparison
2007 Average LOH = 829
2007 Average LOH = 550
Strong Core
Strong Core
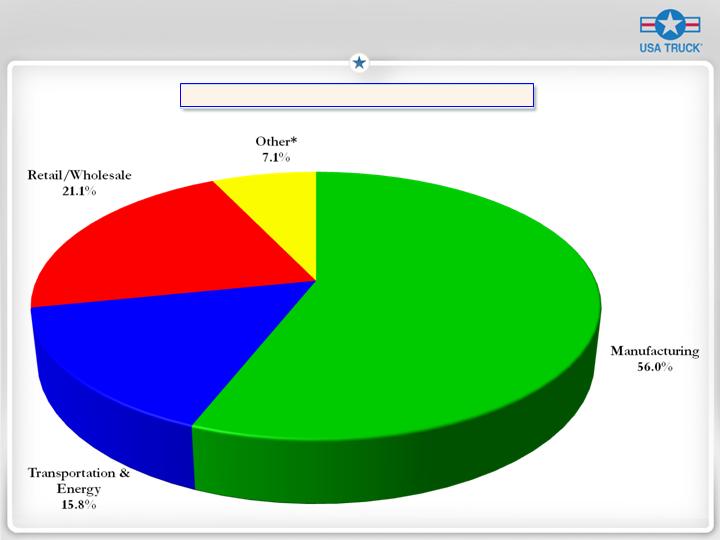
Deep, Diverse Customer Base
Strong Core
Industries Serviced
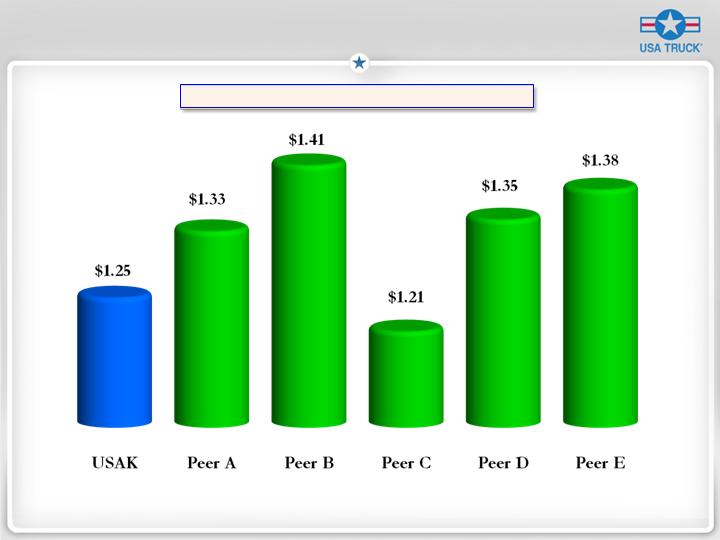
Best-In-Class Cost Structure
Operating Cost per Mile*
* Asset-based operations only for quarter ended September 30,
2008 Source: SEC Documents and USA Truck, Inc.

A New Business Strategy

A Fresh Operating Strategy
Preserve the Core:
Customer base
Cost discipline
Service culture
Trucking Segment:
Restrict capacity growth
Build profitable freight flows
Reduce length of haul
Increase use of asset-light owner operators (120/5%)
Strategic Capacity Solutions (SCS) Segment:
Aggressive growth in asset-light Brokerage & Intermodal
Compliment our Trucking Operations
Flexible capacity for customers
Strong return on capital
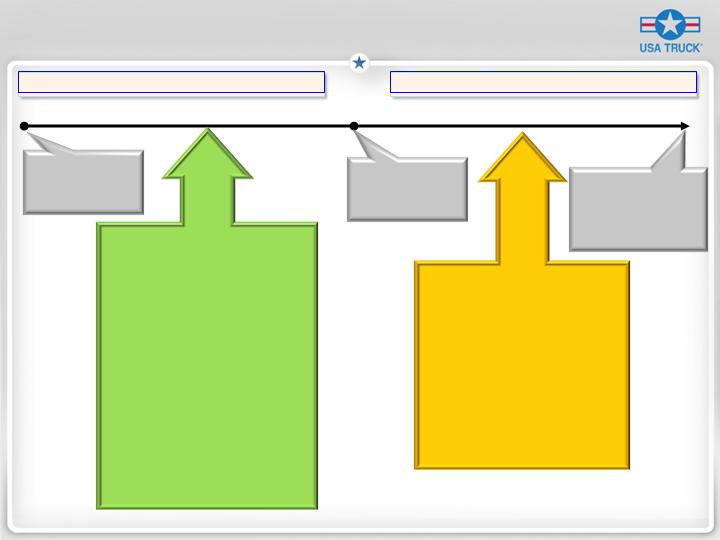
The VEVA*Plan
August 2007
December 2013
December 2010
PHASE II – Earnings Growth
* We call our strategic plan Vision for Economic Value-Added, or VEVA
1.0 x Book Value
2 % ROC
98% O.R.
3.0 x Book Value
10% ROC
89% O.R.
4.0 x Book Value
≥ 10% ROC
≥ 10% EBIT CAGR
< 89% O.R.
The Results We’ll Need
Consistent Earnings
Earn our Cost of Capital
Positioned for Long-Term Growth
How We'll Do It
Culture (Mission, Core Values)
Project Velocity
War on Accidents
Limit Capacity/Yield Management
Cost Management
Expand Owner Operator Fleet
Improve Brokerage Model
Launch Intermodal Model
Project Tech
Project People
The Results We’ll Need
Sustained Earnings Growth > 10%
Positive Economic Value Added
How We’ll Do It
Intermodal Growth
Brokerage Growth
Niche Dedicated Launch
General Freight Acquisitions
Productivity Gains
Share Repurchases/Dividends
PHASE I – Margin Expansion
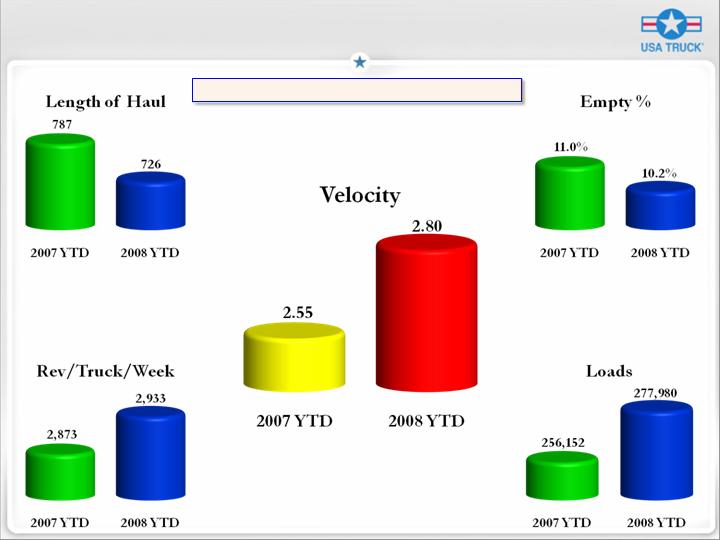
Project Velocity
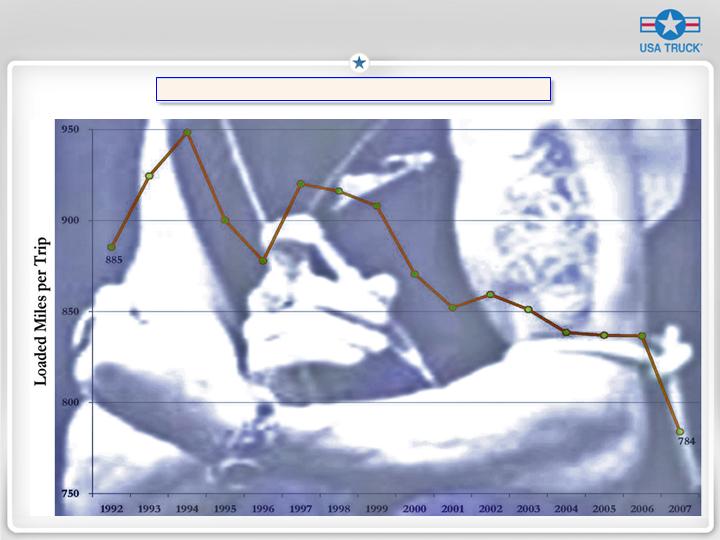
Our Mileage Addiction
Velocity Effect
Nine Months Ended September 30
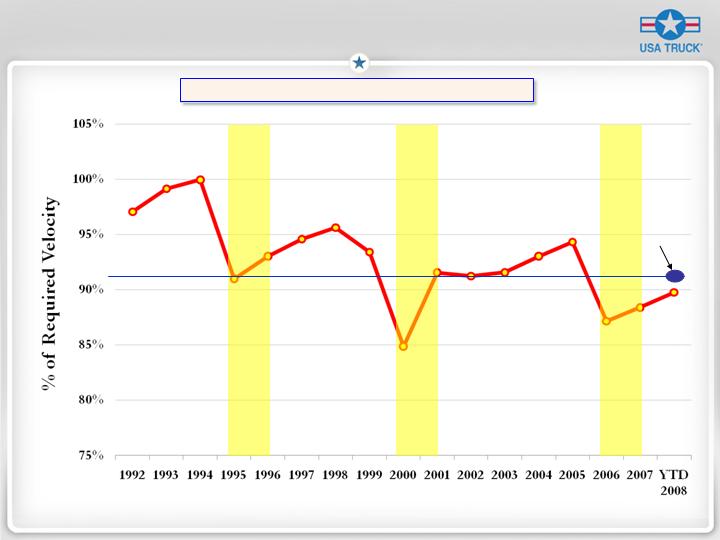
Project Velocity
Performance History
March 22 to
September 30
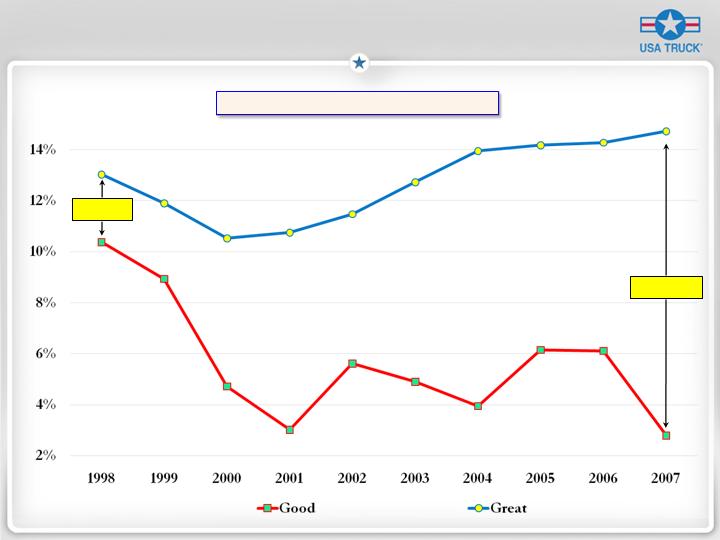
Yield Management
Base Revenue per Paid Mile (2000 = 100)
4.7%
CAGR
1.1%
CAGR

The War on Accidents
Insurance & Claims

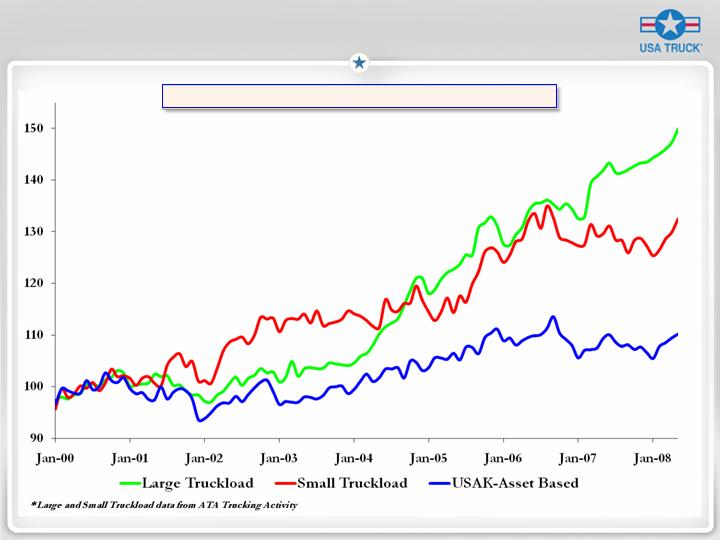
Strategic Capacity Solutions
Freight Brokerage Growth*
Intermodal Growth*
*Base Revenue (excludes fuel surcharge) in Thousands
Project Tech
Software Application
Hardware Platform
Developer
Year Installed
Age
Accounts Payable
Mainframe
3rdParty
Accounting
Mainframe
3rdParty
Risk Management
Mainframe
Custom
Operations
Mainframe
Custom
Accounts Receivable
Mainframe
Custom
Maintenance
Mainframe
Custom
Website
Mainframe
Custom
Driver Recruiting
Mainframe
Custom
Lane Analysis
Server
3rdParty
Business Intelligence
Server
3rdParty
Customer Relationship Mgmt
Server
3rdParty
Aging Technology Infrastructure
October 2008
First Quarter 2009
Fourth Quarter 2008
Third Quarter 2009
Third Quarter 2009
January 2008
October 2008
January 2008
1985 23
1995 13
1999 9
Project People
USAK – 1/1/2008 3.2 : 1
Peer Average – 2007 3.8 : 1
Best-in-Class – 2007 6.0 : 1
USAK – 9/30/08 3.5 : 1
Driver to Non-Driver Ratio
Education Level
Fort Smith MSA
National Average
Less than High School
27%
20%
Bachelor’s degree or higher
13%
24%
Why Invest In USA Truck?
We have a solid core of
service, cost discipline
and a diverse customer
portfolio.
Our stock is trading at
a deep discount to our
industry peers.
We have a vision and a
plan to create
shareholder value.
USA Truck