USA Truck

Forward-Looking Statement
This information and the statements made at this conference presentation may contain
forward-looking statements within the meaning of Section 27A of the Securities Act of 1933, as
amended and Section 21E of the Securities Exchange Act of 1934, as amended. These
statements generally may be identified by their use of terms or phrases such as “expects,”
“estimates,” “anticipates,” “projects,” “believes,” “plans,” “intends,” “may,” “will,” “should,”
“could,” “potential,” “continue,” “future,” and terms or phrases of similar
substance. Forward-looking statements are based upon the current beliefs and expectations of
our management and are inherently subject to risks and uncertainties, some of which cannot
be predicted or quantified, which could cause future events and actual results to differ
materially from those set forth in, contemplated by, or underlying the forward-looking
statements. Accordingly, actual results may differ from those set forth in the forward-looking
statements. Readers should review and consider the factors that may affect future results and
other disclosures by the Company in its reports, Annual Report on Form 10-K, and other filings
with the Securities and Exchange Commission. We disclaim any obligation to update or revise
any forward-looking statements to reflect actual results or changes in the factors affecting the
forward-looking information. In light of these risks and uncertainties, the forward-looking
events and circumstances discussed in this conference presentation might not occur.

Improved Performance

Vision
Planning
Execution
Why USAK?
Research

Our Stock is Under-Valued
As of January 28, 2009
Price to Book Multiples

Why ROC and EPS?
Financial Performance Correlation to Stock Price
Vision
Planning
Execution
Why USAK?
Research
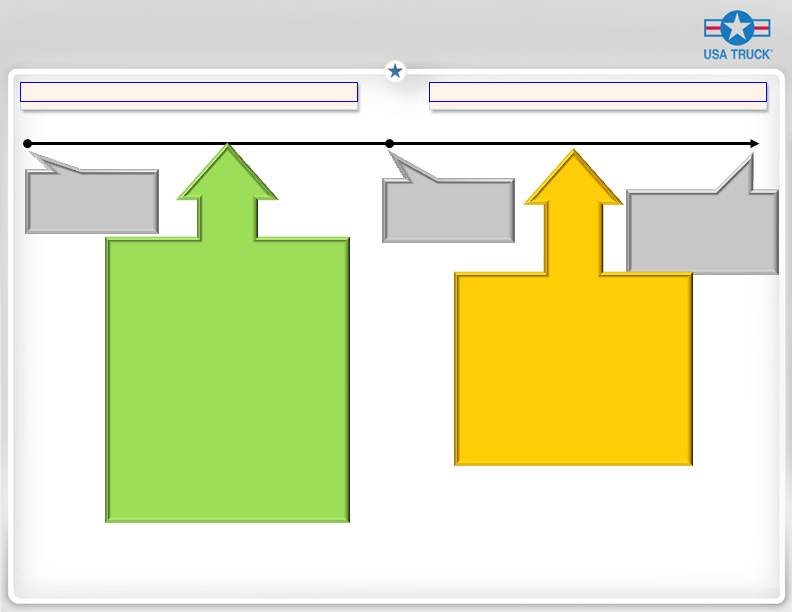
The VEVA*Plan
August 2007
December 2013
December 2010
PHASE II – Earnings Growth
* We call our strategic plan Vision for Economic Value-Added, or VEVA
1.0 x Book Value
2 % ROC
98% O.R.
3.0 x Book Value
10% ROC
89% O.R.
4.0 x Book Value
≥ 10% ROC
≥ 10% EBIT CAGR
< 89% O.R.
The Results We’ll Need
Consistent Earnings
Earn our Cost of Capital
Positioned for Long-Term Growth
How We’ll Do It
Culture (Mission, Core Values)
Project Velocity
War on Accidents
Yield Management
Cost Discipline
Expand Owner Operator Fleet
Improve Brokerage Model
Launch Intermodal Model
Project Tech
Project People
The Results We’ll Need
Sustained Earnings Growth > 10%
Positive Economic Value Added
How We’ll Do It
Intermodal Growth
Brokerage Growth
General Freight Acquisitions
Productivity Gains
Share Repurchases/Dividends
PHASE I – Margin Expansion

Vision
Planning
Execution
Why USAK?
Research
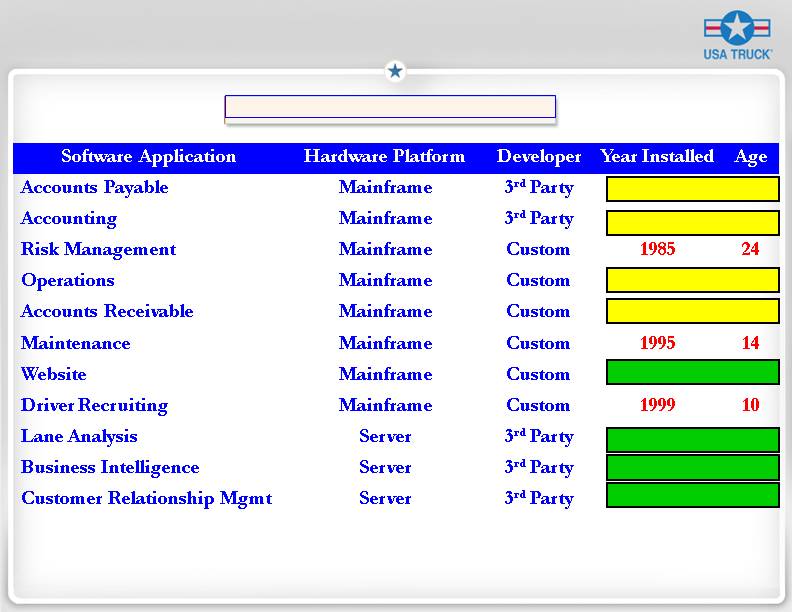
Project Tech
Aging Technology Infrastructure
October 2008
First Quarter 2009
Third Quarter 2009
January 2008
October 2008
January 2008
Third Quarter 2009
First Quarter 2009
Project People
USA Truck 12/31/2007 3.2 : 1
Peer Average 12/31/2007 3.8 : 1
Best-in-Class 12/31/2007 6.0 : 1
USA Truck 12/31/2008 3.9 : 1
Driver to Non-Driver Ratio
A Fresh Operating Strategy

Divergent Business Models
1,190 BPS
270 BPS
Operating Margin Comparison
2007 Average LOH = 829
2007 Average LOH = 550

Velocity Effect
Year-Over-Year Comparison
8.4%
3.6%
1.0%
7.3%
8.6%

Yield Management
Base Revenue per Paid Mile (2000 = 100)
4.7%
CAGR
1.1%
CAGR
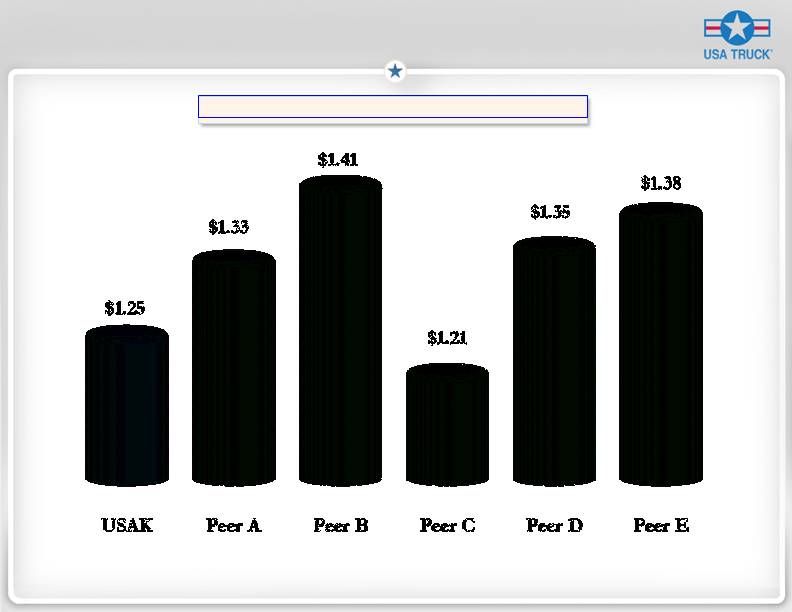
Cost Discipline
Operating Cost per Mile*
* Asset-based operations only for quarter ended September 30, 2008
Source: SEC Documents and USA Truck, Inc.
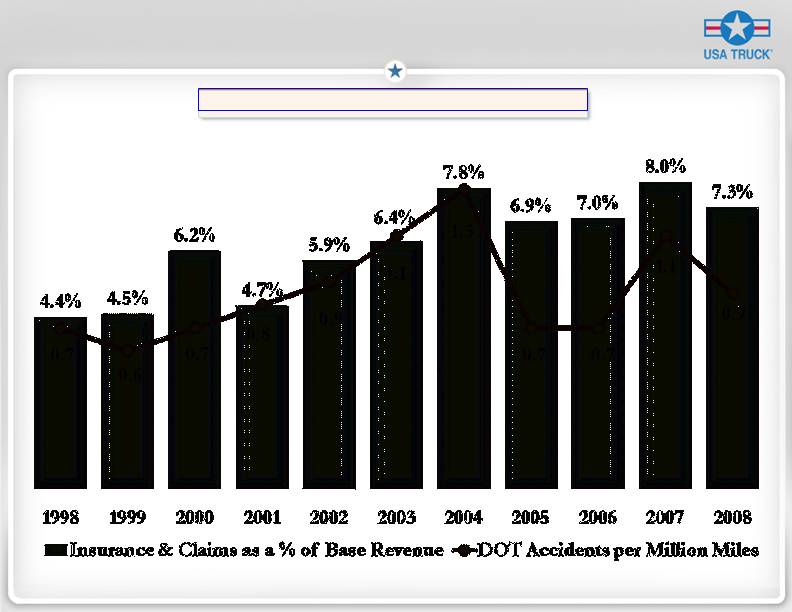
The War on Accidents
Insurance & Claims
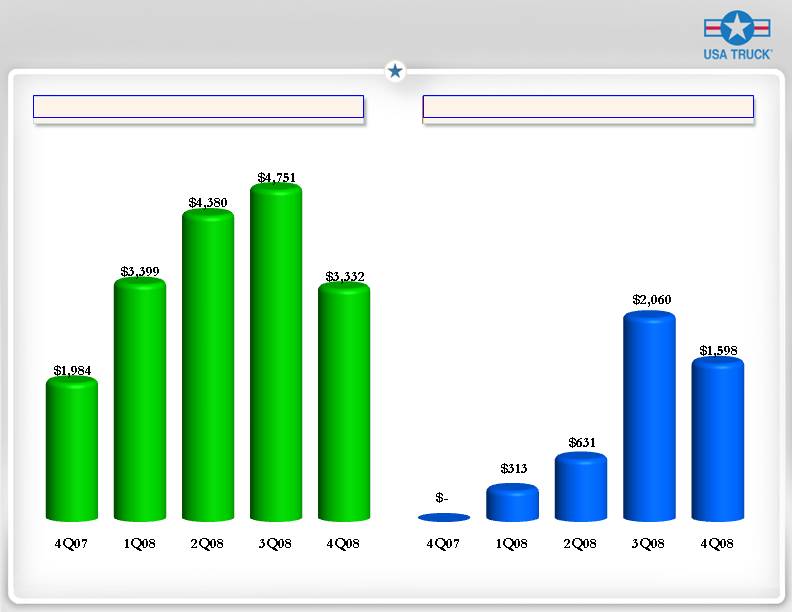
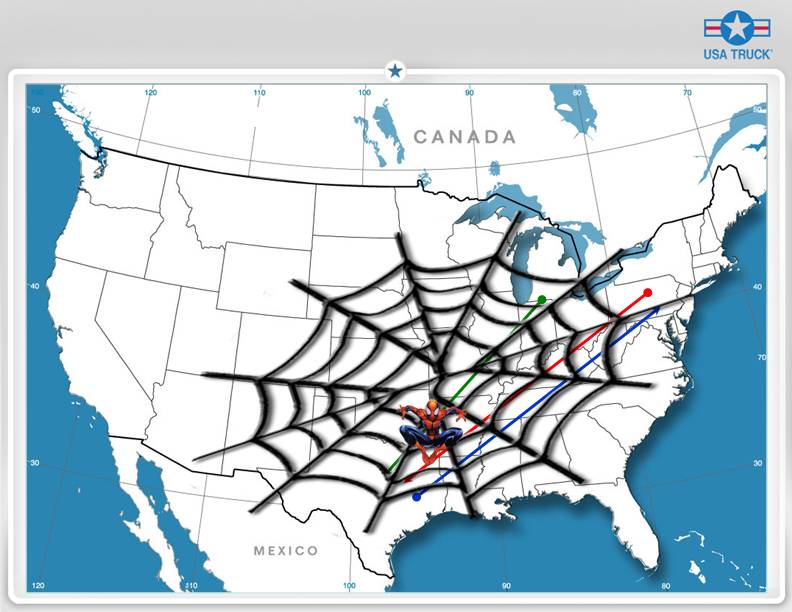
Strategic Capacity Solutions
Freight Brokerage Growth*
Intermodal Growth*
*Base Revenue (excludes fuel surcharge) in Thousands
Vision
Planning
Execution
Why USAK?
Research

The Iceberg Theory of Execution
Public Results– The “Tip of the Iceberg” where
everything is clearly visible.
What the press reports; What drives stock value; and
where the uninformed THINK execution occurs
(ROC, EPS, Operating Ratio, Revenue, etc.)
Operational Results – Just below the surface, but still
shallow enough to be visible.
What the analysts focus on; Where the Street THINKS
execution occurs
(Utilization, Revenue per Mile, Empty Miles, Cost per Mile,
Fixed Costs, etc.)
KPI Results– Deep beneath the surface beyond the
visible sunlight.
Where execution ACTUALLY occurs; Take care of
these numbers, and the Public and Operational
Results will take care of themselves!
(Velocity, Yield, Driver Pay, MPG, Owner Operator Count,
Direct Repairs, Mexico Margin, Staff Wages, APMM,
Recruiting Costs & Quality, SCS Revenue & Margin, DSO,
etc.)
Vision
Planning
Execution
Why USAK?
Research
Why Invest In USA Truck?
Substantial operating
leverage with stock
valuation deeply
discounted vs. peers.
Strong core of
management, cost
discipline and customer
base.
Vision and a plan to
create shareholder value.

USA Truck