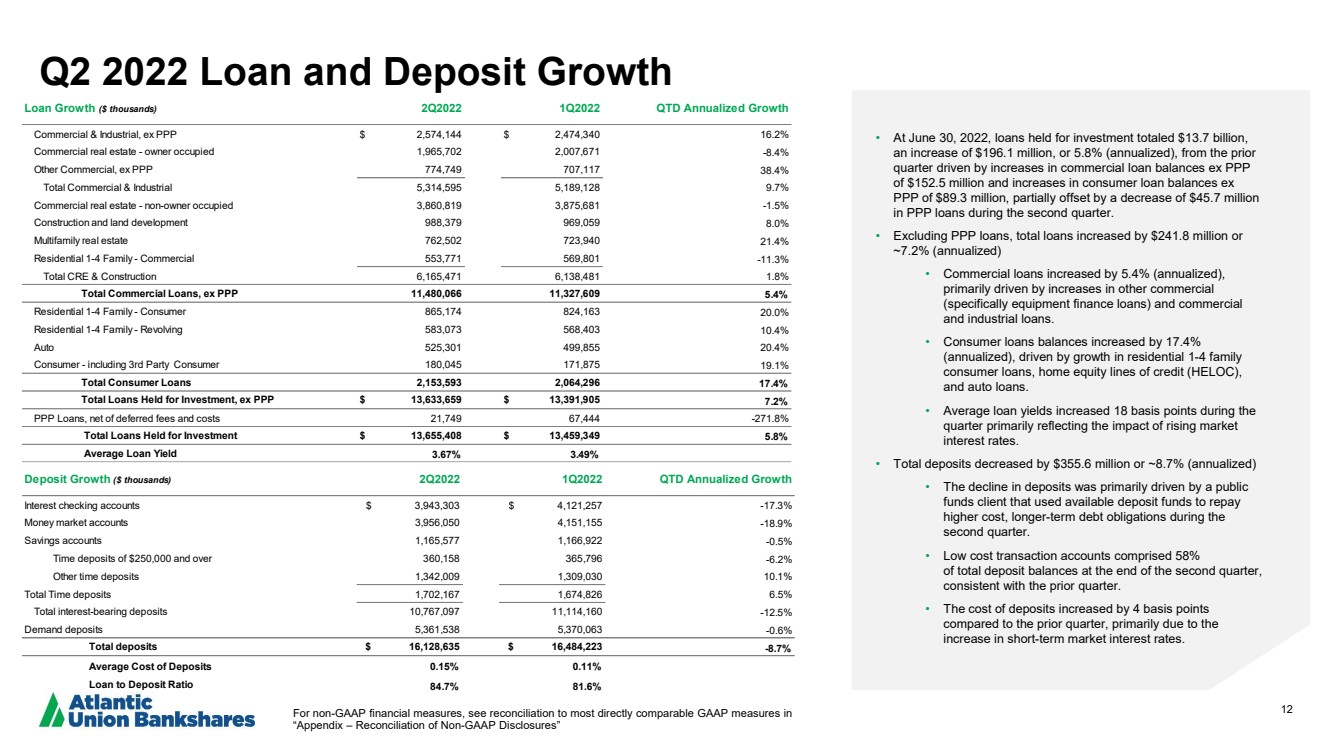
| 12 Q2 2022 Loan and Deposit Growth • At June 30, 2022, loans held for investment totaled $ 13.7 billion, an increase of $196.1 million, or 5.8% (annualized), from the prior quarter driven by increases in commercial loan balances ex PPP of $152.5 million and increases in consumer loan balances ex PPP of $89.3 million , partially offset by a decrease of $45.7 million in PPP loans during the second quarter. • Excluding PPP loans, total loans increased by $241.8 million or ~7.2% (annualized) • Commercial loans increased by 5.4 % (annualized ), primarily driven by increases in other commercial (specifically equipment finance loans) and commercial and industrial loans .. • Consumer loans balances increased by 17.4% (annualized), driven by growth in residential 1 - 4 family consumer loans, home equity lines of credit (HELOC), and auto loans .. • Average loan yields increased 18 basis points during the quarter primarily reflecting the impact of rising market interest rates. • Total deposits decreased by $355.6 million or ~8.7% (annualized) • The decline in deposits was primarily driven by a public funds client that used available deposit funds to repay higher cost, longer - term debt obligations during the second quarter. • Low cost transaction accounts comprised 58% of total deposit balances at the end of the second quarter, consistent with the prior quarter. • The cost of deposits increased by 4 basis points compared to the prior quarter, primarily due to the increase in short - term market interest rates. For non - GAAP financial measures, see reconciliation to most directly comparable GAAP measures in “Appendix – Reconciliation of Non - GAAP Disclosures” Loan Growth ($ thousands) 2Q2022 1Q2022 QTD Annualized Growth Commercial & Industrial, ex PPP $ 2,574,144 $ 2,474,340 16.2% Commercial real estate - owner occupied 1,965,702 2,007,671 -8.4% Other Commercial, ex PPP 774,749 707,117 38.4% Total Commercial & Industrial 5,314,595 5,189,128 9.7% Commercial real estate - non-owner occupied 3,860,819 3,875,681 -1.5% Construction and land development 988,379 969,059 8.0% Multifamily real estate 762,502 723,940 21.4% Residential 1-4 Family - Commercial 553,771 569,801 -11.3% Total CRE & Construction 6,165,471 6,138,481 1.8% Total Commercial Loans, ex PPP 11,480,066 11,327,609 5.4% Residential 1-4 Family - Consumer 865,174 824,163 20.0% Residential 1-4 Family - Revolving 583,073 568,403 10.4% Auto 525,301 499,855 20.4% Consumer - including 3rd Party Consumer 180,045 171,875 19.1% Total Consumer Loans 2,153,593 2,064,296 17.4% Total Loans Held for Investment, ex PPP $ 13,633,659 $ 13,391,905 7.2% PPP Loans, net of deferred fees and costs 21,749 67,444 -271.8% Total Loans Held for Investment $ 13,655,408 $ 13,459,349 5.8% Average Loan Yield 3.67% 3.49% Deposit Growth ($ thousands) 2Q2022 1Q2022 QTD Annualized Growth Interest checking accounts $ 3,943,303 $ 4,121,257 -17.3% Money market accounts 3,956,050 4,151,155 -18.9% Savings accounts 1,165,577 1,166,922 -0.5% Time deposits of $250,000 and over 360,158 365,796 -6.2% Other time deposits 1,342,009 1,309,030 10.1% Total Time deposits 1,702,167 1,674,826 6.5% Total interest-bearing deposits 10,767,097 11,114,160 -12.5% Demand deposits 5,361,538 5,370,063 -0.6% Total deposits $ 16,128,635 $ 16,484,223 -8.7% Average Cost of Deposits 0.15% 0.11% Loan to Deposit Ratio 84.7% 81.6% |