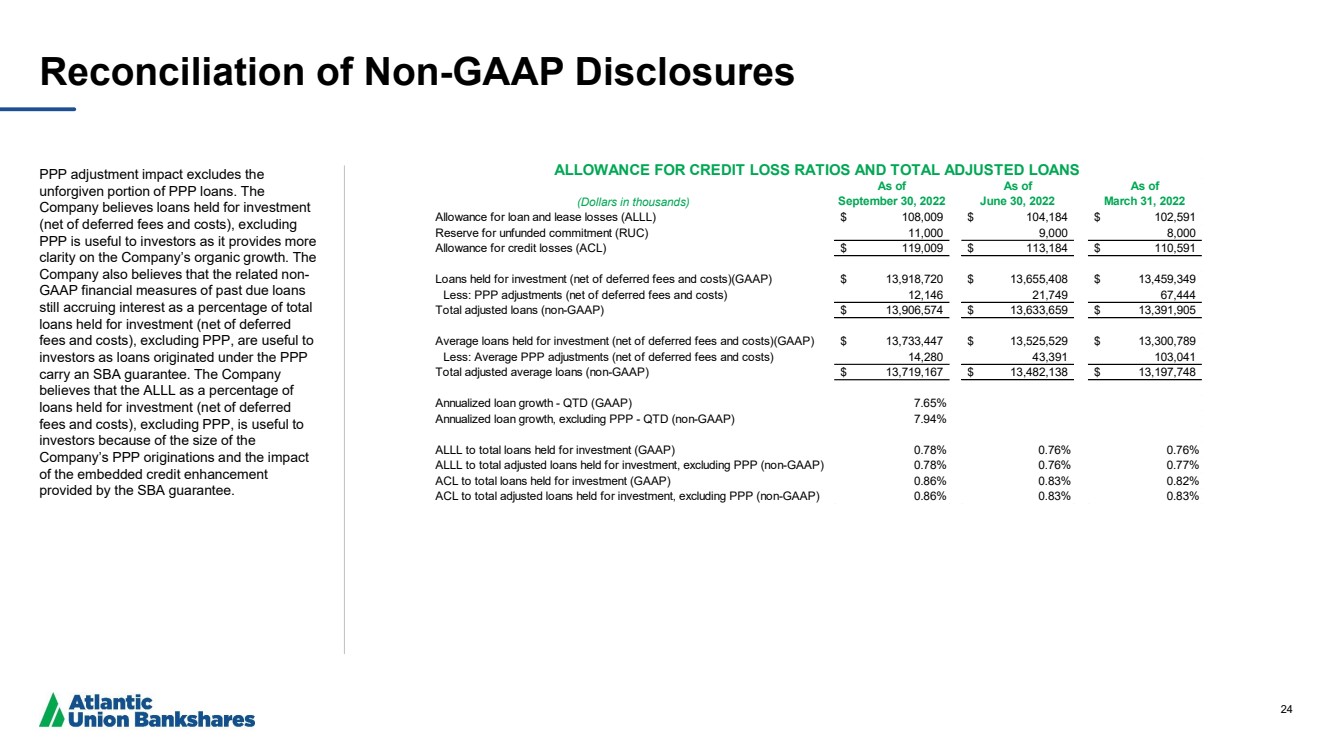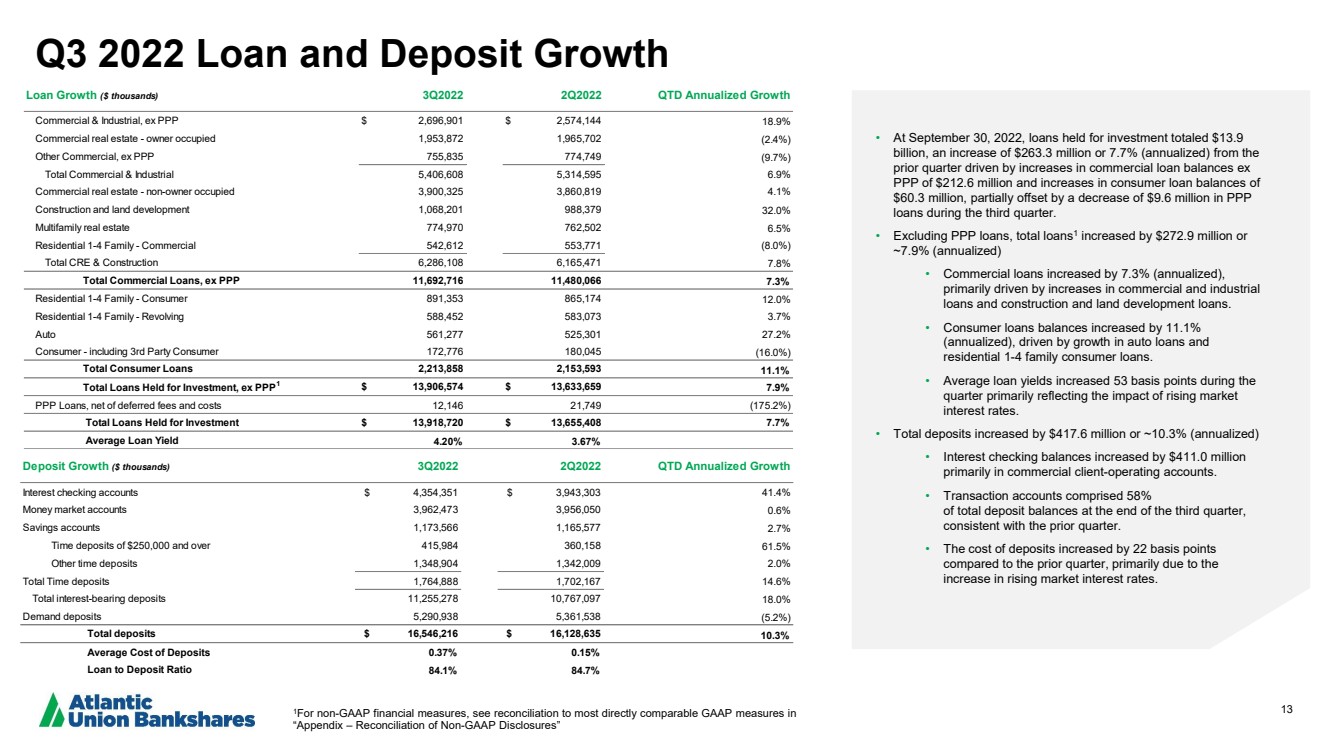
| 13 Q3 2022 Loan and Deposit Growth • At September 30, 2022, loans held for investment totaled $ 13.9 billion, an increase of $263.3 million or 7.7% (annualized) from the prior quarter driven by increases in commercial loan balances ex PPP of $212.6 million and increases in consumer loan balances of $60.3 million , partially offset by a decrease of $9.6 million in PPP loans during the third quarter. • Excluding PPP loans, total loans 1 increased by $272.9 million or ~7.9% (annualized) • Commercial loans increased by 7.3 % (annualized ), primarily driven by increases in commercial and industrial loans and construction and land development loans .. • Consumer loans balances increased by 11.1% (annualized), driven by growth in auto loans and residential 1 - 4 family consumer loans. • Average loan yields increased 53 basis points during the quarter primarily reflecting the impact of rising market interest rates. • Total deposits increased by $417.6 million or ~ 10.3 % (annualized) • Interest checking balances increased by $ 411.0 million primarily in commercial client - operating accounts. • Transaction accounts comprised 58% of total deposit balances at the end of the third quarter, consistent with the prior quarter. • The cost of deposits increased by 22 basis points compared to the prior quarter, primarily due to the increase in rising market interest rates. 1 For non - GAAP financial measures, see reconciliation to most directly comparable GAAP measures in “Appendix – Reconciliation of Non - GAAP Disclosures” Deposit Growth ($ thousands) 3Q2022 2Q2022 QTD Annualized Growth Interest checking accounts $ 4,354,351 $ 3,943,303 41.4% Money market accounts 3,962,473 3,956,050 0.6% Savings accounts 1,173,566 1,165,577 2.7% Time deposits of $250,000 and over 415,984 360,158 61.5% Other time deposits 1,348,904 1,342,009 2.0% Total Time deposits 1,764,888 1,702,167 14.6% Total interest-bearing deposits 11,255,278 10,767,097 18.0% Demand deposits 5,290,938 5,361,538 (5.2%) Total deposits $ 16,546,216 $ 16,128,635 10.3% Average Cost of Deposits 0.37% 0.15% Loan to Deposit Ratio 84.1% 84.7% Loan Growth ($ thousands) 3Q2022 2Q2022 QTD Annualized Growth Commercial & Industrial, ex PPP $ 2,696,901 $ 2,574,144 18.9% Commercial real estate - owner occupied 1,953,872 1,965,702 (2.4%) Other Commercial, ex PPP 755,835 774,749 (9.7%) Total Commercial & Industrial 5,406,608 5,314,595 6.9% Commercial real estate - non-owner occupied 3,900,325 3,860,819 4.1% Construction and land development 1,068,201 988,379 32.0% Multifamily real estate 774,970 762,502 6.5% Residential 1-4 Family - Commercial 542,612 553,771 (8.0%) Total CRE & Construction 6,286,108 6,165,471 7.8% Total Commercial Loans, ex PPP 11,692,716 11,480,066 7.3% Residential 1-4 Family - Consumer 891,353 865,174 12.0% Residential 1-4 Family - Revolving 588,452 583,073 3.7% Auto 561,277 525,301 27.2% Consumer - including 3rd Party Consumer 172,776 180,045 (16.0%) Total Consumer Loans 2,213,858 2,153,593 11.1% Total Loans Held for Investment, ex PPP 1 $ 13,906,574 $ 13,633,659 7.9% PPP Loans, net of deferred fees and costs 12,146 21,749 (175.2%) Total Loans Held for Investment $ 13,918,720 $ 13,655,408 7.7% Average Loan Yield 4.20% 3.67% |