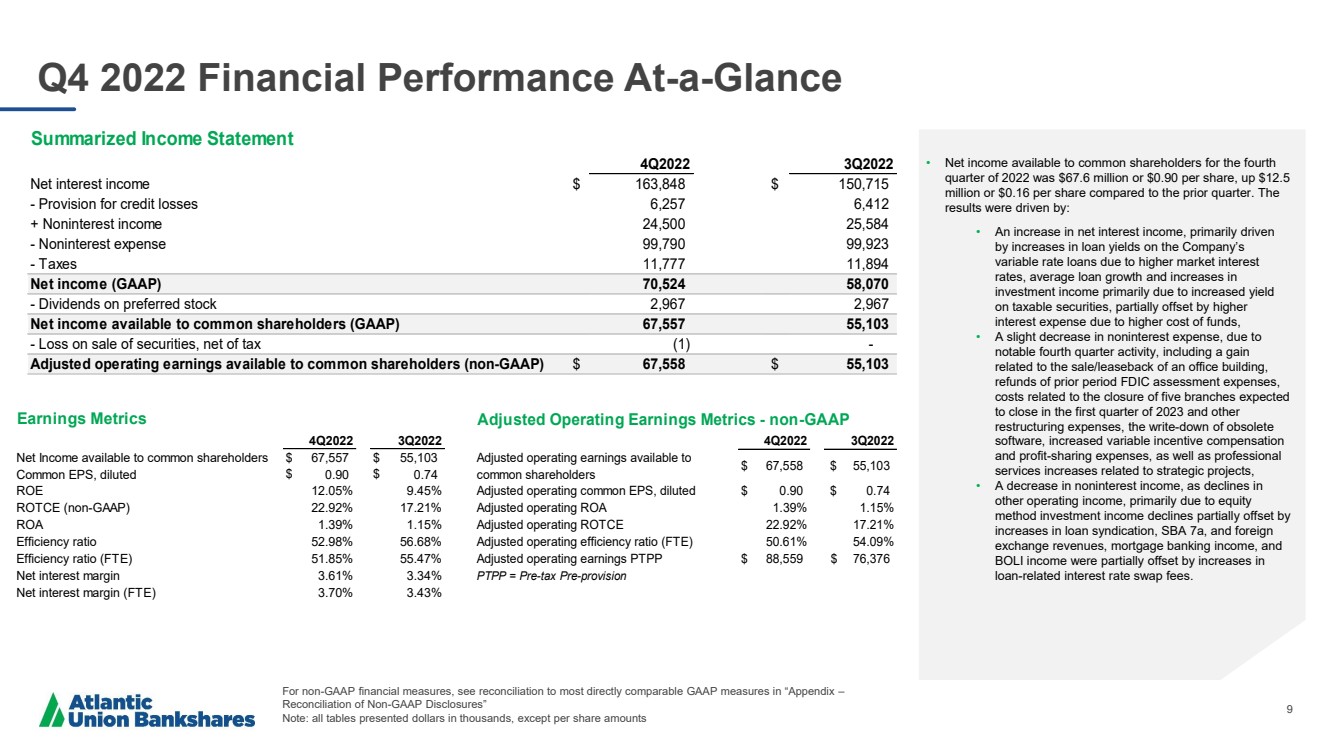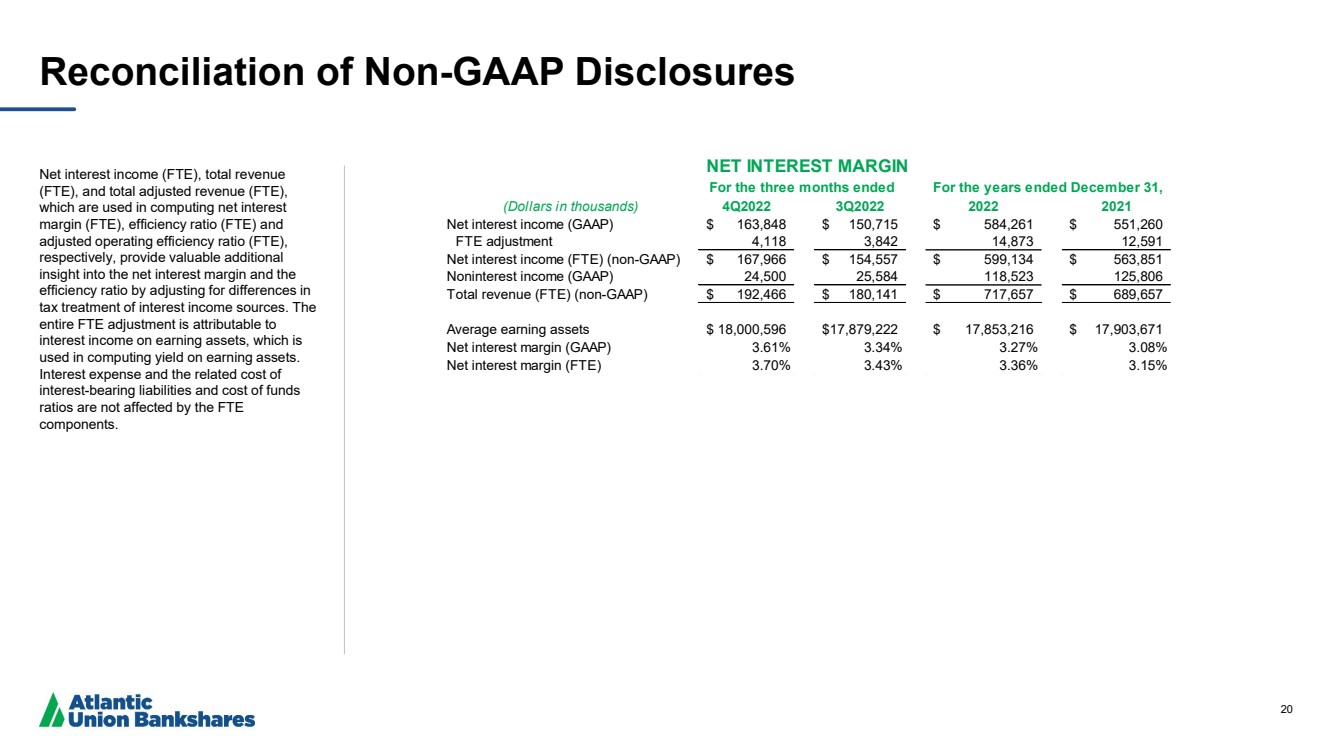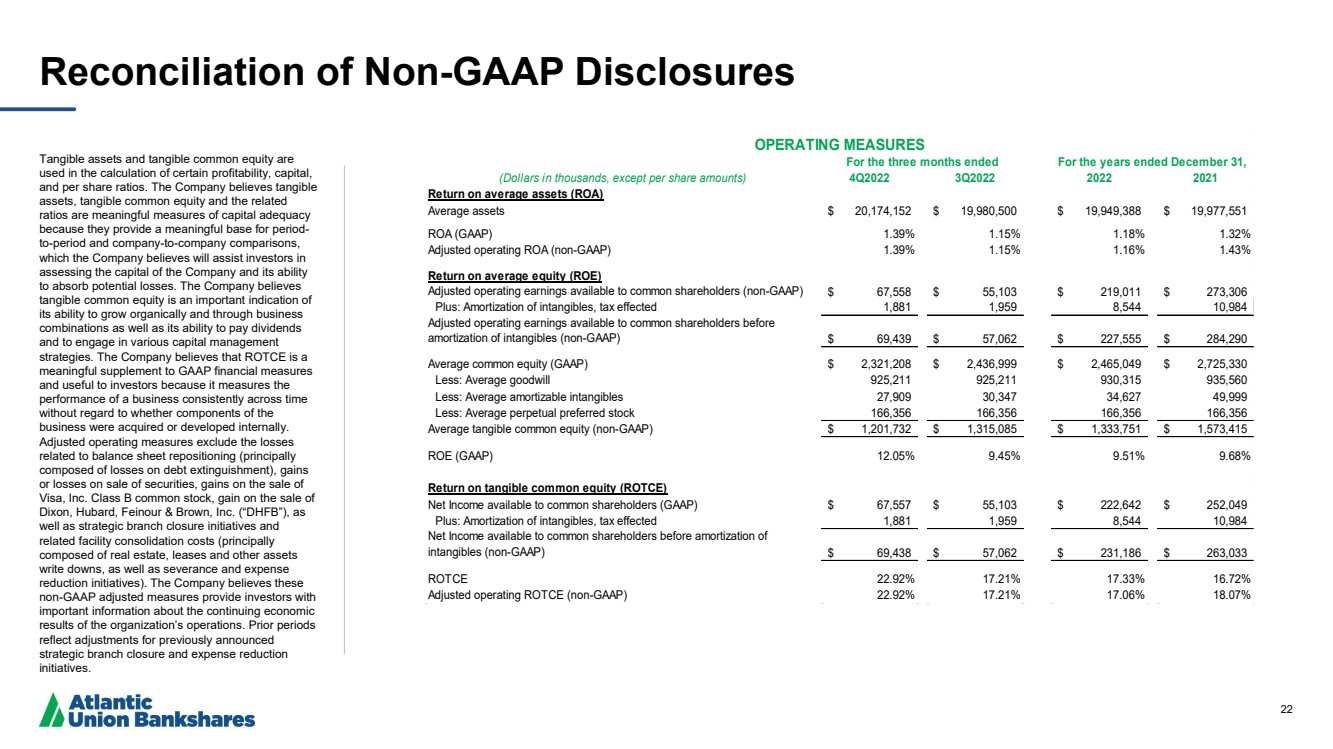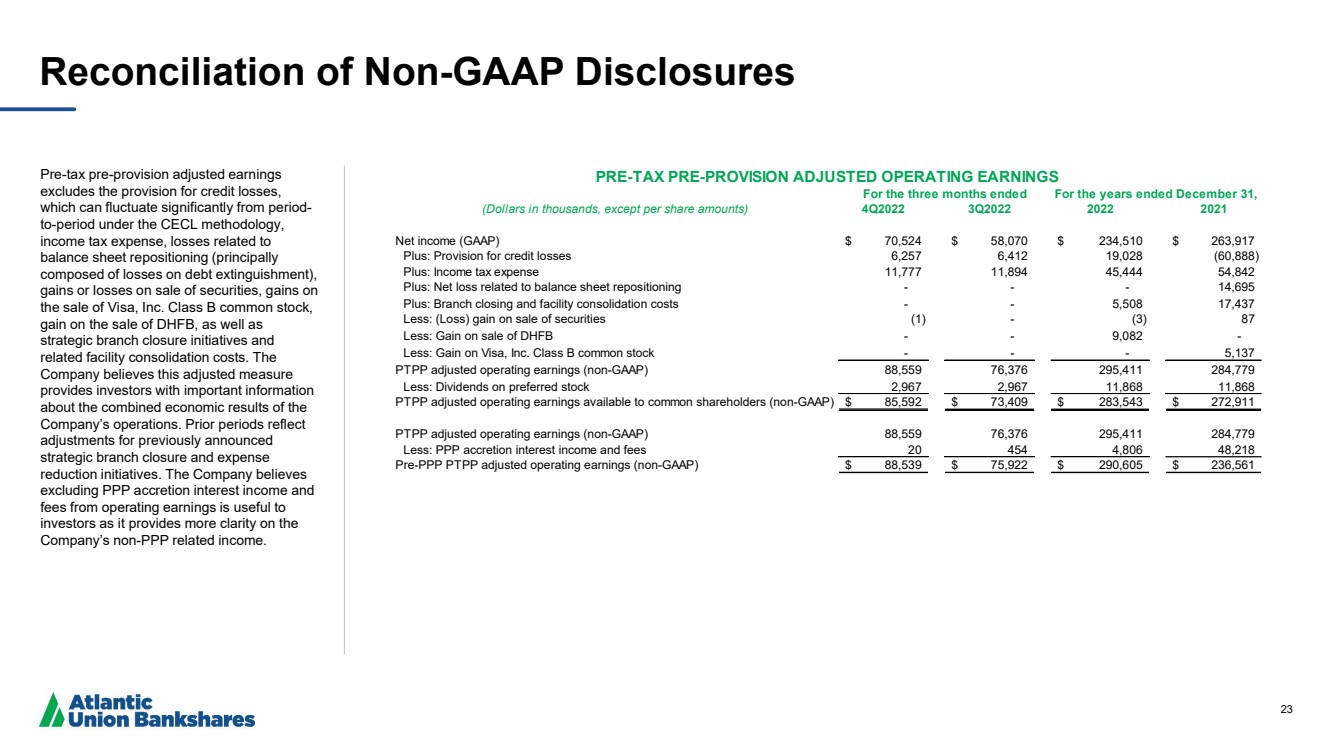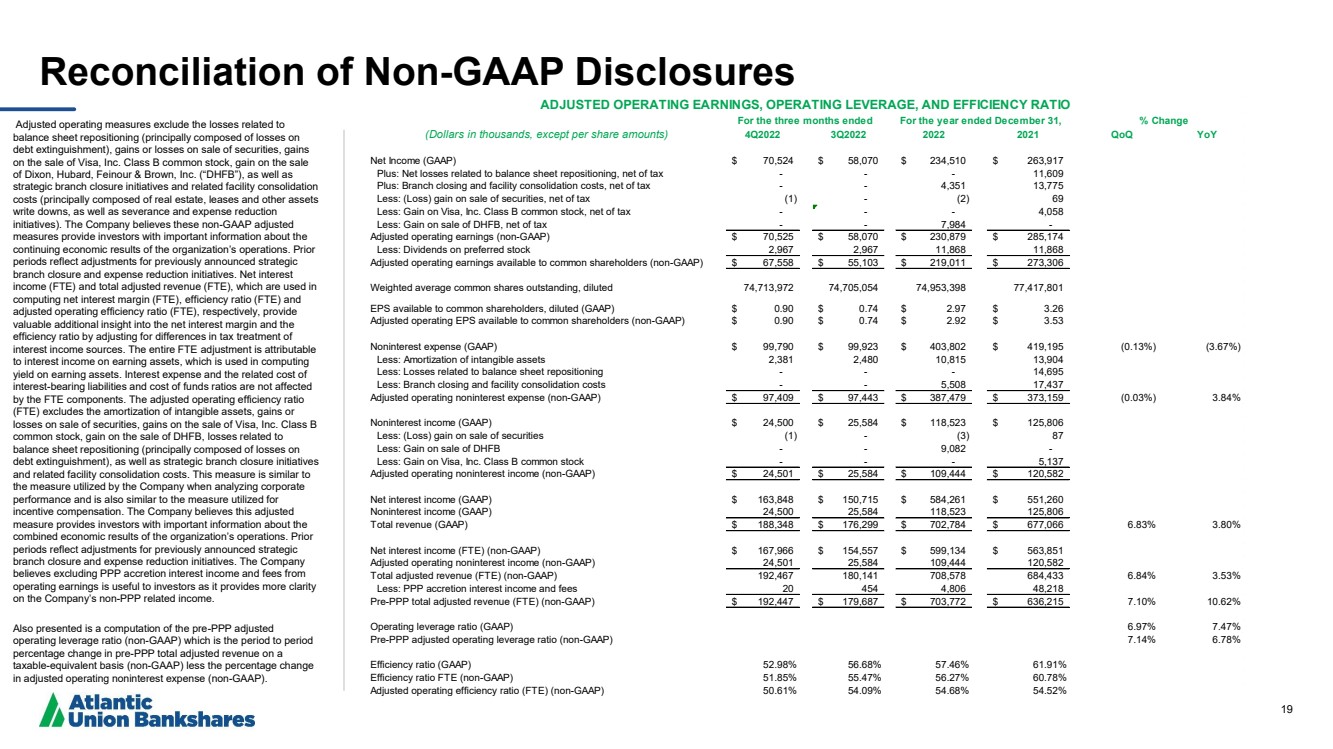
| 19 Reconciliation of Non - GAAP Disclosures Adjusted operating measures exclude the losses related to balance sheet repositioning (principally composed of losses on debt extinguishment), gains or losses on sale of securities, gains on the sale of Visa, Inc. Class B common stock, gain on the sale of Dixon, Hubard, Feinour & Brown, Inc. (“DHFB”), as well as strategic branch closure initiatives and related facility consolidation costs (principally composed of real estate, leases and other assets write downs, as well as severance and expense reduction initiatives). The Company believes these non - GAAP adjusted measures provide investors with important information about the continuing economic results of the organization’s operations. Prior periods reflect adjustments for previously announced strategic branch closure and expense reduction initiatives. Net interest income (FTE) and total adjusted revenue (FTE), which are used in computing net interest margin (FTE), efficiency ratio (FTE) and adjusted operating efficiency ratio (FTE), respectively, provide valuable additional insight into the net interest margin and the efficiency ratio by adjusting for differences in tax treatment of interest income sources. The entire FTE adjustment is attributable to interest income on earning assets, which is used in computing yield on earning assets. Interest expense and the related cost of interest - bearing liabilities and cost of funds ratios are not affected by the FTE components. The adjusted operating efficiency ratio (FTE) excludes the amortization of intangible assets, gains or losses on sale of securities, gains on the sale of Visa, Inc. Class B common stock, gain on the sale of DHFB, losses related to balance sheet repositioning (principally composed of losses on debt extinguishment), as well as strategic branch closure initiatives and related facility consolidation costs. This measure is similar to the measure utilized by the Company when analyzing corporate performance and is also similar to the measure utilized for incentive compensation. The Company believes this adjusted measure provides investors with important information about the combined economic results of the organization’s operations. Prior periods reflect adjustments for previously announced strategic branch closure and expense reduction initiatives. The Company believes excluding PPP accretion interest income and fees from operating earnings is useful to investors as it provides more clarity on the Company’s non - PPP related income. Also presented is a computation of the pre - PPP adjusted operating leverage ratio (non - GAAP) which is the period to period percentage change in pre - PPP total adjusted revenue on a taxable - equivalent basis (non - GAAP) less the percentage change in adjusted operating noninterest expense (non - GAAP). (Dollars in thousands, except per share amounts) 4Q2022 3Q2022 2022 2021 QoQ YoY Net Income (GAAP) 70,524 $ 58,070 $ 234,510 $ 263,917 $ Plus: Net losses related to balance sheet repositioning, net of tax - - - 11,609 Plus: Branch closing and facility consolidation costs, net of tax - - 4,351 13,775 Less: (Loss) gain on sale of securities, net of tax (1) - (2) 69 Less: Gain on Visa, Inc. Class B common stock, net of tax - - - 4,058 Less: Gain on sale of DHFB, net of tax - - 7,984 - Adjusted operating earnings (non-GAAP) 70,525 $ 58,070 $ 230,879 $ 285,174 $ Less: Dividends on preferred stock 2,967 2,967 11,868 11,868 Adjusted operating earnings available to common shareholders (non-GAAP) 67,558 $ 55,103 $ 219,011 $ 273,306 $ Weighted average common shares outstanding, diluted 74,713,972 74,705,054 74,953,398 77,417,801 EPS available to common shareholders, diluted (GAAP) 0.90 $ 0.74 $ 2.97 $ 3.26 $ Adjusted operating EPS available to common shareholders (non-GAAP) 0.90 $ 0.74 $ 2.92 $ 3.53 $ Noninterest expense (GAAP) 99,790 $ 99,923 $ 403,802 $ 419,195 $ (0.13%) (3.67%) Less: Amortization of intangible assets 2,381 2,480 10,815 13,904 Less: Losses related to balance sheet repositioning - - - 14,695 Less: Branch closing and facility consolidation costs - - 5,508 17,437 Adjusted operating noninterest expense (non-GAAP) 97,409 $ 97,443 $ 387,479 $ 373,159 $ (0.03%) 3.84% Noninterest income (GAAP) 24,500 $ 25,584 $ 118,523 $ 125,806 $ Less: (Loss) gain on sale of securities (1) - (3) 87 Less: Gain on sale of DHFB - - 9,082 - Less: Gain on Visa, Inc. Class B common stock - - - 5,137 Adjusted operating noninterest income (non-GAAP) 24,501 $ 25,584 $ 109,444 $ 120,582 $ Net interest income (GAAP) 163,848 $ 150,715 $ 584,261 $ 551,260 $ Noninterest income (GAAP) 24,500 25,584 118,523 125,806 Total revenue (GAAP) 188,348 $ 176,299 $ 702,784 $ 677,066 $ 6.83% 3.80% Net interest income (FTE) (non-GAAP) 167,966 $ 154,557 $ 599,134 $ 563,851 $ Adjusted operating noninterest income (non-GAAP) 24,501 25,584 109,444 120,582 Total adjusted revenue (FTE) (non-GAAP) 192,467 180,141 708,578 684,433 6.84% 3.53% Less: PPP accretion interest income and fees 20 454 4,806 48,218 Pre-PPP total adjusted revenue (FTE) (non-GAAP) 192,447 $ 179,687 $ 703,772 $ 636,215 $ 7.10% 10.62% Operating leverage ratio (GAAP) 6.97% 7.47% Pre-PPP adjusted operating leverage ratio (non-GAAP) 7.14% 6.78% Efficiency ratio (GAAP) 52.98% 56.68% 57.46% 61.91% Efficiency ratio FTE (non-GAAP) 51.85% 55.47% 56.27% 60.78% Adjusted operating efficiency ratio (FTE) (non-GAAP) 50.61% 54.09% 54.68% 54.52% % Change ADJUSTED OPERATING EARNINGS, OPERATING LEVERAGE, AND EFFICIENCY RATIO For the three months ended For the year ended December 31, |