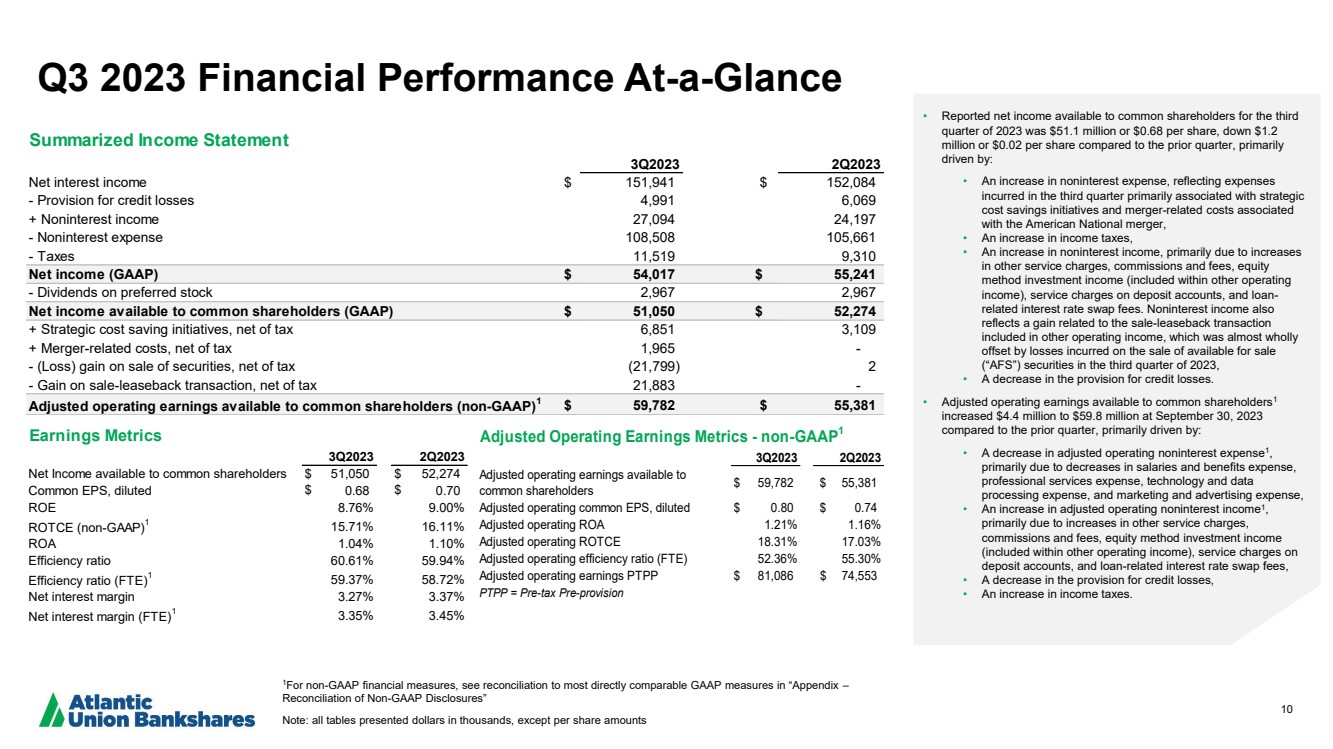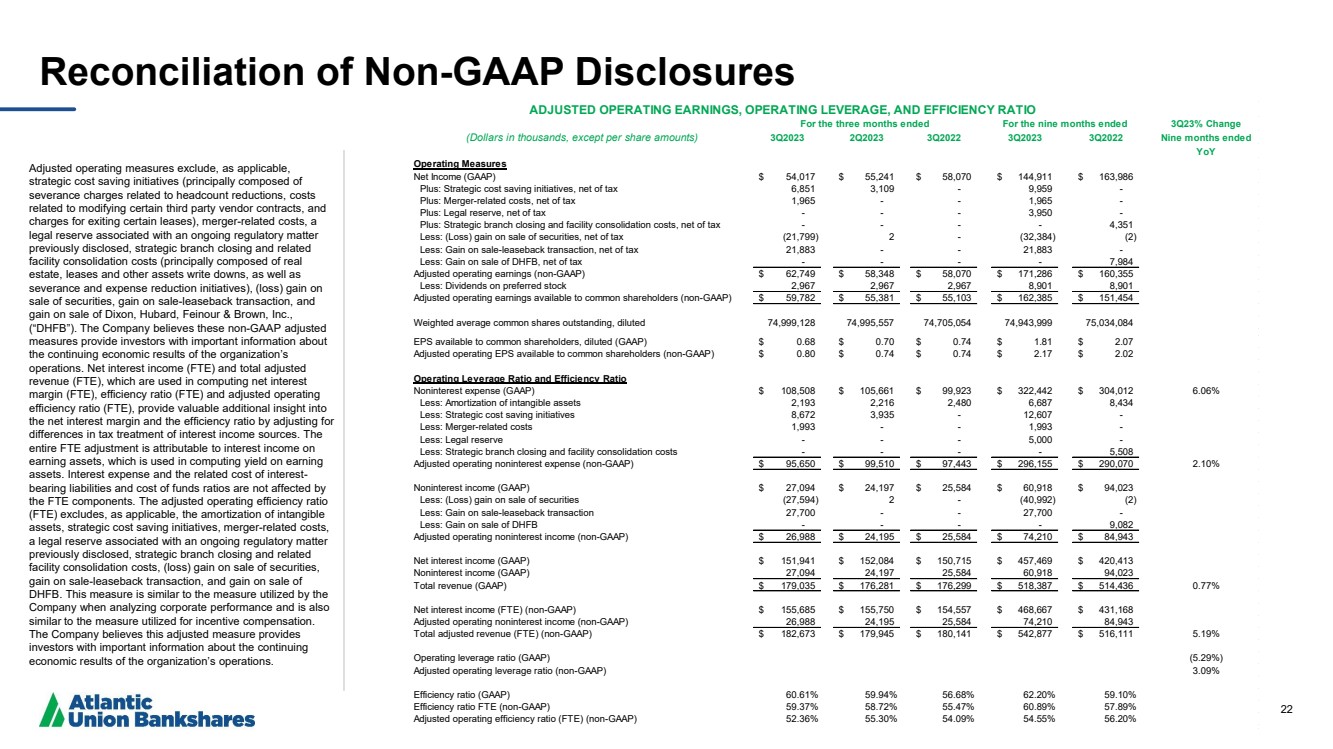
| 22 Reconciliation of Non -GAAP Disclosures Adjusted operating measures exclude, as applicable, strategic cost saving initiatives (principally composed of severance charges related to headcount reductions, costs related to modifying certain third party vendor contracts, and charges for exiting certain leases), merger -related costs, a legal reserve associated with an ongoing regulatory matter previously disclosed, strategic branch closing and related facility consolidation costs (principally composed of real estate, leases and other assets write downs, as well as severance and expense reduction initiatives), (loss) gain on sale of securities, gain on sale -leaseback transaction, and gain on sale of Dixon, Hubard, Feinour & Brown, Inc., (“DHFB”). The Company believes these non -GAAP adjusted measures provide investors with important information about the continuing economic results of the organization’s operations. Net interest income (FTE) and total adjusted revenue (FTE), which are used in computing net interest margin (FTE), efficiency ratio (FTE) and adjusted operating efficiency ratio (FTE), provide valuable additional insight into the net interest margin and the efficiency ratio by adjusting for differences in tax treatment of interest income sources. The entire FTE adjustment is attributable to interest income on earning assets, which is used in computing yield on earning assets. Interest expense and the related cost of interest - bearing liabilities and cost of funds ratios are not affected by the FTE components. The adjusted operating efficiency ratio (FTE) excludes, as applicable, the amortization of intangible assets, strategic cost saving initiatives, merger -related costs, a legal reserve associated with an ongoing regulatory matter previously disclosed, strategic branch closing and related facility consolidation costs, (loss) gain on sale of securities, gain on sale -leaseback transaction, and gain on sale of DHFB. This measure is similar to the measure utilized by the Company when analyzing corporate performance and is also similar to the measure utilized for incentive compensation. The Company believes this adjusted measure provides investors with important information about the continuing economic results of the organization’s operations. (Dollars in thousands, except per share amounts) 3Q2023 2Q2023 3Q2022 3Q2023 3Q2022 Nine months ended YoY Operating Measures Net Income (GAAP) $ 54,017 $ 55,241 $ 58,070 $ 144,911 $ 163,986 Plus: Strategic cost saving initiatives, net of tax 6,851 3,109 - 9,959 - Plus: Merger-related costs, net of tax 1,965 - - 1,965 - Plus: Legal reserve, net of tax - - - 3,950 - Plus: Strategic branch closing and facility consolidation costs, net of tax - - - - 4,351 Less: (Loss) gain on sale of securities, net of tax (21,799) 2 - (32,384) (2) Less: Gain on sale-leaseback transaction, net of tax 21,883 - - 21,883 - Less: Gain on sale of DHFB, net of tax - - - - 7,984 Adjusted operating earnings (non-GAAP) $ 62,749 $ 58,348 $ 58,070 $ 171,286 $ 160,355 Less: Dividends on preferred stock 2,967 2,967 2,967 8,901 8,901 Adjusted operating earnings available to common shareholders (non-GAAP) $ 59,782 $ 55,381 $ 55,103 $ 162,385 $ 151,454 Weighted average common shares outstanding, diluted 74,999,128 74,995,557 74,705,054 74,943,999 75,034,084 EPS available to common shareholders, diluted (GAAP) $ 0.68 $ 0.70 $ 0.74 $ 1.81 $ 2.07 Adjusted operating EPS available to common shareholders (non-GAAP) $ 0.80 $ 0.74 $ 0.74 $ 2.17 $ 2.02 Operating Leverage Ratio and Efficiency Ratio Noninterest expense (GAAP) $ 108,508 $ 105,661 $ 99,923 $ 322,442 $ 304,012 6.06% Less: Amortization of intangible assets 2,193 2,216 2,480 6,687 8,434 Less: Strategic cost saving initiatives 8,672 3,935 - 12,607 - Less: Merger-related costs 1,993 - - 1,993 - Less: Legal reserve - - - 5,000 - Less: Strategic branch closing and facility consolidation costs - - - - 5,508 Adjusted operating noninterest expense (non-GAAP) $ 95,650 $ 99,510 $ 97,443 $ 296,155 $ 290,070 2.10% Noninterest income (GAAP) $ 27,094 $ 24,197 $ 25,584 $ 60,918 $ 94,023 Less: (Loss) gain on sale of securities (27,594) 2 - (40,992) (2) Less: Gain on sale-leaseback transaction 27,700 - - 27,700 - Less: Gain on sale of DHFB - - - - 9,082 Adjusted operating noninterest income (non-GAAP) $ 26,988 $ 24,195 $ 25,584 $ 74,210 $ 84,943 Net interest income (GAAP) $ 151,941 $ 152,084 $ 150,715 $ 457,469 $ 420,413 Noninterest income (GAAP) 27,094 24,197 25,584 60,918 94,023 Total revenue (GAAP) $ 179,035 $ 176,281 $ 176,299 $ 518,387 $ 514,436 0.77% Net interest income (FTE) (non-GAAP) $ 155,685 $ 155,750 $ 154,557 $ 468,667 $ 431,168 Adjusted operating noninterest income (non-GAAP) 26,988 24,195 25,584 74,210 84,943 Total adjusted revenue (FTE) (non-GAAP) $ 182,673 $ 179,945 $ 180,141 $ 542,877 $ 516,111 5.19% Operating leverage ratio (GAAP) (5.29%) Adjusted operating leverage ratio (non-GAAP) 3.09% Efficiency ratio (GAAP) 60.61% 59.94% 56.68% 62.20% 59.10% Efficiency ratio FTE (non-GAAP) 59.37% 58.72% 55.47% 60.89% 57.89% Adjusted operating efficiency ratio (FTE) (non-GAAP) 52.36% 55.30% 54.09% 54.55% 56.20% ADJUSTED OPERATING EARNINGS, OPERATING LEVERAGE, AND EFFICIENCY RATIO For the three months ended For the nine months ended 3Q23% Change |