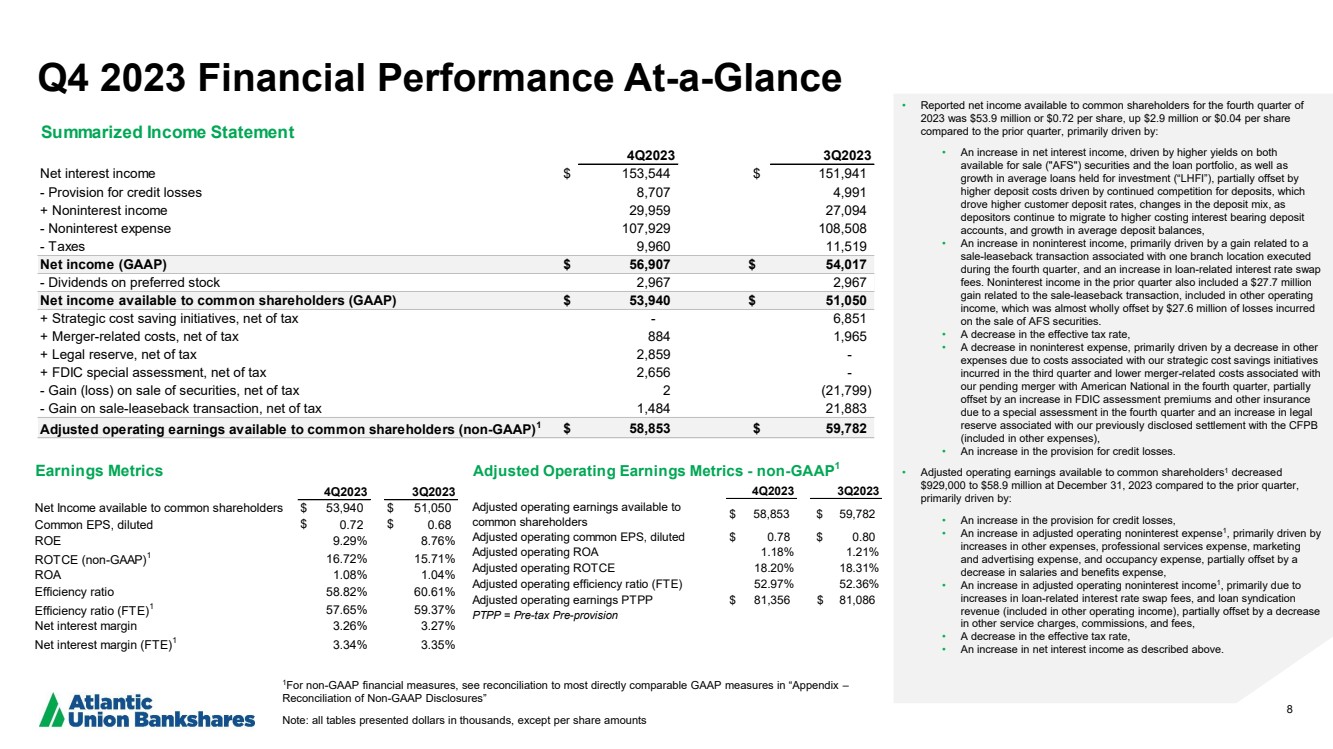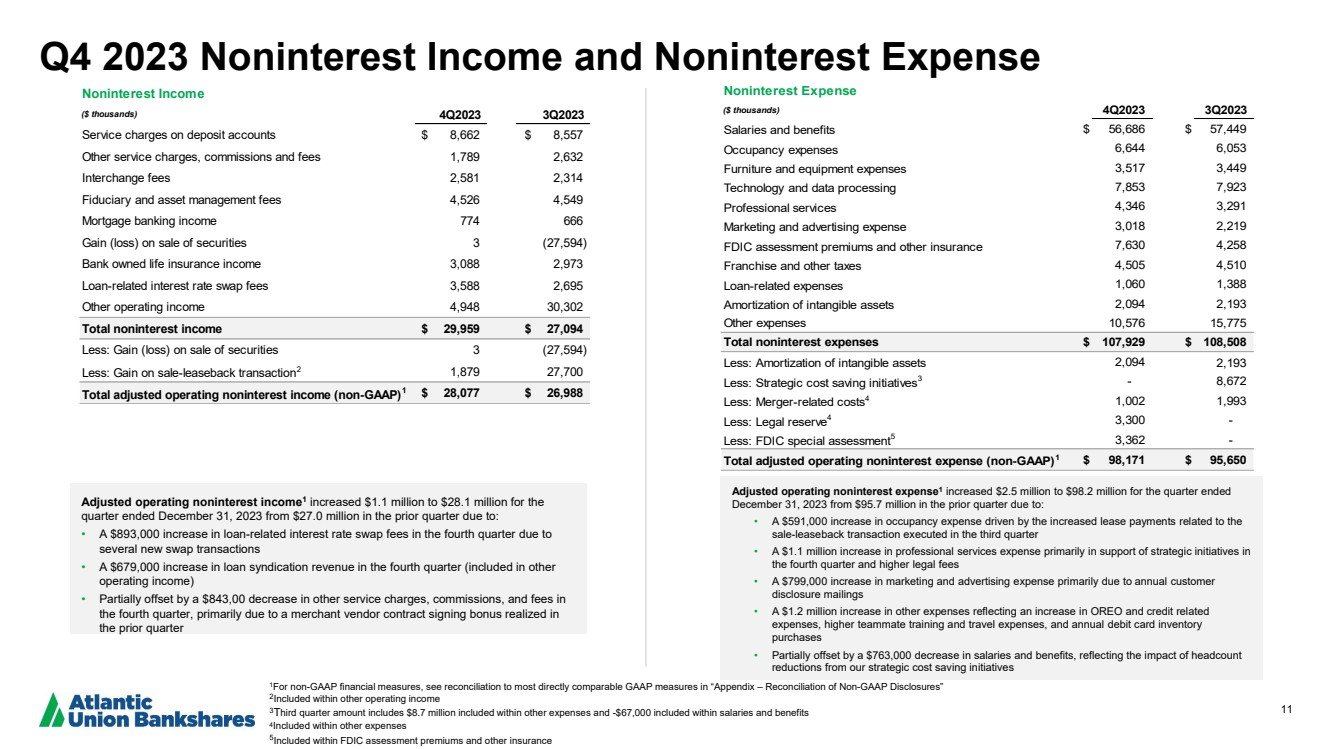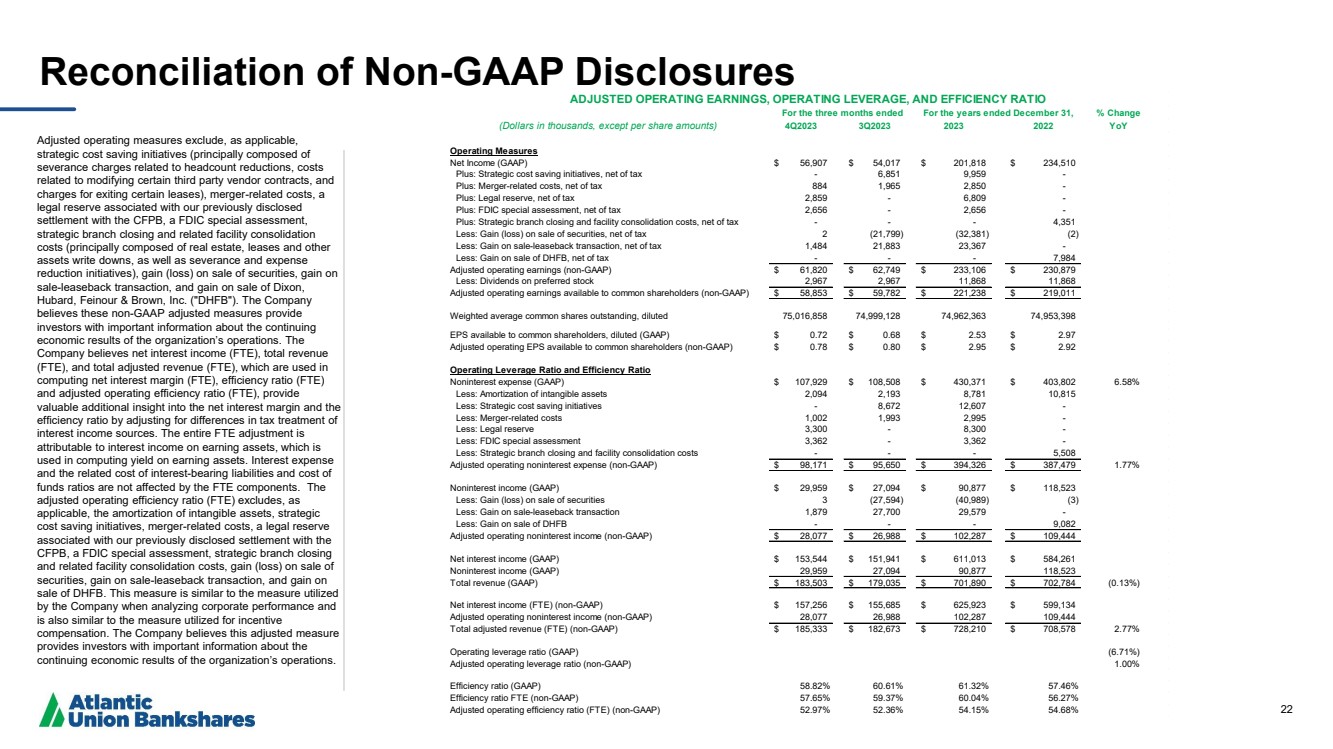
| 22 Reconciliation of Non -GAAP Disclosures Adjusted operating measures exclude, as applicable, strategic cost saving initiatives (principally composed of severance charges related to headcount reductions, costs related to modifying certain third party vendor contracts, and charges for exiting certain leases), merger -related costs, a legal reserve associated with our previously disclosed settlement with the CFPB, a FDIC special assessment, strategic branch closing and related facility consolidation costs (principally composed of real estate, leases and other assets write downs, as well as severance and expense reduction initiatives), gain (loss) on sale of securities, gain on sale -leaseback transaction, and gain on sale of Dixon, Hubard, Feinour & Brown, Inc. ("DHFB"). The Company believes these non -GAAP adjusted measures provide investors with important information about the continuing economic results of the organization’s operations. The Company believes net interest income (FTE), total revenue (FTE), and total adjusted revenue (FTE), which are used in computing net interest margin (FTE), efficiency ratio (FTE) and adjusted operating efficiency ratio (FTE), provide valuable additional insight into the net interest margin and the efficiency ratio by adjusting for differences in tax treatment of interest income sources. The entire FTE adjustment is attributable to interest income on earning assets, which is used in computing yield on earning assets. Interest expense and the related cost of interest -bearing liabilities and cost of funds ratios are not affected by the FTE components. The adjusted operating efficiency ratio (FTE) excludes, as applicable, the amortization of intangible assets, strategic cost saving initiatives, merger -related costs, a legal reserve associated with our previously disclosed settlement with the CFPB, a FDIC special assessment, strategic branch closing and related facility consolidation costs, gain (loss) on sale of securities, gain on sale -leaseback transaction, and gain on sale of DHFB. This measure is similar to the measure utilized by the Company when analyzing corporate performance and is also similar to the measure utilized for incentive compensation. The Company believes this adjusted measure provides investors with important information about the continuing economic results of the organization’s operations. % Change (Dollars in thousands, except per share amounts) 4Q2023 3Q2023 2023 2022 YoY Operating Measures Net Income (GAAP) $ 56,907 $ 54,017 $ 201,818 $ 234,510 Plus: Strategic cost saving initiatives, net of tax - 6,851 9,959 - Plus: Merger-related costs, net of tax 884 1,965 2,850 - Plus: Legal reserve, net of tax 2,859 - 6,809 - Plus: FDIC special assessment, net of tax 2,656 - 2,656 - Plus: Strategic branch closing and facility consolidation costs, net of tax - - - 4,351 Less: Gain (loss) on sale of securities, net of tax 2 (21,799) (32,381) (2) Less: Gain on sale-leaseback transaction, net of tax 1,484 21,883 23,367 - Less: Gain on sale of DHFB, net of tax - - - 7,984 Adjusted operating earnings (non-GAAP) $ 61,820 $ 62,749 $ 233,106 $ 230,879 Less: Dividends on preferred stock 2,967 2,967 11,868 11,868 Adjusted operating earnings available to common shareholders (non-GAAP) $ 58,853 $ 59,782 $ 221,238 $ 219,011 Weighted average common shares outstanding, diluted 75,016,858 74,999,128 74,962,363 74,953,398 EPS available to common shareholders, diluted (GAAP) $ 0.72 $ 0.68 $ 2.53 $ 2.97 Adjusted operating EPS available to common shareholders (non-GAAP) $ 0.78 $ 0.80 $ 2.95 $ 2.92 Operating Leverage Ratio and Efficiency Ratio Noninterest expense (GAAP) $ 107,929 $ 108,508 $ 430,371 $ 403,802 6.58% Less: Amortization of intangible assets 2,094 2,193 8,781 10,815 Less: Strategic cost saving initiatives - 8,672 12,607 - Less: Merger-related costs 1,002 1,993 2,995 - Less: Legal reserve 3,300 - 8,300 - Less: FDIC special assessment 3,362 - 3,362 - Less: Strategic branch closing and facility consolidation costs - - - 5,508 Adjusted operating noninterest expense (non-GAAP) $ 98,171 $ 95,650 $ 394,326 $ 387,479 1.77% Noninterest income (GAAP) $ 29,959 $ 27,094 $ 90,877 $ 118,523 Less: Gain (loss) on sale of securities 3 (27,594) (40,989) (3) Less: Gain on sale-leaseback transaction 1,879 27,700 29,579 - Less: Gain on sale of DHFB - - - 9,082 Adjusted operating noninterest income (non-GAAP) $ 28,077 $ 26,988 $ 102,287 $ 109,444 Net interest income (GAAP) $ 153,544 $ 151,941 $ 611,013 $ 584,261 Noninterest income (GAAP) 29,959 27,094 90,877 118,523 Total revenue (GAAP) $ 183,503 $ 179,035 $ 701,890 $ 702,784 (0.13%) Net interest income (FTE) (non-GAAP) $ 157,256 $ 155,685 $ 625,923 $ 599,134 Adjusted operating noninterest income (non-GAAP) 28,077 26,988 102,287 109,444 Total adjusted revenue (FTE) (non-GAAP) $ 185,333 $ 182,673 $ 728,210 $ 708,578 2.77% Operating leverage ratio (GAAP) (6.71%) Adjusted operating leverage ratio (non-GAAP) 1.00% Efficiency ratio (GAAP) 58.82% 60.61% 61.32% 57.46% Efficiency ratio FTE (non-GAAP) 57.65% 59.37% 60.04% 56.27% Adjusted operating efficiency ratio (FTE) (non-GAAP) 52.97% 52.36% 54.15% 54.68% ADJUSTED OPERATING EARNINGS, OPERATING LEVERAGE, AND EFFICIENCY RATIO For the three months ended For the years ended December 31, |