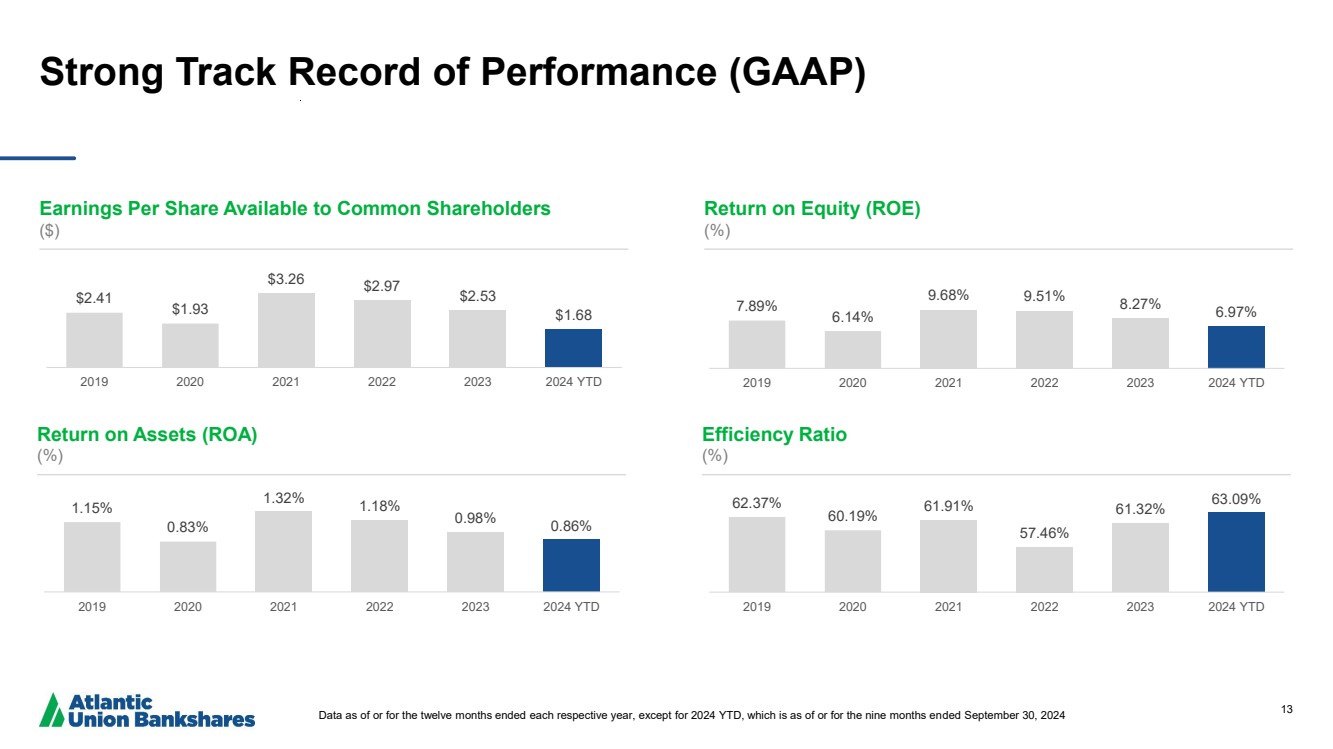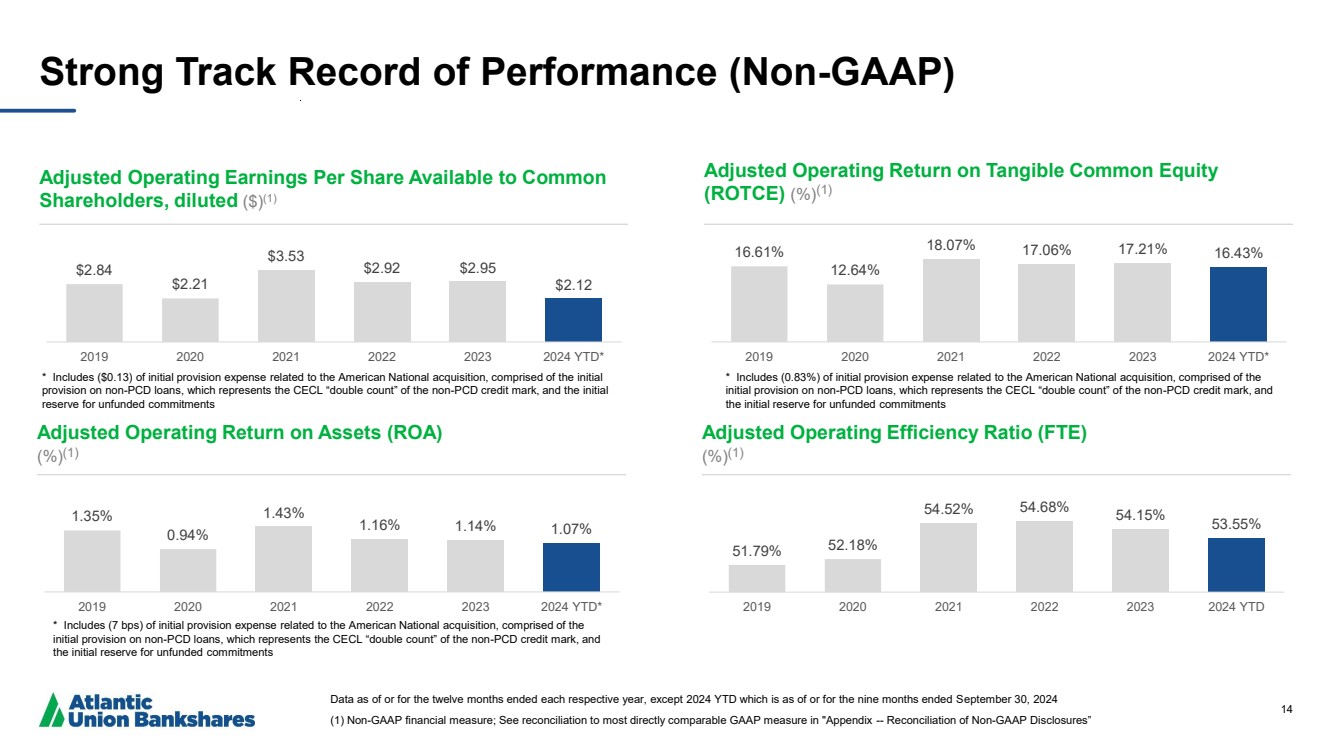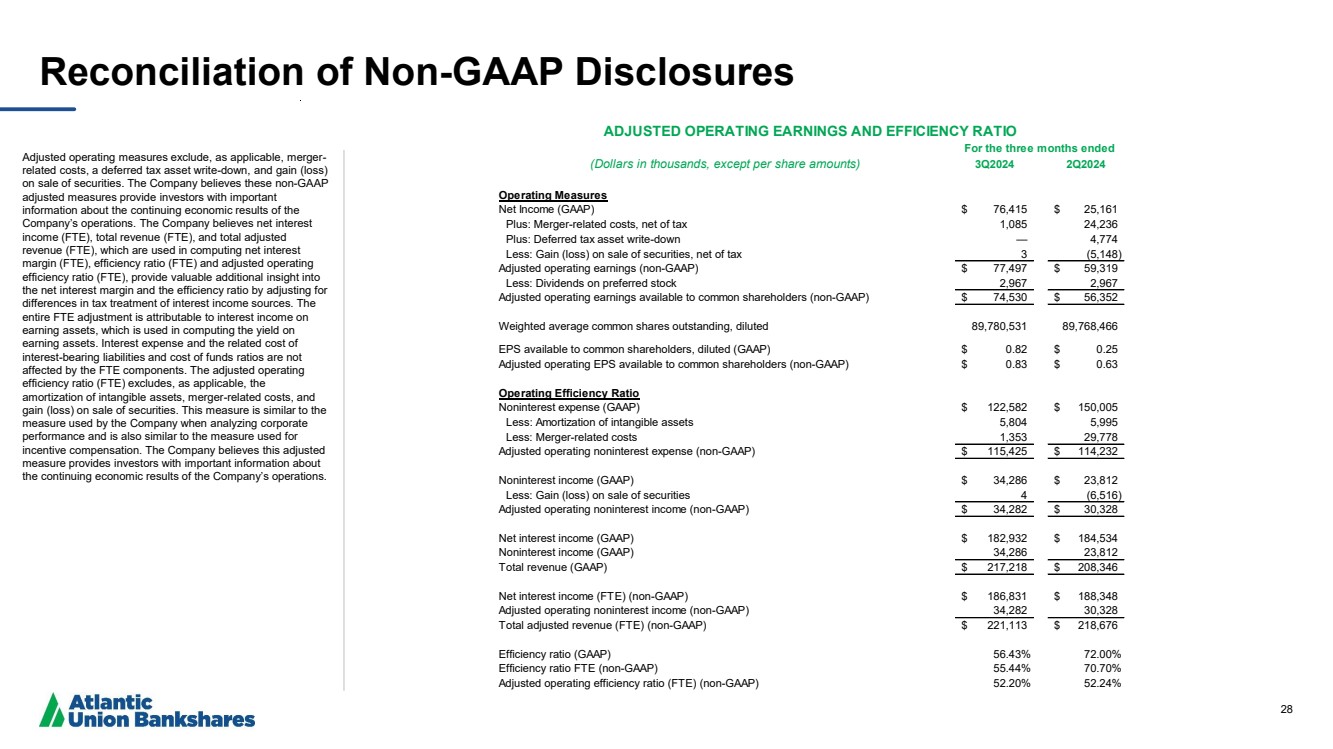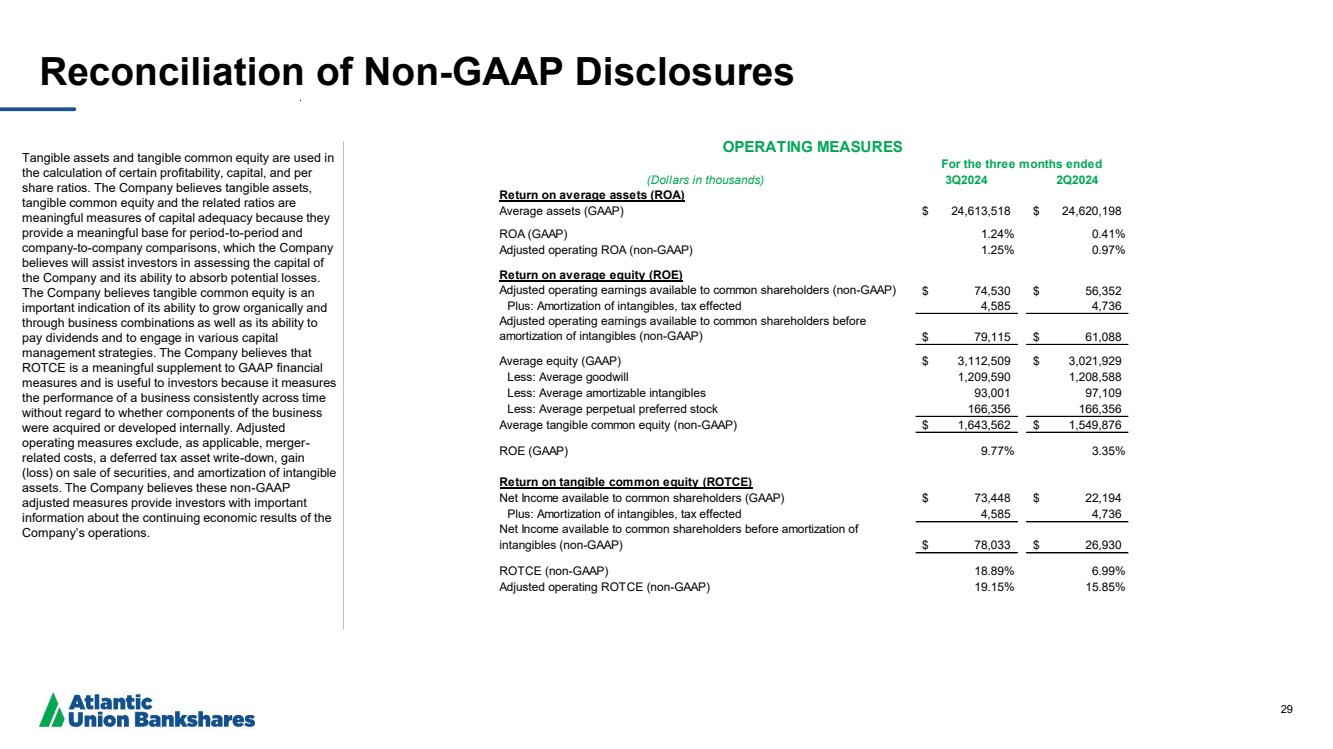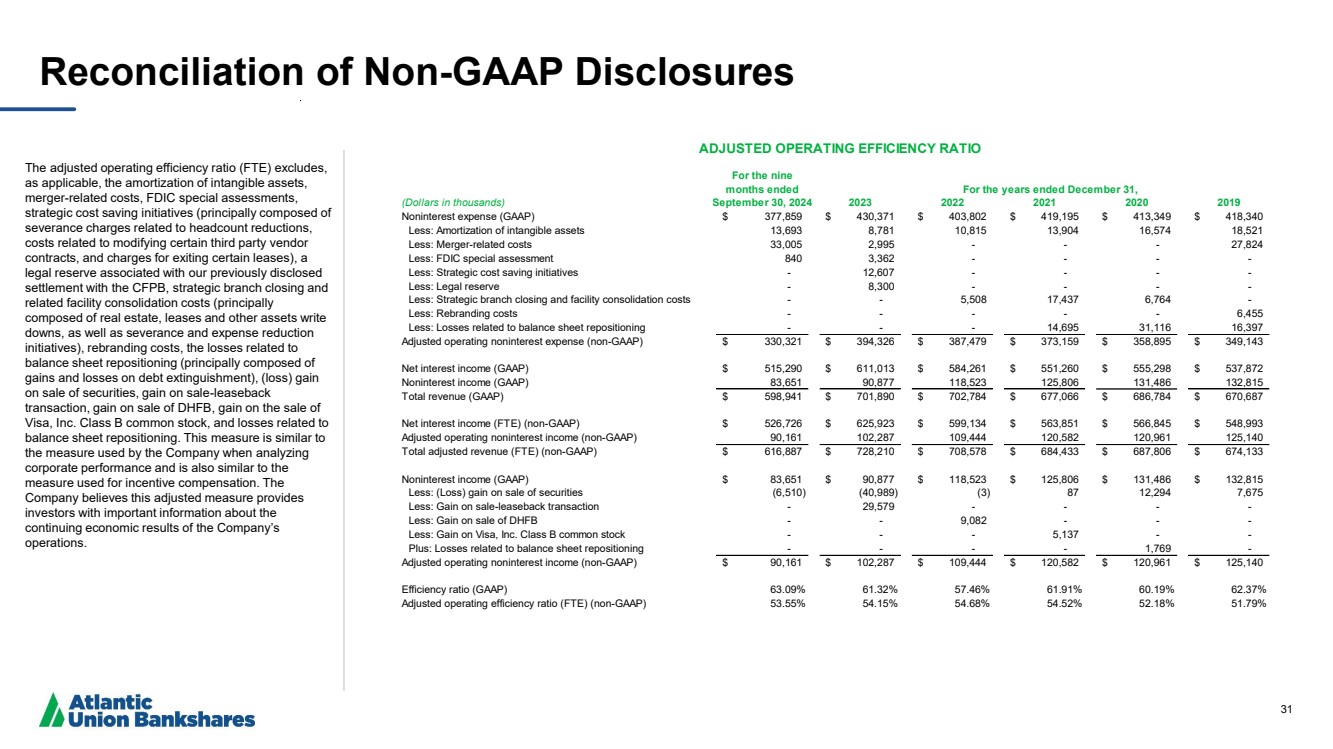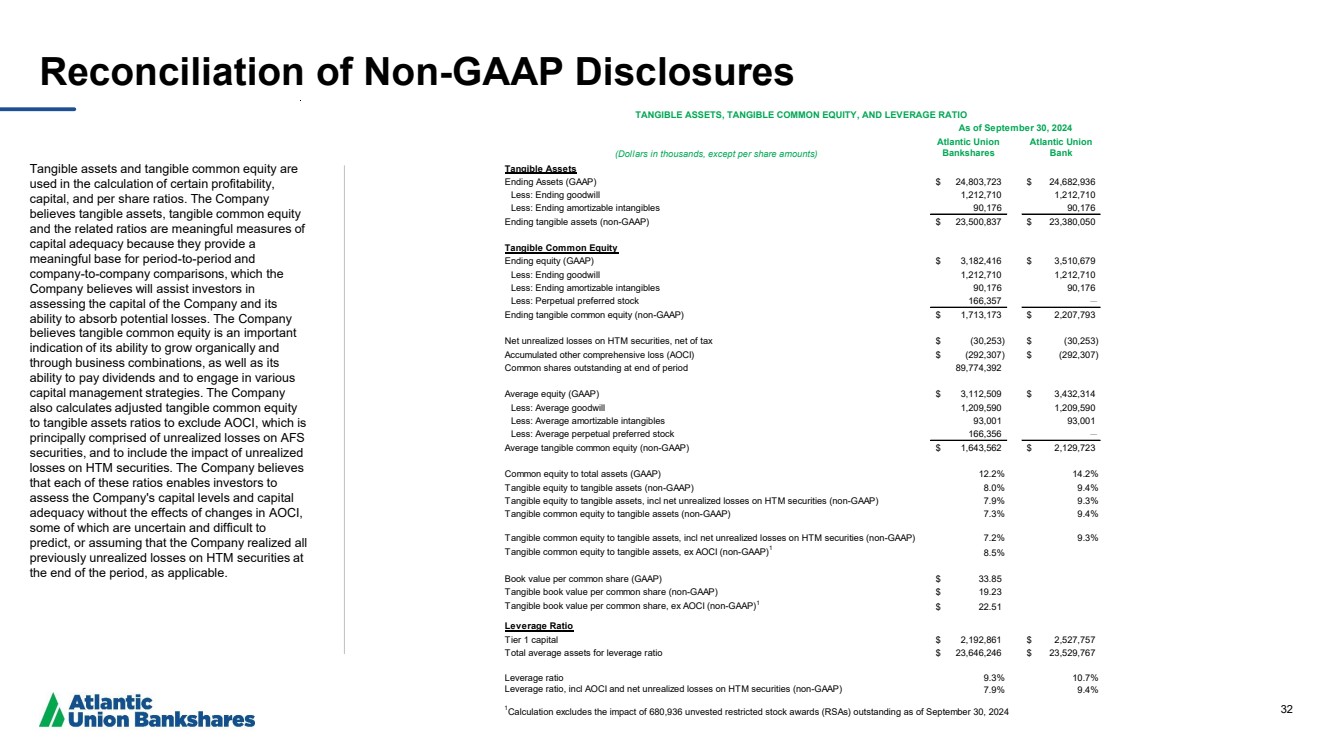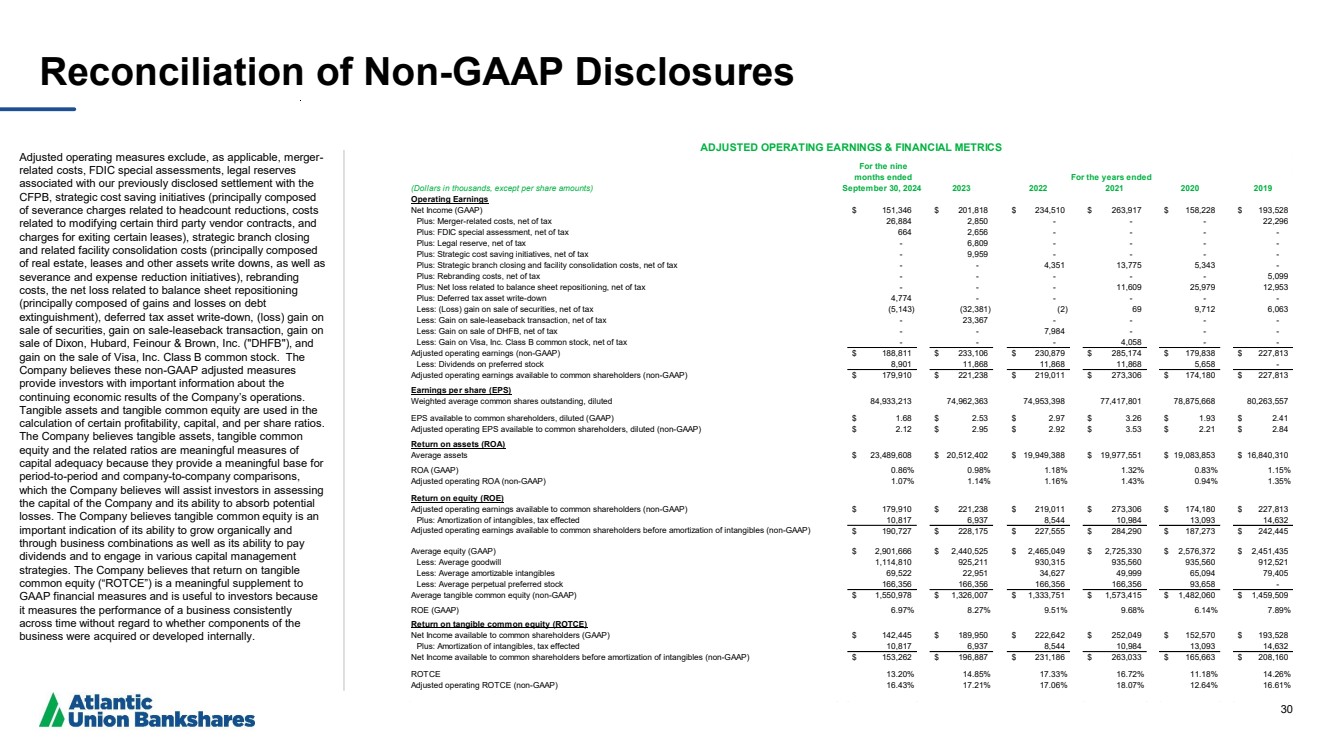
| 30 Reconciliation of Non -GAAP Disclosures Adjusted operating measures exclude, as applicable, merger - related costs, FDIC special assessments, legal reserves associated with our previously disclosed settlement with the CFPB, strategic cost saving initiatives (principally composed of severance charges related to headcount reductions, costs related to modifying certain third party vendor contracts, and charges for exiting certain leases), strategic branch closing and related facility consolidation costs (principally composed of real estate, leases and other assets write downs, as well as severance and expense reduction initiatives), rebranding costs, the net loss related to balance sheet repositioning (principally composed of gains and losses on debt extinguishment), deferred tax asset write -down, (loss) gain on sale of securities, gain on sale -leaseback transaction, gain on sale of Dixon, Hubard, Feinour & Brown, Inc. ("DHFB"), and gain on the sale of Visa, Inc. Class B common stock. The Company believes these non -GAAP adjusted measures provide investors with important information about the continuing economic results of the Company’s operations. Tangible assets and tangible common equity are used in the calculation of certain profitability, capital, and per share ratios. The Company believes tangible assets, tangible common equity and the related ratios are meaningful measures of capital adequacy because they provide a meaningful base for period -to -period and company -to -company comparisons, which the Company believes will assist investors in assessing the capital of the Company and its ability to absorb potential losses. The Company believes tangible common equity is an important indication of its ability to grow organically and through business combinations as well as its ability to pay dividends and to engage in various capital management strategies. The Company believes that return on tangible common equity (“ROTCE”) is a meaningful supplement to GAAP financial measures and is useful to investors because it measures the performance of a business consistently across time without regard to whether components of the business were acquired or developed internally. (Dollars in thousands, except per share amounts) September 30, 2024 2023 2022 2021 2020 2019 Operating Earnings Net Income (GAAP) $ 151,346 $ 201,818 $ 234,510 $ 263,917 $ 158,228 $ 193,528 Plus: Merger-related costs, net of tax 26,884 2,850 - - - 22,296 Plus: FDIC special assessment, net of tax 664 2,656 - - - - Plus: Legal reserve, net of tax - 6,809 - - - - Plus: Strategic cost saving initiatives, net of tax - 9,959 - - - - Plus: Strategic branch closing and facility consolidation costs, net of tax - - 4,351 13,775 5,343 - Plus: Rebranding costs, net of tax - - - - - 5,099 Plus: Net loss related to balance sheet repositioning, net of tax - - - 11,609 25,979 12,953 Plus: Deferred tax asset write-down 4,774 - - - - - Less: (Loss) gain on sale of securities, net of tax (5,143) (32,381) (2) 69 9,712 6,063 Less: Gain on sale-leaseback transaction, net of tax - 23,367 - - - - Less: Gain on sale of DHFB, net of tax - - 7,984 - - - Less: Gain on Visa, Inc. Class B common stock, net of tax - - - 4,058 - - Adjusted operating earnings (non-GAAP) $ 188,811 $ 233,106 $ 230,879 $ 285,174 $ 179,838 $ 227,813 Less: Dividends on preferred stock 8,901 11,868 11,868 11,868 5,658 - Adjusted operating earnings available to common shareholders (non-GAAP) $ 179,910 $ 221,238 $ 219,011 $ 273,306 $ 174,180 $ 227,813 Earnings per share (EPS) Weighted average common shares outstanding, diluted 84,933,213 74,962,363 74,953,398 77,417,801 78,875,668 80,263,557 EPS available to common shareholders, diluted (GAAP) $ 1.68 $ 2.53 $ 2.97 $ 3.26 $ 1.93 $ 2.41 Adjusted operating EPS available to common shareholders, diluted (non-GAAP) $ 2.12 $ 2.95 $ 2.92 $ 3.53 $ 2.21 $ 2.84 Return on assets (ROA) Average assets $ 23,489,608 $ 20,512,402 $ 19,949,388 $ 19,977,551 $ 19,083,853 $ 16,840,310 ROA (GAAP) 0.86% 0.98% 1.18% 1.32% 0.83% 1.15% Adjusted operating ROA (non-GAAP) 1.07% 1.14% 1.16% 1.43% 0.94% 1.35% Return on equity (ROE) Adjusted operating earnings available to common shareholders (non-GAAP) $ 179,910 $ 221,238 $ 219,011 $ 273,306 $ 174,180 $ 227,813 Plus: Amortization of intangibles, tax effected 10,817 6,937 8,544 10,984 13,093 14,632 Adjusted operating earnings available to common shareholders before amortization of intangibles (non-GAAP) $ 190,727 $ 228,175 $ 227,555 $ 284,290 $ 187,273 $ 242,445 Average equity (GAAP) $ 2,901,666 $ 2,440,525 $ 2,465,049 $ 2,725,330 $ 2,576,372 $ 2,451,435 Less: Average goodwill 1,114,810 925,211 930,315 935,560 935,560 912,521 Less: Average amortizable intangibles 69,522 22,951 34,627 49,999 65,094 79,405 Less: Average perpetual preferred stock 166,356 166,356 166,356 166,356 93,658 - Average tangible common equity (non-GAAP) $ 1,550,978 $ 1,326,007 $ 1,333,751 $ 1,573,415 $ 1,482,060 $ 1,459,509 ROE (GAAP) 6.97% 8.27% 9.51% 9.68% 6.14% 7.89% Return on tangible common equity (ROTCE) Net Income available to common shareholders (GAAP) $ 142,445 $ 189,950 $ 222,642 $ 252,049 $ 152,570 $ 193,528 Plus: Amortization of intangibles, tax effected 10,817 6,937 8,544 10,984 13,093 14,632 Net Income available to common shareholders before amortization of intangibles (non-GAAP) $ 153,262 $ 196,887 $ 231,186 $ 263,033 $ 165,663 $ 208,160 ROTCE 13.20% 14.85% 17.33% 16.72% 11.18% 14.26% Adjusted operating ROTCE (non-GAAP) 16.43% 17.21% 17.06% 18.07% 12.64% 16.61% For the years ended ADJUSTED OPERATING EARNINGS & FINANCIAL METRICS For the nine months ended |