 Investor Presentation Investor Presentation August 2011 August 2011 Exhibit 99.1 |
 Agenda Overview Financial Performance Near-Term Outlook Q & A 2 |
 Forward Looking Statement Certain statements in this report may constitute “forward-looking statements” within the meaning of the Private Securities Litigation Reform Act of 1995. Forward-looking statements are statements that include projections, predictions, expectations or beliefs about future events or results or otherwise and are not statements of historical fact. Such statements are often characterized by the use of qualified words (and their derivatives) such as “expect,” “believe,” “estimate,” “plan,” “project,” “anticipate” or other statements concerning opinions or judgment of the Company and its management about future events. Although the Company believes that its expectations with respect to forward-looking statements are based upon reasonable assumptions within the bounds of its existing knowledge of its business and operations, there can be no assurance that actual results, performance or achievements of the Company will not differ materially from any future results, performance or achievements expressed or implied by such forward-looking statements. Actual future results and trends may differ materially from historical results or those anticipated depending on a variety of factors, including, but not limited to, the effects of and changes in: general economic conditions, the interest rate environment, legislative and regulatory requirements, competitive pressures, new products and delivery systems, inflation, changes in the stock and bond markets, technology, and consumer spending and savings habits. The Company does not update any forward-looking statements that may be made from time to time by or on behalf of the Company. 3 |
 Overview One of the largest financial services organizations headquartered in Virginia Holding company formed in 1993 – Banking history in some communities goes back more than 100 years Assets of $3.8 Billion Comprehensive financial services provider offering: banking, mortgage, investment, trust and insurance 4 |
 Investment Highlights Uniquely positioned in Virginia – locations, products and services Branch footprint provides a competitive advantage Experienced management team Proven acquirer and integrator Proven financial performance 5 |
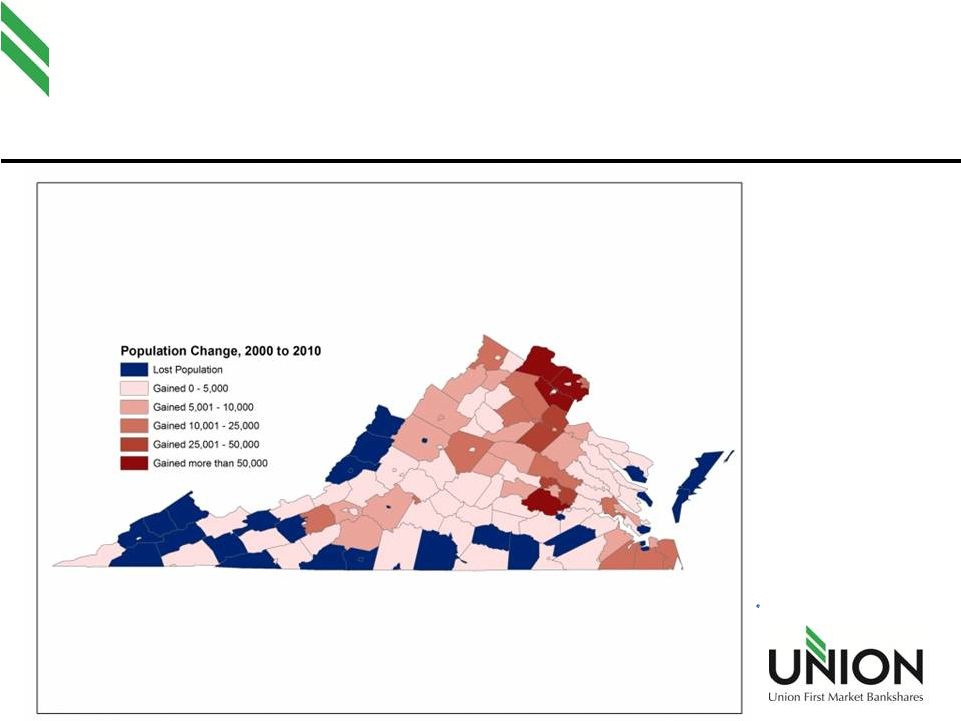 Virginia Population Expansion Source: Weldon Cooper Center, UVA 6 |
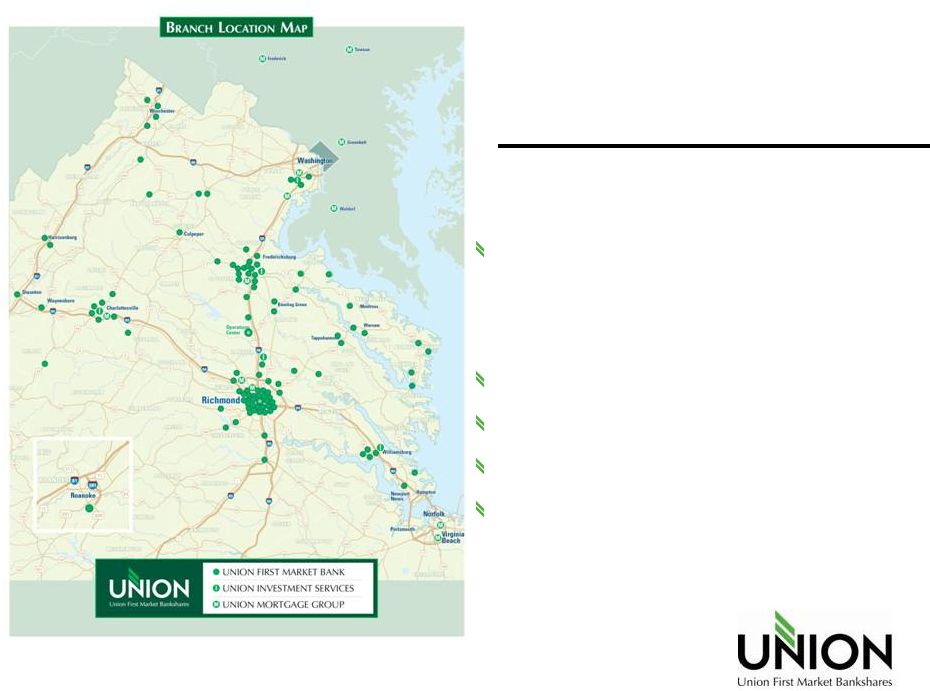 Union First Market Footprint 7 Only community bank with a presence in top 7 Virginia banking markets More than 160 ATMs Along major corridors (I-95 & I-64) Stable/Growing markets Economically diverse markets |
 Diversity Supports Growth in Virginia Charlottesville University of Virginia & Medical College High tech and professional businesses Virginia Beach - Norfolk Military Shipbuilding Tourism Fredericksburg Defense and security contractors Health care Retail Northern Virginia Nation’s Capital Defense and security contractors Associations (lobbyists) High tech Richmond State Capital Fortune 500 headquarters (6) Finance and insurance Fort Lee doubling in size VCU & VCU Medical Center 8 |
 Risk Management Risk Mitigation Practices Forward looking Move early to protect Special Assets Committee Weekly meetings Lending Philosophy In-market lender Community bank lending Granular portfolio analysis Full guarantees of commercial credits 9 Control Environment Strong internal policies Active compliance, audit teams Positive regulatory relations Acted Early In The Current Cycle Reappraised loans Received additional collateral where necessary Working with clients |
 Financial Performance |
 Strong Balance Sheet Assets ($M) Deposits ($M) Loans ($M) 11 |
 Investment Portfolio Highlights Total Portfolio is $591 MM or 15.3% of assets Did not invest in Pooled TRUPs Data as of Q2 2011 12 Investment Portfolio % of Portfolio $ in thousands U.S. government and agency securities 1.6% $ 9,313 Obligations of states and political subdivisions 31.7% 187,417 Corporate and other bonds 2.5% 15,044 Mortgage-backed securities 59.7% 352,651 Federal Reserve Bank stock – restricted 1.1% 6,711 Federal Home Loan Bank stock – restricted 2.7% 16,172 Other securities 0.6% 3,752 Total securities 100.0% $ 591,060 |
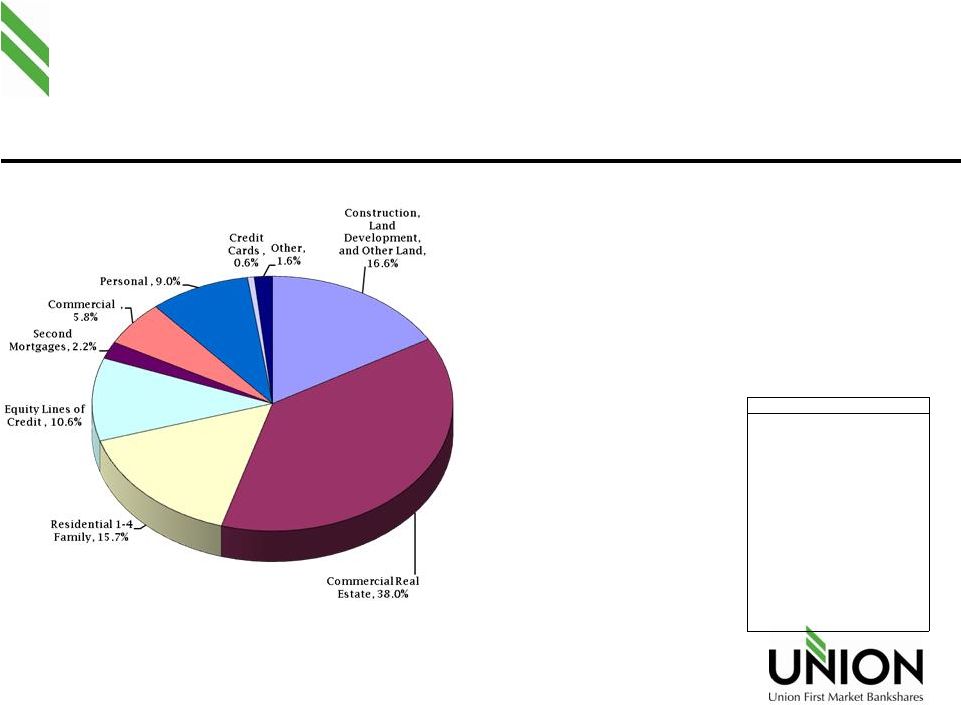 Loan Composition by Type 13 Based on call report filings 6/30/2011 $ % of Portfolio Construction, Land Development, and Other Land $473.6 16.6% Commercial Real Estate $1,086.9 38.0% Residential 1-4 Family $448.3 15.7% Equity Lines of Credit $301.7 10.6% Second Mortgages $62.5 2.2% Commercial $165.6 5.8% Personal $257.2 9.0% Credit Cards $17.3 0.6% Other $46.5 1.6% Gross Loans $2,859.6 100.0% Change 3/11 to 6/11 $ % of Portfolio % of Type Construction, Land Development, and Other Land -$11.2 -0.7% -2.3% Commercial Real Estate $57.4 1.3% 5.6% Residential 1-4 Family $14.8 0.2% 3.4% Equity Lines of Credit $3.1 -0.1% 1.0% Second Mortgages -$0.1 0.0% -0.2% Commercial $1.7 0.0% 1.0% Personal -$7.0 -0.4% -2.6% Credit Cards $0.2 0.0% 1.2% Other -$6.2 -0.3% -11.8% Gross Loans $52.7 1.9% |
 Construction & Development 14 6/30/2011 $ % Raw Land $105.6 22.3% Land Development / Commercial Lots $125.9 26.6% Construction Loans to Builders $63.8 13.5% Residential Non Builder Lots $42.5 9.0% Residential Builder Lots $54.6 11.5% Commercial Construction $62.9 13.3% Consumer Construction $17.2 3.6% Other (including loan settlement) $1.1 0.2% $473.6 100.0% |
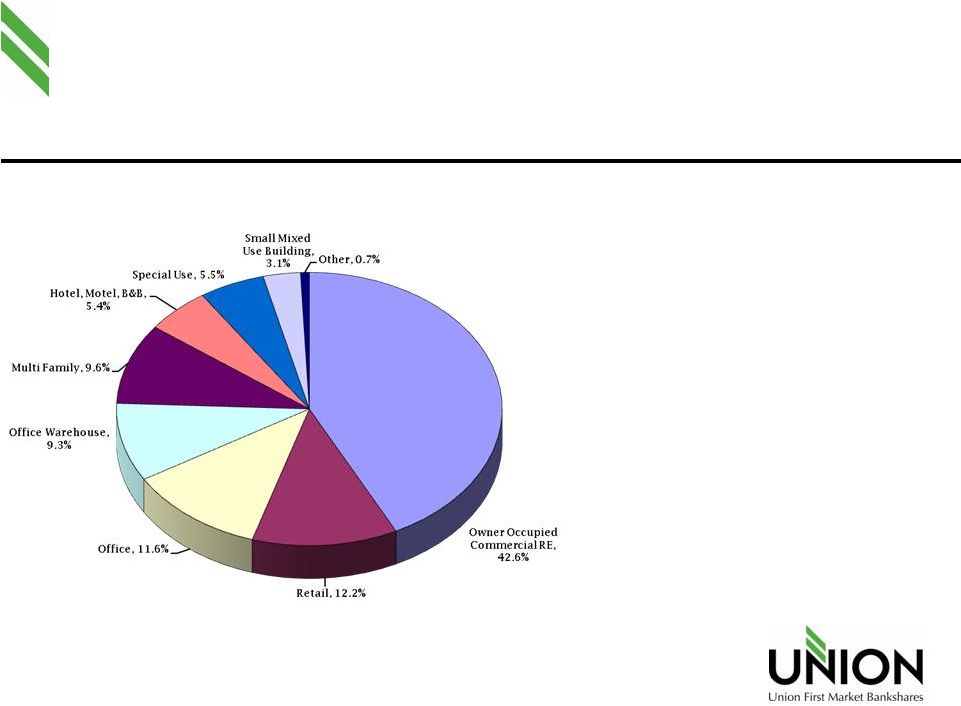 Commercial Real Estate 15 6/30/2011 Owner Occupied Commercial RE $462.8 42.6% Retail $132.6 12.2% Office $126.1 11.6% Office Warehouse $100.7 9.3% Multi Family $103.9 9.6% Hotel, Motel, B&B $58.9 5.4% Special Use $59.8 5.5% Small Mixed Use Building $34.0 3.1% Other $8.0 0.7% $1,086.8 100.0% |
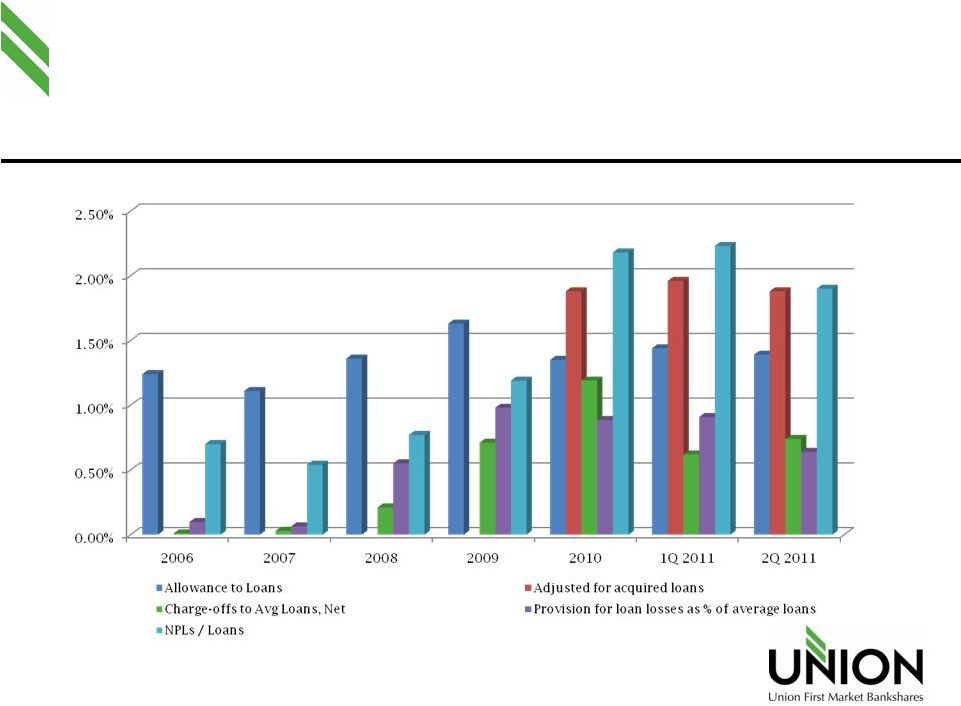 Asset Quality 16 |
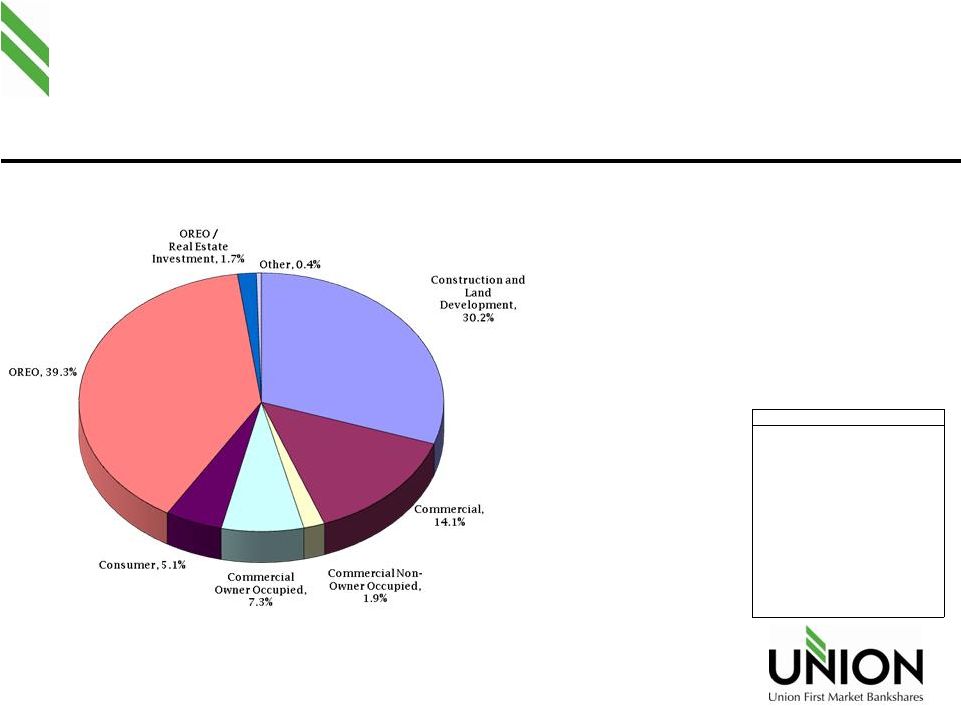 NPAs by Type 17 Based on call report filings 6/30/2011 Construction and Land Development $27.4 30.2% Commercial $12.8 14.1% Commercial Non-Owner Occupied $1.7 1.9% Commercial Owner Occupied $6.6 7.3% Consumer $4.6 5.1% OREO $35.6 39.3% OREO / Real Estate Investment $1.5 1.7% Other $0.4 0.4% $90.6 100.0% Change 3/11 to 6/11 $ % of Portfolio % of Type Construction and Land Development -$6.2 -3.0% -18.5% Commercial -$0.4 1.1% -3.0% Commercial Non-Owner Occupied -$3.6 -3.4% -67.9% Commercial Owner Occupied $0.0 0.8% 0.0% Consumer $1.6 2.1% 53.3% OREO -$1.6 2.5% -4.3% OREO / Real Estate Investment $0.0 0.2% 0.0% Other -$0.2 -0.2% -33.3% -$10.4 -10.3% |
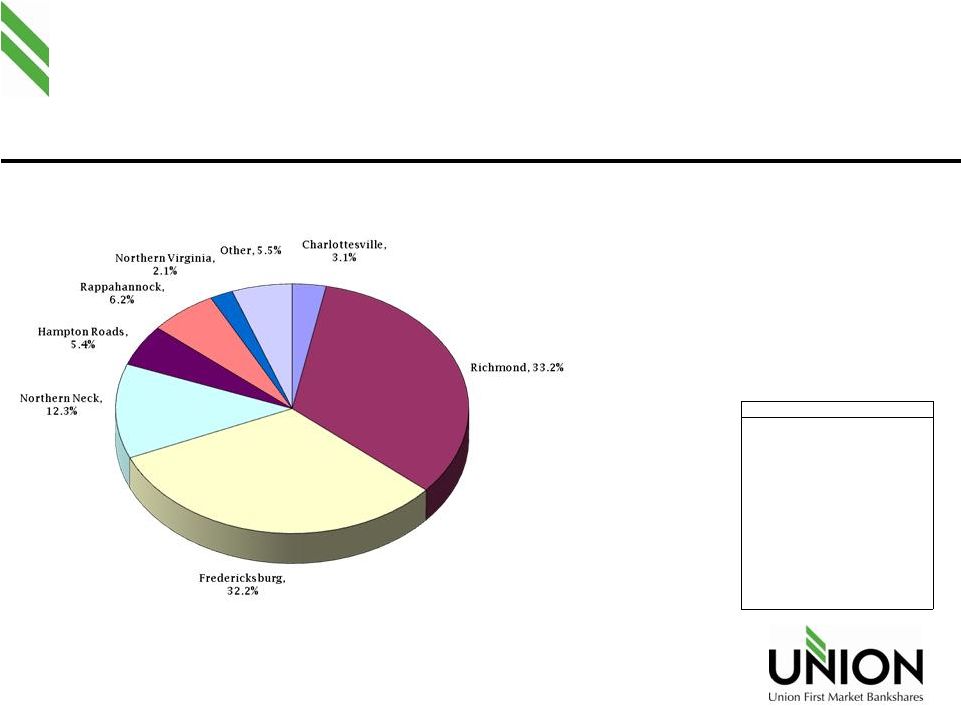 NPAs by Market 18 6/30/2011 Charlottesville $2.8 3.1% Richmond $30.1 33.2% Fredericksburg $29.2 32.2% Northern Neck $11.1 12.3% Hampton Roads $4.9 5.4% Rappahannock $5.6 6.2% Northern Virginia $1.9 2.1% Other $5.0 5.5% $90.6 100.0% Change 3/11 to 6/11 $ % of Portfolio % of Market Charlottesville -$0.2 0.1% -6.7% Richmond -$5.5 -2.0% -15.4% Fredericksburg -$5.4 -2.0% -15.6% Northern Neck $0.5 1.8% 4.7% Hampton Roads -$1.1 -0.5% -18.3% Rappahannock $1.3 1.9% 30.2% Northern Virginia -$0.3 -0.1% -13.6% Other $0.3 0.9% 6.4% -$10.4 -10.3% |
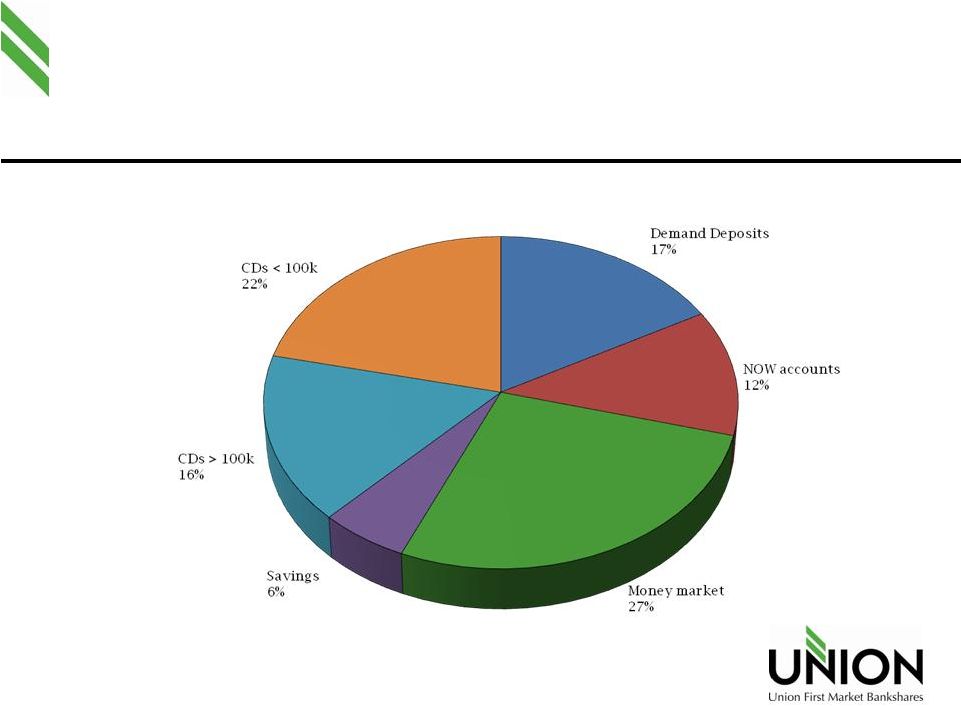 Deposit Composition 19 As of 6/30/11 |
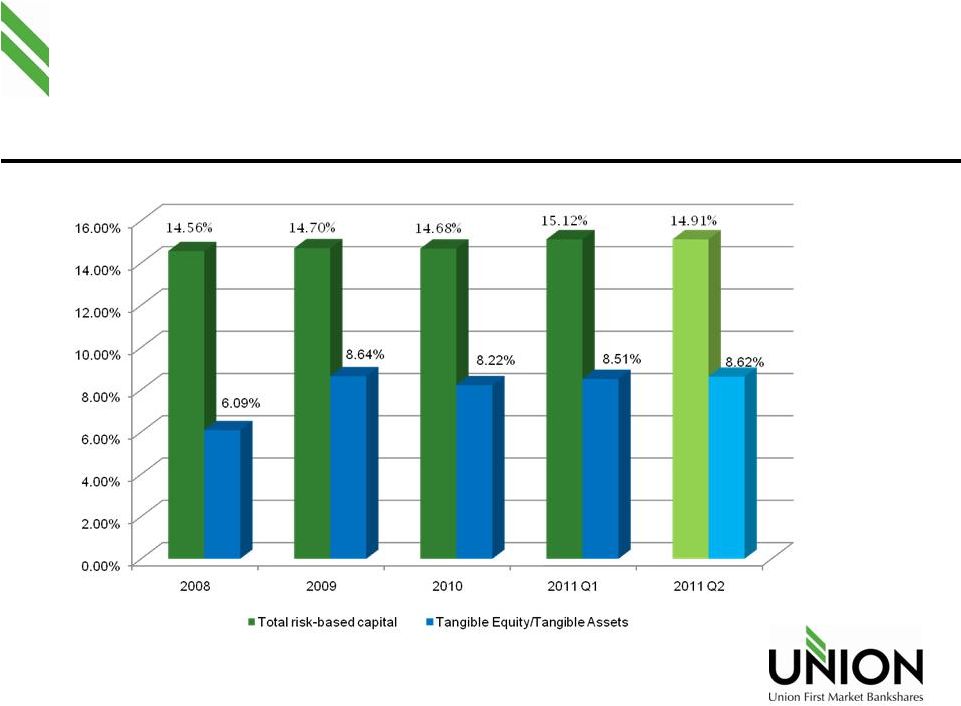 Capital Strength 20 |
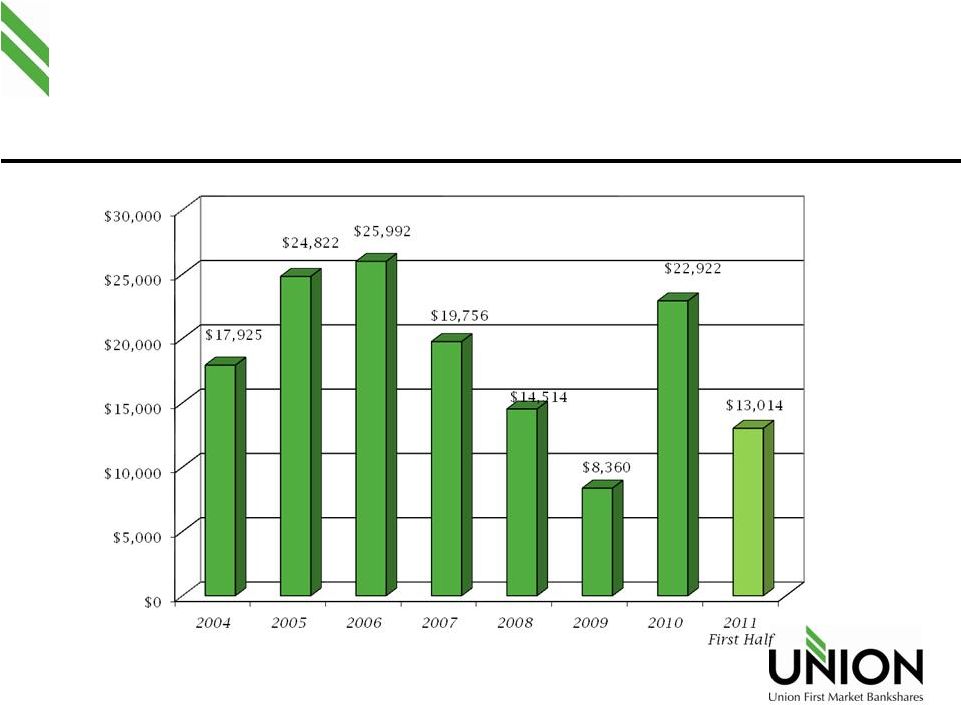 Net Income Trend 21 |
 Comparative Results $ in thousands 22 |
 Net Interest Margin 23 * Includes acquisition accounting impact |
 ROA and ROE Performance 24 |
 Near-Term Outlook/Priorities |
 2011 Outlook Economic recovery? Residential real estate exposure will continue to impact asset quality Challenging loan market Competition rational Expansion opportunities Organic Acquisition 26 |
 2011 Priorities Continued focus on credit quality Deepen existing relationships Increase market share Invest in technology and delivery channels to increase product offerings Rolled out mobile banking which will include text, mobile web and iPhone App (Android coming soon) ATM upgrades coming soon 27 |
 Summary Branch footprint is a competitive advantage Product and services that compete effectively with our largest competitors, but we’re able to maintain low costs Experienced management team Proven acquirer and integrator Strong balance sheet Proven financial performance in all market environments 28 |
 Thank You! |