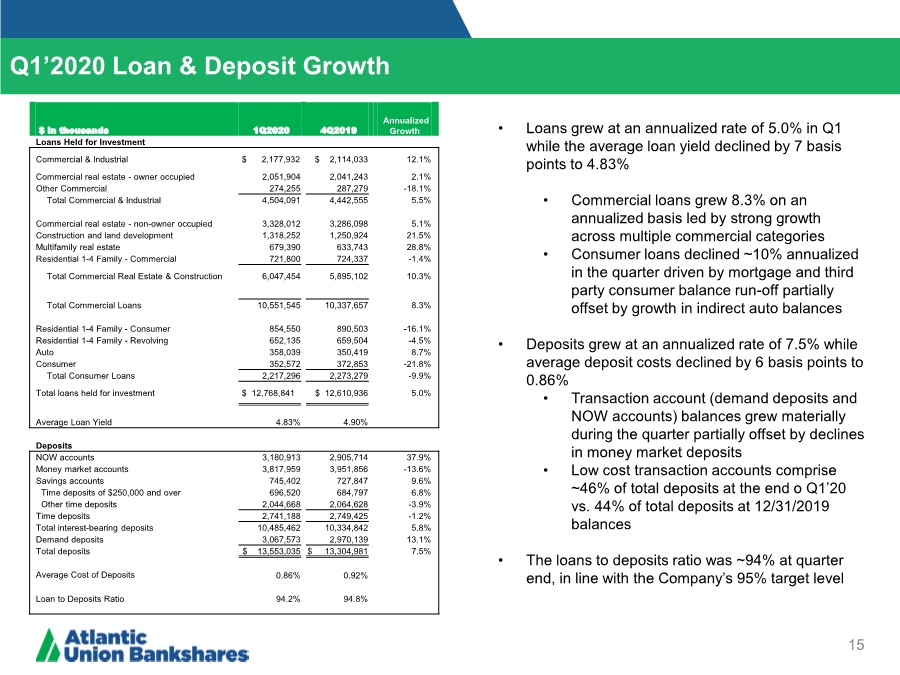
| 15 Q1’2020 Loan & Deposit Growth • Loans grew at an annualized rate of 5.0% in Q1 while the average loan yield declined by 7 basis points to 4.83% • Commercial loans grew 8.3% on an annualized basis led by strong growth across multiple commercial categories • Consumer loans declined ~10% annualized in the quarter driven by mortgage and third party consumer balance run-off partially offset by growth in indirect auto balances • Deposits grew at an annualized rate of 7.5% while average deposit costs declined by 6 basis points to 0.86% • Transaction account (demand deposits and NOW accounts) balances grew materially during the quarter partially offset by declines in money market deposits • Low cost transaction accounts comprise ~46% of total deposits at the end o Q1’20 vs. 44% of total deposits at 12/31/2019 balances • The loans to deposits ratio was ~94% at quarter end, in line with the Company’s 95% target level $ in thousands 1Q2020 4Q2019 Annualized Growth Loans Held for Investment Commercial & Industrial $ 2,177,932 $ 2,114,033 12.1% Commercial real estate - owner occupied 2,051,904 2,041,243 2.1% Other Commercial 274,255 287,279 -18.1% Total Commercial & Industrial 4,504,091 4,442,555 5.5% Commercial real estate - non-owner occupied 3,328,012 3,286,098 5.1% Construction and land development 1,318,252 1,250,924 21.5% Multifamily real estate 679,390 633,743 28.8% Residential 1-4 Family - Commercial 721,800 724,337 -1.4% Total Commercial Real Estate & Construction 6,047,454 5,895,102 10.3% Total Commercial Loans 10,551,545 10,337,657 8.3% Residential 1-4 Family - Consumer 854,550 890,503 -16.1% Residential 1-4 Family - Revolving 652,135 659,504 -4.5% Auto 358,039 350,419 8.7% Consumer 352,572 372,853 -21.8% Total Consumer Loans 2,217,296 2,273,279 -9.9% Total loans held for investment $ 12,768,841 $ 12,610,936 5.0% Average Loan Yield 4.83% 4.90% Deposits NOW accounts 3,180,913 2,905,714 37.9% Money market accounts 3,817,959 3,951,856 -13.6% Savings accounts 745,402 727,847 9.6% Time deposits of $250,000 and over 696,520 684,797 6.8% Other time deposits 2,044,668 2,064,628 -3.9% Time deposits 2,741,188 2,749,425 -1.2% Total interest-bearing deposits 10,485,462 10,334,842 5.8% Demand deposits 3,067,573 2,970,139 13.1% Total deposits $ 13,553,035 $ 13,304,981 7.5% Average Cost of Deposits 0.86% 0.92% Loan to Deposits Ratio 94.2% 94.8% |