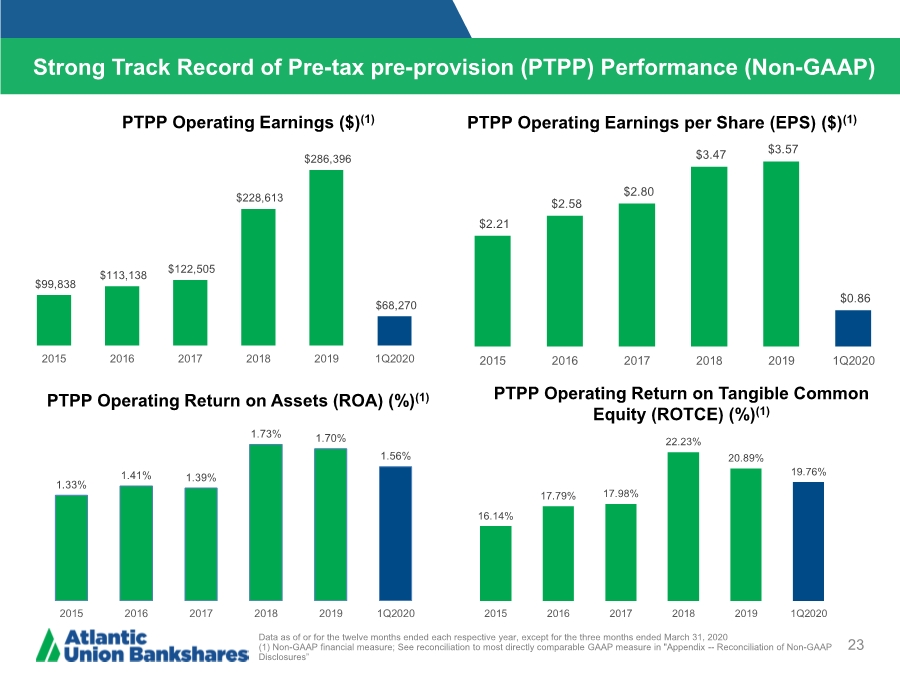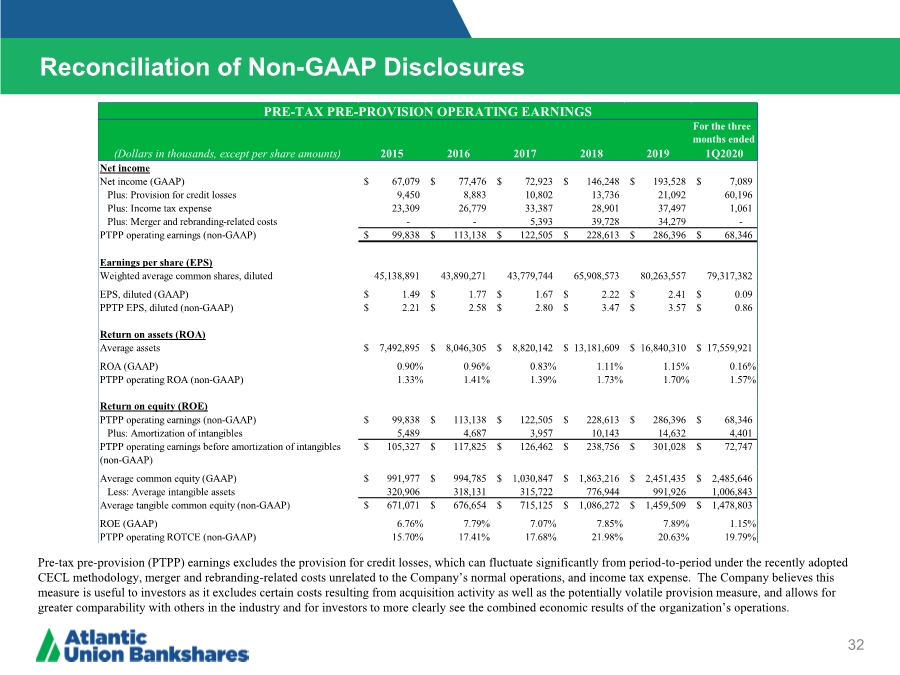
| Reconciliation of Non-GAAP Disclosures 32 ($ IN THOUSANDS) 2015 For the 12 Months Ended 2014 Return on Asset (ROA) 2016 2017 2018 2019 Pre-tax pre-provision (PTPP) earnings excludes the provision for credit losses, which can fluctuate significantly from period-to-period under the recently adopted CECL methodology, merger and rebranding-related costs unrelated to the Company’s normal operations, and income tax expense. The Company believes this measure is useful to investors as it excludes certain costs resulting from acquisition activity as well as the potentially volatile provision measure, and allows for greater comparability with others in the industry and for investors to more clearly see the combined economic results of the organization’s operations. For the three months ended (Dollars in thousands, except per share amounts) 2015 2016 2017 2018 2019 1Q2020 Net income Net income (GAAP) 67,079 $ 77,476 $ 72,923 $ 146,248 $ 193,528 $ 7,089 $ Plus: Provision for credit losses 9,450 8,883 10,802 13,736 21,092 60,196 Plus: Income tax expense 23,309 26,779 33,387 28,901 37,497 1,061 Plus: Merger and rebranding-related costs - - 5,393 39,728 34,279 - PTPP operating earnings (non-GAAP) 99,838 $ 113,138 $ 122,505 $ 228,613 $ 286,396 $ 68,346 $ Earnings per share (EPS) Weighted average common shares, diluted 45,138,891 43,890,271 43,779,744 65,908,573 80,263,557 79,317,382 EPS, diluted (GAAP) 1.49 $ 1.77 $ 1.67 $ 2.22 $ 2.41 $ 0.09 $ PPTP EPS, diluted (non-GAAP) 2.21 $ 2.58 $ 2.80 $ 3.47 $ 3.57 $ 0.86 $ Return on assets (ROA) Average assets 7,492,895 $ 8,046,305 $ 8,820,142 $ 13,181,609 $ 16,840,310 $ 17,559,921 $ ROA (GAAP) 0.90% 0.96% 0.83% 1.11% 1.15% 0.16% PTPP operating ROA (non-GAAP) 1.33% 1.41% 1.39% 1.73% 1.70% 1.57% Return on equity (ROE) PTPP operating earnings (non-GAAP) 99,838 $ 113,138 $ 122,505 $ 228,613 $ 286,396 $ 68,346 $ Plus: Amortization of intangibles 5,489 4,687 3,957 10,143 14,632 4,401 PTPP operating earnings before amortization of intangibles (non-GAAP) 105,327 $ 117,825 $ 126,462 $ 238,756 $ 301,028 $ 72,747 $ Average common equity (GAAP) 991,977 $ 994,785 $ 1,030,847 $ 1,863,216 $ 2,451,435 $ 2,485,646 $ Less: Average intangible assets 320,906 318,131 315,722 776,944 991,926 1,006,843 Average tangible common equity (non-GAAP) 671,071 $ 676,654 $ 715,125 $ 1,086,272 $ 1,459,509 $ 1,478,803 $ ROE (GAAP) 6.76% 7.79% 7.07% 7.85% 7.89% 1.15% PTPP operating ROTCE (non-GAAP) 15.70% 17.41% 17.68% 21.98% 20.63% 19.79% PRE-TAX PRE-PROVISION OPERATING EARNINGS |