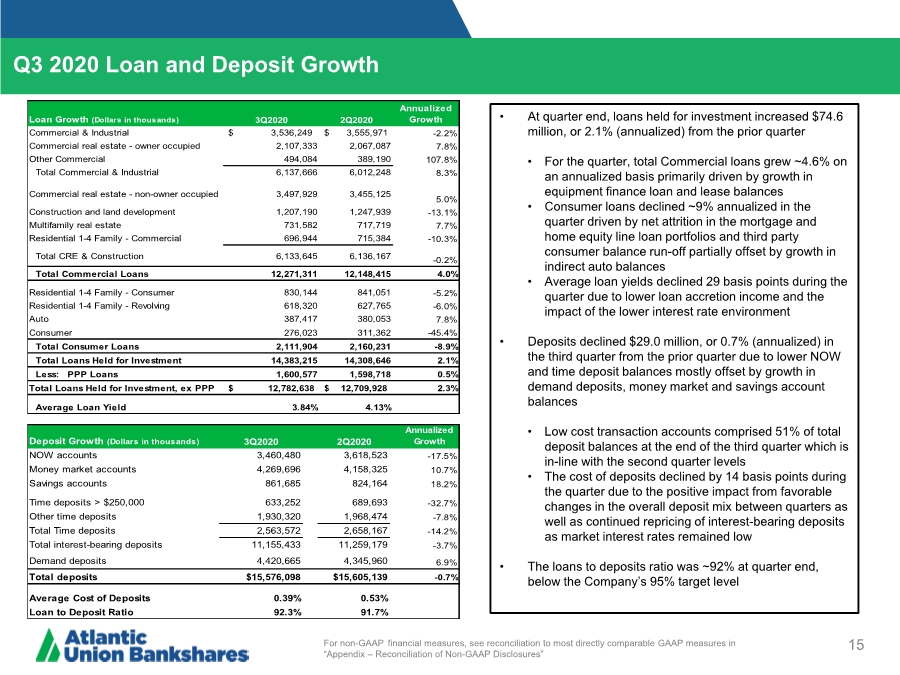
| 15 Q3 2020 Loan and Deposit Growth For non-GAAP financial measures, see reconciliation to most directly comparable GAAP measures in “Appendix – Reconciliation of Non-GAAP Disclosures” • At quarter end, loans held for investment increased $74.6 million, or 2.1% (annualized) from the prior quarter • For the quarter, total Commercial loans grew ~4.6% on an annualized basis primarily driven by growth in equipment finance loan and lease balances • Consumer loans declined ~9% annualized in the quarter driven by net attrition in the mortgage and home equity line loan portfolios and third party consumer balance run-off partially offset by growth in indirect auto balances • Average loan yields declined 29 basis points during the quarter due to lower loan accretion income and the impact of the lower interest rate environment • Deposits declined $29.0 million, or 0.7% (annualized) in the third quarter from the prior quarter due to lower NOW and time deposit balances mostly offset by growth in demand deposits, money market and savings account balances • Low cost transaction accounts comprised 51% of total deposit balances at the end of the third quarter which is in-line with the second quarter levels • The cost of deposits declined by 14 basis points during the quarter due to the positive impact from favorable changes in the overall deposit mix between quarters as well as continued repricing of interest-bearing deposits as market interest rates remained low • The loans to deposits ratio was ~92% at quarter end, below the Company’s 95% target level Loan Growth (Dollars in thousands) 3Q2020 2Q2020 Annualized Growth Commercial & Industrial $ 3,536,249 $ 3,555,971 -2.2% Commercial real estate - owner occupied 2,107,333 2,067,087 7.8% Other Commercial 494,084 389,190 107.8% Total Commercial & Industrial 6,137,666 6,012,248 8.3% Commercial real estate - non-owner occupied 3,497,929 3,455,125 5.0% Construction and land development 1,207,190 1,247,939 -13.1% Multifamily real estate 731,582 717,719 7.7% Residential 1-4 Family - Commercial 696,944 715,384 -10.3% Total CRE & Construction 6,133,645 6,136,167 -0.2% Total Commercial Loans 12,271,311 12,148,415 4.0% Residential 1-4 Family - Consumer 830,144 841,051 -5.2% Residential 1-4 Family - Revolving 618,320 627,765 -6.0% Auto 387,417 380,053 7.8% Consumer 276,023 311,362 -45.4% Total Consumer Loans 2,111,904 2,160,231 -8.9% Total Loans Held for Investment 14,383,215 14,308,646 2.1% Less: PPP Loans 1,600,577 1,598,718 0.5% Total Loans Held for Investment, ex PPP $ 12,782,638 $ 12,709,928 2.3% Average Loan Yield 3.84% 4.13% Deposit Growth (Dollars in thousands) 3Q2020 2Q2020 Annualized Growth NOW accounts 3,460,480 3,618,523 -17.5% Money market accounts 4,269,696 4,158,325 10.7% Savings accounts 861,685 824,164 18.2% Time deposits > $250,000 633,252 689,693 -32.7% Other time deposits 1,930,320 1,968,474 -7.8% Total Time deposits 2,563,572 2,658,167 -14.2% Total interest-bearing deposits 11,155,433 11,259,179 -3.7% Demand deposits 4,420,665 4,345,960 6.9% Total deposits $15,576,098 $15,605,139 -0.7% Average Cost of Deposits 0.39% 0.53% Loan to Deposit Ratio 92.3% 91.7% |