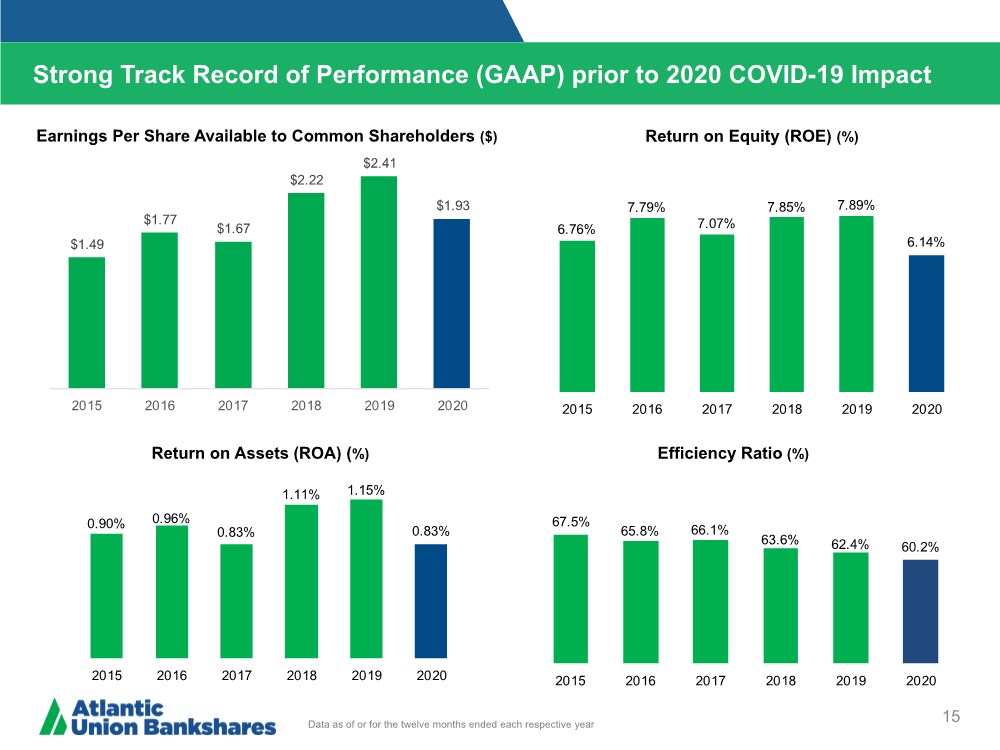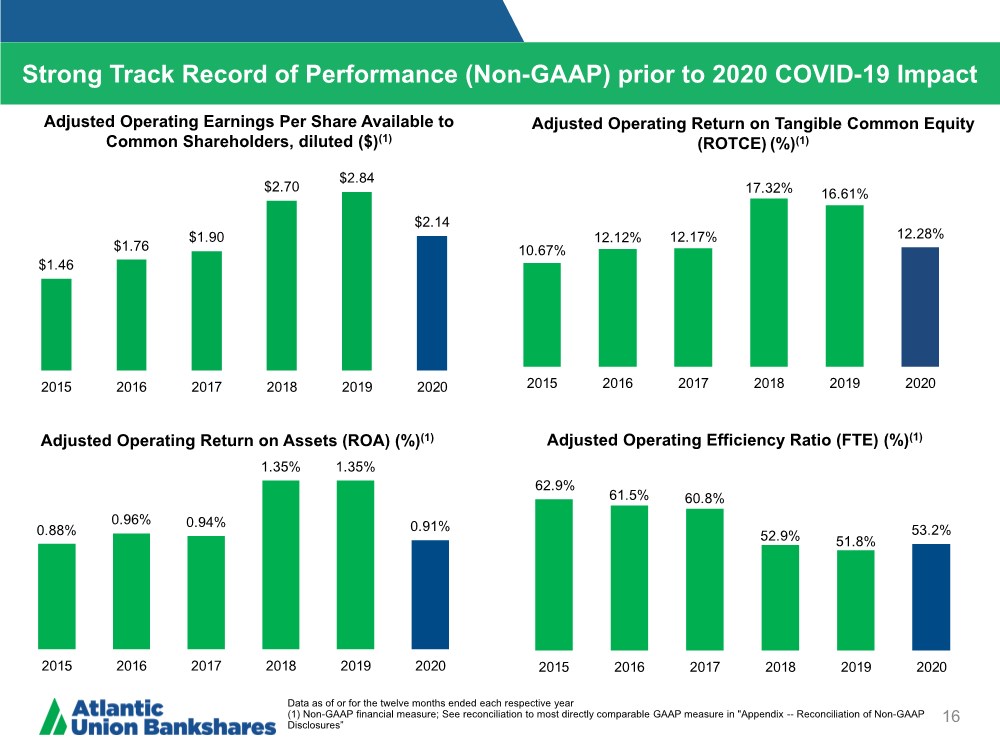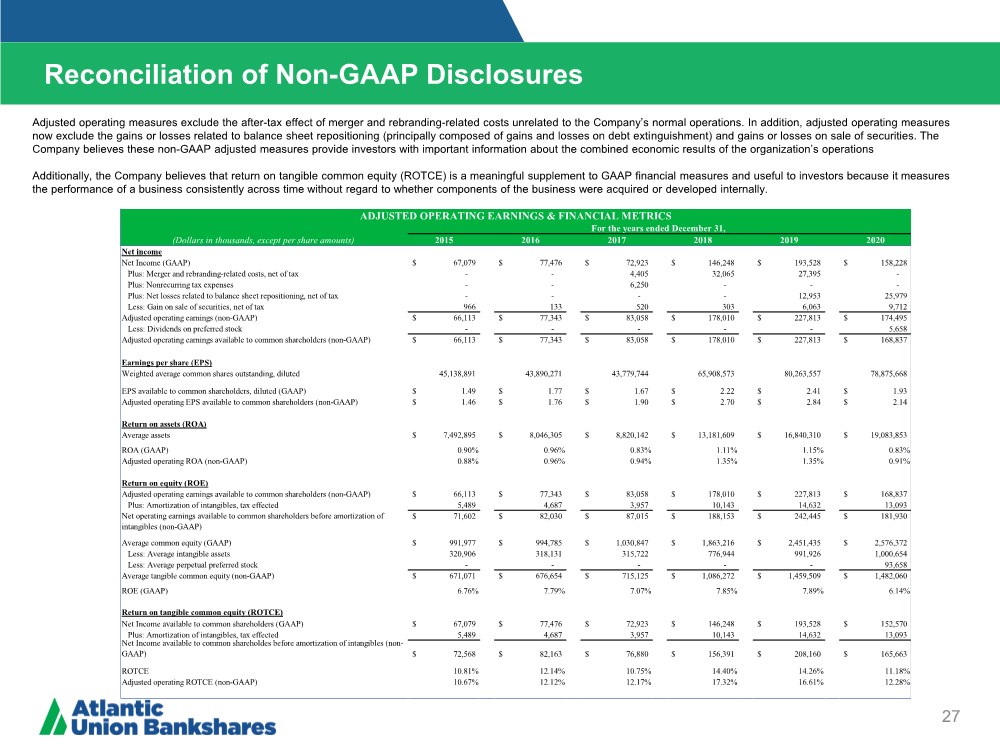
| Reconciliation of Non-GAAP Disclosures 27 Operating Earnings Per Share Adjusted operating measures exclude the after-tax effect of merger and rebranding-related costs unrelated to the Company’s normal operations. In addition, adjusted operating measures now exclude the gains or losses related to balance sheet repositioning (principally composed of gains and losses on debt extinguishment) and gains or losses on sale of securities. The Company believes these non-GAAP adjusted measures provide investors with important information about the combined economic results of the organization’s operations Additionally, the Company believes that return on tangible common equity (ROTCE) is a meaningful supplement to GAAP financial measures and useful to investors because it measures the performance of a business consistently across time without regard to whether components of the business were acquired or developed internally. (Dollars in thousands, except per share amounts) 2015 2016 2017 2018 2019 2020 Net income Net Income (GAAP) 67,079 $ 77,476 $ 72,923 $ 146,248 $ 193,528 $ 158,228 $ Plus: Merger and rebranding-related costs, net of tax - - 4,405 32,065 27,395 - Plus: Nonrecurring tax expenses - - 6,250 - - - Plus: Net losses related to balance sheet repositioning, net of tax - - - - 12,953 25,979 Less: Gain on sale of securities, net of tax 966 133 520 303 6,063 9,712 Adjusted operating earnings (non-GAAP) 66,113 $ 77,343 $ 83,058 $ 178,010 $ 227,813 $ 174,495 $ Less: Dividends on preferred stock - - - - - 5,658 Adjusted operating earnings available to common shareholders (non-GAAP) 66,113 $ 77,343 $ 83,058 $ 178,010 $ 227,813 $ 168,837 $ Earnings per share (EPS) Weighted average common shares outstanding, diluted 45,138,891 43,890,271 43,779,744 65,908,573 80,263,557 78,875,668 EPS available to common shareholders, diluted (GAAP) 1.49 $ 1.77 $ 1.67 $ 2.22 $ 2.41 $ 1.93 $ Adjusted operating EPS available to common shareholders (non-GAAP) 1.46 $ 1.76 $ 1.90 $ 2.70 $ 2.84 $ 2.14 $ Return on assets (ROA) Average assets 7,492,895 $ 8,046,305 $ 8,820,142 $ 13,181,609 $ 16,840,310 $ 19,083,853 $ ROA (GAAP) 0.90% 0.96% 0.83% 1.11% 1.15% 0.83% Adjusted operating ROA (non-GAAP) 0.88% 0.96% 0.94% 1.35% 1.35% 0.91% Return on equity (ROE) Adjusted operating earnings available to common shareholders (non-GAAP) 66,113 $ 77,343 $ 83,058 $ 178,010 $ 227,813 $ 168,837 $ Plus: Amortization of intangibles, tax effected 5,489 4,687 3,957 10,143 14,632 13,093 Net operating earnings available to common shareholders before amortization of intangibles (non-GAAP) 71,602 $ 82,030 $ 87,015 $ 188,153 $ 242,445 $ 181,930 $ Average common equity (GAAP) 991,977 $ 994,785 $ 1,030,847 $ 1,863,216 $ 2,451,435 $ 2,576,372 $ Less: Average intangible assets 320,906 318,131 315,722 776,944 991,926 1,000,654 Less: Average perpetual preferred stock - - - - - 93,658 Average tangible common equity (non-GAAP) 671,071 $ 676,654 $ 715,125 $ 1,086,272 $ 1,459,509 $ 1,482,060 $ ROE (GAAP) 6.76% 7.79% 7.07% 7.85% 7.89% 6.14% Return on tangible common equity (ROTCE) Net Income available to common shareholders (GAAP) 67,079 $ 77,476 $ 72,923 $ 146,248 $ 193,528 $ 152,570 $ Plus: Amortization of intangibles, tax effected 5,489 4,687 3,957 10,143 14,632 13,093 Net Income available to common shareholdes before amortization of intangibles (non- GAAP) 72,568 $ 82,163 $ 76,880 $ 156,391 $ 208,160 $ 165,663 $ ROTCE 10.81% 12.14% 10.75% 14.40% 14.26% 11.18% Adjusted operating ROTCE (non-GAAP) 10.67% 12.12% 12.17% 17.32% 16.61% 12.28% For the years ended December 31, ADJUSTED OPERATING EARNINGS & FINANCIAL METRICS |