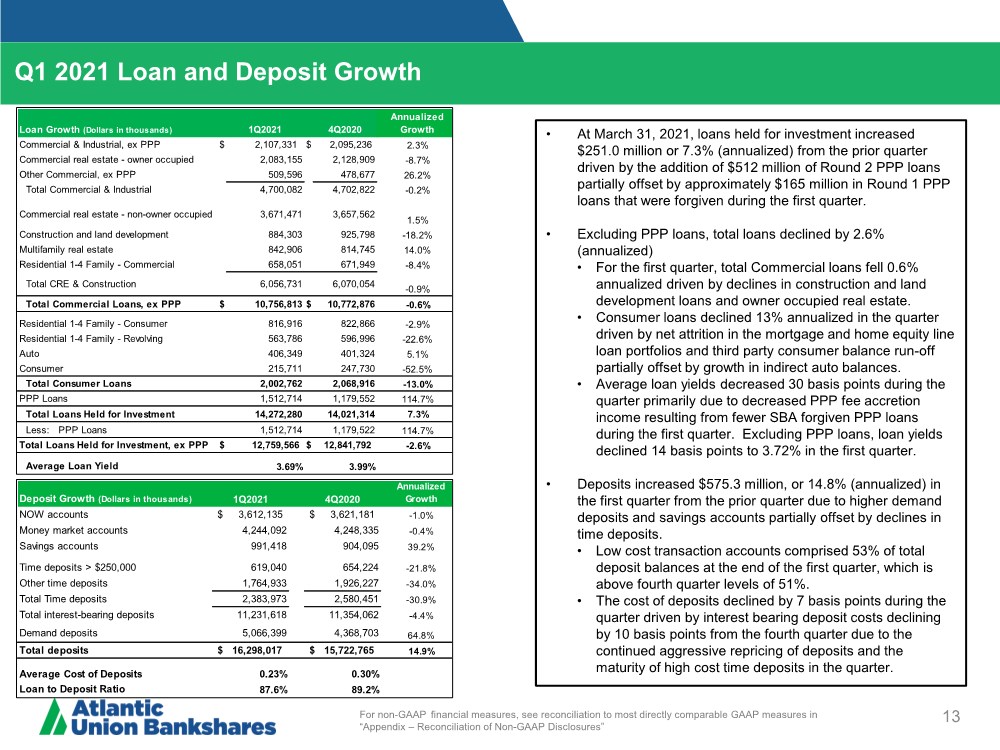
| 13 Q1 2021 Loan and Deposit Growth For non-GAAP financial measures, see reconciliation to most directly comparable GAAP measures in “Appendix – Reconciliation of Non-GAAP Disclosures” • At March 31, 2021, loans held for investment increased $251.0 million or 7.3% (annualized) from the prior quarter driven by the addition of $512 million of Round 2 PPP loans partially offset by approximately $165 million in Round 1 PPP loans that were forgiven during the first quarter. • Excluding PPP loans, total loans declined by 2.6% (annualized) • For the first quarter, total Commercial loans fell 0.6% annualized driven by declines in construction and land development loans and owner occupied real estate. • Consumer loans declined 13% annualized in the quarter driven by net attrition in the mortgage and home equity line loan portfolios and third party consumer balance run-off partially offset by growth in indirect auto balances. • Average loan yields decreased 30 basis points during the quarter primarily due to decreased PPP fee accretion income resulting from fewer SBA forgiven PPP loans during the first quarter. Excluding PPP loans, loan yields declined 14 basis points to 3.72% in the first quarter. • Deposits increased $575.3 million, or 14.8% (annualized) in the first quarter from the prior quarter due to higher demand deposits and savings accounts partially offset by declines in time deposits. • Low cost transaction accounts comprised 53% of total deposit balances at the end of the first quarter, which is above fourth quarter levels of 51%. • The cost of deposits declined by 7 basis points during the quarter driven by interest bearing deposit costs declining by 10 basis points from the fourth quarter due to the continued aggressive repricing of deposits and the maturity of high cost time deposits in the quarter. Loan Growth (Dollars in thousands) 1Q2021 4Q2020 Annualized Growth Commercial & Industrial, ex PPP $ 2,107,331 $ 2,095,236 2.3% Commercial real estate - owner occupied 2,083,155 2,128,909 -8.7% Other Commercial, ex PPP 509,596 478,677 26.2% Total Commercial & Industrial 4,700,082 4,702,822 -0.2% Commercial real estate - non-owner occupied 3,671,471 3,657,562 1.5% Construction and land development 884,303 925,798 -18.2% Multifamily real estate 842,906 814,745 14.0% Residential 1-4 Family - Commercial 658,051 671,949 -8.4% Total CRE & Construction 6,056,731 6,070,054 -0.9% Total Commercial Loans, ex PPP $ 10,756,813 $ 10,772,876 -0.6% Residential 1-4 Family - Consumer 816,916 822,866 -2.9% Residential 1-4 Family - Revolving 563,786 596,996 -22.6% Auto 406,349 401,324 5.1% Consumer 215,711 247,730 -52.5% Total Consumer Loans 2,002,762 2,068,916 -13.0% PPP Loans 1,512,714 1,179,552 114.7% Total Loans Held for Investment 14,272,280 14,021,314 7.3% Less: PPP Loans 1,512,714 1,179,522 114.7% Total Loans Held for Investment, ex PPP $ 12,759,566 $ 12,841,792 -2.6% Average Loan Yield 3.69% 3.99% Deposit Growth (Dollars in thousands) 1Q2021 4Q2020 Annualized Growth NOW accounts $ 3,612,135 $ 3,621,181 -1.0% Money market accounts 4,244,092 4,248,335 -0.4% Savings accounts 991,418 904,095 39.2% Time deposits > $250,000 619,040 654,224 -21.8% Other time deposits 1,764,933 1,926,227 -34.0% Total Time deposits 2,383,973 2,580,451 -30.9% Total interest-bearing deposits 11,231,618 11,354,062 -4.4% Demand deposits 5,066,399 4,368,703 64.8% Total deposits $ 16,298,017 $ 15,722,765 14.9% Average Cost of Deposits 0.23% 0.30% Loan to Deposit Ratio 87.6% 89.2% |