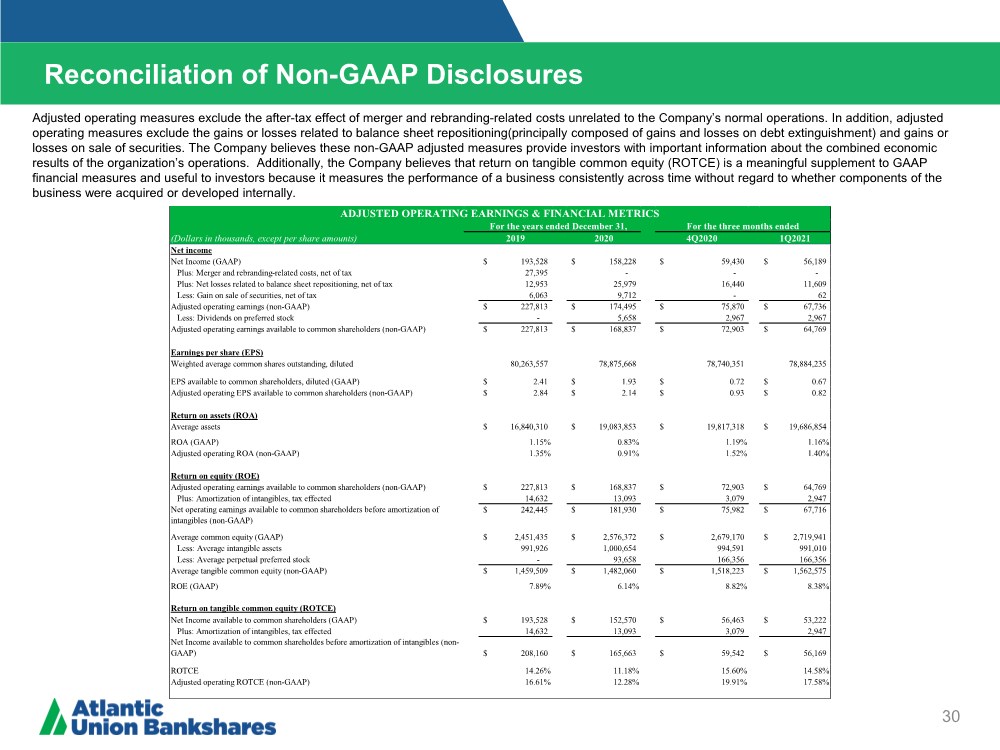
| Reconciliation of Non-GAAP Disclosures 30 Operating Earnings Per Share Adjusted operating measures exclude the after-tax effect of merger and rebranding-related costs unrelated to the Company’s normal operations. In addition, adjusted operating measures exclude the gains or losses related to balance sheet repositioning(principally composed of gains and losses on debt extinguishment) and gains or losses on sale of securities. The Company believes these non-GAAP adjusted measures provide investors with important information about the combined economic results of the organization’s operations. Additionally, the Company believes that return on tangible common equity (ROTCE) is a meaningful supplement to GAAP financial measures and useful to investors because it measures the performance of a business consistently across time without regard to whether components of the business were acquired or developed internally. (Dollars in thousands, except per share amounts) 2019 2020 4Q2020 1Q2021 Net income Net Income (GAAP) 193,528 $ 158,228 $ 59,430 $ 56,189 $ Plus: Merger and rebranding-related costs, net of tax 27,395 - - - Plus: Net losses related to balance sheet repositioning, net of tax 12,953 25,979 16,440 11,609 Less: Gain on sale of securities, net of tax 6,063 9,712 - 62 Adjusted operating earnings (non-GAAP) 227,813 $ 174,495 $ 75,870 $ 67,736 $ Less: Dividends on preferred stock - 5,658 2,967 2,967 Adjusted operating earnings available to common shareholders (non-GAAP) 227,813 $ 168,837 $ 72,903 $ 64,769 $ Earnings per share (EPS) Weighted average common shares outstanding, diluted 80,263,557 78,875,668 78,740,351 78,884,235 EPS available to common shareholders, diluted (GAAP) 2.41 $ 1.93 $ 0.72 $ 0.67 $ Adjusted operating EPS available to common shareholders (non-GAAP) 2.84 $ 2.14 $ 0.93 $ 0.82 $ Return on assets (ROA) Average assets 16,840,310 $ 19,083,853 $ 19,817,318 $ 19,686,854 $ ROA (GAAP) 1.15% 0.83% 1.19% 1.16% Adjusted operating ROA (non-GAAP) 1.35% 0.91% 1.52% 1.40% Return on equity (ROE) Adjusted operating earnings available to common shareholders (non-GAAP) 227,813 $ 168,837 $ 72,903 $ 64,769 $ Plus: Amortization of intangibles, tax effected 14,632 13,093 3,079 2,947 Net operating earnings available to common shareholders before amortization of intangibles (non-GAAP) 242,445 $ 181,930 $ 75,982 $ 67,716 $ Average common equity (GAAP) 2,451,435 $ 2,576,372 $ 2,679,170 $ 2,719,941 $ Less: Average intangible assets 991,926 1,000,654 994,591 991,010 Less: Average perpetual preferred stock - 93,658 166,356 166,356 Average tangible common equity (non-GAAP) 1,459,509 $ 1,482,060 $ 1,518,223 $ 1,562,575 $ ROE (GAAP) 7.89% 6.14% 8.82% 8.38% Return on tangible common equity (ROTCE) Net Income available to common shareholders (GAAP) 193,528 $ 152,570 $ 56,463 $ 53,222 $ Plus: Amortization of intangibles, tax effected 14,632 13,093 3,079 2,947 Net Income available to common shareholdes before amortization of intangibles (non- GAAP) 208,160 $ 165,663 $ 59,542 $ 56,169 $ ROTCE 14.26% 11.18% 15.60% 14.58% Adjusted operating ROTCE (non-GAAP) 16.61% 12.28% 19.91% 17.58% ADJUSTED OPERATING EARNINGS & FINANCIAL METRICS For the three months ended For the years ended December 31, |