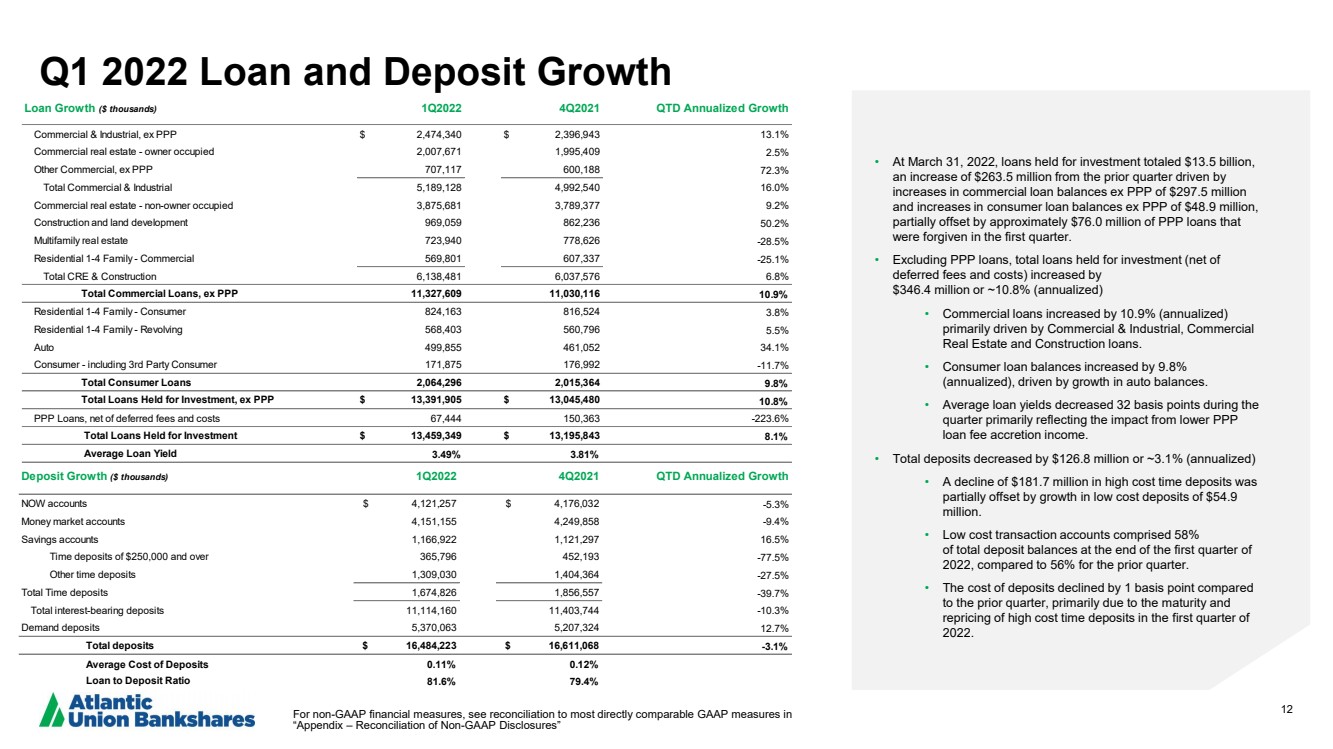
| 12 Q1 2022 Loan and Deposit Growth • At March 31, 2022, loans held for investment totaled $13.5 billion, an increase of $263.5 million from the prior quarter driven by increases in commercial loan balances ex PPP of $297.5 million and increases in consumer loan balances ex PPP of $48.9 million, partially offset by approximately $76.0 million of PPP loans that were forgiven in the first quarter. • Excluding PPP loans, total loans held for investment (net of deferred fees and costs) increased by $346.4 million or ~10.8% (annualized) • Commercial loans increased by 10.9% (annualized) primarily driven by Commercial & Industrial, Commercial Real Estate and Construction loans. • Consumer loan balances increased by 9.8% (annualized), driven by growth in auto balances. • Average loan yields decreased 32 basis points during the quarter primarily reflecting the impact from lower PPP loan fee accretion income. • Total deposits decreased by $126.8 million or ~3.1% (annualized) • A decline of $181.7 million in high cost time deposits was partially offset by growth in low cost deposits of $54.9 million. • Low cost transaction accounts comprised 58% of total deposit balances at the end of the first quarter of 2022, compared to 56% for the prior quarter. • The cost of deposits declined by 1 basis point compared to the prior quarter, primarily due to the maturity and repricing of high cost time deposits in the first quarter of 2022. For non - GAAP financial measures, see reconciliation to most directly comparable GAAP measures in “Appendix – Reconciliation of Non - GAAP Disclosures” Loan Growth ($ thousands) 1Q2022 4Q2021 QTD Annualized Growth Commercial & Industrial, ex PPP $ 2,474,340 $ 2,396,943 13.1% Commercial real estate - owner occupied 2,007,671 1,995,409 2.5% Other Commercial, ex PPP 707,117 600,188 72.3% Total Commercial & Industrial 5,189,128 4,992,540 16.0% Commercial real estate - non-owner occupied 3,875,681 3,789,377 9.2% Construction and land development 969,059 862,236 50.2% Multifamily real estate 723,940 778,626 -28.5% Residential 1-4 Family - Commercial 569,801 607,337 -25.1% Total CRE & Construction 6,138,481 6,037,576 6.8% Total Commercial Loans, ex PPP 11,327,609 11,030,116 10.9% Residential 1-4 Family - Consumer 824,163 816,524 3.8% Residential 1-4 Family - Revolving 568,403 560,796 5.5% Auto 499,855 461,052 34.1% Consumer - including 3rd Party Consumer 171,875 176,992 -11.7% Total Consumer Loans 2,064,296 2,015,364 9.8% Total Loans Held for Investment, ex PPP $ 13,391,905 $ 13,045,480 10.8% PPP Loans, net of deferred fees and costs 67,444 150,363 -223.6% Total Loans Held for Investment $ 13,459,349 $ 13,195,843 8.1% Average Loan Yield 3.49% 3.81% Deposit Growth ($ thousands) 1Q2022 4Q2021 QTD Annualized Growth NOW accounts $ 4,121,257 $ 4,176,032 -5.3% Money market accounts 4,151,155 4,249,858 -9.4% Savings accounts 1,166,922 1,121,297 16.5% Time deposits of $250,000 and over 365,796 452,193 -77.5% Other time deposits 1,309,030 1,404,364 -27.5% Total Time deposits 1,674,826 1,856,557 -39.7% Total interest-bearing deposits 11,114,160 11,403,744 -10.3% Demand deposits 5,370,063 5,207,324 12.7% Total deposits $ 16,484,223 $ 16,611,068 -3.1% Average Cost of Deposits 0.11% 0.12% Loan to Deposit Ratio 81.6% 79.4% |