UNITED STATES
SECURITIES AND EXCHANGE COMMISSION
Washington, D.C. 20549
FORM N-CSR
CERTIFIED SHAREHOLDER REPORT OF REGISTERED
MANAGEMENT INVESTMENT COMPANIES
Investment Company Act file number: 811-6563
CALVERT WORLD VALUES FUND, INC.
(Exact name of registrant as specified in charter)
4550 Montgomery Avenue
Suite 1000N
Bethesda, Maryland 20814
(Address of Principal Executive Offices)
William M. Tartikoff, Esq.
4550 Montgomery Avenue
Suite 1000N
Bethesda, Maryland 20814
(Name and Address of Agent for Service)
Registrant's telephone number, including area code: (301) 951-4800
Date of fiscal year end: September 30
Date of reporting period: Six months ended March 31, 2007
Item 1. Report to Stockholders.
<PAGE>
Calvert
Investments that make a differenceâ
E-Delivery Sign-up -- details inside
March 31, 2007
Semi-Annual Report
Calvert World Values
International Equity Fund
Calvert
Investments that make a differenceâ
A UNIFI Company
Choose Planet-friendly E-delivery! Sign up now for on-line statements, prospectuses, and fund reports. In less than five minutes you can help reduce paper mail and lower fund costs. Just go to www.calvert.com, click on My Account, and select the documents you would like to receive via e-mail. If you're new to account access, you'll be prompted to set up a personal identification number for your account. Once you're in, click on the E-delivery sign-up at the bottom of the Account Portfolio page and follow the quick, easy steps. |
Table of Contents
President's Letter
1
Social Update
4
Portfolio Management Discussion
6
Shareholder Expense Example
10
Statement of Net Assets
12
Statement of Operations
20
Statements of Changes in Net Assets
21
Notes to Financial Statements
23
Financial Highlights
29
Explanation of Financial Tables
34
Proxy Voting and Availability of Quarterly Portfolio Holdings
36
Basis for Board's Approval of Investment Advisory Contract
36
Dear Shareholder:
In the six months ended March 31, 2007, the stock market and economy closed out the period in a surprisingly steady state, especially considering the brief worldwide sell-off in equities at the end of February and ongoing concerns about subprime mortgage loans. Over the six-month period, energy prices finished about where they started, the Federal Reserve left interest rates unchanged, and equities worldwide recovered to end up in positive territory.
During this period, the equity markets had two distinct chapters of performance. In the fourth quarter of 2006, the Standard & Poor's 500 Index posted a total return of 6.7% as the U.S. equity market continued its general upward trend with remarkably low volatility. However, for the first quarter of this year, the S&P 500 gained only 0.64% amid markedly increased volatility. On February 27, an 8.8% drop in the value of the Shanghai Stock Exchange Composite Index triggered a worldwide sell-off in equities, with the S&P 500 losing 3.47% for the day. The U.S. equities market stayed somewhat jittery for the rest of the quarter, with concerns about increasing defaults on subprime mortgages weighing on investors.
For the entire six-month period, the domestic U.S. market, as measured by the S&P 500, gained 7.38%. The Morgan Stanley Capital International EAFE (Europe, Australasia, Far East) Index, a benchmark for international markets, gained 14.98%. The return for international stocks was even more remarkable considering their late-February plunge. The Lehman U.S. Credit Index, a common benchmark for bond fund performance, climbed 2.87% during the period.
A Look at Style Trends
Value stocks outperformed growth stocks for the six-month period, extending a seven-year trend which has been detrimental to several Calvert equity portfolios. However, there are signs (such as a possible peak in the Federal Reserve's benchmark lending rate) that this trend is beginning to reverse. To learn more about these style trends, please visit www.calvert.com, click on Fund Commentary in the right-hand column, and select "Calvert Perspective: Reading the Headwinds" to read a commentary by Steve Falci, Calvert's Chief Investment Officer, Equities.
Another factor that may potentially work in favor of Calvert's equity funds is investor reaction to the market's increased volatility. As investors become increasingly concerned about the tradeoff between risk and return, they may increasingly seek higher-quality stocks that are attractively priced relative to the quality of their fundamental data. In times of volatility, as always, we continue to advise our clients to stay the course with their investment strategy and to discuss their portfolio holdings with a financial advisor when necessary.
Growth of Sustainable, "Green" Investing
The movement to increase environmental and corporate sustainability has recently received considerable attention from the mainstream media, with cover stories on the green movement gracing the covers of publications such as Newsweek and Vanity Fair. The growing popularity of social and environmental responsibility shows that the public may be beginning to realize something that many Calvert investors have known for a long time: environmental and corporate responsibility are vital to society as a whole, and investment selection can have an impact on sustainability.
As Calvert's Double Diligence® investment process shows, companies that are committed to sustainability are often companies with high-quality management, corporate governance, and financial data--which are the types of companies that can make the best long-term investments.
One focus of Calvert's advocacy efforts over the last few years has been our work to convince companies to both disclose more information about how their operations affect climate change and to reduce their contributions to climate change factors. Please visit www.calvert.com/climate.html to learn more about climate change and our efforts to increase corporate awareness of the issue.
Sudan Divestment Initiative
In February, Calvert announced a new partnership with the Sudan Divestment Task Force and the Save Darfur Coalition to encourage investors and institutions to divest holdings of companies that help support the government of Sudan. To find more information about the crisis in Darfur and the divestment initiative, please visit www.calvert.com/sudan.
This effort is consistent with Calvert's long-standing commitment to human rights--in 1982, Calvert was the first mutual fund company to decide not to invest in companies doing business in South Africa's apartheid regime. Calvert's past efforts, in concert with other groups, have demonstrated how divestment and advocacy can exert significant influence on companies--and regimes--to effect positive societal change. We will continue to work toward ending the humanitarian crisis in Darfur and keep supporting efforts to maintain human rights worldwide.
As always, thank you for your continued confidence in our mutual funds. We look forward to continuing to strive to meet your investment needs in the future.
Sincerely,
Barbara J. Krumsiek
President and CEO
Calvert Group, Ltd.
April 2007
Social Update
from the Calvert Social Research Department
As a company, through the work of Calvert Social Research Department, and through our unique investment programs, Calvert is a leader in socially responsible investment practices. This Social Update highlights key initiatives and involvement for the six-month reporting period ended March 31, 2007.
Shareholder Advocacy
For the 2007 proxy season, Calvert was lead or co-filer on 36 shareholder resolutions. To date, 17 of these have been successfully withdrawn because companies have taken action to address our concerns. The others await action at annual shareholder meetings. Issues targeted in the resolutions include climate change reporting, board and employee diversity, sustainability reporting, political contributions disclosure, and executive compensation.
Sudan Divestment
Calvert announced its support for a targeted divestment campaign focused on Sudan and launched a new partnership with the Sudan Divestment Task Force (SDTF) and Save Darfur Coalition (SDC) in early February. Since then, we have provided research and analytical support to the SDTF, drafted an advocacy plan for Calvert on this issue, and organized a small working group of socially responsible investors to encourage shareholder action on this issue. We have also provided a wide range of media support, including radio interviews, a webcast for institutional investors, and articles for BSR Weekly and the U.N. Global Compact.
Climate Change Disclosure
In January, the Ceres/Calvert S&P500 Report was published, based on the responses of U.S. companies to the Carbon Disclosure Project's (CDP) request for information. The Project has historically surveyed executives of the companies on the Financial Times (FT) Global 500 list of the world's largest companies. In 2006, Calvert provided initial funding to extend the CDP survey to companies in the Standard & Poor's 500 Index for the first time. The report launch attracted attention from media outlets such as Business Week and Financial Times. We sent the report to members of Congress who have introduced legislation to reduce greenhouse gas emissions and are now working with other investors to encourage S&P 500 companies to respond to this year's CDP survey.
Community Investments
Many of our Funds participate in Calvert's community investing program, which is known as High Social Impact Investing (HSII) and is administered through the Calvert Social Investment Foundation. The HSII program may allocate up to 1% to 3% of Fund assets at below-market interest rates to provide economic opportunity for struggling populations.1 During the reporting period, the Foundation made several investments with groups working to revitalize the Gulf Coast Region in the aftermath of Hurricanes Katrina and Rita. Diaconía Microcrédito Rotativo, a rural microfinance institution that makes tiny business loans to more than 11,000 entrepreneurs in the impoverished Guayaquil area of Ecuador, was another organization receiving an investment from the Foundation.
Special Equities
A modest but important portion of certain Calvert portfolios is invested in private companies that provide socially or environmentally helpful products or services with a profit objective. Much recent attention has been focused on corn-based ethanol as a renewable energy source. But one new special equities investment, Earthanol, seeks to create fuel from agricultural, industrial, and municipal waste.2 The firm's technology for waste-to-ethanol production in the San Joaquin Valley has already been proven effective in other parts of the world.
Globally, more than 5 million children under the age of 5 years die of dehydration caused by diarrhea each year. But new medications developed by another special equities investment, Napo Pharmaceuticals, could soon be introduced into both the Third World and U.S. markets.3 The company is currently commercializing its Crofelemer gastro-intestinal compound, which operates differently from over-the-counter anti-motility treatments, to treat irritable bowel syndrome (IBS), chronic diarrhea caused by HIV, acute infectious diarrhea, and pediatric diarrhea. The FDA has granted fast-track status for the IBS and AIDS-related formulations.
As always, we appreciate your investment in Calvert and will continue to manage your investments with an eye on both financial performance and corporate integrity.
1. As of March 31, 2007, Calvert Social Investment Foundation Community Investment Notes represented the
following percentages of Fund net assets: Calvert Social Investment Fund (CSIF) Balanced, 0.82%; CSIF Bond,
0.38%; CSIF Equity, 0.58%; Calvert Capital Accumulation Fund, 1.02%; Calvert World Values Fund
International Equity Fund, 0.61%; Calvert New Vision Small Cap Fund, 0.78%; and Calvert Large Cap Growth
Fund, 0.20%. All holdings are subject to change without notice. The Calvert Social Investment Foundation is a
501(c)(3) nonprofit organization.
2. On March 31, 2007, Earthanol represented 0.01% of the Calvert Social Investment Fund Equity Portfolio.
3. On March 31, 2007, Napo Pharmaceuticals represented 0.03% of Calvert Large Cap Growth Fund.
Portfolio Management Discussion
Raymond Mui
of Acadian Asset Management, Inc.
Performance Summary
For the six-month period ending March 31, 2007, Calvert World Values International Equity Fund Class A shares (at NAV*) returned 14.06% versus 14.98% for the Morgan Stanley Capital International Europe Australasia Far East (MSCI EAFE) Index.
Investment Climate
Despite volatility in February and March, non-U.S. markets finished the six-month period strongly--demonstrating continued resilience in spite of high energy prices, inflationary pressures, and other global concerns.
Even with interest rate increases from the European Central Bank, equity market performance in Europe was solid, gaining 15.0% in U.S. dollars for the six-month period. Top performers among the region's developed markets were Germany, up 22.2%, and France, the United Kingdom, and Italy--all up around 13%. In the Pacific Rim, Singapore rose 36.1%, Australia gained 27.6%, and Hong Kong climbed 15.1%. However, Japan trailed its Asian peers with an 8.7% return in U.S. dollars, as household spending declined and wage growth stalled.
Emerging markets demonstrated their potential for volatility -- particularly the nearly 9% drop of China's Shanghai Index one day in February -- as investors responded to uncertainties such as rising commodity prices, inflation, and interest rates, as well as ongoing geopolitical tensions. Nevertheless, the emerging markets as a whole finished the six-month period strongly, gaining 20.4%.1 Latin American emerging markets fared best, as Peru gained 42.3%, Brazil advanced 32.3%, and Mexico rose 25.4%. In contrast, Venezuela eked out a 2% return as President Hugo Chavez announced his intent to nationalize the country's central bank, as well as its oil, utility, and telephone industries. Other emerging market leaders were China, South Africa, and Poland, which returned 32.8%, 37.6%, and 33.9%, respectively.
Portfolio Strategy
Our investment process focuses on bottom-up stock selection across a broad range of non-U.S. equity markets. To identify stocks that are most likely to outperform, we conduct a top-down evaluation of more than 200 country-sectors (e.g., French Technology) versus the world market, and then evaluate each stock within that country-sector versus its peers. During the six-month period, we made opportunistic allocations to the U.S. and Canadian markets, as well as to a selection of emerging markets.2 Overall, the Fund had positions nearly 30 markets at various points, with the largest overweights to France, Spain, and Finland. The Fund also had significant exposure to the emerging markets of Korea and Taiwan. Underweighted markets included Japan, the United Kingdom, Switzerland, Italy, and Australia.
The Fund trailed the EAFE Index for the six-month period by less than one percentage point. Strong stock selection and overweightings to Spain and Finland buoyed performance. Spanish holdings Telefonica and Repsol YPF, an oil and gas company, were notable contributors. In Finland, capital equipment holding Metso, steelmaker Rautaruukki, and financial holding Sampo were the key drivers of positive return. German automaker Volkswagen and Air France-KLM were also top performers for the Fund.
On the other hand, stock selection in Japan, the Netherlands, and France was the greatest detractor from returns. An underweighting to Toyota Motor hampered performance among the Japanese stocks, as did growing positions in Pioneer and Mazda Motor and a lack of investment in Nippon Steel. In the Netherlands, the Fund did not hold top performing financial firm ABN-AMRO and steelmaker Arcelor Mittal, but did have a significant position in ING Group. News of weaker banking and insurance profits hobbled ING's stock price, while ABN-AMRO surged ahead amid reports that acquisition talks with Barclays were heating up.
Outlook
Looking ahead, we anticipate that the recent volatility in global markets will continue as several risk factors have come to the fore--particularly mounting inflationary pressures and slowing corporate profits, which pose concerns for sustained global growth. However, economic fundamentals remain solid in most countries and we expect that this will be reflected in the markets over the longer term. Valuations have leveled off, and there are fewer markets and asset classes that appear truly undervalued relative to the EAFE Index. We still are finding stock selection opportunities within individual markets, but overall we see global equity markets on a course for modest growth over the next three to six months as we await the impact of recent interest-rate increases, slowing housing markets, volatile oil prices, and potential geopolitical instability.
Our bottom-up stock selection process continues to favor Europe over Asia as European inflationary pressures remain low and the region's major economies show signs of steady economic growth. Moreover, continued progress in corporate restructuring and cost cutting through job relocations to Eastern Europe has resulted in increased profitability for many firms. Also, equity valuations are reasonable relative to other developed markets. While the longer-term outlook remains favorable, the stability of the euro and the region's future growth will be dependent upon the direction of the U.S. currency and economy.
Currently, Ireland, Belgium, and the Netherlands are among the highest-ranked European markets in our process. In these countries, we anticipate outperformance from a number of sectors, including Capital Equipment, Finance, and Banking. Switzerland and Portugal are less attractive markets to us. In the Asia-Pacific region, we believe Hong Kong has the most positive outlook--with the Capital Equipment, Utilities, and Finance sectors having the most potential to outperform in this market. But Japan's short-term forecast remains negative, although we believe this broad and rich market still offers a large number of individual stocks that are far more attractive than the market as a whole.
While emerging markets experienced some volatility during the first quarter of 2007 after China's one-day decline, in our view this type of market event is not unusual for the asset class and did not derail its strong future prospects. Many emerging markets--such as Venezuela, Columbia and Argentina--are positively ranked within our framework, as risk concerns have been tempered by robust economic activity, relatively low global interest rates, and solid corporate profits.
April 2007
1 As represented by the MSCI Emerging Markets Index for the six-month period ending March 31, 2007.
2. Investments in the U.S. cannot exceed 5% of the Fund's holdings.
As of March 31, 2007, the following companies represented the following percentages of Fund net assets: Telefonica 2.54%, Repsol YPF 0.00%, Metso 1.30%, Rautaruukki1.06%, Sampo 0.00%, Volkswagen 3.18%, Air France-KLM 1.97%, Toyota Motor 1.77%, Pioneer 0.00%, Mazda Motor 0.83%, Nippon Steel 0.00%, ABN-AMRO 0.00%, Arcelor Mittal 0.00%, ING Group 3.46%, and Barclays 0.72%. All portfolio holdings are subject to change without notice.
Performance Comparison
Comparison of change in value of $10,000 investment.
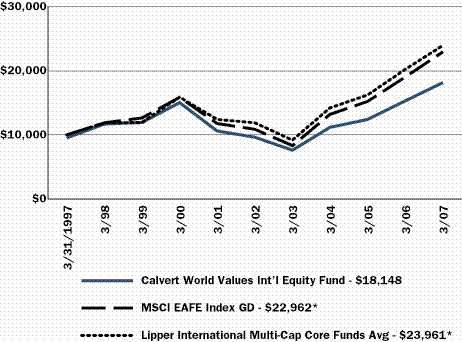
Average annual total returns in the Portfolio Statistics above and the Performance Comparison line graph are with maximum load deducted -- they assume reinvestment of dividends and reflect the deduction of the Fund's Class A maximum front-end sales charge of 4.75%, or deferred sales charge, as applicable. No sales charge has been applied to the index used for comparison. However, the Lipper average does reflect the deduction of the category's average front-end sales charge. The value of an investment in Class A shares is plotted in the line graph. The value of an investment in another class of shares would be different. New subadvisor assumed management of the Fund effective March 2006, and previously in March 2002. The graph and table do not reflect the deduction of taxes that a shareholder would pay on the Fund's distributions or the redemption of Fund shares. Past performance is no guarantee of future results.
*Source: Lipper Analytical Services, Inc.
Portfolio Statistics | | | |
March 31, 2007 | | | |
| | | | |
Investment Performance | | | |
(total return at NAV*) | | | |
| | | | |
| | 6 Months | 12 Months | |
| | ended | ended | |
| | 3/31/07 | 3/31/07 | |
Class A | 14.06% | 18.63% | |
Class B | 13.51% | 17.49% | |
Class C | 13.62% | 17.64% | |
Class I | 14.42% | 19.40% | |
MSCI EAFE Index** | 14.98% | 20.69% | |
Lipper International Multi-Cap Core Funds Avg** | 14.34% | 17.96% | |
| | | | |
Ten Largest Stock Holdings | | | |
| | % of Net Assets | | |
BNP Paribas SA | 3.6% | | |
ING Groep NV (CVA) | 3.5% | | |
Societe Generale Groupe | 3.4% | | |
BT Group plc | 3.2% | | |
Volkswagen AG | 3.2% | | |
Canon, Inc. | 2.8% | | |
Telefonica SA | 2.5% | | |
Royal Bank of Scotland Group plc | 2.3% | | |
Deutsche Bank AG | 2.3% | | |
Muenchener Rueckversicherungs AG | 2.3% | | |
Total | 29.1% | | |
| | | | |
*Investment performance/return at NAV does not reflect the deduction of the Fund's maximum 4.75% front-end sales charge or any deferred sales charge. ** Source: Lipper Analytical Services, Inc. |
Portfolio Statistics | | | |
March 31, 2007 | | | |
| | | | |
Average Annual Total Returns | | | |
(with max. load) | | | |
| | | | |
| | Class A Shares | | |
One year | 13.02% | | |
Five year | 12.41% | | |
Ten year | 6.14% | | |
| | | | |
| | Class B Shares | | |
One year | 12.49% | | |
Five year | 11.94% | | |
Since inception | 3.77% | | |
(3/31/98) | | | |
| | | | |
| | Class C Shares | | |
One year | 16.64% | | |
Five year | 12.47% | | |
Ten year | 5.65% | | |
| | | | |
Portfolio Statistics | | | |
March 31, 2007 | | | |
| | | | |
Average Annual Total Returns | | | |
| | | | |
| | Class I Shares | | |
One year | 19.40% | | |
Five year | 14.42% | | |
Since inception | 6.63% | | |
(2/26/99) | | | |
| | | | |
| | | | |
Portfolio Statistics | | | |
| | | | |
Economic Sectors | % of Total Investments | | |
Consumer Discretionary | 11.3% | | |
Consumer Staples | 2.9% | | |
Energy | 3.2% | | |
Financials | 36.7% | | |
Health Care | 3.2% | | |
Industrials | 13.4% | | |
Information Technology | 7.4% | | |
Limited Partnership Interest | 0.4% | | |
Materials | 8.1% | | |
Telecommunication Services | 10.2% | | |
U.S. Government Agencies and Instrumentalities | 0.4% | | |
Utilities | 2.5% | | |
Venture Capital | 0.3% | | |
| | 100.0% | | |
Shareholder Expense Example
As a shareholder of the Fund, you incur two types of costs: (1) transaction costs, including sales charges (loads) and redemption fees; and (2) ongoing costs, including management fees; distribution (12b-1) fees; and other Fund expenses. This Example is intended to help you understand your ongoing costs (in dollars) of investing in the Fund and to compare these costs with the ongoing costs of investing in other mutual funds.
This Example is based on an investment of $1,000 invested at the beginning of the period and held for the entire period (October 1, 2006 to March 31, 2007).
Actual Expenses
The first line of the table below provides information about actual account values and actual expenses. You may use the information in this line, together with the amount you invested, to estimate the expenses that you paid over the period. Simply divide your account value by $1,000 (for example, an $8,600 account value divided by $1,000 = 8.6), then multiply the result by the number in the first line under the heading entitled "Expenses Paid During Period" to estimate the expenses you paid on your account during this period.
Hypothetical Example for Comparison Purposes
The second line of the table below provides information about hypothetical account values and hypothetical expenses based on the Fund's actual expense ratio and an assumed rate of return of 5% per year before expenses, which is not the Fund's actual return. The hypothetical account values and expenses may not be used to estimate the actual ending account balance or expenses you paid for the period. You may use this information to compare the ongoing costs of investing in the Fund and other funds. To do so, compare the 5% hypothetical example with the 5% hypothetical examples that appear in the shareholder reports of the other funds.
Please note that the expenses shown in the table are meant to highlight your ongoing costs only and do not reflect any transactional costs, such as sales charges (loads) or redemption fees. Therefore, the second line of the table is useful in comparing ongoing costs only, and will not help you determine the relative total costs of owning different funds. In addition, if these transactional costs were included, your costs would have been higher.
| | Beginning | Ending Account | Expenses Paid |
| | Account Value | Value | During Period* |
| | 10/1/06 | 3/31/07 | 10/1/06 - 3/31/07 |
Class A | | | |
Actual | $1,000.00 | $1,140.60 | $8.62 |
Hypothetical | $1,000.00 | $1,016.87 | $8.13 |
(5% return per year before expenses) | | | |
Class B | | | |
Actual | $1,000.00 | $1,135.60 | $13.68 |
Hypothetical | $1,000.00 | $1,012.12 | $12.89 |
(5% return per year before expenses) | | | |
Class C | | | |
Actual | $1,000.00 | $1,136.20 | $12.91 |
Hypothetical | $1,000.00 | $1,012.84 | $12.17 |
(5% return per year before expenses) | | | |
Class I | | | |
Actual | $1,000.00 | $1,144.20 | $5.22 |
Hypothetical | $1,000.00 | $1,020.06 | $4.92 |
(5% return per year before expenses) | | | |
* Expenses are equal to the Fund's annualized expense ratio of 1.62%, 2.57%, 2.42% and 0.98% for Class A, Class B, Class C and Class I, respectively, multiplied by the average account value over the period, multiplied by 182/365.
Statement of Net Assets
March 31, 2007
EQUITY SECURITIES - 97.6% | | Shares | Value | |
Australia - 3.9% | | | | |
Amcor Ltd. | | 121,837 | $745,462 | |
Australia & New Zealand Banking Group Ltd. | | 315,437 | 7,592,213 | |
BlueScope Steel Ltd. | | 424,579 | 3,612,826 | |
Commonwealth Bank of Australia Ltd. | | 23,586 | 960,674 | |
CSL Ltd. | | 29,095 | 1,942,168 | |
Origin Energy Ltd. | | 76,086 | 555,557 | |
QBE Insurance Group Ltd. | | 301,986 | 7,718,764 | |
Santos Ltd. | | 578,237 | 4,756,321 | |
| | | | 27,883,985 | |
| | | | | |
Austria - 1.5% | | | | |
Voestalpine AG | | 147,629 | 10,720,946 | |
| | | | | |
Belgium - 2.4% | | | | |
Colruyt SA | | 6,708 | 1,536,871 | |
Delhaize Group | | 32,453 | 2,986,538 | |
Dexia | | 132,557 | 3,960,476 | |
Fortis SA/NV | | 148,378 | 6,782,709 | |
KBC Groep NV | | 14,925 | 1,858,541 | |
| | | | 17,125,135 | |
| | | | | |
Canada - 2.0% | | | | |
IPSCO, Inc. | | 31,502 | 4,140,973 | |
Teck Cominco Ltd., Class B | | 144,894 | 10,115,811 | |
| | | | 14,256,784 | |
| | | | | |
Denmark - 0.1% | | | | |
Topdanmark A/S* | | 2,850 | 552,440 | |
| | | | | |
Finland - 2.7% | | | | |
Kesko Oyj, Class B | | 39,400 | 2,104,055 | |
Metso Oyj | | 174,433 | 9,226,494 | |
Rautaruukki Oyj | | 160,549 | 7,491,524 | |
| | | | 18,822,073 | |
| | | | | |
France - 11.3% | | | | |
Air France-KLM | | 306,317 | 13,990,183 | |
AXA SA | | 52,160 | 2,214,145 | |
BNP Paribas SA | | 242,176 | 25,324,676 | |
Cap Gemini SA | | 45,257 | 3,449,419 | |
CNP Assurances SA | | 9,446 | 1,101,353 | |
Credit Agricole SA | | 194,065 | 7,576,051 | |
Lafarge SA | | 14,755 | 2,322,418 | |
Societe Generale Groupe | | 138,136 | 23,900,228 | |
| | | | 79,878,473 | |
| | | | | |
| | | | | |
EQUITY SECURITIES - Cont'd | | Shares | Value | |
Germany - 8.9% | | | | |
Allianz SE | | 25,806 | $5,304,988 | |
Beiersdorf AG | | 39,501 | 2,696,904 | |
Deutsche Bank AG | | 120,539 | 16,256,311 | |
Muenchener Rueckversicherungs AG | | 95,866 | 16,232,828 | |
ProSiebenSat.1 Media AG, Preferred | | 8,690 | 307,170 | |
Volkswagen AG | | 149,850 | 22,546,070 | |
| | | | 63,344,271 | |
| | | | | |
Greece - 0.3% | | | | |
Alpha Bank AE | | 10,536 | 333,953 | |
National Bank of Greece SA | | 33,005 | 1,752,394 | |
| | | | 2,086,347 | |
| | | | | |
Hungary - 0.1% | | | | |
OTP Bank Nyrt | | 16,378 | 750,070 | |
| | | | | |
Israel - 0.0% | | | | |
Check Point Software Technologies, Inc.* | | 7,630 | 169,996 | |
| | | | | |
Italy - 0.7% | | | | |
Banca Popolare di Milano SCRL | | 34,298 | 531,635 | |
Banco Popolare di Verona e Novara SCRL | | 144,252 | 4,485,454 | |
| | | | 5,017,089 | |
| | | | | |
Japan - 18.3% | | | | |
Amada Co. Ltd. | | 138,000 | 1,581,134 | |
Brother Industries Ltd. | | 322,000 | 4,371,301 | |
Canon, Inc. | | 364,500 | 19,625,611 | |
Central Japan Railway Co. | | 1,093 | 12,457,959 | |
East Japan Railway Co. | | 598 | 4,669,451 | |
Eisai Co. Ltd. | | 78,000 | 3,748,565 | |
FUJIFILM Holdings Corp. | | 52,800 | 2,164,726 | |
Fujikura Ltd. | | 599,000 | 4,233,990 | |
Haseko Corp. | | 41,500 | 151,788 | |
Honda Motor Co. Ltd. | | 40,300 | 1,408,863 | |
KDDI Corp. | | 1,037 | 8,300,234 | |
Konami Corp. | | 17,500 | 468,889 | |
Mazda Motor Corp. | | 1,064,067 | 5,901,175 | |
Mitsubishi Chemical Holdings Corp. | | 359,000 | 3,062,791 | |
Mitsubishi Gas Chemical Co., Inc. | | 105,000 | 1,009,229 | |
Mitsui OSK Lines Ltd. | | 576,000 | 6,408,438 | |
NGK Spark Plug Co. Ltd. | | 35,000 | 656,445 | |
Nikon Corp. | | 508,000 | 10,737,719 | |
Nisshin Steel Co. Ltd. | | 693,000 | 2,994,463 | |
NSK Ltd. | | 87,000 | 831,778 | |
NTT Data Corp. | | 1,022 | 5,207,145 | |
Olympus Corp. | | 52,000 | 1,782,503 | |
Santen Pharmaceutical Co. Ltd. | | 600 | 15,464 | |
SBI Holdings, Inc. | | 15,883 | 6,038,958 | |
Stanley Electric Co. Ltd. | | 20,400 | 415,583 | |
Suzuken Co. Ltd. | | 9,900 | 351,993 | |
Taiheiyo Cement Corp. | | 191,000 | 846,434 | |
Tokyo Electron Ltd. | | 7 | 491 | |
| | | | | |
| | | | | |
EQUITY SECURITIES - Cont'd | | Shares | Value | |
Japan - Cont'd | | | | |
Tokyo Gas Co. Ltd. | | 748,000 | $4,180,122 | |
Toyo Seikan Kaisha Ltd. | | 84,200 | 1,700,974 | |
Toyota Motor Corp. | | 195,600 | 12,561,392 | |
Yamaha Motor Co. Ltd. | | 74,700 | 2,096,797 | |
| | | | 129,982,405 | |
| | | | | |
Mexico - 0.0% | | | | |
Empresas ESM, Contingent Deferred Distribution (b)(i)* | | 350,000 | 87,500 | |
| | | | | |
Netherlands - 4.1% | | | | |
ASML Holding NV* | | 56,259 | 1,391,203 | |
ING Groep NV (CVA) (s) | | 579,781 | 24,541,397 | |
Koninklijke KPN NV | | 127,563 | 1,989,229 | |
TNT NV | | 20,471 | 939,884 | |
| | | | 28,861,713 | |
| | | | | |
Norway - 2.0% | | | | |
Orkla ASA | | 26,220 | 1,848,393 | |
Petroleum Geo-Services ASA* | | 150,850 | 3,939,760 | |
Statoil ASA | | 311,200 | 8,473,216 | |
| | | | 14,261,369 | |
| | | | | |
South Africa - 1.3% | | | | |
BIDVest Group Ltd. | | 52,485 | 994,153 | |
Community Growth Fund* | | 894,098 | 926,757 | |
FirstRand Ltd. | | 324,832 | 1,096,893 | |
Investec Ltd. | | 42,935 | 549,874 | |
MTN Group Ltd. | | 62,674 | 847,411 | |
Pick'n Pay Holdings Ltd. | | 61,200 | 121,392 | |
Pick'n Pay Stores Ltd. | | 25,371 | 119,733 | |
Spar Group Ltd. | | 33,000 | 226,040 | |
Telkom South Africa Ltd. | | 174,048 | 3,965,953 | |
Tiger Brands Ltd. | | 15,778 | 383,350 | |
VenFin Ltd. | | 55,800 | 157,787 | |
| | | | 9,389,343 | |
| | | | | |
South Korea - 3.3% | | | | |
Kookmin Bank (ADR) | | 90,100 | 8,122,515 | |
KT Corp. (ADR) | | 669,500 | 14,990,105 | |
| | | | 23,112,620 | |
| | | | | |
Spain - 4.9% | | | | |
Actividades de Construccion y Servicios SA | | 83,388 | 5,068,729 | |
Banco Bilbao Vizcaya Argentaria SA | | 402,186 | 9,886,306 | |
Gas Natural SDG SA | | 22,040 | 1,036,092 | |
Iberia Lineas Aereas de Espana | | 112,618 | 600,955 | |
Telefonica SA | | 817,521 | 18,040,329 | |
| | | | 34,632,411 | |
| | | | | |
| | | | | |
EQUITY SECURITIES - Cont'd | | Shares | Value | |
Sweden - 1.4% | | | | |
Nordea Bank AB | | 5,100 | $81,411 | |
Skandinaviska Enskilda Banken AB | | 47,600 | 1,523,075 | |
SKF AB | | 17,827 | 370,707 | |
SSAB Svenskt Stal AB | | 138,911 | 4,285,688 | |
Svenska Handelsbanken AB | | 127,400 | 3,784,637 | |
| | | | 10,045,518 | |
| | | | | |
Switzerland - 3.2% | | | | |
Credit Suisse Group | | 115,821 | 8,328,873 | |
Geberit AG | | 2,002 | 3,087,366 | |
Roche Holding AG | | 36,236 | 6,424,823 | |
Swatch Group AG | | 3,055 | 809,351 | |
Swiss Reinsurance Group | | 11,319 | 1,036,128 | |
Zurich Financial Services AG | | 10,237 | 2,961,098 | |
| | | | 22,647,639 | |
| | | | | |
Taiwan - 2.3% | | | | |
Taiwan Semiconductor Manufacturing Co. Ltd. (ADR) | | 1,202,205 | 12,923,704 | |
United Microelectronics Corp. (ADR) | | 1,079,800 | 3,433,764 | |
| | | | 16,357,468 | |
| | | | | |
United Kingdom - 18.1% | | | | |
Aegis Group plc | | 446,172 | 1,317,401 | |
Alliance Boots plc | | 116,356 | 2,351,105 | |
Amvescap plc | | 231,183 | 2,548,404 | |
Aviva plc | | 341,933 | 5,037,988 | |
Barclays plc | | 360,574 | 5,117,454 | |
Barratt Developments plc | | 29,130 | 633,617 | |
BG Group plc | | 201,954 | 2,913,941 | |
British Airways plc* | | 998,723 | 9,554,449 | |
British Land Co plc | | 68,790 | 2,069,059 | |
BT Group plc | | 3,867,979 | 23,127,288 | |
Centrica plc | | 619,567 | 4,713,702 | |
DSG International plc | | 720,418 | 2,410,781 | |
FirstGroup plc | | 37,796 | 494,385 | |
GlaxoSmithKline plc | | 55,004 | 1,512,568 | |
Hays plc | | 318,137 | 981,626 | |
HBOS plc | | 345,006 | 7,110,459 | |
IMI plc | | 159,209 | 1,817,690 | |
International Power plc | | 201,191 | 1,570,276 | |
J Sainsbury plc | | 199,611 | 2,159,119 | |
Kelda Group plc | | 55,387 | 1,022,669 | |
Lloyds TSB Group plc | | 214,762 | 2,367,390 | |
Man Group plc | | 627,984 | 6,860,660 | |
Marks and Spencer Group plc | | 565,711 | 7,533,326 | |
Michael Page International plc | | 52,887 | 557,484 | |
Next Group plc | | 101,578 | 4,496,902 | |
Northern Foods plc | | 679,817 | 1,656,005 | |
Persimmon plc | | 61,871 | 1,712,367 | |
Reckitt Benckiser plc | | 33,537 | 1,746,781 | |
Royal Bank of Scotland Group plc | | 428,913 | 16,750,786 | |
Scottish & Southern Energy plc | | 118,360 | 3,590,310 | |
Tate & Lyle plc | | 194,843 | 2,205,347 | |
United Utilities plc | | 56,601 | 841,750 | |
| | | | 128,783,089 | |
| | | | | |
EQUITY SECURITIES - Cont'd | | Shares | Value | |
United States - 4.8% | | | | |
AGL Resources, Inc. | | 6,700 | $286,224 | |
AmerisourceBergen Corp. | | 78,822 | 4,157,861 | |
Big Lots, Inc.* | | 19,100 | 597,448 | |
Biogen Idec, Inc.* | | 42,000 | 1,863,960 | |
Continental Airlines, Inc., Class B* | | 131,400 | 4,781,646 | |
Cummins, Inc. | | 14,200 | 2,055,024 | |
Distributed Energy Systems Corp.* | | 308,137 | 422,148 | |
Dollar Tree Stores, Inc.* | | 12,700 | 485,648 | |
Evergreen Solar, Inc.* | | 1,400 | 13,650 | |
FirstFed Financial Corp.* | | 7,600 | 431,908 | |
Global Payments, Inc. | | 12,700 | 432,562 | |
GNet Defta Development Holdings LLC (a)(b)(i)* | | 400,000 | 400,000 | |
H2Gen Innovations, Inc.: | | | | |
Common Stock (b)(i)* | | 2,077 | - | |
Common Warrants (strike price $1.00/share, expires | | | | |
10/31/13) (b)(i)* | | 27,025 | - | |
Series A Preferred (b)(i)* | | 69,033 | 111,143 | |
Series A Preferred, Warrants (strike price $1.00/share, expires | | | | |
10/10/12) (b)(i)* | | 1,104 | 673 | |
Series B Preferred (b)(i)* | | 161,759 | 260,432 | |
Series C Preferred (b)(i)* | | 36,984 | 59,544 | |
Komag, Inc.* | | 9,500 | 310,935 | |
Mayer Laboratories, Inc. Warrants (strike price $6.50/share, | | | | |
expires 12/31/07) (b)(i)* | | 11,538 | - | |
McKesson Corp. | | 13,600 | 796,144 | |
NiSource, Inc. | | 6,100 | 149,084 | |
NVR, Inc.* | | 400 | 266,000 | |
OGE Energy Corp. | | 4,000 | 155,200 | |
Parker Hannifin Corp. | | 15,200 | 1,311,912 | |
Powerspan Corp.: | | | | |
Series A, Preferred (b)(i)* | | 45,455 | 140,136 | |
Series B, Preferred (b)(i)* | | 20,000 | 73,964 | |
Series C, Preferred (b)(i)* | | 239,566 | 299,458 | |
Series C, Preferred, Warrants (strike price $1.14/share, expires | | | | |
6/30/08) (b)(i)* | | 198 | 22 | |
Reliance Steel & Aluminum Co. | | 83,900 | 4,060,760 | |
RF Technology, Inc. (b)(i)* | | 365,374 | - | |
Ryder System, Inc. | | 2,100 | 103,614 | |
Safeco Corp. | | 3,600 | 239,148 | |
SMARTTHINKING, Inc.: | | | | |
Series 1-A, Preferred (b)(i)* | | 104,297 | 172,388 | |
Series 1-B, Preferred (b)(i)* | | 163,588 | 31,050 | |
Series 1-B, Preferred Warrants (strike price $0.01/share, expires | | | | |
5/26/15) (b)(i)* | | 11,920 | 2,143 | |
Superior Energy Services, Inc.* | | 9,900 | 341,253 | |
TEREX Corp.* | | 68,900 | 4,944,264 | |
Tidewater, Inc. | | 26,100 | 1,528,938 | |
Unit Corp.* | | 2,500 | 126,475 | |
| | | | | |
EQUITY SECURITIES - Cont'd | | Shares | Value | |
United States - Cont'd | | | | |
US Airways Group, Inc.* | | 17,400 | $791,352 | |
WR Berkley Corp. | | 46,500 | 1,540,080 | |
| | | | 33,744,191 | |
| | | | | |
Total Equity Securities (Cost $578,460,984) | | | 692,512,875 | |
| | | | | |
| | | Adjusted | | |
Limited Partnership Interest - 0.4% | | Basis | | |
Balkan Financial Sector Equity Fund CV (b)(i)* | | $91,698 | 51,838 | |
China Environment Fund 2004 (b)(i)* | | 200,078 | 177,675 | |
SAM Sustainability Private Equity Fund (b)(i)* | | 991,813 | 839,645 | |
SEAF Central and Eastern European Growth Fund LLC (a)(b)(i)* | | 610,414 | 616,530 | |
SEAF India International Growth Fund LLC (b)(i)* | | 298,932 | 285,922 | |
ShoreCap International (b)(i)* | | 564,465 | 714,734 | |
Terra Capital Investors, Ltd. (b)(i)* | | 469,590 | 1 | |
| | | | | |
Total Limited Partnership Interest (Cost $3,226,990) | | | 2,686,345 | |
| | | | | |
| | | Principal | | |
Corporate Notes - 0.0% | | Amount | | |
Mayer Laboratories, Inc., 6.00%, 12/31/10 (b)(i) | | 86,225 | 21,556 | |
| | | | | |
| | | | | |
Total Corporate Notes (Cost $86,225) | | | 21,556 | |
| | | | | |
| | | | | |
Certificates of Deposit - 0.0% | | | | |
Self Help Credit Union, 5.10%, 2/22/08 (b)(k) | | 100,000 | 99,580 | |
ShoreBank & Trust Co., 4.80%, 3/15/08 (b)(k) | | 100,000 | 99,610 | |
| | | | | |
Total Certificates of Deposit (Cost $200,000) | | | 199,190 | |
| | | | | |
| | | | | |
High Social Impact Investments - 0.6% | | | | |
Calvert Social Investment Foundation Notes, 3.00%, 7/1/08 (b)(i)(r) | | 4,431,583 | 4,361,741 | |
| | | | | |
Total High Social Impact Investments (Cost $4,431,583) | | | 4,361,741 | |
| | | | | |
| | | | | |
U.S. Government Agencies and Instrumentalities - 0.4% | | | | |
Federal Home Loan Bank Discount Notes, 4/2/07 | | 3,000,000 | 2,999,583 | |
| | | | | |
Total U.S. Government Agencies and Instrumentalities (Cost $2,999,583) | | | 2,999,583 | |
| | | | | |
TOTAL INVESTMENTS (Cost $589,405,365) - 99.0% | | | 702,781,290 | |
Other assets and liabilities, net - 1.0% | | | 6,951,340 | |
Net Assets - 100% | | | $709,732,630 | |
| | | | | |
| | | | | |
Net Assets Consist of: | | | | |
Paid-in capital applicable to the following shares of common stock with 250,000,000 shares of $0.01 par value share authorized: | | | | |
Class A: 20,345,523 shares outstanding | | | $379,028,159 | |
Class B: 1,006,752 shares outstanding | | | 18,864,229 | |
Class C: 2,049,915 shares outstanding | | | 37,476,958 | |
Class I: 6,191,639 shares outstanding | | | 131,363,823 | |
Undistributed net investment income (loss) | | | (946,647) | |
Accumulated net realized gain (loss) on investments | | | 30,510,596 | |
Net unrealized appreciation (depreciation) on investments | | | 113,435,512 | |
Net Assets | | | $709,732,630 | |
| | | | | |
| | | | | |
Net Asset Value Per Share | | | | |
Class A (based on net assets of $487,425,415) | | | $23.96 | |
Class B (based on net assets of $21,896,882) | | | $21.75 | |
Class C (based on net assets of $43,394,910) | | | $21.17 | |
Class I (based on net assets of $157,015,423) | | | $25.36 | |
Abbreviations:
ADR: American Depositary Receipt
CVA: Certificaten Van Aandelen
LLC: Limited Liability Corporation
LP: Limited Partnership
* Non-income producing security.
(a) Affiliated company.
(b) This security was valued by the Board of Directors. See Note A.
(i) Restricted securities represent 1.2% of net assets of the Fund.
(k) These certificates of deposit are fully insured by agencies of the federal government.
(r) The coupon rate shown on floating or adjustable rate securities represents the rate period end.
(s) 114,000 shares of ING Groep NV have been soft segregated in order to cover outstanding commitments to certain limited partnership investments within the Fund. There are no restrictions on the trading of this security.
See notes to financial statements.
Restricted Securities | | Acquisition Dates | Cost |
Balkan Financial Sector Equity Fund CV, LP | | 1/12/06 - 3/7/07 | $91,698 |
Calvert Social Investment Foundation Notes, 3.00%, 7/1/08 | | 7/1/05-7/3/06 | 4,431,583 |
China Environment Fund 2004, LP | | 9/15/05 - 1/16/07 | 200,078 |
Empresas ESM, Contingent Deferred Distribution | | 11/2/06 | 350,000 |
GNet Defta Development Holdings LLC | | 8/30/05 | 400,000 |
H2Gen Innovations, Inc.: | | | |
Common Stock | | 11/4/04 | - |
Common Warrants (strike price $1.00/share, expires 10/31/13) | | 11/4/04 | - |
Series A, Preferred | | 11/4/04 | 251,496 |
Series A, Preferred Warrants (strike price $1.00/share, | | | |
expires 10/10/12) | | 11/4/04 | - |
Series B, Preferred | | 10/21/04-10/27/04 | 161,759 |
Series C, Preferred | | 6/1/06 | 52,886 |
Mayer Laboratories, Inc.: | | | |
Note, 6.00%, 12/31/10 | | 12/31/96 | 86,225 |
Warrants (strike price $6.50/share, expires 12/31/07) | | 1/21/03 | - |
Powerspan Corp: | | | |
Series A, Preferred | | 8/20/97 | 250,000 |
Series B, Preferred | | 10/05/99 | 200,000 |
Series C, Preferred | | 12/21/04 | 273,105 |
Series C, Preferred Warrants (strike price $1.14/share, | | | |
expires 6/30/08) | | 12/21/04 | - |
RF Technology, Inc. | | 7/17/06 | 299,990 |
SAM Sustainability Private Equity Fund, LP | | 7/19/01 - 2/12/07 | 991,813 |
SEAF Central & Eastern European Growth Fund LLC, LP | | 8/10/00 - 2/23/06 | 610,414 |
SEAF India International Growth Fund LLC, LP | | 3/22/05 - 3/29/07 | 298,932 |
ShoreCap International LP | | 8/12/04 - 12/19/06 | 564,465 |
SMARTHINKING, Inc.: | | | |
Series 1-A, Preferred | | 4/22/03 - 5/27/05 | 159,398 |
Series 1-B, Preferred | | 6/10/03 | 250,000 |
Series 1-B, Preferred Warrants (strike price $0.01/share, | | | |
expires 5/26/15) | | 5/27/05 | - |
Terra Capital Investors, Ltd., LP | | 11/23/98 - 3/14/06 | 469,590 |
See notes to financial statements.
Statement of Operations
Six Months Ended March 31, 2007
Net Investment Income | | | |
Investment Income: | | | |
Dividend income (net of foreign taxes withheld of $282,086) | | $4,197,250 | |
Interest income | | 213,774 | |
Total investment income | | 4,411,024 | |
| | | | |
Expenses: | | | |
Investment advisory fee | | 2,329,873 | |
Transfer agency fees and expenses | | 519,207 | |
Administrative fees | | 986,451 | |
Distribution Plan expenses: | | | |
Class A | | 556,540 | |
Class B | | 100,135 | |
Class C | | 190,351 | |
Directors' fees and expenses | | 46,820 | |
Custodian fees | | 172,043 | |
Registration fees | | 33,665 | |
Reports to shareholders | | 87,991 | |
Professional fees | | 20,317 | |
Miscellaneous | | 47,124 | |
Total expenses | | 5,090,517 | |
Fees waived | | (67,548) | |
Fees paid indirectly | | (19,032) | |
Net expenses | | 5,003,937 | |
| | | | |
Net Investment Income (Loss) | | (592,913) | |
| | | | |
Realized and Unrealized Gain (Loss) | | | |
Net realized gain (loss) on: | | | |
Investments (net of foreign taxes of $21,359) | | 33,008,889 | |
Foreign currency transactions | | (32,638) | |
| | | 32,976,251 | |
| | | | |
Change in unrealized appreciation or (depreciation) on: | | | |
Investments and foreign currencies | | 50,432,433 | |
Assets and liabilities denominated in foreign currencies | | 30,334 | |
| | | 50,462,767 | |
| | | | |
Net Realized and Unrealized Gain | | | |
(Loss) | | 83,439,018 | |
| | | | |
Increase (Decrease) in Net Assets | | | |
Resulting From Operations | | $82,846,105 | |
See notes to financial statements.
Statements of Changes in Net Assets
| | | Six Months Ended | Year Ended | |
| | | March 31, | September 30, | |
Increase (Decrease) in Net Assets | | 2007 | 2006 | |
Operations: | | | | |
Net investment income (loss) | | ($592,913) | $6,253,989 | |
Net realized gain (loss) | | 32,976,251 | 75,344,484 | |
Change in unrealized appreciation or (depreciation) | | 50,462,767 | 1,954,368 | |
| | | | | |
Increase (Decrease) in Net Assets | | | | |
Resulting From Operations | | 82,846,105 | 83,552,841 | |
| | | | | |
Distributions to shareholders from | | | | |
Net investment income: | | | | |
Class A Shares | | (3,839,925) | (2,476,921) | |
Class B Shares | | -- | (3,122) | |
Class C Shares | | (43,253) | (34,850) | |
Class I Shares | | (1,999,002) | (1,133,678) | |
Net realized gain: | | | | |
Class A Shares | | (49,878,813) | -- | |
Class B Shares | | (2,464,859) | -- | |
Class C Shares | | (4,748,481) | -- | |
Class I Shares | | (14,709,871) | -- | |
Total distributions | | (77,684,204) | (3,648,571) | |
| | | | | |
Capital share transactions: | | | | |
Shares sold: | | | | |
Class A Shares | | 66,911,066 | 99,342,871 | |
Class B Shares | | 3,387,776 | 4,536,918 | |
Class C Shares | | 9,469,947 | 10,050,927 | |
Class I Shares | | 27,982,431 | 28,336,667 | |
Reinvestment of distributions: | | | | |
Class A Shares | | 49,826,720 | 2,262,214 | |
Class B Shares | | 2,199,188 | 2,808 | |
Class C Shares | | 3,734,137 | 28,264 | |
Class I Shares | | 16,187,946 | 1,061,407 | |
Redemption fees: | | | | |
Class A Shares | | 1,968 | 7,796 | |
Class B Shares | | 103 | 854 | |
Class C Shares | | 50 | 929 | |
Shares redeemed: | | | | |
Class A Shares | | (34,007,064) | (52,386,543) | |
Class B Shares | | (1,758,816) | (3,257,865) | |
Class C Shares | | (2,431,238) | (4,596,259) | |
Class I Shares | | (13,101,212) | (13,339,845) | |
Total capital share transactions | | 128,403,002 | 72,051,143 | |
| | | | | |
Total Increase (Decrease) in Net Assets | | 133,564,903 | 151,955,413 | |
| | | | | |
| | | | | |
Net Assets | | | | |
Beginning of period | | 576,167,727 | 424,212,314 | |
End of period (including distributions in excess of net investment income and undistributed net investment income of ($946,647) and $5,528,446, respectively) | | $709,732,630 | $576,167,727 | |
See notes to financial statements.
Statements of Changes in Net Assets
| | | Six Months Ended | Year Ended | |
| | | March 31, | September 30, | |
Capital Share Activity | | 2007 | 2005 | |
Shares sold: | | | | |
Class A Shares | | 2,809,306 | 3,970,828 | |
Class B Shares | | 155,697 | 242,353 | |
Class C Shares | | 448,636 | 474,886 | |
Class I Shares | | 1,118,197 | 1,830,778 | |
Reinvestment of distributions: | | | | |
Class A Shares | | 2,150,893 | 70,565 | |
Class B Shares | | 105,224 | -- | |
Class C Shares | | 183,379 | -- | |
Class I Shares | | 657,997 | 36,599 | |
Shares redeemed: | | | | |
Class A Shares | | (1,422,473) | (2,261,560) | |
Class B Shares | | (80,480) | (61,753) | |
Class C Shares | | (115,246) | (192,016) | |
Class I Shares | | (521,014) | (421,387) | |
Total capital share activity | | 5,490,116 | 3,689,293 | |
See notes to financial statements.
Notes to Financial Statements
Note A -- Significant Accounting Policies
General: The Calvert World Values International Equity Fund (the "Fund"), a series of Calvert World Values Fund, Inc., is registered under the Investment Company Act of 1940 as a diversified, open-end management investment company. The operation of each series is accounted for separately. The Fund offers four classes of shares of capital stock. Class A shares are sold with a maximum front-end sales charge of 4.75%. Class B shares are sold without a front-end sales charge. With certain exceptions, the Fund will impose a deferred sales charge at the time of redemption, depending on how long investors have owned the shares. Class C shares are sold without a front-end sales charge. With certain exceptions, the Fund will impose a deferred sales charge on shares sold within one year of purchase. Class B and Class C shares have higher levels of expenses than Class A shares. Class I shares require a minimum account balance of $1,000,000. The $1 million minimum initial investment may be waived for certain institut ional accounts, where it is believed to be in the best interest of the Fund and its shareholders. Class I shares have no front-end or deferred sales charge and have lower levels of expenses than Class A shares. Each class has different: (a) dividend rates, due to differences in Distribution Plan expenses and other class-specific expenses, (b) exchange privileges and (c) class-specific voting rights.
Security Valuation: Net asset value per share is determined every business day as of the close of the regular session of the New York Stock Exchange (generally 4:00 p.m. Eastern time). The Fund uses independent pricing services approved by the Board of Directors to value its investments wherever possible. Securities for which market quotations are available are valued at last sale price or official closing price on the primary market or exchange in which they trade. Foreign securities are valued based on quotations from the principal market in which such securities are normally traded. If events occur after the close of the principal market in which foreign securities are traded, and before the Fund's net asset value is determined, that are expected to materially affect the value of those securities, then they are valued at their fair value taking these events into account. Short-term notes are stated at amortized cost, which approximates fair value. The Fund may invest in securities whose resale is subje ct to restrictions. Investments for which market quotations are not available or deemed not reliable are fair valued in good faith under the direction of the Board of Directors.
The Fund has retained a third party fair value pricing service to quantitatively analyze the price movement of its holdings on foreign exchanges and to automatically fair value if the variation from the prior day's closing price exceeds specified parameters.
In determining fair value, the Board considers all relevant qualitative and quantitative information available. These factors are subject to change over time and are reviewed periodically. The values assigned to fair value investments are based on available information and do not necessarily represent amounts that might ultimately be realized. Further, because of the inherent uncertainty of valuation, those estimated values may differ significantly from the values that would have been used had a ready market for the investments existed, and the differences could be material.
At March 31, 2007, securities valued at $8,907,285 or 1.3% of net assets, were fair valued in good faith under the direction of the Board of Directors.
Repurchase Agreements: The Fund may enter into repurchase agreements with recognized financial institutions or registered broker/dealers and, in all instances, holds underlying securities with a value exceeding the total repurchase price, including accrued interest. Although risk is mitigated by the collateral, the Fund could experience a delay in recovering its value and a possible loss of income or value if the counterparty fails to perform in accordance with the terms of the agreement.
Restricted Securities: The Fund may invest in securities that are subject to legal or contractual restrictions on resale. Generally, these securities may only be sold publicly upon registration under the Securities Act of 1933 or in transactions exempt from such registration. Information regarding restricted securities is included at the end of the Fund's Statement of Net Assets.
Security Transactions and Net Investment Income: Security transactions are accounted for on trade date. Realized gains and losses are recorded on an identified cost basis and may include proceeds from litigation. Dividend income is recorded on the ex-dividend date or, in the case of dividends on certain foreign securities, as soon as the Fund is informed of the ex-dividend date. Distributions received on securities that represent a return of capital or capital gain are recorded as a reduction of cost of investments and/or as a realized gain. Interest income, which includes amortization of premium and accretion of discount on debt securities, is accrued as earned. Investment income and realized and unrealized gains and losses are allocated to separate classes of shares based upon the relative net assets of each class. Expenses arising in connection with a class are charged directly to that class. Expenses common to the classes are allocated to each class in proportion to their relative net assets. Withhold ing taxes on foreign dividends have been provided for in accordance with the Fund's understanding of the applicable country's tax rules and rates.
Foreign Currency Transactions: The Fund's accounting records are maintained in U. S. dollars. For valuation of assets and liabilities on each date of net asset value determination, foreign denominations are converted into U.S. dollars using the current exchange rate. Security transactions, income and expenses are translated at the prevailing rate of exchange on the date of the event. The effect of changes in foreign exchange rates on securities and foreign currencies is included in the net realized and unrealized gain or loss on securities and foreign currencies.
Distributions to Shareholders: Distributions to shareholders are recorded by the Fund on ex-dividend date. Dividends from net investment income and distributions from
net realized capital gains, if any, are paid at least annually. Distributions are determined
in accordance with income tax regulations which may differ from generally accepted accounting principles; accordingly, periodic reclassifications are made within the Fund's capital accounts to reflect income and gains available for distribution under income
tax regulations.
Estimates: The preparation of the financial statements in conformity with accounting principles generally accepted in the United States requires management to make estimates and assumptions that affect the reported amounts of assets and liabilities and disclosure of contingent assets and liabilities at the date of the financial statements and the reported amounts of income and expenses during the reported period. Actual results could differ from those estimates.
Redemption Fees: The Fund charges a 2% redemption fee on redemptions, including exchanges, made within 30 days of purchase in the same Fund (within seven days for Class I shares). The redemption fee is paid to the Class of the Fund from which the redemption is made, and is accounted for as an addition to paid-in capital. The fee is intended to discourage market-timers by ensuring that short-term trading costs are borne by the investors making the transactions and not the shareholders already in the Fund.
Expense Offset Arrangement: The Fund has an arrangement with its custodian bank whereby the custodian's fees may be paid indirectly by credits earned on the Fund's cash on deposit with the bank. These credits are used to reduce the Fund's expenses. Such a deposit arrangement may be an alternative to overnight investments.
Federal Income Taxes: No provision for federal income or excise tax is required since the Fund intends to continue to qualify as a regulated investment company under the Internal Revenue Code and to distribute substantially all of its taxable earnings.
New Accounting Pronouncements: In July 2006, the Financial Accounting Standards Board (FASB) released FASB Interpretation No. 48 "Accounting for Uncertainty in Income Taxes" -- an interpretation of FASB Statement 109 (FIN 48). FIN 48 provides guidance for how uncertain tax positions should be recognized, measured, presented and disclosed in the financial statements. FIN 48 requires the evaluation of tax positions taken in the course of preparing the Fund's tax returns to determine whether tax positions are "more-likely-than-not" of being sustained by the applicable tax authority. Tax benefits of positions not deemed to meet the more-likely-than-not threshold would be recorded as a tax expense in the current year. Adoption of FIN 48 is required for fiscal years beginning after December 15, 2006 and is to be applied to all open tax years as of the effective date. At this time, management is evaluating the implications of FIN 48 and its impact in the financial statements has not yet been determined.
In September 2006, the Financial Accounting Standards Board (FASB) issued Statement on Financial Accounting Standards (SFAS) No. 157, "Fair Value Measurements." This standard establishes a single authoritative definition of fair value, sets out a framework for measuring fair value and requires additional disclosures about fair value measurements. SFAS No. 157 applies to fair value measurements already required or permitted by existing standards. SFAS No. 157 is effective for financial statements issued for fiscal years beginning after November 15, 2007 and interim periods within those fiscal years. The changes to current generally accepted accounting principles from the application of this Statement relate to the definition of fair value, the methods used to measure fair value, and the expanded disclosures about fair value measurements. As of March 31, 2007, the Fund does not believe the adoption of SFAS No. 157 will impact the financial statement amounts, however, additional disclosures may be requi red about the inputs used to develop the measurements and the effect of certain of the measurements on changes in net assets for the period.
Note B -- Related Party Transactions
Calvert Asset Management Company, Inc. (the "Advisor") is wholly-owned by Calvert Group, Ltd. ("Calvert"), which is indirectly wholly owned by UNIFI Mutual Holding Company. The Advisor provides investment advisory services and pays the salaries and fees of officers and Directors of the Fund who are employees of the Advisor or its affiliates. For its services, the Advisor receives a monthly fee based on the following annual rates of average daily net assets: .75% on the first $250 million, .725% on the next $250 million and .675% on the excess of $500 million. Under the terms of the agreement $406,447 was payable at period end. In addition, $144,059 was payable at period end for operating expenses paid by the Advisor during March 2007. For the six months ended March 31, 2007, the Advisor waived $67,548 of its fee.
The Advisor has contractually agreed to limit net annual fund operating expenses through January 31, 2008 for Class I. The contractual expense cap is 1.10%. For the purposes of this expense limit, operating expenses do not include interest expense, brokerage commissions, taxes, and extraordinary expenses. To the extent any expense offset credits are earned, the Advisor's obligation under the contractual limitation may be reduced and the Advisor may benefit from the expense offset arrangement.
Calvert Distributors, Inc., an affiliate of the Advisor, is the distributor and principal underwriter for the Fund. Distribution Plans, adopted by Class A, Class B and Class C shares, allow the Fund to pay the Distributor for expenses and services associated with distribution of shares. The expenses paid may not exceed .35%, 1.00% and 1.00% annually of average daily net assets of each Class A, Class B and Class C, respectively. The amount actually paid by the Fund, is an annualized fee, payable monthly of .25%, 1.00% and 1.00% of the Fund's average daily net assets of Class A, Class B and Class C, respectively. Class I shares do not have Distribution Plan expenses. Under the terms of agreement $153,458 was payable at period end.
The Distributor received $117,340 as its portion of commissions charged on sales of the Fund's Class A shares for the six months ended March 31, 2007.
Calvert Shareholder Services, Inc. ("CSSI"), an affiliate of the Advisor, is the shareholder servicing agent for the Fund. For its services, CSSI received a fee of $111,683 for the six months ended March 31, 2007. Under the terms of the agreement $18,951 was payable at period end. Boston Financial Data Services, Inc. is the transfer and dividend disbursing agent.
Calvert Administrative Services Company, an affiliate of the Advisor, provides administrative services to the Fund for an annual fee, payable monthly, of .35% for Class A, Class B and Class C shares and .15% for Class I shares, based on their average daily net assets. Under the terms of the agreement $178,209 was payable at period end.
The Fund invests in Community Investment Notes issued by the Calvert Social Investment Foundation (the "CSI Foundation"). The CSI Foundation is a 501(c)(3) non-profit organization that receives in-kind support from the Calvert Group, Ltd. and its subsidiaries. The Fund has received from the Securities and Exchange Commission an exemptive order permitting the Fund to make investments in these notes under certain conditions.
Each Director of the Fund who is not an employee of the Advisor or its affiliates receives an annual retainer of $34,000 plus $2,000 for each Board meeting attended. An additional Chair support fee of $24,000 annually is paid to the Fund Chair. Additional fees of up to $10,000 annually may be paid to the Chairperson of special committees of the Board and to the lead disinterested Director. Director's fees are allocated to each of the funds served.
Note C -- Investment Activity
During the period, cost of purchases and proceeds from sales of investments, other than short-term securities, were $333,661,208 and $287,631,252, respectively.
The cost of investments owned at March 31, 2007 for federal income tax purposes was $590,926,169. Net unrealized appreciation aggregated $111,855,121, of which $119,977,628 related to appreciated securities and $8,122,507 related to depreciated securities.
Net realized capital loss carryforwards for federal income tax purposes of $269,613 (from Calvert South Africa Fund that merged into the Fund in September 2002) at September 30, 2006 may be utilized to offset future capital gains until expiration in September 2009.
The Fund's use of net capital loss carryforwards from Calvert South Africa Fund may be limited under certain tax provisions.
Note D -- Line of Credit
A financing agreement is in place with all Calvert Group Funds (except for the Calvert Social Investment Fund's Balanced and Enhanced Equity Portfolios, the CVS Calvert Social Balanced Portfolio and the CVS Ameritas Index 500 Portfolio) and State Street Corporation ("SSC"). Under the agreement, SSC provides an unsecured line of credit facility, in the aggregate amount of $50 million ($25 million committed and $25 million uncommitted), accessible by the Funds for temporary or emergency purposes only. Borrowings under this committed facility bear interest at the overnight Federal Funds Rate plus .50% per annum. A commitment fee of .10% per annum is incurred on the unused portion of the committed facility, which is allocated to all participating funds. The Fund had no loans outstanding pursuant to this line of credit at March 31, 2007.
For the six months ended March 31, 2007 borrowings by the Fund under the Agreement were as follows:
| | | Weighted | | Month of |
| | Average | Average | Maximum | Maximum |
| | Daily | Interest | Amount | Amount |
| | Balance | Rate | Borrowed | Borrowed |
| | $167,553 | 5.87% | $4,125,025 | December 2006 |
| | | | | |
Note E -- Affiliated Companies
An affiliated company is a company in which the Fund has a direct or indirect ownership of, control of, or voting power over 5 percent or more of the outstanding voting shares. Affiliated companies of the Fund are as follows:
Affiliates | Cost | Value |
GNet Defta Development Holdings LLC | $400,000 | $400,000 |
SEAF Central & Eastern European Growth Fund LLC | 610,414 | 616,530 |
TOTALS | $1,010,414 | $1,016,530 |
Note F -- Other
In connection with certain venture capital investments, the Fund is committed to future capital calls, which will increase the Fund's investment in these securities. The aggregate amount of the future capital commitments totals $1,715,459 at March 31, 2007.
Financial Highlights
| | | | Periods Ended | | |
| | | March 31, | September 30, | September 30, | |
Class A Shares | | 2007 (z) | 2006 | 2005 | |
Net asset value, beginning | | $23.87 | $20.29 | $16.60 | |
Income from investment operations | | | | | |
Net investment income (loss) | | (.03) | .24 | .21 | |
Net realized and unrealized gain (loss) | | 3.25 | 3.51 | 3.59 | |
Total from investment operations | | 3.22 | 3.75 | 3.80 | |
Distributions from | | | | | |
Net investment income | | (.20) | (.17) | (.11) | |
Net realized gain | | (2.93) | -- | -- | |
Total distributions | | (3.13) | (.17) | (.11) | |
Total increase (decrease) in net asset value | | .09 | 3.58 | 3.69 | |
Net asset value, ending | | $23.96 | $23.87 | $20.29 | |
| | | | | | |
Total return* | | 14.06% | 18.58% | 22.95% | |
Ratios to average net assets:A | | | | | |
Net investment income (loss) | | (.25%) (a) | 1.19% | 1.23% | |
Total expenses | | 1.64% (a) | 1.73% | 1.86% | |
Expenses before offsets | | 1.62% (a) | 1.72% | 1.86% | |
Net expenses | | 1.62% (a) | 1.71% | 1.85% | |
Portfolio turnover | | 45% | 120% | 49% | |
Net assets, ending (in thousands) | | $487,425 | $401,195 | $297,151 | |
| | | | | | |
| | | | | | |
| | | | Years Ended | | |
| | | September 30, | September 30, | September 30, | |
Class A Shares | | 2004 (z) | 2003 | 2002 | |
Net asset value, beginning | | $14.55 | $11.99 | $13.65 | |
Income from investment operations | | | | | |
Net investment income (loss) | | .10 | .09 | .01 | |
Net realized and unrealized gain (loss) | | 2.12 | 2.53 | (1.59) | |
Total from investment operations | . | 2.22 | 2.62 | (1.58) | |
Distributions from | | | | | |
Net investment income | | (.17) | (.06) | -- | |
Net realized gains | | -- | -- | (.08) | |
Total distributions | | (.17) | (.06) | (.08) | |
Total increase (decrease) in net asset value | | 2.05 | 2.56 | (1.66) | |
Net asset value, ending | | $16.60 | $14.55 | $11.99 | |
| | | | | | |
Total return* | | 15.30% | 21.93% | (11.69%) | |
Ratios to average net assets:A | | | | | |
Net investment income (loss) | | .60% | .72% | .06% | |
Total expenses | | 1.97% | 2.07% | 2.02% | |
Expenses before offsets | | 1.97% | 2.05% | 2.00% | |
Net expenses | | 1.96% | 2.05% | 1.99% | |
Portfolio turnover | | 72% | 71% | 106% | |
Net assets, ending (in thousands) | | $213,524 | $162,699 | $129,887 | |
| | | | | | |
| | | | | |
Financial Highlights | | | | | |
| | | | | | |
| | | | | | |
| | | | Periods Ended | | |
| | | March 31, | September 30, | September 30, | |
Class B Shares | | 2007 (z) | 2006 | 2005 | |
Net asset value, beginning | | $21.85 | $18.61 | $15.30 | |
Income from investment operations | | | | | |
Net investment income (loss) | | (.13) | .06 | .15 | |
Net realized and unrealized gain (loss) | | 2.96 | 3.18 | 3.16 | |
Total from investment operations | | 2.83 | 3.24 | 3.31 | |
Distributions from: | | | | | |
Net investment income | | -- | ** | -- | |
Net realized gain | | (2.93) | -- | -- | |
Total distributions | | (2.93) | ** | -- | |
Total increase (decrease) in net asset value | | (.10) | 3.24 | 3.31 | |
Net asset value, ending | | $21.75 | $21.85 | $18.61 | |
| | | | | | |
Total return* | | 13.51% | 17.43% | 21.63% | |
Ratios to average net assets:A | | | | | |
Net investment income (loss) | | (1.20%) (a) | .18% | .20% | |
Total expenses | | 2.60% (a) | 2.73% | 2.92% | |
Expenses before offsets | | 2.57% (a) | 2.72% | 2.92% | |
Net expenses | | 2.57% (a) | 2.70% | 2.91% | |
Portfolio turnover | | 45% | 120% | 49% | |
Net assets, ending (in thousands) | | $21,897 | $18,053 | $14,232 | |
| | | | | | |
| | | | | | |
| | | | Years Ended | | |
| | | September 30, | September 30, | September 30, | |
Class B Shares | | 2004 (z) | 2003 | 2002 | |
Net asset value, beginning | | $13.57 | $11.33 | $13.09 | |
Income from investment operations | | | | | |
Net investment income (loss) | | (.08) | (.08) | (.16) | |
Net realized and unrealized gain (loss) | | 1.97 | 2.38 | (1.52) | |
Total from investment operations | | 1.89 | 2.30 | (1.68) | |
Distributions from: | | | | | |
Net investment income | | (.16) | (.06) | -- | |
Net realized gains | | -- | -- | (.08) | |
Total distributions | | (.16) | (.06) | (.08) | |
Total increase (decrease) in net asset value | | 1.73 | 2.24 | (1.76) | |
Net asset value, ending | | $15.30 | $13.57 | $11.33 | |
| | | | | | |
Total return* | | 13.95% | 20.34% | (12.96%) | |
Ratios to average net assets:A | | | | | |
Net investment income (loss) | | (.54%) | (.64%) | (1.22%) | |
Total expenses | | 3.14% | 3.44% | 3.33% | |
Expenses before offsets | | 3.14% | 3.42% | 3.31% | |
Net expenses | | 3.13% | 3.41% | 3.31% | |
Portfolio turnover | | 72% | 71% | 106% | |
Net assets, ending (in thousands) | | $8,934 | $6,176 | $4,424 | |
| | | | | | |
| | | | | | |
Financial Highlights | | | | | |
| | | | | | |
| | | | | | |
| | | | Periods Ended | | |
| | | March 31, | September 30, | September 30, | |
Class C Shares | | 2007 (z) | 2006 | 2005 | |
Net asset value, beginning | | $21.34 | $18.18 | $14.91 | |
Income from investment operations | | | | | |
Net investment income (loss) | | (.11) | .13 | .15 | |
Net realized and unrealized gain (loss) | | 2.89 | 3.06 | 3.12 | |
Total from investment operations | | 2.78 | 3.19 | 3.27 | |
Distributions from: | | �� | | | |
Net investment income | | (.02) | (.03) | -- | |
Net realized gain | | (2.93) | -- | -- | |
Total distributions | | (2.95) | (.03) | -- | |
Total increase (decrease) in net asset value | | (.17) | 3.16 | 3.27 | |
Net asset value, ending | | $21.17 | $21.34 | $18.18 | |
| | | | | | |
Total return* | | 13.62% | 17.55% | 21.93% | |
Ratios to average net assets:A | | | | | |
Net investment income (loss) | | (1.04%) (a) | .38% | .38% | |
Total expenses | | 2.45% (a) | 2.57% | 2.75% | |
Expenses before offsets | | 2.43% (a) | 2.56% | 2.75% | |
Net expenses | | 2.42% (a) | 2.55% | 2.74% | |
Portfolio turnover | | 45% | 120% | 49% | |
Net assets, ending (in thousands) | | $43,395 | $32,723 | $22,856 | |
| | | | | | |
| | | | | | |
| | | | Years Ended | | |
| | | September 30, | September 30, | September 30, | |
Class C Shares | | 2004 (z) | 2003 | 2002 | |
Net asset value, beginning | | $13.18 | $10.97 | $12.64 | |
Income from investment operations | | | | | |
Net investment income (loss) | | (.04) | (.03) | (.12) | |
Net realized and unrealized gain (loss) | | 1.92 | 2.30 | (1.47) | |
Total from investment operations | . | 1.88 | 2.27 | (1.59) | |
Distributions from | | | | | |
Net investment income | | (.15) | (.06) | -- | |
Net realized gains | | -- | -- | (.08) | |
Total distributions | | (.15) | (.06) | (.08) | |
Total increase (decrease) in net asset value | | 1.73 | 2.21 | (1.67) | |
Net asset value, ending | | $14.91 | $13.18 | $10.97 | |
| | | | | | |
Total return* | | 14.33% | 20.72% | (12.71%) | |
Ratios to average net assets:A | | | | | |
Net investment income (loss) | | (.25%) | (.27%) | (.95%) | |
Total expenses | | 2.85% | 3.09% | 3.05% | |
Expenses before offsets | | 2.85% | 3.07% | 3.04% | |
Net expenses | | 2.84% | 3.07% | 3.03% | |
Portfolio turnover | | 72% | 71% | 106% | |
Net assets, ending (in thousands) | | $14,533 | $9,764 | $7,021 | |
| | | | | | |
| | | | | | |
Financial Highlights | | | | | |
| | | | | | |
| | | | | | |
| | | | Periods Ended | | |
| | | March 31, | September 30, | September 30, | |
Class I Shares | | 2007 (z) | 2006 | 2005 | |
Net asset value, beginning | | $25.16 | $21.32 | $17.45 | |
Income from investment operations | | | | | |
Net investment income | | .05 | .37 | .27 | |
Net realized and unrealized gain (loss) | | 3.43 | 3.72 | 3.88 | |
Total from investment operations | | 3.48 | 4.09 | 4.15 | |
Distributions from: | | | | | |
Net investment income | | (.35) | (.25) | (.28) | |
Net realized gain | | (2.93) | -- | -- | |
Total distributions | | (3.28) | (.25) | (.28) | |
Total increase (decrease) in net asset value | | .20 | 3.84 | 3.87 | |
Net asset value, ending | | $25.36 | $25.16 | $21.32 | |
| | | | | | |
Total return* | | 14.42% | 19.35% | 23.92% | |
Ratios to average net assets:A | | | | | |
Net investment income (loss) | | .40% (a) | 1.84% | 2.04% | |
Total expenses | | 1.00% (a) | 1.07% | 1.17% | |
Expenses before offsets | | .98% (a) | 1.06% | 1.11% | |
Net expenses | | .98% (a) | 1.05% | 1.10% | |
Portfolio turnover | | 45% | 120% | 49% | |
Net assets, ending (in thousands) | | $157,015 | $124,197 | $89,974 | |
| | | | | | |
| | | | | | |
| | | | Years Ended | | |
| | | September 30, | September 30, | September 30, | |
Class I Shares | | 2004 (z) | 2003 | 2002 | |
Net asset value, beginning | | $15.17 | $12.38 | $13.97 | |
Income from investment operations | | | | | |
Net investment income | | .27 | .22 | .16 | |
Net realized and unrealized gain (loss) | | 2.19 | 2.63 | (1.67) | |
Total from investment operations | | 2.46 | 2.85 | (1.51) | |
Distributions from: | | | | | |
Net investment income | | (.18) | (.06) | -- | |
Net realized gains | | -- | -- | (.08) | |
Total distributions | | (.18) | (.06) | (.08) | |
Total increase (decrease) in net asset value | | 2.28 | 2.79 | (1.59) | |
Net asset value, ending | | $17.45 | $15.17 | $12.38 | |
| | | | | | |
Total return* | | 16.25% | 23.12% | (10.93%) | |
Ratios to average net assets:A | | | | | |
Net investment income (loss) | | 1.60% | 1.65% | 1.05% | |
Total expenses | | 1.23% | 1.39% | 1.27% | |
Expenses before offsets | | 1.11% | 1.09% | 1.06% | |
Net expenses | | 1.10% | 1.09% | 1.05% | |
Portfolio turnover | | 72% | 71% | 106% | |
Net assets, ending (in thousands) | | $48,420 | $18,026 | $5,943 | |
A Total expenses do not reflect amounts reimbursed and/or waived by the Advisor or reductions from expense offset arrangements. Expenses before offsets reflect expenses after reimbursement and/or waiver by the Advisor but prior to reductions from expense offset arrangements. Net expenses are net of all reductions and represent the net expenses paid by the Fund.
(a) Annualized.
(z) Per share figures are calculated using the Average Share Method.
* Total return is not annualized for periods less than one year and does not reflect deduction of any front-end or deferred sales charge.
** Distribution is less than $0.01 per share.
See notes to financial statements.
Explanation of Financial Tables
Schedule of Investments
The Schedule of Investments is a snapshot of all securities held in the fund at their market value, on the last day of the reporting period. Securities are listed by asset type (e.g., common stock, corporate bonds, U.S. government obligations) or, for International Funds, by country, and may be further broken down into sub-groups and by industry classification.
Statement of Assets and Liabilities
The Statement of Assets and Liabilities is often referred to as the fund's balance sheet. It lists the value of what the fund owns, is due and owes on the last day of the reporting period. The fund's assets include the market value of securities owned, cash, receivables for securities sold and shareholder subscriptions, and receivables for dividends and interest payments that have been earned, but not yet received. The fund's liabilities include payables for securities purchased and shareholder redemptions, and expenses owed but not yet paid. The statement also reports the fund's net asset value (NAV) per share on the last day of the reporting period. The NAV is calculated by dividing the fund's net assets (assets minus liabilities) by the number of shares outstanding. This statement is accompanied by a Schedule of Investments. Alternatively, if certain conditions are met, a Statement of Net Assets may be presented in lieu of this statement and the Schedule of Investments.
Statement of Net Assets
The Statement of Net Assets provides a detailed list of the fund's holdings, including each security's market value on the last day of the reporting period. The Statement of Net Assets includes a Schedule of Investments. Other assets are added and other liabilities subtracted from the investments total to calculate the fund's net assets. Finally, net assets are divided by the outstanding shares of the fund to arrive at its share price, or Net Asset Value (NAV) per share.
At the end of the Statement of Net Assets is a table displaying the composition of the fund's net assets. Paid in Capital is the money invested by shareholders and represents the bulk of net assets. Undistributed Net Investment Income and Accumulated Net Realized Gains usually approximate the amounts the fund had available to distribute to shareholders as of the statement date. Accumulated Realized Losses will appear as negative balances. Unrealized Appreciation (Depreciation) is the difference between the market value of the fund's investments and their cost, and reflects the gains (losses) that would be realized if the fund were to sell all of its investments at their statement-date values.
Statement of Operations
The Statement of Operations summarizes the fund's investment income earned and expenses incurred in operating the fund. Investment income includes dividends earned from stocks and interest earned from interest-bearing securities in the fund. Expenses incurred in operating the fund include the advisory fee paid to the investment advisor, administrative services fees, distribution plan expenses (if applicable), transfer agent fees, shareholder servicing expenses, custodial, legal, and audit fees, and the printing and postage expenses related to shareholder reports. Expense offsets (fees paid indirectly) are also shown. Credits earned from offset arrangements are used to reduce the fund's expenses. This statement also shows net gains (losses) realized on the sale of investments and the increase or decrease in the unrealized appreciation (depreciation) on investments held during the period.
Statement of Changes in Net Assets
The Statement of Changes in Net Assets shows how the fund's total net assets changed during the two most recent reporting periods. Changes in the fund's net assets are attributable to investment operations, distributions and capital share transactions.
The Operations section of the report summarizes information detailed in the Statement of Operations. The Distribution section shows the dividend and capital gain distributions made to shareholders. The amounts shown as distributions in this section may not match the net investment income and realized gains amounts shown in the Operations section because distributions are determined on a tax basis and certain investments or transactions may be treated differently for financial statement and tax purposes. The Capital Share Transactions section shows the amount shareholders invested in the fund, either by purchasing shares or by reinvesting distributions, and the amounts redeemed. The corresponding numbers of shares issued, reinvested and redeemed are shown at the end of the report.
Financial Highlights
The Financial Highlights table provides a per-share breakdown per class of the components that affect the fund's net asset value for current and past reporting periods. The table provides total return, total distributions, expense ratios, portfolio turnover and net assets for the applicable period. Total return is a measure of a fund's performance that encompasses all elements of return: dividends, capital gain distributions and changes in net asset value. Total return is the change in value of an investment over a given period, assuming reinvestment of any dividends and capital gain distributions, expressed as a percentage of the initial investment. Total distributions include distributions from net investment income and net realized gains. Long-term gains are earned on securities held in the fund more than one year. Short-term gains, on the sale of securities held less than one year, are treated as ordinary dividend income for tax purposes. The expense ratio is a fund's cost of doing business, ex pressed as a percentage of net assets. These expenses directly reduce returns to shareholders. Portfolio turnover measures the trading activity in a fund's investment portfolio -- how often securities are bought and sold by a fund. Portfolio turnover is affected by market conditions, changes in the size of the fund, the nature of the fund's investments and the investment style of the portfolio manager.
PROXY VOTING
The Proxy Voting Guidelines of the Calvert Funds that the Fund uses to determine how to vote proxies relating to portfolio securities are provided as an Appendix to the Fund's Statement of Additional Information. The Statement of Additional Information can be obtained free of charge by calling the Fund at 1-800-368-2745, by visiting the Calvert website at www.calvert.com; or by visiting the SEC's website at www.sec.gov.
Information regarding how the Fund voted proxies relating to portfolio securities during the most recent 12-month period ended June 30 is available on the Fund's website at www.calvert.com and on the SEC's website at www.sec.gov.
AVAILABILITY OF QUARTERLY PORTFOLIO HOLDINGS
The Fund files its complete schedule of portfolio holdings with the SEC for the first and third quarters of each fiscal year on Form N-Q. The Fund's Form N-Q is available on the SEC's website at www.sec.gov. The Fund's Form N-Q may be reviewed and copied at the SEC's Public Reference Room in Washington, DC; information on the operation of the Public Reference Room may be obtained by calling 1-800-SEC-0330.
BASIS FOR BOARD'S APPROVAL OF INVESTMENT ADVISORY CONTRACTS
At a meeting held on December 5, 2006, the Board of Directors, and by a separate vote, the disinterested Directors, approved the continuance of the Investment Advisory Agreement between Calvert World Values Fund, Inc. and the Advisor and the Investment Subadvisory Agreement between the Advisor and the Subadvisor with respect to the Fund.
In evaluating the Investment Advisory Agreement, the Board considered a variety of information relating to the Fund and the Advisor. The disinterested Directors reviewed a report prepared by the Advisor regarding various services provided to the Fund by the Advisor and its affiliates. Such report included, among other data, information regarding the Advisor's personnel and the Advisor's revenue and cost of providing services to the Fund, and a separate report prepared by an independent third party, which provided a statistical analysis comparing the Fund's investment performance, expenses, and fees to comparable mutual funds.
The disinterested Directors were separately represented by independent legal counsel with respect to their consideration of the reapproval of the Investment Advisory Agreement and Investment Subadvisory Agreement. Prior to voting, the disinterested Directors reviewed the proposed continuance of the Investment Advisory Agreement and Investment Subadvisory Agreement with management and also met in private sessions with their counsel at which no representatives of management were present.
In the course of its deliberations regarding the Investment Advisory Agreement, the Board considered the following factors, among others: the nature, extent and quality of the services provided by the Advisor, including the personnel providing such services; the Advisor's financial condition; the level and method of computing the Fund's advisory fee; comparative performance, fee and expense information for the Fund; the profitability of the Calvert Group of Funds to the Advisor; the allocation of the Fund's brokerage, including the Advisor's process for monitoring "best execution"; the direct and indirect benefits, if any, derived by the Advisor from its relationship with the Fund; the effect of the Fund's growth and size on the Fund's performance and expenses; the affiliated distributor's process for monitoring sales load breakpoints; the Advisor's compliance programs and policies; the Advisor's performance of substantially similar duties for other funds; and any possible conflicts of interest.
In considering the nature, extent and quality of the services provided by the Advisor under the Investment Advisory Agreement, the Board reviewed information provided by the Advisor relating to its operations and personnel, including, among other information, biographical information on the Advisor's supervisory and professional staff and descriptions of its organizational and management structure. The Board also took into account similar information provided periodically throughout the previous year by the Advisor as well as the Board's familiarity with the Advisor's senior management through Board of Directors' meetings, discussions and other reports. The Advisor's administrative capabilities, including its ability to supervise the other service providers for the Fund, were also considered. The Board discussed the Advisor's effectiveness in monitoring the performance of the Subadvisor and its timeliness in responding to performance issues. The Board concluded that it was satisfied with the nature, e xtent and quality of services provided to the Fund by the Advisor under the Investment Advisory Agreement.
In considering the Fund's performance, the Board noted that it reviewed on a quarterly basis detailed information about the Fund's performance results, portfolio composition and investment strategies. The Board also reviewed various comparative data provided to it in connection with its consideration of the renewal of the Investment Advisory Agreement, including, among other information, a comparison of the Fund's total return with its Lipper index and with that of other mutual funds deemed to be in its peer group by an independent third party in its report. This comparison indicated that for the one-year annualized period ended June 30, 2006, the Fund's performance was above the median of its peer group and below the median of its peer group for the two-, three-, four-, five- and ten-year annualized periods ended June 30, 2006. The Fund outperformed its Lipper index for the one-year annualized period ended June 30, 2006 and underperformed its Lipper index for the two-, three-, four-, five- and ten-yea r annualized periods ended June 30, 2006. The Board noted the recent change in the Subadvisor of the Fund and that the performance information in the report of the independent third party prior to March, 2006 did not reflect the performance the new Subadvisor. The Board also considered management's discussion of the Fund's recent performance. Based upon its review, the Board concluded that appropriate action had been taken by the Advisor to address the Fund's performance.
In considering the Fund's fees and expenses, the Board compared the Fund's fees and total expense ratio with various comparative data for the funds in its peer group. Among other findings, the data indicated that the Fund's advisory fee was below the median of its peer group and that total expenses were above the median of its peer group. The Board noted the Advisor's discussion of the Fund's expenses and certain factors that affected the level of such expenses. Based upon its review, the Board concluded that the advisory fee was reasonable in view of the quality of services provided by the Advisor and the other factors considered.
In reviewing the overall profitability of the advisory fee to the Fund's Advisor, the Board also considered the fact that affiliates of the Advisor provided shareholder servicing and administrative services to the Fund for which they received compensation. The information considered by the Board included Calvert's operating profit margin information both before and after tax expenses with respect to the services that the Advisor and its affiliates provided to the Calvert Group of Funds complex. The Board reviewed the profitability of the Advisor's relationship with the Fund in terms of the total amount of annual advisory fees it received with respect to the Fund and whether the Advisor had the financial wherewithal to continue to provide a high level of services to the Fund. The Board also considered that the Advisor derived benefits to its reputation and other indirect benefits from its relationship with the Fund. The Board also noted that the Advisor paid the subadvisory fee to the Subadvisor. Base d upon its review, the Board concluded that the Advisor's level of profitability from its relationship with the Fund was reasonable.
The Board considered that the advisory fee schedule for the Fund contained breakpoints that reduced the advisory fee rate on assets above specified levels, noting that the Fund currently benefited from economies of scale. The Board also received information showing the effective fees under the Investment Advisory Agreement as a percentage of assets at different asset levels and considered the additional economies of scale that might be realized if the assets of the Fund increased. The Board also noted that if the Fund's assets increased over time, the Fund might realize other economies of scale if assets increased proportionally more than certain other expenses.
In reapproving the Investment Advisory Agreement, the Board, including the disinterested Directors, did not identify any single factor as controlling, and each Director attributed different weight to various factors.
In evaluating the Investment Subadvisory Agreement, the disinterested Directors reviewed information provided by the Subadvisor relating to its operations, personnel, investment philosophy, strategies and techniques. Among other information, the Subadvisor provided biographical information on portfolio management and other professional staff, performance information for itself, and descriptions of its investment philosophies, strategies and techniques, organizational and management structures and brokerage policies and practices.
The Board reapproved the Investment Subadvisory Agreement between the Advisor and the Subadvisor based on a number of factors relating to the Subadvisor's ability to perform under the Investment Subadvisory Agreement. In the course of its deliberations, the Board evaluated, among other factors: the nature, extent and the quality of the services to be provided by the Subadvisor; the Subadvisor's management style and long-term performance record; the Fund's performance record and the Subadvisor's performance in employing its investment strategies; the Subadvisor's current level of staffing and its overall resources; the qualifications and experience of the Subadvisor's personnel; the Subadvisor's financial condition with respect to its ability to perform the services required under the Investment Subadvisory Agreement; the Subadvisor's compliance systems, including those related to personal investing; and any disciplinary history. Based upon its review, the Board concluded that it was satisfied with the nature, extent and quality of services provided to the Fund by the Subadvisor under the Investment Subadvisory Agreement.
As noted above, the Board considered, among other information, the Fund's performance during the one-, two-, three-, four-, five- and ten-year annualized periods ended June 30, 2006 as compared to the Fund's peer group and noted that it reviewed on a quarterly basis detailed information about the Fund's performance results, portfolio composition and investment strategies. The Board noted the Advisor's expertise and resources in monitoring the performance, investment style and risk adjusted performance of the Subadvisor.
In considering the cost of services to be provided by the Subadvisor and the profitability to the Subadvisor of its relationship with the Fund, the Board noted that the subadvisory fee under the Investment Subadvisory Agreement was paid by the Advisor out of the advisory fee that the Advisor received under the Investment Advisory Agreement. The Board also relied on the ability of the Advisor to negotiate the Investment Subadvisory Agreement and the corresponding subadvisory fee at arm's length. Based upon it review, the Board determined that the sub-advisory fee was reasonable. For each of the above reasons, the cost of services to be provided by the Subadvisor and the profitability to the Subadvisor of its relationship with the Fund were not material factors in the Board's deliberations. For similar reasons, the Board did not consider the potential economies of scale in the Subadvisor's management of the Fund to be a material factor in its consideration, although the Board noted that the subadvisory fee schedule for the Fund contained breakpoints that reduced the subadvisory fee rate on assets above specified levels.
In reapproving the Investment Subadvisory Agreement, the Board, including the disinterested Directors, did not identify any single factor as controlling, and each Director attributed different weights to various factors.
Conclusions
The Board reached the following conclusions regarding the Investment Advisory Agreement and the Investment Subadvisory Agreement, among others: (a) the Advisor had demonstrated that it possessed the capability and resources to perform the duties required of it under the Investment Advisory Agreement; (b) the Subadvisor was qualified to manage the Fund's assets in accordance with the Fund's investment objectives and policies; (c) the Advisor and Subadvisor maintained appropriate compliance programs; (d) the Subadvisor was likely to execute its investment strategies consistently over time; (e) appropriate action had been taken by the Advisor to address the Fund's performance; and (f) the Fund's advisory and subadvisory fees were reasonable relative to those of similar funds and to the services to be provided by the Advisor and the Subadvisor. Based on its conclusions, the Board determined that reapproval of the Investment Advisory Agreement and the Investment Subadvisory Agreement was in the interests of the Fund and its shareholders.
Calvert World Values International Equity Fund
To Open an Account
800-368-2748
Yields and Prices
Calvert Information Network
(24 hours, 7 days a week)
800-368-2745
Service for Existing Account
Shareholders: 800-368-2745
Brokers: 800-368-2746
TDD for Hearing Impaired
800-541-1524
Branch Office
4550 Montgomery Avenue
Suite 1000 North
Bethesda, Maryland 20814
Registered, Certified
or Overnight Mail
Calvert Group
c/o BFDS
330 West 9th Street
Kansas City, MO 64105
Web Site
http://www.calvert.com
Note: The information on our website is not incorporated by reference into this report; our website address is included as an inactive textual reference only.
Principal Underwriter
Calvert Distributors, Inc.
4550 Montgomery Avenue
Suite 1000 North
Bethesda, Maryland 20814
This report is intended to provide fund information to shareholders. It is not authorized for distribution to prospective investors unless preceded or accompanied by a prospectus.
Calvert's Family of Funds
Tax-Exempt Money Market Funds
CTFR Money Market Portfolio
Taxable Money Market Funds
First Government Money Market Fund
CSIF Money Market Portfolio
Municipal Funds
CTFR Limited-Term Portfolio
CTFR Long-Term Portfolio
CTFR Vermont Municipal Portfolio
National Muni. Intermediate Fund
Taxable Bond Funds
CSIF Bond Portfolio
Income Fund
Short Duration Income Fund
Long-Term Income Fund
Ultra-Short Floating Income Fund
Equity Funds
CSIF Enhanced Equity Portfolio
CSIF Equity Portfolio
Calvert Large Cap Growth Fund
Capital Accumulation Fund
CWV International Equity Fund
New Vision Small Cap Fund
Calvert Social Index Fund
Calvert Small Cap Value Fund
Calvert Mid Cap Value Fund
Balanced and Asset Allocation Funds
CSIF Balanced Portfolio
Calvert Conservative Allocation Fund
Calvert Moderate Allocation Fund
Calvert Aggressive Allocation Fund
printed on recycled paper using soy-based inks
<PAGE>
Calvert
Investments that make a difference®
March 31, 2007
Semi-Annual Report
Calvert Capital
Accumulation Fund
Calvert
Investments that make a difference®
A UNIFI Company
Choose Planet-friendly E-delivery! Sign up now for on-line statements, prospectuses, and fund reports. In less than five minutes you can help reduce paper mail and lower fund costs. Just go to www.calvert.com, click on My Account, and select the documents you would like to receive via e-mail. If you're new to account access, you'll be prompted to set up a personal identification number for your account. Once you're in, click on the E-delivery sign-up at the bottom of the Account Portfolio page and follow the quick, easy steps. |
Table of Contents
President's Letter
1
Social Update
4
Portfolio Management Discussion
6
Shareholder Expense Example
10
Statement of Net Assets
12
Statement of Operations
15
Statements of Changes in Net Assets
16
Notes to Financial Statements
17
Financial Highlights
22
Explanation of Financial Tables
26
Proxy Voting and Availability of Quarterly Portfolio Holdings
28
Basis for Board's Approval of Investment Advisory Contract
28
Dear Shareholders:
In the six months ended March 31, 2007, the stock market and economy closed out the period in a surprisingly steady state, especially considering the brief worldwide sell-off in equities at the end of February and ongoing concerns about subprime mortgage loans. Over the six-month period, energy prices finished about where they started, the Federal Reserve left interest rates unchanged, and equities worldwide recovered to end up in positive territory.
During this period, the equity markets had two distinct chapters of performance. In the fourth quarter of 2006, the Standard & Poor's 500 Index posted a total return of 6.7% as the U.S. equity market continued its general upward trend with remarkably low volatility. However, for the first quarter of this year, the S&P 500 gained only 0.64% amid markedly increased volatility. On February 27, an 8.8% drop in the value of the Shanghai Stock Exchange Composite Index triggered a worldwide sell-off in equities, with the S&P 500 losing 3.47% for the day. The U.S. equities market stayed somewhat jittery for the rest of the quarter, with concerns about increasing defaults on subprime mortgages weighing on investors.
For the entire six-month period, the domestic U.S. market, as measured by the S&P 500, gained 7.38%. The Morgan Stanley Capital International EAFE (Europe, Australasia, Far East) Index, a benchmark for international markets, gained 14.98%. The return for international stocks was even more remarkable considering their late-February plunge. The Lehman U.S. Credit Index, a common benchmark for bond fund performance, climbed 2.87% during the period.
A Look at Style Trends
Value stocks outperformed growth stocks for the six-month period, extending a seven-year trend which has been detrimental to several Calvert equity portfolios. However, there are signs (such as a possible peak in the Federal Reserve's benchmark lending rate) that this trend is beginning to reverse. To learn more about these style trends, please visit www.calvert.com, click on Fund Commentary in the right-hand column, and select "Calvert Perspective: Reading the Headwinds" to read a commentary by Steve Falci, Calvert's Chief Investment Officer, Equities.
Another factor that may potentially work in favor of Calvert's equity funds is investor reaction to the market's increased volatility. As investors become increasingly concerned about the tradeoff between risk and return, they may increasingly seek higher-quality stocks that are attractively priced relative to the quality of their fundamental data. In times of volatility, as always, we continue to advise our clients to stay the course with their investment strategy and to discuss their portfolio holdings with a financial advisor when necessary.
Growth of Sustainable, "Green" Investing
The movement to increase environmental and corporate sustainability has recently received considerable attention from the mainstream media, with cover stories on the green movement gracing the covers of publications such as Newsweek and Vanity Fair. The growing popularity of social and environmental responsibility shows that the public may be beginning to realize something that many Calvert investors have known for a long time: environmental and corporate responsibility are vital to society as a whole, and investment selection can have an impact on sustainability.
As Calvert's Double Diligence® investment process shows, companies that are committed to sustainability are often companies with high-quality management, corporate governance, and financial data--which are the types of companies that can make the best long-term investments.
One focus of Calvert's advocacy efforts over the last few years has been our work to convince companies to both disclose more information about how their operations affect climate change and to reduce their contributions to climate change factors. Please visit www.calvert.com/climate.html to learn more about climate change and our efforts to increase corporate awareness of the issue.
Sudan Divestment Initiative
In February, Calvert announced a new partnership with the Sudan Divestment Task Force and the Save Darfur Coalition to encourage investors and institutions to divest holdings of companies that help support the government of Sudan. To find more information about the crisis in Darfur and the divestment initiative, please visit www.calvert.com/sudan.
This effort is consistent with Calvert's long-standing commitment to human rights--in 1982, Calvert was the first mutual fund company to decide not to invest in companies doing business in South Africa's apartheid regime. Calvert's past efforts, in concert with other groups, have demonstrated how divestment and advocacy can exert significant influence on companies--and regimes--to effect positive societal change. We will continue to work toward ending the humanitarian crisis in Darfur and keep supporting efforts to maintain human rights worldwide.
As always, thank you for your continued confidence in our mutual funds. We look forward to continuing to strive to meet your investment needs in the future.
Sincerely,
Barbara J. Krumsiek
President and CEO
Calvert Group, Ltd.
April 2007
Social Update
from the Calvert Social Research Department
As a company, through the work of Calvert Social Research Department, and through our unique investment programs, Calvert is a leader in socially responsible investment practices. This Social Update highlights key initiatives and involvement for the six-month reporting period ended March 31, 2007.
Shareholder Advocacy
For the 2007 proxy season, Calvert was lead or co-filer on 36 shareholder resolutions. To date, 17 of these have been successfully withdrawn because companies have taken action to address our concerns. The others await action at annual shareholder meetings. Issues targeted in the resolutions include climate change reporting, board and employee diversity, sustainability reporting, political contributions disclosure, and executive compensation.
Sudan Divestment
Calvert announced its support for a targeted divestment campaign focused on Sudan and launched a new partnership with the Sudan Divestment Task Force (SDTF) and Save Darfur Coalition (SDC) in early February. Since then, we have provided research and analytical support to the SDTF, drafted an advocacy plan for Calvert on this issue, and organized a small working group of socially responsible investors to encourage shareholder action on this issue. We have also provided a wide range of media support, including radio interviews, a webcast for institutional investors, and articles for BSR Weekly and the U.N. Global Compact.
Climate Change Disclosure
In January, the Ceres/Calvert S&P500 Report was published, based on the responses of U.S. companies to the Carbon Disclosure Project's (CDP) request for information. The Project has historically surveyed executives of the companies on the Financial Times (FT) Global 500 list of the world's largest companies. In 2006, Calvert provided initial funding to extend the CDP survey to companies in the Standard & Poor's 500 Index for the first time. The report launch attracted attention from media outlets such as Business Week and Financial Times. We sent the report to members of Congress who have introduced legislation to reduce greenhouse gas emissions and are now working with other investors to encourage S&P 500 companies to respond to this year's CDP survey.
Community Investments
Many of our Funds participate in Calvert's community investing program, which is known as High Social Impact Investing (HSII) and is administered through the Calvert Social Investment Foundation. The HSII program may allocate up to 1% to 3% of Fund assets at below-market interest rates to provide economic opportunity for struggling populations.1 During the reporting period, the Foundation made several investments with groups working to revitalize the Gulf Coast Region in the aftermath of Hurricanes Katrina and Rita. Diaconía Microcrédito Rotativo, a rural microfinance institution that makes tiny business loans to more than 11,000 entrepreneurs in the impoverished Guayaquil area of Ecuador, was another organization receiving an investment from the Foundation.
Special Equities
A modest but important portion of certain Calvert portfolios is invested in private companies that provide socially or environmentally helpful products or services with a profit objective. Much recent attention has been focused on corn-based ethanol as a renewable energy source. But one new special equities investment, Earthanol, seeks to create fuel from agricultural, industrial, and municipal waste.2 The firm's technology for waste-to-ethanol production in the San Joaquin Valley has already been proven effective in other parts of the world.
Globally, more than 5 million children under the age of 5 years die of dehydration caused by diarrhea each year. But new medications developed by another special equities investment, Napo Pharmaceuticals, could soon be introduced into both the Third World and U.S. markets.3 The company is currently commercializing its Crofelemer gastro-intestinal compound, which operates differently from over-the-counter anti-motility treatments, to treat irritable bowel syndrome (IBS), chronic diarrhea caused by HIV, acute infectious diarrhea, and pediatric diarrhea. The FDA has granted fast-track status for the IBS and AIDS-related formulations.
As always, we appreciate your investment in Calvert and will continue to manage your investments with an eye on both financial performance and corporate integrity.
1. As of March 31, 2007, Calvert Social Investment Foundation Community Investment Notes represented the following percentages of Fund net assets: Calvert Social Investment Fund (CSIF) Balanced, 0.82%; CSIF Bond, 0.38%; CSIF Equity, 0.58%; Calvert Capital Accumulation Fund, 1.02%; Calvert World Values Fund International Equity Fund, 0.61%; Calvert New Vision Small Cap Fund, 0.78%; and Calvert Large Cap Growth Fund, 0.20%. All holdings are subject to change without notice. The Calvert Social Investment Foundation is a 501(c)(3) nonprofit organization.
2. On March 31, 2007, Earthanol represented 0.01% of the Calvert Social Investment Fund Equity Portfolio.
3. On March 31, 2007, Napo Pharmaceuticals represented 0.03% of Calvert Large Cap Growth Fund.
Portfolio Management Discussion
Michelle Clayman
Nathaniel Paull
of New Amsterdam Partners LLC
Performance
In the six-month period ended March 31, 2007, Calvert Capital Accumulation Fund Class A shares (at NAV*) returned 9.62% compared with 11.18% for the Russell Midcap® Growth Index. While posting solid returns on an absolute basis, the Fund's sector and stock selection contributed to the Fund's relative underperformance.
Investment Climate
The stock market moved higher over the past six months, with mid-cap stocks eclipsing large-cap and even small-cap stocks by posting returns of 12.38% versus 8.25% and 11.02%, respectively.1
The economy in 2007 is unfolding largely as we had expected. Growth in gross domestic product (GDP) slowed to a 2.5% pace during the first three months of the reporting period, but we still see this as a mid-cycle slowdown as opposed to a slide into recession. The inflation indicator consumer price index (CPI) was running at less than 2.5%, a relatively tame level, as of early 2007.
Meanwhile, the robust employment picture has created a rise in real disposable income--allowing consumers to continue to increase their spending, which has provided a solid underpinning for the economy. Businesses have seen continuing productivity gains that have supported margins and profits. The Federal Reserve (Fed) has not moved to change interest rates this year, and we see this continuing for the foreseeable future. And so far, the housing slowdown has not created the widespread economic meltdown that some analysts had feared. There has undoubtedly been distress in the subprime mortgage industry, but we believe that the damage is limited and unlikely to spill over into the economy as a whole.
Portfolio Strategy
Our core strategy employs a valuation model which seeks to identify reasonably priced companies with better-than-average forecast growth and profitability. We then subject the companies with high expected return to rigorous scrutiny of their fundamentals.
Portfolio Changes
Over the past six months, we sold 11 stocks and purchased 13 new ones. We sold XTO Energy because its growth had pushed the stock's market capitalization outside the mid-cap range. We replaced it with oil and natural gas company St. Mary Land & Exploration. We sold Cimarex Energy and KB Home to reduce our exposure to the Energy sector and homebuilding industry, respectively. We sold Omnicare, a provider of pharmaceuticals and other pharmacy services to long-term healthcare institutions, due to the deteriorating quality of its fundamentals. We purchased Laboratory Corporation of America Holdings to replace it, taking advantage of a recent sell-off caused by investors overreacting to news of an account loss. Also in Health Care, we sold analytical instrument manufacturer Waters, which had reached its price target.
In Information Technology, we sold Cognizant and CSG Systems International when they reached their respective price targets, and we also sold Hewitt Associates during a rally after recent weakness. We added transaction processor Fiserv, Rofin-Sinar, a developer of laser-based equipment, and credit-card processor Global Payments.
Other significant portfolio additions included magazine publisher Meredith, beverage producer Hansen Natural, and Cytyc, a provider of gynecological diagnostic devices.
Key Performance Factors
Our overweight position in Materials helped returns, but an overweight to Information Technology and an underweight to Industrials detracted from performance. Stock selection was strong in Health Care and Consumer Staples, but was weak in the Consumer Discretionary, Financials and Industrials sectors.
Four stocks held by the Fund delivered quarterly results above consensus expectations twice in the past six months: medical equipment manufacturer Dionex (33.7% return during the six-month period), Superior Energy Services (31.3%), Information Technology company Mettler-Toledo International (35.4%), and Consumer Discretionary holding Ross Stores (35.9%). Health Care holding Cytyc gained 38.5% thanks to favorable market reactions to announced acquisitions. In Basic Materials, Reliance Steel & Aluminum rose 51.1% based on strengthened demand for steel, and Eagle Materials rebounded from prior housing-related weakness with a gain of 34.3%.2
Stock selection disappointments in the Consumer Discretionary sector included Group 1 Automotive ( 21.1%), which was hurt by a disappointing earnings report, and Pulte Homes ( 16.7%), which was affected by the subprime mortgage lending fallout and investors' fears that tightened lending standards would further impede housing demand. On a related note, Financials holding First Marblehead was down 19.3% on concerns over rising student loan default rates. In Information Technology, weak earnings forecasts sparked a sell-off for Global Payments (-27.8%), Daktronics (-25.1%) and Diodes
(-15.3%). Barr Pharmaceuticals (-10.8%) struggled as the landscape for generic drug providers grew increasingly competitive.
The Fund currently has an overweight to the Information Technology and Materials sectors and an underweight to the Industrials, Consumer Discretionary, and Telecommunications sectors.
Outlook
Looking forward, we expect this mid-cycle slowdown to bring slower economic growth but not recession. We expect overall GDP growth of 2.5% to 2.75% for the full year, picking up in the second half as the housing decline bottoms out and business inventories start to be replenished. We anticipate that inflation will remain in the 2% to 2.5% range for the remainder of the year. Given these factors, we believe that Fed interest-rate hikes are unlikely for the foreseeable future.
As always, there are risks. International tensions are running high with ongoing wars in Afghanistan and Iraq and a diplomatic stand-off with Iran. International markets remain skittish as evidenced by February's sharp decline in Chinese markets (though they have since regained the lost ground). Oil prices have crept back up and any disruption in supply could drive them higher. In the meantime, we believe the era of double-digit earnings growth may be over and expect mid- to high single-digit corporate profit growth for the year.
However, given the overall benign market backdrop, we remain bullish and expect U.S. equities to increase 7% to 9% in 2007.
April 2007
1 Mid-cap stocks are represented by the Russell Mid Cap Index, large-cap stocks by the Russell 1000® Index, and small-cap stocks by the Russell 2000® Index for the six-month period ending March 31, 2007.
2 All returns shown for individual holdings reflect that part of the reporting period the holdings were held.
As of March 31, 2007, the following companies represented the following percentages of Fund net assets: XTO Energy 0.00%, St. Mary Land & Exploration 2.55%, Cimarex Energy 0.00%, KB Home 0.00%, Omnicare 0.00%, Laboratory Corporation of America Holdings 1.96%, Waters 0.00%, Cognizant 0.00%, CSG Systems International 0.00%, Hewitt Associates 0.00%, Fiserv 2.22%, Rofin-Sinar Technologies 2.40%, Global Payments 2.00%, Meredith 2.50%, Hansen's Natural 2.72%, Cytyc 2.83%, Dionex 3.15%, Superior Energy Services 3.98%, Mettler-Toledo International 3.19%, Ross Stores 2.87%, Reliance Steel & Aluminum 2.19%, Eagle Materials 1.62%, Group 1 Automotive 1.69%, Pulte Homes 2.39%, First Marblehead 2.06%, Daktronics 1.98%, Diodes 0.00%, and Barr Pharmaceuticals 1.46%. All portfolio holdings are subject to change without notice.
Portfolio Statistics
March 31, 2007
Investment Performance
(total return at NAV*)
| | 6 Months | 12 Months | |
| | ended | ended | |
| | 3/31/07 | 3/31/07 | |
Class A | 9.62% | 1.11% | |
Class B | 9.13% | 0.25% | |
Class C | 9.22% | 0.34% | |
Class I | 10.03% | 1.91% | |
Russell Mid-Cap Growth Index** | 11.18% | 6.90% | |
Lipper Mid-Cap Growth Funds Avg.** | 11.30% | 3.58% | |
| | | | |
Ten Largest Stock Holdings | | | |
| | % of Net Assets | | |
Superior Energy Services, Inc. | 4.0% | | |
Church & Dwight Co., Inc. | 3.7% | | |
Itron, Inc. | 3.5% | | |
Strayer Education, Inc. | 3.5% | | |
FactSet Research Systems, Inc. | 3.3% | | |
Mettler - Toledo International, Inc. | 3.2% | | |
Dionex Corp. | 3.1% | | |
ANSYS Inc. | 3.1% | | |
Ross Stores, Inc. | 2.9% | | |
Cytyc Corp. | 2.8% | | |
Total | 33.1% | | |
| | | | |
Economic Sectors | % of Total Investments | | |
Consumer Discretionary | 16.3% | | |
Consumer Staples | 6.5% | | |
Energy | 6.6% | | |
Financials | 10.7% | | |
Health Care | 15.8% | | |
Industrials | 7.5% | | |
Information Technology | 26.5% | | |
Materials | 6.6% | | |
Utilities | 3.5% | | |
Total | 100% | | |
*Investment performance/return at NAV does not reflect the deduction of the Fund's maximum 4.75% front-end sales charge or any deferred sales charge.
** Source: Lipper Analytical Services, Inc.
Portfolio Statistics
March 31, 2007
Average Annual Total Returns | |
(with max. load) | |
| | |
| | Class A Shares |
One year | (3.69%) |
Five year | 1.81% |
Ten year | 5.96% |
| | |
| | Class B Shares |
One year | (4.75%) |
Five year | 1.52% |
Since inception | 1.78% |
(3/31/98) | |
| | |
| | Class C Shares |
One year | (0.66%) |
Five year | 1.97% |
Ten year | 5.61% |
| | |
Portfolio Statistics | |
March 31, 2007 | |
| | |
Average Annual Total Returns | |
| | |
| | Class I Shares* |
One year | 1.91% |
Five year | 3.48% |
Since inception | 3.61% |
(2/26/99) | |
Performance Comparison
Comparison of change in value of $10,000 investment.
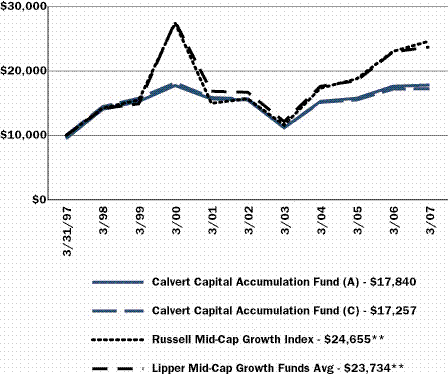
* Note Regarding Class I Shares Total Returns: There were times during the reporting period when there were no shareholders in Class I. For purposes of reporting Average Annual Total Return, Class A performance at NAV (i.e. does not reflect deduction of the Class A front-end sales charge) is used during these periods in which there were no shareholders in Class I. For purposes of this Average Annual Total Return, the Class A performance at NAV was used during the period January 18, 2002 through June 3, 2003.
Average annual total returns in the Portfolio Statistics and the Performance Comparison line graph are with maximum load deducted -- they assume reinvestment of dividends and reflect the deduction of the Fund's Class A maximum front-end sales charge of 4.75%, or deferred sales charge, as applicable. No sales charge has been applied to the index used for comparison. However, the Lipper average does reflect the deduction of the category's average front-end sales charge. The value of an investment in Class A & C shares is plotted in the line graph. The value of an investment in another class of shares would be different. The graph and table do not reflect the deduction of taxes that a shareholder would pay on the Fund's distributions or the redemption of Fund shares. Past performance is no guarantee of future results.
**Source: Lipper Analytical Services, Inc.
Shareholder Expense Example
As a shareholder of the Fund, you incur two types of costs: (1) transaction costs, including sales charges and redemption fees; and (2) ongoing costs, including management fees; distribution (12b-1) fees; and other Fund expenses. This Example is intended to help you understand your ongoing costs (in dollars) of investing in the Fund and to compare these costs with the ongoing costs of investing in other mutual funds.
This Example is based on an investment of $1,000 invested at the beginning of the period and held for the entire period (October 1, 2006 to March 31, 2007).
Actual Expenses
The first line of the table below provides information about actual account values and actual expenses. You may use the information in this line, together with the amount you invested, to estimate the expenses that you paid over the period. Simply divide your account value by $1,000 (for example, an $8,600 account value divided by $1,000 = 8.6), then multiply the result by the number in the first line under the heading entitled "Expenses Paid During Period" to estimate the expenses you paid on your account during this period.
Hypothetical Example for Comparison Purposes
The second line of the table below provides information about hypothetical account values and hypothetical expenses based on the Fund's actual expense ratio and an assumed rate of return of 5% per year before expenses, which is not the Fund's actual return. The hypothetical account values and expenses may not be used to estimate the actual ending account balance or expenses you paid for the period. You may use this information to compare the ongoing costs of investing in the Fund and other funds. To do so, compare the 5% hypothetical example with the 5% hypothetical examples that appear in the shareholder reports of the other funds.
Please note that the expenses shown in the table are meant to highlight your ongoing costs only and do not reflect any transactional costs, such as sales charges (loads) or redemption fees. Therefore, the second line of the table is useful in comparing ongoing costs only, and will not help you determine the relative total costs of owning different funds. In addition, if these transactional costs were included, your costs would have been higher.
| | Beginning | Ending Account | Expenses Paid | | |
| | Account Value | Value | During Period* | | |
| | 10/1/06 | 3/31/07 | 10/1/06 - 3/31/07 | | |
Class A | | | | | |
Actual | $1,000.00 | $1,096.20 | $8.73 | | |
Hypothetical | $1,000.00 | $1,016.60 | $8.40 | | |
(5% return per year before expenses) | | | | | |
Class B | | | | | |
Actual | $1,000.00 | $1,091.30 | $13.26 | | |
Hypothetical | $1,000.00 | $1,012.25 | $12.76 | | |
(5% return per year before expenses) | | | | | |
Class C | | | | | |
Actual | $1,000.00 | $1,092.20 | $12.72 | | |
Hypothetical | $1,000.00 | $1,012.77 | $12.24 | | |
(5% return per year before expenses) | | | | | |
Class I | | | | | |
Actual | $1,000.00 | $1,100.30 | $4.50 | | |
Hypothetical | $1,000.00 | $1,020.64 | $4.33 | | |
(5% return per year before expenses) | | | | | |
* Expenses are equal to the Fund's annualized expense ratio of 1.67%, 2.54%, 2.44% and 0.86% for Class A, Class B, Class C, and Class I respectively, multiplied by the average account value over the period, multiplied by 182/365.
Statement of Net Assets
March 31, 2007
Equity Securities - 98.0% | | Shares | Value | | |
Air Freight & Logistics - 2.3% | | | | | |
Pacer International, Inc. | | 115,900 | $3,122,346 | | |
| | | | | | |
Beverages - 2.7% | | | | | |
Hansen Natural Corp.* | | 97,900 | 3,708,452 | | |
| | | | | | |
Capital Markets - 4.0% | | | | | |
Affiliated Managers Group, Inc.* | | 33,200 | 3,597,220 | | |
Federated Investors, Inc., Class B | | 49,700 | 1,824,984 | | |
| | | | 5,422,204 | | |
| | | | | | |
Chemicals - 2.7% | | | | | |
Praxair, Inc. | | 58,900 | 3,708,344 | | |
| | | | | | |
Construction Materials - 1.6% | | | | | |
Eagle Materials, Inc. | | 49,600 | 2,213,648 | | |
| | | | | | |
Consumer Finance - 2.1% | | | | | |
First Marblehead Corp. | | 62,600 | 2,810,114 | | |
| | | | | | |
Diversified Consumer Services - 3.5% | | | | | |
Strayer Education, Inc. | | 37,850 | 4,731,250 | | |
| | | | | | |
Electronic Equipment & Instruments - 13.8% | | | | | |
Amphenol Corp. | | 55,900 | 3,609,463 | | |
Daktronics, Inc. | | 98,600 | 2,705,584 | | |
Itron, Inc.* | | 74,600 | 4,851,984 | | |
Mettler - Toledo International, Inc.* | | 48,500 | 4,344,145 | | |
Rofin-Sinar Technologies, Inc.* | | 55,400 | 3,278,572 | | |
| | | | 18,789,748 | | |
| | | | | | |
Energy Equipment & Services - 4.0% | | | | | |
Superior Energy Services, Inc.* | | 157,600 | 5,432,472 | | |
| | | | | | |
Gas Utilities - 3.4% | | | | | |
Energen Corp. | | 32,900 | 1,674,281 | | |
Oneok, Inc. | | 67,500 | 3,037,500 | | |
| | | | 4,711,781 | | |
| | | | | | |
Health Care Equipment & Supplies - 2.8% | | | | | |
Cytyc Corp.* | | 112,900 | 3,862,309 | | |
| | | | | | |
Health Care Providers & Services - 7.2% | | | | | |
Coventry Health Care, Inc.* | | 66,450 | 3,724,522 | | |
DaVita, Inc.* | | 65,100 | 3,471,132 | | |
Laboratory Corp. of America Holdings, Inc.* | | 36,700 | 2,665,521 | | |
| | | | 9,861,175 | | |
| | | | | | |
Household Durables - 2.4% | | | | | |
Pulte Homes, Inc. | | 123,300 | 3,262,518 | | |
| | | | | | |
| | | | | | |
Equity Securities - Cont'd | | Shares | Value | | |
Household Products - 3.7% | | | | | |
Church & Dwight Co., Inc. | | 100,050 | $5,037,518 | | |
| | | | | | |
Insurance - 1.4% | | | | | |
AMBAC Financial Group, Inc. | | 22,500 | 1,943,775 | | |
| | | | | | |
IT Services - 4.2% | | | | | |
Fiserv, Inc.* | | 57,000 | 3,024,420 | | |
Global Payments, Inc. | | 79,900 | 2,721,394 | | |
| | | | 5,745,814 | | |
| | | | | | |
Life Sciences - Tools & Services - 4.2% | | | | | |
Dionex Corp.* | | 63,000 | 4,290,930 | | |
Millipore Corp.* | | 19,400 | 1,405,918 | | |
| | | | 5,696,848 | | |
| | | | | | |
Machinery - 2.4% | | | | | |
Graco, Inc. | | 82,300 | 3,222,868 | | |
| | | | | | |
Media - 2.5% | | | | | |
Meredith Corp. | | 59,400 | 3,408,966 | | |
| | | | | | |
Metals & Mining - 2.2% | | | | | |
Reliance Steel & Aluminum Co. | | 61,800 | 2,991,120 | | |
| | | | | | |
Office Electronics - 1.9% | | | | | |
Xerox Corp.* | | 151,600 | 2,560,524 | | |
| | | | | | |
Oil, Gas & Consumable Fuels - 2.5% | | | | | |
St Mary Land & Exploration Co. | | 94,800 | 3,477,264 | | |
| | | | | | |
Pharmaceuticals - 1.4% | | | | | |
Barr Pharmaceuticals, Inc.* | | 43,000 | 1,993,050 | | |
| | | | | | |
Software - 6.4% | | | | | |
ANSYS Inc.* | | 84,100 | 4,269,757 | | |
FactSet Research Systems, Inc. | | 70,900 | 4,456,065 | | |
| | | | 8,725,822 | | |
| | | | | | |
Specialty Retail - 7.8% | | | | | |
Chico's FAS, Inc.* | | 37,600 | 918,568 | | |
Group 1 Automotive, Inc. | | 57,800 | 2,298,706 | | |
Guitar Center, Inc.* | | 76,700 | 3,460,704 | | |
Ross Stores, Inc. | | 113,900 | 3,918,160 | | |
| | | | 10,596,138 | | |
| | | | | | |
Thrifts & Mortgage Finance - 2.1% | | | | | |
FirstFed Financial Corp.* | | 50,200 | 2,852,866 | | |
| | | | | | |
Trading Companies & Distributors - 2.8% | | | | | |
WESCO International, Inc.* | | 60,100 | 3,773,078 | | |
| | | | | | |
| | | | | | |
Total Equity Securities (Cost $118,656,774) | | | 133,662,012 | | |
| | | | | | |
| | | | | | |
| | | Principal | | | |
High Social Impact Investments - 1.0% | | Amount | Value | | |
Calvert Social Investment Foundation Notes, 3.00%, 7/1/08 (b)(i)(r) | | $1,419,488 | $1,397,117 | | |
| | | | | | |
| | | | | | |
Total High Social Impact Investments (Cost $1,419,488) | | | 1,397,117 | | |
| | | | | | |
| | | | | | |
TOTAL INVESTMENTS (Cost $120,076,262) - 99.0% | | | 135,059,129 | | |
Other assets and liabilities, net - 1.0% | | | 1,282,205 | | |
Net Assets - 100% | | | $136,341,334 | | |
| | | | | | |
Net Assets Consist of: | | | | | |
Paid-in capital applicable to the following shares of common stock, 250,000,000 shares of $0.01 par value shares authorized for Class A, Class B, Class C and Class I combined: | | | | | |
Class A: 4,025,677 shares outstanding | | | $93,498,965 | | |
Class B: 528,094 shares outstanding | | | 13,334,048 | | |
Class C: 562,577 shares outstanding | | | 11,985,424 | | |
Class I: 161,962 shares outstanding | | | 3,899,670 | | |
Undistributed net investment income (loss) | | | (786,029) | | |
Accumulated net realized gain (loss) on investments | | | (573,611) | | |
Net unrealized appreciation (depreciation) on investments | | | 14,982,867 | | |
| | | | | | |
Net Assets | | | $136,341,334 | | |
| | | | | | |
Net Asset Value Per Share: | | | | | |
Class A (based on net assets of $105,992,657) | | | $26.33 | | |
Class B (based on net assets of $12,751,895) | | | $24.15 | | |
Class C (based on net assets of $13,190,005) | | | $23.45 | | |
Class I (based on net assets of $4,406,777) | | | $27.21 | | |
| | | | | | |
| | | | | | |
Restricted Securities | | Acquisition Dates | Cost | | |
Calvert Social Investment Foundation Notes, 3.00%, 7/1/08 | | 7/1/05 - 7/3/06 | $1,419,488 | | |
* Non income producing security.
(b) This security was valued by the Board of Directors, see Note A.
(i) Restricted securities represent 1.0% of the net assets of the Fund.
(r) The coupon rate shown on floating or adjustable rate securities represents the rate at period end.
See notes to financial statements.
Statement of Operations
Six Months Ended March 31, 2007
Net Investment Income | | |
Investment Income: | | |
Dividend income | | $375,435 |
Interest income | | 73,861 |
Total investment income | | 449,296 |
| | | |
Expenses: | | |
Investment advisory fee | | 443,922 |
Transfer agency fees and expenses | | 204,538 |
Administrative Services fees | | 167,810 |
Distribution Plan expenses: | | |
Class A | | 185,397 |
Class B | | 67,684 |
Class C | | 66,038 |
Directors' fees and expenses | | 9,082 |
Custodian fees | | 17,166 |
Registration fees | | 22,127 |
Reports to shareholders | | 50,523 |
Professional fees | | 11,085 |
Miscellaneous | | 6,240 |
Total expenses | | 1,251,612 |
Reimbursement from Advisor: | | |
Class I | | (6,137) |
Fees paid indirectly | | (10,150) |
Net expenses | | 1,235,325 |
| | | |
Net Investment Income (Loss) | | (786,029) |
| | | |
Realized and Unrealized Gain (Loss) on Investments | | |
Net realized gain (loss) | | 1,331,504 |
Change in unrealized appreciation or (depreciation) | | 11,843,878 |
| | | |
Net Realized and Unrealized Gain | | |
(Loss) on Investments | | 13,175,382 |
| | | |
Increase (Decrease) in Net Assets | | |
Resulting From Operations | | $12,389,353 |
See notes to financial statements.
Statements of Changes in Net Assets
| | | Six Months Ended | Year Ended | |
| | | March 31, | September 30, | |
Increase (Decrease) in Net Assets | | 2007 | 2006 | |
Operations: | | | | |
Net investment income (loss) | | ($786,029) | ($1,706,951) | |
Net realized gain (loss) | | 1,331,504 | 2,056,939 | |
Change in unrealized appreciation | | | | |
or (depreciation) | | 11,843,878 | 3,005,833 | |
| | | | | |
Increase (Decrease) in Net Assets | | | | |
Resulting From Operations | | 12,389,353 | 3,355,821 | |
| | | | | |
Capital share transactions: | | | | |
Shares sold: | | | | |
Class A Shares | | 6,247,857 | 15,651,876 | |
Class B Shares | | 429,925 | 1,096,127 | |
Class C Shares | | 649,484 | 1,526,106 | |
Class I Shares | | 1,066,338 | 2,981,683 | |
Redemption fees: | | | | |
Class A Shares | | 97 | 1,555 | |
Class B Shares | | 13 | 669 | |
Class C Shares | | 26 | 67 | |
Shares redeemed: | | | | |
Class A Shares | | (13,426,655) | (25,978,467) | |
Class B Shares | | (2,635,184) | (4,150,015) | |
Class C Shares | | (1,447,737) | (3,005,474) | |
Class I Shares | | (287,217) | (2,232,755) | |
Total capital share transactions | | (9,403,053) | (14,108,628) | |
| | | | | |
Total Increase (Decrease) in Net Assets | | 2,986,300 | (10,752,807) | |
| | | | | |
Net Assets | | | | |
Beginning of period | | 133,355,034 | 144,107,841 | |
End of period (including net investment loss of $786,029 and $0, respectively) | | $136,341,334 | $133,355,034 | |
| | | | | |
| | | | | |
Capital Share Activity | | | | |
Shares sold: | | | | |
Class A Shares | | 242,917 | 638,101 | |
Class B Shares | | 18,311 | 48,337 | |
Class C Shares | | 28,462 | 69,143 | |
Class I Shares | | 40,421 | 121,041 | |
Shares redeemed: | | | | |
Class A Shares | | (525,341) | (1,068,374) | |
Class B Shares | | (111,707) | (185,381) | |
Class C Shares | | (63,381) | (137,001) | |
Class I Shares | | (10,816) | (97,382) | |
Total capital share activity | | (381,134) | (611,516) | |
See notes to financial statements.
Notes to Financial Statements
Note A -- Significant Accounting Policies
General: The Calvert Capital Accumulation Fund (the "Fund"), a series of Calvert World Values Fund, Inc., is registered under the Investment Company Act of 1940 as a non-diversified, open-end management investment company. The operation of each series is accounted for separately. The Fund offers four classes of shares of capital stock. Class A shares are sold with a maximum front-end sales charge of 4.75%. Class B shares are sold without a front-end sales charge. With certain exceptions, the Fund will impose a deferred sales charge at the time of redemption, depending on how long investors have owned the shares. Class C shares are sold without a front-end sales charge. With certain exceptions, the Fund will impose a deferred sales charge on shares sold within one year of purchase. Class B and Class C shares have higher levels of expenses than Class A shares. Class I shares require a minimum account balance of $1,000,000. The $1 million minimum initial investment may be waived for certain institutional ac counts, where it is believed to be in the best interest of the Fund and its shareholders. Class I shares have no front-end or deferred sales charge and have lower levels of expenses than Class A Shares. Each class has different: (a) dividend rates, due to differences in Distribution Plan expenses and other class-specific expenses, (b) exchange privileges; and (c) class-specific voting rights.
Security Valuation: Net asset value per share is determined every business day as of the close of the regular session of the New York Stock Exchange (generally 4:00 p.m. Eastern time). The Fund uses independent pricing services approved by the Board of Directors to value its investments wherever possible. Securities for which market quotations are available are valued at last sale price or official closing price on the primary market or exchange in which they trade. Short-term notes are stated at amortized cost, which approximates fair value. The Fund may invest in securities whose resale is subject to restrictions. Investments for which market quotations are not available or deemed not reliable are fair valued in good faith under the direction of the Board of Directors.
In determining fair value, the Board considers all relevant qualitative and quantitative information available. These factors are subject to change over time and are reviewed periodically. The values assigned to fair value investments are based on available information and do not necessarily represent amounts that might ultimately be realized. Further, because of the inherent uncertainty of valuation, those estimated values may differ significantly from the values that would have been used had a ready market for the investments existed, and the differences could be material.
At March 31, 2007, securities valued at $1,397,117, or 1.0% of net assets, were fair valued in good faith under the direction of the Board of Directors.
Repurchase Agreements: The Fund may enter into repurchase agreements with recognized financial institutions or registered broker/dealers and, in all instances, holds underlying securities with a value exceeding the total repurchase price, including accrued interest. Although risk is mitigated by the collateral, the Fund could experience a delay in recovering its value and a possible loss of income or value if the counterparty fails to perform in accordance with the terms of the agreement.
Restricted Securities: The Fund may invest in securities that are subject to legal or contractual restrictions on resale. Generally, these securities may only be sold publicly upon registration under the Securities Act of 1933 or in transactions exempt from such registration. Information regarding restricted securities is included at the end of the Fund's Statement of Net Assets.
Security Transactions and Net Investment Income: Security transactions are accounted for on trade date. Realized gains and losses are recorded on an identified cost basis and may include proceeds from litigation. Dividend income is recorded on the ex-dividend date. Distributions received on securities that represent a return of capital or capital gain are recorded as a reduction of cost investments and/or as a realized gain. Interest income, which includes amortization of premium and accretion of discount on debt securities, is accrued as earned. Investment income and realized and unrealized gains and losses are allocated to separate classes of shares based upon the relative net assets of each class. Expenses arising in connection with a class are charged directly to that class. Expenses common to the classes are allocated to each class in proportion to their relative net assets.
Distributions to Shareholders: Distributions to shareholders are recorded by the Fund on ex-dividend date. Dividends from net investment income and distributions from
net realized capital gains, if any, are paid at least annually. Distributions are determined
in accordance with income tax regulations which may differ from generally accepted accounting principles; accordingly, periodic reclassifications are made within the Fund's capital accounts to reflect income and gains available for distribution under income
tax regulations.
Estimates: The preparation of financial statements in conformity with accounting principles generally accepted in the United States requires management to make estimates and assumptions that affect the reported amounts of assets and liabilities and disclosure of contingent assets and liabilities at the date of the financial statements and the reported amounts of income and expenses during the reporting period. Actual results could differ from those estimates.
Redemption Fees: The Fund charges a 2% redemption fee on redemptions, including exchanges, made within 30 days of purchase in the same Fund (within seven days for Class I shares). The redemption fee is payable to the Class of the Fund from which the redemption is made, and is accounted for as an addition to paid-in capital. The fee is intended to discourage market-timers by ensuring that short-term trading costs are borne by the investors making the transactions and not the shareholders already in the Fund.
Expense Offset Arrangements: The Fund has an arrangement with its custodian
bank whereby the custodian's fees may be paid indirectly by credits earned on the Fund's cash on deposit with the bank. These credits are used to reduce the Fund's expenses. Such a deposit arrangement may be an alternative to overnight investments.
Federal Income Taxes: No provision for federal income or excise tax is required since the Fund intends to qualify as a regulated investment company under the Internal Revenue Code and to distribute substantially all of its taxable earnings.
New Accounting Pronouncements: In July 2006, the Financial Accounting Standards Board (FASB) released FASB Interpretation No. 48 "Accounting for Uncertainty in Income Taxes" -- an interpretation of FASB Statement 109 (FIN 48). FIN 48 provides guidance for how uncertain tax positions should be recognized, measured, presented and disclosed in the financial statements. FIN 48 requires the evaluation of tax positions taken in the course of preparing the Fund's tax returns to determine whether tax positions are "more-likely-than-not" of being sustained by the applicable tax authority. Tax benefits of positions not deemed to meet the more-likely-than-not threshold would be recorded as a tax expense in the current year. Adoption of FIN 48 is required for fiscal years beginning after December 15, 2006 and is to be applied to all open tax years as of the effective date. At this time, management is evaluating the implications of FIN 48 and its impact in the financial statements has not yet been determined.
In September 2006, the Financial Accounting Standards Board (FASB) issued Statement on Financial Accounting Standards (SFAS) No. 157, "Fair Value Measurements." This standard establishes a single authoritative definition of fair value, sets out a framework for measuring fair value and requires additional disclosures about fair value measurements. SFAS No. 157 applies to fair value measurements already required or permitted by existing standards. SFAS No. 157 is effective for financial statements issued for fiscal years beginning after November 15, 2007 and interim periods within those fiscal years. The changes to current generally accepted accounting principles from the application of this Statement relate to the definition of fair value, the methods used to measure fair value, and the expanded disclosures about fair value measurements. As of March 31, 2007, the Fund does not believe the adoption of SFAS No. 157 will impact the financial statement amounts, however, additional disclosures may be requi red about the inputs used to develop the measurements and the effect of certain of the measurements on changes in net assets for the period.
Note B -- Related Party Transactions
Calvert Asset Management Company, Inc. (the "Advisor") is wholly-owned by Calvert Group, Ltd. ("Calvert"), which is indirectly wholly owned by UNIFI Mutual Holding Company. The Advisor provides investment advisory services and pays the salaries and fees of officers and Directors of the Fund who are employees of the Advisor or its affiliates. For its services, the Advisor receives an annual fee, payable monthly, of .65% of the Fund's average daily net assets. Under the terms of the agreement, $74,838 was payable at period end. In addition, $42,903 was payable at period end for operating expenses paid by the Advisor during March 2007.
The Advisor has contractually agreed to limit net annual fund operating expenses through January 31, 2008 for Class I. The contractual expense cap is 0.86%. For the purposes of this expense limit, operating expenses do not include interest expense, brokerage commissions, taxes, and extraordinary expenses. To the extent that any offset credits are earned, the Advisor's obligation under the contractual limitation may be reduced and the Advisor may benefit from the expense offset arrangement.
Calvert Administrative Services Company, an affiliate of the Advisor, provides administrative services to the Fund for an annual fee, payable monthly of .25% for Class A, Class B and Class C, and .10% for Class I shares based on their average daily net assets. Under the terms of the agreement, $28,232 was payable at period end.
Calvert Distributors, Inc., an affiliate of the Advisor, is the distributor and principal underwriter for the Fund. Distribution Plans, adopted by Class A, Class B, and Class C shares, allow the Fund to pay the Distributor for expenses and services associated with distribution of shares. The expenses paid may not exceed .35%, 1.00% and 1.00% annually of average daily net assets of Class A, Class B, and Class C, respectively. The amount actually paid by the Fund, is an annualized fee, payable monthly of .35%, 1.00% and 1.00% of the Fund's average daily net assets of Class A, Class B, and Class C, respectively. Class I shares do not have Distribution Plan expenses. Under the terms of the agreement, $53,342 was payable at period end.
The Distributor received $16,269 as its portion of the commissions charged on sales of the Fund's Class A shares for the six months ended March 31, 2007.
Calvert Shareholder Services, Inc. ("CSSI"), an affiliate of the Advisor, acts as shareholder servicing agent for the Fund. For its services, CSSI received a fee of $62,211 for the six months ended March 31, 2007. Under the terms of the agreement, $9,071 was payable at period end. Boston Financial Data Services, Inc. is the transfer and dividend disbursing agent.
The Fund may invest in Community Investment Notes issued by the Calvert Social Investment Foundation (the "CSI Foundation"). The CSI Foundation is a 501(c)(3) non-profit organization that receives in-kind support from the Calvert Group, Ltd. and its subsidiaries. The Fund has received from the Securities and Exchange Commission an exemptive order permitting the Fund to make investments in these notes under certain conditions.
Each Director of the Fund who is not an employee of the Advisor or its affiliates receives an annual retainer of $34,000 plus a meeting fee of $2,000 for each Board meeting attended. An additional Chair support fee of $24,000 annually is paid to the Fund Chair. Additional fees of up to $10,000 annually may be paid to the Chairperson of special committees of the Board and the lead disinterested Director. Directors' fees are allocated to each of the funds served.
Note C -- Investment Activity
During the period, purchases and sales of investments, other than short-term securities, were $40,025,970 and $46,303,645, respectively.
The cost of investments owned at March 31, 2007 for federal income tax purposes was $120,148,298. Net unrealized appreciation aggregated $14,910,831, of which $21,767,801 related to appreciated securities and $6,856,970 related to depreciated securities.
Net realized capital loss carryforwards for federal income tax purposes of $1,854,355 at September 30, 2006 may be utilized to offset future capital gains until expiration in September 2011.
Note D -- Line of Credit
A financing agreement is in place with all Calvert Group Funds (except for the Calvert Social Investment Fund's Balanced and Enhanced Equity Portfolios, the CVS Calvert Social Balanced Portfolio and the CVS Ameritas Index 500 Portfolio) and State Street Corporation ("SSC"). Under the agreement, SSC provides an unsecured line of credit facility, in the aggregate amount of $50 million ($25 million committed and $25 million uncommitted), accessible by the Funds for temporary or emergency purposes only. Borrowings under the committed facility bear interest at the overnight Federal Funds Rate plus .50% per annum. A commitment fee of .10% per annum is incurred on the unused portion of the committed facility, which is allocated to all participating funds. The Fund had no loans outstanding pursuant to this line of credit at March 31, 2007. For the six months ended March 31, 2007, borrowings by the Fund under the Agreement were as follows:
| | | Weighted | | Month of |
| | Average | Average | Maximum | Maximum |
| | Daily | Interest | Amount | Amount |
| | Balance | Rate | Borrowed | Borrowed |
| | $6,191 | 5.86% | $294,711 | January 2007 |
Financial Highlights
| | | | Periods Ended | | |
| | | March 31, | September 30, | September 30, | |
Class A Shares | | 2007 | 2006 | 2005 | |
Net asset value, beginning | | $24.02 | $23.42 | $21.60 | |
Income from investment operations | | | | | |
Net investment income (loss) | | (.13) | (.27) | (.31) | |
Net realized and unrealized gain (loss) | | 2.44 | .87 | 2.13 | |
Total from investment operations | | 2.31 | .60 | 1.82 | |
Total increase (decrease) in net asset value | | 2.31 | .60 | 1.82 | |
Net asset value, ending | | $26.33 | $24.02 | $23.42 | |
| | | | | | |
Total return* | | 9.62% | 2.56% | 8.43% | |
Ratios to average net assets:A | | | | | |
Net investment income (loss) | | (1.01%) (a) | (1.05%) | (1.26%) | |
Total expenses | | 1.69% (a) | 1.71% | 1.68% | |
Expenses before offsets | | 1.69% (a) | 1.71% | 1.68% | |
Net expenses | | 1.67% (a) | 1.69% | 1.68% | |
Portfolio turnover | | 30% | 31% | 157% | |
Net assets, ending (in thousands) | | $105,993 | $103,499 | $110,970 | |
| | | | | | |
| | | | | | |
| | | | Years Ended | | |
| | | September 30, | September 30, | September 30, | |
Class A Shares | | 2004 | 2003 | 2002 | |
Net asset value, beginning | | $19.82 | $15.79 | $19.35 | |
Income from investment operations | | | | | |
Net investment income (loss) | | (.32) | (.26) | (.29) | |
Net realized and unrealized gain (loss) | | 2.10 | 4.29 | (3.26) | |
Total from investment operations | | 1.78 | 4.03 | (3.55) | |
Distributions from | | | | | |
Net realized gain | | -- | -- | (.01) | |
Total distributions | | -- | -- | (.01) | |
Total increase (decrease) in net asset value | | 1.78 | 4.03 | (3.56) | |
Net asset value, ending | | $21.60 | $19.82 | $15.79 | |
| | | | | | |
Total return* | | 8.98% | 25.52% | (18.36%) | |
Ratios to average net assets:A | | | | | |
Net investment income (loss) | | (1.41%) | (1.48%) | (1.47%) | |
Total expenses | | 1.73% | 1.82% | 1.74% | |
Expenses before offsets | | 1.73% | 1.82% | 1.74% | |
Net expenses | | 1.72% | 1.81% | 1.73% | |
Portfolio turnover | | 101% | 170% | 93% | |
Net assets, ending (in thousands) | | $111,520 | $104,878 | $83,643 | |
| | | | | | |
| | | | | | |
Financial Highlights | | | | | |
| | | | | | |
| | | | | | |
| | | | Periods Ended | | |
| | | March 31, | September 30, | September 30, | |
Class B Shares | | 2007 | 2006 | 2005 | |
Net asset value, beginning | | $22.13 | $21.76 | $20.24 | |
Income from investment operations | | | | | |
Net investment income (loss) | | (.24) | (.49) | (.49) | |
Net realized and unrealized gain (loss) | | 2.26 | .86 | 2.01 | |
Total from investment operations | | 2.02 | .37 | 1.52 | |
Total increase (decrease) in net asset value | | 2.02 | .37 | 1.52 | |
Net asset value, ending | | $24.15 | $22.13 | $21.76 | |
| | | | | | |
Total return* | | 9.13% | 1.70% | 7.51% | |
Ratios to average net assets:A | | | | | |
Net investment income (loss) | | (1.89%) (a) | (1.91%) | (2.12%) | |
Total expenses | | 2.56% (a) | 2.57% | 2.54% | |
Expenses before offsets | | 2.56% (a) | 2.57% | 2.54% | |
Net expenses | | 2.54% (a) | 2.55% | 2.53% | |
Portfolio turnover | | 30% | 31% | 157% | |
Net assets, ending (in thousands) | | $12,752 | $13,752 | $16,503 | |
| | | | | | |
| | | | | | |
| | | | Years Ended | | |
| | | September 30, | September 30, | September 30, | |
Class B Shares | | 2004 | 2003 | 2002 | |
Net asset value, beginning | | $18.73 | $15.07 | $18.64 | |
Income from investment operations | | | | | |
Net investment income (loss) | | (.48) | (.39) | (.44) | |
Net realized and unrealized gain (loss) | | 1.99 | 4.05 | (3.12) | |
Total from investment operations | | 1.51 | 3.66 | (3.56) | |
Distributions from | | | | | |
Net realized gain | | -- | -- | (.01) | |
Total distributions | | -- | -- | (.01) | |
Total increase (decrease) in net asset value | | 1.51 | 3.66 | (3.57) | |
Net asset value, ending | | $20.24 | $18.73 | $15.07 | |
| | | | | | |
Total return* | | 8.06% | 24.29% | (19.11%) | |
Ratios to average net assets:A | | | | | |
Net investment income (loss) | | (2.28%) | (2.45%) | (2.38%) | |
Total expenses | | 2.60% | 2.79% | 2.65% | |
Expenses before offsets | | 2.60% | 2.79% | 2.65% | |
Net expenses | | 2.59% | 2.78% | 2.64% | |
Portfolio turnover | | 101% | 170% | 93% | |
Net assets, ending (in thousands) | | $16,936 | $15,152 | $11,534 | |
| | | | | | |
| | | | | | |
Financial Highlights | | | | | |
| | | | | | |
| | | | | | |
| | | | Periods Ended | | |
| | | March 31, | September 30, | September 30, | |
Class C Shares | | 2007 | 2006 | 2005 | |
Net asset value, beginning | | $21.47 | $21.10 | $19.62 | |
Income from investment operations | | | | | |
Net investment income (loss) | | (.21) | (.42) | (.44) | |
Net realized and unrealized gain (loss) | | 2.19 | .79 | 1.92 | |
Total from investment operations | | 1.98 | .37 | 1.48 | |
Total increase (decrease) in net asset value | | 1.98 | .37 | 1.48 | |
Net asset value, ending | | $23.45 | $21.47 | $21.10 | |
| | | | | | |
Total return* | | 9.22% | 1.75% | 7.54% | |
Ratios to average net assets:A | | | | | |
Net investment income (loss) | | (1.78%) (a) | (1.84%) | (2.07%) | |
Total expenses | | 2.45% (a) | 2.49% | 2.49% | |
Expenses before offsets | | 2.45% (a) | 2.49% | 2.49% | |
Net expenses | | 2.44% (a) | 2.47% | 2.49% | |
Portfolio turnover | | 30% | 31% | 157% | |
Net assets, ending (in thousands) | | $13,190 | $12,831 | $14,038 | |
| | | | | | |
| | | | | | |
| | | | Years Ended | | |
| | | September 30, | September 30, | September 30, | |
Class C Shares | | 2004 | 2003 | 2002 | |
Net asset value, beginning | | $18.15 | $14.59 | $18.02 | |
Income from investment operations | | | | | |
Net investment income (loss) | | (.43) | (.37) | (.42) | |
Net realized and unrealized gain (loss) | | 1.90 | 3.93 | (3.00) | |
Total from investment operations | | 1.47 | 3.56 | (3.42) | |
Distributions from | | | | | |
Net realized gain | | -- | -- | (.01) | |
Total distributions | | -- | -- | (.01) | |
Total increase (decrease) in net asset value | | 1.47 | 3.56 | (3.43) | |
Net asset value, ending | | $19.62 | $18.15 | $14.59 | |
| | | | | | |
Total return* | | 8.10% | 24.40% | (18.99%) | |
Ratios to average net assets:A | | | | | |
Net investment income (loss) | | (2.23%) | (2.35%) | (2.32%) | |
Total expenses | | 2.55% | 2.69% | 2.59% | |
Expenses before offsets | | 2.55% | 2.69% | 2.59% | |
Net expenses | | 2.54% | 2.68% | 2.58% | |
Portfolio turnover | | 101% | 170% | 93% | |
Net assets, ending (in thousands) | | $12,914 | $10,896 | $8,365 | |
| | | | | | |
| | | | | | |
Financial Highlights | | | | | |
| | | | | | |
| | | | | | |
| | | | Periods Ended | | |
| | | March 31, | September 30, | September 30, | |
Class I Shares | | 2007 | 2006 | 2005 | |
Net asset value, beginning | | $24.73 | $23.89 | $21.85 | |
Income from investment operations | | | | | |
Net investment income (loss) | | (.02) | (.02) | (.06) | |
Net realized and unrealized gain (loss) | | 2.50 | .86 | 2.10 | |
Total from investment operations | | 2.48 | .84 | 2.04 | |
Total increase (decrease) in net asset value | | 2.48 | .84 | 2.04 | |
Net asset value, ending | | $27.21 | $24.73 | $23.89 | |
| | | | | | |
Total return* | | 10.03% | 3.52% | 9.34% | |
Ratios to average net assets:A | | | | | |
Net investment income (loss) | | (0.20%) (a) | (0.20%) | (0.43%) | |
Total expenses | | 1.19% (a) | 1.90% | 1.28% | |
Expenses before offsets | | .87% (a) | .88% | .87% | |
Net expenses | | .86% (a) | .86% | .86% | |
Portfolio turnover | | 30% | 31% | 157% | |
Net assets, ending (in thousands) | | $4,407 | $3,273 | $2,596 | |
| | | | | | |
| | | | | | |
| | | | Periods Ended | | |
| | | September 30, | September 30, | January 18, | |
Class I Shares | | 2004 | 2003## | 2002# | |
Net asset value, beginning | | $19.88 | $18.79 | $20.84 | |
Income from investment operations | | | | | |
Net investment income (loss) | | (.09) | (.03) | (.05) | |
Net realized and unrealized gain (loss) | | 2.06 | 1.12 | 4.20 | |
Total from investment operations | | 1.97 | 1.09 | 4.15 | |
Distributions from | | | | | |
Net realized gain | | -- | -- | (.01) | |
Total distributions | | -- | -- | (.01) | |
Total increase (decrease) in net asset value | | 1.97 | 1.09 | 4.14 | |
Net asset value, ending | | $21.85 | $19.88 | $24.98 | |
| | | | | | |
Total return* | | 9.91% | 5.80% | 19.92% | |
Ratios to average net assets:A | | | | | |
Net investment income (loss) | | (0.54%) | (0.50%) (a) | (0.64%) (a) | |
Total expenses | | 1.23% | 1.23% (a) | 1,316.21%(a) | |
Expenses before offsets | | .86% | .87% (a) | .80% (a) | |
Net expenses | | .86% | .86% (a) | .80% (a) | |
Portfolio turnover | | 101% | 66% | 9% | |
Net assets, ending (in thousands) | | $955 | $529 | $0 | |
A Total expenses do not reflect amounts reimbursed and/or waived by the Advisor or reductions from expense offset arrangements. Expenses before offsets reflect expenses after reimbursement and/or waiver by the Advisor but prior to reductions from expense offset arrangements. Net expenses are net of all reductions and represent the net expenses paid by the Fund.
(a) Annualized.
* Total return is not annualized for periods less than one year and does not reflect deduction of any front-end or deferred sales charge.
# The last remaining shareholder in Class I redeemed on January 18, 2002.
## Class I shares resumed upon shareholder investment on June 3, 2003.
See notes to financial statements.
Explanation of Financial Tables
Schedule of Investments
The Schedule of Investments is a snapshot of all securities held in the fund at their market value, on the last day of the reporting period. Securities are listed by asset type (e.g., common stock, corporate bonds, U.S. government obligations) and may be further broken down into sub-groups and by industry classification.
Statement of Assets and Liabilities
The Statement of Assets and Liabilities is often referred to as the fund's balance sheet. It lists the value of what the fund owns, is due and owes on the last day of the reporting period. The fund's assets include the market value of securities owned, cash, receivables for securities sold and shareholder subscriptions, and receivables for dividends and interest payments that have been earned, but not yet received. The fund's liabilities include payables for securities purchased and shareholder redemptions, and expenses owed but not yet paid. The statement also reports the fund's net asset value (NAV) per share on the last day of the reporting period. The NAV is calculated by dividing the fund's net assets (assets minus liabilities) by the number of shares outstanding. This statement is accompanied by a Schedule of Investments. Alternatively, if certain conditions are met, a Statement of Net Assets may be presented in lieu of this statement and the Schedule of Investments.
Statement of Net Assets
The Statement of Net Assets provides a detailed list of the fund's holdings, including each security's market value on the last day of the reporting period. The Statement of Net Assets includes a Schedule of Investments. Other assets are added and other liabilities subtracted from the investments total to calculate the fund's net assets. Finally, net assets are divided by the outstanding shares of the fund to arrive at its share price, or Net Asset Value (NAV) per share.
At the end of the Statement of Net Assets is a table displaying the composition of the fund's net assets. Paid in Capital is the money invested by shareholders and represents the bulk of net assets. Undistributed Net Investment Income and Accumulated Net Realized Gains usually approximate the amounts the fund had available to distribute to shareholders as of the statement date. Accumulated Realized Losses will appear as negative balances. Unrealized Appreciation (Depreciation) is the difference between the market value of the fund's investments and their cost, and reflects the gains (losses) that would be realized if the fund were to sell all of its investments at their statement-date values.
Statement of Operations
The Statement of Operations summarizes the fund's investment income earned and expenses incurred in operating the fund. Investment income includes dividends earned from stocks and interest earned from interest-bearing securities in the fund. Expenses incurred in operating the fund include the advisory fee paid to the investment advisor, administrative services fee, distribution plan expenses (if applicable), transfer agent fees, shareholder servicing expenses, custodial, legal, and audit fees, and the printing and postage expenses related to shareholder reports. Expense offsets (fees paid indirectly) are also shown. Credits earned from offset arrangements are used to reduce the fund's expenses. This statement also shows net gains (losses) realized on the sale of investments and the increase or decrease in the unrealized appreciation (depreciation) on investments held during the period.
Statement of Changes in Net Assets
The Statement of Changes in Net Assets shows how the fund's total net assets changed during the two most recent reporting periods. Changes in the fund's net assets are attributable to investment operations, distributions and capital share transactions.
The Operations section of the report summarizes information detailed in the Statement of Operations. The Distribution section shows the dividend and capital gain distributions made to shareholders. The amounts shown as distributions in this section may not match the net investment income and realized gains amounts shown in the Operations section because distributions are determined on a tax basis and certain investments or transactions may be treated differently for financial statement and tax purposes. The Capital Share Transactions section shows the amount shareholders invested in the fund, either by purchasing shares or by reinvesting distributions, and the amounts redeemed. The corresponding numbers of shares issued, reinvested and redeemed are shown at the end of the report.
Financial Highlights
The Financial Highlights table provides a per-share breakdown per class of the components that affect the fund's net asset value for current and past reporting periods. The table provides total return, total distributions, expense ratios, portfolio turnover and net assets for the applicable period. Total return is a measure of a fund's performance that encompasses all elements of return: dividends, capital gain distributions and changes in net asset value. Total return is the change in value of an investment over a given period, assuming reinvestment of any dividends and capital gain distributions, expressed as a percentage of the initial investment. Total distributions include distributions from net investment income and net realized gains. Long-term gains are earned on securities held in the fund more than one year. Short-term gains, on the sale of securities held less than one year, are treated as ordinary dividend income for tax purposes. The expense ratio is a fund's cost of doing business, ex pressed as a percentage of net assets. These expenses directly reduce returns to shareholders. Portfolio turnover measures the trading activity in a fund's investment portfolio -- how often securities are bought and sold by a fund. Portfolio turnover is affected by market conditions, changes in the size of the fund, the nature of the fund's investments and the investment style of the portfolio.
PROXY VOTING
The Proxy Voting Guidelines of the Calvert Funds that the Fund uses to determine how to vote proxies relating to portfolio securities are provided as an Appendix to the Fund's Statement of Additional Information. The Statement of Additional Information can be obtained free of charge by calling the Fund at 1-800-368-2745, by visiting the Calvert website at www.calvert.com; or by visiting the SEC's website at www.sec.gov.
Information regarding how the Fund voted proxies relating to portfolio securities during the most recent 12-month period ended June 30 is available on the Fund's website at www.calvert.com and on the SEC's website at www.sec.gov.
AVAILABILITY OF QUARTERLY PORTFOLIO HOLDINGS
The Fund files its complete schedule of portfolio holdings with the SEC for the first and third quarters of each fiscal year on Form N-Q. The Fund's Form N-Q is available on the SEC's website at www.sec.gov. The Fund's Form N-Q may be reviewed and copied at the SEC's Public Reference Room in Washington, DC; information on the operation of the Public Reference Room may be obtained by calling 1-800-SEC-0330.
BASIS FOR BOARD'S APPROVAL OF INVESTMENT ADVISORY CONTRACT
At a meeting held on December 5, 2006, the Board of Directors, and by a separate vote, the disinterested Directors, approved the continuance of the Investment Advisory Agreement between Calvert World Values Fund, Inc. and the Advisor and the Investment Subadvisory Agreement between the Advisor and the Subadvisor with respect to the Fund.
In evaluating the Investment Advisory Agreement, the Board considered a variety of information relating to the Fund and the Advisor. The disinterested Directors reviewed a report prepared by the Advisor regarding various services provided to the Fund by the Advisor and its affiliates. Such report included, among other data, information regarding the Advisor's personnel and the Advisor's revenue and cost of providing services to the Fund, and a separate report prepared by an independent third party, which provided a statistical analysis comparing the Fund's investment performance, expenses, and fees to comparable mutual funds.
The disinterested Directors were separately represented by independent legal counsel with respect to their consideration of the reapproval of the Investment Advisory Agreement and the Investment Subadvisory Agreement. Prior to voting, the disinterested Directors reviewed the proposed continuance of the Investment Advisory Agreement and Investment Subadvisory Agreement with management and also met in private sessions with their counsel at which no representatives of management were present.
In the course of its deliberations regarding the Investment Advisory Agreement, the Board considered the following factors, among others: the nature, extent and quality of the services provided by the Advisor, including the personnel providing such services; the Advisor's financial condition; the level and method of computing the Fund's advisory fee; comparative performance, fee and expense information for the Fund; the profitability of the Calvert Group of Funds to the Advisor; the allocation of the Fund's brokerage, including the Advisor's process for monitoring "best execution"; the direct and indirect benefits, if any, derived by the Advisor from its relationship with the Fund; the effect of the Fund's growth and size on the Fund's performance and expenses; the affiliated distributor's process for monitoring sales load breakpoints; the Advisor's compliance programs and policies; the Advisor's performance of substantially similar duties for other funds; and any possible conflicts of interest.
In considering the nature, extent and quality of the services provided by the Advisor under the Investment Advisory Agreement, the Board reviewed information provided by the Advisor relating to its operations and personnel, including, among other information, biographical information on the Advisor's supervisory and professional staff and descriptions of its organizational and management structure. The Board also took into account similar information provided periodically throughout the previous year by the Advisor as well as the Board's familiarity with the Advisor's senior management through Board of Directors' meetings, discussions and other reports. The Advisor's administrative capabilities, including its ability to supervise the other service providers for the Fund, were also considered. The Board discussed the Advisor's effectiveness in monitoring the performance of the Subadvisor and its timeliness in responding to performance issues. The Board concluded that it was satisfied with the nature, e xtent and quality of services provided to the Fund by the Advisor under the Investment Advisory Agreement.
In considering the Fund's performance, the Board noted that it reviewed on a quarterly basis detailed information about the Fund's performance results, portfolio composition and investment strategies. The Board also reviewed various comparative data provided to it in connection with its consideration of the renewal of the Investment Advisory Agreement, including, among other information, a comparison of the Fund's total return with its Lipper index and with that of other mutual funds deemed to be in its peer group by an independent third party in its report. This comparison indicated that for the one-, two-, three-, four- and five-year annualized periods ended June 30, 2006, the Fund's performance was below the median of its peer group and above the median of its peer group for the ten-year annualized period ended June 30, 2006. The Fund underperformed its Lipper index for the same one-, two-, three-, four-, five- and ten-year annualized periods. The Board took into account the steps management had ta ken in an attempt to improve the Fund's performance, including the replacement of the Fund's Subadvisor in September, 2005 and noted that the Fund's performance prior to September, 2005 was attributable to the Fund's previous subadvisor. Based upon its review, the Board concluded that appropriate action had been taken by the Advisor to address the Fund's performance.
In considering the Fund's fees and expenses, the Board compared the Fund's fees and total expense ratio with various comparative data for the funds in its peer group. Among other findings, the data indicated that the Fund's advisory fee was below the median of its peer group and that total expenses were above the median of its peer group. The Board noted the Advisor's discussion of the Fund's expenses and certain factors that affected the level of such expenses. Based upon its review, the Board determined that the advisory fee was reasonable in view of the quality of services provided by the Advisor and the other factors considered.
In reviewing the overall profitability of the advisory fee to the Fund's Advisor, the Board also considered the fact that affiliates of the Advisor provided shareholder servicing and administrative services to the Fund for which they received compensation. The information considered by the Board included Calvert's operating profit margin information both before and after tax expenses with respect to the services that the Advisor and its affiliates provided to the Calvert Group of Funds complex. The Board reviewed the profitability of the Advisor's relationship with the Fund in terms of the total amount of annual advisory fees it received with respect to the Fund and whether the Advisor had the financial wherewithal to continue to provide a high level of services to the Fund. The Board also considered that the Advisor derived benefits to its reputation and other indirect benefits from its relationship with the Fund. The Board also noted that the Advisor paid the subadvisory fee to the Subadvisor. Base d upon its review, the Board concluded that the Advisor's level of profitability from its relationship with the Fund was reasonable.
The Board considered the effect of the Fund's size and potential growth on its performance and expenses. The Board concluded that adding breakpoints to the advisory fee at specified asset levels would not be appropriate given the Fund's current size. The Board also noted that if the Fund's assets increased over time, the Fund might realize other economies of scale if assets increased proportionally more than certain other expenses.
In reapproving the Investment Advisory Agreement, the Board, including the disinterested Directors, did not identify any single factor as controlling, and each Director attributed different weight to various factors.
In evaluating the Investment Subadvisory Agreement, the disinterested Directors reviewed information provided by the Subadvisor relating to its operations, personnel, investment philosophy, strategies and techniques. Among other information, the Subadvisor provided biographical information on portfolio management and other professional staff, performance information for itself, and descriptions of its investment philosophies, strategies and techniques, organizational and management structures and brokerage policies and practices.
The Board reapproved the Investment Subadvisory Agreement between the Subadvisor and the Advisor based on a number of factors relating to the Subadvisor's ability to perform under the Investment Subadvisory Agreement. In the course of its deliberations, the Board evaluated, among other factors: the nature, extent and the quality of the services to be provided by the Subadvisor; the Subadvisor's management style and long-term performance record; the Fund's performance record and the Subadvisor's performance in employing its investment strategies; the Subadvisor's current level of staffing and its overall resources; the qualifications and experience of the Subadvisor's personnel; the Subadvisor's financial condition with respect to its ability to perform the services required under the Investment Subadvisory Agreement; the Subadvisor's compliance systems, including those related to personal investing; and any disciplinary history. Based upon its review, the Board concluded that it was satisfied with the nature, extent and quality of services provided to the Fund by the Subadvisor under the Investment Subadvisory Agreement.
As noted above, the Board considered, among other information, the Fund's performance during the one-, two-, three-, four-, five- and ten-year annualized periods ended June 30, 2006 as compared to the Fund's peer group and noted that it reviewed on a quarterly basis detailed information about the Fund's performance results, portfolio composition and investment strategies. The Board noted the Advisor's expertise and resources in monitoring the performance, investment style and risk adjusted performance of the Subadvisor.
In considering the cost of services to be provided by the Subadvisor and the profitability to the Subadvisor of its relationship with the Fund, the Board noted that the subadvisory fee under the Investment Subadvisory Agreement was paid by the Advisor out of the advisory fee that the Advisor received under the Investment Advisory Agreement. The Board also relied on the ability of the Advisor to negotiate the Investment Subadvisory Agreement and the corresponding subadvisory fee at arm's length. Based upon its review, the Board determined that the subadvisory fee was reasonable. For each of the above reasons, the cost of services to be provided by the Subadvisor and the profitability to the Subadvisor of its relationship with the Fund were not material factors in the Board's deliberations. For similar reasons, the Board did not consider the potential economies of scale in the Subadvisor's management of the Fund to be a material factor in its consideration.
In reapproving the Investment Subadvisory Agreement, the Board, including the disinterested Directors, did not identify any single factor as controlling, and each Director attributed different weight to various factors.
Conclusions
The Board reached the following conclusions regarding the Investment Advisory Agreement and the Investment Subadvisory Agreement, among others: (a) the Advisor had demonstrated that it possessed the capability and resources to perform the duties required of it under the Investment Advisory Agreement; (b) the Subadvisor was qualified to manage the Fund's assets in accordance with the Fund's investment objectives and policies; (c) the Advisor and Subadvisor maintained appropriate compliance programs; (d) the Subadvisor was likely to execute its investment strategies consistently over time; (e) appropriate action had been taken by the Advisor to address the Fund's performance; and (f) the Fund's advisory and subadvisory fees were reasonable relative to those of similar funds and to the services to be provided by the Advisor and the Subadvisor. Based on its conclusions, the Board determined that reapproval of the Investment Advisory Agreement and the Investment Subadvisory Agreement was in the interests of the Fund and its shareholders.
Calvert Capital Accumulation Fund
To Open an Account
800-368-2748
Yields and Prices
Calvert Information Network
(24 hours, 7 days a week)
800-368-2745
Service for Existing Account
Shareholders: 800-368-2745
Brokers: 800-368-2746
TDD for Hearing Impaired
800-541-1524
Branch Office
4550 Montgomery Avenue
Suite 1000 North
Bethesda, Maryland 20814
Registered, Certified
or Overnight Mail
Calvert Group
c/o BFDS
330 West 9th Street
Kansas City, MO 64105
Web Site
http://www.calvert.com
Note: The information on our website is not incorporated by reference into this report; our website address is included as an inactive textual reference only.
Principal Underwriter
Calvert Distributors, Inc.
4550 Montgomery Avenue
Suite 1000 North
Bethesda, Maryland 20814
This report is intended to provide fund information to shareholders. It is not authorized for distribution to prospective investors unless preceded or accompanied by a prospectus.
Calvert's Family of Funds
Tax-Exempt
Money Market Funds
CTFR Money Market Portfolio
Taxable Money Market Funds
First Government Money Market Fund
CSIF Money Market Portfolio
Municipal Funds
CTFR Limited-Term Portfolio
CTFR Long-Term Portfolio
CTFR Vermont Municipal Portfolio
National Muni. Intermediate Fund
Taxable Bond Funds
CSIF Bond Portfolio
Income Fund
Short Duration Income Fund
Long-Term Income Fund
Ultra-Short Floating Income Fund
Equity Funds
CSIF Enhanced Equity Portfolio
CSIF Equity Portfolio
Calvert Large Cap Growth Fund
Capital Accumulation Fund
CWV International Equity Fund
New Vision Small Cap Fund
Calvert Social Index Fund
Calvert Small Cap Value Fund
Calvert Mid Cap Value Fund
Balanced and Asset Allocation Funds
CSIF Balanced Portfolio
Calvert Conservative Allocation Fund
Calvert Moderate Allocation Fund
Calvert Aggressive Allocation Fund
printed on recycled paper using soy-based inks
<PAGE>
Item 2. Code of Ethics.
Not applicable.
Item 3. Audit Committee Financial Expert.
Not applicable.
Item 4. Principal Accountant Fees and Services.
Not applicable.
Item 5. Audit Committee of Listed Registrants.
Not applicable.
Item 6. Schedule of Investments.
This Schedule is included as part of the report to shareholders filed under Item 1 of this Form.
Item 7. Disclosure of Proxy Voting Policies and Procedures for Closed-End Management Investment Companies.
Not applicable.
Item 8. Portfolio Managers of Closed-End Management Investment Companies.
Not applicable.
Item 9. Purchases of Equity Securities by Closed-End Management Investment Company and Affiliated Purchasers.
Not applicable.
Item 10. Submission of Matters to a Vote of Security Holders.
No material changes to the procedures by which shareholders may recommend nominees to the registrant's Board of Directors since last disclosure in response to this Item on registrant's Form N-CSR for the period ending September 30, 2006.
Item 11. Controls and Procedures.
(a) The principal executive and financial officers concluded that the registrant's disclosure controls and procedures (as defined in Rule 30a-3(c) under the 1940 Act) are effective, based on the evaluation of these controls and procedures required by Rule 30a-3(b) under the 1940 Act and Rules 13a-15(b) or 15d-15(b) under the Exchange Act, as of a date within 90 days of the filing date of this report.
(b) There was no change in the registrant's internal control over financial reporting (as defined in Rule 30a-3(d) under the 1940 Act) that occurred during the registrant's second fiscal quarter of the period covered by this report that has materially affected, or is reasonably likely to materially affect, the registrant's internal control over financial reporting.
Item 12. Exhibits.
(a)(1) Not applicable.
(a)(2) A separate certification for each principal executive officer and principal financial officer of the registrant as required by Rule 30a-2 under the Act (17 CFR 270.30a-2).
Attached hereto.
(a)(3) Not applicable.
(b) A certification for the registrant's Principal Executive Officer and Principal Financial Officer, as required by Rule 30a-2(b) under the Investment Company Act of 1940, is attached hereto. The certification furnished pursuant to this paragraph is not deemed to be "filed" for purposes of Section 18 of the Securities Exchange Act of 1934, or otherwise subject to the liability of that section. Such certification is not deemed to be incorporated by reference into any filing under the Securities Act of 1933 or the Securities Exchange Act of 1934, except to the extent that the registrant specifically incorporates it by reference.
Pursuant to the requirements of the Securities Exchange Act of 1934 and the Investment Act of 1940, the registrant has duly caused this report to be signed on its behalf by the undersigned, thereunto duly authorized.
CALVERT WORLD VALUES FUND, INC.
By: | /s/ Barbara J. Krumsiek
Barbara J. Krumsiek
President -- Principal Executive Officer |
| |
| |
Date: | June 1, 2007 |
Pursuant to the requirements of the Securities Exchange Act of 1934 and the Investment Act of 1940, this report has been signed below by the following persons on behalf of the registrant and in the capacities and on the dates indicated.
/s/ Barbara J. Krumsiek
Barbara J. Krumsiek
President -- Principal Executive Officer
Date: June 1, 2007
/s/ Ronald M. Wolfsheimer
Ronald M. Wolfsheimer
Treasurer -- Principal Financial Officer
Date: June 1, 2007