UNITED STATES
SECURITIES AND EXCHANGE COMMISSION
Washington, D.C. 20549
FORM N-CSR
CERTIFIED SHAREHOLDER REPORT OF REGISTERED
MANAGEMENT INVESTMENT COMPANIES
Investment Company Act file number: 811-6563
CALVERT WORLD VALUES FUND, INC.
(Exact name of registrant as specified in charter)
4550 Montgomery Avenue
Suite 1000N
Bethesda, Maryland 20814
(Address of Principal Executive Offices)
William M. Tartikoff, Esq.
4550 Montgomery Avenue
Suite 1000N
Bethesda, Maryland 20814
(Name and Address of Agent for Service)
Registrant's telephone number, including area code: (301) 951-4800
Date of fiscal year end: September 30
Date of reporting period: Six months ended March 31, 2011
Item 1. Report to Stockholders.

INFORMATION REGARDING CALVERT OPERATING COMPANY
NAME CHANGES
Effective on April 30, 2011, the following Calvert operating companies will be renamed as indicated:
| | |
| Current Company Name | Company Name on 4/30/11 | Company Description |
| |
| Calvert Group, Ltd. | Calvert Investments, Inc. | Corporate parent of each |
| | | operating company listed |
| | | below |
| |
| Calvert Asset Management | Calvert Investment | Investment advisor to the |
| Company, Inc. | Management, Inc. | Calvert Funds |
| |
| Calvert Distributors, Inc. | Calvert Investment Distributors, | Principal underwriter |
| | Inc. | and distributor for the |
| | | Calvert Funds |
| |
| Calvert Administrative | Calvert Investment | Administrative services |
| Services Company | Administrative Services, Inc. | provider for the Calvert |
| | | Funds |
| |
| Calvert Shareholder | Calvert Investment Services, | Shareholder servicing |
| Services, Inc. | Inc. | provider for the Calvert |
| | | Funds |
Choose Planet-friendly E-delivery!
Sign up now for on-line statements, prospectuses, and fund reports. In less than five minutes you can help reduce paper mail and lower fund costs.
Just go to www.calvert.com. If you already have an online account at Calvert, click on My Account, and select the documents you would like to receive via e-mail.
If you’re new to online account access, click on Login/Register to open an online account. Once you’re in, click on the E-delivery sign-up at the bottom of the Account Portfolio page and follow the quick, easy steps. Note: if your shares are not held directly at Calvert but through a brokerage firm, you must contact your broker for electronic delivery options available through their firm.
Dear Shareholders:
The financial markets ended the six-month reporting period on a high note. The Federal Reserve’s announcement in the fall of 2010 of a second round of quantitative easing (QE2) initially buoyed the markets, which were further bolstered by the extension in December of the Bush-era tax cuts for all income levels. The resulting increase in U.S. consumer spending and confidence helped drive a year-end rally.
This calm lasted until new storms arrived in the beginning of 2011. Civil and political unrest in the Middle East and North Africa sent the price of energy soaring and heightened energy security concerns in many countries around the world. In March, the tragic earthquake and tsunami struck Japan. Our sympathies go out to the people of Japan who lost loved ones in this disaster. The earthquake—and its impact on the country’s nuclear reactors—roiled global financial markets. The cumulative effect of these events sparked a stock market sell-off before equities rebounded strongly in the final two weeks of the reporting period.
Markets Continue to Pick Up Steam
The stock market generally continued its upward momentum throughout the six-month period—with help from a strong fourth-quarter earnings season. Both U.S. growth- and value-oriented stocks reported significant gains across all capitalizations. In fact, the large-cap Russell 1000 Index and Standard & Poor’s 500 Index rose 18.13% and 17.31%, respectively, for the six-month period. Small- and mid-cap indices posted even higher returns as investors’ appetite for risk continued to strengthen.
However, continued uncertainty about the sovereign debt situation in some European countries as well as a drag from emerging markets tempered returns abroad, with the MSCI EAFE Index of international stocks returning 10.33% for the six-month period. Also, corporate bonds edged down slightly for the period, with the Barclays Capital U.S. Credit Index returning -0.98%. Money market returns remained flat, reflecting the Fed’s efforts to keep its target interest rate low.
Board Diversity and Company Competitiveness
At Calvert, we believe that companies with high standards of corporate governance, including diverse boards, are better positioned to compete in the global marketplace and to potentially outperform their peers. As a result, we continue to use our role as sustainable and responsible investors to encourage companies to clearly define diversity as inclusive of gender, ethnic, and racial backgrounds and to publicly commit to increasing diversity—on their boards and throughout their organizations.
We celebrated the first anniversary of the publication of the Women’s Empowerment Principles (WEP) and the 100th anniversary of International Women’s Day in March with a two-day event sponsored by the United Nations Women and the United Nations Global Compact. The WEP were established through collaboration between the United Nations
| www. | calvert.com CALVERT INTERNATIONAL EQUITY FUND SEMI-ANNUAL REPORT (UNAUDITED) 4 |
Women and the United Nations Global Compact in March 2010. Calvert continues to be an integral player in furthering the adoption of the WEP across the globe. In fact, more than 140 CEOs worldwide have signed a statement of support for the WEP, in part due to Calvert’s efforts.
Also, our October 2010 diversity report “Examining the Cracks in the Ceiling” has been making news by being cited in more than 40 articles from outlets such as The Washington Post, Forbes, and The New York Times. While we are pleased to see such strong media interest in this topic, we’re even more pleased that the report has led to Calvert having conversations with more than a dozen companies about their diversity scores and actions they can take to improve their overall diversity performance.
Opportunities and Challenges Ahead
Overall, we are encouraged by the market’s ability to move ahead despite the recent troubles in the Middle East and Japan, and we expect a slow, gradual economic recovery to continue throughout the remainder of the year. A low core inflation rate (which excludes food and energy prices) will likely facilitate economic growth, while continued debt reduction, lingering high unemployment, and a struggling housing market should limit gains. Energy prices will remain a challenge until we see more resolution of the issues in the Middle East and North Africa. Of course, more geopolitical crises, rising commodity prices, and inflation spikes could certainly dampen the markets.
In short, we are optimistic and believe the markets, the global economy, and your Calvert funds can successfully navigate through any temporary setbacks that may lie ahead.
Discuss Your Portfolio Allocations with Your Advisor
Given the market shifts we have experienced, your overall portfolio asset allocation and investment strategy may no longer match your needs. Therefore, we recommend reviewing these with your financial advisor to ensure that your target mix of U.S. and international stocks, bonds, and cash is well-diversified and appropriate given your financial goals, time horizon, and risk tolerance.
We encourage you to visit our website, www.calvert.com, for fund information and updates as well as market and economic commentary from Calvert professionals.
| www. | calvert.com CALVERT INTERNATIONAL EQUITY FUND SEMI-ANNUAL REPORT (UNAUDITED) 5 |
As noted elsewhere in this report, the Calvert operating companies that provide services to the funds will change their names effective April 30, 2011. As part of the changes, Calvert Group, Ltd. will be known as Calvert Investments, Inc., and the funds’ advisor, Calvert Asset Management Company, Inc., will be known as Calvert Investment Management, Inc. As always, we appreciate your investing with Calvert.

Barbara J. Krumsiek
President and CEO
Calvert Investments, Inc.
April 2011
| www. | calvert.com CALVERT INTERNATIONAL EQUITY FUND SEMI-ANNUAL REPORT (UNAUDITED) 6 |
SRI
Update
from the Calvert Sustainability
Research Department
Responsible management of environmental, social, and governance (ESG) factors isn’t just “nice to do”—it’s essential to keeping our companies and our economy healthy and strong. Therefore, Calvert continues to work hard to ensure that you have a say in charting new paths to a more prosperous future.
Corporate & Board Diversity
The newly released version of the Calvert report, “Examining the Cracks in the Ceiling: A Survey of Corporate Diversity Practices of the S&P 100,” revealed that women are still significantly underrepresented on corporate boards (18%) and in C-level executive positions (8.4%)—despite comprising more than half the workforce.
Another disappointment was learning that 37% of the companies disclose no demographic data on employees—such as race, ethnicity and gender—which is necessary to evaluate a company’s progress. Only eight companies disclose full EEO-1 data, which is a full breakdown of the workforce by race and gender across employment categories.
As an investor, Calvert believes companies that combine competitive financial performance with fair and equitable working environments—where diversity is not only tolerated but embraced—are more likely to recognize gains in both the workplace and marketplace and be better positioned to generate long-term value for their shareholders.
Green Homebuilding
In October, Calvert released “A Green Recovery for America’s Homebuilders? A Survey of Sustainable Practices by the Homebuilding Industry.” This updated version of our 2008 report on America’s 10 largest publicly traded homebuilders shows they have started to improve their policies and practices related to the environment and resources, but much progress remains to be seen.
Out of 42 possible points, the average total sustainability score was just over six points, or 15%. All 10 homebuilders have made some effort to develop environmental policies or practices or offer environmental products. However, there is a big difference in the level of commitment to sustainability and the penetration of “green” homes in each company’s product mix.
In the homebuilder rankings, KB Home and Pulte remained in the top two spots, while Meritage Homes and Toll Brothers had the biggest improvements—each moving up five spots. DR Horton and Ryland Homes fell back four and three places, respectively.
Climate Change
Calvert has continued its corporate engagement and policy work in support of energy efficiency, alternative energy, and reductions in greenhouse gas emissions. We have also been ramping up our work on climate change adaptation. Leading scientists believe that even if we stop producing greenhouse gasses tomorrow, a certain amount of climate
| www. | calvert.com CALVERT INTERNATIONAL EQUITY FUND SEMI-ANNUAL REPORT (UNAUDITED) 7 |
change will still happen because of the carbon dioxide and other pollutants already in the atmosphere.
As a result, Calvert has been collaborating with Oxfam America to highlight the risks U.S. companies face from climate change as well as the opportunities for innovation and new business that corporate solutions could offer. In November 2010, we helped facilitate a high-level roundtable on Capitol Hill hosted by Oxfam for members of Congress, key congressional staff, and companies such as John Deere, Johnson Controls, and Starbucks to discuss these topics.
Calvert and Oxfam are now helping some of the attending companies form a business coalition to assist corporations and vulnerable communities in their adaptation to the effects of climate change. The new coalition would publish case studies and best practices as well as promote public policies related to climate change adaptation and resiliency.
On the shareholder advocacy front, Calvert has filed shareholder proposals with three companies asking them to clarify what they are doing to manage their risks related to climate change—two of these proposals have already been successfully withdrawn.
Overall Shareholder Advocacy Efforts
In all, Calvert has filed 35 resolutions to date in the 2011 proxy season and 22 have already been successfully withdrawn after the companies agreed to the terms of the resolution. In addition to the resolutions cited above, six focused on sustainability reporting, four on political contributions, and seven on climate principles.
Special Equities
A modest but important portion of certain funds is allocated to small private companies that are developing products or services that address important sustainability or environmental issues. For example, Calvert Equity Portfolio recently invested in the DBL Equity Fund-BAEF II, LP, which invests in private, mid- to late-stage growth companies—primarily in the clean tech, health care, information technology, and sustainability-oriented industries—ocated near low- and moderate-income communities in San Francisco and adjoining states. The Fund will assist its portfolio companies in creating and implementing their Second Bottom Line strategy in job creation, job quality, and environmental stewardship.
Calvert International Equity Fund invested in FINAE, S.A.P.I. de C.V. SOFOM ENR, a company that provides college loans to students from low- and middle-income families in Mexico. Students are selected by universities for their academic talent and financial need, and screened by FINAE for their repayment capacity.
| www. | calvert.com CALVERT INTERNATIONAL EQUITY FUND SEMI-ANNUAL REPORT (UNAUDITED) 8 |
As of March 31, 2011, DBL Equity Fund –BAEF II, LP represented 0.02% of Calvert Equity Portfolio; FINAE represented 0.26% of Calvert International Equity Fund. All holdings are subject to change without notice.
As of March 31, 2011, the following companies represent the following percentages of net assets: KB Home represented 0.20% of Calvert Small Cap Fund; Pulte represented 0.03% of Calvert Social Index Fund; Meritage Homes represented 0% of all Calvert equity funds; DR Horton represented 0.04% of Calvert Social Index Fund; Ryland represented 0% of all Calvert equity funds; John Deere represented 1.53% of Calvert Balanced Portfolio and 0.52% of Calvert Social Index Fund; Johnson Controls represented 0.36% of Calvert Social Index Fund; Starbucks represented 0.35% of Calvert Social Index Fund, 2.01% of Calvert Equity Portfolio, and 1.65% of Calvert Enhanced Equity Portfolio; General Cable represented 1.74% of Calvert Capital Accumulation Fund and 0.03% of Calvert Social Index Fund; and WABCO Holdings represented 2.73% of Calvert Capital Accumulation Fund and 0.05% of Calvert Social Index Fund. All holdings are subject to change without notice.
| www. | calvert.com CALVERT INTERNATIONAL EQUITY FUND SEMI-ANNUAL REPORT (UNAUDITED) 9 |
PORTFOLIO MANAGEMENT DISCUSSION

Natalie A. Trunow
Senior Vice President, Chief Investment Officer - Equities
Calvert Investment Management, Inc.
Performance
Calvert International Equity Fund Class A shares (at NAV) returned 6.04% for the six-month period ending March 31, 2011. The Fund underperformed its benchmark, the MSCI Europe Australasia Far East Investable Market Index (MSCI EAFE IMI), which returned 10.90% for the period, primarily due to an underweight to the Materials sector, plus stock selection in Materials and Financials.
Investment Climate
Large-cap benchmarks such as the Standard & Poor’s 500 Index and the Russell 1000 Index were trumped by the small-cap Russell 2000 Index for the period, with returns of 17.31%, 18.13%, and 25.48%, respectively. International benchmarks didn’t fare quite as well, as the MSCI EAFE and MSCI Emerging Markets Indices returned 10.33% and 9.61%, respectively.
Within the MSCI EAFE IMI Index, the Energy, Materials, and Industrials sectors were the top performers for the period, while Consumer Staples and Utilities lagged the
CALVERT INTERNATIONAL EQUITY FUND
MARCH 31, 2011
INVESTMENT PERFORMANCE
(TOTAL RETURN AT NAV*)
| | 6 Months | | 12 Months | |
| | ended | | ended | |
| | 3/31/11 | | 3/31/11 | |
| Class A | 6.04 | % | 7.36 | % |
| Class B | 5.32 | % | 6.01 | % |
| Class C | 5.54 | % | 6.42 | % |
| Class I | 6.44 | % | 8.20 | % |
| Class Y | 6.13 | % | 7.84 | % |
| MSCI EAFE Investable | | | |
| Market Index | 10.90 | % | 11.95 | % |
| Lipper International | | | | |
| Multi-Cap Core | | | | |
| Funds Average | 10.16 | % | 12.48 | % |
| |
| TEN LARGEST | | | % of | |
| STOCK HOLDINGS | | | Net Assets | |
| Canadian National Railway Co. | | 2.2 | % |
| BG Group plc | | | 2.2 | % |
| Pearson plc | | | 2.1 | % |
| Telefonica SA | | | 2.0 | % |
| Toyota Motor Corp. | | | 1.8 | % |
| BNP Paribas | | | 1.8 | % |
| SAP AG | | | 1.5 | % |
| ING Groep NV (CVA) | | 1.4 | % |
| Kingfisher plc | | | 1.3 | % |
| Canon, Inc. | | | 1.3 | % |
| Total | | | 17.6 | % |
*Investment performance/return at NAV does not reflect the deduction of the Fund’s maximum 4.75% front-end sales charge or any deferred sales charges.
| www. | calvert.com CALVERT INTERNATIONAL EQUITY FUND SEMI-ANNUAL REPORT (UNAUDITED) 10 |
most. This dampened performance of portfolios that apply environmental, social, and governance (ESG) criteria, which are most restrictive in the Energy, Materials, and Industrials sectors. However, in the short term, we believe investor enthusiasm for the Energy sector may be momentum-driven, with the current dynamics already reflected in valuations. Therefore, we may see a reversal in Energy’s leadership in the coming months.
Investors worldwide became more focused on inflation as crude oil prices hit 20-month highs and food prices rose too, causing concerns about global economic growth—especially in emerging economies, which rely more on commodity inputs for fast economic growth. China fought inflation with a series of measures, fueling concerns about slowing economic growth in that country. The European sovereign debt crisis continued too, as the cost to insure against sovereign default in Europe hit record highs during early 2011. Austerity measures in response to historically high budget deficits and the sovereign debt crisis have thrown some of the eurozone economies into stagnation. The European Central Bank (ECB) raised the benchmark lending rate to 1.25% in early April.
The Financials sector remained under the regulatory microscope. Then, insurance and reinsurance industries faced record catastrophic losses in the wake of the earthquake and tsunami in Japan. The tragedy affected other industries as well, due to just-in-time manufacturing and low inventories in the personal computer supply chain. The residential real estate market also remained under stress, with 20% more homes potentially going into foreclosure this year.
On a more positive note, U.S. investors were optimistic about the two-year
| | |
| CALVERT |
| INTERNATIONAL |
| EQUITY FUND |
| MARCH 31, 2011 |
| | % OF TOTAL | |
| ECONOMIC SECTORS | INVESTMENTS | |
| Consumer Discretionary | 18.9 | % |
| Consumer Staples | 7.6 | % |
| Energy | 7.7 | % |
| Financials | 25.0 | % |
| Health Care | 6.7 | % |
| Industrials | 10.3 | % |
| Information Technology | 7.7 | % |
| Limited Partnership Interest | 0.8 | % |
| Materials | 4.8 | % |
| Telecommunication Services | 7.2 | % |
| Utilities | 2.8 | % |
| Venture Capital | 0.5 | % |
| Total | 100 | % |
extension of Bush-era income-tax cuts, a reduction in the payroll tax in 2011, and the Federal Reserve’s (Fed) plan to buy an additional $600 billion of Treasury securities under a new quantitative easing (QE2) program. The U.S. labor market seemed to turn upward as the economy accelerated into 2011. Consumer confidence also improved during the period, as consumers’ outlook on employment and the overall economy was at its highest level in seven years.
Portfolio Strategy
Stock selection was strongest in Energy with investments in natural gas company BG Group up 41% and oil sands company SunCor up 37%.1 The Fund had poor stock selection within the Financials and Materials sectors. Financials company Turkiye Garanti Bankasi was down 19%. Within Materials the lack of exposure to
| www. | calvert.com CALVERT INTERNATIONAL EQUITY FUND SEMI-ANNUAL REPORT (UNAUDITED) 11 |
mining companies was a loss driver.
Overall, sector allocation had a negative impact on Fund performance with the largest detractors the Fund’s underweights to Materials and Industrials.
Turning to country allocation, the Fund saw a positive effect from its exposure to Canada, while Turkey’s overweight and Australia’s underweight detracted. The effects of Japan’s earthquake and tsunami were both positive and negative. The Fund was underweight Japan relative to the benchmark but stock selection within Japan was detrimental.
Outlook
Our long-term outlook for equity markets continues to be positive. We are optimistic about improving prospects for economic recovery in the U.S. and are pleased to see consumers demonstrating the signs of recovery we were hoping for. However, some estimate that another 10% to 20% increase in the price of oil may start to impede U.S. and global gross domestic product (GDP) growth. High gasoline prices are already dampening consumer confidence, although it hasn’t been enough yet to offset the improving employment picture and stock market advances. We still see potential for more geopolitical crises and for spikes in commodity prices and inflation to be negative catalysts for equity markets. However, we continue to expect a slow, gradual economic recovery. We also believe the equity markets and global economy can successfully navigate any temporary setbacks.
One concern we have is the relative under-performance of emerging market stocks. If this continues, emerging market fund outflows may exacerbate that downward trend, especially given the relatively low liquidity in these markets. Also, equity valuations
CALVERT INTERNATIONAL EQUITY FUND
MARCH 31, 2011
AVERAGE ANNUAL TOTAL RETURNS
| Class A shares | (with max. load) | |
| One year | 2.29 | % |
| Five year | -4.46 | % |
| Ten year | 1.37 | % |
| |
| Class B shares | (with max. load) | |
| One year | 1.01 | % |
| Five year | -4.77 | % |
| Ten year | 0.67 | % |
| |
| Class c shares | (with max. load) | |
| One year | 5.42 | % |
| Five year | -4.36 | % |
| Ten year | 0.94 | % |
| |
| Class I shares | | |
| One year | 8.20 | % |
| Five year | -2.83 | % |
| Ten year | 2.65 | % |
| |
| Class Y shares* | | |
| One year | 7.84 | % |
| Five year | -3.32 | % |
| Ten year | 1.97 | % |
| * | Calvert International Equity Fund first offered Class Y Shares on October 31, 2008.
Performance prior to that date reflects the performance of Class A Shares at net asset value (NAV). Actual Class Y Share perfor- mance would have been different. |
| |
| www. | calvert.com CALVERT INTERNATIONAL EQUITY FUND SEMI-ANNUAL REPORT (UNAUDITED) 12 |
GROWTH OF $10,000
The graph below shows the value of a hypothetical $10,000 investment in the fund over the past 10 fiscal year periods. The results shown are for Classes A shares and reflect the deduction of the maximum front-end sales charge of 4.75%, and assume the reinvestment of dividends. The result is compared with benchmarks that include a broad based market index and a Lipper peer group average. Market indexes are unmanaged and their results do not reflect the effect of expenses or sales charges. The Lipper average reflects the deduction of the category’s average front-end sales charge. The value of an investment in a different share class would be different.
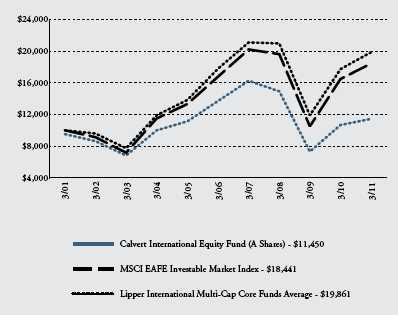
All performance data shown, including the graph above and the adjacent table, represents past performance, does not guarantee future results, assumes reinvestment of dividends and distributions and does not reflect the deduction of taxes that a shareholder would pay on the Fund’s/Portfolio’s distributions or the redemption of the Fund/Portfolio shares. The investment return and principal value of an investment will fluctuate so that an investor’s shares, when redeemed, may be worth more or less than their original cost. Current performance may be lower or higher than the performance data quoted; for current performance data visit www.calvert.com. The gross expense ratio from the current prospectus for Class A shares is 1.90%. This number may differ from the expense ratio shown elsewhere in this report because it is based on a different time period and, if applicable, does not include fee or expense waivers. Performance data quoted already reflects the deduction of the Fund’s/Portfolio’s operating expenses.
| www. | calvert.com CALVERT INTERNATIONAL EQUITY FUND SEMI-ANNUAL REPORT (UNAUDITED) 13 |
have had a strong run-up in the last several months. Therefore, equity markets are likely to be vulnerable to a sell-off from negative news or further deterioration in geopolitical tensions once we’re past the earnings season.
April 2011
1 All returns shown for individual holdings reflect that part of the reporting period the holdings were held.
As of March 31, 2011, the following companies represented the following percentages of Fund net assets: BG Group 2.81%, SunCor 0.96%, and Turkiye Garanti Bankasi 0.40%. All holdings are subject to change at any time.
| www. | calvert.com CALVERT INTERNATIONAL EQUITY FUND SEMI-ANNUAL REPORT (UNAUDITED) 14 |
SHAREHOLDER EXPENSE EXAMPLE
As a shareholder of the Fund, you incur two types of costs: (1) transaction costs, including sales charges (loads) and redemption fees; and (2) ongoing costs, including management fees; distribution (12b-1) fees; and other Fund expenses. This Example is intended to help you understand your ongoing costs (in dollars) of investing in the Fund and to compare these costs with the ongoing costs of investing in other mutual funds.
This Example is based on an investment of $1,000 invested at the beginning of the period and held for the entire period (October 1, 2010 to March 31, 2011).
Actual Expenses
The first line of the table below provides information about actual account values and actual expenses. You may use the information in this line, together with the amount you invested, to estimate the expenses that you paid over the period. Simply divide your account value by $1,000 (for example, an $8,600 account value divided by $1,000 = 8.6), then multiply the result by the number in the first line under the heading entitled “Expenses Paid During Period” to estimate the expenses you paid on your account during this period.
Hypothetical Example for Comparison Purposes
The second line of the table below provides information about hypothetical account values and hypothetical expenses based on the Fund’s actual expense ratio and an assumed rate of return of 5% per year before expenses, which is not the Fund’s actual return. The hypothetical account values and expenses may not be used to estimate the actual ending account balance or expenses you paid for the period. You may use this information to compare the ongoing costs of investing in the Fund and other funds. To do so, compare the 5% hypothetical example with the 5% hypothetical examples that appear in the shareholder reports of the other funds.
Please note that the expenses shown in the table are meant to highlight your ongoing costs only and do not reflect any transactional costs, such as sales charges (loads) or redemption fees. Therefore, the second line of the table is useful in comparing ongoing costs only, and will not help you determine the relative total costs of owning different funds. In addition, if these transactional costs were included, your costs would have been higher.
| www. | calvert.com CALVERT INTERNATIONAL EQUITY FUND SEMI-ANNUAL REPORT (UNAUDITED) 15 |
| | | | | | |
| | | BEGINNING | | ENDING ACCOUNT | | EXPENSES PAID |
| | | ACCOUNT VALUE | | VALUE | | DURING PERIOD* |
| | | 10/1/10 | | 3/31/11 | | 10/1/10 - 3/31/11 |
| CLASS A | | | | | | |
| Actual | $ | 1,000.00 | $ | 1,062.00 | $ | 9.18 |
| Hypothetical | $ | 1,000.00 | $ | 1,016.03 | $ | 8.97 |
| (5% return per year before expenses) |
|
| | | | | | |
| CLASS B | | | | | | |
| Actual | $ | 1,000.00 | $ | 1,054.90 | $ | 15.22 |
| Hypothetical | $ | 1,000.00 | $ | 1,010.12 | $ | 14.88 |
| (5% return per year before expenses) |
|
| | | | | | |
| CLASS C | | | | | | |
| Actual | $ | 1,000.00 | $ | 1,056.20 | $ | 13.67 |
| Hypothetical | $ | 1,000.00 | $ | 1,011.63 | $ | 13.38 |
| (5% return per year before expenses) |
|
| | | | | | |
| CLASS I | | | | | | |
| Actual | $ | 1,000.00 | $ | 1,065.90 | $ | 5.46 |
| Hypothetical | $ | 1,000.00 | $ | 1,019.65 | $ | 5.34 |
| (5% return per year before expenses) |
|
| |
| cLass Y | | | | | | |
| Actual | $ | 1,000.00 | $ | 1,063.50 | $ | 7.15 |
| Hypothetical | $ | 1,000.00 | $ | 1,018.00 | $ | 6.99 |
| (5% return per year before expenses) |
|
* Expenses are equal to the Fund’s annualized expense ratio of 1.79%, 2.97%, 2.67%, 1.06% and 1.39% for Class A, Class B, Class C, Class I and Class Y, respectively, multiplied by the average account value over the period, multiplied by 182/365 (to reflect the one-half year period).
| www. | calvert.com CALVERT INTERNATIONAL EQUITY FUND SEMI-ANNUAL REPORT (UNAUDITED) 16 |
| | | |
| STATEMENT OF NET ASSETS |
| MARCH 31, 2011 |
| |
| |
| |
| EQUITY SECURITIES - 96.5% | SHARES | | VALUE |
| Australia - 1.2% | | | |
| Amcor Ltd. (ADR) | 6,013 | $ | 175,399 |
| Santos Ltd. | 190,373 | | 3,066,280 |
| Sims Metal Management Ltd. (ADR) | 63,229 | | 1,147,606 |
| | | | 4,389,285 |
| |
| Austria - 0.1% | | | |
| Erste Group Bank AG (ADR) | 10,957 | | 278,308 |
| Telekom Austria AG (ADR) | 552 | | 16,201 |
| Verbund AG (ADR) | 1,040 | | 9,183 |
| | | | 303,692 |
| |
| Belgium - 0.1% | | | |
| Ageas (ADR) | 4,301 | | 12,301 |
| Delhaize Group SA (ADR) | 4,372 | | 357,149 |
| | | | 369,450 |
| |
| Brazil - 2.4% | | | |
| Banco do Brasil SA | 78,600 | | 1,425,407 |
| BM&FBOVESPA SA | 243,793 | | 1,772,959 |
| Natura Cosmeticos SA | 94,099 | | 2,656,451 |
| Porto Seguro SA | 104,400 | | 1,768,351 |
| Tim Participacoes SA (ADR) | 35,300 | | 1,540,845 |
| | | | 9,164,013 |
| |
| Canada - 6.6% | | | |
| Canadian National Railway Co.: | | | |
| New York Exchange | 32,532 | | 2,448,684 |
| Toronto Exchange | 113,924 | | 8,575,366 |
| Cenovus Energy, Inc. | 45,200 | | 1,781,395 |
| EnCana Corp.: | | | |
| New York Exchange | 58,769 | | 2,029,294 |
| Toronto Exchange | 68,816 | | 2,374,357 |
| Loblaw Co.’s Ltd. | 62,500 | | 2,498,585 |
| Potash Corporation of Saskatchewan, Inc. | 32,601 | | 1,921,177 |
| Suncor Energy, Inc.: | | | |
| New York Exchange | 13,547 | | 607,447 |
| Toronto Exchange | 68,000 | | 3,042,437 |
| | | | 25,278,742 |
| |
| China - 1.1% | | | |
| China Merchants Bank Co. Ltd | 1,051,915 | | 2,915,447 |
| Mindray Medical International Ltd. (ADR)* | 55,700 | | 1,403,640 |
| | | | 4,319,087 |
| www. | calvert.com CALVERT INTERNATIONAL EQUITY FUND SEMI-ANNUAL REPORT (UNAUDITED) 17 |
| | | |
| EQUITY SECURITIES - CONT’D | SHARES | | VALUE |
| Denmark - 2.0% | | | |
| Danske Bank A/S (ADR)* | 28,999 | $ | 343,638 |
| H Lundbeck A/S (ADR) | 6,741 | | 155,852 |
| Novo Nordisk A/S, Series B | 37,322 | | 4,692,984 |
| Novozymes A/S (ADR) | 772 | | 119,119 |
| Vestas Wind Systems A/S* | 56,071 | | 2,434,090 |
| | | | 7,745,683 |
| |
| Finland - 0.1% | | | |
| Metso Oyj (ADR) | 868 | | 46,872 |
| Nokia Oyj (ADR) | 16,666 | | 141,827 |
| Sampo Oyj (ADR) | 13,165 | | 209,982 |
| | | | 398,681 |
| |
| France - 9.8% | | | |
| Air France-KLM (ADR)* | 5,263 | | 88,418 |
| Air Liquide SA | 21,862 | | 2,907,408 |
| Air Liquide SA (ADR) | 15,772 | | 419,220 |
| AXA SA (ADR) | 38,147 | | 798,798 |
| BNP Paribas | 92,435 | | 6,766,574 |
| BNP Paribas (ADR) | 16,432 | | 602,561 |
| Cap Gemini SA (ADR) | 416 | | 12,085 |
| Carrefour SA (ADR) | 56,867 | | 501,567 |
| Cie Generale d’Optique Essilor International SA (ADR) | 2,619 | | 97,296 |
| Credit Agricole SA (ADR) | 61,779 | | 507,206 |
| Danone (ADR) | 51,943 | | 682,012 |
| Dassault Systemes SA | 38,521 | | 2,963,028 |
| Groupe Danone | 47,866 | | 3,129,533 |
| L’Oreal SA (ADR) | 8,463 | | 197,611 |
| Publicis Groupe | 65,000 | | 3,648,655 |
| Rhodia SA | 64,395 | | 1,887,040 |
| Sanofi-Aventis SA | 47,723 | | 3,348,977 |
| Sanofi-Aventis SA (ADR) | 23,260 | | 819,217 |
| Schneider Electric SA (s) | 23,816 | | 4,073,941 |
| Schneider Electric SA (ADR) | 23,657 | | 406,664 |
| Suez Environnement Co. (ADR) | 3,302 | | 33,978 |
| Suez Environnement SA | 80,468 | | 1,666,382 |
| Valeo SA (ADR)* | 11,525 | | 337,913 |
| Veolia Environnement SA (ADR) | 40,490 | | 1,262,073 |
| | | | 37,158,157 |
| |
| Germany - 8.2% | | | |
| Adidas AG | 61,053 | | 3,849,694 |
| Aixtron SE (ADR) | 40,820 | | 1,791,182 |
| Allianz SE | 15,300 | | 2,149,101 |
| Allianz SE (ADR) | 135,181 | | 1,904,700 |
| Celesio AG (ADR) | 1,971 | | 9,559 |
| Commerzbank AG (ADR)* | 2,035 | | 15,914 |
| Continental AG* | 29,133 | | 2,630,986 |
| Continental AG (ADR)* | 123 | | 11,120 |
| Deutsche Bank AG | 41,826 | | 2,461,138 |
| Deutsche Post AG (ADR) | 15,724 | | 285,233 |
| Henkel AG & Co. KGaA | 35,166 | | 1,838,805 |
| K+S AG (ADR) | 3,053 | | 116,258 |
| www. | calvert.com CALVERT INTERNATIONAL EQUITY FUND SEMI-ANNUAL REPORT (UNAUDITED) 18 |
| | | |
| EQUITY SECURITIES - CONT’D | SHARES | | VALUE |
| Germany - Cont’d | | | |
| Merck KGaA (ADR) | 720 | $ | 21,600 |
| SAP AG | 92,848 | | 5,689,248 |
| SAP AG (ADR) | 32,385 | | 1,987,144 |
| SMA Solar Technology AG | 11,735 | | 1,472,077 |
| Volkswagen AG, Preferred | 27,142 | | 4,406,119 |
| Volkswagen AG (ADR), Preferred | 17,583 | | 573,030 |
| | | | 31,212,908 |
| |
| Greece - 0.2% | | | |
| National Bank of Greece SA (ADR)* | 421,208 | | 745,538 |
| |
| Hong Kong - 3.7% | | | |
| Bank of East Asia Ltd. (ADR) | 6,874 | | 29,146 |
| China Merchants Holdings International Co. Ltd. | 402,000 | | 1,700,980 |
| City Telecom HK Ltd. (ADR) | 99,920 | | 1,511,790 |
| Esprit Holdings Ltd. (ADR) | 114,548 | | 1,045,823 |
| Hang Lung Properties Ltd. | 515,989 | | 2,252,981 |
| Hang Lung Properties Ltd. (ADR) | 88,347 | | 1,962,187 |
| Hang Seng Bank Ltd. (ADR) | 2,321 | | 37,507 |
| Hengdeli Holdings Ltd. | 3,472,000 | | 1,830,800 |
| Hong Kong Exchanges and Clearing Ltd. | 152,646 | | 3,311,904 |
| Hong Kong Exchanges and Clearing Ltd. (ADR) | 7,090 | | 153,002 |
| Johnson Electric Holdings Ltd. (ADR) | 2,248 | | 13,398 |
| Li & Fung Ltd. (ADR) | 46,213 | | 240,307 |
| PCCW Ltd. (ADR) | 4,588 | | 19,270 |
| | | | 14,109,095 |
| |
| India - 0.4% | | | |
| Infosys Technologies Ltd. (ADR) | 19,935 | | 1,429,340 |
| |
| Indonesia - 0.5% | | | |
| Bank Mandiri Tbk PT | 2,479,000 | | 1,935,940 |
| |
| Ireland - 0.1% | | | |
| Experian plc (ADR) | 21,385 | | 263,249 |
| WPP plc (ADR) | 1,396 | | 86,217 |
| | | | 349,466 |
| |
| Israel - 0.6% | | | |
| Bezeq Israeli Telecommunication Corp Ltd. | 769,270 | | 2,282,103 |
| |
| Italy - 0.1% | | | |
| Intesa Sanpaolo SpA (ADR) | 22,862 | | 406,715 |
| Italcementi SpA (ADR) | 5,566 | | 56,439 |
| | | | 463,154 |
| |
| Japan - 14.4% | | | |
| Advantest Corp. (ADR) | 8,476 | | 152,314 |
| Aeon Co. Ltd. (ADR) | 6,165 | | 71,391 |
| Asahi Glass Co. Ltd. (ADR) | 51,260 | | 643,313 |
| Canon, Inc | 109,543 | | 4,790,935 |
| Canon, Inc. (ADR) | 50,554 | | 2,191,516 |
| Dai Nippon Printing Co. Ltd. (ADR) | 46,515 | | 569,809 |
| www. | calvert.com CALVERT INTERNATIONAL EQUITY FUND SEMI-ANNUAL REPORT (UNAUDITED) 19 |
| | | |
| EQUITY SECURITIES - CONT’D | SHARES | | VALUE |
| Japan - Cont’d | | | |
| Dai-ichi Life Insurance Co. Ltd. | 2,329 | $ | 3,531,346 |
| Daiwa House Industry Co. Ltd. (ADR) | 1,009 | | 123,562 |
| Denso Corp. (ADR) | 12,210 | | 200,854 |
| Eisai Co. Ltd. (ADR) | 533 | | 19,055 |
| Fanuc Ltd. | 15,395 | | 2,341,706 |
| Fujitsu Ltd. (ADR) | 21,293 | | 596,204 |
| Honda Motor Co. Ltd. (ADR) | 67,487 | | 2,531,437 |
| KDDI Corp. | 110 | | 684,427 |
| Konami Corp. (ADR) | 4,004 | | 73,914 |
| Kubota Corp. (ADR) | 12,924 | | 608,850 |
| Mitsui Fudosan Co. Ltd. | 102,256 | | 1,696,236 |
| Mizuho Financial Group, Inc. (ADR) | 396,411 | | 1,316,084 |
| MS&AD Insurance Group Holdings (ADR) | 71,066 | | 800,914 |
| Nippon Yusen KK (ADR) | 163,635 | | 1,286,171 |
| Nissan Motor Co. Ltd. (ADR)* | 99,869 | | 1,762,688 |
| Nitto Denko Corp. (ADR) | 15,636 | | 833,399 |
| Nomura Holdings, Inc. (ADR) | 283,127 | | 1,472,260 |
| NSK Ltd. (ADR) | 3,172 | | 54,749 |
| NTT DoCoMo, Inc | 1,607 | | 2,838,509 |
| ORIX Corp. (ADR) | 12,793 | | 595,770 |
| Panasonic Corp | 188,716 | | 2,412,245 |
| Panasonic Corp. (ADR) | 132,037 | | 1,662,346 |
| Sega Sammy Holdings, Inc. (ADR) | 12,316 | | 53,821 |
| Seiko Epson Corp. (ADR) | 18,925 | | 150,832 |
| Sekisui House Ltd. | 193,000 | | 1,818,775 |
| Sharp Corp. (ADR) | 50,097 | | 492,453 |
| Sony Corp. | 48,200 | | 1,551,345 |
| Sony Corp. (ADR) | 66,964 | | 2,131,464 |
| Sumitomo Mitsui Trust Holdings, Inc. (ADR) | 1,132 | | 7,811 |
| Sumitomo Trust & Banking Co. Ltd. (ADR) | 55,663 | | 301,137 |
| Tokyo Gas Co. Ltd. | 698,118 | | 3,205,084 |
| Toyota Motor Corp. | 167,282 | | 6,770,505 |
| Toyota Motor Corp. (ADR) | 31,583 | | 2,534,536 |
| | | | 54,879,767 |
| |
| Luxembourg - 0.7% | | | |
| SES SA (FDR) | 109,876 | | 2,832,539 |
| |
| Mexico - 0.5% | | | |
| America Movil SAB de CV (ADR), Series L | 25,043 | | 1,454,998 |
| FINAE, Series D, Preferred (b)(i)* | 1,910,937 | | 256,545 |
| | | | 1,711,543 |
| |
| Netherlands - 3.6% | | | |
| ASML Holding NV* | 5,168 | | 229,976 |
| BE Semiconductor Industries NV* | 7,522 | | 67,322 |
| Gemalto NV | 50,931 | | 2,507,107 |
| ING Groep NV (CVA)* | 422,915 | | 5,357,371 |
| Koninklijke Philips Electronics NV: | | | |
| Common* | 73,054 | | 2,337,144 |
| NY Shares* | 79,797 | | 2,567,069 |
| TNT NV (ADR) | 28,181 | | 721,152 |
| | | | 13,787,141 |
| www. | calvert.com CALVERT INTERNATIONAL EQUITY FUND SEMI-ANNUAL REPORT (UNAUDITED) 20 |
| | | |
| EQUITY SECURITIES - CONT’D | SHARES | | VALUE |
| Norway - 2.3% | | | |
| DnB NOR ASA | 188,167 | $ | 2,885,303 |
| Petroleum Geo-Services ASA* | 192,737 | | 3,087,735 |
| Yara International ASA | 40,150 | | 2,033,059 |
| Yara International ASA (ADR) | 16,024 | | 814,019 |
| | | | 8,820,116 |
| |
| Philippines - 0.7% | | | |
| Philippine Long Distance Telephone Co. (ADR) | 49,713 | | 2,659,646 |
| |
| Portugal - 0.2% | | | |
| Portugal Telecom SGPS SA (ADR) | 51,850 | | 603,016 |
| |
| Singapore - 0.8% | | | |
| City Developments Ltd. (ADR) | 986 | | 9,111 |
| Oversea-Chinese Banking Corp. Ltd. | 310,830 | | 2,362,920 |
| Singapore Telecommunications Ltd. (ADR) | 21,467 | | 517,569 |
| | | | 2,889,600 |
| |
| South Africa - 1.5% | | | |
| African Bank Investments Ltd. (ADR) | 340 | | 9,445 |
| Aspen Pharmacare Holdings Ltd.* | 179,954 | | 2,100,217 |
| Clicks Group Ltd.* | 379,200 | | 2,384,215 |
| MTN Group Ltd. (ADR) | 42,057 | | 853,757 |
| Nedbank Group Ltd. (ADR) | 7,205 | | 150,945 |
| Tiger Brands Ltd. (ADR) | 3,958 | | 103,185 |
| | | | 5,601,764 |
| |
| South Korea - 0.5% | | | |
| KT Corp. (ADR) | 97,100 | | 1,896,363 |
| |
| Spain - 2.6% | | | |
| Banco Bilbao Vizcaya Argentaria SA (ADR) | 73,588 | | 883,056 |
| Banco Santander SA (ADR) | 135,958 | | 1,593,428 |
| International Consolidated Airlines Group SA (ADR)* | 1,365 | | 24,911 |
| Telefonica SA | 301,828 | | 7,562,610 |
| | | | 10,064,005 |
| |
| Sweden - 2.3% | | | |
| Assa Abloy AB, Series B | 98,400 | | 2,828,907 |
| Atlas Copco AB (ADR) | 4,896 | | 130,429 |
| Hennes & Mauritz AB, B Shares | 101,754 | | 3,378,234 |
| Husqvarna AB, Series B | 275,200 | | 2,358,266 |
| SKF AB (ADR) | 1,361 | | 39,592 |
| Svenska Cellulosa AB (ADR) | 7,488 | | 121,605 |
| | | | 8,857,033 |
| |
| Switzerland - 5.4% | | | |
| Adecco SA (ADR) | 575 | | 19,032 |
| Credit Suisse Group AG | 108,430 | | 4,620,617 |
| Credit Suisse Group AG (ADR) | 63,021 | | 2,683,434 |
| Julius Baer Group Ltd | 42,873 | | 1,865,834 |
| Logitech International SA* | 119,234 | | 2,153,216 |
| Nobel Biocare Holding AG (ADR)* | 1,022 | | 10,506 |
| www. | calvert.com CALVERT INTERNATIONAL EQUITY FUND SEMI-ANNUAL REPORT (UNAUDITED) 21 |
| | | |
| EQUITY SECURITIES - CONT’D | SHARES | | VALUE |
| Switzerland - Cont’d | | | |
| Novartis AG | 77,612 | $ | 4,221,673 |
| Roche Holding AG (ADR) | 81,873 | | 2,943,334 |
| STMicroelectronics NV | 30,466 | | 378,388 |
| Swiss Reinsurance (ADR) | 8,622 | | 492,316 |
| Zurich Financial Services AG (ADR) | 35,996 | | 1,010,768 |
| | | | 20,399,118 |
| |
| Turkey - 0.4% | | | |
| Turkiye Garanti Bankasi AS | 322,700 | | 1,507,973 |
| |
| United Kingdom - 21.5% | | | |
| ARM Holdings plc | 163,700 | | 1,510,606 |
| Aviva plc (ADR) | 31,339 | | 442,507 |
| Barclays plc | 547,117 | | 2,437,003 |
| Barclays plc (ADR) | 40,096 | | 727,341 |
| BG Group plc | 344,368 | | 8,571,744 |
| BG Group plc (ADR) | 17,163 | | 2,143,659 |
| British Land Co. plc (ADR) | 1,136 | | 10,235 |
| BT Group plc (ADR) | 46,754 | | 1,406,360 |
| Bunzl plc (ADR) | 1,321 | | 80,515 |
| Cairn Energy plc* | 301,724 | | 2,237,589 |
| Capita Group plc | 216,239 | | 2,578,442 |
| Centrica plc | 545,604 | | 2,848,369 |
| Centrica plc (ADR) | 19,432 | | 410,598 |
| Compass Group plc | 322,548 | | 2,901,380 |
| GlaxoSmithKline plc | 122,492 | | 2,338,335 |
| HSBC Holdings plc | 326,228 | | 3,355,937 |
| HSBC Holdings plc (ADR) | 42,139 | | 2,182,800 |
| International Power plc (ADR) | 4,301 | | 215,910 |
| J Sainsbury plc (ADR) | 15,098 | | 324,003 |
| Johnson Matthey plc | 53,854 | | 1,607,555 |
| Johnson Matthey plc (ADR) | 291 | | 17,437 |
| Kingfisher plc | 1,216,487 | | 4,800,656 |
| Legal & General Group plc (ADR) | 1,274 | | 11,899 |
| Lloyds Banking Group plc (ADR)* | 263,495 | | 974,932 |
| Man Group plc (ADR) | 71,023 | | 284,092 |
| Old Mutual plc (ADR) | 1,880 | | 32,712 |
| Pearson plc | 455,949 | | 8,056,347 |
| Persimmon plc | 212,629 | | 1,518,508 |
| Prudential plc | 201,406 | | 2,283,595 |
| Prudential plc (ADR) | 102,558 | | 2,330,118 |
| Reckitt Benckiser Group plc | 82,117 | | 4,219,772 |
| Reckitt Benckiser Group plc (ADR) | 35,453 | | 368,002 |
| Sage Group plc (ADR) | 14,550 | | 261,464 |
| Scottish & Southern Energy plc (ADR) | 33,422 | | 684,148 |
| Smith & Nephew plc (ADR) | 27,389 | | 1,545,013 |
| Standard Chartered plc | 169,264 | | 4,392,474 |
| Tate & Lyle plc | 183,586 | | 1,701,477 |
| Tesco plc | 743,886 | | 4,548,476 |
| www. | calvert.com CALVERT INTERNATIONAL EQUITY FUND SEMI-ANNUAL REPORT (UNAUDITED) 22 |
| | | | |
| EQUITY SECURITIES - CONT’D | | SHARES | | VALUE |
| United Kingdom - Cont’d | | | | |
| Tesco plc (ADR) | | 85,163 | $ | 1,575,515 |
| Unilever plc (ADR) | | 78,317 | | 2,398,067 |
| United Utilities Group plc (ADR) | | 8,214 | | 156,477 |
| Vodafone Group plc (ADR) | | 46,585 | | 1,339,319 |
| | | | | 81,831,388 |
| |
| United States - 1.9% | | | | |
| Bristol-Myers Squibb Co. | | 49,992 | | 1,321,289 |
| Distributed Energy Systems Corp.* | | 308,138 | | 2,619 |
| Evergreen Solar, Inc.* | | 233 | | 314 |
| MeadWestvaco Corp. | | 82,974 | | 2,516,601 |
| Powerspan Corp.: | | | | |
| Series A, Convertible Preferred (b)(i)* | | 45,455 | | - |
| Series B, Convertible Preferred (b)(i)* | | 20,000 | | - |
| Series C, Convertible Preferred (b)(i)* | | 239,764 | | - |
| Series D, Convertible Preferred (b)(i)* | | 45,928 | | - |
| Series D, Preferred Warrants (strike price $3.44/share, | | | | |
| expires 12/31/12) (b)(i)* | | 2,347 | | - |
| Pricesmart, Inc. | | 40,500 | | 1,483,920 |
| RF Technology, Inc., Contingent Deferred Distribution (b)(i)* | | 365,374 | | 3,654 |
| Sealed Air Corp. | | 48,413 | | 1,290,691 |
| SmarThinking, Inc.: | | | | |
| Series 1-A, Convertible Preferred (b)(i)* | | 104,297 | | 387,429 |
| Series 1-B, Convertible Preferred (b)(i)* | | 163,588 | | 201,383 |
| Series 1-B, Preferred Warrants (strike price $0.01/share, expires | | | | |
| 5/31/15) (b)(i)* | | 11,920 | | 14,555 |
| Series 1-B, Preferred Warrants (strike price $1.53/share, expires | | | | |
| 6/1/15) (b)(i)* | | 32,726 | | - |
| | | | | 7,222,455 |
| |
| |
| Total Equity Securities (Cost $337,174,917) | | | | 367,217,801 |
| |
| | | PRINCIPAL | | |
| VENTURE CAPITAL DEBT OBLIGATIONS - 0.3% | | AMOUNT | | |
| FINAE: | | | | |
| Note I, 6.50%, 12/10/15 (b)(i) | $ | 250,000 | | 250,000 |
| Note II, 6.50%, 2/29/16 (b)(i) | | 500,000 | | 500,000 |
| Access Bank plc, 8.477%, 8/29/12 (b)(i) | | 375,000 | | 390,331 |
| Mayer Laboratories, Inc., 6.00%, 12/31/01 (b)(i)(w) | | 37,482 | | 9,371 |
| |
| Total Venture Capital Debt Obligations (Cost $1,162,482) | | | | 1,149,702 |
| |
| HIGH SOCIAL IMPACT INVESTMENTS - 1.2% | | | | |
| Calvert Social Investment Foundation Notes, 1.17%, 7/1/11 (b)(i)(r) | | 4,431,583 | | 4,395,864 |
| |
| Total High Social Impact Investments (Cost $4,431,583) | | | | 4,395,864 |
| www. | calvert.com CALVERT INTERNATIONAL EQUITY FUND SEMI-ANNUAL REPORT (UNAUDITED) 23 |
| | | | | | |
| | | | ADJUSTED | | | |
| VENTURE CAPITAL LIMITED PARTNERSHIP INTEREST - 0.8% | | BASIS | | VALUE | |
| Blackstone Cleantech Venture Partners (b)(i)* | $ | 49,396 | $ | 43,103 | |
| Balkan Financial Sector Equity Fund CV (b)(i)* | | 563,779 | | 518,796 | |
| China Environment Fund 2004 (b)(i)* | | - | | 182,455 | |
| Emerald Cleantech Fund I (b)(i)* | | 966,151 | | 611,417 | |
| gNet Defta Development Holdings LLC (a)(b)(i)* | | 400,000 | | 385,198 | |
| SEAF Central and Eastern European Growth Fund LLC (a)(b)(i)* | | 352,304 | | 526,370 | |
| SEAF India International Growth Fund (b)(i)* | | 394,032 | | 473,965 | |
| ShoreCap International LLC (b)(i)* | | - | | 216,289 | |
| Terra Capital (b)(i)* | | 469,590 | | 1 | |
| |
| Total Venture Capital Limited Partnership Interest | | | | | |
| (Cost $3,195,252) | | | | 2,957,594 | |
| |
| |
| |
| TOTAL INVESTMENTS (Cost $345,964,234) - 98.8% | | | | 375,720,961 | |
| Other assets and liabilities, net - 1.2% | | | | 4,589,265 | |
| NET ASSETS - 100% | | | $ | 380,310,226 | |
| |
| |
| |
| NET ASSETS CONSIST OF: | | | | | |
| Paid-in capital applicable to the following shares of common stock with | | | | | |
| 250,000,000 shares of $0.01 par value shares authorized: | | | | | |
| Class A: 17,388,324 shares outstanding | | | $ | 361,534,285 | |
| Class B: 486,798 shares outstanding | | | | 12,808,875 | |
| Class C: 1,709,858 shares outstanding | | | | 37,782,592 | |
| Class I: 5,812,141 shares outstanding | | | | 136,755,172 | |
| Class Y: 372,218 shares outstanding | | | | 5,143,787 | |
| Undistributed net investment income | | | | 30,651 | |
| Accumulated net realized gain (loss) on investments | | | | | |
| and foreign currency transactions | | | | (203,530,084 | ) |
| Net unrealized appreciation (depreciation) on investments, foreign | | | | | |
| currencies, and assets and liabilities denominated in foreign currencies | | | | 29,784,948 | |
| |
| NET ASSETS | | | $ | 380,310,226 | |
| |
| |
| NET ASSET VALUE PER SHARE | | | | | |
| Class A (based on net assets of $255,213,136) | | | $ | 14.68 | |
| Class B (based on net assets of $6,359,592) | | | $ | 13.06 | |
| Class C (based on net assets of $21,837,455) | | | $ | 12.77 | |
| Class I (based on net assets of $91,166,372) | | | $ | 15.69 | |
| Class Y (based on net assets of $5,733,671) | | | $ | 15.40 | |
See notes to financial statements.
| www. | calvert.com CALVERT INTERNATIONAL EQUITY FUND SEMI-ANNUAL REPORT (UNAUDITED) 24 |
| | | |
| RESTRICTED SECURITIES | ACQUISITION DATES | | COST |
| Access Bank plc, 8.477%, 8/29/12 | 8/29/07 | $ | 375,000 |
| Balkan Financial Sector Equity Fund CV LP | 1/12/06 - 9/24/10 | | 563,779 |
| Blackstone Cleantech Venture Partners LP | 7/29/10 - 1/28/11 | | 49,396 |
| Calvert Social Investment Foundation Notes, 1.17%, 7/1/11 | 7/1/08 | | 4,431,583 |
| China Environment Fund 2004 LP | 9/15/05 - 4/1/09 | | - |
| Emerald Cleantech Fund I LP | 7/19/01 - 3/29/11 | | 966,151 |
| FINAE: | | | |
| Series D, Preferred | 2/28/11 | | 252,398 |
| Note I, 6.50%, 12/10/15 | 12/10/10 | | 250,000 |
| Note II, 6.50%, 2/29/16 | 2/24/11 | | 500,000 |
| gNet Defta Development Holdings LLC, LP | 8/30/05 | | 400,000 |
| Mayer Laboratories, Inc., 6.00%, 12/31/01 | 12/31/96 | | 37,482 |
| Powerspan Corp.: | | | |
| Series A, Convertible Preferred | 8/20/97 | | 250,000 |
| Series B, Convertible Preferred | 10/5/99 | | 200,000 |
| Series C, Convertible Preferred | 12/21/04 - 6/12/08 | | 273,331 |
| Series D, Convertible Preferred | 6/20/08 | | 157,996 |
| Series D, Preferred Warrants | | | |
| (strike price $3.44/share, expires 12/31/12) | 12/5/07 - 6/20/08 | | - |
| RF Technology, Inc., Contingent Deferred Distribution | 7/17/06 | | 104,368 |
| SEAF Central and Eastern European Growth Fund LLC, LP | 8/10/00 - 3/25/11 | | 352,304 |
| SEAF India International Growth Fund LP | 3/22/05 - 5/24/10 | | 394,032 |
| ShoreCap International LLC, LP | 8/12/04 - 12/15/08 | | - |
| SmarThinking, Inc.: | | | |
| Series 1-A, Convertible Preferred | 4/22/03 - 5/27/05 | | 159,398 |
| Series 1-B, Convertible Preferred | 6/10/03 | | 250,000 |
| Series 1-B, Preferred Warrants | | | |
| (strike price $0.01/share, expires 5/31/15) | 5/27/05 | | - |
| Series 1-B, Preferred Warrants | | | |
| (strike price $1.53/share, expires 6/1/15) | 9/19/00 | | - |
| Terra Capital LP | 11/23/98 - 3/14/06 | | 469,590 |
See notes to financial statements.
| www. | calvert.com CALVERT INTERNATIONAL EQUITY FUND SEMI-ANNUAL REPORT (UNAUDITED) 25 |
| (a) | Affiliated company. |
| (b) | This security was valued by the Board of Directors. See Note A. |
| (i) | Restricted securities represent 2.5% of net assets of the Fund. |
| (r) | The coupon rate shown on floating or adjustable rate securities represents the rate at period end. |
| (s) | 23,816 shares of Schneider Electric SA have been soft segregated in order to cover outstanding commitments to certain limited partnerships investments within the Fund. There are no restrictions on the trading of this security. |
| (w) | Mayer Laboratories, Inc. is in default for principal and interest. Past due accrued interest as of March 31, 2011 totaled $1,184. |
| * | Non-income producing security. |
Abbreviations:
ADR: American Depositary Receipts
CVA: Certificaten Van Aandelen
FDR: Fiduciary Depositary Receipts
LLC: Limited Liability Corporation
LP: Limited Partnership
See notes to financial statements.
| www. | calvert.com CALVERT INTERNATIONAL EQUITY FUND SEMI-ANNUAL REPORT (UNAUDITED) 26 |
| | | |
| STATEMENT OF OPERATIONS |
| SIX MONTHS ENDED MARCH 31, 2011 |
| |
| |
| NET INVESTMENT INCOME | | | |
| Investment Income: | | | |
| Dividend income (net of foreign taxes withheld of $233,852) | $ | 3,115,220 | |
| Interest income | | 64,801 | |
| Total investment income | | 3,180,021 | |
| |
| Expenses: | | | |
| Investment advisory fee | | 1,382,156 | |
| Transfer agency fees and expenses | | 407,470 | |
| Administrative fees | | 562,676 | |
| Distribution Plan expenses: | | | |
| Class A | | 312,842 | |
| Class B | | 33,235 | |
| Class C | | 110,792 | |
| Directors’ fees and expenses | | 16,226 | |
| Custodian fees | | 144,176 | |
| Registration fees | | 33,891 | |
| Reports to shareholders | | 79,346 | |
| Professional fees | | 21,207 | |
| Miscellaneous | | 40,085 | |
| Total expenses | | 3,144,102 | |
| Reimbursement from Advisor: | | | |
| Class B | | (1,372 | ) |
| Class I | | (5,008 | ) |
| Class Y | | (4,316 | ) |
| Fees paid indirectly | | (1,864 | ) |
| Net expenses | | 3,131,542 | |
| |
| NET INVESTMENT INCOME | | 48,479 | |
| |
| REALIZED AND UNREALIZED GAIN (LOSS) | | | |
| Net realized gain (loss) on: | | | |
| Investments | | 6,806,855 | |
| Foreign currency transactions | | (234,226 | ) |
| | | 6,572,629 | |
| Change in unrealized appreciation (depreciation) on: | | | |
| Investments and foreign currencies | | 15,134,324 | |
| Assets and liabilities denominated in foreign currencies | | 53,567 | |
| | | 15,187,891 | |
| |
| NET REALIZED AND UNREALIZED GAIN (LOSS) | | 21,760,520 | |
| |
| INCREASE (DECREASE) IN NET ASSETS | | | |
| RESULTING FROM OPERATIONS | $ | 21,808,999 | |
See notes to financial statements.
| www. | calvert.com CALVERT INTERNATIONAL EQUITY FUND SEMI-ANNUAL REPORT (UNAUDITED) 27 |
STATEMENTS OF CHANGES IN NET ASSETS
| | | | | | |
| | | SIX MONTHS ENDED | | | YEAR ENDED | |
| | | MARCH
31, | | | SEPTEMBER 30, | |
| INCREASE (DECREASE) IN NET ASSETS | | 2011 | | | 2010 | |
| Operations: | | | | | | |
| Net investment income | $ | 48,479 | | $ | 2,088,917 | |
| Net realized gain (loss) | | 6,572,629 | | | 1,595,659 | |
| Change in unrealized appreciation (depreciation) | | 15,187,891 | | | (532,062 | ) |
| |
| INCREASE (DECREASE) IN NET ASSETS | | | | | | |
| RESULTING FROM OPERATIONS | | 21,808,999 | | | 3,152,514 | |
| |
| Distributions to shareholders from: | | | | | | |
| Net investment income: | | | | | | |
| Class A shares | | (655,710 | ) | | (1,877,571 | ) |
| Class I shares | | (542,675 | ) | | (1,650,864 | ) |
| Class Y shares | | (3,993 | ) | | (5,626 | ) |
| Total distributions | | (1,202,378 | ) | | (3,534,061 | ) |
| |
| Capital share transactions: | | | | | | |
| Shares sold: | | | | | | |
| Class A shares | | 22,229,166 | | | 37,402,286 | |
| Class B shares | | 49,297 | | | 269,456 | |
| Class C shares | | 825,701 | | | 2,587,664 | |
| Class I shares | | 5,832,831 | | | 13,046,519 | |
| Class Y shares | | 3,397,788 | | | 3,391,938 | |
| Reinvestment of distributions: | | | | | | |
| Class A shares | | 608,387 | | | 1,712,839 | |
| Class I shares | | 483,830 | | | 1,379,546 | |
| Class Y shares | | 419 | | | 2,622 | |
| Redemption fees: | | | | | | |
| Class A shares | | 492 | | | 1,376 | |
| Class B shares | | — | | | 6 | |
| Class C shares | | 166 | | | 59 | |
| Class Y shares | | 2 | | | 1,837 | |
| Shares redeemed: | | | | | | |
| Class A shares | | (26,804,130 | ) | | (64,598,217 | ) |
| Class B shares | | (894,672 | ) | | (2,328,107 | ) |
| Class C shares | | (2,130,616 | ) | | (4,676,204 | ) |
| Class I shares | | (6,585,645 | ) | | (35,107,420 | ) |
| Class Y shares | | (675,366 | ) | | (1,497,086 | ) |
| Total capital share transactions | | (3,662,350 | ) | | (48,410,886 | ) |
| |
| |
| TOTAL INCREASE (DECREASE) IN NET ASSETS | | 16,944,271 | | | (48,792,433 | ) |
| |
| |
| NET ASSETS | | | | | | |
| Beginning of period | | 363,365,955 | | | 412,158,388 | |
| End of period (including undistributed net investment | | | | | | |
| income of $30,651 and $1,184,550, respectively) | $ | 380,310,226 | | $ | 363,365,955 | |
See notes to financial statements.
| www. | calvert.com CALVERT INTERNATIONAL EQUITY FUND SEMI-ANNUAL REPORT (UNAUDITED) 28 |
stateMents of changes in net assets
| | | | |
| | SIX MONTHS ENDED | | YEAR ENDED | |
| | MARCH
31, | | SEPTEMBER 30, | |
| CAPITAL SHARE ACTIVITY | 2011 | | 2010 | |
| Shares sold: | | | | |
| Class A shares | 1,537,976 | | 2,802,787 | |
| Class B shares | 3,848 | | 22,231 | |
| Class C shares | 65,954 | | 220,010 | |
| Class I shares | 381,320 | | 924,635 | |
| Class Y shares | 224,949 | | 248,819 | |
| Reinvestment of distributions: | | | | |
| Class A shares | 42,634 | | 125,851 | |
| Class I shares | 31,789 | | 95,470 | |
| Class Y shares | 28 | | 185 | |
| Shares redeemed: | | | | |
| Class A shares | (1,861,502 | ) | (4,854,110 | ) |
| Class B shares | (69,591 | ) | (194,930 | ) |
| Class C shares | (169,203 | ) | (404,192 | ) |
| Class I shares | (430,343 | ) | (2,456,887 | ) |
| Class Y shares | (44,831 | ) | (105,845 | ) |
| Total capital share activity | (286,972 | ) | (3,575,976 | ) |
See notes to financial statements.
| www. | calvert.com CALVERT INTERNATIONAL EQUITY FUND SEMI-ANNUAL REPORT (UNAUDITED) 29 |
NOTES TO FINANCIAL STATEMENTS
NOTE A — SIGNIFICANT ACCOUNTING POLICIES
General: The Calvert World Values International Equity Fund (the “Fund”), a series of Calvert World Values Fund, Inc., is registered under the Investment Company Act of 1940 as a diversified, open-end management investment company. The operation of each series is accounted for separately. The Fund offers five classes of shares of capital stock. Class A shares are sold with a maximum front-end sales charge of 4.75%. Class B shares are sold without a front-end sales charge. With certain exceptions, the Fund will impose a deferred sales charge at the time of redemption, depending on how long investors have owned the shares. Effective March 1, 2010, Class B shares are no longer offered for purchase, except through reinvestment of dividends and/or distributions and through certain exchanges. Class C shares are sold without a front-end sales charge. With certain exceptions, the Fund will impose a deferred sales charge on shares sold within one year of purchase. Class B and Class C shares have higher levels of expenses than Class A shares. Class I shares require a minimum account balance of $1,000,000. The $1 million minimum initial investment may be waived for certain institutional accounts, where it is believed to be in the best interest of the Fund and its shareholders. Class I shares have no front-end or deferred sales charge and have lower levels of expenses than Class A shares. Effective October 31, 2008, the Fund began to offer Class Y shares. Class Y shares are generally only available to wrap or similar fee-based programs offered by financial intermediaries that have entered into an agreement with the Fund’s Distributor to offer Class Y shares. Class Y shares have no front-end or deferred sales charge. Each class has different: (a) dividend rates, due to differences in Distribution Plan expenses and other class-specific expenses, (b) exchange privileges and (c) class-specific voting rights.
Security Valuation: Net asset value per share is determined every business day as of the close of the regular session of the New York Stock Exchange (generally 4:00 p.m. Eastern time). The Fund uses independent pricing services approved by the Board of Directors to value its investments wherever possible. Investments for which market quotations are not available or deemed not reliable are fair valued in good faith under the direction of the Board of Directors. In determining fair value, the Board considers all relevant qualitative and quantitative information available. These factors are subject to change over time and are reviewed periodically. The values assigned to fair value investments are based on available information and do not necessarily represent amounts that might ultimately be realized. Further, because of the inherent uncertainty of valuation, those estimated values may differ significantly from the values that would have been used had a ready market for the investments existed, and the differences could be material.
At March 31, 2011, securities valued at $9,366,726 or 2.5% of net assets were fair valued in good faith under the direction of the Board of Directors.
The Fund utilizes various methods to measure the fair value of its investments. Generally Accepted Accounting Principles (GAAP) establishes a disclosure hierarchy that categorizes the inputs to valuation techniques used to value assets and liabilities at measurement date. These inputs are summarized in the three broad levels listed below: Level 1 – quoted prices in active markets for identical securities Level 2 – other significant observable inputs (including quoted prices for similar securities, interest rates, prepayment speeds, credit risk, etc.)
| www. | calvert.com CALVERT INTERNATIONAL EQUITY FUND SEMI-ANNUAL REPORT (UNAUDITED) 30 |
Level 3 – significant unobservable inputs (including the Fund’s own assumptions in determining the fair value of investments) The inputs or methodology used for valuing securities are not necessarily an indication of the risk associated with investing in those securities.
Changes in valuation techniques may result in transfers in or out of an investment’s assigned level within the hierarchy during the period. Valuation techniques used to value the Fund’s investments by major category are as follows.
Equity securities, including restricted securities and venture capital securities, for which market quotations are readily available, are valued at the last reported sale price or official closing price as reported by an independent pricing service on the primary market or exchange on which they are traded and are categorized as Level 1 in the hierarchy. Foreign securities are valued based on quotations from the principle market in which such securities are normally traded. If events occur after the close of the principle market in which foreign securities are traded, and before the close of business of the Fund, that are expected to materially affect the value of those securities, then they are valued at their fair value taking these events into account. The Fund has retained a third party fair value pricing service to quantitatively analyze the price movement of its holdings on foreign exchanges and to automatically fair value if the variation from the prior day’s closing price exceeds specified parameters. Such securities would be categorized as Level 2 in the hierarchy in these circumstances. Utilizing this technique may result in transfers between Level 1 and Level 2. For restricted securities and private placements where observable inputs are limited, assumptions about market activity and risk are used and are categorized as Level 3 in the hierarchy.
Venture capital securities for which market quotations are not readily available are fair valued by the Fund’s Board of Directors and are categorized as Level 3 in the hierarchy. Venture capital equity securities are generally valued at enterprise value, determined by an industry multiple times revenue, with discounts as appropriate based on assumptions of liquidation or exit risk, or to a recent round of equity financing. Venture capital limited partnership securities are generally valued at the enterprise value of the underlying investments held by the partnership based on reports from the general partner or other available information; the resulting figure is then multiplied by the capital percentage owned in the limited partnership. Venture capital debt securities are valued based on assumptions of credit and market risk. For venture capital securities denominated in foreign currency, the fair value is marked to the daily exchange rate.
Debt securities, including restricted securities, are valued based on evaluated prices received from independent pricing services or from dealers who make markets in such securities and are generally categorized as Level 2 in the hierarchy. Short-term securities with remaining maturities of sixty days or less for which quotations are not readily available are valued at amortized cost, which approximates fair value, and are categorized as Level 2 in the hierarchy.
When independent prices are unavailable or unreliable, debt securities may be valued utilizing pricing matrices which consider similar factors that would be used by independent pricing services. These are generally categorized as Level 2 in the hierarchy but may be Level 3 depending on the circumstances.
| www. | calvert.com CALVERT INTERNATIONAL EQUITY FUND SEMI-ANNUAL REPORT (UNAUDITED) 31 |
The following is a summary of the inputs used to value the Fund’s net assets as of March 31, 2011:
| | | | | | | | | |
| | | VALUATION INPUTS | |
| InvestMents In securItIes | | LeveL 1 | LeveL 2 | | LeveL 3 | | | totaL | |
| Equity securities* | $ | 366,351,302 | — | | — | | $ | 366,351,302 | |
| Venture capital | | 2,933 | — | $ | 4,970,862 | | | 4,973,795 | |
| Other debt obligations | | — | — | | 4,395,864 | | | 4,395,864 | |
| TOTAL | $ | 366,354,235 | — | $ | 9,366,726 | ** | $ | 375,720,961 | |
| |
| * For further breakdown of equity securities by country, please refer to the Statement of Net Assets. | | | | |
| | | | | | | | | VENTURE | |
| | | | | | | | | CAPITAL | |
| Balance as of 9/30/10 | | | | | | | $ | 5,488,687 | |
| Accrued discounts/premiums | | | | | | | | - | |
| Realized gain (loss) | | | | | | | | 276 | |
| Change in unrealized appreciation (depreciation) | | | | | | (1,333,349 | ) |
| Purchases | | | | | | | | 1,084,307 | |
| Sales | | | | | | | | (269,059 | ) |
| Transfers in and/or out of Level 31 | | | | | | - | |
| Balance as of 3/31/11 | | | | | | | $ | 4,970,862 | |
| |
| | | | | | OTHER DEBT | | | | |
| | | | | | OBLIGATIONS | | | TOTAL | |
| Balance as of 9/30/10 | | | | $ | 4,532,706 | | $ | 10,021,393 | |
| Accrued discounts/premiums | | | | | - | | | - | |
| Realized gain (loss) | | | | | - | | | 276 | |
| Change in unrealized appreciation (depreciation) | | | 113,158 | | | (1,220,191 | ) |
| Purchases | | | | | - | | | 1,084,307 | |
| Sales | | | | | (250,000 | ) | | (519,059 | ) |
| Transfers in and/or out of Level 31 | | | - | | | - | |
| Balance as of 3/31/11 | | | | $ | 4,395,864 | | $ | 9,366,726 | |
1 The Fund’s policy is to recognize transfers into and transfers out of Level 3 as of the end of the reporting period.
For the six months ended March 31, 2011, total change in unrealized gain (loss) on Level 3 securities included in the change in net assets was ($1,220,191). Total unrealized gain (loss) for all securities (including Level 1 and Level 2) can be found on the accompanying Statement of Operations.
Repurchase Agreements: The Fund may enter into repurchase agreements with recognized financial institutions or registered broker/dealers and, in all instances, holds underlying securities with a value exceeding the total repurchase price, including accrued interest. Although risk is mitigated by the collateral, the Fund could experience a delay in recovering its value and a possible loss of income or value if the counterparty fails to perform in accordance with the terms of the agreement.
| www. | calvert.com CALVERT INTERNATIONAL EQUITY FUND SEMI-ANNUAL REPORT (UNAUDITED) 32 |
Restricted Securities: The Fund may invest in securities that are subject to legal or contractual restrictions on resale. Generally, these securities may only be sold publicly upon registration under the Securities Act of 1933 or in transactions exempt from such registration. Information regarding restricted securities is included at the end of the Fund’s Statement of Net Assets.
Security Transactions and Net Investment Income: Security transactions are accounted for on trade date. Realized gains and losses are recorded on an identified cost basis and may include proceeds from litigation. Dividend income is recorded on the ex-dividend date or, in the case of dividends on certain foreign securities, as soon as the Fund is informed of the ex-dividend date. Distributions received on securities that represent a return of capital or capital gain are recorded as a reduction of cost of investments and/or as a realized gain. Interest income, which includes amortization of premium and accretion of discount on debt securities, is accrued as earned. Investment income and realized and unrealized gains and losses are allocated to separate classes of shares based upon the relative net assets of each class. Expenses arising in connection with a class are charged directly to that class. Expenses common to the classes are allocated to each class in proportion to their relative net assets. Withholding taxes on foreign dividends have been provided for in accordance with the Fund’s understanding of the applicable country’s tax rules and rates.
Foreign Currency Transactions: The Fund’s accounting records are maintained in U.S. dollars. For valuation of assets and liabilities on each date of net asset value determination, foreign denominations are converted into U.S. dollars using the current exchange rate. Security transactions, income and expenses are translated at the prevailing rate of exchange on the date of the event. The effect of changes in foreign exchange rates on securities and foreign currencies is included in the net realized and unrealized gain or loss on securities and foreign currencies.
Distributions to Shareholders: Distributions to shareholders are recorded by the Fund on ex-dividend date. Dividends from net investment income and distributions from net realized capital gains, if any, are paid at least annually. Distributions are determined in accordance with income tax regulations which may differ from generally accepted accounting principles; accordingly, periodic reclassifications are made within the Fund’s capital accounts to reflect income and gains available for distribution under income tax regulations.
Estimates: The preparation of the financial statements in conformity with accounting principles generally accepted in the United States requires management to make estimates and assumptions that affect the reported amounts of assets and liabilities and disclosure of contingent assets and liabilities at the date of the financial statements and the reported amounts of income and expenses during the reported period. Actual results could differ from those estimates.
Redemption Fees: The Fund charges a 2% redemption fee on redemptions, including exchanges, made within 30 days of purchase in the same Fund (within seven days for Class I shares). The redemption fee is paid to the Class of the Fund from which the redemption is made, and is accounted for as an addition to paid-in capital. The fee is
| www. | calvert.com CALVERT INTERNATIONAL EQUITY FUND SEMI-ANNUAL REPORT (UNAUDITED) 33 |
intended to discourage market-timers by ensuring that short-term trading costs are borne by the investors making the transactions and not the shareholders already in the Fund.
Expense Offset Arrangement: The Fund has an arrangement with its custodian bank whereby the custodian’s fees may be paid indirectly by credits earned on the Fund’s cash on deposit with the bank. These credits are used to reduce the Fund’s expenses. Such a deposit arrangement may be an alternative to overnight investments.
Federal Income Taxes: No provision for federal income or excise tax is required since the Fund intends to continue to qualify as a regulated investment company under the Internal Revenue Code and to distribute substantially all of its taxable earnings.
Management has analyzed the Fund’s tax positions taken for all open federal income tax years and has concluded that no provision for federal income tax is required in the Fund’s financial statements. A Fund’s federal tax return is subject to examination by the Internal Revenue Service for a period of three years.
NOTE B — RELATED PARTY TRANSACTIONS
Calvert Asset Management Company, Inc. (the “Advisor”) is wholly-owned by Calvert Group, Ltd. (“Calvert”), which is indirectly wholly owned by UNIFI Mutual Holding Company. The Advisor provides investment advisory services and pays the salaries and fees of officers and Directors of the Fund who are employees of the Advisor or its affiliates. For its services, the Advisor receives a monthly fee based on the following annual rates of average daily net assets: .75% on the first $250 million, .725% on the next $250 million and .675% on the excess of $500 million. Under the terms of the agreement, $237,741 was payable at period end. In addition, $121,253 was payable at period end for operating expenses paid by the Advisor during March 2011.
The Advisor has contractually agreed to limit net annual fund operating expenses through January 31, 2012 for Class I and Class Y. The contractual expense cap is 1.10% and 1.39%, respectively. For the purposes of this expense limit, operating expenses do not include interest expense, brokerage commissions, taxes, and extraordinary expenses. This expense limitation does not limit any acquired fund fees and expenses. To the extent any expense offset credits are earned, the Advisor’s obligation under the contractual limitation may be reduced and the Advisor may benefit from the expense offset arrangement. The Advisor voluntarily reimbursed Class B shares for expenses of $1,372 for the six months ended March 31, 2011.
Calvert Administrative Services Company, an affiliate of the Advisor, provides administrative services to the Fund for an annual fee, payable monthly, of .35% for Classes A, B, C and Y, and .15% for Class I, based on their average daily net assets. Under the terms of the agreement, $96,905 was payable at period end.
Calvert Distributors, Inc., an affiliate of the Advisor, is the distributor and principal underwriter for the Fund. Distribution Plans, adopted by Class A, Class B and Class C shares, allow the Fund to pay the Distributor for expenses and services associated with distribution of shares. The expenses paid may not exceed .35%, 1.00% and 1.00% annually of average daily net assets of each Class A, Class B and Class C, respectively. The amount actually paid by the Fund is an annualized fee, payable monthly of .25%, 1.00%
| www. | calvert.com CALVERT INTERNATIONAL EQUITY FUND SEMI-ANNUAL REPORT (UNAUDITED) 34 |
and 1.00% of the Fund’s average daily net assets of Class A, Class B and Class C, respectively. Class I and Class Y shares do not have Distribution Plan expenses. Under the terms of agreement, $77,727 was payable at period end.
The Distributor received $19,241 as its portion of commissions charged on sales of the Fund’s Class A shares for the six months ended March 31, 2011.
Calvert Shareholder Services, Inc. (“CSSI”), an affiliate of the Advisor, is the shareholder servicing agent for the Fund. For its services, CSSI received a fee of $89,291 for the six months ended March 31, 2011. Under the terms of the agreement, $14,745 was payable at period end. Boston Financial Data Services, Inc. is the transfer and dividend disbursing agent.
The Fund invests in Community Investment Notes issued by the Calvert Social Investment Foundation (the “CSI Foundation”). The CSI Foundation is a 501(c)(3) non-profit organization that receives in-kind support from the Calvert Group, Ltd. and its subsidiaries. The Fund has received from the Securities and Exchange Commission an exemptive order permitting the Fund to make investments in these notes under certain conditions.
Each Director of the Funds who is not an employee of the Advisor or its affiliates receives an annual retainer of $44,000 plus a meeting fee of $2,000 for each Board meeting attended. Additional fees of up to $5,000 annually may be paid to the Board chair and Committee chairs ($10,000 for the Special Equities Committee chair) and $2,500 annually may be paid to Committee members, plus a Committee meeting fee of $500 for each Committee meeting attended. Director’s fees are allocated to each of the Funds served.
NOTE C — INVESTMENT ACTIVITY
During the period, the cost of purchases and proceeds from sales of investments, other than short-term securities, were $121,400,969 and $115,532,231, respectively.
| CAPITAL LOSS CARRYFORWARDS | | | |
| EXPIRATION DATE | | | |
| 30-Sep-17 | ($ | 90,728,857 | ) |
| 30-Sep-18 | | (105,942,268 | ) |
Capital losses may be utilized to offset future capital gains until expiration. Under the recently enacted Regulated Investment Company Modernization Act of 2010, the Funds will be permitted to carry forward capital losses incurred in taxable years beginning after December 22, 2010 for an unlimited period. Losses incurred during those future years will be required to be utilized prior to the losses incurred in pre-enactment taxable years. As a result of this ordering rule, pre-enactment capital loss carryforwards may more likely expire unused. Also, post-enactment capital losses that are carried forward will retain their character as either short-term or long-term capital losses rather than being considered all short-term as under previous law.
| www. | calvert.com CALVERT INTERNATIONAL EQUITY FUND SEMI-ANNUAL REPORT (UNAUDITED) 35 |
The Fund intends to elect to defer net capital losses of $13,056,491 incurred from November 1, 2009 through September 30, 2010 and treat them as arising in the fiscal year ending September 30, 2011.
As of March 31, 2011, the tax basis components of unrealized appreciation/(depreciation) and the federal tax cost were as follows:
| Unrealized appreciation | $ | 42,739,831 | |
| Unrealized (depreciation) | | (13,424,164 | ) |
| Net unrealized appreciation/(depreciation) | $ | 29,315,667 | |
| Federal income tax cost of investments | $ | 346,405,294 | |
NOTE D — LINE OF CREDITA financing agreement is in place with all Calvert Group Funds and State Street Corporation (“SSC”). Under the agreement, SSC provides an unsecured line of credit facility, in the aggregate amount of $50 million ($25 million committed and $25 million uncommitted), accessible by the Funds for temporary or emergency purposes only. Borrowings under this committed facility bear interest at the higher of the London Interbank Offered Rate, (LIBOR) or the overnight Federal Funds Rate plus 1.25% per annum. A commitment fee of .125% per annum is incurred on the unused portion of the committed facility, which is allocated to all participating funds. The Fund had no borrowings under the agreement during the six months ended March 31, 2011.
NOTE E — AFFILIATED COMPANIES
An affiliated company is a company in which the Fund has a direct or indirect ownership of, control of, or voting power over 5 percent or more of the outstanding voting shares. Affiliated companies of the Fund are as follows:
| AFFILIATES | | COST | | VALUE |
| gNet Defta Development Holdings LLC, LP | $ | 400,000 | $ | 385,198 |
| SEAF Central & Eastern European Growth Fund LLC, LP | | 352,304 | | 526,370 |
| TOTALS | $ | 752,304 | $ | 911,568 |
NOTE F — SUBSEQUENT EVENTSIn preparing the financial statements as of March 31, 2011, no subsequent events or transactions occurred that would have materially impacted the financial statements as presented.
Effective April 30, 2011, the Calvert operating companies will be renamed as follows: Calvert Group, Ltd. will be renamed Calvert Investments, Inc., Calvert Asset Management Company, Inc. will be renamed Calvert Investment Management, Inc., Calvert Distributors, Inc. will be renamed Calvert Investment Distributors, Inc., Calvert Administrative Services Company will be renamed Calvert Investment Administrative
| www. | calvert.com CALVERT INTERNATIONAL EQUITY FUND SEMI-ANNUAL REPORT (UNAUDITED) 36 |
Services, Inc., and Calvert Shareholder Services, Inc. will be renamed Calvert Investment Services, Inc.
NOTE G — OTHER
In connection with certain venture capital investments, the Fund is committed to future capital calls, which will increase the Fund’s investment in these securities. The aggregate amount of the future capital commitments totals $476,468 at March 31, 2011.
| www. | calvert.com CALVERT INTERNATIONAL EQUITY FUND SEMI-ANNUAL REPORT (UNAUDITED) 37 |
| | | | | | | | | |
| FINANCIAL HIGHLIGHTS |
| | | Periods ended | |
| | | MARCH
31, | | | SEPTEMBER 30, | | | SEPTEMBER 30, | |
| class A shares | | 2011 | (z) | | 2010 | (z) | | 2009 | (z) |
| Net asset value, beginning | $ | 13.88 | | $ | 13.83 | | $ | 15.31 | |
| Income from investment operations: | | | | | | | | | |
| Net investment income | | *** | | | .06 | | | .11 | |
| Net realized and unrealized gain (loss) | | .84 | | | .09 | | | (1.19 | ) |
| Total from investment operations | | .84 | | | .15 | | | (1.08 | ) |
| Distributions from: | | | | | | | | | |
| Net investment income | | (.04 | ) | | (.10 | ) | | (.37 | ) |
| Net realized gain | | — | | | — | | | (.03 | ) |
| Total distributions | | (.04 | ) | | (.10 | ) | | (.40 | ) |
| Total increase (decrease) in net asset value | | 0.80 | | | 0.05 | | | (1.48 | ) |
| Net asset value, ending | $ | 14.68 | | $ | 13.88 | | $ | 13.83 | |
| |
| Total return* | | 6.04 | % | | 1.08 | % | | (6.27 | %) |
| Ratios to average net assets: A | | | | | | | | | |
| Net investment income (loss) | | (.08 | %) (a) | | .46 | % | | .99 | % |
| Total expenses | | 1.79 | % (a) | | 1.83 | % | | 1.87 | % |
| Expenses before offsets | | 1.79 | % (a) | | 1.80 | % | | 1.86 | % |
| Net expenses | | 1.79 | % (a) | | 1.80 | % | | 1.86 | % |
| Portfolio turnover | | 32 | % | | 133 | % | | 135 | % |
| Net assets, ending (in thousands) | $ | 255,213 | | $ | 245,309 | | $ | 270,900 | |
| |
| |
| | | | | | Years ended | | | | |
| | | SEPTEMBER 30, | | | SEPTEMBER 30, | | | SEPTEMBER 30, | |
| class A shares | | 2008 | | | 2007 | | | 2006 | |
| Net asset value, beginning | $ | 22.57 | | $ | 23.87 | | $ | 20.29 | |
| Income from investment operations: | | | | | | | | | |
| Net investment income | | .37 | | | .22 | | | .24 | |
| Net realized and unrealized gain (loss) | | (8.46 | ) | | 4.61 | | | 3.51 | |
| Total from investment operations | | (8.09 | ) | | 4.83 | | | 3.75 | |
| Distributions from: | | | | | | | | | |
| Net investment income | | (.24 | ) | | (.20 | ) | | (.17 | ) |
| Net realized gain | | (1.93 | ) | | (2.93 | ) | | — | |
| Total distributions | | (2.17 | ) | | (3.13 | ) | | (.17 | ) |
| Total increase (decrease) in net asset value | | (10.26 | ) | | 1.70 | | | 3.58 | |
| Net asset value, ending | $ | 15.31 | | $ | 25.57 | | $ | 23.87 | |
| |
| Total return* | | (34.31 | %) | | 21.72 | % | | 18.58 | % |
| Ratios to average net assets: A | | | | | | | | | |
| Net investment income | | 1.81 | % | | 1.08 | % | | 1.19 | % |
| Total expenses | | 1.65 | % | | 1.62 | % | | 1.73 | % |
| Expenses before offsets | | 1.63 | % | | 1.60 | % | | 1.72 | % |
| Net expenses | | 1.63 | % | | 1.60 | % | | 1.71 | % |
| Portfolio turnover | | 100 | % | | 82 | % | | 120 | % |
| Net assets, ending (in thousands) | $ | 324,091 | | $ | 546,564 | | $ | 401,195 | |
See notes to financial highlights.
| www. | calvert.com CALVERT INTERNATIONAL EQUITY FUND SEMI-ANNUAL REPORT (UNAUDITED) 38 |
| | | | | | | | | |
| FINANCIAL HIGHLIGHTS |
| |
| |
| | | | | | Periods ended | | | | |
| | | MARCH
31, | | | SEPTEMBER 30, | | | SEPTEMBER 30, | |
| cLass B shares | | 2011 | (z) | | 2010 | (z) | | 2009 | (z) |
| Net asset value, beginning | $ | 12.40 | | $ | 12.40 | | $ | 13.69 | |
| Income from investment operations: | | | | | | | | | |
| Net investment income (loss) | | (.08 | ) | | (.09 | ) | | (.02 | ) |
| Net realized and unrealized gain (loss) | | .74 | | | .09 | | | (1.06 | ) |
| Total from investment operations | | .66 | | | — | | | (1.08 | ) |
| Distributions from: | | | | | | | | | |
| Net investment income | | — | | | — | | | (.18 | ) |
| Net realized gain | | — | | | — | | | (.03 | ) |
| Total distributions | | — | | | — | | | (.21 | ) |
| Total increase (decrease) in net asset value | | .66 | | | — | | | (1.29 | ) |
| Net asset value, ending | $ | 13.06 | | $ | 12.40 | | $ | 12.40 | |
| |
| Total return* | | 5.32 | % | | 0.00 | % | | (7.47 | %) |
| Ratios to average net assets: A | | | | | | | | | |
| Net investment income (loss) | | (1.28 | %) (a) | | (.74 | %) | | (.26 | %) |
| Total expenses | | 3.01 | % (a) | | 3.03 | % | | 3.12 | % |
| Expenses before offsets | | 2.97 | % (a) | | 2.97 | % | | 3.10 | % |
| Net expenses | | 2.97 | % (a) | | 2.97 | % | | 3.10 | % |
| Portfolio turnover | | 32 | % | | 133 | % | | 135 | % |
| Net assets, ending (in thousands) | $ | 6,360 | | $ | 6,850 | | $ | 8,993 | |
| |
| |
| | | | | | Years ended | | | | |
| | | SEPTEMBER
30, | | | SEPTEMBER 30, | | | SEPTEMBER 30, | |
| cLass B shares | | 2008 | | | 2007 | | | 2006 | |
| Net asset value, beginning | $ | 23.11 | | $ | 21.85 | | $ | 18.61 | |
| Income from investment operations: | | | | | | | | | |
| Net investment income | | .12 | | | .09 | | | .06 | |
| Net realized and unrealized gain (loss) | | (7.56 | ) | | 4.10 | | | 3.18 | |
| Total from investment operations | | (7.44 | ) | | 4.19 | | | 3.24 | |
| Distributions from: | | | | | | | | | |
| Net investment income | | (.05 | ) | | — | | | ** | |
| Net realized gain | | (1.93 | ) | | (2.93 | ) | | — | |
| Total distributions | | (1.98 | ) | | (2.93 | ) | | ** | |
| Total increase (decrease) in net asset value | | (9.42 | ) | | 1.26 | | | 3.24 | |
| Net asset value, ending | $ | 13.69 | | $ | 23.11 | | $ | 21.85 | |
| |
| Total return* | | (34.97 | %) | | 20.60 | % | | 17.43 | % |
| Ratios to average net assets: A | | | | | | | | | |
| Net investment income | | .78 | % | | .13 | % | | .18 | % |
| Total expenses | | 2.63 | % | | 2.57 | % | | 2.73 | % |
| Expenses before offsets | | 2.61 | % | | 2.54 | % | | 2.72 | % |
| Net expenses | | 2.60 | % | | 2.54 | % | | 2.70 | % |
| Portfolio turnover | | 100 | % | | 82 | % | | 120 | % |
| Net assets, ending (in thousands) | $ | 12,512 | | $ | 23,805 | | $ | 18,053 | |
See notes to financial highlights.
| www. | calvert.com CALVERT INTERNATIONAL EQUITY FUND SEMI-ANNUAL REPORT (UNAUDITED) 39 |
| | | | | | | | | |
| FINANCIAL HIGHLIGHTS |
| |
| |
| | | | | | PerIods ended | | | | |
| | | MARCH
31, | | | SEPTEMBER 30, | | | SEPTEMBER 30, | |
| cLass c shares | | 2011 | (z) | | 2010 | (z) | | 2009 | (z) |
| Net asset value, beginning | $ | 12.10 | | $ | 12.07 | | $ | 13.31 | |
| Income from investment operations: | | | | | | | | | |
| Net investment income (loss) | | (.06 | ) | | (.05 | ) | | .01 | |
| Net realized and unrealized gain (loss) | | .73 | | | .08 | | | (1.03 | ) |
| Total from investment operations | | .67 | | | .03 | | | (1.02 | ) |
| Distributions from: | | | | | | | | | |
| Net investment income | | — | | | — | | | (.19 | ) |
| Net realized gain | | — | | | — | | | (.03 | ) |
| Total distributions | | — | | | — | | | (.22 | ) |
| Total increase (decrease) in net asset value | | 0.67 | | | 0.03 | | | (1.24 | ) |
| Net asset value, ending | $ | 12.77 | | $ | 12.10 | | $ | 12.07 | |
| |
| Total return* | | 5.54 | % | | 0.25 | % | | (7.16 | %) |
| Ratios to average net assets: A | | | | | | | | | |
| Net investment income (loss) | | (.97 | %) (a) | | (.41 | %) | | .07 | % |
| Total expenses | | 2.67 | % (a) | | 2.72 | % | | 2.79 | % |
| Expenses before offsets | | 2.67 | % (a) | | 2.69 | % | | 2.79 | % |
| Net expenses | | 2.67 | % (a) | | 2.69 | % | | 2.79 | % |
| Portfolio turnover | | 32 | % | | 133 | % | | 135 | % |
| Net assets, ending (in thousands) | $ | 21,837 | | $ | 21,942 | | $ | 24,107 | |
| |
| |
| | | | | | Years ended | | | | |
| | | SEPTEMBER 30, | | | SEPTEMBER 30, | | | SEPTEMBER 30, | |
| cLass c shares | | 2008 | | | 2007 | | | 2006 | |
| Net asset value, beginning | $ | 22.51 | | $ | 21.34 | | $ | 18.18 | |
| Income from investment operations: | | | | | | | | | |
| Net investment income | | .19 | | | .13 | | | .13 | |
| Net realized and unrealized gain (loss) | | (7.40 | ) | | 3.99 | | | 3.06 | |
| Total from investment operations | | (7.21 | ) | | 4.12 | | | 3.19 | |
| Distributions from: | | | | | | | | | |
| Net investment income | | (.06 | ) | | (.02 | ) | | (.03 | ) |
| Net realized gain | | (1.93 | ) | | (2.93 | ) | | — | |
| Total distributions | | (1.99 | ) | | (2.95 | ) | | (.03 | ) |
| Total increase (decrease) in net asset value | | (9.20 | ) | | 1.17 | | | 3.16 | |
| Net asset value, ending | $ | 13.31 | | $ | 22.51 | | $ | 21.34 | |
| |
| Total return* | | (34.86 | %) | | 20.81 | % | | 17.55 | % |
| Ratios to average net assets: A | | | | | | | | | |
| Net investment income | | 1.01 | % | | .31 | % | | .38 | % |
| Total expenses | | 2.47 | % | | 2.43 | % | | 2.57 | % |
| Expenses before offsets | | 2.45 | % | | 2.41 | % | | 2.56 | % |
| Net expenses | | 2.45 | % | | 2.40 | % | | 2.55 | % |
| Portfolio turnover | | 100 | % | | 82 | % | | 120 | % |
| Net assets, ending (in thousands) | $ | 31,475 | | $ | 50,790 | | $ | 32,723 | |
See notes to financial highlights.
| www. | calvert.com CALVERT INTERNATIONAL EQUITY FUND SEMI-ANNUAL REPORT (UNAUDITED) 40 |
| | | | | | | | | |
| FINANCIAL HIGHLIGHTS |
| |
| |
| | | | | | Periods ended | | | | |
| | | MARCH
31, | | | SEPTEMBER 30, | | | SEPTEMBER 30, | |
| cLass I shares | | 2011 | (z) | | 2010 | (z) | | 2009 | (z) |
| Net asset value, beginning | $ | 14.83 | | $ | 14.79 | | $ | 16.37 | |
| Income from investment operations: | | | | | | | | | |
| Net investment income | | .05 | | | .17 | | | .22 | |
| Net realized and unrealized gain (loss) | | .90 | | | .11 | | | (1.29 | ) |
| Total from investment operations | | .95 | | | .28 | | | (1.07 | ) |
| Distributions from: | | | | | | | | | |
| Net investment income | | (.09 | ) | | (.24 | ) | | (.48 | ) |
| Net realized gain | | — | | | — | | | (.03 | ) |
| Total distributions | | (.09 | ) | | (.24 | ) | | (.51 | ) |
| Total increase (decrease) in net asset value | | 0.86 | | | 0.04 | | | (1.58 | ) |
| Net asset value, ending | $ | 15.69 | | $ | 14.83 | | $ | 14.79 | |
| |
| Total return* | | 6.44 | % | | 1.91 | % | | (5.59 | %) |
| Ratios to average net assets: A | | | | | | | | | |
| Net investment income | | .65 | % (a) | | 1.17 | % | | 1.80 | % |
| Total expenses | | 1.07 | % (a) | | 1.08 | % | | 1.08 | % |
| Expenses before offsets | | 1.06 | % (a) | | 1.06 | % | | 1.07 | % |
| Net expenses | | 1.06 | % (a) | | 1.06 | % | | 1.07 | % |
| Portfolio turnover | | 32 | % | | 133 | % | | 135 | % |
| Net assets, ending (in thousands) | $ | 91,166 | | $ | 86,475 | | $ | 107,456 | |
| |
| |
| | | | | | Years ended | | | | |
| | | SEPTEMBER 30, | | | SEPTEMBER 30, | | | SEPTEMBER 30, | |
| cLass I shares | | 2008 | | | 2007 | | | 2006 | |
| Net asset value, beginning | $ | 27.15 | | $ | 25.16 | | $ | 21.32 | |
| Income from investment operations: | | | | | | | | | |
| Net investment income | | .48 | | | .34 | | | .37 | |
| Net realized and unrealized gain (loss) | | (8.96 | ) | | 4.93 | | | 3.72 | |
| Total from investment operations | | (8.48 | ) | | 5.27 | | | 4.09 | |
| Distributions from: | | | | | | | | | |
| Net investment income | | (.37 | ) | | (.35 | ) | | (.25 | ) |
| Net realized gain | | (1.93 | ) | | (2.93 | ) | | — | |
| Total distributions | | (2.30 | ) | | (3.28 | ) | | (.25 | ) |
| Total increase (decrease) in net asset value | | (10.78 | ) | | 1.99 | | | 3.84 | |
| Net asset value, ending | $ | 16.37 | | $ | 27.15 | | $ | 25.16 | |
| |
| Total return* | | (33.84 | %) | | 22.49 | % | | 19.35 | % |
| Ratios to average net assets: A | | | | | | | | | |
| Net investment income | | 2.47 | % | | 1.74 | % | | 1.84 | % |
| Total expenses | | 1.00 | % | | .98 | % | | 1.07 | % |
| Expenses before offsets | | .98 | % | | .96 | % | | 1.06 | % |
| Net expenses | | .97 | % | | .96 | % | | 1.05 | % |
| Portfolio turnover | | 100 | % | | 82 | % | | 120 | % |
| Net assets, ending (in thousands) | $ | 118,033 | | $ | 181,672 | | $ | 124,197 | |
See notes to financial highlights.
| www. | calvert.com CALVERT INTERNATIONAL EQUITY FUND SEMI-ANNUAL REPORT (UNAUDITED) 41 |
| | | | | | | | | |
| FINANCIAL HIGHLIGHTS |
| |
| | | | | | Periods ended | | | | |
| | | MARCH
31, | | | SEPTEMBER 30, | | | SEPTEMBER 30, | |
| cLass Y shares | | 2011 | (z) | | 2010 | (z) | | 2009 | # (z) |
| Net asset value, beginning | $ | 14.53 | | $ | 14.34 | | $ | 11.45 | |
| Income from investment operations: | | | | | | | | | |
| Net investment income | | .02 | | | .08 | | | .17 | |
| Net realized and unrealized gain (loss) | | .87 | | | .17 | | | 2.76 | |
| Total from investment operations | | .89 | | | .25 | | | 2.93 | |
| Distributions from: | | | | | | | | | |
| Net investment income | | (.02 | ) | | (.06 | ) | | (.01 | ) |
| Net realized gain | | — | | | — | | | (.03 | ) |
| Total distributions | | (.02 | ) | | (.06 | ) | | (.04 | ) |
| Total increase (decrease) in net asset value | | 0.87 | | | 0.19 | | | 2.89 | |
| Net asset value, ending | $ | 15.40 | | $ | 14.53 | | $ | 14.34 | |
| |
| Total return* | | 6.13 | % | | 1.73 | % | | 25.75 | % |
| Ratios to average net assets: A | | | | | | | | | |
| Net investment income | | .44 | % (a) | | .61 | % | | 1.52 | % (a) |
| Total expenses | | 1.60 | % (a) | | 2.14 | % | | 5.91 | % (a) |
| Expenses before offsets | | 1.39 | % (a) | | 1.39 | % | | 1.39 | % (a) |
| Net expenses | | 1.39 | % (a) | | 1.39 | % | | 1.39 | % (a) |
| Portfolio turnover | | 32 | % | | 133 | % | | 100 | % |
| Net assets, ending (in thousands) | $ | 5,734 | | $ | 2,790 | | $ | 702 | |
| A | Total expenses do not reflect amounts reimbursed and/or waived by the Advisor or reductions from expense offset arrangements. Expenses before offsets reflect expenses after reimbursement and/or waiver by the Advisor but prior to reductions from expense offset arrangements. Net expenses are net of all reductions and represent the net expenses paid by the Fund. |
| (a) | Annualized. |
| (z) | Per share figures are calculated using the Average Share Method. |
| * | Total return is not annualized for periods less than one year and does not reflect deduction of any front- end or deferred sales charge. |
| ** | Distribution is less than $0.01 per share. |
| *** | Net investment loss was $0.006 per share. |
| # | From October 31, 2008, inception. |
See notes to financial statements.
| www. | calvert.com CALVERT INTERNATIONAL EQUITY FUND SEMI-ANNUAL REPORT (UNAUDITED) 42 |
EXPLANATION OF FINANCIAL TABLES
SCHEDULE OF INVESTMENTS
The Schedule of Investments is a snapshot of all securities held in the fund at their market value, on the last day of the reporting period. Securities are listed by asset type (e.g., common stock, corporate bonds, U.S. government obligations) or, for International Funds, by country, and may be further broken down into sub-groups and by industry classification.
STATEMENT OF ASSETS AND LIABILITIES
The Statement of Assets and Liabilities is often referred to as the fund’s balance sheet. It lists the value of what the fund owns, is due and owes on the last day of the reporting period. The fund’s assets include the market value of securities owned, cash, receivables for securities sold and shareholder subscriptions, and receivables for dividends and interest payments that have been earned, but not yet received. The fund’s liabilities include payables for securities purchased and shareholder redemptions, and expenses owed but not yet paid. The statement also reports the fund’s net asset value (NAV) per share on the last day of the reporting period. The NAV is calculated by dividing the fund’s net assets (assets minus liabilities) by the number of shares outstanding. This statement is accompanied by a Schedule of Investments. Alternatively, if certain conditions are met, a Statement of Net Assets may be presented in lieu of this statement and the Schedule of Investments.
STATEMENT OF NET ASSETS
The Statement of Net Assets provides a detailed list of the fund’s holdings, including each security’s market value on the last day of the reporting period. The Statement of Net Assets includes a Schedule of Investments. Other assets are added and other liabilities subtracted from the investments total to calculate the fund’s net assets. Finally, net assets are divided by the outstanding shares of the fund to arrive at its share price, or Net Asset Value (NAV) per share.
At the end of the Statement of Net Assets is a table displaying the composition of the fund’s net assets. Paid in Capital is the money invested by shareholders and represents the bulk of net assets. Undistributed Net Investment Income and Accumulated Net Realized Gains usually approximate the amounts the fund had available to distribute to shareholders as of the statement date. Accumulated Realized Losses will appear as negative balances. Unrealized Appreciation (Depreciation) is the difference between the market value of the fund’s investments and their cost, and reflects the gains (losses) that would be realized if the fund were to sell all of its investments at their statement-date values.
STATEMENT OF OPERATIONS
The Statement of Operations summarizes the fund’s investment income earned and expenses incurred in operating the fund. Investment income includes dividends earned from stocks and interest earned from interest-bearing securities in the fund. Expenses incurred in operating the fund include the advisory fee paid to the investment advisor, administrative services fees, distribution plan expenses (if applicable), transfer agent fees, shareholder servicing expenses, custodial, legal, and audit fees, and the printing and post-
| www. | calvert.com CALVERT INTERNATIONAL EQUITY FUND SEMI-ANNUAL REPORT (UNAUDITED) 43 |
age expenses related to shareholder reports. Expense offsets (fees paid indirectly) are also shown. Credits earned from offset arrangements are used to reduce the fund’s expenses. This statement also shows net gains (losses) realized on the sale of investments and the increase or decrease in the unrealized appreciation (depreciation) on investments held during the period. stateMent of changes In net assets
The Statement of Changes in Net Assets shows how the fund’s total net assets changed during the two most recent reporting periods. Changes in the fund’s net assets are attributable to investment operations, distributions and capital share transactions.
The Operations section of the report summarizes information detailed in the Statement of Operations. The Distribution section shows the dividend and capital gain distributions made to shareholders. The amounts shown as distributions in this section may not match the net investment income and realized gains amounts shown in the Operations section because distributions are determined on a tax basis and certain investments or transactions may be treated differently for financial statement and tax purposes. The Capital Share Transactions section shows the amount shareholders invested in the fund, either by purchasing shares or by reinvesting distributions, and the amounts redeemed. The corresponding numbers of shares issued, reinvested and redeemed are shown at the end of the report. fInancIaL hIghLIghts
The Financial Highlights table provides a per-share breakdown per class of the components that affect the fund’s net asset value for current and past reporting periods. The table provides total return, total distributions, expense ratios, portfolio turnover and net assets for the applicable period. Total return is a measure of a fund’s performance that encompasses all elements of return: dividends, capital gain distributions and changes in net asset value. Total return is the change in value of an investment over a given period, assuming reinvestment of any dividends and capital gain distributions, expressed as a percentage of the initial investment. Total distributions include distributions from net investment income and net realized gains. Long-term gains are earned on securities held in the fund more than one year. Short-term gains, on the sale of securities held less than one year, are treated as ordinary dividend income for tax purposes. The expense ratio is a fund’s cost of doing business, expressed as a percentage of net assets. These expenses directly reduce returns to shareholders. Portfolio turnover measures the trading activity in a fund’s investment portfolio – how often securities are bought and sold by a fund. Portfolio turnover is affected by market conditions, changes in the size of the fund, the nature of the fund’s investments and the investment style of the portfolio manager.
| www. | calvert.com CALVERT INTERNATIONAL EQUITY FUND SEMI-ANNUAL REPORT (UNAUDITED) 44 |
PROXY VOTING
The Proxy Voting Guidelines of the Calvert Funds that the Fund uses to determine how to vote proxies relating to portfolio securities are provided as an Appendix to the Fund’s Statement of Additional Information. The Statement of Additional Information can be obtained free of charge by calling the Fund at 1-800-368-2745, by visiting the Calvert website at www.calvert.com; or by visiting the SEC’s website at www.sec.gov.
Information regarding how the Fund voted proxies relating to portfolio securities during the most recent 12-month period ended June 30 is available on the Fund’s website at www.calvert.com and on the SEC’s website at www.sec.gov.
AVAILABILITY OF QUARTERLY PORTFOLIO HOLDINGS
The Fund files its complete schedule of portfolio holdings with the SEC for the first and third quarters of each fiscal year on Form N-Q. The Fund’s Form N-Q is available on the SEC’s website at www.sec.gov. The Fund’s Form N-Q may be reviewed and copied at the SEC’s Public Reference Room in Washington, DC; information on the operation of the Public Reference Room may be obtained by calling 1-800-SEC-0330.
BASIS FOR BOARD’S APPROVAL OF INVESTMENT ADVISORY CONTRACTS
At a meeting held on December 7, 2010, the Board of Directors, and by a separate vote, the disinterested Directors, approved the continuance of the Investment Advisory Agreement between Calvert World Values Fund, Inc. and the Advisor and the Investment Subadvisory Agreement between the Advisor and each of Thornburg Investment Management, Inc. and Martin Currie, Inc. (each a “Subadvisor”) with respect to the Fund.
In evaluating the Investment Advisory Agreement, the Board considered a variety of information relating to the Fund and the Advisor. The disinterested Directors reviewed a report prepared by the Advisor regarding various services provided to the Fund by the Advisor and its affiliates. Such report included, among other data, information regarding the Advisor’s personnel and the Advisor’s revenue and cost of providing services to the Fund, and a separate report prepared by an independent third party, which provided a statistical analysis comparing the Fund’s investment performance, expenses, and fees to comparable mutual funds.
The disinterested Directors were separately represented by independent legal counsel with respect to their consideration of the reapproval of the Investment Advisory Agreement and each Investment Subadvisory Agreement with the applicable Subadvisor. Prior to voting, the disinterested Directors reviewed the proposed continuance of the Investment
| www. | calvert.com CALVERT INTERNATIONAL EQUITY FUND SEMI-ANNUAL REPORT (UNAUDITED) 45 |
Advisory Agreement and each Investment Subadvisory Agreement with management and also met in private sessions with their counsel at which no representatives of management were present.
In the course of its deliberations regarding the Investment Advisory Agreement, the Board considered the following factors, among others: the nature, extent and quality of the services provided by the Advisor, including the personnel providing such services; the Advisor’s financial condition; the level and method of computing the Fund’s advisory fee; comparative performance, fee and expense information for the Fund; the profitability of the Calvert Group of Funds to the Advisor and its affiliates; the allocation of the Fund’s brokerage, including the Advisor’s process for monitoring “best execution”; the direct and indirect benefits, if any, derived by the Advisor and its affiliates from their relationship with the Fund; the effect of the Fund’s growth and size on the Fund’s performance and expenses; the affiliated distributor’s process for monitoring sales load breakpoints; the Advisor’s compliance programs and policies; the Advisor’s performance of substantially similar duties for other funds; and any possible conflicts of interest.
In considering the nature, extent and quality of the services provided by the Advisor under the Investment Advisory Agreement, the Board reviewed information provided by the Advisor relating to its operations and personnel, including, among other information, biographical information on the Advisor’s investment, supervisory and professional staff and descriptions of its organizational and management structure. The Board also took into account similar information provided periodically throughout the previous year by the Advisor as well as the Board’s familiarity with the Advisor’s senior management through Board of Directors’ meetings, discussions and other reports. The Board considered the Advisor’s management style and its performance in employing its investment strategies, as well as its current level of staffing and overall resources. The Advisor’s administrative capabilities, including its ability to supervise the other service providers for the Fund, were also considered. The Board also took into account the environmental, social, sustainability and governance research and analysis provided by the Advisor to the Fund. The Board discussed the Advisor’s effectiveness in monitoring the performance of the Subadvisors and its timeliness in responding to performance issues. The Board concluded that it was satisfied with the nature, extent and quality of services provided to the Fund by the Advisor under the Investment Advisory Agreement.
In considering the Fund’s performance, the Board noted that it reviewed on a quarterly basis detailed information about the Fund’s performance results, portfolio composition and investment strategies. In addition, the Board took into account overall financial market conditions. The Board also reviewed various comparative data provided to it in connection with its consideration of the renewal of the Investment Advisory Agreement, including, among other information, a comparison of the Fund’s total return with its Lipper index and with that of other mutual funds deemed to be in its peer group by an independent third party in its report. This comparison indicated that the Fund performed below the median of its peer universe for the one-, three- and five-year periods ended June 30, 2010. The data also indicated that the Fund underperformed its Lipper index for the same one-, three- and five-year periods ended June 30, 2010. The Board took into account management’s discussion of the Fund’s performance, including the fact that the Advisor and two new subadvisors assumed day-to-day management of the Fund
| www. | calvert.com CALVERT INTERNATIONAL EQUITY FUND SEMI-ANNUAL REPORT (UNAUDITED) 46 |
as of December 11, 2009. The Board noted the Advisor’s continued monitoring of the Fund’s performance. Based upon its review, the Board concluded that appropriate action was being taken with respect to the Fund’s performance.
In considering the Fund’s fees and expenses, the Board compared the Fund’s fees and total expense ratio with various comparative data for the funds in its peer group. Among other findings, the data indicated that the Fund’s advisory fee was below the median of its peer group and that total expenses were above the median of its peer group. The Board noted that the allocation of advisory and administrative fees may vary among the Fund’s peer group. The Board noted the Advisor’s discussion of the Fund’s expenses and certain factors that affected the level of such expenses, including the cost of providing the environmental, social, sustainability and governance research and analysis provided by the Advisor. Based upon its review, the Board determined that the advisory fee was reasonable in view of the quality of services provided by the Advisor and the other factors considered.
The Board reviewed the Advisor’s profitability on a fund-by-fund basis. In reviewing the overall profitability of the advisory fee to the Fund’s Advisor, the Board also considered the fact that affiliates of the Advisor provided shareholder servicing and administrative services to the Fund for which they received compensation. The information considered by the Board included Calvert’s operating profit margin information both before and after tax expenses with respect to the services that the Advisor and its affiliates provided to the Calvert Group of Funds complex. The Board reviewed the profitability of the Advisor’s relationship with the Fund in terms of the total amount of annual advisory fees it received with respect to the Fund and whether the Advisor had the financial wherewithal to continue to provide a high level of services to the Fund. The Board noted that the Advisor had reimbursed expenses of the Fund. The Board also noted the Advisor’s current undertaking to maintain expense limitations for the Fund’s Class I shares. The Board also considered that the Advisor derived benefits to its reputation and other indirect benefits from its relationship with the Fund. The Board noted that the Advisor paid the subadvisory fees to the Subadvisors. Based upon its review, the Board concluded that the Advisor’s and its affiliates’ level of profitability from their relationship with the Fund was reasonable.
The Board considered the effect of the Fund’s current size and potential growth on its performance and fees. The Board took into account that the Fund’s advisory fee schedule contained breakpoints that would reduce the advisory fee rate on assets above specified levels as the Fund’s assets increased. The Board noted that the Fund was currently realizing economies of scale in its advisory fee. The Board also noted that if the Fund’s assets increased over time, the Fund might realize other economies of scale if assets increased proportionally more than certain other expenses.
In reapproving the Investment Advisory Agreement, the Board, including the disinterested Directors, did not identify any single factor as controlling, and each Director may have attributed different weight to various factors.
In evaluating each of the Investment Subadvisory Agreements, the disinterested Directors
| www. | calvert.com CALVERT INTERNATIONAL EQUITY FUND SEMI-ANNUAL REPORT (UNAUDITED) 47 |
reviewed information provided by the Subadvisors relating to their respective operations, personnel, investment philosophy, strategies and techniques. Among other information, the Subadvisors provided biographical information on portfolio management and other professional staff, performance information for themselves, and descriptions of their respective investment philosophies, strategies and techniques, organizational and management structures and brokerage policies and practices.
The Board reapproved the Investment Subadvisory Agreement between the Advisor and each of the Subadvisors based on a number of factors relating to each Subadvisor’s ability to perform under the respective Investment Subadvisory Agreement. In the course of its deliberations, the Board evaluated, among other factors: the nature, extent and the quality of the services to be provided by each Subadvisor; each Subadvisor’s management style and long-term performance record; each Subadvisor’s performance in employing its investment strategies; each Subadvisor’s current level of staffing and its overall resources; the qualifications and experience of each Subadvisor’s personnel; each Subadvisor’s financial condition with respect to its ability to perform the services required under the respective Investment Subadvisory Agreement; each Subadvisor’s compliance systems, including those related to personal investing; and any disciplinary history. Based upon its review, the Board concluded that it was satisfied with the nature, extent and quality of services provided to the Fund by each Subadvisor under the respective Investment Subadvisory Agreement.
As noted above, the Board considered, among other information, the Fund’s performance during the one-, three- and five-year periods ended June 30, 2010 as compared to the Fund’s peer universe and noted that it reviewed on a quarterly basis detailed information about the Fund’s performance results, portfolio composition and investment strategies. The Board noted the Advisor’s expertise and resources in monitoring the performance, investment style and risk-adjusted performance of the Subadvisors.
In considering the cost of services to be provided by each Subadvisor and the profitability to each Subadvisor of its relationship with the Fund, the Board noted that the subad-visory fees under each Investment Subadvisory Agreement was paid by the Advisor out of the advisory fee that the Advisor received under the Investment Advisory Agreement. The Board also relied on the ability of the Advisor to negotiate each Investment Subadvisory Agreement and the corresponding subadvisory fee at arm’s length. In addition, the Board took into account the fees the Subadvisors charged to their other clients and considered these fee comparisons in light of the differences in managing these other accounts. Based upon its review, the Board determined that the subadvisory fees were reasonable. Because the Advisor pays the Subadvisors’ subadvisory fees and the sub-advisory fees were negotiated at arm’s length by the Advisor, the cost of services to be provided by the Subadvisors and the profitability to the Subadvisors of their relationships with the Fund were not material factors in the Board’s deliberations. For similar reasons, the Board did not consider the potential economies of scale in each Subadvisor’s management of the Fund to be a material factor in its consideration, although the Board noted that Martin Currie, Inc.’s subadvisory fee schedule for the Fund contained breakpoints that reduced the subadvisory fee rate on assets above specified levels.
In reapproving each Investment Subadvisory Agreement, the Board, including the dis-
| www. | calvert.com CALVERT INTERNATIONAL EQUITY FUND SEMI-ANNUAL REPORT (UNAUDITED) 48 |
interested Directors, did not identify any single factor as controlling, and each Director may have attributed different weight to various factors.
CONCLUSIONS
The Board reached the following conclusions regarding the Investment Advisory Agreement and each Investment Subadvisory Agreement, among others: (a) the Advisor has demonstrated that it possesses the capability and resources to perform the duties required of it under the Investment Advisory Agreement; (b) the Advisor and each Subadvisor is qualified to manage the Fund’s assets in accordance with the Fund’s investment objectives and policies; (c) the Advisor and each Subadvisor maintain appropriate compliance programs; (d) the Advisor and each Subadvisor is likely to execute its investment strategies consistently over time; (e) appropriate action is being taken with respect to the performance of the Fund; and (f) the Fund’s advisory and subadvisory fees are reasonable relative to those of similar funds and to the services to be provided by the Advisor and each Subadvisor. Based on its conclusions, the Board determined that reapproval of the Investment Advisory Agreement and each Investment Subadvisory Agreement would be in the best interests of the Fund and its shareholders.
| www. | calvert.com CALVERT INTERNATIONAL EQUITY FUND SEMI-ANNUAL REPORT (UNAUDITED) 49 |
To Open an Account
800-368-2748
Yields and Prices
Calvert Information Network
(24 hours, 7 days a week)
800-368-2745
Service for Existing Account
Shareholders: 800-368-2745
Brokers: 800-368-2746
TDD for Hearing Impaired
800-541-1524
Branch Office
4550 Montgomery Avenue
Suite 1000 North
Bethesda, Maryland 20814
Registered, Certified or Overnight Mail
Calvert Investments
c/o BFDS,
330 West 9th Street
Kansas City, MO 64105
Web Site
www.calvert.com
Principal Underwriter
Calvert Investment Distributors, Inc.
4550 Montgomery Avenue
Suite 1000 North
Bethesda, Maryland 20814
| | |
| CALVERT | CALVERT’S | Equity Funds |
| INTERNATIONAL | FAMILY OF FUNDS | Enhanced Equity Portfolio |
| EQUITY | | Equity Portfolio |
| FUND | Tax-Exempt Money | Large Cap Growth Fund |
| | Market Funds | Large Cap Value Fund |
| | CTFR Money Market Portfolio | Social Index Fund |
| | | Capital Accumulation Fund |
| | Taxable Money Market | International Equity Fund |
| | Funds | Small Cap Fund |
| | First Government Money Market | Global Alternative Energy Fund |
| | Fund | Global Water Fund |
| | Money Market Portfolio | International Opportunities Fund |
| |
| | Municipal Funds | Balanced and Asset |
| | Tax-Free Bond Fund | Allocation Funds |
| | | Balanced Portfolio |
| | Taxable Bond Funds | Conservative Allocation Fund |
| | Bond Portfolio | Moderate Allocation Fund |
| | Income Fund | Aggressive Allocation Fund |
| | Short Duration Income Fund | |
| | Long-Term Income Fund | |
| | Ultra-Short Income Fund | |
| | Government Fund | |
| | High-Yield Bond Fund | |
This report is intended to provide fund information to shareholders. It is not authorized for distribution to prospective investors unless preceded or accompanied by a prospectus.
Note: The information on our website is not incorporated by reference into this report; our website address is included as an inactive textual reference only.
Investors should carefully consider the investment objectives, risks, charges and expenses of the Calvert Funds. This and other important information is contained in the fund’s summary prospectus and prospectus, which can be obtained from your financial professional and should be read carefully before investing. You may also call Calvert at 800/368-2745 or visit www. calvert.com.
INFORMATION REGARDING CALVERT OPERATING COMPANY
NAME CHANGES
Effective on April 30, 2011, the following Calvert operating companies will be renamed as indicated:
| | |
| Current Company Name | Company Name on 4/30/11 | Company Description |
| |
| Calvert Group, Ltd. | Calvert Investments, Inc. | Corporate parent of each |
| | | operating company listed |
| | | below |
| |
| Calvert Asset Management | Calvert Investment | Investment advisor to the |
| Company, Inc. | Management, Inc. | Calvert Funds |
| |
| Calvert Distributors, Inc. | Calvert Investment Distributors, | Principal underwriter |
| | Inc. | and distributor for the |
| | | Calvert Funds |
| |
| Calvert Administrative | Calvert Investment | Administrative services |
| Services Company | Administrative Services, Inc. | provider for the Calvert |
| | | Funds |
| |
| Calvert Shareholder | Calvert Investment Services, | Shareholder servicing |
| Services, Inc. | Inc. | provider for the Calvert |
| | | Funds |
Choose Planet-friendly E-delivery!
Sign up now for on-line statements, prospectuses, and fund reports. In less than five minutes you can help reduce paper mail and lower fund costs.
Just go to www.calvert.com. If you already have an online account at Calvert, click on My Account, and select the documents you would like to receive via e-mail.
If you’re new to online account access, click on Login/Register to open an online account. Once you’re in, click on the E-delivery sign-up at the bottom of the Account Portfolio page and follow the quick, easy steps. Note: if your shares are not held directly at Calvert but through a brokerage firm, you must contact your broker for electronic delivery options available through their firm.

Dear Shareholders:
The financial markets ended the six-month reporting period on a high note. The Federal Reserve’s announcement in the fall of 2010 of a second round of quantitative easing (QE2) initially buoyed the markets, which were further bolstered by the extension in December of the Bush-era tax cuts for all income levels. The resulting increase in U.S. consumer spending and confidence helped drive a year-end rally.
This calm lasted until new storms arrived in the beginning of 2011. Civil and political unrest in the Middle East and North Africa sent the price of energy soaring and heightened energy security concerns in many countries around the world. In March, the tragic earthquake and tsunami struck Japan. Our sympathies go out to the people of Japan who lost loved ones in this disaster. The earthquake—and its impact on the country’s nuclear reactors—roiled global financial markets. The cumulative effect of these events sparked a stock market sell-off before equities rebounded strongly in the final two weeks of the reporting period.
Markets Continue to Pick Up Steam
The stock market generally continued its upward momentum throughout the six-month period—with help from a strong fourth-quarter earnings season. Both U.S. growth-and value-oriented stocks reported significant gains across all capitalizations. In fact, the large-cap Russell 1000 Index and Standard & Poor’s 500 Index rose 18.13% and 17.31%, respectively, for the six-month period. Small- and mid-cap indices posted even higher returns as investors’ appetite for risk continued to strengthen.
However, continued uncertainty about the sovereign debt situation in some European countries as well as a drag from emerging markets tempered returns abroad, with the MSCI EAFE Index of international stocks returning 10.33% for the six-month period. Also, corporate bonds edged down slightly for the period, with the Barclays Capital U.S. Credit Index returning -0.98%. Money market returns remained flat, reflecting the Fed’s efforts to keep its target interest rate low.
Board Diversity and Company Competitiveness
At Calvert, we believe that companies with high standards of corporate governance, including diverse boards, are better positioned to compete in the global marketplace and to potentially outperform their peers. As a result, we continue to use our role as sustainable and responsible investors to encourage companies to clearly define diversity as inclusive of gender, ethnic, and racial backgrounds and to publicly commit to increasing diversity—on their boards and throughout their organizations.
We celebrated the first anniversary of the publication of the Women’s Empowerment Principles (WEP) and the 100th anniversary of International Women’s Day in March with a two-day event sponsored by the United Nations Women and the United Nations Global Compact. The WEP were established through collaboration between the United
www.calvert.com CALVERT CAPITAL ACCUMULATION FUND SEMI-ANNUAL REPORT (UNAUDITED) 4
Nations Women and the United Nations Global Compact in March 2010. Calvert continues to be an integral player in furthering the adoption of the WEP across the globe. In fact, more than 140 CEOs worldwide have signed a statement of support for the WEP, in part due to Calvert’s efforts.
Also, our October 2010 diversity report “Examining the Cracks in the Ceiling” has been making news by being cited in more than 40 articles from outlets such as The Washington Post, Forbes, and The New York Times. While we are pleased to see such strong media interest in this topic, we’re even more pleased that the report has led to Calvert having conversations with more than a dozen companies about their diversity scores and actions they can take to improve their overall diversity performance.
Opportunities and Challenges Ahead
Overall, we are encouraged by the market’s ability to move ahead despite the recent troubles in the Middle East and Japan, and we expect a slow, gradual economic recovery to continue throughout the remainder of the year. A low core inflation rate (which excludes food and energy prices) will likely facilitate economic growth, while continued debt reduction, lingering high unemployment, and a struggling housing market should limit gains. Energy prices will remain a challenge until we see more resolution of the issues in the Middle East and North Africa. Of course, more geopolitical crises, rising commodity prices, and inflation spikes could certainly dampen the markets.
In short, we are optimistic and believe the markets, the global economy, and your Calvert funds can successfully navigate through any temporary setbacks that may lie ahead.
Discuss Your Portfolio Allocations with Your Advisor
Given the market shifts we have experienced, your overall portfolio asset allocation and investment strategy may no longer match your needs. Therefore, we recommend reviewing these with your financial advisor to ensure that your target mix of U.S. and international stocks, bonds, and cash is well-diversified and appropriate given your financial goals, time horizon, and risk tolerance.
We encourage you to visit our website, www.calvert.com, for fund information and updates as well as market and economic commentary from Calvert professionals.
www.calvert.com CALVERT CAPITAL ACCUMULATION FUND SEMI-ANNUAL REPORT (UNAUDITED) 5
As noted elsewhere in this report, the Calvert operating companies that provide services to the funds will change their names effective April 30, 2011. As part of the changes, Calvert Group, Ltd. will be known as Calvert Investments, Inc., and the funds’ advisor, Calvert Asset Management Company, Inc., will be known as Calvert Investment Management, Inc. As always, we appreciate your investing with Calvert.

Barbara J. Krumsiek
President and CEO
Calvert Investments, Inc.
April 2011
www.calvert.com CALVERT CAPITAL ACCUMULATION FUND SEMI-ANNUAL REPORT (UNAUDITED) 6
Sri
Update
from the Calvert Sustainability Research Department
Responsible management of environmental, social, and governance (ESG) factors isn’t just “nice to do”—it’s essential to keeping our companies and our economy healthy and strong. Therefore, Calvert continues to work hard to ensure that you have a say in charting new paths to a more prosperous future.
Corporate & Board Diversity
The newly released version of the Calvert report, “Examining the Cracks in the Ceiling: A Survey of Corporate Diversity Practices of the S&P 100,” revealed that women are still significantly underrepresented on corporate boards (18%) and in C-level executive positions (8.4%)—despite comprising more than half the workforce.
Another disappointment was learning that 37% of the companies disclose no demographic data on employees—such as race, ethnicity and gender—which is necessary to evaluate a company’s progress. Only eight companies disclose full EEO-1 data, which is a full breakdown of the workforce by race and gender across employment categories.
As an investor, Calvert believes companies that combine competitive financial performance with fair and equitable working environments—where diversity is not only tolerated but embraced—are more likely to recognize gains in both the workplace and marketplace and be better positioned to generate long-term value for their shareholders.
Green Homebuilding
In October, Calvert released “A Green Recovery for America’s Homebuilders? A Survey of Sustainable Practices by the Homebuilding Industry.” This updated version of our 2008 report on America’s 10 largest publicly traded homebuilders shows they have started to improve their policies and practices related to the environment and resources, but much progress remains to be seen.
Out of 42 possible points, the average total sustainability score was just over six points, or 15%. All 10 homebuilders have made some effort to develop environmental policies or practices or offer environmental products. However, there is a big difference in the level of commitment to sustainability and the penetration of “green” homes in each company’s product mix.
In the homebuilder rankings, KB Home and Pulte remained in the top two spots, while Meritage Homes and Toll Brothers had the biggest improvements—each moving up five spots. DR Horton and Ryland Homes fell back four and three places, respectively.
Climate Change
Calvert has continued its corporate engagement and policy work in support of energy efficiency, alternative energy, and reductions in greenhouse gas emissions. We have also been ramping up our work on climate change adaptation. Leading scientists believe
www.calvert.com CALVERT CAPITAL ACCUMULATION FUND SEMI-ANNUAL REPORT (UNAUDITED) 7
that even if we stop producing greenhouse gasses tomorrow, a certain amount of climate change will still happen because of the carbon dioxide and other pollutants already in the atmosphere.
As a result, Calvert has been collaborating with Oxfam America to highlight the risks U.S. companies face from climate change as well as the opportunities for innovation and new business that corporate solutions could offer. In November 2010, we helped facilitate a high-level roundtable on Capitol Hill hosted by Oxfam for members of Congress, key congressional staff, and companies such as John Deere, Johnson Controls, and Starbucks to discuss these topics.
Calvert and Oxfam are now helping some of the attending companies form a business coalition to assist corporations and vulnerable communities in their adaptation to the effects of climate change. The new coalition would publish case studies and best practices as well as promote public policies related to climate change adaptation and resiliency.
On the shareholder advocacy front, Calvert has filed shareholder proposals with three companies asking them to clarify what they are doing to manage their risks related to climate change—two of these proposals have already been successfully withdrawn.
Overall Shareholder Advocacy Efforts
In all, Calvert has filed 35 resolutions to date in the 2011 proxy season and 22 have already been successfully withdrawn after the companies agreed to the terms of the resolution. In addition to the resolutions cited above, six focused on sustainability reporting, four on political contributions, and seven on climate principles.
Special Equities
A modest but important portion of certain funds is allocated to small private companies that are developing products or services that address important sustainability or environmental issues. For example, Calvert Equity Portfolio recently invested in the DBL Equity Fund-BAEF II, LP, which invests in private, mid- to late-stage growth companies—primarily in the clean tech, health care, information technology, and sustainability-oriented industries—ocated near low- and moderate-income communities in San Francisco and adjoining states. The Fund will assist its portfolio companies in creating and implementing their Second Bottom Line strategy in job creation, job quality, and environmental stewardship.
Calvert International Equity Fund invested in FINAE, S.A.P.I. de C.V. SOFOM ENR, a company that provides college loans to students from low- and middle-income families in Mexico. Students are selected by universities for their academic talent and financial need, and screened by FINAE for their repayment capacity.
www.calvert.com CALVERT CAPITAL ACCUMULATION FUND SEMI-ANNUAL REPORT (UNAUDITED) 8
As of March 31, 2011, DBL Equity Fund –BAEF II, LP represented 0.02% of Calvert Equity Portfolio; FINAE represented 0.26% of Calvert International Equity Fund. All holdings are subject to change without notice.
As of March 31, 2011, the following companies represent the following percentages of net assets: KB Home represented 0.20% of Calvert Small Cap Fund; Pulte represented 0.03% of Calvert Social Index Fund; Meritage Homes represented 0% of all Calvert equity funds; DR Horton represented 0.04% of Calvert Social Index Fund; Ryland represented 0% of all Calvert equity funds; John Deere represented 1.53% of Calvert Balanced Portfolio and 0.52% of Calvert Social Index Fund; Johnson Controls represented 0.36% of Calvert Social Index Fund; Starbucks represented 0.35% of Calvert Social Index Fund, 2.01% of Calvert Equity Portfolio, and 1.65% of Calvert Enhanced Equity Portfolio; General Cable represented 1.74% of Calvert Capital Accumulation Fund and 0.03% of Calvert Social Index Fund; and WABCO Holdings represented 2.73% of Calvert Capital Accumulation Fund and 0.05% of Calvert Social Index Fund. All holdings are subject to change without notice.
www.calvert.com CALVERT CAPITAL ACCUMULATION FUND SEMI-ANNUAL REPORT (UNAUDITED) 9
PORTFOLIO MANAGEMENT DISCUSSION

Michelle Clayman
Nathaniel Paull
of New Amsterdam
Partners LLC
In the six months ended March 31, 2011, Calvert Capital Accumulation Fund Class A shares (at NAV) returned a strong 29.28%, compared with 22.97% for the Russell Midcap Growth Index. The Fund’s outperformance was primarily due to strong stock selection.
CALVERT CAPITAL ACCUMULATION FUND
MARCH 31, 2011
INVESTMENT PERFORMANCE
(TOTAL RETURN AT NAV*)
| | 6 Months | | 12 Months | |
| | ended | | ended | |
| | 3/31/11 | | 3/31/11 | |
| Class A | 29.28 | % | 31.93 | % |
| Class B | 28.60 | % | 30.49 | % |
| Class C | 28.77 | % | 30.83 | % |
| Class I | 29.82 | % | 33.03 | % |
| Class Y** | 29.32 | % | 31.97 | % |
| Russell Midcap Growth | | | |
| Index | 22.97 | % | 26.60 | % |
| Lipper Mid-Cap Growth | | | |
| Funds Average | 23.63 | % | 27.47 | % |
| TEN LARGEST STOCK HOLDINGS | % OF NET ASSETS | |
| Unit Corp. | 3.1 | % |
| RPC, Inc. | 3.1 | % |
| Teradata Corp. | 3.1 | % |
| Wright Express Corp. | 3.1 | % |
| Syntel, Inc. | 3.0 | % |
| Affiliated Managers Group, Inc. | 2.9 | % |
| Gardner Denver, Inc. | 2.9 | % |
| WESCO International, Inc. | 2.8 | % |
| WABCO Holdings, Inc. | 2.7 | % |
| Deckers Outdoor Corp. | 2.7 | % |
| Total | 29.4 | % |
Investment Climate
Positive data about U.S. gross domestic
product (GDP) growth and corporate prof-
its, as well as the results of the November
U.S. mid-term elections, another round of
quantitative easing by the Federal Reserve
(Fed), and the extension of the Bush-era tax
cuts eased market uncertainty and powered a
strong rally in the fourth quarter of 2010.
The first quarter of 2011 saw the world
buffeted by unrest in North Africa and the
Middle East, two natural disasters in Japan,
and resulting issues with nuclear reactors in | ECONOMIC SECTORS | % of Total Investments | |
| Consumer Discretionary | 21.1 | % |
| Consumer Staples | 3.9 | % |
| Energy | 7.8 | % |
| Financials | 7.7 | % |
| Health Care | 11.2 | % |
| Industrials | 11.9 | % |
| Information Technology | 25.4 | % |
| Materials | 6.0 | % |
| Telecommunication Services | 3.0 | % |
| Utilities | 2.0 | % |
| Total | 100 | % |
| | | |
*Investment performance/return at NAV does not reflect the deduction of the Fund’s maximum 4.75% front-end sales charge or any deferred sales charge.
** See note on page 13 regarding Class Y shares.
www.calvert.com CALVERT CAPITAL ACCUMULATION FUND SEMI-ANNUAL REPORT (UNAUDITED) 10
Japan. Forecasts for U.S .and global GDP growth were increasing at the beginning of the year, then came down to our predicted growth rate of about 3%, before declining to 1.8% for the first quarter. U.S. markets dipped on news of the global turmoil, yet subsequently recovered as the impacts of the shocks were assessed. The large-cap laden Standard & Poor’s 500 Index returned 17.31% for the period, topped by the 21.53% return of the Russell Midcap Index and 25.48% gain of the Russell 2000 Index.
Portfolio Strategy
During the six-month period, we sold 10 stocks and bought 10 new positions. We also consolidated Calvert Mid Cap Value Fund into Capital Accumulation Fund upon its merger in November.
We added to our Energy holdings with the purchase of oil field services company RPC. Other new names include fluid management machinery company Graco and wire and cable products provider General Cable, in Industrials. Semiconductor equipment manufacturer Lam Research, internet communications company J2 Global Communications, and electronics wholesaler Arrow Electronics were three new names for Information Technology.
Seven stocks were sold after successfully reaching their price targets, including Flowserve (Industrials), Lennox International (Industrials), Del Monte (Consumer Staples), Hospira (Health Care), Hittite Microwave (Information Technology), Global Payments (Information Technology), and Syniverse Holdings (Telecommunications). In Health Care, Forest Labs was sold after Calvert determined the company no longer met the Fund’s environmental, social, and governance (ESG) criteria.
While our sector selection was slightly negative during the reporting period, our stock selection was strong. Our overweight position in Energy helped performance, but an overweight to Telecommunications detracted.
Stock selection was strong in most sectors, highlighted by Consumer Discretionary, Industrials, and Energy. Consumer Discretionary holding Deckers Outdoor (72.4%) and Industrials stocks WABCO Holdings (47.0%) and Wesco International (59.1%)1 benefited from recovering end markets brought on by the cyclical economic upswing. In the Energy sector, Unit rose 66.1% and RPC gained 43.3% in concert with rising energy commodity prices. Consumer Staples holding Del Monte was up 44.4% and Syniverse increased 34.2% in Telecommunications, both reaching new highs on the news that they would be acquired.
Our stock picking was weak in Materials, where Nalco edged up 8.6% but lagged as rising input costs led to disappointing earnings guidance. Information Technology holding Itron lost 5.8% on weak international revenues before it was sold. NII Holdings (1.4%) under-performed peers within the Telecommunications sector as investors wrestled with concerns about internal control issues in its Brazilian operations. Consumer Discretionary holding Hanes Brands (4.6%) lagged on rising input costs, notably for cotton.
The Fund is currently overweight relative to the benchmark in Telecommunications, Utilities, and Energy, and underweight in Consumer stocks, Industrials, and Materials.
www.calvert.com CALVERT CAPITAL ACCUMULATION FUND SEMI-ANNUAL REPORT (UNAUDITED) 11
GROWTH OF $10,000
The graph below shows the value of a hypothetical $10,000 investment in the fund over the past 10 fiscal year periods. The results shown are for Classes A and C shares and reflect the deduction of the maximum front-end Class A sales charge of 4.75%, or deferred sales charge, as applicable and assume the reinvestment of dividends. The result is compared with benchmarks that include a broad based market index and a Lipper peer group average. Market indexes are unmanaged and their results do not reflect the effect of expenses or sales charges. The Lipper average reflects the deduction of the category’s average front-end sales charge. The value of an investment in a different share class would be different.
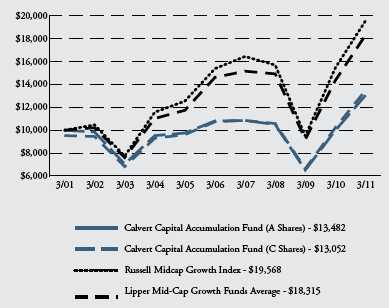
All performance data shown, including the graph above and the adjacent table, represents past performance, does not guarantee future results, assumes reinvestment of dividends and distributions and does not reflect the deduction of taxes that a shareholder would pay on the Fund’s/Portfolio’s distributions or the redemption of the Fund/Portfolio shares. The investment return and principal value of an investment will fluctuate so that an investor’s shares, when redeemed, may be worth more or less than their original cost. Current performance may be lower or higher than the performance data quoted; for current performance data visit www.calvert.com. The gross expense ratio from the current prospectus for Class A shares is 1.61%. This number may differ from the expense ratio shown elsewhere in this report because it is based on a different time period and, if applicable, does not include fee or expense waivers. Performance data quoted already reflects the deduction of the Fund’s/Portfolio’s operating expenses.
www.calvert.com CALVERT CAPITAL ACCUMULATION FUND SEMI-ANNUAL REPORT (UNAUDITED) 12
Market Outlook
We continue to see a decent year for both the U.S. economy and stock market; we expect GDP growth to be 3% and near-term inflation to stay below 2%. Economic activity is picking up. But despite high commodity prices, we do not yet see a pickup in overall inflation since there is still slack in the labor markets and industrial capacity is still plentiful. While initial jobless claims and the unemployment rate are dropping, they are still high and wage growth is relatively low.
High government budget deficits are a concern, but steps are being taken at federal, state, and local levels to address them. The housing market is still weak, with home prices seeing a double dip. Yet the housing sector, as it has shrunk, is having a lower overall effect on the economy. Global political and economic turmoil remains the greatest risk to global growth and markets, in our opinion. While oil prices have risen substantially, we do not believe they pose a major threat to current economic growth at their current levels unless production is curtailed from the world’s major oil producing countries. The end of the Federal Reserve’s quantitative easing program is another wild card on the domestic front that will depend on whether the economic recovery is able to sustain itself.
CALVERT CAPITAL ACCUMULATION FUND
MARCH 31, 2011
AVERAGE ANNUAL TOTAL RETURNS
| Class A shares | (with max. load) | |
| One year | 25.65 | % |
| Five year | 3.65 | % |
| Ten year | 3.03 | % |
| | |
| Class B shares | (with max. load) | |
| One year | 25.49 | % |
| Five year | 3.46 | % |
| Ten year | 2.56 | % |
| |
| Class C shares | (with max. load) | |
| One year | 29.83 | % |
| Five year | 3.84 | % |
| Ten year | 2.70 | % |
| | |
| Class I shares* | | |
| One year | 33.03 | % |
| Five year | 5.57 | % |
| Ten year | 2.98 | % |
| |
| Class Y shares** | | |
| One year | 31.97 | % |
| Five year | 4.67 | % |
| Ten year | 3.54 | % |
* Note Regarding Class I Shares Total Returns: There were times during the reporting period when there were no shareholders in Class I. For purposes of reporting Average Annual Total Return, Class A performance at NAV (i.e. does not reflect deduction of the Class A front-end sales charge) is used during these periods in which there were no shareholders in Class I. For purposes of this Average Annual Total Return, the Class A performance at NAV was used during the period January 18, 2002 through June 3, 2003.
** Calvert Capital Accumulation Fund first offered Class Y Shares on January 31, 2011. Performance prior to that date reflects the performance of Class A Shares at net asset value (NAV). Actual Class Y Share performance would have been different.
www.calvert.com CALVERT CAPITAL ACCUMULATION FUND SEMI-ANNUAL REPORT (UNAUDITED) 13
On a positive note, growth outside the U.S. is still healthy—producing a rising middle class that will continue to require a better standard of living and boost demand for U.S. goods and services. Corporate profits continue to be strong, with increases in revenues making up for rising input prices. Overall, we expect the U.S. stock market to post low double-digit gains for the full year of 2011.
April 2011
1 All returns shown for individual holdings reflect that part of the reporting period the holdings were held.
As of March 31, 2011, the following companies represented the following percentages of Fund net assets: RPC 3.10%, Graco 2.09%, General Cable 1.75%, Lam Research 2.50%, J2 Global Communications 2.35%, Arrow Electronics 2.51%, Flowserve 0%, Lennox International 0%, Del Monte 0%, Hospira 0%, Hittite Microwave 0%, Global Payments 0%, Syniverse Holdings 0%, Forest Labs 0%, Deckers Outdoor 2.72%, WABCO Holdings 2.73%, Wesco International 2.86%, Unit Corp 3.13%, Nalco 2.36%, Itron 0%, NII Holdings 1.86%, and Hanes Brands 1.75%. All holdings are subject to change without notice.
www.calvert.com CALVERT CAPITAL ACCUMULATION FUND SEMI-ANNUAL REPORT (UNAUDITED) 14
SHAREHOLDER EXPENSE EXAMPLE
As a shareholder of the Fund, you incur two types of costs: (1) transaction costs, including sales charges and redemption fees; and (2) ongoing costs, including management fees; distribution (12b-1) fees; and other Fund expenses. This Example is intended to help you understand your ongoing costs (in dollars) of investing in the Fund and to compare these costs with the ongoing costs of investing in other mutual funds.
This Example is based on an investment of $1,000 invested at the beginning of the period and held for the entire period (October 1, 2010 to March 31, 2011).
Actual Expenses
The first line of the table below provides information about actual account values and actual expenses. You may use the information in this line, together with the amount you invested, to estimate the expenses that you paid over the period. Simply divide your account value by $1,000 (for example, an $8,600 account value divided by $1,000 = 8.6), then multiply the result by the number in the first line under the heading entitled “Expenses Paid During Period” to estimate the expenses you paid on your account during this period.
Hypothetical Example for Comparison Purposes
The second line of the table below provides information about hypothetical account values and hypothetical expenses based on the Fund’s actual expense ratio and an assumed rate of return of 5% per year before expenses, which is not the Fund’s actual return. The hypothetical account values and expenses may not be used to estimate the actual ending account balance or expenses you paid for the period. You may use this information to compare the ongoing costs of investing in the Fund and other funds. To do so, compare the 5% hypothetical example with the 5% hypothetical examples that appear in the shareholder reports of the other funds.
Please note that the expenses shown in the table are meant to highlight your ongoing costs only and do not reflect any transactional costs, such as sales charges (loads) or redemption fees. Therefore, the second line of the table is useful in comparing ongoing costs only, and will not help you determine the relative total costs of owning different funds. In addition, if these transactional costs were included, your costs would have been higher.
www.calvert.com CALVERT CAPITAL ACCUMULATION FUND SEMI-ANNUAL REPORT (UNAUDITED) 15
| | | | | | |
| | | BEGINNING | | ENDING ACCOUNT | | EXPENSES PAID |
| | | ACCOUNT VALUE | | VALUE | | DURING PERIOD* |
| | | 10/1/10 | | 3/31/11 | | 10/1/10 - 3/31/11 |
| cLass A | | | | | | |
| Actual | $ | 1,000.00 | $ | 1,293.30 | $ | 9.21 |
| Hypothetical | $ | 1,000.00 | $ | 1,016.90 | $ | 8.10 |
| (5% return per year before expenses) |
|
| |
| cLass B | | | | | | |
| Actual | $ | 1,000.00 | $ | 1,286.00 | $ | 15.57 |
| Hypothetical | $ | 1,000.00 | $ | 1,011.31 | $ | 13.70 |
| (5% return per year before expenses) |
|
| |
| cLass c | | | | | | |
| Actual | $ | 1,000.00 | $ | 1,287.70 | $ | 14.18 |
| Hypothetical | $ | 1,000.00 | $ | 1,012.54 | $ | 12.47 |
| (5% return per year before expenses) |
|
| |
| cLass I | | | | | | |
| Actual | $ | 1,000.00 | $ | 1,298.20 | $ | 4.93 |
| Hypothetical | $ | 1,000.00 | $ | 1,020.64 | $ | 4.33 |
| (5% return per year before expenses) |
|
* Expenses are equal to the Fund’s annualized expense ratio of 1.61%, 2.73%, 2.49% and 0.86% for Class A, Class B, Class C, and Class I respectively, multiplied by the average account value over the period, multiplied by 182/365 (to reflect the one-half year period).
| | | BEGINNING | | | ENDING ACCOUNT | | EXPENSES PAID |
| | | ACCOUNT VALUE | | | VALUE | | DURING PERIOD*** |
| | | 1/31/11 | ** | | 3/31/11 | | 1/31/11 - 3/31/11 |
| cLass Y | | | | | | | |
| Actual | $ | 1,000.00 | | $ | 1,082.20 | $ | 2.46 |
| Hypothetical | $ | 1,000.00 | | $ | 1,005.85 | $ | 2.37 |
| ** | Inception date 1/31/11. |
| *** | Expenses are equal to the Fund’s annualized expense ratio of 1.44% for Class Y, multiplied by the average account value over the period, multiplied by 60/365 (to reflect the period from inception through 3/31/11). |
www.calvert.com CALVERT CAPITAL ACCUMULATION FUND SEMI-ANNUAL REPORT (UNAUDITED) 16
| | | |
| STATEMENT OF NET ASSETS |
| MARCH 31, 2011 |
| |
| |
| EQUITY SECURITIES - 97.5% | SHARES | | VALUE |
| |
| Auto Components - 2.6% | | | |
| TRW Automotive Holdings Corp.* | 93,500 | $ | 5,149,980 |
| |
| Capital Markets - 2.9% | | | |
| Affiliated Managers Group, Inc.* | 50,900 | | 5,566,933 |
| |
| Chemicals - 3.4% | | | |
| Ecolab, Inc. | 41,700 | | 2,127,534 |
| Nalco Holding Co. | 167,600 | | 4,577,156 |
| | | | 6,704,690 |
| |
| Communications Equipment - 2.0% | | | |
| Harris Corp | 78,300 | | 3,883,680 |
| |
| Diversified Financial Services - 2.1% | | | |
| IntercontinentalExchange, Inc.* | 32,600 | | 4,027,404 |
| |
| Electrical Equipment - 1.7% | | | |
| General Cable Corp.* | 78,100 | | 3,381,730 |
| |
| Electronic Equipment & Instruments - 4.7% | | | |
| Amphenol Corp. | 79,100 | | 4,302,249 |
| Arrow Electronics, Inc.* | 116,300 | | 4,870,644 |
| | | | 9,172,893 |
| |
| Energy Equipment & Services - 7.6% | | | |
| FMC Technologies, Inc.* | 28,500 | | 2,692,680 |
| RPC, Inc. | 238,100 | | 6,028,692 |
| Unit Corp.* | 98,100 | | 6,077,295 |
| | | | 14,798,667 |
| |
| Food Products - 1.5% | | | |
| Corn Products International, Inc. | 56,300 | | 2,917,466 |
| |
| Gas Utilities - 2.0% | | | |
| Energen Corp | 61,250 | | 3,866,100 |
www.calvert.com CALVERT CAPITAL ACCUMULATION FUND SEMI-ANNUAL REPORT (UNAUDITED) 17
| | | |
| EQUITY SECURITIES - CONT’D | SHARES | | VALUE |
| |
| Health Care Providers & Services - 6.6% | | | |
| AmerisourceBergen Corp. | 87,100 | $ | 3,445,676 |
| Chemed Corp. | 27,500 | | 1,831,775 |
| HealthSpring, Inc.* | 120,300 | | 4,495,611 |
| Lincare Holdings, Inc. | 100,575 | | 2,983,055 |
| | | | 12,756,117 |
| |
| Household Products - 2.3% | | | |
| Church & Dwight Co., Inc. | 56,700 | | 4,498,578 |
| |
| Insurance - 1.9% | | | |
| Torchmark Corp | 54,900 | | 3,649,752 |
| |
| Internet Software & Services - 2.3% | | | |
| j2 Global Communications, Inc.* | 154,600 | | 4,562,246 |
| |
| IT Services - 9.2% | | | |
| Syntel, Inc. | 111,800 | | 5,839,314 |
| Teradata Corp.* | 118,600 | | 6,013,020 |
| Wright Express Corp.* | 115,200 | | 5,971,968 |
| | | | 17,824,302 |
| |
| Leisure Equipment & Products - 1.9% | | | |
| Polaris Industries, Inc | 41,650 | | 3,624,383 |
| |
| Life Sciences - Tools & Services - 4.4% | | | |
| Mettler-Toledo International, Inc.* | 23,495 | | 4,041,140 |
| Waters Corp.* | 52,050 | | 4,523,145 |
| | | | 8,564,285 |
| |
| Machinery - 9.8% | | | |
| Gardner Denver, Inc | 71,300 | | 5,563,539 |
| Graco, Inc. | 89,300 | | 4,062,257 |
| The Toro Co. | 61,900 | | 4,099,018 |
| WABCO Holdings, Inc.* | 86,050 | | 5,304,122 |
| | | | 19,028,936 |
| |
| Media - 1.7% | | | |
| Gannett Co., Inc | 219,150 | | 3,337,655 |
| |
| Metals & Mining - 2.5% | | | |
| Reliance Steel & Aluminum Co | 83,200 | | 4,807,296 |
| |
| Multiline Retail - 2.2% | | | |
| Nordstrom, Inc. | 94,500 | | 4,241,160 |
www.calvert.com CALVERT CAPITAL ACCUMULATION FUND SEMI-ANNUAL REPORT (UNAUDITED) 18
| | | | |
| EQUITY SECURITIES - CONT’D | | SHARES | | VALUE |
| |
| Pharmaceuticals - 2.1% | | | | |
| Endo Pharmaceuticals Holdings, Inc.* | | 109,200 | $ | 4,167,072 |
| |
| Semiconductors & Semiconductor Equipment - 4.7% | | | | |
| Lam Research Corp.* | | 85,500 | | 4,844,430 |
| National Semiconductor Corp. | | 296,225 | | 4,247,866 |
| | | | | 9,092,296 |
| |
| Specialty Retail - 5.1% | | | | |
| Advance Auto Parts, Inc | | 73,200 | | 4,803,384 |
| Ross Stores, Inc | | 71,300 | | 5,070,856 |
| | | | | 9,874,240 |
| |
| Textiles, Apparel & Luxury Goods - 4.5% | | | | |
| Deckers Outdoor Corp.* | | 61,300 | | 5,280,995 |
| Hanesbrands, Inc.* | | 125,375 | | 3,390,140 |
| | | | | 8,671,135 |
| |
| Trading Companies & Distributors - 2.8% | | | | |
| WESCO International, Inc.* | | 88,975 | | 5,560,937 |
| |
| Wireless Telecommunication Services - 3.0% | | | | |
| MetroPCS Communications, Inc.* | | 133,200 | | 2,163,168 |
| NII Holdings, Inc.* | | 86,500 | | 3,604,455 |
| | | | | 5,767,623 |
| |
| Total Equity Securities (Cost $142,632,130) | | | | 189,497,556 |
| |
| |
| | | PRINCIPAL | | |
| HIGH SOCIAL IMPACT INVESTMENTS - 0.7% | | AMOUNT | | |
| Calvert Social Investment Foundation Notes, | | | | |
| 1.17%, 7/1/11 (b)(i)(r) | $ | 1,419,488 | | 1,408,047 |
| |
| Total High Social Impact Investments (Cost $1,419,488) | | | | 1,408,047 |
| | |
| TOTAL INVESTMENTS (Cost $144,051,618) - 98.2% | | 190,905,603 |
| Other assets and liabilities, net - 1.8% | | 3,467,708 |
| net assets - 100% | $ | 194,373,311 |
www.calvert.com CALVERT CAPITAL ACCUMULATION FUND SEMI-ANNUAL REPORT (UNAUDITED) 19
| | | | | |
| NET ASSETS CONSIST OF: | | | | |
| Paid-in capital applicable to the following shares of common stock, | | | |
| with 250,000,000 shares of $0.01 par value shares authorized: | | | |
| Class A: 4,748,989 shares outstanding | | $ | 111,181,442 | |
| Class B: 171,405 shares outstanding | | | 5,539,473 | |
| Class C: 569,422 shares outstanding | | | 12,150,738 | |
| Class I: 597,714 shares outstanding | | | 15,319,303 | |
| Class Y: 33.568 shares outstanding | | | 1,000 | |
| Undistributed net investment income (loss) | | | (748,806 | ) |
| Accumulated net realized gain (loss) on investments | | | 4,076,176 | |
| Net unrealized appreciation (depreciation) on investments | | | 46,853,985 | |
| |
| NET ASSETS | | $ | 194,373,311 | |
| |
| |
| NET ASSET VALUE PER SHARE | | | | |
| Class A (based on net assets of $153,081,729) | | $ | 32.23 | |
| Class B (based on net assets of $4,856,212) | | $ | 28.33 | |
| Class C (based on net assets of $15,803,651) | | $ | 27.75 | |
| Class I (based on net assets of $20,630,637) | | $ | 34.52 | |
| Class Y (based on net assets of $1,082.14) | | $ | 32.24 | |
| |
| |
| |
| RESTRICTED SECURITIES | ACQUISITION DATES | | COST | |
| Calvert Social Investment Foundation Notes, 1.17%, 7/1/11 | 7/1/08 | $ | 1,419,488 | |
| (b) | This security was valued by the Board of Directors. See Note A. |
| (i) | Restricted securities represent 0.7% of the net assets of the Fund. |
| (r) | The coupon rate shown on floating or adjustable rate securities represents the rate at period end. |
| * | Non-income producing security. |
See notes to financial statements.
www.calvert.com CALVERT CAPITAL ACCUMULATION FUND SEMI-ANNUAL REPORT (UNAUDITED) 20
| | | |
| STATEMENT OF OPERATIONS |
| SIX MONTHS ENDED MARCH 31, 2011 |
| |
| |
| NET INVESTMENT INCOME | | | |
| Investment Income: | | | |
| Dividend income | $ | 527,584 | |
| Interest income | | 9,341 | |
| Total investment income | | 536,925 | |
| |
| Expenses: | | | |
| Investment advisory fee | | 507,962 | |
| Transfer agency fees and expenses | | 208,540 | |
| Administrative fees | | 184,160 | |
| Distribution Plan expenses: | | | |
| Class A | | 169,515 | |
| Class B | | 22,656 | |
| Class C | | 65,258 | |
| Directors’ fees and expenses | | 8,124 | |
| Custodian fees | | 19,382 | |
| Registration fees | | 37,891 | |
| Reports to shareholders | | 51,467 | |
| Professional fees | | 14,942 | |
| Miscellaneous | | 13,200 | |
| Total expenses | | 1,303,097 | |
| Reimbursement from Advisor: | | | |
| Class I | | (12,277 | ) |
| Class Y | | (4,638 | ) |
| Fees paid indirectly | | (451 | ) |
| Net expenses | | 1,285,731 | |
| |
| |
| NET INVESTMENT INCOME (LOSS) | | (748,806 | ) |
| |
| REALIZED AND UNREALIZED GAIN (LOSS) ON INVESTMENTS | | | |
| Net realized gain (loss) | | 10,079,728 | |
| Change in unrealized appreciation (depreciation) | | 29,371,978 | |
| |
| NET REALIZED AND UNREALIZED GAIN | | | |
| (LOSS) ON INVESTMENTS | | 39,451,706 | |
| |
| INCREASE (DECREASE) IN NET ASSETS | | | |
| RESULTING FROM OPERATIONS | $ | 38,702,900 | |
See notes to financial statements.
www.calvert.com CALVERT CAPITAL ACCUMULATION FUND SEMI-ANNUAL REPORT (UNAUDITED) 21
STATEMENTS OF CHANGES IN NET ASSETS
| | | | | | |
| | | SIX MONTHS ENDED | | | YEAR ENDED | |
| | | MARCH
31, | | | SEPTEMBER 30, | |
| INCREASE (DECREASE) IN NET ASSETS | | 2011 | | | 2010 | |
| Operations: | | | | | | |
| Net investment income (loss) | ($ | 748,806 | ) | ($ | 1,137,067 | ) |
| Net realized gain (loss) | | 10,079,728 | | | 13,500,374 | |
| Change in net unrealized appreciation (depreciation) | | 29,371,978 | | | 5,739,164 | |
| |
| |
| INCREASE (DECREASE) IN NET ASSETS | | | | | | |
| RESULTING FROM OPERATIONS | | 38,702,900 | | | 18,102,471 | |
| |
| |
| Capital share transactions: | | | | | | |
| Shares sold: | | | | | | |
| Class A shares | | 17,865,250 | | | 14,410,519 | |
| Class B shares | | 173,281 | | | 305,711 | |
| Class C shares | | 1,399,140 | | | 808,515 | |
| Class I shares | | 2,374,305 | | | 3,104,135 | |
| Class Y shares | | 1,000 | | | — | |
| Shares issued from merger (See Note F): | | | | | | |
| Class A shares | | 32,646,286 | | | — | |
| Class C shares | | 2,759,872 | | | — | |
| Class I shares | | 8,070,394 | | | — | |
| Redemption fees: | | | | | | |
| Class A shares | | 1,792 | | | 351 | |
| Class B shares | | — | | | 198 | |
| Class C shares | | — | | | 5 | |
| Shares redeemed: | | | | | | |
| Class A shares | | (14,783,443 | ) | | (14,759,050 | ) |
| Class B shares | | (582,879 | ) | | (1,786,946 | ) |
| Class C shares | | (1,002,635 | ) | | (1,203,164 | ) |
| Class I shares | | (611,808 | ) | | (828,967 | ) |
| Total capital share transactions | | 48,310,555 | | | 51,307 | |
| |
| |
| TOTAL INCREASE (DECREASE) IN NET ASSETS | | 87,013,455 | | | 18,153,778 | |
| |
| |
| NET ASSETS | | | | | | |
| Beginning of period | | 107,359,856 | | | 89,206,078 | |
| End of period (including net investment loss | | | | | | |
| of $748,806 and $0, respectively) | $ | 194,373,311 | | $ | 107,359,856 | |
See notes to financial statements.
www.calvert.com CALVERT CAPITAL ACCUMULATION FUND SEMI-ANNUAL REPORT (UNAUDITED) 22
STATEMENTS OF CHANGES IN NET ASSETS
| | | | |
| | SIX MONTHS ENDED | | YEAR ENDED | |
| | MARCH 31, | | SEPTEMBER 30, | |
| CAPITAL SHARE ACTIVITY | 2011 | | 2010 | |
| Shares sold: | | | | |
| Class A shares | 605,400 | | 623,033 | |
| Class B shares | 6,615 | | 14,768 | |
| Class C shares | 55,225 | | 39,504 | |
| Class I shares | 75,012 | | 126,782 | |
| Class Y shares | 34 | | — | |
| Shares issued from merger (See Note F): | | | | |
| Class A shares | 1,182,147 | | — | |
| Class C shares | 115,716 | | — | |
| Class I shares | 273,543 | | — | |
| Shares redeemed: | | | | |
| Class A shares | (514,255 | ) | (638,692 | ) |
| Class B shares | (23,036 | ) | (86,086 | ) |
| Class C shares | (39,931 | ) | (60,274 | ) |
| Class I shares | (19,310 | ) | (33,638 | ) |
| Total capital share activity | 1,717,160 | | (14,603 | ) |
See notes to financial statements.
www.calvert.com CALVERT CAPITAL ACCUMULATION FUND SEMI-ANNUAL REPORT (UNAUDITED) 23
NOTES TO FINANCIAL STATEMENTS
NOTE A — SIGNIFICANT ACCOUNTING POLICIES
General: The Calvert Capital Accumulation Fund (the “Fund”), a series of Calvert World Values Fund, Inc., is registered under the Investment Company Act of 1940 as a non-diversified, open-end management investment company. The operation of each series is accounted for separately. The Fund offers five classes of shares of capital stock. Class A shares are sold with a maximum front-end sales charge of 4.75%. Class B shares are sold without a front-end sales charge. With certain exceptions, the Fund will impose a deferred sales charge at the time of redemption, depending on how long investors have owned the shares. Effective March 1, 2010, Class B shares are no longer offered for purchase, except through reinvestment of dividends and/or distributions and through certain exchanges. Class C shares are sold without a front-end sales charge. With certain exceptions, the Fund will impose a deferred sales charge on shares sold within one year of purchase. Class B and Class C shares have higher levels of expenses than Class A shares. Class I shares require a minimum account balance of $1,000,000. The $1 million minimum initial investment may be waived for certain institutional accounts, where it is believed to be in the best interest of the Fund and its shareholders. Class I shares have no front-end or deferred sales charge and have lower levels of expenses than Class A Shares. Effective January 31, 2011, the Fund began to offer Class Y shares. Class Y shares are generally only available to wrap or similar fee-based programs offered by financial intermediaries that have entered into an agreement with the Fund’s Distributor to offer Class Y shares. Class Y shares have no front-end or deferred sales charge. Each class has different: (a) dividend rates, due to differences in Distribution Plan expenses and other class-specific expenses, (b) exchange privileges; and (c) class-specific voting rights.
Security Valuation: Net asset value per share is determined every business day as of the close of the regular session of the New York Stock Exchange (generally 4:00 p.m. Eastern time). The Fund uses independent pricing services approved by the Board of Directors to value its investments wherever possible. Investments for which market quotations are not available or deemed not reliable are fair valued in good faith under the direction of the Board of Directors. In determining fair value, the Board considers all relevant qualitative and quantitative information available. These factors are subject to change over time and are reviewed periodically. The values assigned to fair value investments are based on available information and do not necessarily represent amounts that might ultimately be realized. Further, because of the inherent uncertainty of valuation, those estimated values may differ significantly from the values that would have been used had a ready market for the investments existed, and the differences could be material.
At March 31, 2011, securities valued at $1,408,047 or 0.7% of net assets were fair valued in good faith under the direction of the Board of Directors.
The Fund utilizes various methods to measure the fair value of its investments. Generally Accepted Accounting Principles (GAAP) establishes a disclosure hierarchy that categorizes the inputs to valuation techniques used to value assets and liabilities at measurement date. These inputs are summarized in the three broad levels listed below: Level 1 – quoted prices in active markets for identical securities Level 2 – other significant observable inputs (including quoted prices for similar securi-
www.calvert.com CALVERT CAPITAL ACCUMULATION FUND SEMI-ANNUAL REPORT (UNAUDITED) 24
ties, interest rates, prepayment speeds, credit risk, etc.)
Level 3 – significant unobservable inputs (including the Fund’s own assumptions in determining the fair value of investments) The inputs or methodology used for valuing securities are not necessarily an indication of the risk associated with investing in those securities.
Changes in valuation techniques may result in transfers in or out of an investment’s assigned level within the hierarchy during the period. Valuation techniques used to value the Fund’s investments by major category are as follows.
Equity securities, including restricted securities, for which market quotations are readily available, are valued at the last reported sale price or official closing price as reported by an independent pricing service on the primary market or exchange on which they are traded and are categorized as Level 1 in the hierarchy. Foreign securities are valued based on quotations from the principle market in which such securities are normally traded. If events occur after the close of the principle market in which foreign securities are traded, and before the close of business of the Fund, that are expected to materially affect the value of those securities, then they are valued at their fair value taking these events into account. For restricted securities and private placements where observable inputs are limited, assumptions about market activity and risk are used and are categorized as Level 3 in the hierarchy.
Debt securities, including restricted securities, are valued based on evaluated prices received from independent pricing services or from dealers who make markets in such securities and are generally categorized as Level 2 in the hierarchy. Short-term securities with remaining maturities of sixty days or less for which quotations are not readily available are valued at amortized cost, which approximates fair value, and are categorized as Level 2 in the hierarchy.
When independent prices are unavailable or unreliable, debt securities may be valued utilizing pricing matrices which consider similar factors that would be used by independent pricing services. These are generally categorized as Level 2 in the hierarchy but may be Level 3 depending on the circumstances.
The following is a summary of the inputs used to value the Fund’s net assets as of March 31, 2011:
| | | | | | | | |
| | | VALUATION INPUTS |
| |
| InvestMents In securItIes | | LeveL 1 | LeveL 2 | | LeveL 3 | | | Total |
| Equity securities* | $ | 189,497,556 | — | | — | | $ | 189,497,556 |
| Other debt obligations | | — | — | $ | 1,408,047 | | | 1,408,047 |
| TOTAL | $ | 189,497,556 | — | $ | 1,408,047 | ** | $ | 190,905,603 |
* For further breakdown of equity securities by industry type, please refer to the Statement of Net Assets.
**Level 3 securities represent 0.7% of net assets.
Repurchase Agreements: The Fund may enter into repurchase agreements with recognized financial institutions or registered broker/dealers and, in all instances, holds underlying securities with a value exceeding the total repurchase price, including accrued interest. Although risk is mitigated by the collateral, the Fund could experience a delay in recovering its value and a possible loss of income or value if the
www.calvert.com CALVERT CAPITAL ACCUMULATION FUND SEMI-ANNUAL REPORT (UNAUDITED) 25
counterparty fails to perform in accordance with the terms of the agreement.
Restricted Securities: The Fund may invest in securities that are subject to legal or contractual restrictions on resale. Generally, these securities may only be sold publicly upon registration under the Securities Act of 1933 or in transactions exempt from such registration. Information regarding restricted securities is included at the end of the Fund’s Statement of Net Assets.
Security Transactions and Net Investment Income: Security transactions are accounted for on trade date. Realized gains and losses are recorded on an identified cost basis and may include proceeds from litigation. Dividend income is recorded on the ex-dividend date. Distributions received on securities that represent a return of capital or capital gain are recorded as a reduction of cost investments and/or as a realized gain. Interest income, which includes amortization of premium and accretion of discount on debt securities, is accrued as earned. Investment income and realized and unrealized gains and losses are allocated to separate classes of shares based upon the relative net assets of each class. Expenses arising in connection with a class are charged directly to that class. Expenses common to the classes are allocated to each class in proportion to their relative net assets.
Distributions to Shareholders: Distributions to shareholders are recorded by the Fund on ex-dividend date. Dividends from net investment income and distributions from net realized capital gains, if any, are paid at least annually. Distributions are determined in accordance with income tax regulations which may differ from generally accepted accounting principles; accordingly, periodic reclassifications are made within the Fund’s capital accounts to reflect income and gains available for distribution under income tax regulations.
Estimates: The preparation of financial statements in conformity with accounting principles generally accepted in the United States requires management to make estimates and assumptions that affect the reported amounts of assets and liabilities and disclosure of contingent assets and liabilities at the date of the financial statements and the reported amounts of income and expenses during the reporting period. Actual results could differ from those estimates.
Redemption Fees: The Fund charges a 2% redemption fee on redemptions, including exchanges, made within 30 days of purchase in the same Fund (within seven days for Class I shares). The redemption fee is payable to the Class of the Fund from which the redemption is made, and is accounted for as an addition to paid-in capital. The fee is intended to discourage market-timers by ensuring that short-term trading costs are borne by the investors making the transactions and not the shareholders already in the Fund.
Expense Offset Arrangements: The Fund has an arrangement with its custodian bank whereby the custodian’s fees may be paid indirectly by credits earned on the Fund’s cash on deposit with the bank. These credits are used to reduce the Fund’s expenses. Such a deposit arrangement may be an alternative to overnight investments.
Federal Income Taxes: No provision for federal income or excise tax is required since the Fund intends to qualify as a regulated investment company under the Internal Revenue Code and to distribute substantially all of its taxable earnings.
www.calvert.com CALVERT CAPITAL ACCUMULATION FUND SEMI-ANNUAL REPORT (UNAUDITED) 26
Management has analyzed the Fund’s tax positions taken for all open federal income tax years and has concluded that no provision for federal income tax is required in the Fund’s financial statements. A Fund’s federal tax return is subject to examination by the Internal Revenue Service for a period of three years.
NOTE B — RELATED PARTY TRANSACTIONS
Calvert Asset Management Company, Inc. (the “Advisor”) is wholly-owned by Calvert Group, Ltd. (“Calvert”), which is indirectly wholly owned by UNIFI Mutual Holding Company. The Advisor provides investment advisory services and pays the salaries and fees of officers and Directors of the Fund who are employees of the Advisor or its affiliates. For its services, the Advisor receives an annual fee, payable monthly, of .65% of the Fund’s average daily net assets. Under the terms of the agreement, $102,880 was payable at period end. In addition, $53,608 was payable at period end for operating expenses paid by the Advisor during March 31, 2011.
The Advisor has contractually agreed to limit net annual fund operating expenses through January 31, 2013. The contractual expense cap is 1.59% for Class A (effective November 29, 2010), 2.59% for Class C (effective November 29, 2010), .86% for Class I, and 1.44% for Class Y. For the purposes of this expense limit, operating expenses do not include interest expense, brokerage commissions, taxes, and extraordinary expenses. To the extent that any expense offset credits are earned, the Advisor’s obligation under the contractual limitation may be reduced and the Advisor may benefit from the expense offset arrangement.
Calvert Administrative Services Company, an affiliate of the Advisor, provides administrative services to the Fund for an annual fee, payable monthly of .25% for Class A, Class B, Class C, and Class Y, and .10% for Class I shares based on their average daily net assets. Under the terms of the agreement, $37,030 was payable at period end.
Calvert Distributors, Inc., an affiliate of the Advisor, is the distributor and principal underwriter for the Fund. Distribution Plans, adopted by Class A, Class B, and Class C shares, allow the Fund to pay the Distributor for expenses and services associated with distribution of shares. The expenses paid may not exceed .35%, 1.00% and 1.00% annually of average daily net assets of Class A, Class B, and Class C, respectively. The amount actually paid by the Fund is an annualized fee, payable monthly of .25% (.35% prior to November 29, 2010), 1.00% and 1.00% of the Fund’s average daily net assets of Class A, Class B, and Class C, respectively. Class I and Class Y shares do not have Distribution Plan expenses. Under the terms of the agreement, $47,986 was payable at period end.
The Distributor received $29,606 as its portion of the commissions charged on sales of the Fund’s Class A shares for the six months ended March 31, 2011.
Calvert Shareholder Services, Inc. (“CSSI”), an affiliate of the Advisor, acts as shareholder servicing agent for the Fund. For its services, CSSI received a fee of $50,821 for the six months ended March 31, 2011. Under the terms of the agreement, $9,518 was payable at period end. Boston Financial Data Services, Inc. is the transfer and dividend disburs-
www.calvert.com CALVERT CAPITAL ACCUMULATION FUND SEMI-ANNUAL REPORT (UNAUDITED) 27
ing agent.
The Fund may invest in Community Investment Notes issued by the Calvert Social Investment Foundation (the “CSI Foundation”). The CSI Foundation is a 501(c)(3) non-profit organization that receives in-kind support from the Calvert Group, Ltd. and its subsidiaries. The Fund has received from the Securities and Exchange Commission an exemptive order permitting the Fund to make investments in these notes under certain conditions.
Each Director of the Fund who is not an employee of the Advisor or its affiliates receives an annual retainer of $44,000 plus a meeting fee of $2,000 for each Board meeting attended. Additional fees of up to $5,000 annually may be paid to the Board chairs and Committee chairs ($10,000 for Special Equities Committee chair) and $2,500 annually may be paid to Committee members, plus a Committee meeting fee of $500 for each Committee meeting attended. Director’s fees are allocated to each of the funds served.
NOTE C — INVESTMENT ACTIVITY
During the period, the cost of purchases and proceeds from sales of investments, other than short-term securities, were $69,642,069, and $64,785,748, respectively.
CAPITAL LOSS CARRYFORWARDS
EXPIRATION DATE
30-Sep-17 ($5,740,332)
Capital losses may be utilized to offset future capital gains until expiration. Under the recently enacted Regulated Investment Company Modernization Act of 2010, the Funds will be permitted to carry forward capital losses incurred in taxable years beginning after December 22, 2010 for an unlimited period. Losses incurred during those future years will be required to be utilized prior to the losses incurred in pre-enactment taxable years. As a result of this ordering rule, pre-enactment capital loss carryforwards may more likely expire unused. Also, post-enactment capital losses that are carried forward will retain their character as either short-term or long-term capital losses rather than being considered all short-term as under previous law.
As of March 31, 2011, the tax basis components of unrealized appreciation/(depreciation) and the federal tax cost were as follows:
| Unrealized appreciation | $ | 46,542,090 | |
| Unrealized (depreciation) | | (14,363 | ) |
| Net unrealized appreciation/(depreciation) | $ | 46,527,727 | |
| Federal income tax cost of investments | $ | 144,377,876 | |
www.calvert.com CALVERT CAPITAL ACCUMULATION FUND SEMI-ANNUAL REPORT (UNAUDITED) 28
NOTE D — LINE OF CREDIT
A financing agreement is in place with all Calvert Group Funds and State Street Corporation (“SSC”). Under the agreement, SSC provides an unsecured line of credit facility, in the aggregate amount of $50 million ($25 million committed and $25 million uncommitted), accessible by the Funds for temporary or emergency purposes only. Borrowings under the committed facility bear interest at the higher of the London Interbank Offered Rate, (LIBOR) or the overnight Federal Funds Rate plus 1.25% per annum. A commitment fee of .125% per annum is incurred on the unused portion of the committed facility, which is allocated to all participating funds. The Fund had no loans outstanding pursuant to this line of credit at March 31, 2011. For the six months ended March 31, 2011, borrowings by the Fund under the agreement were as follows:
| | WEIGHTED | | MONTH OF |
| AVERAGE | AVERAGE | MAXIMUM | MAXIMUM |
| DAILY | INTEREST | AMOUNT | AMOUNT |
| BALANCE | RATE | BORROWED | BORROWED |
| $12,358 | 1.51% | $1,846,142 | October 2010 |
NOTE E - SUBSEQUENT EVENTSIn preparing the financial statements as of March 31, 2011, no subsequent events or transactions occurred that would have materially impacted the financial statements as presented.
Effective April 30, 2011, the Calvert operating companies will be renamed as follows: Calvert Group, Ltd. will be renamed Calvert Investments, Inc., Calvert Asset Management Company, Inc. will be renamed Calvert Investment Management, Inc., Calvert Distributors, Inc. will be renamed Calvert Investment Distributors, Inc., Calvert Administrative Services Company will be renamed Calvert Investment Administrative Services, Inc., and Calvert Shareholder Services, Inc. will be renamed Calvert Investment Services, Inc.
NOTE F – REORGANIZATION
On July 29, 2010, the Board of Directors approved an Agreement and Plan of Reorganization (the “Plan”) which provides for the transfer of all the assets of the Calvert Mid Cap Value Fund (“Mid Cap Value”) for shares of the acquiring portfolio, Calvert Capital Accumulation Fund (“Capital Accumulation”) and the assumption of the liabilities of Mid Cap Value. Shareholders approved the Plan at a meeting on November 15, 2010 and the reorganization took place on November 29, 2010.
www.calvert.com CALVERT CAPITAL ACCUMULATION FUND SEMI-ANNUAL REPORT (UNAUDITED) 29
The acquisition was accomplished by a tax-free exchange of the following shares:
| | | ACQUIRING | | | |
| MERGED PORTFOLIO | SHARES | PORTFOLIO | SHARES | | VALUE |
| Mid Cap Value, Class A | 1,893,904 | Capital Accum., Class A | 1,182,147 | $ | 32,646,286 |
| Mid Cap Value, Class C | 168,591 | Capital Accum., Class C | 115,716 | $ | 2,759,872 |
| Mid Cap Value, Class I | 453,854 | Capital Accum., Class I | 273,543 | $ | 8,070,394 |
For financial reporting purposes, assets received and shares issued by Capital Accumulation were recorded at fair value; however, the cost basis of the investments received from Mid Cap Value were carried forward to align ongoing reporting of Capital Accumulation’s realized and unrealized gains and losses with amounts distributable to shareholders for tax purposes.
The net assets and net unrealized appreciation (depreciation) immediately before the acquisitions were as follows:
| | | | | UNREALIZED | | | |
| | | | | APPRECIATION | ACQUIRING | | |
| MERGED PORTFOLIO | | NET ASSETS | | (DEPRECIATION) | PORTFOLIO | | NET ASSETS |
| Mid Cap Value | $ | 43,476,552 | $ | 4,028,812 | Capital Accum. | $ | 117,367,809 |
Assuming the acquisition had been completed on October 1, 2010, Capital Accumulation’s results of operations for the six months ended March 31, 2011 would have been as follows:
| | |
| Net investment income | ($756,726) | (a) |
| Net realized and change in unrealized gain (loss) on investments | $42,590,032 | (b) |
| Net increase (decrease) in assets from operations | $41,833,306 | |
Because Capital Accumulation and Mid Cap Value sold and redeemed shares throughout the period, it is not practicable to provide pro-forma information on a per-share basis.
Because the combined investment portfolios have been managed as a single integrated portfolio since the acquisition was completed, it is also not practicable to separate the amounts of revenue and earnings of Mid Cap Value that have been included in Capital Accumulation’s Statement of Operations since November 29, 2010.
| (a) | ($748,806) as reported, plus ($7,920), from Mid Cap Value pre-merger. |
| (b) | $39,451,706 as reported, plus $3,138,326 from Mid Cap Value pre-merger. |
www.calvert.com CALVERT CAPITAL ACCUMULATION FUND SEMI-ANNUAL REPORT (UNAUDITED) 30
| | | | | | | | | |
| FINANCIAL HIGHLIGHTS |
| |
| | | | | | Periods ended | | | | |
| | | MARCH
31, | | | SEPTEMBER 30, | | | SEPTEMBER 30, | |
| cLass A shares | | 2011 | | | 2010 | | | 2009 | |
| Net asset value, beginning | $ | 24.93 | | $ | 20.71 | | $ | 23.00 | |
| Income from investment operations: | | | | | | | | | |
| Net investment income (loss) | | (.12 | ) | | (.25 | ) | | (.17 | ) |
| Net realized and unrealized gain (loss) | | 7.42 | | | 4.47 | | | (2.12 | ) |
| Total from investment operations | | 7.30 | | | 4.22 | | | (2.29 | ) |
| Total increase (decrease) in net asset value | | 7.30 | | | 4.22 | | | (2.29 | ) |
| Net asset value, ending | $ | 32.23 | | $ | 24.93 | | $ | 20.71 | |
| |
| Total return* | | 29.28 | % | | 20.38 | % | | (9.96 | %) |
| Ratios to average net assets: A | | | | | | | | | |
| Net investment income (loss) | | (.93 | %) (a) | | (1.08 | %) | | (.92 | %) |
| Total expenses | | 1.61 | % (a) | | 1.76 | % | | 1.88 | % |
| Expenses before offsets | | 1.61 | % (a) | | 1.76 | % | | 1.88 | % |
| Net expenses | | 1.61 | % (a) | | 1.76 | % | | 1.88 | % |
| Portfolio turnover | | 42 | % | | 87 | % | | 72 | % |
| Net assets, ending (in thousands) | $ | 153,082 | | $ | 86,635 | | $ | 72,289 | |
| |
| |
| | | | | | Years ended | | | | |
| | | SEPTEMBER 30, | | | SEPTEMBER 30, | | | SEPTEMBER 30, | |
| cLass a shares | | 2008 | | | 2007 | (z) | | 2006 | |
| Net asset value, beginning | $ | 28.11 | | $ | 24.02 | | $ | 23.42 | |
| Income from investment operations: | | | | | | | | | |
| Net investment income (loss) | | (.21 | ) | | (.26 | ) | | (.27 | ) |
| Net realized and unrealized gain | | (4.49 | ) | | 4.35 | | | .87 | |
| Total from investment operations | | (4.70 | ) | | 4.09 | | | .60 | |
| Distributions from: | | | | | | | | | |
| Net realized gain | | (.41 | ) | | — | | | — | |
| Total distributions | | (.41 | ) | | — | | | — | |
| Total increase (decrease) in net asset value | | (5.11 | ) | | 4.09 | | | .60 | |
| Net asset value, ending | $ | 23.00 | | $ | 28.11 | | $ | 24.02 | |
| |
| Total return* | | (16.97 | %) | | 17.03 | % | | 2.56 | % |
| Ratios to average net assets: A | | | | | | | | | |
| Net investment income (loss) | | (.79 | %) | | (.98 | %) | | (1.05 | %) |
| Total expenses | | 1.66 | % | | 1.66 | % | | 1.71 | % |
| Expenses before offsets | | 1.66 | % | | 1.66 | % | | 1.71 | % |
| Net expenses | | 1.65 | % | | 1.64 | % | | 1.69 | % |
| Portfolio turnover | | 49 | % | | 47 | % | | 31 | % |
| Net assets, ending (in thousands) | $ | 85,195 | | $ | 107,976 | | $ | 103,499 | |
See notes to financial highlights.
www.calvert.com CALVERT CAPITAL ACCUMULATION FUND SEMI-ANNUAL REPORT (UNAUDITED) 31
| | | | | | | | | |
| FINANCIAL HIGHLIGHTS |
| |
| | | | | | Periods ended | | | | |
| | | MARCH
31, | | | SEPTEMBER 30, | | | SEPTEMBER 30, | |
| cLass B shares | | 2011 | | | 2010 | | | 2009 | |
| Net asset value, beginning | $ | 22.03 | | $ | 18.50 | | $ | 20.78 | |
| Income from investment operations: | | | | | | | | | |
| Net investment income (loss) | | (.27 | ) | | (.53 | ) | | (.39 | ) |
| Net realized and unrealized gain (loss) | | 6.57 | | | 4.06 | | | (1.89 | ) |
| Total from investment operations | | 6.30 | | | 3.53 | | | (2.28 | ) |
| Total increase (decrease) in net asset value | | 6.30 | | | 3.53 | | | (2.28 | ) |
| Net asset value, ending | $ | 28.33 | | $ | 22.03 | | $ | 18.50 | |
| |
| Total return* | | 28.60 | % | | 19.08 | % | | (10.97 | %) |
| Ratios to average net assets: A | | | | | | | | | |
| Net investment income (loss) | | (2.06 | %) (a) | | (2.17 | %) | | (2.04 | %) |
| Total expenses | | 2.73 | % (a) | | 2.84 | % | | 2.99 | % |
| Expenses before offsets | | 2.73 | % (a) | | 2.84 | % | | 2.99 | % |
| Net expenses | | 2.73 | % (a) | | 2.84 | % | | 2.99 | % |
| Portfolio turnover | | 42 | % | | 87 | % | | 72 | % |
| Net assets, ending (in thousands) | $ | 4,856 | | $ | 4,138 | | $ | 4,793 | |
| |
| |
| | | | | | Years ended | | | | |
| | | SEPTEMBER
30, | | | SEPTEMBER 30, | | | SEPTEMBER 30, | |
| cLass B shares | | 2008 | | | 2007 | (z) | | 2006 | |
| Net asset value, beginning | $ | 25.66 | | $ | 22.13 | | $ | 21.76 | |
| Income from investment operations: | | | | | | | | | |
| Net investment income (loss) | | (.47 | ) | | (.45 | ) | | (.49 | ) |
| Net realized and unrealized gain (loss) | | (4.00 | ) | | 3.98 | | | .86 | |
| Total from investment operations | | (4.47 | ) | | 3.53 | | | .37 | |
| Distributions from: | | | | | | | | | |
| Net realized gain | | (.41 | ) | | — | | | — | |
| Total distributions | | (.41 | ) | | — | | | — | |
| Total increase (decrease) in net asset value | | 4.88 | | | 3.53 | | | .37 | |
| Net asset value, ending | $ | 20.78 | | $ | 25.66 | | $ | 22.13 | |
| |
| Total return* | | (17.70 | %) | | 15.95 | % | | 1.70 | % |
| Ratios to average net assets: A | | | | | | | | | |
| Net investment income (loss) | | (1.73 | %) | | (1.86 | %) | | (1.91 | %) |
| Total expenses | | 2.57 | % | | 2.54 | % | | 2.57 | % |
| Expenses before offsets | | 2.57 | % | | 2.54 | % | | 2.57 | % |
| Net expenses | | 2.56 | % | | 2.52 | % | | 2.55 | % |
| Portfolio turnover | | 49 | % | | 47 | % | | 31 | % |
| Net assets, ending (in thousands) | $ | 7,803 | | $ | 11,613 | | $ | 13,752 | |
See notes to financial highlights.
www.calvert.com CALVERT CAPITAL ACCUMULATION FUND SEMI-ANNUAL REPORT (UNAUDITED) 32
| | | | | | | | | |
| FINANCIAL HIGHLIGHTS |
| |
| | | | | | PerIods ended | | | | |
| | | MARCH
31, | | | SEPTEMBER 30, | | | SEPTEMBER 30, | |
| cLass c shares | | 2011 | | | 2010 | | | 2009 | |
| Net asset value, beginning | $ | 21.55 | | $ | 18.05 | | $ | 20.20 | |
| Income from investment operations: | | | | | | | | | |
| Net investment income (loss) | | (.21 | ) | | (.39 | ) | | (.28 | ) |
| Net realized and unrealized gain (loss) | | 6.41 | | | 3.89 | | | (1.87 | ) |
| Total from investment operations | | 6.20 | | | 3.50 | | | (2.15 | ) |
| Total increase (decrease) in net asset value | | 6.20 | | | 3.50 | | | (2.15 | ) |
| Net asset value, ending | $ | 27.75 | | $ | 21.55 | | $ | 18.05 | |
| |
| Total return* | | 28.77 | % | | 19.39 | % | | (10.64 | %) |
| Ratios to average net assets: A | | | | | | | | | |
| Net investment income (loss) | | (1.80 | %) (a) | | (1.87 | %) | | (1.75 | %) |
| Total expenses | | 2.49 | % (a) | | 2.54 | % | | 2.71 | % |
| Expenses before offsets | | 2.49 | % (a) | | 2.54 | % | | 2.71 | % |
| Net expenses | | 2.49 | % (a) | | 2.54 | % | | 2.70 | % |
| Portfolio turnover | | 42 | % | | 87 | % | | 72 | % |
| Net assets, ending (in thousands) | $ | 15,804 | | $ | 9,449 | | $ | 8,287 | |
| |
| |
| | | | | | Years ended | | | | |
| | | SEPTEMBER 30, | | | SEPTEMBER 30, | | | SEPTEMBER 30, | |
| cLass c shares | | 2008 | | | 2007 | (z) | | 2006 | |
| Net asset value, beginning | $ | 24.93 | | $ | 21.47 | | $ | 21.10 | |
| Income from investment operations: | | | | | | | | | |
| Net investment income (loss) | | (.38 | ) | | (.41 | ) | | (.42 | ) |
| Net realized and unrealized gain (loss) | | (3.94 | ) | | 3.87 | | | .79 | |
| Total from investment operations | | (4.32 | ) | | 3.46 | | | .37 | |
| Distributions from: | | | | | | | | | |
| Net realized gain | | (.41 | ) | | — | | | — | |
| Total distributions | | (.41 | ) | | — | | | — | |
| Total increase (decrease) in net asset value | | (4.73 | ) | | 3.46 | | | .37 | |
| Net asset value, ending | $ | 20.20 | | $ | 24.93 | | $ | 21.47 | |
| |
| Total return* | | (17.62 | %) | | 16.12 | % | | 1.75 | % |
| Ratios to average net assets: A | | | | | | | | | |
| Net investment income (loss) | | (.157 | %) | | (1.74 | %) | | (1.84 | %) |
| Total expenses | | 2.42 | % | | 2.42 | % | | 2.49 | % |
| Expenses before offsets | | 2.42 | % | | 2.42 | % | | 2.49 | % |
| Net expenses | | 2.42 | % | | 2.41 | % | | 2.47 | % |
| Portfolio turnover | | 49 | % | | 47 | % | | 31 | % |
| Net assets, ending (in thousands) | $ | 10,252 | | $ | 13,275 | | $ | 12,831 | |
See notes to financial highlights.
www.calvert.com CALVERT CAPITAL ACCUMULATION FUND SEMI-ANNUAL REPORT (UNAUDITED) 33
| | | | | | | | | |
| FINANCIAL HIGHLIGHTS |
| |
| | | | | | Periods ended | | | | |
| | | MARCH
31, | | | SEPTEMBER 30, | | | SEPTEMBER 30, | |
| cLass I shares | | 2011 | | | 2010 | | | 2009 | |
| Net asset value, beginning | $ | 26.59 | | $ | 21.89 | | $ | 24.06 | |
| Income from investment operations: | | | | | | | | | |
| Net investment income (loss) | | (.02 | ) | | (.04 | ) | | .02 | |
| Net realized and unrealized gain (loss) | | 7.95 | | | 4.74 | | | (2.19 | ) |
| Total from investment operations | | 7.93 | | | 4.70 | | | (2.17 | ) |
| Total increase (decrease) in net asset value | | 7.93 | | | 4.70 | | | (2.17 | ) |
| Net asset value, ending | $ | 34.52 | | $ | 26.59 | | $ | 21.89 | |
| |
| Total return* | | 29.82 | % | | 21.47 | % | | (9.02 | %) |
| Ratios to average net assets: A | | | | | | | | | |
| Net investment income (loss) | | (.16 | %) (a) | | (.19 | %) | | .10 | % |
| Total expenses | | 1.02 | % (a) | | 1.12 | % | | 1.28 | % |
| Expenses before offsets | | .86 | % (a) | | .86 | % | | .86 | % |
| Net expenses | | .86 | % (a) | | .86 | % | | .86 | % |
| Portfolio turnover | | 42 | % | | 87 | % | | 72 | % |
| Net assets, ending (in thousands) | $ | 20,631 | | $ | 7,138 | | $ | 3,837 | |
| |
| |
| | | | | | Years ended | | | | |
| | | SEPTEMBER 30, | | | SEPTEMBER 30, | | | SEPTEMBER 30, | |
| cLass I shares | | 2008 | | | 2007 | (z) | | 2006 | |
| Net asset value, beginning | $ | 29.16 | | $ | 24.73 | | $ | 23.89 | |
| Income from investment operations: | | | | | | | | | |
| Net investment income (loss) | | ** | | | (.05 | ) | | (.02 | ) |
| Net realized and unrealized gain (loss) | | (4.96 | ) | | 4.48 | | | .86 | |
| Total from investment operations | | (4.96 | ) | | 4.43 | | | .84 | |
| Distributions from: | | | | | | | | | |
| Net realized gain | | (.41 | ) | | — | | | — | |
| Total distributions | | (.41 | ) | | — | | | — | |
| Total increase (decrease) in net asset value | | (5.10 | ) | | 4.43 | | | .84 | |
| Net asset value, ending | $ | 24.06 | | $ | 29.16 | | $ | 24.73 | |
| |
| Total return* | | (16.31 | %) | | 17.91 | % | | 3.52 | % |
| Ratios to average net assets: A | | | | | | | | | |
| Net investment income (loss) | | .01 | % | | (.19 | %) | | (.20 | %) |
| Total expenses | | 1.18 | % | | 1.14 | % | | 1.90 | % |
| Expenses before offsets | | .87 | % | | .87 | % | | .88 | % |
| Net expenses | | .86 | % | | .86 | % | | .86 | % |
| Portfolio turnover | | 49 | % | | 47 | % | | 31 | % |
| Net assets, ending (in thousands) | $ | 3,573 | | $ | 4,311 | | $ | 3,273 | |
See notes to financial highlights.
www.calvert.com CALVERT CAPITAL ACCUMULATION FUND SEMI-ANNUAL REPORT (UNAUDITED) 34
| | | |
| FINANCIAL HIGHLIGHTS |
| |
| | | PERIOD ENDED | |
| | | MARCH31, | |
| cLass Y shares | | 2011 | # |
| Net asset value, beginning | $ | 29.79 | |
| Income from investment operations: | | | |
| Net investment income (loss) | | (.04 | ) |
| Net realized and unrealized gain (loss) | | 2.49 | |
| Total from investment operations | | 2.45 | |
| Total increase (decrease) in net asset value | | 2.45 | |
| Net asset value, ending | $ | 32.24 | |
| |
| Total return* | | 8.22 | % |
| Ratios to average net assets: A | | | |
| Net investment income (loss) | | (.74 | %) (a) |
| Total expenses | | 2749.99 | % (a) |
| Expenses before offsets | | 1.44 | % (a) |
| Net expenses | | 1.44 | % (a) |
| Portfolio turnover | | 8 | % |
| Net assets, ending (in thousands) | $ | 1 | |
| A | Total expenses do not reflect amounts reimbursed and/or waived by the Advisor or reductions from expense offset arrangements. Expenses before offsets reflect expenses after reimbursement and/or waiver by the Advisor but prior to reductions from expense offset arrangements. Net expenses are net of all reductions and represent the net expenses paid by the Fund. |
| (a) | Annualized. |
| (z) | Per share figures are calculated using the Average Shares Method. |
| * | Total return is not annualized for periods less than one year and does not reflect deduction of any front-end or deferred sales charge. |
| ** | Less than $0.01 per share. |
| # | From January 31, 2011, inception. |
See notes to financial statements.
www.calvert.com CALVERT CAPITAL ACCUMULATION FUND SEMI-ANNUAL REPORT (UNAUDITED) 35
EXPLANATION OF FINANCIAL TABLES
SCHEDULE OF INVESTMENTS
The Schedule of Investments is a snapshot of all securities held in the fund at their market value, on the last day of the reporting period. Securities are listed by asset type (e.g., common stock, corporate bonds, U.S. government obligations) and may be further broken down into sub-groups and by industry classification.
STATEMENT OF ASSETS AND LIABILITIES
The Statement of Assets and Liabilities is often referred to as the fund’s balance sheet. It lists the value of what the fund owns, is due and owes on the last day of the reporting period. The fund’s assets include the market value of securities owned, cash, receivables for securities sold and shareholder subscriptions, and receivables for dividends and interest payments that have been earned, but not yet received. The fund’s liabilities include payables for securities purchased and shareholder redemptions, and expenses owed but not yet paid. The statement also reports the fund’s net asset value (NAV) per share on the last day of the reporting period. The NAV is calculated by dividing the fund’s net assets (assets minus liabilities) by the number of shares outstanding. This statement is accompanied by a Schedule of Investments. Alternatively, if certain conditions are met, a Statement of Net Assets may be presented in lieu of this statement and the Schedule of Investments.
STATEMENT OF NET ASSETS
The Statement of Net Assets provides a detailed list of the fund’s holdings, including each security’s market value on the last day of the reporting period. The Statement of Net Assets includes a Schedule of Investments. Other assets are added and other liabilities subtracted from the investments total to calculate the fund’s net assets. Finally, net assets are divided by the outstanding shares of the fund to arrive at its share price, or Net Asset Value (NAV) per share.
At the end of the Statement of Net Assets is a table displaying the composition of the fund’s net assets. Paid in Capital is the money invested by shareholders and represents the bulk of net assets. Undistributed Net Investment Income and Accumulated Net Realized Gains usually approximate the amounts the fund had available to distribute to shareholders as of the statement date. Accumulated Realized Losses will appear as negative balances. Unrealized Appreciation (Depreciation) is the difference between the market value of the fund’s investments and their cost, and reflects the gains (losses) that would be realized if the fund were to sell all of its investments at their statement-date values.
www.calvert.com CALVERT CAPITAL ACCUMULATION FUND SEMI-ANNUAL REPORT (UNAUDITED) 36
STATEMENT OF OPERATIONS
The Statement of Operations summarizes the fund’s investment income earned and expenses incurred in operating the fund. Investment income includes dividends earned from stocks and interest earned from interest-bearing securities in the fund. Expenses incurred in operating the fund include the advisory fee paid to the investment advisor, administrative services fee, distribution plan expenses (if applicable), transfer agent fees, shareholder servicing expenses, custodial, legal, and audit fees, and the printing and postage expenses related to shareholder reports. Expense offsets (fees paid indirectly) are also shown. Credits earned from offset arrangements are used to reduce the fund’s expenses. This statement also shows net gains (losses) realized on the sale of investments and the increase or decrease in the unrealized appreciation (depreciation) on investments held during the period.
STATEMENT OF CHANGES IN NET ASSETS
The Statement of Changes in Net Assets shows how the fund’s total net assets changed during the two most recent reporting periods. Changes in the fund’s net assets are attributable to investment operations, distributions and capital share transactions.
The Operations section of the report summarizes information detailed in the Statement of Operations. The Distribution section shows the dividend and capital gain distributions made to shareholders. The amounts shown as distributions in this section may not match the net investment income and realized gains amounts shown in the Operations section because distributions are determined on a tax basis and certain investments or transactions may be treated differently for financial statement and tax purposes. The Capital Share Transactions section shows the amount shareholders invested in the fund, either by purchasing shares or by reinvesting distributions, and the amounts redeemed. The corresponding numbers of shares issued, reinvested and redeemed are shown at the end of the report.
FINANCIAL HIGHLIGHTS
The Financial Highlights table provides a per-share breakdown per class of the components that affect the fund’s net asset value for current and past reporting periods. The table provides total return, total distributions, expense ratios, portfolio turnover and net assets for the applicable period. Total return is a measure of a fund’s performance that encompasses all elements of return: dividends, capital gain distributions and changes in net asset value. Total return is the change in value of an investment over a given period, assuming reinvestment of any dividends and capital gain distributions, expressed as a percentage of the initial investment. Total distributions include distributions from net investment income and net realized gains. Long-term gains are earned on securities held in the fund more than one year. Short-term gains, on the sale of securities held less than one year, are treated as ordinary dividend income for tax purposes. The expense ratio is a fund’s cost of doing business, expressed as a percentage of net assets. These expenses directly reduce returns to shareholders. Portfolio turnover measures the trading activity in a fund’s investment portfolio – how often securities are bought and sold by a fund. Portfolio turnover is affected by market conditions, changes in the size of the fund, the nature of the fund’s investments and the investment style of the portfolio.
www.calvert.com CALVERT CAPITAL ACCUMULATION FUND SEMI-ANNUAL REPORT (UNAUDITED) 37
PROXY VOTING
The Proxy Voting Guidelines of the Calvert Funds that the Fund uses to determine how to vote proxies relating to portfolio securities are provided as an Appendix to the Fund’s Statement of Additional Information. The Statement of Additional Information can be obtained free of charge by calling the Fund at 1-800-368-2745, by visiting the Calvert website at www.calvert.com; or by visiting the SEC’s website at www.sec.gov.
Information regarding how the Fund voted proxies relating to portfolio securities during the most recent 12-month period ended June 30 is available on the Fund’s website at www.calvert.com and on the SEC’s website at www.sec.gov.
AVAILABILITY OF QUARTERLY PORTFOLIO HOLDINGS
The Fund files its complete schedule of portfolio holdings with the SEC for the first and third quarters of each fiscal year on Form N-Q. The Fund’s Form N-Q is available on the SEC’s website at www.sec.gov. The Fund’s Form N-Q may be reviewed and copied at the SEC’s Public Reference Room in Washington, DC; information on the operation of the Public Reference Room may be obtained by calling 1-800-SEC-0330.
BASIS FOR BOARD’S APPROVAL OF INVESTMENT ADVISORY AND INVESTMENT SUBADVISORY CONTRACTS
At a meeting held on December 7, 2010, the Board of Directors, and by a separate vote, the disinterested Directors, approved the continuance of the Investment Advisory Agreement between Calvert World Values Fund, Inc. and the Advisor and the Investment Subadvisory Agreement between the Advisor and the Subadvisor with respect to the Fund.
In evaluating the Investment Advisory Agreement, the Board considered a variety of information relating to the Fund and the Advisor. The disinterested Directors reviewed a report prepared by the Advisor regarding various services provided to the Fund by the Advisor and its affiliates. Such report included, among other data, information regarding the Advisor’s personnel and the Advisor’s revenue and cost of providing services to the Fund, and a separate report prepared by an independent third party, which provided a statistical analysis comparing the Fund’s investment performance, expenses, and fees to comparable mutual funds.
The disinterested Directors were separately represented by independent legal counsel with respect to their consideration of the reapproval of the Investment Advisory Agreement and the Investment Subadvisory Agreement. Prior to voting, the disinterested Directors reviewed the proposed continuance of the Investment Advisory Agreement and Investment Subadvisory Agreement with management and also met in private sessions with their counsel at which no representatives of management were present.
www.calvert.com CALVERT CAPITAL ACCUMULATION FUND SEMI-ANNUAL REPORT (UNAUDITED) 38
In the course of its deliberations regarding the Investment Advisory Agreement, the Board considered the following factors, among others: the nature, extent and quality of the services provided by the Advisor, including the personnel providing such services; the Advisor’s financial condition; the level and method of computing the Fund’s advisory fee; comparative performance, fee and expense information for the Fund; the profitability of the Calvert Group of Funds to the Advisor and its affiliates; the allocation of the Fund’s brokerage, including the Advisor’s process for monitoring “best execution”; the direct and indirect benefits, if any, derived by the Advisor and its affiliates from their relationship with the Fund; the effect of the Fund’s growth and size on the Fund’s performance and expenses; the affiliated distributor’s process for monitoring sales load breakpoints; the Advisor’s compliance programs and policies; the Advisor’s performance of substantially similar duties for other funds; and any possible conflicts of interest.
In considering the nature, extent and quality of the services provided by the Advisor under the Investment Advisory Agreement, the Board reviewed information provided by the Advisor relating to its operations and personnel, including, among other information, biographical information on the Advisor’s supervisory and professional staff and descriptions of its organizational and management structure. The Board also took into account similar information provided periodically throughout the previous year by the Advisor as well as the Board’s familiarity with the Advisor’s senior management through Board of Directors’ meetings, discussions and other reports. The Advisor’s administrative capabilities, including its ability to supervise the other service providers for the Fund, were also considered. The Board also took into account the environmental, social, sustainability and governance research and analysis provided by the Advisor to the Fund. The Board discussed the Advisor’s effectiveness in monitoring the performance of the Subadvisor and its timeliness in responding to performance issues. The Board concluded that it was satisfied with the nature, extent and quality of services provided to the Fund by the Advisor under the Investment Advisory Agreement.
In considering the Fund’s performance, the Board noted that it reviewed on a quarterly basis detailed information about the Fund’s performance results, portfolio composition and investment strategies. In addition, the Board took into account overall financial market conditions. The Board also reviewed various comparative data provided to it in connection with its consideration of the renewal of the Investment Advisory Agreement, including, among other information, a comparison of the Fund’s total return with its Lipper index and with that of other mutual funds deemed to be in its peer group by an independent third party in its report. This comparison indicated that the Fund performed above the median of its peer group for the one- and three-year periods ended June 30, 2010 and below the median of its peer group for the five-year period ended June 30, 2010. The data also indicated that the Fund outperformed its Lipper index for the one-and three-year periods ended June 30, 2010, and underperformed its Lipper index for the five-year period ended June 30, 2010. Based upon its review, the Board concluded that the Fund’s performance was satisfactory.
In considering the Fund’s fees and expenses, the Board compared the Fund’s fees and total expense ratio with various comparative data for the funds in its peer group. Among other findings, the data indicated that the Fund’s advisory fee was at the median of its peer group and that total expenses were above the median of its peer group. The Board
www.calvert.com CALVERT CAPITAL ACCUMULATION FUND SEMI-ANNUAL REPORT (UNAUDITED) 39
noted that the allocation of advisory and administrative fees may vary among the Fund’s peer group. The Board also took into account the Advisor’s current undertaking to add expense limitations for the Fund’s Class A, Class C and Class Y shares and reduce the Fund’s Rule 12b-1 fees. The Board noted the Advisor’s discussion of the Fund’s expenses and certain factors that affected the level of such expenses, including the cost of providing the environmental, social, sustainability and governance research and analysis provided by the Advisor. Based upon its review, the Board determined that the advisory fee was reasonable in view of the quality of services provided by the Advisor and the other factors considered.
The Board reviewed the Advisor’s profitability on a fund-by-fund basis. In reviewing the overall profitability of the advisory fee to the Fund’s Advisor, the Board also considered the fact that affiliates of the Advisor provided shareholder servicing and administrative services to the Fund for which they received compensation. The information considered by the Board included Calvert’s operating profit margin information both before and after tax expenses with respect to the services that the Advisor and its affiliates provided to the Calvert Group of Funds complex. The Board reviewed the profitability of the Advisor’s relationship with the Fund in terms of the total amount of annual advisory fees it received with respect to the Fund and whether the Advisor had the financial wherewithal to continue to provide a high level of services to the Fund. The Board noted that the Advisor had reimbursed expenses of the Fund for some classes. The Board also took into account the Advisor’s current undertaking to add expense limitations for the Fund’s Class A, Class C and Class Y shares and reduce the Fund’s Rule 12b-1 fees. The Board also considered that the Advisor derived benefits to its reputation and other indirect benefits from its relationship with the Fund. The Board also noted that the Advisor paid the subadvisory fee to the Subadvisor. Based upon its review, the Board concluded that the Advisor’s and its affiliates’ level of profitability from their relationship with the Fund was reasonable.
The Board considered the effect of the Fund’s current size and potential growth on its performance and fees. The Board concluded that adding breakpoints to the advisory fee at specified asset levels would not be appropriate at this time given the Fund’s current size. The Board noted that if the Fund’s assets increased over time, the Fund might realize other economies of scale if assets increased proportionally more than certain other expenses.
In reapproving the Investment Advisory Agreement, the Board, including the disinterested Directors, did not identify any single factor as controlling, and each Director may have attributed different weight to various factors.
In evaluating the Investment Subadvisory Agreement, the disinterested Directors reviewed information provided by the Subadvisor relating to its operations, personnel, investment philosophy, strategies and techniques. Among other information, the Subadvisor provided biographical information on portfolio management and other professional staff, performance information for itself, and descriptions of its investment philosophies, strategies and techniques, organizational and management structures and brokerage policies and practices.
www.calvert.com CALVERT CAPITAL ACCUMULATION FUND SEMI-ANNUAL REPORT (UNAUDITED) 40
The Board reapproved the Investment Subadvisory Agreement between the Subadvisor and the Advisor based on a number of factors relating to the Subadvisor’s ability to perform under the Investment Subadvisory Agreement. In the course of its deliberations, the Board evaluated, among other factors: the nature, extent and the quality of the services to be provided by the Subadvisor; the Subadvisor’s management style and long-term performance record; the Fund’s performance record and the Subadvisor’s performance in employing its investment strategies; the Subadvisor’s current level of staffing and its overall resources; the qualifications and experience of the Subadvisor’s personnel; the Subadvisor’s financial condition with respect to its ability to perform the services required under the Investment Subadvisory Agreement; the Subadvisor’s compliance systems, including those related to personal investing; and any disciplinary history. Based upon its review, the Board concluded that it was satisfied with the nature, extent and quality of services provided to the Fund by the Subadvisor under the Investment Subadvisory Agreement.
As noted above, the Board considered, among other information, the Fund’s performance during the one-, three- and five-year periods ended June 30, 2010 as compared to the Fund’s peer group and noted that it reviewed on a quarterly basis detailed information about the Fund’s performance results, portfolio composition and investment strategies. The Board noted the Advisor’s expertise and resources in monitoring the performance, investment style and risk-adjusted performance of the Subadvisor.
In considering the cost of services to be provided by the Subadvisor and the profitability to the Subadvisor of its relationship with the Fund, the Board noted that the subadvisory fee under the Investment Subadvisory Agreement was paid by the Advisor out of the advisory fee that the Advisor received under the Investment Advisory Agreement. The Board also relied on the ability of the Advisor to negotiate the Investment Subadvisory Agreement and the corresponding subadvisory fee at arm’s length. In addition, the Board took into account the fees the Subadvisor charged to its other clients and considered these fee comparisons in light of the differences in managing these other accounts. Based upon its review, the Board determined that the subadvisory fee was reasonable. Because the Advisor pays the Subadvisor’s subadvisory fee and the subadvisory fee was negotiated at arm’s length by the Advisor, the cost of services to be provided by the Subadvisor and the profitability to the Subadvisor of its relationship with the Fund were not material factors in the Board’s deliberations. For similar reasons, the Board did not consider the potential economies of scale in the Subadvisor’s management of the Fund to be a material factor in its consideration.
In reapproving the Investment Subadvisory Agreement, the Board, including the disinterested Directors, did not identify any single factor as controlling, and each Director may have attributed different weight to various factors.
www.calvert.com CALVERT CAPITAL ACCUMULATION FUND SEMI-ANNUAL REPORT (UNAUDITED) 41
CONCLUSIONS
The Board reached the following conclusions regarding the Investment Advisory Agreement and the Investment Subadvisory Agreement, among others: (a) the Advisor has demonstrated that it possesses the capability and resources to perform the duties required of it under the Investment Advisory Agreement; (b) the Subadvisor is qualified to manage the Fund’s assets in accordance with the Fund’s investment objectives and policies; (c) the Advisor and Subadvisor maintain appropriate compliance programs; (d) the Subadvisor is likely to execute its investment strategies consistently over time; (e) the Fund’s performance is satisfactory relative to the performance of funds with similar investment objectives and to relevant indices; and (f) the Fund’s advisory and subadvisory fees are reasonable relative to those of similar funds and to the services to be provided by the Advisor and the Subadvisor. Based on its conclusions, the Board determined that reapproval of the Investment Advisory Agreement and the Investment Subadvisory Agreement would be in the best interests of the Fund and its shareholders.
www.calvert.com CALVERT CAPITAL ACCUMULATION FUND SEMI-ANNUAL REPORT (UNAUDITED) 42
To Open an Account
800-368-2748
Yields and Prices
Calvert Information Network
(24 hours, 7 days a week)
800-368-2745
Service for Existing Account
Shareholders: 800-368-2745
Brokers: 800-368-2746
TDD for Hearing Impaired
800-541-1524
Branch Office
4550 Montgomery Avenue
Suite 1000 North
Bethesda, Maryland 20814
Registered, Certified or Overnight Mail
Calvert Investments
c/o BFDS,
330 West 9th Street
Kansas City, MO 64105
Web Site
www.calvert.com
Principal Underwriter
Calvert Investment Distributors, Inc.
4550 Montgomery Avenue
Suite 1000 North
Bethesda, Maryland 20814
| | |
| CALVERT | CALVERT’S | Equity Funds |
| CAPITAL | FAMILY OF FUNDS | Enhanced Equity Portfolio |
| ACCUMULATION | | Equity Portfolio |
| FUND | Tax-Exempt Money | Large Cap Growth Fund |
| | Market Funds | Large Cap Value Fund |
| | CTFR Money Market Portfolio | Social Index Fund |
| | | Capital Accumulation Fund |
| | Taxable Money Market | International Equity Fund |
| | Funds | Small Cap Fund |
| | First Government Money Market | Global Alternative Energy Fund |
| | Fund | Global Water Fund |
| | Money Market Portfolio | International Opportunities Fund |
| |
| | Municipal Funds | Balanced and Asset |
| | Calvert Tax-Free Bond Fund | Allocation Funds |
| | | Balanced Portfolio |
| | Taxable Bond Funds | Conservative Allocation Fund |
| | Bond Portfolio | Moderate Allocation Fund |
| | Income Fund | Aggressive Allocation Fund |
| | Short Duration Income Fund | |
| | Long-Term Income Fund | |
| | Ultra-Short Income Fund | |
| | Government Fund | |
| | High-Yield Bond Fund | |
This report is intended to provide fund information to shareholders. It is not authorized for distribution to prospective investors unless preceded or accompanied by a prospectus.
Note: The information on our website is not incorporated by reference into this report; our website address is included as an inactive textual reference only.
Investors should carefully consider the investment objectives, risks, charges and expenses of the Calvert Funds. This and other important information is contained in the fund’s summary prospectus and prospectus, which can be obtained from your financial professional and should be read carefully before investing. You may also call Calvert at 800/368-2745 or visit www. calvert.com.
INFORMATION REGARDING CALVERT OPERATING COMPANY
NAME CHANGES
Effective on April 30, 2011, the following Calvert operating companies will be renamed as indicated:
| | |
| Current Company Name | Company Name on 4/30/11 | Company Description |
| |
| Calvert Group, Ltd. | Calvert Investments, Inc. | Corporate parent of each |
| | | operating company listed |
| | | below |
| |
| Calvert Asset Management | Calvert Investment | Investment advisor to the |
| Company, Inc. | Management, Inc. | Calvert Funds |
| |
| Calvert Distributors, Inc. | Calvert Investment Distributors, | Principal underwriter |
| | Inc. | and distributor for the |
| | | Calvert Funds |
| |
| Calvert Administrative | Calvert Investment | Administrative services |
| Services Company | Administrative Services, Inc. | provider for the Calvert |
| | | Funds |
| |
| Calvert Shareholder | Calvert Investment Services, | Shareholder servicing |
| Services, Inc. | Inc. | provider for the Calvert |
| | | Funds |
Choose Planet-friendly E-delivery!
Sign up now for on-line statements, prospectuses, and fund reports. In less than five minutes you can help reduce paper mail and lower fund costs.
Just go to www.calvert.com. If you already have an online account at Calvert, click on My Account, and select the documents you would like to receive via e-mail.
If you’re new to online account access, click on Login/Register to open an online account. Once you’re in, click on the E-delivery sign-up at the bottom of the Account Portfolio page and follow the quick, easy steps. Note: if your shares are not held directly at Calvert but through a brokerage firm, you must contact your broker for electronic delivery options available through their firm.
Dear Shareholder:
The financial markets ended the six-month reporting period on a high note. The Federal Reserve’s announcement in the fall of 2010 of a second round of quantitative easing (QE2) initially buoyed the markets, which were further bolstered by the extension in December of the Bush-era tax cuts for all income levels. The resulting increase in U.S. consumer spending and confidence helped drive a year-end rally.
This calm lasted until new storms arrived in the beginning of 2011. Civil and political unrest in the Middle East and North Africa sent the price of energy soaring and heightened energy security concerns in many countries around the world. In March, the tragic earthquake and tsunami struck Japan. Our sympathies go out to the people of Japan who lost loved ones in this disaster. The earthquake—and its impact on the country’s nuclear reactors—roiled global financial markets. The cumulative effect of these events sparked a stock market sell-off before equities rebounded strongly in the final two weeks of the reporting period.
Markets Continue to Pick Up Steam
The stock market generally continued its upward momentum throughout the six-month period—with help from a strong fourth-quarter earnings season. Both U.S. growth- and value-oriented stocks reported significant gains across all capitalizations. In fact, the large-cap Russell 1000 Index and Standard & Poor’s 500 Index rose 18.13% and 17.31%, respectively, for the six-month period. Small- and mid-cap indices posted even higher returns as investors’ appetite for risk continued to strengthen.
However, continued uncertainty about the sovereign debt situation in some European countries as well as a drag from emerging markets tempered returns abroad, with the MSCI EAFE Index of international stocks returning 10.33% for the six-month period. Also, corporate bonds edged down slightly for the period, with the Barclays Capital U.S. Credit Index returning -0.98%. Money market returns remained flat, reflecting the Fed’s efforts to keep its target interest rate low.
Board Diversity and Company Competitiveness
At Calvert, we believe that companies with high standards of corporate governance, including diverse boards, are better positioned to compete in the global marketplace and to potentially outperform their peers. As a result, we continue to use our role as sustainable and responsible investors to encourage companies to clearly define diversity as inclusive of gender, ethnic, and racial backgrounds and to publicly commit to increasing diversity—on their boards and throughout their organizations.
We celebrated the first anniversary of the publication of the Women’s Empowerment Principles (WEP) and the 100th anniversary of International Women’s Day in March with a two-day event sponsored by the United Nations Women and the United Nations Global Compact. The WEP were established through collaboration between
| www. | calvert.com CALVERT INTERNATIONAL OPPORTUNITIES FUND SEMI-ANNUAL REPORT (UNAUDITED) 4 |
the United Nations Women and the United Nations Global Compact in March 2010. Calvert continues to be an integral player in furthering the adoption of the WEP across the globe. In fact, more than 140 CEOs worldwide have signed a statement of support for the WEP, in part due to Calvert’s efforts.
Also, our October 2010 diversity report “Examining the Cracks in the Ceiling” has been making news by being cited in more than 40 articles from outlets such as The Washington Post, Forbes, and The New York Times. While we are pleased to see such strong media interest in this topic, we’re even more pleased that the report has led to Calvert having conversations with more than a dozen companies about their diversity scores and actions they can take to improve their overall diversity performance.
Opportunities and Challenges Ahead
Overall, we are encouraged by the market’s ability to move ahead despite the recent troubles in the Middle East and Japan, and we expect a slow, gradual economic recovery to continue throughout the remainder of the year. A low core inflation rate (which excludes food and energy prices) will likely facilitate economic growth, while continued debt reduction, lingering high unemployment, and a struggling housing market should limit gains. Energy prices will remain a challenge until we see more resolution of the issues in the Middle East and North Africa. Of course, more geopolitical crises, rising commodity prices, and inflation spikes could certainly dampen the markets.
In short, we are optimistic and believe the markets, the global economy, and your Calvert funds can successfully navigate through any temporary setbacks that may lie ahead.
Discuss Your Portfolio Allocations with Your Advisor
Given the market shifts we have experienced, your overall portfolio asset allocation and investment strategy may no longer match your needs. Therefore, we recommend reviewing these with your financial advisor to ensure that your target mix of U.S. and international stocks, bonds, and cash is well-diversified and appropriate given your financial goals, time horizon, and risk tolerance.
We encourage you to visit our website, www.calvert.com, for fund information and updates as well as market and economic commentary from Calvert professionals.
www.calvert.com CALVERT INTERNATIONAL OPPORTUNITIES FUND SEMI-ANNUAL REPORT (UNAUDITED) 5
As noted elsewhere in this report, the Calvert operating companies that provide services to the funds will change their names effective April 30, 2011. As part of the changes, Calvert Group, Ltd. will be known as Calvert Investments, Inc., and the funds’ advisor, Calvert Asset Management Company, Inc., will be known as Calvert Investment Management, Inc. As always, we appreciate your investing with Calvert.

Barbara J. Krumsiek
President and CEO
Calvert Investments, Inc.
April 2011
| www. | calvert.com CALVERT INTERNATIONAL OPPORTUNITIES FUND SEMI-ANNUAL REPORT (UNAUDITED) 6 |
| |
SRI |
Update |
from the Calvert Sustainability Research Department |
Responsible management of environmental, social, and governance (ESG) factors isn’t just “nice to do”—it’s essential to keeping our companies and our economy healthy and strong. Therefore, Calvert continues to work hard to ensure that you have a say in charting new paths to a more prosperous future.
Corporate & Board Diversity
The newly released version of the Calvert report, “Examining the Cracks in the Ceiling: A Survey of Corporate Diversity Practices of the S&P 100,” revealed that women are still significantly underrepresented on corporate boards (18%) and in C-level executive positions (8.4%)—despite comprising more than half the workforce.
Another disappointment was learning that 37% of the companies disclose no demographic data on employees—such as race, ethnicity and gender—which is necessary to evaluate a company’s progress. Only eight companies disclose full EEO-1 data, which is a full breakdown of the workforce by race and gender across employment categories.
As an investor, Calvert believes companies that combine competitive financial performance with fair and equitable working environments—where diversity is not only tolerated but embraced—are more likely to recognize gains in both the workplace and marketplace and be better positioned to generate long-term value for their shareholders.
Green Homebuilding
In October, Calvert released “A Green Recovery for America’s Homebuilders? A Survey of Sustainable Practices by the Homebuilding Industry.” This updated version of our 2008 report on America’s 10 largest publicly traded homebuilders shows they have started to improve their policies and practices related to the environment and resources, but much progress remains to be seen.
Out of 42 possible points, the average total sustainability score was just over six points, or 15%. All 10 homebuilders have made some effort to develop environmental policies or practices or offer environmental products. However, there is a big difference in the level of commitment to sustainability and the penetration of “green” homes in each company’s product mix.
In the homebuilder rankings, KB Home and Pulte remained in the top two spots, while Meritage Homes and Toll Brothers had the biggest improvements—each moving up five spots. DR Horton and Ryland Homes fell back four and three places, respectively.
Climate Change
Calvert has continued its corporate engagement and policy work in support of energy efficiency, alternative energy, and reductions in greenhouse gas emissions. We have also been ramping up our work on climate change adaptation. Leading scientists believe that even if we stop producing greenhouse gasses tomorrow, a certain amount of climate
www.calvert.com CALVERT INTERNATIONAL OPPORTUNITIES FUND SEMI-ANNUAL REPORT (UNAUDITED) 7
change will still happen because of the carbon dioxide and other pollutants already in the atmosphere.
As a result, Calvert has been collaborating with Oxfam America to highlight the risks U.S. companies face from climate change as well as the opportunities for innovation and new business that corporate solutions could offer. In November 2010, we helped facilitate a high-level roundtable on Capitol Hill hosted by Oxfam for members of Congress, key congressional staff, and companies such as John Deere, Johnson Controls, and Starbucks to discuss these topics.
Calvert and Oxfam are now helping some of the attending companies form a business coalition to assist corporations and vulnerable communities in their adaptation to the effects of climate change. The new coalition would publish case studies and best practices as well as promote public policies related to climate change adaptation and resiliency.
On the shareholder advocacy front, Calvert has filed shareholder proposals with three companies asking them to clarify what they are doing to manage their risks related to climate change—two of these proposals have already been successfully withdrawn.
Overall Shareholder Advocacy Efforts
In all, Calvert has filed 35 resolutions to date in the 2011 proxy season and 22 have already been successfully withdrawn after the companies agreed to the terms of the resolution. In addition to the resolutions cited above, six focused on sustainability reporting, four on political contributions, and seven on climate principles.
Special Equities
A modest but important portion of certain funds is allocated to small private companies that are developing products or services that address important sustainability or environmental issues. For example, Calvert Equity Portfolio recently invested in the DBL Equity Fund-BAEF II, LP, which invests in private, mid- to late-stage growth companies—primarily in the clean tech, health care, information technology, and sustainability-oriented industries—ocated near low- and moderate-income communities in San Francisco and adjoining states. The Fund will assist its portfolio companies in creating and implementing their Second Bottom Line strategy in job creation, job quality, and environmental stewardship.
Calvert International Equity Fund invested in FINAE, S.A.P.I. de C.V. SOFOM ENR, a company that provides college loans to students from low- and middle-income families in Mexico. Students are selected by universities for their academic talent and financial need, and screened by FINAE for their repayment capacity.
| www. | calvert.com CALVERT INTERNATIONAL OPPORTUNITIES FUND SEMI-ANNUAL REPORT (UNAUDITED) 8 |
As of March 31, 2011, DBL Equity Fund –BAEF II, LP represented 0.02% of Calvert Equity Portfolio; FINAE represented 0.26% of Calvert International Equity Fund. All holdings are subject to change without notice.
As of March 31, 2011, the following companies represent the following percentages of net assets: KB Home represented 0.20% of Calvert Small Cap Fund; Pulte represented 0.03% of Calvert Social Index Fund; Meritage Homes represented 0% of all Calvert equity funds; DR Horton represented 0.04% of Calvert Social Index Fund; Ryland represented 0% of all Calvert equity funds; John Deere represented 1.53% of Calvert Balanced Portfolio and 0.52% of Calvert Social Index Fund; Johnson Controls represented 0.36% of Calvert Social Index Fund; Starbucks represented 0.35% of Calvert Social Index Fund, 2.01% of Calvert Equity Portfolio, and 1.65% of Calvert Enhanced Equity Portfolio; General Cable represented 1.74% of Calvert Capital Accumulation Fund and 0.03% of Calvert Social Index Fund; and WABCO Holdings represented 2.73% of Calvert Capital Accumulation Fund and 0.05% of Calvert Social Index Fund. All holdings are subject to change without notice.
www.calvert.com CALVERT INTERNATIONAL OPPORTUNITIES FUND SEMI-ANNUAL REPORT (UNAUDITED) 9
PORTFOLIO MANAGEMENT DISCUSSION

Sophie Horsfall
of F&C
Management
Limited
Performance
Calvert International Opportunities Fund Class A shares (at NAV) returned 6.19% for the six-month period ended March 31 2011, underperforming the benchmark MSCI Australasia Far East Small Mid Cap Index (MSCI EAFE SMID), which returned 13.47% for the period. The Fund’s under-performance was largely due to the Fund’s stock selection in Europe, the Pacific Rim, and emerging markets.
Investment Climate
Global equity markets overcame a bout of heightened risk aversion during the reporting period to post healthy gains. Fears that nations in the eurozone periphery would default on their debt pushed markets lower but confidence recovered as the Federal Reserve’s expansionary policy continued and data indicated the recovery was gaining traction in the developed countries.
U.S. equities ended the six-month period higher, encouraged by a strong fourth-quarter earnings season. While the continued fragility of the housing market undermined investor sentiment, there were finally some
CALVERT INTERNATIONAL OPPORTUNITIES FUND
MARCH 31, 2011
INVESTMENT PERFORMANCE
(TOTAL RETURN AT NAV*)
| | 6 Months | | 12 Months | |
| | ended | | ended | |
| | 3/31/11 | | 3/31/11 | |
| Class A | 6.19 | % | 9.90 | % |
| Class C | 5.74 | % | 8.95 | % |
| Class I | 6.44 | % | 10.34 | % |
| Class Y | 6.33 | % | 10.09 | % |
| MSCI EAFE Small Mid | | | |
| Cap Index | 13.47 | % | 17.70 | % |
| Lipper International | | | | |
| Multi-Cap Growth | | | | |
| Funds Average | 11.15 | % | 15.44 | % |
| |
| | | | % OF TOTAL | |
| ECONOMIC SECTORS | | | INVESTMENTS | |
| Consumer Discretionary | | 29.1 | % |
| Consumer Staples | | | 6.9 | % |
| Energy | | | 4.2 | % |
| Financials | | | 7.4 | % |
| Health Care | | | 8.5 | % |
| Industrials | | | 23.0 | % |
| Information Technology | | 9.6 | % |
| Materials | | | 6.2 | % |
| Utilities | | | 5.1 | % |
| Total | | | 100 | % |
| * | Investment performance/return at NAV does not reflect the deduction of the Fund’s maximum 4.75% front-end sales charge or any deferred sales charge. |
|
www. calvert.com CALVERT INTERNATIONAL OPPORTUNITIES FUND SEMI-ANNUAL REPORT (UNAUDITED) 10
| | |
| CALVERT INTERNATIONAL | |
| OPPORTUNITIES FUND | |
| MARCH 31, 2011 | | |
| | | |
| TEN LARGEST | % OF NET | |
| STOCK HOLDINGS | ASSETS | |
| | | |
| ProSafe SE | 2.6 | % |
| Umicore SA | 2.4 | % |
| Cap Gemini SA | 2.4 | % |
| Publicis Groupe | 2.3 | % |
| Vallourec SA | 2.3 | % |
| Adidas AG | 2.1 | % |
| Informa plc | 2.0 | % |
| VistaPrint NV | 2.0 | % |
| Benesse Holdings, Inc. | 2.0 | % |
| QIAGEN NV | 2.0 | % |
convincing signals on employment growth toward the end of the period. Stocks in the Asia-Pacific region also rallied as mining companies in the Australian market advanced on rising demand for commodities and infrastructure products. Emerging-market equities lost a degree of momentum as risk appetite fell—a response to possible sovereign debt defaults in Europe and concerns over rising inflation and interest
rates. The prospect of the Chinese authorities tightening monetary policy damaged sentiment, too, as fears grew that the pace of China’s economic growth would slow, dampening its demand for imports.
Bullish sentiment heading into the end of 2010 was tempered in the early months of 2011 by a series of negative events, partic- Total 22.1% ularly political and social unrest in North Africa and the Middle East and a major earthquake and tsunami in Japan. Nonetheless, the markets proved resilient and ended the period up, boosted by the continued outflow of funds from bonds into equities as risk appetite improved.
Portfolio Strategy
While our off-benchmark overweight position to North America proved beneficial to performance, this wasn’t enough to offset stock selection challenges in Europe and the Pacific Rim and our overweight to emerging markets.
At a sector level, our significant underweighting of the Financials sector contributed positively to performance—particularly where we avoided exposure to commercial banks. However, our overweight position in the Consumer Discretionary sector detracted, as did our stock selections within the sector. Swedish direct sales cosmetic retailer Oriflame suffered from supply problems in its key market of Russia. Retailer Marks & Spencer weakened from concern about the financial health of U.K. consumers. In addition, several consumer holdings in Japan declined as a result of concerns about the impact of the earthquake and tsunami on economic growth.
On the upside, German company Centrotec Sustainable posted an excellent return, benefiting from regulatory environment changes in favor of energy efficiency. Our investment in companies that benefit from late-cycle capital expenditures bore fruit when French transmission and distribution infrastructure provider Nexans recorded strong gains. We continued to increase the Fund’s exposure to the theme with the purchase of Rotork, a provider of specialized engineering products for a variety of end markets such as the oil industry.
www.calvert.com CALVERT INTERNATIONAL OPPORTUNITIES FUND SEMI-ANNUAL REPORT (UNAUDITED) 11
Stocks that had a negative impact on performance included Australian coal bed methane company Dart Energy. Although the move was anticipated, the company still retreated after two major shareholders took their profits and exited their positions. Since we believe Dart Energy’s long-term prospects are strong, we used the weakness to increase our position in the company. Japanese cosmetics company Shiseido also detracted from performance, declining on the back of weak domestic demand and the earthquake and tsunami disasters.
Outlook
Economically, we are seeing mixed signals, with encouraging data from the U.S. tempered by uncertainty in Europe and questions about the impact of rising interest rates and high inflation on growth in developing markets. In the near term, we believe the economic effect of the Japanese earthquake may be underestimated in terms of the direct impact on companies, energy shortages, and the supply chain.
While we would expect to see a broader impact from the Japanese disaster, we do not expect any material impact on the Fund
CALVERT INTERNATIONAL OPPORTUNITIES FUND
MARCH 31, 2011
AVERAGE ANNUAL TOTAL RETURNS
| Class A shares | (with max. load) | |
| One year | 4.67 | % |
| Since inception (5/31/2007) | -4.32 | % |
| |
| Class C shares | (with max. load) | |
| One year | 7.95 | % |
| Since inception (7/31/2007) | -3.56 | % |
| |
| Class I shares | | |
| One year | 10.34 | % |
| Since inception (5/31/2007) | -2.67 | % |
| |
| Class Y shares* | | |
| One year | 10.09 | % |
| Since inception (5/31/2007) | -2.98 | % |
*Calvert International Opportunities Fund first offered Class Y shares on October 31, 2008. Performance prior to that date reflects the performance of Class A shares at net asset value (NAV). Actual Class Y share performance would have been different.
given our minimal exposure to electronics and automotives, which are most strongly tied to Japanese suppliers. We believe the situation with the nuclear plant in Japan supports our case for alternative and transitional fuels, and for companies such as Dart Energy. We plan to retain our underweight position in Japan but will cautiously look for specific opportunities in companies that will benefit from the rebuilding effort.
April 2011
As of March 31, 2011, the following companies represented the following percentages of Fund net assets: Oriflame 1.35%, Marks & Spencer 1.83%, Centrotec Sustainable 1.29%, Nexans 1.63%, Rotork 1.56%, Dart Energy 1.52%, and Shiseido 1.28% All portfolio holdings are subject to change without notice.
| www. | calvert.com CALVERT INTERNATIONAL OPPORTUNITIES FUND SEMI-ANNUAL REPORT (UNAUDITED) 12 |
GROWTH OF $10,000
The graph below shows the value of a hypothetical $10,000 investment in the fund over the past 10 fiscal year periods or since inception (for funds without 10-year records). The results shown are for Classes A and I shares and reflect the deduction of the maximum front-end Class A sales charge of 4.75%, and assume the reinvestment of dividends. The result is compared with benchmarks that include a broad based market index and a Lipper peer group average. Market indexes are unmanaged and their results do not reflect the effect of expenses or sales charges. The Lipper average reflects the deduction of the category’s average front-end sales charge. The value of an investment in a different share class would be different.
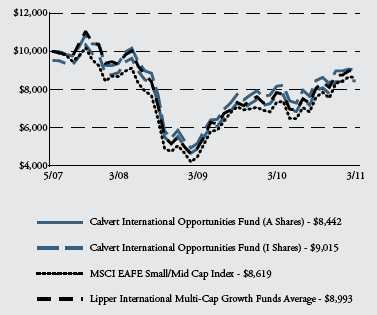
All performance data shown, including the graph above and the adjacent table, represents past performance, does not guarantee future results, assumes reinvestment of dividends and distributions and does not reflect the deduction of taxes that a shareholder would pay on the Fund’s/Portfolio’s distributions or the redemption of the Fund/Portfolio shares. The investment return and principal value of an investment will fluctuate so that an investor’s shares, when redeemed, may be worth more or less than their original cost. Current performance may be lower or higher than the performance data quoted; for current performance data visit www.calvert.com. The gross expense ratio from the current prospectus for Class A shares is 2.27%. This number may differ from the expense ratio shown elsewhere in this report because it is based on a different time period and, if applicable, does not include fee or expense waivers. Performance data quoted already reflects the deduction of the Fund’s/Portfolio’s operating expenses.
www.calvert.com CALVERT INTERNATIONAL OPPORTUNITIES FUND SEMI-ANNUAL REPORT (UNAUDITED) 13
SHAREHOLDER EXPENSE EXAMPLE
As a shareholder of the Fund, you incur two types of costs: (1) transaction costs, including sales charges and redemption fees; and (2) ongoing costs, including management fees; distribution (12b-1) fees; and other Fund expenses. This Example is intended to help you understand your ongoing costs (in dollars) of investing in the Fund and to compare these costs with the ongoing costs of investing in other mutual funds.
This Example is based on an investment of $1,000 invested at the beginning of the period and held for the entire period (October 1, 2010 to March 31, 2011).
Actual Expenses
The first line of the table below provides information about actual account values and actual expenses. You may use the information in this line, together with the amount you invested, to estimate the expenses that you paid over the period. Simply divide your account value by $1,000 (for example, an $8,600 account value divided by $1,000 = 8.6), then multiply the result by the number in the first line under the heading entitled “Expenses Paid During Period” to estimate the expenses you paid on your account during this period.
Hypothetical Example for Comparison Purposes
The second line of the table below provides information about hypothetical account values and hypothetical expenses based on the Fund’s actual expense ratio and an assumed rate of return of 5% per year before expenses, which is not the Fund’s actual return. The hypothetical account values and expenses may not be used to estimate the actual ending account balance or expenses you paid for the period. You may use this information to compare the ongoing costs of investing in the Fund and other funds. To do so, compare the 5% hypothetical example with the 5% hypothetical examples that appear in the shareholder reports of the other funds.
Please note that the expenses shown in the table are meant to highlight your ongoing costs only and do not reflect any transactional costs, such as sales charges (loads), or redemption fees. Therefore, the second line of the table is useful in comparing ongoing costs only, and will not help you determine the relative total costs of owning different funds. In addition, if these transactional costs were included, your costs would have been higher.
| www. | calvert.com CALVERT INTERNATIONAL OPPORTUNITIES FUND SEMI-ANNUAL REPORT (UNAUDITED) 14 |
| | | | | | |
| | | BEGINNING | | ENDING ACCOUNT | | EXPENSES PAID |
| | | ACCOUNT VALUE | | VALUE | | DURING PERIOD* |
| | | 10/1/10 | | 3/31/11 | | 10/1/10 - 3/31/11 |
| class A | | | | | | |
| Actual | $ | 1,000.00 | $ | 1,061.90 | $ | 8.53 |
| Hypothetical | $ | 1,000.00 | $ | 1,016.65 | $ | 8.35 |
| (5% return per | | | | | | |
| year before expenses) | | | | | | |
| |
| class c | | | | | | |
| Actual | $ | 1,000.00 | $ | 1,057.40 | $ | 12.82 |
| Hypothetical | $ | 1,000.00 | $ | 1,012.47 | $ | 12.54 |
| (5% return per | | | | | | |
| year before expenses) | | | | | | |
| |
| class I | | | | | | |
| Actual | $ | 1,000.00 | $ | 1,064.40 | $ | 6.18 |
| Hypothetical | $ | 1,000.00 | $ | 1,018.95 | $ | 6.04 |
| (5% return per | | | | | | |
| year before expenses) | | | | | | |
| |
| class Y | | | | | | |
| Actual | $ | 1,000.00 | $ | 1,063.30 | $ | 7.25 |
| Hypothetical | $ | 1,000.00 | $ | 1,017.90 | $ | 7.09 |
| (5% return per | | | | | | |
| year before expenses) | | | | | | |
*Expenses are equal to the Fund’s annualized expense ratio of 1.66%, 2.50%, 1.20% and 1.41% for Class A, Class C , Class I and Class Y respectively, multiplied by the average account value over the period, multiplied by 182/365 (to reflect the one-half year period).
www.calvert.com CALVERT INTERNATIONAL OPPORTUNITIES FUND SEMI-ANNUAL REPORT (UNAUDITED) 15
| | | |
| STATEMENT OF NET ASSETS |
| MARCH 31, 2011 |
| |
| |
| EQUITY SECURITIES - 96.7% | shares | | value |
| Argentina - 1.1% | | | |
| MercadoLibre, Inc. | 6,371 | $ | 520,065 |
| |
| Australia - 6.8% | | | |
| Computershare Ltd. | 92,502 | | 887,234 |
| Dart Energy Ltd.* | 808,967 | | 728,998 |
| QBE Insurance Group Ltd. | 37,103 | | 679,081 |
| Ramsay Health Care Ltd. | 19,133 | | 378,325 |
| Sims Metal Management Ltd. | 31,027 | | 562,732 |
| | | | 3,236,370 |
| |
| Belgium - 2.4% | | | |
| Umicore SA | 23,523 | | 1,167,609 |
| |
| Brazil - 4.2% | | | |
| Anhanguera Educacional Participacoes SA | 27,537 | | 675,645 |
| Diagnosticos da America SA | 38,400 | | 494,891 |
| Natura Cosmeticos SA | 19,200 | | 542,023 |
| Tractebel Energia SA | 17,900 | | 303,194 |
| | | | 2,015,753 |
| |
| Canada - 0.9% | | | |
| Canadian Pacific Railway Ltd. | 6,938 | | 444,923 |
| |
| Cyprus - 2.6% | | | |
| ProSafe SE | 162,080 | | 1,229,319 |
| |
| Finland - 0.4% | | | |
| Lassila & Tikanoja Oyj | 11,575 | | 208,508 |
| |
| France - 10.5% | | | |
| Cap Gemini SA | 19,564 | | 1,137,316 |
| Nexans SA | 8,152 | | 780,373 |
| PPR SA | 5,845 | | 896,622 |
| Publicis Groupe | 19,695 | | 1,105,543 |
| Vallourec SA | 9,786 | | 1,098,777 |
| | | | 5,018,631 |
| |
| Germany - 4.4% | | | |
| Adidas AG | 15,688 | | 989,206 |
| CENTROTEC Sustainable AG* | 19,580 | | 615,433 |
| Rhoen Klinikum AG | 23,428 | | 508,423 |
| | | | 2,113,062 |
| |
| Hong Kong - 1.2% | | | |
| Esprit Holdings Ltd. | 127,700 | | 586,322 |
| www. | calvert.com CALVERT INTERNATIONAL OPPORTUNITIES FUND SEMI-ANNUAL REPORT (UNAUDITED) 16 |
| | | |
| EQUITY SECURITIES - CONT’D | SHARES | | VALUE |
| Italy - 1.6% | | | |
| Luxottica Group SpA | 22,841 | $ | 746,442 |
| |
| Japan - 17.1% | | | |
| Asahi Glass Co. Ltd. | 48,000 | | 606,597 |
| Benesse Holdings, Inc. | 23,200 | | 954,404 |
| Daiwa House Industry Co. Ltd | 20,000 | | 246,949 |
| Kubota Corp | 84,000 | | 795,651 |
| Kurita Water Industries Ltd. | 28,500 | | 846,702 |
| Nikon Corp. | 32,900 | | 681,690 |
| Sharp Corp. | 25,000 | | 249,184 |
| Shimano, Inc. | 16,100 | | 808,209 |
| Shiseido Co. Ltd. | 35,000 | | 608,916 |
| USS Co. Ltd. | 9,760 | | 762,924 |
| Yamada Denki Co. Ltd. | 12,890 | | 873,661 |
| Yamatake Corp. | 28,600 | | 704,202 |
| | | | 8,139,089 |
| |
| Luxembourg - 1.4% | | | |
| Oriflame Cosmetics SA (SDR) | 12,450 | | 644,069 |
| |
| Mexico - 2.5% | | | |
| Compartamos SAB de CV* | 314,152 | | 564,883 |
| Urbi Desarrollos Urbanos SA de CV* | 278,433 | | 645,970 |
| | | | 1,210,853 |
| |
| Netherlands - 5.4% | | | |
| QIAGEN NV* | 47,311 | | 945,858 |
| TNT NV | 25,447 | | 653,302 |
| VistaPrint NV* | 18,434 | | 956,724 |
| | | | 2,555,884 |
| |
| Norway - 1.7% | | | |
| Tomra Systems ASA | 48,200 | | 393,715 |
| Yara International ASA | 8,600 | | 435,474 |
| | | | 829,189 |
| |
| Philippines - 0.7% | | | |
| Manila Water Co., Inc. | 845,000 | | 353,576 |
| |
| Singapore - 2.3% | | | |
| ComfortDelgro Corp. Ltd. | 503,000 | | 622,663 |
| Hyflux Ltd. | 283,000 | | 485,066 |
| | | | 1,107,729 |
| |
| Spain - 1.4% | | | |
| Ebro Foods SA | 28,492 | | 670,048 |
| |
| Sweden - 1.5% | | | |
| Svenska Cellulosa AB, Series B | 44,140 | | 710,351 |
www.calvert.com CALVERT INTERNATIONAL OPPORTUNITIES FUND SEMI-ANNUAL REPORT (UNAUDITED) 17
| | | |
| EQUITY SECURITIES - CONT’D | SHARES | | VALUE |
| Switzerland - 4.0% | | | |
| Adecco SA | 13,626 | $ | 898,581 |
| Informa plc | 147,871 | | 988,874 |
| | | | 1,887,455 |
| |
| United Kingdom - 13.7% | | | |
| Associated British Foods plc | 45,555 | | 725,241 |
| Halfords Group plc | 80,738 | | 451,171 |
| Intertek Group plc | 18,390 | | 600,299 |
| Legal & General Group plc | 304,738 | | 563,396 |
| Marks & Spencer Group plc | 161,203 | | 871,066 |
| Pearson plc | 52,346 | | 924,923 |
| Rotork plc | 26,615 | | 745,771 |
| Severn Trent plc | 28,561 | | 669,666 |
| United Utilities Group plc | 57,328 | | 544,197 |
| Wolseley plc* | 12,804 | | 431,313 |
| | | | 6,527,043 |
| |
| United States - 8.9% | | | |
| DaVita, Inc.* | 4,390 | | 375,389 |
| F5 Networks, Inc.* | 2,058 | | 211,089 |
| Haemonetics Corp.* | 3,844 | | 251,936 |
| Henry Schein, Inc.* | 3,489 | | 244,823 |
| Insituform Technologies, Inc.* | 11,648 | | 311,584 |
| IntercontinentalExchange, Inc.* | 3,863 | | 477,235 |
| Mednax, Inc.* | 3,799 | | 253,051 |
| New York Community Bancorp, Inc. | 25,181 | | 434,624 |
| Principal Financial Group, Inc. | 13,925 | | 447,132 |
| Quanta Services, Inc.* | 13,744 | | 308,278 |
| ResMed, Inc.* | 148,366 | | 447,202 |
| Towers Watson & Co. | 5,053 | | 280,239 |
| Whirlpool Corp. | 2,671 | | 227,997 |
| | | | 4,270,579 |
| |
| Total Equity Securities (Cost $40,433,592) | | | 46,192,869 |
| |
| |
| TOTAL INVESTMENTS (Cost $40,433,592) - 96.7% | | | 46,192,869 |
| Other assets and liabilities, net - 3.3% | | | 1,557,969 |
| net assets - 100% | | $ | 47,750,838 |
See notes to financial statements.
| www. | calvert.com CALVERT INTERNATIONAL OPPORTUNITIES FUND SEMI-ANNUAL REPORT (UNAUDITED) 18 |
| | | |
| NET ASSETS CONSIST OF: | | | |
| Paid-in capital applicable to the following shares of common stock with | | | |
| 250,000,000 shares of $.01 par value shares authorized: | | | |
| Class A: 2,999,389 shares outstanding | $ | 38,835,121 | |
| Class C: 178,932 shares outstanding | | 2,207,620 | |
| Class I: 358,430 shares outstanding | | 5,033,934 | |
| Class Y: 107,806 shares outstanding | | 1,186,566 | |
| Undistributed net investment income (loss) | | (57,296 | ) |
| Accumulated net realized gain (loss) on investments and foreign | | | |
| currency transactions | | (5,214,803 | ) |
| Net unrealized appreciation (depreciation) on investments, foreign currencies and | | | |
| assets and liabilities denominated in foreign currencies | | 5,759,696 | |
| |
| NET ASSETS | $ | 47,750,838 | |
| |
| NET ASSET VALUE PER SHARE | | | |
| Class A (based on net assets of $39,487,871) | $ | 13.17 | |
| Class C (based on net assets of $2,308,011) | $ | 12.90 | |
| Class I (based on net assets of $4,613,942) | $ | 12.87 | |
| Class Y (based on net assets of $1,341,014) | $ | 12.44 | |
* Non-income producing security.
Abbreviations:
SDR: Swedish Depositary Receipts
See notes to financial statements. www.calvert.com CALVERT INTERNATIONAL OPPORTUNITIES FUND SEMI-ANNUAL REPORT (UNAUDITED) 19
| | | |
| STATEMENT OF OPERATIONS |
| SIX MONTHS ENDED MARCH 31, 2011 |
| |
| |
| NET INVESTMENT INCOME | | | |
| Investment Income: | | | |
| Dividend income (net of foreign taxes withheld of $13,154) | $ | 291,409 | |
| Interest income | | 669 | |
| Total investment income | | 292,078 | |
| |
| Expenses: | | | |
| Investment advisory fee | | 169,852 | |
| Transfer agency fees and expenses | | 64,225 | |
| Distribution Plan expenses: | | | |
| Class A | | 43,602 | |
| Class C | | 10,148 | |
| Directors’ fees and expenses | | 2,167 | |
| Administrative fees | | 69,878 | |
| Accounting fees | | 3,508 | |
| Custodian fees | | 48,914 | |
| Registration fees | | 21,554 | |
| Reports to shareholders | | 14,542 | |
| Professional fees | | 11,010 | |
| Miscellaneous | | 6,788 | |
| Total expenses | | 466,188 | |
| Reimbursement from Advisor: | | | |
| Class A | | (90,594 | ) |
| Class C | | (9,907 | ) |
| Class I | | (7,329 | ) |
| Class Y | | (8,532 | ) |
| Fees paid indirectly | | (452 | ) |
| Net expenses | | 349,374 | |
| |
| |
| NET INVESTMENT INCOME (LOSS) | | (57,296 | ) |
| |
| |
| REALIZED AND UNREALIZED GAIN (LOSS) | | | |
| Net realized gain (loss) on: | | | |
| Investments | | 1,045,262 | |
| Foreign currency transactions | | 7,674 | |
| | | 1,052,936 | |
| Change in unrealized appreciation (depreciation) on: | | | |
| Investments and foreign currencies | | 1,472,425 | |
| Assets and liabilities denominated in foreign currencies | | (1,734 | ) |
| | | 1,470,691 | |
| |
| NET REALIZED AND UNREALIZED GAIN (LOSS) | | 2,523,627 | |
| |
| INCREASE (DECREASE) IN NET ASSETS | | | |
| RESULTING FROM OPERATIONS | $ | 2,466,331 | |
See notes to financial statements.
| www. | calvert.com CALVERT INTERNATIONAL OPPORTUNITIES FUND SEMI-ANNUAL REPORT (UNAUDITED) 20 |
STATEMENTS OF CHANGES IN NET ASSETS
| | | | | | |
| | | SIX MONTHS ENDED | | | YEAR ENDED | |
| | | MARCH
31, | | | SEPTEMBER 30, | |
| INCREASE (DECREASE) IN NET ASSETS | | 2011 | | | 2010 | |
| Operations: | | | | | | |
| Net investment income | ($ | 57,296 | ) | $ | 156,258 | |
| Net realized gain (loss) | | 1,052,936 | | | 941,218 | |
| Change in unrealized appreciation or (depreciation) | | 1,470,691 | | | 1,796,385 | |
| |
| INCREASE (DECREASE) IN NET ASSETS | | | | | | |
| RESULTING FROM OPERATIONS | | 2,466,331 | | | 2,893,861 | |
| |
| Distributions to shareholders from: | | | | | | |
| Net investment income: | | | | | | |
| Class A shares | | (76,759 | ) | | — | |
| Class I shares | | (28,795 | ) | | (64,681 | ) |
| Class Y shares | | (1,938 | ) | | (8,846 | ) |
| Total distributions | | (107,492 | ) | | (73,527 | ) |
| |
| Capital share transactions: | | | | | | |
| Shares sold: | | | | | | |
| Class A shares | | 10,091,099 | | | 11,583,422 | |
| Class C shares | | 559,782 | | | 999,261 | |
| Class I shares | | 279,198 | | | 522,238 | |
| Class Y shares | | 385,200 | | | 968,455 | |
| Reinvestment of distributions: | | | | | | |
| Class A shares | | 69,323 | | | — | |
| Class I shares | | 28,796 | | | 64,681 | |
| Class Y shares | | 852 | | | 8,846 | |
| Redemption fees: | | | | | | |
| Class A shares | | 122 | | | 166 | |
| Class C shares | | — | | | 40 | |
| Class Y shares | | 1 | | | — | |
| Shares redeemed: | | | | | | |
| Class A shares | | (2,683,170 | ) | | (5,203,155 | ) |
| Class C shares | | (102,170 | ) | | (195,764 | ) |
| Class I shares | | (128,563 | ) | | (397,915 | ) |
| Class Y shares | | (48,549 | ) | | (206,139 | ) |
| Total capital share transactions | | 8,451,921 | | | 8,144,136 | |
| |
| TOTAL INCREASE (DECREASE) IN NET ASSETS | | 10,810,760 | | | 10,964,470 | |
| |
| NET ASSETS | | | | | | |
| Beginning of period | | 36,940,078 | | | 25,975,608 | |
| End of period (including distributions in excess of net investment | | | | | | |
| income of $57,296 and undistributed net | | | | | | |
| investment income of $107,492, respectively) | $ | 47,750,838 | | $ | 36,940,078 | |
See notes to financial statements.
www.calvert.com CALVERT INTERNATIONAL OPPORTUNITIES FUND SEMI-ANNUAL REPORT (UNAUDITED) 21
STATEMENTS OF CHANGES IN NET ASSETS
| | | | |
| | SIX MONTHS
ENDED | | YEAR ENDED | |
| | MARCH
31, | | SEPTEMBER 30, | |
| CAPITAL SHARE ACTIVITY | 2011 | | 2010 | |
| Shares sold: | | | | |
| Class A shares | 781,577 | | 998,916 | |
| Class C shares | 43,991 | | 87,604 | |
| Class I shares | 22,082 | | 45,909 | |
| Class Y shares | 31,134 | | 89,345 | |
| Reinvestment of distributions: | | | | |
| Class A shares | 5,353 | | — | |
| Class I shares | 2,277 | | 5,709 | |
| Class Y shares | 70 | | 809 | |
| Shares redeemed: | | | | |
| Class A shares | (206,866 | ) | (449,789 | ) |
| Class C shares | (8,014 | ) | (17,578 | ) |
| Class I shares | (10,136 | ) | (35,362 | ) |
| Class Y shares | (3,970 | ) | (19,331 | ) |
| Total capital share activity | 657,498 | | 706,232 | |
See notes to financial statements.
| www. | calvert.com CALVERT INTERNATIONAL OPPORTUNITIES FUND SEMI-ANNUAL REPORT (UNAUDITED) 22 |
NOTES TO FINANCIAL STATEMENTS
NOTE A — SIGNIFICANT ACCOUNTING POLICIES
General: The Calvert International Opportunities Fund (the “Fund”), a series of Calvert World Values Fund, Inc., is registered under the Investment Company Act of 1940 as a diversified, open-end management investment company. The operation of each series is accounted for separately. Class A shares are sold with a maximum front-end sales charge of 4.75%. Class C shares are sold without a front-end sales charge. With certain exceptions, the Fund will impose a deferred sales charge on shares sold within one year of purchase. Class C shares have higher levels of expenses than Class A shares. Class I shares require a minimum account balance of $1,000,000. The $1 million minimum initial investment may be waived for certain institutional accounts, where it is believed to be in the best interest of the Fund and its shareholders. Class I shares have no front-end or deferred sales charge and have lower levels of expenses than Class A shares. Effective October 31, 2008, the Fund began to offer Class Y shares. Class Y shares are generally only available to wrap or similar fee-based programs offered by financial intermediaries that have entered into an agreement with the Fund’s Distributor to offer Class Y shares. Class Y shares have no front-end or deferred sales charge and have lower levels of expenses than Class A shares. Each class has different: (a) dividend rates, due to differences in Distribution Plan expenses and other class-specific expenses, (b) exchange privileges, and (c) class-specific voting rights.
Security Valuation: Net asset value per share is determined every business day as of the close of the regular session of the New York Stock Exchange (generally 4:00 p.m. Eastern time). The Fund uses independent pricing services approved by the Board of Directors to value its investments wherever possible. Investments for which market quotations are not available or deemed not reliable are fair valued in good faith under the direction of the Board of Directors. In determining fair value, the Board considers all relevant qualitative and quantitative information available. These factors are subject to change over time and are reviewed periodically. The values assigned to fair value investments are based on available information and do not necessarily represent amounts that might ultimately be realized. Further, because of the inherent uncertainty of valuation, those estimated values may differ significantly from the values that would have been used had a ready market for the investments existed, and the differences could be material.
At March 31, 2011, no securities were fair valued in good faith under the direction of the Board of Directors.
The Fund utilizes various methods to measure the fair value of its investments. Generally Accepted Accounting Principles (GAAP) establishes a disclosure hierarchy that categorizes the inputs to valuation techniques used to value assets and liabilities at measurement date. These inputs are summarized in the three broad levels listed below: Level 1 – quoted prices in active markets for identical securities Level 2 – other significant observable inputs (including quoted prices for similar securities, interest rates, prepayment speeds, credit risk, etc.) Level 3 – significant unobservable inputs (including the Fund’s own assumptions in
www.calvert.com CALVERT INTERNATIONAL OPPORTUNITIES FUND SEMI-ANNUAL REPORT (UNAUDITED) 23
determining the fair value of investments)
The inputs or methodology used for valuing securities are not necessarily an indication of the risk associated with investing in those securities.
Changes in valuation techniques may result in transfers in or out of an investment’s assigned level within the hierarchy during the period. Valuation techniques used to value the Fund’s investments by major category are as follows.
Equity securities, including restricted securities, for which market quotations are readily available, are valued at the last reported sale price or official closing price as reported by an independent pricing service on the primary market or exchange on which they are traded and are categorized as Level 1 in the hierarchy. Foreign securities are valued based on quotations from the principle market in which such securities are normally traded. If events occur after the close of the principle market in which foreign securities are traded, and before the close of business of the Fund, that are expected to materially affect the value of those securities, then they are valued at their fair value taking these events into account. The Fund has retained a third party fair value pricing service to quantitatively analyze the price movement of its holdings on foreign exchanges and to automatically fair value if the variation from the prior day’s closing price exceeds specified parameters. Such securities would be categorized as Level 2 in the hierarchy in these circumstances. Utilizing this technique may result in transfers between Level 1 and Level 2. For restricted securities and private placements where observable inputs are limited, assumptions about market activity and risk are used and are categorized as Level 3 in the hierarchy.
Short-term securities with remaining maturities of sixty days or less for which quotations are not readily available are valued at amortized cost, which approximates fair value, and are categorized as Level 2 in the hierarchy.
The following is a summary of the inputs used to value the Fund’s net assets as of March 31, 2011:
| | | | | | |
| | | VALUATION INPUTS |
| InvestMents In securItIes | | level 1 | level 2 | level 3 | | total |
| Equity securities* | $ | 46,192,869 | - | - | $ | 46,192,869 |
| TOTAL | $ | 46,192,869 | - | - | $ | 46,192,869 |
* For further breakdown of equity securities by country, please refer to the Statement of Net Assets.
Repurchase Agreements: The Fund may enter into repurchase agreements with recognized financial institutions or registered broker/dealers and, in all instances, holds underlying securities with a value exceeding the total repurchase price, including accrued interest. Although risk is mitigated by the collateral, the Fund could experience a delay in recovering its value and a possible loss of income or value if the counterparty fails to perform in accordance with the terms of the agreement.
Security Transactions and Net Investment Income: Security transactions are accounted for on trade date. Realized gains and losses are recorded on an identified cost basis and may include proceeds from litigation. Dividend income is recorded on the ex-dividend date or, in the case of dividends on certain foreign securities, as soon as the Fund is informed of the ex-dividend date. Distributions received on securities that represent a
| www. | calvert.com CALVERT INTERNATIONAL OPPORTUNITIES FUND SEMI-ANNUAL REPORT (UNAUDITED) 24 |
return of capital or capital gain are recorded as a reduction of cost of investments and/or as a realized gain. Interest income, which includes amortization of premium and accretion of discount on debt securities, is accrued as earned. Withholding taxes on foreign dividends have been provided for in accordance with the Fund’s understanding of the applicable country’s tax rules and rates. Investment income and realized and unrealized gains and losses are allocated to separate classes of shares based upon the relative net assets of each class. Expenses arising in connection with a class are charged directly to that class. Expenses common to the classes are allocated to each class in proportion to their relative net assets.
Foreign Currency Transactions: The Fund’s accounting records are maintained in U.S. dollars. For valuation of assets and liabilities on each date of net asset value determination, foreign denominations are converted into U.S. dollars using the current exchange rate. Security transactions, income and expenses are translated at the prevailing rate of exchange on the date of the event. The effect of changes in foreign exchange rates on securities and foreign currencies is included in the net realized and unrealized gain or loss on securities and foreign currencies.
Distributions to Shareholders: Distributions to shareholders are recorded by the Fund on ex-dividend date. Dividends from net investment income and distributions from net realized capital gains, if any, are paid at least annually. Distributions are determined in accordance with income tax regulations which may differ from generally accepted accounting principles; accordingly, periodic reclassifications are made within the Fund’s capital accounts to reflect income and gains available for distribution under income tax regulations.
Estimates: The preparation of financial statements in conformity with accounting principles generally accepted in the United States requires management to make estimates and assumptions that affect the reported amounts of assets and liabilities and disclosure of contingent assets and liabilities at the date of the financial statements and the reported amounts of income and expenses during the reporting period. Actual results could differ from those estimates.
Redemption Fees: The Fund charges a 2% redemption fee on redemptions, including exchanges, made within 30 days of purchase in the same Fund (within seven days for Class I shares). The redemption fee is paid to the Class of the Fund from which the redemption is made, and is accounted for as an addition to paid-in capital. The fee is intended to discourage market-timers by ensuring that short-term trading costs are borne by the investors making the transactions and not the shareholders already in the Fund.
Expense Offset Arrangements: The Fund has an arrangement with its custodian bank whereby the custodian’s fees may be paid indirectly by credits earned on the Fund’s cash on deposit with the bank. These credits are used to reduce the Fund’s expenses. Such a deposit arrangement may be an alternative to overnight investments.
Federal Income Taxes: No provision for federal income or excise tax is required since the Fund intends to qualify as a regulated investment company under the Internal Revenue Code and to distribute substantially all of its taxable earnings.
www.calvert.com CALVERT INTERNATIONAL OPPORTUNITIES FUND SEMI-ANNUAL REPORT (UNAUDITED) 25
Management has analyzed the Fund’s tax positions taken for all open federal income tax years and has concluded that no provision for federal income tax is required in the Fund’s financial statements. A Fund’s federal tax return is subject to examination by the Internal Revenue Service for a period of three years.
NOTE B — RELATED PARTY TRANSACTIONS
Calvert Asset Management Company, Inc. (the “Advisor”) is wholly-owned by Calvert Group, Ltd. (“Calvert”), which is indirectly wholly owned by UNIFI Mutual Holding Company. The Advisor provides investment advisory services and pays the salaries and fees of officers and Directors of the Fund who are employees of the Advisor or its affiliates. For its services, the Advisor receives an annual fee, payable monthly, of .80% of the average daily net assets. Under the terms of the agreement, $31,487 was payable at period end. In addition, $5,929 was payable at period end for operating expenses paid by the Advisor during March 2011.
The Advisor has contractually agreed to limit net annual fund operating expenses through January 31, 2012. The contractual expense cap is 1.66% for Class A, 2.50% for Class C, 1.20% for Class I, and 1.41% for Class Y. For the purposes of this expense limit, operating expenses do not include interest expense, brokerage commissions, taxes, and extraordinary expenses. To the extent any expense offset credits are earned, the Advisor’s obligation under the contractual limitation may be reduced and the Advisor may benefit from the expense offset arrangement.
Calvert Administrative Services Company, an affiliate of the Advisor, provides administrative services to the Fund for an annual fee, payable monthly, of .35% for Class A, Class C, and Class Y shares and .15% for Class I shares, based on their average daily net assets. Under the terms of the agreement, $13,008 was payable at period end.
Calvert Distributors, Inc., an affiliate of the Advisor, is the distributor and principal underwriter for the Fund. Distribution Plans, adopted by Class A and Class C shares, allow the Fund to pay the Distributor for expenses and services associated with the distribution of shares. The expenses paid may not exceed .50% and 1.00% annually of the Fund’s average daily net assets of Class A and Class C, respectively. The amount actually paid by the Fund is an annualized fee, payable monthly of .25% and 1.00% of the Fund’s average daily net assets of Class A and Class C, respectively. Class I and Y shares do not have Distribution Plan expenses. Under the terms of the agreement, $10,035 was payable at period end.
The Distributor received $13,322 as its portion of the commissions charged on sales of the Fund’s Class A shares for the six months ended March 31, 2011.
Calvert Shareholder Services, Inc. (“CSSI”), an affiliate of the Advisor, is the shareholder servicing agent for the Fund. For its services, CSSI received a fee of $10,828 for the six months ended March 31, 2011. Under the terms of the agreement, $2,043 was payable at period end. Boston Financial Data Services, Inc. is the transfer and dividend disbursing agent.
Each Director of the Fund who is not an employee of the Advisor or its affiliates receives an annual retainer of $44,000 plus a meeting fee of $2,000 for each Board meeting
| www. | calvert.com CALVERT INTERNATIONAL OPPORTUNITIES FUND SEMI-ANNUAL REPORT (UNAUDITED) 26 |
attended. Additional fees of up to $5,000 annually may be paid to the Board chair and Committee chairs ($10,000 for the Special Equities Committee chair) and $2,500 annually may be paid to Committee members, plus a Committee meeting fee of $500 for each Committee meeting attended. Directors fees are allocated to each of the Funds served.
NOTE C — INVESTMENT ACTIVITY
During the period, the cost of purchases and proceeds from sales of investments, other than short-term securities, were $18,662,678 and $10,053,478, respectively.
| CAPITAL LOSS CARRYFORWARDS | |
| EXPIRATION DATE | |
| 30-Sep-17 | ($1,330,630) |
| 30-Sep-18 | (4,754,491) |
Capital losses may be utilized to offset future capital gains until expiration. Under the recently enacted Regulated Investment Company Modernization Act of 2010, the Funds will be permitted to carry forward capital losses incurred in taxable years beginning after December 22, 2010 for an unlimited period. Losses incurred during those future years will be required to be utilized prior to the losses incurred in pre-enactment taxable years. As a result of this ordering rule, pre-enactment capital loss carryforwards may more likely expire unused. Also, post-enactment capital losses that are carried forward will retain their character as either short-term or long-term capital losses rather than being considered all short-term as under previous law.
The Fund intends to elect to defer net capital losses of $12,120 incurred from November 1, 2009 though September 30, 2010 and treat them as arising in the fiscal year ending September 30, 2011.
As of March 31, 2011, the tax basis components of unrealized appreciation/(depreciation) and the federal tax cost were as follows:
| Unrealized appreciation | $ | 6,366,369 | |
| Unrealized (depreciation) | | (713,467 | ) |
| Net unrealized appreciation/(depreciation) | $ | 5,652,902 | |
| Federal income tax cost of investments | $ | 40,539,967 | |
www.calvert.com CALVERT INTERNATIONAL OPPORTUNITIES FUND SEMI-ANNUAL REPORT (UNAUDITED) 27
NOTE D — LINE OF CREDIT
A financing agreement is in place with all Calvert Group Funds and State Street Corporation (“SSC”). Under the agreement, SSC provides an unsecured line of credit facility, in the aggregate amount of $50 million ($25 million committed and $25 million uncommitted), accessible by the Funds for temporary or emergency purposes only. Borrowings under the committed facility bear interest at the higher of the London Interbank Offered Rate, (LIBOR) or the overnight Federal Funds Rate plus 1.25% per annum. A commitment fee of .125% per annum is incurred on the unused portion of the committed facility, which is allocated to all participating funds. The Fund had no borrowings under the agreement during the six months ended March 31, 2011.
NOTE E – SUBSEQUENT EVENTS
In preparing the financial statements as of March 31, 2011, no subsequent events or transactions occurred that would have materially impacted the financial statements as presented.
Effective April 30, 2011, the Calvert operating companies will be renamed as follows: Calvert Group, Ltd. will be renamed Calvert Investments, Inc., Calvert Asset Management Company, Inc. will be renamed Calvert Investment Management, Inc., Calvert Distributors, Inc. will be renamed Calvert Investment Distributors, Inc., Calvert Administrative Services Company will be renamed Calvert Investment Administrative Services, Inc., and Calvert Shareholder Services, Inc. will be renamed Calvert Investment Services, Inc.
| www. | calvert.com CALVERT INTERNATIONAL OPPORTUNITIES FUND SEMI-ANNUAL REPORT (UNAUDITED) 28 |
| | | | | | | | | |
| FINANCIAL HIGHLIGHTS |
| |
| | | | | | Periods ended | | | | |
| | | MARCH
31, | | | SEPTEMBER 30, | | | SEPTEMBER 30, | |
| class A shares | | 2011 | (z) | | 2010 | (z) | | 2009 | (z) |
| Net asset value, beginning | $ | 12.43 | | $ | 11.40 | | $ | 11.50 | |
| Income from investment operations: | | | | | | | | | |
| Net investment income (loss) | | (.02 | ) | | .06 | | | .06 | |
| Net realized and unrealized gain (loss) | | .79 | | | .97 | | | (.10 | ) |
| Total from investment operations | | .77 | | | 1.03 | | | (.04 | ) |
| Distributions from: | | | | | | | | | |
| Net investment income | | (.03 | ) | | — | | | (.06 | ) |
| Net realized gain | | — | | | — | | | ** | |
| Total from distributions | | (.03 | ) | | — | | | (.06 | ) |
| Total increase (decrease) in net asset value | | .74 | | | 1.03 | | | (.10 | ) |
| Net asset value, ending | $ | 13.17 | | $ | 12.43 | | $ | 11.40 | |
| |
| Total return* | | 6.19 | % | | 9.04 | % | | (.16 | %) |
| Ratios to average net assets:A | | | | | | | | | |
| Net investment income (loss) | | (.28 | %) (a) | | .48 | % | | .63 | % |
| Total expenses | | 2.18 | % (a) | | 2.27 | % | | 2.70 | % |
| Expenses before offsets | | 1.66 | % (a) | | 1.66 | % | | 1.67 | % |
| Net expenses | | 1.66 | % (a) | | 1.66 | % | | 1.67 | % |
| Portfolio turnover | | 25 | % | | 44 | % | | 98 | % |
| Net assets, ending (in thousands) | $ | 39,488 | | $ | 30,062 | | $ | 21,328 | |
| |
| |
| | | | | | Periods ended | |
| | | | | | SEPTEMBER 30, | | | SEPTEMBER 30, | |
| class A shares | | | | | 2008 | (z) | | 2007 | # (z) |
| Net asset value, beginning | | | | $ | 15.32 | | $ | 15.00 | |
| Income from investment operations: | | | | | | | | | |
| Net investment income | | | | | .17 | | | .02 | |
| Net realized and unrealized gain (loss) | | | | | (3.99 | ) | | .30 | |
| Total from investment operations | | | | | (3.82 | ) | | .32 | |
| Total increase (decrease) in net asset value | | | | | (3.82 | ) | | .32 | |
| Net asset value, ending | | | | $ | 11.50 | | $ | 15.32 | |
| |
| Total return* | | | | | (24.93 | %) | | 2.13 | % |
| Ratios to average net assets:A | | | | | | | | | |
| Net investment income | | | | | 1.22 | % | | .50 | % (a) |
| Total expenses | | | | | 2.81 | % | | 7.82 | % (a) |
| Expenses before offsets | | | | | 1.68 | % | | 1.74 | % (a) |
| Net expenses | | | | | 1.66 | % | | 1.66 | % (a) |
| Portfolio turnover | | | | | 29 | % | | 2 | % |
| Net assets, ending (in thousands) | | | | $ | 16,710 | | $ | 5,678 | |
See notes to financial highlights.
www.calvert.com CALVERT INTERNATIONAL OPPORTUNITIES FUND SEMI-ANNUAL REPORT (UNAUDITED) 29
| | | | | | | | | |
| FINANCIAL HIGHLIGHTS |
| |
| | | | | | Periods ended | | | | |
| | | MARCH
31, | | | SEPTEMBER 30, | | | SEPTEMBER 30, | |
| class c shares | | 2011 | (z) | | 2010 | (z) | | 2009 | (z) |
| Net asset value, beginning | $ | 12.20 | | $ | 11.29 | | $ | 11.39 | |
| Income from investment operations: | | | | | | | | | |
| Net investment income (loss) | | (.07 | ) | | (.03 | ) | | (.02 | ) |
| Net realized and unrealized gain (loss) | | .77 | | | .94 | | | (.08 | ) |
| Total from investment operations | | .70 | | | .91 | | | (.10 | ) |
| Distributions from: | | | | | | | | | |
| Net realized gain | | — | | | — | | | ** | |
| Total from distributions | | — | | | — | | | ** | |
| Total increase (decrease) in net asset value | | .70 | | | .91 | | | (.10 | ) |
| Net asset value, ending | $ | 12.90 | | $ | 12.20 | | $ | 11.29 | |
| |
| Total return* | | 5.74 | % | | 8.06 | % | | (.82 | %) |
| Ratios to average net assets:A | | | | | | | | | |
| Net investment income (loss) | | (1.12 | %) (a) | | (.25 | %) | | (.19 | %) |
| Total expenses | | 3.48 | % (a) | | 3.88 | % | | 5.38 | % |
| Expenses before offsets | | 2.50 | % (a) | | 2.50 | % | | 2.51 | % |
| Net expenses | | 2.50 | % (a) | | 2.50 | % | | 2.51 | % |
| Portfolio turnover | | 25 | % | | 44 | % | | 98 | % |
| Net assets, ending (in thousands) | $ | 2,308 | | $ | 1,744 | | $ | 823 | |
| |
| |
| | | | | | Periods ended | |
| | | | | | SEPTEMBER 30, | | | SEPTEMBER 30, | |
| class c shares | | | | | 2008 | (z) | | 2007 | ##(z) |
| Net asset value, beginning | | | | $ | 15.30 | | $ | 14.74 | |
| Income from investment operations | | | | | | | | | |
| Net investment income | | | | | .09 | | | .01 | |
| Net realized and unrealized gain (loss) | | | | | (4.00 | ) | | .55 | |
| Total from investment operations | | | | | (3.91 | ) | | .56 | |
| Total increase (decrease) in net asset value | | | | | (3.91 | ) | | .56 | |
| Net asset value, ending | | | | $ | 11.39 | | $ | 15.30 | |
| |
| Total return* | | | | | (25.56 | %) | | 3.80 | % |
| Ratios to average net assets:A | | | | | | | | | |
| Net investment income | | | | | .67 | % | | 1.14 | % (a) |
| Total expenses | | | | | 7.55 | % | | 66.65 | % (a) |
| Expenses before offsets | | | | | 2.52 | % | | 2.58 | % (a) |
| Net expenses | | | | | 2.50 | % | | 2.50 | % (a) |
| Portfolio turnover | | | | | 29 | % | | 1 | % |
| Net assets, ending (in thousands) | | | | $ | 620 | | $ | 140 | |
See notes to financial highlights.
| www. | calvert.com CALVERT INTERNATIONAL OPPORTUNITIES FUND SEMI-ANNUAL REPORT (UNAUDITED) 30 |
| | | | | | | | | |
| FINANCIAL HIGHLIGHTS |
| |
| | | | | | Periods ended | | | | |
| | | MARCH
31, | | | SEPTEMBER 30, | | | SEPTEMBER 30, | |
| class I shares | | 2011 | (z) | | 2010 | (z) | | 2009 | (z) |
| Net asset value, beginning | $ | 12.17 | | $ | 11.32 | | $ | 11.58 | |
| Income from investment operations: | | | | | | | | | |
| Net investment income | | .01 | | | .10 | | | .09 | |
| Net realized and unrealized gain (loss) | | .77 | | | .95 | | | (.14 | ) |
| Total from investment operations | | .78 | | | 1.05 | | | (.05 | ) |
| Distributions from: | | | | | | | | | |
| Net investment income | | (.08 | ) | | (.20 | ) | | (.21 | ) |
| Net realized gain | | — | | | — | | | ** | |
| Total from distributions | | (.08 | ) | | (.20 | ) | | (.21 | ) |
| Total increase (decrease) in net asset value | | .70 | | | .85 | | | (.26 | ) |
| Net asset value, ending | $ | 12.87 | | $ | 12.17 | | $ | 11.32 | |
| |
| Total return* | | 6.44 | % | | 9.42 | % | | .26 | % |
| Ratios to average net assets:A | | | | | | | | | |
| Net investment income | | .14 | % (a) | | .90 | % | | 1.03 | % |
| Total expenses | | 1.53 | % (a) | | 1.73 | % | | 2.11 | % |
| Expenses before offsets | | 1.20 | % (a) | | 1.20 | % | | 1.21 | % |
| Net expenses | | 1.20 | %(a) | | 1.20 | % | | 1.21 | % |
| Portfolio turnover | | 25 | % | | 44 | % | | 98 | % |
| Net assets, ending (in thousands) | $ | 4,614 | | $ | 4,190 | | $ | 3,712 | |
| |
| |
| |
| | | | | | Periods ended | |
| | | | | | SEPTEMBER 30, | | | SEPTEMBER 30, | |
| class I shares | | | | | 2008 | (z) | | 2007 | #(z) |
| Net asset value, beginning | | | | $ | 15.35 | | $ | 15.00 | |
| Income from investment operations: | | | | | | | | | |
| Net investment income | | | | | .25 | | | .04 | |
| Net realized and unrealized gain (loss) | | | | | (4.02 | ) | | .31 | |
| Total from investment operations | | | | | (3.77 | ) | | .35 | |
| Total increase (decrease) in net asset value | | | | | (3.77 | ) | | .35 | |
| Net asset value, ending | | | | $ | 11.58 | | $ | 15.35 | |
| |
| Total return* | | | | | (24.56 | %) | | 2.33 | % |
| Ratios to average net assets:A | | | | | | | | | |
| Net investment income | | | | | 1.72 | % | | .78 | % (a) |
| Total expenses | | | | | 2.26 | % | | 7.47 | % (a) |
| Expenses before offsets | | | | | 1.22 | % | | 1.28 | % (a) |
| Net expenses | | | | | 1.20 | % | | 1.20 | % (a) |
| Portfolio turnover | | | | | 29 | % | | 2 | % |
| Net assets, ending (in thousands) | | | | $ | 3,533 | | $ | 3,075 | |
See notes to financial highlights.
www.calvert.com CALVERT INTERNATIONAL OPPORTUNITIES FUND SEMI-ANNUAL REPORT (UNAUDITED) 31
| | | | | | | | | |
| FINANCIAL HIGHLIGHTS |
| |
| | | | | | Periods ended | | | | |
| | | MARCH
31, | | | SEPTEMBER 30, | | | SEPTEMBER 30, | |
| class Y shares | | 2011 | (z) | | 2010 | (z) | | 2009 | ###(z) |
| Net asset value, beginning | $ | 11.72 | | $ | 11.50 | | $ | 8.67 | |
| Income from investment operations: | | | | | | | | | |
| Net investment income (loss) | | *** | | | .10 | | | .13 | |
| Net realized and unrealized gain (loss) | | .74 | | | .90 | | | 2.70 | |
| Total from investment operations | | .74 | | | 1.00 | | | 2.83 | |
| Distributions from: | | | | | | | | | |
| Net investment income | | (.02 | ) | | (.78 | ) | | — | |
| Net realized gain | | — | | | — | | | ** | |
| Total from distributions | | (.02 | ) | | (.78 | ) | | ** | |
| Total increase (decrease) in net asset value | | .72 | | | .22 | | | 2.83 | |
| Net asset value, ending | $ | 12.44 | | $ | 11.72 | | $ | 11.50 | |
| |
| Total return* | | 6.33 | % | | 9.18 | % | | 32.71 | % |
| Ratios to average net assets:A | | | | | | | | | |
| Net investment income | | (.002 | %) (a) | | .96 | % | | 1.56 | % (a) |
| Total expenses | | 2.94 | % (a) | | 4.73 | % | | 21.67 | % (a) |
| Expenses before offsets | | 1.41 | % (a) | | 1.41 | % | | 1.42 | % (a) |
| Net expenses | | 1.41 | % (a) | | 1.41 | % | | 1.41 | % (a) |
| Portfolio turnover | | 25 | % | | 44 | % | | 90 | % |
| Net assets, ending (in thousands) | $ | 1,341 | | $ | 944 | | $ | 112 | |
| A | Total expenses do not reflect amounts reimbursed and/or waived by the Advisor or reductions from expense off set arrangements. Expenses before offsets reflect expenses after reimbursement and/or waiver by the Advisor but prior to reductions from expense offset arrangements. Net expenses are net of all reductions and represent the net expenses paid by the Fund. |
| # | From May 31, 2007 inception. |
| ## | From July 31, 2007 inception. |
| ### | From October 31, 2008 inception. |
| * | Total return is not annualized for periods less than one year and does not reflect deduction of any front- end or deferred sales charge. |
| ** | Less than $0.01 per share. |
| *** | Net investment loss equals $.0001 per share. |
| (a) | Annualized. |
| (z) | Per share figures are calculated using the Average Shares Method. |
See notes to financial statements.
www.calvert.com CALVERT INTERNATIONAL OPPORTUNITIES FUND SEMI-ANNUAL REPORT (UNAUDITED) 32
EXPLANATION OF FINANCIAL TABLES
SCHEDULE OF INVESTMENTS
The Schedule of Investments is a snapshot of all securities held in the fund at their market value, on the last day of the reporting period. Securities are listed by asset type (e.g., common stock, corporate bonds, U.S. government obligations) and may be further broken down into sub-groups and by industry classification.
STATEMENT OF ASSETS AND LIABILITIES
The Statement of Assets and Liabilities is often referred to as the fund’s balance sheet. It lists the value of what the fund owns, is due and owes on the last day of the reporting period. The fund’s assets include the market value of securities owned, cash, receivables for securities sold and shareholder subscriptions, and receivables for dividends and interest payments that have been earned, but not yet received. The fund’s liabilities include payables for securities purchased and shareholder redemptions, and expenses owed but not yet paid. The statement also reports the fund’s net asset value (NAV) per share on the last day of the reporting period. The NAV is calculated by dividing the fund’s net assets (assets minus liabilities) by the number of shares outstanding. This statement is accompanied by a Schedule of Investments. Alternatively, if certain conditions are met, a Statement of Net Assets may be presented in lieu of this statement and the Schedule of Investments.
STATEMENT OF NET ASSETS
The Statement of Net Assets provides a detailed list of the fund’s holdings, including each security’s market value on the last day of the reporting period. The Statement of Net Assets includes a Schedule of Investments. Other assets are added and other liabilities subtracted from the investments total to calculate the fund’s net assets. Finally, net assets are divided by the outstanding shares of the fund to arrive at its share price, or Net Asset Value (NAV) per share.
At the end of the Statement of Net Assets is a table displaying the composition of the fund’s net assets. Paid in Capital is the money invested by shareholders and represents the bulk of net assets. Undistributed Net Investment Income and Accumulated Net Realized Gains usually approximate the amounts the fund had available to distribute to shareholders as of the statement date. Accumulated Realized Losses will appear as negative balances. Unrealized Appreciation (Depreciation) is the difference between the market value of the fund’s investments and their cost, and reflects the gains (losses) that would be realized if the fund were to sell all of its investments at their statement-date values.
STATEMENT OF OPERATIONS
The Statement of Operations summarizes the fund’s investment income earned and expenses incurred in operating the fund. Investment income includes dividends earned from stocks and interest earned from interest-bearing securities in the fund. Expenses incurred in operating the fund include the advisory fee paid to the investment advisor, administrative services fees, distribution plan expenses (if applicable), transfer agent fees,
www.calvert.com CALVERT INTERNATIONAL OPPORTUNITIES FUND SEMI-ANNUAL REPORT (UNAUDITED) 33
shareholder servicing expenses, custodial, legal, and audit fees, and the printing and postage expenses related to shareholder reports. Expense offsets (fees paid indirectly) are also shown. Credits earned from offset arrangements are used to reduce the fund’s expenses. This statement also shows net gains (losses) realized on the sale of investments and the increase or decrease in the unrealized appreciation (depreciation) on investments held during the period.
STATEMENT OF CHANGES IN NET ASSETS
The Statement of Changes in Net Assets shows how the fund’s total net assets changed during the two most recent reporting periods. Changes in the fund’s net assets are attributable to investment operations, distributions and capital share transactions.
The Operations section of the report summarizes information detailed in the Statement of Operations. The Distribution section shows the dividend and capital gain distributions made to shareholders. The amounts shown as distributions in this section may not match the net investment income and realized gains amounts shown in the Operations section because distributions are determined on a tax basis and certain investments or transactions may be treated differently for financial statement and tax purposes. The Capital Share Transactions section shows the amount shareholders invested in the fund, either by purchasing shares or by reinvesting distributions, and the amounts redeemed. The corresponding numbers of shares issued, reinvested and redeemed are shown at the end of the report.
FINANCIAL HIGHLIGHTS
The Financial Highlights table provides a per-share breakdown per class of the components that affect the fund’s net asset value for current and past reporting periods. The table provides total return, total distributions, expense ratios, portfolio turnover and net assets for the applicable period. Total return is a measure of a fund’s performance that encompasses all elements of return: dividends, capital gain distributions and changes in net asset value. Total return is the change in value of an investment over a given period, assuming reinvestment of any dividends and capital gain distributions, expressed as a percentage of the initial investment. Total distributions include distributions from net investment income and net realized gains. Long-term gains are earned on securities held in the fund more than one year. Short-term gains, on the sale of securities held less than one year, are treated as ordinary dividend income for tax purposes. The expense ratio is a fund’s cost of doing business, expressed as a percentage of net assets. These expenses directly reduce returns to shareholders. Portfolio turnover measures the trading activity in a fund’s investment portfolio – how often securities are bought and sold by a fund. Portfolio turnover is affected by market conditions, changes in the size of the fund, the nature of the fund’s investments and the investment style of the portfolio manager.
www.calvert.com CALVERT INTERNATIONAL OPPORTUNITIES FUND SEMI-ANNUAL REPORT (UNAUDITED) 34
PROXY VOTING
The Proxy Voting Guidelines of the Calvert Funds that the Fund uses to determine how to vote proxies relating to portfolio securities are provided as an Appendix to the Fund’s Statement of Additional Information. The Statement of Additional Information can be obtained free of charge by calling the Fund at 1-800-368-2745, by visiting the Calvert website at www.calvert.com; or by visiting the SEC’s website at www.sec.gov.
Information regarding how the Fund voted proxies relating to portfolio securities during the most recent 12-month period ended June 30 is available on the Fund’s website at www.calvert.com and on the SEC’s website at www.sec.gov.
AVAILABILITY OF QUARTERLY PORTFOLIO HOLDINGS
The Fund files its complete schedule of portfolio holdings with the SEC for the first and third quarters of each fiscal year on Form N-Q. The Fund’s Form N-Q is available on the SEC’s website at www.sec.gov. The Fund’s Form N-Q may be reviewed and copied at the SEC’s Public Reference Room in Washington, DC; information on the operation of the Public Reference Room may be obtained by calling 1-800-SEC-0330.
BASIS FOR BOARD’S APPROVAL OF INVESTMENT ADVISORY CONTRACTS
At a meeting held on December 7, 2010, the Board of Directors, and by a separate vote, the disinterested Directors, approved the continuance of the Investment Advisory Agreement between Calvert World Values Fund, Inc. and the Advisor and the Investment Subadvisory Agreement between the Advisor and the Subadvisor with respect to the Fund.
In evaluating the Investment Advisory Agreement, the Board considered a variety of information relating to the Fund and the Advisor. The disinterested Directors reviewed a report prepared by the Advisor regarding various services provided to the Fund by the Advisor and its affiliates. Such report included, among other data, information regarding the Advisor’s personnel and the Advisor’s revenue and cost of providing services to the Fund, and a separate report prepared by an independent third party, which provided a statistical analysis comparing the Fund ‘s investment performance, expenses, and fees to comparable mutual funds.
The disinterested Directors were separately represented by independent legal counsel with respect to their consideration of the reapproval of the Investment Advisory Agreement and Investment Subadvisory Agreement. Prior to voting, the disinterested
www.calvert.com CALVERT INTERNATIONAL OPPORTUNITIES FUND SEMI-ANNUAL REPORT (UNAUDITED) 35
Directors reviewed the proposed continuance of the Investment Advisory Agreement and Investment Subadvisory Agreement with management and also met in private sessions with their counsel at which no representatives of management were present.
In the course of its deliberations regarding the Investment Advisory Agreement, the Board considered the following factors, among others: the nature, extent and quality of the services provided by the Advisor, including the personnel providing such services; the Advisor’s financial condition; the level and method of computing the Fund’s advisory fee; comparative performance, fee and expense information for the Fund; the profitability of the Calvert Group of Funds to the Advisor and its affiliates; the allocation of the Fund’s brokerage, including the Advisor’s process for monitoring “best execution”; the direct and indirect benefits, if any, derived by the Advisor and its affiliates from their relationship with the Fund; the effect of the Fund’s growth and size on the Fund’s performance and expenses; the affiliated distributor’s process for monitoring sales load breakpoints; the Advisor’s compliance programs and policies; the Advisor’s performance of substantially similar duties for other funds; and any possible conflicts of interest.
In considering the nature, extent and quality of the services provided by the Advisor under the Investment Advisory Agreement, the Board reviewed information provided by the Advisor relating to its operations and personnel, including, among other information, biographical information on the Advisor’s supervisory and professional staff and descriptions of its organizational and management structure. The Board also took into account similar information provided periodically throughout the previous year by the Advisor as well as the Board’s familiarity with the Advisor’s senior management through Board of Directors’ meetings, discussions and other reports. The Advisor’s administrative capabilities, including its ability to supervise the other service providers for the Fund, were also considered. The Board also took into account the environmental, social, sustainability and governance research and analysis provided by the Advisor to the Fund. The Board discussed the Advisor’s effectiveness in monitoring the performance of the Subadvisor and its timeliness in responding to performance issues. The Board concluded that it was satisfied with the nature, extent and quality of services provided to the Fund by the Advisor under the Investment Advisory Agreement.
In considering the Fund’s performance, the Board noted that it reviewed on a quarterly basis detailed information about the Fund’s performance results, portfolio composition and investment strategies. In addition, the Board took into account overall financial market conditions. The Board also reviewed various comparative data provided to it in connection with its consideration of the renewal of the Investment Advisory Agreement, including, among other information, a comparison of the Fund’s total return with its Lipper index and with that of other mutual funds deemed to be in its peer group by an independent third party in its report. This comparison indicates that the Fund performed below the median of its peer universe for the one-year period ended June 30, 2010 and above the median of its peer universe for the three-year period ended June 30, 2010. The data also indicated that the Fund underperformed its Lipper index for the one-year period ended June 30, 2010 and outperformed its Lipper index for the three-year period ended June 30, 2010. The Board took into account management’s discussion of the Fund’s performance and management’s continued monitoring of the Fund’s performance. Based upon its review, the Board concluded that appropriate action was being
www.calvert.com CALVERT INTERNATIONAL OPPORTUNITIES FUND SEMI-ANNUAL REPORT (UNAUDITED) 36
taken with respect to the Fund’s performance.
In considering the Fund’s fees and expenses, the Board compared the Fund’s fees and total expense ratio with various comparative data for the funds in its peer group. Among other findings, the data indicated that the Fund’s advisory fee (after taking into account waivers and/or reimbursements) was below the median of its peer group and that total expenses (net of waivers and/or reimbursements) were above the median of its peer group. The Board noted that the allocation of advisory and administrative fees may vary among the Fund’s peer group. The Board also noted management’s discussion of the Fund’s expenses and certain factors that affected the level of such expenses, including the cost of providing the environmental, social, sustainability and governance research and analysis provided by the Advisor. Based upon its review, the Board concluded that the advisory fee was reasonable in view of the quality of services provided by the Advisor and the other factors considered.
The Board reviewed the Advisor’s profitability on a fund-by-fund basis. In reviewing the overall profitability of the advisory fee to the Fund’s Advisor, the Board also considered the fact that affiliates of the Advisor provided shareholder servicing and administrative services to the Fund for which they received compensation. The information considered by the Board included Calvert’s operating profit margin information both before and after tax expenses with respect to the services that the Advisor and its affiliates provided to the Calvert Group of Funds complex. The Board reviewed the profitability of the Advisor’s relationship with the Fund in terms of the total amount of annual advisory fees it received with respect to the Fund and whether the Advisor had the financial wherewithal to continue to provide a high level of services to the Fund. The Board noted that the Advisor had reimbursed expenses of the Fund The Board also noted the Advisor’s current undertaking to maintain expense limitations for the Fund. The Board also considered that the Advisor derived benefits to its reputation and other indirect benefits from its relationship with the Fund. The Board also noted that the Advisor paid the subadvisory fee to the Subadvisor. Based upon its review, the Board concluded that the Advisor’s and its affiliates’ level of profitability from their relationship with the Fund was reasonable.
The Board considered the effect of the Fund’s current size and potential growth on its performance and fees. The Board concluded that adding breakpoints to the advisory fee at specified asset levels would not be appropriate at this time given the Fund’s current size. The Board noted that if the Fund’s assets increased over time, the Fund might realize other economies of scale if assets increased proportionally more than certain other expenses.
In reapproving the Investment Advisory Agreement, the Board, including the disinterested Directors, did not identify any single factor as controlling, and each Director may have attributed different weight to various factors.
In evaluating the Investment Subadvisory Agreement, the disinterested Directors reviewed information provided by the Subadvisor relating to its operations, personnel, investment philosophy, strategies and techniques. Among other information, the Subadvisor provided biographical information on portfolio management and other professional staff, performance information for itself, and descriptions of its investment philosophies, strategies and techniques, organizational and management structures and brokerage policies
www.calvert.com CALVERT INTERNATIONAL OPPORTUNITIES FUND SEMI-ANNUAL REPORT (UNAUDITED) 37
and practices.
The Board reapproved the Investment Subadvisory Agreement between the Advisor and the Subadvisor based on a number of factors relating to the Subadvisor’s ability to perform under the Investment Subadvisory Agreement. In the course of its deliberations, the Board evaluated, among other factors: the nature, extent and the quality of the services to be provided by the Subadvisor; the Subadvisor’s management style and long-term performance record; the Fund’s performance record and the Subadvisor’s performance in employing its investment strategies; the Subadvisor’s current level of staffing and its overall resources; the qualifications and experience of the Subadvisor’s personnel; the Subadvisor’s financial condition with respect to its ability to perform the services required under the Investment Subadvisory Agreement; the Subadvisor’s compliance systems, including those related to personal investing; and any disciplinary history. Based upon its review, the Board concluded that it was satisfied with the nature, extent and quality of services provided to the Fund by the Subadvisor under the Investment Subadvisory Agreement.
As noted above, the Board considered, among other information, the Fund’s performance during the one- and three-year periods ended June 30, 2010 as compared to the Fund’s peer universe and noted that it reviewed on a quarterly basis detailed information about the Fund’s performance results, portfolio composition and investment strategies. The Board noted the Advisor’s expertise and resources in monitoring the performance, investment style and risk-adjusted performance of the Subadvisor.
In considering the cost of services to be provided by the Subadvisor and the profitability to the Subadvisor of its relationship with the Fund, the Board noted that the subadvisory fee under the Investment Subadvisory Agreement was paid by the Advisor out of the advisory fee that the Advisor received under the Investment Advisory Agreement. The Board also relied on the ability of the Advisor to negotiate the Investment Subadvisory Agreement and the corresponding subadvisory fee at arm’s length. In addition, the Board took into account the fees the Subadvisor charged to its other clients and considered these fee comparisons in light of differences in managing these other accounts. Based upon its review, the Board determined that the subadvisory fee was reasonable. Because the Advisor pays the Subadvisor’s subadvisory fee and the subadvisory fee was negotiated at arm’s length by the Advisor, the cost of services to be provided by the Subadvisor and the profitability to the Subadvisor of its relationship with the Fund were not material factors in the Board’s deliberations. For similar reasons, the Board did not consider the potential economies of scale in the Subadvisor’s management of the Fund to be a material factor in its consideration, although the Board noted that the subadvisory fee schedule for the Fund contained breakpoints that reduced the subadvisory fee rate on assets above specified levels.
In reapproving the Investment Subadvisory Agreement, the Board, including the disinterested Directors, did not identify any single factor as controlling, and each Director may have attributed different weights to various factors.
www.calvert.com CALVERT INTERNATIONAL OPPORTUNITIES FUND SEMI-ANNUAL REPORT (UNAUDITED) 38
CONCLUSIONS
The Board reached the following conclusions regarding the Investment Advisory Agreement and the Investment Subadvisory Agreement, among others: (a) the Advisor has demonstrated that it possessed the capability and resources to perform the duties required of it under the Investment Advisory Agreement; (b) the Subadvisor is qualified to manage the Fund’s assets in accordance with the Fund’s investment objectives and policies; (c) the Advisor and Subadvisor maintain appropriate compliance programs; (d) the Subadvisor is likely to execute its investment strategies consistently over time; (e) appropriate action is being taken with respect to the performance of the Fund; and (f) the Fund’s advisory and subadvisory fees are reasonable relative to those of similar funds and to the services to be provided by the Advisor and the Subadvisor. Based on its conclusions, the Board determined that reapproval of the Investment Advisory Agreement and the Investment Subadvisory Agreement would be in the best interests of the Fund and its shareholders.
www.calvert.com CALVERT INTERNATIONAL OPPORTUNITIES FUND SEMI-ANNUAL REPORT (UNAUDITED) 39
To Open an Account
800-368-2748
Yields and Prices
Calvert Information Network
(24 hours, 7 days a week)
800-368-2745
Service for Existing Account
Shareholders: 800-368-2745
Brokers: 800-368-2746
TDD for Hearing Impaired
800-541-1524
Branch Office
4550 Montgomery Avenue
Suite 1000 North
Bethesda, Maryland 20814
Registered, Certified or Overnight Mail
Calvert Investments
c/o BFDS,
330 West 9th Street
Kansas City, MO 64105
Web Site
www.calvert.com
Principal Underwriter
Calvert Investment Distributors, Inc.
4550 Montgomery Avenue
Suite 1000 North
Bethesda, Maryland 20814
| | |
| CALVERT | CALVERT’S | Equity Funds |
| INTERNATIONAL | FAMILY OF FUNDS | Enhanced Equity Portfolio |
| OPPORTUNITIES | | Equity Portfolio |
| FUND | Tax-Exempt Money | Large Cap Growth Fund |
| | Market Funds | Large Cap Value Fund |
| | CTFR Money Market Portfolio | Social Index Fund |
| | | Capital Accumulation Fund |
| | Taxable Money Market | International Equity Fund |
| | Funds | Small Cap Fund |
| | First Government Money Market | Global Alternative Energy Fund |
| | Fund | Global Water Fund |
| | Money Market Portfolio | International Opportunities Fund |
| |
| | Municipal Funds | Balanced and Asset |
| | Tax-Free Bond Fund | Allocation Funds |
| | | Balanced Portfolio |
| | Taxable Bond Funds | Conservative Allocation Fund |
| | Bond Portfolio | Moderate Allocation Fund |
| | Income Fund | Aggressive Allocation Fund |
| | Short Duration Income Fund | |
| | Long-Term Income Fund | |
| | Ultra-Short Income Fund | |
| | Government Fund | |
| | High-Yield Bond Fund | |
This report is intended to provide fund information to shareholders. It is not authorized for distribution to prospective investors unless preceded or accompanied by a prospectus.
Note: The information on our website is not incorporated by reference into this report; our website address is included as an inactive textual reference only.
Investors should carefully consider the investment objectives, risks, charges and expenses of the Calvert Funds. This and other important information is contained in the fund’s summary prospectus and prospectus, which can be obtained from your financial professional and should be read carefully before investing. You may also call Calvert at 800/368-2745 or visit www. calvert.com.
Item 2. Code of Ethics.
Not applicable.
Item 3. Audit Committee Financial Expert.
Not applicable.
Item 4. Principal Accountant Fees and Services.
Not applicable.
Item 5. Audit Committee of Listed Registrants.
Not applicable.
Item 6. Schedule of Investments.
(a) This Schedule is included as part of the report to shareholders filed under Item 1 of this Form.
(b) Not applicable.
Item 7. Disclosure of Proxy Voting Policies and Procedures for Closed-End Management Investment Companies.
Not applicable.
Item 8. Portfolio Managers of Closed-End Management Investment Companies.
Not applicable.
Item 9. Purchases of Equity Securities by Closed-End Management Investment Company and Affiliated Purchasers.
Not applicable.
Item 10. Submission of Matters to a Vote of Security Holders.
No material changes to the procedures by which shareholders may recommend nominees to the registrant’s Board of Directors since registrant last provided disclosure in response to this Item.
Item 11. Controls and Procedures.
(a) The principal executive and financial officers concluded that the registrant's disclosure controls and procedures (as defined in Rule 30a-3(c) under the 1940 Act) are effective, based on the evaluation of these controls and procedures required by Rule 30a-3(b) under the 1940 Act and Rules 13a-15(b) or 15d-15(b) under the Exchange Act, as of a date within 90 days of the filing date of this report.
(b) There was no change in the registrant's internal control over financial reporting (as defined in Rule 30a-3(d) under the 1940 Act) that occurred during the registrant's second fiscal quarter of the period covered by this report that has materially affected, or is reasonably likely to materially affect, the registrant's internal control over financial reporting.
Item 12. Exhibits.
(a)(1) Not applicable.
(a)(2) A separate certification for each principal executive officer and principal financial officer of the registrant as required by Rule 30a-2 under the Act (17 CFR 270.30a-2).
Attached hereto.
(a)(3) Not applicable.
(b) A certification for the registrant's Principal Executive Officer and Principal Financial Officer, as required by Rule 30a-2(b) under the Investment Company Act of 1940, is attached hereto. The certification furnished pursuant to this paragraph is not deemed to be "filed" for purposes of Section 18 of the Securities Exchange Act of 1934, or otherwise subject to the liability of that section. Such certification is not deemed to be incorporated by reference into any filing under the Securities Act of 1933 or the Securities Exchange Act of 1934, except to the extent that the registrant specifically incorporates it by reference.
Pursuant to the requirements of the Securities Exchange Act of 1934 and the Investment Act of 1940, the registrant has duly caused this report to be signed on its behalf by the undersigned, thereunto duly authorized.
CALVERT WORLD VALUES FUND, INC.
By: /s/ Barbara J. Krumsiek
Barbara J. Krumsiek
President -- Principal Executive Officer
Date: June 2, 2011
Pursuant to the requirements of the Securities Exchange Act of 1934 and the Investment Act of 1940, this report has been signed below by the following persons on behalf of the registrant and in the capacities and on the dates indicated.
/s/ Barbara J. Krumsiek
Barbara J. Krumsiek
President -- Principal Executive Officer
Date: June 2, 2011
/s/ Ronald M. Wolfsheimer
Ronald M. Wolfsheimer
Treasurer -- Principal Financial Officer
Date: June 2, 2011