UNITED STATES
SECURITIES AND EXCHANGE COMMISSION
Washington, D.C. 20549
FORM N-CSR
CERTIFIED SHAREHOLDER REPORT OF REGISTERED
MANAGEMENT INVESTMENT COMPANIES
Investment Company Act file number: 811-6563
CALVERT WORLD VALUES FUND, INC.
(Exact name of registrant as specified in charter)
4550 Montgomery Avenue
Suite 1000N
Bethesda, Maryland 20814
(Address of Principal Executive Offices)
Ivy Wafford Duke, Esq.
4550 Montgomery Avenue
Suite 1000N
Bethesda, Maryland 20814
(Name and Address of Agent for Service)
Registrant's telephone number, including area code: (301) 951-4800
Date of fiscal year end: September 30
Date of reporting period: Six months ended March 31, 2015
Item 1. Report to Stockholders.
[Calvert International Equity Fund Semi-Annual Report to Shareholders]
and
[Calvert Capital Accumulation Fund Semi-Annual Report to Shareholders]
and
[Calvert International Opportunities Fund Semi-Annual Report to Shareholders]
and
[Calvert Emerging Markets Equity Fund Semi-Annual Report to Shareholders]
|
| | |
| | |
| | | |
| Calvert International Equity Fund | | |
| | | |
| | |
|
| |
Semi-Annual Report March 31, 2015
E-Delivery Sign-Up — Details Inside | |
Choose Planet-friendly E-delivery!
Sign up now for on-line statements, prospectuses, and fund reports. In less than five minutes you can help reduce paper mail and lower fund costs.
Just go to www.calvert.com. If you already have an online account at Calvert, click on Login, to access your Account, and select the documents you would like to receive via e-mail.
If you’re new to online account access, click on Login, then Register to create your user name and password. Once you’re in, click on the E-delivery sign-up on the Account Portfolio page and follow the quick, easy steps.
Note: if your shares are not held directly at Calvert but through a brokerage firm, you must contact your broker for electronic delivery options available through their firm.
|
| | | |
| TABLE OF CONTENTS |
| | | | |
| | | | President's Letter |
| | | | Portfolio Management Discussion |
| | | | Shareholder Advocacy Update |
| | | | Shareholder Expense Example |
| | | | Statement of Net Assets |
| | | | Statement of Operations |
| | | | Statements of Changes in Net Assets |
| | | | Notes to Financial Statements |
| | | | Financial Highlights |
| | | | Explanation of Financial Tables |
| | | | Proxy Voting |
| | | | Availability of Quarterly Portfolio Holdings |
| | | | Basis for Board’s Approval of Investment Advisory Contracts |
|
| |
| John Streur President and Chief Executive Officer, Calvert Investments, Inc. |
Dear Calvert Shareowner,
The United States economy improved throughout 2014 and into the first quarter of 2015, while major economies in other regions of the world struggled to regain momentum or saw slowing growth. It is still too early to declare victory, but one may say that while the United States led the world into financial crisis nearly eight years ago, the innovative and aggressive responses to the crisis by our policymakers are allowing the United States to recover more quickly. Granted, the United States has the benefit of possessing the world’s reserve currency and our monetary maneuvers in our self-interest are not without cost to economies in other regions.
As 2014 drew to a close, the United States was winding down the quantitative easing portion of its post-crisis monetary policy while the European and Japanese central banks were finding it necessary to increase their own forms of quantitative easing in efforts to support asset prices and spur economic growth.
The impact of modestly improving economic activity in the U.S. and ongoing low global interest rates on financial assets in 2014 created positive returns for most stocks and bonds for the previous 12 months, a condition that gave benefit to most Calvert Funds. The exceptions are assets tied to the price of oil, which collapsed during the second half of the year. Energy industries and natural resource based companies, including renewable energy companies and water related companies, saw their stock valuations drop in reaction.
Across our fixed income and equity strategies, Calvert finds more utility in conducting fundamental research in order to find relative values in securities of individual companies than we do in attempting to anticipate or time changes in global economic indicators. Broadly, we are mindful of the fact that stocks and bonds have benefitted substantially from the easy monetary policies and ultra-low interest rates of the post-crisis era. We believe markets are more or less fairly valued and we have taken steps seeking to moderate the risk across our portfolios.
As I take the helm at Calvert and look back at the 39 years since the firm’s founding in 1976, I note the substantial growth in the world’s population, the massive increase in the industrialization of our global society, and the associated change in the role of corporations in societal and environmental outcomes for our future.
4 www.calvert.com CALVERT INTERNATIONAL EQUITY FUND SEMI-ANNUAL REPORT (UNAUDITED)
Public companies have created tremendous net benefits to society through advances in health care, food systems, energy efficiency, communications and technology, and access to finance and other products and services too vast to detail. Hundreds of millions of people throughout the world have seen their standard of living increased through benefits created by corporate activity.
Along with the obvious net benefits to society, we are aware of the substantial stresses placed upon society and the environment from corporate behaviors. At the same time, society has awarded corporations an increasingly prominent role in the day-to-day outcomes of our lives and in the societal and environmental outcomes that will determine the future direction of the world.
Calvert, as a global investment management firm and a steward of client assets, has a growing and evolving role as a leader in responsible investing. Calvert has a rich history as a socially responsible investor and has made many contributions to public policy and corporate governance. Today we are bringing Calvert’s deep expertise in socially responsible investing, public and private policy work, and investment management to a new level with a focus on developing principles and setting standards for use in our investment management processes, our active ownership and engagement discipline and within our investment risk management processes.
As a long-term investor with unique insights into environmental, social, and governance activities of companies throughout the world, Calvert is able to develop a holistic view of companies’ operations. Our ability to use our insights for the benefit of the stewardship of client assets, both to produce desirable investment outcomes for our clients and to assist companies in evolving their role in society along a responsible path has never been more important.
As fellow shareowners of Calvert Funds, you and I know that it is essential to pursue the type of enduring value that Calvert seeks to create, through excellence in financial results balanced with the evolving needs of society and the environment.
Thank you for your share ownership in Calvert Funds; all of us at Calvert Investments, Inc. appreciate the confidence and trust you have placed in us.
John Streur
April 2015
www.calvert.com CALVERT INTERNATIONAL EQUITY FUND SEMI-ANNUAL REPORT (UNAUDITED) 5
|
| |
| PORTFOLIO MANAGEMENT DISCUSSION |
|
| |
| Natalie A. Trunow Senior Vice President and Chief Investment Officer, Equities |
Equity market returns over the six-month reporting period largely reflected macroeconomic trends, with solid gains for U.S. stocks relative to international equity markets. Improving economic conditions in the United States remained in stark contrast to the sluggish growth outlook in much of the rest of the world, particularly in Europe. However, U.S. equity markets faced several headwinds at the start of 2015 as another harsh winter weighed on economic activity and the stronger dollar contributed to negative earnings revisions for companies deriving larger portions of their earnings from overseas. International equity markets underperformed for the period, but recouped some of their losses in the first quarter of 2015 as central banks in Europe and Japan maintained quantitative-easing programs and emerging markets were buoyed by stimulus announcements from China.
For the six-month period ended March 31, 2015, the Standard and Poor’s (S&P) 500, Russell 1000, Russell 2000, MSCI EAFE, and MSCI Emerging Markets Indices returned 5.93%, 6.55%, 14.46%, 1.29%, and -2.26%, respectively.
From an investment-style perspective, growth stocks outperformed value stocks, and domestic small-cap stocks, which have less exposure to foreign markets and are less dependent on global growth, outperformed their large-cap counterparts. Looking at sector performance, Health Care, Consumer Discretionary, and Consumer Staples were the top-performing sectors within the Russell 1000 Index during the period, while the Energy, Telecommunication Services, and Materials sectors lagged.
U.S. Economic Recovery Hits Soft Patch, but Outpaces Rest of Developed World
The U.S. economy continued to outperform other developed countries, with U.S. gross domestic product (GDP) growing at a 2.2% annualized rate in the fourth quarter of 2014. More recent U.S. macroeconomic data has been weaker, however, with the slowdown largely attributed to poor weather and the strength of the dollar. A labor dispute between West Coast ports and dockworkers also resulted in a modest drag on economic activity. The U.S. ISM Manufacturing Purchasing Manufacturers Index (PMI)1 ended the period at 51.5, firmly in expansion territory, but has declined for five consecutive months. Housing activity, while remaining on an upward trend, has been disappointing of late.
Although the most recent jobs report for March was less than stellar, the job market has continued to improve, adding an average of 260,000 jobs per month over the last year. This helped push the unemployment rate down to 5.5% from 6.6% this time a year ago, though this has been aided by a drop in the labor-force participation rate. Wage growth is taking longer to materialize than in past recoveries, but recent data has been encouraging, showing modest gains in average hourly earnings and the Employment Cost Index.
6 www.calvert.com CALVERT INTERNATIONAL EQUITY FUND SEMI-ANNUAL REPORT (UNAUDITED)
|
| | | | |
| | | | |
| | CALVERT INTERNATIONAL EQUITY FUND |
| | MARCH 31, 2015 | |
| | | | |
| | ECONOMIC SECTORS | % OF TOTAL INVESTMENTS | |
| | Consumer Discretionary | 15.0 | % | |
| | Consumer Staples | 7.4 | % | |
| | Energy | 4.6 | % | |
| | Financials | 24.4 | % | |
| | Health Care | 14.4 | % | |
| | Industrials | 7.8 | % | |
| | Information Technology | 3.1 | % | |
| | Limited Partnership Interest | 0.4 | % | |
| | Materials | 4.1 | % | |
| | Short-Term Investments | 8.6 | % | |
| | Telecommunication Services | 7.0 | % | |
| | Utilities | 2.9 | % | |
| | Venture Capital | 0.3 | % | |
| | Total | 100 | % | |
| | | | |
Consumer confidence reached a nine-year high during the reporting period, due in part to lower gasoline prices, which should lead to a pick-up in consumer spending and housing activity over the remainder of the year.
Decline in Oil Prices a Positive for U.S. Economy Overall
The price of crude oil fell nearly 50% over the six-month reporting period. Weakening demand due to slowing global growth and a strategic decision by Saudi Arabia, the world’s largest oil producer, to not cut oil production in the face of increased U.S. supplies, were key drivers of the dramatic price decline.
Some economies and sectors stand to benefit from the significant price decline in oil while others will undoubtedly continue to come under pressure. Countries which import a large portion of their energy are the clear winners, with the United States, Europe, Japan, and China benefiting.
|
| | | | | | |
| | | | | |
| | CALVERT INTERNATIONAL EQUITY FUND | |
| | MARCH 31, 2015 | |
| | | | | |
| | INVESTMENT PERFORMANCE | |
| | (TOTAL RETURN AT NAV*) | |
| | | 6 MONTHS ENDED 3/31/15 | 12 MONTHS ENDED 3/31/15
| |
| | Class A | 1.56 | % | -2.06 | % | |
| | Class B | 0.90 | % | -3.38 | % | |
| | Class C | 1.12 | % | -2.96 | % | |
| | Class I | 1.91 | % | -1.43 | % | |
| | Class Y | 1.72 | % | -1.72 | % | |
| | | | | |
| | MSCI EAFE Investable Market Index (IMI) | 1.54 | % | -0.74 | % | |
| | | | | |
| | Lipper International Multi-Cap Growth Funds Average | 2.40 | % | -0.17 | % | |
| | | | | |
| | TEN LARGEST STOCK HOLDINGS | % OF NET ASSETS | |
| | Statoil ASA (ADR) | 2.8 | % | |
| | Sanofi SA (ADR) | 2.8 | % | |
| | Toyota Motor Corp. | 2.5 | % | |
| | Unilever NV (CVA) | 2.1 | % | |
| | Novartis AG (ADR) | 2.0 | % | |
| | Roche Holding AG | 2.0 | % | |
| | AIA Group Ltd. | 1.9 | % | |
| | Allianz SE (ADR) | 1.7 | % | |
| | Prudential plc | 1.6 | % | |
| | Astellas Pharma, Inc. | 1.5 | % | |
| | Total | 20.9 | % | |
| | | |
| | * Investment performance/return at NAV does not reflect the deduction of the Fund’s maximum 4.75% front-end sales charge or any deferred sales charge. | |
| | | | | |
Within the U.S., states such as North Dakota and Texas will be hurt by lower oil prices; however energy capital expenditure (CapEx) represents less than 2% of GDP and we believe the overall impact of lower
www.calvert.com CALVERT INTERNATIONAL EQUITY FUND SEMI-ANNUAL REPORT (UNAUDITED) 7
energy prices is positive for the U.S. economy as a whole due to the significant cost savings its creates in a majority of sectors and the multiplier effect it has throughout the economy.
Global Easing Continues Amid Low Inflation and Stronger Dollar
The U.S. dollar strengthened throughout the period, hitting a 7-year high vs. the Japanese Yen and a 12-year high against the euro. Since most commodities are priced globally in U.S. dollars, a stronger dollar relative to foreign currencies typically correlates with lower commodity prices, which has kept a lid on inflation.
More than half the central banks in the G20 economies implemented some type of monetary easing policy during the period, which provided additional support for global equities. Most notably, the Bank of Japan announced a massive stimulus policy and the European Central Bank (ECB) followed with a strong quantitative easing (QE) program of its own.
Interest Rate Hikes by the Fed on the Horizon
With the U.S. economy improving, both market sentiment and Federal Reserve officials seem divided on the optimal timing of the Fed’s interest-rate increases. However, consistently low inflation and recent softness in U.S. macroeconomic data—as well as the rapid increase in the dollar’s strength, which has hurt U.S. exports and the manufacturing sector—makes it more likely that the Fed will delay raising rates until later in the year or possibly even next year.
Eurozone Economic Struggles Continue but QE Offers Some Respite
Economic conditions continued to deteriorate in the eurozone through the end of 2014 as inflation turned negative, prompting the ECB to launch its massive QE program. The program has been successful thus far in decreasing the value of the euro in an attempt to stimulate exports and eurozone economies.
|
| | | | |
| | | | |
| | CALVERT INTERNATIONAL EQUITY FUND | |
| | MARCH 31, 2015 | |
| | | | |
| | AVERAGE ANNUAL TOTAL RETURNS | |
| | | | |
| | CLASS A SHARES | (WITH MAX. LOAD) | |
| | One year | -6.69 | % | |
| | Five year | 3.69 | % | |
| | Ten year | 1.39 | % | |
| | | | |
| | CLASS B SHARES | (WITH MAX. LOAD) | |
| | One year | -8.21 | % | |
| | Five year | 3.25 | % | |
| | Ten year | 0.74 | % | |
| | | | |
| | CLASS C SHARES | (WITH MAX. LOAD) | |
| | One year | -3.93 | % | |
| | Five year | 3.78 | % | |
| | Ten year | 1.00 | % | |
| | | | |
| | CLASS I SHARES | | |
| | One year | -1.43 | % | |
| | Five year | 5.45 | % | |
| | Ten year | 2.61 | % | |
| | | | |
| | CLASS Y SHARES* | | |
| | One year | -1.72 | % | |
| | Five year | 5.12 | % | |
| | Ten year | 2.15 | % | |
| | | | |
| | * Calvert International Equity Fund first offered Class Y shares on October 31, 2008. Performance prior to that date reflects the performance of Class A shares at net asset value (NAV). Actual Class Y share performance would have been different. | |
| | | | |
Manufacturing PMIs, credit demand, and consumer confidence all have been showing signs of modest improvement, indicating a potential positive effect from QE as well as a potential bottoming out of eurozone economic malaise. Despite these marginally positive developments, we are skeptical that central bankers’ efforts will meaningfully reinvigorate those economies unless accompanied by structural economic
8 www.calvert.com CALVERT INTERNATIONAL EQUITY FUND SEMI-ANNUAL REPORT (UNAUDITED)
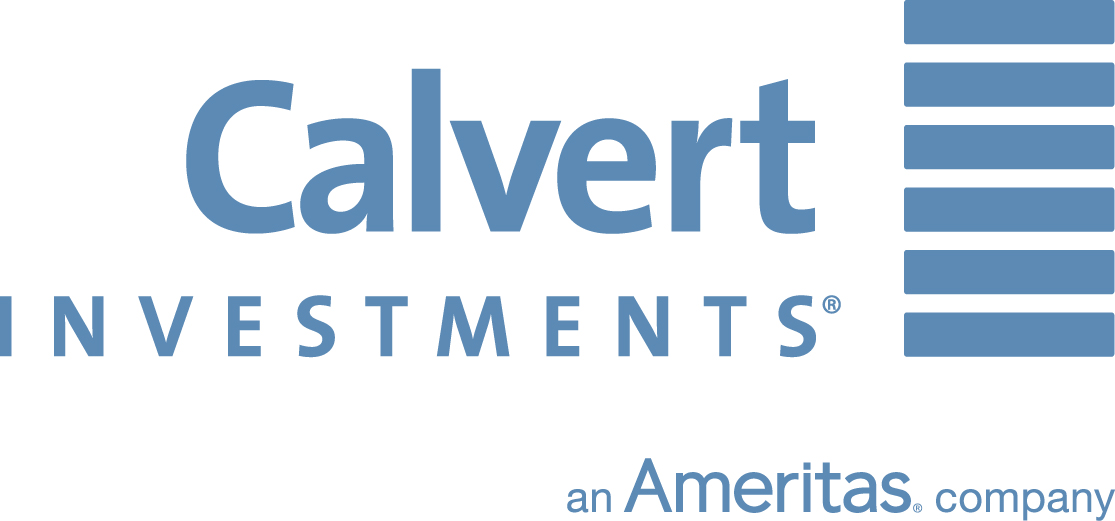
Growth of $10,000
The graph below shows the value of a hypothetical $10,000 investment in the Fund over the past 10 fiscal year periods. The results shown are for Class A shares and reflect the deduction of the maximum front-end Class A sales charge of 4.75%, and assume the reinvestment of dividends. The result is compared with benchmarks that include a broad based market index and a Lipper peer group average. Market indexes are unmanaged and their results do not reflect the effect of expenses or sales charges. The Lipper average reflects the deduction of the category’s average front-end sales charge. The value of an investment in a different share class would be different.
All performance data shown, including the graph above and the adjacent table, represents past performance, does not guarantee future results, assumes reinvestment of dividends and distributions and does not reflect the deduction of taxes that a shareholder would pay on the Fund’s distributions or the redemption of the Fund shares. All performance data reflects fee waivers and/or expense limitations, if any are in effect; in their absence performance would be lower. See Note B in Notes to Financial Statements. The investment return and principal value of an investment will fluctuate so that an investor’s shares, when redeemed, may be worth more or less than their original cost. Current performance may be lower or higher than the performance data quoted; for current performance data visit www.calvert.com. The gross expense ratio from the current prospectus for Class A shares is 1.68%. This number may differ from the expense ratio shown elsewhere in this report because it is based on a different time period and, if applicable, does not include fee or expense waivers. Performance data quoted already reflects the deduction of the Fund’s operating expenses.
www.calvert.com CALVERT INTERNATIONAL EQUITY FUND SEMI-ANNUAL REPORT (UNAUDITED) 9
reforms. Possible risks from Greece exiting the eurozone and political turmoil emerging in other euro-area countries also remain a lingering concern and may re-surface later in the year.
Stimulus Measures Boost Chinese Stocks but Economic Challenges Remain
Despite Manufacturing PMI weakening throughout the period, Chinese equities rallied on the back of several stimulus measures and investor expectations that the government would continue stimulus measures to offset slowing, though still robust, economic growth. China is also benefiting from cheaper oil, which essentially acts as another form of stimulus. The Services PMI held up better than expected, indicating some very modest progress in transitioning away from an investment-driven economy to a more consumer-oriented one. However, structural improvements in social welfare programs, such as health care and retirement planning, will be needed in order to encourage Chinese consumers to spend more and bring down their notoriously high savings rate. Given these challenges, as well as ongoing concerns regarding a potential property-bubble burst, stimulus does not mean the Chinese economy is out of the woods. A hard economic landing remains a possibility down the road.
Outlook
While we may see some continued softness in U.S. macroeconomic data during the first half of the year, we believe U.S. economic growth will continue to exceed growth from other developed countries and we remain positive on the U.S. economy longer-term. We believe the significant positive multiplier effect from lower gas prices hasn’t yet been fully reflected in U.S. economic data, and we are likely to see the additional positive impact in the coming quarters.
In our view, U.S. stocks can still post decent performance, but probably not as good as what we saw in the past couple of years because of higher valuations, slower earnings growth, and potentially having reached peak margins. The stronger dollar, combined with lower commodity prices, tends to benefit consumers and hurt industrial companies, especially those with heavy sales outside the United States, or those directly involved in the energy sector. This is one reason why we continue to favor small-cap stocks on the domestic front.
With lower commodity prices, a stronger dollar, and little wage growth, inflation in the United States will likely remain low for some time to come, while deflationary threats are very real in other parts of the world. This may lead the Federal Reserve to raise interest rates less quickly than currently expected, since challenging global economic conditions can have a significant impact on the U.S. economy. Our position remains that when the Fed does decide to raise rates, the tightening process will be slow and gradual, with the Fed keeping a close eye on interest-rate volatility and its impact on mortgage rates. Even with a gradual tightening, monetary policy should still remain accommodative for an extended period of time. That said, we expect market volatility to increase as we grow closer to the inevitability of higher interest rates.
Calvert Investment Management, Inc.
April 2015
1. The Institute for Supply Management (ISM) Manufacturing PMI is published monthly and shows business conditions in the U.S. manufacturing sector, and is considered a significant indicator of overall economic conditions. The ISM index includes prices paid for all purchases including import purchases and purchases of food and energy, excluding crude oil. A result above 50 indicates that the manufacturing economy is generally expanding; below 50 indicates that it is generally declining.
10 www.calvert.com CALVERT INTERNATIONAL EQUITY FUND SEMI-ANNUAL REPORT (UNAUDITED)
SHAREHOLDER ADVOCACY UPDATE
2014 Corporate Diversity Report Findings Released
In March, Calvert published its 2014 survey findings on the corporate diversity practices of the largely multinational companies that make up the Standard & Poor’s 100 Index (S&P 100), in follow-up to reports published in 2012 and 2010. Calvert believes companies that fully commit to providing a fair and equitable working environment will recognize gains in both the workplace and marketplace.
Key findings from the 2014 survey include:
| |
| • | Milestone for women in the board room. In 2014, every company in the S&P 100 had at least one woman on its board of directors. In addition, there was a 17% increase in companies with three or more women and/or minorities on their boards. |
| |
| • | Diversity commitment on the rise. In the past two years, top scores related to overall corporate commitment have increased by 45%.This stems primarily from greater board oversight of diversity initiatives and increased CEO and/or chair involvement. |
| |
| • | LGBT policies have advanced overall. However, initiatives for persons with disabilities continue to fall behind other groups. |
Overall, in 2014, we saw growing commitment to women and minority employees, momentum around family-friendly work environments, and accelerated progress in support of LGBT employees. Looking ahead, we hope to see enhanced corporate diversity commitments, greater representation of women and minorities on boards, improved EEO1-disclosure, and expanded diversity initiatives for persons with disabilities.
To learn the highest- and lowest-rated companies in the report, A Survey of Corporate Diversity Practices of the S&P 100, and to find out more about the report’s methodology and findings, visit www.calvert.com.
2015 Shareholder Resolutions
Building on our initiatives from 2014, Calvert was the lead filer on 38 shareholder resolutions for the 2015 proxy season, and co-filer on another 18 proposals. Key topics include “big data” and civil rights issues, sustainability reporting, board of director oversight of environmental and social matters, water risk, climate change and greenhouse gas emissions reductions, supply chain labor issues, and board diversity.
Specifically, Calvert asked 14 companies to set a goal and a timeline for reducing their greenhouse gas emissions and filed seven proposals asking companies to issue a sustainability report describing their environmental, social and governance (ESG) performance and goals. To push for improved boardroom diversity, Calvert filed six proposals with companies requesting they report on their plans to increase minority and women Board representation and assess the effectiveness of these efforts. We also filed seven proposals requesting that companies assess and manage the civil rights’ risks related to their use of big data, which refers to data sets so large or complex that traditional data processing applications are inadequate. We also filed proposals on water risk in the agricultural supply chain and on developing a sustainable agriculture policy.
To keep abreast of the outcomes of these 2015 shareholder resolutions, as well as Calvert’s proxy voting and public policy initiatives, visit the “Resources” section on www.calvert.com.
www.calvert.com CALVERT INTERNATIONAL EQUITY FUND SEMI-ANNUAL REPORT (UNAUDITED) 11
SHAREHOLDER EXPENSE EXAMPLE
As a shareholder of the Fund, you incur two types of costs: (1) transaction costs, including sales charges (loads) and redemption fees; and (2) ongoing costs, including management fees; distribution (12b-1) fees; and other Fund expenses. This Example is intended to help you understand your ongoing costs (in dollars) of investing in the Fund and to compare these costs with the ongoing costs of investing in other mutual funds.
This Example is based on an investment of $1,000 invested at the beginning of the period and held for the entire period (October 1, 2014 to March 31, 2015).
Actual Expenses
The first line of the table below provides information about actual account values and actual expenses. You may use the information in this line, together with the amount you invested, to estimate the expenses that you paid over the period. Simply divide your account value by $1,000 (for example, an $8,600 account value divided by $1,000 = 8.6), then multiply the result by the number in the first line under the heading entitled "Expenses Paid During Period" to estimate the expenses you paid on your account during this period.
Hypothetical Example for Comparison Purposes
The second line of the table below provides information about hypothetical account values and hypothetical expenses based on the Fund’s actual expense ratio and an assumed rate of return of 5% per year before expenses, which is not the Fund’s actual return. The hypothetical account values and expenses may not be used to estimate the actual ending account balance or expenses you paid for the period. You may use this information to compare the ongoing costs of investing in the Fund and other funds. To do so, compare the 5% hypothetical example with the 5% hypothetical examples that appear in the shareholder reports of the other funds.
Please note that the expenses shown in the table are meant to highlight your ongoing costs only and do not reflect any transactional costs, such as sales charges (loads), or redemption fees. Therefore, the second line of the table is useful in comparing ongoing costs only, and will not help you determine the relative total costs of owning different funds. In addition, if these transactional costs were included, your costs would have been higher.
12 www.calvert.com CALVERT INTERNATIONAL EQUITY FUND SEMI-ANNUAL REPORT (UNAUDITED)
|
| | | |
| | BEGINNING ACCOUNT VALUE 10/1/14 | ENDING ACCOUNT VALUE 3/31/15 | EXPENSES PAID DURING PERIOD* 10/1/14 - 3/31/15 |
CLASS A | | | |
| Actual | $1,000.00 | $1,015.56 | $8.44 |
| Hypothetical | $1,000.00 | $1,016.56 | $8.44 |
| (5% return per year before expenses) | | | |
| | | | |
CLASS B | | | |
| Actual | $1,000.00 | $1,009.00 | $14.88 |
| Hypothetical | $1,000.00 | $1,010.12 | $14.88 |
| (5% return per year before expenses) | | | |
| | | | |
CLASS C | | | |
| Actual | $1,000.00 | $1,010.50 | $13.08 |
| Hypothetical | $1,000.00 | $1,011.92 | $13.09 |
| (5% return per year before expenses) | | | |
| | | | |
| | | | |
CLASS I | | | |
| Actual | $1,000.00 | $1,019.15 | $5.17 |
| Hypothetical | $1,000.00 | $1,019.81 | $5.18 |
| (5% return per year before expenses) | | | |
| | | | |
CLASS Y | | | |
| Actual | $1,000.00 | $1,017.16 | $6.62 |
| Hypothetical | $1,000.00 | $1,018.37 | $6.62 |
| (5% return per year before expenses) | | | |
| | | | |
| | | | |
* Expenses are equal to the Fund’s annualized expense ratio of 1.68%, 2.97%, 2.61%, 1.03%, and 1.32% for Class A, Class B, Class C, Class I, and Class Y, respectively, multiplied by the average account value over the period, multiplied by 182/365 (to reflect the one-half year period).
|
www.calvert.com CALVERT INTERNATIONAL EQUITY FUND SEMI-ANNUAL REPORT (UNAUDITED) 13
STATEMENT OF NET ASSETS
MARCH 31, 2015
|
| | | |
EQUITY SECURITIES - 91.5% | SHARES | VALUE |
| Australia - 2.2% | | |
| Macquarie Group Ltd. | 36,560 |
| $2,126,225 |
| Westpac Banking Corp. | 14,549 |
| 435,674 |
| Westpac Banking Corp. (ADR) | 87,222 |
| 2,608,810 |
| Woolworths Ltd. | 128,731 |
| 2,885,816 |
| | | 8,056,525 |
| | | |
| Austria - 1.0% | | |
| OMV AG (ADR) | 723 |
| 19,911 |
| Voestalpine AG | 97,015 |
| 3,543,301 |
| | | 3,563,212 |
| | | |
| Belgium - 0.2% | | |
| Ageas (ADR) | 16,568 |
| 594,377 |
| | | |
| Canada - 0.4% | | |
| Lululemon Athletica, Inc.* | 20,813 |
| 1,332,448 |
| | | |
| China - 1.1% | | |
| BOC Hong Kong Holdings Ltd. (ADR) | 15,012 |
| 1,069,155 |
| China Construction Bank Corp. | 3,834,000 |
| 3,180,635 |
| | | 4,249,790 |
| | | |
| Denmark - 0.0% | | |
| H Lundbeck A/S (ADR) | 5,080 |
| 108,026 |
| | | |
| Finland - 0.1% | | |
| Sampo Oyj (ADR) | 10,009 |
| 252,627 |
| | | |
| France - 7.2% | | |
| AXA SA (ADR) | 103,724 |
| 2,617,994 |
| BNP Paribas SA (ADR) | 52,375 |
| 1,588,272 |
| Casino Guichard Perrachon SA (ADR) | 370 |
| 6,597 |
| Credit Agricole SA (ADR) | 72,354 |
| 528,184 |
| Kering SA | 23,121 |
| 4,515,098 |
| Orange SA | 6,279 |
| 100,928 |
| Orange SA (ADR) | 201,354 |
| 3,223,678 |
| Sanofi SA | 24,075 |
| 2,366,802 |
| Sanofi SA (ADR) | 205,399 |
| 10,154,927 |
| Suez Environnement Co. (ADR) | 12,411 |
| 105,494 |
| Valeo SA (ADR) | 8,067 |
| 601,516 |
| Veolia Environnement SA (ADR) | 32,156 |
| 606,784 |
| | | 26,416,274 |
| | | |
| Germany - 6.2% | | |
| Allianz SE | 7,885 |
| 1,368,837 |
| Allianz SE (ADR) | 361,651 |
| 6,294,536 |
| Brenntag AG | 26,536 |
| 1,589,370 |
| Celesio AG (ADR) | 2,134 |
| 12,377 |
14 www.calvert.com CALVERT INTERNATIONAL EQUITY FUND SEMI-ANNUAL REPORT (UNAUDITED)
|
| | | | | |
EQUITY SECURITIES - CONT'D | SHARES | VALUE |
| | | |
| Germany - Cont'd | | |
| Commerzbank AG (ADR)* | 2 |
| $28 |
| Continental AG (ADR) | 76 |
| 3,589 |
| Deutsche Post AG | 141,953 |
| 4,436,514 |
| Deutsche Post AG (ADR) | 68,078 |
| 2,132,203 |
| Dialog Semiconductor plc* | 66,219 |
| 2,991,943 |
| Hugo Boss AG | 28,000 |
| 3,406,324 |
| K+S AG (ADR) | 2,275 |
| 37,196 |
| Merck KGaA (ADR) | 4,215 |
| 156,398 |
| Muenchener Rueckversicherungs-Gesellschaft AG (ADR) | 18,721 |
| 403,531 |
| | | 22,832,846 |
| | | |
| Hong Kong - 3.2% | | |
| AIA Group Ltd. | 1,094,600 |
| 6,852,232 |
| Hang Seng Bank Ltd. (ADR) | 53,867 |
| 965,297 |
| PCCW Ltd. | 7,000 |
| 4,265 |
| PCCW Ltd. (ADR) | 4,416 |
| 26,496 |
| Samsonite International SA* | 1,157,100 |
| 4,017,651 |
| The Bank of East Asia Ltd. (ADR) | 7,835 |
| 31,027 |
| | | 11,896,968 |
| | | |
| Ireland - 1.1% | | |
| Kerry Group plc | 61,021 |
| 4,094,673 |
| | | |
| Israel - 1.5% | | |
| Check Point Software Technologies Ltd.* | 65,600 |
| 5,377,232 |
| | | |
| Italy - 3.8% | | |
| GTECH SpA (ADR) | 1,136 |
| 22,640 |
| Intesa Sanpaolo SpA, Milano Stock Exchange | 1,589,554 |
| 5,389,059 |
| Intesa Sanpaolo SpA (ADR) | 15,917 |
| 324,388 |
| Mediobanca SpA | 501,526 |
| 4,804,019 |
| Prysmian SpA | 161,645 |
| 3,326,944 |
| Snam SpA (ADR) | 4,650 |
| 45,058 |
| Terna Rete Elettrica Nazionale SpA (ADR) | 3,886 |
| 51,315 |
| | | 13,963,423 |
| | | |
| Japan - 17.8% | | |
| Astellas Pharma, Inc. | 346,000 |
| 5,668,354 |
| Eisai Co. Ltd. (ADR) | 436 |
| 31,196 |
| Isuzu Motors Ltd. | 418,900 |
| 5,570,965 |
| JSR Corp. | 192,800 |
| 3,343,877 |
| Mitsui Fudosan Co. Ltd. | 154,256 |
| 4,532,369 |
| Mizuho Financial Group, Inc. | 2,696,200 |
| 4,741,289 |
| Mizuho Financial Group, Inc. (ADR) | 477,960 |
| 1,696,758 |
| MS&AD Insurance Group Holdings (ADR) | 51,806 |
| 725,543 |
| Nippon Telegraph & Telephone Corp. | 10,100 |
| 622,219 |
| Nippon Telegraph & Telephone Corp. (ADR) | 119,596 |
| 3,685,949 |
| Nissan Motor Co. Ltd. | 408,000 |
| 4,159,372 |
| Nissan Motor Co. Ltd. (ADR) | 86,568 |
| 1,759,927 |
| Nomura Holdings, Inc. | 40,600 |
| 238,662 |
| Nomura Holdings, Inc. (ADR) | 246,548 |
| 1,447,237 |
| ORIX Corp. | 360,400 |
| 5,067,829 |
www.calvert.com CALVERT INTERNATIONAL EQUITY FUND SEMI-ANNUAL REPORT (UNAUDITED) 15
|
| | | | | |
EQUITY SECURITIES - CONT'D | SHARES | VALUE |
| | | |
| Japan - Cont'd | | |
| Softbank Corp. | 83,500 |
| $4,852,601 |
| Sony Corp.* | 9,700 |
| 259,261 |
| Sony Corp. (ADR)* | 57,644 |
| 1,543,706 |
| Takeda Pharmaceutical Co. Ltd. (ADR) | 14,813 |
| 370,918 |
| Tokyo Gas Co. Ltd. | 621,118 |
| 3,910,785 |
| Toyota Motor Corp. (t) | 129,900 |
| 9,063,656 |
| Toyota Motor Corp. (ADR) | 14,920 |
| 2,087,159 |
| | | 65,379,632 |
| | | |
| Luxembourg - 1.3% | | |
| Ipsen SA (ADR) | 47,534 |
| 556,623 |
| ProSiebenSat.1 Media AG | 84,472 |
| 4,147,270 |
| | | 4,703,893 |
| | | |
| Malaysia - 0.2% | | |
| AirAsia Bhd. | 1,433,600 |
| 921,109 |
| | | |
| Mexico - 0.1% | | |
| FINAE, Series D, Preferred (b)(i)* | 1,962,553 |
| 226,071 |
| | | |
| Netherlands - 4.5% | | |
| Koninklijke Ahold NV, Amsterdam Stock Exchange | 13,249 |
| 261,128 |
| Koninklijke Ahold NV (ADR) | 80,500 |
| 1,582,630 |
| Koninklijke Philips NV: | | |
| Common | 13,830 |
| 392,494 |
| NY Shares | 82,615 |
| 2,341,309 |
| Unilever NV, NY Shares | 100,971 |
| 4,216,549 |
| Unilever NV (CVA) | 183,493 |
| 7,669,073 |
| | | 16,463,183 |
| | | |
| New Zealand - 0.1% | | |
| Spark New Zealand Ltd. | 26,473 |
| 58,840 |
| Spark New Zealand Ltd. (ADR) | 32,193 |
| 356,537 |
| | | 415,377 |
| | | |
| Norway - 4.5% | | |
| DNB ASA | 187,819 |
| 3,022,131 |
| DNB ASA (ADR) | 377 |
| 60,350 |
| Statoil ASA (ADR) | 589,938 |
| 10,377,009 |
| StatoilHydro ASA | 133,032 |
| 2,349,759 |
| Yara International ASA (ADR) | 12,176 |
| 617,932 |
| | | 16,427,181 |
| | | |
| Peru - 1.1% | | |
| Credicorp Ltd. | 28,503 |
| 4,008,377 |
| | | |
| Philippines - 0.9% | | |
| Philippine Long Distance Telephone Co. | 7,910 |
| 502,839 |
| Philippine Long Distance Telephone Co. (ADR) | 48,217 |
| 3,013,080 |
| | | 3,515,919 |
| | | |
16 www.calvert.com CALVERT INTERNATIONAL EQUITY FUND SEMI-ANNUAL REPORT (UNAUDITED)
|
| | | | | |
EQUITY SECURITIES - CONT'D | SHARES | VALUE |
| | | |
| Singapore - 0.3% | | |
| Singapore Telecommunications Ltd. (ADR) | 29,605 |
| $943,363 |
| | | |
| South Africa - 2.2% | | |
| Aspen Pharmacare Holdings Ltd.* | 105,170 |
| 3,327,072 |
| MTN Group Ltd. (ADR) | 31,566 |
| 538,358 |
| Naspers Ltd. | 26,867 |
| 4,121,565 |
| Nedbank Group Ltd. (ADR) | 5,888 |
| 115,140 |
| Tiger Brands Ltd. (ADR) | 2,952 |
| 73,844 |
| | | 8,175,979 |
| | | |
| South Korea - 0.5% | | |
| LG Household & Health Care Ltd. | 2,347 |
| 1,777,389 |
| | | |
| Spain - 2.3% | | |
| Banco Bilbao Vizcaya Argentaria SA: | | |
| Common | 28,740 |
| 289,771 |
| Rights* | 28,740 |
| 4,137 |
| Banco Bilbao Vizcaya Argentaria SA (ADR) | 173,673 |
| 1,741,940 |
| Banco Santander SA | 37,296 |
| 280,243 |
| Banco Santander SA (ADR) | 225,996 |
| 1,683,670 |
| Enagas SA (ADR) | 2,626 |
| 37,460 |
| Ferrovial SA (ADR) | 442 |
| 9,286 |
| Inditex SA | 136,945 |
| 4,386,664 |
| | | 8,433,171 |
| | | |
| Sweden - 2.0% | | |
| Atlas Copco AB | 2,755 |
| 89,066 |
| Atlas Copco AB (ADR): | | |
| A Shares | 42,356 |
| 1,371,699 |
| B Shares | 17,932 |
| 529,622 |
| Sandvik AB | 358,977 |
| 4,009,030 |
| Sandvik AB (ADR) | 5,564 |
| 61,872 |
| Svenska Handelsbanken AB (ADR) | 12,848 |
| 289,787 |
| Swedbank AB (ADR) | 14,941 |
| 357,463 |
| Tele2 AB (ADR) | 121,443 |
| 722,586 |
| | | 7,431,125 |
| | | |
| Switzerland - 7.5% | | |
| Clariant AG* | 264,132 |
| 5,279,208 |
| Novartis AG | 15,624 |
| 1,545,362 |
| Novartis AG (ADR) | 76,156 |
| 7,509,743 |
| Roche Holding AG | 27,020 |
| 7,452,101 |
| Roche Holding AG (ADR) | 131,390 |
| 4,517,188 |
| Swiss Re AG (ADR) | 4,079 |
| 394,011 |
| Zurich Insurance Group AG (ADR)* | 30,490 |
| 1,028,885 |
| | | 27,726,498 |
| | | |
| United Kingdom - 17.2% | | |
| Admiral Group plc (ADR) | 3,494 |
| 80,904 |
| ARM Holdings plc | 192,278 |
| 3,151,058 |
| AstraZeneca plc | 4,551 |
| 312,312 |
www.calvert.com CALVERT INTERNATIONAL EQUITY FUND SEMI-ANNUAL REPORT (UNAUDITED) 17
|
| | | | | |
EQUITY SECURITIES - CONT'D | SHARES | VALUE |
| | | |
| United Kingdom - Cont'd | | |
| AstraZeneca plc (ADR) | 75,725 |
| $5,181,862 |
| Barclays plc | 1,320,992 |
| 4,744,443 |
| Barclays plc (ADR) | 218,811 |
| 3,188,076 |
| BG Group plc | 324,390 |
| 3,988,775 |
| BT Group plc | 76,870 |
| 498,499 |
| BT Group plc (ADR) | 45,852 |
| 2,988,175 |
| Bunzl plc (ADR) | 21,554 |
| 584,113 |
| Capita plc | 159,059 |
| 2,631,920 |
| Catlin Group Ltd. (ADR) | 2,231 |
| 46,739 |
| GlaxoSmithKline plc | 14,334 |
| 328,558 |
| GlaxoSmithKline plc (ADR) | 43,218 |
| 1,994,511 |
| Howden Joinery Group plc | 274,685 |
| 1,807,212 |
| Indivior plc (ADR)* | 1,064 |
| 14,970 |
| Inmarsat plc | 298,192 |
| 4,094,844 |
| J Sainsbury plc (ADR) | 11,183 |
| 173,001 |
| Johnson Matthey plc | 54,055 |
| 2,714,569 |
| Legal & General Group plc (ADR) | 907 |
| 18,816 |
| Man Group plc (ADR) | 55,991 |
| 164,614 |
| Meggitt plc | 504,745 |
| 4,104,671 |
| Old Mutual plc (ADR) | 1,346 |
| 35,503 |
| Persimmon plc* | 147,203 |
| 3,632,987 |
| Prudential plc | 233,225 |
| 5,780,153 |
| Reckitt Benckiser Group plc (ADR) | 26,602 |
| 455,160 |
| Sage Group plc (ADR) | 91 |
| 2,518 |
| SSE plc | 155,983 |
| 3,467,827 |
| SSE plc (ADR) | 89,854 |
| 1,998,353 |
| The British Land Co. plc (ADR) | 5,664 |
| 69,739 |
| Unilever plc | 9,203 |
| 384,204 |
| Unilever plc (ADR) | 97,067 |
| 4,048,665 |
| United Utilities Group plc (ADR) | 26,500 |
| 731,798 |
| | | 63,419,549 |
| | | |
| United States - 1.0% | | |
| Applied Industrial Technologies, Inc. | 13,914 |
| 630,861 |
| Bioceptive, Inc., Series A, Preferred (a)(b)(i)* | 582,574 |
| 299,967 |
| Bristol-Myers Squibb Co. | 35,316 |
| 2,277,882 |
|
| Powerspan Corp., Contingent Deferred Distribution (b)(i)* | 1 |
| — |
|
| Unit Corp.* | 17,325 |
| 484,754 |
| | | 3,693,464 |
| | | |
| Total Equity Securities (Cost $315,884,230) | | 336,399,701 |
| | | |
VENTURE CAPITAL LIMITED PARTNERSHIP INTEREST - 0.4% | ADJUSTED BASIS | |
| Mainstream Brazil Impact Investing Fund (b)(i)* |
| $18,422 |
| 941 |
| BFSE Holding, BV (b)(i)* | 612,966 |
| 292,833 |
| Africa Renewable Energy Fund (b)(i)* | 102,623 |
| 70,845 |
| Blackstone Clean Technology Partners (b)(i)* | 76,276 |
| 26,513 |
| China Environment Fund 2004 (b)(i)* | — |
| 123,854 |
| Emerald Sustainability Fund I (b)(i)* | 433,916 |
| 140,859 |
| gNet Defta Development Holdings LLC (a)(b)(i)* | 400,000 |
| 313,827 |
18 www.calvert.com CALVERT INTERNATIONAL EQUITY FUND SEMI-ANNUAL REPORT (UNAUDITED)
|
| | | | | |
VENTURE CAPITAL LIMITED PARTNERSHIP INTEREST - CONT'D | ADJUSTED BASIS | VALUE |
| | | |
| SEAF Central and Eastern European Growth Fund LLC (a)(b)(i)* |
| $327,254 |
| $429,009 |
| SEAF India International Growth Fund (b)(i)* | 274,667 |
| 120,146 |
| ShoreCap International LLC (b)(i)* | — |
| — |
|
| Terra Capital (b)(i)* | 469,590 |
| 1 |
| | | |
Total Venture Capital Limited Partnership Interest (Cost $2,715,714) | | 1,518,828 |
| | | |
VENTURE CAPITAL DEBT OBLIGATIONS - 0.3% | PRINCIPAL AMOUNT | |
| AFIG LLC, 6.00%, 10/17/17 (b)(i) | 450,953 |
| 338,214 |
| FINAE: | | |
| Note I, 6.50%, 12/1/15 (b)(i) | 187,500 |
| 187,500 |
| Note II, 6.50%, 12/1/15 (b)(i) | 375,000 |
| 375,000 |
| Windhorse International-Spring Health Water Ltd., 1.00%, 3/14/18 (b)(i)(u) | 70,000 |
| 52,500 |
| | | |
| Total Venture Capital Debt Obligations (Cost $1,083,453) | | 953,214 |
| | | |
HIGH SOCIAL IMPACT INVESTMENTS - 1.2% | | |
| Calvert Social Investment Foundation Notes, 0.25%, 7/1/17 (b)(i)(r) | 4,431,583 |
| 4,393,480 |
| | | |
| Total High Social Impact Investments (Cost $4,431,583) | | 4,393,480 |
| | | |
TIME DEPOSIT - 8.8% | | |
| State Street Bank Time Deposit, 0.088%, 4/1/15 | 32,317,328 |
| 32,317,328 |
| | | |
| Total Time Deposit (Cost $32,317,328) | | 32,317,328 |
| | | |
| | | |
| TOTAL INVESTMENTS (Cost $356,432,308) - 102.2% | | 375,582,551 |
| Other assets and liabilities, net - (2.2%) | | (8,025,970) |
NET ASSETS - 100% | | $367,556,581 |
| | | |
| See notes to financial statements. |
www.calvert.com CALVERT INTERNATIONAL EQUITY FUND SEMI-ANNUAL REPORT (UNAUDITED) 19
|
| | | |
NET ASSETS CONSIST OF: | |
| Paid-in capital applicable to the following shares of common stock with 250,000,000 shares of $0.01 par value shares authorized: | |
| Class A: 13,811,555 shares outstanding |
| $311,828,948 |
|
| Class B: 96,469 shares outstanding | 7,754,331 |
|
| Class C: 1,177,554 shares outstanding | 31,331,711 |
|
| Class I: 5,575,232 shares outstanding | 134,018,975 |
|
| Class Y: 1,119,226 shares outstanding | 18,106,336 |
|
| Undistributed net investment income | 53,640 |
|
| Accumulated net realized gain (loss) on investments and foreign currency transactions | (154,639,088 | ) |
| Net unrealized appreciation (depreciation) on investments, foreign currencies, and assets and liabilities denominated in foreign currencies | 19,101,728 |
|
| | |
NET ASSETS |
| $367,556,581 |
|
| | |
NET ASSET VALUE PER SHARE | |
| Class A (based on net assets of $230,144,776) |
| $16.66 |
|
| Class B (based on net assets of $1,406,427) |
| $14.58 |
|
| Class C (based on net assets of $16,993,809) |
| $14.43 |
|
| Class I (based on net assets of $99,286,078) |
| $17.81 |
|
| Class Y (based on net assets of $19,725,491) |
| $17.62 |
|
| | |
| |
|
| | | | |
RESTRICTED SECURITIES | ACQUISITION DATES | COST |
| AFIG LLC, 6.00%, 10/17/17 | 10/11/12 |
| $450,953 |
|
| Africa Renewable Energy Fund LP | 4/17/14 - 11/10/14 | 102,623 |
|
| BFSE Holding, BV LP | 1/12/06 - 6/11/14 | 612,966 |
|
| Bioceptive, Inc., Series A, Preferred | 10/26/12 - 12/18/13 | 252,445 |
|
| Blackstone Clean Technology Partners LP | 7/29/10 - 2/10/15 | 76,276 |
|
| Calvert Social Investment Foundation Notes, 0.25%, 7/1/17 | 7/1/14 | 4,431,583 |
|
| China Environment Fund 2004 LP | 9/15/05 - 4/1/09 | — |
|
| Emerald Sustainability Fund I LP | 7/19/01 - 5/17/11 | 433,916 |
|
| FINAE: | | |
| Series D, Preferred | 2/28/11 | 252,686 |
|
| Note I, 6.50%, 12/1/15 | 12/10/10 | 187,500 |
|
| Note II, 6.50%, 12/1/15 | 2/24/11 | 375,000 |
|
| gNet Defta Development Holdings LLC, LP | 8/30/05 | 400,000 |
|
| Mainstream Brazil Impact Investing Fund LP | 12/12/14 - 3/25/15 | 18,422 |
|
| Powerspan Corp., Contingent Deferred Distribution | 7/11/14 | — |
|
| SEAF Central and Eastern European Growth Fund LLC, LP | 8/10/00 - 8/26/11 | 327,254 |
|
| SEAF India International Growth Fund LP | 3/22/05 - 5/24/10 | 274,667 |
|
| ShoreCap International LLC, LP | 8/12/04 - 12/15/08 | — |
|
| Terra Capital LP | 11/23/98 - 3/14/06 | 469,590 |
|
| Windhorse International-Spring Health Water Ltd., 1.00%, 3/14/18 | 2/12/14 | 70,000 |
|
| See notes to financial statements. |
20 www.calvert.com CALVERT INTERNATIONAL EQUITY FUND SEMI-ANNUAL REPORT (UNAUDITED)
|
| | |
(a) Affiliated company. (b) This security was valued under the direction of the Board of Directors. See Note A. (i) Restricted securities represent 2.0% of net assets of the Fund. (r) The coupon rate shown on floating or adjustable rate securities represents the rate at period end. (t) 90,000 shares of Toyota Motor Corp. have been soft segregated in order to cover outstanding commitments to certain limited partnerships investments within the Fund. There are no restrictions on the trading of this security. (u) Security defaulted as to principal and interest in March 2013. It has been restructured at a 9% rate maturing on March 14, 2018 with 1% to be paid annually and the remaining interest due at maturity. This security is currently accruing at 1%. * Non-income producing security Abbreviations: ADR: American Depositary Receipts CVA: Certificaten Van Aandelen LLC: Limited Liability Corporation plc: Public Limited Company See notes to financial statements. |
www.calvert.com CALVERT INTERNATIONAL EQUITY FUND SEMI-ANNUAL REPORT (UNAUDITED) 21
STATEMENT OF OPERATIONS
SIX MONTHS ENDED MARCH 31, 2015
|
| | | |
NET INVESTMENT INCOME | |
| Investment Income: | |
| Dividend income (net of foreign taxes withheld of $285,992) |
| $3,515,406 |
|
| Interest income |
| $50,791 |
|
| Total investment income | 3,566,197 |
|
| | |
| Expenses: | |
| Investment advisory fee | 1,411,723 |
|
| Transfer agency fees and expenses | 341,244 |
|
| Administrative fees | 573,204 |
|
| Distribution Plan expenses: | |
| Class A | 314,002 |
|
| Class B | 8,718 |
|
| Class C | 83,521 |
|
| Directors' fees and expenses | 21,216 |
|
| Custodian fees | 87,403 |
|
| Registration fees | 31,078 |
|
| Reports to shareholders | 27,716 |
|
| Professional fees | 29,707 |
|
| Miscellaneous | 28,877 |
|
| Total expenses | 2,958,409 |
|
| Reimbursement from Advisor: | |
| Class B | (7,474 | ) |
| Net expenses | 2,950,935 |
|
| | |
NET INVESTMENT INCOME | 615,262 |
|
| | |
REALIZED AND UNREALIZED GAIN (LOSS) | |
| Net realized gain (loss) on: | |
| Investments | 8,272,351 |
|
| Foreign currency transactions | (424,076 | ) |
| | 7,848,275 |
|
| Change in unrealized appreciation (depreciation) on: | |
| Investments and foreign currencies | (1,222,998 | ) |
| Assets and liabilities denominated in foreign currencies | (19,522 | ) |
| | (1,242,520 | ) |
| | |
NET REALIZED AND UNREALIZED GAIN (LOSS) | 6,605,755 |
|
| | |
INCREASE (DECREASE) IN NET ASSETS RESULTING FROM OPERATIONS |
| $7,221,017 |
|
| | |
| See notes to financial statements. |
22 www.calvert.com CALVERT INTERNATIONAL EQUITY FUND SEMI-ANNUAL REPORT (UNAUDITED)
STATEMENTS OF CHANGES IN NET ASSETS
|
| | | | | | | |
INCREASE (DECREASE) IN NET ASSETS | SIX MONTHS ENDED MARCH 31, 2015 | | YEAR ENDED SEPTEMBER 30, 2014 |
| Operations: | | | |
| Net investment income |
| $615,262 |
| |
| $3,856,887 |
|
| Net realized gain (loss) | 7,848,275 |
| | 38,182,047 |
|
| Change in unrealized appreciation (depreciation) | (1,242,520 | ) | | (39,050,285 | ) |
| | | | |
INCREASE (DECREASE) IN NET ASSETS RESULTING FROM OPERATIONS | 7,221,017 |
| | 2,988,649 |
|
| | | | |
| Distributions to shareholders from: | | | |
| Net investment income: | | | |
| Class A shares | (1,631,424 | ) | | (1,441,168 | ) |
| Class I shares | (1,067,547 | ) | | (1,465,772 | ) |
| Class Y shares | (128,897 | ) | | (125,098 | ) |
| Total distributions | (2,827,868 | ) | | (3,032,038 | ) |
| | | | |
| Capital share transactions: | | | |
| Shares sold: | | | |
| Class A shares | 33,874,439 |
| | 58,755,990 |
|
| Class B shares | 16,461 |
| | 22,810 |
|
| Class C shares | 1,311,205 |
| | 2,254,459 |
|
| Class I shares | 8,481,853 |
| | 15,405,740 |
|
| Class Y shares | 4,390,097 |
| | 9,173,420 |
|
| Reinvestment of distributions: | | | |
| Class A shares | 1,180,437 |
| | 1,068,320 |
|
| Class I shares | 878,598 |
| | 1,195,493 |
|
| Class Y shares | 88,086 |
| | 72,616 |
|
| Redemption fees: | | | |
| Class A shares | 388 |
| | 3,602 |
|
| Class C shares | 20 |
| | 227 |
|
| Shares redeemed: | | | |
| Class A shares | (71,858,315 | ) | | (38,938,256 | ) |
| Class B shares | (631,923 | ) | | (1,205,154 | ) |
| Class C shares | (1,662,924 | ) | | (2,857,013 | ) |
| Class I shares | (3,163,763 | ) | | (6,486,688 | ) |
| Class Y shares | (2,439,207 | ) | | (1,959,045 | ) |
| Total capital share transactions | (29,534,548 | ) | | 36,506,521 |
|
| | | | |
TOTAL INCREASE (DECREASE) IN NET ASSETS | (25,141,399 | ) | | 36,463,132 |
|
| | | | |
NET ASSETS | | | |
| Beginning of period | 392,697,980 |
| | 356,234,848 |
|
| End of period (including undistributed net investment income of $53,640 and $2,266,246, respectively) |
| $367,556,581 |
| |
| $392,697,980 |
|
| | | | |
| See notes to financial statements. |
www.calvert.com CALVERT INTERNATIONAL EQUITY FUND SEMI-ANNUAL REPORT (UNAUDITED) 23
STATEMENTS OF CHANGES IN NET ASSETS
|
| | | | | |
CAPITAL SHARE ACTIVITY | SIX MONTHS ENDED MARCH 31, 2015 | | YEAR ENDED SEPTEMBER 30, 2014 |
| Shares sold: | | | |
| Class A shares | 2,082,393 |
| | 3,451,461 |
|
| Class B shares | 1,117 |
| | 1,517 |
|
| Class C shares | 92,523 |
| | 152,718 |
|
| Class I shares | 484,303 |
| | 846,818 |
|
| Class Y shares | 253,817 |
| | 510,073 |
|
| Reinvestment of distributions: | | | |
| Class A shares | 73,138 |
| | 62,658 |
|
| Class I shares | 51,022 |
| | 65,795 |
|
| Class Y shares | 5,163 |
| | 4,041 |
|
| Shares redeemed: | | | |
| Class A shares | (4,316,558 | ) | | (2,290,221 | ) |
| Class B shares | (43,778 | ) | | (80,280 | ) |
| Class C shares | (118,058 | ) | | (193,947 | ) |
| Class I shares | (181,682 | ) | | (355,259 | ) |
| Class Y shares | (141,613 | ) | | (108,621 | ) |
| Total capital share activity | (1,758,213 | ) | | 2,066,753 |
|
| | | | |
| See notes to financial statements. |
24 www.calvert.com CALVERT INTERNATIONAL EQUITY FUND SEMI-ANNUAL REPORT (UNAUDITED)
NOTES TO FINANCIAL STATEMENTS
NOTE A — SIGNIFICANT ACCOUNTING POLICIES
General: Calvert International Equity Fund (the “Fund”), a series of Calvert World Values Fund, Inc., is registered under the Investment Company Act of 1940 as a diversified, open-end management investment company. Calvert World Values Fund, Inc. is comprised of four separate series. The operations of each series are accounted for separately. The Fund offers five classes of shares of capital stock - Classes A, B, C, I, and Y. Class A shares are sold with a maximum front-end sales charge of 4.75%. Class B shares are sold without a front-end sales charge and, with certain exceptions, will be charged a deferred sales charge at the time of redemption, depending on how long investors have owned the shares. Class B shares are no longer offered for purchase, except through reinvestment of dividends and/or distributions and through certain exchanges. Class B shares were closed effective April 20, 2015. Class C shares are sold without a front-end sales charge and, with certain exceptions, will be charged a deferred sales charge on shares sold within one year of purchase. Class B and Class C shares have higher levels of expenses than Class A shares. Class I shares require a minimum account balance of $1,000,000. The $1 million minimum initial investment is waived for retirement plans that trade through omnibus accounts and may be waived for certain other institutional accounts where it is believed to be in the best interest of the Fund and its shareholders. Class I shares have no front-end or deferred sales charge and have lower levels of expenses than Class A shares. Class Y shares are generally only available to wrap or similar fee-based programs offered by financial intermediaries, foundations, and endowments that have entered into an agreement with the Fund’s Distributor to offer Class Y shares. Class Y shares have no front-end or deferred sales charge and have lower levels of expenses than Class A shares. Each class has different: (a) dividend rates, due to differences in Distribution Plan expenses and other class-specific expenses, (b) exchange privileges and (c) class-specific voting rights.
Security Valuation: Net asset value per share is determined every business day as of the close of the regular session of the New York Stock Exchange (generally 4:00 p.m. Eastern time). The Fund uses independent pricing services approved by the Board of Directors (“the Board”) to value its investments wherever possible. Investments for which market quotations are not available or deemed not reliable are fair valued in good faith under the direction of the Board.
The Board has adopted Valuation Procedures (the “Procedures”) to determine the fair value of securities and other financial instruments for which market prices are not readily available or which may not be reliably priced. The Board has delegated the day-to-day responsibility for determining the fair value of assets of the Fund, except Special Equities investments, to Calvert Investment Management, Inc. (the “Advisor” or “Calvert”) and has provided these Procedures to govern Calvert in its valuation duties. Special Equities investments, as described in the Fund’s prospectus and statement of additional information, are fair valued by the Board’s Audit Committee (prior to January 1, 2015, by the Special Equities Committee).
Calvert has chartered an internal Valuation Committee to oversee the implementation of these Procedures and to assist it in carrying out the valuation responsibilities that the Board has delegated.
The Valuation Committee meets on a regular basis to review illiquid securities and other investments which may not have readily available market prices. The Valuation Committee’s fair valuation determinations are subject to review, approval and ratification by the Board at its next regularly scheduled meeting covering the calendar quarter in which the fair valuation was determined.
www.calvert.com CALVERT INTERNATIONAL EQUITY FUND SEMI-ANNUAL REPORT (UNAUDITED) 25
The Valuation Committee utilizes various methods to measure the fair value of the Fund’s investments. Generally Accepted Accounting Principles (GAAP) establishes a disclosure hierarchy that categorizes the inputs to valuation techniques used to value assets and liabilities at measurement date. These inputs are summarized in the three broad levels listed below:
Level 1 - quoted prices in active markets for identical securities
Level 2 - other significant observable inputs (including quoted prices for similar securities, interest rates, prepayment speeds, credit risk, etc.)
Level 3 - significant unobservable inputs (including the Fund’s own assumptions in determining the fair value of investments)
The inputs or methodologies used for valuing securities are not necessarily an indication of the risk associated with investing in those securities.
Changes in valuation techniques may result in transfers in or out of an investment’s assigned level within the hierarchy during the period. At March 31, 2015, $206,991,697 transferred out of Level 1 into Level 2. Valuation techniques used to value the Fund's investments by major category are as follows:
Equity securities, including restricted securities and venture capital securities, for which market quotations are readily available, are valued at the last reported sale price or official closing price as reported by an independent pricing service on the primary market or exchange on which they are traded and are categorized as Level 1 in the hierarchy. In the event there were no sales during the day or closing prices are not available, securities are valued at the last quoted bid price or using the last available price and are categorized as Level 2 in the hierarchy. Foreign securities are valued based on quotations from the principal market in which such securities are normally traded. If events occur after the close of the principal market in which foreign securities are traded, and before the close of business of the Fund, that are expected to materially affect the value of those securities, then they are valued at their fair value taking these events into account. The Fund has retained a third party fair value pricing service to quantitatively analyze the price movement of its holdings on foreign exchanges and to automatically fair value if the variation from the prior day’s closing price exceeds specified parameters. Such securities would be categorized as Level 2 in the hierarchy in these circumstances. Utilizing this technique may result in transfers between Level 1 and Level 2. For restricted securities and private placements where observable inputs are limited, assumptions about market activity and risk are used and such securities are categorized as Level 3 in the hierarchy.
Venture capital securities for which market quotations are not readily available are fair valued by the Fund’s Board of Directors and are categorized as Level 3 in the hierarchy. Venture capital direct equity securities are generally valued using the most appropriate and applicable method to measure fair value in light of each company’s situation. Methods may include market, income or cost approaches with discounts as appropriate based on assumptions of liquidation or exit risk. Examples of the market approach are subsequent rounds of financing, comparable transactions, and revenue times an industry multiple. An example of the income approach is the discounted cash flow. Examples of the cost approach are replacement cost, salvage value, or net asset percentage. Venture capital limited partnership (“LP”) securities are valued at the fair value reported by the general partner of the partnership adjusted as necessary to reflect subsequent capital calls and distributions and any other available information, as a practical expedient. In the absence of a reported LP unit value, fair value may be estimated based on the Fund’s percentage equity in the partnership and/or other balance sheet information and portfolio value for the
26 www.calvert.com CALVERT INTERNATIONAL EQUITY FUND SEMI-ANNUAL REPORT (UNAUDITED)
most recently available period reported by the general partner. In some cases adjustments may be made to account for daily pricing of material public holdings within the partnership. Venture capital debt securities are valued based on assumptions of credit and market risk. For venture capital securities denominated in foreign currency, the fair value is marked to the daily exchange rate.
Debt securities, including restricted securities, are valued based on evaluated prices received from independent pricing services or from dealers who make markets in such securities and are generally categorized as Level 2 in the hierarchy. Short-term securities of sufficient credit quality with remaining maturities of sixty days or less for which quotations are not readily available are valued at amortized cost, which approximates fair value, and are categorized as Level 2 in the hierarchy.
When independent prices are unavailable or unreliable, debt securities may be valued utilizing pricing matrices which consider similar factors that would be used by independent pricing services. These are generally categorized as Level 2 in the hierarchy but may be Level 3 depending on the circumstances.
If a market value cannot be determined for a security using the methodologies described above, or if, in the good faith opinion of the Advisor, the market value does not constitute a readily available market quotation, or if a significant event has occurred that would materially affect the value of the security, the security will be fair valued as determined in good faith by the Valuation Committee or with respect to Special Equities investments, by the Audit Committee using the venture capital methodologies described above.
The Valuation Committee considers a number of factors, including significant unobservable valuation inputs when arriving at fair value. It considers all significant facts that are reasonably available and relevant to the determination of fair value.
The Valuation Committee primarily employs a market-based approach which may use related or comparable assets or liabilities, recent transactions, market multiples, book values, and other relevant information for the investment to determine the fair value of the investment. When more appropriate, the fund may employ an income-based or cost approach. An income-based valuation approach discounts anticipated future cash flows of the investment to calculate a present amount (discounted). The measurement is based on the value indicated by current market expectations about those future amounts. Discounts may also be applied due to the nature or duration of any restrictions on the disposition of the investments. A cost based approach is based on the amount that currently would be required to replace the service capacity of an asset (current replacement cost). From the seller’s perspective, the price that would be received for the asset is determined based on the cost to a buyer to acquire or construct a substitute asset of comparable utility, adjusted for obsolescence.
The values assigned to fair value investments are based on available information and do not necessarily represent amounts that might ultimately be realized. Further, due to the inherent uncertainty of valuations of such investments, the fair values may differ significantly from the values that would have been used had an active market existed, and the differences could be material. The Valuation Committee employs various methods for calibrating these valuation approaches including a regular review of key inputs and assumptions, transactional back-testing or disposition analysis and reviews of any related market activity.
At March 31, 2015, securities valued at $7,391,560, or 2.0% of net assets, were fair valued in good faith under the direction of the Board.
www.calvert.com CALVERT INTERNATIONAL EQUITY FUND SEMI-ANNUAL REPORT (UNAUDITED) 27
The following table summarizes the market value of the Fund’s holdings as of March 31, 2015, based on the inputs used to value them:
|
| | | | | | | | | | | | | | | |
| | VALUATION INPUTS |
INVESTMENTS IN SECURITIES | LEVEL 1 | | LEVEL 2 | | LEVEL 3 | | TOTAL |
| Equity securities* |
| $128,881,966 |
| |
| $206,991,697 | ** | | — |
| | $335,873,663*** |
|
| Other debt obligations | — |
| | 36,710,808 |
| | — |
| | 36,710,808 |
|
| Venture capital | — |
| | 226,071 |
| | $2,772,009 | | 2,998,080 |
|
| TOTAL |
| $128,881,966 |
| |
| $243,928,576 |
| |
| $2,772,009 | **** | |
| $375,582,551 |
|
| | | | | | | | |
* For further breakdown of equity securities by country, please refer to the Statement of Net Assets. ** Includes certain securities trading primarily outside the U.S. whose value was adjusted as a result of significant market movements following the close of local trading. On March 31, 2015, price movements exceeded specified parameters and the third party fair value pricing service quantitatively fair valued the affected securities. *** Exclusive of $526,038 venture capital equity shown in venture capital heading. **** Level 3 securities represent 0.8% of net assets. |
At March 31, 2015, a significant transfer out of Level 1 and into Level 2 occurred.
On March 31, 2015, price movements exceeded specified parameters and the third party fair value pricing service quantitatively fair valued the affected securities.
Restricted Securities: The Fund may invest in securities that are subject to legal or contractual restrictions on resale. Generally, these securities may only be sold publicly upon registration under the Securities Act of 1933 or in transactions exempt from such registration. Information regarding restricted securities is included at the end of the Fund’s Statement of Net Assets.
Security Transactions and Net Investment Income: Security transactions are accounted for on trade date. Realized gains and losses are recorded on an identified cost basis and may include proceeds from litigation. Dividend income is recorded on the ex-dividend date or, in the case of dividends on certain foreign securities, as soon as the Fund is informed of the ex-dividend date. Withholding taxes on foreign dividends have been provided for in accordance with the Fund’s understanding of the applicable country’s tax rules and rates. Distributions received on securities that represent a return of capital or capital gain are recorded as a reduction of cost of investments and/or as a realized gain. Interest income, which includes amortization of premium and accretion of discount on debt securities, is accrued as earned. Investment income and realized and unrealized gains and losses are allocated to separate classes of shares based upon the relative net assets of each class. Expenses arising in connection with a specific class are charged directly to that class. Expenses common to the classes are allocated to each class in proportion to their relative net assets.
Foreign Currency Transactions: The Fund’s accounting records are maintained in U.S. dollars. For valuation of assets and liabilities on each date of net asset value determination, foreign denominations are converted into U.S. dollars using the current exchange rate. Security transactions, income and expenses are translated at the prevailing rate of exchange on the date of the event. The effect of changes in foreign exchange rates on securities and foreign currencies is included in the net realized and unrealized gain or loss on securities and foreign currencies.
28 www.calvert.com CALVERT INTERNATIONAL EQUITY FUND SEMI-ANNUAL REPORT (UNAUDITED)
Distributions to Shareholders: Distributions to shareholders are recorded by the Fund on ex-dividend date. Dividends from net investment income and distributions from net realized capital gains, if any, are paid at least annually. Distributions are determined in accordance with income tax regulations which may differ from generally accepted accounting principles; accordingly, periodic reclassifications are made within the Fund’s capital accounts to reflect income and gains available for distribution under income tax regulations.
Estimates: The preparation of the financial statements in conformity with accounting principles generally accepted in the United States requires management to make estimates and assumptions that affect the reported amounts of assets and liabilities and disclosure of contingent assets and liabilities at the date of the financial statements and the reported amounts of income and expenses during the reported period. Actual results could differ from those estimates.
Redemption Fees: The Fund charges a 2% redemption fee on redemptions, including exchanges, made within 30 days of purchase in the same Fund (within seven days for Class I shares). The redemption fee is accounted for as an addition to paid-in capital and is intended to discourage market-timers by ensuring that short-term trading costs are borne by the investors making the transactions and not the shareholders already in the Fund. This fee was eliminated effective February 2, 2015.
Federal Income Taxes: No provision for federal income or excise tax is required since the Fund intends to continue to qualify as a regulated investment company under the Internal Revenue Code and to distribute substantially all of its taxable earnings.
Management has analyzed the Fund’s tax positions taken for all open federal income tax years and has concluded that no provision for federal income tax is required in the Fund’s financial statements. A Fund’s federal tax return is subject to examination by the Internal Revenue Service for a period of three years.
NOTE B — RELATED PARTY TRANSACTIONS
Calvert Investment Management, Inc. (the “Advisor”) is wholly-owned by Calvert Investments, Inc., which is indirectly wholly-owned by Ameritas Mutual Holding Company. The Advisor provides investment advisory services and pays the salaries and fees of officers and Directors of the Fund who are employees of the Advisor or its affiliates. For its services, the Advisor receives a monthly fee based on the following annual rates of average daily net assets: .75% on the first $250 million, .725% on the next $250 million, and .675% on the excess of $500 million. Under the terms of the agreement, $231,340 was payable.
The Advisor has contractually agreed to limit net annual fund operating expenses through January 31, 2016 for Class I and Class Y. The contractual expense cap is 1.10% and 1.39%, respectively. For the purpose of this expense limit, operating expenses do not include interest expense, brokerage commissions, taxes, and extraordinary expenses. This expense limitation does not limit any acquired fund fees and expenses, if any. At period end, $838 was receivable from the Advisor. The Advisor voluntarily reimbursed Class B shares for expenses of $7,474 for the six months ended March 31, 2015.
Calvert Investment Administrative Services, Inc., an affiliate of the Advisor, provides administrative services to the Fund for an annual fee, payable monthly, of .35% for Classes A, B, C, and Y, and .15% for Class I, based on their average daily net assets. Under the terms of the agreement, $92,349 was payable at period end.
Calvert Investment Distributors, Inc. (“CID”), an affiliate of the Advisor, is the distributor and principal underwriter for the Fund. Pursuant to Rule 12b-1 under the Investment Company Act
www.calvert.com CALVERT INTERNATIONAL EQUITY FUND SEMI-ANNUAL REPORT (UNAUDITED) 29
of 1940, the Fund has adopted a Distribution Plan that permits the Fund to pay certain expenses associated with the distribution and servicing of its shares. The expenses paid may not exceed .35%, 1.00% and 1.00% annually of average daily net assets of Class A, B, and C, respectively. The amount actually paid by the Fund is an annualized fee, payable monthly, of .25%, 1.00% and 1.00% of the Fund’s average daily net assets of Class A, B, and C, respectively. Class I and Class Y shares do not have Distribution Plan expenses. Under the terms of agreement, $64,699 was payable at period end.
CID received $17,482 as its portion of commissions charged on sales of the Fund’s Class A shares for the six months ended March 31, 2015.
Calvert Investment Services, Inc. (“CIS”), an affiliate of the Advisor, is the shareholder servicing agent for the Fund. For its services, CIS received a fee of $48,191 for the period ended March 31, 2015. Under the terms of the agreement, $7,940 was payable at period end. Boston Financial Data Services, Inc. is the transfer and dividend disbursing agent.
The Fund invests in Community Investment Notes issued by the Calvert Social Investment Foundation (the “CSI Foundation”). The CSI Foundation is a 501(c)(3) non-profit organization that receives in-kind support from Calvert and its subsidiaries. The Fund has received an exemptive order from the Securities and Exchange Commission permitting the Fund to make investments in these notes under certain conditions.
Each Director of the Funds who is not an employee of the Advisor or its affiliates receives an annual retainer of $52,000 ($48,000 prior to January 1, 2015) plus a meeting fee of up to $3,000 for each Board meeting attended. Additional fees of up to $6,000 ($5,000 prior to January 1, 2015) annually may be paid to the Committee chairs ($10,000 for the Board chair and the Special Equities Committee chair) and $2,500 annually may be paid to Committee members, plus a Committee meeting fee of $500 for each Committee meeting attended. Directors’ fees are allocated to each of the Funds served.
NOTE C — INVESTMENT ACTIVITY AND TAX INFORMATION
During the period, the cost of purchases and proceeds from sales of investments, other than short-term securities, were $104,310,312, and $148,482,648, respectively.
The Fund may purchase securities, typically short-term variable rate demand notes, from or sell to other funds managed by the Advisor. These interportfolio transactions are primarily used for cash management purposes and are made pursuant to Rule 17a-7 of the Investment Company Act of 1940. For the six months ended March 31, 2015, such sales transactions were $201,633. The realized loss on sales transactions was $92,252.
|
| | | |
CAPITAL LOSS CARRYFORWARD | |
| |
EXPIRATION DATE | |
| 30-Sep-17 |
| ($44,177,301 | ) |
| 30-Sep-18 | (105,942,268 | ) |
| 30-Sep-19 | (10,386,632 | ) |
Under the Regulated Investment Company Modernization Act of 2010, capital losses incurred in taxable years beginning after December 22, 2010 can be carried forward for an unlimited period. These losses are required to be utilized prior to the losses incurred in pre-enactment taxable years and will retain their character as either long-term or short term. Losses incurred in pre-enactment taxable years can be utilized until expiration.
30 www.calvert.com CALVERT INTERNATIONAL EQUITY FUND SEMI-ANNUAL REPORT (UNAUDITED)
As of March 31, 2015, the tax basis components of unrealized appreciation/(depreciation) and the federal tax cost were as follows:
|
| | | |
| Unrealized appreciation |
| $34,388,376 |
|
| Unrealized (depreciation) | (16,423,810 | ) |
| Net unrealized appreciation/(depreciation) |
| $17,964,566 |
|
| | |
| Federal income tax cost of investments |
| $357,617,985 |
|
NOTE D — LINE OF CREDIT
A financing agreement is in place with the Calvert Funds and State Street Corporation (“SSC”). Under the agreement, SSC provides an unsecured line of credit facility, in the aggregate amount of $50 million ($25 million committed and $25 million uncommitted), accessible by the Funds for temporary or emergency purposes only. Borrowings bear interest at the higher of the London Interbank Offered Rate (LIBOR) or the overnight Federal Funds Rate plus 1.25% per annum. A commitment fee of .125% per annum is incurred on the unused portion of the committed facility, which is allocated to all participating funds. The fund had no borrowings under the agreement during the six months ending March 31, 2015.
NOTE E — AFFILIATED COMPANIES
An affiliated company is a company in which the Fund has a direct or indirect ownership of, control of, or voting power of 5 percent or more of the outstanding voting shares. Affiliated companies of the Fund as of March 31, 2015 are as follows:
|
| | | |
AFFILIATES | COST | | VALUE |
| Bioceptive, Inc. | $252,445 | | $299,967 |
| gNet Defta Development Holdings LLC, LP | 400,000 | | 313,827 |
| SEAF Central & Eastern European Growth Fund LLC, LP | 327,254 | | 429,009 |
| TOTALS | $979,699 | | $1,042,803 |
NOTE F — OTHER
In connection with certain venture capital investments, the Fund is committed to future capital calls, which will increase the Fund’s investment in these securities. The aggregate amount of the future capital commitments totals $1,587,411 at March 31, 2015.
NOTE G — SUBSEQUENT EVENTS
All existing Class B shares of the Fund were automatically converted to Class A shares of the Fund at the close of business on April 20, 2015, without the imposition of the applicable Class A sales load or the Class B contingent deferred sales charge. Class B shares were closed at that time and are no longer available.
The Advisor has contractually agreed to further limit net annual fund operating expenses. Effective April 1, 2015, the contractual expense caps are 1.38%, 2.14%, 0.95%, and 1.13% for Class A, Class C, Class I, and Class Y, respectively. These expense limitations will be in effect through January 31, 2017.
In preparing the financial statements as of March 31, 2015, no other subsequent events or transactions occurred that would have required recognition or disclosure in these financial statements.
www.calvert.com CALVERT INTERNATIONAL EQUITY FUND SEMI-ANNUAL REPORT (UNAUDITED) 31
FINANCIAL HIGHLIGHTS
|
| | | | | | | | | | | |
| | | PERIODS ENDED | |
CLASS A SHARES | MARCH 31, 2015 (z) | | SEPTEMBER 30, 2014 (z) | | SEPTEMBER 30, 2013 (z) |
| Net asset value, beginning |
| $16.51 |
| |
| $16.44 |
| |
| $13.49 |
|
| Income from investment operations: | | | | | |
| Net investment income | .01 |
| | .15 |
| | .08 |
|
| Net realized and unrealized gain (loss) | .24 |
| | .02 |
| | 2.98 |
|
| Total from investment operations | .25 |
| | .17 |
| | 3.06 |
|
| Distributions from: | | | | | |
| Net investment income | (.10 | ) | | (.10 | ) | | (.11 | ) |
| Net realized gain | — |
| | — |
| | — |
|
| Total distributions | (.10 | ) | | (.10 | ) | | (.11 | ) |
| Total increase (decrease) in net asset value | .15 |
| | .07 |
| | 2.95 |
|
| Net asset value, ending |
| $16.66 |
| |
| $16.51 |
| |
| $16.44 |
|
| | | | | | |
| Total return* | 1.56 | % | | .99 | % | | 22.82 | % |
Ratios to average net assets: A | | | | | |
| Net investment income | .16% (a) |
| | .88 | % | | .52 | % |
| Total expenses | 1.68% (a) |
| | 1.66 | % | | 1.76 | % |
| Expenses before offsets | 1.68% (a) |
| | 1.66 | % | | 1.76 | % |
| Net expenses | 1.68% (a) |
| | 1.66 | % | | 1.76 | % |
| Portfolio turnover | 28 | % | | 82 | % | | 40 | % |
| Net assets, ending (in thousands) |
| $230,145 |
| |
| $263,718 |
| |
| $242,464 |
|
| | | | | | |
|
| | | | | | | | | | | |
| | | | YEARS ENDED | | |
CLASS A SHARES | SEPTEMBER 30, 2012 (z) | | SEPTEMBER 30, 2011 (z) | | SEPTEMBER 30, 2010 (z) |
| Net asset value, beginning |
| $11.84 |
| |
| $13.88 |
| |
| $13.83 |
|
| Income from investment operations: | | | | | |
| Net investment income | .12 |
| | .15 |
| | .06 |
|
| Net realized and unrealized gain (loss) | 1.68 |
| | (2.15 | ) | | .09 |
|
| Total from investment operations | 1.80 |
| | (2.00 | ) | | .15 |
|
| Distributions from: | | | | | |
| Net investment income | (.15 | ) | | (.04 | ) | | (.10 | ) |
| Net realized gain | — |
| | — |
| | — |
|
| Total distributions | (.15 | ) | | (.04 | ) | | (.10 | ) |
| Total increase (decrease) in net asset value | 1.65 |
| | (2.04 | ) | | .05 |
|
| Net asset value, ending |
| $13.49 |
| |
| $11.84 |
| |
| $13.88 |
|
| | | | | | |
| Total return* | 15.34 | % | | (14.47 | %) | | 1.08 | % |
Ratios to average net assets: A | | | | | |
| Net investment income | .96 | % | | 1.03 | % | | .46 | % |
| Total expenses | 1.84 | % | | 1.80 | % | | 1.83 | % |
| Expenses before offsets | 1.80 | % | | 1.80 | % | | 1.80 | % |
| Net expenses | 1.80 | % | | 1.80 | % | | 1.80 | % |
| Portfolio turnover | 43 | % | | 49 | % | | 133 | % |
| Net assets, ending (in thousands) |
| $183,588 |
| |
| $173,936 |
| |
| $245,309 |
|
| See notes to financial highlights. |
32 www.calvert.com CALVERT INTERNATIONAL EQUITY FUND SEMI-ANNUAL REPORT (UNAUDITED)
FINANCIAL HIGHLIGHTS
|
| | | | | | | | | | | |
| | | PERIODS ENDED | |
CLASS B SHARES | MARCH 31, 2015 (z) | | SEPTEMBER 30, 2014 (z) | | SEPTEMBER 30, 2013 (z) |
| Net asset value, beginning |
| $14.45 |
| |
| $14.49 |
| |
| $11.94 |
|
| Income from investment operations: | | | | | |
| Net investment income (loss) | (.08 | ) | | (.08 | ) | | (.10 | ) |
| Net realized and unrealized gain (loss) | .21 |
| | .04 |
| | 2.65 |
|
| Total from investment operations | .13 |
| | (.04 | ) | | 2.55 |
|
| Distributions from: | | | | | |
| Net investment income | — |
| | — |
| | — |
|
| Net realized gain | — |
| | — |
| | — |
|
| Total distributions | — |
| | — |
| | — |
|
| Total increase (decrease) in net asset value | .13 |
| | (.04 | ) | | 2.55 |
|
| Net asset value, ending |
| $14.58 |
| |
| $14.45 |
| |
| $14.49 |
|
| | | | | | |
| Total return* | .90 | % | | (.28 | %) | | 21.36 | % |
Ratios to average net assets: A | | | | | |
| Net investment income (loss) | (1.16%) (a) |
| | (.53 | %) | | (.75 | %) |
| Total expenses | 3.83% (a) |
| | 3.19 | % | | 3.19 | % |
| Expenses before offsets | 2.97% (a) |
| | 2.97 | % | | 2.97 | % |
| Net expenses | 2.97% (a) |
| | 2.97 | % | | 2.97 | % |
| Portfolio turnover | 28 | % | | 82 | % | | 40 | % |
| Net assets, ending (in thousands) |
| $1,406 |
| |
| $2,010 |
| |
| $3,158 |
|
| | | | | | |
|
| | | | | | | | | | | |
| | | | YEARS ENDED | | |
CLASS B SHARES | SEPTEMBER 30, 2012 (z) | | SEPTEMBER 30, 2011 (z) | | SEPTEMBER 30, 2010 (z) |
| Net asset value, beginning |
| $10.48 |
| |
| $12.40 |
| |
| $12.40 |
|
| Income from investment operations: | | | | | |
| Net investment income (loss) | (.03 | ) | | (.03 | ) | | (.09 | ) |
| Net realized and unrealized gain (loss) | 1.49 |
| | (1.89 | ) | | .09 |
|
| Total from investment operations | 1.46 |
| | (1.92 | ) | | — |
|
| Distributions from: | | | | | |
| Net investment income | — |
| | — |
| | — |
|
| Net realized gain | — |
| | — |
| | — |
|
| Total distributions | — |
| | — |
| | — |
|
| Total increase (decrease) in net asset value | 1.46 |
| | (1.92 | ) | | — |
|
| Net asset value, ending |
| $11.94 |
| |
| $10.48 |
| |
| $12.40 |
|
| | | | | | |
| Total return* | 13.93 | % | | (15.48 | %) | | .00 | % |
Ratios to average net assets: A | | | | | |
| Net investment income (loss) | (.26 | %) | | (.21 | %) | | (.74 | %) |
| Total expenses | 3.18 | % | | 3.02 | % | | 3.03 | % |
| Expenses before offsets | 2.97 | % | | 2.97 | % | | 2.97 | % |
| Net expenses | 2.97 | % | | 2.97 | % | | 2.97 | % |
| Portfolio turnover | 43 | % | | 49 | % | | 133 | % |
| Net assets, ending (in thousands) |
| $3,607 |
| |
| $4,506 |
| |
| $6,850 |
|
| See notes to financial highlights. |
www.calvert.com CALVERT INTERNATIONAL EQUITY FUND SEMI-ANNUAL REPORT (UNAUDITED) 33
FINANCIAL HIGHLIGHTS
|
| | | | | | | | | | | |
| | | PERIODS ENDED | |
CLASS C SHARES | MARCH 31, 2015 (z) | | SEPTEMBER 30, 2014 (z) | | SEPTEMBER 30, 2013 (z) |
| Net asset value, beginning |
| $14.27 |
| |
| $14.26 |
| |
| $11.71 |
|
| Income from investment operations: | | | | | |
| Net investment income (loss) | (.05 | ) | | (.01 | ) | | (.05 | ) |
| Net realized and unrealized gain (loss) | .21 |
| | .02 |
| | 2.60 |
|
| Total from investment operations | .16 |
| | .01 |
| | 2.55 |
|
| Distributions from: | | | | | |
| Net investment income | — |
| | — |
| | — |
|
| Net realized gain | — |
| | — |
| | — |
|
| Total distributions | — |
| | — |
| | — |
|
| Total increase (decrease) in net asset value | .16 |
| | .01 |
| | 2.55 |
|
| Net asset value, ending |
| $14.43 |
| |
| $14.27 |
| |
| $14.26 |
|
| | | | | | |
| Total return* | 1.12 | % | | .07 | % | | 21.78 | % |
Ratios to average net assets: A | | | | | |
| Net investment income (loss) | (.69%) (a) |
| | (.06 | %) | | (.40 | %) |
| Total expenses | 2.61% (a) |
| | 2.57 | % | | 2.65 | % |
| Expenses before offsets | 2.61% (a) |
| | 2.57 | % | | 2.65 | % |
| Net expenses | 2.61% (a) |
| | 2.57 | % | | 2.65 | % |
| Portfolio turnover | 28 | % | | 82 | % | | 40 | % |
| Net assets, ending (in thousands) |
| $16,994 |
| |
| $17,173 |
| |
| $17,746 |
|
| | | | | | |
|
| | | | | | | | | | | |
| | | | YEARS ENDED | | |
CLASS C SHARES | SEPTEMBER 30, 2012 (z) | | SEPTEMBER 30, 2011 (z) | | SEPTEMBER 30, 2010 (z) |
| Net asset value, beginning |
| $10.26 |
| |
| $12.10 |
| |
| $12.07 |
|
| Income from investment operations: | | | | | |
| Net investment income (loss) | .01 |
| | .01 |
| | (.05 | ) |
| Net realized and unrealized gain (loss) | 1.45 |
| | (1.85 | ) | | .08 |
|
| Total from investment operations | 1.46 |
| | (1.84 | ) | | .03 |
|
| Distributions from: | | | | | |
| Net investment income | (.01 | ) | | — |
| | — |
|
| Net realized gain | — |
| | — |
| | — |
|
| Total distributions | (.01 | ) | | — |
| | — |
|
| Total increase (decrease) in net asset value | 1.45 |
| | (1.84 | ) | | .03 |
|
| Net asset value, ending |
| $11.71 |
| |
| $10.26 |
| |
| $12.10 |
|
| | | | | | |
| Total return* | 14.23 | % | | (15.21 | %) | | .25 | % |
Ratios to average net assets: A | | | | | |
| Net investment income (loss) | .05 | % | | .12 | % | | (.41 | %) |
| Total expenses | 2.72 | % | | 2.67 | % | | 2.72 | % |
| Expenses before offsets | 2.69 | % | | 2.67 | % | | 2.69 | % |
| Net expenses | 2.69 | % | | 2.67 | % | | 2.69 | % |
| Portfolio turnover | 43 | % | | 49 | % | | 133 | % |
| Net assets, ending (in thousands) |
| $15,922 |
| |
| $16,195 |
| |
| $21,942 |
|
| See notes to financial highlights. |
34 www.calvert.com CALVERT INTERNATIONAL EQUITY FUND SEMI-ANNUAL REPORT (UNAUDITED)
FINANCIAL HIGHLIGHTS
|
| | | | | | | | | | | |
| | | PERIODS ENDED | |
CLASS I SHARES | MARCH 31, 2015 (z) | | SEPTEMBER 30, 2014 (z) | | SEPTEMBER 30, 2013 (z) |
| Net asset value, beginning |
| $17.68 |
| |
| $17.69 |
| |
| $14.52 |
|
| Income from investment operations: | | | | | |
| Net investment income | .08 |
| | .28 |
| | .17 |
|
| Net realized and unrealized gain (loss) | .25 |
| | .02 |
| | 3.24 |
|
| Total from investment operations | .33 |
| | .30 |
| | 3.41 |
|
| Distributions from: | | | | | |
| Net investment income | (.20 | ) | | (.31 | ) | | (.24 | ) |
| Net realized gain | — |
| | — |
| | — |
|
| Total distributions | (.20 | ) | | (.31 | ) | | (.24 | ) |
| Total increase (decrease) in net asset value | .13 |
| | (.01 | ) | | 3.17 |
|
| Net asset value, ending |
| $17.81 |
| |
| $17.68 |
| |
| $17.69 |
|
| | | | | | |
| Total return* | 1.91 | % | | 1.64 | % | | 23.74 | % |
Ratios to average net assets: A | | | | | |
| Net investment income | .92% (a) |
| | 1.53 | % | | 1.07 | % |
| Total expenses | 1.03% (a) |
| | 1.02 | % | | 1.06 | % |
| Expenses before offsets | 1.03% (a) |
| | 1.02 | % | | 1.06 | % |
| Net expenses | 1.03% (a) |
| | 1.02 | % | | 1.06 | % |
| Portfolio turnover | 28 | % | | 82 | % | | 40 | % |
| Net assets, ending (in thousands) |
| $99,286 |
| |
| $92,318 |
| |
| $82,499 |
|
| | | | | | |
|
| | | | | | | | | | | |
| | | | YEARS ENDED | | |
CLASS I SHARES | SEPTEMBER 30, 2012 (z) | | SEPTEMBER 30, 2011 (z) | | SEPTEMBER 30, 2010 (z) |
| Net asset value, beginning |
| $12.70 |
| |
| $14.83 |
| |
| $14.79 |
|
| Income from investment operations: | | | | | |
| Net investment income | .24 |
| | .26 |
| | .17 |
|
| Net realized and unrealized gain (loss) | 1.79 |
| | (2.30 | ) | | .11 |
|
| Total from investment operations | 2.03 |
| | (2.04 | ) | | .28 |
|
| Distributions from: | | | | | |
| Net investment income | (.21 | ) | | (.09 | ) | | (.24 | ) |
| Net realized gain | — |
| | — |
| | — |
|
| Total distributions | (.21 | ) | | (.09 | ) | | (.24 | ) |
| Total increase (decrease) in net asset value | 1.82 |
| | (2.13 | ) | | .04 |
|
| Net asset value, ending |
| $14.52 |
| |
| $12.70 |
| |
| $14.83 |
|
| | | | | | |
| Total return* | 16.16 | % | | (13.84 | %) | | 1.91 | % |
Ratios to average net assets: A | | | | | |
| Net investment income | 1.71 | % | | 1.74 | % | | 1.17 | % |
| Total expenses | 1.09 | % | | 1.07 | % | | 1.08 | % |
| Expenses before offsets | 1.06 | % | | 1.06 | % | | 1.06 | % |
| Net expenses | 1.06 | % | | 1.06 | % | | 1.06 | % |
| Portfolio turnover | 43 | % | | 49 | % | | 133 | % |
| Net assets, ending (in thousands) |
| $101,203 |
| |
| $89,142 |
| |
| $86,475 |
|
| See notes to financial highlights. |
www.calvert.com CALVERT INTERNATIONAL EQUITY FUND SEMI-ANNUAL REPORT (UNAUDITED) 35
FINANCIAL HIGHLIGHTS
|
| | | | | | | | | | | |
| | | PERIODS ENDED | |
CLASS Y SHARES | MARCH 31, 2015 (z) | | SEPTEMBER 30, 2014 (z) | | SEPTEMBER 30, 2013 (z) |
| Net asset value, beginning |
| $17.45 |
| |
| $17.38 |
| |
| $14.25 |
|
| Income from investment operations: | | | | | |
| Net investment income | .06 |
| | .23 |
| | .14 |
|
| Net realized and unrealized gain (loss) | .24 |
| | .02 |
| | 3.15 |
|
| Total from investment operations | .30 |
| | .25 |
| | 3.29 |
|
| Distributions from: | | | | | |
| Net investment income | (.13 | ) | | (.18 | ) | | (.16 | ) |
| Net realized gain | — |
| | — |
| | — |
|
| Total distributions | (.13 | ) | | (.18 | ) | | (.16 | ) |
| Total increase (decrease) in net asset value | .17 |
| | .07 |
| | 3.13 |
|
| Net asset value, ending |
| $17.62 |
| |
| $17.45 |
| |
| $17.38 |
|
| | | | | | |
| Total return* | 1.72 | % | | 1.41 | % | | 23.27 | % |
Ratios to average net assets: A | | | | | |
| Net investment income | .65% (a) |
| | 1.27 | % | | .90 | % |
| Total expenses | 1.32% (a) |
| | 1.31 | % | | 1.41 | % |
| Expenses before offsets | 1.32% (a) |
| | 1.31 | % | | 1.39 | % |
| Net expenses | 1.32% (a) |
| | 1.31 | % | | 1.39 | % |
| Portfolio turnover | 28 | % | | 82 | % | | 40 | % |
| Net assets, ending (in thousands) |
| $19,725 |
| |
| $17,479 |
| |
| $10,367 |
|
| | | | | | |
|
| | | | | | | | | | | |
| | | | YEARS ENDED | | |
CLASS Y SHARES | SEPTEMBER 30, 2012 (z) | | SEPTEMBER 30, 2011 (z) | | SEPTEMBER 30, 2010 (z) |
| Net asset value, beginning |
| $12.45 |
| |
| $14.53 |
| |
| $14.34 |
|
| Income from investment operations: | | | | | |
| Net investment income | .18 |
| | .24 |
| | .08 |
|
| Net realized and unrealized gain (loss) | 1.77 |
| | (2.30 | ) | | .17 |
|
| Total from investment operations | 1.95 |
| | (2.06 | ) | | .25 |
|
| Distributions from: | | | | | |
| Net investment income | (.15 | ) | | (.02 | ) | | (.06 | ) |
| Net realized gain | — |
| | — |
| | — |
|
| Total distributions | (.15 | ) | | (.02 | ) | | (.06 | ) |
| Total increase (decrease) in net asset value | 1.80 |
| | (2.08 | ) | | .19 |
|
| Net asset value, ending |
| $14.25 |
| |
| $12.45 |
| |
| $14.53 |
|
| | | | | | |
| Total return* | 15.80 | % | | (14.20 | %) | | 1.73 | % |
Ratios to average net assets: A | | | | | |
| Net investment income | 1.36 | % | | 1.56 | % | | .61 | % |
| Total expenses | 1.46 | % | | 1.51 | % | | 2.14 | % |
| Expenses before offsets | 1.39 | % | | 1.39 | % | | 1.39 | % |
| Net expenses | 1.39 | % | | 1.39 | % | | 1.39 | % |
| Portfolio turnover | 43 | % | | 49 | % | | 133 | % |
| Net assets, ending (in thousands) |
| $7,535 |
| |
| $7,398 |
| |
| $2,790 |
|
| See notes to financial highlights. |
36 www.calvert.com CALVERT INTERNATIONAL EQUITY FUND SEMI-ANNUAL REPORT (UNAUDITED)
|
|
A Total expenses do not reflect amounts reimbursed and/or waived by the Advisor or reductions from expense offset arrangements. Expenses before offsets reflect expenses after reimbursement and/or waiver by the Advisor but prior to reductions from expense offset arrangements. Net expenses are net of all reductions and represent the net expenses paid by the Fund. (a) Annualized. (z) Per share figures are calculated using the Average Shares Method. * Total return is not annualized for periods of less than one year and does not reflect deduction of any front-end or deferred sales charge. See notes to financial statements. |
www.calvert.com CALVERT INTERNATIONAL EQUITY FUND SEMI-ANNUAL REPORT (UNAUDITED) 37
EXPLANATION OF FINANCIAL TABLES
SCHEDULE OF INVESTMENTS
The Schedule of Investments is a snapshot of all securities held in the fund at their market value, on the last day of the reporting period. Securities are listed by asset type (e.g., common stock, corporate bonds, U.S. government obligations) or, for International and Global funds, by country, and may be further broken down into sub-groups and by industry classification.
STATEMENT OF ASSETS AND LIABILITIES
The Statement of Assets and Liabilities is often referred to as the fund’s balance sheet. It lists the value of what the fund owns, is due and owes on the last day of the reporting period. The fund’s assets include the market value of securities owned, cash, receivables for securities sold and shareholder subscriptions, and receivables for dividends and interest payments that have been earned, but not yet received. The fund’s liabilities include payables for securities purchased and shareholder redemptions, and expenses owed but not yet paid. The statement also reports the fund’s net asset value (NAV) per share on the last day of the reporting period. The NAV is calculated by dividing the fund’s net assets (assets minus liabilities) by the number of shares outstanding. This statement is accompanied by a Schedule of Investments. Alternatively, if certain conditions are met, a Statement of Net Assets may be presented in lieu of this statement and the Schedule of Investments.
STATEMENT OF NET ASSETS
The Statement of Net Assets provides a detailed list of the fund’s holdings, including each security’s market value on the last day of the reporting period. The Statement of Net Assets includes a Schedule of Investments. Other assets are added and other liabilities subtracted from the investments total to calculate the fund’s net assets. Finally, net assets are divided by the outstanding shares of the fund to arrive at its share price, or Net Asset Value (NAV) per share.
At the end of the Statement of Net Assets is a table displaying the composition of the fund’s net assets. Paid in Capital is the money invested by shareholders and represents the bulk of net assets. Undistributed Net Investment Income and Accumulated Net Realized Gains usually approximate the amounts the fund had available to distribute to shareholders as of the statement date. Accumulated Realized Losses will appear as negative balances. Unrealized Appreciation (Depreciation) is the difference between the market value of the fund’s investments and their cost, and reflects the gains (losses) that would be realized if the fund were to sell all of its investments at their statement-date values.
STATEMENT OF OPERATIONS
The Statement of Operations summarizes the fund’s investment income earned and expenses incurred in operating the fund. Investment income includes dividends earned from stocks and interest earned from interest-bearing securities in the fund. Expenses incurred in operating the fund include the advisory fee paid to the investment advisor, administrative services fees, distribution plan expenses (if applicable), transfer agent fees, shareholder servicing expenses, custodial, legal, and audit fees, and the printing and postage expenses related to shareholder reports. Expense offsets (fees paid indirectly) may also be shown. Credits earned from offset arrangements are used to reduce the fund’s expenses. This statement also shows net gains (losses) realized on the sale of investments and the increase or decrease in the unrealized appreciation (depreciation) on investments held during the period.
38 www.calvert.com CALVERT INTERNATIONAL EQUITY FUND SEMI-ANNUAL REPORT (UNAUDITED)
STATEMENT OF CHANGES IN NET ASSETS
The Statement of Changes in Net Assets shows how the fund’s total net assets changed during the two most recent reporting periods. Changes in the fund’s net assets are attributable to investment operations, distributions and capital share transactions.
The Operations section of the report summarizes information detailed in the Statement of Operations. The Distribution section shows the dividend and capital gain distributions made to shareholders. The amounts shown as distributions in this section may not match the net investment income and realized gains amounts shown in the Operations section because distributions are determined on a tax basis and certain investments or transactions may be treated differently for financial statement and tax purposes. The Capital Share Transactions section shows the amount shareholders invested in the fund, either by purchasing shares or by reinvesting distributions, and the amounts redeemed. The corresponding numbers of shares issued, reinvested and redeemed are shown at the end of the report.
FINANCIAL HIGHLIGHTS
The Financial Highlights table provides a per-share breakdown per class of the components that affect the fund’s net asset value for current and past reporting periods. The table provides total return, total distributions, expense ratios, portfolio turnover and net assets for the applicable period. Total return is a measure of a fund’s performance that encompasses all elements of return: dividends, capital gain distributions and changes in net asset value. Total return is the change in value of an investment over a given period, assuming reinvestment of any dividends and capital gain distributions, expressed as a percentage of the initial investment. Total distributions include distributions from net investment income and net realized gains. Long-term gains are earned on securities held in the fund more than one year. Short-term gains, on the sale of securities held less than one year, are treated as ordinary dividend income for tax purposes. The expense ratio is a fund’s cost of doing business, expressed as a percentage of net assets. These expenses directly reduce returns to shareholders. Portfolio turnover measures the trading activity in a fund’s investment portfolio—how often securities are bought and sold by a fund. Portfolio turnover is affected by market conditions, changes in the size of the fund, the nature of the fund’s investments and the investment style of the portfolio manager.
PROXY VOTING
The Proxy Voting Guidelines of the Calvert Funds that the Fund uses to determine how to vote proxies relating to portfolio securities are provided as an Appendix to the Fund’s Statement of Additional Information. The Statement of Additional Information can be obtained free of charge by calling the Fund at 1-800-368-2745, by visiting the Calvert website at www.calvert.com; or by visiting the SEC’s website at www.sec.gov.
Information regarding how the Fund voted proxies relating to portfolio securities during the most recent 12-month period ended June 30 is available on the Fund’s website at www.calvert.com and on the SEC’s website at www.sec.gov.
AVAILABILITY OF QUARTERLY PORTFOLIO HOLDINGS
The Fund files its complete schedule of portfolio holdings with the SEC for the first and third quarters of each fiscal year on Form N-Q. The Fund’s Form N-Q is available on the SEC’s website at www.sec.gov. The Fund’s Form N-Q may be reviewed and copied at the SEC’s Public Reference Room in Washington, DC; information on the operation of the Public Reference Room may be obtained by calling 1-800-SEC-0330.
www.calvert.com CALVERT INTERNATIONAL EQUITY FUND SEMI-ANNUAL REPORT (UNAUDITED) 39
BASIS FOR BOARD'S APPROVAL OF INVESTMENT ADVISORY CONTRACTS
At a meeting held on December 9, 2014, the Board of Directors, and by a separate vote, the disinterested Directors, approved the continuance of the Investment Advisory Agreement between Calvert World Values Fund, Inc. and the Advisor and the Investment Subadvisory Agreement between the Advisor and Martin Currie, Inc. (the “Subadvisor”) with respect to the Fund. The Board also approved the termination of the Investment Subadvisory Agreement between the Advisor and Thornburg Investment Management, Inc.
In evaluating the Investment Advisory Agreement, the Board considered a variety of information relating to the Fund and the Advisor. The disinterested Directors reviewed a report prepared by the Advisor regarding various services provided to the Fund by the Advisor and its affiliates. Such report included, among other data, information regarding the Advisor’s personnel and the Advisor’s revenue and cost of providing services to the Fund, and a separate report prepared by an independent third party, which provided a statistical analysis comparing the Fund's investment performance, expenses, and fees to comparable mutual funds.
The disinterested Directors were separately represented by independent legal counsel with respect to their consideration of the reapproval of the Investment Advisory Agreement and the Investment Subadvisory Agreement. Prior to voting, the disinterested Directors reviewed the proposed continuance of the Investment Advisory Agreement and the Investment Subadvisory Agreement with management and also met in private sessions with their counsel at which no representatives of management were present.
In the course of its deliberations regarding the Investment Advisory Agreement, the Board considered the following factors, among others: the nature, extent and quality of the services provided by the Advisor, including the personnel providing such services; the Advisor's financial condition; the level and method of computing the Fund's advisory fee; comparative performance, fee and expense information for the Fund; the profitability of the Calvert Family of Funds to the Advisor and its affiliates; the allocation of the Fund's brokerage, including the Advisor's process for monitoring "best execution"; the direct and indirect benefits, if any, derived by the Advisor and its affiliates from their relationship with the Fund; the effect of the Fund's growth and size on the Fund's performance and expenses; the affiliated distributor's process for monitoring sales load breakpoints; the Advisor's compliance programs and policies; the Advisor's performance of substantially similar duties for other funds; and any possible conflicts of interest.
In considering the nature, extent and quality of the services provided by the Advisor under the Investment Advisory Agreement, the Board reviewed information provided by the Advisor relating to its operations and personnel, including, among other information, biographical information on the Advisor's investment, supervisory and professional staff and descriptions of its organizational and management structure. The Board also took into account similar information provided periodically throughout the previous year by the Advisor as well as the Board’s familiarity with management through Board of Directors’ meetings, discussions and other reports. The Board considered the Advisor’s management style and its performance in employing its investment strategies, as well as its current level of staffing and overall resources. The Board also noted that it reviewed on a quarterly basis information regarding the Advisor’s compliance with applicable policies and procedures, including those related to personal investing. The Advisor's administrative capabilities, including its ability to supervise the other service providers for the Fund, were also considered. The Board also took into account the environmental, social, sustainability and governance research and analysis provided by the Advisor to the Fund. The Board observed that the scope of services provided
40 www.calvert.com CALVERT INTERNATIONAL EQUITY FUND SEMI-ANNUAL REPORT (UNAUDITED)
by the Advisor generally had expanded over time as a result of regulatory, market and other changes. The Board took into consideration, among other factors, the effectiveness of the Fund’s and Advisor’s processes, policies and procedures and the Advisor’s personnel. The Board also took into account, among other items, periodic reports received from the Advisor over the past year concerning the Advisor’s ongoing review and enhancement of certain processes, policies and procedures of the Fund and the Advisor. The Board discussed the Advisor’s effectiveness in monitoring the performance of the Subadvisor and its timeliness in responding to performance issues. The Board concluded that it was satisfied with the nature, extent and quality of services provided to the Fund by the Advisor under the Investment Advisory Agreement.
In considering the Fund’s performance, the Board noted that it reviewed on a quarterly basis detailed information about the Fund’s performance results, portfolio composition and investment strategies. In addition, the Board took into account overall financial market conditions. The Board also reviewed various comparative data provided to it in connection with its consideration of the renewal of the Investment Advisory Agreement, including, among other information, a comparison of the Fund’s total return with that of other mutual funds deemed to be in its peer group by an independent third party in its report and with that of other mutual funds in the Lipper International Multi-Cap Growth category. This comparison indicated that the Fund performed below the median of its peer group for the one-, three- and five-year periods ended June 30, 2014. The data also indicated that the Fund underperformed the average of the funds in its Lipper category for the one-year period ended June 30, 2014 and outperformed the Lipper category average for the three-year period ended June 30, 2014. The Board took into account management’s discussion of the Fund’s performance and management’s continued monitoring of the Fund’s performance. The Board noted that, upon the recommendation of the Advisor, it had approved the termination of the Investment Subadvisory Agreement with one of the Fund’s subadvisors and approved the reallocation of the Fund’s assets that were managed by that subadvisor between the Advisor and the Subadvisor. Based upon its review, the Board concluded that appropriate action was being taken to address the Fund’s performance.
In considering the Fund’s fees and expenses, the Board compared the Fund’s fees and total expense ratio with various comparative data for the funds in its peer group. Among other findings, the data indicated that the Fund’s advisory fee (after taking into account waivers and/or reimbursements) was below the median of its peer group and that total expenses (net of waivers and/or reimbursements) were above the median of its peer group. The Board noted that the allocation of advisory and administrative fees may vary among the Fund’s peer group. The Board also took into account the Advisor’s current undertaking to maintain expense limitations for the Fund. The Board noted that the Adviser was not reimbursing any Fund expenses under the expense limitation, however, the Adviser was voluntarily reimbursing the Fund’s Class B shares. The Board noted the Advisor’s discussion of the Fund’s expenses and certain factors that affected the level of such expenses, including the cost of providing the environmental, social, sustainability and governance research and analysis provided by the Advisor. Based upon its review, the Board determined that the advisory fee was reasonable in view of the quality of services received by the Fund from the Advisor and the other factors considered.
The Board reviewed the Advisor’s profitability on a fund-by-fund basis. In reviewing the overall profitability of the advisory fee to the Fund’s Advisor, the Board also considered the fact that affiliates of the Advisor provided shareholder servicing, administrative and distribution services to the Fund for which they received compensation. The information considered by the Board included Calvert’s operating profit margin information both before
www.calvert.com CALVERT INTERNATIONAL EQUITY FUND SEMI-ANNUAL REPORT (UNAUDITED) 41
and after tax expenses with respect to the services that the Advisor and its affiliates provided to the Calvert Family of Funds complex. The Board reviewed the profitability of the Advisor’s relationship with the Fund in terms of the total amount of annual advisory fees it received with respect to the Fund and whether the Advisor had the financial wherewithal to continue to provide services to the Fund. The Board noted that the Advisor had voluntarily reimbursed the Fund’s Class B shares’ expenses. The Board also noted the Advisor’s current undertaking to maintain expense limitations for certain share classes of the Fund. The Board also considered that the Advisor derived benefits to its reputation and other indirect benefits from its relationship with the Fund. The Board noted that the Advisor paid the subadvisory fees to the Subadvisor. Based upon its review, the Board concluded that the Advisor’s and its affiliates’ level of profitability from their relationship with the Fund was reasonable.
The Board considered the effect of the Fund’s current size and its potential growth on its performance and fees. The Board took into account that the Fund’s advisory fee schedule contained breakpoints that would reduce the advisory fee rate on assets above specified levels as the Fund’s assets increased. The Board noted that the Fund was currently realizing economies of scale in its advisory fee. The Board also noted that if the Fund’s assets increased over time, the Fund might realize other economies of scale if assets increased proportionally more than certain other expenses.
In reapproving the Investment Advisory Agreement, the Board, including the disinterested Directors, did not identify any single factor as controlling, and each Director may have attributed different weight to various factors.
In evaluating the Investment Subadvisory Agreement with the Subadvisor, the disinterested Directors reviewed information provided by the Subadvisor relating to its operations, personnel, investment philosophy, strategies and techniques. Among other information, the Subadvisor provided biographical information on portfolio management and other professional staff, performance information for itself, and descriptions of its investment philosophies, strategies and techniques, organizational and management structures and brokerage policies and practices.
The Board reapproved the Investment Subadvisory Agreement between the Advisor and the Subadvisor, based on a number of factors relating to the Subadvisor’s ability to perform under the Investment Subadvisory Agreement. In the course of its deliberations, the Board evaluated, among other factors: the nature, extent and the quality of the services provided by the Subadvisor; the Subadvisor's management style and long-term performance record; the Fund’s performance record and the Subadvisor's performance in employing its investment strategies; the Subadvisor's current level of staffing and its overall resources; the qualifications and experience of the Subadvisor's personnel; the Subadvisor's financial condition with respect to its ability to perform the services required under the Investment Subadvisory Agreement; the Subadvisor’s risk management processes; the Subadvisor's compliance systems, including those related to personal investing; and any disciplinary history. Based upon its review, the Board concluded that it was satisfied with the nature, extent and quality of services provided to the Fund by the Subadvisor under the Investment Subadvisory Agreement.
As noted above, the Board considered, among other information, the Fund’s performance during the one-, three- and five-year periods ended June 30, 2014 as compared to the Fund’s peer group and noted that it reviewed on a quarterly basis detailed information about the Fund’s performance results, portfolio composition and investment strategies. The Board noted the Advisor’s expertise and resources in monitoring the performance, investment style and risk- adjusted performance of the Subadvisor.
42 www.calvert.com CALVERT INTERNATIONAL EQUITY FUND SEMI-ANNUAL REPORT (UNAUDITED)
In considering the cost of services provided by the Subadvisor and the profitability to the Subadvisor of its relationship with the Fund, the Board noted that the subadvisory fee under the Investment Subadvisory Agreement was paid by the Advisor out of the advisory fee that the Advisor received under the Investment Advisory Agreement. The Board also relied on the ability of the Advisor to negotiate the Investment Subadvisory Agreement and the corresponding subadvisory fee at arm’s length. In addition, the Board took into account the fees the Subadvisor charged to its other clients and considered these fee comparisons in light of the differences in managing these other accounts. Based upon its review, the Board determined that the subadvisory fee was reasonable in view of the quality of services received by the Fund from the Subadvisor. Because the Advisor pays the Subadvisor’s subadvisory fee and the subadvisory fee was negotiated at arm’s length by the Advisor, the cost of services provided by the Subadvisor and the profitability to the Subadvisor of its relationship with the Fund was not a material factor in the Board’s deliberations. For similar reasons, the Board did not consider the potential economies of scale in the Subadvisor’s management of the Fund to be a material factor in its consideration, although the Board noted that the Subadvisor’s subadvisory fee schedule for the Fund contained breakpoints that reduced the subadvisory fee rate on assets above specified levels.
In reapproving the Investment Subadvisory Agreement with the Subadvisor, the Board, including the disinterested Directors, did not identify any single factor as controlling, and each Director may have attributed different weight to various factors.
Conclusions
The Board reached the following conclusions regarding the Investment Advisory Agreement and the Investment Subadvisory Agreement with the Subadvisor, among others: (a) the Advisor has demonstrated that it possesses the capability and resources to perform the duties required of it under the Investment Advisory Agreement; (b) the Advisor and the Subadvisor are qualified to manage the Fund's assets in accordance with the Fund’s investment objectives and policies; (c) the Advisor and the Subadvisor maintain appropriate compliance programs; (d) the Advisor and the Subadvisor are likely to execute their investment strategies consistently over time; (e) appropriate action is being taken to address the Fund’s performance; and (f) the Fund's advisory and subadvisory fees are reasonable in view of the quality of services received by the Fund from the Advisor and the Subadvisor, respectively, and the other factors considered. Based on its conclusions, the Board determined that reapproval of the Investment Advisory Agreement and the Investment Subadvisory Agreement with the Subadvisor would be in the best interests of the Fund and its shareholders.
www.calvert.com CALVERT INTERNATIONAL EQUITY FUND SEMI-ANNUAL REPORT (UNAUDITED) 43
To Open an Account
800-368-2748
Service for Existing Account
Shareholders: 800-368-2745
Brokers: 800-368-2746
TDD for Hearing Impaired
800-541-1524
Registered Mail
Calvert Investments
c/o BFDS,
P.O. Box 219544
Kansas City, MO 64121-9544
Overnight Mail
Calvert Investments
c/o BFDS,
330 West 9th Street
Kansas City, MO 64105
Web Site
www.calvert.com
Principal Underwriter
Calvert Investment Distributors, Inc.
4550 Montgomery Avenue
Suite 1000 North
Bethesda, Maryland 20814
|
| | | |
CALVERT INTERNATIONAL EQUITY FUND | CALVERT'S FAMILY OF FUNDS | | |
| | Municipal Funds Tax-Free Bond Fund Taxable Bond Funds Bond Portfolio Income Fund Short Duration Income Fund Long-Term Income Fund Ultra-Short Income Fund High Yield Bond Fund Green Bond Fund Unconstrained Bond Fund Balanced and Asset Allocation Funds Balanced Portfolio Conservative Allocation Fund Moderate Allocation Fund Aggressive Allocation Fund | | Equity Funds Large Cap Core Portfolio Equity Portfolio Large Cap Value Fund Social Index Fund Capital Accumulation Fund International Equity Fund Small Cap Fund Global Energy Solutions Fund Global Water Fund International Opportunities Fund Equity Income Fund Emerging Markets Equity Fund |
| | |
This report is intended to provide fund information to shareholders. It is not authorized for distribution to prospective investors unless preceded or accompanied by a prospectus.
Note: The information on our website is not incorporated by reference into this report; our website address is included as an inactive textual reference only.
Investors should carefully consider the investment objectives, risks, charges and expenses of the Calvert Funds. This and other important information is contained in the fund’s summary prospectus and prospectus, which can be obtained from your financial professional and should be read carefully before investing. You may also call Calvert at 800/368-2748 or visit www. calvert.com.
Printed on recycled paper using soy inks.
|
| | |
| | |
| | | |
| Calvert Capital Accumulation Fund | | |
| | | |
| | |
|
| |
Semi-Annual Report March 31, 2015
E-Delivery Sign-Up — Details Inside | |
Choose Planet-friendly E-delivery!
Sign up now for on-line statements, prospectuses, and fund reports. In less than five minutes you can help reduce paper mail and lower fund costs.
Just go to www.calvert.com. If you already have an online account at Calvert, click on Login, to access your Account, and select the documents you would like to receive via e-mail.
If you’re new to online account access, click on Login, then Register to create your user name and password. Once you’re in, click on the E-delivery sign-up on the Account Portfolio page and follow the quick, easy steps.
Note: if your shares are not held directly at Calvert but through a brokerage firm, you must contact your broker for electronic delivery options available through their firm.
|
| | | |
| TABLE OF CONTENTS |
| | | | |
| | | | President's Letter |
| | | | Portfolio Management Discussion |
| | | | Shareholder Advocacy Update |
| | | | Shareholder Expense Example |
| | | | Statement of Net Assets |
| | | | Statement of Operations |
| | | | Statements of Changes in Net Assets |
| | | | Notes to Financial Statements |
| | | | Financial Highlights |
| | | | Explanation of Financial Tables |
| | | | Proxy Voting |
| | | | Availability of Quarterly Portfolio Holdings |
| | | | Basis for Board’s Approval of Investment Advisory Contracts |
|
| |
| John Streur President and Chief Executive Officer, Calvert Investments, Inc. |
Dear Calvert Shareowner,
The United States economy improved throughout 2014 and into the first quarter of 2015, while major economies in other regions of the world struggled to regain momentum or saw slowing growth. It is still too early to declare victory, but one may say that while the United States led the world into financial crisis nearly eight years ago, the innovative and aggressive responses to the crisis by our policymakers are allowing the United States to recover more quickly. Granted, the United States has the benefit of possessing the world’s reserve currency and our monetary maneuvers in our self-interest are not without cost to economies in other regions.
As 2014 drew to a close, the United States was winding down the quantitative easing portion of its post-crisis monetary policy while the European and Japanese central banks were finding it necessary to increase their own forms of quantitative easing in efforts to support asset prices and spur economic growth.
The impact of modestly improving economic activity in the U.S. and ongoing low global interest rates on financial assets in 2014 created positive returns for most stocks and bonds for the previous 12 months, a condition that gave benefit to most Calvert Funds. The exceptions are assets tied to the price of oil, which collapsed during the second half of the year. Energy industries and natural resource based companies, including renewable energy companies and water related companies, saw their stock valuations drop in reaction.
Across our fixed income and equity strategies, Calvert finds more utility in conducting fundamental research in order to find relative values in securities of individual companies than we do in attempting to anticipate or time changes in global economic indicators. Broadly, we are mindful of the fact that stocks and bonds have benefitted substantially from the easy monetary policies and ultra-low interest rates of the post-crisis era. We believe markets are more or less fairly valued and we have taken steps seeking to moderate the risk across our portfolios.
As I take the helm at Calvert and look back at the 39 years since the firm’s founding in 1976, I note the substantial growth in the world’s population, the massive increase in the industrialization of our global society, and the associated change in the role of corporations in societal and environmental outcomes for our future.
4 www.calvert.com CALVERT CAPITAL ACCUMULATION FUND SEMI-ANNUAL REPORT (UNAUDITED)
Public companies have created tremendous net benefits to society through advances in health care, food systems, energy efficiency, communications and technology, and access to finance and other products and services too vast to detail. Hundreds of millions of people throughout the world have seen their standard of living increased through benefits created by corporate activity.
Along with the obvious net benefits to society, we are aware of the substantial stresses placed upon society and the environment from corporate behaviors. At the same time, society has awarded corporations an increasingly prominent role in the day-to-day outcomes of our lives and in the societal and environmental outcomes that will determine the future direction of the world.
Calvert, as a global investment management firm and a steward of client assets, has a growing and evolving role as a leader in responsible investing. Calvert has a rich history as a socially responsible investor and has made many contributions to public policy and corporate governance. Today we are bringing Calvert’s deep expertise in socially responsible investing, public and private policy work, and investment management to a new level with a focus on developing principles and setting standards for use in our investment management processes, our active ownership and engagement discipline and within our investment risk management processes.
As a long-term investor with unique insights into environmental, social, and governance activities of companies throughout the world, Calvert is able to develop a holistic view of companies’ operations. Our ability to use our insights for the benefit of the stewardship of client assets, both to produce desirable investment outcomes for our clients and to assist companies in evolving their role in society along a responsible path has never been more important.
As fellow shareowners of Calvert Funds, you and I know that it is essential to pursue the type of enduring value that Calvert seeks to create, through excellence in financial results balanced with the evolving needs of society and the environment.
Thank you for your share ownership in Calvert Funds; all of us at Calvert Investments, Inc. appreciate the confidence and trust you have placed in us.
John Streur
April 2015
www.calvert.com CALVERT CAPITAL ACCUMULATION FUND SEMI-ANNUAL REPORT (UNAUDITED) 5
|
| |
| PORTFOLIO MANAGEMENT DISCUSSION |
|
| |
| Natalie A. Trunow Senior Vice President and Chief Investment Officer, Equities |
Equity market returns over the six-month reporting period largely reflected macroeconomic trends, with solid gains for U.S. stocks relative to international equity markets. Improving economic conditions in the United States remained in stark contrast to the sluggish growth outlook in much of the rest of the world, particularly in Europe. However, U.S. equity markets faced several headwinds at the start of 2015 as another harsh winter weighed on economic activity and the stronger dollar contributed to negative earnings revisions for companies deriving larger portions of their earnings from overseas. International equity markets underperformed for the period, but recouped some of their losses in the first quarter of 2015 as central banks in Europe and Japan maintained quantitative-easing programs and emerging markets were buoyed by stimulus announcements from China.
For the six-month period ended March 31, 2015, the Standard and Poor’s (S&P) 500, Russell 1000, Russell 2000, MSCI EAFE, and MSCI Emerging Markets Indices returned 5.93%, 6.55%, 14.46%, 1.29%, and -2.26%, respectively.
From an investment-style perspective, growth stocks outperformed value stocks, and domestic small-cap stocks, which have less exposure to foreign markets and are less dependent on global growth, outperformed their large-cap counterparts. Looking at sector performance, Health Care, Consumer Discretionary, and Consumer Staples were the top-performing sectors within the Russell 1000 Index during the period, while the Energy, Telecommunication Services, and Materials sectors lagged.
U.S. Economic Recovery Hits Soft Patch, but Outpaces Rest of Developed World
The U.S. economy continued to outperform other developed countries, with U.S. gross domestic product (GDP) growing at a 2.2% annualized rate in the fourth quarter of 2014. More recent U.S. macroeconomic data has been weaker, however, with the slowdown largely attributed to poor weather and the strength of the dollar. A labor dispute between West Coast ports and dockworkers also resulted in a modest drag on economic activity. The U.S. ISM Manufacturing Purchasing Manufacturers Index (PMI)1 ended the period at 51.5, firmly in expansion territory, but has declined for five consecutive months. Housing activity, while remaining on an upward trend, has been disappointing of late.
Although the most recent jobs report for March was less than stellar, the job market has continued to improve, adding an average of 260,000 jobs per month over the last year. This helped push the unemployment rate down to 5.5% from 6.6% this time a year ago, though this has been aided by a drop in the labor-force participation rate. Wage growth is taking longer to materialize than in past recoveries, but recent data has been encouraging, showing modest gains in average hourly earnings and the Employment Cost Index.
6 www.calvert.com CALVERT CAPITAL ACCUMULATION FUND SEMI-ANNUAL REPORT (UNAUDITED)
|
| | | | |
| | | | |
| | CALVERT CAPITAL ACCUMULATION FUND |
| | MARCH 31, 2015 | |
| | | | |
| | ECONOMIC SECTORS | % OF TOTAL INVESTMENTS | |
| | Consumer Discretionary | 25.1 | % | |
| | Consumer Staples | 4.5 | % | |
| | Energy | 3.6 | % | |
| | Financials | 9.4 | % | |
| | Health Care | 14.7 | % | |
| | Industrials | 15.2 | % | |
| | Information Technology | 19.2 | % | |
| | Materials | 5.3 | % | |
| | Short-Term Investments | 2.0 | % | |
| | Utilities | 1.0 | % | |
| | Total | 100 | % | |
| | | | |
Consumer confidence reached a nine-year high during the reporting period, due in part to lower gasoline prices, which should lead to a pick-up in consumer spending and housing activity over the remainder of the year.
Decline in Oil Prices a Positive for U.S. Economy Overall
The price of crude oil fell nearly 50% over the six-month reporting period. Weakening demand due to slowing global growth and a strategic decision by Saudi Arabia, the world’s largest oil producer, to not cut oil production in the face of increased U.S. supplies, were key drivers of the dramatic price decline.
Some economies and sectors stand to benefit from the significant price decline in oil while others will undoubtedly continue to come under pressure. Countries which import a large portion of their energy are the clear winners, with the United States, Europe, Japan, and China benefiting. Within the U.S., states such as North Dakota and Texas will be hurt by lower oil prices; however energy capital expenditure
(CapEx) represents less than 2% of GDP
|
| | | | | | |
| | | | | |
| | CALVERT CAPITAL ACCUMULATION FUND | |
| | MARCH 31, 2015 | |
| | | | | |
| | INVESTMENT PERFORMANCE | |
| | (TOTAL RETURN AT NAV*) | |
| | | 6 MONTHS ENDED 3/31/15 | 12 MONTHS ENDED 3/31/15
| |
| | Class A | 14.63 | % | 15.44 | % | |
| | Class B | 13.83 | % | 13.83 | % | |
| | Class C | 14.20 | % | 14.59 | % | |
| | Class I | 14.98 | % | 16.17 | % | |
| | Class Y | 14.78 | % | 15.61 | % | |
| | | | | |
| | Russell Midcap Growth Index | 11.53 | % | 15.56 | % | |
| | | | | |
| | Lipper Mid-Cap Growth Funds Average | 11.29 | % | 11.59 | % | |
| | | | | |
| | TEN LARGEST STOCK HOLDINGS | % OF NET ASSETS | |
| | DST Systems, Inc. | 3.0 | % | |
| | Gannett Co., Inc. | 3.0 | % | |
| | Ross Stores, Inc. | 3.0 | % | |
| | Synaptics, Inc. | 3.0 | % | |
| | Syntel, Inc. | 3.0 | % | |
| | Lithia Motors, Inc. | 2.9 | % | |
| | Ulta Salon, Cosmetics & Fragrance, Inc. | 2.9 | % | |
| | Gentherm, Inc. | 2.8 | % | |
| | Arrow Electronics, Inc. | 2.8 | % | |
| | The Middleby Corp. | 2.8 | % | |
| | Total | 29.2 | % | |
| | | |
| | * Investment performance/return at NAV does not reflect the deduction of the Fund’s maximum 4.75% front-end sales charge or any deferred sales charges. | |
| | | | | |
and we believe the overall impact of lower energy prices is positive for the U.S. economy as a whole due to the significant cost savings its creates in a majority of sectors and the multiplier effect it has throughout the economy.
www.calvert.com CALVERT CAPITAL ACCUMULATION FUND SEMI-ANNUAL REPORT (UNAUDITED) 7
Global Easing Continues Amid Low Inflation and Stronger Dollar
The U.S. dollar strengthened throughout the period, hitting a 7-year high vs. the Japanese Yen and a 12-year high against the euro. Since most commodities are priced globally in U.S. dollars, a stronger dollar relative to foreign currencies typically correlates with lower commodity prices, which has kept a lid on inflation.
More than half the central banks in the G20 economies implemented some type of monetary easing policy during the period, which provided additional support for global equities. Most notably, the Bank of Japan announced a massive stimulus policy and the European Central Bank (ECB) followed with a strong quantitative easing (QE) program of its own.
Interest Rate Hikes by the Fed on the Horizon
With the U.S. economy improving, both market sentiment and Federal Reserve officials seem divided on the optimal timing of the Fed’s interest-rate increases. However, consistently low inflation and recent softness in U.S. macroeconomic data—as well as the rapid increase in the dollar’s strength, which has hurt U.S. exports and the manufacturing sector—makes it more likely that the Fed will delay raising rates until later in the year or possibly even next year.
Eurozone Economic Struggles Continue but QE Offers Some Respite
Economic conditions continued to deteriorate in the eurozone through the end of 2014 as inflation turned negative, prompting the ECB to launch its massive QE program. The program has been successful thus far in decreasing the value of the euro in an attempt to stimulate exports and eurozone economies. Manufacturing PMIs, credit demand, and consumer confidence all have been showing signs of modest improvement, indicating a potential positive effect from QE as well as a potential bottoming out of eurozone
economic malaise.
|
| | | | |
| | | | |
| | CALVERT CAPITAL ACCUMULATION FUND | |
| | MARCH 31, 2015 | |
| | | | |
| | AVERAGE ANNUAL TOTAL RETURNS | |
| | | | |
| | CLASS A SHARES | (WITH MAX. LOAD) | |
| | One year | 9.96 | % | |
| | Five year | 15.10 | % | |
| | Ten year | 7.95 | % | |
| | | | |
| | CLASS B SHARES | (WITH MAX. LOAD) | |
| | One year | 8.83 | % | |
| | Five year | 14.61 | % | |
| | Ten year | 7.27 | % | |
| | | | |
| | CLASS C SHARES | (WITH MAX. LOAD) | |
| | One year | 13.59 | % | |
| | Five year | 15.30 | % | |
| | Ten year | 7.62 | % | |
| | | | |
| | CLASS I SHARES | | |
| | One year | 16.17 | % | |
| | Five year | 17.00 | % | |
| | Ten year | 9.32 | % | |
| | | | |
| | CLASS Y SHARES* | | |
| | One year | 15.61 | % | |
| | Five year | 16.40 | % | |
| | Ten year | 8.56 | % | |
| | | | |
| | * Calvert Capital Accumulation Fund first offered Class Y Shares on January 31, 2011. Performance prior to that date reflects the performance of Class A Shares at net asset value (NAV). Actual Class Y Share performance would have been different. | |
| | | | |
Despite these marginally positive developments, we are skeptical that central bankers’ efforts will meaningfully reinvigorate those economies unless accompanied by structural economic reforms. Possible risks from Greece exiting the eurozone and political turmoil emerging in other euro-area countries also remain a lingering concern and may re-surface later
in the year.
8 www.calvert.com CALVERT CAPITAL ACCUMULATION FUND SEMI-ANNUAL REPORT (UNAUDITED)
Growth of $10,000
The graph below shows the value of a hypothetical $10,000 investment in the Fund over the past 10 fiscal year periods. The results shown are for Class A and C shares and reflect the deduction of the maximum front-end Class A sales charge of 4.75%, and assume the reinvestment of dividends. The result is compared with benchmarks that include a broad based market index and a Lipper peer group average. Market indexes are unmanaged and their results do not reflect the effect of expenses or sales charges. The Lipper average reflects the deduction of the category’s average front-end sales charge. The value of an investment in a different share class would be different.
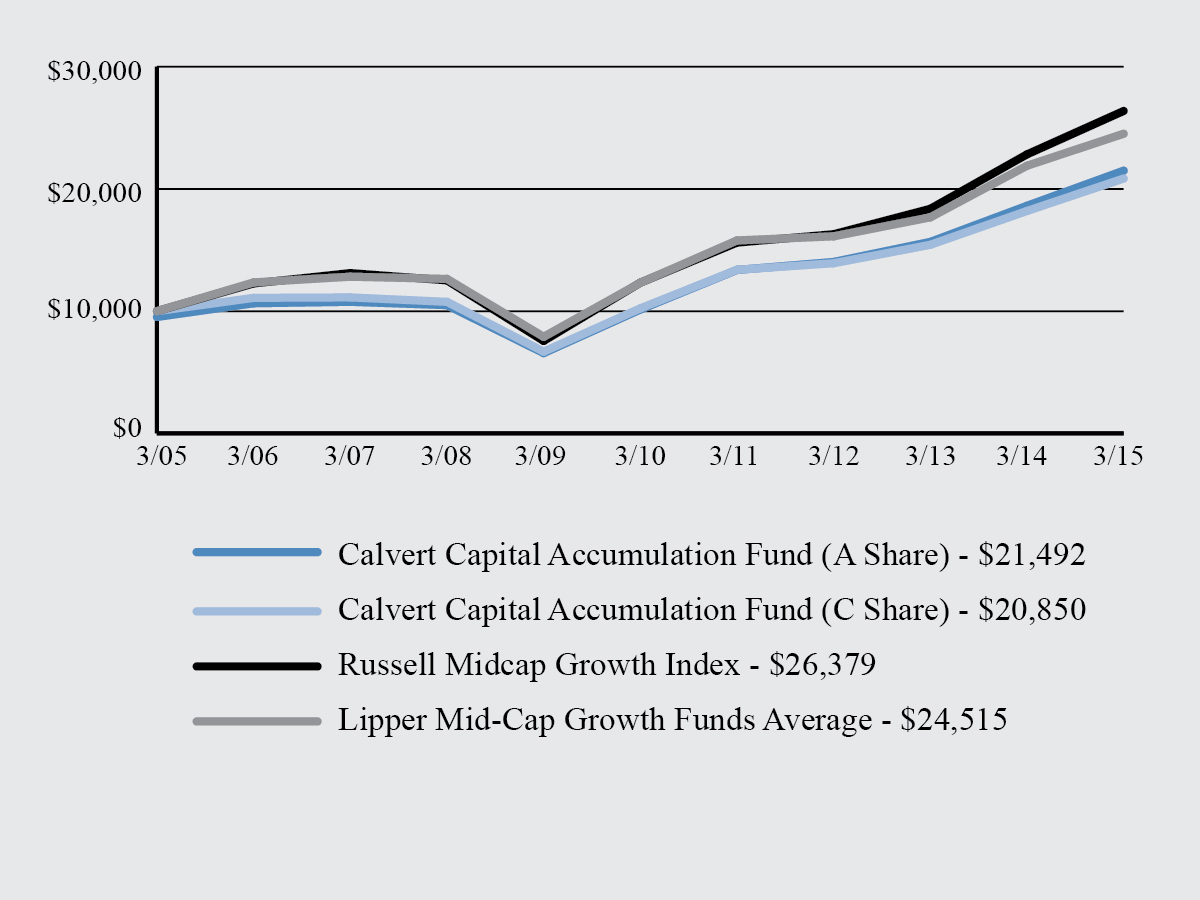
All performance data shown, including the graph above and the adjacent table, represents past performance, does not guarantee future results, assumes reinvestment of dividends and distributions and does not reflect the deduction of taxes that a shareholder would pay on the Fund’s distributions or the redemption of the Fund shares. All performance data reflects fee waivers and/or expense limitations, if any are in effect; in their absence performance would be lower. See Note B in Notes to Financial Statements. The investment return and principal value of an investment will fluctuate so that an investor’s shares, when redeemed, may be worth more or less than their original cost. Current performance may be lower or higher than the performance data quoted; for current performance data visit www.calvert.com. The gross expense ratio from the current prospectus for Class A shares is 1.43%. This number may differ from the expense ratio shown elsewhere in this report because it is based on a different time period and, if applicable, does not include fee or expense waivers. Performance data quoted already reflects the deduction of the Fund’s operating expenses.
www.calvert.com CALVERT CAPITAL ACCUMULATION FUND SEMI-ANNUAL REPORT (UNAUDITED) 9
Stimulus Measures Boost Chinese Stocks but Economic Challenges Remain
Despite Manufacturing PMI weakening throughout the period, Chinese equities rallied on the back of several stimulus measures and investor expectations that the government would continue stimulus measures to offset slowing, though still robust, economic growth. China is also benefiting from cheaper oil, which essentially acts as another form of stimulus. The Services PMI held up better than expected, indicating some very modest progress in transitioning away from an investment-driven economy to a more consumer-oriented one. However, structural improvements in social welfare programs, such as health care and retirement planning, will be needed in order to encourage Chinese consumers to spend more and bring down their notoriously high savings rate. Given these challenges, as well as ongoing concerns regarding a potential property-bubble burst, stimulus does not mean the Chinese economy is out of the woods. A hard economic landing remains a possibility down the road.
Outlook
While we may see some continued softness in U.S. macroeconomic data during the first half of the year, we believe U.S. economic growth will continue to exceed growth from other developed countries and we remain positive on the U.S. economy longer-term. We believe the significant positive multiplier effect from lower gas prices hasn’t yet been fully reflected in U.S. economic data, and we are likely to see the additional positive impact in the coming quarters.
In our view, U.S. stocks can still post decent performance, but probably not as good as what we saw in the past couple of years because of higher valuations, slower earnings growth, and potentially having reached peak margins. The stronger dollar, combined with lower commodity prices, tends to benefit consumers and hurt industrial companies, especially those with heavy sales outside the United States, or those directly involved in the energy sector. This is one reason why we continue to favor small-cap stocks on the domestic front.
With lower commodity prices, a stronger dollar, and little wage growth, inflation in the United States will likely remain low for some time to come, while deflationary threats are very real in other parts of the world. This may lead the Federal Reserve to raise interest rates less quickly than currently expected, since challenging global economic conditions can have a significant impact on the U.S. economy. Our position remains that when the Fed does decide to raise rates, the tightening process will be slow and gradual, with the Fed keeping a close eye on interest-rate volatility and its impact on mortgage rates. Even with a gradual tightening, monetary policy should still remain accommodative for an extended period of time. That said, we expect market volatility to increase as we grow closer to the inevitability of higher interest rates.
Calvert Investment Management, Inc.
April 2015
1. The Institute for Supply Management (ISM) Manufacturing PMI is published monthly and shows business conditions in the U.S. manufacturing sector, and is considered a significant indicator of overall economic conditions. The ISM index includes prices paid for all purchases including import purchases and purchases of food and energy, excluding crude oil. A result above 50 indicates that the manufacturing economy is generally expanding; below 50 indicates that it is generally declining.
10 www.calvert.com CALVERT CAPITAL ACCUMULATION FUND SEMI-ANNUAL REPORT (UNAUDITED)
SHAREHOLDER ADVOCACY UPDATE
2014 Corporate Diversity Report Findings Released
In March, Calvert published its 2014 survey findings on the corporate diversity practices of the largely multinational companies that make up the Standard & Poor’s 100 Index (S&P 100), in follow-up to reports published in 2012 and 2010. Calvert believes companies that fully commit to providing a fair and equitable working environment will recognize gains in both the workplace and marketplace.
Key findings from the 2014 survey include:
| |
| • | Milestone for women in the board room. In 2014, every company in the S&P 100 had at least one woman on its board of directors. In addition, there was a 17% increase in companies with three or more women and/or minorities on their boards. |
| |
| • | Diversity commitment on the rise. In the past two years, top scores related to overall corporate commitment have increased by 45%.This stems primarily from greater board oversight of diversity initiatives and increased CEO and/or chair involvement. |
| |
| • | LGBT policies have advanced overall. However, initiatives for persons with disabilities continue to fall behind other groups. |
Overall, in 2014, we saw growing commitment to women and minority employees, momentum around family-friendly work environments, and accelerated progress in support of LGBT employees. Looking ahead, we hope to see enhanced corporate diversity commitments, greater representation of women and minorities on boards, improved EEO1-disclosure, and expanded diversity initiatives for persons with disabilities.
To learn the highest- and lowest-rated companies in the report, A Survey of Corporate Diversity Practices of the S&P 100, and to find out more about the report’s methodology and findings, visit www.calvert.com.
2015 Shareholder Resolutions
Building on our initiatives from 2014, Calvert was the lead filer on 38 shareholder resolutions for the 2015 proxy season, and co-filer on another 18 proposals. Key topics include “big data” and civil rights issues, sustainability reporting, board of director oversight of environmental and social matters, water risk, climate change and greenhouse gas emissions reductions, supply chain labor issues, and board diversity.
Specifically, Calvert asked 14 companies to set a goal and a timeline for reducing their greenhouse gas emissions and filed seven proposals asking companies to issue a sustainability report describing their environmental, social and governance (ESG) performance and goals. To push for improved boardroom diversity, Calvert filed six proposals with companies requesting they report on their plans to increase minority and women Board representation and assess the effectiveness of these efforts. We also filed seven proposals requesting that companies assess and manage the civil rights’ risks related to their use of big data, which refers to data sets so large or complex that traditional data processing applications are inadequate. We also filed proposals on water risk in the agricultural supply chain and on developing a sustainable agriculture policy.
To keep abreast of the outcomes of these 2015 shareholder resolutions, as well as Calvert’s proxy voting and public policy initiatives, visit the “Resources” section on www.calvert.com.
www.calvert.com CALVERT CAPITAL ACCUMULATION FUND SEMI-ANNUAL REPORT (UNAUDITED) 11
SHAREHOLDER EXPENSE EXAMPLE
As a shareholder of the Fund, you incur two types of costs: (1) transaction costs, including sales charges (loads) and redemption fees; and (2) ongoing costs, including management fees; distribution (12b-1) fees; and other Fund expenses. This Example is intended to help you understand your ongoing costs (in dollars) of investing in the Fund and to compare these costs with the ongoing costs of investing in other mutual funds.
This Example is based on an investment of $1,000 invested at the beginning of the period and held for the entire period (October 1, 2014 to March 31, 2015).
Actual Expenses
The first line of the table below provides information about actual account values and actual expenses. You may use the information in this line, together with the amount you invested, to estimate the expenses that you paid over the period. Simply divide your account value by $1,000 (for example, an $8,600 account value divided by $1,000 = 8.6), then multiply the result by the number in the first line under the heading entitled "Expenses Paid During Period" to estimate the expenses you paid on your account during this period.
Hypothetical Example for Comparison Purposes
The second line of the table below provides information about hypothetical account values and hypothetical expenses based on the Fund’s actual expense ratio and an assumed rate of return of 5% per year before expenses, which is not the Fund’s actual return. The hypothetical account values and expenses may not be used to estimate the actual ending account balance or expenses you paid for the period. You may use this information to compare the ongoing costs of investing in the Fund and other funds. To do so, compare the 5% hypothetical example with the 5% hypothetical examples that appear in the shareholder reports of the other funds.
Please note that the expenses shown in the table are meant to highlight your ongoing costs only and do not reflect any transactional costs, such as sales charges (loads), or redemption fees. Therefore, the second line of the table is useful in comparing ongoing costs only, and will not help you determine the relative total costs of owning different funds. In addition, if these transactional costs were included, your costs would have been higher.
12 www.calvert.com CALVERT CAPITAL ACCUMULATION FUND SEMI-ANNUAL REPORT (UNAUDITED)
|
| | | |
| | BEGINNING ACCOUNT VALUE 10/1/14 | ENDING ACCOUNT VALUE 3/31/15 | EXPENSES PAID DURING PERIOD* 10/1/14 - 3/31/15 |
CLASS A | | | |
| Actual | $1,000.00 | $1,146.28 | $7.65 |
| Hypothetical | $1,000.00 | $1,017.81 | $7.19 |
| (5% return per year before expenses) | | | |
| | | | |
CLASS B | | | |
| Actual | $1,000.00 | $1,138.28 | $15.25 |
| Hypothetical | $1,000.00 | $1,010.67 | $14.34 |
| (5% return per year before expenses) | | | |
| | | | |
CLASS C | | | |
| Actual | $1,000.00 | $1,142.02 | $11.67 |
| Hypothetical | $1,000.00 | $1,014.03 | $10.97 |
| (5% return per year before expenses) | | | |
| | | | |
CLASS I | | | |
| Actual | $1,000.00 | $1,149.84 | $4.44 |
| Hypothetical | $1,000.00 | $1,020.80 | $4.17 |
| (5% return per year before expenses) | | | |
| | | | |
CLASS Y | | | |
| Actual | $1,000.00 | $1,147.76 | $6.44 |
| Hypothetical | $1,000.00 | $1,018.94 | $6.05 |
| (5% return per year before expenses) | | | |
| | | | |
* Expenses are equal to the Fund’s annualized expense ratio of 1.43%, 2.86%, 2.19%, 0.83%, and 1.20% for Class A, Class B, Class C, Class I, and Class Y, respectively, multiplied by the average account value over the period, multiplied by 182/365 (to reflect the one-half year period).
|
www.calvert.com CALVERT CAPITAL ACCUMULATION FUND SEMI-ANNUAL REPORT (UNAUDITED) 13
STATEMENT OF NET ASSETS
MARCH 31, 2015
|
| | | |
EQUITY SECURITIES - 97.9% | SHARES | VALUE |
| Airlines - 2.7% | | |
| JetBlue Airways Corp.* | 651,850 |
| $12,548,113 |
| | | |
| Auto Components - 2.8% | | |
| Gentherm, Inc.* | 260,156 |
| 13,140,480 |
| | | |
| Biotechnology - 2.2% | | |
| United Therapeutics Corp.* | 57,953 |
| 9,993,126 |
| | | |
| Building Products - 1.1% | | |
| USG Corp.* | 194,300 |
| 5,187,810 |
| | | |
| Chemicals - 2.6% | | |
| Minerals Technologies, Inc. | 167,265 |
| 12,227,072 |
| | | |
| Commercial Services & Supplies - 3.8% | | |
| Deluxe Corp. | 94,600 |
| 6,553,888 |
| United Stationers, Inc. | 274,125 |
| 11,236,384 |
| | | 17,790,272 |
| | | |
| Communications Equipment - 4.0% | | |
| F5 Networks, Inc.* | 93,122 |
| 10,703,443 |
| Ubiquiti Networks, Inc. | 262,510 |
| 7,757,170 |
| | | 18,460,613 |
| | | |
| Electric Utilities - 1.0% | | |
| ITC Holdings Corp. | 122,950 |
| 4,602,019 |
| | | |
| Electronic Equipment & Instruments - 2.8% | | |
| Arrow Electronics, Inc.* | 210,350 |
| 12,862,902 |
| | | |
| Energy Equipment & Services - 1.8% | | |
| RPC, Inc. | 662,525 |
| 8,486,945 |
| | | |
| Food Products - 2.3% | | |
| Ingredion, Inc. | 133,799 |
| 10,412,238 |
| | | |
| Health Care Equipment & Supplies - 3.1% | | |
| Globus Medical, Inc.* | 198,775 |
| 5,017,081 |
| Varian Medical Systems, Inc.* | 97,469 |
| 9,170,858 |
| | | 14,187,939 |
| | | |
| Health Care Providers & Services - 6.9% | | |
| AmerisourceBergen Corp. | 110,412 |
| 12,550,532 |
| Chemed Corp. | 58,464 |
| 6,980,602 |
| Laboratory Corporation of America Holdings* | 97,841 |
| 12,336,772 |
| | | 31,867,906 |
| | | |
14 www.calvert.com CALVERT CAPITAL ACCUMULATION FUND SEMI-ANNUAL REPORT (UNAUDITED)
|
| | | | | | |
EQUITY SECURITIES - CONT'D | SHARES | VALUE |
| | | |
| Hotels, Restaurants & Leisure - 2.2% | | |
| Interval Leisure Group, Inc. | 394,850 |
| $10,349,018 |
| | | |
| Insurance - 4.7% | | |
| American Financial Group, Inc. | 153,549 |
| 9,850,168 |
| Amtrust Financial Services, Inc. | 207,850 |
| 11,844,332 |
| | | 21,694,500 |
| | | |
| IT Services - 8.0% | | |
| DST Systems, Inc. | 127,268 |
| 14,089,840 |
| NeuStar, Inc.* | 374,498 |
| 9,220,141 |
| Syntel, Inc.* | 268,670 |
| 13,898,299 |
| | | 37,208,280 |
| | | |
| Leisure Products - 2.7% | | |
| Polaris Industries, Inc. | 88,975 |
| 12,554,372 |
| | | |
| Machinery - 5.3% | | |
| The Middleby Corp.* | 125,125 |
| 12,844,081 |
| The Toro Co. | 166,175 |
| 11,652,191 |
| | | 24,496,272 |
| | | |
| Media - 3.0% | | |
| Gannett Co., Inc. | 377,519 |
| 13,998,405 |
| | | |
| Oil, Gas & Consumable Fuels - 1.8% | | |
| SM Energy Co. | 160,492 |
| 8,294,227 |
| | | |
| Paper & Forest Products - 2.7% | | |
| Domtar Corp. | 266,375 |
| 12,311,852 |
| | | |
| Personal Products - 2.2% | | |
| Inter Parfums, Inc. | 319,204 |
| 10,412,434 |
| | | |
| Pharmaceuticals - 2.6% | | |
| Lannett Co., Inc.* | 177,575 |
| 12,023,603 |
| | | |
| Real Estate Management & Development - 2.7% | | |
| Jones Lang LaSalle, Inc. | 72,045 |
| 12,276,468 |
| | | |
| Road & Rail - 2.2% | | |
| Landstar System, Inc. | 156,092 |
| 10,348,900 |
| | | |
| Semiconductors & Semiconductor Equipment - 3.0% | | |
| Synaptics, Inc.* | 171,125 |
| 13,913,318 |
| | | |
| Software - 1.5% | | |
| FactSet Research Systems, Inc. | 42,500 |
| 6,766,000 |
| | | |
| Specialty Retail - 11.1% | | |
| Lithia Motors, Inc. | 133,685 |
| 13,289,626 |
| Ross Stores, Inc. | 132,800 |
| 13,991,808 |
www.calvert.com CALVERT CAPITAL ACCUMULATION FUND SEMI-ANNUAL REPORT (UNAUDITED) 15
|
| | | | | | |
EQUITY SECURITIES - CONT'D | SHARES | VALUE |
| | | |
| Specialty Retail - Cont'd | | |
| The Buckle, Inc. | 209,950 |
| $10,726,345 |
| Ulta Salon, Cosmetics & Fragrance, Inc.* | 87,827 |
| 13,248,703 |
| | | 51,256,482 |
| | | |
| Textiles, Apparel & Luxury Goods - 3.3% | | |
| Deckers Outdoor Corp.* | 89,900 |
| 6,551,013 |
| Fossil Group, Inc.* | 103,228 |
| 8,511,149 |
| | | 15,062,162 |
| | | |
| Thrifts & Mortgage Finance - 1.8% | | |
| BofI Holding, Inc.* | 90,100 |
| 8,382,904 |
| | | |
| | | |
| Total Equity Securities (Cost $369,274,764) | | 453,116,632 |
| | | |
| | | |
HIGH SOCIAL IMPACT INVESTMENTS - 0.3% | PRINCIPAL AMOUNT | |
| Calvert Social Investment Foundation Notes, 0.25%, 7/1/17 (b)(i)(r) |
| $1,419,488 |
| 1,407,283 |
| | | |
| Total High Social Impact Investments (Cost $1,419,488) | | 1,407,283 |
| | | |
TIME DEPOSIT - 2.0% | | |
| State Street Bank Time Deposit, 0.088%, 4/1/15 | 9,389,468 |
| 9,389,468 |
|
| | | |
| Total Time Deposit (Cost $9,389,468) | | 9,389,468 |
|
| | | |
| TOTAL INVESTMENTS (Cost $380,083,720) - 100.2% | | 463,913,383 |
|
| Other assets and liabilities, net - (0.2%) | | (891,601 | ) |
NET ASSETS - 100% | |
| $463,021,782 |
|
| | | |
| See notes to financial statements. |
16 www.calvert.com CALVERT CAPITAL ACCUMULATION FUND SEMI-ANNUAL REPORT (UNAUDITED)
|
| | | |
NET ASSETS CONSIST OF: | |
| Paid-in capital applicable to the following shares of common stock, with 250,000,000 shares of $0.01 par value authorized: | |
| Class A: 6,661,081 shares outstanding |
| $177,557,304 |
|
| Class B: 48,364 shares outstanding | 2,209,510 |
|
| Class C: 1,117,952 shares outstanding | 26,875,045 |
|
| Class I: 4,218,643 shares outstanding | 142,622,778 |
|
| Class Y: 328,423 shares outstanding | 10,321,685 |
|
| Undistributed net investment income (loss) | (100,543 | ) |
| Accumulated net realized gain (loss) | 19,706,340 |
|
| Net unrealized appreciation (depreciation) | 83,829,663 |
|
| | |
NET ASSETS |
| $463,021,782 |
|
| | |
NET ASSET VALUE PER SHARE | |
| Class A (based on net assets of $243,204,433) |
| $36.51 |
|
| Class B (based on net assets of $1,363,097) |
| $28.18 |
|
| Class C (based on net assets of $31,430,353) |
| $28.11 |
|
| Class I (based on net assets of $174,915,686) |
| $41.46 |
|
| Class Y (based on net assets of $12,108,213) |
| $36.87 |
|
| | |
| |
|
| | | | |
RESTRICTED SECURITIES | ACQUISITION DATE | COST |
| Calvert Social Investment Foundation Notes, 0.25%, 7/1/17 | 7/1/14 |
| $1,419,488 |
|
(b) This security was valued under the direction of the Board of Directors. See Note A. (i) Restricted securities represent 0.3% of the net assets of the fund. (r) The coupon rate shown on floating or adjustable rate securities represents the rate at period end. * Non-income producing security. See notes to financial statements. |
www.calvert.com CALVERT CAPITAL ACCUMULATION FUND SEMI-ANNUAL REPORT (UNAUDITED) 17
STATEMENT OF OPERATIONS
SIX MONTHS ENDED MARCH 31, 2015
|
| | | |
NET INVESTMENT INCOME | |
| Investment Income: | |
| Dividend income |
| $2,560,348 |
|
| Interest income | 9,460 |
|
| Total investment income | 2,569,808 |
|
| | |
| Expenses: | |
| Investment advisory fee | 1,386,784 |
|
| Transfer agency fees | 291,468 |
|
| Administrative fees | 412,346 |
|
| Distribution Plan expenses: | |
| Class A | 279,866 |
|
| Class B | 7,126 |
|
| �� Class C | 144,203 |
|
| Directors' fees and expenses | 22,368 |
|
| Custodian fees | 24,022 |
|
| Registration fees | 45,955 |
|
| Reports to shareholders | 26,351 |
|
| Professional fees | 22,221 |
|
| Miscellaneous | 12,244 |
|
| Total expenses | 2,674,954 |
|
| Reimbursement from Advisor: | |
| Class B | (4,603 | ) |
| Net expenses | 2,670,351 |
|
| | |
NET INVESTMENT INCOME (LOSS) | (100,543 | ) |
| | |
REALIZED AND UNREALIZED GAIN (LOSS) ON INVESTMENTS | |
| Net realized gain (loss) | 22,296,708 |
|
| Change in unrealized appreciation (depreciation) | 37,366,396 |
|
| | |
| | |
NET REALIZED AND UNREALIZED GAIN (LOSS) ON INVESTMENTS | 59,663,104 |
|
| | |
INCREASE (DECREASE) IN NET ASSETS RESULTING FROM OPERATIONS |
| $59,562,561 |
|
| | |
| See notes to financial statements. |
18 www.calvert.com CALVERT CAPITAL ACCUMULATION FUND SEMI-ANNUAL REPORT (UNAUDITED)
STATEMENTS OF CHANGES IN NET ASSETS
|
| | | | | | | |
INCREASE (DECREASE) IN NET ASSETS | SIX MONTHS ENDED MARCH 31, 2015 | | YEAR ENDED SEPTEMBER 30, 2014 |
| Operations: | | | |
| Net investment income (loss) |
| ($100,543 | ) | |
| ($815,075 | ) |
| Net realized gain (loss) | 22,296,708 |
| | 59,457,045 |
|
| Change in unrealized appreciation (depreciation) | 37,366,396 |
| | (28,138,344 | ) |
| | | | |
INCREASE (DECREASE) IN NET ASSETS RESULTING FROM OPERATIONS | 59,562,561 |
| | 30,503,626 |
|
| | | | |
| Distributions to shareholders from: | | | |
| Net realized gain: | | | |
| Class A shares | (30,865,909 | ) | | (14,945,015 | ) |
| Class B shares | (251,625 | ) | | (177,298 | ) |
| Class C shares | (4,946,653 | ) | | (2,189,103 | ) |
| Class I shares | (20,496,886 | ) | | (8,563,686 | ) |
| Class Y shares | (1,536,994 | ) | | (1,114,603 | ) |
| Total distributions | (58,098,067 | ) | | (26,989,705 | ) |
| | | | |
| Capital share transactions: | | | |
| Shares sold: | | | |
| Class A shares | 17,352,706 |
| | 32,067,475 |
|
| Class B shares | 4,704 |
| | 63,533 |
|
| Class C shares | 2,669,557 |
| | 4,614,839 |
|
| Class I shares | 20,766,951 |
| | 40,956,937 |
|
| Class Y shares | 1,204,314 |
| | 10,488,394 |
|
| Reinvestment of distributions: | | | |
| Class A shares | 28,980,344 |
| | 14,069,011 |
|
| Class B shares | 238,368 |
| | 170,836 |
|
| Class C shares | 4,103,070 |
| | 1,820,485 |
|
| Class I shares | 11,967,403 |
| | 4,405,337 |
|
| Class Y shares | 1,529,030 |
| | 1,101,720 |
|
| Redemption fees: | | | |
| Class A shares | 208 |
| | 997 |
|
| Class C shares | 2 |
| | 43 |
|
| Class I shares | 191 |
| | 200 |
|
| Shares redeemed: | | | |
| Class A shares | (19,027,179 | ) | | (39,220,043 | ) |
| Class B shares | (339,271 | ) | | (793,635 | ) |
| Class C shares | (1,881,973 | ) | | (3,738,490 | ) |
| Class I shares | (16,838,026 | ) | | (22,197,082 | ) |
| Class Y shares | (1,519,479 | ) | | (15,100,337 | ) |
| Total capital share transactions | 49,210,920 |
| | 28,710,220 |
|
| | | | |
TOTAL INCREASE (DECREASE) IN NET ASSETS | 50,675,414 |
| | 32,224,141 |
|
| See notes to financial statements. |
www.calvert.com CALVERT CAPITAL ACCUMULATION FUND SEMI-ANNUAL REPORT (UNAUDITED) 19
STATEMENTS OF CHANGES IN NET ASSETS
|
| | | | | | | |
NET ASSETS | SIX MONTHS ENDED MARCH 31, 2015 | | YEAR ENDED SEPTEMBER 30, 2014 |
| Beginning of period |
| $412,346,368 |
| |
| $380,122,227 |
|
| End of period (including undistributed net loss of $100,543 and $0, respectively) |
| $463,021,782 |
| |
| $412,346,368 |
|
| | | | |
CAPITAL SHARE ACTIVITY | | | |
| Shares sold: | | | |
| Class A shares | 491,721 |
| | 870,814 |
|
| Class B shares | 151 |
| | 2,073 |
|
| Class C shares | 98,429 |
| | 154,647 |
|
| Class I shares | 524,013 |
| | 1,005,460 |
|
| Class Y shares | 33,741 |
| | 280,613 |
|
| Reinvestment of distributions: | | | |
| Class A shares | 877,129 |
| | 395,976 |
|
| Class B shares | 9,308 |
| | 5,877 |
|
| Class C shares | 160,904 |
| | 63,299 |
|
| Class I shares | 319,557 |
| | 111,896 |
|
| Class Y shares | 45,862 |
| | 30,809 |
|
| Shares redeemed: | | | |
| Class A shares | (539,035 | ) | | (1,062,252 | ) |
| Class B shares | (12,156 | ) | | (26,330 | ) |
| Class C shares | (68,322 | ) | | (124,957 | ) |
| Class I shares | (428,468 | ) | | (541,398 | ) |
| Class Y shares | (42,934 | ) | | (417,051 | ) |
| Total capital share activity | 1,469,900 |
| | 749,476 |
|
| | | | |
| See notes to financial statements. |
20 www.calvert.com CALVERT CAPITAL ACCUMULATION FUND SEMI-ANNUAL REPORT (UNAUDITED)
NOTES TO FINANCIAL STATEMENTS
NOTE A — SIGNIFICANT ACCOUNTING POLICIES
General: Calvert Capital Accumulation Fund (the “Fund”), a series of Calvert World Values Fund, Inc., is registered under the Investment Company Act of 1940 as a non-diversified, open-end management investment company. Calvert World Values Fund, Inc. is comprised of four separate series. The operations of each series are accounted for separately. The Fund offers five classes of shares of capital stock - Classes A, B, C, I, and Y. Class A shares are sold with a maximum front-end sales charge of 4.75%. Class B shares are sold without a front-end sales charge and, with certain exceptions, will be charged a deferred sales charge at the time of redemption, depending on how long investors have owned the shares. Class B shares are no longer offered for purchase, except through reinvestment of dividends and/or distributions and through certain exchanges. Class B shares were closed effective April 20, 2015. Class C shares are sold without a front-end sales charge and, with certain exceptions, will be charged a deferred sales charge on shares sold within one year of purchase. Class B and Class C shares have higher levels of expenses than Class A shares. Class I shares require a minimum account balance of $1,000,000. The $1 million minimum initial investment is waived for retirement plans that trade through omnibus accounts and may be waived for certain other institutional accounts where it is believed to be in the best interest of the Fund and its shareholders. Class I shares have no front-end or deferred sales charge and have lower levels of expenses than Class A Shares. Class Y shares are generally only available to wrap or similar fee-based programs offered by financial intermediaries, foundations, and endowments that have entered into an agreement with the Fund’s Distributor to offer Class Y shares. Class Y shares have no front-end or deferred sales charge and have lower levels of expenses than Class A shares. Each class has different: (a) dividend rates, due to differences in Distribution Plan expenses and other class-specific expenses, (b) exchange privileges; and (c) class-specific voting rights.
Security Valuation: Net asset value per share is determined every business day as of the close of the regular session of the New York Stock Exchange (generally 4:00 p.m. Eastern time). The Fund uses independent pricing services approved by the Board of Directors (“the Board”) to value its investments wherever possible. Investments for which market quotations are not available or deemed not reliable are fair valued in good faith under the direction of the Board.
The Board has adopted Valuation Procedures (the “Procedures”) to determine the fair value of securities and other financial instruments for which market prices are not readily available or which may not be reliably priced. The Board has delegated the day-to-day responsibility for determining the fair value of assets of the Fund to Calvert Investment Management, Inc. (the “Advisor” or “Calvert”) and has provided these Procedures to govern Calvert in its valuation duties.
Calvert has chartered an internal Valuation Committee to oversee the implementation of these Procedures and to assist it in carrying out the valuation responsibilities that the Board has delegated.
The Valuation Committee meets on a regular basis to review illiquid securities and other investments which may not have readily available market prices. The Valuation Committee’s fair valuation determinations are subject to review, approval and ratification by the Board at its next regularly scheduled meeting covering the calendar quarter in which the fair valuation was determined.
The Valuation Committee utilizes various methods to measure the fair value of the Funds’ investments. Generally Accepted Accounting Principles (GAAP) establishes a disclosure hierarchy that categorizes the inputs to valuation techniques used to value assets and liabilities at measurement date. These inputs are summarized in the three broad levels listed below:
www.calvert.com CALVERT CAPITAL ACCUMULATION FUND SEMI-ANNUAL REPORT (UNAUDITED) 21
Level 1 - quoted prices in active markets for identical securities
Level 2 - other significant observable inputs (including quoted prices for similar securities, interest rates, prepayment speeds, credit risk, etc.)
Level 3 - significant unobservable inputs (including the Fund’s own assumptions in determining the fair value of investments)
The inputs or methodologies used for valuing securities are not necessarily an indication of the risk associated with investing in those securities.
Changes in valuation techniques may result in transfers in or out of an investment’s assigned level within the hierarchy during the period. There were no such transfers during the period. Valuation techniques used to value the Fund's investments by major category are as follows:
Equity securities, including restricted securities, for which market quotations are readily available, are valued at the last reported sale price or official closing price as reported by an independent pricing service on the primary market or exchange on which they are traded and are categorized as Level 1 in the hierarchy. In the event there were no sales during the day or closing prices are not available, securities are valued at the last quoted bid price or using the last available price and are categorized as Level 2 in the hierarchy. Foreign securities are valued based on quotations from the principal market in which such securities are normally traded. If events occur after the close of the principal market in which foreign securities are traded, and before the close of business of the Fund, that are expected to materially affect the value of those securities, then they are valued at their fair value taking these events into account. For restricted securities and private placements where observable inputs are limited, assumptions about market activity and risk are used and such securities are categorized as Level 3 in the hierarchy.
Debt securities, including restricted securities, are valued based on evaluated prices received from independent pricing services or from dealers who make markets in such securities and are generally categorized as Level 2 in the hierarchy. Short-term securities of sufficient credit quality with remaining maturities of sixty days or less for which quotations are not readily available are valued at amortized cost, which approximates fair value, and are categorized as Level 2 in the hierarchy.
When independent prices are unavailable or unreliable, debt securities may be valued utilizing pricing matrices which consider similar factors that would be used by independent pricing services. These are generally categorized as Level 2 in the hierarchy but may be Level 3 depending on the circumstances.
If a market value cannot be determined for a security using the methodologies described above, or if, in the good faith opinion of the Advisor, the market value does not constitute a readily available market quotation, or if a significant event has occurred that would materially affect the value of the security, the security will be fair valued as determined in good faith by the Valuation Committee.
The Valuation Committee considers a number of factors, including significant unobservable valuation inputs when arriving at fair value. It considers all significant facts that are reasonably available and relevant to the determination of fair value.
The Valuation Committee primarily employs a market-based approach which may use related or comparable assets or liabilities, recent transactions, market multiples, book values, and other relevant information for the investment to determine the fair value of the investment. When more appropriate, the fund may employ an income-based or cost approach. An income-based valuation approach discounts anticipated future cash flows of the investment to calculate a present amount (discounted). The measurement is based on the value indicated by current
22 www.calvert.com CALVERT CAPITAL ACCUMULATION FUND SEMI-ANNUAL REPORT (UNAUDITED)
market expectations about those future amounts. Discounts may also be applied due to the nature or duration of any restrictions on the disposition of the investments. A cost based approach is based on the amount that currently would be required to replace the service capacity of an asset (current replacement cost). From the seller’s perspective, the price that would be received for the asset is determined based on the cost to a buyer to acquire or construct a substitute asset of comparable utility, adjusted for obsolescence.
The values assigned to fair value investments are based on available information and do not necessarily represent amounts that might ultimately be realized. Further, due to the inherent uncertainty of valuations of such investments, the fair values may differ significantly from the values that would have been used had an active market existed, and the differences could be material. The Valuation Committee employs various methods for calibrating these valuation approaches including a regular review of key inputs and assumptions, transactional back-testing or disposition analysis and reviews of any related market activity.
At March 31, 2015, securities valued at $1,407,283, or 0.3% of net assets, were fair valued in good faith under the direction of the Board.
The following table summarizes the market value of the Fund’s holdings as of March 31, 2015, based on the inputs used to value them:
|
| | | | | | | | | | | | | | |
| | VALUATION INPUTS |
INVESTMENTS IN SECURITIES | LEVEL 1 | | LEVEL 2 | | LEVEL 3 | | TOTAL |
| Equity securities* |
| $453,116,632 |
| | — |
| | — |
| |
| $453,116,632 |
|
| Other debt obligations | — |
| |
| $10,796,751 |
| | — |
| | 10,796,751 |
|
| TOTAL |
| $453,116,632 |
| |
| $10,796,751 |
| | — |
| |
| $463,913,383 |
|
| | | | | | | | |
* For further breakdown of equity securities by industry, please refer to the Statement of Net Assets. |
Restricted Securities: The Fund may invest in securities that are subject to legal or contractual restrictions on resale. Generally, these securities may only be sold publicly upon registration under the Securities Act of 1933 or in transactions exempt from such registration. Information regarding restricted securities is included at the end of the Statement of Net Assets.
Security Transactions and Net Investment Income: Security transactions are accounted for on trade date. Realized gains and losses are recorded on an identified cost basis and may include proceeds from litigation. Dividend income is recorded on the ex-dividend date. Distributions received on securities that represent a return of capital or capital gain are recorded as a reduction of cost investments and/or as a realized gain. Interest income, which includes amortization of premium and accretion of discount on debt securities, is accrued as earned. Investment income and realized and unrealized gains and losses are allocated to separate classes of shares based upon the relative net assets of each class. Expenses arising in connection with a specific class are charged directly to that class. Expenses common to the classes are allocated to each class in proportion to their relative net assets.
Distributions to Shareholders: Distributions to shareholders are recorded by the Fund on ex-dividend date. Dividends from net investment income and distributions from net realized capital gains, if any, are paid at least annually. Distributions are determined in accordance with income tax regulations which may differ from generally accepted accounting principles; accordingly, periodic reclassifications are made within the Fund’s capital accounts to reflect income and gains available for distribution under income tax regulations.
www.calvert.com CALVERT CAPITAL ACCUMULATION FUND SEMI-ANNUAL REPORT (UNAUDITED) 23
Estimates: The preparation of financial statements in conformity with accounting principles generally accepted in the United States requires management to make estimates and assumptions that affect the reported amounts of assets and liabilities and disclosure of contingent assets and liabilities at the date of the financial statements and the reported amounts of income and expenses during the reported period. Actual results could differ from those estimates.
Redemption Fees: The Fund charges a 2% redemption fee on redemptions, including exchanges, made within 30 days of purchase (within seven days for Class I shares). The redemption fee is accounted for as an addition to paid-in capital and is intended to discourage market-timers by ensuring that short-term trading costs are borne by the investors making the transactions and not the shareholders already in the Fund. This fee was eliminated effective February 2, 2015.
Federal Income Taxes: No provision for federal income or excise tax is required since the Fund intends to continue to qualify as a regulated investment company under the Internal Revenue Code and to distribute substantially all of its taxable earnings.
Management has analyzed the Fund’s tax positions taken for all open federal income tax years and has concluded that no provision for federal income tax is required in the Fund’s financial statements. A Fund’s federal tax return is subject to examination by the Internal Revenue Service for a period of three years.
NOTE B — RELATED PARTY TRANSACTIONS
Calvert Investment Management, Inc. (the “Advisor”) is wholly-owned by Calvert Investments, Inc., which is indirectly wholly-owned by Ameritas Mutual Holding Company. The Advisor provides investment advisory services and pays the salaries and fees of officers and Directors of the Fund who are employees of the Advisor or its affiliates. For its services, the Advisor receives an annual fee, payable monthly, of .65% of the Fund’s average daily net assets. Under the terms of the agreement, $250,237 was payable at period end.
The Advisor has contractually agreed to limit net annual fund operating expenses through January 31, 2016. The contractual expense caps are 1.59%, 2.59%, .86%, and 1.44% for Class A, C, I, and Y, respectively. For the purpose of this expense limit, operating expenses do not include interest expense, brokerage commissions, taxes, and extraordinary expenses. This expense limitation does not limit acquired fund fees and expenses, if any.
During the six months ended March 31, 2015, the Advisor voluntarily reimbursed expenses of $4,603 for Class B of the Fund. At period end, $1,021 was receivable from the Advisor.
Calvert Investment Administrative Services, Inc., an affiliate of the Advisor, provides administrative services to the Fund for an annual fee, payable monthly, of .25% for Classes A, B, C, and Y, and .10% for Class I shares based on their average daily net assets. Under the terms of the agreement, $74,478 was payable at period end.
Calvert Investment Distributors, Inc. (“CID”), an affiliate of the Advisor, is the distributor and principal underwriter for the Fund. Pursuant to Rule 12b-1 under the Investment Company Act of 1940, the Fund has adopted a Distribution Plan that permits the Fund to pay certain expenses associated with the distribution and servicing of its shares. The expenses paid may not exceed .35%, 1.00% and 1.00% annually of average daily net assets of Classes A, B, and C, respectively. The amount actually paid by the Fund is an annualized fee, payable monthly, of .25%, 1.00% and 1.00% of the Fund’s average daily net assets of Classes A, B, and C, respectively. Class I and Class Y shares do not have Distribution Plan expenses. Under the terms of the agreement, $77,926 was payable at period end.
24 www.calvert.com CALVERT CAPITAL ACCUMULATION FUND SEMI-ANNUAL REPORT (UNAUDITED)
CID received $31,075 as its portion of the commissions charged on sales of the Fund’s Class A shares for the six months ended March 31, 2015.
Calvert Investment Services, Inc. (“CIS”), an affiliate of the Advisor, acts as shareholder servicing agent for the Fund. For its services, CIS received a fee of $42,938 for the six months ended March 31, 2015. Under the terms of the agreement, $7,075 was payable at period end. Boston Financial Data Services, Inc. is the transfer and dividend disbursing agent.
The Fund may invest in Community Investment Notes issued by the Calvert Social Investment Foundation (the “CSI Foundation”). The CSI Foundation is a 501(c)(3) non-profit organization that receives in-kind support from Calvert and its subsidiaries. The Fund has received an exemptive order from the Securities and Exchange Commission permitting the Fund to make investments in these notes under certain conditions.
Each Director of the Fund who is not an employee of the Advisor or its affiliates receives an annual retainer of $52,000 ($48,000 prior to January 1, 2015) plus a meeting fee of up to $3,000 for each Board meeting attended. Additional fees of $6,000 ($5,000 prior to January 1, 2015) annually may be paid to the Committee chairs ($10,000 for the Board Chair and the Special Equities Committee chair) and $2,500 annually may be paid to Committee members, plus a Committee meeting fee of $500 for each Committee meeting attended. Directors’ fees are allocated to each of the funds served.
NOTE C — INVESTMENT ACTIVITY AND TAX INFORMATION
During the period, the cost of purchases and proceeds from sales of investments, other than short-term securities, were $180,907,585 and $190,510,538, respectively.
|
| | | |
| Unrealized appreciation |
| $95,470,927 |
|
| Unrealized (depreciation) | (12,095,420 | ) |
| Net unrealized appreciation/(depreciation) |
| $83,375,507 |
|
| | |
| Federal income tax cost of investments |
| $380,537,876 |
|
NOTE D — LINE OF CREDIT
A financing agreement is in place with the Calvert Funds and State Street Corporation (“SSC”). Under the agreement, SSC provides an unsecured line of credit facility, in the aggregate amount of $50 million ($25 million committed and $25 million uncommitted), accessible by the Funds for temporary or emergency purposes only. Borrowings bear interest at the higher of the London Interbank Offered Rate (LIBOR) or the overnight Federal Funds Rate plus 1.25% per annum. A commitment fee of .125% per annum is incurred on the unused portion of the committed facility, which is allocated to all participating funds. The Fund had no borrowings under the agreement during the six months ended March 31, 2015.
NOTE E — SUBSEQUENT EVENTS
All existing Class B shares of the Fund were automatically converted to Class A shares of the Fund at the close of business on April 20, 2015, without the imposition of the applicable Class A sales load or the Class B contingent deferred sales charge. Class B shares were closed at that time and are no longer available.
In preparing the financial statements as of March 31, 2015, no other subsequent events or transactions occurred that would have required recognition or disclosure in these financial statements.
www.calvert.com CALVERT CAPITAL ACCUMULATION FUND SEMI-ANNUAL REPORT (UNAUDITED) 25
FINANCIAL HIGHLIGHTS
|
| | | | | | | | | | | |
| | | PERIODS ENDED | |
CLASS A SHARES | MARCH 31, 2015 | | SEPTEMBER 30, 2014 (z) | | SEPTEMBER 30, 2013 (z) |
| Net asset value, beginning |
| $36.99 |
| |
| $36.83 |
| |
| $31.45 |
|
| Income from investment operations: | | | | | |
| Net investment income (loss) | (.04 | ) | | (.14 | ) | | (.18 | ) |
| Net realized and unrealized gain (loss) | 4.89 |
| | 2.94 |
| | 7.49 |
|
| Total from investment operations | 4.85 |
| | 2.80 |
| | 7.31 |
|
| Distributions from: | | | | | |
| Net investment income | — |
| | — |
| | — |
|
| Net realized gain | (5.33 | ) | | (2.64 | ) | | (1.93 | ) |
| Total distributions | (5.33 | ) | | (2.64 | ) | | (1.93 | ) |
| Total increase (decrease) in net asset value | (.48 | ) | | .16 |
| | 5.38 |
|
| Net asset value, ending |
| $36.51 |
| |
| $36.99 |
| |
| $36.83 |
|
| | | | | | |
| Total return* | 14.63 | % | | 7.90 | % | | 24.74 | % |
Ratios to average net assets: A | | | | | |
| Net investment income (loss) | (.22%) (a) |
| | (.36 | %) | | (.53 | %) |
| Total expenses | 1.43% (a) |
| | 1.43 | % | | 1.48 | % |
| Expenses before offsets | 1.43% (a) |
| | 1.43 | % | | 1.48 | % |
| Net expenses | 1.43% (a) |
| | 1.43 | % | | 1.48 | % |
| Portfolio turnover | 42 | % | | 81 | % | | 73 | % |
| Net assets, ending (in thousands) |
| $243,204 |
| |
| $215,683 |
| |
| $207,257 |
|
| | | | | | |
|
| | | | | | | | | | | |
| | | | YEARS ENDED | | |
CLASS A SHARES | SEPTEMBER 30, 2012 (z) | | SEPTEMBER 30, 2011 (z) | | SEPTEMBER 30, 2010 |
| Net asset value, beginning |
| $26.00 |
| |
| $24.93 |
| |
| $20.71 |
|
| Income from investment operations: | | | | | |
| Net investment income (loss) | (.26 | ) | | (.28 | ) | | (.25 | ) |
| Net realized and unrealized gain (loss) | 7.64 |
| | 1.35 |
| | 4.47 |
|
| Total from investment operations | 7.38 |
| | 1.07 |
| | 4.22 |
|
| Distributions from: | | | | | |
| Net investment income | — |
| | — |
| | — |
|
| Net realized gain | (1.93 | ) | | — |
| | — |
|
| Total distributions | (1.93 | ) | | — |
| | — |
|
| Total increase (decrease) in net asset value | 5.45 |
| | 1.07 |
| | 4.22 |
|
| Net asset value, ending |
| $31.45 |
| |
| $26.00 |
| |
| $24.93 |
|
| | | | | | |
| Total return* | 29.16 | % | | 4.29 | % | | 20.38 | % |
Ratios to average net assets: A | | | | | |
| Net investment income (loss) | (.85 | %) | | (.93 | %) | | (1.08 | %) |
| Total expenses | 1.53 | % | | 1.58 | % | | 1.76 | % |
| Expenses before offsets | 1.53 | % | | 1.58 | % | | 1.76 | % |
| Net expenses | 1.53 | % | | 1.58 | % | | 1.76 | % |
| Portfolio turnover | 63 | % | | 65 | % | | 87 | % |
| Net assets, ending (in thousands) |
| $157,016 |
| |
| $128,755 |
| |
| $86,635 |
|
| See notes to financial highlights. |
26 www.calvert.com CALVERT CAPITAL ACCUMULATION FUND SEMI-ANNUAL REPORT (UNAUDITED)
FINANCIAL HIGHLIGHTS
|
| | | | | | | | | | | |
| | | PERIODS ENDED | |
CLASS B SHARES | MARCH 31, 2015 | | SEPTEMBER 30, 2014 (z) | | SEPTEMBER 30, 2013 (z) |
| Net asset value, beginning |
| $29.91 |
| |
| $30.68 |
| |
| $26.86 |
|
| Income from investment operations: | | | | | |
| Net investment income (loss) | (.25 | ) | | (.54 | ) | | (.52 | ) |
| Net realized and unrealized gain (loss) | 3.85 |
| | 2.41 |
| | 6.27 |
|
| Total from investment operations | 3.60 |
| | 1.87 |
| | 5.75 |
|
| Distributions from: | | | | | |
| Net investment income | — |
| | — |
| | — |
|
| Net realized gain | (5.33 | ) | | (2.64 | ) | | (1.93 | ) |
| Total distributions | (5.33 | ) | | (2.64 | ) | | (1.93 | ) |
| Total increase (decrease) in net asset value | (1.73 | ) | | (.77 | ) | | 3.82 |
|
| Net asset value, ending |
| $28.18 |
| |
| $29.91 |
| |
| $30.68 |
|
| | | | | | |
| Total return* | 13.83 | % | | 6.35 | % | | 23.05 | % |
Ratios to average net assets: A | | | | | |
| Net investment income (loss) | (1.67%) (a) |
| | (1.78 | %) | | (1.88 | %) |
| Total expenses | 3.51% (a) |
| | 2.93 | % | | 2.93 | % |
| Expenses before offsets | 2.86% (a) |
| | 2.86 | % | | 2.86 | % |
| Net expenses | 2.86% (a) |
| | 2.86 | % | | 2.86 | % |
| Portfolio turnover | 42 | % | | 81 | % | | 73 | % |
| Net assets, ending (in thousands) |
| $1,363 |
| |
| $1,527 |
| |
| $2,131 |
|
| | | | | | |
|
| | | | | | | | | | | |
| | | | YEARS ENDED | | |
CLASS B SHARES | SEPTEMBER 30, 2012 (z) | | SEPTEMBER 30, 2011 (z) | | SEPTEMBER 30, 2010 |
| Net asset value, beginning |
| $22.72 |
| |
| $22.03 |
| |
| $18.50 |
|
| Income from investment operations: | | | | | |
| Net investment income (loss) | (.55 | ) | | (.55 | ) | | (.53 | ) |
| Net realized and unrealized gain (loss) | 6.62 |
| | 1.24 |
| | 4.06 |
|
| Total from investment operations | 6.07 |
| | .69 |
| | 3.53 |
|
| Distributions from: | | | | | |
| Net investment income | — |
| | — |
| | — |
|
| Net realized gain | (1.93 | ) | | — |
| | — |
|
| Total distributions | (1.93 | ) | | — |
| | — |
|
| Total increase (decrease) in net asset value | 4.14 |
| | .69 |
| | 3.53 |
|
| Net asset value, ending |
| $26.86 |
| |
| $22.72 |
| |
| $22.03 |
|
| | | | | | |
| Total return* | 27.50 | % | | 3.13 | % | | 19.08 | % |
Ratios to average net assets: A | | | | | |
| Net investment income (loss) | (2.12 | %) | | (2.07 | %) | | (2.17 | %) |
| Total expenses | 2.80 | % | | 2.72 | % | | 2.84 | % |
| Expenses before offsets | 2.80 | % | | 2.72 | % | | 2.84 | % |
| Net expenses | 2.80 | % | | 2.71 | % | | 2.84 | % |
| Portfolio turnover | 63 | % | | 65 | % | | 87 | % |
| Net assets, ending (in thousands) |
| $2,707 |
| |
| $3,129 |
| |
| $4,138 |
|
| See notes to financial highlights. |
www.calvert.com CALVERT CAPITAL ACCUMULATION FUND SEMI-ANNUAL REPORT (UNAUDITED) 27
FINANCIAL HIGHLIGHTS
|
| | | | | | | | | | | |
| | | PERIODS ENDED | |
CLASS C SHARES | MARCH 31, 2015 | | SEPTEMBER 30, 2014 (z) | | SEPTEMBER 30, 2013 (z) |
| Net asset value, beginning |
| $29.76 |
| |
| $30.35 |
| |
| $26.44 |
|
| Income from investment operations: | | | | | |
| Net investment income (loss) | (.13 | ) | | (.34 | ) | | (.36 | ) |
| Net realized and unrealized gain (loss) | 3.81 |
| | 2.39 |
| | 6.20 |
|
| Total from investment operations | 3.68 |
| | 2.05 |
| | 5.84 |
|
| Distributions from: | | | | | |
| Net investment income | — |
| | — |
| | — |
|
| Net realized gain | (5.33 | ) | | (2.64 | ) | | (1.93 | ) |
| Total distributions | (5.33 | ) | | (2.64 | ) | | (1.93 | ) |
| Total increase (decrease) in net asset value | (1.65 | ) | | (.59 | ) | | 3.91 |
|
| Net asset value, ending |
| $28.11 |
| |
| $29.76 |
| |
| $30.35 |
|
| | | | | | |
| Total return* | 14.20 | % | | 7.06 | % | | 23.81 | % |
Ratios to average net assets: A | | | | | |
| Net investment income (loss) | (.98%) (a) |
| | (1.12 | %) | | (1.30 | %) |
| Total expenses | 2.19% (a) |
| | 2.19 | % | | 2.25 | % |
| Expenses before offsets | 2.19% (a) |
| | 2.19 | % | | 2.25 | % |
| Net expenses | 2.19% (a) |
| | 2.19 | % | | 2.25 | % |
| Portfolio turnover | 42 | % | | 81 | % | | 73 | % |
| Net assets, ending (in thousands) |
| $31,430 |
| |
| $27,588 |
| |
| $25,311 |
|
| | | | | | |
|
| | | | | | | | | | | |
| | | | YEARS ENDED | | |
CLASS C SHARES | SEPTEMBER 30, 2012 (z) | | SEPTEMBER 30, 2011 (z) | | SEPTEMBER 30, 2010 |
| Net asset value, beginning |
| $22.29 |
| |
| $21.55 |
| |
| $18.05 |
|
| Income from investment operations: | | | | | |
| Net investment income (loss) | (.42 | ) | | (.46 | ) | | (.39 | ) |
| Net realized and unrealized gain (loss) | 6.50 |
| | 1.20 |
| | 3.89 |
|
| Total from investment operations | 6.08 |
| | .74 |
| | 3.50 |
|
| Distributions from: | | | | | |
| Net investment income | — |
| | — |
| | — |
|
| Net realized gain | (1.93 | ) | | — |
| | — |
|
| Total distributions | (1.93 | ) | | — |
| | — |
|
| Total increase (decrease) in net asset value | 4.15 |
| | .74 |
| | 3.50 |
|
| Net asset value, ending |
| $26.44 |
| |
| $22.29 |
| |
| $21.55 |
|
| | | | | | |
| Total return* | 28.11 | % | | 3.43 | % | | 19.39 | % |
Ratios to average net assets: A | | | | | |
| Net investment income (loss) | (1.64 | %) | | (1.79 | %) | | (1.87 | %) |
| Total expenses | 2.33 | % | | 2.44 | % | | 2.54 | % |
| Expenses before offsets | 2.33 | % | | 2.44 | % | | 2.54 | % |
| Net expenses | 2.33 | % | | 2.44 | % | | 2.54 | % |
| Portfolio turnover | 63 | % | | 65 | % | | 87 | % |
| Net assets, ending (in thousands) |
| $18,630 |
| |
| $12,973 |
| |
| $9,449 |
|
| See notes to financial highlights. |
28 www.calvert.com CALVERT CAPITAL ACCUMULATION FUND SEMI-ANNUAL REPORT (UNAUDITED)
FINANCIAL HIGHLIGHTS
|
| | | | | | | | | | | |
| | | PERIODS ENDED | |
CLASS I SHARES | MARCH 31, 2015 | | SEPTEMBER 30, 2014 (z) | | SEPTEMBER 30, 2013 (z) |
| Net asset value, beginning |
| $41.19 |
| |
| $40.50 |
| |
| $34.18 |
|
| Income from investment operations: | | | | | |
| Net investment income | .07 |
| | .10 |
| | .03 |
|
| Net realized and unrealized gain (loss) | 5.53 |
| | 3.23 |
| | 8.22 |
|
| Total from investment operations | 5.60 |
| | 3.33 |
| | 8.25 |
|
| Distributions from: | | | | | |
| Net investment income | — |
| | — |
| | — |
|
| Net realized gain | (5.33 | ) | | (2.64 | ) | | (1.93 | ) |
| Total distributions | (5.33 | ) | | (2.64 | ) | | (1.93 | ) |
| Total increase (decrease) in net asset value | .27 |
| | .69 |
| | 6.32 |
|
| Net asset value, ending |
| $41.46 |
| |
| $41.19 |
| |
| $40.50 |
|
| | | | | | |
| Total return* | 14.98 | % | | 8.53 | % | | 25.55 | % |
Ratios to average net assets: A | | | | | |
| Net investment income | .38% (a) |
| | .24 | % | | .08 | % |
| Total expenses | .83% (a) |
| | .82 | % | | .85 | % |
| Expenses before offsets | .83% (a) |
| | .82 | % | | .85 | % |
| Net expenses | .83% (a) |
| | .82 | % | | .85 | % |
| Portfolio turnover | 42 | % | | 81 | % | | 73 | % |
| Net assets, ending (in thousands) |
| $174,916 |
| |
| $156,677 |
| |
| $130,705 |
|
| | | | | | |
|
| | | | | | | | | | | |
| | | | YEARS ENDED | | |
CLASS I SHARES | SEPTEMBER 30, 2012 (z) | | SEPTEMBER 30, 2011 (z) | | SEPTEMBER 30, 2010 |
| Net asset value, beginning |
| $27.94 |
| |
| $26.59 |
| |
| $21.89 |
|
| Income from investment operations: | | | | | |
| Net investment income (loss) | (.05 | ) | | (.06 | ) | | (.04 | ) |
| Net realized and unrealized gain (loss) | 8.22 |
| | 1.41 |
| | 4.74 |
|
| Total from investment operations | 8.17 |
| | 1.35 |
| | 4.70 |
|
| Distributions from: | | | | | |
| Net investment income | — |
| | — |
| | — |
|
| Net realized gain | (1.93 | ) | | — |
| | — |
|
| Total distributions | (1.93 | ) | | — |
| | — |
|
| Total increase (decrease) in net asset value | 6.24 |
| | 1.35 |
| | 4.70 |
|
| Net asset value, ending |
| $34.18 |
| |
| $27.94 |
| |
| $26.59 |
|
| | | | | | |
| Total return* | 30.00 | % | | 5.08 | % | | 21.47 | % |
Ratios to average net assets: A | | | | | |
| Net investment income (loss) | (.16 | %) | | (.20 | %) | | (.19 | %) |
| Total expenses | .88 | % | | .99 | % | | 1.12 | % |
| Expenses before offsets | .86 | % | | .86 | % | | .86 | % |
| Net expenses | .86 | % | | .86 | % | | .86 | % |
| Portfolio turnover | 63 | % | | 65 | % | | 87 | % |
| Net assets, ending (in thousands) |
| $83,181 |
| |
| $21,144 |
| |
| $7,138 |
|
| See notes to financial highlights. |
www.calvert.com CALVERT CAPITAL ACCUMULATION FUND SEMI-ANNUAL REPORT (UNAUDITED) 29
FINANCIAL HIGHLIGHTS
|
| | | | | | | | | | | |
| | | PERIODS ENDED | |
CLASS Y SHARES | MARCH 31, 2015 | | SEPTEMBER 30, 2014 (z) | | SEPTEMBER 30, 2013 (z) |
| Net asset value, beginning |
| $37.26 |
| |
| $37.04 |
| |
| $31.56 |
|
| Income from investment operations: | | | | | |
| Net investment income (loss) | *** |
| | (.07 | ) | | (.12 | ) |
| Net realized and unrealized gain (loss) | 4.94 |
| | 2.93 |
| | 7.53 |
|
| Total from investment operations | 4.94 |
| | 2.86 |
| | 7.41 |
|
| Distributions from: | | | | | |
| Net investment income | — |
| | — |
| | — |
|
| Net realized gain | (5.33 | ) | | (2.64 | ) | | (1.93 | ) |
| Total distributions | (5.33 | ) | | (2.64 | ) | | (1.93 | ) |
| Total increase (decrease) in net asset value | (.39 | ) | | .22 |
| | 5.48 |
|
| Net asset value, ending |
| $36.87 |
| |
| $37.26 |
| |
| $37.04 |
|
| | | | | | |
| Total return* | 14.78 | % | | 8.02 | % | | 24.98 | % |
Ratios to average net assets: A | | | | | |
| Net investment income (loss) | 0.00% (a) |
| | (.17 | %) | | (.36 | %) |
| Total expenses | 1.20% (a) |
| | 1.26 | % | | 1.29 | % |
| Expenses before offsets | 1.20% (a) |
| | 1.26 | % | | 1.29 | % |
| Net expenses | 1.20% (a) |
| | 1.26 | % | | 1.29 | % |
| Portfolio turnover | 42 | % | | 81 | % | | 73 | % |
| Net assets, ending (in thousands) |
| $12,108 |
| |
| $10,871 |
| |
| $14,719 |
|
| | | | | | |
|
| | | | | | | | | |
| | PERIODS ENDED | | |
CLASS Y SHARES | SEPTEMBER 30, 2012 (z) | | SEPTEMBER 30, 2011 (z) # | | |
| Net asset value, beginning |
| $26.03 |
| |
| $29.79 |
| | |
| Income from investment operations: | | | | | |
| Net investment income (loss) | (.18 | ) | | (.15 | ) | | |
| Net realized and unrealized gain (loss) | 7.64 |
| | (3.61 | ) | | |
| Total from investment operations | 7.46 |
| | (3.76 | ) | | |
| Distributions from: | | | | | |
| Net investment income | — |
| | — |
| | |
| Net realized gain | (1.93 | ) | | — |
| | |
| Total distributions | (1.93 | ) | | — |
| | |
| Total increase (decrease) in net asset value | 5.53 |
| | (3.76 | ) | | |
| Net asset value, ending |
| $31.56 |
| |
| $26.03 |
| | |
| | | | | | |
| Total return* | 29.45 | % | | (12.62 | %) | | |
Ratios to average net assets: A | | | | | |
| Net investment income (loss) | (.59 | %) | | (.74%) (a) |
| | |
| Total expenses | 1.29 | % | | 1.49% (a) |
| | |
| Expenses before offsets | 1.29 | % | | 1.44% (a) |
| | |
| Net expenses | 1.29 | % | | 1.44% (a) |
| | |
| Portfolio turnover | 63 | % | | 65%** |
| | |
| Net assets, ending (in thousands) |
| $8,071 |
| |
| $7,968 |
| | |
| See notes to financial highlights. |
30 www.calvert.com CALVERT CAPITAL ACCUMULATION FUND SEMI-ANNUAL REPORT (UNAUDITED)
|
|
A Total expenses do not reflect amounts reimbursed and/or waived by the Advisor or reductions from expense offset arrangements. Expenses before offsets reflect expenses after reimbursement and/or waiver by the Advisor but prior to reductions from expense offset arrangements. Net expenses are net of all reductions and represent the net expenses paid by the Fund. (a) Annualized. (z) Per share figures are calculated using the Average Shares Method. * Total return is not annualized for periods of less than one year and does not reflect deduction of any front-end or deferred sales charge. ** Portfolio turnover is not annualized for periods of less than one year. *** Less than $.01 per share. # From January 31, 2011 inception. See notes to financial statements. |
www.calvert.com CALVERT CAPITAL ACCUMULATION FUND SEMI-ANNUAL REPORT (UNAUDITED) 31
EXPLANATION OF FINANCIAL TABLES
SCHEDULE OF INVESTMENTS
The Schedule of Investments is a snapshot of all securities held in the fund at their market value, on the last day of the reporting period. Securities are listed by asset type (e.g., common stock, corporate bonds, U.S. government obligations) and may be further broken down into sub-groups and by industry classification.
STATEMENT OF ASSETS AND LIABILITIES
The Statement of Assets and Liabilities is often referred to as the fund’s balance sheet. It lists the value of what the fund owns, is due and owes on the last day of the reporting period. The fund’s assets include the market value of securities owned, cash, receivables for securities sold and shareholder subscriptions, and receivables for dividends and interest payments that have been earned, but not yet received. The fund’s liabilities include payables for securities purchased and shareholder redemptions, and expenses owed but not yet paid. The statement also reports the fund’s net asset value (NAV) per share on the last day of the reporting period. The NAV is calculated by dividing the fund’s net assets (assets minus liabilities) by the number of shares outstanding. This statement is accompanied by a Schedule of Investments. Alternatively, if certain conditions are met, a Statement of Net Assets may be presented in lieu of this statement and the Schedule of Investments.
STATEMENT OF NET ASSETS
The Statement of Net Assets provides a detailed list of the fund’s holdings, including each security’s market value on the last day of the reporting period. The Statement of Net Assets includes a Schedule of Investments. Other assets are added and other liabilities subtracted from the investments total to calculate the fund’s net assets. Finally, net assets are divided by the outstanding shares of the fund to arrive at its share price, or Net Asset Value (NAV) per share.
At the end of the Statement of Net Assets is a table displaying the composition of the fund’s net assets. Paid in Capital is the money invested by shareholders and represents the bulk of net assets. Undistributed Net Investment Income and Accumulated Net Realized Gains usually approximate the amounts the fund had available to distribute to shareholders as of the statement date. Accumulated Realized Losses will appear as negative balances. Unrealized Appreciation (Depreciation) is the difference between the market value of the fund’s investments and their cost, and reflects the gains (losses) that would be realized if the fund were to sell all of its investments at their statement-date -values.
STATEMENT OF OPERATIONS
The Statement of Operations summarizes the fund’s investment income earned and expenses incurred in operating the fund. Investment income includes dividends earned from stocks and interest earned from interest-bearing securities in the fund. Expenses incurred in operating the fund include the advisory fee paid to the investment advisor, administrative services fees, distribution plan expenses (if applicable), transfer agent fees, shareholder servicing expenses, custodial, legal, and audit fees, and the printing and postage expenses related to shareholder reports. Expense offsets (fees paid indirectly) may also be shown. Credits earned from offset arrangements may be used to reduce the fund’s expenses. This statement also shows net gains (losses) realized on the sale of investments and the increase or decrease in the unrealized appreciation (depreciation) on investments held during the period.
32 www.calvert.com CALVERT CAPITAL ACCUMULATION FUND SEMI-ANNUAL REPORT (UNAUDITED)
STATEMENT OF CHANGES IN NET ASSETS
The Statement of Changes in Net Assets shows how the fund’s total net assets changed during the two most recent reporting periods. Changes in the fund’s net assets are attributable to investment operations, distributions and capital share transactions.
The Operations section of the report summarizes information detailed in the Statement of Operations. The Distribution section shows the dividend and capital gain distributions made to shareholders. The amounts shown as distributions in this section may not match the net investment income and realized gains amounts shown in the Operations section because distributions are determined on a tax basis and certain investments or transactions may be treated differently for financial statement and tax purposes. The Capital Share Transactions section shows the amount shareholders invested in the fund, either by purchasing shares or by reinvesting distributions, and the amounts redeemed. The corresponding numbers of shares issued, reinvested and redeemed are shown at the end of the report.
FINANCIAL HIGHLIGHTS
The Financial Highlights table provides a per-share breakdown per class of the components that affect the fund’s net asset value for current and past reporting periods. The table provides total return, total distributions, expense ratios, portfolio turnover and net assets for the applicable period. Total return is a measure of a fund’s performance that encompasses all elements of return: dividends, capital gain distributions and changes in net asset value. Total return is the change in value of an investment over a given period, assuming reinvestment of any dividends and capital gain distributions, expressed as a percentage of the initial investment. Total distributions include distributions from net investment income and net realized gains. Long-term gains are earned on securities held in the fund more than one year. Short-term gains, on the sale of securities held less than one year, are treated as ordinary dividend income for tax purposes. The expense ratio is a fund’s cost of doing business, expressed as a percentage of net assets. These expenses directly reduce returns to shareholders. Portfolio turnover measures the trading activity in a fund’s investment portfolio—how often securities are bought and sold by a fund. Portfolio turnover is affected by market conditions, changes in the size of the fund, the nature of the fund’s investments and the investment style of the portfolio manager.
PROXY VOTING
The Proxy Voting Guidelines of the Calvert Funds that the Fund uses to determine how to vote proxies relating to portfolio securities are provided as an Appendix to the Fund’s Statement of Additional Information. The Statement of Additional Information can be obtained free of charge by calling the Fund at 1-800-368-2745, by visiting the Calvert website at www.calvert.com; or by visiting the SEC’s website at www.sec.gov.
Information regarding how the Fund voted proxies relating to portfolio securities during the most recent 12-month period ended June 30 is available on the Fund’s website at www.calvert.com and on the SEC’s website at www.sec.gov.
AVAILABILITY OF QUARTERLY PORTFOLIO HOLDINGS
The Fund files its complete schedule of portfolio holdings with the SEC for the first and third quarters of each fiscal year on Form N-Q. The Fund’s Form N-Q is available on the SEC’s website at www.sec.gov. The Fund’s Form N-Q may be reviewed and copied at the SEC’s Public Reference Room in Washington, DC; information on the operation of the Public Reference Room may be obtained by calling 1-800-SEC-0330.
www.calvert.com CALVERT CAPITAL ACCUMULATION FUND SEMI-ANNUAL REPORT (UNAUDITED) 33
BASIS FOR BOARD'S APPROVAL OF INVESTMENT ADVISORY CONTRACTS
At a meeting held on December 9, 2014, the Board of Directors, and by a separate vote, the disinterested Directors, approved the continuance of the Investment Advisory Agreement between Calvert World Values Fund, Inc. and the Advisor and the Investment Subadvisory Agreement between the Advisor and the Subadvisor with respect to the Fund.
In evaluating the Investment Advisory Agreement, the Board considered a variety of information relating to the Fund and the Advisor. The disinterested Directors reviewed a report prepared by the Advisor regarding various services provided to the Fund by the Advisor and its affiliates. Such report included, among other data, information regarding the Advisor’s personnel and the Advisor’s revenue and cost of providing services to the Fund, and a separate report prepared by an independent third party, which provided a statistical analysis comparing the Fund's investment performance, expenses, and fees to comparable mutual funds.
The disinterested Directors were separately represented by independent legal counsel with respect to their consideration of the reapproval of the Investment Advisory Agreement and the Investment Subadvisory Agreement. Prior to voting, the disinterested Directors reviewed the proposed continuance of the Investment Advisory Agreement and Investment Subadvisory Agreement with management and also met in private sessions with their counsel at which no representatives of management were present.
In the course of its deliberations regarding the Investment Advisory Agreement, the Board considered the following factors, among others: the nature, extent and quality of the services provided by the Advisor, including the personnel providing such services; the Advisor's financial condition; the level and method of computing the Fund's advisory fee; comparative performance, fee and expense information for the Fund; the profitability of the Calvert Family of Funds to the Advisor and its affiliates; the allocation of the Fund's brokerage, including the Advisor's process for monitoring "best execution"; the direct and indirect benefits, if any, derived by the Advisor and its affiliates from their relationship with the Fund; the effect of the Fund's growth and size on the Fund's performance and expenses; the affiliated distributor's process for monitoring sales load breakpoints; the Advisor's compliance programs and policies; the Advisor's performance of substantially similar duties for other funds; and any possible conflicts of interest.
In considering the nature, extent and quality of the services provided by the Advisor under the Investment Advisory Agreement, the Board reviewed information provided by the Advisor relating to its operations and personnel, including, among other information, biographical information on the Advisor's supervisory and professional staff and descriptions of its organizational and management structure. The Board also took into account similar information provided periodically throughout the previous year by the Advisor as well as the Board’s familiarity with management through Board of Directors’ meetings, discussions and other reports. The Board also noted that it reviewed on a quarterly basis information regarding the Advisor’s compliance with applicable policies and procedures, including those related to personal investing. The Advisor's administrative capabilities, including its ability to supervise the other service providers for the Fund, were also considered. The Board also took into account the environmental, social, sustainability and governance research and analysis provided by the Advisor to the Fund. The Board observed that the scope of services provided by the Advisor generally had expanded over time as a result of regulatory, market and other changes. The Board took into consideration, among other factors, the effectiveness of the Fund’s and Advisor’s processes, policies and procedures and the Advisor’s personnel. The Board also took into account, among other items, periodic reports received from the Advisor
34 www.calvert.com CALVERT CAPITAL ACCUMULATION FUND SEMI-ANNUAL REPORT (UNAUDITED)
over the past year concerning the Advisor’s ongoing review and enhancement of certain processes, policies and procedures of the Fund and the Advisor. The Board discussed the Advisor’s effectiveness in monitoring the performance of the Subadvisor and its timeliness in responding to performance issues. The Board concluded that it was satisfied with the nature, extent and quality of services provided to the Fund by the Advisor under the Investment Advisory Agreement.
In considering the Fund’s performance, the Board noted that it reviewed on a quarterly basis detailed information about the Fund’s performance results, portfolio composition and investment strategies. In addition, the Board took into account overall financial market conditions. The Board also reviewed various comparative data provided to it in connection with its consideration of the renewal of the Investment Advisory Agreement, including, among other information, a comparison of the Fund’s total return with its Lipper index and with that of other mutual funds deemed to be in its peer group by an independent third party in its report. This comparison indicated that the Fund performed below the median of its peer group for the one-year period ended June 30, 2014. For the three- and five-year periods ended June 30, 2014, the Fund performed above the median of its peer group. The data also indicated that the Fund underperformed its Lipper index for the one- and three-year periods ended June 30, 2014, and outperformed its Lipper index for the five-year period ended June 30, 2014. The Board took into account management’s discussion of the Portfolio’s performance and management’s continuing monitoring of the Fund’s performance. Based upon its review, the Board concluded that appropriate action was being taken with respect to the Fund’s performance.
In considering the Fund’s fees and expenses, the Board compared the Fund’s fees and total expense ratio with various comparative data for the funds in its peer group. Among other findings, the data indicated that the Fund’s advisory fee (after taking into account waivers and/or reimbursements) was below the median of its peer group and that total expenses (net of waivers and/or reimbursements) were above the median of its peer group. The Board noted that the allocation of advisory and administrative fees may vary among the Fund’s peer group. The Board also took into account the Advisor’s current undertaking to maintain expense limitations for the Fund. The Board noted that the Advisor was not reimbursing any Fund expenses under the expense limitation, however, the Adviser was voluntarily reimbursing the Fund’s Class B share expenses. The Board noted the Advisor’s discussion of the Fund’s expenses and certain factors that affected the level of such expenses, including the cost of providing the environmental, social, sustainability and governance research and analysis provided by the Advisor. Based upon its review, the Board determined that the advisory fee was reasonable in view of the quality of services received by the Fund from the Advisor and the other factors considered.
The Board reviewed the Advisor’s profitability on a fund-by-fund basis. In reviewing the overall profitability of the advisory fee to the Fund’s Advisor, the Board also considered the fact that affiliates of the Advisor provided shareholder servicing, administrative and distribution services to the Fund for which they received compensation. The information considered by the Board included Calvert’s operating profit margin information both before and after tax expenses with respect to the services that the Advisor and its affiliates provided to the Calvert Family of Funds complex. The Board reviewed the profitability of the Advisor’s relationship with the Fund in terms of the total amount of annual advisory fees it received with respect to the Fund and whether the Advisor had the financial wherewithal to continue to provide services to the Fund. The Board noted that the Advisor was voluntarily reimbursing a portion of the Fund’s Class B expenses. The Board also took into account the Advisor’s current undertaking to maintain expense limitations for the Fund. The Board also
www.calvert.com CALVERT CAPITAL ACCUMULATION FUND SEMI-ANNUAL REPORT (UNAUDITED) 35
considered that the Advisor derived benefits to its reputation and other indirect benefits from its relationship with the Fund. The Board also noted that the Advisor paid the subadvisory fee to the Subadvisor. Based upon its review, the Board concluded that the Advisor’s and its affiliates’ level of profitability from their relationship with the Fund was reasonable.
The Board considered the effect of the Fund's current size and its potential growth on its performance and fees. The Board concluded that adding breakpoints to the advisory fee at specified asset levels would not be appropriate at this time given the Fund's current size. The Board noted that if the Fund’s assets increased over time, the Fund might realize other economies of scale if assets increased proportionally more than certain other expenses.
In reapproving the Investment Advisory Agreement, the Board, including the disinterested Directors, did not identify any single factor as controlling, and each Director may have attributed different weight to various factors.
In evaluating the Investment Subadvisory Agreement, the disinterested Directors reviewed information provided by the Subadvisor relating to its operations, personnel, investment philosophy, strategies and techniques. Among other information, the Subadvisor provided biographical information on portfolio management and other professional staff, performance information for itself, and descriptions of its investment philosophies, strategies and techniques, organizational and management structures and brokerage policies and practices.
The Board reapproved the Investment Subadvisory Agreement between the Subadvisor and the Advisor based on a number of factors relating to the Subadvisor's ability to perform under the Investment Subadvisory Agreement. In the course of its deliberations, the Board evaluated, among other factors: the nature, extent and the quality of the services provided by the Subadvisor; the Subadvisor's management style and long-term performance record; the Fund’s performance record and the Subadvisor's performance in employing its investment strategies; the Subadvisor's current level of staffing and its overall resources; the qualifications and experience of the Subadvisor's personnel; the Subadvisor's financial condition with respect to its ability to perform the services required under the Investment Subadvisory Agreement; the Subadvisor’s risk management processes; the Subadvisor's compliance systems, including those related to personal investing; and any disciplinary history. Based upon its review, the Board concluded that it was satisfied with the nature, extent and quality of services provided to the Fund by the Subadvisor under the Investment Subadvisory Agreement.
As noted above, the Board considered, among other information, the Fund’s performance during the one-, three- and five-year periods ended June 30, 2014 as compared to the Fund’s peer group and noted that it reviewed on a quarterly basis detailed information about the Fund’s performance results, portfolio composition and investment strategies. The Board noted the Advisor’s expertise and resources in monitoring the performance, investment style and risk-adjusted performance of the Subadvisor.
In considering the cost of services provided by the Subadvisor and the profitability to the Subadvisor of its relationship with the Fund, the Board noted that the subadvisory fee under the Investment Subadvisory Agreement was paid by the Advisor out of the advisory fee that the Advisor received under the Investment Advisory Agreement. The Board also relied on the ability of the Advisor to negotiate the Investment Subadvisory Agreement and the corresponding subadvisory fee at arm’s length. In addition, the Board took into account the fees the Subadvisor charged to its other clients and considered these fee comparisons in light of the differences in managing these other accounts. Based upon its review, the Board determined that the subadvisory fee was reasonable in view of the quality of services received by the Fund from the Subadvisor and the other factors considered. Because the Advisor pays
36 www.calvert.com CALVERT CAPITAL ACCUMULATION FUND SEMI-ANNUAL REPORT (UNAUDITED)
the Subadvisor’s subadvisory fee and the subadvisory fee was negotiated at arm’s length by the Advisor, the cost of services provided by the Subadvisor and the profitability to the Subadvisor of its relationship with the Fund were not material factors in the Board’s deliberations. For similar reasons, the Board did not consider the potential economies of scale in the Subadvisor’s management of the Fund to be a material factor in its consideration.
In reapproving the Investment Subadvisory Agreement, the Board, including the disinterested Directors, did not identify any single factor as controlling, and each Director may have attributed different weight to various factors.
Conclusions
The Board reached the following conclusions regarding the Investment Advisory Agreement and the Investment Subadvisory Agreement, among others: (a) the Advisor has demonstrated that it possesses the capability and resources to perform the duties required of it under the Investment Advisory Agreement; (b) the Subadvisor is qualified to manage the Fund’s assets in accordance with the Fund’s investment objectives and policies; (c) the Advisor and Subadvisor maintain appropriate compliance programs; (d) the Subadvisor is likely to execute its investment strategies consistently over time; (e) appropriate action is being taken with respect to the Fund’s performance; and (f) the Fund's advisory and subadvisory fees are reasonable in view of the quality of services received by the Fund from the Advisor and Subadvisor, respectively, and the other factors considered. Based on its conclusions, the Board determined that reapproval of the Investment Advisory Agreement and the Investment Subadvisory Agreement would be in the best interests of the Fund and its shareholders.
www.calvert.com CALVERT CAPITAL ACCUMULATION FUND SEMI-ANNUAL REPORT (UNAUDITED) 37
To Open an Account
800-368-2748
Service for Existing Account
Shareholders: 800-368-2745
Brokers: 800-368-2746
TDD for Hearing Impaired
800-541-1524
Registered Mail
Calvert Investments
c/o BFDS,
P.O. Box 219544
Kansas City, MO 64121-9544
Overnight Mail
Calvert Investments
c/o BFDS,
330 West 9th Street
Kansas City, MO 64105
Web Site
www.calvert.com
Principal Underwriter
Calvert Investment Distributors, Inc.
4550 Montgomery Avenue
Suite 1000 North
Bethesda, Maryland 20814
|
| | | |
CALVERT CAPITAL ACCUMULATION FUND | CALVERT'S FAMILY OF FUNDS | | |
| | Municipal Funds Tax-Free Bond Fund Taxable Bond Funds Bond Portfolio Income Fund Short Duration Income Fund Long-Term Income Fund Ultra-Short Income Fund High Yield Bond Fund Green Bond Fund Unconstrained Bond Fund Balanced and Asset Allocation Funds Balanced Portfolio Conservative Allocation Fund Moderate Allocation Fund Aggressive Allocation Fund | | Equity Funds Large Cap Core Portfolio Equity Portfolio Large Cap Value Fund Social Index Fund Capital Accumulation Fund International Equity Fund Small Cap Fund Global Energy Solutions Fund Global Water Fund International Opportunities Fund Equity Income Fund Emerging Markets Equity Fund |
| | |
This report is intended to provide fund information to shareholders. It is not authorized for distribution to prospective investors unless preceded or accompanied by a prospectus.
Note: The information on our website is not incorporated by reference into this report; our website address is included as an inactive textual reference only.
Investors should carefully consider the investment objectives, risks, charges and expenses of the Calvert Funds. This and other important information is contained in the fund’s summary prospectus and prospectus, which can be obtained from your financial professional and should be read carefully before investing. You may also call Calvert at 800/368-2748 or visit www. calvert.com.
Printed on recycled paper using soy inks.
|
| | |
| | |
| | | |
| Calvert International Opportunities Fund | | |
| | | |
| | |
|
| |
Semi-Annual Report March 31, 2015
E-Delivery Sign-Up — Details Inside | |
Choose Planet-friendly E-delivery!
Sign up now for on-line statements, prospectuses, and fund reports. In less than five minutes you can help reduce paper mail and lower fund costs.
Just go to www.calvert.com. If you already have an online account at Calvert, click on Login, to access your Account, and select the documents you would like to receive via e-mail.
If you’re new to online account access, click on Login, then Register to create your user name and password. Once you’re in, click on the E-delivery sign-up on the Account Portfolio page and follow the quick, easy steps.
Note: if your shares are not held directly at Calvert but through a brokerage firm, you must contact your broker for electronic delivery options available through their firm.
|
| | | |
| TABLE OF CONTENTS |
| | | | |
| | | | President's Letter |
| | | | Portfolio Management Discussion |
| | | | Shareholder Advocacy Update |
| | | | Shareholder Expense Example |
| | | | Statement of Net Assets |
| | | | Statement of Operations |
| | | | Statements of Changes in Net Assets |
| | | | Notes to Financial Statements |
| | | | Financial Highlights |
| | | | Explanation of Financial Tables |
| | | | Proxy Voting |
| | | | Availability of Quarterly Portfolio Holdings |
| | | | Basis for Board’s Approval of Investment Advisory Contracts |
|
| |
| John Streur President and Chief Executive Officer, Calvert Investments, Inc. |
Dear Calvert Shareowner,
The United States economy improved throughout 2014 and into the first quarter of 2015, while major economies in other regions of the world struggled to regain momentum or saw slowing growth. It is still too early to declare victory, but one may say that while the United States led the world into financial crisis nearly eight years ago, the innovative and aggressive responses to the crisis by our policymakers are allowing the United States to recover more quickly. Granted, the United States has the benefit of possessing the world’s reserve currency and our monetary maneuvers in our self-interest are not without cost to economies in other regions.
As 2014 drew to a close, the United States was winding down the quantitative easing portion of its post-crisis monetary policy while the European and Japanese central banks were finding it necessary to increase their own forms of quantitative easing in efforts to support asset prices and spur economic growth.
The impact of modestly improving economic activity in the U.S. and ongoing low global interest rates on financial assets in 2014 created positive returns for most stocks and bonds for the previous 12 months, a condition that gave benefit to most Calvert Funds. The exceptions are assets tied to the price of oil, which collapsed during the second half of the year. Energy industries and natural resource based companies, including renewable energy companies and water related companies, saw their stock valuations drop in reaction.
Across our fixed income and equity strategies, Calvert finds more utility in conducting fundamental research in order to find relative values in securities of individual companies than we do in attempting to anticipate or time changes in global economic indicators. Broadly, we are mindful of the fact that stocks and bonds have benefitted substantially from the easy monetary policies and ultra-low interest rates of the post-crisis era. We believe markets are more or less fairly valued and we have taken steps seeking to moderate the risk across our portfolios.
As I take the helm at Calvert and look back at the 39 years since the firm’s founding in 1976, I note the substantial growth in the world’s population, the massive increase in the industrialization of our global society, and the associated change in the role of corporations in societal and environmental outcomes for our future.
4 www.calvert.com CALVERT INTERNATIONAL OPPORTUNITIES FUND SEMI-ANNUAL REPORT (UNAUDITED)
Public companies have created tremendous net benefits to society through advances in health care, food systems, energy efficiency, communications and technology, and access to finance and other products and services too vast to detail. Hundreds of millions of people throughout the world have seen their standard of living increased through benefits created by corporate activity.
Along with the obvious net benefits to society, we are aware of the substantial stresses placed upon society and the environment from corporate behaviors. At the same time, society has awarded corporations an increasingly prominent role in the day-to-day outcomes of our lives and in the societal and environmental outcomes that will determine the future direction of the world.
Calvert, as a global investment management firm and a steward of client assets, has a growing and evolving role as a leader in responsible investing. Calvert has a rich history as a socially responsible investor and has made many contributions to public policy and corporate governance. Today we are bringing Calvert’s deep expertise in socially responsible investing, public and private policy work, and investment management to a new level with a focus on developing principles and setting standards for use in our investment management processes, our active ownership and engagement discipline and within our investment risk management processes.
As a long-term investor with unique insights into environmental, social, and governance activities of companies throughout the world, Calvert is able to develop a holistic view of companies’ operations. Our ability to use our insights for the benefit of the stewardship of client assets, both to produce desirable investment outcomes for our clients and to assist companies in evolving their role in society along a responsible path has never been more important.
As fellow shareowners of Calvert Funds, you and I know that it is essential to pursue the type of enduring value that Calvert seeks to create, through excellence in financial results balanced with the evolving needs of society and the environment.
Thank you for your share ownership in Calvert Funds; all of us at Calvert Investments, Inc. appreciate the confidence and trust you have placed in us.
John Streur
April 2015
www.calvert.com CALVERT INTERNATIONAL OPPORTUNITIES FUND SEMI-ANNUAL REPORT (UNAUDITED) 5
|
| |
| PORTFOLIO MANAGEMENT DISCUSSION |
|
| |
| Natalie A. Trunow Senior Vice President and Chief Investment Officer, Equities |
Equity market returns over the six-month reporting period largely reflected macroeconomic trends, with solid gains for U.S. stocks relative to international equity markets. Improving economic conditions in the United States remained in stark contrast to the sluggish growth outlook in much of the rest of the world, particularly in Europe. However, U.S. equity markets faced several headwinds at the start of 2015 as another harsh winter weighed on economic activity and the stronger dollar contributed to negative earnings revisions for companies deriving larger portions of their earnings from overseas. International equity markets underperformed for the period, but recouped some of their losses in the first quarter of 2015 as central banks in Europe and Japan maintained quantitative-easing programs and emerging markets were buoyed by stimulus announcements from China.
For the six-month period ended March 31, 2015, the Standard and Poor’s (S&P) 500, Russell 1000, Russell 2000, MSCI EAFE, and MSCI Emerging Markets Indices returned 5.93%, 6.55%, 14.46%, 1.29%, and -2.26%, respectively.
From an investment-style perspective, growth stocks outperformed value stocks, and domestic small-cap stocks, which have less exposure to foreign markets and are less dependent on global growth, outperformed their large-cap counterparts. Looking at sector performance, Health Care, Consumer Discretionary, and Consumer Staples were the top-performing sectors within the Russell 1000 Index during the period, while the Energy, Telecommunication Services, and Materials sectors lagged.
U.S. Economic Recovery Hits Soft Patch, but Outpaces Rest of Developed World
The U.S. economy continued to outperform other developed countries, with U.S. gross domestic product (GDP) growing at a 2.2% annualized rate in the fourth quarter of 2014. More recent U.S. macroeconomic data has been weaker, however, with the slowdown largely attributed to poor weather and the strength of the dollar. A labor dispute between West Coast ports and dockworkers also resulted in a modest drag on economic activity. The U.S. ISM Manufacturing Purchasing Manufacturers Index (PMI)1 ended the period at 51.5, firmly in expansion territory, but has declined for five consecutive months. Housing activity, while remaining on an upward trend, has been disappointing of late.
Although the most recent jobs report for March was less than stellar, the job market has continued to improve, adding an average of 260,000 jobs per month over the last year. This helped push the unemployment rate down to 5.5% from 6.6% this time a year ago, though this has been aided by a drop in the labor-force participation rate. Wage growth is taking longer to materialize than in past recoveries, but recent data has been encouraging, showing modest gains in average hourly earnings and the Employment Cost Index.
6 www.calvert.com CALVERT INTERNATIONAL OPPORTUNITIES FUND SEMI-ANNUAL REPORT (UNAUDITED)
|
| | | | |
| | | | |
| | CALVERT INTERNATIONAL OPPORTUNITIES FUND |
| | MARCH 31, 2015 | |
| | | | |
| | ECONOMIC SECTORS | % OF TOTAL INVESTMENTS | |
| | Consumer Discretionary | 22.9 | % | |
| | Consumer Staples | 7.2 | % | |
| | Energy | 1.7 | % | |
| | Financials | 31.4 | % | |
| | Health Care | 1.3 | % | |
| | Industrials | 13.8 | % | |
| | Information Technology | 9.7 | % | |
| | Materials | 7.5 | % | |
| | Short-Term Investments | 3.7 | % | |
| | Telecommunication Services | 0.8 | % | |
| | Total | 100 | % | |
| | | | |
Consumer confidence reached a nine-year high during the reporting period, due in part to lower gasoline prices, which should lead to a pick-up in consumer spending and housing activity over the remainder of the year.
Decline in Oil Prices a Positive for U.S. Economy Overall
The price of crude oil fell nearly 50% over the six-month reporting period. Weakening demand due to slowing global growth and a strategic decision by Saudi Arabia, the world’s largest oil producer, to not cut oil production in the face of increased U.S. supplies, were key drivers of the dramatic price decline.
Some economies and sectors stand to benefit from the significant price decline in oil while others will undoubtedly continue to come under pressure. Countries which import a large portion of their energy are the clear winners, with the United States, Europe, Japan, and China benefiting. Within the U.S., states such as North Dakota and Texas will be hurt by lower oil prices; however energy capital expenditure (CapEx) represents less than 2% of GDP and we believe the overall impact of lower
|
| | | | | | |
| | | | | |
| | CALVERT INTERNATIONAL OPPORTUNITIES FUND | |
| | MARCH 31, 2015 | |
| | | | | |
| | INVESTMENT PERFORMANCE | |
| | (TOTAL RETURN AT NAV*) | |
| | | 6 MONTHS ENDED 3/31/15 | 12 MONTHS ENDED 3/31/15
| |
| | Class A | 2.18 | % | -1.77 | % | |
| | Class C | 1.76 | % | -2.66 | % | |
| | Class I | 2.42 | % | -1.35 | % | |
| | Class Y | 2.33 | % | -1.50 | % | |
| | | | | |
| | MSCI EAFE Small/Mid Cap Index | 4.37 | % | -0.32 | % | |
| | | | | |
| | Lipper International Small/Mid Cap Core Funds Average | 1.16 | % | -4.06 | % | |
| | | | | |
| | TEN LARGEST STOCK HOLDINGS | % OF NET ASSETS | |
| | Smurfit Kappa Group plc | 2.2 | % | |
| | BUWOG AG | 1.9 | % | |
| | Aozora Bank Ltd. | 1.9 | % | |
| | Zumtobel Group AG | 1.4 | % | |
| | Delta Lloyd NV | 1.3 | % | |
| | Industrivarden AB | 1.3 | % | |
| | GAM Holding AG | 1.2 | % | |
| | Cie Generale des Etablissements Michelin | 1.2 | % | |
| | Grand City Properties SA | 1.2 | % | |
| | Makita Corp. | 1.2 | % | |
| | Total | 14.8 | % | |
| | | |
| | * Investment performance/return at NAV does not reflect the deduction of the Fund’s maximum 4.75% front-end sales charge or any deferred sales charge. | |
| | | | | |
energy prices is positive for the U.S. economy as a whole due to the significant cost savings its creates in a majority of sectors and the multiplier effect it has throughout the economy.
www.calvert.com CALVERT INTERNATIONAL OPPORTUNITIES FUND SEMI-ANNUAL REPORT (UNAUDITED) 7
Global Easing Continues Amid Low Inflation and Stronger Dollar
The U.S. dollar strengthened throughout the period, hitting a 7-year high vs. the Japanese Yen and a 12-year high against the euro. Since most commodities are priced globally in U.S. dollars, a stronger dollar relative to foreign currencies typically correlates with lower commodity prices, which has kept a lid on inflation.
More than half the central banks in the G20 economies implemented some type of monetary easing policy during the period, which provided additional support for global equities. Most notably, the Bank of Japan announced a massive stimulus policy and the European Central Bank (ECB) followed with a strong quantitative easing (QE) program of its own.
Interest Rate Hikes by the Fed on the Horizon
With the U.S. economy improving, both market sentiment and Federal Reserve officials seem divided on the optimal timing of the Fed’s interest-rate increases. However, consistently low inflation and recent softness in U.S. macroeconomic data—as well as the rapid increase in the dollar’s strength, which has hurt U.S. exports and the manufacturing sector—makes it more likely that the Fed will delay raising rates until later in the year or possibly even next year.
Eurozone Economic Struggles Continue but QE Offers Some Respite
Economic conditions continued to deteriorate in the eurozone through the end of 2014 as inflation turned negative, prompting the ECB to launch its massive QE program. The program has been successful thus far in decreasing the value of the euro in an attempt to stimulate exports and eurozone economies. Manufacturing PMIs, credit demand, and consumer confidence all have been showing signs of modest improvement, indicating a potential positive effect from QE as well as a potential bottoming out of eurozone economic malaise. Despite these marginally positive developments, we are skeptical that
|
| | | | |
| | | | |
| | CALVERT INTERNATIONAL OPPORTUNITIES FUND | |
| | MARCH 31, 2015 | |
| | | | |
| | AVERAGE ANNUAL TOTAL RETURNS | |
| | | | |
| | CLASS A SHARES | (WITH MAX. LOAD) | |
| | One year | -6.42 | % | |
| | Five year | 6.63 | % | |
| | Since inception (5/31/2007) | 1.36 | % | |
| | | | |
| | CLASS C SHARES* | (WITH MAX. LOAD) | |
| | One year | -3.63 | % | |
| | Five year | 6.75 | % | |
| | Since inception (7/31/2007) | 1.16 | % | |
| | | | |
| | CLASS I SHARES | | |
| | One year | -1.35 | % | |
| | Five year | 8.15 | % | |
| | Since inception (5/31/2007) | 2.45 | % | |
| | | | |
| | CLASS Y SHARES* | | |
| | One year | -1.50 | % | |
| | Five year | 7.92 | % | |
| | Since inception (5/31/2007) | 2.18 | % | |
| | | | |
| | * Calvert International Opportunities Fund first offered Class C shares on July 31, 2007 and Class Y shares on October 31, 2008. Performance prior to those dates reflects the performance of Class A shares at net asset value (NAV). Actual Class C and Class Y share performance would have been different. | |
| | | | |
central bankers’ efforts will meaningfully reinvigorate those economies unless accompanied by structural economic reforms. Possible risks from Greece exiting the eurozone and political turmoil emerging in other euro-area countries also remain a lingering concern and may re-surface later in the year.
Stimulus Measures Boost Chinese Stocks but Economic Challenges Remain
Despite Manufacturing PMI weakening throughout the period, Chinese equities rallied on the back of several stimulus measures and investor expectations that the government would continue stimulus
8 www.calvert.com CALVERT INTERNATIONAL OPPORTUNITIES FUND SEMI-ANNUAL REPORT (UNAUDITED)
Growth of $10,000
The graph below shows the value of a hypothetical $10,000 investment in the Fund over the past 10 fiscal year periods or since inception (for funds without 10-year records). The results shown are for Class A and I shares and reflect the deduction of the maximum front-end Class A sales charge of 4.75%, and assume the reinvestment of dividends. The result is compared with benchmarks that include a broad based market index and a Lipper peer group average. Market indexes are unmanaged and their results do not reflect the effect of expenses or sales charges. The Lipper average reflects the deduction of the category’s average front-end sales charge. The value of an investment in a different share class would be different.
All performance data shown, including the graph above and the adjacent table, represents past performance, does not guarantee future results, assumes reinvestment of dividends and distributions and does not reflect the deduction of taxes that a shareholder would pay on the Fund’s distributions or the redemption of the Fund shares. All performance data reflects fee waivers and/or expense limitations, if any are in effect; in their absence performance would be lower. See Note B in Notes to Financial Statements. The investment return and principal value of an investment will fluctuate so that an investor’s shares, when redeemed, may be worth more or less than their original cost. Current performance may be lower or higher than the performance data quoted; for current performance data visit www.calvert.com. The gross expense ratio from the current prospectus for Class A shares is 1.85%. This number may differ from the expense ratio shown elsewhere in this report because it is based on a different time period and, if applicable, does not include fee or expense waivers. Performance data quoted already reflects the deduction of the Fund’s operating expenses.
www.calvert.com CALVERT INTERNATIONAL OPPORTUNITIES FUND SEMI-ANNUAL REPORT (UNAUDITED) 9
measures to offset slowing, though still robust, economic growth. China is also benefiting from cheaper oil, which essentially acts as another form of stimulus. The Services PMI held up better than expected, indicating some very modest progress in transitioning away from an investment-driven economy to a more consumer-oriented one. However, structural improvements in social welfare programs, such as health care and retirement planning, will be needed in order to encourage Chinese consumers to spend more and bring down their notoriously high savings rate. Given these challenges, as well as ongoing concerns regarding a potential property-bubble burst, stimulus does not mean the Chinese economy is out of the woods. A hard economic landing remains a possibility down the road.
Outlook
While we may see some continued softness in U.S. macroeconomic data during the first half of the year, we believe U.S. economic growth will continue to exceed growth from other developed countries and we remain positive on the U.S. economy longer-term. We believe the significant positive multiplier effect from lower gas prices hasn’t yet been fully reflected in U.S. economic data, and we are likely to see the additional positive impact in the coming quarters.
In our view, U.S. stocks can still post decent performance, but probably not as good as what we saw in the past couple of years because of higher valuations, slower earnings growth, and potentially having reached peak margins. The stronger dollar, combined with lower commodity prices, tends to benefit consumers and hurt industrial companies, especially those with heavy sales outside the United States, or those directly involved in the energy sector. This is one reason why we continue to favor small-cap stocks on the domestic front.
With lower commodity prices, a stronger dollar, and little wage growth, inflation in the United States will likely remain low for some time to come, while deflationary threats are very real in other parts of the world. This may lead the Federal Reserve to raise interest rates less quickly than currently expected, since challenging global economic conditions can have a significant impact on the U.S. economy. Our position remains that when the Fed does decide to raise rates, the tightening process will be slow and gradual, with the Fed keeping a close eye on interest-rate volatility and its impact on mortgage rates. Even with a gradual tightening, monetary policy should still remain accommodative for an extended period of time. That said, we expect market volatility to increase as we grow closer to the inevitability of higher interest rates.
Calvert Investment Management, Inc.
April 2015
1. The Institute for Supply Management (ISM) Manufacturing PMI is published monthly and shows business conditions in the U.S. manufacturing sector, and is considered a significant indicator of overall economic conditions. The ISM index includes prices paid for all purchases including import purchases and purchases of food and energy, excluding crude oil. A result above 50 indicates that the manufacturing economy is generally expanding; below 50 indicates that it is generally declining.
10 www.calvert.com CALVERT INTERNATIONAL OPPORTUNITIES FUND SEMI-ANNUAL REPORT (UNAUDITED)
SHAREHOLDER ADVOCACY UPDATE
2014 Corporate Diversity Report Findings Released
In March, Calvert published its 2014 survey findings on the corporate diversity practices of the largely multinational companies that make up the Standard & Poor’s 100 Index (S&P 100), in follow-up to reports published in 2012 and 2010. Calvert believes companies that fully commit to providing a fair and equitable working environment will recognize gains in both the workplace and marketplace.
Key findings from the 2014 survey include:
| |
| • | Milestone for women in the board room. In 2014, every company in the S&P 100 had at least one woman on its board of directors. In addition, there was a 17% increase in companies with three or more women and/or minorities on their boards. |
| |
| • | Diversity commitment on the rise. In the past two years, top scores related to overall corporate commitment have increased by 45%.This stems primarily from greater board oversight of diversity initiatives and increased CEO and/or chair involvement. |
| |
| • | LGBT policies have advanced overall. However, initiatives for persons with disabilities continue to fall behind other groups. |
Overall, in 2014, we saw growing commitment to women and minority employees, momentum around family-friendly work environments, and accelerated progress in support of LGBT employees. Looking ahead, we hope to see enhanced corporate diversity commitments, greater representation of women and minorities on boards, improved EEO1-disclosure, and expanded diversity initiatives for persons with disabilities.
To learn the highest- and lowest-rated companies in the report, A Survey of Corporate Diversity Practices of the S&P 100, and to find out more about the report’s methodology and findings, visit www.calvert.com.
2015 Shareholder Resolutions
Building on our initiatives from 2014, Calvert was the lead filer on 38 shareholder resolutions for the 2015 proxy season, and co-filer on another 18 proposals. Key topics include “big data” and civil rights issues, sustainability reporting, board of director oversight of environmental and social matters, water risk, climate change and greenhouse gas emissions reductions, supply chain labor issues, and board diversity.
Specifically, Calvert asked 14 companies to set a goal and a timeline for reducing their greenhouse gas emissions and filed seven proposals asking companies to issue a sustainability report describing their environmental, social and governance (ESG) performance and goals. To push for improved boardroom diversity, Calvert filed six proposals with companies requesting they report on their plans to increase minority and women Board representation and assess the effectiveness of these efforts. We also filed seven proposals requesting that companies assess and manage the civil rights’ risks related to their use of big data, which refers to data sets so large or complex that traditional data processing applications are inadequate. We also filed proposals on water risk in the agricultural supply chain and on developing a sustainable agriculture policy.
To keep abreast of the outcomes of these 2015 shareholder resolutions, as well as Calvert’s proxy voting and public policy initiatives, visit the “Resources” section on www.calvert.com.
www.calvert.com CALVERT INTERNATIONAL OPPORTUNITIES FUND SEMI-ANNUAL REPORT (UNAUDITED) 11
SHAREHOLDER EXPENSE EXAMPLE
As a shareholder of the Fund, you incur two types of costs: (1) transaction costs, including sales charges (loads) and redemption fees; and (2) ongoing costs, including management fees; distribution (12b-1) fees; and other Fund expenses. This Example is intended to help you understand your ongoing costs (in dollars) of investing in the Fund and to compare these costs with the ongoing costs of investing in other mutual funds.
This Example is based on an investment of $1,000 invested at the beginning of the period and held for the entire period (October 1, 2014 to March 31, 2015).
Actual Expenses
The first line of the table below provides information about actual account values and actual expenses. You may use the information in this line, together with the amount you invested, to estimate the expenses that you paid over the period. Simply divide your account value by $1,000 (for example, an $8,600 account value divided by $1,000 = 8.6), then multiply the result by the number in the first line under the heading entitled “Expenses Paid During Period” to estimate the expenses you paid on your account during this period.
Hypothetical Example for Comparison Purposes
The second line of the table below provides information about hypothetical account values and hypothetical expenses based on the Fund’s actual expense ratio and an assumed rate of return of 5% per year before expenses, which is not the Fund’s actual return. The hypothetical account values and expenses may not be used to estimate the actual ending account balance or expenses you paid for the period. You may use this information to compare the ongoing costs of investing in the Fund and other funds. To do so, compare the 5% hypothetical example with the 5% hypothetical examples that appear in the shareholder reports of the other funds.
Please note that the expenses shown in the table are meant to highlight your ongoing costs only and do not reflect any transactional costs, such as sales charges (loads), or redemption fees. Therefore, the second line of the table is useful in comparing ongoing costs only, and will not help you determine the relative total costs of owning different funds. In addition, if these transactional costs were included, your costs would have been higher.
12 www.calvert.com CALVERT INTERNATIONAL OPPORTUNITIES FUND SEMI-ANNUAL REPORT (UNAUDITED)
|
| | | |
| | BEGINNING ACCOUNT VALUE 10/1/14 | ENDING ACCOUNT VALUE 3/31/15 | EXPENSES PAID DURING PERIOD* 10/1/14 - 3/31/15 |
CLASS A | | | |
| Actual | $1,000.00 | $1,021.82 | $8.37 |
| Hypothetical | $1,000.00 | $1,016.65 | $8.35 |
| (5% return per year before expenses) | | | |
| | | | |
CLASS C | | | |
| Actual | $1,000.00 | $1,017.58 | $12.58 |
| Hypothetical | $1,000.00 | $1,012.47 | $12.54 |
| (5% return per year before expenses) | | | |
| | | | |
CLASS I | | | |
| Actual | $1,000.00 | $1,024.24 | $5.77 |
| Hypothetical | $1,000.00 | $1,019.23 | $5.76 |
| (5% return per year before expenses) | | | |
| | | | |
CLASS Y | | | |
| Actual | $1,000.00 | $1,023.31 | $6.89 |
| Hypothetical | $1,000.00 | $1,018.12 | $6.87 |
| (5% return per year before expenses) | | | |
| | | | |
* Expenses are equal to the Fund’s annualized expense ratio of 1.66%, 2.50%, 1.14%, and 1.37% for Class A, Class C, Class I, and Class Y, respectively, multiplied by the average account value over the period, multiplied by 182/365 (to reflect the one-half year period).
|
www.calvert.com CALVERT INTERNATIONAL OPPORTUNITIES FUND SEMI-ANNUAL REPORT (UNAUDITED) 13
STATEMENT OF NET ASSETS
MARCH 31, 2015
|
| | | |
EQUITY SECURITIES - 95.7% | SHARES | VALUE |
| | | |
| Australia - 1.7% | | |
| GrainCorp Ltd. | 211,630 |
| $1,514,474 |
| Orora Ltd. | 773,996 |
| 1,335,560 |
| | | 2,850,034 |
| | | |
| Austria - 6.1% | | |
| BUWOG AG* | 155,108 |
| 3,183,231 |
| IMMOFINANZ AG* | 446,833 |
| 1,311,944 |
| Vienna Insurance Group AG Wiener Versicherung Gruppe | 37,355 |
| 1,652,821 |
| Wienerberger AG | 104,418 |
| 1,667,213 |
| Zumtobel Group AG | 91,317 |
| 2,263,360 |
| | | 10,078,569 |
| | | |
| Bahrain - 0.5% | | |
| Banco ABC Brasil SA: | | |
| Common* | 2,668 |
| 9,467 |
| Preferred | 223,389 |
| 806,661 |
| | | 816,128 |
| | | |
| Brazil - 1.3% | | |
| Localiza Rent a Car SA | 21,836 |
| 248,892 |
| MRV Engenharia e Participacoes SA | 554,270 |
| 1,397,553 |
| Qualicorp SA* | 61,056 |
| 437,114 |
| | | 2,083,559 |
| | | |
| Denmark - 0.7% | | |
| D/S Norden A/S | 57,103 |
| 1,218,231 |
| | | |
| Finland - 0.6% | | |
| Ramirent Oyj | 144,639 |
| 1,026,702 |
| | | |
| France - 4.7% | | |
| Cie Generale des Etablissements Michelin | 20,329 |
| 2,022,222 |
| Saft Groupe SA | 36,492 |
| 1,341,766 |
| UBISOFT Entertainment* | 102,444 |
| 1,892,483 |
| Vallourec SA | 37,425 |
| 913,562 |
| Wendel SA | 13,557 |
| 1,614,615 |
| | | 7,784,648 |
| | | |
| Germany - 5.7% | | |
| Aareal Bank AG | 43,722 |
| 1,845,541 |
| Aurelius AG | 28,497 |
| 1,193,920 |
| DMG MORI SEIKI AG | 48,641 |
| 1,598,889 |
| Hugo Boss AG | 11,728 |
| 1,426,763 |
| Talanx AG | 56,780 |
| 1,781,218 |
| Tom Tailor Holding AG* | 120,669 |
| 1,520,293 |
| | | 9,366,624 |
| | | |
14 www.calvert.com CALVERT INTERNATIONAL OPPORTUNITIES FUND SEMI-ANNUAL REPORT (UNAUDITED)
|
| | | |
EQUITY SECURITIES - CONT’D | SHARES | VALUE |
| | | |
| Hong Kong - 1.2% | | |
| PAX Global Technology Ltd.* | 660,058 |
| $689,444 |
| Techtronic Industries Co. Ltd. | 366,420 |
| 1,238,673 |
| | | 1,928,117 |
| | | |
| India - 0.4% | | |
| Yes Bank Ltd. | 49,527 |
| 641,699 |
| | | |
| Ireland - 2.2% | | |
| Smurfit Kappa Group plc | 126,190 |
| 3,537,816 |
| | | |
| Italy - 2.8% | | |
| Banca Generali SpA | 60,764 |
| 1,901,104 |
| Buzzi Unicem SpA | 85,048 |
| 1,272,765 |
| Piaggio & C SpA* | 482,706 |
| 1,470,822 |
| | | 4,644,691 |
| | | |
| Japan - 27.3% | | |
| Aozora Bank Ltd. | 860,123 |
| 3,053,353 |
| Azbil Corp. | 61,900 |
| 1,680,235 |
| Chugoku Marine Paints Ltd. | 112,000 |
| 1,013,651 |
| COOKPAD, Inc. | 40,471 |
| 1,853,454 |
| CyberAgent, Inc. | 31,069 |
| 1,781,901 |
| Daiichikosho Co. Ltd. | 49,968 |
| 1,553,032 |
| Daiseki Co. Ltd. | 53,200 |
| 960,768 |
| Gulliver International Co. Ltd. | 198,684 |
| 1,639,064 |
| Haseko Corp. | 149,359 |
| 1,457,098 |
| Hogy Medical Co. Ltd. | 24,000 |
| 1,179,383 |
| Horiba Ltd. | 37,800 |
| 1,441,494 |
| Ibiden Co. Ltd. | 83,800 |
| 1,415,244 |
| Leopalace21 Corp.* | 275,195 |
| 1,441,350 |
| Makita Corp. | 38,166 |
| 1,982,080 |
| Monex Group, Inc. | 642,609 |
| 1,711,459 |
| MS&AD Insurance Group Holdings, Inc. | 38,200 |
| 1,071,598 |
| Nabtesco Corp. | 44,319 |
| 1,284,043 |
| Nishi-Nippon City Bank Ltd. | 383,000 |
| 1,112,517 |
| Ryosan Co. Ltd. | 54,200 |
| 1,332,727 |
| Secom Co. Ltd. | 17,400 |
| 1,162,512 |
| Ship Healthcare Holdings, Inc. | 21,347 |
| 487,300 |
| SKY Perfect JSAT Holdings, Inc. | 307,500 |
| 1,910,372 |
| Stanley Electric Co. Ltd. | 83,145 |
| 1,879,921 |
| Star Micronics Co. Ltd. | 111,200 |
| 1,559,905 |
| Tadano Ltd. | 141,854 |
| 1,909,358 |
| The Bank of Yokohama Ltd. | 198,300 |
| 1,159,229 |
| Toyota Industries Corp. | 29,800 |
| 1,707,398 |
| Unipres Corp. | 68,800 |
| 1,403,694 |
| Yamaha Corp. | 90,300 |
| 1,582,064 |
| Yokohama Rubber Co. Ltd. | 130,911 |
| 1,351,383 |
| | | 45,077,587 |
| | | |
| Luxembourg - 1.2% | | |
| Grand City Properties SA* | 108,970 |
| 2,020,860 |
| | | |
www.calvert.com CALVERT INTERNATIONAL OPPORTUNITIES FUND SEMI-ANNUAL REPORT (UNAUDITED) 15
|
| | | |
EQUITY SECURITIES - CONT’D | SHARES | VALUE |
| | | |
| Malaysia - 1.1% | | |
| PureCircle Ltd.* | 244,660 |
| $1,879,989 |
| | | |
| Netherlands - 3.4% | | |
| BinckBank NV | 182,226 |
| 1,478,287 |
| Delta Lloyd NV | 114,040 |
| 2,142,227 |
| Koninklijke DSM NV | 34,132 |
| 1,905,247 |
| | | 5,525,761 |
| | | |
| Norway - 3.8% | | |
| Austevoll Seafood ASA | 315,033 |
| 1,681,947 |
| Borregaard ASA | 213,788 |
| 1,578,430 |
| Opera Software ASA | 214,973 |
| 1,726,473 |
| Petroleum Geo-Services ASA | 255,169 |
| 1,310,347 |
| | | 6,297,197 |
| | | |
| Poland - 0.7% | | |
| Eurocash SA | 126,143 |
| 1,088,135 |
| | | |
| Russia - 0.2% | | |
| Lenta Ltd. (GDR)* | 42,574 |
| 329,935 |
| | | |
| South Korea - 3.6% | | |
| DGB Financial Group, Inc. | 151,088 |
| 1,646,879 |
| Dongbu Insurance Co. Ltd. | 13,884 |
| 618,784 |
| Grand Korea Leisure Co. Ltd. | 21,787 |
| 742,100 |
| Samsung SDI Co. Ltd. | 12,017 |
| 1,473,213 |
| SL Corp. | 88,424 |
| 1,489,467 |
| | | 5,970,443 |
| | | |
| Spain - 1.1% | | |
| Ebro Foods SA | 93,700 |
| 1,743,123 |
| | | |
| Sweden - 3.1% | | |
| BillerudKorsnas AB | 98,208 |
| 1,582,805 |
| Industrivarden AB, C Shares | 110,541 |
| 2,073,950 |
| Opus Group AB: | | |
| Common | 1,396,433 |
| 1,431,891 |
| Rights (b)* | 1,396,433 |
| 60,224 |
| | | 5,148,870 |
| | | |
| Switzerland - 2.4% | | |
| Baloise Holding AG | 14,150 |
| 1,870,501 |
| GAM Holding AG* | 98,222 |
| 2,037,095 |
| | | 3,907,596 |
| | | |
| Taiwan - 0.9% | | |
| China Life Insurance Co. Ltd. | 1,679,145 |
| 1,459,548 |
| | | |
| United Kingdom - 17.1% | | |
| Ashtead Group plc | 112,439 |
| 1,807,563 |
| Bank of Georgia Holdings plc | 49,102 |
| 1,265,012 |
| Beazley plc | 306,195 |
| 1,303,065 |
16 www.calvert.com CALVERT INTERNATIONAL OPPORTUNITIES FUND SEMI-ANNUAL REPORT (UNAUDITED)
|
| | | |
EQUITY SECURITIES - CONT’D | SHARES | VALUE |
| | | |
| United Kingdom - Cont’d | | |
| Bovis Homes Group plc | 116,234 |
| $1,608,691 |
| Britvic plc | 157,074 |
| 1,703,291 |
| Catlin Group Ltd. | 160,955 |
| 1,695,525 |
| Close Brothers Group plc | 79,010 |
| 1,826,774 |
| Dialight plc | 102,975 |
| 1,157,689 |
| Entertainment One Ltd. | 400,136 |
| 1,794,906 |
| Halfords Group plc | 221,323 |
| 1,514,090 |
| Inmarsat plc | 95,375 |
| 1,309,712 |
| Investec plc | 182,841 |
| 1,516,515 |
| Kennedy Wilson Europe Real Estate plc | 73,038 |
| 1,191,415 |
| Kingfisher plc | 335,706 |
| 1,896,230 |
| N Brown Group plc | 295,602 |
| 1,388,447 |
| Provident Financial plc | 47,069 |
| 1,879,850 |
| Speedy Hire plc | 1,465,476 |
| 1,555,138 |
| William Morrison Supermarkets plc | 639,146 |
| 1,828,702 |
| | | 28,242,615 |
| | | |
| United States - 0.9% | | |
| Tsakos Energy Navigation Ltd. | 184,361 |
| 1,508,073 |
| | | |
| Virgin Islands, British - 1.0% | | |
| China Lesso Group Holdings Ltd. | 2,833,550 |
| 1,677,776 |
| | | |
| Total Equity Securities (Cost $148,361,569) | | 157,854,326 |
| | | |
TIME DEPOSIT - 3.7% | PRINCIPAL AMOUNT | |
| State Street Bank Time Deposit, 0.088%, 4/1/15 | $6,043,511 |
| 6,043,511 |
| | | |
| Total Time Deposit (Cost $6,043,511) | | 6,043,511 |
| | | |
| | | |
| TOTAL INVESTMENTS (Cost $154,405,080) - 99.4% | | 163,897,837 |
| Other assets and liabilities, net - 0.6% | | 1,028,625 |
NET ASSETS - 100% | | $164,926,462 |
| | | |
| See notes to financial statements. |
www.calvert.com CALVERT INTERNATIONAL OPPORTUNITIES FUND SEMI-ANNUAL REPORT (UNAUDITED) 17
|
| | | |
NET ASSETS CONSIST OF: | |
| Paid-in capital applicable to the following shares of common stock with 250,000,000 shares of $.01 par value shares authorized: | |
| Class A: 6,407,748 shares outstanding |
| $93,732,791 |
|
| Class C: 319,662 shares outstanding | 4,381,197 |
|
| Class I: 2,533,995 shares outstanding | 35,677,767 |
|
| Class Y: 1,436,033 shares outstanding | 21,375,671 |
|
| Undistributed net investment income (loss) | (144,704 | ) |
| Accumulated net realized gain (loss) on investments and foreign currency transactions | 437,748 |
|
| Net unrealized appreciation (depreciation) on investments, foreign currencies and assets and liabilities denominated in foreign currencies | 9,465,992 |
|
| | |
NET ASSETS |
| $164,926,462 |
|
| | |
NET ASSET VALUE PER SHARE | |
| Class A (based on net assets of $99,763,656) |
| $15.57 |
|
| Class C (based on net assets of $4,894,559) |
| $15.31 |
|
| Class I (based on net assets of $38,829,729) |
| $15.32 |
|
| Class Y (based on net assets of $21,438,518) |
| $14.93 |
|
| | |
(b) This security was valued under the direction of the Board of Directors. See Note A. * Non-income producing security. Abbreviations: GDR: Global Depositary Receipts plc: Public Limited Company See notes to financial statements. |
18 www.calvert.com CALVERT INTERNATIONAL OPPORTUNITIES FUND SEMI-ANNUAL REPORT (UNAUDITED)
STATEMENT OF OPERATIONS
SIX MONTHS ENDED MARCH 31, 2015
|
| | | |
NET INVESTMENT INCOME | |
| Investment Income: | |
| Dividend income (net of foreign taxes withheld of $73,167) |
| $1,026,404 |
|
| Interest income | 1,296 |
|
| Total investment income | 1,027,700 |
|
| | |
| Expenses: | |
| Investment advisory fee | 434,448 |
|
| Transfer agency fees | 90,387 |
|
| Distribution Plan expenses: | |
| Class A | 75,146 |
|
| Class C | 22,784 |
|
| Directors' fees and expenses | 5,077 |
|
| Administrative fees | 149,121 |
|
| Accounting fees | 8,192 |
|
| Custodian fees | 66,180 |
|
| Registration fees | 21,045 |
|
| Reports to shareholders | 7,876 |
|
| Professional fees | 14,275 |
|
| Miscellaneous | 7,635 |
|
| Total expenses | 902,166 |
|
| Reimbursement from Advisor: | |
| Class A | (27,453 | ) |
| Class C | (5,747 | ) |
| Net expenses | 868,966 |
|
| | |
NET INVESTMENT INCOME | 158,734 |
|
| | |
REALIZED AND UNREALIZED GAIN (LOSS) | |
| Net realized gain (loss) on: | |
| Investments | 1,303,231 |
|
| Foreign currency transactions | (156,272 | ) |
| | 1,146,959 |
|
| | |
| Change in unrealized appreciation (depreciation) on: | |
| Investments and foreign currencies | 1,798,191 |
|
| Assets and liabilities denominated in foreign currencies | (11,070 | ) |
| | 1,787,121 |
|
| | |
NET REALIZED AND UNREALIZED GAIN (LOSS) | 2,934,080 |
|
| | |
INCREASE (DECREASE) IN NET ASSETS RESULTING FROM OPERATIONS |
| $3,092,814 |
|
| | |
| See notes to financial statements. |
www.calvert.com CALVERT INTERNATIONAL OPPORTUNITIES FUND SEMI-ANNUAL REPORT (UNAUDITED) 19
STATEMENTS OF CHANGES IN NET ASSETS
|
| | | | | | | |
INCREASE (DECREASE) IN NET ASSETS | SIX MONTHS ENDED MARCH 31, 2015 | | YEAR ENDED SEPTEMBER 30, 2014 |
| Operations: | | | |
| Net investment income |
| $158,734 |
| |
| $881,762 |
|
| Net realized gain (loss) | 1,146,959 |
| | 8,634,029 |
|
| Change in unrealized appreciation (depreciation) | 1,787,121 |
| | (5,740,450 | ) |
| | | | |
INCREASE (DECREASE) IN NET ASSETS RESULTING FROM OPERATIONS | 3,092,814 |
| | 3,775,341 |
|
| | | | |
| Distributions to shareholders from: | | | |
| Net investment income: | | | |
| Class A shares | (620,616 | ) | | (435,450 | ) |
| Class C shares | (11,490 | ) | | (1,772 | ) |
| Class I shares | (485,711 | ) | | (373,540 | ) |
| Class Y shares | (116,872 | ) | | (56,631 | ) |
| Net realized gain: | | | |
| Class A shares | (3,083,385 | ) | | — |
|
| Class C shares | (281,879 | ) | | — |
|
| Class I shares | (1,909,382 | ) | | — |
|
| Class Y shares | (1,123,889 | ) | | — |
|
| Total distributions | (7,633,224 | ) | | (867,393 | ) |
| | | | |
| Capital share transactions: | | | |
| Shares sold: | | | |
| Class A shares | 54,543,448 |
| | 20,793,142 |
|
| Class C shares | 634,605 |
| | 1,625,487 |
|
| Class I shares | 8,959,607 |
| | 11,596,182 |
|
| Class Y shares | 6,346,282 |
| | 12,768,845 |
|
| Reinvestment of distributions: | | | |
| Class A shares | 3,435,374 |
| | 412,387 |
|
| Class C shares | 247,069 |
| | 1,516 |
|
| Class I shares | 2,395,093 |
| | 373,539 |
|
| Class Y shares | 1,061,068 |
| | 41,090 |
|
| Redemption fees: | | | |
| Class A shares | 7 |
| | 2,151 |
|
| Class C shares | — |
| | 170 |
|
| Class Y shares | 18 |
| | 80 |
|
| Shares redeemed: | | | |
| Class A shares | (6,526,418 | ) | | (18,216,987 | ) |
| Class C shares | (383,425 | ) | | (405,860 | ) |
| Class I shares | (3,166,423 | ) | | (5,011,190 | ) |
| Class Y shares | (1,839,123 | ) | | (1,241,457 | ) |
| Total capital share transactions | 65,707,182 |
| | 22,739,095 |
|
| | | | |
TOTAL INCREASE (DECREASE) IN NET ASSETS | 61,166,772 |
| | 25,647,043 |
|
| See notes to financial statements. |
20 www.calvert.com CALVERT INTERNATIONAL OPPORTUNITIES FUND SEMI-ANNUAL REPORT (UNAUDITED)
STATEMENTS OF CHANGES IN NET ASSETS
|
| | | | | | | |
NET ASSETS | SIX MONTHS ENDED MARCH 31, 2015 | | YEAR ENDED SEPTEMBER 30, 2014 |
| Beginning of period |
| $103,759,690 |
| |
| $78,112,647 |
|
| End of period (including distributions in excess of net investment income and undistributed net investment income of $144,704 and $931,251, respectively) |
| $164,926,462 |
| |
| $103,759,690 |
|
| | | | |
CAPITAL SHARE ACTIVITY | | | |
| Shares sold: | | | |
| Class A shares | 3,524,535 |
| | 1,245,394 |
|
| Class C shares | 41,832 |
| | 98,171 |
|
| Class I shares | 601,109 |
| | 706,798 |
|
| Class Y shares | 433,120 |
| | 787,986 |
|
| Reinvestment of distributions: | | | |
| Class A shares | 229,208 |
| | 25,269 |
|
| Class C shares | 16,844 |
| | 94 |
|
| Class I shares | 162,152 |
| | 23,288 |
|
| Class Y shares | 74,193 |
| | 2,641 |
|
| Shares redeemed: | | | |
| Class A shares | (424,822 | ) | | (1,082,722 | ) |
| Class C shares | (25,352 | ) | | (24,568 | ) |
| Class I shares | (210,767 | ) | | (301,772 | ) |
| Class Y shares | (126,025 | ) | | (77,652 | ) |
| Total capital share activity | 4,296,027 |
| | 1,402,927 |
|
| | | | |
| See notes to financial statements. |
www.calvert.com CALVERT INTERNATIONAL OPPORTUNITIES FUND SEMI-ANNUAL REPORT (UNAUDITED) 21
NOTES TO FINANCIAL STATEMENTS
NOTE A — SIGNIFICANT ACCOUNTING POLICIES
General: Calvert International Opportunities Fund (the “Fund”), a series of Calvert World Values Fund, Inc., is registered under the Investment Company Act of 1940 as a diversified, open-end management investment company. Calvert World Values Fund, Inc. is comprised of four separate series. The operations of each series are accounted for separately. The Fund offers four classes of shares of capital stock - Classes A, C, I, and Y. Class A shares are sold with a maximum front-end sales charge of 4.75%. Class C shares are sold without a front-end sales charge and, with certain exceptions, will be charged a deferred sales charge on shares sold within one year of purchase. Class C shares have higher levels of expenses than Class A shares. Class I shares require a minimum account balance of $1,000,000. The $1 million minimum initial investment is waived for retirement plans that trade through omnibus accounts and may be waived for certain other institutional accounts where it is believed to be in the best interest of the Fund and its shareholders. Class I shares have no front-end or deferred sales charge and have lower levels of expenses than Class A shares. Class Y shares are generally only available to wrap or similar fee-based programs offered by financial intermediaries, foundations, and endowments that have entered into an agreement with the Fund’s Distributor to offer Class Y shares. Class Y shares have no front-end or deferred sales charge and have lower levels of expenses than Class A shares. Each class has different: (a) dividend rates, due to differences in Distribution Plan expenses and other class-specific expenses, (b) exchange privileges, and (c) class-specific voting rights.
Security Valuation: Net asset value per share is determined every business day as of the close of the regular session of the New York Stock Exchange (generally 4:00 p.m. Eastern time). The Fund uses independent pricing services approved by the Board of Directors (“the Board”) to value its investments wherever possible. Investments for which market quotations are not available or deemed not reliable are fair valued in good faith under the direction of the Board.
The Board has adopted Valuation Procedures (the “Procedures”) to determine the fair value of securities and other financial instruments for which market prices are not readily available or which may not be reliably priced. The Board has delegated the day-to-day responsibility for determining the fair value of assets of the Fund to Calvert Investment Management, Inc. (the “Advisor” or “Calvert”) and has provided these Procedures to govern Calvert in its valuation duties.
Calvert has chartered an internal Valuation Committee to oversee the implementation of these Procedures and to assist it in carrying out the valuation responsibilities that the Board has delegated.
The Valuation Committee meets on a regular basis to review illiquid securities and other investments which may not have readily available market prices. The Valuation Committee’s fair valuation determinations are subject to review, approval and ratification by the Board at its next regularly scheduled meeting covering the calendar quarter in which the fair valuation was determined.
The Valuation Committee utilizes various methods to measure the fair value of the Fund’s investments. Generally Accepted Accounting Principles (GAAP) establishes a disclosure hierarchy that categorizes the inputs to valuation techniques used to value assets and liabilities at measurement date. These inputs are summarized in the three broad levels listed below:
Level 1 - quoted prices in active markets for identical securities
22 www.calvert.com CALVERT INTERNATIONAL OPPORTUNITIES FUND SEMI-ANNUAL REPORT (UNAUDITED)
Level 2 - other significant observable inputs (including quoted prices for similar securities, interest rates, prepayment speeds, credit risk, etc.)
Level 3 - significant unobservable inputs (including the Fund’s own assumptions in determining the fair value of investments)
The inputs or methodologies used for valuing securities are not necessarily an indication of the risk associated with investing in those securities.
Changes in valuation techniques may result in transfers in or out of an investment’s assigned level within the hierarchy during the period. At March 31, 2015, $153,446,566 transferred out of Level 1 into Level 2. Valuation techniques used to value the Fund’s investments by major category are as follows:
Equity securities, including restricted securities, for which market quotations are readily available, are valued at the last reported sale price or official closing price as reported by an independent pricing service on the primary market or exchange on which they are traded and are categorized as Level 1 in the hierarchy. In the event there were no sales during the day or closing prices are not available, securities are valued at the last quoted bid price or using the last available price and are categorized as Level 2 in the hierarchy. Foreign securities are valued based on quotations from the principal market in which such securities are normally traded. If events occur after the close of the principal market in which foreign securities are traded, and before the close of business of the Fund, that are expected to materially affect the value of those securities, then they are valued at their fair value taking these events into account. The Fund has retained a third party fair value pricing service to quantitatively analyze the price movement of its holdings on foreign exchanges and to automatically fair value if the variation from the prior day’s closing price exceeds specified parameters. Such securities would be categorized as Level 2 in the hierarchy in these circumstances. Utilizing this technique may result in transfers between Level 1 and Level 2. For restricted securities and private placements where observable inputs are limited, assumptions about market activity and risk are used and such securities are categorized as Level 3 in the hierarchy.
Short-term securities of sufficient credit quality with remaining maturities of sixty days or less for which quotations are not readily available are valued at amortized cost, which approximates fair value, and are categorized as Level 2 in the hierarchy.
If a market value cannot be determined for a security using the methodologies described above, or if, in the good faith opinion of the Advisor, the market value does not constitute a readily available market quotation, or if a significant event has occurred that would materially affect the value of the security, the security will be fair valued as determined in good faith by the Valuation Committee.
The Valuation Committee considers a number of factors, including significant unobservable valuation inputs when arriving at fair value. It considers all significant facts that are reasonably available and relevant to the determination of fair value.
The Valuation Committee primarily employs a market-based approach which may use related or comparable assets or liabilities, recent transactions, market multiples, book values, and other relevant information for the investment to determine the fair value of the investment. When more appropriate, the fund may employ an income-based or cost approach. An income-based valuation approach discounts anticipated future cash flows of the investment to calculate a present amount (discounted). The measurement is based on the value indicated by current market expectations about those future amounts. Discounts may also be applied due to the
www.calvert.com CALVERT INTERNATIONAL OPPORTUNITIES FUND SEMI-ANNUAL REPORT (UNAUDITED) 23
nature or duration of any restrictions on the disposition of the investments. A cost based approach is based on the amount that currently would be required to replace the service capacity of an asset (current replacement cost). From the seller’s perspective, the price that would be received for the asset is determined based on the cost to a buyer to acquire or construct a substitute asset of comparable utility, adjusted for obsolescence.
The values assigned to fair value investments are based on available information and do not necessarily represent amounts that might ultimately be realized. Further, due to the inherent uncertainty of valuations of such investments, the fair values may differ significantly from the values that would have been used had an active market existed, and the differences could be material. The Valuation Committee employs various methods for calibrating these valuation approaches including a regular review of key inputs and assumptions, transactional back-testing or disposition analysis and reviews of any related market activity.
At March 31, 2015, securities valued at $60,244, or 0.1% of net assets were fair valued in good faith under the direction of the Board.
The following table summarizes the market value of the Fund’s holdings as of March 31, 2015, based on the inputs used to value them:
|
| | | | | | | | | | | | | | |
| | VALUATION INPUTS |
INVESTMENTS IN SECURITIES* | LEVEL 1 | | LEVEL 2 | | LEVEL 3 | | TOTAL |
| Equity securities* |
| $4,407,760 |
| |
| $153,446,566 | ** | | — |
| |
| $157,854,326 |
|
| Other debt obligations | — |
| | 6,043,511 |
| | — |
| | 6,043,511 |
|
| TOTAL |
| $4,407,760 |
| |
| $159,490,077 |
| | — |
| |
| $163,897,837 |
|
| | | | | | | | |
* For further breakdown of equity securities by country, please refer to the Statement of Net Assets. ** Includes certain securities trading primarily outside the U.S. whose value was adjusted as a result of significant market movements following the close of local trading. On March 31, 2015, price movements exceeded specified parameters and the third party fair value pricing service quantitatively fair valued the affected securities. |
At March 31, 2015, a significant transfer out of Level 1 and into Level 2 occurred.
On March 31, 2015, price movements exceeded specified parameters and the third party fair value pricing service quantitatively fair valued the affected securities.
Security Transactions and Net Investment Income: Security transactions are accounted for on trade date. Realized gains and losses are recorded on an identified cost basis and may include proceeds from litigation. Dividend income is recorded on the ex-dividend date or, in the case of dividends on certain foreign securities, as soon as the Fund is informed of the ex-dividend date. Withholding taxes on foreign dividends have been provided for in accordance with the Fund’s understanding of the applicable country’s tax rules and rates. Distributions received on securities that represent a return of capital or capital gain are recorded as a reduction of cost of investments and/or as a realized gain. Interest income, which includes amortization of premium and accretion of discount on debt securities, is accrued as earned. Investment income and realized and unrealized gains and losses are allocated to separate classes of shares based upon the relative net assets of each class. Expenses arising in connection with a specific class are charged directly to that class. Expenses common to the classes are allocated to each class in proportion to their relative net assets.
Foreign Currency Transactions: The Fund’s accounting records are maintained in U.S. dollars. For valuation of assets and liabilities on each date of net asset value determination, foreign denominations are converted into U.S. dollars using the current exchange rate.
24 www.calvert.com CALVERT INTERNATIONAL OPPORTUNITIES FUND SEMI-ANNUAL REPORT (UNAUDITED)
Security transactions, income, and expenses are translated at the prevailing rate of exchange on the date of the event. The effect of changes in foreign exchange rates on securities and foreign currencies is included in the net realized and unrealized gain or loss on securities and foreign currencies.
Distributions to Shareholders: Distributions to shareholders are recorded by the Fund on ex-dividend date. Dividends from net investment income and distributions from net realized capital gains, if any, are paid at least annually. Distributions are determined in accordance with income tax regulations which may differ from generally accepted accounting principles; accordingly, periodic reclassifications are made within the Fund’s capital accounts to reflect income and gains available for distribution under income tax regulations.
Estimates: The preparation of financial statements in conformity with accounting principles generally accepted in the United States requires management to make estimates and assumptions that affect the reported amounts of assets and liabilities and disclosure of contingent assets and liabilities at the date of the financial statements and the reported amounts of income and expenses during the reported period. Actual results could differ from those estimates.
Redemption Fees: The Fund charges a 2% redemption fee on redemptions, including exchanges, made within 30 days of purchase (within seven days for Class I shares). The redemption fee is accounted for as an addition to paid-in capital and is intended to discourage market-timers by ensuring that short-term trading costs are borne by the investors making the transactions and not the shareholders already in the Fund. This fee was eliminated effective February 2, 2015.
Federal Income Taxes: No provision for federal income or excise tax is required since the Fund intends to continue to qualify as a regulated investment company under the Internal Revenue Code and to distribute substantially all of its taxable earnings.
Management has analyzed the Fund’s tax positions taken for all open federal income tax years and has concluded that no provision for federal income tax is required in the Fund’s financial statements. A Fund’s federal tax return is subject to examination by the Internal Revenue Service for a period of three years.
NOTE B — RELATED PARTY TRANSACTIONS
Calvert Investment Management, Inc. (the “Advisor”) is wholly-owned by Calvert Investments, Inc., which is indirectly wholly-owned by Ameritas Mutual Holding Company. The Advisor provides investment advisory services and pays the salaries and fees of officers and Directors of the Fund who are employees of the Advisor or its affiliates. For its services, the Advisor receives an annual fee, payable monthly, of .75% of the average daily net assets. Under the terms of the agreement, $103,790 was payable at period end.
The Advisor has contractually agreed to limit net annual fund operating expenses through January 31, 2016. The contractual expense caps are 1.66%, 2.50%, 1.20%, and 1.41% for Class A, C, I, and Y, respectively. For the purpose of this expense limit, operating expenses do not include interest expense, brokerage commissions, taxes, and extraordinary expenses. This expense limitation does not limit acquired fund fees and expenses, if any. At period end $5,707 was receivable from the Advisor.
Calvert Investment Administrative Services, Inc., an affiliate of the Advisor, provides administrative services to the Fund for an annual fee, payable monthly, of .30% for Classes A, C, and Y shares and .15% for Class I shares, based on their average daily net assets. Under the terms of the agreement, $36,642 was payable at period end.
www.calvert.com CALVERT INTERNATIONAL OPPORTUNITIES FUND SEMI-ANNUAL REPORT (UNAUDITED) 25
Calvert Investment Distributors, Inc. (“CID”), an affiliate of the Advisor, is the distributor and principal underwriter for the Fund. Pursuant to Rule 12b-1 under the Investment Company Act of 1940, the Fund has adopted a Distribution Plan that permits the Fund to pay certain expenses associated with the distribution and servicing of its shares. The expenses paid may not exceed .50% and 1.00% annually of the average daily net assets of Class A and C, respectively. The amount actually paid by the Fund is an annualized fee, payable monthly, of .25% and 1.00% of the average daily net assets of Class A and C, respectively. Class I and Y shares do not have Distribution Plan expenses. Under the terms of the agreement, $25,094 was payable at period end.
CID received $10,659 as its portion of the commissions charged on sales of the Fund’s Class A shares for the six months ended March 31, 2015.
Calvert Investment Services, Inc. (“CIS”), an affiliate of the Advisor, is the shareholder servicing agent for the Fund. For its services, CIS received a fee of $10,207 for the six months ended March 31, 2015. Under the terms of the agreement, $1,813 was payable at period end. Boston Financial Data Services, Inc. is the transfer and dividend disbursing agent.
Each Director of the Fund who is not an employee of the Advisor or its affiliates receives an annual retainer of $52,000 ($48,000 prior to January 1, 2015) plus a meeting fee of up to $3,000 for each Board meeting attended. Additional fees of $6,000 ($5,000 prior to January 1, 2015) annually may be paid to the Committee chairs ($10,000 for the Board chair and the Special Equities Committee chair) and $2,500 annually may be paid to Committee members, plus a Committee meeting fee of $500 for each Committee meeting attended. Directors’ fees are allocated to each of the Funds served.
NOTE C — INVESTMENT ACTIVITY AND TAX INFORMATION
During the period, the cost of purchases and proceeds from sales of investments, other than short-term securities, were $85,970,205 and $26,762,969, respectively.
The Fund may purchase securities, typically short-term variable rate demand notes, from or sell to other funds managed by the Advisor. These interportfolio transactions are primarily used for cash management purposes and are made pursuant to Rule 17a-7 of the Investment Company Act of 1940. For the six months ended March 31, 2015, such purchase transactions were $201,633.
As of March 31, 2015, the tax basis components of unrealized appreciation/(depreciation) and the federal tax cost were as follows:
|
| | | |
| Unrealized appreciation |
| $15,404,556 |
|
| Unrealized (depreciation) | (6,326,017 | ) |
| Net unrealized appreciation/(depreciation) |
| $9,078,539 |
|
| | |
| Federal income tax cost of investments |
| $154,819,298 |
|
26 www.calvert.com CALVERT INTERNATIONAL OPPORTUNITIES FUND SEMI-ANNUAL REPORT (UNAUDITED)
NOTE D — LINE OF CREDIT
A financing agreement is in place with the Calvert Funds and State Street Corporation (“SSC”). Under the agreement, SSC provides an unsecured line of credit facility, in the aggregate amount of $50 million ($25 million committed and $25 million uncommitted), accessible by the Funds for temporary or emergency purposes only. Borrowings bear interest at the higher of the London Interbank Offered Rate (LIBOR) or the overnight Federal Funds Rate plus 1.25% per annum. A commitment fee of .125% per annum is incurred on the unused portion of the committed facility, which is allocated to all participating funds. The Fund had no borrowings under the agreement during the six months ended March 31, 2015.
NOTE E — SUBSEQUENT EVENTS
In preparing the financial statements as of March 31, 2015, no subsequent events or transactions occurred that would have required recognition or disclosure in these financial statements.
www.calvert.com CALVERT INTERNATIONAL OPPORTUNITIES FUND SEMI-ANNUAL REPORT (UNAUDITED) 27
FINANCIAL HIGHLIGHTS
|
| | | | | | | | | | | |
| | | PERIODS ENDED | |
CLASS A SHARES | MARCH 31, 2015 (z) | | SEPTEMBER 30, 2014 (z) | | SEPTEMBER 30, 2013 (z) |
| Net asset value, beginning |
| $16.42 |
| |
| $15.76 |
| |
| $12.59 |
|
| Income from investment operations: | | | | | |
| Net investment income | .02 |
| | .15 |
| | .14 |
|
| Net realized and unrealized gain (loss) | .28 |
| | .66 |
| | 3.19 |
|
| Total from investment operations | .30 |
| | .81 |
| | 3.33 |
|
| Distributions from: | | | | | |
| Net investment income | (.18 | ) | | (.15 | ) | | (.16 | ) |
| Net realized gain | (.97 | ) | | — |
| | — |
|
| Total distributions | (1.15 | ) | | (.15 | ) | | (.16 | ) |
| Total increase (decrease) in net asset value | (.85 | ) | | .66 |
| | 3.17 |
|
| Net asset value, ending |
| $15.57 |
| |
| $16.42 |
| |
| $15.76 |
|
| | | | | | |
| Total return* | 2.18 | % | | 5.14 | % | | 26.70 | % |
Ratios to average net assets: A | | | | | |
| Net investment income | .21% (a) |
| | .88 | % | | 1.04 | % |
| Total expenses | 1.75% (a) |
| | 1.85 | % | | 2.13 | % |
| Expenses before offsets | 1.66% (a) |
| | 1.66 | % | | 1.66 | % |
| Net expenses | 1.66% (a) |
| | 1.66 | % | | 1.66 | % |
| Portfolio turnover | 23 | % | | 56 | % | | 42 | % |
| Net assets, ending (in thousands) |
| $99,764 |
| |
| $50,540 |
| |
| $45,563 |
|
| | | | | | |
|
| | | | | | | | | | | |
| | | | YEARS ENDED | | |
CLASS A SHARES | SEPTEMBER 30, 2012 | | SEPTEMBER 30, 2011 | | SEPTEMBER 30, 2010 (z) |
| Net asset value, beginning |
| $10.57 |
| |
| $12.43 |
| |
| $11.40 |
|
| Income from investment operations: | | | | | |
| Net investment income | .13 |
| | .10 |
| | .06 |
|
| Net realized and unrealized gain (loss) | 2.01 |
| | (1.93 | ) | | .97 |
|
| Total from investment operations | 2.14 |
| | (1.83 | ) | | 1.03 |
|
| Distributions from: | | | | | |
| Net investment income | (.12 | ) | | (.03 | ) | | — |
|
| Net realized gain | — |
| | — |
| | — |
|
| Total distributions | (.12 | ) | | (.03 | ) | | — |
|
| Total increase (decrease) in net asset value | 2.02 |
| | (1.86 | ) | | 1.03 |
|
| Net asset value, ending |
| $12.59 |
| |
| $10.57 |
| |
| $12.43 |
|
| | | | | | |
| Total return* | 20.52 | % | | (14.78 | %) | | 9.04 | % |
Ratios to average net assets: A | | | | | |
| Net investment income | 1.10 | % | | .68 | % | | .48 | % |
| Total expenses | 2.35 | % | | 2.21 | % | | 2.27 | % |
| Expenses before offsets | 1.66 | % | | 1.66 | % | | 1.66 | % |
| Net expenses | 1.66 | % | | 1.66 | % | | 1.66 | % |
| Portfolio turnover | 56 | % | | 126 | % | | 44 | % |
| Net assets, ending (in thousands) |
| $27,406 |
| |
| $24,874 |
| |
| $30,062 |
|
| See notes to financial highlights. |
28 www.calvert.com CALVERT INTERNATIONAL OPPORTUNITIES FUND SEMI-ANNUAL REPORT (UNAUDITED)
FINANCIAL HIGHLIGHTS
|
| | | | | | | | | | | |
| | | PERIODS ENDED | |
CLASS C SHARES | MARCH 31, 2015 (z) | | SEPTEMBER 30, 2014 (z) | | SEPTEMBER 30, 2013 (z) |
| Net asset value, beginning |
| $16.08 |
| |
| $15.44 |
| |
| $12.30 |
|
| Income from investment operations: | | | | | |
| Net investment income (loss) | (.07 | ) | | (.01 | ) | | .02 |
|
| Net realized and unrealized gain (loss) | .31 |
| | .66 |
| | 3.14 |
|
| Total from investment operations | .24 |
| | .65 |
| | 3.16 |
|
| Distributions from: | | | | | |
| Net investment income | (.04 | ) | | (.01 | ) | | (.02 | ) |
| Net realized gain | (.97 | ) | | — |
| | — |
|
| Total distributions | (1.01 | ) | | (.01 | ) | | (.02 | ) |
| Total increase (decrease) in net asset value | (.77 | ) | | .64 |
| | 3.14 |
|
| Net asset value, ending |
| $15.31 |
| |
| $16.08 |
| |
| $15.44 |
|
| | | | | | |
| Total return* | 1.76 | % | | 4.20 | % | | 25.70 | % |
Ratios to average net assets: A | | | | | |
| Net investment income (loss) | (.88%) (a) |
| | (.08 | %) | | .17 | % |
| Total expenses | 2.75% (a) |
| | 2.81 | % | | 3.27 | % |
| Expenses before offsets | 2.50% (a) |
| | 2.50 | % | | 2.50 | % |
| Net expenses | 2.50% (a) |
| | 2.50 | % | | 2.50 | % |
| Portfolio turnover | 23 | % | | 56 | % | | 42 | % |
| Net assets, ending (in thousands) |
| $4,895 |
| |
| $4,605 |
| |
| $3,282 |
|
| | | | | | |
|
| | | | | | | | | | | |
| | | | YEARS ENDED | | |
CLASS C SHARES | SEPTEMBER 30, 2012 | | SEPTEMBER 30, 2011 | | SEPTEMBER 30, 2010 (z) |
| Net asset value, beginning |
| $10.32 |
| |
| $12.20 |
| |
| $11.29 |
|
| Income from investment operations: | | | | | |
| Net investment income (loss) | .04 |
| | (.01 | ) | | (.03 | ) |
| Net realized and unrealized gain (loss) | 1.95 |
| | (1.87 | ) | | .94 |
|
| Total from investment operations | 1.99 |
| | (1.88 | ) | | .91 |
|
| Distributions from: | | | | | |
| Net investment income | (.01 | ) | | — |
| | — |
|
| Net realized gain | — |
| | — |
| | — |
|
| Total distributions | (.01 | ) | | — |
| | — |
|
| Total increase (decrease) in net asset value | 1.98 |
| | (1.88 | ) | | .91 |
|
| Net asset value, ending |
| $12.30 |
| |
| $10.32 |
| |
| $12.20 |
|
| | | | | | |
| Total return* | 19.31 | % | | (15.41 | %) | | 8.06 | % |
Ratios to average net assets: A | | | | | |
| Net investment income (loss) | .30 | % | | (.13 | %) | | (.25 | %) |
| Total expenses | 3.65 | % | | 3.48 | % | | 3.88 | % |
| Expenses before offsets | 2.50 | % | | 2.50 | % | | 2.50 | % |
| Net expenses | 2.50 | % | | 2.50 | % | | 2.50 | % |
| Portfolio turnover | 56 | % | | 126 | % | | 44 | % |
| Net assets, ending (in thousands) |
| $2,363 |
| |
| $1,831 |
| |
| $1,744 |
|
| See notes to financial highlights. |
www.calvert.com CALVERT INTERNATIONAL OPPORTUNITIES FUND SEMI-ANNUAL REPORT (UNAUDITED) 29
FINANCIAL HIGHLIGHTS
|
| | | | | | | | | | | |
| | | PERIODS ENDED | |
CLASS I SHARES | MARCH 31, 2015 (z) | | SEPTEMBER 30, 2014 (z) | | SEPTEMBER 30, 2013 (z) |
| Net asset value, beginning |
| $16.19 |
| |
| $15.54 |
| |
| $12.37 |
|
| Income from investment operations: | | | | | |
| Net investment income | .04 |
| | .20 |
| | .25 |
|
| Net realized and unrealized gain (loss) | .29 |
| | .66 |
| | 3.10 |
|
| Total from investment operations | .33 |
| | .86 |
| | 3.35 |
|
| Distributions from: | | | | | |
| Net investment income | (.23 | ) | | (.21 | ) | | (.18 | ) |
| Net realized gain | (.97 | ) | | — |
| | — |
|
| Total distributions | (1.20 | ) | | (.21 | ) | | (.18 | ) |
| Total increase (decrease) in net asset value | (.87 | ) | | .65 |
| | 3.17 |
|
| Net asset value, ending |
| $15.32 |
| |
| $16.19 |
| |
| $15.54 |
|
| | | | | | |
| Total return* | 2.42 | % | | 5.58 | % | | 27.43 | % |
Ratios to average net assets: A | | | | | |
| Net investment income | .54% (a) |
| | 1.24 | % | | 1.76 | % |
| Total expenses | 1.14% (a) |
| | 1.18 | % | | 1.43 | % |
| Expenses before offsets | 1.14% (a) |
| | 1.18 | % | | 1.20 | % |
| Net expenses | 1.14% (a) |
| | 1.18 | % | | 1.20 | % |
| Portfolio turnover | 23 | % | | 56 | % | | 42 | % |
| Net assets, ending (in thousands) |
| $38,830 |
| |
| $32,079 |
| |
| $24,130 |
|
| | | | | | |
|
| | | | | | | | | | | |
| | | | YEARS ENDED | | |
CLASS I SHARES | SEPTEMBER 30, 2012 | | SEPTEMBER 30, 2011 | | SEPTEMBER 30, 2010 (z) |
| Net asset value, beginning |
| $10.36 |
| |
| $12.17 |
| |
| $11.32 |
|
| Income from investment operations: | | | | | |
| Net investment income | .21 |
| | .15 |
| | .10 |
|
| Net realized and unrealized gain (loss) | 1.93 |
| | (1.88 | ) | | .95 |
|
| Total from investment operations | 2.14 |
| | (1.73 | ) | | 1.05 |
|
| Distributions from: | | | | | |
| Net investment income | (.13 | ) | | (.08 | ) | | (.20 | ) |
| Net realized gain | — |
| | — |
| | — |
|
| Total distributions | (.13 | ) | | (.08 | ) | | (.20 | ) |
| Total increase (decrease) in net asset value | 2.01 |
| | (1.81 | ) | | .85 |
|
| Net asset value, ending |
| $12.37 |
| |
| $10.36 |
| |
| $12.17 |
|
| | | | | | |
| Total return* | 20.89 | % | | (14.32 | %) | | 9.42 | % |
Ratios to average net assets: A | | | | | |
| Net investment income | 1.76 | % | | 1.11 | % | | .90 | % |
| Total expenses | 1.70 | % | | 1.54 | % | | 1.73 | % |
| Expenses before offsets | 1.20 | % | | 1.20 | % | | 1.20 | % |
| Net expenses | 1.20 | % | | 1.20 | % | | 1.20 | % |
| Portfolio turnover | 56 | % | | 126 | % | | 44 | % |
| Net assets, ending (in thousands) |
| $8,771 |
| |
| $4,174 |
| |
| $4,190 |
|
| See notes to financial highlights. |
30 www.calvert.com CALVERT INTERNATIONAL OPPORTUNITIES FUND SEMI-ANNUAL REPORT (UNAUDITED)
FINANCIAL HIGHLIGHTS
|
| | | | | | | | | | | |
| | | PERIODS ENDED | |
CLASS Y SHARES | MARCH 31, 2015 (z) | | SEPTEMBER 30, 2014 (z) | | SEPTEMBER 30, 2013 (z) |
| Net asset value, beginning |
| $15.68 |
| |
| $15.03 |
| |
| $11.94 |
|
| Income from investment operations: | | | | | |
| Net investment income | .02 |
| | .11 |
| | .18 |
|
| Net realized and unrealized gain (loss) | .29 |
| | .70 |
| | 3.03 |
|
| Total from investment operations | .31 |
| | .81 |
| | 3.21 |
|
| Distributions from: | | | | | |
| Net investment income | (.09 | ) | | (.16 | ) | | (.12 | ) |
| Net realized gain | (.97 | ) | | — |
| | — |
|
| Total distributions | (1.06 | ) | | (.16 | ) | | (.12 | ) |
| Total increase (decrease) in net asset value | (.75 | ) | | .65 |
| | 3.09 |
|
| Net asset value, ending |
| $14.93 |
| |
| $15.68 |
| |
| $15.03 |
|
| | | | | | |
| Total return* | 2.33 | % | | 5.40 | % | | 27.06 | % |
Ratios to average net assets: A | | | | | |
| Net investment income | .29% (a) |
| | .68 | % | | 1.31 | % |
| Total expenses | 1.37% (a) |
| | 1.48 | % | | 1.90 | % |
| Expenses before offsets | 1.37% (a) |
| | 1.41 | % | | 1.41 | % |
| Net expenses | 1.37% (a) |
| | 1.41 | % | | 1.41 | % |
| Portfolio turnover | 23 | % | | 56 | % | | 42 | % |
| Net assets, ending (in thousands) |
| $21,439 |
| |
| $16,536 |
| |
| $5,138 |
|
| | | | | | |
|
| | | | | | | | | | | |
| | | | YEARS ENDED | | |
CLASS Y SHARES | SEPTEMBER 30, 2012 | | SEPTEMBER 30, 2011 | | SEPTEMBER 30, 2010 (z) |
| Net asset value, beginning |
| $10.00 |
| |
| $11.72 |
| |
| $11.50 |
|
| Income from investment operations: | | | | | |
| Net investment income | .15 |
| | .13 |
| | .10 |
|
| Net realized and unrealized gain (loss) | 1.90 |
| | (1.83 | ) | | .90 |
|
| Total from investment operations | 2.05 |
| | (1.70 | ) | | 1.00 |
|
| Distributions from: | | | | | |
| Net investment income | (.11 | ) | | (.02 | ) | | (.78 | ) |
| Net realized gain | — |
| | — |
| | — |
|
| Total distributions | (.11 | ) | | (.02 | ) | | (.78 | ) |
| Total increase (decrease) in net asset value | 1.94 |
| | (1.72 | ) | | .22 |
|
| Net asset value, ending |
| $11.94 |
| |
| $10.00 |
| |
| $11.72 |
|
| | | | | | |
| Total return* | 20.69 | % | | (14.52 | %) | | 9.18 | % |
Ratios to average net assets: A | | | | | |
| Net investment income | 1.36 | % | | 1.04 | % | | .96 | % |
| Total expenses | 2.49 | % | | 2.68 | % | | 4.73 | % |
| Expenses before offsets | 1.41 | % | | 1.41 | % | | 1.41 | % |
| Net expenses | 1.41 | % | | 1.41 | % | | 1.41 | % |
| Portfolio turnover | 56 | % | | 126 | % | | 44 | % |
| Net assets, ending (in thousands) |
| $1,638 |
| |
| $1,519 |
| |
| $944 |
|
| See notes to financial highlights. |
www.calvert.com CALVERT INTERNATIONAL OPPORTUNITIES FUND SEMI-ANNUAL REPORT (UNAUDITED) 31
|
|
A Total expenses do not reflect amounts reimbursed and/or waived by the Advisor or reductions from expense offset arrangements. Expenses before offsets reflect expenses after reimbursement and/or waiver by the Advisor but prior to reductions from expense offset arrangements. Net expenses are net of all reductions and represent the net expenses paid by the Fund. (a) Annualized. (z) Per share figures are calculated using the Average Shares Method. * Total return is not annualized for periods of less than one year and does not reflect deduction of any front-end or deferred sales charge. See notes to financial statements. |
32 www.calvert.com CALVERT INTERNATIONAL OPPORTUNITIES FUND SEMI-ANNUAL REPORT (UNAUDITED)
EXPLANATION OF FINANCIAL TABLES
SCHEDULE OF INVESTMENTS
The Schedule of Investments is a snapshot of all securities held in the fund at their market value, on the last day of the reporting period. Securities are listed by asset type (e.g., common stock, corporate bonds, U.S. government obligations) or, for International and Global funds, by country, and may be further broken down into sub-groups and by industry classification.
STATEMENT OF ASSETS AND LIABILITIES
The Statement of Assets and Liabilities is often referred to as the fund’s balance sheet. It lists the value of what the fund owns, is due and owes on the last day of the reporting period. The fund’s assets include the market value of securities owned, cash, receivables for securities sold and shareholder subscriptions, and receivables for dividends and interest payments that have been earned, but not yet received. The fund’s liabilities include payables for securities purchased and shareholder redemptions, and expenses owed but not yet paid. The statement also reports the fund’s net asset value (NAV) per share on the last day of the reporting period. The NAV is calculated by dividing the fund’s net assets (assets minus liabilities) by the number of shares outstanding. This statement is accompanied by a Schedule of Investments. Alternatively, if certain conditions are met, a Statement of Net Assets may be presented in lieu of this statement and the Schedule of Investments.
STATEMENT OF NET ASSETS
The Statement of Net Assets provides a detailed list of the fund’s holdings, including each security’s market value on the last day of the reporting period. The Statement of Net Assets includes a Schedule of Investments. Other assets are added and other liabilities subtracted from the investments total to calculate the fund’s net assets. Finally, net assets are divided by the outstanding shares of the fund to arrive at its share price, or Net Asset Value (NAV) per share.
At the end of the Statement of Net Assets is a table displaying the composition of the fund’s net assets. Paid in Capital is the money invested by shareholders and represents the bulk of net assets. Undistributed Net Investment Income and Accumulated Net Realized Gains usually approximate the amounts the fund had available to distribute to shareholders as of the statement date. Accumulated Realized Losses will appear as negative balances. Unrealized Appreciation (Depreciation) is the difference between the market value of the fund’s investments and their cost, and reflects the gains (losses) that would be realized if the fund were to sell all of its investments at their statement-date -values.
STATEMENT OF OPERATIONS
The Statement of Operations summarizes the fund’s investment income earned and expenses incurred in operating the fund. Investment income includes dividends earned from stocks and interest earned from interest-bearing securities in the fund. Expenses incurred in operating the fund include the advisory fee paid to the investment advisor, administrative services fees, distribution plan expenses (if applicable), transfer agent fees, shareholder servicing expenses, custodial, legal, and audit fees, and the printing and postage expenses related to shareholder reports. Expense offsets (fees paid indirectly) may also be shown. Credits earned from offset arrangements are used to reduce the fund’s expenses. This statement also shows net gains (losses) realized on the sale of investments and the increase or decrease in the unrealized appreciation (depreciation) on investments held during the period.
www.calvert.com CALVERT INTERNATIONAL OPPORTUNITIES FUND SEMI-ANNUAL REPORT (UNAUDITED) 33
STATEMENT OF CHANGES IN NET ASSETS
The Statement of Changes in Net Assets shows how the fund’s total net assets changed during the two most recent reporting periods. Changes in the fund’s net assets are attributable to investment operations, distributions and capital share transactions.
The Operations section of the report summarizes information detailed in the Statement of Operations. The Distribution section shows the dividend and capital gain distributions made to shareholders. The amounts shown as distributions in this section may not match the net investment income and realized gains amounts shown in the Operations section because distributions are determined on a tax basis and certain investments or transactions may be treated differently for financial statement and tax purposes. The Capital Share Transactions section shows the amount shareholders invested in the fund, either by purchasing shares or by reinvesting distributions, and the amounts redeemed. The corresponding numbers of shares issued, reinvested and redeemed are shown at the end of the report.
FINANCIAL HIGHLIGHTS
The Financial Highlights table provides a per-share breakdown per class of the components that affect the fund’s net asset value for current and past reporting periods. The table provides total return, total distributions, expense ratios, portfolio turnover and net assets for the applicable period. Total return is a measure of a fund’s performance that encompasses all elements of return: dividends, capital gain distributions and changes in net asset value. Total return is the change in value of an investment over a given period, assuming reinvestment of any dividends and capital gain distributions, expressed as a percentage of the initial investment. Total distributions include distributions from net investment income and net realized gains. Long-term gains are earned on securities held in the fund more than one year. Short-term gains, on the sale of securities held less than one year, are treated as ordinary dividend income for tax purposes. The expense ratio is a fund’s cost of doing business, expressed as a percentage of net assets. These expenses directly reduce returns to shareholders. Portfolio turnover measures the trading activity in a fund’s investment portfolio—how often securities are bought and sold by a fund. Portfolio turnover is affected by market conditions, changes in the size of the fund, the nature of the fund’s investments and the investment style of the portfolio manager.
PROXY VOTING
The Proxy Voting Guidelines of the Calvert Funds that the Fund uses to determine how to vote proxies relating to portfolio securities are provided as an Appendix to the Fund’s Statement of Additional Information. The Statement of Additional Information can be obtained free of charge by calling the Fund at 1-800-368-2745, by visiting the Calvert website at www.calvert.com; or by visiting the SEC’s website at www.sec.gov.
Information regarding how the Fund voted proxies relating to portfolio securities during the most recent 12-month period ended June 30 is available on the Fund’s website at www.calvert.com and on the SEC’s website at www.sec.gov.
AVAILABILITY OF QUARTERLY PORTFOLIO HOLDINGS
The Fund files its complete schedule of portfolio holdings with the SEC for the first and third quarters of each fiscal year on Form N-Q. The Fund’s Form N-Q is available on the SEC’s website at www.sec.gov. The Fund’s Form N-Q may be reviewed and copied at the SEC’s Public Reference Room in Washington, DC; information on the operation of the Public Reference Room may be obtained by calling 1-800-SEC-0330.
34 www.calvert.com CALVERT INTERNATIONAL OPPORTUNITIES FUND SEMI-ANNUAL REPORT (UNAUDITED)
BASIS FOR BOARD’S APPROVAL OF INVESTMENT ADVISORY CONTRACTS
At a meeting held on December 9, 2014, the Board of Directors, and by a separate vote, the disinterested Directors, approved the continuance of the Investment Advisory Agreement between Calvert World Values Fund, Inc. and the Advisor and the Investment Subadvisory Agreement between the Advisor and each Subadvisor.
In evaluating the Investment Advisory Agreement, the Board considered a variety of information relating to the Fund and the Advisor. The disinterested Directors reviewed a report prepared by the Advisor regarding various services provided to the Fund by the Advisor and its affiliates. Such report included, among other data, information regarding the Advisor’s personnel and the Advisor’s revenue and cost of providing services to the Fund, and a separate report prepared by an independent third party, which provided a statistical analysis comparing the Fund 's investment performance, expenses, and fees to comparable mutual funds.
The disinterested Directors were separately represented by independent legal counsel with respect to their consideration of the reapproval of the Investment Advisory Agreement and each Investment Subadvisory Agreement with the applicable Subadvisor. Prior to voting, the disinterested Directors reviewed the proposed continuance of the Investment Advisory Agreement and each Investment Subadvisory Agreement with management and also met in private sessions with their counsel at which no representatives of management were present.
In the course of its deliberations regarding the Investment Advisory Agreement, the Board considered the following factors, among others: the nature, extent and quality of the services provided by the Advisor, including the personnel providing such services; the Advisor's financial condition; the level and method of computing the Fund's advisory fee; comparative performance, fee and expense information for the Fund; the profitability of the Calvert Family of Funds to the Advisor and its affiliates; the allocation of the Fund's brokerage, including the Advisor's process for monitoring "best execution"; the direct and indirect benefits, if any, derived by the Advisor and its affiliates from their relationship with the Fund; the effect of the Fund's growth and size on the Fund’s performance and expenses; the affiliated distributor's process for monitoring sales load breakpoints; the Advisor's compliance programs and policies; the Advisor's performance of substantially similar duties for other funds; and any possible conflicts of interest.
In considering the nature, extent and quality of the services provided by the Advisor under the Investment Advisory Agreement, the Board reviewed information provided by the Advisor relating to its operations and personnel, including, among other information, biographical information on the Advisor's supervisory and professional staff and descriptions of its organizational and management structure. The Board also took into account similar information provided periodically throughout the previous year by the Advisor as well as the Board’s familiarity with management through Board of Directors’ meetings, discussions and other reports. The Board also noted that it reviewed on a quarterly basis information regarding the Advisor’s compliance with applicable policies and procedures, including those related to personal investing. The Advisor's administrative capabilities, including its ability to supervise the other service providers for the Fund, were also considered. The Board also took into account the environmental, social, sustainability and governance research and analysis provided by the Advisor to the Fund. The Board observed that the scope of services provided by the Advisor generally had expanded over time as a result of regulatory, market and other changes. The Board took into consideration, among other factors, the effectiveness of the Fund’s and Advisor’s processes, policies and procedures and the Advisor’s personnel. The Board also took into account, among other items, periodic reports received from the Advisor
www.calvert.com CALVERT INTERNATIONAL OPPORTUNITIES FUND SEMI-ANNUAL REPORT (UNAUDITED) 35
over the past year concerning the Advisor’s ongoing review and enhancement of certain processes, policies and procedures of the Fund and the Advisor. The Board discussed the Advisor’s effectiveness in monitoring the performance of the Subadvisors and its timeliness in responding to performance issues. The Board concluded that it was satisfied with the nature, extent and quality of services provided to the Fund by the Advisor under the Investment Advisory Agreement.
In considering the Fund’s performance, the Board noted that it reviewed on a quarterly basis detailed information about the Fund’s performance results, portfolio composition and investment strategies. In addition, the Board took into account overall financial market conditions. The Board also reviewed various comparative data provided to it in connection with its consideration of the renewal of the Investment Advisory Agreement, including, among other information, a comparison of the Fund’s total return with its Lipper index and with that of other mutual funds deemed to be in its peer universe by an independent third party in its report. This comparison indicated that the Fund performed above the median of its peer universe for the one- and three-year periods ended June 30, 2014, and at the median of its peer universe for the five-year period ended June 30, 2014. The data also indicated that the Fund outperformed its Lipper index for the one- and three-year periods ended June 30, 2014, and underperformed its Lipper index for the five-year period ended June 30, 2014. Based upon its review, the Board concluded that the Fund’s performance was satisfactory relative to the performance of funds with similar investment objectives and to relevant indices.
In considering the Fund’s fees and expenses, the Board compared the Fund’s fees and total expense ratio with various comparative data for the funds in its peer group. Among other findings, the data indicated that the Fund’s advisory fee (after taking into account waivers and/or reimbursements) was below the median of its peer group and that total expenses (net of waivers and/or reimbursements) were above the median of its peer group. The Board noted that the allocation of advisory and administrative fees may vary among the Fund’s peer group. The Board also took into account the Advisor’s current undertaking to maintain expense limitations for the Fund and that the Advisor was reimbursing a portion of the Fund’s expenses. The Board also noted management’s discussion of the Fund’s expenses and certain factors that affected the level of such expenses, including the cost of providing the environmental, social, sustainability and governance research and analysis provided by the Advisor. Based upon its review, the Board concluded that the advisory fee was reasonable in view of the quality of services received by the Fund from the Advisor and the other factors considered.
The Board reviewed the Advisor’s profitability on a fund-by-fund basis. In reviewing the overall profitability of the advisory fee to the Fund’s Advisor, the Board also considered the fact that affiliates of the Advisor provided shareholder servicing, administrative and distribution services to the Fund for which they received compensation. The information considered by the Board included Calvert’s operating profit margin information both before and after tax expenses with respect to the services that the Advisor and its affiliates provided to the Calvert Family of Funds complex. The Board reviewed the profitability of the Advisor’s relationship with the Fund in terms of the total amount of annual advisory fees it received with respect to the Fund and whether the Advisor had the financial wherewithal to continue to provide services to the Fund. The Board also noted the Advisor’s current undertaking to maintain expense limitations for the Fund and that the Advisor was reimbursing a portion of the Fund’s expenses. The Board also considered that the Advisor derived benefits to its reputation and other indirect benefits from its relationship with the Fund. The Board also noted that the Advisor paid the subadvisory fees to the Subadvisors. Based upon its
36 www.calvert.com CALVERT INTERNATIONAL OPPORTUNITIES FUND SEMI-ANNUAL REPORT (UNAUDITED)
review, the Board concluded that the Advisor’s and its affiliates’ level of profitability from their relationship with the Fund was reasonable.
The Board considered the effect of the Fund’s current size and its potential growth on its performance and fees. The Board concluded that adding breakpoints to the advisory fee at specified asset levels would not be appropriate at this time given the Fund's current size. The Board noted that if the Fund’s assets increased over time, the Fund might realize other economies of scale if assets increased proportionally more than certain other expenses.
In reapproving the Investment Advisory Agreement, the Board, including the disinterested Directors, did not identify any single factor as controlling, and each Director may have attributed different weight to various factors.
In evaluating each of the Investment Subadvisory Agreements, the disinterested Directors reviewed information provided by the Subadvisors relating to their respective operations, personnel, investment philosophy, strategies and techniques. Among other information, the Subadvisors provided biographical information on portfolio management and other professional staff, performance information for themselves, and descriptions of their respective investment philosophies, strategies and techniques, organizational and management structures and brokerage policies and practices.
The Board reapproved the Investment Subadvisory Agreement between the Advisor and each of the Subadvisors based on a number of factors relating to each Subadvisor’s ability to perform under the respective Investment Subadvisory Agreement. In the course of its deliberations, the Board evaluated, among other factors: the nature, extent and the quality of the services provided by each Subadvisor; each Subadvisor's management style and long-term performance record; each Subadvisor's performance in employing its investment strategies; each Subadvisor's current level of staffing and its overall resources; the qualifications and experience of each Subadvisor's personnel; each Subadvisor's financial condition with respect to its ability to perform the services required under the respective Investment Subadvisory Agreement; each Subadvisor’s risk management processes; each Subadvisor's compliance systems, including those related to personal investing; and any disciplinary history. Based upon its review, the Board concluded that it was satisfied with the nature, extent and quality of services provided to the Fund by each Subadvisor under the respective Investment Subadvisory Agreement.
As noted above, the Board considered, among other information, the Fund’s performance during the one-, three- and five-year periods ended June 30, 2014 as compared to the Fund’s peer universe and noted that it reviewed on a quarterly basis detailed information about the Fund’s performance results, portfolio composition and investment strategies. The Board noted the Advisor’s expertise and resources in monitoring the performance, investment style and risk- adjusted performance of the Subadvisors.
In considering the cost of services provided by each Subadvisor and the profitability to each Subadvisor of its relationship with the Fund, the Board noted that the subadvisory fees under each Investment Subadvisory Agreement was paid by the Advisor out of the advisory fee that the Advisor received under the Investment Advisory Agreement. The Board also relied on the ability of the Advisor to negotiate each Investment Subadvisory Agreement and the corresponding subadvisory fee at arm’s length. The Board took into consideration the fees each Subadvisor charges to other clients and considered these fee comparisons in light of the differences in managing these other accounts. Based upon its review, the Board determined that the subadvisory fees were reasonable in view of the quality of the services received by the Fund from the Subadvisors. Because the Advisor pays the Subadvisors’ subadvisory fees and
www.calvert.com CALVERT INTERNATIONAL OPPORTUNITIES FUND SEMI-ANNUAL REPORT (UNAUDITED) 37
the subadvisory fees were negotiated at arm’s length by the Advisor, the cost of services provided by the Subadvisors and the profitability to the Subadvisors of their relationships with the Fund were not material factors in the Board’s deliberations. For similar reasons, the Board did not consider the potential economies of scale in each Subadvisor’s management of the Fund to be a material factor in its consideration, although the Board noted that each Subadvisor’s subadvisory fee schedule for the Fund contained breakpoints that reduced the subadvisory fee rate on assets above specified levels.
In reapproving each Investment Subadvisory Agreement, the Board, including the disinterested Directors, did not identify any single factor as controlling, and each Director may have attributed different weight to various factors.
Conclusions
The Board reached the following conclusions regarding the Investment Advisory Agreement and each Investment Subadvisory Agreement, among others: (a) the Advisor has demonstrated that it possesses the capability and resources to perform the duties required of it under the Investment Advisory Agreement; (b) each Subadvisor is qualified to manage the Fund’s assets in accordance with the Fund’s investment objectives and policies; (c) the Advisor and each Subadvisor maintain appropriate compliance programs; (d) each Subadvisor is likely to execute its investment strategies consistently over time; (e) the Fund’s overall performance is satisfactory relative to the performance of funds with similar investment objectives and to relevant indices; and (f) the Fund 's advisory and subadvisory fees are reasonable in view of the services received by the Fund from the Advisor and Subadvisors. Based on its conclusions, the Board determined that reapproval of the Investment Advisory Agreement and each Investment Subadvisory Agreement would be in the best interests of the Fund and its shareholders.
38 www.calvert.com CALVERT INTERNATIONAL OPPORTUNITIES FUND SEMI-ANNUAL REPORT (UNAUDITED)
To Open an Account
800-368-2748
Service for Existing Account
Shareholders: 800-368-2745
Brokers: 800-368-2746
TDD for Hearing Impaired
800-541-1524
Registered Mail
Calvert Investments
c/o BFDS,
P.O. Box 219544
Kansas City, MO 64121-9544
Overnight Mail
Calvert Investments
c/o BFDS,
330 West 9th Street
Kansas City, MO 64105
Web Site
www.calvert.com
Principal Underwriter
Calvert Investment Distributors, Inc.
4550 Montgomery Avenue
Suite 1000 North
Bethesda, Maryland 20814
|
| | | |
CALVERT INTERNATIONAL OPPORTUNITIES FUND | CALVERT’S FAMILY OF FUNDS | | |
| | Municipal Funds Tax-Free Bond Fund Taxable Bond Funds Bond Portfolio Income Fund Short Duration Income Fund Long-Term Income Fund Ultra-Short Income Fund High Yield Bond Fund Green Bond Fund Unconstrained Bond Fund Balanced and Asset Allocation Funds Balanced Portfolio Conservative Allocation Fund Moderate Allocation Fund Aggressive Allocation Fund
| | Equity Funds Large Cap Core Portfolio Equity Portfolio Large Cap Value Fund Social Index Fund Capital Accumulation Fund International Equity Fund Small Cap Fund Global Energy Solutions Fund Global Water Fund International Opportunities Fund Equity Income Fund Emerging Markets Equity Fund |
| | |
This report is intended to provide fund information to shareholders. It is not authorized for distribution to prospective investors unless preceded or accompanied by a prospectus.
Note: The information on our website is not incorporated by reference into this report; our website address is included as an inactive textual reference only.
Investors should carefully consider the investment objectives, risks, charges and expenses of the Calvert Funds. This and other important information is contained in the fund’s summary prospectus and prospectus, which can be obtained from your financial professional and should be read carefully before investing. You may also call Calvert at 800/368-2748 or visit www. calvert.com.
Printed on recycled paper using soy inks.
|
| | |
| | |
| | | |
| Calvert Emerging Markets Equity Fund | | |
| | | |
| | |
|
| |
Semi-Annual Report March 31, 2015
E-Delivery Sign-Up — Details Inside | |
Choose Planet-friendly E-delivery!
Sign up now for on-line statements, prospectuses, and fund reports. In less than five minutes you can help reduce paper mail and lower fund costs.
Just go to www.calvert.com. If you already have an online account at Calvert, click on Login, to access your Account, and select the documents you would like to receive via e-mail.
If you’re new to online account access, click on Login, then Register to create your user name and password. Once you’re in, click on the E-delivery sign-up on the Account Portfolio page and follow the quick, easy steps.
Note: if your shares are not held directly at Calvert but through a brokerage firm, you must contact your broker for electronic delivery options available through their firm.
|
| | | |
| TABLE OF CONTENTS |
| | | | |
| | | | President's Letter |
| | | | Portfolio Management Discussion |
| | | | Shareholder Advocacy Update |
| | | | Shareholder Expense Example |
| | | | Schedule of Investments |
| | | | Statement of Assets and Liabilities |
| | | | Statement of Operations |
| | | | Statements of Changes in Net Assets |
| | | | Notes to Financial Statements |
| | | | Financial Highlights |
| | | | Explanation of Financial Tables |
| | | | Proxy Voting |
| | | | Availability of Quarterly Portfolio Holdings |
| | | | Basis for Board’s Approval of Investment Advisory Contracts |
|
| |
| John Streur President and Chief Executive Officer, Calvert Investments, Inc. |
Dear Calvert Shareowner,
The United States economy improved throughout 2014 and into the first quarter of 2015, while major economies in other regions of the world struggled to regain momentum or saw slowing growth. It is still too early to declare victory, but one may say that while the United States led the world into financial crisis nearly eight years ago, the innovative and aggressive responses to the crisis by our policymakers are allowing the United States to recover more quickly. Granted, the United States has the benefit of possessing the world’s reserve currency and our monetary maneuvers in our self-interest are not without cost to economies in other regions.
As 2014 drew to a close, the United States was winding down the quantitative easing portion of its post-crisis monetary policy while the European and Japanese central banks were finding it necessary to increase their own forms of quantitative easing in efforts to support asset prices and spur economic growth.
The impact of modestly improving economic activity in the U.S. and ongoing low global interest rates on financial assets in 2014 created positive returns for most stocks and bonds for the previous 12 months, a condition that gave benefit to most Calvert Funds. The exceptions are assets tied to the price of oil, which collapsed during the second half of the year. Energy industries and natural resource based companies, including renewable energy companies and water related companies, saw their stock valuations drop in reaction.
Across our fixed income and equity strategies, Calvert finds more utility in conducting fundamental research in order to find relative values in securities of individual companies than we do in attempting to anticipate or time changes in global economic indicators. Broadly, we are mindful of the fact that stocks and bonds have benefitted substantially from the easy monetary policies and ultra-low interest rates of the post-crisis era. We believe markets are more or less fairly valued and we have taken steps seeking to moderate the risk across our portfolios.
As I take the helm at Calvert and look back at the 39 years since the firm’s founding in 1976, I note the substantial growth in the world’s population, the massive increase in the industrialization of our global society, and the associated change in the role of corporations in societal and environmental outcomes for our future.
4 www.calvert.com CALVERT EMERGING MARKETS EQUITY FUND SEMI-ANNUAL REPORT (UNAUDITED)
Public companies have created tremendous net benefits to society through advances in health care, food systems, energy efficiency, communications and technology, and access to finance and other products and services too vast to detail. Hundreds of millions of people throughout the world have seen their standard of living increased through benefits created by corporate activity.
Along with the obvious net benefits to society, we are aware of the substantial stresses placed upon society and the environment from corporate behaviors. At the same time, society has awarded corporations an increasingly prominent role in the day-to-day outcomes of our lives and in the societal and environmental outcomes that will determine the future direction of the world.
Calvert, as a global investment management firm and a steward of client assets, has a growing and evolving role as a leader in responsible investing. Calvert has a rich history as a socially responsible investor and has made many contributions to public policy and corporate governance. Today we are bringing Calvert’s deep expertise in socially responsible investing, public and private policy work, and investment management to a new level with a focus on developing principles and setting standards for use in our investment management processes, our active ownership and engagement discipline and within our investment risk management processes.
As a long-term investor with unique insights into environmental, social, and governance activities of companies throughout the world, Calvert is able to develop a holistic view of companies’ operations. Our ability to use our insights for the benefit of the stewardship of client assets, both to produce desirable investment outcomes for our clients and to assist companies in evolving their role in society along a responsible path has never been more important.
As fellow shareowners of Calvert Funds, you and I know that it is essential to pursue the type of enduring value that Calvert seeks to create, through excellence in financial results balanced with the evolving needs of society and the environment.
Thank you for your share ownership in Calvert Funds; all of us at Calvert Investments, Inc. appreciate the confidence and trust you have placed in us.
John Streur
April 2015
www.calvert.com CALVERT EMERGING MARKETS EQUITY FUND SEMI-ANNUAL REPORT (UNAUDITED) 5
|
| |
| PORTFOLIO MANAGEMENT DISCUSSION |
|
| |
| Natalie A. Trunow Senior Vice President and Chief Investment Officer, Equities |
Equity market returns over the six-month reporting period largely reflected macroeconomic trends, with solid gains for U.S. stocks relative to international equity markets. Improving economic conditions in the United States remained in stark contrast to the sluggish growth outlook in much of the rest of the world, particularly in Europe. However, U.S. equity markets faced several headwinds at the start of 2015 as another harsh winter weighed on economic activity and the stronger dollar contributed to negative earnings revisions for companies deriving larger portions of their earnings from overseas. International equity markets underperformed for the period, but recouped some of their losses in the first quarter of 2015 as central banks in Europe and Japan maintained quantitative-easing programs and emerging markets were buoyed by stimulus announcements from China.
For the six-month period ended March 31, 2015, the Standard and Poor’s (S&P) 500, Russell 1000, Russell 2000, MSCI EAFE, and MSCI Emerging Markets Indices returned 5.93%, 6.55%, 14.46%, 1.29%, and -2.26%, respectively.
From an investment-style perspective, growth stocks outperformed value stocks, and domestic small-cap stocks, which have less exposure to foreign markets and are less dependent on global growth, outperformed their large-cap counterparts. Looking at sector performance, Health Care, Consumer Discretionary, and Consumer Staples were the top-performing sectors within the Russell 1000 Index during the period, while the Energy, Telecommunication Services, and Materials sectors lagged.
U.S. Economic Recovery Hits Soft Patch, but Outpaces Rest of Developed World
The U.S. economy continued to outperform other developed countries, with U.S. gross domestic product (GDP) growing at a 2.2% annualized rate in the fourth quarter of 2014. More recent U.S. macroeconomic data has been weaker, however, with the slowdown largely attributed to poor weather and the strength of the dollar. A labor dispute between West Coast ports and dockworkers also resulted in a modest drag on economic activity. The U.S. ISM Manufacturing Purchasing Manufacturers Index (PMI)1 ended the period at 51.5, firmly in expansion territory, but has declined for five consecutive months. Housing activity, while remaining on an upward trend, has been disappointing of late.
Although the most recent jobs report for March was less than stellar, the job market has continued to improve, adding an average of 260,000 jobs per month over the last year. This helped push the unemployment rate down to 5.5% from 6.6% this time a year ago, though this has been aided by a drop in the labor-force participation rate. Wage growth is taking longer to materialize than in past recoveries, but recent data has been encouraging, showing modest gains in average hourly earnings and the Employment Cost Index.
6 www.calvert.com CALVERT EMERGING MARKETS EQUITY FUND SEMI-ANNUAL REPORT (UNAUDITED)
|
| | | | |
| | | | |
| | CALVERT EMERGING MARKETS EQUITY FUND |
| | MARCH 31, 2015 | |
| | | | |
| | ECONOMIC SECTORS | % OF TOTAL INVESTMENTS | |
| | Consumer Discretionary | 17.8 | % | |
| | Consumer Staples | 10.9 | % | |
| | Exchange Traded Products | 4.9 | % | |
| | Financials | 27.0 | % | |
| | Health Care | 3.0 | % | |
| | Industrials | 4.5 | % | |
| | Information Technology | 21.0 | % | |
| | Materials | 1.8 | % | |
| | Closed-End Funds | 5.3 | % | |
| | Telecommunication Services | 1.0 | % | |
| | Utilities | 2.8 | % | |
| | Total | 100 | % | |
| | | | |
Consumer confidence reached a nine-year high during the reporting period, due in part to lower gasoline prices, which should lead to a pick-up in consumer spending and housing activity over the remainder of the year.
Decline in Oil Prices a Positive for U.S. Economy Overall
The price of crude oil fell nearly 50% over the six-month reporting period. Weakening demand due to slowing global growth and a strategic decision by Saudi Arabia, the world’s largest oil producer, to not cut oil production in the face of increased U.S. supplies, were key drivers of the dramatic price decline.
Some economies and sectors stand to benefit from the significant price decline in oil while others will undoubtedly continue to come under pressure. Countries which import a large portion of their energy are the clear winners, with the United States, Europe, Japan, and China benefiting. Within the U.S., states such as North Dakota and Texas will be hurt by lower oil prices; however energy capital expenditure
|
| | | | | | |
| | | | | |
| | CALVERT EMERGING MARKETS EQUITY FUND | |
| | MARCH 31, 2015 | |
| | | | | |
| | INVESTMENT PERFORMANCE | |
| | (TOTAL RETURN AT NAV*) | |
| | | 6 MONTHS ENDED 3/31/15 | 12 MONTHS ENDED 3/31/15
| |
| | Class A | 1.88 | % | 4.83 | % | |
| | Class C | 1.41 | % | 3.80 | % | |
| | Class I | 2.06 | % | 5.23 | % | |
| | Class Y | 2.01 | % | 5.08 | % | |
| | | | | |
| | MSCI Emerging Markets Index | -2.26 | % | 0.79 | % | |
| | | | | |
| | Lipper Emerging Markets Funds Average | -4.32 | % | -1.61 | % | |
| | | | | |
| | TEN LARGEST STOCK HOLDINGS | % OF NET ASSETS | |
| | Tencent Holdings Ltd. | 5.5 | % | |
| | Taiwan Semiconductor Manufacturing Co. Ltd. (ADR) | 4.7 | % | |
| | China Mengniu Dairy Company Ltd. | 4.6 | % | |
| | HDFC Bank Ltd. (ADR) | 4.1 | % | |
| | Techtronic Industries Co. Ltd. | 3.9 | % | |
| | Shenzhen International Holdings Ltd. | 3.5 | % | |
| | Shoprite Holdings Ltd. | 3.4 | % | |
| | Bank Rakyat Indonesia Persero Tbk PT | 3.4 | % | |
| | Samsonite International SA | 3.3 | % | |
| | Bangkok Bank PCL | 3.2 | % | |
| | Total | 39.6 | % | |
| | | |
| | * Investment performance/return at NAV does not reflect the deduction of the Fund’s maximum 4.75% front-end sales charge or any deferred sales charge. | |
| | | | | |
(CapEx) represents less than 2% of GDP and we believe the overall impact of lower energy prices is positive for the U.S. economy as a whole due to the significant
www.calvert.com CALVERT EMERGING MARKETS EQUITY FUND SEMI-ANNUAL REPORT (UNAUDITED) 7
cost savings its creates in a majority of sectors and the multiplier effect it has throughout the economy.
Global Easing Continues Amid Low Inflation and Stronger Dollar
The U.S. dollar strengthened throughout the period, hitting a 7-year high vs. the Japanese Yen and a 12-year high against the euro. Since most commodities are priced globally in U.S. dollars, a stronger dollar relative to foreign currencies typically correlates with lower commodity prices, which has kept a lid on inflation.
More than half the central banks in the G20 economies implemented some type of monetary easing policy during the period, which provided additional support for global equities. Most notably, the Bank of Japan announced a massive stimulus policy and the European Central Bank (ECB) followed with a strong quantitative easing (QE) program of its own.
Interest Rate Hikes by the Fed on the Horizon
With the U.S. economy improving, both market sentiment and Federal Reserve officials seem divided on the optimal timing of the Fed’s interest-rate increases. However, consistently low inflation and recent softness in U.S. macroeconomic data—as well as the rapid increase in the dollar’s strength, which has hurt U.S. exports and the manufacturing sector—makes it more likely that the Fed will delay raising rates until later in the year or possibly even next year.
Eurozone Economic Struggles Continue but QE Offers Some Respite
Economic conditions continued to deteriorate in the eurozone through the end of 2014 as inflation turned negative, prompting the ECB to launch its massive QE program. The program has been successful thus far in decreasing the value of the euro in an attempt to stimulate exports and eurozone economies. Manufacturing PMIs, credit demand, and consumer confidence all have been showing signs of modest improvement, indicating a
|
| | | | |
| | | | |
| | CALVERT EMERGING MARKETS EQUITY FUND | |
| | MARCH 31, 2015 | |
| | | | |
| | AVERAGE ANNUAL TOTAL RETURNS | |
| | | | |
| | CLASS A SHARES | (WITH MAX. LOAD) | |
| | One year | -0.17 | % | |
| | Since inception 10/29/2012 | 5.39 | % | |
| | | | |
| | CLASS C SHARES | (WITH MAX. LOAD) | |
| | One year | 2.80 | % | |
| | Since inception 10/29/2012 | 6.50 | % | |
| | | | |
| | CLASS I SHARES | | |
| | One year | 5.23 | % | |
| | Since inception 10/29/2012 | 7.94 | % | |
| | | | |
| | CLASS Y SHARES | | |
| | One year | 5.08 | % | |
| | Since inception 10/29/2012 | 7.82 | % | |
| | | | |
potential positive effect from QE as well as a potential bottoming out of eurozone economic malaise. Despite these marginally positive developments, we are skeptical that central bankers’ efforts will meaningfully reinvigorate those economies unless accompanied by structural economic reforms. Possible risks from Greece exiting the eurozone and political turmoil emerging in other euro-area countries also remain a lingering concern and may re-surface later in the year.
Stimulus Measures Boost Chinese Stocks but Economic Challenges Remain
Despite Manufacturing PMI weakening throughout the period, Chinese equities rallied on the back of several stimulus measures and investor expectations that the government would continue stimulus measures to offset slowing, though still robust, economic growth. China is also benefiting from cheaper oil, which essentially acts as another form of stimulus. The Services PMI held up better than expected, indicating some very modest progress in transitioning away from an
8 www.calvert.com CALVERT EMERGING MARKETS EQUITY FUND SEMI-ANNUAL REPORT (UNAUDITED)
Growth of $10,000
The graph below shows the value of a hypothetical $10,000 investment in the Fund over the past 10 fiscal year periods or since inception (for funds without 10-year records). The results shown are for Class A, C, I and Y shares and reflect the deduction of the maximum front-end Class A sales charge of 4.75%, and assume the reinvestment of dividends. The result is compared with benchmarks that include a broad based market index and a Lipper peer group average. Market indexes are unmanaged and their results do not reflect the effect of expenses or sales charges. The Lipper average reflects the deduction of the category’s average front-end sales charge.
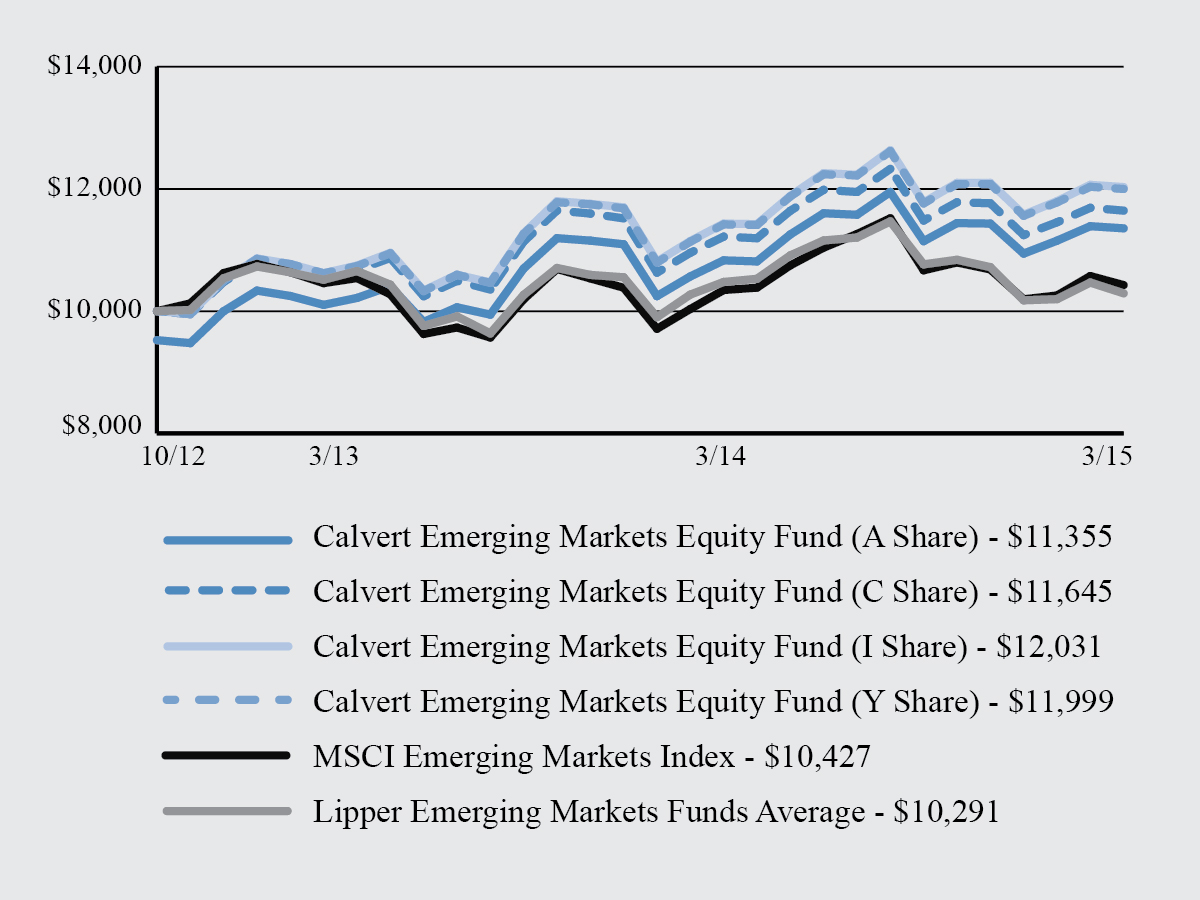
All performance data shown, including the graph above and the adjacent table, represents past performance, does not guarantee future results, assumes reinvestment of dividends and distributions and does not reflect the deduction of taxes that a shareholder would pay on the Fund’s distributions or the redemption of the Fund shares. All performance data reflects fee waivers and/or expense limitations, if any are in effect; in their absence performance would be lower. See Note B in Notes to Financial Statements. The investment return and principal value of an investment will fluctuate so that an investor’s shares, when redeemed, may be worth more or less than their original cost. Current performance may be lower or higher than the performance data quoted; for current performance data visit www.calvert.com. The gross expense ratio from the current prospectus for Class A shares is 2.22%. This number may differ from the expense ratio shown elsewhere in this report because it is based on a different time period and, if applicable, does not include fee or expense waivers. Performance data quoted already reflects the deduction of the Fund’s operating expenses.
www.calvert.com CALVERT EMERGING MARKETS EQUITY FUND SEMI-ANNUAL REPORT (UNAUDITED) 9
investment-driven economy to a more consumer-oriented one. However, structural improvements in social welfare programs, such as health care and retirement planning, will be needed in order to encourage Chinese consumers to spend more and bring down their notoriously high savings rate. Given these challenges, as well as ongoing concerns regarding a potential property-bubble burst, stimulus does not mean the Chinese economy is out of the woods. A hard economic landing remains a possibility down the road.
Outlook
While we may see some continued softness in U.S. macroeconomic data during the first half of the year, we believe U.S. economic growth will continue to exceed growth from other developed countries and we remain positive on the U.S. economy longer-term. We believe the significant positive multiplier effect from lower gas prices hasn’t yet been fully reflected in U.S. economic data, and we are likely to see the additional positive impact in the coming quarters.
In our view, U.S. stocks can still post decent performance, but probably not as good as what we saw in the past couple of years because of higher valuations, slower earnings growth, and potentially having reached peak margins. The stronger dollar, combined with lower commodity prices, tends to benefit consumers and hurt industrial companies, especially those with heavy sales outside the United States, or those directly involved in the energy sector. This is one reason why we continue to favor small-cap stocks on the domestic front.
With lower commodity prices, a stronger dollar, and little wage growth, inflation in the United States will likely remain low for some time to come, while deflationary threats are very real in other parts of the world. This may lead the Federal Reserve to raise interest rates less quickly than currently expected, since challenging global economic conditions can have a significant impact on the U.S. economy. Our position remains that when the Fed does decide to raise rates, the tightening process will be slow and gradual, with the Fed keeping a close eye on interest-rate volatility and its impact on mortgage rates. Even with a gradual tightening, monetary policy should still remain accommodative for an extended period of time. That said, we expect market volatility to increase as we grow closer to the inevitability of higher interest rates.
Calvert Investment Management, Inc.
April 2015
1. The Institute for Supply Management (ISM) Manufacturing PMI is published monthly and shows business conditions in the U.S. manufacturing sector, and is considered a significant indicator of overall economic conditions. The ISM index includes prices paid for all purchases including import purchases and purchases of food and energy, excluding crude oil. A result above 50 indicates that the manufacturing economy is generally expanding; below 50 indicates that it is generally declining.
10 www.calvert.com CALVERT EMERGING MARKETS EQUITY FUND SEMI-ANNUAL REPORT (UNAUDITED)
SHAREHOLDER ADVOCACY UPDATE
2014 Corporate Diversity Report Findings Released
In March, Calvert published its 2014 survey findings on the corporate diversity practices of the largely multinational companies that make up the Standard & Poor’s 100 Index (S&P 100), in follow-up to reports published in 2012 and 2010. Calvert believes companies that fully commit to providing a fair and equitable working environment will recognize gains in both the workplace and marketplace.
Key findings from the 2014 survey include:
| |
| • | Milestone for women in the board room. In 2014, every company in the S&P 100 had at least one woman on its board of directors. In addition, there was a 17% increase in companies with three or more women and/or minorities on their boards. |
| |
| • | Diversity commitment on the rise. In the past two years, top scores related to overall corporate commitment have increased by 45%.This stems primarily from greater board oversight of diversity initiatives and increased CEO and/or chair involvement. |
| |
| • | LGBT policies have advanced overall. However, initiatives for persons with disabilities continue to fall behind other groups. |
Overall, in 2014, we saw growing commitment to women and minority employees, momentum around family-friendly work environments, and accelerated progress in support of LGBT employees. Looking ahead, we hope to see enhanced corporate diversity commitments, greater representation of women and minorities on boards, improved EEO1-disclosure, and expanded diversity initiatives for persons with disabilities.
To learn the highest- and lowest-rated companies in the report, A Survey of Corporate Diversity Practices of the S&P 100, and to find out more about the report’s methodology and findings, visit www.calvert.com.
2015 Shareholder Resolutions
Building on our initiatives from 2014, Calvert was the lead filer on 38 shareholder resolutions for the 2015 proxy season, and co-filer on another 18 proposals. Key topics include “big data” and civil rights issues, sustainability reporting, board of director oversight of environmental and social matters, water risk, climate change and greenhouse gas emissions reductions, supply chain labor issues, and board diversity.
Specifically, Calvert asked 14 companies to set a goal and a timeline for reducing their greenhouse gas emissions and filed seven proposals asking companies to issue a sustainability report describing their environmental, social and governance (ESG) performance and goals. To push for improved boardroom diversity, Calvert filed six proposals with companies requesting they report on their plans to increase minority and women Board representation and assess the effectiveness of these efforts. We also filed seven proposals requesting that companies assess and manage the civil rights’ risks related to their use of big data, which refers to data sets so large or complex that traditional data processing applications are inadequate. We also filed proposals on water risk in the agricultural supply chain and on developing a sustainable agriculture policy.
To keep abreast of the outcomes of these 2015 shareholder resolutions, as well as Calvert’s proxy voting and public policy initiatives, visit the “Resources” section on www.calvert.com.
www.calvert.com CALVERT EMERGING MARKETS EQUITY FUND SEMI-ANNUAL REPORT (UNAUDITED) 11
SHAREHOLDER EXPENSE EXAMPLE
As a shareholder of the Fund, you incur two types of costs: (1) transaction costs, including sales charges (loads) and redemption fees; and (2) ongoing costs, including management fees; distribution (12b-1) fees; and other Fund expenses. This Example is intended to help you understand your ongoing costs (in dollars) of investing in the Fund and to compare these costs with the ongoing costs of investing in other mutual funds.
This Example is based on an investment of $1,000 invested at the beginning of the period and held for the entire period (October 1, 2014 to March 31, 2015).
Actual Expenses
The first line of the table below provides information about actual account values and actual expenses. You may use the information in this line, together with the amount you invested, to estimate the expenses that you paid over the period. Simply divide your account value by $1,000 (for example, an $8,600 account value divided by $1,000 = 8.6), then multiply the result by the number in the first line under the heading entitled “Expenses Paid During Period” to estimate the expenses you paid on your account during this period.
Hypothetical Example for Comparison Purposes
The second line of the table below provides information about hypothetical account values and hypothetical expenses based on the Fund’s actual expense ratio and an assumed rate of return of 5% per year before expenses, which is not the Fund’s actual return. The hypothetical account values and expenses may not be used to estimate the actual ending account balance or expenses you paid for the period. You may use this information to compare the ongoing costs of investing in the Fund and other funds. To do so, compare the 5% hypothetical example with the 5% hypothetical examples that appear in the shareholder reports of the other funds.
Please note that the expenses shown in the table are meant to highlight your ongoing costs only and do not reflect any transactional costs, such as sales charges (loads), or redemption fees. Therefore, the second line of the table is useful in comparing ongoing costs only, and will not help you determine the relative total costs of owning different funds. In addition, if these transactional costs were included, your costs would have been higher.
12 www.calvert.com CALVERT EMERGING MARKETS EQUITY FUND SEMI-ANNUAL REPORT (UNAUDITED)
|
| | | |
| | BEGINNING ACCOUNT VALUE 10/1/14 | ENDING ACCOUNT VALUE 3/31/15 | EXPENSES PAID DURING PERIOD* 10/1/14 - 3/31/15 |
CLASS A | | | |
| Actual | $1,000.00 | $1,018.83 | $8.96 |
| Hypothetical | $1,000.00 | $1,016.06 | $8.95 |
| (5% return per year before expenses) | | | |
| | | | |
CLASS C | | | |
| Actual | $1,000.00 | $1,014.12 | $13.96 |
| Hypothetical | $1,000.00 | $1,011.07 | $13.94 |
| (5% return per year before expenses) | | | |
| | | | |
CLASS I | | | |
| Actual | $1,000.00 | $1,021.36 | $7.21 |
| Hypothetical | $1,000.00 | $1,017.80 | $7.19 |
| (5% return per year before expenses) | | | |
| | | | |
CLASS Y | | | |
| Actual | $1,000.00 | $1,020.08 | $7.71 |
| Hypothetical | $1,000.00 | $1,017.30 | $7.70 |
| (5% return per year before expenses) | | | |
| | | | |
* Expenses are equal to the Fund’s annualized expense ratio of 1.78%, 2.78%, 1.43%, and 1.53% for Class A, Class C , Class I, and Class Y, respectively, multiplied by the average account value over the period, multiplied by 182/365 (to reflect the one-half year period).
|
www.calvert.com CALVERT EMERGING MARKETS EQUITY FUND SEMI-ANNUAL REPORT (UNAUDITED) 13
SCHEDULE OF INVESTMENTS
MARCH 31, 2015
|
| | | |
EQUITY SECURITIES - 79.9% | SHARES | VALUE |
| Austria - 1.2% | | |
| Vienna Insurance Group AG Wiener Versicherung Gruppe | 19,309 |
| $854,352 |
| | | |
| Brazil - 5.1% | | |
| Cosan Ltd. | 195,666 |
| 1,238,566 |
| Grendene SA | 60,000 |
| 308,035 |
| Itau Unibanco Holding SA, Preferred | 189,557 |
| 2,101,692 |
| | | 3,648,293 |
| | | |
| China - 13.9% | | |
| Alibaba Group Holding Ltd. (ADR)* | 20,164 |
| 1,678,451 |
| China Child Care Corp Ltd. | 1,865,000 |
| 356,285 |
| China Dongxiang Group Co. Ltd. | 4,012,000 |
| 724,349 |
| Ping An Insurance Group Company of China Ltd. | 66,000 |
| 795,900 |
| Shenzhen International Holdings Ltd. | 1,623,904 |
| 2,455,169 |
| Tencent Holdings Ltd. | 204,500 |
| 3,867,975 |
| | | 9,878,129 |
| | | |
| Egypt - 1.6% | | |
| Commercial International Bank Egypt SAE | 152,760 |
| 1,137,198 |
| | | |
| Hong Kong - 13.8% | | |
| China Mengniu Dairy Company Ltd. | 621,000 |
| 3,285,633 |
| Galaxy Entertainment Group Ltd. | 309,000 |
| 1,396,859 |
| Samsonite International SA* | 680,859 |
| 2,364,060 |
| Techtronic Industries Co. Ltd. | 817,500 |
| 2,763,537 |
| | | 9,810,089 |
| | | |
| India - 6.8% | | |
| Greenko Group plc* | 409,936 |
| 633,169 |
| HDFC Bank Ltd. (ADR) | 49,238 |
| 2,899,626 |
| ICICI Bank Ltd. (ADR) | 124,431 |
| 1,289,105 |
| | | 4,821,900 |
| | | |
| Indonesia - 4.4% | | |
| Bank Rakyat Indonesia Persero Tbk PT | 2,391,100 |
| 2,424,968 |
| Tower Bersama Infrastructure Tbk PT | 951,600 |
| 689,469 |
| | | 3,114,437 |
| | | |
| Russia - 3.3% | | |
| Mail.ru Group Ltd. (GDR)* | 59,027 |
| 1,162,494 |
| MMC Norilsk Nickel OJSC (ADR): | | |
| BATS Chi-X Europe | 61,728 |
| 1,090,728 |
| OTC US | 5,832 |
| 104,335 |
| | | 2,357,557 |
| | | |
| South Africa - 6.2% | | |
| Life Healthcare Group Holdings Ltd. | 566,860 |
| 1,975,937 |
| Shoprite Holdings Ltd. | 180,271 |
| 2,432,698 |
| | | 4,408,635 |
| | | |
14 www.calvert.com CALVERT EMERGING MARKETS EQUITY FUND SEMI-ANNUAL REPORT (UNAUDITED)
|
| | | |
EQUITY SECURITIES - CONT’D | SHARES | VALUE |
| | | |
| South Korea - 6.8% | | |
| Hyundai Motor Co. | 6,963 |
| $1,056,847 |
| KB Financial Group, Inc. | 61,647 |
| 2,176,963 |
| Samsung Fire & Marine Insurance Co. Ltd. | 6,477 |
| 1,561,335 |
| Youngone Holdings Co. Ltd. | 720 |
| 60,085 |
| | | 4,855,230 |
| | | |
| Taiwan - 11.8% | | |
| Phison Electronics Corp. | 202,982 |
| 1,681,448 |
| SiliConware Precision Industries Co. Ltd. (ADR) | 166,747 |
| 1,363,990 |
| Taiwan Semiconductor Manufacturing Co. Ltd. (ADR) | 141,663 |
| 3,326,247 |
| Tong Yang Industry Co. Ltd. | 1,702,138 |
| 1,988,401 |
| | | 8,360,086 |
| | | |
| Thailand - 3.2% | | |
| Bangkok Bank PCL | 397,675 |
| 2,252,038 |
| | | |
| Turkey - 1.8% | | |
| Aygaz AS | 340,600 |
| 1,242,543 |
| | | |
| Total Equity Securities (Cost $55,751,375) | | 56,740,487 |
| | | |
CLOSED-END FUNDS - 5.0% | | |
| India Fund, Inc. | 126,135 |
| 3,567,098 |
| | | |
| Total Closed-End Funds (Cost $3,402,911) | | 3,567,098 |
| | | |
EXCHANGE TRADED PRODUCTS - 4.6% | | |
| ChinaAMC CSI 300 Index ETF | 502,200 |
| 3,244,336 |
| | | |
| Total Exchange Traded Products (Cost $2,216,222) | | 3,244,336 |
| | | |
PARTICIPATORY NOTES - 4.7% | | |
| China - 2.4% | | |
| Daqin Railway Co. Ltd., Merrill Lynch International & Co., 7/6/18 (b)* | 1,104 |
| 1,971 |
| Gree Electric Appliances, Inc., Merrill Lynch International & Co., 8/31/18 (b)* | 101,265 |
| 717,366 |
| Hangzhou Hikvision Digital Technology Co., Ltd. Merrill Lynch International & Co., 4/9/19 (b)* | 200,940 |
| 994,742 |
| | | 1,714,079 |
| India - 0.8% | | |
| Motherson Sumi Systems Ltd., Merrill Lynch International & Co., 5/31/18 (b)* | 65,751 |
| 540,581 |
| | | |
| Saudi Arabia - 1.5% | | |
| Samba Financial Group, Morgan Stanley BV, 9/28/15, (b)* | 78,090 |
| 534,395 |
| Saudi Ceramic, Morgan Stanley BV, 7/18/16, (b)* | 19,049 |
| 524,583 |
| | | 1,058,978 |
| | | |
| Total Participatory Notes (Cost $2,733,222) | | 3,313,638 |
| | | |
www.calvert.com CALVERT EMERGING MARKETS EQUITY FUND SEMI-ANNUAL REPORT (UNAUDITED) 15
|
| | | |
| | | VALUE |
| | | |
| TOTAL INVESTMENTS (Cost $64,103,730) - 94.2% | | $66,865,559 |
| Other assets and liabilities, net - 5.8% | | 4,088,474 |
NET ASSETS - 100% | | $70,954,033 |
| | | |
(b) This security was valued under the direction of the Board of Directors. See Note A. * Non-income producing security. Abbreviations: ADR: American Depositary Receipts ETF: Exchange Traded Fund GDR: Global Depositary Receipts PCL: Public Company Limited plc: Public Limited Company See notes to financial statements. |
16 www.calvert.com CALVERT EMERGING MARKETS EQUITY FUND SEMI-ANNUAL REPORT (UNAUDITED)
STATEMENT OF ASSETS AND LIABILITIES
MARCH 31, 2015
|
| | | |
ASSETS | |
| Investments in securities, at value (Cost $64,103,730) - see accompanying schedule | $66,865,559 |
|
| Cash | 4,246,204 |
|
| Cash denominated in foreign currencies (Cost $2,875) | 2,887 |
|
| Receivable for securities sold | 25,219 |
|
| Receivable for shares sold | 503,682 |
|
| Interest and dividends receivable | 148,244 |
|
| Other assets | 53,868 |
|
| Total Assets | 71,845,663 |
|
| | |
LIABILITIES | |
| Payable for securities purchased | 703,136 |
|
| Payable for shares redeemed | 58,236 |
|
| Payable to Calvert Investment Management, Inc. | 46,945 |
|
| Payable to Calvert Investment Administrative Services, Inc. | 11,820 |
|
| Payable to Calvert Investment Services, Inc. | 675 |
|
| Payable to Calvert Investment Distributors, Inc. | 5,658 |
|
| Accrued expenses and other liabilities | 65,160 |
|
| Total Liabilities | 891,630 |
|
| | |
NET ASSETS | $70,954,033 |
|
| | |
NET ASSETS CONSIST OF: | |
| Paid-in capital applicable to the following shares of common stock, with 250,000,000 shares of $0.01 par value shares authorized: | |
| Class A: 1,969,681 shares outstanding |
| $25,332,555 |
|
| Class C: 50,478 shares outstanding | 655,366 |
|
| Class I: 3,116,374 shares outstanding | 38,508,678 |
|
| Class Y: 318,981 shares outstanding | 4,045,654 |
|
| Undistributed net investment income | 46,538 |
|
| Accumulated net realized gain (loss) on investments and foreign currency transactions | (393,823 | ) |
| Net unrealized appreciation (depreciation) on investments, foreign currencies and assets and liabilities denominated in foreign currencies | 2,759,065 |
|
| | |
NET ASSETS | $70,954,033 |
|
| | |
NET ASSET VALUE PER SHARE | |
| Class A (based on net assets of $25,487,162) | $12.94 |
| Class C (based on net assets of $646,531) | $12.81 |
| Class I (based on net assets of $40,621,705) | $13.03 |
| Class Y (based on net assets of $4,198,635) | $13.16 |
| | |
| See notes to financial statements. |
www.calvert.com CALVERT EMERGING MARKETS EQUITY FUND SEMI-ANNUAL REPORT (UNAUDITED) 17
STATEMENT OF OPERATIONS
SIX MONTHS ENDED MARCH 31, 2015
|
| | | |
NET INVESTMENT INCOME | |
| Investment Income: | |
| Dividend income (net of foreign taxes withheld of $47,599) |
| $537,650 |
|
| Interest income | 133 |
|
| Total investment income | 537,783 |
|
| | |
| Expenses: | |
| Investment advisory fee | 296,437 |
|
| Transfer agency fees and expenses | 28,026 |
|
| Administrative fees | 65,170 |
|
| Distribution Plan expenses | |
| Class A | 27,582 |
|
| Class C | 3,095 |
|
| Directors' fees and expenses | 2,652 |
|
| Custodian fees | 80,127 |
|
| Registration fees | 29,907 |
|
| Reports to shareholders | 4,217 |
|
| Professional fees | 10,924 |
|
| Accounting fees | 4,752 |
|
| Miscellaneous | 4,957 |
|
| Total expenses | 557,846 |
|
| Reimbursement from Advisor: | |
| Class A | (43,732 | ) |
| Class C | (5,712 | ) |
| Class I | (7,684 | ) |
| Class Y | (9,465 | ) |
| Net expenses | 491,253 |
|
| | |
NET INVESTMENT INCOME | 46,530 |
|
| | |
REALIZED AND UNREALIZED GAIN (LOSS) | |
| Net realized gain (loss) on: | |
| Investments | 329,104 |
|
| Foreign currency transactions | (40,273 | ) |
| | 288,831 |
|
| Changes in unrealized appreciation (depreciation) on: | |
| Investments and foreign currencies | 1,098,992 |
|
| Assets and liabilities denominated in foreign currencies | (2,048 | ) |
| | 1,096,944 |
|
| | |
NET REALIZED AND UNREALIZED GAIN (LOSS) | 1,385,775 |
|
| | |
INCREASE (DECREASE) IN NET ASSETS RESULTING FROM OPERATIONS |
| $1,432,305 |
|
| | |
| See notes to financial statements. |
18 www.calvert.com CALVERT EMERGING MARKETS EQUITY FUND SEMI-ANNUAL REPORT (UNAUDITED)
STATEMENTS OF CHANGES IN NET ASSETS
|
| | | | | | | |
INCREASE (DECREASE) IN NET ASSETS | SIX MONTHS ENDED MARCH 31, 2015 | | YEAR ENDED SEPTEMBER 30, 2014 |
| Operations: | | | |
| Net investment income |
| $46,530 |
| |
| $377,036 |
|
| Net realized gain (loss) | 288,831 |
| | 1,692,873 |
|
| Change in unrealized appreciation (depreciation) | 1,096,944 |
| | 611,506 |
|
| | | | |
INCREASE (DECREASE) IN NET ASSETS RESULTING FROM OPERATIONS | 1,432,305 |
| | 2,681,415 |
|
| | | | |
| Distributions to shareholders from: | | | |
| Net investment income: | | | |
| Class A shares | (55,632 | ) | | (28,225 | ) |
| Class I shares | (197,710 | ) | | (317,615 | ) |
| Class Y shares | (7,207 | ) | | (1,227 | ) |
| Net realized gain: | | | |
| Class A shares | (719,224 | ) | | (430,902 | ) |
| Class C shares | (19,298 | ) | | (10,387 | ) |
| Class I shares | (1,059,704 | ) | | (1,713,041 | ) |
| Class Y shares | (80,750 | ) | | (42,699 | ) |
| Total distributions | (2,139,525 | ) | | (2,544,096 | ) |
| | | | |
| Capital share transactions: | | | |
| Shares sold: | | | |
| Class A shares | 10,589,254 |
| | 16,568,829 |
|
| Class C shares | 104,233 |
| | 485,806 |
|
| Class I shares | 6,464,782 |
| | 5,236,012 |
|
| Class Y shares | 7,398,947 |
| | 1,949,648 |
|
| Reinvestment of distributions: | | | |
| Class A shares | 730,848 |
| | 433,075 |
|
| Class C shares | 15,018 |
| | 9,915 |
|
| Class I shares | 1,257,413 |
| | 2,030,657 |
|
| Class Y shares | 83,767 |
| | 42,453 |
|
| Redemption fees: | | | |
| Class A shares | 3 |
| | 89 |
|
| Class Y shares | — |
| | 150 |
|
| Shares redeemed: | | | |
| Class A shares | (6,144,176 | ) | | (2,817,017 | ) |
| Class C shares | (73,047 | ) | | (16,467 | ) |
| Class I shares | (277,948 | ) | | (6,669,371 | ) |
| Class Y shares | (5,767,055 | ) | | (75,526 | ) |
| Total capital share transactions | 14,382,039 |
| | 17,178,253 |
|
| | | | |
TOTAL INCREASE (DECREASE) IN NET ASSETS | 13,674,819 |
| | 17,315,572 |
|
| See notes to financial statements. |
www.calvert.com CALVERT EMERGING MARKETS EQUITY FUND SEMI-ANNUAL REPORT (UNAUDITED) 19
STATEMENTS OF CHANGES IN NET ASSETS
|
| | | | | | | |
NET ASSETS | SIX MONTHS ENDED MARCH 31, 2015 | | YEAR ENDED SEPTEMBER 30, 2014 |
| Beginning of period |
| $57,279,214 |
| |
| $39,963,642 |
|
| End of period (including undistributed net investment income of $46,538 and $260,557, respectively) |
| $70,954,033 |
| |
| $57,279,214 |
|
| | | | |
CAPITAL SHARE ACTIVITY | | | |
| Shares sold: | | | |
| Class A shares | 817,546 |
| | 1,275,683 |
|
| Class C shares | 8,185 |
| | 37,216 |
|
| Class I shares | 496,085 |
| | 410,505 |
|
| Class Y shares | 577,596 |
| | 143,493 |
|
| Reinvestment of distributions: | | | |
| Class A shares | 58,063 |
| | 33,624 |
|
| Class C shares | 1,205 |
| | 771 |
|
| Class I shares | 99,029 |
| | 155,876 |
|
| Class Y shares | 6,546 |
| | 3,258 |
|
| Shares redeemed: | | | |
| Class A shares | (474,877 | ) | | (215,396 | ) |
| Class C shares | (5,680 | ) | | (1,223 | ) |
| Class I shares | (21,422 | ) | | (474,511 | ) |
| Class Y shares | (438,911 | ) | | (5,649 | ) |
| Total capital share activity | 1,123,365 |
| | 1,363,647 |
|
| | | | |
| See notes to financial statements. |
20 www.calvert.com CALVERT EMERGING MARKETS EQUITY FUND SEMI-ANNUAL REPORT (UNAUDITED)
NOTES TO FINANCIAL STATEMENTS
NOTE A — SIGNIFICANT ACCOUNTING POLICIES
General: Calvert Emerging Markets Equity Fund (the “Fund”), a series of Calvert World Values Fund, Inc., is registered under the Investment Company Act of 1940 as a non-diversified, open-end management investment company. Calvert World Values Fund, Inc. is comprised of four separate series. The operations of each series are accounted for separately. The Fund commenced operations on October 29, 2012. The Fund offers four classes of shares of capital stock - Classes A, C, I, and Y. Class A shares are sold with a maximum front-end sales charge of 4.75%. Class C shares are sold without a front-end sales charge and, with certain exceptions, will be charged a deferred sales charge on shares sold within one year of purchase. Class C shares have higher levels of expenses than Class A shares. Class I shares require a minimum account balance of $1,000,000. The $1 million minimum initial investment is waived for retirement plans that trade through omnibus accounts and may be waived for certain other institutional accounts where it is believed to be in the best interest of the Fund and its shareholders. Class I shares have no front-end or deferred sales charge and have lower levels of expenses than Class A shares. Class Y shares are generally only available to wrap or similar fee-based programs offered by financial intermediaries, foundations, and endowments that have entered into an agreement with the Fund’s Distributor to offer Class Y shares. Class Y shares have no front-end or deferred sales charge and have lower levels of expenses than Class A shares. Each class has different: (a) dividend rates, due to differences in Distribution Plan expenses and other class-specific expenses, (b) exchange privileges, and (c) class-specific voting rights.
Security Valuation: Net asset value per share is determined every business day as of the close of the regular session of the New York Stock Exchange (generally 4:00 p.m. Eastern time). The Fund uses independent pricing services approved by the Board of Directors (“the Board”) to value its investments wherever possible. Investments for which market quotations are not available or deemed not reliable are fair valued in good faith under the direction of the Board.
The Board has adopted Valuation Procedures (the “Procedures”) to determine the fair value of securities and other financial instruments for which market prices are not readily available or which may not be reliably priced. The Board has delegated the day-to-day responsibility for determining the fair value of assets of the Fund to Calvert Investment Management, Inc. (the “Advisor” or “Calvert”) and has provided these Procedures to govern Calvert in its valuation duties.
Calvert has chartered an internal Valuation Committee to oversee the implementation of these Procedures and to assist it in carrying out the valuation responsibilities that the Board has delegated.
The Valuation Committee meets on a regular basis to review illiquid securities and other investments which may not have readily available market prices. The Valuation Committee’s fair valuation determinations are subject to review, approval and ratification by the Board at its next regularly scheduled meeting covering the calendar quarter in which the fair valuation was determined.
The Valuation Committee utilizes various methods to measure the fair value of the Fund’s investments. Generally Accepted Accounting Principles (GAAP) establishes a disclosure hierarchy that categorizes the inputs to valuation techniques used to value assets and liabilities at measurement date. These inputs are summarized in the three broad levels listed below:
www.calvert.com CALVERT EMERGING MARKETS EQUITY FUND SEMI-ANNUAL REPORT (UNAUDITED) 21
Level 1 - quoted prices in active markets for identical securities
Level 2 - other significant observable inputs (including quoted prices for similar securities, interest rates, prepayment speeds, credit risk, etc.)
Level 3 - significant unobservable inputs (including the Fund’s own assumptions in determining the fair value of investments)
The inputs or methodologies used for valuing securities are not necessarily an indication of the risk associated with investing in those securities.
Changes in valuation techniques may result in transfers in or out of an investment’s assigned level within the hierarchy during the period. At March 31, 2015, $42,430,439 transferred out of Level 1 into Level 2. Valuation techniques used to value the Fund’s investments by major category are as follows:
Equity securities, including restricted securities, for which market quotations are readily available, are valued at the last reported sale price or official closing price as reported by an independent pricing service on the primary market or exchange on which they are traded and are categorized as Level 1 in the hierarchy. In the event there were no sales during the day or closing prices are not available, securities are valued at the last quoted bid price or using the last available price and are categorized as Level 2 in the hierarchy. Foreign securities are valued based on quotations from the principal market in which such securities are normally traded. If events occur after the close of the principal market in which foreign securities are traded, and before the close of business of the Fund, that are expected to materially affect the value of those securities, then they are valued at their fair value taking these events into account. The Fund has retained a third party fair value pricing service to quantitatively analyze the price movement of its holdings on foreign exchanges and to automatically fair value if the variation from the prior day’s closing price exceeds specified parameters. Such securities would be categorized as Level 2 in the hierarchy in these circumstances. Utilizing this technique may result in transfers between Level 1 and Level 2. For restricted securities and private placements where observable inputs are limited, assumptions about market activity and risk are used and such securities are categorized as Level 3 in the hierarchy.
Exchange traded products and closed-end funds are valued at the official closing price as reported by an independent pricing service on the primary market or exchange on which they are traded and are categorized as Level 1 in the hierarchy.
Participatory notes are valued based on the value of the underlying equity security as determined using the valuation techniques for equity securities listed above. Participatory notes are categorized as Level 2 in the hierarchy.
If a market value cannot be determined for a security using the methodologies described above, or if, in the good faith opinion of the Advisor, the market value does not constitute a readily available market quotation, or if a significant event has occurred that would materially affect the value of the security, the security will be fair valued as determined in good faith by the Valuation Committee.
The Valuation Committee considers a number of factors, including significant unobservable valuation inputs when arriving at fair value. It considers all significant facts that are reasonably available and relevant to the determination of fair value.
The Valuation Committee primarily employs a market-based approach which may use related or comparable assets or liabilities, recent transactions, market multiples, book values, and
22 www.calvert.com CALVERT EMERGING MARKETS EQUITY FUND SEMI-ANNUAL REPORT (UNAUDITED)
other relevant information for the investment to determine the fair value of the investment. When more appropriate, the fund may employ an income-based or cost approach. An income-based valuation approach discounts anticipated future cash flows of the investment to calculate a present amount (discounted). The measurement is based on the value indicated by current market expectations about those future amounts. Discounts may also be applied due to the nature or duration of any restrictions on the disposition of the investments. A cost based approach is based on the amount that currently would be required to replace the service capacity of an asset (current replacement cost). From the seller’s perspective, the price that would be received for the asset is determined based on the cost to a buyer to acquire or construct a substitute asset of comparable utility, adjusted for obsolescence.
The values assigned to fair value investments are based on available information and do not necessarily represent amounts that might ultimately be realized. Further, due to the inherent uncertainty of valuations of such investments, the fair values may differ significantly from the values that would have been used had an active market existed, and the differences could be material. The Valuation Committee employs various methods for calibrating these valuation approaches including a regular review of key inputs and assumptions, transactional back-testing or disposition analysis and reviews of any related market activity.
At March 31, 2015, securities valued at $3,313,638, or 4.7% of net assets, were fair valued in good faith under the direction of the Board.
The following table summarizes the market value of the Fund’s holdings as of March 31, 2015, based on the inputs used to value them:
|
| | | | | | | | | | | | | | |
| | VALUATION INPUTS |
INVESTMENTS IN SECURITIES* | LEVEL 1 | | LEVEL 2 | | LEVEL 3 | | TOTAL |
| Equity securities* |
| $14,310,048 |
| |
| $42,430,439 | ** | | — |
| |
| $56,740,487 |
|
| Closed-end funds | 3,567,098 |
| | — |
| | — |
| | 3,567,098 |
|
| Exchange traded products | — |
| | 3,244,336 |
| | — |
| | 3,244,336 |
|
| Participatory notes | — |
| | 3,313,638 |
| | — |
| | 3,313,638 |
|
| TOTAL |
| $17,877,146 |
| |
| $48,988,413 |
| | — |
| |
| $66,865,559 |
|
| | | | | | | | |
* For further breakdown of equity securities by country, please refer to the Schedule of Investments. ** Includes certain securities trading primarily outside the U.S. whose value was adjusted as a result of significant market movements following the close of local trading. On March 31, 2015, price movements exceeded specified parameters and the third party fair value pricing service quantitatively fair valued the affected securities. |
At March 31, 2015, a significant transfer out of Level 1 and into Level 2 occurred.
On March 31, 2015, price movements exceeded specified parameters and the third party fair value pricing service quantitatively fair valued the affected securities.
Participatory Notes: The Fund may gain exposure to securities in certain foreign markets through investments in participatory notes (“P-notes”), especially in markets where direct investment by the Fund is not possible. P-notes are generally issued by a bank or broker-dealer (the “counterparty”) and are designed to offer a return linked to a particular underlying equity security. While the holder of a P-note is entitled to receive from the counterparty any dividends paid by the underlying security, the counterparty retains legal ownership and voting rights of the underlying security. The risks associated with investing in a P-note may include the possible failure of the counterparty to perform its obligations under the terms of the
www.calvert.com CALVERT EMERGING MARKETS EQUITY FUND SEMI-ANNUAL REPORT (UNAUDITED) 23
agreement, an inability to liquidate or transfer the notes, and an imperfect correlation between the value of the P-note and the underlying security.
Security Transactions and Net Investment Income: Security transactions are accounted for on trade date. Realized gains and losses are recorded on an identified cost basis and may include proceeds from litigation. Dividend income is recorded on the ex-dividend date or, in the case of dividends on certain foreign securities, as soon as the Fund is informed of the ex-dividend date. Withholding taxes on foreign dividends have been provided for in accordance with the Fund’s understanding of the applicable country’s tax rules and rates. Distributions received on securities that represent a return of capital or capital gain are recorded as a reduction of cost of investments and/or as a realized gain. Interest income, which includes amortization of premium and accretion of discount on debt securities, is accrued as earned. Investment income and realized and unrealized gains and losses are allocated to separate classes of shares based upon the relative net assets of each class. Expenses arising in connection with a specific class are charged directly to that class. Expenses common to the classes are allocated to each class in proportion to their relative net assets.
Foreign Currency Transactions: The Fund’s accounting records are maintained in U.S. dollars. For valuation of assets and liabilities on each date of net asset value determination, foreign denominations are converted into U.S. dollars using the current exchange rate. Security transactions, income, and expenses are translated at the prevailing rate of exchange on the date of the event. The effect of changes in foreign exchange rates on securities and foreign currencies is included in the net realized and unrealized gain or loss on securities and foreign currencies.
Distributions to Shareholders: Distributions to shareholders are recorded by the Fund on ex-dividend date. Dividends from net investment income and distributions from net realized capital gains, if any, are paid at least annually. Distributions are determined in accordance with income tax regulations which may differ from generally accepted accounting principles; accordingly, periodic reclassifications are made within the Fund’s capital accounts to reflect income and gains available for distribution under income tax regulations.
Estimates: The preparation of financial statements in conformity with accounting principles generally accepted in the United States requires management to make estimates and assumptions that affect the reported amounts of assets and liabilities and disclosure of contingent assets and liabilities at the date of the financial statements and the reported amounts of income and expenses during the reported period. Actual results could differ from those estimates.
Redemption Fees: The Fund charges a 2% redemption fee on redemptions, including exchanges, made within 30 days of purchase (within seven days for Class I shares). The redemption fee is accounted for as an addition to paid-in capital and is intended to discourage market-timers by ensuring that short-term trading costs are borne by the investors making the transactions and not the shareholders already in the Fund. This fee was eliminated effective February 2, 2015.
Federal Income Taxes: No provision for federal income or excise tax is required since the Fund intends to continue to qualify as a regulated investment company under the Internal Revenue Code and to distribute substantially all of its taxable earnings.
Management has analyzed the Fund’s tax positions taken for all open federal income tax years and has concluded that no provision for federal income tax is required in the Fund’s financial statements. A Fund’s federal tax return is subject to examination by the Internal Revenue Service for a period of three years.
24 www.calvert.com CALVERT EMERGING MARKETS EQUITY FUND SEMI-ANNUAL REPORT (UNAUDITED)
NOTE B — RELATED PARTY TRANSACTIONS
Calvert Investment Management, Inc. (the “Advisor”) is wholly-owned by Calvert Investments, Inc., which is indirectly wholly-owned by Ameritas Mutual Holding Company. The Advisor provides investment advisory services and pays the salaries and fees of officers and Directors of the Fund who are employees of the Advisor or its affiliates. For its services, the Advisor receives an annual fee, payable monthly, of .95% of the average daily net assets.
The Advisor has contractually agreed to limit net annual fund operating expenses through January 31, 2016. The contractual expense caps are 1.78%, 2.78%, 1.43%, and 1.53% for Class A, C, I, and Y, respectively. For the purpose of this expense limit, operating expenses do not include interest expense, brokerage commissions, taxes, and extraordinary expenses. This expense limitation does not limit acquired fund fees and expenses, if any.
Calvert Investment Administrative Services, Inc., an affiliate of the Advisor, provides administrative services to the Fund for an annual fee, payable monthly, of .35% for Classes A, C, and Y shares and .10% for Class I shares, based on their average daily net assets.
Calvert Investment Distributors, Inc. (“CID”), an affiliate of the Advisor, is the distributor and principal underwriter for the Fund. Pursuant to Rule 12b-1 under the Investment Company Act of 1940, the Fund has adopted a Distribution Plan that permits the Fund to pay certain expenses associated with the distribution and servicing of its shares. The expenses paid may not exceed .50% and 1.00% annually of the average daily net assets of Class A and C, respectively. The amount actually paid by the Fund is an annualized fee, payable monthly, of .25% and 1.00% of the average daily net assets of Class A and C, respectively. Class I and Y shares do not have Distribution Plan expenses. CID received $3,399 as its portion of the commissions charged on sales of the Fund’s Class A shares for the six months ended March 31, 2015.
Calvert Investment Services, Inc. (“CIS”), an affiliate of the Advisor, is the shareholder servicing agent for the Fund. For its services, CIS received a fee of $3,142 for the six months ended March 31, 2015.
Each Director of the Fund who is not an employee of the Advisor or its affiliates receives an annual retainer of $52,000 ($48,000 prior to January 1, 2015) plus a meeting fee of up to $3,000 for each Board meeting attended. Additional fees of $6,000 ($5,000 prior to January 1, 2015) annually may be paid to the Committee chairs ($10,000 for the Board chair and the Special Equities Committee chair) and $2,500 annually may be paid to Committee members, plus a Committee meeting fee of $500 for each Committee meeting attended. Directors’ fees are allocated to each of the Funds served.
NOTE C — INVESTMENT ACTIVITY AND TAX INFORMATION
During the period, the cost of purchases and proceeds from sales of investments, other than short-term securities, were $30,892,640 and $21,227,719, respectively.
The Fund intends to elect to defer net capital losses of $405,394 incurred from November 1, 2013 through September 30, 2014 and treat them as arising in the fiscal year ending September 30, 2015.
As of March 31, 2015, the tax basis components of unrealized appreciation/(depreciation) and the federal tax cost were as follows:
|
| | | |
| Unrealized appreciation |
| $7,748,232 |
|
| Unrealized (depreciation) | (5,456,127 | ) |
| Net unrealized appreciation/(depreciation) |
| $2,292,105 |
|
| | |
| Federal income tax cost of investments |
| $64,573,454 |
|
www.calvert.com CALVERT EMERGING MARKETS EQUITY FUND SEMI-ANNUAL REPORT (UNAUDITED) 25
NOTE D — LINE OF CREDIT
A financing agreement is in place with the Calvert Funds and State Street Corporation (“SSC”). Under the agreement, SSC provides an unsecured line of credit facility, in the aggregate amount of $50 million ($25 million committed and $25 million uncommitted), accessible by the Funds for temporary or emergency purposes only. Borrowings bear interest at the higher of the London Interbank Offered Rate (LIBOR) or the overnight Federal Funds Rate plus 1.25% per annum. A commitment fee of .125% per annum is incurred on the unused portion of the committed facility, which is allocated to all participating funds. The Fund had no loans outstanding pursuant to this line of credit at March 31, 2015. For the six months ended March 31, 2015, borrowings by the Fund under the agreement were as follows:
|
| | | |
AVERAGE DAILY BALANCE | WEIGHTED AVERAGE INTEREST RATE | MAXIMUM AMOUNT BORROWED | MONTH OF MAXIMUM AMOUNT BORROWED |
| $96,783 | 1.38% | $3,563,751 | February 2015 |
NOTE E — SUBSEQUENT EVENTS
In preparing the financial statements as of March 31, 2015, no subsequent events or transactions occurred that would have required recognition or disclosure in these financial statements.
26 www.calvert.com CALVERT EMERGING MARKETS EQUITY FUND SEMI-ANNUAL REPORT (UNAUDITED)
FINANCIAL HIGHLIGHTS
|
| | | | | | | | | | | |
| | | PERIODS ENDED | |
CLASS A SHARES | MARCH 31, 2015 (z) | | SEPTEMBER 30, 2014 (z) | | SEPTEMBER 30, 2013 (z) # |
| Net asset value, beginning |
| $13.15 |
| |
| $13.34 |
| |
| $12.00 |
|
| Income from investment operations: | | | | | |
| Net investment income | — |
| | .08 |
| | .13 |
|
| Net realized and unrealized gain (loss) | .23 |
| | .46 |
| | 1.34 |
|
| Total from investment operations | .23 |
| | .54 |
| | 1.47 |
|
| Distributions from: | | | | | |
| Net investment income | (.03 | ) | | (.04 | ) | | (.13 | ) |
| Net realized gain | (.41 | ) | | (.69 | ) | | — |
|
| Total distributions | (.44 | ) | | (.73 | ) | | (.13 | ) |
| Total increase (decrease) in net asset value | (.21 | ) | | (.19 | ) | | 1.34 |
|
| Net asset value, ending |
| $12.94 |
| |
| $13.15 |
| |
| $13.34 |
|
| | | | | | |
| Total return* | 1.88 | % | | 4.19 | % | | 12.30 | % |
Ratios to average net assets: A | | | | | |
| Net investment income | (.02%) (a) |
| | .57 | % | | 1.16% (a) |
|
| Total expenses | 2.18% (a) |
| | 2.22 | % | | 3.03% (a) |
|
| Expenses before offsets | 1.78% (a) |
| | 1.78 | % | | 1.78% (a) |
|
| Net expenses | 1.78% (a) |
| | 1.78 | % | | 1.78% (a) |
|
| Portfolio turnover | 35 | % | | 95 | % | | 74 | % |
| Net assets, ending (in thousands) |
| $25,487 |
| |
| $20,628 |
| |
| $6,337 |
|
| | | | | | |
|
| | | | | |
| | | | | | |
| | | | | | |
| | | | | | |
| | | | | | |
| | | | | | |
| | | | | | |
| | | | | | |
| | | | | | |
| | | | | | |
| | | | | | |
| | | | | | |
| | | | | | |
| | | | | | |
| | | | | | |
| | | | | | |
| | | | | | |
| | | | | | |
| | | | | | |
| | | | | | |
| | | | | | |
| | | | | | |
| | | | | | |
| See notes to financial highlights. |
www.calvert.com CALVERT EMERGING MARKETS EQUITY FUND SEMI-ANNUAL REPORT (UNAUDITED) 27
FINANCIAL HIGHLIGHTS
|
| | | | | | | | | | | |
| | | PERIODS ENDED | |
CLASS C SHARES | MARCH 31, 2015 (z) | | SEPTEMBER 30, 2014 (z) | | SEPTEMBER 30, 2013 (z) # |
| Net asset value, beginning |
| $13.05 |
| |
| $13.34 |
| |
| $12.00 |
|
| Income from investment operations: | | | | | |
| Net investment income (loss) | (.07 | ) | | (.05 | ) | | (.01 | ) |
| Net realized and unrealized gain (loss) | .24 |
| | .45 |
| | 1.37 |
|
| Total from investment operations | .17 |
| | .40 |
| | 1.36 |
|
| Distributions from: | | | | | |
| Net investment income | — |
| | — |
| | (.02 | ) |
| Net realized gain | (.41 | ) | | (.69 | ) | | — |
|
| Total distributions | (.41 | ) | | (.69 | ) | | (.02 | ) |
| Total increase (decrease) in net asset value | (.24 | ) | | (.29 | ) | | 1.34 |
|
| Net asset value, ending |
| $12.81 |
| |
| $13.05 |
| |
| $13.34 |
|
| | | | | | |
| Total return* | 1.41 | % | | 3.10 | % | | 11.38 | % |
Ratios to average net assets: A | | | | | |
| Net investment income (loss) | (1.05%) (a) |
| | (.41 | %) | | (.09%) (a) |
|
| Total expenses | 4.63% (a) |
| | 4.36 | % | | 100.72% (a) |
|
| Expenses before offsets | 2.78% (a) |
| | 2.78 | % | | 2.78% (a) |
|
| Net expenses | 2.78% (a) |
| | 2.78 | % | | 2.78% (a) |
|
| Portfolio turnover | 35 | % | | 95 | % | | 74 | % |
| Net assets, ending (in thousands) |
| $647 |
| |
| $610 |
| |
| $133 |
|
| | | | | | |
|
| | | | | |
| | | | | | |
| | | | | | |
| | | | | | |
| | | | | | |
| | | | | | |
| | | | | | |
| | | | | | |
| | | | | | |
| | | | | | |
| | | | | | |
| | | | | | |
| | | | | | |
| | | | | | |
| | | | | | |
| | | | | | |
| | | | | | |
| | | | | | |
| | | | | | |
| | | | | | |
| | | | | | |
| | | | | | |
| | | | | | |
| See notes to financial highlights. |
28 www.calvert.com CALVERT EMERGING MARKETS EQUITY FUND SEMI-ANNUAL REPORT (UNAUDITED)
FINANCIAL HIGHLIGHTS
|
| | | | | | | | | | | |
| | | PERIODS ENDED | |
CLASS I SHARES | MARCH 31, 2015 (z) | | SEPTEMBER 30, 2014 (z) | | SEPTEMBER 30, 2013 (z) # |
| Net asset value, beginning |
| $13.26 |
| |
| $13.49 |
| |
| $12.00 |
|
| Income from investment operations: | | | | | |
| Net investment income | .02 |
| | .10 |
| | .19 |
|
| Net realized and unrealized gain (loss) | .23 |
| | .48 |
| | 1.33 |
|
| Total from investment operations | .25 |
| | .58 |
| | 1.52 |
|
| Distributions from: | | | | | |
| Net investment income | (.07 | ) | | (.12 | ) | | (.03 | ) |
| Net realized gain | (.41 | ) | | (.69 | ) | | — |
|
| Total distributions | (.48 | ) | | (.81 | ) | | (.03 | ) |
| Total increase (decrease) in net asset value | (.23 | ) | | (.23 | ) | | 1.49 |
|
| Net asset value, ending |
| $13.03 |
| |
| $13.26 |
| |
| $13.49 |
|
| | | | | | |
| Total return* | 2.06 | % | | 4.49 | % | | 12.73 | % |
Ratios to average net assets: A | | | | | |
| Net investment income | .29% (a) |
| | .78 | % | | 1.61% (a) |
|
| Total expenses | 1.47% (a) |
| | 1.42 | % | | 1.65% (a) |
|
| Expenses before offsets | 1.43% (a) |
| | 1.42 | % | | 1.43% (a) |
|
| Net expenses | 1.43% (a) |
| | 1.42 | % | | 1.43% (a) |
|
| Portfolio turnover | 35 | % | | 95 | % | | 74 | % |
| Net assets, ending (in thousands) |
| $40,622 |
| |
| $33,721 |
| |
| $33,053 |
|
| | | | | | |
|
| | | | | |
| | | | | | |
| | | | | | |
| | | | | | |
| | | | | | |
| | | | | | |
| | | | | | |
| | | | | | |
| | | | | | |
| | | | | | |
| | | | | | |
| | | | | | |
| | | | | | |
| | | | | | |
| | | | | | |
| | | | | | |
| | | | | | |
| | | | | | |
| | | | | | |
| | | | | | |
| | | | | | |
| | | | | | |
| | | | | | |
| See notes to financial highlights. |
www.calvert.com CALVERT EMERGING MARKETS EQUITY FUND SEMI-ANNUAL REPORT (UNAUDITED) 29
FINANCIAL HIGHLIGHTS
|
| | | | | | | | | | | |
| | | PERIODS ENDED | |
CLASS Y SHARES | MARCH 31, 2015 (z) | | SEPTEMBER 30, 2014 (z) | | SEPTEMBER 30, 2013 (z) # |
| Net asset value, beginning |
| $13.35 |
| |
| $13.48 |
| |
| $12.00 |
|
| Income from investment operations: | | | | | |
| Net investment income | — |
| | .10 |
| | .14 |
|
| Net realized and unrealized gain (loss) | .25 |
| | .49 |
| | 1.36 |
|
| Total from investment operations | .25 |
| | .59 |
| | 1.50 |
|
| Distributions from: | | | | | |
| Net investment income | (.03 | ) | | (.03 | ) | | (.02 | ) |
| Net realized gain | (.41 | ) | | (.69 | ) | | — |
|
| Total distributions | (.44 | ) | | (.72 | ) | | (.02 | ) |
| Total increase (decrease) in net asset value | (.19 | ) | | (.13 | ) | | 1.48 |
|
| Net asset value, ending |
| $13.16 |
| |
| $13.35 |
| |
| $13.48 |
|
| | | | | | |
| Total return* | 2.01 | % | | 4.51 | % | | 12.55 | % |
Ratios to average net assets: A | | | | | |
| Net investment income | .05% (a) |
| | .78 | % | | 1.28% (a) |
|
| Total expenses | 1.95% (a) |
| | 2.24 | % | | 18.62% (a) |
|
| Expenses before offsets | 1.53% (a) |
| | 1.53 | % | | 1.53% (a) |
|
| Net expenses | 1.53% (a) |
| | 1.53 | % | | 1.53% (a) |
|
| Portfolio turnover | 35 | % | | 95 | % | | 74 | % |
| Net assets, ending (in thousands) |
| $4,199 |
| |
| $2,320 |
| |
| $440 |
|
| | | | | | |
A Total expenses do not reflect amounts reimbursed and/or waived by the Advisor or reductions from expense offset arrangements. Expenses before offsets reflect expenses after reimbursement and/or waiver by the Advisor but prior to reductions from expense offset arrangements. Net expenses are net of all reductions and represent the net expenses paid by the Fund. (a) Annualized. (z) Per share figures are calculated using the Average Shares Method. * Total return is not annualized for periods of less than one year and does not reflect deduction of any front-end or deferred sales charge. # From October 29, 2012 inception. See notes to financial statements. |
30 www.calvert.com CALVERT EMERGING MARKETS EQUITY FUND SEMI-ANNUAL REPORT (UNAUDITED)
EXPLANATION OF FINANCIAL TABLES
SCHEDULE OF INVESTMENTS
The Schedule of Investments is a snapshot of all securities held in the fund at their market value, on the last day of the reporting period. Securities are listed by asset type (e.g., common stock, corporate bonds, U.S. government obligations) or, for International and Global funds, by country, and may be further broken down into sub-groups and by industry classification.
STATEMENT OF ASSETS AND LIABILITIES
The Statement of Assets and Liabilities is often referred to as the fund’s balance sheet. It lists the value of what the fund owns, is due and owes on the last day of the reporting period. The fund’s assets include the market value of securities owned, cash, receivables for securities sold and shareholder subscriptions, and receivables for dividends and interest payments that have been earned, but not yet received. The fund’s liabilities include payables for securities purchased and shareholder redemptions, and expenses owed but not yet paid. The statement also reports the fund’s net asset value (NAV) per share on the last day of the reporting period. The NAV is calculated by dividing the fund’s net assets (assets minus liabilities) by the number of shares outstanding. This statement is accompanied by a Schedule of Investments. Alternatively, if certain conditions are met, a Statement of Net Assets may be presented in lieu of this statement and the Schedule of Investments.
STATEMENT OF NET ASSETS
The Statement of Net Assets provides a detailed list of the fund’s holdings, including each security’s market value on the last day of the reporting period. The Statement of Net Assets includes a Schedule of Investments. Other assets are added and other liabilities subtracted from the investments total to calculate the fund’s net assets. Finally, net assets are divided by the outstanding shares of the fund to arrive at its share price, or Net Asset Value (NAV) per share.
At the end of the Statement of Net Assets is a table displaying the composition of the fund’s net assets. Paid in Capital is the money invested by shareholders and represents the bulk of net assets. Undistributed Net Investment Income and Accumulated Net Realized Gains usually approximate the amounts the fund had available to distribute to shareholders as of the statement date. Accumulated Realized Losses will appear as negative balances. Unrealized Appreciation (Depreciation) is the difference between the market value of the fund’s investments and their cost, and reflects the gains (losses) that would be realized if the fund were to sell all of its investments at their statement-date -values.
STATEMENT OF OPERATIONS
The Statement of Operations summarizes the fund’s investment income earned and expenses incurred in operating the fund. Investment income includes dividends earned from stocks and interest earned from interest-bearing securities in the fund. Expenses incurred in operating the fund include the advisory fee paid to the investment advisor, administrative services fees, distribution plan expenses (if applicable), transfer agent fees, shareholder servicing expenses, custodial, legal, and audit fees, and the printing and postage expenses related to shareholder reports. Expense offsets (fees paid indirectly) may also be shown. Credits earned from offset arrangements are used to reduce the fund’s expenses. This statement also shows net gains (losses) realized on the sale of investments and the increase or decrease in the unrealized appreciation (depreciation) on investments held during the period.
www.calvert.com CALVERT EMERGING MARKETS EQUITY FUND SEMI-ANNUAL REPORT (UNAUDITED) 31
STATEMENT OF CHANGES IN NET ASSETS
The Statement of Changes in Net Assets shows how the fund’s total net assets changed during the two most recent reporting periods. Changes in the fund’s net assets are attributable to investment operations, distributions and capital share transactions.
The Operations section of the report summarizes information detailed in the Statement of Operations. The Distribution section shows the dividend and capital gain distributions made to shareholders. The amounts shown as distributions in this section may not match the net investment income and realized gains amounts shown in the Operations section because distributions are determined on a tax basis and certain investments or transactions may be treated differently for financial statement and tax purposes. The Capital Share Transactions section shows the amount shareholders invested in the fund, either by purchasing shares or by reinvesting distributions, and the amounts redeemed. The corresponding numbers of shares issued, reinvested and redeemed are shown at the end of the report.
FINANCIAL HIGHLIGHTS
The Financial Highlights table provides a per-share breakdown per class of the components that affect the fund’s net asset value for current and past reporting periods. The table provides total return, total distributions, expense ratios, portfolio turnover and net assets for the applicable period. Total return is a measure of a fund’s performance that encompasses all elements of return: dividends, capital gain distributions and changes in net asset value. Total return is the change in value of an investment over a given period, assuming reinvestment of any dividends and capital gain distributions, expressed as a percentage of the initial investment. Total distributions include distributions from net investment income and net realized gains. Long-term gains are earned on securities held in the fund more than one year. Short-term gains, on the sale of securities held less than one year, are treated as ordinary dividend income for tax purposes. The expense ratio is a fund’s cost of doing business, expressed as a percentage of net assets. These expenses directly reduce returns to shareholders. Portfolio turnover measures the trading activity in a fund’s investment portfolio—how often securities are bought and sold by a fund. Portfolio turnover is affected by market conditions, changes in the size of the fund, the nature of the fund’s investments and the investment style of the portfolio manager.
PROXY VOTING
The Proxy Voting Guidelines of the Calvert Funds that the Fund uses to determine how to vote proxies relating to portfolio securities are provided as an Appendix to the Fund’s Statement of Additional Information. The Statement of Additional Information can be obtained free of charge by calling the Fund at 1-800-368-2745, by visiting the Calvert website at www.calvert.com; or by visiting the SEC’s website at www.sec.gov.
Information regarding how the Fund voted proxies relating to portfolio securities during the most recent 12-month period ended June 30 is available on the Fund’s website at www.calvert.com and on the SEC’s website at www.sec.gov.
AVAILABILITY OF QUARTERLY PORTFOLIO HOLDINGS
The Fund files its complete schedule of portfolio holdings with the SEC for the first and third quarters of each fiscal year on Form N-Q. The Fund’s Form N-Q is available on the SEC’s website at www.sec.gov. The Fund’s Form N-Q may be reviewed and copied at the SEC’s Public Reference Room in Washington, DC; information on the operation of the Public Reference Room may be obtained by calling 1-800-SEC-0330.
32 www.calvert.com CALVERT EMERGING MARKETS EQUITY FUND SEMI-ANNUAL REPORT (UNAUDITED)
BASIS FOR BOARD’S APPROVAL OF INVESTMENT ADVISORY CONTRACTS
At a meeting held on December 9, 2014, the Board of Directors, and by a separate vote, the disinterested Directors, approved the continuance of the Investment Advisory Agreement between Calvert World Values Fund, Inc. and the Advisor and the Investment Subadvisory Agreement between the Advisor and the Subadvisor with respect to the Fund.
In evaluating the Investment Advisory Agreement, the Board considered a variety of information relating to the Fund and the Advisor. The disinterested Directors reviewed a report prepared by the Advisor regarding various services provided to the Fund by the Advisor and its affiliates. Such report included, among other data, information regarding the Advisor’s personnel and the Advisor’s revenue and cost of providing services to the Fund, and a separate report prepared by an independent third party, which provided a statistical analysis comparing the Fund's expenses and fees to comparable mutual funds.
The disinterested Directors were separately represented by independent legal counsel with respect to their consideration of the reapproval of the Investment Advisory Agreement and the Investment Subadvisory Agreement. Prior to voting, the disinterested Directors reviewed the proposed continuance of the Investment Advisory Agreement and Investment Subadvisory Agreement with management and also met in private sessions with their counsel at which no representatives of management were present.
In the course of its deliberations regarding the Investment Advisory Agreement, the Board considered the following factors, among others: the nature, extent and quality of the services provided by the Advisor, including the personnel providing such services; the Advisor's financial condition; the level and method of computing the Fund's advisory fee; comparative performance, fee and expense information for the Fund; the profitability of the Calvert Family of Funds to the Advisor and its affiliates; the allocation of the Fund's brokerage, including the Advisor's process for monitoring "best execution"; the direct and indirect benefits, if any, derived by the Advisor and its affiliates from their relationship with the Fund; the effect of the Fund's growth and size on the Fund's performance and expenses; the affiliated distributor's process for monitoring sales load breakpoints; the Advisor's compliance programs and policies; the Advisor's performance of substantially similar duties for other funds; and any possible conflicts of interest.
In considering the nature, extent and quality of the services provided by the Advisor under the Investment Advisory Agreement, the Board reviewed information provided by the Advisor relating to its operations and personnel, including, among other information, biographical information on the Advisor's supervisory and professional staff and descriptions of its organizational and management structure. The Board also took into account similar information provided periodically throughout the previous year by the Advisor as well as the Board’s familiarity with management through Board of Directors’ meetings, discussions and other reports. The Board also noted that it reviewed on a quarterly basis information regarding the Advisor’s compliance with applicable policies and procedures, including those related to personal investing. The Advisor's administrative capabilities, including its ability to supervise the other service providers for the Fund, were also considered. The Board also took into account the environmental, social, sustainability and governance research and analysis provided by the Advisor to the Fund. The Board observed that the scope of services provided by the Advisor generally had expanded over time as a result of regulatory, market and other changes. The Board took into consideration, among other factors, the effectiveness of the Fund’s and Advisor’s processes, policies and procedures and the Advisor’s personnel. The Board also took into account, among other items, periodic reports received from the Advisor
www.calvert.com CALVERT EMERGING MARKETS EQUITY FUND SEMI-ANNUAL REPORT (UNAUDITED) 33
over the past year concerning the Advisor’s ongoing review and enhancement of certain processes, policies and procedures of the Fund and the Advisor. The Board discussed the Advisor’s effectiveness in monitoring the performance of the Subadvisor and its timeliness in responding to performance issues. The Board concluded that it was satisfied with the nature, extent and quality of services provided to the Fund by the Advisor under the Investment Advisory Agreement.
In considering the Fund’s performance, the Board noted that it reviewed on a quarterly basis detailed information about the Fund’s performance results, portfolio composition and investment strategies. In addition, the Board took into account overall financial market conditions. The Board also reviewed various comparative data provided to it in connection with its consideration of the renewal of the Investment Advisory Agreement, including, among other information, a comparison of the Fund’s total return with its Lipper Index and with that of other mutual funds deemed to be in its peer group by an independent third party in its report. This comparison indicated that the Fund performed above the median of its peer group for the one-year period ended June 30, 2014. The data also indicated that the Fund outperformed its Lipper index over that same period. Based upon its review, the Board concluded that the Fund’s performance was satisfactory relative to the performance of funds with similar investment objectives and to relevant indices.
In considering the Fund’s fees and expenses, the Board compared the Fund’s fees and total expense ratio with various comparative data for the funds in its peer group. Among other findings, the data indicated that the Fund’s total expenses (net of waivers and/or reimbursements) were below the median of its peer group. The Board noted that the allocation of advisory and administrative fees may vary among the Fund’s peer group. The Board also took into account the Advisor’s current undertaking to maintain expense limitations for the Fund and that the Advisor was reimbursing a portion of the Fund’s expenses. The Board noted the Advisor’s discussion of the Fund’s expenses and certain factors that affected the level of such expenses, including the cost of providing the environmental, social, sustainability and governance research and analysis provided by the Advisor. Based upon its review, the Board determined that the advisory fee was reasonable in view of the quality of services received by the Fund from the Advisor and the other factors considered.
The Board reviewed the Advisor’s profitability on a fund-by-fund basis. In reviewing the overall profitability of the advisory fee to the Fund’s Advisor, the Board also considered the fact that affiliates of the Advisor provided shareholder servicing, administrative and distribution services to the Fund for which they received compensation. The information considered by the Board included Calvert’s operating profit margin information both before and after tax expenses with respect to the services that the Advisor and its affiliates provided to the Calvert Family of Funds complex. The Board reviewed the profitability of the Advisor’s relationship with the Fund in terms of the total amount of annual advisory fees it received with respect to the Fund and whether the Advisor had the financial wherewithal to continue to provide services to the Fund. The Board noted that the Advisor was reimbursing a portion of the Fund’s expenses. The Board also took into account the Advisor’s current undertaking to maintain expense limitations for the Fund. The Board also considered that the Advisor derived benefits to its reputation and other indirect benefits from its relationship with the Fund. The Board also noted that the Advisor paid the subadvisory fee to the Subadvisor. Based upon its review, the Board concluded that the Advisor’s and its affiliates’ level of profitability from their relationship with the Fund was reasonable.
The Board considered the effect of the Fund's current size and its potential growth on its performance and fees. The Board concluded that adding breakpoints to the advisory fee at
34 www.calvert.com CALVERT EMERGING MARKETS EQUITY FUND SEMI-ANNUAL REPORT (UNAUDITED)
specified asset levels would not be appropriate at this time given the Fund's current size. The Board noted that if the Fund’s assets increased over time, the Fund might realize other economies of scale if assets increased proportionally more than certain other expenses.
In reapproving the Investment Advisory Agreement, the Board, including the disinterested Directors, did not identify any single factor as controlling, and each Director may have attributed different weight to various factors.
In evaluating the Investment Subadvisory Agreement, the disinterested Directors reviewed information provided by the Subadvisor relating to its operations, personnel, investment philosophy, strategies and techniques. Among other information, the Subadvisor provided biographical information on portfolio management and other professional staff, performance information for itself, and descriptions of its investment philosophies, strategies and techniques, organizational and management structures and brokerage policies and practices.
The Board reapproved the Investment Subadvisory Agreement between the Subadvisor and the Advisor based on a number of factors relating to the Subadvisor's ability to perform under the Investment Subadvisory Agreement. In the course of its deliberations, the Board evaluated, among other factors: the nature, extent and the quality of the services provided by the Subadvisor; the Subadvisor's management style and long-term performance record; the Fund’s performance record and the Subadvisor's performance in employing its investment strategies; the Subadvisor's current level of staffing and its overall resources; the qualifications and experience of the Subadvisor's personnel; the Subadvisor's financial condition with respect to its ability to perform the services required under the Investment Subadvisory Agreement; the Subadvisor’s risk management processes; the Subadvisor's compliance systems, including those related to personal investing; and any disciplinary history. Based upon its review, the Board concluded that it was satisfied with the nature, extent and quality of services provided to the Fund by the Subadvisor under the Investment Subadvisory Agreement.
As noted above, the Board considered, among other information, the Fund’s performance during the one-year period ended June 30, 2014 as compared to the Fund’s peer group and noted that it reviewed on a quarterly basis detailed information about the Fund’s performance results, portfolio composition and investment strategies. The Board noted the Advisor’s expertise and resources in monitoring the performance, investment style and risk-adjusted performance of the Subadvisor.
In considering the cost of services provided by the Subadvisor and the profitability to the Subadvisor of its relationship with the Fund, the Board noted that the subadvisory fee under the Investment Subadvisory Agreement was paid by the Advisor out of the advisory fee that the Advisor received under the Investment Advisory Agreement. The Board also relied on the ability of the Advisor to negotiate the Investment Subadvisory Agreement and the corresponding subadvisory fee at arm’s length. In addition, the Board took into account the fees the Subadvisor charged to its other clients and considered these fee comparisons in light of the differences in managing these other accounts. Based upon its review, the Board determined that the subadvisory fee was reasonable in view of the quality of services received by the Fund from the Subadvisor and the other factors considered. Because the Advisor pays the Subadvisor’s subadvisory fee and the subadvisory fee was negotiated at arm’s length by the Advisor, the cost of services provided by the Subadvisor and the profitability to the Subadvisor of its relationship with the Fund were not material factors in the Board’s deliberations. For similar reasons, the Board did not consider the potential economies of scale in the Subadvisor’s management of the Fund to be a material factor in its consideration.
www.calvert.com CALVERT EMERGING MARKETS EQUITY FUND SEMI-ANNUAL REPORT (UNAUDITED) 35
In reapproving the Investment Subadvisory Agreement, the Board, including the disinterested Directors, did not identify any single factor as controlling, and each Director may have attributed different weight to various factors.
Conclusions
The Board reached the following conclusions regarding the Investment Advisory Agreement and the Investment Subadvisory Agreement, among others: (a) the Advisor has demonstrated that it possesses the capability and resources to perform the duties required of it under the Investment Advisory Agreement; (b) the Subadvisor is qualified to manage the Fund’s assets in accordance with the Fund’s investment objectives and policies; (c) the Advisor and Subadvisor maintain appropriate compliance programs; (d) the Subadvisor is likely to execute its investment strategies consistently over time; (e) the Fund’s performance is satisfactory relative to the performance of funds with similar investment objectives and to relevant indices; and (f) the Fund's advisory and subadvisory fees are reasonable in view of the quality of services received by the Fund from the Advisor and Subadvisor and the other factors considered. Based on its conclusions, the Board determined that reapproval of the Investment Advisory Agreement and the Investment Subadvisory Agreement would be in the best interests of the Fund and its shareholders.
36 www.calvert.com CALVERT EMERGING MARKETS EQUITY FUND SEMI-ANNUAL REPORT (UNAUDITED)
This page intentionally left blank.
This page intentionally left blank.
To Open an Account
800-368-2748
Service for Existing Account
Shareholders: 800-368-2745
Brokers: 800-368-2746
TDD for Hearing Impaired
800-541-1524
Registered Mail
Calvert Investments
c/o BFDS,
P.O. Box 219544
Kansas City, MO 64121-9544
Overnight Mail
Calvert Investments
c/o BFDS,
330 West 9th Street
Kansas City, MO 64105
Web Site
www.calvert.com
Principal Underwriter
Calvert Investment Distributors, Inc.
4550 Montgomery Avenue
Suite 1000 North
Bethesda, Maryland 20814
|
| | | |
CALVERT EMERGING MARKETS EQUITY FUND | CALVERT’S FAMILY OF FUNDS | | |
| | Municipal Funds Tax-Free Bond Fund Taxable Bond Funds Bond Portfolio Income Fund Short Duration Income Fund Long-Term Income Fund Ultra-Short Income Fund High Yield Bond Fund Green Bond Fund Unconstrained Bond Fund Balanced and Asset Allocation Funds Balanced Portfolio Conservative Allocation Fund Moderate Allocation Fund Aggressive Allocation Fund
| | Equity Funds Large Cap Core Portfolio Equity Portfolio Large Cap Value Fund Social Index Fund Capital Accumulation Fund International Equity Fund Small Cap Fund Global Energy Solutions Fund Global Water Fund International Opportunities Fund Equity Income Fund Emerging Markets Equity Fund |
| | |
This report is intended to provide fund information to shareholders. It is not authorized for distribution to prospective investors unless preceded or accompanied by a prospectus.
Note: The information on our website is not incorporated by reference into this report; our website address is included as an inactive textual reference only.
Investors should carefully consider the investment objectives, risks, charges and expenses of the Calvert Funds. This and other important information is contained in the fund’s summary prospectus and prospectus, which can be obtained from your financial professional and should be read carefully before investing. You may also call Calvert at 800/368-2748 or visit www. calvert.com.
Printed on recycled paper using soy inks.
Item 2. Code of Ethics.
Not applicable.
Item 3. Audit Committee Financial Expert.
Not applicable.
Item 4. Principal Accountant Fees and Services.
Not applicable.
Item 5. Audit Committee of Listed Registrants.
Not applicable.
Item 6. Schedule of Investments.
(a) This Schedule is included as part of the report to shareholders filed under Item 1 of this Form.
(b) Not applicable.
Item 7. Disclosure of Proxy Voting Policies and Procedures for Closed-End Management Investment Companies.
Not applicable.
Item 8. Portfolio Managers of Closed-End Management Investment Companies.
Not applicable.
Item 9. Purchases of Equity Securities by Closed-End Management Investment Company and Affiliated Purchasers.
Not applicable.
Item 10. Submission of Matters to a Vote of Security Holders.
No material changes have been made to the procedures by which shareholders may recommend nominees to the registrant’s Board of Directors since registrant last provided disclosure in response to this Item.
Item 11. Controls and Procedures.
(a) The principal executive and financial officers concluded that the registrant's disclosure controls and procedures (as defined in Rule 30a-3(c) under the 1940 Act) are effective, based on the evaluation of these controls and procedures required by Rule 30a-3(b) under the 1940 Act and Rules 13a-15(b) or 15d-15(b) under the Exchange Act, as of a date within 90 days of the filing date of this report.
(b) There was no change in the registrant's internal control over financial reporting (as defined in Rule 30a-3(d) under the 1940 Act) that occurred during the registrant's second fiscal quarter of the period covered by this report that has materially affected, or is reasonably likely to materially affect, the registrant's internal control over financial reporting.
Item 12. Exhibits.
(a)(1) Not applicable.
(a)(2) A separate certification for each principal executive officer and principal financial officer of the registrant as required by Rule 30a-2 under the Act (17 CFR 270.30a-2).
Attached hereto.
(a)(3) Not applicable.
(b) A certification for the registrant's Principal Executive Officer and Principal Financial Officer, as required by Rule 30a-2(b) under the Investment Company Act of 1940, is attached hereto. The certification furnished pursuant to this paragraph is not deemed to be "filed" for purposes of Section 18 of the Securities Exchange Act of 1934, or otherwise subject to the liability of that section. Such certification is not deemed to be incorporated by reference into any filing under the Securities Act of 1933 or the Securities Exchange Act of 1934, except to the extent that the registrant specifically incorporates it by reference.
Pursuant to the requirements of the Securities Exchange Act of 1934 and the Investment Act of 1940, the registrant has duly caused this report to be signed on its behalf by the undersigned, thereunto duly authorized.
CALVERT WORLD VALUES FUND, INC.
By: /s/ John H. Streur
John H. Streur
President -- Principal Executive Officer
Date: May 28, 2015
Pursuant to the requirements of the Securities Exchange Act of 1934 and the Investment Act of 1940, this report has been signed below by the following persons on behalf of the registrant and in the capacities and on the dates indicated.
/s/ John H. Streur
John H. Streur
President -- Principal Executive Officer
Date: May 28, 2015
/s/ Vicki L. Benjamin
Vicki L. Benjamin
Treasurer -- Principal Financial Officer
Date: May 28, 2015