UNITED STATES
SECURITIES AND EXCHANGE COMMISSION
Washington, D.C. 20549
Form N-CSR
CERTIFIED SHAREHOLDER REPORT OF REGISTERED
MANAGEMENT INVESTMENT COMPANIES
Investment Company Act File Number: 811-06563
CALVERT WORLD VALUES FUND, INC.
(Exact Name of Registrant as Specified in Charter)
1825 Connecticut Avenue NW, Suite 400, Washington, DC 20009
(Address of Principal Executive Offices)
Deidre E. Walsh
Two International Place, Boston, Massachusetts 02110
(Name and Address of Agent for Services)
(202) 238-2200
(Registrant’s Telephone Number)
September 30
Date of Fiscal Year End
September 30, 2022
Date of Reporting Period
Item 1. Reports to Stockholders
Calvert
Mid-Cap Fund
Annual Report
September 30, 2022
Commodity Futures Trading Commission Registration. The Commodity Futures Trading Commission (“CFTC”) has adopted regulations that subject registered investment companies and advisers to regulation by the CFTC if a fund invests more than a prescribed level of its assets in certain CFTC-regulated instruments (including futures, certain options and swap agreements) or markets itself as providing investment exposure to such instruments. The adviser has claimed an exclusion from the definition of “commodity pool operator” under the Commodity Exchange Act with respect to its management of the Fund and the other funds it manages. Accordingly, neither the Fund nor the adviser is subject to CFTC regulation.
Fund shares are not insured by the FDIC and are not deposits or other obligations of, or guaranteed by, any depository institution. Shares are subject to investment risks, including possible loss of principal invested.
This report must be preceded or accompanied by a current summary prospectus or prospectus. Before investing, investors should consider carefully the investment objective, risks, and charges and expenses of a mutual fund. This and other important information is contained in the summary prospectus and prospectus, which can be obtained from a financial intermediary. Prospective investors should read the prospectus carefully before investing. For further information, please call 1-800-368-2745.
Choose Planet-friendly E-delivery!
Sign up now for on-line statements, prospectuses, and fund reports. In less than five minutes you can help reduce paper mail and lower fund costs.
Just go to www.calvert.com. If you already have an online account with the Calvert funds, click on Login to access your Account and select the documents you would like to receive via e-mail.
If you’re new to online account access, click on Login, then Register to create your user name and password. Once you’re in, click on the E-delivery sign-up on the Account Portfolio page and follow the quick, easy steps.
Note: If your shares are not held directly with the Calvert funds but through a brokerage firm, you must contact your broker for electronic delivery options available through their firm.
Annual Report September 30, 2022
Calvert
Mid-Cap Fund
Calvert
Mid-Cap Fund
September 30, 2022
Management's Discussion of Fund Performance†
Economic and Market Conditions
The 12-month period starting October 1, 2021, was dominated by the ongoing effects of one black swan event — the COVID-19 pandemic — and new fallout from another — Russia’s unprovoked invasion of Ukraine.
In the opening months of the period, stock investors as well as consumers appeared to be taking a “glass is half full” approach. Despite the appearance of a new and more contagious COVID-19 variant, the highest inflation readings in nearly four decades, and the U.S. Federal Reserve’s (the Fed’s) announcement that it would begin tapering bond purchases that had supported economic growth, major U.S. equity indexes repeatedly closed at new all-time highs during the final quarter of 2021. As consumers rushed to spend money saved during the early months of the pandemic, Mastercard, Inc. reported its highest retail sales on record during the 2021 holiday season.
But as the new year began, investors appeared to reevaluate the twin threats of inflation and interest rate hikes, and stock performance turned negative. In February, Russia’s invasion of Ukraine sent shock waves through U.S. and global markets, exacerbating inflationary pressures on energy and food costs.
As the Fed’s outlook on inflation worsened from “transitory” to “persistent,” the central bank admitted it might have been late in initiating rate hikes to address the problem. Investors began to expect that the Fed would raise interest rates at every 2022 policy meeting and, in turn, worried that aggressive rate hikes could tip the U.S. economy into recession. At its June, July, and September meetings, the Fed hiked the federal funds rate 0.75% each time — its first moves of that magnitude since 1994. Higher interest rates, inflation, and recessionary worries drove stock prices down, with rate-sensitive technology stocks — which had been star performers early in the pandemic — suffering some of the worst declines.
For the period as a whole, the blue-chip Dow Jones Industrial Average® returned -13.40%; the S&P 500® Index, a broad measure of U.S. stocks, lost 15.47%; and the technology-laden Nasdaq Composite Index fell 26.25%.
Fund Performance
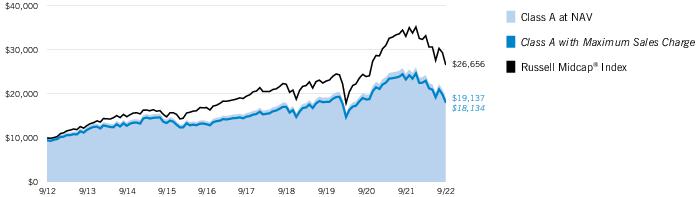
For the 12-month period ended September 30, 2022, Calvert Mid-Cap Fund (the Fund) returned -22.06% for Class A shares at net asset value (NAV), underperforming its benchmark, the Russell Midcap® Index (the Index), which returned -19.39%.
Security selections in the industrials, energy, and health care sectors detracted from returns relative to the Index during the period. An underweight exposure to the energy sector — the top-performing sector within the Index during the period — also detracted from relative performance.
Bill.com Holdings, Inc. (Bill.com), a provider of cloud-based software for automating the back-office financial operations of small- and mid-size businesses, detracted from Fund performance relative to the Index. Bill.com’s share price fell as rising interest rates weighed on highly valued growth stocks. By period-end, the stock was sold from the Fund.
Teleflex Inc. (Teleflex) manufactures single-use medical devices for hospitals and health care providers. Teleflex’s share price fell after the company did not improve its 2022 outlook, raising investor concerns that a strong U.S. dollar might hinder earnings growth for the remainder of the year.
The share price of Bath & Body Works, LLC, a retailer of personal care and home products, fell on investor concerns about the company’s transition to a new CEO, elevated freight costs, and the possible impact of inflation on consumer spending. By period-end, the stock was sold from the Fund.
On the up side, security selections in the financials and information technology sectors contributed to relative performance. Overweight exposures to the industrials and consumer staples sectors were also beneficial during the period.
Baker Hughes Co. (Baker), a global provider of technology for energy producers, contributed to performance relative to the Index. Its share price benefited from the rapid rise in oil prices during the period, leading investors to expect Baker’s customers to spend more for its services. By period-end, the stock was sold from the Fund.
The share price of Assurant, Inc., a provider of consumer electronics and homeowners insurance, rose after the company reported strong 2021 returns. Earnings growth, driven by mobile device trade-ins, exceeded market expectations. By period-end, the stock was sold from the Fund.
Xcel Energy, Inc., a Minnesota-based electric and natural gas utility, benefited from investment demand for noncyclical stocks in a volatile market environment. Utilities and energy were the only two sectors to have positive returns during the period. By period-end, the stock was sold from the Fund.
See Endnotes and Additional Disclosures in this report.
Past performance is no guarantee of future results. Returns are historical and are calculated by determining the percentage change in net asset value (NAV) or offering price (as applicable) with all distributions reinvested. Furthermore, returns do not reflect the deduction of taxes that shareholders may have to pay on Fund distributions or upon the redemption of Fund shares. Investment return and principal value will fluctuate so that shares, when redeemed, may be worth more or less than their original cost. Performance for periods less than or equal to one year is cumulative. Performance is for the stated time period only; due to market volatility, current Fund performance may be lower or higher than the quoted return. For performance as of the most recent month-end, please refer to www.calvert.com.
Calvert
Mid-Cap Fund
September 30, 2022
Performance
Portfolio Manager(s) Michael D. McLean, CFA and J. Griffith Noble, CFA, each of Calvert Research and Management
| % Average Annual Total Returns1,2 | Class
Inception Date | Performance
Inception Date | One Year | Five Years | Ten Years |
| Class A at NAV | 10/31/1994 | 10/31/1994 | (22.06)% | 4.12% | 6.70% |
| Class A with 5.25% Maximum Sales Charge | — | — | (26.16) | 3.01 | 6.13 |
| Class C at NAV | 10/31/1994 | 10/31/1994 | (22.63) | 3.35 | 6.06 |
| Class C with 1% Maximum Deferred Sales Charge | — | — | (23.27) | 3.35 | 6.06 |
| Class I at NAV | 06/03/2003 | 10/31/1994 | (21.87) | 4.42 | 7.14 |
|
| Russell Midcap® Index | — | — | (19.39)% | 6.48% | 10.29% |
| % Total Annual Operating Expense Ratios3 | Class A | Class C | Class I |
| Gross | 1.22% | 1.98% | 0.97% |
| Net | 1.18 | 1.93 | 0.93 |
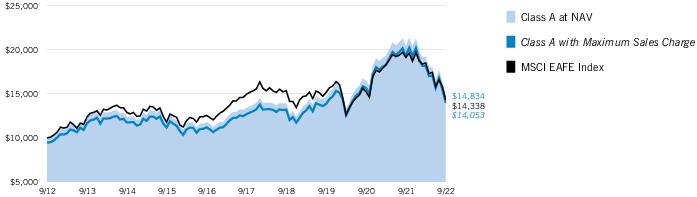
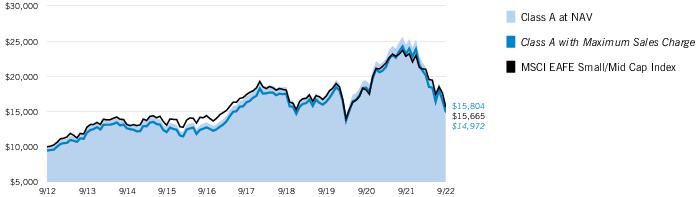
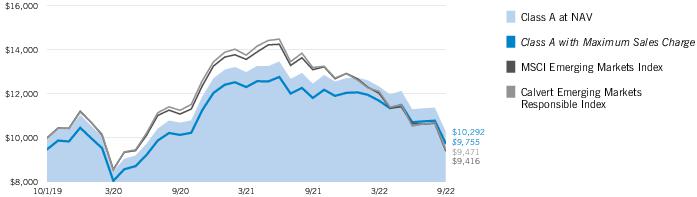
Growth of $10,000
This graph shows the change in value of a hypothetical investment of $10,000 in Class A of the Fund for the period indicated. For comparison, the same investment is shown in the indicated index.
| Growth of Investment | Amount Invested | Period Beginning | At NAV | With Maximum Sales Charge |
| Class C | $10,000 | 09/30/2012 | $18,008 | N.A. |
| Class I, at minimum investment | $1,000,000 | 09/30/2012 | $1,993,088 | N.A. |
See Endnotes and Additional Disclosures in this report.
Past performance is no guarantee of future results. Returns are historical and are calculated by determining the percentage change in net asset value (NAV) or offering price (as applicable) with all distributions reinvested. Furthermore, returns do not reflect the deduction of taxes that shareholders may have to pay on Fund distributions or upon the redemption of Fund shares. Investment return and principal value will fluctuate so that shares, when redeemed, may be worth more or less than their original cost. Performance for periods less than or equal to one year is cumulative. Performance is for the stated time period only; due to market volatility, current Fund performance may be lower or higher than the quoted return. For performance as of the most recent month-end, please refer to www.calvert.com.
Calvert
Mid-Cap Fund
September 30, 2022
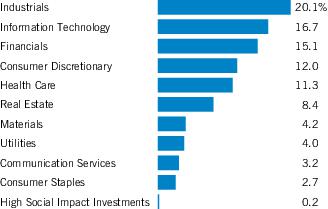
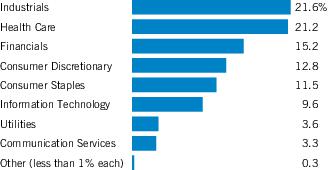
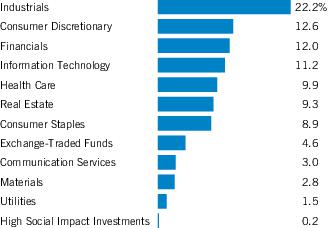
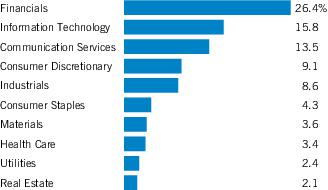
| Sector Allocation (% of net assets)1 |
| Top 10 Holdings (% of net assets)1 | |
| Sysco Corp. | 2.7% |
| Synopsys, Inc. | 2.7 |
| Nordson Corp. | 2.6 |
| Teleflex, Inc. | 2.6 |
| Graco, Inc. | 2.5 |
| Tyler Technologies, Inc. | 2.4 |
| Equity LifeStyle Properties, Inc. | 2.4 |
| Fair Isaac Corp. | 2.4 |
| Microchip Technology, Inc. | 2.4 |
| VeriSign, Inc. | 2.4 |
| Total | 25.1% |
Footnotes:
| 1 | Excludes cash and cash equivalents. |
Calvert
Mid-Cap Fund
September 30, 2022
Endnotes and Additional Disclosures
| † | The views expressed in this report are those of the portfolio manager(s) and are current only through the date stated at the top of this page. These views are subject to change at any time based upon market or other conditions, and Calvert and the Fund(s) disclaim any responsibility to update such views. These views may not be relied upon as investment advice and, because investment decisions are based on many factors, may not be relied upon as an indication of trading intent on behalf of any Calvert fund. This commentary may contain statements that are not historical facts, referred to as “forward-looking statements.” The Fund’s actual future results may differ significantly from those stated in any forward-looking statement, depending on factors such as changes in securities or financial markets or general economic conditions, the volume of sales and purchases of Fund shares, the continuation of investment advisory, administrative and service contracts, and other risks discussed from time to time in the Fund’s filings with the Securities and Exchange Commission. |
| | |
| 1 | Russell Midcap® Index is an unmanaged index of U.S. mid-cap stocks. Unless otherwise stated, index returns do not reflect the effect of any applicable sales charges, commissions, expenses, taxes or leverage, as applicable. It is not possible to invest directly in an index. |
| 2 | Total Returns at NAV do not include applicable sales charges. If sales charges were deducted, the returns would be lower. Total Returns shown with maximum sales charge reflect the stated maximum sales charge. Unless otherwise stated, performance does not reflect the deduction of taxes on Fund distributions or redemptions of Fund shares.Effective November 5, 2020, Class C shares automatically convert to Class A shares eight years after purchase. The average annual total returns listed for Class C reflect conversion to Class A shares after eight years. Prior to November 5, 2020, Class C shares automatically converted to Class A shares ten years after purchase.Calvert Research and Management became the investment adviser to the Fund on December 31, 2016. Performance reflected prior to such date is that of the Fund’s former investment adviser. |
| 3 | Source: Fund prospectus. Net expense ratios reflect a contractual expense reimbursement that continues through 1/31/23. The expense ratios for the current reporting period can be found in the Financial Highlights section of this report. Performance reflects expenses waived and/or reimbursed, if applicable. Without such waivers and/or reimbursements, performance would have been lower. |
| | Fund profile subject to change due to active management. |
| | Additional Information |
| | S&P 500® Index is an unmanaged index of large-cap stocks commonly used as a measure of U.S. stock market performance. Dow Jones Industrial Average® is a price-weighted average of 30 blue-chip stocks that are generally the leaders in their industry. S&P Dow Jones Indices are a product of S&P Dow Jones Indices LLC (“S&P DJI”) and have been licensed for use. S&P® and S&P 500® are registered trademarks of S&P DJI; Dow Jones® is a registered trademark of Dow Jones Trademark Holdings LLC (“Dow Jones”); S&P DJI, Dow Jones and their respective affiliates do not sponsor, endorse, sell or promote the Fund, will not have any liability with respect thereto and do not have any liability for any errors, omissions, or interruptions of the S&P Dow Jones Indices. Nasdaq Composite Index is a market capitalization-weighted index of all domestic and international securities listed on Nasdaq. Source: Nasdaq, Inc. The information is provided by Nasdaq (with its affiliates, are referred to as the “Corporations”) and Nasdaq’s third party licensors on an “as is” basis and the Corporations make no guarantees and bear no liability of any kind with respect to the information or the Fund. |
Calvert
Mid-Cap Fund
September 30, 2022
Example
As a Fund shareholder, you incur two types of costs: (1) transaction costs, including sales charges (loads) on purchases and redemption fees (if applicable); and (2) ongoing costs, including management fees; distribution and/or service fees; and other Fund expenses. This Example is intended to help you understand your ongoing costs (in dollars) of Fund investing and to compare these costs with the ongoing costs of investing in other mutual funds. The Example is based on an investment of $1,000 invested at the beginning of the period and held for the entire period (April 1, 2022 to September 30, 2022).
Actual Expenses
The first section of the table below provides information about actual account values and actual expenses. You may use the information in this section, together with the amount you invested, to estimate the expenses that you paid over the period. Simply divide your account value by $1,000 (for example, an $8,600 account value divided by $1,000 = 8.6), then multiply the result by the number in the first section under the heading entitled “Expenses Paid During Period” to estimate the expenses you paid on your account during this period.
Hypothetical Example for Comparison Purposes
The second section of the table below provides information about hypothetical account values and hypothetical expenses based on the actual Fund expense ratio and an assumed rate of return of 5% per year (before expenses), which is not the actual Fund return. The hypothetical account values and expenses may not be used to estimate the actual ending account balance or expenses you paid for the period. You may use this information to compare the ongoing costs of investing in the Fund and other funds. To do so, compare this 5% hypothetical example with the 5% hypothetical examples that appear in the shareholder reports of the other funds.
Please note that the expenses shown in the table are meant to highlight your ongoing costs only and do not reflect any transactional costs, such as sales charges (loads) or redemption fees (if applicable). Therefore, the second section of the table is useful in comparing ongoing costs only, and will not help you determine the relative total costs of owning different funds. In addition, if these transactional costs were included, your costs would be higher.
| | Beginning
Account Value
(4/1/22) | Ending
Account Value
(9/30/22) | Expenses Paid
During Period*
(4/1/22 – 9/30/22) | Annualized
Expense
Ratio |
| Actual | | | | |
| Class A | $1,000.00 | $ 789.00 | $5.29 ** | 1.18% |
| Class C | $1,000.00 | $ 785.70 | $8.64 ** | 1.93% |
| Class I | $1,000.00 | $ 789.90 | $4.17 ** | 0.93% |
| Hypothetical | | | | |
| (5% return per year before expenses) | | | | |
| Class A | $1,000.00 | $1,019.15 | $5.97 ** | 1.18% |
| Class C | $1,000.00 | $1,015.39 | $9.75 ** | 1.93% |
| Class I | $1,000.00 | $1,020.41 | $4.71 ** | 0.93% |
| * | Expenses are equal to the Fund's annualized expense ratio for the indicated Class, multiplied by the average account value over the period, multiplied by 183/365 (to reflect the one-half year period). The Example assumes that the $1,000 was invested at the net asset value per share determined at the close of business on March 31, 2022. |
| ** | Absent a waiver and/or reimbursement of expenses by an affiliate, expenses would be higher. |
Calvert
Mid-Cap Fund
September 30, 2022
| Security | Shares | Value |
| Auto Components — 3.8% | |
| Aptiv PLC(1) | | 54,950 | $ 4,297,640 |
| Dorman Products, Inc.(1) | | 58,418 | 4,797,286 |
| | | | $ 9,094,926 |
| Banks — 5.0% | |
| Commerce Bancshares, Inc. | | 60,425 | $ 3,997,718 |
| First Republic Bank | | 27,040 | 3,530,072 |
| M&T Bank Corp. | | 24,925 | 4,394,776 |
| | | | $ 11,922,566 |
| Building Products — 1.7% | |
| Trex Co., Inc.(1) | | 93,356 | $ 4,102,063 |
| | | | $ 4,102,063 |
| Capital Markets — 6.3% | |
| LPL Financial Holdings, Inc. | | 17,422 | $ 3,806,358 |
| MarketAxess Holdings, Inc. | | 14,980 | 3,332,900 |
| Raymond James Financial, Inc. | | 50,087 | 4,949,597 |
| Tradeweb Markets, Inc., Class A | | 54,947 | 3,100,110 |
| | | | $ 15,188,965 |
| Chemicals — 2.1% | |
| Quaker Chemical Corp. | | 35,390 | $ 5,109,608 |
| | | | $ 5,109,608 |
| Commercial Services & Supplies — 3.0% | |
| Copart, Inc.(1) | | 23,941 | $ 2,547,322 |
| Rentokil Initial PLC ADR(2) | | 179,368 | 4,719,172 |
| | | | $ 7,266,494 |
| Communications Equipment — 3.1% | |
| F5, Inc.(1) | | 25,025 | $ 3,621,868 |
| Motorola Solutions, Inc. | | 17,273 | 3,868,634 |
| | | | $ 7,490,502 |
| Containers & Packaging — 2.0% | |
| AptarGroup, Inc. | | 51,730 | $ 4,915,902 |
| | | | $ 4,915,902 |
| Distributors — 1.0% | |
| Pool Corp. | | 7,556 | $ 2,404,395 |
| | | | $ 2,404,395 |
| Electric Utilities — 2.0% | |
| Alliant Energy Corp. | | 92,486 | $ 4,900,833 |
| | | | $ 4,900,833 |
| Security | Shares | Value |
| Electrical Equipment — 3.0% | |
| AMETEK, Inc. | | 41,593 | $ 4,717,062 |
| Generac Holdings, Inc.(1) | | 14,529 | 2,588,196 |
| | | | $ 7,305,258 |
| Electronic Equipment, Instruments & Components — 1.4% | |
| TE Connectivity, Ltd. | | 29,626 | $ 3,269,525 |
| | | | $ 3,269,525 |
| Entertainment — 2.3% | |
| Electronic Arts, Inc. | | 47,775 | $ 5,528,045 |
| | | | $ 5,528,045 |
| Equity Real Estate Investment Trusts (REITs) — 8.4% | |
| Equity LifeStyle Properties, Inc. | | 91,628 | $ 5,757,903 |
| Lamar Advertising Co., Class A | | 58,759 | 4,847,030 |
| Mid-America Apartment Communities, Inc. | | 30,857 | 4,784,995 |
| Rexford Industrial Realty, Inc. | | 91,025 | 4,733,300 |
| | | | $ 20,123,228 |
| Food & Staples Retailing — 2.7% | |
| Sysco Corp. | | 93,339 | $ 6,600,001 |
| | | | $ 6,600,001 |
| Health Care Equipment & Supplies — 5.9% | |
| Cooper Cos., Inc. (The) | | 20,794 | $ 5,487,537 |
| IDEXX Laboratories, Inc.(1) | | 7,461 | 2,430,794 |
| Teleflex, Inc. | | 30,962 | 6,237,604 |
| | | | $ 14,155,935 |
| Health Care Providers & Services — 1.5% | |
| R1 RCM, Inc.(1) | | 194,636 | $ 3,606,605 |
| | | | $ 3,606,605 |
| Hotels, Restaurants & Leisure — 1.0% | |
| Wyndham Hotels & Resorts, Inc. | | 38,496 | $ 2,361,730 |
| | | | $ 2,361,730 |
| Insurance — 3.8% | |
| RLI Corp. | | 47,059 | $ 4,817,900 |
| Ryan Specialty Holdings, Inc.(1) | | 105,577 | 4,288,538 |
| | | | $ 9,106,438 |
| Interactive Media & Services — 0.9% | |
| CarGurus, Inc.(1) | | 147,939 | $ 2,096,296 |
| | | | $ 2,096,296 |
7
See Notes to Financial Statements.
Calvert
Mid-Cap Fund
September 30, 2022
Schedule of Investments — continued
| Security | Shares | Value |
| IT Services — 2.4% | |
| VeriSign, Inc.(1) | | 32,524 | $ 5,649,419 |
| | | | $ 5,649,419 |
| Life Sciences Tools & Services — 1.8% | |
| Waters Corp.(1) | | 16,223 | $ 4,372,585 |
| | | | $ 4,372,585 |
| Machinery — 7.2% | |
| Graco, Inc. | | 99,578 | $ 5,969,701 |
| Nordson Corp. | | 29,495 | 6,260,904 |
| Westinghouse Air Brake Technologies Corp. | | 62,773 | 5,106,583 |
| | | | $ 17,337,188 |
| Multiline Retail — 2.2% | |
| Dollar General Corp. | | 21,712 | $ 5,207,840 |
| | | | $ 5,207,840 |
| Multi-Utilities — 2.0% | |
| CMS Energy Corp. | | 80,944 | $ 4,714,179 |
| | | | $ 4,714,179 |
| Pharmaceuticals — 2.1% | |
| Royalty Pharma PLC, Class A | | 125,092 | $ 5,026,197 |
| | | | $ 5,026,197 |
| Road & Rail — 1.6% | |
| Landstar System, Inc. | | 27,139 | $ 3,918,057 |
| | | | $ 3,918,057 |
| Semiconductors & Semiconductor Equipment — 2.4% | |
| Microchip Technology, Inc. | | 92,725 | $ 5,659,007 |
| | | | $ 5,659,007 |
| Software — 7.5% | |
| Fair Isaac Corp.(1) | | 13,877 | $ 5,717,463 |
| Synopsys, Inc.(1) | | 21,475 | 6,560,827 |
| Tyler Technologies, Inc.(1) | | 16,855 | 5,857,113 |
| | | | $ 18,135,403 |
| Specialty Retail — 4.1% | |
| Five Below, Inc.(1) | | 21,570 | $ 2,969,542 |
| Floor & Decor Holdings, Inc., Class A(1) | | 37,226 | 2,615,499 |
| O'Reilly Automotive, Inc.(1) | | 4,178 | 2,938,596 |
| RH (1)(2) | | 5,231 | 1,287,192 |
| | | | $ 9,810,829 |
| Trading Companies & Distributors — 3.5% | |
| Core & Main, Inc., Class A(1) | | 181,659 | $ 4,130,926 |
| Security | Shares | Value |
| Trading Companies & Distributors (continued) | |
| United Rentals, Inc.(1) | | 15,946 | $ 4,307,333 |
| | | | $ 8,438,259 |
Total Common Stocks
(identified cost $247,857,629) | | | $234,818,278 |
| High Social Impact Investments — 0.2% |
| Security | Principal
Amount
(000's omitted) | Value |
| Calvert Impact Capital, Inc., Community Investment Notes, 1.50%, 12/15/23(3)(4) | $ | 360 | $ 334,354 |
Total High Social Impact Investments
(identified cost $360,000) | | | $ 334,354 |
| Short-Term Investments — 4.1% | | | |
| Affiliated Fund — 2.2% |
| Security | Shares | Value |
| Morgan Stanley Institutional Liquidity Funds - Government Portfolio, Institutional Class, 2.80%(5) | | 5,423,426 | $ 5,423,426 |
Total Affiliated Fund
(identified cost $5,423,426) | | | $ 5,423,426 |
| Securities Lending Collateral — 1.9% |
| Security | Shares | Value |
| State Street Navigator Securities Lending Government Money Market Portfolio, 3.07%(6) | | 4,485,280 | $ 4,485,280 |
Total Securities Lending Collateral
(identified cost $4,485,280) | | | $ 4,485,280 |
Total Short-Term Investments
(identified cost $9,908,706) | | | $ 9,908,706 |
Total Investments — 102.0%
(identified cost $258,126,335) | | | $245,061,338 |
| Other Assets, Less Liabilities — (2.0)% | | | $ (4,762,537) |
| Net Assets — 100.0% | | | $ 240,298,801 |
| The percentage shown for each investment category in the Schedule of Investments is based on net assets. |
| (1) | Non-income producing security. |
| (2) | All or a portion of this security was on loan at September 30, 2022. The aggregate market value of securities on loan at September 30, 2022 was $4,765,352. |
| (3) | May be deemed to be an affiliated company (see Note 7). |
8
See Notes to Financial Statements.
Calvert
Mid-Cap Fund
September 30, 2022
Schedule of Investments — continued
| (4) | Restricted security. Total market value of restricted securities amounts to $334,354, which represents 0.2% of the net assets of the Fund as of September 30, 2022. |
| (5) | May be deemed to be an affiliated investment company. The rate shown is the annualized seven-day yield as of September 30, 2022. |
| (6) | Represents investment of cash collateral received in connection with securities lending. |
Restricted Securities
| Description | Acquisition Date | Cost |
| Calvert Impact Capital, Inc., Community Investment Notes, 1.50%, 12/15/23 | 12/14/20 | $360,000 |
| Abbreviations: |
| ADR | – American Depositary Receipt |
9
See Notes to Financial Statements.
Calvert
Mid-Cap Fund
September 30, 2022
Statement of Assets and Liabilities
| | September 30, 2022 |
| Assets | |
Investments in securities of unaffiliated issuers, at value (identified cost $252,342,909) - including
$4,765,352 of securities on loan | $ 239,303,558 |
| Investments in securities of affiliated issuers, at value (identified cost $5,783,426) | 5,757,780 |
| Receivable for capital shares sold | 209,479 |
| Dividends receivable | 96,916 |
| Dividends and interest receivable - affiliated | 10,926 |
| Securities lending income receivable | 15,021 |
| Receivable from affiliate | 2,171 |
| Directors' deferred compensation plan | 144,417 |
| Total assets | $245,540,268 |
| Liabilities | |
| Payable for capital shares redeemed | $ 301,707 |
| Deposits for securities loaned | 4,485,280 |
| Payable to affiliates: | |
| Investment advisory fee | 137,791 |
| Administrative fee | 25,523 |
| Distribution and service fees | 34,937 |
| Sub-transfer agency fee | 11,900 |
| Directors' deferred compensation plan | 144,417 |
| Accrued expenses | 99,912 |
| Total liabilities | $ 5,241,467 |
| Net Assets | $240,298,801 |
| Sources of Net Assets | |
| Paid-in capital | $ 256,490,219 |
| Accumulated loss | (16,191,418) |
| Net Assets | $240,298,801 |
| Class A Shares | |
| Net Assets | $ 138,646,241 |
| Shares Outstanding | 4,828,533 |
Net Asset Value and Redemption Price Per Share
(net assets ÷ shares of beneficial interest outstanding) | $ 28.71 |
Maximum Offering Price Per Share
(100 ÷ 94.75 of net asset value per share) | $ 30.30 |
| Class C Shares | |
| Net Assets | $ 4,611,511 |
| Shares Outstanding | 261,959 |
Net Asset Value and Offering Price Per Share*
(net assets ÷ shares of beneficial interest outstanding) | $ 17.60 |
10
See Notes to Financial Statements.
Calvert
Mid-Cap Fund
September 30, 2022
Statement of Assets and Liabilities — continued
| | September 30, 2022 |
| Class I Shares | |
| Net Assets | $ 97,041,049 |
| Shares Outstanding | 2,745,789 |
Net Asset Value, Offering Price and Redemption Price Per Share
(net assets ÷ shares of beneficial interest outstanding) | $ 35.34 |
| On sales of $50,000 or more, the offering price of Class A shares is reduced. |
| * | Redemption price per share is equal to the net asset value less any applicable contingent deferred sales charge. |
11
See Notes to Financial Statements.
Calvert
Mid-Cap Fund
September 30, 2022
| | Year Ended |
| | September 30, 2022 |
| Investment Income | |
| Dividend income (net of foreign taxes withheld of $662) | $ 3,309,168 |
| Dividend income - affiliated issuers | 19,408 |
| Interest income - affiliated issuers | 5,400 |
| Securities lending income, net | 29,122 |
| Total investment income | $ 3,363,098 |
| Expenses | |
| Investment advisory fee | $ 1,953,735 |
| Administrative fee | 360,689 |
| Distribution and service fees: | |
| Class A | 429,902 |
| Class C | 62,915 |
| Directors' fees and expenses | 13,250 |
| Custodian fees | 6,705 |
| Transfer agency fees and expenses | 376,455 |
| Accounting fees | 68,961 |
| Professional fees | 37,180 |
| Registration fees | 64,816 |
| Reports to shareholders | 29,756 |
| Miscellaneous | 18,705 |
| Total expenses | $ 3,423,069 |
| Waiver and/or reimbursement of expenses by affiliate | $ (135,219) |
| Net expenses | $ 3,287,850 |
| Net investment income | $ 75,248 |
| Realized and Unrealized Gain (Loss) | |
| Net realized gain (loss): | |
| Investment securities | $ 2,440,767 |
| Investment securities - affiliated issuers | (777) |
| Foreign currency transactions | (5,244) |
| Net realized gain | $ 2,434,746 |
| Change in unrealized appreciation (depreciation): | |
| Investment securities | $ (72,510,082) |
| Investment securities - affiliated issuers | (20,023) |
| Net change in unrealized appreciation (depreciation) | $(72,530,105) |
| Net realized and unrealized loss | $(70,095,359) |
| Net decrease in net assets from operations | $(70,020,111) |
12
See Notes to Financial Statements.
Calvert
Mid-Cap Fund
September 30, 2022
Statements of Changes in Net Assets
| | Year Ended September 30, |
| | 2022 | 2021 |
| Increase (Decrease) in Net Assets | | |
| From operations: | | |
| Net investment income (loss) | $ 75,248 | $ (688,234) |
| Net realized gain | 2,434,746 | 40,068,200 |
| Net change in unrealized appreciation (depreciation) | (72,530,105) | 18,161,340 |
| Net increase (decrease) in net assets from operations | $ (70,020,111) | $ 57,541,306 |
| Distributions to shareholders: | | |
| Class A | $ (22,683,407) | $ (1,449,640) |
| Class C | (1,286,728) | (106,024) |
| Class I | (14,188,529) | (801,809) |
| Total distributions to shareholders | $ (38,158,664) | $ (2,357,473) |
| Capital share transactions: | | |
| Class A | $ 17,137,117 | $ 352,323 |
| Class C | (149,927) | (3,016,708) |
| Class I | 17,639,759 | 27,105,326 |
| Net increase in net assets from capital share transactions | $ 34,626,949 | $ 24,440,941 |
| Net increase (decrease) in net assets | $ (73,551,826) | $ 79,624,774 |
| Net Assets | | |
| At beginning of year | $ 313,850,627 | $ 234,225,853 |
| At end of year | $240,298,801 | $313,850,627 |
13
See Notes to Financial Statements.
Calvert
Mid-Cap Fund
September 30, 2022
| | Class A |
| | Year Ended September 30, |
| | 2022 | 2021 | 2020 | 2019 | 2018 |
| Net asset value — Beginning of year | $ 41.79 | $ 33.96 | $ 34.69 | $ 34.84 | $ 33.40 |
| Income (Loss) From Operations | | | | | |
| Net investment income (loss)(1) | $ (0.02) | $ (0.12) | $ 0.05 | $ 0.09 | $ 0.07 |
| Net realized and unrealized gain (loss) | (7.90) | 8.28 | 1.07 | 1.85 | 4.59 |
| Total income (loss) from operations | $ (7.92) | $ 8.16 | $ 1.12 | $ 1.94 | $ 4.66 |
| Less Distributions | | | | | |
| From net investment income | $ — | $ (0.00)(2) | $ (0.03) | $ (0.08) | $ (0.04) |
| From net realized gain | (5.16) | (0.33) | (1.82) | (2.01) | (3.18) |
| Total distributions | $ (5.16) | $ (0.33) | $ (1.85) | $ (2.09) | $ (3.22) |
| Net asset value — End of year | $ 28.71 | $ 41.79 | $ 33.96 | $ 34.69 | $ 34.84 |
| Total Return(3) | (22.06)% | 24.13% | 3.20% | 6.56% | 15.04% |
| Ratios/Supplemental Data | | | | | |
| Net assets, end of year (000’s omitted) | $138,646 | $183,991 | $149,112 | $158,005 | $157,046 |
| Ratios (as a percentage of average daily net assets):(4) | | | | | |
| Total expenses | 1.23% | 1.22% | 1.26% | 1.30% | 1.28% |
| Net expenses | 1.18% (5) | 1.18% | 1.18% | 1.19% | 1.21% |
| Net investment income (loss) | (0.07)% | (0.30)% | 0.15% | 0.27% | 0.22% |
| Portfolio Turnover | 109% | 79% | 70% | 83% | 62% |
| (1) | Computed using average shares outstanding. |
| (2) | Amount is less than $(0.005). |
| (3) | Returns are historical and are calculated by determining the percentage change in net asset value with all distributions reinvested and do not reflect the effect of sales charges, if any. |
| (4) | Total expenses do not reflect amounts reimbursed and/or waived by the adviser and certain of its affiliates, if applicable. Net expenses are net of all reductions and represent the net expenses paid by the Fund. |
| (5) | Includes a reduction by the investment adviser of a portion of its advisory fee due to the Fund’s investment in the Liquidity Fund (equal to less than 0.005% of average daily net assets for the year ended September 30, 2022). |
14
See Notes to Financial Statements.
Calvert
Mid-Cap Fund
September 30, 2022
Financial Highlights — continued
| | Class C |
| | Year Ended September 30, |
| | 2022 | 2021 | 2020 | 2019 | 2018 |
| Net asset value — Beginning of year | $ 27.53 | $ 22.64 | $ 23.83 | $ 24.65 | $ 24.55 |
| Income (Loss) From Operations | | | | | |
| Net investment loss(1) | $ (0.18) | $ (0.28) | $ (0.14) | $ (0.11) | $ (0.12) |
| Net realized and unrealized gain (loss) | (4.78) | 5.50 | 0.73 | 1.23 | 3.27 |
| Total income (loss) from operations | $ (4.96) | $ 5.22 | $ 0.59 | $ 1.12 | $ 3.15 |
| Less Distributions | | | | | |
| From net realized gain | $ (4.97) | $ (0.33) | $ (1.78) | $ (1.94) | $ (3.05) |
| Total distributions | $ (4.97) | $ (0.33) | $ (1.78) | $ (1.94) | $ (3.05) |
| Net asset value — End of year | $ 17.60 | $27.53 | $22.64 | $ 23.83 | $ 24.65 |
| Total Return(2) | (22.63)% | 23.20% | 2.40% | 5.77% | 14.20% |
| Ratios/Supplemental Data | | | | | |
| Net assets, end of year (000’s omitted) | $ 4,612 | $ 7,469 | $ 8,787 | $14,535 | $17,043 |
| Ratios (as a percentage of average daily net assets):(3) | | | | | |
| Total expenses | 1.98% | 1.98% | 2.01% | 2.05% | 2.03% |
| Net expenses | 1.93% (4) | 1.93% | 1.93% | 1.94% | 1.96% |
| Net investment loss | (0.82)% | (1.05)% | (0.62)% | (0.49)% | (0.53)% |
| Portfolio Turnover | 109% | 79% | 70% | 83% | 62% |
| (1) | Computed using average shares outstanding. |
| (2) | Returns are historical and are calculated by determining the percentage change in net asset value with all distributions reinvested and do not reflect the effect of sales charges, if any. |
| (3) | Total expenses do not reflect amounts reimbursed and/or waived by the adviser and certain of its affiliates, if applicable. Net expenses are net of all reductions and represent the net expenses paid by the Fund. |
| (4) | Includes a reduction by the investment adviser of a portion of its advisory fee due to the Fund’s investment in the Liquidity Fund (equal to less than 0.005% of average daily net assets for the year ended September 30, 2022). |
15
See Notes to Financial Statements.
Calvert
Mid-Cap Fund
September 30, 2022
Financial Highlights — continued
| | Class I |
| | Year Ended September 30, |
| | 2022 | 2021 | 2020 | 2019 | 2018 |
| Net asset value — Beginning of year | $ 50.28 | $ 40.77 | $ 41.25 | $ 40.97 | $ 38.70 |
| Income (Loss) From Operations | | | | | |
| Net investment income (loss)(1) | $ 0.09 | $ (0.03) | $ 0.16 | $ 0.21 | $ 0.23 |
| Net realized and unrealized gain (loss) | (9.77) | 9.95 | 1.27 | 2.24 | 5.37 |
| Total income (loss) from operations | $ (9.68) | $ 9.92 | $ 1.43 | $ 2.45 | $ 5.60 |
| Less Distributions | | | | | |
| From net investment income | $ (0.08) | $ (0.08) | $ (0.09) | $ (0.16) | $ (0.15) |
| From net realized gain | (5.18) | (0.33) | (1.82) | (2.01) | (3.18) |
| Total distributions | $ (5.26) | $ (0.41) | $ (1.91) | $ (2.17) | $ (3.33) |
| Net asset value — End of year | $ 35.34 | $ 50.28 | $ 40.77 | $ 41.25 | $ 40.97 |
| Total Return(2) | (21.87)% | 24.45% | 3.45% | 6.85% | 15.48% |
| Ratios/Supplemental Data | | | | | |
| Net assets, end of year (000’s omitted) | $97,041 | $122,391 | $76,327 | $46,533 | $93,198 |
| Ratios (as a percentage of average daily net assets):(3) | | | | | |
| Total expenses | 0.98% | 0.97% | 1.01% | 1.05% | 1.03% |
| Net expenses | 0.93% (4) | 0.93% | 0.93% | 0.91% | 0.86% |
| Net investment income (loss) | 0.20% | (0.06)% | 0.40% | 0.54% | 0.59% |
| Portfolio Turnover | 109% | 79% | 70% | 83% | 62% |
| (1) | Computed using average shares outstanding. |
| (2) | Returns are historical and are calculated by determining the percentage change in net asset value with all distributions reinvested and do not reflect the effect of sales charges, if any. |
| (3) | Total expenses do not reflect amounts reimbursed and/or waived by the adviser and certain of its affiliates, if applicable. Net expenses are net of all reductions and represent the net expenses paid by the Fund. |
| (4) | Includes a reduction by the investment adviser of a portion of its advisory fee due to the Fund’s investment in the Liquidity Fund (equal to less than 0.005% of average daily net assets for the year ended September 30, 2022). |
16
See Notes to Financial Statements.
Calvert
Mid-Cap Fund
September 30, 2022
Notes to Financial Statements
1 Significant Accounting Policies
Calvert Mid-Cap Fund (the Fund) is a diversified series of Calvert World Values Fund, Inc. (the Corporation). The Corporation is a Maryland corporation registered under the Investment Company Act of 1940, as amended (the 1940 Act), as an open-end management investment company. The investment objective of the Fund is to seek to provide long-term capital appreciation by investing primarily in mid-cap stocks.
The Fund offers three classes of shares. Class A shares are generally sold subject to a sales charge imposed at time of purchase. A contingent deferred sales charge of 1.00% (0.80% prior to April 29, 2022) may apply to certain redemptions of Class A shares for accounts for which no sales charge was paid, if redeemed within 12 months of purchase. Class C shares are sold without a front-end sales charge, and with certain exceptions, are charged a contingent deferred sales charge of 1% on shares redeemed within 12 months of purchase. Class C shares are only available for purchase through a financial intermediary. Effective November 5, 2020, Class C shares automatically convert to Class A shares eight years after their purchase as described in the Fund’s prospectus. Class I shares are sold at net asset value, are not subject to a sales charge and are sold only to certain eligible investors. Each class represents a pro rata interest in the Fund, but votes separately on class-specific matters and is subject to different expenses.
The Fund applies the accounting and reporting guidance in the Financial Accounting Standards Board (FASB) Accounting Standards Codification Topic 946, Financial Services – Investment Companies (ASC 946). Subsequent events, if any, through the date that the financial statements were issued have been evaluated in the preparation of the financial statements.
A Investment Valuation— Net asset value per share is determined every business day as of the close of the regular session of the New York Stock Exchange (generally 4:00 p.m. Eastern time). The Fund uses independent pricing services approved by the Board of Directors (the Board) to value its investments wherever possible. Investments for which market quotations are not available or deemed not reliable are fair valued in good faith under the direction of the Board.
U.S. generally accepted accounting principles (U.S. GAAP) establishes a disclosure hierarchy that categorizes the inputs to valuation techniques used to value assets and liabilities at measurement date. These inputs are summarized in the three broad levels listed below:
Level 1 - quoted prices in active markets for identical securities
Level 2 - other significant observable inputs (including quoted prices for similar securities, interest rates, prepayment speeds, credit risk, etc.)
Level 3 - significant unobservable inputs (including the Fund’s own assumptions in determining the fair value of investments)
The inputs or methodologies used for valuing securities are not necessarily an indication of the risk associated with investing in those securities.
Valuation techniques used to value the Fund’s investments by major category are as follows:
Equity Securities. Equity securities (including warrants and rights) listed on a U.S. securities exchange generally are valued at the last sale or closing price as reported by an independent pricing service on the primary market or exchange on which they are traded and are categorized as Level 1 in the hierarchy. Equity securities listed on the NASDAQ National Market System are valued at the NASDAQ official closing price and are categorized as Level 1 in the hierarchy. Unlisted or listed securities for which closing sales prices or closing quotations are not available are valued at the mean between the latest available bid and ask prices and are categorized as Level 2 in the hierarchy.
Debt Securities. Debt securities are generally valued based on valuations provided by third party pricing services, as derived from such services’ pricing models. Inputs to the models may include, but are not limited to, reported trades, executable bid and ask prices, broker/dealer quotations, prices or yields of securities with similar characteristics, interest rates, anticipated prepayments, benchmark curves or information pertaining to the issuer, as well as industry and economic events. Accordingly, debt securities are generally categorized as Level 2 in the hierarchy. Short-term debt securities with a remaining maturity at time of purchase of more than sixty days are valued based on valuations provided by a third party pricing service. Such securities are generally categorized as Level 2 in the hierarchy. Short-term debt securities of sufficient credit quality purchased with remaining maturities of sixty days or less for which a valuation from a third party pricing service is not readily available may be valued at amortized cost, which approximates fair value, and are categorized as Level 2 in the hierarchy.
Other Securities. Investments in management investment companies (including money market funds) that do not trade on an exchange are valued at the net asset value as of the close of each business day and are categorized as Level 1 in the hierarchy.
Fair Valuation. In connection with Rule 2a-5 of the 1940 Act, which became effective September 8, 2022, the Board has designated the Fund’s investment adviser as its valuation designee. Investments for which valuations or market quotations are not readily available or are deemed unreliable are valued by the investment adviser, as valuation designee, at fair value using methods that most fairly reflect the security’s “fair value”, which is the amount that the Fund might reasonably expect to receive for the security upon its current sale in the ordinary course. Each such determination is based on a consideration of relevant factors, which are likely to vary from one pricing context to another. These factors may include, but are not limited to, the type of security, the existence of any contractual restrictions on the security’s disposition, the price and extent of public trading in similar securities of the issuer or of comparable companies or entities, quotations or relevant information obtained from broker/dealers or other market participants, information obtained from the issuer, analysts, and/or the appropriate stock exchange (for exchange-traded securities), an analysis of the company’s or entity’s financial statements, and an evaluation of the forces that influence the issuer and the market(s) in which the security is purchased and sold.
Calvert
Mid-Cap Fund
September 30, 2022
Notes to Financial Statements — continued
The values assigned to fair value investments are based on available information and do not necessarily represent amounts that might ultimately be realized. Further, due to the inherent uncertainty of valuations of such investments, the fair values may differ significantly from the values that would have been used had an active market existed, and the differences could be material.
The following table summarizes the market value of the Fund's holdings as of September 30, 2022, based on the inputs used to value them:
| Asset Description | Level 1 | Level 2 | Level 3 | Total |
| Common Stocks | $ 234,818,278(1) | $ — | $ — | $ 234,818,278 |
| High Social Impact Investments | — | 334,354 | — | 334,354 |
| Short-Term Investments: | | | | |
| Affiliated Fund | 5,423,426 | — | — | 5,423,426 |
| Securities Lending Collateral | 4,485,280 | — | — | 4,485,280 |
| Total Investments | $244,726,984 | $334,354 | $ — | $245,061,338 |
| (1) | The level classification by major category of investments is the same as the category presentation in the Schedule of Investments. |
B Investment Transactions and Income— Investment transactions for financial statement purposes are accounted for on trade date. Realized gains and losses are recorded on an identified cost basis and may include proceeds from litigation. Dividend income is recorded on the ex-dividend date for dividends received in cash and/or securities or, in the case of dividends on certain foreign securities, as soon as the Fund is informed of the ex-dividend date. Non-cash dividends are recorded at the fair value of the securities received. Withholding taxes on foreign dividends, if any, have been provided for in accordance with the Fund's understanding of the applicable country’s tax rules and rates. Distributions received that represent a return of capital are recorded as a reduction of cost of investments. Distributions received that represent a capital gain are recorded as a realized gain. Interest income, which includes amortization of premium and accretion of discount on debt securities, is accrued as earned.
C Share Class Accounting— Realized and unrealized gains and losses and net investment income and losses, other than class-specific expenses, are allocated daily to each class of shares based upon the relative net assets of each class to the total net assets of the Fund. Expenses arising in connection with a specific class are charged directly to that class.
D Foreign Currency Transactions— The Fund’s accounting records are maintained in U.S. dollars. For valuation of assets and liabilities on each date of net asset value determination, foreign denominations are converted into U.S. dollars using the current exchange rate. Security transactions, income and expenses are translated at the prevailing rate of exchange on the date of the event. Recognized gains or losses on investment transactions attributable to changes in foreign currency exchange rates are recorded for financial statement purposes as net realized gains and losses on investments. That portion of unrealized gains and losses on investments that results from fluctuations in foreign currency exchange rates is not separately disclosed.
E Restricted Securities— The Fund may invest in securities that are subject to legal or contractual restrictions on resale. Generally, these securities may only be sold publicly upon registration under the Securities Act of 1933 or in transactions exempt from such registration. Information regarding restricted securities (excluding Rule 144A securities) is included at the end of the Schedule of Investments.
F Distributions to Shareholders— Distributions to shareholders are recorded by the Fund on ex-dividend date. Distributions from net investment income and distributions from net realized capital gains, if any, are paid at least annually. Distributions are declared separately for each class of shares. Distributions are determined in accordance with income tax regulations, which may differ from U.S. GAAP; accordingly, periodic reclassifications are made within the Fund's capital accounts to reflect income and gains available for distribution under income tax regulations.
G Estimates— The preparation of financial statements in conformity with U.S. GAAP requires management to make estimates and assumptions that affect the reported amounts of assets and liabilities and disclosure of contingent assets and liabilities at the date of the financial statements and the reported amounts of increases and decreases in net assets from operations during the reporting period. Actual results could differ from those estimates.
H Indemnifications— The Corporation’s By-Laws provide for indemnification for Directors or officers of the Corporation and certain other parties, to the fullest extent permitted by Maryland law and the 1940 Act, provided certain conditions are met. Additionally, in the normal course of business, the Fund enters into agreements with service providers that may contain indemnification clauses. The Fund’s maximum exposure under these arrangements is unknown as this would involve future claims that may be made against the Fund that have not yet occurred.
I Federal Income Taxes— No provision for federal income or excise tax is required since the Fund intends to continue to qualify as a regulated investment company under the Internal Revenue Code and to distribute substantially all of its taxable earnings.
Management has analyzed the Fund's tax positions taken for all open federal income tax years and has concluded that no provision for federal income tax is required in the Fund's financial statements. A Fund's federal tax return is subject to examination by the Internal Revenue Service for a period of three years from the date of filing.
Calvert
Mid-Cap Fund
September 30, 2022
Notes to Financial Statements — continued
2 Related Party Transactions
The investment advisory fee is earned by Calvert Research and Management (CRM), an indirect, wholly-owned subsidiary of Morgan Stanley, as compensation for investment advisory services rendered to the Fund. The investment advisory fee is computed at the annual rate of 0.65% of the Fund's average daily net assets and is payable monthly. For the year ended September 30, 2022, the investment advisory fee amounted to $1,953,735.
Effective April 26, 2022, the Fund may invest in a money market fund, the Institutional Class of the Morgan Stanley Institutional Liquidity Funds - Government Portfolio (the “Liquidity Fund”), an open-end management investment company managed by Morgan Stanley Investment Management Inc., a wholly-owned subsidiary of Morgan Stanley. The investment advisory fee paid by the Fund is reduced by an amount equal to its pro-rata share of the advisory and administration fees paid by the Fund due to its investment in the Liquidity Fund. For the year ended September 30, 2022, the investment advisory fee paid was reduced by $1,882 relating to the Fund’s investment in the Liquidity Fund. Prior to April 26, 2022, the Fund may have invested its cash in Calvert Cash Reserves Fund, LLC (Cash Reserves Fund), an affiliated investment company managed by CRM. CRM did not receive a fee for advisory services provided to Cash Reserves Fund.
CRM has agreed to reimburse the Fund’s operating expenses to the extent that total annual operating expenses (relating to ordinary operating expenses only and excluding expenses such as brokerage commissions, acquired fund fees and expenses of unaffiliated funds, borrowing costs, taxes or litigation expenses) exceed 1.18%, 1.93% and 0.93% for Class A, Class C and Class I, respectively, of such class's average daily net assets. The expense reimbursement agreement with CRM may be changed or terminated after January 31, 2023. For the year ended September 30, 2022, CRM waived or reimbursed expenses of $133,337.
The administrative fee is earned by CRM as compensation for administrative services rendered to the Fund. The fee is computed at an annual rate of 0.12% of the Fund’s average daily net assets attributable to Class A, Class C and Class I and is payable monthly. For the year ended September 30, 2022, CRM was paid administrative fees of $360,689.
The Fund has in effect a distribution plan for Class A shares (Class A Plan) pursuant to Rule 12b-1 under the 1940 Act. Pursuant to the Class A Plan, the Fund pays Eaton Vance Distributors, Inc. (EVD), an affiliate of CRM and the Fund’s principal underwriter, a distribution and service fee of 0.25% per annum of its average daily net assets attributable to Class A shares for distribution services and facilities provided to the Fund by EVD, as well as for personal services and/or the maintenance of shareholder accounts. The Fund also has in effect a distribution plan for Class C shares (Class C Plan) pursuant to Rule 12b-1 under the 1940 Act. Pursuant to the Class C Plan, the Fund pays EVD amounts equal to 0.75% per annum of its average daily net assets attributable to Class C shares for providing ongoing distribution services and facilities to the Fund. In addition, pursuant to the Class C Plan, the Fund also makes payments of service fees to EVD, financial intermediaries and other persons in amounts equal to 0.25% per annum of its average daily net assets attributable to that class. Service fees paid or accrued are for personal services and/or the maintenance of shareholder accounts. Distribution and service fees paid or accrued for the year ended September 30, 2022 amounted to $429,902 and $62,915 for Class A shares and Class C shares, respectively.
The Fund was informed that EVD received $20,841 as its portion of the sales charge on sales of Class A shares for the year ended September 30, 2022. The Fund was also informed that EVD received less than $100 and $267 of contingent deferred sales charges paid by Class A and Class C shareholders, respectively, for the same period.
Eaton Vance Management (EVM), an affiliate of CRM, provides sub-transfer agency and related services to the Fund pursuant to a Sub-Transfer Agency Support Services Agreement. For the year ended September 30, 2022, sub-transfer agency fees and expenses incurred to EVM amounted to $65,421 and are included in transfer agency fees and expenses on the Statement of Operations.
Each Director of the Fund who is not an employee of CRM or its affiliates receives an annual fee of $214,000 ($154,000 prior to January 1, 2022), plus an annual Committee fee ranging from $8,500 to $16,500 depending on the Committee. The Board chair receives an additional $30,000 annual fee, Committee chairs receive an additional $6,000 annual fee and the special equities liaison receives an additional $2,500 annual fee. Eligible Directors may participate in a Deferred Compensation Plan (the Plan). Amounts deferred under the Plan are treated as though equal dollar amounts had been invested in shares of the Fund or other Calvert funds selected by the Directors. The Fund purchases shares of the funds selected equal to the dollar amounts deferred under the Plan, resulting in an asset equal to the deferred compensation liability. Obligations of the Plan are paid solely from the Fund's assets. Directors’ fees are allocated to each of the Calvert funds served. Salaries and fees of officers and Directors of the Fund who are employees of CRM or its affiliates are paid by CRM.
3 Investment Activity
During the year ended September 30, 2022, the cost of purchases and proceeds from sales of investments, other than short-term securities, were $322,507,785 and $324,110,541, respectively.
Calvert
Mid-Cap Fund
September 30, 2022
Notes to Financial Statements — continued
4 Distributions to Shareholders and Income Tax Information
The tax character of distributions declared for the years ended September 30, 2022 and September 30, 2021 was as follows:
| | Year Ended September 30, |
| | 2022 | 2021 |
| Ordinary income | $ 4,740,634 | $ 165,389 |
| Long-term capital gains | $33,418,030 | $2,192,084 |
During the year ended September 30, 2022, accumulated loss was increased by $1,457 and paid-in capital was increased by $1,457 due to differences between book and tax accounting. These reclassifications had no effect on the net assets or net asset value per share of the Fund.
As of September 30, 2022, the components of distributable earnings (accumulated loss) on a tax basis were as follows:
| Post October capital losses | $ (3,048,302) |
| Late year ordinary losses | (29,021) |
| Net unrealized depreciation | (13,114,095) |
| Accumulated loss | $(16,191,418) |
At September 30, 2022, the Fund had a late year ordinary loss of $29,021 which it has elected to defer to the following taxable year pursuant to income tax regulations. Late year ordinary losses represent certain specified losses realized in that portion of a taxable year after October 31 that are treated as ordinary for tax purposes plus ordinary losses attributable to that portion of a taxable year after December 31.
Additionally, at September 30, 2022, the Fund had a net capital loss of $3,048,302 attributable to security transactions incurred after October 31, 2021 that it has elected to defer. This net capital loss is treated as arising on the first day of the Fund's taxable year ending September 30, 2023.
The cost and unrealized appreciation (depreciation) of investments of the Fund at September 30, 2022, as determined on a federal income tax basis, were as follows:
| Aggregate cost | $258,175,433 |
| Gross unrealized appreciation | $ 8,856,589 |
| Gross unrealized depreciation | (21,970,684) |
| Net unrealized depreciation | $ (13,114,095) |
5 Securities Lending
To generate additional income, the Fund may lend its securities pursuant to a securities lending agency agreement with State Street Bank and Trust Company (SSBT), the securities lending agent. Security loans are subject to termination by the Fund at any time and, therefore, are not considered illiquid investments. The Fund requires that the loan be continuously collateralized by either cash or securities in an amount at least equal to the market value of the securities on loan. The market value of securities loaned is determined daily and any additional required collateral is delivered to the Fund on the next business day. Cash collateral is generally invested in a money market fund registered under the 1940 Act that is managed by an affiliate of SSBT. Any gain or loss in the market price of the loaned securities that might occur and any interest earned or dividends declared during the term of the loan would accrue to the account of the Fund. Income earned on the investment of collateral, net of broker rebates and other expenses incurred by the securities lending agent, is split between the Fund and the securities lending agent based on agreed upon contractual terms. Non-cash collateral, if any, is held by the lending agent on behalf of the Fund and cannot be sold or re-pledged by the Fund; accordingly, such collateral is not reflected in the Statement of Assets and Liabilities.
The risks associated with lending portfolio securities include, but are not limited to, possible delays in receiving additional collateral or in the recovery of the loaned securities, possible loss of rights to the collateral should the borrower fail financially, as well as risk of loss in the value of the collateral or the value of the investments made with the collateral. The securities lending agent shall indemnify the Fund in the case of default of any securities borrower.
Calvert
Mid-Cap Fund
September 30, 2022
Notes to Financial Statements — continued
At September 30, 2022, the total value of securities on loan was $4,765,352 and the total value of collateral received was $4,853,948, comprised of cash of $4,485,280 and U.S. government and/or agencies securities of $368,668.
The following table provides a breakdown of securities lending transactions accounted for as secured borrowings, the obligations by class of collateral pledged, and the remaining contractual maturity of those transactions as of September 30, 2022.
| | Remaining Contractual Maturity of the Transactions |
| | Overnight and
Continuous | <30 days | 30 to 90 days | >90 days | Total |
| Common Stocks | $4,485,280 | $ — | $ — | $ — | $4,485,280 |
The carrying amount of the liability for deposits for securities loaned at September 30, 2022 approximated its fair value. If measured at fair value, such liability would have been considered as Level 2 in the fair value hierarchy (see Note 1A) at September 30, 2022.
6 Line of Credit
The Fund participates with other portfolios and funds managed by EVM and its affiliates, including CRM, in an $800 million unsecured line of credit with a group of banks, which is in effect through October 25, 2022. Borrowings are made by the Fund solely for temporary purposes related to redemptions and other short-term cash needs. Interest is charged to the Fund based on its borrowings at an amount above either the Secured Overnight Financing Rate (SOFR) or Federal Funds rate. In addition, a fee computed at an annual rate of 0.15% on the daily unused portion of the line of credit is allocated among the participating portfolios and funds at the end of each quarter. In connection with the renewal of the agreement in October 2021, an arrangement fee of $150,000 was incurred that was allocated to the participating portfolios and funds. Because the line of credit is not available exclusively to the Fund, it may be unable to borrow some or all of its requested amounts at any particular time.
The Fund had no borrowings outstanding pursuant to its line of credit at September 30, 2022. The Fund did not have any significant borrowings or allocated fees during the year ended September 30, 2022. Effective October 25, 2022, the Fund renewed its line of credit agreement, which expires October 24, 2023. In connection with the renewal, the borrowing limit was decreased to $725 million.
7 Affiliated Companies and Funds
The Fund has invested a portion of its assets in notes (the Notes) issued by Calvert Impact Capital, Inc. (CIC) pursuant to exemptive relief granted by the U.S. Securities and Exchange Commission (the SEC). There are certain potential points of affiliation between the Fund and CIC. CRM has licensed use of the Calvert name to CIC and provides other types of support. CRM’s President and Chief Executive Officer (and the only director/trustee on the Fund Board that is an “interested person” of the Fund) serves on the CIC Board. In addition, another director/trustee on the Fund Board serves as a director emeritus on the CIC Board.
At September 30, 2022, the value of the Fund’s investment in the Notes and affiliated funds was $5,757,780, which represents 2.4% of the Fund’s net assets. Transactions in the Notes and affiliated funds by the Fund for the year ended September 30, 2022 were as follows:
| Name | Value,
beginning
of period | Purchases | Sales
proceeds | Net
realized
gain
(loss) | Change in
unrealized
appreciation
(depreciation) | Value,
end of
period | Interest/
Dividend
income | Principal amount/
Units/Shares,
end of period |
| High Social Impact Investments | | | | | | | | |
| Calvert Impact Capital, Inc., Community Investment Notes, 1.50%, 12/15/23(1) | $ 353,819 | $ — | $ — | $ — | $ (19,465) | $ 334,354 | $ 5,400 | $ 360,000 |
| Short-Term Investments | | | | | | |
| Cash Reserves Fund | 5,583,915 | 26,366,998 | (31,949,578) | (777) | (558) | — | 1,031 | — |
| Liquidity Fund | — | 38,745,254 | (33,321,828) | — | — | 5,423,426 | 18,377 | 5,423,426 |
| Total | | | | $(777) | $(20,023) | $5,757,780 | $24,808 | |
Calvert
Mid-Cap Fund
September 30, 2022
Notes to Financial Statements — continued
8 Capital Shares
The Corporation may issue its shares in one or more series (such as the Fund). The authorized shares of the Fund consist of 75,000,000 common shares, $0.01 par value, for each Class.
Transactions in capital shares for the years ended September 30, 2022 and September 30, 2021 were as follows:
| | Year Ended
September 30, 2022 | | Year Ended
September 30, 2021 |
| | Shares | Amount | | Shares | Amount |
| Class A | | | | | |
| Shares sold | 347,775 | $ 12,598,312 | | 375,750 | $ 15,160,623 |
| Reinvestment of distributions | 569,411 | 21,853,997 | | 36,990 | 1,395,999 |
| Shares redeemed | (511,755) | (18,074,158) | | (465,944) | (18,704,612) |
| Converted from Class C | 20,522 | 758,966 | | 65,033 | 2,500,313 |
| Net increase | 425,953 | $ 17,137,117 | | 11,829 | $ 352,323 |
| Class C | | | | | |
| Shares sold | 18,402 | $ 425,732 | | 39,443 | $ 1,049,807 |
| Reinvestment of distributions | 53,032 | 1,255,259 | | 4,145 | 103,674 |
| Shares redeemed | (47,986) | (1,071,952) | | (62,534) | (1,669,876) |
| Converted to Class A | (32,755) | (758,966) | | (97,920) | (2,500,313) |
| Net decrease | (9,307) | $ (149,927) | | (116,866) | $ (3,016,708) |
| Class I | | | | | |
| Shares sold | 1,148,431 | $ 52,061,444 | | 1,050,276 | $ 50,894,880 |
| Reinvestment of distributions | 296,205 | 13,963,127 | | 17,429 | 789,688 |
| Shares redeemed | (1,133,056) | (48,384,812) | | (505,501) | (24,579,242) |
| Net increase | 311,580 | $ 17,639,759 | | 562,204 | $ 27,105,326 |
9 Risks and Uncertainties
Pandemic Risk
An outbreak of respiratory disease caused by a novel coronavirus was first detected in China in late 2019 and subsequently spread internationally. This coronavirus has resulted in closing borders, enhanced health screenings, changes to healthcare service preparation and delivery, quarantines, cancellations, disruptions to supply chains and customer activity, as well as general concern and uncertainty. Health crises caused by outbreaks of disease, such as the coronavirus outbreak, may exacerbate other pre-existing political, social and economic risks and disrupt normal market conditions and operations. The impact of this outbreak has negatively affected the worldwide economy, as well as the economies of individual countries and industries, and could continue to affect the market in significant and unforeseen ways. Other epidemics and pandemics that may arise in the future may have similar effects. Any such impact could adversely affect the Fund's performance, or the performance of the securities in which the Fund invests.
Calvert
Mid-Cap Fund
September 30, 2022
Report of Independent Registered Public Accounting Firm
To the Board of Directors of Calvert World Values Fund, Inc. and Shareholders of Calvert Mid-Cap Fund:
Opinion on the Financial Statements and Financial Highlights
We have audited the accompanying statement of assets and liabilities of Calvert Mid-Cap Fund (the "Fund") (one of the funds constituting Calvert World Values Fund, Inc.), including the schedule of investments, as of September 30, 2022, the related statement of operations for the year then ended, the statements of changes in net assets and the financial highlights for each of the two years in the period then ended, and the related notes. In our opinion, the financial statements and financial highlights present fairly, in all material respects, the financial position of the Fund as of September 30, 2022, and the results of its operations for the year then ended, and the changes in its net assets and the financial highlights for each of the two years in the period then ended, in conformity with accounting principles generally accepted in the United States of America. The financial highlights for the years ended September 30, 2020, 2019, and 2018 were audited by other auditors whose report, dated November 20, 2020, expressed an unqualified opinion on those financial highlights.
Basis for Opinion
These financial statements and financial highlights are the responsibility of the Fund's management. Our responsibility is to express an opinion on the Fund's financial statements and financial highlights based on our audits. We are a public accounting firm registered with the Public Company Accounting Oversight Board (United States) (PCAOB) and are required to be independent with respect to the Fund in accordance with the U.S. federal securities laws and the applicable rules and regulations of the Securities and Exchange Commission and the PCAOB.
We conducted our audits in accordance with the standards of the PCAOB. Those standards require that we plan and perform the audit to obtain reasonable assurance about whether the financial statements and financial highlights are free of material misstatement, whether due to error or fraud. The Fund is not required to have, nor were we engaged to perform, an audit of its internal control over financial reporting. As part of our audits, we are required to obtain an understanding of internal control over financial reporting but not for the purpose of expressing an opinion on the effectiveness of the Fund’s internal control over financial reporting. Accordingly, we express no such opinion.
Our audits included performing procedures to assess the risks of material misstatement of the financial statements and financial highlights, whether due to error or fraud, and performing procedures that respond to those risks. Such procedures included examining, on a test basis, evidence regarding the amounts and disclosures in the financial statements and financial highlights. Our audits also included evaluating the accounting principles used and significant estimates made by management, as well as evaluating the overall presentation of the financial statements and financial highlights. Our procedures included confirmation of securities owned as of September 30, 2022, by correspondence with the custodian and brokers; when replies were not received from brokers, we performed other auditing procedures. We believe that our audits provide a reasonable basis for our opinion.
/s/ Deloitte & Touche LLP
Boston, Massachusetts
November 22, 2022
We have served as the auditor of one or more Calvert investment companies since 2021.
Calvert
Mid-Cap Fund
September 30, 2022
Federal Tax Information (Unaudited)
The Form 1099-DIV you receive in February 2023 will show the tax status of all distributions paid to your account in calendar year 2022. Shareholders are advised to consult their own tax adviser with respect to the tax consequences of their investment in the Fund. As required by the Internal Revenue Code and/or regulations, shareholders must be notified regarding the status of qualified dividend income for individuals, the dividends received deduction for corporations and capital gains dividends.
Qualified Dividend Income. For the fiscal year ended September 30, 2022, the Fund designates approximately $2,601,665, or up to the maximum amount of such dividends allowable pursuant to the Internal Revenue Code, as qualified dividend income eligible for the reduced tax rate of 15%.
Dividends Received Deduction. Corporate shareholders are generally entitled to take the dividends received deduction on the portion of the Fund's dividend distribution that qualifies under tax law. For the Fund's fiscal 2022 ordinary income dividends, 38.53% qualifies for the corporate dividends received deduction.
Capital Gains Dividends. The Fund hereby designates as a capital gain dividend with respect to the taxable year ended September 30, 2022, $4,726,203 or, if subsequently determined to be different, the net capital gain of such year.
Calvert
Mid-Cap Fund
September 30, 2022
Board of Directors' Contract Approval
Overview of the Contract Review Process
The Investment Company Act of 1940, as amended, provides, in substance, that each investment advisory agreement between a fund and its investment adviser will continue in effect from year to year only if its continuation is approved at least annually by the fund’s board of directors, including by a vote of a majority of the directors who are not “interested persons” of the fund (“Independent Directors”), cast in person at a meeting called for the purpose of considering such approval.
At a video conference meeting of the Boards of Trustees/Directors (each a “Board”) of the registered investment companies advised by Calvert Research and Management (“CRM” or the “Adviser”) (the “Calvert Funds”) held on June 14, 2022, the Board, including a majority of the Independent Directors, voted to approve continuation of existing investment advisory and investment sub-advisory agreements for the Calvert Funds for an additional one-year period. The meeting was held by video conference due to circumstances related to current or potential effects of COVID-19 pursuant to temporary exemptive relief issued by the Securities and Exchange Commission.
In evaluating the investment advisory and investment sub-advisory agreements for the Calvert Funds, the Board considered a variety of information relating to the Calvert Funds and various service providers, including the Adviser. The Independent Directors reviewed a report prepared by the Adviser regarding various services provided to the Calvert Funds by the Adviser and its affiliates. Such report included, among other data, information regarding the Adviser’s personnel and the Adviser’s revenue and cost of providing services to the Calvert Funds, and a separate report prepared by an independent data provider, which compared each fund’s investment performance, fees and expenses to those of comparable funds as identified by such independent data provider (“comparable funds”).
The Independent Directors were separately represented by independent legal counsel with respect to their consideration of the continuation of the investment advisory and investment sub-advisory agreements for the Calvert Funds. Prior to voting, the Independent Directors reviewed the proposed continuation of the Calvert Funds’ investment advisory and investment sub-advisory agreements with management and also met in private sessions with their counsel at which time no representatives of management were present.
The information that the Board considered included, among other things, the following (for funds that invest through one or more affiliated underlying fund(s), references to “each fund” in this section may include information that was considered at the underlying fund-level):
Information about Fees, Performance and Expenses
| • | A report from an independent data provider comparing the advisory and related fees paid by each fund with fees paid by comparable funds; |
| • | A report from an independent data provider comparing each fund’s total expense ratio and its components to comparable funds; |
| • | A report from an independent data provider comparing the investment performance of each fund to the investment performance of comparable funds over various time periods; |
| • | Data regarding investment performance in comparison to benchmark indices; |
| • | For each fund, comparative information concerning the fees charged and the services provided by the Adviser in managing other accounts (including mutual funds, other collective investment funds and institutional accounts) using investment strategies and techniques similar to those used in managing such fund; |
| • | Profitability analyses for the Adviser with respect to each fund; |
Information about Portfolio Management and Trading
| • | Descriptions of the investment management services provided to each fund, including investment strategies and processes it employs; |
| • | Information about the Adviser’s policies and practices with respect to trading, including the Adviser’s processes for monitoring best execution of portfolio transactions; |
| • | Information about the allocation of brokerage transactions and the benefits received by the Adviser as a result of brokerage allocation, including information concerning the acquisition of research through client commission arrangements and policies with respect to “soft dollars”; |
Information about the Adviser
| • | Reports detailing the financial results and condition of CRM; |
| • | Descriptions of the qualifications, education and experience of the individual investment professionals whose responsibilities include portfolio management and investment research for the funds, and information relating to their compensation and responsibilities with respect to managing other mutual funds and investment accounts; |
| • | Policies and procedures relating to proxy voting and the handling of corporate actions and class actions; |
| • | A description of CRM’s procedures for overseeing sub-advisers, including with respect to regulatory and compliance issues, investment management and other matters; |
Calvert
Mid-Cap Fund
September 30, 2022
Board of Directors' Contract Approval — continued
Other Relevant Information
| • | Information concerning the nature, cost and character of the administrative and other non-investment advisory services provided by CRM and its affiliates; and |
| • | The terms of each investment advisory agreement. |
Over the course of the year, the Board and its committees held regular quarterly meetings. During these meetings, the Directors participated in investment and performance reviews with the portfolio managers and other investment professionals of the Adviser relating to each fund, and considered various investment and trading strategies used in pursuing each fund’s investment objective(s), such as the use of derivative instruments, as well as risk management techniques. The Board and its committees also evaluated issues pertaining to industry and regulatory developments, compliance procedures, corporate governance and other issues with respect to the funds, and received and participated in reports and presentations provided by CRM and its affiliates with respect to such matters. In addition to the formal meetings of the Board and its committees, the Independent Directors held regular video conferences in between meetings to discuss, among other topics, matters relating to the continuation of the Calvert Funds’ investment advisory and investment sub-advisory agreements.
For funds that invest through one or more affiliated underlying funds, the Board considered similar information about the underlying fund(s) when considering the approval of investment advisory agreements. In addition, in cases where the Adviser has engaged a sub-adviser, the Board considered similar information about the sub-adviser when considering the approval of any investment sub-advisory agreement.
The Independent Directors were assisted throughout the contract review process by their independent legal counsel. The Independent Directors relied upon the advice of such counsel and their own business judgment in determining the material factors to be considered in evaluating each investment advisory and investment sub-advisory agreement and the weight to be given to each such factor. The Board, including the Independent Directors, did not identify any single factor as controlling, and each Director may have attributed different weight to various factors.
Results of the Contract Review Process
Based on its consideration of the foregoing, and such other information as it deemed relevant, including the factors and conclusions described below, the Board, including the Independent Directors, concluded that the continuation of the investment advisory agreement of Calvert Mid-Cap Fund (the “Fund”), including the fee payable under the agreement, is in the best interests of the Fund’s shareholders. Accordingly, the Board, including a majority of the Independent Directors, voted to approve the continuation of the investment advisory agreement of the Fund.
Nature, Extent and Quality of Services
In considering the nature, extent and quality of the services provided by the Adviser under the investment advisory agreement, the Board reviewed information provided by the Adviser relating to its operations and personnel, including, among other information, biographical information on the Adviser’s investment personnel and descriptions of its organizational and management structure. The Board also took into account similar information provided periodically throughout the previous year by the Adviser as well as the Board’s familiarity with management through Board meetings, discussions and other reports. The Board considered the Adviser’s management style and its performance in employing its investment strategies as well as its current level of staffing and overall resources. The Board also noted that it reviewed on a quarterly basis information regarding the Adviser’s compliance with applicable policies and procedures, including those related to personal investing. The Board took into account, among other items, periodic reports received from the Adviser over the past year concerning the Adviser’s ongoing review and enhancement of certain processes, policies and procedures of the Calvert Funds and the Adviser. The Board concluded that it was satisfied with the nature, extent and quality of services provided to the Fund by the Adviser under the investment advisory agreement.
Fund Performance
In considering the Fund’s performance, the Board noted that it reviewed on a quarterly basis detailed information about the Fund’s performance results, portfolio composition and investment strategies. The Board compared the Fund’s investment performance to that of the Fund’s peer universe and its benchmark index. The Board’s review included comparative performance data for the one-, three- and five-year periods ended December 31, 2021. This performance data indicated that the Fund had underperformed the median of its peer universe and its benchmark index for the one-, three- and five-year periods ended December 31, 2021. The Board took into account management’s discussion of the Fund’s performance and anticipated portfolio management changes. Based upon its review, the Board concluded that the Fund’s performance was satisfactory relative to the performance of its peer universe and its benchmark index.
Management Fees and Expenses
In considering the Fund’s fees and expenses, the Board compared the Fund’s fees and total expense ratio with those of comparable funds in its expense group. Among other findings, the data indicated that the Fund’s advisory and administrative fees (after taking into account waivers and/or reimbursements) (referred to collectively as “management fees”) and the Fund’s total expenses (net of waivers and/or reimbursements) were each below the respective median of the Fund’s expense group. The Board took into account the Adviser’s current undertaking to maintain expense limitations for the Fund and that the Adviser was waiving and/or reimbursing a portion of the Fund’s expenses. Based upon its review, the Board concluded that the management fees were reasonable in view of the nature, extent and quality of services provided by the Adviser.
Calvert
Mid-Cap Fund
September 30, 2022
Board of Directors' Contract Approval — continued
Profitability and Other “Fall-Out” Benefits
The Board reviewed the Adviser’s profitability in regard to the Fund and the Calvert Funds in the aggregate. In reviewing the overall profitability of the Fund to the Adviser, the Board also considered the fact that the Adviser and its affiliates provided sub-transfer agency support, administrative and distribution services to the Fund for which they received compensation. The information considered by the Board included the profitability of the Fund to the Adviser and its affiliates without regard to any marketing support or other payments by the Adviser and its affiliates to third parties in respect of distribution services. The Board also considered that the Adviser and its affiliates derived benefits to their reputation and other indirect benefits from their relationships with the Fund. Based upon its review, the Board concluded that the Adviser’s and its affiliates’ level of profitability from their relationships with the Fund was reasonable.
Economies of Scale
The Board considered the effect of the Fund’s current size and its potential growth on its performance and fees. The Board concluded that adding breakpoints to the advisory fee at specified asset levels would not be appropriate at this time. The Board noted that if the Fund’s assets increased over time, the Fund might realize other economies of scale if assets increased proportionally more than certain other expenses.
Calvert
Mid-Cap Fund
September 30, 2022
Liquidity Risk Management Program
The Fund has implemented a written liquidity risk management program (Program) and related procedures to manage its liquidity in accordance with Rule 22e-4 under the Investment Company Act of 1940, as amended (Liquidity Rule). The Liquidity Rule defines “liquidity risk” as the risk that a fund could not meet requests to redeem shares issued by the fund without significant dilution of the remaining investors’ interests in the fund. The Fund’s Board of Trustees/Directors has designated the investment adviser to serve as the administrator of the Program and the related procedures. The administrator has established a Liquidity Risk Management Oversight Committee (Committee) to perform the functions necessary to administer the Program. As part of the Program, the administrator is responsible for identifying illiquid investments and categorizing the relative liquidity of the Fund’s investments in accordance with the Liquidity Rule. Under the Program, the administrator assesses, manages, and periodically reviews the Fund’s liquidity risk, and is responsible for making certain reports to the Fund’s Board of Trustees/Directors and the Securities and Exchange Commission (SEC) regarding the liquidity of the Fund’s investments, and to notify the Board of Trustees/Directors and the SEC of certain liquidity events specified in the Liquidity Rule. The liquidity of the Fund’s portfolio investments is determined based on a number of factors including, but not limited to, relevant market, trading and investment-specific considerations under the Program.
At a meeting of the Fund’s Board of Trustees/Directors on June 14, 2022, the Committee provided a written report to the Fund’s Board of Trustees/ Directors pertaining to the operation, adequacy, and effectiveness of implementation of the Program, as well as the operation of the highly liquid investment minimum (if applicable) for the period January 1, 2021 through December 31, 2021 (Review Period). The Program operated effectively during the Review Period, supporting the administrator’s ability to assess, manage and monitor Fund liquidity risk, including during periods of market volatility and net redemptions. During the Review Period, the Fund met redemption requests on a timely basis.
There can be no assurance that the Program will achieve its objectives in the future. Please refer to the Fund’s prospectus for more information regarding the Fund’s exposure to liquidity risk and other principal risks to which an investment in the Fund may be subject.
Calvert
Mid-Cap Fund
September 30, 2022
Management and Organization
Fund Management. The Directors of Calvert World Values Fund, Inc. (the Corporation) are responsible for the overall management and supervision of the affairs of the Corporation. The Board members and officers of the Corporation are listed below. Except as indicated, each individual has held the office shown or other offices in the same company for the last five years. Board members hold indefinite terms of office. Each Board member holds office until his or her successor is elected and qualified, or until his or her earlier death, resignation, retirement, removal or disqualification. Under the terms of the Fund's current Board member retirement policy, an Independent Board member must retire at the end of the calendar year in which he or she turns 75. However, if such retirement would cause the Fund to be out of compliance with Section 16 of the 1940 Act or any other regulations or guidance of the SEC, then such retirement will not become effective until such time as action has been taken for the Fund to be in compliance therewith. The “noninterested Directors” consist of those Directors who are not “interested persons” of the Corporation, as that term is defined under the 1940 Act. The business address of each Board member and the Chief Compliance Officer is 1825 Connecticut Avenue NW, Suite 400, Washington, DC 20009 and the business address of the Secretary, Vice President and Chief Legal Officer and the Treasurer is Two International Place, Boston, Massachusetts 02110. As used below, “CRM” refers to Calvert Research and Management and “Eaton Vance” refers to Eaton Vance Management. Each Director oversees 42 funds in the Calvert fund complex. Effective March 1, 2021, each of Eaton Vance and CRM are indirect wholly-owned subsidiaries of Morgan Stanley. Each officer affiliated with CRM may hold a position with other CRM affiliates that is comparable to his or her position with CRM listed below.
| Name and Year of Birth | Corporation
Position(s) | Length of
Service | Principal Occupation(s) and Other Directorships
During Past Five Years and Other Relevant Experience |
| Interested Director |
John H. Streur(1)
1960 | Director and
President | Since 2015 | President and Chief Executive Officer of CRM (since December 31, 2016). President and Chief Executive Officer of Calvert Investments, Inc.
(January 2015 - December 2016); Chief Executive Officer of Calvert
Investment Distributors, Inc. (August 2015 - December 2016); Chief
Compliance Officer of Calvert Investment Management, Inc. (August 2015 -
April 2016); President and Director, Portfolio 21 Investments, Inc.
(through October 2014); President, Chief Executive Officer and
Director, Managers Investment Group LLC (through January 2012);
President and Director, The Managers Funds and Managers AMG
Funds (through January 2012).
Other Directorships. Portfolio 21 Investments, Inc. (asset management)
(through October 2014); Managers Investment Group LLC (asset management)
(through January 2012); The Managers Funds (asset management)
(through January 2012); Managers AMG Funds (asset management)
(through January 2012); Calvert Impact Capital, Inc. |
| Noninterested Directors |
Richard L. Baird, Jr.
1948 | Director | Since 2005 | Regional Disaster Recovery Lead, American Red Cross of Greater
Pennsylvania (since 2017). Volunteer, American Red Cross (since 2015).
Former President and CEO of Adagio Health Inc. (retired in 2014) in
Pittsburgh, PA.
Other Directorships. None. |
Alice Gresham Bullock
1950 | Chair and
Director | Since 2016 | Professor Emerita at Howard University School of Law. Dean Emerita of
Howard University School of Law and Deputy Director of the Association
of American Law Schools (1992-1994).
Other Directorships. None. |
Cari M. Dominguez
1949 | Director | Since 2016 | Former Chair of the U.S. Equal Employment Opportunity Commission.
Other Directorships. ManpowerGroup Inc. (workforce solutions company);
Triple S Management Corporation (managed care); National Association of Corporate Directors. |
John G. Guffey, Jr.
1948 | Director | Since 1992 | President of Aurora Press Inc., a privately held publisher of trade
paperbacks (since January 1997).
Other Directorships. Calvert Impact Capital, Inc. (through December 31, 2018); Calvert Ventures, LLC. |
Miles D. Harper, III
1962 | Director | Since 2005 | Partner, Carr Riggs & Ingram (public accounting firm) since October 2014.
Partner, Gainer Donnelly & Desroches (public accounting firm) (now Carr
Riggs & Ingram) (November 1999 - September 2014).
Other Directorships. Bridgeway Funds (9) (asset management). |
Joy V. Jones
1950 | Director | Since 2005 | Attorney.
Other Directorships. Palm Management Corporation. |
Calvert
Mid-Cap Fund
September 30, 2022
Management and Organization — continued
| Name and Year of Birth | Corporation
Position(s) | Length of
Service | Principal Occupation(s) and Other Directorships
During Past Five Years and Other Relevant Experience |
| Noninterested Directors (continued) |
Anthony A. Williams
1951 | Director | Since 2016 | CEO and Executive Director of the Federal City Council (July 2012 to
present); Senior Adviser and Independent Consultant for King and
Spalding LLP (September 2015 to present); Executive Director of Global
Government Practice at the Corporate Executive Board (January 2010 to
January 2012).
Other Directorships. Freddie Mac; Evoq Properties/Meruelo Maddux
Properties, Inc. (real estate management); Weston Solutions, Inc.
(environmental services); Bipartisan Policy Center’s Debt Reduction Task Force;
Chesapeake Bay Foundation; Catholic University of America; Urban Institute (research organization); The Howard Hughes Corporation (real estate development); Old Dominion National Bank. |
| Name and Year of Birth | Corporation
Position(s) | Length of
Service | Principal Occupation(s)
During Past Five Years |
| Principal Officers who are not Directors |
Hope L. Brown
1973 | Chief
Compliance
Officer | Since 2014 | Chief Compliance Officer of 42 registered investment companies advised
by CRM (since 2014). Vice President and Chief Compliance Officer,
Wilmington Funds (2012-2014). |
Deidre E. Walsh
1971 | Secretary,
Vice President
and Chief
Legal Officer | Since 2021 | Vice President of CRM and officer of 42 registered investment companies
advised by CRM (since 2021). Also Vice President of Eaton Vance and
certain of its affiliates and officer of 136 registered investment companies
advised or administered by Eaton Vance. |
James F. Kirchner
1967 | Treasurer | Since 2016 | Vice President of CRM and officer of 42 registered investment companies
advised by CRM (since 2016). Also Vice President of Eaton Vance and
certain of its affiliates and officer of 136 registered investment companies
advised or administered by Eaton Vance. |
| | | | |
| (1) Mr. Streur is an interested person of the Fund because of his positions with the Fund’s adviser and certain affiliates. |
The SAI for the Fund includes additional information about the Directors and officers of the Fund and can be obtained without charge on Calvert’s website at www.calvert.com or by calling 1-800-368-2745.
| FACTS | WHAT DOES EATON VANCE DO WITH YOUR
PERSONAL INFORMATION? |
| Why? | Financial companies choose how they share your personal information. Federal law gives consumers the right to limit some but not all sharing. Federal law also requires us to tell you how we collect, share, and protect your personal information. Please read this notice carefully to understand what we do. |
| |
| What? | The types of personal information we collect and share depend on the product or service you have with us. This information can include:■ Social Security number and income
■
investment experience and risk tolerance
■
checking account number and wire transfer instructions |
| |
| How? | All financial companies need to share customers’ personal information to run their everyday business. In the section below, we list the reasons financial companies can share their customers’ personal information; the reasons Eaton Vance chooses to share; and whether you can limit this sharing. |
Reasons we can share your
personal information | Does Eaton Vance
share? | Can you limit
this sharing? |
| For our everyday business purposes — such as to process your transactions, maintain your account(s), respond to court orders and legal investigations, or report to credit bureaus | Yes | No |
| For our marketing purposes — to offer our products and services to you | Yes | No |
| For joint marketing with other financial companies | No | We don’t share |
| For our investment management affiliates’ everyday business purposes — information about your transactions, experiences, and creditworthiness | Yes | Yes |
| For our affiliates’ everyday business purposes — information about your transactions and experiences | Yes | No |
| For our affiliates’ everyday business purposes — information about your creditworthiness | No | We don’t share |
| For our investment management affiliates to market to you | Yes | Yes |
| For our affiliates to market to you | No | We don’t share |
| For nonaffiliates to market to you | No | We don’t share |
To limit our
sharing | Call toll-free 1-800-368-2745 or email: CRMPrivacy@calvert.comPlease note:If you are a new customer, we can begin sharing your information 30 days from the date we sent this notice. When you are no longer our customer, we continue to share your information as described in this notice. However, you can contact us at any time to limit our sharing. |
| Questions? | Call toll-free 1-800-368-2745 or email: CRMPrivacy@calvert.com |
| Privacy Notice — continued | April 2021 |
| Who we are |
| Who is providing this notice? | Eaton Vance Management, Eaton Vance Distributors, Inc., Eaton Vance Trust Company, Eaton Vance Management (International) Limited, Eaton Vance Advisers International Ltd., Eaton Vance Global Advisors Limited, Eaton Vance Management’s Real Estate Investment Group, Boston Management and Research, Calvert Research and Management, Eaton Vance and Calvert Fund Families and our investment advisory affiliates (“Eaton Vance”) (see Investment Management Affiliates definition below) |
| What we do |
How does Eaton Vance
protect my personal
information? | To protect your personal information from unauthorized access and use, we use security measures that comply with federal law. These measures include computer safeguards and secured files and buildings. We have policies governing the proper handling of customer information by personnel and requiring third parties that provide support to adhere to appropriate security standards with respect to such information. |
How does Eaton Vance
collect my personal
information? | We collect your personal information, for example, when you■ open an account or make deposits or withdrawals from your account
■
buy securities from us or make a wire transfer
■
give us your contact informationWe also collect your personal information from others, such as credit bureaus, affiliates, or other companies. |
| Why can’t I limit all sharing? | Federal law gives you the right to limit only■ sharing for affiliates’ everyday business purposes — information about your creditworthiness
■
affiliates from using your information to market to you
■
sharing for nonaffiliates to market to youState laws and individual companies may give you additional rights to limit sharing. See below for more on your rights under state law. |
| Definitions |
Investment Management
Affiliates | Eaton Vance Investment Management Affiliates include registered investment advisers, registered broker- dealers, and registered and unregistered funds. Investment Management Affiliates does not include entities associated with Morgan Stanley Wealth Management, such as Morgan Stanley Smith Barney LLC and Morgan Stanley & Co. |
| Affiliates | Companies related by common ownership or control. They can be financial and nonfinancial companies.■ Our affiliates include companies with a Morgan Stanley name and financial companies such as Morgan Stanley Smith Barney LLC and Morgan Stanley & Co. |
| Nonaffiliates | Companies not related by common ownership or control. They can be financial and nonfinancial companies.■ Eaton Vance does not share with nonaffiliates so they can market to you. |
| Joint marketing | A formal agreement between nonaffiliated financial companies that together market financial products or services to you.■ Eaton Vance doesn’t jointly market. |
| Other important information |
| Vermont: Except as permitted by law, we will not share personal information we collect about Vermont residents with Nonaffiliates unless you provide us with your written consent to share such information.California: Except as permitted by law, we will not share personal information we collect about California residents with Nonaffiliates and we will limit sharing such personal information with our Affiliates to comply with California privacy laws that apply to us. |
Delivery of Shareholder Documents. The Securities and Exchange Commission (SEC) permits funds to deliver only one copy of shareholder documents, including prospectuses, proxy statements and shareholder reports, to fund investors with multiple accounts at the same residential or post office box address. This practice is often called “householding” and it helps eliminate duplicate mailings to shareholders. Calvert funds, or your financial intermediary, may household the mailing of your documents indefinitely unless you instruct Calvert funds, or your financial intermediary, otherwise. If you would prefer that your Calvert fund documents not be householded, please contact Calvert funds at 1-800-368-2745, or contact your financial intermediary. Your instructions that householding not apply to delivery of your Calvert fund documents will typically be effective within 30 days of receipt by Calvert funds or your financial intermediary.
Portfolio Holdings. Each Calvert fund files a schedule of portfolio holdings on Part F to Form N-PORT with the SEC. Certain information filed on Form N-PORT may be viewed on the Calvert website at www.calvert.com, by calling Calvert at 1-800-368-2745 or in the EDGAR database on the SEC’s website at www.sec.gov.
Proxy Voting. The Proxy Voting Guidelines that each Calvert fund uses to determine how to vote proxies relating to portfolio securities is provided as an Appendix to the fund’s Statement of Additional Information. The Statement of Additional Information can be obtained free of charge by calling the Calvert funds at 1-800-368-2745, by visiting the Calvert funds’ website at www.calvert.com or visiting the SEC’s website at www.sec.gov. Information regarding how a Calvert fund voted proxies relating to portfolio securities during the most recent 12-month period ended June 30 is available by calling Calvert funds, by visiting the Calvert funds’ website at www.calvert.com or by visiting the SEC’s website at www.sec.gov.
This Page Intentionally Left Blank
This Page Intentionally Left Blank
This Page Intentionally Left Blank
Investment Adviser and Administrator
Calvert Research and Management
1825 Connecticut Avenue NW, Suite 400
Washington, DC 20009
Principal Underwriter*
Eaton Vance Distributors, Inc.
Two International Place
Boston, MA 02110
(617) 482-8260
Custodian
State Street Bank and Trust Company
State Street Financial Center, One Lincoln Street
Boston, MA 02111
Transfer Agent
DST Asset Manager Solutions, Inc.
2000 Crown Colony Drive
Quincy, MA 02169
Independent Registered Public Accounting Firm
Deloitte & Touche LLP
200 Berkeley Street
Boston, MA 02116-5022
Fund Offices
1825 Connecticut Avenue NW, Suite 400
Washington, DC 20009
* FINRA BrokerCheck. Investors may check the background of their Investment Professional by contacting the Financial Industry Regulatory Authority (FINRA). FINRA BrokerCheck is a free tool to help investors check the professional background of current and former FINRA-registered securities firms and brokers. FINRA BrokerCheck is available by calling 1-800-289-9999 and at www.FINRA.org. The FINRA BrokerCheck brochure describing this program is available to investors at www.FINRA.org.
Printed on recycled paper.
24209 9.30.22
Calvert
Emerging Markets Equity Fund
Annual Report
September 30, 2022
Commodity Futures Trading Commission Registration. The Commodity Futures Trading Commission (“CFTC”) has adopted regulations that subject registered investment companies and advisers to regulation by the CFTC if a fund invests more than a prescribed level of its assets in certain CFTC-regulated instruments (including futures, certain options and swap agreements) or markets itself as providing investment exposure to such instruments. The adviser has claimed an exclusion from the definition of “commodity pool operator” under the Commodity Exchange Act with respect to its management of the Fund and the other funds it manages. Accordingly, neither the Fund nor the adviser is subject to CFTC regulation.
Fund shares are not insured by the FDIC and are not deposits or other obligations of, or guaranteed by, any depository institution. Shares are subject to investment risks, including possible loss of principal invested.
This report must be preceded or accompanied by a current summary prospectus or prospectus. Before investing, investors should consider carefully the investment objective, risks, and charges and expenses of a mutual fund. This and other important information is contained in the summary prospectus and prospectus, which can be obtained from a financial intermediary. Prospective investors should read the prospectus carefully before investing. For further information, please call 1-800-368-2745.
Choose Planet-friendly E-delivery!
Sign up now for on-line statements, prospectuses, and fund reports. In less than five minutes you can help reduce paper mail and lower fund costs.
Just go to www.calvert.com. If you already have an online account with the Calvert funds, click on Login to access your Account and select the documents you would like to receive via e-mail.
If you’re new to online account access, click on Login, then Register to create your user name and password. Once you’re in, click on the E-delivery sign-up on the Account Portfolio page and follow the quick, easy steps.
Note: If your shares are not held directly with the Calvert funds but through a brokerage firm, you must contact your broker for electronic delivery options available through their firm.
Annual Report September 30, 2022
Calvert
Emerging Markets Equity Fund
Calvert
Emerging Markets Equity Fund
September 30, 2022
Management's Discussion of Fund Performance†
Economic and Market Conditions
Emerging markets struggled during the 12-month period ended September 30, 2022, as appetites for taking on investment risk faded in light of the Ukraine War, rising U.S. interest rates to combat inflation, and COVID-19 lockdowns in China. The benchmark MSCI Emerging Markets Index (the Index) returned -28.11% during the period.
In March 2022, the U.S. Federal Reserve (the Fed) hiked the federal funds rate for the first time in more than three years and central banks in developed markets followed its lead. Central banks in emerging markets had been well ahead of the Fed, starting with Brazil, which began raising rates in March 2021. Nevertheless, as the Fed hiked rates, nearly all emerging-market currencies depreciated in value against the stronger U.S. dollar, and currency volatility hit highs not seen since the beginning of the pandemic.
Asia ex-Japan underperformed the Index, pulled down by the growth-sensitive markets of South Korea and Taiwan as the outlook for global trade deteriorated during the period. Rising inflation, supply-chain disruptions, fears of a drop in consumer demand, and recessionary worries fanned a technology sell-off that dealt a blow to the semiconductors and technology hardware industries.
Chinese stocks within the Index returned -22.44% during the first three quarters of 2022 due to muted economic activities. Consumer sentiment was weighed down by uncertainties over China’s COVID-19 policy and weakness in its real estate market. Geopolitical tensions with Taiwan and reduced investor appetite for risk assets globally further contributed to the stock market’s overall decline during the period.
The ASEAN — Association of Southeast Asian Nations — economic bloc was a bright spot during the period, benefiting from the reopening of markets for many commodity-exporting countries.
In the latter part of the period, expectations rose that interest rates might continue to climb. In August, the Fed and other central banks reaffirmed their priority to fight inflation by easing economic growth and slowing consumer demand. Concerns over the impact of higher prices and borrowing costs heightened fears of an economic recession. This sentiment drove a sharp rise in bond yields and a sell-off in stocks during the final quarter of the period.
Fund Performance
For the 12-month period ended September 30, 2022, Calvert Emerging Markets Equity Fund (the Fund) returned -31.79% for Class A shares at net asset value (NAV), underperforming its benchmark, the Index, which returned -28.11%.
The Fund’s security selections — most notably in Brazil, Russia, and Malaysia — detracted from performance relative to the Index during the period. The Fund’s lack of exposure to the energy markets of Saudi Arabia, Kuwait, and Qatar; and an underweight exposure to the United Arab Emirates also detracted from relative returns.
Yandex LLC, a diversified Russian provider of e-commerce services, detracted from relative Fund performance during the period. Yandex’s share price fell sharply in anticipation of Russia’s invasion of Ukraine. By period-end, the Fund sold its position in the stock.
The share price of Natura & Co. Holding SA (Natura), a Brazilian beauty care products provider, fell after the company reported lower revenues in the first quarter of 2022. The stock price was also weakened by investor concerns that appreciation of Brazil’s currency — the real — made Natura’s products less competitive in global markets. By period-end, the Fund sold its position in the stock.
Techtronic Industries Co. Ltd. (Techtronic), a Hong Kong-based manufacturer of cordless power tools primarily for the U.S. construction industry, detracted from returns relative to the Index during the period. Techtronic’s share price fell in part due to investors’ rotation away from growth equities to value stocks during the period, and on concerns about a slowdown of U.S. housing activity, and a potential recession.
On the up side, security selections in Mexico and Taiwan contributed to performance relative to the Index. The Fund’s underweight allocation to — and eventual exit from Russia in February 2022 — also contributed to relative performance during the period. Overweight allocations to commodity-exporting markets — including Chile, Peru, Indonesia, and Mexico — benefited from positive trade terms and further enhanced relative performance. An overweight exposure to India also contributed to relative returns during the period.
Bank Rakyat Indonesia (Bank Rakyat), one of the largest and oldest banks in the southeast Asian island nation, contributed to performance relative to the Index during the period. Bank Rakyat’s share price rose on expectations for strong economic growth that would support the expansion and profitability of the bank’s micro loan business. Bank Rakyat’s profitability was driven by the bank’s high yield assets and low-cost funding during the period.
ICICI Bank Ltd. (ICICI), one of India’s largest private banks, also contributed to relative returns during the period. ICICI’s share price rose after the bank reported core operating profit growth based on its strong loan business, fee income, asset quality, and the provisioning of funds to anticipate potential losses.
The Fund’s lack of exposure to Gazprom, Russia’s state-owned gas company, contributed to relative returns during the period as Russian stocks were removed from the Index following the country’s invasion of Ukraine in February 2022.
See Endnotes and Additional Disclosures in this report.
Past performance is no guarantee of future results. Returns are historical and are calculated by determining the percentage change in net asset value (NAV) or offering price (as applicable) with all distributions reinvested. Furthermore, returns do not reflect the deduction of taxes that shareholders may have to pay on Fund distributions or upon the redemption of Fund shares. Investment return and principal value will fluctuate so that shares, when redeemed, may be worth more or less than their original cost. Performance for periods less than or equal to one year is cumulative. Performance is for the stated time period only; due to market volatility, current Fund performance may be lower or higher than the quoted return. For performance as of the most recent month-end, please refer to www.calvert.com.
Calvert
Emerging Markets Equity Fund
September 30, 2022
Performance
Portfolio Manager(s) Kunjal Gala and Vivek Bhutoria, CFA, each of Hermes Investment Management Limited
| % Average Annual Total Returns1,2 | Class
Inception Date | Performance
Inception Date | One Year | Five Years | Since Inception |
| Class A at NAV | 10/29/2012 | 10/29/2012 | (31.79)% | (2.27)% | 3.15% |
| Class A with 5.25% Maximum Sales Charge | — | — | (35.36) | (3.32) | 2.59 |
| Class C at NAV | 10/29/2012 | 10/29/2012 | (32.30) | (3.01) | 2.46 |
| Class C with 1% Maximum Deferred Sales Charge | — | — | (32.97) | (3.01) | 2.46 |
| Class I at NAV | 10/29/2012 | 10/29/2012 | (31.59) | (2.00) | 3.47 |
| Class R6 at NAV | 02/01/2018 | 10/29/2012 | (31.55) | (1.97) | 3.49 |
|
| MSCI Emerging Markets Index | — | — | (28.11)% | (1.81)% | 1.17% |
| % Total Annual Operating Expense Ratios3 | Class A | Class C | Class I | Class R6 |
| Gross | 1.27% | 2.02% | 1.02% | 0.94% |
| Net | 1.24 | 1.99 | 0.99 | 0.92 |
Growth of $10,000
This graph shows the change in value of a hypothetical investment of $10,000 in Class A of the Fund for the period indicated. For comparison, the same investment is shown in the indicated index.
| Growth of Investment2 | Amount Invested | Period Beginning | At NAV | With Maximum Sales Charge |
| Class C | $10,000 | 10/29/2012 | $12,728 | N.A. |
| Class I, at minimum investment | $1,000,000 | 10/29/2012 | $1,403,060 | N.A. |
| Class R6, at minimum investment | $5,000,000 | 10/29/2012 | $7,026,942 | N.A. |
See Endnotes and Additional Disclosures in this report.
Past performance is no guarantee of future results. Returns are historical and are calculated by determining the percentage change in net asset value (NAV) or offering price (as applicable) with all distributions reinvested. Furthermore, returns do not reflect the deduction of taxes that shareholders may have to pay on Fund distributions or upon the redemption of Fund shares. Investment return and principal value will fluctuate so that shares, when redeemed, may be worth more or less than their original cost. Performance for periods less than or equal to one year is cumulative. Performance is for the stated time period only; due to market volatility, current Fund performance may be lower or higher than the quoted return. For performance as of the most recent month-end, please refer to www.calvert.com.
Calvert
Emerging Markets Equity Fund
September 30, 2022
| Sector Allocation (% of net assets)1 |
| Top 10 Holdings (% of net assets)1 | |
| Taiwan Semiconductor Manufacturing Co., Ltd. | 8.1% |
| Samsung Electronics Co., Ltd. | 5.6 |
| Tencent Holdings, Ltd. | 3.9 |
| Alibaba Group Holding, Ltd. | 3.8 |
| Bank Rakyat Indonesia Persero Tbk PT | 3.6 |
| JD.com, Inc., Class A | 3.5 |
| ICICI Bank, Ltd. | 3.0 |
| NARI Technology Co., Ltd., Class A | 2.8 |
| Delta Electronics, Inc. | 2.7 |
| AIA Group, Ltd. | 2.4 |
| Total | 39.4% |
Footnotes:
| 1 | Excludes cash and cash equivalents. |
Calvert
Emerging Markets Equity Fund
September 30, 2022
Endnotes and Additional Disclosures
| † | The views expressed in this report are those of the portfolio manager(s) and are current only through the date stated at the top of this page. These views are subject to change at any time based upon market or other conditions, and Calvert and the Fund(s) disclaim any responsibility to update such views. These views may not be relied upon as investment advice and, because investment decisions are based on many factors, may not be relied upon as an indication of trading intent on behalf of any Calvert fund. This commentary may contain statements that are not historical facts, referred to as “forward-looking statements.” The Fund’s actual future results may differ significantly from those stated in any forward-looking statement, depending on factors such as changes in securities or financial markets or general economic conditions, the volume of sales and purchases of Fund shares, the continuation of investment advisory, administrative and service contracts, and other risks discussed from time to time in the Fund’s filings with the Securities and Exchange Commission. |
| | |
| 1 | MSCI Emerging Markets Index is an unmanaged index of emerging markets common stocks. MSCI indexes are net of foreign withholding taxes. Source: MSCI. MSCI data may not be reproduced or used for any other purpose. MSCI provides no warranties, has not prepared or approved this report, and has no liability hereunder. Unless otherwise stated, index returns do not reflect the effect of any applicable sales charges, commissions, expenses, taxes or leverage, as applicable. It is not possible to invest directly in an index. |
| 2 | Total Returns at NAV do not include applicable sales charges. If sales charges were deducted, the returns would be lower. Total Returns shown with maximum sales charge reflect the stated maximum sales charge. Unless otherwise stated, performance does not reflect the deduction of taxes on Fund distributions or redemptions of Fund shares.Performance prior to the inception date of a class may be linked to the performance of an older class of the Fund. This linked performance is adjusted for any applicable sales charge, but is not adjusted for class expense differences. If adjusted for such differences, the performance would be different. The performance of Class R6 is linked to Class I. Performance since inception for an index, if presented, is the performance since the Fund’s or oldest share class’ inception, as applicable. Performance presented in the Financial Highlights included in the financial statements is not linked.Effective November 5, 2020, Class C shares automatically convert to Class A shares eight years after purchase. The average annual total returns listed for Class C reflect conversion to Class A shares after eight years. Prior to November 5, 2020, Class C shares automatically converted to Class A shares ten years after purchase. |
| | Calvert Research and Management became the investment adviser to the Fund on December 31, 2016. Performance reflected prior to such date is that of the Fund’s former investment adviser. |
| 3 | Source: Fund prospectus. Net expense ratios reflect a contractual expense reimbursement that continues through 1/31/23. The expense ratios for the current reporting period can be found in the Financial Highlights section of this report. Performance reflects expenses waived and/or reimbursed, if applicable. Without such waivers and/or reimbursements, performance would have been lower. |
| Fund profile subject to change due to active management. |
| | Important Notice to Shareholders |
| | Effective November 22, 2022, Christopher Clube was added as a portfolio manager to the Fund. |
Calvert
Emerging Markets Equity Fund
September 30, 2022
Example
As a Fund shareholder, you incur two types of costs: (1) transaction costs, including sales charges (loads) on purchases and redemption fees (if applicable); and (2) ongoing costs, including management fees; distribution and/or service fees; and other Fund expenses. This Example is intended to help you understand your ongoing costs (in dollars) of Fund investing and to compare these costs with the ongoing costs of investing in other mutual funds. The Example is based on an investment of $1,000 invested at the beginning of the period and held for the entire period (April 1, 2022 to September 30, 2022).
Actual Expenses
The first section of the table below provides information about actual account values and actual expenses. You may use the information in this section, together with the amount you invested, to estimate the expenses that you paid over the period. Simply divide your account value by $1,000 (for example, an $8,600 account value divided by $1,000 = 8.6), then multiply the result by the number in the first section under the heading entitled “Expenses Paid During Period” to estimate the expenses you paid on your account during this period.
Hypothetical Example for Comparison Purposes
The second section of the table below provides information about hypothetical account values and hypothetical expenses based on the actual Fund expense ratio and an assumed rate of return of 5% per year (before expenses), which is not the actual Fund return. The hypothetical account values and expenses may not be used to estimate the actual ending account balance or expenses you paid for the period. You may use this information to compare the ongoing costs of investing in the Fund and other funds. To do so, compare this 5% hypothetical example with the 5% hypothetical examples that appear in the shareholder reports of the other funds.
Please note that the expenses shown in the table are meant to highlight your ongoing costs only and do not reflect any transactional costs, such as sales charges (loads) or redemption fees (if applicable). Therefore, the second section of the table is useful in comparing ongoing costs only, and will not help you determine the relative total costs of owning different funds. In addition, if these transactional costs were included, your costs would be higher.
| | Beginning
Account Value
(4/1/22) | Ending
Account Value
(9/30/22) | Expenses Paid
During Period*
(4/1/22 – 9/30/22) | Annualized
Expense
Ratio |
| Actual | | | | |
| Class A | $1,000.00 | $ 774.60 | $ 5.52** | 1.24% |
| Class C | $1,000.00 | $ 771.50 | $ 8.84** | 1.99% |
| Class I | $1,000.00 | $ 775.40 | $ 4.41** | 0.99% |
| Class R6 | $1,000.00 | $ 775.90 | $ 4.10** | 0.92% |
| Hypothetical | | | | |
| (5% return per year before expenses) | | | | |
| Class A | $1,000.00 | $1,018.85 | $ 6.28** | 1.24% |
| Class C | $1,000.00 | $1,015.09 | $10.05 ** | 1.99% |
| Class I | $1,000.00 | $1,020.10 | $ 5.01** | 0.99% |
| Class R6 | $1,000.00 | $1,020.46 | $ 4.66** | 0.92% |
| * | Expenses are equal to the Fund's annualized expense ratio for the indicated Class, multiplied by the average account value over the period, multiplied by 183/365 (to reflect the one-half year period). The Example assumes that the $1,000 was invested at the net asset value per share determined at the close of business on March 31, 2022. |
| ** | Absent a waiver and/or reimbursement of expenses by an affiliate, expenses would be higher. |
Calvert
Emerging Markets Equity Fund
September 30, 2022
| Security | Shares | Value |
| Brazil — 3.7% | |
| Hapvida Participacoes e Investimentos S.A.(1) | | 33,759,334 | $ 47,375,153 |
| Magazine Luiza S.A.(2) | | 23,235,600 | 19,297,133 |
| WEG S.A. | | 3,038,600 | 18,104,240 |
| | | | $ 84,776,526 |
| Chile — 1.9% | |
| Banco de Chile | | 480,791,357 | $ 42,321,242 |
| | | | $ 42,321,242 |
| China — 26.4% | |
| Alibaba Group Holding, Ltd.(2) | | 8,655,527 | $ 86,376,410 |
| Autohome, Inc. ADR | | 938,203 | 26,982,718 |
| China Communications Services Corp., Ltd., Class H | | 59,585,534 | 20,032,434 |
| China Merchants Bank Co., Ltd., Class H | | 4,217,000 | 19,515,676 |
| Hangzhou Tigermed Consulting Co., Ltd., Class A | | 2,279,046 | 29,174,735 |
| Hundsun Technologies, Inc., Class A | | 7,086,277 | 33,718,746 |
| JD.com, Inc., Class A | | 3,148,537 | 79,431,865 |
| Meituan, Class B(1)(2) | | 1,945,300 | 40,883,284 |
| Midea Group Co., Ltd. | | 4,291,662 | 29,751,325 |
| NARI Technology Co., Ltd., Class A | | 17,995,877 | 62,758,269 |
| Silergy Corp. | | 644,000 | 8,399,012 |
| Sungrow Power Supply Co., Ltd. | | 2,356,540 | 36,504,270 |
| Tencent Holdings, Ltd. | | 2,610,592 | 88,176,161 |
| WuXi Biologics Cayman, Inc.(1)(2) | | 3,934,000 | 23,418,480 |
| Wuxi Lead Intelligent Equipment Co., Ltd. | | 2,445,367 | 16,227,837 |
| | | | $ 601,351,222 |
| Hong Kong — 5.9% | |
| AIA Group, Ltd. | | 6,683,217 | $ 55,643,816 |
| Samsonite International S.A.(1)(2) | | 18,349,377 | 44,009,198 |
| Techtronic Industries Co., Ltd. | | 3,646,790 | 34,798,121 |
| | | | $ 134,451,135 |
| Hungary — 1.1% | |
| Richter Gedeon Nyrt | | 1,458,274 | $ 24,977,346 |
| | | | $ 24,977,346 |
| India — 15.9% | |
| Bajaj Finserv, Ltd. | | 2,285,777 | $ 47,032,816 |
| Bharat Forge, Ltd. | | 2,766,072 | 23,449,010 |
| Container Corp. of India, Ltd. | | 2,832,768 | 24,703,505 |
| Dabur India, Ltd. | | 5,065,830 | 35,497,117 |
| Hero MotoCorp, Ltd. | | 812,790 | 25,307,849 |
| ICICI Bank, Ltd. | | 6,463,529 | 68,240,113 |
| Motherson Sumi Systems, Ltd. | | 10,454,512 | 13,954,931 |
| SBI Life Insurance Co., Ltd.(1) | | 3,173,461 | 48,481,674 |
| Security | Shares | Value |
| India (continued) | |
| State Bank of India | | 6,589,451 | $ 42,750,026 |
| Tech Mahindra, Ltd. | | 2,746,495 | 33,824,042 |
| | | | $ 363,241,083 |
| Indonesia — 5.1% | |
| Bank Central Asia Tbk PT | | 59,076,400 | $ 32,978,771 |
| Bank Rakyat Indonesia Persero Tbk PT | | 283,712,750 | 83,034,924 |
| | | | $ 116,013,695 |
| Malaysia — 2.0% | |
| Press Metal Aluminium Holdings Bhd | | 53,549,700 | $ 46,374,514 |
| | | | $ 46,374,514 |
| Mexico — 4.7% | |
| Grupo Aeroportuario del Pacifico SAB de CV, Class B | | 1,958,667 | $ 24,800,024 |
| Grupo Financiero Banorte SAB de CV, Class O | | 6,564,880 | 42,053,436 |
| Wal-Mart de Mexico SAB de CV | | 11,639,690 | 40,878,635 |
| | | | $ 107,732,095 |
| Peru — 1.5% | |
| Credicorp, Ltd. | | 274,109 | $ 33,660,585 |
| | | | $ 33,660,585 |
| South Africa — 3.5% | |
| Clicks Group, Ltd. | | 1,564,725 | $ 24,698,949 |
| Prosus NV(3) | | 597,994 | 30,978,358 |
| Shoprite Holdings, Ltd.(3) | | 1,982,453 | 23,667,947 |
| | | | $ 79,345,254 |
| South Korea — 9.7% | |
| KB Financial Group, Inc. | | 1,376,218 | $ 41,559,735 |
| LG Chem, Ltd. | | 140,353 | 51,823,286 |
| Samsung Electronics Co., Ltd. | | 3,484,990 | 127,966,191 |
| | | | $ 221,349,212 |
| Sweden — 0.5% | |
| Epiroc AB, Class A | | 846,540 | $ 12,110,171 |
| | | | $ 12,110,171 |
| Taiwan — 15.2% | |
| Accton Technology Corp. | | 5,180,000 | $ 44,182,773 |
| Delta Electronics, Inc. | | 7,658,000 | 60,828,409 |
| LandMark Optoelectronics Corp. | | 3,335,398 | 14,845,021 |
| Taiwan Semiconductor Manufacturing Co., Ltd. | | 13,979,000 | 185,297,111 |
| Win Semiconductors Corp. | | 2,352,000 | 9,037,568 |
| Wiwynn Corp. | | 1,293,000 | 32,674,402 |
| | | | $ 346,865,284 |
7
See Notes to Financial Statements.
Calvert
Emerging Markets Equity Fund
September 30, 2022
Schedule of Investments — continued
| Security | Shares | Value |
| United Arab Emirates — 0.5% | |
| Abu Dhabi Commercial Bank PJSC | | 4,816,998 | $ 11,815,361 |
| | | | $ 11,815,361 |
| United States — 0.9% | |
| Micron Technology, Inc. | | 419,341 | $ 21,008,984 |
| | | | $ 21,008,984 |
Total Common Stocks
(identified cost $2,555,347,965) | | | $2,247,393,709 |
| High Social Impact Investments — 0.2% |
| Security | Principal
Amount
(000's omitted) | Value |
| Calvert Impact Capital, Inc., Community Investment Notes, 1.50%, 12/15/23(4)(5) | $ | 5,170 | $ 4,801,689 |
Total High Social Impact Investments
(identified cost $5,170,000) | | | $ 4,801,689 |
| Short-Term Investments — 0.2% |
| Affiliated Fund — 0.0%(6) |
| Security | Shares | Value |
| Morgan Stanley Institutional Liquidity Funds - Government Portfolio, Institutional Class, 2.80%(7) | | 1,258 | $ 1,258 |
Total Affiliated Fund
(identified cost $1,258) | | | $ 1,258 |
| Securities Lending Collateral — 0.2% |
| Security | Shares | Value |
| State Street Navigator Securities Lending Government Money Market Portfolio, 3.07%(8) | | 4,443,880 | $ 4,443,880 |
Total Securities Lending Collateral
(identified cost $4,443,880) | | | $ 4,443,880 |
Total Short-Term Investments
(identified cost $4,445,138) | | | $ 4,445,138 |
| | | |
Total Investments — 98.9%
(identified cost $2,564,963,103) | | $2,256,640,536 |
| Other Assets, Less Liabilities — 1.1% | | $ 24,967,157 |
| Net Assets — 100.0% | | $2,281,607,693 |
| The percentage shown for each investment category in the Schedule of Investments is based on net assets. |
| (1) | Security exempt from registration under Rule 144A of the Securities Act of 1933, as amended. These securities may be sold in certain transactions in reliance on an exemption from registration (normally to qualified institutional buyers). At September 30, 2022, the aggregate value of these securities is $204,167,789 or 8.9% of the Fund's net assets. |
| (2) | Non-income producing security. |
| (3) | All or a portion of this security was on loan at September 30, 2022. The aggregate market value of securities on loan at September 30, 2022 was $26,741,679. |
| (4) | May be deemed to be an affiliated company (see Note 7). |
| (5) | Restricted security. Total market value of restricted securities amounts to $4,801,689, which represents 0.2% of the net assets of the Fund as of September 30, 2022. |
| (6) | Amount is less than 0.05%. |
| (7) | May be deemed to be an affiliated investment company. The rate shown is the annualized seven-day yield as of September 30, 2022. |
| (8) | Represents investment of cash collateral received in connection with securities lending. |
At September 30, 2022, the concentration of the Fund’s investments in the various sectors, determined as a percentage of net assets, was as follows:
| Economic Sectors | % of Net Assets |
| Information Technology | 25.1% |
| Financials | 24.9 |
| Consumer Discretionary | 17.2 |
| Industrials | 11.0 |
| Health Care | 5.5 |
| Consumer Staples | 5.5 |
| Communication Services | 5.0 |
| Materials | 4.3 |
| High Social Impact Investments | 0.2 |
| Total | 98.7% |
8
See Notes to Financial Statements.
Calvert
Emerging Markets Equity Fund
September 30, 2022
Schedule of Investments — continued
Restricted Securities
| Description | Acquisition Date | Cost |
| Calvert Impact Capital, Inc., Community Investment Notes, 1.50%, 12/15/23 | 12/14/20 | $5,170,000 |
| Abbreviations: |
| ADR | – American Depositary Receipt |
9
See Notes to Financial Statements.
Calvert
Emerging Markets Equity Fund
September 30, 2022
Statement of Assets and Liabilities
| | September 30, 2022 |
| Assets | |
Investments in securities of unaffiliated issuers, at value (identified cost $2,559,791,845) - including
$26,741,679 of securities on loan | $ 2,251,837,589 |
| Investments in securities of affiliated issuers, at value (identified cost $5,171,258) | 4,802,947 |
| Cash denominated in foreign currency, at value (cost $27,757,414) | 27,130,457 |
| Receivable for investments sold | 16,436,618 |
| Receivable for capital shares sold | 19,427,294 |
| Dividends and interest receivable | 1,660,999 |
| Dividends and interest receivable - affiliated | 87,102 |
| Securities lending income receivable | 2,609 |
| Receivable from affiliate | 45,903 |
| Directors' deferred compensation plan | 661,644 |
| Total assets | $2,322,093,162 |
| Liabilities | |
| Payable for investments purchased | $ 4,035,547 |
| Payable for capital shares redeemed | 14,924,939 |
| Payable for foreign capital gains taxes | 6,904,585 |
| Deposits for securities loaned | 4,443,880 |
| Payable to affiliates: | |
| Investment advisory fee | 1,572,503 |
| Administrative fee | 251,934 |
| Distribution and service fees | 56,396 |
| Sub-transfer agency fee | 53,611 |
| Directors' deferred compensation plan | 661,644 |
| Accrued expenses | 820,430 |
| Demand note payable | 6,760,000 |
| Total liabilities | $ 40,485,469 |
| Net Assets | $2,281,607,693 |
| Sources of Net Assets | |
| Paid-in capital | $ 2,749,406,370 |
| Accumulated loss | (467,798,677) |
| Net Assets | $2,281,607,693 |
| Class A Shares | |
| Net Assets | $ 178,282,113 |
| Shares Outstanding | 12,500,868 |
Net Asset Value and Redemption Price Per Share
(net assets ÷ shares of beneficial interest outstanding) | $ 14.26 |
Maximum Offering Price Per Share
(100 ÷ 94.75 of net asset value per share) | $ 15.05 |
| Class C Shares | |
| Net Assets | $ 19,000,083 |
| Shares Outstanding | 1,385,697 |
Net Asset Value and Offering Price Per Share*
(net assets ÷ shares of beneficial interest outstanding) | $ 13.71 |
10
See Notes to Financial Statements.
Calvert
Emerging Markets Equity Fund
September 30, 2022
Statement of Assets and Liabilities — continued
| | September 30, 2022 |
| Class I Shares | |
| Net Assets | $ 1,818,889,051 |
| Shares Outstanding | 126,321,466 |
Net Asset Value, Offering Price and Redemption Price Per Share
(net assets ÷ shares of beneficial interest outstanding) | $ 14.40 |
| Class R6 Shares | |
| Net Assets | $ 265,436,446 |
| Shares Outstanding | 18,473,250 |
Net Asset Value, Offering Price and Redemption Price Per Share
(net assets ÷ shares of beneficial interest outstanding) | $ 14.37 |
| On sales of $50,000 or more, the offering price of Class A shares is reduced. |
| * | Redemption price per share is equal to the net asset value less any applicable contingent deferred sales charge. |
11
See Notes to Financial Statements.
Calvert
Emerging Markets Equity Fund
September 30, 2022
| | Year Ended |
| | September 30, 2022 |
| Investment Income | |
| Dividend income (net of foreign taxes withheld of $8,772,514) | $ 64,152,894 |
| Dividend income - affiliated issuers | 114,948 |
| Interest income - affiliated issuers | 77,550 |
| Securities lending income, net | 16,261 |
| Total investment income | $ 64,361,653 |
| Expenses | |
| Investment advisory fee | $ 25,310,884 |
| Administrative fee | 4,049,742 |
| Distribution and service fees: | |
| Class A | 584,632 |
| Class C | 269,865 |
| Directors' fees and expenses | 143,328 |
| Custodian fees | 906,425 |
| Transfer agency fees and expenses | 3,009,354 |
| Accounting fees | 520,625 |
| Professional fees | 170,993 |
| Registration fees | 288,839 |
| Reports to shareholders | 204,569 |
| Miscellaneous | 197,270 |
| Total expenses | $ 35,656,526 |
| Waiver and/or reimbursement of expenses by affiliate | $ (1,605,889) |
| Net expenses | $ 34,050,637 |
| Net investment income | $ 30,311,016 |
| Realized and Unrealized Gain (Loss) | |
| Net realized gain (loss): | |
| Investment securities (net of foreign capital gains taxes of $14,619,461) | $ (135,348,743) |
| Investment securities - affiliated issuers | 505 |
| Foreign currency transactions | (6,471,958) |
| Net realized loss | $ (141,820,196) |
| Change in unrealized appreciation (depreciation): | |
| Investment securities (including net decrease in payable for foreign capital gains taxes of $19,560,860) | $ (1,072,785,467) |
| Investment securities - affiliated issuers | (279,543) |
| Foreign currency | (580,645) |
| Net change in unrealized appreciation (depreciation) | $(1,073,645,655) |
| Net realized and unrealized loss | $(1,215,465,851) |
| Net decrease in net assets from operations | $(1,185,154,835) |
12
See Notes to Financial Statements.
Calvert
Emerging Markets Equity Fund
September 30, 2022
Statements of Changes in Net Assets
| | Year Ended September 30, |
| | 2022 | 2021 |
| Increase (Decrease) in Net Assets | | |
| From operations: | | |
| Net investment income | $ 30,311,016 | $ 29,727,866 |
| Net realized gain (loss) | (141,820,196) | 99,843,177 |
| Net change in unrealized appreciation (depreciation) | (1,073,645,655) | 314,373,812 |
| Net increase (decrease) in net assets from operations | $(1,185,154,835) | $ 443,944,855 |
| Distributions to shareholders: | | |
| Class A | $ (725,054) | $ (716,932) |
| Class I | (23,624,539) | (13,667,112) |
| Class R6 | (4,343,502) | (1,855,013) |
| Total distributions to shareholders | $ (28,693,095) | $ (16,239,057) |
| Capital share transactions: | | |
| Class A | $ (25,911,123) | $ 92,770,986 |
| Class C | (4,437,988) | (1,983,892) |
| Class I | (569,958,512) | 467,857,670 |
| Class R6 | (108,315,286) | 169,097,679 |
| Net increase (decrease) in net assets from capital share transactions | $ (708,622,909) | $ 727,742,443 |
| Net increase (decrease) in net assets | $(1,922,470,839) | $1,155,448,241 |
| Net Assets | | |
| At beginning of year | $ 4,204,078,532 | $ 3,048,630,291 |
| At end of year | $ 2,281,607,693 | $4,204,078,532 |
13
See Notes to Financial Statements.
Calvert
Emerging Markets Equity Fund
September 30, 2022
| | Class A |
| | Year Ended September 30, |
| | 2022 | 2021 | 2020 | 2019 | 2018 |
| Net asset value — Beginning of year | $ 20.98 | $ 18.33 | $ 16.05 | $ 15.55 | $ 16.33 |
| Income (Loss) From Operations | | | | | |
| Net investment income(1) | $ 0.14 | $ 0.12 | $ 0.09 | $ 0.17 | $ 0.19 |
| Net realized and unrealized gain (loss) | (6.79) | 2.59 | 2.27 | 0.45 | (0.94) |
| Total income (loss) from operations | $ (6.65) | $ 2.71 | $ 2.36 | $ 0.62 | $ (0.75) |
| Less Distributions | | | | | |
| From net investment income | $ (0.07) | $ (0.06) | $ (0.08) | $ (0.12) | $ (0.03) |
| Total distributions | $ (0.07) | $ (0.06) | $ (0.08) | $ (0.12) | $ (0.03) |
| Net asset value — End of year | $ 14.26 | $ 20.98 | $ 18.33 | $ 16.05 | $ 15.55 |
| Total Return(2) | (31.79)% | 14.70% | 14.82% | 4.02% | (4.62)% |
| Ratios/Supplemental Data | | | | | |
| Net assets, end of year (000’s omitted) | $178,282 | $290,117 | $173,728 | $132,066 | $155,735 |
| Ratios (as a percentage of average daily net assets):(3) | | | | | |
| Total expenses | 1.29% | 1.27% | 1.27% | 1.41% | 1.56% |
| Net expenses | 1.24% (4) | 1.24% | 1.24% | 1.25% | 1.27% |
| Net investment income | 0.76% | 0.54% | 0.54% | 1.06% | 1.15% |
| Portfolio Turnover | 56% | 36% | 38% | 32% | 27% |
| (1) | Computed using average shares outstanding. |
| (2) | Returns are historical and are calculated by determining the percentage change in net asset value with all distributions reinvested and do not reflect the effect of sales charges, if any. |
| (3) | Total expenses do not reflect amounts reimbursed and/or waived by the adviser and certain of its affiliates, if applicable. Net expenses are net of all reductions and represent the net expenses paid by the Fund. |
| (4) | Includes a reduction by the investment adviser of a portion of its advisory fee due to the Fund's investment in the Liquidity Fund (equal to less than 0.005% of average daily net assets for the year ended September 30, 2022). |
14
See Notes to Financial Statements.
Calvert
Emerging Markets Equity Fund
September 30, 2022
Financial Highlights — continued
| | Class C |
| | Year Ended September 30, |
| | 2022 | 2021 | 2020 | 2019 | 2018 |
| Net asset value — Beginning of year | $ 20.25 | $ 17.78 | $ 15.62 | $ 15.18 | $ 16.04 |
| Income (Loss) From Operations | | | | | |
| Net investment income (loss)(1) | $ (0.02) | $ (0.07) | $ (0.04) | $ 0.05 | $ 0.10 |
| Net realized and unrealized gain (loss) | (6.52) | 2.54 | 2.20 | 0.45 | (0.96) |
| Total income (loss) from operations | $ (6.54) | $ 2.47 | $ 2.16 | $ 0.50 | $ (0.86) |
| Less Distributions | | | | | |
| From net investment income | $ — | $ — | $ — | $ (0.06) | $ — |
| Total distributions | $ — | $ — | $ — | $ (0.06) | $ — |
| Net asset value — End of year | $ 13.71 | $ 20.25 | $ 17.78 | $ 15.62 | $ 15.18 |
| Total Return(2) | (32.30)% | 13.83% | 13.89% | 3.33% | (5.36)% |
| Ratios/Supplemental Data | | | | | |
| Net assets, end of year (000’s omitted) | $19,000 | $33,249 | $30,938 | $28,794 | $24,286 |
| Ratios (as a percentage of average daily net assets):(3) | | | | | |
| Total expenses | 2.05% | 2.02% | 2.02% | 2.16% | 2.31% |
| Net expenses | 1.99% (4) | 1.99% | 1.99% | 2.00% | 2.02% |
| Net investment income (loss) | (0.09)% | (0.32)% | (0.22)% | 0.35% | 0.60% |
| Portfolio Turnover | 56% | 36% | 38% | 32% | 27% |
| (1) | Computed using average shares outstanding. |
| (2) | Returns are historical and are calculated by determining the percentage change in net asset value with all distributions reinvested and do not reflect the effect of sales charges, if any. |
| (3) | Total expenses do not reflect amounts reimbursed and/or waived by the adviser and certain of its affiliates, if applicable. Net expenses are net of all reductions and represent the net expenses paid by the Fund. |
| (4) | Includes a reduction by the investment adviser of a portion of its advisory fee due to the Fund's investment in the Liquidity Fund (equal to less than 0.005% of average daily net assets for the year ended September 30, 2022). |
15
See Notes to Financial Statements.
Calvert
Emerging Markets Equity Fund
September 30, 2022
Financial Highlights — continued
| | Class I |
| | Year Ended September 30, |
| | 2022 | 2021 | 2020 | 2019 | 2018 |
| Net asset value — Beginning of year | $ 21.21 | $ 18.52 | $ 16.22 | $ 15.73 | $ 16.48 |
| Income (Loss) From Operations | | | | | |
| Net investment income(1) | $ 0.17 | $ 0.16 | $ 0.13 | $ 0.22 | $ 0.29 |
| Net realized and unrealized gain (loss) | (6.82) | 2.62 | 2.29 | 0.45 | (0.99) |
| Total income (loss) from operations | $ (6.65) | $ 2.78 | $ 2.42 | $ 0.67 | $ (0.70) |
| Less Distributions | | | | | |
| From net investment income | $ (0.16) | $ (0.09) | $ (0.12) | $ (0.18) | $ (0.05) |
| Total distributions | $ (0.16) | $ (0.09) | $ (0.12) | $ (0.18) | $ (0.05) |
| Net asset value — End of year | $ 14.40 | $ 21.21 | $ 18.52 | $ 16.22 | $ 15.73 |
| Total Return(2) | (31.59)% | 14.94% | 15.07% | 4.36% | (4.30)% |
| Ratios/Supplemental Data | | | | | |
| Net assets, end of year (000’s omitted) | $1,818,889 | $3,357,833 | $2,530,135 | $1,817,479 | $1,012,574 |
| Ratios (as a percentage of average daily net assets):(3) | | | | | |
| Total expenses | 1.04% | 1.02% | 1.02% | 1.15% | 1.32% |
| Net expenses | 0.99% (4) | 0.99% | 0.99% | 0.97% | 0.92% |
| Net investment income | 0.91% | 0.71% | 0.79% | 1.41% | 1.71% |
| Portfolio Turnover | 56% | 36% | 38% | 32% | 27% |
| (1) | Computed using average shares outstanding. |
| (2) | Returns are historical and are calculated by determining the percentage change in net asset value with all distributions reinvested and do not reflect the effect of sales charges, if any. |
| (3) | Total expenses do not reflect amounts reimbursed and/or waived by the adviser and certain of its affiliates, if applicable. Net expenses are net of all reductions and represent the net expenses paid by the Fund. |
| (4) | Includes a reduction by the investment adviser of a portion of its advisory fee due to the Fund's investment in the Liquidity Fund (equal to less than 0.005% of average daily net assets for the year ended September 30, 2022). |
16
See Notes to Financial Statements.
Calvert
Emerging Markets Equity Fund
September 30, 2022
Financial Highlights — continued
| | Class R6 |
| | Year Ended September 30, | Period Ended
September 30, |
| | 2022 | 2021 | 2020 | 2019 | 2018 (1) |
| Net asset value — Beginning of period | $ 21.18 | $ 18.49 | $ 16.19 | $ 15.72 | $ 18.65 |
| Income (Loss) From Operations | | | | | |
| Net investment income(2) | $ 0.18 | $ 0.17 | $ 0.14 | $ 0.27 | $ 0.26 |
| Net realized and unrealized gain (loss) | (6.81) | 2.62 | 2.30 | 0.40 | (3.19) |
| Total income (loss) from operations | $ (6.63) | $ 2.79 | $ 2.44 | $ 0.67 | $ (2.93) |
| Less Distributions | | | | | |
| From net investment income | $ (0.18) | $ (0.10) | $ (0.14) | $ (0.20) | $ — |
| Total distributions | $ (0.18) | $ (0.10) | $ (0.14) | $ (0.20) | $ — |
| Net asset value — End of period | $ 14.37 | $ 21.18 | $ 18.49 | $ 16.19 | $ 15.72 |
| Total Return(3) | (31.55)% | 15.09% | 15.13% | 4.35% | (15.71)% (4) |
| Ratios/Supplemental Data | | | | | |
| Net assets, end of period (000’s omitted) | $265,436 | $522,879 | $313,830 | $218,601 | $10,217 |
| Ratios (as a percentage of average daily net assets):(5) | | | | | |
| Total expenses | 0.97% | 0.94% | 0.95% | 1.06% | 1.24% (6) |
| Net expenses | 0.92% (7) | 0.92% | 0.92% | 0.92% | 0.92% (6) |
| Net investment income | 1.00% | 0.78% | 0.84% | 1.67% | 2.48% (6) |
| Portfolio Turnover | 56% | 36% | 38% | 32% | 27% (8) |
| (1) | From February 1, 2018 inception. |
| (2) | Computed using average shares outstanding. |
| (3) | Returns are historical and are calculated by determining the percentage change in net asset value with all distributions reinvested and do not reflect the effect of sales charges, if any. |
| (4) | Not annualized. |
| (5) | Total expenses do not reflect amounts reimbursed and/or waived by the adviser and certain of its affiliates, if applicable. Net expenses are net of all reductions and represent the net expenses paid by the Fund. |
| (6) | Annualized. |
| (7) | Includes a reduction by the investment adviser of a portion of its advisory fee due to the Fund's investment in the Liquidity Fund (equal to less than 0.005% of average daily net assets for the year ended September 30, 2022). |
| (8) | For the year ended September 30, 2018. |
17
See Notes to Financial Statements.
Calvert
Emerging Markets Equity Fund
September 30, 2022
Notes to Financial Statements
1 Significant Accounting Policies
Calvert Emerging Markets Equity Fund (the Fund) is a diversified series of Calvert World Values Fund, Inc. (the Corporation). The Corporation is a Maryland corporation registered under the Investment Company Act of 1940, as amended (the 1940 Act), as an open-end management investment company. The investment objective of the Fund is to seek long-term capital appreciation by investing primarily in equity securities of companies located in emerging market countries.
The Fund offers four classes of shares. Class A shares are generally sold subject to a sales charge imposed at time of purchase. A contingent deferred sales charge of 1.00% (0.80% prior to April 29, 2022) may apply to certain redemptions of Class A shares for accounts for which no sales charge was paid, if redeemed within 12 months of purchase. Class C shares are sold without a front-end sales charge, and with certain exceptions, are charged a contingent deferred sales charge of 1% on shares redeemed within 12 months of purchase. Class C shares are only available for purchase through a financial intermediary. Effective November 5, 2020, Class C shares automatically convert to Class A shares eight years after their purchase as described in the Fund's prospectus. Class I and Class R6 shares are sold at net asset value, are not subject to a sales charge and are sold only to certain eligible investors. Effective after the close of business on May 14, 2021, the Fund was closed to new investors, subject to limited exceptions. The Fund was re-opened to new investors effective November 22, 2022.Each class represents a pro rata interest in the Fund, but votes separately on class-specific matters and is subject to different expenses.
The Fund applies the accounting and reporting guidance in the Financial Accounting Standards Board (FASB) Accounting Standards Codification Topic 946, Financial Services – Investment Companies (ASC 946). Subsequent events, if any, through the date that the financial statements were issued have been evaluated in the preparation of the financial statements.
A Investment Valuation— Net asset value per share is determined every business day as of the close of the regular session of the New York Stock Exchange (generally 4:00 p.m. Eastern time). The Fund uses independent pricing services approved by the Board of Directors (the Board) to value its investments wherever possible. Investments for which market quotations are not available or deemed not reliable are fair valued in good faith under the direction of the Board.
U.S. generally accepted accounting principles (U.S. GAAP) establishes a disclosure hierarchy that categorizes the inputs to valuation techniques used to value assets and liabilities at measurement date. These inputs are summarized in the three broad levels listed below:
Level 1 - quoted prices in active markets for identical securities
Level 2 - other significant observable inputs (including quoted prices for similar securities, interest rates, prepayment speeds, credit risk, etc.)
Level 3 - significant unobservable inputs (including the Fund’s own assumptions in determining the fair value of investments)
The inputs or methodologies used for valuing securities are not necessarily an indication of the risk associated with investing in those securities.
Valuation techniques used to value the Fund’s investments by major category are as follows:
Equity Securities. Equity securities (including warrants and rights) listed on a U.S. securities exchange generally are valued at the last sale or closing price as reported by an independent pricing service on the primary market or exchange on which they are traded and are categorized as Level 1 in the hierarchy. Equity securities listed on the NASDAQ National Market System are valued at the NASDAQ official closing price and are categorized as Level 1 in the hierarchy. Unlisted or listed securities for which closing sales prices or closing quotations are not available are valued at the mean between the latest available bid and ask prices and are categorized as Level 2 in the hierarchy. The daily valuation of exchange-traded foreign securities generally is determined as of the close of trading on the principal exchange on which such securities trade. Events occurring after the close of trading on foreign exchanges may result in adjustments to the valuation of foreign securities to more accurately reflect their fair value as of the close of regular trading on the New York Stock Exchange. When valuing foreign equity securities that meet certain criteria, the Fund's Board has approved the use of a fair value service that values such securities to reflect market trading that occurs after the close of the applicable foreign markets of comparable securities or other instruments that have a strong correlation to the fair-valued securities. Such securities are categorized as Level 2 in the hierarchy.
Debt Securities. Debt securities are generally valued based on valuations provided by third party pricing services, as derived from such services’ pricing models. Inputs to the models may include, but are not limited to, reported trades, executable bid and ask prices, broker/dealer quotations, prices or yields of securities with similar characteristics, interest rates, anticipated prepayments, benchmark curves or information pertaining to the issuer, as well as industry and economic events. Accordingly, debt securities are generally categorized as Level 2 in the hierarchy. Short-term debt securities with a remaining maturity at time of purchase of more than sixty days are valued based on valuations provided by a third party pricing service. Such securities are generally categorized as Level 2 in the hierarchy. Short-term debt securities of sufficient credit quality purchased with remaining maturities of sixty days or less for which a valuation from a third party pricing service is not readily available may be valued at amortized cost, which approximates fair value, and are categorized as Level 2 in the hierarchy.
Other Securities. Investments in management investment companies (including money market funds) that do not trade on an exchange are valued at the net asset value as of the close of each business day and are categorized as Level 1 in the hierarchy.
Calvert
Emerging Markets Equity Fund
September 30, 2022
Notes to Financial Statements — continued
Fair Valuation. In connection with Rule 2a-5 of the 1940 Act, which became effective September 8, 2022, the Board has designated the Fund’s investment adviser as its valuation designee. Investments for which valuations or market quotations are not readily available or are deemed unreliable are valued by the investment adviser, as valuation designee, at fair value using methods that most fairly reflect the security’s “fair value”, which is the amount that the Fund might reasonably expect to receive for the security upon its current sale in the ordinary course. Each such determination is based on a consideration of relevant factors, which are likely to vary from one pricing context to another. These factors may include, but are not limited to, the type of security, the existence of any contractual restrictions on the security’s disposition, the price and extent of public trading in similar securities of the issuer or of comparable companies or entities, quotations or relevant information obtained from broker/dealers or other market participants, information obtained from the issuer, analysts, and/or the appropriate stock exchange (for exchange-traded securities), an analysis of the company’s or entity’s financial statements, and an evaluation of the forces that influence the issuer and the market(s) in which the security is purchased and sold.
The values assigned to fair value investments are based on available information and do not necessarily represent amounts that might ultimately be realized. Further, due to the inherent uncertainty of valuations of such investments, the fair values may differ significantly from the values that would have been used had an active market existed, and the differences could be material.
The following table summarizes the market value of the Fund's holdings as of September 30, 2022, based on the inputs used to value them:
| Asset Description | Level 1 | Level 2 | Level 3 | Total |
| Common Stocks: | | | | |
| Brazil | $ 84,776,526 | $ — | $ — | $ 84,776,526 |
| Chile | — | 42,321,242 | — | 42,321,242 |
| China | 26,982,718 | 574,368,504 | — | 601,351,222 |
| Hong Kong | — | 134,451,135 | — | 134,451,135 |
| Hungary | — | 24,977,346 | — | 24,977,346 |
| India | — | 363,241,083 | — | 363,241,083 |
| Indonesia | — | 116,013,695 | — | 116,013,695 |
| Malaysia | — | 46,374,514 | — | 46,374,514 |
| Mexico | 107,732,095 | — | — | 107,732,095 |
| Peru | 33,660,585 | — | — | 33,660,585 |
| South Africa | — | 79,345,254 | — | 79,345,254 |
| South Korea | — | 221,349,212 | — | 221,349,212 |
| Sweden | — | 12,110,171 | — | 12,110,171 |
| Taiwan | — | 346,865,284 | — | 346,865,284 |
| United Arab Emirates | — | 11,815,361 | — | 11,815,361 |
| United States | 21,008,984 | — | — | 21,008,984 |
| Total Common Stocks | $274,160,908 | $1,973,232,801 (1) | $ — | $2,247,393,709 |
| High Social Impact Investments | $ — | $ 4,801,689 | $ — | $ 4,801,689 |
| Short-Term Investments: | | | | |
| Affiliated Fund | 1,258 | — | — | 1,258 |
| Securities Lending Collateral | 4,443,880 | — | — | 4,443,880 |
| Total Investments | $278,606,046 | $1,978,034,490 | $ — | $2,256,640,536 |
| (1) | Includes foreign equity securities whose values were adjusted to reflect market trading of comparable securities or other correlated instruments that occurred after the close of trading in their applicable foreign markets. |
B Investment Transactions and Income— Investment transactions for financial statement purposes are accounted for on trade date. Realized gains and losses are recorded on an identified cost basis and may include proceeds from litigation. Dividend income is recorded on the ex-dividend date for dividends received in cash and/or securities or, in the case of dividends on certain foreign securities, as soon as the Fund is informed of the ex-dividend date. Non-cash dividends are recorded at the fair value of the securities received. Withholding taxes on foreign dividends and interest, if any, have been provided for in accordance with the Fund's understanding of the applicable country’s tax rules and rates. Distributions received that represent a return of capital are recorded as a reduction of cost of investments. Distributions received that represent a capital gain are recorded as a realized gain. Interest income, which includes amortization of premium and accretion of discount on debt securities, is accrued as earned.
Calvert
Emerging Markets Equity Fund
September 30, 2022
Notes to Financial Statements — continued
C Share Class Accounting— Realized and unrealized gains and losses and net investment income and losses, other than class-specific expenses, are allocated daily to each class of shares based upon the relative net assets of each class to the total net assets of the Fund. Expenses arising in connection with a specific class are charged directly to that class. Sub-accounting, recordkeeping and similar administrative fees payable to financial intermediaries, which are a component of transfer agency fees and expenses on the Statement of Operations, are not allocated to Class R6 shares.
D Foreign Currency Transactions— The Fund’s accounting records are maintained in U.S. dollars. For valuation of assets and liabilities on each date of net asset value determination, foreign denominations are converted into U.S. dollars using the current exchange rate. Security transactions, income and expenses are translated at the prevailing rate of exchange on the date of the event. Recognized gains or losses on investment transactions attributable to changes in foreign currency exchange rates are recorded for financial statement purposes as net realized gains and losses on investments. That portion of unrealized gains and losses on investments that results from fluctuations in foreign currency exchange rates is not separately disclosed.
E Restricted Securities— The Fund may invest in securities that are subject to legal or contractual restrictions on resale. Generally, these securities may only be sold publicly upon registration under the Securities Act of 1933 or in transactions exempt from such registration. Information regarding restricted securities (excluding Rule 144A securities) is included at the end of the Schedule of Investments.
F Distributions to Shareholders— Distributions to shareholders are recorded by the Fund on ex-dividend date. Distributions from net investment income and distributions from net realized capital gains, if any, are paid at least annually. Distributions are declared separately for each class of shares. Distributions are determined in accordance with income tax regulations, which may differ from U.S. GAAP; accordingly, periodic reclassifications are made within the Fund's capital accounts to reflect income and gains available for distribution under income tax regulations.
G Estimates— The preparation of financial statements in conformity with U.S. GAAP requires management to make estimates and assumptions that affect the reported amounts of assets and liabilities and disclosure of contingent assets and liabilities at the date of the financial statements and the reported amounts of increases and decreases in net assets from operations during the reporting period. Actual results could differ from those estimates.
H Indemnifications— The Corporation’s By-Laws provide for indemnification for Directors or officers of the Corporation and certain other parties, to the fullest extent permitted by Maryland law and the 1940 Act, provided certain conditions are met. Additionally, in the normal course of business, the Fund enters into agreements with service providers that may contain indemnification clauses. The Fund’s maximum exposure under these arrangements is unknown as this would involve future claims that may be made against the Fund that have not yet occurred.
I Federal Income Taxes— No provision for federal income or excise tax is required since the Fund intends to continue to qualify as a regulated investment company under the Internal Revenue Code and to distribute substantially all of its taxable earnings.
In addition to the requirements of the Internal Revenue Code, the Fund may also be subject to local taxes on the recognition of capital gains in certain countries. In determining the daily net asset value, the Fund estimates the accrual for such taxes, if any, based on the unrealized appreciation on certain portfolio securities and the related tax rates. Taxes attributable to unrealized appreciation are included in the change in unrealized appreciation (depreciation) on investments. Capital gains taxes on securities sold are included in net realized gain (loss) on investments.
Management has analyzed the Fund's tax positions taken for all open federal income tax years and has concluded that no provision for federal income tax is required in the Fund's financial statements. A Fund's federal tax return is subject to examination by the Internal Revenue Service for a period of three years from the date of filing.
2 Related Party Transactions
The investment advisory fee is earned by Calvert Research and Management (CRM), an indirect, wholly-owned subsidiary of Morgan Stanley, as compensation for investment advisory services rendered to the Fund. The investment advisory fee is computed at an annual rate of 0.75% of the Fund’s average daily net assets and is payable monthly. For the year ended September 30, 2022, the investment advisory fee amounted to $25,310,884.
Effective April 26, 2022, the Fund may invest in a money market fund, the Institutional Class of the Morgan Stanley Institutional Liquidity Funds - Government Portfolio (the “Liquidity Fund”), an open-end management investment company managed by Morgan Stanley Investment Management Inc., a wholly-owned subsidiary of Morgan Stanley. The investment advisory fee paid by the Fund is reduced by an amount equal to its pro-rata share of the advisory and administration fees paid by the Fund due to its investment in the Liquidity Fund. For the year ended September 30, 2022, the investment advisory fee paid was reduced by $10,228 relating to the Fund’s investment in the Liquidity Fund. Prior to April 26, 2022, the Fund may have invested its cash in Calvert Cash Reserves Fund, LLC (Cash Reserves Fund), an affiliated investment company managed by CRM. CRM did not receive a fee for advisory services provided to Cash Reserves Fund.
Pursuant to an investment sub-advisory agreement, CRM has delegated the investment management of the Fund to Hermes Investment Management Limited (Hermes). CRM pays Hermes a portion of its investment advisory fee for sub-advisory services provided to the Fund.
Calvert
Emerging Markets Equity Fund
September 30, 2022
Notes to Financial Statements — continued
CRM has agreed to reimburse the Fund’s operating expenses to the extent that total annual operating expenses (relating to ordinary operating expenses only and excluding expenses such as brokerage commissions, acquired fund fees and expenses of unaffiliated funds, borrowing costs, taxes or litigation expenses) exceed 1.24%, 1.99%, 0.99% and 0.92% for Class A, Class C, Class I and Class R6, respectively, of such class’s average daily net assets. The expense reimbursement agreement with CRM may be changed or terminated after January 31, 2023. For the year ended September 30, 2022, CRM waived or reimbursed expenses of $1,595,661.
The administrative fee is earned by CRM as compensation for administrative services rendered to the Fund. The fee is computed at an annual rate of 0.12% of the Fund’s average daily net assets attributable to Class A, Class C, Class I and Class R6 and is payable monthly. For the year ended September 30, 2022, CRM was paid administrative fees of $4,049,742.
The Fund has in effect a distribution plan for Class A shares (Class A Plan) pursuant to Rule 12b-1 under the 1940 Act. Pursuant to the Class A Plan, the Fund pays Eaton Vance Distributors, Inc. (EVD), an affiliate of CRM and the Fund’s principal underwriter, a distribution and service fee of 0.25% per annum of its average daily net assets attributable to Class A shares for distribution services and facilities provided to the Fund by EVD, as well as for personal services and/or the maintenance of shareholder accounts. The Fund also has in effect a distribution plan for Class C shares (Class C Plan) pursuant to Rule 12b-1 under the 1940 Act. Pursuant to the Class C Plan, the Fund pays EVD amounts equal to 0.75% per annum of its average daily net assets attributable to Class C shares for providing ongoing distribution services and facilities to the Fund. In addition, pursuant to the Class C Plan, the Fund also makes payments of service fees to EVD, financial intermediaries and other persons in amounts equal to 0.25% per annum of its average daily net assets attributable to that class. Service fees paid or accrued are for personal services and/or the maintenance of shareholder accounts. Distribution and service fees paid or accrued for the year ended September 30, 2022 amounted to $584,632 and $269,865 for Class A shares and Class C shares, respectively.
The Fund was informed that EVD received $26,747 as its portion of the sales charge on sales of Class A shares for the year ended September 30, 2022. The Fund was also informed that EVD received less than $507 and $5,333 of contingent deferred sales charges paid by Class A and Class C shareholders, respectively, for the same period. The Fund was informed that Morgan Stanley affiliated broker-dealers, which may be deemed to be affiliates of CRM and EVD, also received a portion of the sales charge on sales of Class A shares for the year ended September 30, 2022 in the amount of $4,106.
Eaton Vance Management (EVM), an affiliate of CRM, provides sub-transfer agency and related services to the Fund pursuant to a Sub-Transfer Agency Support Services Agreement. For the year ended September 30, 2022, sub-transfer agency fees and expenses incurred to EVM amounted to $225,037 and are included in transfer agency fees and expenses on the Statement of Operations.
Each Director of the Fund who is not an employee of CRM or its affiliates receives an annual fee of $214,000 ($154,000 prior to January 1, 2022), plus an annual Committee fee ranging from $8,500 to $16,500 depending on the Committee. The Board chair receives an additional $30,000 annual fee, Committee chairs receive an additional $6,000 annual fee and the special equities liaison receives an additional $2,500 annual fee. Eligible Directors may participate in a Deferred Compensation Plan (the Plan). Amounts deferred under the Plan are treated as though equal dollar amounts had been invested in shares of the Fund or other Calvert funds selected by the Directors. The Fund purchases shares of the funds selected equal to the dollar amounts deferred under the Plan, resulting in an asset equal to the deferred compensation liability. Obligations of the Plan are paid solely from the Fund's assets. Directors’ fees are allocated to each of the Calvert funds served. Salaries and fees of officers and Directors of the Fund who are employees of CRM or its affiliates are paid by CRM.
3 Investment Activity
During the year ended September 30, 2022, the cost of purchases and proceeds from sales of investments, other than short-term securities, were $1,868,090,832 and $2,591,379,872, respectively.
4 Distributions to Shareholders and Income Tax Information
The tax character of distributions declared for the years ended September 30, 2022 and September 30, 2021 was as follows:
| | Year Ended September 30, |
| | 2022 | 2021 |
| Ordinary income | $28,693,095 | $16,239,057 |
During the year ended September 30, 2022, accumulated loss was increased by $10,527,460 and paid-in capital was increased by $10,527,460 due to the Fund's use of equalization accounting. Tax equalization accounting allows the Fund to treat as a distribution that portion of redemption proceeds representing a redeeming shareholder’s portion of undistributed taxable income and net capital gains. These reclassifications had no effect on the net assets or net asset value per share of the Fund.
Calvert
Emerging Markets Equity Fund
September 30, 2022
Notes to Financial Statements — continued
As of September 30, 2022, the components of distributable earnings (accumulated loss) on a tax basis were as follows:
| Undistributed ordinary income | $ 17,400,701 |
| Deferred capital losses | (114,524,263) |
| Net unrealized depreciation | (370,675,115) |
| Accumulated loss | $(467,798,677) |
At September 30, 2022, the Fund, for federal income tax purposes, had deferred capital losses of $114,524,263 which would reduce the Fund’s taxable income arising from future net realized gains on investment transactions, if any, to the extent permitted by the Internal Revenue Code, and thus would reduce the amount of distributions to shareholders, which would otherwise be necessary to relieve the Fund of any liability for federal income or excise tax. The deferred capital losses are treated as arising on the first day of the Fund’s next taxable year, can be carried forward for an unlimited period, and retain the same short-term or long-term character as when originally deferred. Of the deferred capital losses at September 30, 2022, $114,524,263 are short-term.
The cost and unrealized appreciation (depreciation) of investments of the Fund at September 30, 2022, as determined on a federal income tax basis, were as follows:
| Aggregate cost | $2,619,762,626 |
| Gross unrealized appreciation | $ 305,126,513 |
| Gross unrealized depreciation | (668,248,603) |
| Net unrealized depreciation | $ (363,122,090) |
5 Securities Lending
To generate additional income, the Fund may lend its securities pursuant to a securities lending agency agreement with State Street Bank and Trust Company (SSBT), the securities lending agent. Security loans are subject to termination by the Fund at any time and, therefore, are not considered illiquid investments. The Fund requires that the loan be continuously collateralized by either cash or securities in an amount at least equal to the market value of the securities on loan. The market value of securities loaned is determined daily and any additional required collateral is delivered to the Fund on the next business day. Cash collateral is generally invested in a money market fund registered under the 1940 Act that is managed by an affiliate of SSBT. Any gain or loss in the market price of the loaned securities that might occur and any interest earned or dividends declared during the term of the loan would accrue to the account of the Fund. Income earned on the investment of collateral, net of broker rebates and other expenses incurred by the securities lending agent, is split between the Fund and the securities lending agent based on agreed upon contractual terms. Non-cash collateral, if any, is held by the lending agent on behalf of the Fund and cannot be sold or re-pledged by the Fund; accordingly, such collateral is not reflected in the Statement of Assets and Liabilities.
The risks associated with lending portfolio securities include, but are not limited to, possible delays in receiving additional collateral or in the recovery of the loaned securities, possible loss of rights to the collateral should the borrower fail financially, as well as risk of loss in the value of the collateral or the value of the investments made with the collateral. The securities lending agent shall indemnify the Fund in the case of default of any securities borrower.
At September 30, 2022, the total value of securities on loan was $26,741,679 and the total value of collateral received was $28,613,378, comprised of cash of $4,443,880 and U.S. government and/or agencies securities of $24,169,498.
The following table provides a breakdown of securities lending transactions accounted for as secured borrowings, the obligations by class of collateral pledged, and the remaining contractual maturity of those transactions as of September 30, 2022.
| | Remaining Contractual Maturity of the Transactions |
| | Overnight and
Continuous | <30 days | 30 to 90 days | >90 days | Total |
| Common Stocks | $4,443,880 | $ — | $ — | $ — | $4,443,880 |
The carrying amount of the liability for deposits for securities loaned at September 30, 2022 approximated its fair value. If measured at fair value, such liability would have been considered as Level 2 in the fair value hierarchy (see Note 1A) at September 30, 2022.
Calvert
Emerging Markets Equity Fund
September 30, 2022
Notes to Financial Statements — continued
6 Line of Credit
The Fund participates with other portfolios and funds managed by EVM and its affiliates, including CRM, in an $800 million unsecured line of credit with a group of banks, which is in effect through October 25, 2022. Borrowings are made by the Fund solely for temporary purposes related to redemptions and other short-term cash needs. Interest is charged to the Fund based on its borrowings at an amount above either the Secured Overnight Financing Rate (SOFR) or Federal Funds rate. In addition, a fee computed at an annual rate of 0.15% on the daily unused portion of the line of credit is allocated among the participating portfolios and funds at the end of each quarter. In connection with the renewal of the agreement in October 2021, an arrangement fee of $150,000 was incurred that was allocated to the participating portfolios and funds. Because the line of credit is not available exclusively to the Fund, it may be unable to borrow some or all of its requested amounts at any particular time.
At September 30, 2022, the Fund had a balance outstanding pursuant to this line of credit of $6,760,000 at an annual interest rate of 4.08%. Based on the short-term nature of the borrowings under the line of credit and variable interest rate, the carrying value of the borrowings approximated its fair value at September 30, 2022. If measured at fair value, borrowings under the line of credit would have been considered as Level 2 in the fair value hierarchy (see Note 1A) at September 30, 2022. The Fund did not have any significant borrowings or allocated fees during the year ended September 30, 2022. Effective October 25, 2022, the Fund renewed its line of credit agreement, which expires October 24, 2023. In connection with the renewal, the borrowing limit was decreased to $725 million.
7 Affiliated Companies and Funds
The Fund has invested a portion of its assets in notes (the Notes) issued by Calvert Impact Capital, Inc. (CIC) pursuant to exemptive relief granted by the U.S. Securities and Exchange Commission (the SEC). There are certain potential points of affiliation between the Fund and CIC. CRM has licensed use of the Calvert name to CIC and provides other types of support. CRM’s President and Chief Executive Officer (and the only director/trustee on the Fund Board that is an “interested person” of the Fund) serves on the CIC Board. In addition, another director/trustee on the Fund Board serves as a director emeritus on the CIC Board.
At September 30, 2022, the value of the Fund’s investment in the Notes and affiliated funds was $4,802,947, which represents 0.2% of the Fund’s net assets. Transactions in the Notes and affiliated funds by the Fund for the year ended September 30, 2022 were as follows:
| Name | Value,
beginning
of period | Purchases | Sales
proceeds | Net
realized
gain
(loss) | Change in
unrealized
appreciation
(depreciation) | Value,
end of
period | Interest/
Dividend
income | Principal amount/
Units/Shares,
end of period |
| High Social Impact Investments | | | | | | | | |
| Calvert Impact Capital, Inc., Community Investment Notes, 1.50%, 12/15/23(1) | $5,081,231 | $ — | $ — | $ — | $ (279,542) | $ 4,801,689 | $ 77,550 | $5,170,000 |
| Short-Term Investments | | | | | | |
| Cash Reserves Fund | 6,784,347 | 665,739,119 | (672,523,970) | 505 | (1) | — | 12,388 | — |
| Liquidity Fund | — | 301,867,269 | (301,866,011) | — | — | 1,258 | 102,560 | 1,258 |
| Total | | | | $ 505 | $(279,543) | $4,802,947 | $192,498 | |
8 Capital Shares
The Corporation may issue its shares in one or more series (such as the Fund). The authorized shares of the Fund consist of 75,000,000 common shares, $0.01 par value, for each Class.
Calvert
Emerging Markets Equity Fund
September 30, 2022
Notes to Financial Statements — continued
Transactions in capital shares for the years ended September 30, 2022 and September 30, 2021 were as follows:
| | Year Ended
September 30, 2022 | | Year Ended
September 30, 2021 |
| | Shares | Amount | | Shares | Amount |
| Class A | | | | | |
| Shares sold | 29,675,451 | $ 511,946,663 | | 15,904,646 | $ 347,555,284 |
| Reinvestment of distributions | 27,819 | 559,156 | | 31,266 | 677,539 |
| Shares redeemed | (31,036,827) | (538,474,686) | | (11,585,367) | (255,550,144) |
| Converted from Class C | 3,278 | 57,744 | | 4,116 | 88,307 |
| Net increase (decrease) | (1,330,279) | $ (25,911,123) | | 4,354,661 | $ 92,770,986 |
| Class C | | | | | |
| Shares sold | 75,305 | $ 1,377,530 | | 382,860 | $ 8,383,949 |
| Shares redeemed | (328,264) | (5,757,774) | | (476,281) | (10,279,534) |
| Converted to Class A | (3,399) | (57,744) | | (4,252) | (88,307) |
| Net decrease | (256,358) | $ (4,437,988) | | (97,673) | $ (1,983,892) |
| Class I | | | | | |
| Shares sold | 50,052,091 | $ 926,913,958 | | 73,886,174 | $ 1,643,627,034 |
| Reinvestment of distributions | 1,114,340 | 22,565,377 | | 587,397 | 12,852,247 |
| Shares redeemed | (83,134,435) | (1,519,437,847) | | (52,783,871) | (1,188,621,611) |
| Net increase (decrease) | (31,968,004) | $ (569,958,512) | | 21,689,700 | $ 467,857,670 |
| Class R6 | | | | | |
| Shares sold | 6,309,425 | $ 115,719,589 | | 13,330,886 | $ 293,926,149 |
| Reinvestment of distributions | 164,920 | 3,331,380 | | 77,754 | 1,697,360 |
| Shares redeemed | (12,689,642) | (227,366,255) | | (5,694,908) | (126,525,830) |
| Net increase (decrease) | (6,215,297) | $ (108,315,286) | | 7,713,732 | $ 169,097,679 |
9 Risks and Uncertainties
Risks Associated with Foreign Investments
Foreign investments can be adversely affected by political, economic and market developments abroad, including the imposition of economic and other sanctions by the United States or another country. There may be less publicly available information about foreign issuers because they may not be subject to reporting practices, requirements or regulations comparable to those to which United States companies are subject. Foreign markets may be smaller, less liquid and more volatile than the major markets in the United States. Trading in foreign markets typically involves higher expense than trading in the United States. The Fund may have difficulties enforcing its legal or contractual rights in a foreign country. Securities that trade or are denominated in currencies other than the U.S. dollar may be adversely affected by fluctuations in currency exchange rates.
Emerging market securities often involve greater risks than developed market securities. Investment markets within emerging market countries are typically smaller, less liquid, less developed and more volatile than those in more developed markets like the United States, and may be focused in certain economic sectors. The information available about an emerging market issuer may be less reliable than for comparable issuers in more developed capital markets. Governmental actions can have a significant effect on the economic conditions in emerging market countries. It may be more difficult to make a claim or obtain a judgment in the courts of these countries than it is in the United States. The possibility of fraud, negligence, undue influence being exerted by an issuer or refusal to recognize ownership exists in some emerging markets. Disruptions due to work stoppages and trading improprieties in foreign securities markets have caused such markets to close. Emerging market securities are also subject to speculative trading, which contributes to their volatility.
Pandemic Risk
An outbreak of respiratory disease caused by a novel coronavirus was first detected in China in late 2019 and subsequently spread internationally. This coronavirus has resulted in closing borders, enhanced health screenings, changes to healthcare service preparation and delivery, quarantines, cancellations, disruptions to supply chains and customer activity, as well as general concern and uncertainty. Health crises caused by outbreaks of disease, such as the
Calvert
Emerging Markets Equity Fund
September 30, 2022
Notes to Financial Statements — continued
coronavirus outbreak, may exacerbate other pre-existing political, social and economic risks and disrupt normal market conditions and operations. The impact of this outbreak has negatively affected the worldwide economy, as well as the economies of individual countries and industries, and could continue to affect the market in significant and unforeseen ways. Other epidemics and pandemics that may arise in the future may have similar effects. Any such impact could adversely affect the Fund's performance, or the performance of the securities in which the Fund invests.
Calvert
Emerging Markets Equity Fund
September 30, 2022
Report of Independent Registered Public Accounting Firm
To the Board of Directors of Calvert World Values Fund, Inc. and Shareholders of Calvert Emerging Markets Equity Fund:
Opinion on the Financial Statements and Financial Highlights
We have audited the accompanying statement of assets and liabilities of Calvert Emerging Markets Equity Fund (the "Fund") (one of the funds constituting Calvert World Values Fund, Inc.), including the schedule of investments, as of September 30, 2022, the related statement of operations for the year then ended, the statements of changes in net assets and the financial highlights for each of the two years in the period then ended, and the related notes. In our opinion, the financial statements and financial highlights present fairly, in all material respects, the financial position of the Fund as of September 30, 2022, and the results of its operations for the year then ended, and the changes in its net assets and the financial highlights for each of the two years in the period then ended, in conformity with accounting principles generally accepted in the United States of America. The financial highlights for the years or periods ended September 30, 2020, 2019, and 2018 were audited by other auditors whose report, dated November 20, 2020, expressed an unqualified opinion on those financial highlights.
Basis for Opinion
These financial statements and financial highlights are the responsibility of the Fund's management. Our responsibility is to express an opinion on the Fund's financial statements and financial highlights based on our audits. We are a public accounting firm registered with the Public Company Accounting Oversight Board (United States) (PCAOB) and are required to be independent with respect to the Fund in accordance with the U.S. federal securities laws and the applicable rules and regulations of the Securities and Exchange Commission and the PCAOB.
We conducted our audits in accordance with the standards of the PCAOB. Those standards require that we plan and perform the audit to obtain reasonable assurance about whether the financial statements and financial highlights are free of material misstatement, whether due to error or fraud. The Fund is not required to have, nor were we engaged to perform, an audit of its internal control over financial reporting. As part of our audits, we are required to obtain an understanding of internal control over financial reporting but not for the purpose of expressing an opinion on the effectiveness of the Fund’s internal control over financial reporting. Accordingly, we express no such opinion.
Our audits included performing procedures to assess the risks of material misstatement of the financial statements and financial highlights, whether due to error or fraud, and performing procedures that respond to those risks. Such procedures included examining, on a test basis, evidence regarding the amounts and disclosures in the financial statements and financial highlights. Our audits also included evaluating the accounting principles used and significant estimates made by management, as well as evaluating the overall presentation of the financial statements and financial highlights. Our procedures included confirmation of securities owned as of September 30, 2022, by correspondence with the custodian and brokers; when replies were not received from brokers, we performed other auditing procedures. We believe that our audits provide a reasonable basis for our opinion.
/s/ Deloitte & Touche LLP
Boston, Massachusetts
November 22, 2022
We have served as the auditor of one or more Calvert investment companies since 2021.
Calvert
Emerging Markets Equity Fund
September 30, 2022
Federal Tax Information (Unaudited)
The Form 1099-DIV you receive in February 2023 will show the tax status of all distributions paid to your account in calendar year 2022. Shareholders are advised to consult their own tax adviser with respect to the tax consequences of their investment in the Fund. As required by the Internal Revenue Code and/or regulations, shareholders must be notified regarding the status of qualified dividend income for individuals and the foreign tax credit.
Qualified Dividend Income. For the fiscal year ended September 30, 2022, the Fund designates approximately $36,443,333, or up to the maximum amount of such dividends allowable pursuant to the Internal Revenue Code, as qualified dividend income eligible for the reduced tax rate of 15%.
Foreign Tax Credit. For the fiscal year ended September 30, 2022, the Fund paid foreign taxes of $23,334,249 and recognized foreign source income of $72,952,309.
Calvert
Emerging Markets Equity Fund
September 30, 2022
Board of Directors' Contract Approval
Overview of the Contract Review Process
The Investment Company Act of 1940, as amended, provides, in substance, that each investment advisory agreement between a fund and its investment adviser will continue in effect from year to year only if its continuation is approved at least annually by the fund’s board of directors, including by a vote of a majority of the directors who are not “interested persons” of the fund (“Independent Directors”), cast in person at a meeting called for the purpose of considering such approval.
At a video conference meeting of the Boards of Trustees/Directors (each a “Board”) of the registered investment companies advised by Calvert Research and Management (“CRM” or the “Adviser”) (the “Calvert Funds”) held on June 14, 2022, the Board, including a majority of the Independent Directors, voted to approve continuation of existing investment advisory and investment sub-advisory agreements for the Calvert Funds for an additional one-year period. The meeting was held by video conference due to circumstances related to current or potential effects of COVID-19 pursuant to temporary exemptive relief issued by the Securities and Exchange Commission.
In evaluating the investment advisory and investment sub-advisory agreements for the Calvert Funds, the Board considered a variety of information relating to the Calvert Funds and various service providers, including the Adviser. The Independent Directors reviewed a report prepared by the Adviser regarding various services provided to the Calvert Funds by the Adviser and its affiliates. Such report included, among other data, information regarding the Adviser’s personnel and the Adviser’s revenue and cost of providing services to the Calvert Funds, and a separate report prepared by an independent data provider, which compared each fund’s investment performance, fees and expenses to those of comparable funds as identified by such independent data provider (“comparable funds”).
The Independent Directors were separately represented by independent legal counsel with respect to their consideration of the continuation of the investment advisory and investment sub-advisory agreements for the Calvert Funds. Prior to voting, the Independent Directors reviewed the proposed continuation of the Calvert Funds’ investment advisory and investment sub-advisory agreements with management and also met in private sessions with their counsel at which time no representatives of management were present.
The information that the Board considered included, among other things, the following (for funds that invest through one or more affiliated underlying fund(s), references to “each fund” in this section may include information that was considered at the underlying fund-level):
Information about Fees, Performance and Expenses
| • | A report from an independent data provider comparing the advisory and related fees paid by each fund with fees paid by comparable funds; |
| • | A report from an independent data provider comparing each fund’s total expense ratio and its components to comparable funds; |
| • | A report from an independent data provider comparing the investment performance of each fund to the investment performance of comparable funds over various time periods; |
| • | Data regarding investment performance in comparison to benchmark indices; |
| • | For each fund, comparative information concerning the fees charged and the services provided by the Adviser in managing other accounts (including mutual funds, other collective investment funds and institutional accounts) using investment strategies and techniques similar to those used in managing such fund; |
| • | Profitability analyses for the Adviser with respect to each fund; |
Information about Portfolio Management and Trading
| • | Descriptions of the investment management services provided to each fund, including investment strategies and processes it employs; |
| • | Information about the Adviser’s policies and practices with respect to trading, including the Adviser’s processes for monitoring best execution of portfolio transactions; |
| • | Information about the allocation of brokerage transactions and the benefits received by the Adviser as a result of brokerage allocation, including information concerning the acquisition of research through client commission arrangements and policies with respect to “soft dollars”; |
Information about the Adviser
| • | Reports detailing the financial results and condition of CRM; |
| • | Descriptions of the qualifications, education and experience of the individual investment professionals whose responsibilities include portfolio management and investment research for the funds, and information relating to their compensation and responsibilities with respect to managing other mutual funds and investment accounts; |
| • | Policies and procedures relating to proxy voting and the handling of corporate actions and class actions; |
| • | A description of CRM’s procedures for overseeing sub-advisers, including with respect to regulatory and compliance issues, investment management and other matters; |
Calvert
Emerging Markets Equity Fund
September 30, 2022
Board of Directors' Contract Approval — continued
Other Relevant Information
| • | Information concerning the nature, cost and character of the administrative and other non-investment advisory services provided by CRM and its affiliates; and |
| • | The terms of each investment advisory agreement. |
Over the course of the year, the Board and its committees held regular quarterly meetings. During these meetings, the Directors participated in investment and performance reviews with the portfolio managers and other investment professionals of the Adviser relating to each fund, and considered various investment and trading strategies used in pursuing each fund’s investment objective(s), such as the use of derivative instruments, as well as risk management techniques. The Board and its committees also evaluated issues pertaining to industry and regulatory developments, compliance procedures, corporate governance and other issues with respect to the funds, and received and participated in reports and presentations provided by CRM and its affiliates with respect to such matters. In addition to the formal meetings of the Board and its committees, the Independent Directors held regular video conferences in between meetings to discuss, among other topics, matters relating to the continuation of the Calvert Funds’ investment advisory and investment sub-advisory agreements.
For funds that invest through one or more affiliated underlying funds, the Board considered similar information about the underlying fund(s) when considering the approval of investment advisory agreements. In addition, in cases where the Adviser has engaged a sub-adviser, the Board considered similar information about the sub-adviser when considering the approval of any investment sub-advisory agreement.
The Independent Directors were assisted throughout the contract review process by their independent legal counsel. The Independent Directors relied upon the advice of such counsel and their own business judgment in determining the material factors to be considered in evaluating each investment advisory and investment sub-advisory agreement and the weight to be given to each such factor. The Board, including the Independent Directors, did not identify any single factor as controlling, and each Director may have attributed different weight to various factors.
Results of the Contract Review Process
Based on its consideration of the foregoing, and such other information as it deemed relevant, including the factors and conclusions described below, the Board, including the Independent Directors, concluded that the continuation of the investment advisory agreement of Calvert Emerging Markets Equity Fund (the “Fund”), and the investment sub-advisory agreement with Hermes Investment Management Limited (the “Sub-Adviser”), including the fees payable under each agreement, is in the best interests of the Fund’s shareholders. Accordingly, the Board, including a majority of the Independent Directors, voted to approve the continuation of the investment advisory agreement and the investment sub-advisory agreement of the Fund.
Nature, Extent and Quality of Services
In considering the nature, extent and quality of the services provided by the Adviser and Sub-Adviser under the investment advisory agreement and investment sub-advisory agreement, respectively, the Board reviewed information relating to the Adviser’s and Sub-Adviser’s operations and personnel, including, among other information, biographical information on the Sub-Adviser’s investment personnel and descriptions of the Adviser’s organizational and management structure. The Board also took into account similar information provided periodically throughout the previous year by the Adviser and Sub-Adviser as well as the Board’s familiarity with the Adviser and Sub-Adviser through Board meetings, discussions and other reports. With respect to the Adviser, the Board considered the Adviser’s responsibilities overseeing the Sub-Adviser and the business-related and other risks to which the Adviser or its affiliates may be subject in managing the Fund. With respect to the Sub-Adviser, the Board took into account the resources available to the Sub-Adviser in fulfilling its duties under the investment sub-advisory agreement and the Sub-Adviser’s experience in managing the Fund. The Board also noted that it reviewed on a quarterly basis information regarding the Adviser’s and Sub-Adviser’s compliance with applicable policies and procedures, including those related to personal investing. The Board took into account, among other items, periodic reports received from the Adviser over the past year concerning the Adviser’s ongoing review and enhancement of certain processes, policies and procedures of the Calvert Funds and the Adviser. The Board concluded that it was satisfied with the nature, extent and quality of services provided to the Fund by the Adviser and the Sub-Adviser under the investment advisory agreement and investment sub-advisory agreement, respectively.
Fund Performance
In considering the Fund’s performance, the Board noted that it reviewed on a quarterly basis detailed information about the Fund’s performance results, portfolio composition and investment strategies. The Board compared the Fund’s investment performance to that of the Fund’s peer universe and its benchmark index. The Board’s review included comparative performance data for the one-, three- and five-year periods ended December 31, 2021. This performance data indicated that the Fund had underperformed the median of its peer universe for the one- and three-year periods ended December 31, 2021, while it had outperformed the median of its peer universe for the five-year period ended December 31, 2021. This performance data also indicated that the Fund had underperformed its benchmark index for the one-year period, while it had outperformed its benchmark index for the three- and five-year periods. The Board took into account management’s discussion of the Fund’s recent performance. Based upon its review, the Board concluded that the Fund’s performance was satisfactory relative to the performance of its peer universe and its benchmark index.
Calvert
Emerging Markets Equity Fund
September 30, 2022
Board of Directors' Contract Approval — continued
Management Fees and Expenses
In considering the Fund’s fees and expenses, the Board compared the Fund’s fees and total expense ratio with those of comparable funds in its expense group. Among other findings, the data indicated that the Fund’s advisory and administrative fees (after taking into account waivers and/or reimbursements) (referred to collectively as “management fees”) and the Fund’s total expenses (net of waivers and/or reimbursements) were each below the respective median of the Fund’s expense group. The Board took into account the Adviser’s and Sub-Adviser’s current undertaking to maintain expense limitations for the Fund and that the Adviser and Sub-Adviser were waiving and/or reimbursing a portion of the Fund’s expenses. Based upon its review, the Board concluded that the management and sub-advisory fees were reasonable in view of the nature, extent and quality of services provided by the Adviser and Sub-Adviser, respectively.
Profitability and Other “Fall-Out” Benefits
The Board reviewed the Adviser’s profitability in regard to the Fund and the Calvert Funds in the aggregate. In reviewing the overall profitability of the Fund to the Adviser, the Board also considered the fact that the Adviser and its affiliates provided sub-transfer agency support, administrative and distribution services to the Fund for which they received compensation. The information considered by the Board included the profitability of the Fund to the Adviser and its affiliates without regard to any marketing support or other payments by the Adviser and its affiliates to third parties in respect of distribution services. The Board also considered that the Adviser and its affiliates derived benefits to their reputation and other indirect benefits from their relationships with the Fund. Because the Adviser pays the Sub-Adviser’s sub-advisory fee out of its advisory fee and the sub-advisory fee was negotiated at arm’s length by the Adviser, the profitability of the Fund to the Sub-Adviser was not a material factor in the Board’s deliberations concerning the continuation of the investment sub-advisory agreement. Based upon its review, the Board concluded that the level of profitability of the Adviser and its affiliates from their relationships with the Fund was reasonable.
Economies of Scale
The Board considered the effect of the Fund’s current size and its potential growth on its performance and fees. The Board also took into account the breakpoints in the advisory fee schedule for the Fund that would reduce the advisory fee rate on assets above specific asset levels. Because the Adviser pays the Sub-Adviser’s sub-advisory fee out of its advisory fee and the sub-advisory fee was negotiated at arm’s length by the Adviser, the Board did not consider the potential economies of scale from the Sub-Adviser’s management of the Fund to be a material factor in the Board’s deliberations concerning the continuation of the investment sub-advisory agreement, although the Board noted that the sub-advisory fee schedule contained breakpoints. The Board noted that if the Fund’s assets increased over time, the Fund might realize other economies of scale if assets increased proportionally more than certain other expenses.
Calvert
Emerging Markets Equity Fund
September 30, 2022
Liquidity Risk Management Program
The Fund has implemented a written liquidity risk management program (Program) and related procedures to manage its liquidity in accordance with Rule 22e-4 under the Investment Company Act of 1940, as amended (Liquidity Rule). The Liquidity Rule defines “liquidity risk” as the risk that a fund could not meet requests to redeem shares issued by the fund without significant dilution of the remaining investors’ interests in the fund. The Fund’s Board of Trustees/Directors has designated the investment adviser to serve as the administrator of the Program and the related procedures. The administrator has established a Liquidity Risk Management Oversight Committee (Committee) to perform the functions necessary to administer the Program. As part of the Program, the administrator is responsible for identifying illiquid investments and categorizing the relative liquidity of the Fund’s investments in accordance with the Liquidity Rule. Under the Program, the administrator assesses, manages, and periodically reviews the Fund’s liquidity risk, and is responsible for making certain reports to the Fund’s Board of Trustees/Directors and the Securities and Exchange Commission (SEC) regarding the liquidity of the Fund’s investments, and to notify the Board of Trustees/Directors and the SEC of certain liquidity events specified in the Liquidity Rule. The liquidity of the Fund’s portfolio investments is determined based on a number of factors including, but not limited to, relevant market, trading and investment-specific considerations under the Program.
At a meeting of the Fund’s Board of Trustees/Directors on June 14, 2022, the Committee provided a written report to the Fund’s Board of Trustees/ Directors pertaining to the operation, adequacy, and effectiveness of implementation of the Program, as well as the operation of the highly liquid investment minimum (if applicable) for the period January 1, 2021 through December 31, 2021 (Review Period). The Program operated effectively during the Review Period, supporting the administrator’s ability to assess, manage and monitor Fund liquidity risk, including during periods of market volatility and net redemptions. During the Review Period, the Fund met redemption requests on a timely basis.
There can be no assurance that the Program will achieve its objectives in the future. Please refer to the Fund’s prospectus for more information regarding the Fund’s exposure to liquidity risk and other principal risks to which an investment in the Fund may be subject.
Calvert
Emerging Markets Equity Fund
September 30, 2022
Management and Organization
Fund Management. The Directors of Calvert World Values Fund, Inc. (the Corporation) are responsible for the overall management and supervision of the affairs of the Corporation. The Board members and officers of the Corporation are listed below. Except as indicated, each individual has held the office shown or other offices in the same company for the last five years. Board members hold indefinite terms of office. Each Board member holds office until his or her successor is elected and qualified, or until his or her earlier death, resignation, retirement, removal or disqualification. Under the terms of the Fund's current Board member retirement policy, an Independent Board member must retire at the end of the calendar year in which he or she turns 75. However, if such retirement would cause the Fund to be out of compliance with Section 16 of the 1940 Act or any other regulations or guidance of the SEC, then such retirement will not become effective until such time as action has been taken for the Fund to be in compliance therewith. The “noninterested Directors” consist of those Directors who are not “interested persons” of the Corporation, as that term is defined under the 1940 Act. The business address of each Board member and the Chief Compliance Officer is 1825 Connecticut Avenue NW, Suite 400, Washington, DC 20009 and the business address of the Secretary, Vice President and Chief Legal Officer and the Treasurer is Two International Place, Boston, Massachusetts 02110. As used below, “CRM” refers to Calvert Research and Management and “Eaton Vance” refers to Eaton Vance Management. Each Director oversees 42 funds in the Calvert fund complex. Effective March 1, 2021, each of Eaton Vance and CRM are indirect wholly-owned subsidiaries of Morgan Stanley. Each officer affiliated with CRM may hold a position with other CRM affiliates that is comparable to his or her position with CRM listed below.
| Name and Year of Birth | Corporation
Position(s) | Length of
Service | Principal Occupation(s) and Other Directorships
During Past Five Years and Other Relevant Experience |
| Interested Director |
John H. Streur(1)
1960 | Director and
President | Since 2015 | President and Chief Executive Officer of CRM (since December 31, 2016). President and Chief Executive Officer of Calvert Investments, Inc.
(January 2015 - December 2016); Chief Executive Officer of Calvert
Investment Distributors, Inc. (August 2015 - December 2016); Chief
Compliance Officer of Calvert Investment Management, Inc. (August 2015 -
April 2016); President and Director, Portfolio 21 Investments, Inc.
(through October 2014); President, Chief Executive Officer and
Director, Managers Investment Group LLC (through January 2012);
President and Director, The Managers Funds and Managers AMG
Funds (through January 2012).
Other Directorships. Portfolio 21 Investments, Inc. (asset management)
(through October 2014); Managers Investment Group LLC (asset management)
(through January 2012); The Managers Funds (asset management)
(through January 2012); Managers AMG Funds (asset management)
(through January 2012); Calvert Impact Capital, Inc. |
| Noninterested Directors |
Richard L. Baird, Jr.
1948 | Director | Since 2005 | Regional Disaster Recovery Lead, American Red Cross of Greater
Pennsylvania (since 2017). Volunteer, American Red Cross (since 2015).
Former President and CEO of Adagio Health Inc. (retired in 2014) in
Pittsburgh, PA.
Other Directorships. None. |
Alice Gresham Bullock
1950 | Chair and
Director | Since 2016 | Professor Emerita at Howard University School of Law. Dean Emerita of
Howard University School of Law and Deputy Director of the Association
of American Law Schools (1992-1994).
Other Directorships. None. |
Cari M. Dominguez
1949 | Director | Since 2016 | Former Chair of the U.S. Equal Employment Opportunity Commission.
Other Directorships. ManpowerGroup Inc. (workforce solutions company);
Triple S Management Corporation (managed care); National Association of Corporate Directors. |
John G. Guffey, Jr.
1948 | Director | Since 1992 | President of Aurora Press Inc., a privately held publisher of trade
paperbacks (since January 1997).
Other Directorships. Calvert Impact Capital, Inc. (through December 31, 2018); Calvert Ventures, LLC. |
Miles D. Harper, III
1962 | Director | Since 2005 | Partner, Carr Riggs & Ingram (public accounting firm) since October 2014.
Partner, Gainer Donnelly & Desroches (public accounting firm) (now Carr
Riggs & Ingram) (November 1999 - September 2014).
Other Directorships. Bridgeway Funds (9) (asset management). |
Joy V. Jones
1950 | Director | Since 2005 | Attorney.
Other Directorships. Palm Management Corporation. |
Calvert
Emerging Markets Equity Fund
September 30, 2022
Management and Organization — continued
| Name and Year of Birth | Corporation
Position(s) | Length of
Service | Principal Occupation(s) and Other Directorships
During Past Five Years and Other Relevant Experience |
| Noninterested Directors (continued) |
Anthony A. Williams
1951 | Director | Since 2016 | CEO and Executive Director of the Federal City Council (July 2012 to
present); Senior Adviser and Independent Consultant for King and
Spalding LLP (September 2015 to present); Executive Director of Global
Government Practice at the Corporate Executive Board (January 2010 to
January 2012).
Other Directorships. Freddie Mac; Evoq Properties/Meruelo Maddux
Properties, Inc. (real estate management); Weston Solutions, Inc.
(environmental services); Bipartisan Policy Center’s Debt Reduction Task Force;
Chesapeake Bay Foundation; Catholic University of America; Urban Institute (research organization); The Howard Hughes Corporation (real estate development); Old Dominion National Bank. |
| Name and Year of Birth | Corporation
Position(s) | Length of
Service | Principal Occupation(s)
During Past Five Years |
| Principal Officers who are not Directors |
Hope L. Brown
1973 | Chief
Compliance
Officer | Since 2014 | Chief Compliance Officer of 42 registered investment companies advised
by CRM (since 2014). Vice President and Chief Compliance Officer,
Wilmington Funds (2012-2014). |
Deidre E. Walsh
1971 | Secretary,
Vice President
and Chief
Legal Officer | Since 2021 | Vice President of CRM and officer of 42 registered investment companies
advised by CRM (since 2021). Also Vice President of Eaton Vance and
certain of its affiliates and officer of 136 registered investment companies
advised or administered by Eaton Vance. |
James F. Kirchner
1967 | Treasurer | Since 2016 | Vice President of CRM and officer of 42 registered investment companies
advised by CRM (since 2016). Also Vice President of Eaton Vance and
certain of its affiliates and officer of 136 registered investment companies
advised or administered by Eaton Vance. |
| | | | |
| (1) Mr. Streur is an interested person of the Fund because of his positions with the Fund’s adviser and certain affiliates. |
The SAI for the Fund includes additional information about the Directors and officers of the Fund and can be obtained without charge on Calvert’s website at www.calvert.com or by calling 1-800-368-2745.
| FACTS | WHAT DOES EATON VANCE DO WITH YOUR
PERSONAL INFORMATION? |
| Why? | Financial companies choose how they share your personal information. Federal law gives consumers the right to limit some but not all sharing. Federal law also requires us to tell you how we collect, share, and protect your personal information. Please read this notice carefully to understand what we do. |
| |
| What? | The types of personal information we collect and share depend on the product or service you have with us. This information can include:■ Social Security number and income
■
investment experience and risk tolerance
■
checking account number and wire transfer instructions |
| |
| How? | All financial companies need to share customers’ personal information to run their everyday business. In the section below, we list the reasons financial companies can share their customers’ personal information; the reasons Eaton Vance chooses to share; and whether you can limit this sharing. |
Reasons we can share your
personal information | Does Eaton Vance
share? | Can you limit
this sharing? |
| For our everyday business purposes — such as to process your transactions, maintain your account(s), respond to court orders and legal investigations, or report to credit bureaus | Yes | No |
| For our marketing purposes — to offer our products and services to you | Yes | No |
| For joint marketing with other financial companies | No | We don’t share |
| For our investment management affiliates’ everyday business purposes — information about your transactions, experiences, and creditworthiness | Yes | Yes |
| For our affiliates’ everyday business purposes — information about your transactions and experiences | Yes | No |
| For our affiliates’ everyday business purposes — information about your creditworthiness | No | We don’t share |
| For our investment management affiliates to market to you | Yes | Yes |
| For our affiliates to market to you | No | We don’t share |
| For nonaffiliates to market to you | No | We don’t share |
To limit our
sharing | Call toll-free 1-800-368-2745 or email: CRMPrivacy@calvert.comPlease note:If you are a new customer, we can begin sharing your information 30 days from the date we sent this notice. When you are no longer our customer, we continue to share your information as described in this notice. However, you can contact us at any time to limit our sharing. |
| Questions? | Call toll-free 1-800-368-2745 or email: CRMPrivacy@calvert.com |
| Privacy Notice — continued | April 2021 |
| Who we are |
| Who is providing this notice? | Eaton Vance Management, Eaton Vance Distributors, Inc., Eaton Vance Trust Company, Eaton Vance Management (International) Limited, Eaton Vance Advisers International Ltd., Eaton Vance Global Advisors Limited, Eaton Vance Management’s Real Estate Investment Group, Boston Management and Research, Calvert Research and Management, Eaton Vance and Calvert Fund Families and our investment advisory affiliates (“Eaton Vance”) (see Investment Management Affiliates definition below) |
| What we do |
How does Eaton Vance
protect my personal
information? | To protect your personal information from unauthorized access and use, we use security measures that comply with federal law. These measures include computer safeguards and secured files and buildings. We have policies governing the proper handling of customer information by personnel and requiring third parties that provide support to adhere to appropriate security standards with respect to such information. |
How does Eaton Vance
collect my personal
information? | We collect your personal information, for example, when you■ open an account or make deposits or withdrawals from your account
■
buy securities from us or make a wire transfer
■
give us your contact informationWe also collect your personal information from others, such as credit bureaus, affiliates, or other companies. |
| Why can’t I limit all sharing? | Federal law gives you the right to limit only■ sharing for affiliates’ everyday business purposes — information about your creditworthiness
■
affiliates from using your information to market to you
■
sharing for nonaffiliates to market to youState laws and individual companies may give you additional rights to limit sharing. See below for more on your rights under state law. |
| Definitions |
Investment Management
Affiliates | Eaton Vance Investment Management Affiliates include registered investment advisers, registered broker- dealers, and registered and unregistered funds. Investment Management Affiliates does not include entities associated with Morgan Stanley Wealth Management, such as Morgan Stanley Smith Barney LLC and Morgan Stanley & Co. |
| Affiliates | Companies related by common ownership or control. They can be financial and nonfinancial companies.■ Our affiliates include companies with a Morgan Stanley name and financial companies such as Morgan Stanley Smith Barney LLC and Morgan Stanley & Co. |
| Nonaffiliates | Companies not related by common ownership or control. They can be financial and nonfinancial companies.■ Eaton Vance does not share with nonaffiliates so they can market to you. |
| Joint marketing | A formal agreement between nonaffiliated financial companies that together market financial products or services to you.■ Eaton Vance doesn’t jointly market. |
| Other important information |
| Vermont: Except as permitted by law, we will not share personal information we collect about Vermont residents with Nonaffiliates unless you provide us with your written consent to share such information.California: Except as permitted by law, we will not share personal information we collect about California residents with Nonaffiliates and we will limit sharing such personal information with our Affiliates to comply with California privacy laws that apply to us. |
Delivery of Shareholder Documents. The Securities and Exchange Commission (SEC) permits funds to deliver only one copy of shareholder documents, including prospectuses, proxy statements and shareholder reports, to fund investors with multiple accounts at the same residential or post office box address. This practice is often called “householding” and it helps eliminate duplicate mailings to shareholders. Calvert funds, or your financial intermediary, may household the mailing of your documents indefinitely unless you instruct Calvert funds, or your financial intermediary, otherwise. If you would prefer that your Calvert fund documents not be householded, please contact Calvert funds at 1-800-368-2745, or contact your financial intermediary. Your instructions that householding not apply to delivery of your Calvert fund documents will typically be effective within 30 days of receipt by Calvert funds or your financial intermediary.
Portfolio Holdings. Each Calvert fund files a schedule of portfolio holdings on Part F to Form N-PORT with the SEC. Certain information filed on Form N-PORT may be viewed on the Calvert website at www.calvert.com, by calling Calvert at 1-800-368-2745 or in the EDGAR database on the SEC’s website at www.sec.gov.
Proxy Voting. The Proxy Voting Guidelines that each Calvert fund uses to determine how to vote proxies relating to portfolio securities is provided as an Appendix to the fund’s Statement of Additional Information. The Statement of Additional Information can be obtained free of charge by calling the Calvert funds at 1-800-368-2745, by visiting the Calvert funds’ website at www.calvert.com or visiting the SEC’s website at www.sec.gov. Information regarding how a Calvert fund voted proxies relating to portfolio securities during the most recent 12-month period ended June 30 is available by calling Calvert funds, by visiting the Calvert funds’ website at www.calvert.com or by visiting the SEC’s website at www.sec.gov.
Investment Adviser and Administrator
Calvert Research and Management
1825 Connecticut Avenue NW, Suite 400
Washington, DC 20009
Investment Sub-Adviser
Hermes Investment Management Limited
150 Cheapside
London EC2V 6ET
Principal Underwriter*
Eaton Vance Distributors, Inc.
Two International Place
Boston, MA 02110
(617) 482-8260
Custodian
State Street Bank and Trust Company
State Street Financial Center, One Lincoln Street
Boston, MA 02111
Transfer Agent
DST Asset Manager Solutions, Inc.
2000 Crown Colony Drive
Quincy, MA 02169
Independent Registered Public Accounting Firm
Deloitte & Touche LLP
200 Berkeley Street
Boston, MA 02116-5022
Fund Offices
1825 Connecticut Avenue NW, Suite 400
Washington, DC 20009
* FINRA BrokerCheck. Investors may check the background of their Investment Professional by contacting the Financial Industry Regulatory Authority (FINRA). FINRA BrokerCheck is a free tool to help investors check the professional background of current and former FINRA-registered securities firms and brokers. FINRA BrokerCheck is available by calling 1-800-289-9999 and at www.FINRA.org. The FINRA BrokerCheck brochure describing this program is available to investors at www.FINRA.org.
Printed on recycled paper.
24213 9.30.22
Calvert
International Equity Fund
Annual Report
September 30, 2022
Commodity Futures Trading Commission Registration. The Commodity Futures Trading Commission (“CFTC”) has adopted regulations that subject registered investment companies and advisers to regulation by the CFTC if a fund invests more than a prescribed level of its assets in certain CFTC-regulated instruments (including futures, certain options and swap agreements) or markets itself as providing investment exposure to such instruments. The adviser has claimed an exclusion from the definition of “commodity pool operator” under the Commodity Exchange Act with respect to its management of the Fund and the other funds it manages. Accordingly, neither the Fund nor the adviser is subject to CFTC regulation.
Fund shares are not insured by the FDIC and are not deposits or other obligations of, or guaranteed by, any depository institution. Shares are subject to investment risks, including possible loss of principal invested.
This report must be preceded or accompanied by a current summary prospectus or prospectus. Before investing, investors should consider carefully the investment objective, risks, and charges and expenses of a mutual fund. This and other important information is contained in the summary prospectus and prospectus, which can be obtained from a financial intermediary. Prospective investors should read the prospectus carefully before investing. For further information, please call 1-800-368-2745.
Choose Planet-friendly E-delivery!
Sign up now for on-line statements, prospectuses, and fund reports. In less than five minutes you can help reduce paper mail and lower fund costs.
Just go to www.calvert.com. If you already have an online account with the Calvert funds, click on Login to access your Account and select the documents you would like to receive via e-mail.
If you’re new to online account access, click on Login, then Register to create your user name and password. Once you’re in, click on the E-delivery sign-up on the Account Portfolio page and follow the quick, easy steps.
Note: If your shares are not held directly with the Calvert funds but through a brokerage firm, you must contact your broker for electronic delivery options available through their firm.
Annual Report September 30, 2022
Calvert
International Equity Fund
Calvert
International Equity Fund
September 30, 2022
Management's Discussion of Fund Performance†
Economic and Market Conditions
The 12-month period starting October 1, 2021, was dominated by the ongoing effects of one black swan event — the COVID-19 pandemic — and new fallout from another — Russia’s unprovoked invasion of Ukraine.
In the opening months of the period, stock investors as well as consumers appeared to be taking a “glass is half full” approach. Despite the appearance of a new and more contagious COVID-19 variant, the highest inflation readings in nearly four decades, and the U.S. Federal Reserve’s (the Fed’s) announcement that it would begin tapering bond purchases that had supported economic growth, major U.S. equity indexes repeatedly closed at new all-time highs during the final quarter of 2021.
In both the U.S. and Europe, consumers rushed to spend money saved during the early months of the pandemic. Mastercard, Inc. reported its highest retail sales on record during the 2021 holiday season. But as the new year began, investors appeared to reevaluate the twin threats of inflation and interest rate hikes, and stock performance turned negative around the globe. In February, Russia’s invasion of Ukraine sent shock waves through markets worldwide, exacerbating inflationary pressures on energy and food costs.
As the Fed’s outlook on inflation worsened from “transitory” to “persistent,” central banks around the world — including the Bank of England and the European Central Bank — initiated their first interest rate hikes in years. In Europe, looming energy shortages caused by Russia’s invasion of Ukraine pushed inflation rates higher and stock prices lower during the period.
Investors began to expect that the Fed would raise interest rates at every policy meeting in 2022 and, in turn, worried that aggressive rate hikes could tip the U.S. economy into recession. At its June, July, and September 2022 meetings, the Fed hiked the federal funds rate 0.75% each time — its first moves of that magnitude since 1994. Higher interest rates, inflation, and recessionary worries drove stock prices down, with rate-sensitive technology stocks — which had been star performers early in the pandemic — suffering some of the worst declines.
Meanwhile in the world’s second-largest economy, China’s zero-COVID policy and problems within its real estate sector severely restricted economic output. The MSCI Golden Dragon Index, a measure of Chinese large-cap and mid-cap stocks, was one of the worst-performing major indexes, declining 32.61% during the period.
Major equity indexes elsewhere also suffered significant losses. For the period as a whole, the MSCI ACWI Index, a broad measure of global equities, returned -20.66%; the S&P 500® Index, a broad measure of U.S. stocks, lost 15.47%; and the technology-laden Nasdaq Composite Index fell 26.25%. The MSCI EAFE Index of developed-market international equities returned -25.13%, while the MSCI Emerging Markets Index returned -28.11% during the period.
Fund Performance
For the 12-month period ended September 30, 2022, Calvert International Equity Fund (the Fund) returned -27.28% for Class A shares at net asset value (NAV), underperforming its benchmark, the MSCI EAFE Index (the Index), which returned -25.13%.
The Fund focuses on a bottom-up stock selection strategy that prioritizes the fundamental business-model strengths of individual companies. The Fund does not seek to outperform the Index by top-down investing in certain regions of the world and tends not to invest in cyclical, high-beta, lower quality stocks that typically exhibit volatile earnings and price returns.
During the period, the Fund’s overweight exposure to the industrials sector led to underperformance relative to the Index as a deteriorating growth environment weighed on investor sentiment. The war in Ukraine had a notable downside impact on some of the Fund’s holdings as the European conflict disrupted supply chains and triggered a surge in oil and commodity prices. The Fund’s lack of exposure to energy — the strongest performing sector within the Index during the period — and an underweight exposure to the materials sector hurt relative performance. Meanwhile, rising global inflation forced interest rates and bond yields up, which reduced demand for high-quality growth stocks.
Kingspan Group Plc. (Kingspan), a manufacturer of building materials, detracted from relative returns as the Ireland-based company was hurt by its large exposure to the European market, which deteriorated following the onset of the Ukraine War. Kingspan’s share price was also weakened by investor concerns about the impact of rising interest rates and increasing costs for raw building materials.
The share price of Adidas AG (Adidas), a German sportswear manufacturer in the consumer discretionary sector, was weakened by a decline in sales in China — one of the company’s largest markets — as lockdowns to control COVID-19 continued during the period. Investor concerns about the impact of persistent inflation and rising interest rates on consumer spending globally also weighed on Adidas’ share price.
Fisher & Paykel Healthcare Corp., a health care company based in New Zealand, is a manufacturer of artificial respiration devices used in emergency rooms. Its share price dropped as sales, which had skyrocketed during the COVID-19 pandemic, returned to prepandemic levels during the period.
On the up side, the Fund’s overweight exposure to the health care sector contributed to relative performance during the period. The health care sector benefited from shifting investment demand toward defensive sectors as rising inflation and interest rates weakened prospects for equity growth stocks. Selections in the financials sector, particularly in Asia, further benefited returns relative to the Index during the period.
See Endnotes and Additional Disclosures in this report.
Past performance is no guarantee of future results. Returns are historical and are calculated by determining the percentage change in net asset value (NAV) or offering price (as applicable) with all distributions reinvested. Furthermore, returns do not reflect the deduction of taxes that shareholders may have to pay on Fund distributions or upon the redemption of Fund shares. Investment return and principal value will fluctuate so that shares, when redeemed, may be worth more or less than their original cost. Performance for periods less than or equal to one year is cumulative. Performance is for the stated time period only; due to market volatility, current Fund performance may be lower or higher than the quoted return. For performance as of the most recent month-end, please refer to www.calvert.com.
Calvert
International Equity Fund
September 30, 2022
Management's Discussion of Fund Performance† — continued
DBS Group Holdings Ltd. (DBS) contributed to returns relative to the Index during the period. DBS’ share price rose as the Singapore-based bank benefited from rising interest rates. Investors also rewarded DBS for recent acquisitions that expanded its banking presence in Asia.
Compass Group Plc. (Compass) is a contract catering company serving hospitals, schools, and offices in the U.K. Compass’ share price rose as the company gained market share following the reopening of these institutions in the aftermath of mandatory pandemic shutdowns.
Iberdrola SA (Iberdrola), a Spanish utility, contributed to relative performance during the period as investors pivoted to more defensive businesses in light of rising inflation and interest rates. Iberdrola’s industry-leading renewable energy portfolio positioned the company particularly well amid Europe’s mounting energy crisis.
See Endnotes and Additional Disclosures in this report.
Past performance is no guarantee of future results. Returns are historical and are calculated by determining the percentage change in net asset value (NAV) or offering price (as applicable) with all distributions reinvested. Furthermore, returns do not reflect the deduction of taxes that shareholders may have to pay on Fund distributions or upon the redemption of Fund shares. Investment return and principal value will fluctuate so that shares, when redeemed, may be worth more or less than their original cost. Performance for periods less than or equal to one year is cumulative. Performance is for the stated time period only; due to market volatility, current Fund performance may be lower or higher than the quoted return. For performance as of the most recent month-end, please refer to www.calvert.com.
Calvert
International Equity Fund
September 30, 2022
Performance
Portfolio Manager(s) Christopher M. Dyer, CFA and Ian Kirwan, each of Eaton Vance Advisers International Ltd.
| % Average Annual Total Returns1,2 | Class
Inception Date | Performance
Inception Date | One Year | Five Years | Ten Years |
| Class A at NAV | 07/02/1992 | 07/02/1992 | (27.28)% | 2.05% | 4.02% |
| Class A with 5.25% Maximum Sales Charge | — | — | (31.10) | 0.95 | 3.46 |
| Class C at NAV | 03/01/1994 | 07/02/1992 | (27.85) | 1.29 | 3.36 |
| Class C with 1% Maximum Deferred Sales Charge | — | — | (28.52) | 1.29 | 3.36 |
| Class I at NAV | 02/26/1999 | 07/02/1992 | (27.14) | 2.33 | 4.45 |
| Class R6 at NAV | 03/07/2019 | 07/02/1992 | (27.08) | 2.37 | 4.47 |
|
| MSCI EAFE Index | — | — | (25.13)% | (0.84)% | 3.67% |
| % Total Annual Operating Expense Ratios3 | Class A | Class C | Class I | Class R6 |
| Gross | 1.20% | 1.95% | 0.95% | 0.91% |
| Net | 1.14 | 1.89 | 0.89 | 0.85 |
Growth of $10,000
This graph shows the change in value of a hypothetical investment of $10,000 in Class A of the Fund for the period indicated. For comparison, the same investment is shown in the indicated index.
| Growth of Investment | Amount Invested | Period Beginning | At NAV | With Maximum Sales Charge |
| Class C | $10,000 | 09/30/2012 | $13,920 | N.A. |
| Class I, at minimum investment | $1,000,000 | 09/30/2012 | $1,546,068 | N.A. |
| Class R6, at minimum investment | $5,000,000 | 09/30/2012 | $7,745,983 | N.A. |
See Endnotes and Additional Disclosures in this report.
Past performance is no guarantee of future results. Returns are historical and are calculated by determining the percentage change in net asset value (NAV) or offering price (as applicable) with all distributions reinvested. Furthermore, returns do not reflect the deduction of taxes that shareholders may have to pay on Fund distributions or upon the redemption of Fund shares. Investment return and principal value will fluctuate so that shares, when redeemed, may be worth more or less than their original cost. Performance for periods less than or equal to one year is cumulative. Performance is for the stated time period only; due to market volatility, current Fund performance may be lower or higher than the quoted return. For performance as of the most recent month-end, please refer to www.calvert.com.
Calvert
International Equity Fund
September 30, 2022
| Sector Allocation (% of net assets)1 |
| Top 10 Holdings (% of net assets)1 | |
| Nestle S.A. | 6.3% |
| Iberdrola S.A. | 3.6 |
| Reckitt Benckiser Group PLC | 3.5 |
| Compass Group PLC | 3.5 |
| RELX PLC | 3.3 |
| DBS Group Holdings, Ltd. | 3.3 |
| Sanofi | 3.2 |
| AIA Group, Ltd. | 3.2 |
| AstraZeneca PLC | 3.1 |
| CSL, Ltd. | 3.1 |
| Total | 36.1% |
Footnotes:
| 1 | Excludes cash and cash equivalents. |
Calvert
International Equity Fund
September 30, 2022
Endnotes and Additional Disclosures
| † | The views expressed in this report are those of the portfolio manager(s) and are current only through the date stated at the top of this page. These views are subject to change at any time based upon market or other conditions, and Calvert and the Fund(s) disclaim any responsibility to update such views. These views may not be relied upon as investment advice and, because investment decisions are based on many factors, may not be relied upon as an indication of trading intent on behalf of any Calvert fund. This commentary may contain statements that are not historical facts, referred to as “forward-looking statements.” The Fund’s actual future results may differ significantly from those stated in any forward-looking statement, depending on factors such as changes in securities or financial markets or general economic conditions, the volume of sales and purchases of Fund shares, the continuation of investment advisory, administrative and service contracts, and other risks discussed from time to time in the Fund’s filings with the Securities and Exchange Commission. |
| | |
| 1 | MSCI EAFE Index is an unmanaged index of equities in the developed markets, excluding the U.S. and Canada. MSCI indexes are net of foreign withholding taxes. Source: MSCI. MSCI data may not be reproduced or used for any other purpose. MSCI provides no warranties, has not prepared or approved this report, and has no liability hereunder. Unless otherwise stated, index returns do not reflect the effect of any applicable sales charges, commissions, expenses, taxes or leverage, as applicable. It is not possible to invest directly in an index. |
| 2 | Total Returns at NAV do not include applicable sales charges. If sales charges were deducted, the returns would be lower. Total Returns shown with maximum sales charge reflect the stated maximum sales charge. Unless otherwise stated, performance does not reflect the deduction of taxes on Fund distributions or redemptions of Fund shares.Performance prior to the inception date of a class may be linked to the performance of an older class of the Fund. This linked performance is adjusted for any applicable sales charge, but is not adjusted for class expense differences. If adjusted for such differences, the performance would be different. The performance of Class R6 is linked to Class I. Performance presented in the Financial Highlights included in the financial statements is not linked.Effective November 5, 2020, Class C shares automatically convert to Class A shares eight years after purchase. The average annual total returns listed for Class C reflect conversion to Class A shares after eight years. Prior to November 5, 2020, Class C shares automatically converted to Class A shares ten years after purchase. |
| | Calvert Research and Management became the investment adviser to the Fund on December 31, 2016. Performance reflected prior to such date is that of the Fund’s former investment adviser. |
| 3 | Source: Fund prospectus. Net expense ratios reflect a contractual expense reimbursement that continues through 1/31/23. The expense ratios for the current reporting period can be found in the Financial Highlights section of this report. Performance reflects expenses waived and/or reimbursed, if applicable. Without such waivers and/or reimbursements, performance would have been lower. |
| Fund profile subject to change due to active management. |
| | Additional Information |
| | S&P 500® Index is an unmanaged index of large-cap stocks commonly used as a measure of U.S. stock market performance. S&P Dow Jones Indices are a product of S&P Dow Jones Indices LLC (“S&P DJI”) and have been licensed for use. S&P® and S&P 500® are registered trademarks of S&P DJI; Dow Jones® is a registered trademark of Dow Jones Trademark Holdings LLC (“Dow Jones”); S&P DJI, Dow Jones and their respective affiliates do not sponsor, endorse, sell or promote the Fund, will not have any liability with respect thereto and do not have any liability for any errors, omissions, or interruptions of the S&P Dow Jones Indices. Nasdaq Composite Index is a market capitalization-weighted index of all domestic and international securities listed on Nasdaq. Source: Nasdaq, Inc. The information is provided by Nasdaq (with its affiliates, are referred to as the “Corporations”) and Nasdaq’s third party licensors on an “as is” basis and the Corporations make no guarantees and bear no liability of any kind with respect to the information or the Fund. MSCI Golden Dragon Index is an unmanaged index of common stocks traded in China, Hong Kong and Taiwan. MSCI ACWI Index is an unmanaged free-float-adjusted, market-capitalization-weighted index designed to measure the equity market performance of developed and emerging markets. MSCI Emerging Markets Index is an unmanaged index of emerging markets common stocks. |
Calvert
International Equity Fund
September 30, 2022
Example
As a Fund shareholder, you incur two types of costs: (1) transaction costs, including sales charges (loads) on purchases and redemption fees (if applicable); and (2) ongoing costs, including management fees; distribution and/or service fees; and other Fund expenses. This Example is intended to help you understand your ongoing costs (in dollars) of Fund investing and to compare these costs with the ongoing costs of investing in other mutual funds. The Example is based on an investment of $1,000 invested at the beginning of the period and held for the entire period (April 1, 2022 to September 30, 2022).
Actual Expenses
The first section of the table below provides information about actual account values and actual expenses. You may use the information in this section, together with the amount you invested, to estimate the expenses that you paid over the period. Simply divide your account value by $1,000 (for example, an $8,600 account value divided by $1,000 = 8.6), then multiply the result by the number in the first section under the heading entitled “Expenses Paid During Period” to estimate the expenses you paid on your account during this period.
Hypothetical Example for Comparison Purposes
The second section of the table below provides information about hypothetical account values and hypothetical expenses based on the actual Fund expense ratio and an assumed rate of return of 5% per year (before expenses), which is not the actual Fund return. The hypothetical account values and expenses may not be used to estimate the actual ending account balance or expenses you paid for the period. You may use this information to compare the ongoing costs of investing in the Fund and other funds. To do so, compare this 5% hypothetical example with the 5% hypothetical examples that appear in the shareholder reports of the other funds.
Please note that the expenses shown in the table are meant to highlight your ongoing costs only and do not reflect any transactional costs, such as sales charges (loads) or redemption fees (if applicable). Therefore, the second section of the table is useful in comparing ongoing costs only, and will not help you determine the relative total costs of owning different funds. In addition, if these transactional costs were included, your costs would be higher.
| | Beginning
Account Value
(4/1/22) | Ending
Account Value
(9/30/22) | Expenses Paid
During Period*
(4/1/22 – 9/30/22) | Annualized
Expense
Ratio |
| Actual | | | | |
| Class A | $1,000.00 | $ 772.40 | $5.07 ** | 1.14% |
| Class C | $1,000.00 | $ 769.80 | $8.39 ** | 1.89% |
| Class I | $1,000.00 | $ 773.30 | $3.96 ** | 0.89% |
| Class R6 | $1,000.00 | $ 773.70 | $3.78 ** | 0.85% |
| Hypothetical | | | | |
| (5% return per year before expenses) | | | | |
| Class A | $1,000.00 | $1,019.35 | $5.77 ** | 1.14% |
| Class C | $1,000.00 | $1,015.59 | $9.55 ** | 1.89% |
| Class I | $1,000.00 | $1,020.61 | $4.51 ** | 0.89% |
| Class R6 | $1,000.00 | $1,020.81 | $4.31 ** | 0.85% |
| * | Expenses are equal to the Fund's annualized expense ratio for the indicated Class, multiplied by the average account value over the period, multiplied by 183/365 (to reflect the one-half year period). The Example assumes that the $1,000 was invested at the net asset value per share determined at the close of business on March 31, 2022. |
| ** | Absent a waiver and/or reimbursement of expenses by affiliates, expenses would be higher. |
Calvert
International Equity Fund
September 30, 2022
| Security | Shares | Value |
| Australia — 3.1% | |
| CSL, Ltd. | | 118,699 | $ 21,587,443 |
| | | | $ 21,587,443 |
| Belgium — 2.2% | |
| KBC Group NV | | 324,561 | $ 15,401,713 |
| | | | $ 15,401,713 |
| Denmark — 2.9% | |
| Novo Nordisk A/S, Class B | | 198,797 | $ 19,803,719 |
| | | | $ 19,803,719 |
| France — 10.6% | |
| LVMH Moet Hennessy Louis Vuitton SE | | 31,344 | $ 18,479,629 |
| Safran S.A. | | 184,832 | 16,817,815 |
| Sanofi | | 292,330 | 22,259,900 |
| Schneider Electric SE | | 139,698 | 15,778,995 |
| | | | $ 73,336,339 |
| Germany — 5.6% | |
| adidas AG | | 119,909 | $ 13,784,887 |
| Infineon Technologies AG | | 414,063 | 9,061,364 |
| Siemens AG | | 158,606 | 15,502,602 |
| | | | $ 38,348,853 |
| Hong Kong — 3.2% | |
| AIA Group, Ltd. | | 2,638,592 | $ 21,968,661 |
| | | | $ 21,968,661 |
| India — 2.3% | |
| HDFC Bank, Ltd. | | 914,859 | $ 15,858,189 |
| | | | $ 15,858,189 |
| Ireland — 1.1% | |
| Kingspan Group PLC | | 168,621 | $ 7,597,145 |
| | | | $ 7,597,145 |
| Japan — 12.0% | |
| Keyence Corp. | | 28,627 | $ 9,462,950 |
| Kose Corp. | | 115,060 | 11,863,185 |
| Nihon M&A Center Holdings, Inc. | | 694,050 | 7,937,953 |
| Olympus Corp. | | 880,450 | 16,937,858 |
| Recruit Holdings Co., Ltd. | | 371,567 | 10,703,222 |
| SMC Corp. | | 21,960 | 8,937,070 |
| Yamaha Corp. | | 481,365 | 17,105,000 |
| | | | $ 82,947,238 |
| Security | Shares | Value |
| Netherlands — 2.6% | |
| ASML Holding NV | | 42,462 | $ 17,591,107 |
| | | | $ 17,591,107 |
| New Zealand — 1.3% | |
| Fisher & Paykel Healthcare Corp., Ltd. | | 886,138 | $ 9,184,716 |
| | | | $ 9,184,716 |
| Singapore — 3.3% | |
| DBS Group Holdings, Ltd. | | 972,238 | $ 22,491,131 |
| | | | $ 22,491,131 |
| South Africa — 1.1% | |
| Vodacom Group, Ltd. | | 1,111,376 | $ 7,467,433 |
| | | | $ 7,467,433 |
| Spain — 5.4% | |
| Amadeus IT Group S.A.(1) | | 260,321 | $ 12,069,165 |
| Iberdrola S.A.(2) | | 2,679,414 | 24,983,346 |
| | | | $ 37,052,511 |
| Sweden — 5.1% | |
| Assa Abloy AB, Class B | | 610,181 | $ 11,432,383 |
| Indutrade AB | | 645,166 | 10,464,567 |
| Svenska Handelsbanken AB, Class A | | 1,624,087 | 13,332,116 |
| | | | $ 35,229,066 |
| Switzerland — 9.5% | |
| Lonza Group AG | | 32,717 | $ 15,929,611 |
| Nestle S.A. | | 399,792 | 43,240,428 |
| Straumann Holding AG | | 71,343 | 6,525,041 |
| | | | $ 65,695,080 |
| Taiwan — 1.0% | |
| Taiwan Semiconductor Manufacturing Co., Ltd. ADR | | 103,276 | $ 7,080,602 |
| | | | $ 7,080,602 |
| United Kingdom — 26.5% | |
| Abcam PLC(1) | | 821,510 | $ 12,266,562 |
| Ashtead Group PLC | | 240,904 | 10,818,949 |
| AstraZeneca PLC | | 197,376 | 21,697,429 |
| Compass Group PLC | | 1,198,252 | 23,860,080 |
| Halma PLC | | 493,767 | 11,105,985 |
| InterContinental Hotels Group PLC | | 318,417 | 15,335,552 |
| London Stock Exchange Group PLC | | 185,405 | 15,657,242 |
| Reckitt Benckiser Group PLC | | 360,757 | 23,911,492 |
| RELX PLC | | 939,301 | 22,952,514 |
| Vodafone Group PLC | | 13,680,405 | 15,311,103 |
8
See Notes to Financial Statements.
Calvert
International Equity Fund
September 30, 2022
Schedule of Investments — continued
| Security | Shares | Value |
| United Kingdom (continued) | |
| Weir Group PLC (The) | | 628,221 | $ 9,725,622 |
| | | | $182,642,530 |
Total Common Stocks
(identified cost $805,965,899) | | | $681,283,476 |
| High Social Impact Investments — 0.1% |
| Security | Principal
Amount
(000's omitted) | Value |
| Calvert Impact Capital, Inc., Community Investment Notes, 1.50%, 12/15/23(3)(4) | $ | 880 | $ 817,309 |
Total High Social Impact Investments
(identified cost $880,000) | | | $ 817,309 |
| Preferred Stocks — 0.0%(5) |
| Security | Shares | Value |
| Venture Capital — 0.0%(5) | |
| Bioceptive, Inc.: | | | |
| Series A(1)(4)(6) | | 582,574 | $ 0 |
| Series B(1)(4)(6) | | 40,523 | 0 |
| FINAE, Series D(1)(4)(6) | | 2,597,442 | 128,972 |
Total Preferred Stocks
(identified cost $491,304) | | | $ 128,972 |
| Venture Capital Limited Partnership Interests — 0.2% |
| Security | | | Value |
| Africa Renewable Energy Fund L.P.(1)(4)(6) | | | $ 1,031,746 |
| Emerald Sustainability Fund I L.P.(1)(4)(6) | | | 45,939 |
| gNet Defta Development Holding LLC(1)(3)(4)(6) | | | 194,151 |
| SEAF India International Growth Fund L.P.(1)(4)(6) | | | 0 |
Total Venture Capital Limited Partnership Interests
(identified cost $1,986,717) | | | $ 1,271,836 |
| Short-Term Investments — 0.5% |
| Security | Shares | Value |
| Morgan Stanley Institutional Liquidity Funds - Government Portfolio, Institutional Class, 2.80%(7) | | 3,030,574 | $ 3,030,574 |
Total Short-Term Investments
(identified cost $3,030,574) | | | $ 3,030,574 |
| | | Value |
Total Investments — 99.6%
(identified cost $812,354,494) | | $686,532,167 |
| Other Assets, Less Liabilities — 0.4% | | $ 3,049,989 |
| Net Assets — 100.0% | | $689,582,156 |
| The percentage shown for each investment category in the Schedule of Investments is based on net assets. |
| (1) | Non-income producing security. |
| (2) | All or a portion of this security was on loan at September 30, 2022. The aggregate market value of securities on loan at September 30, 2022 was $571,051. |
| (3) | May be deemed to be an affiliated company (see Note 8). |
| (4) | Restricted security. Total market value of restricted securities amounts to $2,218,117, which represents 0.3% of the net assets of the Fund as of September 30, 2022. |
| (5) | Amount is less than 0.05%. |
| (6) | For fair value measurement disclosure purposes, security is categorized as Level 3 (see Note 1A). |
| (7) | May be deemed to be an affiliated investment company. The rate shown is the annualized seven-day yield as of September 30, 2022. |
At September 30, 2022, the concentration of the Fund’s investments in the various sectors, determined as a percentage of net assets, was as follows:
| Economic Sectors | % of Net Assets |
| Industrials | 21.6% |
| Health Care | 21.2 |
| Financials | 15.2 |
| Consumer Discretionary | 12.8 |
| Consumer Staples | 11.5 |
| Information Technology | 9.6 |
| Utilities | 3.6 |
| Communication Services | 3.3 |
| Venture Capital | 0.2 |
| High Social Impact Investments | 0.1 |
| Total | 99.1% |
9
See Notes to Financial Statements.
Calvert
International Equity Fund
September 30, 2022
Schedule of Investments — continued
Restricted Securities
| Description | Acquisition Dates | Cost |
| Africa Renewable Energy Fund L.P. | 4/17/14-5/13/19 | $997,005 |
| Bioceptive, Inc., Series A | 10/26/12-12/18/13 | 252,445 |
| Bioceptive, Inc., Series B | 1/7/16 | 16,250 |
| Calvert Impact Capital, Inc., Community Investment Notes, 1.50%, 12/15/23 | 12/14/20 | 880,000 |
| Emerald Sustainability Fund I L.P. | 7/19/01-5/17/11 | 393,935 |
| FINAE, Series D | 2/28/11-11/16/15 | 222,609 |
| gNet Defta Development Holding LLC | 8/30/05 | 400,000 |
| SEAF India International Growth Fund L.P. | 3/22/05-5/24/10 | 195,777 |
| Abbreviations: |
| ADR | – American Depositary Receipt |
10
See Notes to Financial Statements.
Calvert
International Equity Fund
September 30, 2022
Statement of Assets and Liabilities
| | September 30, 2022 |
| Assets | |
Investments in securities of unaffiliated issuers, at value (identified cost $808,043,920) - including
$571,051 of securities on loan | $ 682,490,133 |
| Investments in securities of affiliated issuers, at value (identified cost $4,310,574) | 4,042,034 |
| Cash | 3,034,937 |
| Cash denominated in foreign currency, at value (cost $14,656) | 14,590 |
| Receivable for investments sold | 1,129,089 |
| Receivable for capital shares sold | 2,279,103 |
| Dividends receivable | 591,361 |
| Dividends and interest receivable - affiliated | 31,860 |
| Securities lending income receivable | 135 |
| Tax reclaims receivable | 1,002,646 |
| Receivable from affiliates | 91,863 |
| Directors' deferred compensation plan | 111,553 |
| Other assets | 1,077 |
| Total assets | $ 694,820,381 |
| Liabilities | |
| Payable for capital shares redeemed | $ 1,181,438 |
| Payable for foreign capital gains taxes | 140,809 |
| Payable to affiliates: | |
| Investment advisory fee | 401,395 |
| Administrative fee | 72,688 |
| Distribution and service fees | 36,885 |
| Sub-transfer agency fee | 13,549 |
| Directors' deferred compensation plan | 111,553 |
| Accrued expenses | 248,493 |
| Other liabilities | 3,031,415 |
| Total liabilities | $ 5,238,225 |
| Commitments and contingent liabilities (Note 11) | |
| Net Assets | $ 689,582,156 |
| Sources of Net Assets | |
| Paid-in capital | $ 799,919,509 |
| Accumulated loss | (110,337,353) |
| Net Assets | $ 689,582,156 |
| Class A Shares | |
| Net Assets | $ 140,997,624 |
| Shares Outstanding | 8,260,438 |
Net Asset Value and Redemption Price Per Share
(net assets ÷ shares of beneficial interest outstanding) | $ 17.07 |
Maximum Offering Price Per Share
(100 ÷ 94.75 of net asset value per share) | $ 18.02 |
| Class C Shares | |
| Net Assets | $ 4,303,783 |
| Shares Outstanding | 300,798 |
Net Asset Value and Offering Price Per Share*
(net assets ÷ shares of beneficial interest outstanding) | $ 14.31 |
11
See Notes to Financial Statements.
Calvert
International Equity Fund
September 30, 2022
Statement of Assets and Liabilities — continued
| | September 30, 2022 |
| Class I Shares | |
| Net Assets | $ 416,978,137 |
| Shares Outstanding | 22,719,088 |
Net Asset Value, Offering Price and Redemption Price Per Share
(net assets ÷ shares of beneficial interest outstanding) | $ 18.35 |
| Class R6 Shares | |
| Net Assets | $ 127,302,612 |
| Shares Outstanding | 6,946,769 |
Net Asset Value, Offering Price and Redemption Price Per Share
(net assets ÷ shares of beneficial interest outstanding) | $ 18.33 |
| On sales of $50,000 or more, the offering price of Class A shares is reduced. |
| * | Redemption price per share is equal to the net asset value less any applicable contingent deferred sales charge. |
12
See Notes to Financial Statements.
Calvert
International Equity Fund
September 30, 2022
| | Year Ended |
| | September 30, 2022 |
| Investment Income | |
| Dividend income (net of foreign taxes withheld of $2,103,299) | $ 17,386,434 |
| Dividend income - affiliated issuers | 46,049 |
| Non-cash dividend income | 1,229,723 |
| Interest and other income | 49,013 |
| Interest income - affiliated issuers | 13,200 |
| Securities lending income, net | 157,946 |
| Total investment income | $ 18,882,365 |
| Expenses | |
| Investment advisory fee | $ 5,609,638 |
| Administrative fee | 1,014,856 |
| Distribution and service fees: | |
| Class A | 461,118 |
| Class C | 62,482 |
| Directors' fees and expenses | 37,052 |
| Custodian fees | 85,291 |
| Transfer agency fees and expenses | 768,266 |
| Accounting fees | 197,746 |
| Professional fees | 58,450 |
| Registration fees | 165,438 |
| Reports to shareholders | 51,513 |
| Miscellaneous | 64,121 |
| Total expenses | $ 8,575,971 |
| Waiver and/or reimbursement of expenses by affiliates | $ (574,518) |
| Net expenses | $ 8,001,453 |
| Net investment income | $ 10,880,912 |
| Realized and Unrealized Gain (Loss) | |
| Net realized gain (loss): | |
| Investment securities (net of foreign capital gains taxes of $9,892) | $ 21,308,588 |
| Investment securities - affiliated issuers | 1,652 |
| Foreign currency transactions | (208,787) |
| Net realized gain | $ 21,101,453 |
| Change in unrealized appreciation (depreciation): | |
| Investment securities (including net increase in payable for foreign capital gains taxes of $140,809) | $ (286,389,938) |
| Investment securities - affiliated issuers | (85,598) |
| Foreign currency | (136,395) |
| Net change in unrealized appreciation (depreciation) | $(286,611,931) |
| Net realized and unrealized loss | $(265,510,478) |
| Net decrease in net assets from operations | $(254,629,566) |
13
See Notes to Financial Statements.
Calvert
International Equity Fund
September 30, 2022
Statements of Changes in Net Assets
| | Year Ended September 30, |
| | 2022 | 2021 |
| Increase (Decrease) in Net Assets | | |
| From operations: | | |
| Net investment income | $ 10,880,912 | $ 4,502,444 |
| Net realized gain | 21,101,453 | 56,441,711 |
| Net change in unrealized appreciation (depreciation) | (286,611,931) | 86,903,672 |
| Net increase (decrease) in net assets from operations | $(254,629,566) | $147,847,827 |
| Distributions to shareholders: | | |
| Class A | $ (11,969,909) | $ (313,091) |
| Class C | (506,133) | — |
| Class I | (34,004,747) | (1,619,435) |
| Class R6 | (10,457,460) | (712,823) |
| Total distributions to shareholders | $ (56,938,249) | $ (2,645,349) |
| Capital share transactions: | | |
| Class A | $ 18,361,281 | $ 18,954,832 |
| Class C | (881,402) | 5,633 |
| Class I | 75,702,092 | 164,196,275 |
| Class R6 | 24,801,196 | 8,652,717 |
| Net increase in net assets from capital share transactions | $ 117,983,167 | $191,809,457 |
| Net increase (decrease) in net assets | $(193,584,648) | $337,011,935 |
| Net Assets | | |
| At beginning of year | $ 883,166,804 | $ 546,154,869 |
| At end of year | $ 689,582,156 | $883,166,804 |
14
See Notes to Financial Statements.
Calvert
International Equity Fund
September 30, 2022
| | Class A |
| | Year Ended September 30, |
| | 2022 | 2021 | 2020 | 2019 | 2018 |
| Net asset value — Beginning of year | $ 25.06 | $ 20.35 | $ 18.18 | $ 17.53 | $ 17.10 |
| Income (Loss) From Operations | | | | | |
| Net investment income(1) | $ 0.25 | $ 0.08 | $ 0.06 | $ 0.22 | $ 0.19 |
| Net realized and unrealized gain (loss) | (6.64) | 4.67 | 2.30 | 0.61 | 0.50 |
| Total income (loss) from operations | $ (6.39) | $ 4.75 | $ 2.36 | $ 0.83 | $ 0.69 |
| Less Distributions | | | | | |
| From net investment income | $ (0.23) | $ (0.04) | $ (0.19) | $ (0.18) | $ (0.26) |
| From net realized gain | (1.37) | — | — | — | — |
| Total distributions | $ (1.60) | $ (0.04) | $ (0.19) | $ (0.18) | $ (0.26) |
| Net asset value — End of year | $ 17.07 | $ 25.06 | $ 20.35 | $ 18.18 | $ 17.53 |
| Total Return(2) | (27.28)% | 23.38% | 13.02% | 4.93% | 4.02% |
| Ratios/Supplemental Data | | | | | |
| Net assets, end of year (000’s omitted) | $140,998 | $190,998 | $138,810 | $112,923 | $114,915 |
| Ratios (as a percentage of average daily net assets):(3) | | | | | |
| Total expenses | 1.22% | 1.20% | 1.27% | 1.46% | 1.47% |
| Net expenses | 1.14% (4) | 1.14% | 1.14% | 1.27% | 1.32% |
| Net investment income | 1.15% | 0.34% | 0.33% | 1.26% | 1.09% |
| Portfolio Turnover | 32% | 38% | 47% | 51% | 48% |
| (1) | Computed using average shares outstanding. |
| (2) | Returns are historical and are calculated by determining the percentage change in net asset value with all distributions reinvested and do not reflect the effect of sales charges, if any. |
| (3) | Total expenses do not reflect amounts reimbursed and/or waived by the adviser and certain of its affiliates, if applicable. Net expenses are net of all reductions and represent the net expenses paid by the Fund. |
| (4) | Includes a reduction by the investment adviser of a portion of its advisory fee due to the Fund's investment in the Liquidity Fund (equal to less than 0.005% of average daily net assets for the year ended September 30, 2022). |
15
See Notes to Financial Statements.
Calvert
International Equity Fund
September 30, 2022
Financial Highlights — continued
| | Class C |
| | Year Ended September 30, |
| | 2022 | 2021 | 2020 | 2019 | 2018 |
| Net asset value — Beginning of year | $ 21.28 | $ 17.37 | $ 15.54 | $ 15.00 | $ 14.68 |
| Income (Loss) From Operations | | | | | |
| Net investment income (loss)(1) | $ 0.06 | $ (0.09) | $ (0.07) | $ 0.03 | $ 0.06 |
| Net realized and unrealized gain (loss) | (5.57) | 4.00 | 1.96 | 0.58 | 0.42 |
| Total income (loss) from operations | $ (5.51) | $ 3.91 | $ 1.89 | $ 0.61 | $ 0.48 |
| Less Distributions | | | | | |
| From net investment income | $ (0.09) | $ — | $ (0.06) | $ (0.07) | $ (0.16) |
| From net realized gain | (1.37) | — | — | — | — |
| Total distributions | $ (1.46) | $ — | $ (0.06) | $ (0.07) | $ (0.16) |
| Net asset value — End of year | $ 14.31 | $21.28 | $17.37 | $15.54 | $ 15.00 |
| Total Return(2) | (27.85)% | 22.51% | 12.17% | 4.15% | 3.23% |
| Ratios/Supplemental Data | | | | | |
| Net assets, end of year (000’s omitted) | $ 4,304 | $ 7,485 | $ 6,157 | $ 6,122 | $11,149 |
| Ratios (as a percentage of average daily net assets):(3) | | | | | |
| Total expenses | 1.96% | 1.95% | 2.02% | 2.21% | 2.22% |
| Net expenses | 1.89% (4) | 1.89% | 1.89% | 2.03% | 2.07% |
| Net investment income (loss) | 0.32% | (0.42)% | (0.43)% | 0.23% | 0.39% |
| Portfolio Turnover | 32% | 38% | 47% | 51% | 48% |
| (1) | Computed using average shares outstanding. |
| (2) | Returns are historical and are calculated by determining the percentage change in net asset value with all distributions reinvested and do not reflect the effect of sales charges, if any. |
| (3) | Total expenses do not reflect amounts reimbursed and/or waived by the adviser and certain of its affiliates, if applicable. Net expenses are net of all reductions and represent the net expenses paid by the Fund. |
| (4) | Includes a reduction by the investment adviser of a portion of its advisory fee due to the Fund's investment in the Liquidity Fund (equal to less than 0.005% of average daily net assets for the year ended September 30, 2022). |
16
See Notes to Financial Statements.
Calvert
International Equity Fund
September 30, 2022
Financial Highlights — continued
| | Class I |
| | Year Ended September 30, |
| | 2022 | 2021 | 2020 | 2019 | 2018 |
| Net asset value — Beginning of year | $ 26.83 | $ 21.77 | $ 19.43 | $ 18.72 | $ 18.24 |
| Income (Loss) From Operations | | | | | |
| Net investment income(1) | $ 0.31 | $ 0.16 | $ 0.13 | $ 0.28 | $ 0.27 |
| Net realized and unrealized gain (loss) | (7.13) | 5.00 | 2.45 | 0.66 | 0.53 |
| Total income (loss) from operations | $ (6.82) | $ 5.16 | $ 2.58 | $ 0.94 | $ 0.80 |
| Less Distributions | | | | | |
| From net investment income | $ (0.29) | $ (0.10) | $ (0.24) | $ (0.23) | $ (0.32) |
| From net realized gain | (1.37) | — | — | — | — |
| Total distributions | $ (1.66) | $ (0.10) | $ (0.24) | $ (0.23) | $ (0.32) |
| Net asset value — End of year | $ 18.35 | $ 26.83 | $ 21.77 | $ 19.43 | $ 18.72 |
| Total Return(2) | (27.14)% | 23.75% | 13.31% | 5.25% | 4.37% |
| Ratios/Supplemental Data | | | | | |
| Net assets, end of year (000’s omitted) | $416,978 | $524,521 | $279,039 | $82,261 | $64,739 |
| Ratios (as a percentage of average daily net assets):(3) | | | | | |
| Total expenses | 0.96% | 0.95% | 1.02% | 1.20% | 1.22% |
| Net expenses | 0.89% (4) | 0.89% | 0.89% | 0.98% | 0.95% |
| Net investment income | 1.32% | 0.63% | 0.61% | 1.52% | 1.44% |
| Portfolio Turnover | 32% | 38% | 47% | 51% | 48% |
| (1) | Computed using average shares outstanding. |
| (2) | Returns are historical and are calculated by determining the percentage change in net asset value with all distributions reinvested and do not reflect the effect of sales charges, if any. |
| (3) | Total expenses do not reflect amounts reimbursed and/or waived by the adviser and certain of its affiliates, if applicable. Net expenses are net of all reductions and represent the net expenses paid by the Fund. |
| (4) | Includes a reduction by the investment adviser of a portion of its advisory fee due to the Fund's investment in the Liquidity Fund (equal to less than 0.005% of average daily net assets for the year ended September 30, 2022). |
17
See Notes to Financial Statements.
Calvert
International Equity Fund
September 30, 2022
Financial Highlights — continued
| | Class R6 |
| | Year Ended September 30, | Period Ended
September 30, |
| | 2022 | 2021 | 2020 | 2019 (1) |
| Net asset value — Beginning of period | $ 26.80 | $ 21.76 | $ 19.44 | $ 17.79 |
| Income (Loss) From Operations | | | | |
| Net investment income(2) | $ 0.32 | $ 0.16 | $ 0.13 | $ 0.28 |
| Net realized and unrealized gain (loss) | (7.11) | 5.00 | 2.46 | 1.37 |
| Total income (loss) from operations | $ (6.79) | $ 5.16 | $ 2.59 | $ 1.65 |
| Less Distributions | | | | |
| From net investment income | $ (0.31) | $ (0.12) | $ (0.27) | $ — |
| From net realized gain | (1.37) | — | — | — |
| Total distributions | $ (1.68) | $ (0.12) | $ (0.27) | $ — |
| Net asset value — End of period | $ 18.33 | $ 26.80 | $ 21.76 | $ 19.44 |
| Total Return(3) | (27.08)% | 23.79% | 13.34% | 9.27% (4) |
| Ratios/Supplemental Data | | | | |
| Net assets, end of period (000’s omitted) | $127,303 | $160,163 | $122,150 | $49,332 |
| Ratios (as a percentage of average daily net assets):(5) | | | | |
| Total expenses | 0.92% | 0.91% | 0.98% | 1.14% (6) |
| Net expenses | 0.85% (7) | 0.85% | 0.85% | 0.96% (6) |
| Net investment income | 1.38% | 0.63% | 0.64% | 2.62% (6) |
| Portfolio Turnover | 32% | 38% | 47% | 51% (8) |
| (1) | For the period from the commencement of operations, March 7, 2019, to September 30, 2019. |
| (2) | Computed using average shares outstanding. |
| (3) | Returns are historical and are calculated by determining the percentage change in net asset value with all distributions reinvested and do not reflect the effect of sales charges, if any. |
| (4) | Not annualized. |
| (5) | Total expenses do not reflect amounts reimbursed and/or waived by the adviser and certain of its affiliates, if applicable. Net expenses are net of all reductions and represent the net expenses paid by the Fund. |
| (6) | Annualized. |
| (7) | Includes a reduction by the investment adviser of a portion of its advisory fee due to the Fund's investment in the Liquidity Fund (equal to less than 0.005% of average daily net assets for the year ended September 30, 2022). |
| (8) | For the year ended September 30, 2019. |
18
See Notes to Financial Statements.
Calvert
International Equity Fund
September 30, 2022
Notes to Financial Statements
1 Significant Accounting Policies
Calvert International Equity Fund (the Fund) is a diversified series of Calvert World Values Fund, Inc. (the Corporation). The Corporation is a Maryland corporation registered under the Investment Company Act of 1940, as amended (the 1940 Act), as an open-end management investment company. The investment objective of the Fund is to seek to provide a high total return consistent with reasonable risk by investing primarily in a diversified portfolio of stocks. The Fund invests primarily in equity securities of foreign companies.
The Fund offers four classes of shares. Class A shares are generally sold subject to a sales charge imposed at time of purchase. A contingent deferred sales charge of 1.00% (0.80% prior to April 29, 2022) may apply to certain redemptions of Class A shares for accounts for which no sales charge was paid, if redeemed within 12 months of purchase. Class C shares are sold without a front-end sales charge, and with certain exceptions, are charged a contingent deferred sales charge of 1% on shares redeemed within 12 months of purchase. Class C shares are only available for purchase through a financial intermediary. Effective November 5, 2020, Class C shares automatically convert to Class A shares eight years after their purchase as described in the Fund’s prospectus. Class I and Class R6 shares are sold at net asset value, are not subject to a sales charge and are sold only to certain eligible investors. Each class represents a pro rata interest in the Fund, but votes separately on class-specific matters and is subject to different expenses.
The Fund applies the accounting and reporting guidance in the Financial Accounting Standards Board (FASB) Accounting Standards Codification Topic 946, Financial Services – Investment Companies (ASC 946). Subsequent events, if any, through the date that the financial statements were issued have been evaluated in the preparation of the financial statements.
A Investment Valuation— Net asset value per share is determined every business day as of the close of the regular session of the New York Stock Exchange (generally 4:00 p.m. Eastern time). The Fund uses independent pricing services approved by the Board of Directors (the Board) to value its investments wherever possible. Investments for which market quotations are not available or deemed not reliable are fair valued in good faith under the direction of the Board.
U.S. generally accepted accounting principles (U.S. GAAP) establishes a disclosure hierarchy that categorizes the inputs to valuation techniques used to value assets and liabilities at measurement date. These inputs are summarized in the three broad levels listed below:
Level 1 - quoted prices in active markets for identical securities
Level 2 - other significant observable inputs (including quoted prices for similar securities, interest rates, prepayment speeds, credit risk, etc.)
Level 3 - significant unobservable inputs (including the Fund’s own assumptions in determining the fair value of investments)
The inputs or methodologies used for valuing securities are not necessarily an indication of the risk associated with investing in those securities.
Valuation techniques used to value the Fund’s investments by major category are as follows:
Equity Securities. Equity securities (including warrants and rights) listed on a U.S. securities exchange generally are valued at the last sale or closing price as reported by an independent pricing service on the primary market or exchange on which they are traded and are categorized as Level 1 in the hierarchy. Equity securities listed on the NASDAQ National Market System are valued at the NASDAQ official closing price and are categorized as Level 1 in the hierarchy. Unlisted or listed securities for which closing sales prices or closing quotations are not available are valued at the mean between the latest available bid and ask prices and are categorized as Level 2 in the hierarchy. The daily valuation of exchange-traded foreign securities generally is determined as of the close of trading on the principal exchange on which such securities trade. Events occurring after the close of trading on foreign exchanges may result in adjustments to the valuation of foreign securities to more accurately reflect their fair value as of the close of regular trading on the New York Stock Exchange. When valuing foreign equity securities that meet certain criteria, the Fund’s Board has approved the use of a fair value service that values such securities to reflect market trading that occurs after the close of the applicable foreign markets of comparable securities or other instruments that have a strong correlation to the fair-valued securities. Such securities are categorized as Level 2 in the hierarchy.
Debt Securities. Debt securities are generally valued based on valuations provided by third party pricing services, as derived from such services’ pricing models. Inputs to the models may include, but are not limited to, reported trades, executable bid and ask prices, broker/dealer quotations, prices or yields of securities with similar characteristics, interest rates, anticipated prepayments, benchmark curves or information pertaining to the issuer, as well as industry and economic events. Accordingly, debt securities are generally categorized as Level 2 in the hierarchy. Short-term debt securities with a remaining maturity at time of purchase of more than sixty days are valued based on valuations provided by a third party pricing service. Such securities are generally categorized as Level 2 in the hierarchy. Short-term debt securities of sufficient credit quality purchased with remaining maturities of sixty days or less for which a valuation from a third party pricing service is not readily available may be valued at amortized cost, which approximates fair value, and are categorized as Level 2 in the hierarchy.
Venture Capital Securities. Venture capital securities for which market quotations are not readily available are generally categorized as Level 3 in the hierarchy. Venture capital equity securities are generally valued using the most appropriate and applicable method to measure fair value in light of each company’s situation. Methods may include market, income, options-pricing or cost approaches with discounts as appropriate based on assumptions of liquidation or exit risk. Examples of the market approach are subsequent rounds of financing, comparable transactions, and revenue times an industry multiple. An example of the income approach is the discounted cash flow model. Examples of the cost approach are replacement cost, salvage value, or net asset value. The options-pricing method treats common stock and preferred stock as call options on the enterprise value with strike price based on the
Calvert
International Equity Fund
September 30, 2022
Notes to Financial Statements — continued
preferred stock liquidation preference. Venture capital limited partnership interests are valued at the fair value reported by the general partner of the partnership, adjusted as necessary to reflect subsequent capital calls and distributions and any other available information. In some cases, adjustments may be made to account for daily pricing of material public holdings within the partnership.
Other Securities. Investments in management investment companies (including money market funds) that do not trade on an exchange are valued at the net asset value as of the close of each business day and are categorized as Level 1 in the hierarchy.
Fair Valuation. In connection with Rule 2a-5 of the 1940 Act, which became effective September 8, 2022, the Board has designated the Fund’s investment adviser as its valuation designee. Investments for which valuations or market quotations are not readily available or are deemed unreliable are valued by the investment adviser, as valuation designee, at fair value using methods that most fairly reflect the security’s “fair value”, which is the amount that the Fund might reasonably expect to receive for the security upon its current sale in the ordinary course. Each such determination is based on a consideration of relevant factors, which are likely to vary from one pricing context to another. These factors may include, but are not limited to, the type of security, the existence of any contractual restrictions on the security’s disposition, the price and extent of public trading in similar securities of the issuer or of comparable companies or entities, quotations or relevant information obtained from broker/dealers or other market participants, information obtained from the issuer, analysts, and/or the appropriate stock exchange (for exchange-traded securities), an analysis of the company’s or entity’s financial statements, and an evaluation of the forces that influence the issuer and the market(s) in which the security is purchased and sold.
The values assigned to fair value investments are based on available information and do not necessarily represent amounts that might ultimately be realized. Further, due to the inherent uncertainty of valuations of such investments, the fair values may differ significantly from the values that would have been used had an active market existed, and the differences could be material.
The following table summarizes the market value of the Fund's holdings as of September 30, 2022, based on the inputs used to value them:
| Asset Description | Level 1 | Level 2 | Level 3(1) | Total |
| Common Stocks: | | | | |
| Australia | $ — | $ 21,587,443 | $ — | $ 21,587,443 |
| Belgium | — | 15,401,713 | — | 15,401,713 |
| Denmark | — | 19,803,719 | — | 19,803,719 |
| France | — | 73,336,339 | — | 73,336,339 |
| Germany | — | 38,348,853 | — | 38,348,853 |
| Hong Kong | — | 21,968,661 | — | 21,968,661 |
| India | — | 15,858,189 | — | 15,858,189 |
| Ireland | — | 7,597,145 | — | 7,597,145 |
| Japan | — | 82,947,238 | — | 82,947,238 |
| Netherlands | — | 17,591,107 | — | 17,591,107 |
| New Zealand | — | 9,184,716 | — | 9,184,716 |
| Singapore | — | 22,491,131 | — | 22,491,131 |
| South Africa | — | 7,467,433 | — | 7,467,433 |
| Spain | — | 37,052,511 | — | 37,052,511 |
| Sweden | — | 35,229,066 | — | 35,229,066 |
| Switzerland | — | 65,695,080 | — | 65,695,080 |
| Taiwan | 7,080,602 | — | — | 7,080,602 |
| United Kingdom | — | 182,642,530 | — | 182,642,530 |
| Total Common Stocks | $ 7,080,602 | $674,202,874 (2) | $ — | $681,283,476 |
| High Social Impact Investments | $ — | $ 817,309 | $ — | $ 817,309 |
| Preferred Stocks - Venture Capital | — | — | 128,972 | 128,972 |
| Venture Capital Limited Partnership Interests | — | — | 1,271,836 | 1,271,836 |
Calvert
International Equity Fund
September 30, 2022
Notes to Financial Statements — continued
| Asset Description (continued) | Level 1 | Level 2 | Level 3(1) | Total |
| Short-Term Investments | $ 3,030,574 | $ — | $ — | $ 3,030,574 |
| Total Investments | $10,111,176 | $675,020,183 | $1,400,808 | $686,532,167 |
| (1) | None of the unobservable inputs for Level 3 assets, individually or collectively, had a material impact on the Fund. |
| (2) | Includes foreign equity securities whose values were adjusted to reflect market trading of comparable securities or other correlated instruments that occurred after the close of trading in their applicable foreign markets. |
Level 3 investments at the beginning and/or end of the period in relation to net assets were not significant and accordingly, a reconciliation of Level 3 assets for the year ended September 30, 2022 is not presented.
B Investment Transactions and Income— Investment transactions for financial statement purposes are accounted for on trade date. Realized gains and losses are recorded on an identified cost basis and may include proceeds from litigation. Dividend income is recorded on the ex-dividend date for dividends received in cash and/or securities or, in the case of dividends on certain foreign securities, as soon as the Fund is informed of the ex-dividend date. Non-cash dividends are recorded at the fair value of the securities received. Withholding taxes on foreign dividends, if any, have been provided for in accordance with the Fund's understanding of the applicable country’s tax rules and rates. In consideration of recent decisions rendered by European courts, the Fund has filed additional tax reclaims for previously withheld taxes on dividends earned in certain European Union countries. These filings are subject to various administrative and judicial proceedings within these countries. Due to the uncertainty as to the ultimate resolution of these proceedings, the likelihood of receipt of these reclaims, and the potential timing of payment, no amounts are reflected in the financial statements for such outstanding reclaims.
Distributions received that represent a return of capital are recorded as a reduction of cost of investments. Distributions received that represent a capital gain are recorded as a realized gain. Interest income, which includes amortization of premium and accretion of discount on debt securities, is accrued as earned.
C Share Class Accounting— Realized and unrealized gains and losses and net investment income and losses, other than class-specific expenses, are allocated daily to each class of shares based upon the relative net assets of each class to the total net assets of the Fund. Expenses arising in connection with a specific class are charged directly to that class. Sub-accounting, recordkeeping and similar administrative fees payable to financial intermediaries, which are a component of transfer agency fees and expenses on the Statement of Operations, are not allocated to Class R6 shares.
D Foreign Currency Transactions— The Fund’s accounting records are maintained in U.S. dollars. For valuation of assets and liabilities on each date of net asset value determination, foreign denominations are converted into U.S. dollars using the current exchange rate. Security transactions, income and expenses are translated at the prevailing rate of exchange on the date of the event. Recognized gains or losses on investment transactions attributable to changes in foreign currency exchange rates are recorded for financial statement purposes as net realized gains and losses on investments. That portion of unrealized gains and losses on investments that results from fluctuations in foreign currency exchange rates is not separately disclosed.
E Restricted Securities— The Fund may invest in securities that are subject to legal or contractual restrictions on resale. Generally, these securities may only be sold publicly upon registration under the Securities Act of 1933 or in transactions exempt from such registration. Information regarding restricted securities (excluding Rule 144A securities) is included at the end of the Schedule of Investments.
F Distributions to Shareholders— Distributions to shareholders are recorded by the Fund on ex-dividend date. Distributions from net investment income and distributions from net realized capital gains, if any, are paid at least annually. Distributions are declared separately for each class of shares. Distributions are determined in accordance with income tax regulations, which may differ from U.S. GAAP; accordingly, periodic reclassifications are made within the Fund's capital accounts to reflect income and gains available for distribution under income tax regulations.
G Estimates— The preparation of financial statements in conformity with U.S. GAAP requires management to make estimates and assumptions that affect the reported amounts of assets and liabilities and disclosure of contingent assets and liabilities at the date of the financial statements and the reported amounts of increases and decreases in net assets from operations during the reporting period. Actual results could differ from those estimates.
H Indemnifications— The Corporation’s By-Laws provide for indemnification for Directors or officers of the Corporation and certain other parties, to the fullest extent permitted by Maryland law and the 1940 Act, provided certain conditions are met. Additionally, in the normal course of business, the Fund enters into agreements with service providers that may contain indemnification clauses. The Fund’s maximum exposure under these arrangements is unknown as this would involve future claims that may be made against the Fund that have not yet occurred.
I Federal Income Taxes— No provision for federal income or excise tax is required since the Fund intends to continue to qualify as a regulated investment company under the Internal Revenue Code and to distribute substantially all of its taxable earnings.
Calvert
International Equity Fund
September 30, 2022
Notes to Financial Statements — continued
In addition to the requirements of the Internal Revenue Code, the Fund may also be subject to local taxes on the recognition of capital gains in certain countries. In determining the daily net asset value, the Fund estimates the accrual for such taxes, if any, based on the unrealized appreciation on certain portfolio securities and the related tax rates. Taxes attributable to unrealized appreciation are included in the change in unrealized appreciation (depreciation) on investments. Capital gains taxes on securities sold are included in net realized gain (loss) on investments.
Management has analyzed the Fund's tax positions taken for all open federal income tax years and has concluded that no provision for federal income tax is required in the Fund's financial statements. A Fund's federal tax return is subject to examination by the Internal Revenue Service for a period of three years from the date of filing.
2 Related Party Transactions
The investment advisory fee is earned by Calvert Research and Management (CRM), an indirect, wholly-owned subsidiary of Morgan Stanley, as compensation for investment advisory services rendered to the Fund. The investment advisory fee is computed at an annual rate as a percentage of the Fund’s average daily net assets as follows and is payable monthly:
| Average Daily Net Assets | Annual Fee
Rate |
| Up to and including $250 million | 0.680% |
| Over $250 million up to and including $500 million | 0.665% |
| Over $500 million | 0.650% |
For the year ended September 30, 2022, the investment advisory fee amounted to $5,609,638 or 0.66% of the Fund’s average daily net assets.
Pursuant to an investment sub-advisory agreement, CRM has delegated the investment management of the Fund to Eaton Vance Advisers International Ltd. (EVAIL), an affiliate of CRM and an indirect, wholly-owned subsidiary of Morgan Stanley. CRM pays EVAIL a portion of its investment advisory fee for sub-advisory services provided to the Fund.
Effective April 26, 2022, the Fund may invest in a money market fund, the Institutional Class of the Morgan Stanley Institutional Liquidity Funds - Government Portfolio (the “Liquidity Fund”), an open-end management investment company managed by Morgan Stanley Investment Management Inc., a wholly-owned subsidiary of Morgan Stanley. The investment advisory fee paid by the Fund is reduced by an amount equal to its pro-rata share of the advisory and administration fees paid by the Fund due to its investment in the Liquidity Fund. For the year ended September 30, 2022, the investment advisory fee paid was reduced by $3,730 relating to the Fund’s investment in the Liquidity Fund. Prior to April 26, 2022, the Fund may have invested its cash in Calvert Cash Reserves Fund, LLC (Cash Reserves Fund), an affiliated investment company managed by CRM. CRM did not receive a fee for advisory services provided to Cash Reserves Fund.
CRM and EVAIL have agreed to reimburse the Fund’s operating expenses to the extent that total annual operating expenses (relating to ordinary operating expenses only and excluding expenses such as brokerage commissions, acquired fund fees and expenses of unaffiliated funds, borrowing costs, taxes or litigation expenses) exceed 1.14%, 1.89%, 0.89% and 0.85% for Class A, Class C, Class I and Class R6, respectively, of such class’s average daily net assets. The expense reimbursement agreement may be changed or terminated after January 31, 2023. For the year ended September 30, 2022, CRM and EVAIL waived or reimbursed expenses in total of $570,788.
The administrative fee is earned by CRM as compensation for administrative services rendered to the Fund. The fee is computed at an annual rate of 0.12% of the Fund’s average daily net assets attributable to Class A, Class C, Class I and Class R6 and is payable monthly. For the year ended September 30, 2022, CRM was paid administrative fees of $1,014,856.
The Fund has in effect a distribution plan for Class A shares (Class A Plan) pursuant to Rule 12b-1 under the 1940 Act. Pursuant to the Class A Plan, the Fund pays Eaton Vance Distributors, Inc. (EVD), an affiliate of CRM and the Fund’s principal underwriter, a distribution and service fee of 0.25% per annum of its average daily net assets attributable to Class A shares for distribution services and facilities provided to the Fund by EVD, as well as for personal services and/or the maintenance of shareholder accounts. The Fund also has in effect a distribution plan for Class C shares (Class C Plan) pursuant to Rule 12b-1 under the 1940 Act. Pursuant to the Class C Plan, the Fund pays EVD amounts equal to 0.75% per annum of its average daily net assets attributable to Class C shares for providing ongoing distribution services and facilities to the Fund. In addition, pursuant to the Class C Plan, the Fund also makes payments of service fees to EVD, financial intermediaries and other persons in amounts equal to 0.25% per annum of its average daily net assets attributable to that class. Service fees paid or accrued are for personal services and/or the maintenance of shareholder accounts. Distribution and service fees paid or accrued for the year ended September 30, 2022 amounted to $461,118 and $62,482 for Class A shares and Class C shares, respectively.
Calvert
International Equity Fund
September 30, 2022
Notes to Financial Statements — continued
The Fund was informed that EVD received $25,889 as its portion of the sales charge on sales of Class A shares for the year ended September 30, 2022. The Fund was also informed that EVD received $1,060 and $932 of contingent deferred sales charges paid by Class A and Class C shareholders, respectively, for the same period. The Fund was informed that Morgan Stanley affiliated broker-dealers, which may be deemed to be affiliates of CRM and EVD, also received a portion of the sales charge on sales of Class A shares for the year ended September 30, 2022 in the amount of $2,196.
Eaton Vance Management (EVM), an affiliate of CRM, provides sub-transfer agency and related services to the Fund pursuant to a Sub-Transfer Agency Support Services Agreement. For the year ended September 30, 2022, sub-transfer agency fees and expenses incurred to EVM amounted to $73,382 and are included in transfer agency fees and expenses on the Statement of Operations.
Each Director of the Fund who is not an employee of CRM or its affiliates receives an annual fee of $214,000 ($154,000 prior to January 1, 2022), plus an annual Committee fee ranging from $8,500 to $16,500 depending on the Committee. The Board chair receives an additional $30,000 annual fee, Committee chairs receive an additional $6,000 annual fee and the special equities liaison receives an additional $2,500 annual fee. Eligible Directors may participate in a Deferred Compensation Plan (the Plan). Amounts deferred under the Plan are treated as though equal dollar amounts had been invested in shares of the Fund or other Calvert funds selected by the Directors. The Fund purchases shares of the funds selected equal to the dollar amounts deferred under the Plan, resulting in an asset equal to the deferred compensation liability. Obligations of the Plan are paid solely from the Fund's assets. Directors’ fees are allocated to each of the Calvert funds served. Salaries and fees of officers and Directors of the Fund who are employees of CRM or its affiliates are paid by CRM.
3 Investment Activity
During the year ended September 30, 2022, the cost of purchases and proceeds from sales of investments, other than short-term securities, were $343,738,491 and $270,340,328, respectively.
4 Distributions to Shareholders and Income Tax Information
The tax character of distributions declared for the years ended September 30, 2022 and September 30, 2021 was as follows:
| | Year Ended September 30, |
| | 2022 | 2021 |
| Ordinary income | $48,278,310 | $2,645,349 |
| Long-term capital gains | $ 8,659,939 | $ — |
During the year ended September 30, 2022, accumulated loss was increased by $3,396,714 and paid-in capital was increased by $3,396,714 due to the Fund's use of equalization accounting. Tax equalization accounting allows the Fund to treat as a distribution that portion of redemption proceeds representing a redeeming shareholder’s portion of undistributed taxable income and net capital gains. These reclassifications had no effect on the net assets or net asset value per share of the Fund.
As of September 30, 2022, the components of distributable earnings (accumulated loss) on a tax basis were as follows:
| Undistributed ordinary income | $ 9,504,888 |
| Undistributed long-term capital gains | 9,735,912 |
| Net unrealized depreciation | (129,578,153) |
| Accumulated loss | $(110,337,353) |
The cost and unrealized appreciation (depreciation) of investments of the Fund at September 30, 2022, as determined on a federal income tax basis, were as follows:
| Aggregate cost | $ 815,827,911 |
| Gross unrealized appreciation | $ 21,804,108 |
| Gross unrealized depreciation | (151,099,852) |
| Net unrealized depreciation | $(129,295,744) |
Calvert
International Equity Fund
September 30, 2022
Notes to Financial Statements — continued
5 Securities Lending
To generate additional income, the Fund may lend its securities pursuant to a securities lending agency agreement with State Street Bank and Trust Company (SSBT), the securities lending agent. Security loans are subject to termination by the Fund at any time and, therefore, are not considered illiquid investments. The Fund requires that the loan be continuously collateralized by either cash or securities in an amount at least equal to the market value of the securities on loan. The market value of securities loaned is determined daily and any additional required collateral is delivered to the Fund on the next business day. Cash collateral is generally invested in a money market fund registered under the 1940 Act that is managed by an affiliate of SSBT. Any gain or loss in the market price of the loaned securities that might occur and any interest earned or dividends declared during the term of the loan would accrue to the account of the Fund. Income earned on the investment of collateral, net of broker rebates and other expenses incurred by the securities lending agent, is split between the Fund and the securities lending agent based on agreed upon contractual terms. Non-cash collateral, if any, is held by the lending agent on behalf of the Fund and cannot be sold or re-pledged by the Fund; accordingly, such collateral is not reflected in the Statement of Assets and Liabilities.
The risks associated with lending portfolio securities include, but are not limited to, possible delays in receiving additional collateral or in the recovery of the loaned securities, possible loss of rights to the collateral should the borrower fail financially, as well as risk of loss in the value of the collateral or the value of the investments made with the collateral. The securities lending agent shall indemnify the Fund in the case of default of any securities borrower.
At September 30, 2022, the total value of securities on loan was $571,051 and the total value of collateral received was $697,308, comprised of U.S. government and/or agencies securities.
6 Line of Credit
The Fund participates with other portfolios and funds managed by EVM and its affiliates, including CRM, in an $800 million unsecured line of credit with a group of banks, which is in effect through October 25, 2022. Borrowings are made by the Fund solely for temporary purposes related to redemptions and other short-term cash needs. Interest is charged to the Fund based on its borrowings at an amount above either the Secured Overnight Financing Rate (SOFR) or Federal Funds rate. In addition, a fee computed at an annual rate of 0.15% on the daily unused portion of the line of credit is allocated among the participating portfolios and funds at the end of each quarter. In connection with the renewal of the agreement in October 2021, an arrangement fee of $150,000 was incurred that was allocated to the participating portfolios and funds. Because the line of credit is not available exclusively to the Fund, it may be unable to borrow some or all of its requested amounts at any particular time.
The Fund had no borrowings outstanding pursuant to its line of credit at September 30, 2022. The Fund did not have any significant borrowings or allocated fees during the year ended September 30, 2022. Effective October 25, 2022, the Fund renewed its line of credit agreement, which expires October 24, 2023. In connection with the renewal, the borrowing limit was decreased to $725 million.
7 Cash Advances
Pursuant to the custodian agreement, SSBT may, in its discretion, advance funds to the Fund in connection with the sale of certain securities, including certain foreign currency transactions, on a contractual settlement basis. Simultaneously with making a cash advance, the Fund grants to SSBT a security interest and a lien on any and all assets held by it for the account of the Fund. Cash advances are repayable on demand by SSBT. At September 30, 2022, the Fund owed SSBT $3,031,415 pursuant to the foregoing arrangement, which is included in other liabilities on the Statement of Assets and Liabilities. The Fund repaid the amount subsequent to year end. Based on the short-term nature of the agreement, the carrying value of other liabilities approximated its fair value at September 30, 2022. If measured at fair value, other liabilities would have been considered as Level 2 in the fair value hierarchy (see Note 1A) at September 30, 2022.
8 Affiliated Companies and Funds
The Fund has invested a portion of its assets in notes (the Notes) issued by Calvert Impact Capital, Inc. (CIC) pursuant to exemptive relief granted by the U.S. Securities and Exchange Commission (the SEC). There are certain potential points of affiliation between the Fund and CIC. CRM has licensed use of the Calvert name to CIC and provides other types of support. CRM’s President and Chief Executive Officer (and the only director/trustee on the Fund Board that is an “interested person” of the Fund) serves on the CIC Board. In addition, another director/trustee on the Fund Board serves as a director emeritus on the CIC Board.
Calvert
International Equity Fund
September 30, 2022
Notes to Financial Statements — continued
In addition to the Notes, the Fund may also invest in companies that are considered affiliated companies because the Fund has a direct or indirect ownership of, control of, or voting power of 5 percent or more of the outstanding voting shares of the company, or the company is under common ownership or control with the Fund. At September 30, 2022, the value of the Fund's investment in the Notes and affiliated companies and funds was $4,042,034, which represents 0.6% of the Fund's net assets. Transactions in the Notes and affiliated companies and funds by the Fund for the year ended September 30, 2022 were as follows:
| Name | Value,
beginning
of period | Purchases | Sales
proceeds | Net
realized
gain
(loss) | Change in
unrealized
appreciation
(depreciation) | Value,
end of
period | Interest/
Dividend
income | Principal amount/
Units/Shares,
end of period |
| High Social Impact Investments | | | | | | | | |
| Calvert Impact Capital, Inc., Community Investment Notes, 1.50%, 12/15/23(1) | $ 864,890 | $ — | $ — | $ — | $ (47,581) | $ 817,309 | $ 13,200 | $ 880,000 |
| Venture Capital Limited Partnership Interests | | | | | | | | |
| gNet Defta Development Holding LLC(1) | 231,604 | — | — | — | (37,453) | 194,151 | — | — |
| Short-Term Investments | | | | | | |
| Cash Reserves Fund | 5,635,556 | 162,356,889 | (167,993,533) | 1,652 | (564) | — | 2,004 | — |
| Liquidity Fund | — | 78,996,042 | (75,965,468) | — | — | 3,030,574 | 44,045 | 3,030,574 |
| Total | | | | $1,652 | $(85,598) | $4,042,034 | $59,249 | |
9 Capital Shares
The Corporation may issue its shares in one or more series (such as the Fund). The authorized shares of the Fund consist of 75,000,000 common shares, $0.01 par value, for each Class.
Transactions in capital shares for the years ended September 30, 2022 and September 30, 2021 were as follows:
| | Year Ended
September 30, 2022 | | Year Ended
September 30, 2021 |
| | Shares | Amount | | Shares | Amount |
| Class A | | | | | |
| Shares sold | 2,488,089 | $ 54,714,076 | | 1,643,681 | $ 39,373,904 |
| Reinvestment of distributions | 484,066 | 11,496,557 | | 12,947 | 297,262 |
| Shares redeemed | (2,365,692) | (48,568,376) | | (907,802) | (21,869,874) |
| Converted from Class C | 33,248 | 719,024 | | 50,240 | 1,153,540 |
| Net increase | 639,711 | $ 18,361,281 | | 799,066 | $ 18,954,832 |
| Class C | | | | | |
| Shares sold | 32,222 | $ 625,307 | | 111,587 | $ 2,286,086 |
| Reinvestment of distributions | 24,796 | 496,666 | | — | — |
| Shares redeemed | (68,537) | (1,284,351) | | (55,316) | (1,126,913) |
| Converted to Class A | (39,481) | (719,024) | | (58,945) | (1,153,540) |
| Net increase (decrease) | (51,000) | $ (881,402) | | (2,674) | $ 5,633 |
| Class I | | | | | |
| Shares sold | 10,950,827 | $ 251,290,611 | | 12,693,224 | $ 319,563,633 |
| Reinvestment of distributions | 1,290,290 | 32,889,495 | | 63,273 | 1,552,097 |
| Shares redeemed | (9,074,350) | (208,478,014) | | (6,021,538) | (156,919,455) |
| Net increase | 3,166,767 | $ 75,702,092 | | 6,734,959 | $ 164,196,275 |
Calvert
International Equity Fund
September 30, 2022
Notes to Financial Statements — continued
| | Year Ended
September 30, 2022 | | Year Ended
September 30, 2021 |
| | Shares | Amount | | Shares | Amount |
| Class R6 | | | | | |
| Shares sold | 2,502,819 | $ 61,012,052 | | 1,815,279 | $ 45,216,469 |
| Reinvestment of distributions | 365,740 | 9,304,424 | | 25,420 | 622,531 |
| Shares redeemed | (1,898,570) | (45,515,280) | | (1,477,180) | (37,186,283) |
| Net increase | 969,989 | $ 24,801,196 | | 363,519 | $ 8,652,717 |
10 Risks and Uncertainties
Risks Associated with Foreign Investments
Foreign investments can be adversely affected by political, economic and market developments abroad, including the imposition of economic and other sanctions by the United States or another country. There may be less publicly available information about foreign issuers because they may not be subject to reporting practices, requirements or regulations comparable to those to which United States companies are subject. Foreign markets may be smaller, less liquid and more volatile than the major markets in the United States. Trading in foreign markets typically involves higher expense than trading in the United States. The Fund may have difficulties enforcing its legal or contractual rights in a foreign country. Securities that trade or are denominated in currencies other than the U.S. dollar may be adversely affected by fluctuations in currency exchange rates.
Pandemic Risk
An outbreak of respiratory disease caused by a novel coronavirus was first detected in China in late 2019 and subsequently spread internationally. This coronavirus has resulted in closing borders, enhanced health screenings, changes to healthcare service preparation and delivery, quarantines, cancellations, disruptions to supply chains and customer activity, as well as general concern and uncertainty. Health crises caused by outbreaks of disease, such as the coronavirus outbreak, may exacerbate other pre-existing political, social and economic risks and disrupt normal market conditions and operations. The impact of this outbreak has negatively affected the worldwide economy, as well as the economies of individual countries and industries, and could continue to affect the market in significant and unforeseen ways. Other epidemics and pandemics that may arise in the future may have similar effects. Any such impact could adversely affect the Fund's performance, or the performance of the securities in which the Fund invests.
11 Capital Commitments
In connection with certain venture capital and/or limited partnership investments, the Fund is committed to future capital calls, which will increase the Fund’s investment in these securities. The aggregate amount of the future capital commitments totaled $17,500 at September 30, 2022. The Fund had sufficient cash and/or securities to cover these commitments.
The Fund's unfunded capital commitments by investment at September 30, 2022 were as follows:
| Name of Investment | Unfunded
Commitment |
| SEAF India International Growth Fund L.P. | $ 17,500 |
| Total | $17,500 |
Calvert
International Equity Fund
September 30, 2022
Report of Independent Registered Public Accounting Firm
To the Board of Directors of Calvert World Values Fund, Inc. and Shareholders of Calvert International Equity Fund:
Opinion on the Financial Statements and Financial Highlights
We have audited the accompanying statement of assets and liabilities of Calvert International Equity Fund (the "Fund") (one of the funds constituting Calvert World Values Fund, Inc.), including the schedule of investments, as of September 30, 2022, the related statement of operations for the year then ended, the statements of changes in net assets and the financial highlights for each of the two years in the period then ended, and the related notes. In our opinion, the financial statements and financial highlights present fairly, in all material respects, the financial position of the Fund as of September 30, 2022, and the results of its operations for the year then ended, the changes in its net assets and the financial highlights for each of the two years in the period then ended, in conformity with accounting principles generally accepted in the United States of America. The financial highlights for the years or periods ended September 30, 2020, 2019, and 2018 were audited by other auditors whose report, dated November 22, 2020, expressed an unqualified opinion on those financial highlights.
Basis for Opinion
These financial statements and financial highlights are the responsibility of the Fund's management. Our responsibility is to express an opinion on the Fund's financial statements and financial highlights based on our audits. We are a public accounting firm registered with the Public Company Accounting Oversight Board (United States) (PCAOB) and are required to be independent with respect to the Fund in accordance with the U.S. federal securities laws and the applicable rules and regulations of the Securities and Exchange Commission and the PCAOB.
We conducted our audits in accordance with the standards of the PCAOB. Those standards require that we plan and perform the audit to obtain reasonable assurance about whether the financial statements and financial highlights are free of material misstatement, whether due to error or fraud. The Fund is not required to have, nor were we engaged to perform, an audit of its internal control over financial reporting. As part of our audits, we are required to obtain an understanding of internal control over financial reporting but not for the purpose of expressing an opinion on the effectiveness of the Fund’s internal control over financial reporting. Accordingly, we express no such opinion.
Our audits included performing procedures to assess the risks of material misstatement of the financial statements and financial highlights, whether due to error or fraud, and performing procedures that respond to those risks. Such procedures included examining, on a test basis, evidence regarding the amounts and disclosures in the financial statements and financial highlights. Our audits also included evaluating the accounting principles used and significant estimates made by management, as well as evaluating the overall presentation of the financial statements and financial highlights. Our procedures included confirmation of securities owned as of September 30, 2022, by correspondence with the custodian and brokers; when replies were not received from brokers, we performed other auditing procedures. We believe that our audits provide a reasonable basis for our opinion.
/s/ Deloitte & Touche LLP
Boston, Massachusetts
November 22, 2022
We have served as the auditor of one or more Calvert investment companies since 2021.
Calvert
International Equity Fund
September 30, 2022
Federal Tax Information (Unaudited)
The Form 1099-DIV you receive in February 2023 will show the tax status of all distributions paid to your account in calendar year 2022. Shareholders are advised to consult their own tax adviser with respect to the tax consequences of their investment in the Fund. As required by the Internal Revenue Code and/or regulations, shareholders must be notified regarding the status of qualified dividend income for individuals, the foreign tax credit and capital gains dividends.
Qualified Dividend Income. For the fiscal year ended September 30, 2022, the Fund designates approximately $19,162,682, or up to the maximum amount of such dividends allowable pursuant to the Internal Revenue Code, as qualified dividend income eligible for the reduced tax rate of 15%.
Foreign Tax Credit. For the fiscal year ended September 30, 2022, the Fund paid foreign taxes of $2,103,399 and recognized foreign source income of $20,761,383.
Capital Gains Dividends. The Fund hereby designates as a capital gain dividend with respect to the taxable year ended September 30, 2022, $20,114,600 or, if subsequently determined to be different, the net capital gain of such year.
Calvert
International Equity Fund
September 30, 2022
Board of Directors' Contract Approval
Overview of the Contract Review Process
The Investment Company Act of 1940, as amended, provides, in substance, that each investment advisory agreement between a fund and its investment adviser will continue in effect from year to year only if its continuation is approved at least annually by the fund’s board of directors, including by a vote of a majority of the directors who are not “interested persons” of the fund (“Independent Directors”), cast in person at a meeting called for the purpose of considering such approval.
At a video conference meeting of the Boards of Trustees/Directors (each a “Board”) of the registered investment companies advised by Calvert Research and Management (“CRM” or the “Adviser”) (the “Calvert Funds”) held on June 14, 2022, the Board, including a majority of the Independent Directors, voted to approve continuation of existing investment advisory and investment sub-advisory agreements for the Calvert Funds for an additional one-year period. The meeting was held by video conference due to circumstances related to current or potential effects of COVID-19 pursuant to temporary exemptive relief issued by the Securities and Exchange Commission.
In evaluating the investment advisory and investment sub-advisory agreements for the Calvert Funds, the Board considered a variety of information relating to the Calvert Funds and various service providers, including the Adviser. The Independent Directors reviewed a report prepared by the Adviser regarding various services provided to the Calvert Funds by the Adviser and its affiliates. Such report included, among other data, information regarding the Adviser’s personnel and the Adviser’s revenue and cost of providing services to the Calvert Funds, and a separate report prepared by an independent data provider, which compared each fund’s investment performance, fees and expenses to those of comparable funds as identified by such independent data provider (“comparable funds”).
The Independent Directors were separately represented by independent legal counsel with respect to their consideration of the continuation of the investment advisory and investment sub-advisory agreements for the Calvert Funds. Prior to voting, the Independent Directors reviewed the proposed continuation of the Calvert Funds’ investment advisory and investment sub-advisory agreements with management and also met in private sessions with their counsel at which time no representatives of management were present.
The information that the Board considered included, among other things, the following (for funds that invest through one or more affiliated underlying fund(s), references to “each fund” in this section may include information that was considered at the underlying fund-level):
Information about Fees, Performance and Expenses
| • | A report from an independent data provider comparing the advisory and related fees paid by each fund with fees paid by comparable funds; |
| • | A report from an independent data provider comparing each fund’s total expense ratio and its components to comparable funds; |
| • | A report from an independent data provider comparing the investment performance of each fund to the investment performance of comparable funds over various time periods; |
| • | Data regarding investment performance in comparison to benchmark indices; |
| • | For each fund, comparative information concerning the fees charged and the services provided by the Adviser in managing other accounts (including mutual funds, other collective investment funds and institutional accounts) using investment strategies and techniques similar to those used in managing such fund; |
| • | Profitability analyses for the Adviser with respect to each fund; |
Information about Portfolio Management and Trading
| • | Descriptions of the investment management services provided to each fund, including investment strategies and processes it employs; |
| • | Information about the Adviser’s policies and practices with respect to trading, including the Adviser’s processes for monitoring best execution of portfolio transactions; |
| • | Information about the allocation of brokerage transactions and the benefits received by the Adviser as a result of brokerage allocation, including information concerning the acquisition of research through client commission arrangements and policies with respect to “soft dollars”; |
Information about the Adviser
| • | Reports detailing the financial results and condition of CRM; |
| • | Descriptions of the qualifications, education and experience of the individual investment professionals whose responsibilities include portfolio management and investment research for the funds, and information relating to their compensation and responsibilities with respect to managing other mutual funds and investment accounts; |
| • | Policies and procedures relating to proxy voting and the handling of corporate actions and class actions; |
| • | A description of CRM’s procedures for overseeing sub-advisers, including with respect to regulatory and compliance issues, investment management and other matters; |
Calvert
International Equity Fund
September 30, 2022
Board of Directors' Contract Approval
Other Relevant Information
| • | Information concerning the nature, cost and character of the administrative and other non-investment advisory services provided by CRM and its affiliates; and |
| • | The terms of each investment advisory agreement. |
Over the course of the year, the Board and its committees held regular quarterly meetings. During these meetings, the Directors participated in investment and performance reviews with the portfolio managers and other investment professionals of the Adviser relating to each fund, and considered various investment and trading strategies used in pursuing each fund’s investment objective(s), such as the use of derivative instruments, as well as risk management techniques. The Board and its committees also evaluated issues pertaining to industry and regulatory developments, compliance procedures, corporate governance and other issues with respect to the funds, and received and participated in reports and presentations provided by CRM and its affiliates with respect to such matters. In addition to the formal meetings of the Board and its committees, the Independent Directors held regular video conferences in between meetings to discuss, among other topics, matters relating to the continuation of the Calvert Funds’ investment advisory and investment sub-advisory agreements.
For funds that invest through one or more affiliated underlying funds, the Board considered similar information about the underlying fund(s) when considering the approval of investment advisory agreements. In addition, in cases where the Adviser has engaged a sub-adviser, the Board considered similar information about the sub-adviser when considering the approval of any investment sub-advisory agreement.
The Independent Directors were assisted throughout the contract review process by their independent legal counsel. The Independent Directors relied upon the advice of such counsel and their own business judgment in determining the material factors to be considered in evaluating each investment advisory and investment sub-advisory agreement and the weight to be given to each such factor. The Board, including the Independent Directors, did not identify any single factor as controlling, and each Director may have attributed different weight to various factors.
Results of the Contract Review Process
Based on its consideration of the foregoing, and such other information as it deemed relevant, including the factors and conclusions described below, the Board, including the Independent Directors, concluded that the continuation of the investment advisory agreement of Calvert International Equity Fund (the “Fund”), and the investment sub-advisory agreement with Eaton Vance Advisers International Ltd. (the “Sub-Adviser”), an affiliate of CRM, including the fees payable under each agreement, is in the best interests of the Fund’s shareholders. Accordingly, the Board, including a majority of the Independent Directors, voted to approve the continuation of the investment advisory agreement and the investment sub-advisory agreement of the Fund.
Nature, Extent and Quality of Services
In considering the nature, extent and quality of the services provided by the Adviser and Sub-Adviser under the investment advisory agreement and investment sub-advisory agreement, respectively, the Board reviewed information relating to the Adviser’s and Sub-Adviser’s operations and personnel, including, among other information, biographical information on the Sub-Adviser’s investment personnel and descriptions of the Adviser’s organizational and management structure. The Board also took into account similar information provided periodically throughout the previous year by the Adviser and Sub-Adviser as well as the Board’s familiarity with the Adviser and Sub-Adviser through Board meetings, discussions and other reports. With respect to the Adviser, the Board considered the Adviser’s responsibilities overseeing the Sub-Adviser and the business-related and other risks to which the Adviser or its affiliates may be subject in managing the Fund. With respect to the Sub-Adviser, the Board took into account the resources available to the Sub-Adviser in fulfilling its duties under the investment sub-advisory agreement and the Sub-Adviser’s experience in managing the Fund. The Board also noted that it reviewed on a quarterly basis information regarding the Adviser’s and Sub-Adviser’s compliance with applicable policies and procedures, including those related to personal investing. The Board took into account, among other items, periodic reports received from the Adviser over the past year concerning the Adviser’s ongoing review and enhancement of certain processes, policies and procedures of the Calvert Funds and the Adviser. The Board concluded that it was satisfied with the nature, extent and quality of services provided to the Fund by the Adviser and the Sub-Adviser under the investment advisory agreement and investment sub-advisory agreement, respectively.
Fund Performance
In considering the Fund’s performance, the Board noted that it reviewed on a quarterly basis detailed information about the Fund’s performance results, portfolio composition and investment strategies. The Board compared the Fund’s investment performance to that of the Fund’s peer universe and its benchmark index. The Board’s review included comparative performance data for the one-, three- and five-year periods ended December 31, 2021. This performance data indicated that the Fund had outperformed the median of the Fund’s peer universe for the one- and three-year periods ended December 31, 2021, while it had underperformed the median of its peer universe for the five-year period ended December 31, 2021. This performance data also indicated that the Fund had outperformed its benchmark index for the one-, three- and five-year periods ended December 31, 2021. Based upon its review, the Board concluded that the Fund’s performance was satisfactory relative to the performance of its peer universe and its benchmark index.
Management Fees and Expenses
In considering the Fund’s fees and expenses, the Board compared the Fund’s fees and total expense ratio with those of comparable funds in its expense group. Among other findings, the data indicated that the Fund’s advisory and administrative fees (after taking into account waivers and/or reimbursements) (referred to collectively as “management fees”) and the Fund’s total expenses (net of waivers and/or reimbursements) were each below the respective
Calvert
International Equity Fund
September 30, 2022
Board of Directors' Contract Approval — continued
median of the Fund’s expense group. The Board took into account the Adviser’s and Sub-Adviser’s current undertaking to maintain expense limitations for the Fund and that the Adviser and Sub-Adviser were waiving and/or reimbursing a portion of the Fund’s expenses. Based upon its review, the Board concluded that the management and sub-advisory fees were reasonable in view of the nature, extent and quality of services provided by the Adviser and Sub-Adviser, respectively.
Profitability and Other “Fall-Out” Benefits
The Board reviewed the Adviser’s profitability in regard to the Fund and the Calvert Funds in the aggregate. In reviewing the overall profitability of the Fund to the Adviser, the Board also considered the fact that the Adviser and its affiliates, including the Sub-Adviser, provided sub-advisory, sub-transfer agency support, administrative and distribution services to the Fund for which they received compensation. The information considered by the Board included the profitability of the Fund to the Adviser and its affiliates without regard to any marketing support or other payments by the Adviser and its affiliates to third parties in respect of distribution services. The Board also considered that the Adviser and its affiliates, including the Sub-Adviser, derived benefits to their reputation and other indirect benefits from their relationships with the Fund. Because the Adviser pays the Sub-Adviser’s sub-advisory fee out of its advisory fee, the profitability of the Fund to the Sub-Adviser was not a material factor in the Board’s deliberations concerning the continuation of the investment sub-advisory agreement. Based upon its review, the Board concluded that the level of profitability of the Adviser and its affiliates, including the Sub-Adviser, from their relationships with the Fund was reasonable.
Economies of Scale
The Board considered the effect of the Fund’s current size and its potential growth on its performance and fees. The Board also took into account the breakpoints in the advisory fee schedule for the Fund that would reduce the advisory fee rate on assets above specific asset levels. Because the Adviser pays the Sub-Adviser’s sub-advisory fee out of its advisory fee, the Board did not consider the potential economies of scale from the Sub-Adviser’s management of the Fund to be a material factor in the Board’s deliberations concerning the continuation of the investment sub-advisory agreement, although the Board noted that the sub-advisory fee schedule contained breakpoints. The Board noted that if the Fund’s assets increased over time, the Fund might realize other economies of scale if assets increased proportionally more than certain other expenses.
Calvert
International Equity Fund
September 30, 2022
Liquidity Risk Management Program
The Fund has implemented a written liquidity risk management program (Program) and related procedures to manage its liquidity in accordance with Rule 22e-4 under the Investment Company Act of 1940, as amended (Liquidity Rule). The Liquidity Rule defines “liquidity risk” as the risk that a fund could not meet requests to redeem shares issued by the fund without significant dilution of the remaining investors’ interests in the fund. The Fund’s Board of Trustees/Directors has designated the investment adviser to serve as the administrator of the Program and the related procedures. The administrator has established a Liquidity Risk Management Oversight Committee (Committee) to perform the functions necessary to administer the Program. As part of the Program, the administrator is responsible for identifying illiquid investments and categorizing the relative liquidity of the Fund’s investments in accordance with the Liquidity Rule. Under the Program, the administrator assesses, manages, and periodically reviews the Fund’s liquidity risk, and is responsible for making certain reports to the Fund’s Board of Trustees/Directors and the Securities and Exchange Commission (SEC) regarding the liquidity of the Fund’s investments, and to notify the Board of Trustees/Directors and the SEC of certain liquidity events specified in the Liquidity Rule. The liquidity of the Fund’s portfolio investments is determined based on a number of factors including, but not limited to, relevant market, trading and investment-specific considerations under the Program.
At a meeting of the Fund’s Board of Trustees/Directors on June 14, 2022, the Committee provided a written report to the Fund’s Board of Trustees/ Directors pertaining to the operation, adequacy, and effectiveness of implementation of the Program, as well as the operation of the highly liquid investment minimum (if applicable) for the period January 1, 2021 through December 31, 2021 (Review Period). The Program operated effectively during the Review Period, supporting the administrator’s ability to assess, manage and monitor Fund liquidity risk, including during periods of market volatility and net redemptions. During the Review Period, the Fund met redemption requests on a timely basis.
There can be no assurance that the Program will achieve its objectives in the future. Please refer to the Fund’s prospectus for more information regarding the Fund’s exposure to liquidity risk and other principal risks to which an investment in the Fund may be subject.
Calvert
International Equity Fund
September 30, 2022
Management and Organization
Fund Management. The Directors of Calvert World Values Fund, Inc. (the Corporation) are responsible for the overall management and supervision of the affairs of the Corporation. The Board members and officers of the Corporation are listed below. Except as indicated, each individual has held the office shown or other offices in the same company for the last five years. Board members hold indefinite terms of office. Each Board member holds office until his or her successor is elected and qualified, or until his or her earlier death, resignation, retirement, removal or disqualification. Under the terms of the Fund's current Board member retirement policy, an Independent Board member must retire at the end of the calendar year in which he or she turns 75. However, if such retirement would cause the Fund to be out of compliance with Section 16 of the 1940 Act or any other regulations or guidance of the SEC, then such retirement will not become effective until such time as action has been taken for the Fund to be in compliance therewith. The “noninterested Directors” consist of those Directors who are not “interested persons” of the Corporation, as that term is defined under the 1940 Act. The business address of each Board member and the Chief Compliance Officer is 1825 Connecticut Avenue NW, Suite 400, Washington, DC 20009 and the business address of the Secretary, Vice President and Chief Legal Officer and the Treasurer is Two International Place, Boston, Massachusetts 02110. As used below, “CRM” refers to Calvert Research and Management and “Eaton Vance” refers to Eaton Vance Management. Each Director oversees 42 funds in the Calvert fund complex. Effective March 1, 2021, each of Eaton Vance and CRM are indirect wholly-owned subsidiaries of Morgan Stanley. Each officer affiliated with CRM may hold a position with other CRM affiliates that is comparable to his or her position with CRM listed below.
| Name and Year of Birth | Corporation
Position(s) | Length of
Service | Principal Occupation(s) and Other Directorships
During Past Five Years and Other Relevant Experience |
| Interested Director |
John H. Streur(1)
1960 | Director and
President | Since 2015 | President and Chief Executive Officer of CRM (since December 31, 2016). President and Chief Executive Officer of Calvert Investments, Inc.
(January 2015 - December 2016); Chief Executive Officer of Calvert
Investment Distributors, Inc. (August 2015 - December 2016); Chief
Compliance Officer of Calvert Investment Management, Inc. (August 2015 -
April 2016); President and Director, Portfolio 21 Investments, Inc.
(through October 2014); President, Chief Executive Officer and
Director, Managers Investment Group LLC (through January 2012);
President and Director, The Managers Funds and Managers AMG
Funds (through January 2012).
Other Directorships. Portfolio 21 Investments, Inc. (asset management)
(through October 2014); Managers Investment Group LLC (asset management)
(through January 2012); The Managers Funds (asset management)
(through January 2012); Managers AMG Funds (asset management)
(through January 2012); Calvert Impact Capital, Inc. |
| Noninterested Directors |
Richard L. Baird, Jr.
1948 | Director | Since 2005 | Regional Disaster Recovery Lead, American Red Cross of Greater
Pennsylvania (since 2017). Volunteer, American Red Cross (since 2015).
Former President and CEO of Adagio Health Inc. (retired in 2014) in
Pittsburgh, PA.
Other Directorships. None. |
Alice Gresham Bullock
1950 | Chair and
Director | Since 2016 | Professor Emerita at Howard University School of Law. Dean Emerita of
Howard University School of Law and Deputy Director of the Association
of American Law Schools (1992-1994).
Other Directorships. None. |
Cari M. Dominguez
1949 | Director | Since 2016 | Former Chair of the U.S. Equal Employment Opportunity Commission.
Other Directorships. ManpowerGroup Inc. (workforce solutions company);
Triple S Management Corporation (managed care); National Association of Corporate Directors. |
John G. Guffey, Jr.
1948 | Director | Since 1992 | President of Aurora Press Inc., a privately held publisher of trade
paperbacks (since January 1997).
Other Directorships. Calvert Impact Capital, Inc. (through December 31, 2018); Calvert Ventures, LLC. |
Miles D. Harper, III
1962 | Director | Since 2005 | Partner, Carr Riggs & Ingram (public accounting firm) since October 2014.
Partner, Gainer Donnelly & Desroches (public accounting firm) (now Carr
Riggs & Ingram) (November 1999 - September 2014).
Other Directorships. Bridgeway Funds (9) (asset management). |
Joy V. Jones
1950 | Director | Since 2005 | Attorney.
Other Directorships. Palm Management Corporation. |
Calvert
International Equity Fund
September 30, 2022
Management and Organization — continued
| Name and Year of Birth | Corporation
Position(s) | Length of
Service | Principal Occupation(s) and Other Directorships
During Past Five Years and Other Relevant Experience |
| Noninterested Directors (continued) |
Anthony A. Williams
1951 | Director | Since 2016 | CEO and Executive Director of the Federal City Council (July 2012 to
present); Senior Adviser and Independent Consultant for King and
Spalding LLP (September 2015 to present); Executive Director of Global
Government Practice at the Corporate Executive Board (January 2010 to
January 2012).
Other Directorships. Freddie Mac; Evoq Properties/Meruelo Maddux
Properties, Inc. (real estate management); Weston Solutions, Inc.
(environmental services); Bipartisan Policy Center’s Debt Reduction Task Force;
Chesapeake Bay Foundation; Catholic University of America; Urban Institute (research organization); The Howard Hughes Corporation (real estate development); Old Dominion National Bank. |
| Name and Year of Birth | Corporation
Position(s) | Length of
Service | Principal Occupation(s)
During Past Five Years |
| Principal Officers who are not Directors |
Hope L. Brown
1973 | Chief
Compliance
Officer | Since 2014 | Chief Compliance Officer of 42 registered investment companies advised
by CRM (since 2014). Vice President and Chief Compliance Officer,
Wilmington Funds (2012-2014). |
Deidre E. Walsh
1971 | Secretary,
Vice President
and Chief
Legal Officer | Since 2021 | Vice President of CRM and officer of 42 registered investment companies
advised by CRM (since 2021). Also Vice President of Eaton Vance and
certain of its affiliates and officer of 136 registered investment companies
advised or administered by Eaton Vance. |
James F. Kirchner
1967 | Treasurer | Since 2016 | Vice President of CRM and officer of 42 registered investment companies
advised by CRM (since 2016). Also Vice President of Eaton Vance and
certain of its affiliates and officer of 136 registered investment companies
advised or administered by Eaton Vance. |
| | | | |
| (1) Mr. Streur is an interested person of the Fund because of his positions with the Fund’s adviser and certain affiliates. |
The SAI for the Fund includes additional information about the Directors and officers of the Fund and can be obtained without charge on Calvert’s website at www.calvert.com or by calling 1-800-368-2745.
| FACTS | WHAT DOES EATON VANCE DO WITH YOUR
PERSONAL INFORMATION? |
| Why? | Financial companies choose how they share your personal information. Federal law gives consumers the right to limit some but not all sharing. Federal law also requires us to tell you how we collect, share, and protect your personal information. Please read this notice carefully to understand what we do. |
| |
| What? | The types of personal information we collect and share depend on the product or service you have with us. This information can include:■ Social Security number and income
■
investment experience and risk tolerance
■
checking account number and wire transfer instructions |
| |
| How? | All financial companies need to share customers’ personal information to run their everyday business. In the section below, we list the reasons financial companies can share their customers’ personal information; the reasons Eaton Vance chooses to share; and whether you can limit this sharing. |
Reasons we can share your
personal information | Does Eaton Vance
share? | Can you limit
this sharing? |
| For our everyday business purposes — such as to process your transactions, maintain your account(s), respond to court orders and legal investigations, or report to credit bureaus | Yes | No |
| For our marketing purposes — to offer our products and services to you | Yes | No |
| For joint marketing with other financial companies | No | We don’t share |
| For our investment management affiliates’ everyday business purposes — information about your transactions, experiences, and creditworthiness | Yes | Yes |
| For our affiliates’ everyday business purposes — information about your transactions and experiences | Yes | No |
| For our affiliates’ everyday business purposes — information about your creditworthiness | No | We don’t share |
| For our investment management affiliates to market to you | Yes | Yes |
| For our affiliates to market to you | No | We don’t share |
| For nonaffiliates to market to you | No | We don’t share |
To limit our
sharing | Call toll-free 1-800-368-2745 or email: CRMPrivacy@calvert.comPlease note:If you are a new customer, we can begin sharing your information 30 days from the date we sent this notice. When you are no longer our customer, we continue to share your information as described in this notice. However, you can contact us at any time to limit our sharing. |
| Questions? | Call toll-free 1-800-368-2745 or email: CRMPrivacy@calvert.com |
| Privacy Notice — continued | April 2021 |
| Who we are |
| Who is providing this notice? | Eaton Vance Management, Eaton Vance Distributors, Inc., Eaton Vance Trust Company, Eaton Vance Management (International) Limited, Eaton Vance Advisers International Ltd., Eaton Vance Global Advisors Limited, Eaton Vance Management’s Real Estate Investment Group, Boston Management and Research, Calvert Research and Management, Eaton Vance and Calvert Fund Families and our investment advisory affiliates (“Eaton Vance”) (see Investment Management Affiliates definition below) |
| What we do |
How does Eaton Vance
protect my personal
information? | To protect your personal information from unauthorized access and use, we use security measures that comply with federal law. These measures include computer safeguards and secured files and buildings. We have policies governing the proper handling of customer information by personnel and requiring third parties that provide support to adhere to appropriate security standards with respect to such information. |
How does Eaton Vance
collect my personal
information? | We collect your personal information, for example, when you■ open an account or make deposits or withdrawals from your account
■
buy securities from us or make a wire transfer
■
give us your contact informationWe also collect your personal information from others, such as credit bureaus, affiliates, or other companies. |
| Why can’t I limit all sharing? | Federal law gives you the right to limit only■ sharing for affiliates’ everyday business purposes — information about your creditworthiness
■
affiliates from using your information to market to you
■
sharing for nonaffiliates to market to youState laws and individual companies may give you additional rights to limit sharing. See below for more on your rights under state law. |
| Definitions |
Investment Management
Affiliates | Eaton Vance Investment Management Affiliates include registered investment advisers, registered broker- dealers, and registered and unregistered funds. Investment Management Affiliates does not include entities associated with Morgan Stanley Wealth Management, such as Morgan Stanley Smith Barney LLC and Morgan Stanley & Co. |
| Affiliates | Companies related by common ownership or control. They can be financial and nonfinancial companies.■ Our affiliates include companies with a Morgan Stanley name and financial companies such as Morgan Stanley Smith Barney LLC and Morgan Stanley & Co. |
| Nonaffiliates | Companies not related by common ownership or control. They can be financial and nonfinancial companies.■ Eaton Vance does not share with nonaffiliates so they can market to you. |
| Joint marketing | A formal agreement between nonaffiliated financial companies that together market financial products or services to you.■ Eaton Vance doesn’t jointly market. |
| Other important information |
| Vermont: Except as permitted by law, we will not share personal information we collect about Vermont residents with Nonaffiliates unless you provide us with your written consent to share such information.California: Except as permitted by law, we will not share personal information we collect about California residents with Nonaffiliates and we will limit sharing such personal information with our Affiliates to comply with California privacy laws that apply to us. |
Delivery of Shareholder Documents. The Securities and Exchange Commission (SEC) permits funds to deliver only one copy of shareholder documents, including prospectuses, proxy statements and shareholder reports, to fund investors with multiple accounts at the same residential or post office box address. This practice is often called “householding” and it helps eliminate duplicate mailings to shareholders. Calvert funds, or your financial intermediary, may household the mailing of your documents indefinitely unless you instruct Calvert funds, or your financial intermediary, otherwise. If you would prefer that your Calvert fund documents not be householded, please contact Calvert funds at 1-800-368-2745, or contact your financial intermediary. Your instructions that householding not apply to delivery of your Calvert fund documents will typically be effective within 30 days of receipt by Calvert funds or your financial intermediary.
Portfolio Holdings. Each Calvert fund files a schedule of portfolio holdings on Part F to Form N-PORT with the SEC. Certain information filed on Form N-PORT may be viewed on the Calvert website at www.calvert.com, by calling Calvert at 1-800-368-2745 or in the EDGAR database on the SEC’s website at www.sec.gov.
Proxy Voting. The Proxy Voting Guidelines that each Calvert fund uses to determine how to vote proxies relating to portfolio securities is provided as an Appendix to the fund’s Statement of Additional Information. The Statement of Additional Information can be obtained free of charge by calling the Calvert funds at 1-800-368-2745, by visiting the Calvert funds’ website at www.calvert.com or visiting the SEC’s website at www.sec.gov. Information regarding how a Calvert fund voted proxies relating to portfolio securities during the most recent 12-month period ended June 30 is available by calling Calvert funds, by visiting the Calvert funds’ website at www.calvert.com or by visiting the SEC’s website at www.sec.gov.
This Page Intentionally Left Blank
This Page Intentionally Left Blank
This Page Intentionally Left Blank
Investment Adviser and Administrator
Calvert Research and Management
1825 Connecticut Avenue NW, Suite 400
Washington, DC 20009
Investment Sub-Adviser
Eaton Vance Advisers International Ltd.
125 Old Broad Street
London, EC2N 1AR
Principal Underwriter*
Eaton Vance Distributors, Inc.
Two International Place
Boston, MA 02110
(617) 482-8260
Custodian
State Street Bank and Trust Company
State Street Financial Center, One Lincoln Street
Boston, MA 02111
Transfer Agent
DST Asset Manager Solutions, Inc.
2000 Crown Colony Drive
Quincy, MA 02169
Independent Registered Public Accounting Firm
Deloitte & Touche LLP
200 Berkeley Street
Boston, MA 02116-5022
Fund Offices
1825 Connecticut Avenue NW, Suite 400
Washington, DC 20009
* FINRA BrokerCheck. Investors may check the background of their Investment Professional by contacting the Financial Industry Regulatory Authority (FINRA). FINRA BrokerCheck is a free tool to help investors check the professional background of current and former FINRA-registered securities firms and brokers. FINRA BrokerCheck is available by calling 1-800-289-9999 and at www.FINRA.org. The FINRA BrokerCheck brochure describing this program is available to investors at www.FINRA.org.
Printed on recycled paper.
24207 9.30.22
Calvert
International Opportunities Fund
Annual Report
September 30, 2022
Commodity Futures Trading Commission Registration. The Commodity Futures Trading Commission (“CFTC”) has adopted regulations that subject registered investment companies and advisers to regulation by the CFTC if a fund invests more than a prescribed level of its assets in certain CFTC-regulated instruments (including futures, certain options and swap agreements) or markets itself as providing investment exposure to such instruments. The adviser has claimed an exclusion from the definition of “commodity pool operator” under the Commodity Exchange Act with respect to its management of the Fund and the other funds it manages. Accordingly, neither the Fund nor the adviser is subject to CFTC regulation.
Fund shares are not insured by the FDIC and are not deposits or other obligations of, or guaranteed by, any depository institution. Shares are subject to investment risks, including possible loss of principal invested.
This report must be preceded or accompanied by a current summary prospectus or prospectus. Before investing, investors should consider carefully the investment objective, risks, and charges and expenses of a mutual fund. This and other important information is contained in the summary prospectus and prospectus, which can be obtained from a financial intermediary. Prospective investors should read the prospectus carefully before investing. For further information, please call 1-800-368-2745.
Choose Planet-friendly E-delivery!
Sign up now for on-line statements, prospectuses, and fund reports. In less than five minutes you can help reduce paper mail and lower fund costs.
Just go to www.calvert.com. If you already have an online account with the Calvert funds, click on Login to access your Account and select the documents you would like to receive via e-mail.
If you’re new to online account access, click on Login, then Register to create your user name and password. Once you’re in, click on the E-delivery sign-up on the Account Portfolio page and follow the quick, easy steps.
Note: If your shares are not held directly with the Calvert funds but through a brokerage firm, you must contact your broker for electronic delivery options available through their firm.
Annual Report September 30, 2022
Calvert
International Opportunities Fund
Calvert
International Opportunities Fund
September 30, 2022
Management's Discussion of Fund Performance†
Economic and Market Conditions
The 12-month period starting October 1, 2021, was dominated by the ongoing effects of one black swan event — the COVID-19 pandemic — and new fallout from another — Russia’s unprovoked invasion of Ukraine.
In the opening months of the period, stock investors as well as consumers appeared to be taking a “glass is half full” approach. Despite the appearance of a new and more contagious COVID-19 variant, the highest inflation readings in nearly four decades, and the U.S. Federal Reserve’s (the Fed’s) announcement that it would begin tapering bond purchases that had supported economic growth, major U.S. equity indexes repeatedly closed at new all-time highs during the final quarter of 2021.
In both the U.S. and Europe, consumers rushed to spend money saved during the early months of the pandemic. Mastercard, Inc. reported its highest retail sales on record during the 2021 holiday season. But as the new year began, investors appeared to reevaluate the twin threats of inflation and interest rate hikes, and stock performance turned negative around the globe. In February, Russia’s invasion of Ukraine sent shock waves through markets worldwide, exacerbating inflationary pressures on energy and food costs.
As the Fed’s outlook on inflation worsened from “transitory” to “persistent,” central banks around the world — including the Bank of England and the European Central Bank — initiated their first interest rate hikes in years. In Europe, looming energy shortages caused by Russia’s invasion of Ukraine pushed inflation rates higher and stock prices lower during the period.
Investors began to expect that the Fed would raise interest rates at every policy meeting in 2022 and, in turn, worried that aggressive rate hikes could tip the U.S. economy into recession. At its June, July, and September 2022 meetings, the Fed hiked the federal funds rate 0.75% each time — its first moves of that magnitude since 1994. Higher interest rates, inflation, and recessionary worries drove stock prices down, with rate-sensitive technology stocks — which had been star performers early in the pandemic — suffering some of the worst declines.
Meanwhile in the world’s second-largest economy, China’s zero-COVID policy and problems within its real estate sector severely restricted economic output. The MSCI Golden Dragon Index, a measure of Chinese large-cap and mid-cap stocks, was one of the worst-performing major indexes, declining 32.61% during the period.
Major equity indexes elsewhere also suffered significant losses. For the period as a whole, the MSCI ACWI Index, a broad measure of global equities, returned -20.66%; the S&P 500® Index, a broad measure of U.S. stocks, lost 15.47%; and the technology-laden Nasdaq Composite Index fell 26.25%. The MSCI EAFE Index of developed-market international equities returned -25.13%, while the MSCI Emerging Markets Index returned -28.11% during the period.
Fund Performance
For the 12-month period ended September 30, 2022, Calvert International Opportunities Fund (the Fund) returned -35.33% for Class A shares at net asset value (NAV), underperforming its benchmark, the MSCI EAFE Small/Mid Cap Index (the Index), which returned -31.41%.
Stock selections in the industrials, health care, and real estate sectors were leading detractors from returns relative to the Index during the period. Stock selections in Europe, the largest regional allocation within the Index, also weighed on relative performance. Selections in the consumer discretionary sector contributed to relative returns.
The Fund does not seek to outperform the Index by favoring or avoiding certain global regions or sectors. However, an underweight exposure to regions other than Europe and Japan detracted from relative returns. A lack of exposure to the energy sector and underweight exposures to the utilities and materials sectors also detracted from relative performance during the period.
Sdiptech AB (Sdiptech), a Swedish engineering services company that specializes in urban infrastructure, was among the largest detractors from Fund performance during the period. Sdiptech’s share price fell during much of the period as the outlook for the European economy weakened.
PolyPeptide Group AG (PolyPeptide), a Swiss manufacturer of peptides for the pharmaceutical and biotechnology industries, also detracted from relative performance. PolyPeptide’s share price declined after the company reported decreased profitability because of inflation and capital expenditures to accommodate growth.
RWS Holdings PLC (RWS) is a U.K. provider of translation and intellectual property services. RWS’ share price fell after the company announced it expected revenue growth to slow in 2022 because of changes in European patent law and reduced business from translations into and from Russian as a result of the war in Ukraine.
Kyoritsu Maintenance Co., Ltd. (Kyoritsu), a Japanese manager of student and employee dormitories and hotels, contributed to relative performance during the period. Kyoritsu reported first-quarter profits in August that exceeded investor expectations. In addition, the Japanese government relaxed entry requirements during the period, leading to increased travel and tourism.
See Endnotes and Additional Disclosures in this report.
Past performance is no guarantee of future results. Returns are historical and are calculated by determining the percentage change in net asset value (NAV) or offering price (as applicable) with all distributions reinvested. Furthermore, returns do not reflect the deduction of taxes that shareholders may have to pay on Fund distributions or upon the redemption of Fund shares. Investment return and principal value will fluctuate so that shares, when redeemed, may be worth more or less than their original cost. Performance for periods less than or equal to one year is cumulative. Performance is for the stated time period only; due to market volatility, current Fund performance may be lower or higher than the quoted return. For performance as of the most recent month-end, please refer to www.calvert.com.
Calvert
International Opportunities Fund
September 30, 2022
Management's Discussion of Fund Performance† — continued
Wise PLC (Wise), a U.K.-based financial technology company that provides online money transfers, also contributed to relative returns during the period. Wise announced strong revenue growth supported by rising interest income during the first six months of its fiscal year that began April 1.
Sakata Seed Corp. (Sakata) is a Japan-based provider of seeds for vegetables and ornamental plants. Sakata’s share price rose after it announced record profits for its 2022 fiscal year, which ended in May. Sakata said rising profits stemmed from growing sales attributed in part to international customers stockpiling seeds in preparation of possible supply disruptions arising from the Ukraine War and COVID-19.
See Endnotes and Additional Disclosures in this report.
Past performance is no guarantee of future results. Returns are historical and are calculated by determining the percentage change in net asset value (NAV) or offering price (as applicable) with all distributions reinvested. Furthermore, returns do not reflect the deduction of taxes that shareholders may have to pay on Fund distributions or upon the redemption of Fund shares. Investment return and principal value will fluctuate so that shares, when redeemed, may be worth more or less than their original cost. Performance for periods less than or equal to one year is cumulative. Performance is for the stated time period only; due to market volatility, current Fund performance may be lower or higher than the quoted return. For performance as of the most recent month-end, please refer to www.calvert.com.
Calvert
International Opportunities Fund
September 30, 2022
Performance
Portfolio Manager(s) Aidan M. Farrell of MSIM Fund Management (Ireland) Limited
| % Average Annual Total Returns1,2 | Class
Inception Date | Performance
Inception Date | One Year | Five Years | Ten Years |
| Class A at NAV | 05/31/2007 | 05/31/2007 | (35.33)% | (1.67)% | 4.68% |
| Class A with 5.25% Maximum Sales Charge | — | — | (38.73) | (2.73) | 4.12 |
| Class C at NAV | 07/31/2007 | 05/31/2007 | (35.84) | (2.41) | 4.00 |
| Class C with 1% Maximum Deferred Sales Charge | — | — | (36.44) | (2.41) | 4.00 |
| Class I at NAV | 05/31/2007 | 05/31/2007 | (35.18) | (1.42) | 5.05 |
| Class R6 at NAV | 02/01/2019 | 05/31/2007 | (35.11) | (1.37) | 5.07 |
|
| MSCI EAFE Small/Mid Cap Index | — | — | (31.41)% | (2.07)% | 4.59% |
| % Total Annual Operating Expense Ratios3 | Class A | Class C | Class I | Class R6 |
| | 1.31% | 2.06% | 1.06% | 0.98% |
Growth of $10,000
This graph shows the change in value of a hypothetical investment of $10,000 in Class A of the Fund for the period indicated. For comparison, the same investment is shown in the indicated index.
| Growth of Investment2 | Amount Invested | Period Beginning | At NAV | With Maximum Sales Charge |
| Class C | $10,000 | 09/30/2012 | $14,804 | N.A. |
| Class I, at minimum investment | $1,000,000 | 09/30/2012 | $1,636,726 | N.A. |
| Class R6, at minimum investment | $5,000,000 | 09/30/2012 | $8,203,306 | N.A. |
See Endnotes and Additional Disclosures in this report.
Past performance is no guarantee of future results. Returns are historical and are calculated by determining the percentage change in net asset value (NAV) or offering price (as applicable) with all distributions reinvested. Furthermore, returns do not reflect the deduction of taxes that shareholders may have to pay on Fund distributions or upon the redemption of Fund shares. Investment return and principal value will fluctuate so that shares, when redeemed, may be worth more or less than their original cost. Performance for periods less than or equal to one year is cumulative. Performance is for the stated time period only; due to market volatility, current Fund performance may be lower or higher than the quoted return. For performance as of the most recent month-end, please refer to www.calvert.com.
Calvert
International Opportunities Fund
September 30, 2022
| Sector Allocation (% of net assets)1 |
| Top 10 Holdings (% of net assets)1 | |
| iShares MSCI Hong Kong ETF | 2.1% |
| Kyoritsu Maintenance Co., Ltd. | 1.9 |
| Mitsubishi Research Institute, Inc. | 1.8 |
| Azelis Group NV | 1.7 |
| As One Corp. | 1.6 |
| Lion Corp. | 1.5 |
| Ashtead Group PLC | 1.5 |
| Tosei Corp. | 1.5 |
| Yamaha Corp. | 1.5 |
| carsales.com, Ltd. | 1.5 |
| Total | 16.6% |
Footnotes:
| 1 | Excludes cash and cash equivalents. |
Calvert
International Opportunities Fund
September 30, 2022
Endnotes and Additional Disclosures
| † | The views expressed in this report are those of the portfolio manager(s) and are current only through the date stated at the top of this page. These views are subject to change at any time based upon market or other conditions, and Calvert and the Fund(s) disclaim any responsibility to update such views. These views may not be relied upon as investment advice and, because investment decisions are based on many factors, may not be relied upon as an indication of trading intent on behalf of any Calvert fund. This commentary may contain statements that are not historical facts, referred to as “forward-looking statements.” The Fund’s actual future results may differ significantly from those stated in any forward-looking statement, depending on factors such as changes in securities or financial markets or general economic conditions, the volume of sales and purchases of Fund shares, the continuation of investment advisory, administrative and service contracts, and other risks discussed from time to time in the Fund’s filings with the Securities and Exchange Commission. |
| | |
| 1 | MSCI EAFE Small/Mid Cap Index is an unmanaged index of small & mid-capitalization equities in the developed markets, excluding the U.S. and Canada. MSCI indexes are net of foreign withholding taxes. Source: MSCI. MSCI data may not be reproduced or used for any other purpose. MSCI provides no warranties, has not prepared or approved this report, and has no liability hereunder. Unless otherwise stated, index returns do not reflect the effect of any applicable sales charges, commissions, expenses, taxes or leverage, as applicable. It is not possible to invest directly in an index. |
| 2 | Total Returns at NAV do not include applicable sales charges. If sales charges were deducted, the returns would be lower. Total Returns shown with maximum sales charge reflect the stated maximum sales charge. Unless otherwise stated, performance does not reflect the deduction of taxes on Fund distributions or redemptions of Fund shares.Performance prior to the inception date of a class may be linked to the performance of an older class of the Fund. This linked performance is adjusted for any applicable sales charge, but is not adjusted for class expense differences. If adjusted for such differences, the performance would be different. The performance of Class R6 is linked to Class I. Performance presented in the Financial Highlights included in the financial statements is not linked.Effective November 5, 2020, Class C shares automatically convert to Class A shares eight years after purchase. The average annual total returns listed for Class C reflect conversion to Class A shares after eight years. Prior to November 5, 2020, Class C shares automatically converted to Class A shares ten years after purchase. |
| | Calvert Research and Management became the investment adviser to the Fund on December 31, 2016. Performance reflected prior to such date is that of the Fund’s former investment adviser. |
| 3 | Source: Fund prospectus. The expense ratios for the current reporting period can be found in the Financial Highlights section of this report. Performance reflects expenses waived and/or reimbursed, if applicable. Without such waivers and/or reimbursements, performance would have been lower. |
| Fund profile subject to change due to active management. |
| | S&P 500® Index is an unmanaged index of large-cap stocks commonly used as a measure of U.S. stock market performance. S&P Dow Jones Indices are a product of S&P Dow Jones Indices LLC (“S&P DJI”) and have been licensed for use. S&P® and S&P 500® are registered trademarks of S&P DJI; Dow Jones® is a registered trademark of Dow Jones Trademark Holdings LLC (“Dow Jones”); S&P DJI, Dow Jones and their respective affiliates do not sponsor, endorse, sell or promote the Fund, will not have any liability with respect thereto and do not have any liability for any errors, omissions, or interruptions of the S&P Dow Jones Indices. Nasdaq Composite Index is a market capitalization-weighted index of all domestic and international securities listed on Nasdaq. Source: Nasdaq, Inc. The information is provided by Nasdaq (with its affiliates, are referred to as the “Corporations”) and Nasdaq’s third party licensors on an “as is” basis and the Corporations make no guarantees and bear no liability of any kind with respect to the information or the Fund. MSCI Golden Dragon Index is an unmanaged index of common stocks traded in China, Hong Kong and Taiwan. MSCI ACWI Index is an unmanaged free-float-adjusted, market-capitalization-weighted index designed to measure the equity market performance of developed and emerging markets. MSCI EAFE Index is an unmanaged index of equities in the developed markets, excluding the U.S. and Canada. MSCI Emerging Markets Index is an unmanaged index of emerging markets common stocks. |
Calvert
International Opportunities Fund
September 30, 2022
Example
As a Fund shareholder, you incur two types of costs: (1) transaction costs, including sales charges (loads) on purchases and redemption fees (if applicable); and (2) ongoing costs, including management fees; distribution and/or service fees; and other Fund expenses. This Example is intended to help you understand your ongoing costs (in dollars) of Fund investing and to compare these costs with the ongoing costs of investing in other mutual funds. The Example is based on an investment of $1,000 invested at the beginning of the period and held for the entire period (April 1, 2022 to September 30, 2022).
Actual Expenses
The first section of the table below provides information about actual account values and actual expenses. You may use the information in this section, together with the amount you invested, to estimate the expenses that you paid over the period. Simply divide your account value by $1,000 (for example, an $8,600 account value divided by $1,000 = 8.6), then multiply the result by the number in the first section under the heading entitled “Expenses Paid During Period” to estimate the expenses you paid on your account during this period.
Hypothetical Example for Comparison Purposes
The second section of the table below provides information about hypothetical account values and hypothetical expenses based on the actual Fund expense ratio and an assumed rate of return of 5% per year (before expenses), which is not the actual Fund return. The hypothetical account values and expenses may not be used to estimate the actual ending account balance or expenses you paid for the period. You may use this information to compare the ongoing costs of investing in the Fund and other funds. To do so, compare this 5% hypothetical example with the 5% hypothetical examples that appear in the shareholder reports of the other funds.
Please note that the expenses shown in the table are meant to highlight your ongoing costs only and do not reflect any transactional costs, such as sales charges (loads) or redemption fees (if applicable). Therefore, the second section of the table is useful in comparing ongoing costs only, and will not help you determine the relative total costs of owning different funds. In addition, if these transactional costs were included, your costs would be higher.
| | Beginning
Account Value
(4/1/22) | Ending
Account Value
(9/30/22) | Expenses Paid
During Period*
(4/1/22 – 9/30/22) | Annualized
Expense
Ratio |
| Actual | | | | |
| Class A | $1,000.00 | $ 743.80 | $ 5.86 | 1.34% |
| Class C | $1,000.00 | $ 740.60 | $ 9.12 | 2.09% |
| Class I | $1,000.00 | $ 744.50 | $ 4.72 | 1.08% |
| Class R6 | $1,000.00 | $ 744.90 | $ 4.37 | 1.00% |
| Hypothetical | | | | |
| (5% return per year before expenses) | | | | |
| Class A | $1,000.00 | $1,018.35 | $ 6.78 | 1.34% |
| Class C | $1,000.00 | $1,014.59 | $10.56 | 2.09% |
| Class I | $1,000.00 | $1,019.65 | $ 5.47 | 1.08% |
| Class R6 | $1,000.00 | $1,020.05 | $ 5.06 | 1.00% |
| * | Expenses are equal to the Fund's annualized expense ratio for the indicated Class, multiplied by the average account value over the period, multiplied by 183/365 (to reflect the one-half year period). The Example assumes that the $1,000 was invested at the net asset value per share determined at the close of business on March 31, 2022. |
Calvert
International Opportunities Fund
September 30, 2022
| Security | Shares | Value |
| Australia — 7.2% | |
| Bapcor, Ltd.(1) | | 873,738 | $ 3,410,952 |
| BlueScope Steel, Ltd. | | 116,107 | 1,127,589 |
| carsales.com, Ltd. | | 411,992 | 4,914,352 |
| Data#3, Ltd. | | 695,291 | 2,764,068 |
| Dexus | | 611,577 | 3,042,324 |
| Dicker Data, Ltd. | | 393,691 | 2,573,796 |
| EBOS Group, Ltd. | | 67,581 | 1,422,489 |
| Steadfast Group, Ltd. | | 1,042,088 | 3,098,602 |
| WiseTech Global, Ltd. | | 62,881 | 2,054,482 |
| | | | $ 24,408,654 |
| Austria — 1.6% | |
| ams-OSRAM AG(2) | | 298,129 | $ 1,855,765 |
| BAWAG Group AG(3) | | 86,476 | 3,717,454 |
| | | | $ 5,573,219 |
| Belgium — 2.4% | |
| Azelis Group NV(1) | | 262,029 | $ 5,828,692 |
| KBC Group NV | | 28,236 | 1,339,911 |
| VGP NV | | 10,915 | 1,041,087 |
| | | | $ 8,209,690 |
| Canada — 2.9% | |
| Agnico Eagle Mines, Ltd. | | 32,126 | $ 1,357,276 |
| ATS Automation Tooling Systems, Inc.(2) | | 170,660 | 4,504,480 |
| CAE, Inc.(2) | | 107,754 | 1,652,953 |
| TMX Group, Ltd. | | 24,963 | 2,296,159 |
| | | | $ 9,810,868 |
| France — 0.5% | |
| Rubis SCA | | 88,437 | $ 1,840,390 |
| | | | $ 1,840,390 |
| Germany — 1.1% | |
| Jenoptik AG | | 98,851 | $ 1,945,949 |
| LEG Immobilien SE | | 31,456 | 1,877,596 |
| | | | $ 3,823,545 |
| Ireland — 1.4% | |
| Irish Residential Properties REIT PLC(1) | | 1,941,487 | $ 2,178,793 |
| Kerry Group PLC, Class A | | 28,547 | 2,544,459 |
| | | | $ 4,723,252 |
| Israel — 0.5% | |
| Amot Investments, Ltd. | | 264,092 | $ 1,509,855 |
| | | | $ 1,509,855 |
| Security | Shares | Value |
| Italy — 5.3% | |
| Amplifon SpA(1) | | 113,122 | $ 2,947,313 |
| BFF Bank SpA(3) | | 450,986 | 2,995,434 |
| DiaSorin SpA(1) | | 27,684 | 3,089,329 |
| FinecoBank Banca Fineco SpA | | 246,702 | 3,046,890 |
| MARR SpA | | 243,777 | 2,292,741 |
| Moncler SpA | | 88,453 | 3,611,052 |
| | | | $ 17,982,759 |
| Japan — 30.0% | |
| As One Corp.(1) | | 132,865 | $ 5,487,308 |
| Asahi Intecc Co., Ltd.(1) | | 193,770 | 3,090,302 |
| Chiba Bank, Ltd. (The)(1) | | 679,812 | 3,681,409 |
| Cosmos Pharmaceutical Corp. | | 42,530 | 4,205,314 |
| Daiseki Co., Ltd. | | 77,948 | 2,389,526 |
| Dip Corp. | | 129,250 | 3,283,348 |
| Fukuoka Financial Group, Inc. | | 213,388 | 3,800,263 |
| Goldwin, Inc. | | 72,170 | 3,815,019 |
| JMDC, Inc. | | 59,415 | 1,945,456 |
| Kewpie Corp. | | 119,678 | 1,969,694 |
| Kose Corp. | | 37,821 | 3,899,509 |
| Kuraray Co., Ltd. | | 603,620 | 4,220,040 |
| Kyoritsu Maintenance Co., Ltd.(1) | | 155,308 | 6,416,962 |
| LaSalle Logiport REIT | | 2,925 | 3,272,285 |
| Lion Corp. | | 463,916 | 5,242,438 |
| Mitsubishi Research Institute, Inc. | | 199,685 | 6,152,201 |
| Mitsui Fudosan Logistics Park, Inc. | | 978 | 3,347,186 |
| Miura Co., Ltd. | | 239,371 | 4,876,958 |
| Nihon M&A Center Holdings, Inc. | | 411,480 | 4,706,158 |
| Nomura Co., Ltd. | | 336,654 | 2,100,470 |
| Sakata Seed Corp. | | 145,092 | 4,826,496 |
| Sanwa Holdings Corp. | | 571,030 | 4,904,389 |
| SUMCO Corp. | | 356,968 | 4,159,052 |
| Tosei Corp. | | 527,954 | 5,056,296 |
| Yamaha Corp. | | 141,202 | 5,017,523 |
| | | | $101,865,602 |
| Luxembourg — 0.2% | |
| APERAM S.A. | | 30,435 | $ 718,210 |
| | | | $ 718,210 |
| Netherlands — 4.7% | |
| Aalberts NV | | 102,278 | $ 3,335,594 |
| BE Semiconductor Industries NV | | 42,305 | 1,811,092 |
| Euronext NV(1)(3) | | 59,305 | 3,753,188 |
| IMCD NV(1) | | 37,796 | 4,481,150 |
| NN Group NV | | 62,324 | 2,424,025 |
| | | | $ 15,805,049 |
8
See Notes to Financial Statements.
Calvert
International Opportunities Fund
September 30, 2022
Schedule of Investments — continued
| Security | Shares | Value |
| New Zealand — 0.6% | |
| Fisher & Paykel Healthcare Corp., Ltd. | | 198,935 | $ 2,061,938 |
| | | | $ 2,061,938 |
| Norway — 2.2% | |
| Entra ASA(3) | | 290,599 | $ 2,713,719 |
| Norsk Hydro ASA | | 136,166 | 730,656 |
| SmartCraft ASA(1)(2) | | 2,006,132 | 2,815,515 |
| SpareBank 1 SR-Bank ASA | | 122,640 | 1,148,866 |
| | | | $ 7,408,756 |
| Portugal — 0.6% | |
| NOS SGPS S.A. | | 596,045 | $ 1,951,133 |
| | | | $ 1,951,133 |
| Singapore — 1.0% | |
| Daiwa House Logistics Trust(1) | | 8,016,185 | $ 3,340,750 |
| | | | $ 3,340,750 |
| Spain — 1.7% | |
| Acciona S.A. | | 18,330 | $ 3,221,606 |
| Inmobiliaria Colonial Socimi S.A.(1) | | 488,184 | 2,357,060 |
| | | | $ 5,578,666 |
| Sweden — 5.5% | |
| AddTech AB, Class B | | 209,401 | $ 2,750,828 |
| Autoliv, Inc. | | 46,816 | 3,119,350 |
| Boliden AB | | 42,058 | 1,299,421 |
| Bravida Holding AB(3) | | 420,840 | 3,443,716 |
| Indutrade AB | | 127,665 | 2,070,721 |
| Lagercrantz Group AB, Class B | | 298,357 | 2,611,797 |
| Sdiptech AB, Class B(2) | | 199,600 | 3,439,847 |
| | | | $ 18,735,680 |
| Switzerland — 2.7% | |
| Galenica AG(3) | | 37,426 | $ 2,710,188 |
| Logitech International S.A. | | 49,982 | 2,285,053 |
| PolyPeptide Group AG(3) | | 51,174 | 1,491,372 |
| Straumann Holding AG | | 30,729 | 2,810,479 |
| | | | $ 9,297,092 |
| United Kingdom — 21.3% | |
| Abcam PLC(2) | | 254,616 | $ 3,801,856 |
| Allfunds Group PLC | | 430,835 | 3,148,603 |
| Ashtead Group PLC | | 115,680 | 5,195,165 |
| Bellway PLC | | 72,229 | 1,360,560 |
| Capital & Counties Properties PLC | | 1,612,463 | 1,918,959 |
| Compass Group PLC | | 114,821 | 2,286,362 |
| Cranswick PLC | | 121,484 | 3,608,908 |
| Security | Shares | Value |
| United Kingdom (continued) | |
| Dechra Pharmaceuticals PLC | | 88,238 | $ 2,562,517 |
| Diploma PLC | | 188,228 | 4,836,591 |
| DiscoverIE Group PLC | | 637,606 | 4,570,055 |
| Dr. Martens PLC | | 889,043 | 2,178,276 |
| Games Workshop Group PLC | | 46,372 | 2,965,193 |
| Greggs PLC | | 126,896 | 2,397,075 |
| Halma PLC | | 102,549 | 2,306,569 |
| InterContinental Hotels Group PLC | | 73,769 | 3,552,852 |
| JTC PLC(1)(3) | | 431,663 | 3,287,396 |
| Judges Scientific PLC | | 37,113 | 3,033,778 |
| Nomad Foods, Ltd.(2) | | 105,093 | 1,492,321 |
| RWS Holdings PLC | | 1,169,536 | 4,156,636 |
| St. James's Place PLC | | 276,066 | 3,143,890 |
| Volution Group PLC | | 928,754 | 3,012,822 |
| Watches of Switzerland Group PLC(2)(3) | | 363,430 | 2,686,033 |
| Wise PLC, Class A(2) | | 661,136 | 4,825,206 |
| | | | $ 72,327,623 |
Total Common Stocks
(identified cost $386,721,287) | | | $316,972,731 |
| Exchange-Traded Funds — 4.6% |
| Security | Shares | Value |
| Equity Funds — 4.6% | |
| iShares MSCI Hong Kong ETF(1) | | 389,711 | $ 7,108,329 |
| iShares MSCI Singapore ETF(1) | | 247,266 | 4,230,721 |
| Vanguard MSCI Australian Small Companies Index ETF | | 117,168 | 4,376,543 |
Total Exchange-Traded Funds
(identified cost $18,857,850) | | | $ 15,715,593 |
| High Social Impact Investments — 0.2% |
| Security | Principal
Amount
(000's omitted) | Value |
| Calvert Impact Capital, Inc., Community Investment Notes, 1.50%, 12/15/23(4)(5) | $ | 560 | $ 520,106 |
Total High Social Impact Investments
(identified cost $560,000) | | | $ 520,106 |
9
See Notes to Financial Statements.
Calvert
International Opportunities Fund
September 30, 2022
Schedule of Investments — continued
| Short-Term Investments — 7.3% |
| Affiliated Fund — 2.3% |
| Security | Shares | Value |
| Morgan Stanley Institutional Liquidity Funds - Government Portfolio, Institutional Class, 2.80%(6) | | 7,647,564 | $ 7,647,564 |
Total Affiliated Fund
(identified cost $7,647,564) | | | $ 7,647,564 |
| Securities Lending Collateral — 5.0% |
| Security | Shares | Value |
| State Street Navigator Securities Lending Government Money Market Portfolio, 3.07%(7) | | 17,126,964 | $ 17,126,964 |
Total Securities Lending Collateral
(identified cost $17,126,964) | | | $ 17,126,964 |
Total Short-Term Investments
(identified cost $24,774,528) | | | $ 24,774,528 |
| | | |
Total Investments — 105.5%
(identified cost $430,913,665) | | $ 357,982,958 |
| Other Assets, Less Liabilities — (5.5)% | | $ (18,579,211) |
| Net Assets — 100.0% | | $ 339,403,747 |
| The percentage shown for each investment category in the Schedule of Investments is based on net assets. |
| (1) | All or a portion of this security was on loan at September 30, 2022. The aggregate market value of securities on loan at September 30, 2022 was $28,731,542. |
| (2) | Non-income producing security. |
| (3) | Security exempt from registration under Rule 144A of the Securities Act of 1933, as amended. These securities may be sold in certain transactions in reliance on an exemption from registration (normally to qualified institutional buyers). At September 30, 2022, the aggregate value of these securities is $26,798,500 or 7.9% of the Fund's net assets. |
| (4) | May be deemed to be an affiliated company (see Note 8). |
| (5) | Restricted security. Total market value of restricted securities amounts to $520,106, which represents 0.2% of the net assets of the Fund as of September 30, 2022. |
| (6) | May be deemed to be an affiliated investment company. The rate shown is the annualized seven-day yield as of September 30, 2022. |
| (7) | Represents investment of cash collateral received in connection with securities lending. |
At September 30, 2022, the concentration of the Fund’s investments in the various sectors, determined as a percentage of net assets, was as follows:
| Economic Sectors | % of Net Assets |
| Industrials | 22.2% |
| Consumer Discretionary | 12.6 |
| Financials | 12.0 |
| Information Technology | 11.2 |
| Health Care | 9.9 |
| Real Estate | 9.3 |
| Consumer Staples | 8.9 |
| Exchange-Traded Funds | 4.6 |
| Communication Services | 3.0 |
| Materials | 2.8 |
| Utilities | 1.5 |
| High Social Impact Investments | 0.2 |
| Total | 98.2% |
Restricted Securities
| Description | Acquisition Date | Cost |
| Calvert Impact Capital, Inc., Community Investment Notes, 1.50%, 12/15/23 | 12/14/20 | $560,000 |
10
See Notes to Financial Statements.
Calvert
International Opportunities Fund
September 30, 2022
Statement of Assets and Liabilities
| | September 30, 2022 |
| Assets | |
Investments in securities of unaffiliated issuers, at value (identified cost $422,706,101) - including
$28,731,542 of securities on loan | $ 349,815,288 |
| Investments in securities of affiliated issuers, at value (identified cost $8,207,564) | 8,167,670 |
| Cash denominated in foreign currency, at value (cost $616,180) | 614,132 |
| Receivable for investments sold | 1,300,221 |
| Receivable for capital shares sold | 1,319,955 |
| Dividends receivable | 741,865 |
| Dividends and interest receivable - affiliated | 17,597 |
| Securities lending income receivable | 27,371 |
| Tax reclaims receivable | 318,409 |
| Directors' deferred compensation plan | 159,552 |
| Total assets | $362,482,060 |
| Liabilities | |
| Due to custodian | $ 585,369 |
| Payable for investments purchased | 4,571,575 |
| Payable for capital shares redeemed | 215,910 |
| Deposits for securities loaned | 17,126,964 |
| Payable to affiliates: | |
| Investment advisory fee | 220,404 |
| Administrative fee | 35,382 |
| Distribution and service fees | 16,460 |
| Sub-transfer agency fee | 5,010 |
| Directors' deferred compensation plan | 159,552 |
| Other | 2,417 |
| Accrued expenses | 139,270 |
| Total liabilities | $ 23,078,313 |
| Net Assets | $339,403,747 |
| Sources of Net Assets | |
| Paid-in capital | $ 430,056,721 |
| Accumulated loss | (90,652,974) |
| Net Assets | $339,403,747 |
| Class A Shares | |
| Net Assets | $ 60,334,768 |
| Shares Outstanding | 4,450,481 |
Net Asset Value and Redemption Price Per Share
(net assets ÷ shares of beneficial interest outstanding) | $ 13.56 |
Maximum Offering Price Per Share
(100 ÷ 94.75 of net asset value per share) | $ 14.31 |
| Class C Shares | |
| Net Assets | $ 3,583,226 |
| Shares Outstanding | 272,827 |
Net Asset Value and Offering Price Per Share*
(net assets ÷ shares of beneficial interest outstanding) | $ 13.13 |
11
See Notes to Financial Statements.
Calvert
International Opportunities Fund
September 30, 2022
Statement of Assets and Liabilities — continued
| | September 30, 2022 |
| Class I Shares | |
| Net Assets | $ 189,082,199 |
| Shares Outstanding | 14,260,988 |
Net Asset Value, Offering Price and Redemption Price Per Share
(net assets ÷ shares of beneficial interest outstanding) | $ 13.26 |
| Class R6 Shares | |
| Net Assets | $ 86,403,554 |
| Shares Outstanding | 6,516,413 |
Net Asset Value, Offering Price and Redemption Price Per Share
(net assets ÷ shares of beneficial interest outstanding) | $ 13.26 |
| On sales of $50,000 or more, the offering price of Class A shares is reduced. |
| * | Redemption price per share is equal to the net asset value less any applicable contingent deferred sales charge. |
12
See Notes to Financial Statements.
Calvert
International Opportunities Fund
September 30, 2022
| | Year Ended |
| | September 30, 2022 |
| Investment Income | |
| Dividend income (net of foreign taxes withheld of $1,045,589) | $ 10,642,705 |
| Dividend income - affiliated issuers | 41,025 |
| Interest income | 916 |
| Interest income - affiliated issuers | 8,400 |
| Securities lending income, net | 138,964 |
| Total investment income | $ 10,832,010 |
| Expenses | |
| Investment advisory fee | $ 3,314,942 |
| Administrative fee | 530,391 |
| Distribution and service fees: | |
| Class A | 203,237 |
| Class C | 51,621 |
| Directors' fees and expenses | 18,787 |
| Custodian fees | 60,833 |
| Transfer agency fees and expenses | 381,290 |
| Accounting fees | 115,202 |
| Professional fees | 42,940 |
| Registration fees | 83,460 |
| Reports to shareholders | 46,429 |
| Miscellaneous | 47,671 |
| Total expenses | $ 4,896,803 |
| Waiver and/or reimbursement of expenses by affiliates | $ (3,779) |
| Net expenses | $ 4,893,024 |
| Net investment income | $ 5,938,986 |
| Realized and Unrealized Gain (Loss) | |
| Net realized gain (loss): | |
| Investment securities | $ (15,969,414) |
| Investment securities - affiliated issuers | 237 |
| Foreign currency transactions | (220,598) |
| Net realized loss | $ (16,189,775) |
| Change in unrealized appreciation (depreciation): | |
| Investment securities | $ (169,905,745) |
| Investment securities - affiliated issuers | (31,186) |
| Foreign currency | (58,402) |
| Net change in unrealized appreciation (depreciation) | $(169,995,333) |
| Net realized and unrealized loss | $(186,185,108) |
| Net decrease in net assets from operations | $(180,246,122) |
13
See Notes to Financial Statements.
Calvert
International Opportunities Fund
September 30, 2022
Statements of Changes in Net Assets
| | Year Ended September 30, |
| | 2022 | 2021 |
| Increase (Decrease) in Net Assets | | |
| From operations: | | |
| Net investment income | $ 5,938,986 | $ 2,644,080 |
| Net realized gain (loss) | (16,189,775) | 65,782,386 |
| Net change in unrealized appreciation (depreciation) | (169,995,333) | 31,295,662 |
| Net increase (decrease) in net assets from operations | $(180,246,122) | $ 99,722,128 |
| Distributions to shareholders: | | |
| Class A | $ (6,524,092) | $ (413,572) |
| Class C | (390,242) | — |
| Class I | (26,006,669) | (2,243,218) |
| Class R6 | (4,768,045) | (497,493) |
| Total distributions to shareholders | $ (37,689,048) | $ (3,154,283) |
| Capital share transactions: | | |
| Class A | $ 8,211,521 | $ 5,722,020 |
| Class C | (162,702) | (555,571) |
| Class I | (19,734,804) | 29,139,228 |
| Class R6 | 53,993,474 | 6,866,062 |
| Net increase in net assets from capital share transactions | $ 42,307,489 | $ 41,171,739 |
| Net increase (decrease) in net assets | $(175,627,681) | $137,739,584 |
| Net Assets | | |
| At beginning of year | $ 515,031,428 | $ 377,291,844 |
| At end of year | $ 339,403,747 | $515,031,428 |
14
See Notes to Financial Statements.
Calvert
International Opportunities Fund
September 30, 2022
| | Class A |
| | Year Ended September 30, |
| | 2022 | 2021 | 2020 | 2019 | 2018 |
| Net asset value — Beginning of year | $ 22.54 | $ 18.01 | $ 16.18 | $ 18.86 | $ 18.70 |
| Income (Loss) From Operations | | | | | |
| Net investment income(1) | $ 0.21 | $ 0.08 | $ 0.07 | $ 0.18 | $ 0.17 |
| Net realized and unrealized gain (loss) | (7.63) | 4.56 | 1.95 | (1.51) | 1.20 |
| Total income (loss) from operations | $ (7.42) | $ 4.64 | $ 2.02 | $ (1.33) | $ 1.37 |
| Less Distributions | | | | | |
| From net investment income | $ (0.27) | $ (0.11) | $ (0.19) | $ (0.23) | $ (0.24) |
| From net realized gain | (1.29) | — | — | (1.12) | (0.97) |
| Total distributions | $ (1.56) | $ (0.11) | $ (0.19) | $ (1.35) | $ (1.21) |
| Net asset value — End of year | $ 13.56 | $ 22.54 | $ 18.01 | $ 16.18 | $ 18.86 |
| Total Return(2) | (35.33)% | 25.83% | 12.57% | (6.77)% | 7.62% |
| Ratios/Supplemental Data | | | | | |
| Net assets, end of year (000’s omitted) | $60,335 | $92,236 | $68,940 | $64,070 | $65,994 |
| Ratios (as a percentage of average daily net assets):(3) | | | | | |
| Total expenses | 1.32% | 1.30% | 1.32% | 1.37% | 1.38% |
| Net expenses | 1.32% (4) | 1.30% | 1.32% | 1.35% | 1.38% |
| Net investment income | 1.14% | 0.36% | 0.42% | 1.15% | 0.91% |
| Portfolio Turnover | 48% | 54% | 62% | 60% | 60% |
| (1) | Computed using average shares outstanding. |
| (2) | Returns are historical and are calculated by determining the percentage change in net asset value with all distributions reinvested and do not reflect the effect of sales charges, if any. |
| (3) | Total expenses do not reflect amounts reimbursed and/or waived by the adviser and certain of its affiliates, if applicable. Net expenses are net of all reductions and represent the net expenses paid by the Fund. |
| (4) | Includes a reduction by the investment adviser of a portion of its advisory fee due to the Fund’s investment in the Liquidity Fund (equal to less than 0.005% of average daily net assets for the year ended September 30, 2022). |
15
See Notes to Financial Statements.
Calvert
International Opportunities Fund
September 30, 2022
Financial Highlights — continued
| | Class C |
| | Year Ended September 30, |
| | 2022 | 2021 | 2020 | 2019 | 2018 |
| Net asset value — Beginning of year | $ 21.87 | $ 17.51 | $ 15.74 | $ 18.37 | $ 18.29 |
| Income (Loss) From Operations | | | | | |
| Net investment income (loss)(1) | $ 0.07 | $ (0.08) | $ (0.06) | $ 0.06 | $ 0.03 |
| Net realized and unrealized gain (loss) | (7.42) | 4.44 | 1.90 | (1.47) | 1.18 |
| Total income (loss) from operations | $ (7.35) | $ 4.36 | $ 1.84 | $ (1.41) | $ 1.21 |
| Less Distributions | | | | | |
| From net investment income | $ (0.10) | $ — | $ (0.07) | $ (0.10) | $ (0.16) |
| From net realized gain | (1.29) | — | — | (1.12) | (0.97) |
| Total distributions | $ (1.39) | $ — | $ (0.07) | $ (1.22) | $ (1.13) |
| Net asset value — End of year | $ 13.13 | $21.87 | $17.51 | $15.74 | $18.37 |
| Total Return(2) | (35.84)% | 24.90% | 11.68% | (7.49)% | 6.92% |
| Ratios/Supplemental Data | | | | | |
| Net assets, end of year (000’s omitted) | $ 3,583 | $ 6,260 | $ 5,527 | $ 6,532 | $ 7,603 |
| Ratios (as a percentage of average daily net assets):(3) | | | | | |
| Total expenses | 2.07% | 2.05% | 2.08% | 2.12% | 2.13% |
| Net expenses | 2.07% (4) | 2.05% | 2.08% | 2.10% | 2.13% |
| Net investment income (loss) | 0.37% | (0.40)% | (0.37)% | 0.38% | 0.18% |
| Portfolio Turnover | 48% | 54% | 62% | 60% | 60% |
| (1) | Computed using average shares outstanding. |
| (2) | Returns are historical and are calculated by determining the percentage change in net asset value with all distributions reinvested and do not reflect the effect of sales charges, if any. |
| (3) | Total expenses do not reflect amounts reimbursed and/or waived by the adviser and certain of its affiliates, if applicable. Net expenses are net of all reductions and represent the net expenses paid by the Fund. |
| (4) | Includes a reduction by the investment adviser of a portion of its advisory fee due to the Fund’s investment in the Liquidity Fund (equal to less than 0.005% of average daily net assets for the year ended September 30, 2022). |
16
See Notes to Financial Statements.
Calvert
International Opportunities Fund
September 30, 2022
Financial Highlights — continued
| | Class I |
| | Year Ended September 30, |
| | 2022 | 2021 | 2020 | 2019 | 2018 |
| Net asset value — Beginning of year | $ 22.08 | $ 17.64 | $ 15.86 | $ 18.52 | $ 18.42 |
| Income (Loss) From Operations | | | | | |
| Net investment income(1) | $ 0.25 | $ 0.13 | $ 0.11 | $ 0.22 | $ 0.23 |
| Net realized and unrealized gain (loss) | (7.46) | 4.47 | 1.90 | (1.49) | 1.17 |
| Total income (loss) from operations | $ (7.21) | $ 4.60 | $ 2.01 | $ (1.27) | $ 1.40 |
| Less Distributions | | | | | |
| From net investment income | $ (0.32) | $ (0.16) | $ (0.23) | $ (0.27) | $ (0.33) |
| From net realized gain | (1.29) | — | — | (1.12) | (0.97) |
| Total distributions | $ (1.61) | $ (0.16) | $ (0.23) | $ (1.39) | $ (1.30) |
| Net asset value — End of year | $ 13.26 | $ 22.08 | $ 17.64 | $ 15.86 | $ 18.52 |
| Total Return(2) | (35.18)% | 26.17% | 12.77% | (6.50)% | 7.95% |
| Ratios/Supplemental Data | | | | | |
| Net assets, end of year (000’s omitted) | $189,082 | $348,044 | $254,350 | $222,546 | $230,748 |
| Ratios (as a percentage of average daily net assets):(3) | | | | | |
| Total expenses | 1.06% | 1.05% | 1.07% | 1.12% | 1.13% |
| Net expenses | 1.06% (4) | 1.05% | 1.07% | 1.10% | 1.13% |
| Net investment income | 1.37% | 0.62% | 0.67% | 1.41% | 1.23% |
| Portfolio Turnover | 48% | 54% | 62% | 60% | 60% |
| (1) | Computed using average shares outstanding. |
| (2) | Returns are historical and are calculated by determining the percentage change in net asset value with all distributions reinvested and do not reflect the effect of sales charges, if any. |
| (3) | Total expenses do not reflect amounts reimbursed and/or waived by the adviser and certain of its affiliates, if applicable. Net expenses are net of all reductions and represent the net expenses paid by the Fund. |
| (4) | Includes a reduction by the investment adviser of a portion of its advisory fee due to the Fund’s investment in the Liquidity Fund (equal to less than 0.005% of average daily net assets for the year ended September 30, 2022). |
17
See Notes to Financial Statements.
Calvert
International Opportunities Fund
September 30, 2022
Financial Highlights — continued
| | Class R6 |
| | Year Ended September 30, | Period Ended
September 30, |
| | 2022 | 2021 | 2020 | 2019 (1) |
| Net asset value — Beginning of period | $ 22.07 | $ 17.64 | $ 15.86 | $ 15.14 |
| Income (Loss) From Operations | | | | |
| Net investment income(2) | $ 0.27 | $ 0.14 | $ 0.12 | $ 0.16 |
| Net realized and unrealized gain (loss) | (7.45) | 4.46 | 1.91 | 0.56 |
| Total income (loss) from operations | $ (7.18) | $ 4.60 | $ 2.03 | $ 0.72 |
| Less Distributions | | | | |
| From net investment income | $ (0.34) | $ (0.17) | $ (0.25) | $ — |
| From net realized gain | (1.29) | — | — | — |
| Total distributions | $ (1.63) | $ (0.17) | $ (0.25) | $ — |
| Net asset value — End of period | $ 13.26 | $ 22.07 | $ 17.64 | $ 15.86 |
| Total Return(3) | (35.11)% | 26.21% | 12.87% | 4.76% (4) |
| Ratios/Supplemental Data | | | | |
| Net assets, end of period (000’s omitted) | $86,404 | $68,492 | $48,475 | $43,489 |
| Ratios (as a percentage of average daily net assets):(5) | | | | |
| Total expenses | 0.99% | 0.97% | 1.00% | 1.08% (6) |
| Net expenses | 0.99% (7) | 0.97% | 1.00% | 1.05% (6) |
| Net investment income | 1.56% | 0.69% | 0.74% | 1.53% (6) |
| Portfolio Turnover | 48% | 54% | 62% | 60% (8) |
| (1) | For the period from the commencement of operations, February 1, 2019, to September 30, 2019. |
| (2) | Computed using average shares outstanding. |
| (3) | Returns are historical and are calculated by determining the percentage change in net asset value with all distributions reinvested and do not reflect the effect of sales charges, if any. |
| (4) | Not annualized. |
| (5) | Total expenses do not reflect amounts reimbursed and/or waived by the adviser and certain of its affiliates, if applicable. Net expenses are net of all reductions and represent the net expenses paid by the Fund. |
| (6) | Annualized. |
| (7) | Includes a reduction by the investment adviser of a portion of its advisory fee due to the Fund’s investment in the Liquidity Fund (equal to less than 0.005% of average daily net assets for the year ended September 30, 2022). |
| (8) | For the year ended September 30, 2019. |
18
See Notes to Financial Statements.
Calvert
International Opportunities Fund
September 30, 2022
Notes to Financial Statements
1 Significant Accounting Policies
Calvert International Opportunities Fund (the Fund) is a diversified series of Calvert World Values Fund, Inc. (the Corporation). The Corporation is a Maryland corporation registered under the Investment Company Act of 1940, as amended (the 1940 Act), as an open-end management investment company. The investment objective of the Fund is to seek long-term capital appreciation. The Fund invests primarily in common and preferred stocks of non-U.S. small-cap to mid-cap companies.
The Fund offers four classes of shares. Class A shares are generally sold subject to a sales charge imposed at time of purchase. A contingent deferred sales charge of 1.00% (0.80% prior to April 29, 2022) may apply to certain redemptions of Class A shares for accounts for which no sales charge was paid, if redeemed within 12 months of purchase. Class C shares are sold without a front-end sales charge, and with certain exceptions, are charged a contingent deferred sales charge of 1% on shares redeemed within 12 months of purchase. Class C shares are only available for purchase through a financial intermediary. Effective November 5, 2020, Class C shares automatically convert to Class A shares eight years after their purchase as described in the Fund's prospectus. Class I and Class R6 shares are sold at net asset value, are not subject to a sales charge and are sold only to certain eligible investors. Each class represents a pro rata interest in the Fund, but votes separately on class-specific matters and is subject to different expenses.
The Fund applies the accounting and reporting guidance in the Financial Accounting Standards Board (FASB) Accounting Standards Codification Topic 946, Financial Services – Investment Companies (ASC 946). Subsequent events, if any, through the date that the financial statements were issued have been evaluated in the preparation of the financial statements.
A Investment Valuation— Net asset value per share is determined every business day as of the close of the regular session of the New York Stock Exchange (generally 4:00 p.m. Eastern time). The Fund uses independent pricing services approved by the Board of Directors (the Board) to value its investments wherever possible. Investments for which market quotations are not available or deemed not reliable are fair valued in good faith under the direction of the Board.
U.S. generally accepted accounting principles (U.S. GAAP) establishes a disclosure hierarchy that categorizes the inputs to valuation techniques used to value assets and liabilities at measurement date. These inputs are summarized in the three broad levels listed below:
Level 1 - quoted prices in active markets for identical securities
Level 2 - other significant observable inputs (including quoted prices for similar securities, interest rates, prepayment speeds, credit risk, etc.)
Level 3 - significant unobservable inputs (including the Fund’s own assumptions in determining the fair value of investments)
The inputs or methodologies used for valuing securities are not necessarily an indication of the risk associated with investing in those securities.
Valuation techniques used to value the Fund’s investments by major category are as follows:
Equity Securities. Equity securities (including warrants and rights) listed on a U.S. securities exchange generally are valued at the last sale or closing price as reported by an independent pricing service on the primary market or exchange on which they are traded and are categorized as Level 1 in the hierarchy. Equity securities listed on the NASDAQ National Market System are valued at the NASDAQ official closing price and are categorized as Level 1 in the hierarchy. Unlisted or listed securities for which closing sales prices or closing quotations are not available are valued at the mean between the latest available bid and ask prices and are categorized as Level 2 in the hierarchy. The daily valuation of exchange-traded foreign securities generally is determined as of the close of trading on the principal exchange on which such securities trade. Events occurring after the close of trading on foreign exchanges may result in adjustments to the valuation of foreign securities to more accurately reflect their fair value as of the close of regular trading on the New York Stock Exchange. When valuing foreign equity securities that meet certain criteria, the Fund's Board has approved the use of a fair value service that values such securities to reflect market trading that occurs after the close of the applicable foreign markets of comparable securities or other instruments that have a strong correlation to the fair-valued securities. Such securities are categorized as Level 2 in the hierarchy.
Debt Securities. Debt securities are generally valued based on valuations provided by third party pricing services, as derived from such services’ pricing models. Inputs to the models may include, but are not limited to, reported trades, executable bid and ask prices, broker/dealer quotations, prices or yields of securities with similar characteristics, interest rates, anticipated prepayments, benchmark curves or information pertaining to the issuer, as well as industry and economic events. Accordingly, debt securities are generally categorized as Level 2 in the hierarchy. Short-term debt securities with a remaining maturity at time of purchase of more than sixty days are valued based on valuations provided by a third party pricing service. Such securities are generally categorized as Level 2 in the hierarchy. Short-term debt securities of sufficient credit quality purchased with remaining maturities of sixty days or less for which a valuation from a third party pricing service is not readily available may be valued at amortized cost, which approximates fair value, and are categorized as Level 2 in the hierarchy.
Other Securities. Investments in management investment companies (including money market funds) that do not trade on an exchange are valued at the net asset value as of the close of each business day and are categorized as Level 1 in the hierarchy.
Fair Valuation. In connection with Rule 2a-5 of the 1940 Act, which became effective September 8, 2022, the Board has designated the Fund’s investment adviser as its valuation designee. Investments for which valuations or market quotations are not readily available or are deemed unreliable are valued by the investment adviser, as valuation designee, at fair value using methods that most fairly reflect the security’s “fair value”, which is the amount
Calvert
International Opportunities Fund
September 30, 2022
Notes to Financial Statements — continued
that the Fund might reasonably expect to receive for the security upon its current sale in the ordinary course. Each such determination is based on a consideration of relevant factors, which are likely to vary from one pricing context to another. These factors may include, but are not limited to, the type of security, the existence of any contractual restrictions on the security’s disposition, the price and extent of public trading in similar securities of the issuer or of comparable companies or entities, quotations or relevant information obtained from broker/dealers or other market participants, information obtained from the issuer, analysts, and/or the appropriate stock exchange (for exchange-traded securities), an analysis of the company’s or entity’s financial statements, and an evaluation of the forces that influence the issuer and the market(s) in which the security is purchased and sold.
The values assigned to fair value investments are based on available information and do not necessarily represent amounts that might ultimately be realized. Further, due to the inherent uncertainty of valuations of such investments, the fair values may differ significantly from the values that would have been used had an active market existed, and the differences could be material.
The following table summarizes the market value of the Fund's holdings as of September 30, 2022, based on the inputs used to value them:
| Asset Description | Level 1 | Level 2 | Level 3 | Total |
| Common Stocks: | | | | |
| Australia | $ — | $ 24,408,654 | $ — | $ 24,408,654 |
| Austria | — | 5,573,219 | — | 5,573,219 |
| Belgium | — | 8,209,690 | — | 8,209,690 |
| Canada | 9,810,868 | — | — | 9,810,868 |
| France | — | 1,840,390 | — | 1,840,390 |
| Germany | — | 3,823,545 | — | 3,823,545 |
| Ireland | — | 4,723,252 | — | 4,723,252 |
| Israel | — | 1,509,855 | — | 1,509,855 |
| Italy | — | 17,982,759 | — | 17,982,759 |
| Japan | — | 101,865,602 | — | 101,865,602 |
| Luxembourg | — | 718,210 | — | 718,210 |
| Netherlands | — | 15,805,049 | — | 15,805,049 |
| New Zealand | — | 2,061,938 | — | 2,061,938 |
| Norway | — | 7,408,756 | — | 7,408,756 |
| Portugal | — | 1,951,133 | — | 1,951,133 |
| Singapore | — | 3,340,750 | — | 3,340,750 |
| Spain | — | 5,578,666 | — | 5,578,666 |
| Sweden | 3,119,350 | 15,616,330 | — | 18,735,680 |
| Switzerland | — | 9,297,092 | — | 9,297,092 |
| United Kingdom | 1,492,321 | 70,835,302 | — | 72,327,623 |
| Total Common Stocks | $14,422,539 | $302,550,192 (1) | $ — | $316,972,731 |
| Exchange-Traded Funds | $ 11,339,050 | $ 4,376,543 | $ — | $ 15,715,593 |
| High Social Impact Investments | — | 520,106 | — | 520,106 |
| Short-Term Investments: | | | | |
| Affiliated Fund | 7,647,564 | — | — | 7,647,564 |
| Securities Lending Collateral | 17,126,964 | — | — | 17,126,964 |
| Total Investments | $50,536,117 | $307,446,841 | $ — | $357,982,958 |
| (1) | Includes foreign equity securities whose values were adjusted to reflect market trading of comparable securities or other correlated instruments that occurred after the close of trading in their applicable foreign markets. |
B Investment Transactions and Income— Investment transactions for financial statement purposes are accounted for on trade date. Realized gains and losses are recorded on an identified cost basis and may include proceeds from litigation. Dividend income is recorded on the ex-dividend date for dividends received in cash and/or securities or, in the case of dividends on certain foreign securities, as soon as the Fund is informed of the ex-dividend date. Non-cash dividends are recorded at the fair value of the securities received. Withholding taxes on foreign dividends, if any, have been provided for in accordance with the Fund's understanding of the applicable country’s tax rules and rates. Distributions received that represent a return of capital are recorded as a
Calvert
International Opportunities Fund
September 30, 2022
Notes to Financial Statements — continued
reduction of cost of investments. Distributions received that represent a capital gain are recorded as a realized gain. Interest income, which includes amortization of premium and accretion of discount on debt securities, is accrued as earned.
C Share Class Accounting— Realized and unrealized gains and losses and net investment income and losses, other than class-specific expenses, are allocated daily to each class of shares based upon the relative net assets of each class to the total net assets of the Fund. Expenses arising in connection with a specific class are charged directly to that class. Sub-accounting, recordkeeping and similar administrative fees payable to financial intermediaries, which are a component of transfer agency fees and expenses on the Statement of Operations, are not allocated to Class R6 shares.
D Foreign Currency Transactions— The Fund’s accounting records are maintained in U.S. dollars. For valuation of assets and liabilities on each date of net asset value determination, foreign denominations are converted into U.S. dollars using the current exchange rate. Security transactions, income and expenses are translated at the prevailing rate of exchange on the date of the event. Recognized gains or losses on investment transactions attributable to changes in foreign currency exchange rates are recorded for financial statement purposes as net realized gains and losses on investments. That portion of unrealized gains and losses on investments that results from fluctuations in foreign currency exchange rates is not separately disclosed.
E Restricted Securities— The Fund may invest in securities that are subject to legal or contractual restrictions on resale. Generally, these securities may only be sold publicly upon registration under the Securities Act of 1933 or in transactions exempt from such registration. Information regarding restricted securities (excluding Rule 144A securities) is included at the end of the Schedule of Investments.
F Distributions to Shareholders— Distributions to shareholders are recorded by the Fund on ex-dividend date. Distributions from net investment income and distributions from net realized capital gains, if any, are paid at least annually. Distributions are declared separately for each class of shares. Distributions are determined in accordance with income tax regulations, which may differ from U.S. GAAP; accordingly, periodic reclassifications are made within the Fund's capital accounts to reflect income and gains available for distribution under income tax regulations.
G Estimates— The preparation of financial statements in conformity with U.S. GAAP requires management to make estimates and assumptions that affect the reported amounts of assets and liabilities and disclosure of contingent assets and liabilities at the date of the financial statements and the reported amounts of increases and decreases in net assets from operations during the reporting period. Actual results could differ from those estimates.
H Indemnifications— The Corporation’s By-Laws provide for indemnification for Directors or officers of the Corporation and certain other parties, to the fullest extent permitted by Maryland law and the 1940 Act, provided certain conditions are met. Additionally, in the normal course of business, the Fund enters into agreements with service providers that may contain indemnification clauses. The Fund’s maximum exposure under these arrangements is unknown as this would involve future claims that may be made against the Fund that have not yet occurred.
I Federal Income Taxes— No provision for federal income or excise tax is required since the Fund intends to continue to qualify as a regulated investment company under the Internal Revenue Code and to distribute substantially all of its taxable earnings.
Management has analyzed the Fund's tax positions taken for all open federal income tax years and has concluded that no provision for federal income tax is required in the Fund's financial statements. A Fund's federal tax return is subject to examination by the Internal Revenue Service for a period of three years from the date of filing.
2 Related Party Transactions
The investment advisory fee is earned by Calvert Research and Management (CRM), an indirect, wholly-owned subsidiary of Morgan Stanley, as compensation for investment advisory services rendered to the Fund. The investment advisory fee is computed at the annual rate of 0.75% of the Fund’s average daily net assets and is payable monthly. For the year ended September 30, 2022, the investment advisory fee amounted to $3,314,942.
Pursuant to an investment sub-advisory agreement, CRM has delegated a portion of the investment management of the Fund to Eaton Vance Advisers International Ltd. (EVAIL), an affiliate of CRM and an indirect, wholly-owned subsidiary of Morgan Stanley. Effective October 1, 2021, EVAIL uses the portfolio management, research and other resources of its affiliate, MSIM Fund Management (Ireland) Limited (MSIM FMIL), in rendering investment advisory services to the Fund. MSIM FMIL has entered into a Memorandum of Understanding with EVAIL pursuant to which MSIM FMIL is considered a participating affiliate of the sub-adviser as that term is used in relief granted by the staff of the U.S. Securities and Exchange Commission allowing U.S. registered investment advisers to use portfolio management or research resources of unregistered advisory affiliates subject to the supervision of a U.S. registered adviser. CRM pays EVAIL a portion of its investment advisory fee for sub-advisory services provided to the Fund.
Effective April 26, 2022, the Fund may invest in a money market fund, the Institutional Class of the Morgan Stanley Institutional Liquidity Funds - Government Portfolio (the “Liquidity Fund”), an open-end management investment company managed by Morgan Stanley Investment Management Inc., a wholly-owned subsidiary of Morgan Stanley. The investment advisory fee paid by the Fund is reduced by an amount equal to its pro-rata share of the advisory and administration fees paid by the Fund due to its investment in the Liquidity Fund. For the year ended September 30, 2022, the investment advisory fee paid was reduced by $3,779 relating to the Fund’s investment in the Liquidity Fund. Prior to April 26, 2022, the Fund may have invested its cash in Calvert Cash Reserves Fund, LLC (Cash Reserves Fund), an affiliated investment company managed by CRM. CRM did not receive a fee for advisory services provided to Cash Reserves Fund.
Calvert
International Opportunities Fund
September 30, 2022
Notes to Financial Statements — continued
CRM and EVAIL have agreed to reimburse the Fund’s operating expenses to the extent that total annual operating expenses (relating to ordinary operating expenses only and excluding expenses such as brokerage commissions, acquired fund fees and expenses of unaffiliated funds, borrowing costs, taxes or litigation expenses) exceed 1.34%, 2.09%, 1.09% and 1.05% for Class A, Class C, Class I and Class R6, respectively, of such class’s average daily net assets. The expense reimbursement agreement may be changed or terminated after January 31, 2023. For the year ended September 30, 2022, no expenses were waived or reimbursed by CRM and EVAIL.
The administrative fee is earned by CRM as compensation for administrative services rendered to the Fund. The fee is computed at an annual rate of 0.12% of the Fund’s average daily net assets attributable to Class A, Class C, Class I and Class R6 and is payable monthly. For the year ended September 30, 2022, CRM was paid administrative fees of $530,391.
The Fund has in effect a distribution plan for Class A shares (Class A Plan) pursuant to Rule 12b-1 under the 1940 Act. Pursuant to the Class A Plan, the Fund pays Eaton Vance Distributors, Inc. (EVD), an affiliate of CRM and the Fund’s principal underwriter, a distribution and service fee of 0.25% per annum of its average daily net assets attributable to Class A shares for distribution services and facilities provided to the Fund by EVD, as well as for personal services and/or the maintenance of shareholder accounts. The Fund also has in effect a distribution plan for Class C shares (Class C Plan) pursuant to Rule 12b-1 under the 1940 Act. Pursuant to the Class C Plan, the Fund pays EVD amounts equal to 0.75% per annum of its average daily net assets attributable to Class C shares for providing ongoing distribution services and facilities to the Fund. In addition, pursuant to the Class C Plan, the Fund also makes payments of service fees to EVD, financial intermediaries and other persons in amounts equal to 0.25% per annum of its average daily net assets attributable to that class. Service fees paid or accrued are for personal services and/or the maintenance of shareholder accounts. Distribution and service fees paid or accrued for the year ended September 30, 2022 amounted to $203,237 and $51,621 for Class A shares and Class C shares, respectively.
The Fund was informed that EVD received $14,287 as its portion of the sales charge on sales of Class A shares for the year ended September 30, 2022. The Fund was also informed that EVD received $830 and $251 of contingent deferred sales charges paid by Class A and Class C shareholders, respectively, for the same period.
Eaton Vance Management (EVM), an affiliate of CRM, provides sub-transfer agency and related services to the Fund pursuant to a Sub-Transfer Agency Support Services Agreement. For the year ended September 30, 2022, sub-transfer agency fees and expenses incurred to EVM amounted to $26,740 and are included in transfer agency fees and expenses on the Statement of Operations.
Each Director of the Fund who is not an employee of CRM or its affiliates receives an annual fee of $214,000 ($154,000 prior to January 1, 2022), plus an annual Committee fee ranging from $8,500 to $16,500 depending on the Committee. The Board chair receives an additional $30,000 annual fee, Committee chairs receive an additional $6,000 annual fee and the special equities liaison receives an additional $2,500 annual fee. Eligible Directors may participate in a Deferred Compensation Plan (the Plan). Amounts deferred under the Plan are treated as though equal dollar amounts had been invested in shares of the Fund or other Calvert funds selected by the Directors. The Fund purchases shares of the funds selected equal to the dollar amounts deferred under the Plan, resulting in an asset equal to the deferred compensation liability. Obligations of the Plan are paid solely from the Fund's assets. Directors’ fees are allocated to each of the Calvert funds served. Salaries and fees of officers and Directors of the Fund who are employees of CRM or its affiliates are paid by CRM.
3 Investment Activity
During the year ended September 30, 2022, the cost of purchases and proceeds from sales of investments, other than short-term securities, were $224,271,586 and $207,332,656, respectively.
4 Distributions to Shareholders and Income Tax Information
The tax character of distributions declared for the years ended September 30, 2022 and September 30, 2021 was as follows:
| | Year Ended September 30, |
| | 2022 | 2021 |
| Ordinary income | $ 7,308,727 | $3,154,283 |
| Long-term capital gains | $30,380,321 | $ — |
During the year ended September 30, 2022, accumulated loss was increased by $1,297,679 and paid-in capital was increased by $1,297,679 due to the Fund's use of equalization accounting and differences between book and tax accounting, primarily for investments in passive foreign investment companies. Tax equalization accounting allows the Fund to treat as a distribution that portion of redemption proceeds representing a redeeming shareholder’s portion of undistributed taxable income and net capital gains. These reclassifications had no effect on the net assets or net asset value per share of the Fund.
Calvert
International Opportunities Fund
September 30, 2022
Notes to Financial Statements — continued
As of September 30, 2022, the components of distributable earnings (accumulated loss) on a tax basis were as follows:
| Undistributed ordinary income | $ 1,709,514 |
| Deferred capital losses | (9,230,593) |
| Net unrealized depreciation | (83,131,895) |
| Accumulated loss | $(90,652,974) |
At September 30, 2022, the Fund, for federal income tax purposes, had deferred capital losses of $9,230,593 which would reduce the Fund’s taxable income arising from future net realized gains on investment transactions, if any, to the extent permitted by the Internal Revenue Code, and thus would reduce the amount of distributions to shareholders, which would otherwise be necessary to relieve the Fund of any liability for federal income or excise tax. The deferred capital losses are treated as arising on the first day of the Fund’s next taxable year, can be carried forward for an unlimited period, and retain the same short-term or long-term character as when originally deferred. Of the deferred capital losses at September 30, 2022, $9,230,593 are short-term.
The cost and unrealized appreciation (depreciation) of investments of the Fund at September 30, 2022, as determined on a federal income tax basis, were as follows:
| Aggregate cost | $441,064,120 |
| Gross unrealized appreciation | $ 11,748,563 |
| Gross unrealized depreciation | (94,829,725) |
| Net unrealized depreciation | $ (83,081,162) |
5 Overdraft Advances
Pursuant to the custodian agreement, State Street Bank and Trust Company (SSBT) may, in its discretion, advance funds to the Fund to make properly authorized payments. When such payments result in an overdraft, the Fund is obligated to repay SSBT at the current rate of interest charged by SSBT for secured loans (currently, the Federal Funds rate plus 2%). This obligation is payable on demand to SSBT. SSBT has a lien on the Fund's assets to the extent of any overdraft. At September 30, 2022, the Fund had a payment due to SSBT pursuant to the foregoing arrangement of $585,369. Based on the short-term nature of these payments and the variable interest rate, the carrying value of the overdraft advances approximated its fair value at September 30, 2022. If measured at fair value, overdraft advances would have been considered as Level 2 in the fair value hierarchy (see Note 1A) at September 30, 2022. The Fund’s average overdraft advances during the year ended September 30, 2022 were not significant.
6 Securities Lending
To generate additional income, the Fund may lend its securities pursuant to a securities lending agency agreement with SSBT, the securities lending agent. Security loans are subject to termination by the Fund at any time and, therefore, are not considered illiquid investments. The Fund requires that the loan be continuously collateralized by either cash or securities in an amount at least equal to the market value of the securities on loan. The market value of securities loaned is determined daily and any additional required collateral is delivered to the Fund on the next business day. Cash collateral is generally invested in a money market fund registered under the 1940 Act that is managed by an affiliate of SSBT. Any gain or loss in the market price of the loaned securities that might occur and any interest earned or dividends declared during the term of the loan would accrue to the account of the Fund. Income earned on the investment of collateral, net of broker rebates and other expenses incurred by the securities lending agent, is split between the Fund and the securities lending agent based on agreed upon contractual terms. Non-cash collateral, if any, is held by the lending agent on behalf of the Fund and cannot be sold or re-pledged by the Fund; accordingly, such collateral is not reflected in the Statement of Assets and Liabilities.
The risks associated with lending portfolio securities include, but are not limited to, possible delays in receiving additional collateral or in the recovery of the loaned securities, possible loss of rights to the collateral should the borrower fail financially, as well as risk of loss in the value of the collateral or the value of the investments made with the collateral. The securities lending agent shall indemnify the Fund in the case of default of any securities borrower.
At September 30, 2022, the total value of securities on loan was $28,731,542 and the total value of collateral received was $30,064,840, comprised of cash of $17,126,964 and U.S. government and/or agencies securities of $12,937,876.
Calvert
International Opportunities Fund
September 30, 2022
Notes to Financial Statements — continued
The following table provides a breakdown of securities lending transactions accounted for as secured borrowings, the obligations by class of collateral pledged, and the remaining contractual maturity of those transactions as of September 30, 2022.
| | Remaining Contractual Maturity of the Transactions |
| | Overnight and
Continuous | <30 days | 30 to 90 days | >90 days | Total |
| Common Stocks | $ 10,905,714 | $ — | $ — | $ — | $ 10,905,714 |
| Exchange-Traded Funds | 6,221,250 | — | — | — | 6,221,250 |
| Total | $17,126,964 | $ — | $ — | $ — | $17,126,964 |
The carrying amount of the liability for deposits for securities loaned at September 30, 2022 approximated its fair value. If measured at fair value, such liability would have been considered as Level 2 in the fair value hierarchy (see Note 1A) at September 30, 2022.
7 Line of Credit
The Fund participates with other portfolios and funds managed by EVM and its affiliates, including CRM, in an $800 million unsecured line of credit with a group of banks, which is in effect through October 25, 2022. Borrowings are made by the Fund solely for temporary purposes related to redemptions and other short-term cash needs. Interest is charged to the Fund based on its borrowings at an amount above either the Secured Overnight Financing Rate (SOFR) or Federal Funds rate. In addition, a fee computed at an annual rate of 0.15% on the daily unused portion of the line of credit is allocated among the participating portfolios and funds at the end of each quarter. In connection with the renewal of the agreement in October 2021, an arrangement fee of $150,000 was incurred that was allocated to the participating portfolios and funds. Because the line of credit is not available exclusively to the Fund, it may be unable to borrow some or all of its requested amounts at any particular time.
The Fund had no borrowings outstanding pursuant to its line of credit at September 30, 2022. The Fund did not have any significant borrowings or allocated fees during the year ended September 30, 2022. Effective October 25, 2022, the Fund renewed its line of credit agreement, which expires October 24, 2023. In connection with the renewal, the borrowing limit was decreased to $725 million.
8 Affiliated Companies and Funds
The Fund has invested a portion of its assets in notes (the Notes) issued by Calvert Impact Capital, Inc. (CIC) pursuant to exemptive relief granted by the U.S. Securities and Exchange Commission (the SEC). There are certain potential points of affiliation between the Fund and CIC. CRM has licensed use of the Calvert name to CIC and provides other types of support. CRM’s President and Chief Executive Officer (and the only director/trustee on the Fund Board that is an “interested person” of the Fund) serves on the CIC Board. In addition, another director/trustee on the Fund Board serves as a director emeritus on the CIC Board.
At September 30, 2022, the value of the Fund’s investment in the Notes and affiliated funds was $8,167,670, which represents 2.5% of the Fund’s net assets. Transactions in the Notes and affiliated funds by the Fund for the year ended September 30, 2022 were as follows:
| Name | Value,
beginning
of period | Purchases | Sales
proceeds | Net
realized
gain
(loss) | Change in
unrealized
appreciation
(depreciation) | Value,
end of
period | Interest/
Dividend
income | Principal amount/
Shares/Units,
end of period |
| High Social Impact Investments | | | | | | | | |
| Calvert Impact Capital, Inc., Community Investment Notes, 1.50%, 12/15/23(1) | $ 550,385 | $ — | $ — | $ — | $ (30,279) | $ 520,106 | $ 8,400 | $ 560,000 |
| Short-Term Investments | | | | | | |
| Cash Reserves Fund | 9,284,016 | 60,210,762 | (69,494,108) | 237 | (907) | — | 2,809 | — |
| Liquidity Fund | — | 81,872,952 | (74,225,388) | — | — | 7,647,564 | 38,216 | 7,647,564 |
| Total | | | | $ 237 | $(31,186) | $8,167,670 | $49,425 | |
Calvert
International Opportunities Fund
September 30, 2022
Notes to Financial Statements — continued
9 Capital Shares
The Corporation may issue its shares in one or more series (such as the Fund). The authorized shares of the Fund consist of 75,000,000 common shares, $0.01 par value, for each Class.
Transactions in capital shares for the years ended September 30, 2022 and September 30, 2021 were as follows:
| | Year Ended
September 30, 2022 | | Year Ended
September 30, 2021 |
| | Shares | Amount | | Shares | Amount |
| Class A | | | | | |
| Shares sold | 782,516 | $ 14,591,092 | | 760,083 | $ 16,175,778 |
| Reinvestment of distributions | 304,379 | 6,349,351 | | 19,781 | 396,014 |
| Shares redeemed | (741,218) | (12,954,786) | | (541,451) | (11,369,638) |
| Converted from Class C | 12,106 | 225,864 | | 26,177 | 519,866 |
| Net increase | 357,783 | $ 8,211,521 | | 264,590 | $ 5,722,020 |
| Class C | | | | | |
| Shares sold | 28,158 | $ 489,572 | | 34,930 | $ 722,561 |
| Reinvestment of distributions | 16,712 | 339,750 | | — | — |
| Shares redeemed | (45,845) | (766,160) | | (37,361) | (758,266) |
| Converted to Class A | (12,472) | (225,864) | | (26,938) | (519,866) |
| Net decrease | (13,447) | $ (162,702) | | (29,369) | $ (555,571) |
| Class I | | | | | |
| Shares sold | 5,958,362 | $ 102,997,588 | | 5,018,088 | $103,872,491 |
| Reinvestment of distributions | 1,144,540 | 23,314,281 | | 101,329 | 1,984,025 |
| Shares redeemed | (8,606,572) | (146,046,673) | | (3,771,380) | (76,717,288) |
| Net increase (decrease) | (1,503,670) | $ (19,734,804) | | 1,348,037 | $ 29,139,228 |
| Class R6 | | | | | |
| Shares sold | 4,002,027 | $ 64,255,839 | | 564,906 | $ 11,061,998 |
| Reinvestment of distributions | 234,302 | 4,768,045 | | 25,434 | 497,493 |
| Shares redeemed | (822,820) | (15,030,410) | | (235,237) | (4,693,429) |
| Net increase | 3,413,509 | $ 53,993,474 | | 355,103 | $ 6,866,062 |
10 Risks and Uncertainties
Risks Associated with Foreign Investments
Foreign investments can be adversely affected by political, economic and market developments abroad, including the imposition of economic and other sanctions by the United States or another country. There may be less publicly available information about foreign issuers because they may not be subject to reporting practices, requirements or regulations comparable to those to which United States companies are subject. Foreign markets may be smaller, less liquid and more volatile than the major markets in the United States. Trading in foreign markets typically involves higher expense than trading in the United States. The Fund may have difficulties enforcing its legal or contractual rights in a foreign country. Securities that trade or are denominated in currencies other than the U.S. dollar may be adversely affected by fluctuations in currency exchange rates.
Pandemic Risk
An outbreak of respiratory disease caused by a novel coronavirus was first detected in China in late 2019 and subsequently spread internationally. This coronavirus has resulted in closing borders, enhanced health screenings, changes to healthcare service preparation and delivery, quarantines, cancellations, disruptions to supply chains and customer activity, as well as general concern and uncertainty. Health crises caused by outbreaks of disease, such as the coronavirus outbreak, may exacerbate other pre-existing political, social and economic risks and disrupt normal market conditions and operations. The
Calvert
International Opportunities Fund
September 30, 2022
Notes to Financial Statements — continued
impact of this outbreak has negatively affected the worldwide economy, as well as the economies of individual countries and industries, and could continue to affect the market in significant and unforeseen ways. Other epidemics and pandemics that may arise in the future may have similar effects. Any such impact could adversely affect the Fund's performance, or the performance of the securities in which the Fund invests.
Calvert
International Opportunities Fund
September 30, 2022
Report of Independent Registered Public Accounting Firm
To the Board of Directors of Calvert World Values Fund, Inc. and Shareholders of Calvert International Opportunities Fund:
Opinion on the Financial Statements and Financial Highlights
We have audited the accompanying statement of assets and liabilities of Calvert International Opportunities Fund (the "Fund") (one of the funds constituting Calvert World Values Fund, Inc.), including the schedule of investments, as of September 30, 2022, the related statement of operations for the year then ended, the statements of changes in net assets and the financial highlights for each of the two years in the period then ended, and the related notes. In our opinion, the financial statements and financial highlights present fairly, in all material respects, the financial position of the Fund as of September 30, 2022, and the results of its operations for the year then ended, and the changes in its net assets and the financial highlights for each of the two years in the period then ended, in conformity with accounting principles generally accepted in the United States of America. The financial highlights for the years or periods ended September 30, 2020, 2019, and 2018 were audited by other auditors whose report, dated November 20, 2020, expressed an unqualified opinion on those financial highlights.
Basis for Opinion
These financial statements and financial highlights are the responsibility of the Fund's management. Our responsibility is to express an opinion on the Fund's financial statements and financial highlights based on our audits. We are a public accounting firm registered with the Public Company Accounting Oversight Board (United States) (PCAOB) and are required to be independent with respect to the Fund in accordance with the U.S. federal securities laws and the applicable rules and regulations of the Securities and Exchange Commission and the PCAOB.
We conducted our audits in accordance with the standards of the PCAOB. Those standards require that we plan and perform the audit to obtain reasonable assurance about whether the financial statements and financial highlights are free of material misstatement, whether due to error or fraud. The Fund is not required to have, nor were we engaged to perform, an audit of its internal control over financial reporting. As part of our audits, we are required to obtain an understanding of internal control over financial reporting but not for the purpose of expressing an opinion on the effectiveness of the Fund’s internal control over financial reporting. Accordingly, we express no such opinion.
Our audits included performing procedures to assess the risks of material misstatement of the financial statements and financial highlights, whether due to error or fraud, and performing procedures that respond to those risks. Such procedures included examining, on a test basis, evidence regarding the amounts and disclosures in the financial statements and financial highlights. Our audits also included evaluating the accounting principles used and significant estimates made by management, as well as evaluating the overall presentation of the financial statements and financial highlights. Our procedures included confirmation of securities owned as of September 30, 2022, by correspondence with the custodian and brokers; when replies were not received from brokers, we performed other auditing procedures. We believe that our audits provide a reasonable basis for our opinion.
/s/ Deloitte & Touche LLP
Boston, Massachusetts
November 22, 2022
We have served as the auditor of one or more Calvert investment companies since 2021.
Calvert
International Opportunities Fund
September 30, 2022
Federal Tax Information (Unaudited)
The Form 1099-DIV you receive in February 2023 will show the tax status of all distributions paid to your account in calendar year 2022. Shareholders are advised to consult their own tax adviser with respect to the tax consequences of their investment in the Fund. As required by the Internal Revenue Code and/or regulations, shareholders must be notified regarding the status of qualified dividend income for individuals, the dividends received deduction for corporations and the foreign tax credit.
Qualified Dividend Income. For the fiscal year ended September 30, 2022, the Fund designates approximately $8,934,873, or up to the maximum amount of such dividends allowable pursuant to the Internal Revenue Code, as qualified dividend income eligible for the reduced tax rate of 15%.
Dividends Received Deduction. Corporate shareholders are generally entitled to take the dividends received deduction on the portion of the Fund's dividend distribution that qualifies under tax law. For the Fund's fiscal 2022 ordinary income dividends, 1.20% qualifies for the corporate dividends received deduction.
Foreign Tax Credit. For the fiscal year ended September 30, 2022, the Fund paid foreign taxes of $677,304 and recognized foreign source income of $11,368,801.
Calvert
International Opportunities Fund
September 30, 2022
Board of Directors' Contract Approval
Overview of the Contract Review Process
The Investment Company Act of 1940, as amended, provides, in substance, that each investment advisory agreement between a fund and its investment adviser will continue in effect from year to year only if its continuation is approved at least annually by the fund’s board of directors, including by a vote of a majority of the directors who are not “interested persons” of the fund (“Independent Directors”), cast in person at a meeting called for the purpose of considering such approval.
At a video conference meeting of the Boards of Trustees/Directors (each a “Board”) of the registered investment companies advised by Calvert Research and Management (“CRM” or the “Adviser”) (the “Calvert Funds”) held on June 14, 2022, the Board, including a majority of the Independent Directors, voted to approve continuation of existing investment advisory and investment sub-advisory agreements for the Calvert Funds for an additional one-year period. The meeting was held by video conference due to circumstances related to current or potential effects of COVID-19 pursuant to temporary exemptive relief issued by the Securities and Exchange Commission.
In evaluating the investment advisory and investment sub-advisory agreements for the Calvert Funds, the Board considered a variety of information relating to the Calvert Funds and various service providers, including the Adviser. The Independent Directors reviewed a report prepared by the Adviser regarding various services provided to the Calvert Funds by the Adviser and its affiliates. Such report included, among other data, information regarding the Adviser’s personnel and the Adviser’s revenue and cost of providing services to the Calvert Funds, and a separate report prepared by an independent data provider, which compared each fund’s investment performance, fees and expenses to those of comparable funds as identified by such independent data provider (“comparable funds”).
The Independent Directors were separately represented by independent legal counsel with respect to their consideration of the continuation of the investment advisory and investment sub-advisory agreements for the Calvert Funds. Prior to voting, the Independent Directors reviewed the proposed continuation of the Calvert Funds’ investment advisory and investment sub-advisory agreements with management and also met in private sessions with their counsel at which time no representatives of management were present.
The information that the Board considered included, among other things, the following (for funds that invest through one or more affiliated underlying fund(s), references to “each fund” in this section may include information that was considered at the underlying fund-level):
Information about Fees, Performance and Expenses
| • | A report from an independent data provider comparing the advisory and related fees paid by each fund with fees paid by comparable funds; |
| • | A report from an independent data provider comparing each fund’s total expense ratio and its components to comparable funds; |
| • | A report from an independent data provider comparing the investment performance of each fund to the investment performance of comparable funds over various time periods; |
| • | Data regarding investment performance in comparison to benchmark indices; |
| • | For each fund, comparative information concerning the fees charged and the services provided by the Adviser in managing other accounts (including mutual funds, other collective investment funds and institutional accounts) using investment strategies and techniques similar to those used in managing such fund; |
| • | Profitability analyses for the Adviser with respect to each fund; |
Information about Portfolio Management and Trading
| • | Descriptions of the investment management services provided to each fund, including investment strategies and processes it employs; |
| • | Information about the Adviser’s policies and practices with respect to trading, including the Adviser’s processes for monitoring best execution of portfolio transactions; |
| • | Information about the allocation of brokerage transactions and the benefits received by the Adviser as a result of brokerage allocation, including information concerning the acquisition of research through client commission arrangements and policies with respect to “soft dollars”; |
Information about the Adviser
| • | Reports detailing the financial results and condition of CRM; |
| • | Descriptions of the qualifications, education and experience of the individual investment professionals whose responsibilities include portfolio management and investment research for the funds, and information relating to their compensation and responsibilities with respect to managing other mutual funds and investment accounts; |
| • | Policies and procedures relating to proxy voting and the handling of corporate actions and class actions; |
| • | A description of CRM’s procedures for overseeing sub-advisers, including with respect to regulatory and compliance issues, investment management and other matters; |
Calvert
International Opportunities Fund
September 30, 2022
Board of Directors' Contract Approval — continued
Other Relevant Information
| • | Information concerning the nature, cost and character of the administrative and other non-investment advisory services provided by CRM and its affiliates; and |
| • | The terms of each investment advisory agreement. |
Over the course of the year, the Board and its committees held regular quarterly meetings. During these meetings, the Directors participated in investment and performance reviews with the portfolio managers and other investment professionals of the Adviser relating to each fund, and considered various investment and trading strategies used in pursuing each fund’s investment objective(s), such as the use of derivative instruments, as well as risk management techniques. The Board and its committees also evaluated issues pertaining to industry and regulatory developments, compliance procedures, corporate governance and other issues with respect to the funds, and received and participated in reports and presentations provided by CRM and its affiliates with respect to such matters. In addition to the formal meetings of the Board and its committees, the Independent Directors held regular video conferences in between meetings to discuss, among other topics, matters relating to the continuation of the Calvert Funds’ investment advisory and investment sub-advisory agreements.
For funds that invest through one or more affiliated underlying funds, the Board considered similar information about the underlying fund(s) when considering the approval of investment advisory agreements. In addition, in cases where the Adviser has engaged a sub-adviser, the Board considered similar information about the sub-adviser when considering the approval of any investment sub-advisory agreement.
The Independent Directors were assisted throughout the contract review process by their independent legal counsel. The Independent Directors relied upon the advice of such counsel and their own business judgment in determining the material factors to be considered in evaluating each investment advisory and investment sub-advisory agreement and the weight to be given to each such factor. The Board, including the Independent Directors, did not identify any single factor as controlling, and each Director may have attributed different weight to various factors.
Results of the Contract Review Process
Based on its consideration of the foregoing, and such other information as it deemed relevant, including the factors and conclusions described below, the Board, including the Independent Directors, concluded that the continuation of the investment advisory agreement of Calvert International Opportunities Fund (the “Fund”), and the investment sub-advisory agreement with Eaton Vance Advisers International Ltd. (the “Sub-Adviser”), an affiliate of CRM, including the fees payable under each agreement, is in the best interests of the Fund’s shareholders. Accordingly, the Board, including a majority of the Independent Directors, voted to approve the continuation of the investment advisory agreement and the investment sub-advisory agreement of the Fund.
Nature, Extent and Quality of Services
In considering the nature, extent and quality of the services provided by the Adviser and Sub-Adviser under the investment advisory agreement and investment sub-advisory agreement, respectively, the Board reviewed information relating to the Adviser’s and Sub-Adviser’s operations and personnel, including, among other information, biographical information on the Sub-Adviser’s investment personnel and descriptions of the Adviser’s organizational and management structure. The Board also took into account similar information provided periodically throughout the previous year by the Adviser and Sub-Adviser as well as the Board’s familiarity with the Adviser and Sub-Adviser through Board meetings, discussions and other reports. With respect to the Adviser, the Board considered the Adviser’s responsibilities overseeing the Sub-Adviser and the business-related and other risks to which the Adviser or its affiliates may be subject in managing the Fund. With respect to the Sub-Adviser, the Board took into account the resources available to the Sub-Adviser in fulfilling its duties under the investment sub-advisory agreement and the Sub-Adviser’s experience in managing the Fund. The Board also noted that it reviewed on a quarterly basis information regarding the Adviser’s and Sub-Adviser’s compliance with applicable policies and procedures, including those related to personal investing. The Board took into account, among other items, periodic reports received from the Adviser over the past year concerning the Adviser’s ongoing review and enhancement of certain processes, policies and procedures of the Calvert Funds and the Adviser. The Board concluded that it was satisfied with the nature, extent and quality of services provided to the Fund by the Adviser and the Sub-Adviser under the investment advisory agreement and investment sub-advisory agreement, respectively.
Fund Performance
In considering the Fund’s performance, the Board noted that it reviewed on a quarterly basis detailed information about the Fund’s performance results, portfolio composition and investment strategies. The Board compared the Fund’s investment performance to that of the Fund’s peer universe and its benchmark index. The Board’s review included comparative performance data for the one-, three- and five-year periods ended December 31, 2021. This performance data indicated that the Fund had outperformed the median of its peer universe for the one-year period ended December 31, 2021, while it had underperformed the median of its peer universe for the three- and five-year periods ended December 31, 2021. This data also indicated that the Fund had outperformed its benchmark index for the one-, three- and five-year periods ended December 31, 2021. Based upon its review, the Board concluded that the Fund’s performance was satisfactory relative to the performance of its peer universe and its benchmark index.
Calvert
International Opportunities Fund
September 30, 2022
Board of Directors' Contract Approval — continued
Management Fees and Expenses
In considering the Fund’s fees and expenses, the Board compared the Fund’s fees and total expense ratio with those of comparable funds in its expense group. Among other findings, the data indicated that the Fund’s advisory and administrative fees (referred to collectively as “management fees”) were above the median of the Fund’s expense group and the Fund’s total expenses were below the median of the Fund’s expense group. The Board took into account the Adviser’s and Sub-Adviser’s current undertaking to maintain expense limitations for the Fund. Based upon its review, the Board concluded that the management and sub-advisory fees were reasonable in view of the nature, extent and quality of services provided by the Adviser and Sub-Adviser, respectively.
Profitability and Other “Fall-Out” Benefits
The Board reviewed the Adviser’s profitability in regard to the Fund and the Calvert Funds in the aggregate. In reviewing the overall profitability of the Fund to the Adviser, the Board also considered the fact that the Adviser and its affiliates, including the Sub-Adviser, provided sub-advisory, sub-transfer agency support, administrative and distribution services to the Fund for which they received compensation. The information considered by the Board included the profitability of the Fund to the Adviser and its affiliates without regard to any marketing support or other payments by the Adviser and its affiliates to third parties in respect of distribution services. The Board also considered that the Adviser and its affiliates, including the Sub-Adviser, derived benefits to their reputation and other indirect benefits from their relationships with the Fund. Because the Adviser pays the Sub-Adviser’s sub-advisory fee out of its advisory fee, the profitability of the Fund to the Sub-Adviser was not a material factor in the Board’s deliberations concerning the continuation of the investment sub-advisory agreement. Based upon its review, the Board concluded that the level of profitability of the Adviser and its affiliates, including the Sub-Adviser, from their relationships with the Fund was reasonable.
Economies of Scale
The Board considered the effect of the Fund’s current size and its potential growth on its performance and fees. The Board concluded that adding breakpoints to the advisory fee at specific asset levels would not be appropriate at this time. Because the Adviser pays the Sub-Adviser’s sub-advisory fee out of its advisory fee, the Board did not consider the potential economies of scale from the Sub-Adviser’s management of the Fund to be a material factor in the Board’s deliberations concerning the continuation of the investment sub-advisory agreement. The Board noted that if the Fund’s assets increased over time, the Fund might realize other economies of scale if assets increased proportionally more than certain other expenses.
Calvert
International Opportunities Fund
September 30, 2022
Liquidity Risk Management Program
The Fund has implemented a written liquidity risk management program (Program) and related procedures to manage its liquidity in accordance with Rule 22e-4 under the Investment Company Act of 1940, as amended (Liquidity Rule). The Liquidity Rule defines “liquidity risk” as the risk that a fund could not meet requests to redeem shares issued by the fund without significant dilution of the remaining investors’ interests in the fund. The Fund’s Board of Trustees/Directors has designated the investment adviser to serve as the administrator of the Program and the related procedures. The administrator has established a Liquidity Risk Management Oversight Committee (Committee) to perform the functions necessary to administer the Program. As part of the Program, the administrator is responsible for identifying illiquid investments and categorizing the relative liquidity of the Fund’s investments in accordance with the Liquidity Rule. Under the Program, the administrator assesses, manages, and periodically reviews the Fund’s liquidity risk, and is responsible for making certain reports to the Fund’s Board of Trustees/Directors and the Securities and Exchange Commission (SEC) regarding the liquidity of the Fund’s investments, and to notify the Board of Trustees/Directors and the SEC of certain liquidity events specified in the Liquidity Rule. The liquidity of the Fund’s portfolio investments is determined based on a number of factors including, but not limited to, relevant market, trading and investment-specific considerations under the Program.
At a meeting of the Fund’s Board of Trustees/Directors on June 14, 2022, the Committee provided a written report to the Fund’s Board of Trustees/ Directors pertaining to the operation, adequacy, and effectiveness of implementation of the Program, as well as the operation of the highly liquid investment minimum (if applicable) for the period January 1, 2021 through December 31, 2021 (Review Period). The Program operated effectively during the Review Period, supporting the administrator’s ability to assess, manage and monitor Fund liquidity risk, including during periods of market volatility and net redemptions. During the Review Period, the Fund met redemption requests on a timely basis.
There can be no assurance that the Program will achieve its objectives in the future. Please refer to the Fund’s prospectus for more information regarding the Fund’s exposure to liquidity risk and other principal risks to which an investment in the Fund may be subject.
Calvert
International Opportunities Fund
September 30, 2022
Management and Organization
Fund Management. The Directors of Calvert World Values Fund, Inc. (the Corporation) are responsible for the overall management and supervision of the affairs of the Corporation. The Board members and officers of the Corporation are listed below. Except as indicated, each individual has held the office shown or other offices in the same company for the last five years. Board members hold indefinite terms of office. Each Board member holds office until his or her successor is elected and qualified, or until his or her earlier death, resignation, retirement, removal or disqualification. Under the terms of the Fund's current Board member retirement policy, an Independent Board member must retire at the end of the calendar year in which he or she turns 75. However, if such retirement would cause the Fund to be out of compliance with Section 16 of the 1940 Act or any other regulations or guidance of the SEC, then such retirement will not become effective until such time as action has been taken for the Fund to be in compliance therewith. The “noninterested Directors” consist of those Directors who are not “interested persons” of the Corporation, as that term is defined under the 1940 Act. The business address of each Board member and the Chief Compliance Officer is 1825 Connecticut Avenue NW, Suite 400, Washington, DC 20009 and the business address of the Secretary, Vice President and Chief Legal Officer and the Treasurer is Two International Place, Boston, Massachusetts 02110. As used below, “CRM” refers to Calvert Research and Management and “Eaton Vance” refers to Eaton Vance Management. Each Director oversees 42 funds in the Calvert fund complex. Effective March 1, 2021, each of Eaton Vance and CRM are indirect wholly-owned subsidiaries of Morgan Stanley. Each officer affiliated with CRM may hold a position with other CRM affiliates that is comparable to his or her position with CRM listed below.
| Name and Year of Birth | Corporation
Position(s) | Length of
Service | Principal Occupation(s) and Other Directorships
During Past Five Years and Other Relevant Experience |
| Interested Director |
John H. Streur(1)
1960 | Director and
President | Since 2015 | President and Chief Executive Officer of CRM (since December 31, 2016). President and Chief Executive Officer of Calvert Investments, Inc.
(January 2015 - December 2016); Chief Executive Officer of Calvert
Investment Distributors, Inc. (August 2015 - December 2016); Chief
Compliance Officer of Calvert Investment Management, Inc. (August 2015 -
April 2016); President and Director, Portfolio 21 Investments, Inc.
(through October 2014); President, Chief Executive Officer and
Director, Managers Investment Group LLC (through January 2012);
President and Director, The Managers Funds and Managers AMG
Funds (through January 2012).
Other Directorships. Portfolio 21 Investments, Inc. (asset management)
(through October 2014); Managers Investment Group LLC (asset management)
(through January 2012); The Managers Funds (asset management)
(through January 2012); Managers AMG Funds (asset management)
(through January 2012); Calvert Impact Capital, Inc. |
| Noninterested Directors |
Richard L. Baird, Jr.
1948 | Director | Since 2005 | Regional Disaster Recovery Lead, American Red Cross of Greater
Pennsylvania (since 2017). Volunteer, American Red Cross (since 2015).
Former President and CEO of Adagio Health Inc. (retired in 2014) in
Pittsburgh, PA.
Other Directorships. None. |
Alice Gresham Bullock
1950 | Chair and
Director | Since 2016 | Professor Emerita at Howard University School of Law. Dean Emerita of
Howard University School of Law and Deputy Director of the Association
of American Law Schools (1992-1994).
Other Directorships. None. |
Cari M. Dominguez
1949 | Director | Since 2016 | Former Chair of the U.S. Equal Employment Opportunity Commission.
Other Directorships. ManpowerGroup Inc. (workforce solutions company);
Triple S Management Corporation (managed care); National Association of Corporate Directors. |
John G. Guffey, Jr.
1948 | Director | Since 1992 | President of Aurora Press Inc., a privately held publisher of trade
paperbacks (since January 1997).
Other Directorships. Calvert Impact Capital, Inc. (through December 31, 2018); Calvert Ventures, LLC. |
Miles D. Harper, III
1962 | Director | Since 2005 | Partner, Carr Riggs & Ingram (public accounting firm) since October 2014.
Partner, Gainer Donnelly & Desroches (public accounting firm) (now Carr
Riggs & Ingram) (November 1999 - September 2014).
Other Directorships. Bridgeway Funds (9) (asset management). |
Joy V. Jones
1950 | Director | Since 2005 | Attorney.
Other Directorships. Palm Management Corporation. |
Calvert
International Opportunities Fund
September 30, 2022
Management and Organization — continued
| Name and Year of Birth | Corporation
Position(s) | Length of
Service | Principal Occupation(s) and Other Directorships
During Past Five Years and Other Relevant Experience |
| Noninterested Directors (continued) |
Anthony A. Williams
1951 | Director | Since 2016 | CEO and Executive Director of the Federal City Council (July 2012 to
present); Senior Adviser and Independent Consultant for King and
Spalding LLP (September 2015 to present); Executive Director of Global
Government Practice at the Corporate Executive Board (January 2010 to
January 2012).
Other Directorships. Freddie Mac; Evoq Properties/Meruelo Maddux
Properties, Inc. (real estate management); Weston Solutions, Inc.
(environmental services); Bipartisan Policy Center’s Debt Reduction Task Force;
Chesapeake Bay Foundation; Catholic University of America; Urban Institute (research organization); The Howard Hughes Corporation (real estate development); Old Dominion National Bank. |
| Name and Year of Birth | Corporation
Position(s) | Length of
Service | Principal Occupation(s)
During Past Five Years |
| Principal Officers who are not Directors |
Hope L. Brown
1973 | Chief
Compliance
Officer | Since 2014 | Chief Compliance Officer of 42 registered investment companies advised
by CRM (since 2014). Vice President and Chief Compliance Officer,
Wilmington Funds (2012-2014). |
Deidre E. Walsh
1971 | Secretary,
Vice President
and Chief
Legal Officer | Since 2021 | Vice President of CRM and officer of 42 registered investment companies
advised by CRM (since 2021). Also Vice President of Eaton Vance and
certain of its affiliates and officer of 136 registered investment companies
advised or administered by Eaton Vance. |
James F. Kirchner
1967 | Treasurer | Since 2016 | Vice President of CRM and officer of 42 registered investment companies
advised by CRM (since 2016). Also Vice President of Eaton Vance and
certain of its affiliates and officer of 136 registered investment companies
advised or administered by Eaton Vance. |
| | | | |
| (1) Mr. Streur is an interested person of the Fund because of his positions with the Fund’s adviser and certain affiliates. |
The SAI for the Fund includes additional information about the Directors and officers of the Fund and can be obtained without charge on Calvert’s website at www.calvert.com or by calling 1-800-368-2745.
| FACTS | WHAT DOES EATON VANCE DO WITH YOUR
PERSONAL INFORMATION? |
| Why? | Financial companies choose how they share your personal information. Federal law gives consumers the right to limit some but not all sharing. Federal law also requires us to tell you how we collect, share, and protect your personal information. Please read this notice carefully to understand what we do. |
| |
| What? | The types of personal information we collect and share depend on the product or service you have with us. This information can include:■ Social Security number and income
■
investment experience and risk tolerance
■
checking account number and wire transfer instructions |
| |
| How? | All financial companies need to share customers’ personal information to run their everyday business. In the section below, we list the reasons financial companies can share their customers’ personal information; the reasons Eaton Vance chooses to share; and whether you can limit this sharing. |
Reasons we can share your
personal information | Does Eaton Vance
share? | Can you limit
this sharing? |
| For our everyday business purposes — such as to process your transactions, maintain your account(s), respond to court orders and legal investigations, or report to credit bureaus | Yes | No |
| For our marketing purposes — to offer our products and services to you | Yes | No |
| For joint marketing with other financial companies | No | We don’t share |
| For our investment management affiliates’ everyday business purposes — information about your transactions, experiences, and creditworthiness | Yes | Yes |
| For our affiliates’ everyday business purposes — information about your transactions and experiences | Yes | No |
| For our affiliates’ everyday business purposes — information about your creditworthiness | No | We don’t share |
| For our investment management affiliates to market to you | Yes | Yes |
| For our affiliates to market to you | No | We don’t share |
| For nonaffiliates to market to you | No | We don’t share |
To limit our
sharing | Call toll-free 1-800-368-2745 or email: CRMPrivacy@calvert.comPlease note:If you are a new customer, we can begin sharing your information 30 days from the date we sent this notice. When you are no longer our customer, we continue to share your information as described in this notice. However, you can contact us at any time to limit our sharing. |
| Questions? | Call toll-free 1-800-368-2745 or email: CRMPrivacy@calvert.com |
| Privacy Notice — continued | April 2021 |
| Who we are |
| Who is providing this notice? | Eaton Vance Management, Eaton Vance Distributors, Inc., Eaton Vance Trust Company, Eaton Vance Management (International) Limited, Eaton Vance Advisers International Ltd., Eaton Vance Global Advisors Limited, Eaton Vance Management’s Real Estate Investment Group, Boston Management and Research, Calvert Research and Management, Eaton Vance and Calvert Fund Families and our investment advisory affiliates (“Eaton Vance”) (see Investment Management Affiliates definition below) |
| What we do |
How does Eaton Vance
protect my personal
information? | To protect your personal information from unauthorized access and use, we use security measures that comply with federal law. These measures include computer safeguards and secured files and buildings. We have policies governing the proper handling of customer information by personnel and requiring third parties that provide support to adhere to appropriate security standards with respect to such information. |
How does Eaton Vance
collect my personal
information? | We collect your personal information, for example, when you■ open an account or make deposits or withdrawals from your account
■
buy securities from us or make a wire transfer
■
give us your contact informationWe also collect your personal information from others, such as credit bureaus, affiliates, or other companies. |
| Why can’t I limit all sharing? | Federal law gives you the right to limit only■ sharing for affiliates’ everyday business purposes — information about your creditworthiness
■
affiliates from using your information to market to you
■
sharing for nonaffiliates to market to youState laws and individual companies may give you additional rights to limit sharing. See below for more on your rights under state law. |
| Definitions |
Investment Management
Affiliates | Eaton Vance Investment Management Affiliates include registered investment advisers, registered broker- dealers, and registered and unregistered funds. Investment Management Affiliates does not include entities associated with Morgan Stanley Wealth Management, such as Morgan Stanley Smith Barney LLC and Morgan Stanley & Co. |
| Affiliates | Companies related by common ownership or control. They can be financial and nonfinancial companies.■ Our affiliates include companies with a Morgan Stanley name and financial companies such as Morgan Stanley Smith Barney LLC and Morgan Stanley & Co. |
| Nonaffiliates | Companies not related by common ownership or control. They can be financial and nonfinancial companies.■ Eaton Vance does not share with nonaffiliates so they can market to you. |
| Joint marketing | A formal agreement between nonaffiliated financial companies that together market financial products or services to you.■ Eaton Vance doesn’t jointly market. |
| Other important information |
| Vermont: Except as permitted by law, we will not share personal information we collect about Vermont residents with Nonaffiliates unless you provide us with your written consent to share such information.California: Except as permitted by law, we will not share personal information we collect about California residents with Nonaffiliates and we will limit sharing such personal information with our Affiliates to comply with California privacy laws that apply to us. |
Delivery of Shareholder Documents. The Securities and Exchange Commission (SEC) permits funds to deliver only one copy of shareholder documents, including prospectuses, proxy statements and shareholder reports, to fund investors with multiple accounts at the same residential or post office box address. This practice is often called “householding” and it helps eliminate duplicate mailings to shareholders. Calvert funds, or your financial intermediary, may household the mailing of your documents indefinitely unless you instruct Calvert funds, or your financial intermediary, otherwise. If you would prefer that your Calvert fund documents not be householded, please contact Calvert funds at 1-800-368-2745, or contact your financial intermediary. Your instructions that householding not apply to delivery of your Calvert fund documents will typically be effective within 30 days of receipt by Calvert funds or your financial intermediary.
Portfolio Holdings. Each Calvert fund files a schedule of portfolio holdings on Part F to Form N-PORT with the SEC. Certain information filed on Form N-PORT may be viewed on the Calvert website at www.calvert.com, by calling Calvert at 1-800-368-2745 or in the EDGAR database on the SEC’s website at www.sec.gov.
Proxy Voting. The Proxy Voting Guidelines that each Calvert fund uses to determine how to vote proxies relating to portfolio securities is provided as an Appendix to the fund’s Statement of Additional Information. The Statement of Additional Information can be obtained free of charge by calling the Calvert funds at 1-800-368-2745, by visiting the Calvert funds’ website at www.calvert.com or visiting the SEC’s website at www.sec.gov. Information regarding how a Calvert fund voted proxies relating to portfolio securities during the most recent 12-month period ended June 30 is available by calling Calvert funds, by visiting the Calvert funds’ website at www.calvert.com or by visiting the SEC’s website at www.sec.gov.
This Page Intentionally Left Blank
This Page Intentionally Left Blank
This Page Intentionally Left Blank
Investment Adviser and Administrator
Calvert Research and Management
1825 Connecticut Avenue NW, Suite 400
Washington, DC 20009
Investment Sub-Adviser
Eaton Vance Advisers International Ltd.
125 Old Broad Street
London, EC2N 1AR
Principal Underwriter*
Eaton Vance Distributors, Inc.
Two International Place
Boston, MA 02110
(617) 482-8260
Custodian
State Street Bank and Trust Company
State Street Financial Center, One Lincoln Street
Boston, MA 02111
Transfer Agent
DST Asset Manager Solutions, Inc.
2000 Crown Colony Drive
Quincy, MA 02169
Independent Registered Public Accounting Firm
Deloitte & Touche LLP
200 Berkeley Street
Boston, MA 02116-5022
Fund Offices
1825 Connecticut Avenue NW, Suite 400
Washington, DC 20009
* FINRA BrokerCheck. Investors may check the background of their Investment Professional by contacting the Financial Industry Regulatory Authority (FINRA). FINRA BrokerCheck is a free tool to help investors check the professional background of current and former FINRA-registered securities firms and brokers. FINRA BrokerCheck is available by calling 1-800-289-9999 and at www.FINRA.org. The FINRA BrokerCheck brochure describing this program is available to investors at www.FINRA.org.
Printed on recycled paper.
24211 9.30.22
Calvert
Emerging Markets Advancement Fund
Annual Report
September 30, 2022
Commodity Futures Trading Commission Registration. The Commodity Futures Trading Commission (“CFTC”) has adopted regulations that subject registered investment companies and advisers to regulation by the CFTC if a fund invests more than a prescribed level of its assets in certain CFTC-regulated instruments (including futures, certain options and swap agreements) or markets itself as providing investment exposure to such instruments. The adviser has claimed an exclusion from the definition of “commodity pool operator” under the Commodity Exchange Act with respect to its management of the Fund and the other funds it manages. Accordingly, neither the Fund nor the adviser is subject to CFTC regulation.
Fund shares are not insured by the FDIC and are not deposits or other obligations of, or guaranteed by, any depository institution. Shares are subject to investment risks, including possible loss of principal invested.
This report must be preceded or accompanied by a current summary prospectus or prospectus. Before investing, investors should consider carefully the investment objective, risks, and charges and expenses of a mutual fund. This and other important information is contained in the summary prospectus and prospectus, which can be obtained from a financial intermediary. Prospective investors should read the prospectus carefully before investing. For further information, please call 1-800-368-2745.
Choose Planet-friendly E-delivery!
Sign up now for on-line statements, prospectuses, and fund reports. In less than five minutes you can help reduce paper mail and lower fund costs.
Just go to www.calvert.com. If you already have an online account with the Calvert funds, click on Login to access your Account and select the documents you would like to receive via e-mail.
If you’re new to online account access, click on Login, then Register to create your user name and password. Once you’re in, click on the E-delivery sign-up on the Account Portfolio page and follow the quick, easy steps.
Note: If your shares are not held directly with the Calvert funds but through a brokerage firm, you must contact your broker for electronic delivery options available through their firm.
Annual Report September 30, 2022
Calvert
Emerging Markets Advancement Fund
Calvert
Emerging Markets Advancement Fund
September 30, 2022
Management's Discussion of Fund Performance†
Economic and Market Conditions
Emerging markets struggled during the 12-month period ended September 30, 2022, as appetites for taking on investment risk faded in light of the Ukraine War, rising U.S. interest rates to combat inflation, and COVID-19 lockdowns in China. The benchmark MSCI Emerging Markets Index (the Index) returned -28.11% during the period.
In March 2022, the U.S. Federal Reserve (the Fed) hiked the federal funds rate for the first time in more than three years and central banks in developed markets followed its lead. Central banks in emerging markets had been well ahead of the Fed, starting with Brazil, which began raising rates in March 2021. Nevertheless, as the Fed hiked rates, nearly all emerging-market currencies depreciated in value against the stronger U.S. dollar, and currency volatility hit highs not seen since the beginning of the pandemic.
Asia ex-Japan underperformed the Index, pulled down by the growth-sensitive markets of South Korea and Taiwan as the outlook for global trade deteriorated during the period. Rising inflation, supply-chain disruptions, fears of a drop in consumer demand, and recessionary worries fanned a technology sell-off that dealt a blow to the semiconductors and technology hardware industries.
Chinese stocks within the Index returned -22.44% during the first three quarters of 2022 due to muted economic activities. Consumer sentiment was weighed down by uncertainties over China’s COVID-19 policy and weakness in its real estate market. Geopolitical tensions with Taiwan and reduced investor appetite for risk assets globally further contributed to the stock market’s overall decline during the period.
The ASEAN — Association of Southeast Asian Nations — economic bloc was a bright spot during the period, benefiting from the reopening of markets for many commodity-exporting countries.
In the latter part of the period, expectations rose that interest rates might continue to climb. In August, the Fed and other central banks reaffirmed their priority to fight inflation by easing economic growth and slowing consumer demand. Concerns over the impact of higher prices and borrowing costs heightened fears of an economic recession. This sentiment drove a sharp rise in bond yields and a sell-off in stocks during the final quarter of the period.
Fund Performance
For the 12-month period ended September 30, 2022, Calvert Emerging Markets Advancement Fund (the Fund) returned -17.42% for Class A shares at net asset value (NAV), outperforming its benchmark, the Index, which returned -28.11%.
Generally, the Fund seeks active country-level investments in emerging markets by pursuing overweight exposures to countries it believes may improve Environmental, Social, and Governance (ESG) performance; and pursuing underweight exposures to countries it believes may not. The Fund generally selects companies from the Calvert Emerging Markets Responsible Index.
During the period, Indonesia and Qatar were the two best-performing markets within the Index. As commodity exporters, both countries benefited from rising commodity prices during the period. Indonesia’s pro-business president and credible central bank — operating in an inflationary environment — also contributed to the country being the top performer within the Index. Commodity exporters, including those in the Middle East and Latin America, generally had positive returns, while importers tended to lag the market during the period.
China, the Index’s largest constituent, underperformed the Index by 7.4% during the period. The Fund’s underweight exposure to China was a leading contributor to Fund performance relative to the Index. The country’s so-called “zero COVID-19” policy hampered China’s economic growth while competing countries worldwide began to open up their markets. The Fund also hedged much of its Chinese currency exposure in light of a strong U.S. dollar during the period.
The Fund’s lack of exposure to Russia also contributed to relative returns during the period. All Russian stocks were written off and removed from the Index following Russia’s invasion of Ukraine.
An overweight exposure to the United Arab Emirates (UAE) further enhanced relative returns as that country’s equity index gained 1.27% during the period. Social policy reforms have made the UAE more attractive to foreign investors, and the government has eased business procedures, helping to lower capital costs and improve cash flows for companies.
In contrast, the Fund’s overweight exposure to South Korea detracted from returns relative to the Index during the period. South Korea, China, and Taiwan — the three largest countries within the Index — were among the worst performers in part because of concerns about rising global trade tensions. South Korea’s promising reforms were overwhelmed by concerns that an economic downturn could erode global demand for its microchips.
The Fund’s overweight exposure to Egypt — based on management’s expectation of continuing economic reforms in the country — further weighed on relative performance during the period. In addition, the war in Ukraine caused major increases in the cost of Egyptian imports, particularly wheat, weakening Egypt’s economy.
See Endnotes and Additional Disclosures in this report.
Past performance is no guarantee of future results. Returns are historical and are calculated by determining the percentage change in net asset value (NAV) or offering price (as applicable) with all distributions reinvested. Furthermore, returns do not reflect the deduction of taxes that shareholders may have to pay on Fund distributions or upon the redemption of Fund shares. Investment return and principal value will fluctuate so that shares, when redeemed, may be worth more or less than their original cost. Performance for periods less than or equal to one year is cumulative. Performance is for the stated time period only; due to market volatility, current Fund performance may be lower or higher than the quoted return. For performance as of the most recent month-end, please refer to www.calvert.com.
Calvert
Emerging Markets Advancement Fund
September 30, 2022
Management's Discussion of Fund Performance† — continued
The Fund’s overweight exposure to Malaysia also detracted from relative performance during the period. Management had expected economic reforms and the reopening of the economy following COVID-19 combined with attractive valuations might produce strong market returns. However, the Malaysian government reversed course on certain economic policies during the period, hurting some exporters.
The Fund’s use of derivatives overall, including foreign exchange hedges of the Chinese currency, contributed to performance relative to the Index during the period.
See Endnotes and Additional Disclosures in this report.
Past performance is no guarantee of future results. Returns are historical and are calculated by determining the percentage change in net asset value (NAV) or offering price (as applicable) with all distributions reinvested. Furthermore, returns do not reflect the deduction of taxes that shareholders may have to pay on Fund distributions or upon the redemption of Fund shares. Investment return and principal value will fluctuate so that shares, when redeemed, may be worth more or less than their original cost. Performance for periods less than or equal to one year is cumulative. Performance is for the stated time period only; due to market volatility, current Fund performance may be lower or higher than the quoted return. For performance as of the most recent month-end, please refer to www.calvert.com.
Calvert
Emerging Markets Advancement Fund
September 30, 2022
Performance
Portfolio Manager(s) Marshall Stocker, Ph.D., CFA of Calvert Research and Management
| % Average Annual Total Returns1,2 | Class
Inception Date | Performance
Inception Date | One Year | Five Years | Since
Inception |
| Class A at NAV | 10/01/2019 | 10/01/2019 | (17.42)% | —% | 0.96% |
| Class A with 5.25% Maximum Sales Charge | — | — | (21.78) | — | (0.82) |
| Class I at NAV | 10/01/2019 | 10/01/2019 | (17.20) | — | 1.21 |
|
| MSCI Emerging Markets Index | — | — | (28.11)% | (1.81)% | (1.98)% |
| Calvert Emerging Markets Responsible Index | — | — | (28.23) | — | (1.80) |
| % Total Annual Operating Expense Ratios3 | Class A | Class I |
| Gross | 1.41% | 1.16% |
| Net | 1.20 | 0.95 |
Growth of $10,000
This graph shows the change in value of a hypothetical investment of $10,000 in Class A of the Fund for the period indicated. For comparison, the same investment is shown in the indicated index.
| Growth of Investment | Amount Invested | Period Beginning | At NAV | With Maximum Sales Charge |
| Class I, at minimum investment | $1,000,000 | 10/01/2019 | $1,036,695 | N.A. |
See Endnotes and Additional Disclosures in this report.
Past performance is no guarantee of future results. Returns are historical and are calculated by determining the percentage change in net asset value (NAV) or offering price (as applicable) with all distributions reinvested. Furthermore, returns do not reflect the deduction of taxes that shareholders may have to pay on Fund distributions or upon the redemption of Fund shares. Investment return and principal value will fluctuate so that shares, when redeemed, may be worth more or less than their original cost. Performance for periods less than or equal to one year is cumulative. Performance is for the stated time period only; due to market volatility, current Fund performance may be lower or higher than the quoted return. For performance as of the most recent month-end, please refer to www.calvert.com.
Calvert
Emerging Markets Advancement Fund
September 30, 2022
| Sector Allocation (% of net assets)1 |
| Top 10 Holdings (% of net assets)1 | |
| Samsung Electronics Co., Ltd. | 5.2% |
| International Holdings Co. PJSC | 4.3 |
| Taiwan Semiconductor Manufacturing Co., Ltd. | 4.2 |
| Hellenic Telecommunications Organization S.A. | 3.8 |
| First Abu Dhabi Bank PJSC | 2.8 |
| Bank Central Asia Tbk PT | 2.6 |
| Tencent Holdings, Ltd. | 2.3 |
| Eurobank Ergasias S.A. | 2.1 |
| Bank Rakyat Indonesia Persero Tbk PT | 1.8 |
| National Bank of Greece S.A. | 1.6 |
| Total | 30.7% |
Footnotes:
| 1 | Excludes cash and cash equivalents. |
Calvert
Emerging Markets Advancement Fund
September 30, 2022
Endnotes and Additional Disclosures
| † | The views expressed in this report are those of the portfolio manager(s) and are current only through the date stated at the top of this page. These views are subject to change at any time based upon market or other conditions, and Calvert and the Fund(s) disclaim any responsibility to update such views. These views may not be relied upon as investment advice and, because investment decisions are based on many factors, may not be relied upon as an indication of trading intent on behalf of any Calvert fund. This commentary may contain statements that are not historical facts, referred to as “forward-looking statements.” The Fund’s actual future results may differ significantly from those stated in any forward-looking statement, depending on factors such as changes in securities or financial markets or general economic conditions, the volume of sales and purchases of Fund shares, the continuation of investment advisory, administrative and service contracts, and other risks discussed from time to time in the Fund’s filings with the Securities and Exchange Commission. |
| | |
| 1 | MSCI Emerging Markets Index is an unmanaged index of emerging markets common stocks. MSCI indexes are net of foreign withholding taxes. Source: MSCI. MSCI data may not be reproduced or used for any other purpose. MSCI provides no warranties, has not prepared or approved this report, and has no liability hereunder. The Calvert Emerging Markets Responsible Index (the Index) is composed of equity securities of companies that are located in or tied economically to countries that Calvert Research and Management has classified as emerging market countries and that meet certain environmental, social and governance criteria. The Index is reconstituted annually and rebalanced quarterly. Unless otherwise stated, index returns do not reflect the effect of any applicable sales charges, commissions, expenses, taxes or leverage, as applicable. It is not possible to invest directly in an index. |
| 2 | Total Returns at NAV do not include applicable sales charges. If sales charges were deducted, the returns would be lower. Total Returns shown with maximum sales charge reflect the stated maximum sales charge. Unless otherwise stated, performance does not reflect the deduction of taxes on Fund distributions or redemptions of Fund shares. Performance since inception for an index, if presented, is the performance since the Fund's or oldest share class's inception, as applicable. |
| 3 | Source: Fund prospectus. Net expense ratios reflect a contractual expense reimbursement that continues through 1/31/23. The expense ratios for the current reporting period can be found in the Financial Highlights section of this report. Performance reflects expenses waived and/or reimbursed, if applicable. Without such waivers and/or reimbursements, performance would have been lower. |
| | Fund profile subject to change due to active management. |
Calvert
Emerging Markets Advancement Fund
September 30, 2022
Example
As a Fund shareholder, you incur two types of costs: (1) transaction costs, including sales charges (loads) on purchases and redemption fees (if applicable); and (2) ongoing costs, including management fees; distribution and/or service fees; and other Fund expenses. This Example is intended to help you understand your ongoing costs (in dollars) of Fund investing and to compare these costs with the ongoing costs of investing in other mutual funds. The Example is based on an investment of $1,000 invested at the beginning of the period and held for the entire period (April 1, 2022 to September 30, 2022).
Actual Expenses
The first section of the table below provides information about actual account values and actual expenses. You may use the information in this section, together with the amount you invested, to estimate the expenses that you paid over the period. Simply divide your account value by $1,000 (for example, an $8,600 account value divided by $1,000 = 8.6), then multiply the result by the number in the first section under the heading entitled “Expenses Paid During Period” to estimate the expenses you paid on your account during this period.
Hypothetical Example for Comparison Purposes
The second section of the table below provides information about hypothetical account values and hypothetical expenses based on the actual Fund expense ratio and an assumed rate of return of 5% per year (before expenses), which is not the actual Fund return. The hypothetical account values and expenses may not be used to estimate the actual ending account balance or expenses you paid for the period. You may use this information to compare the ongoing costs of investing in the Fund and other funds. To do so, compare this 5% hypothetical example with the 5% hypothetical examples that appear in the shareholder reports of the other funds.
Please note that the expenses shown in the table are meant to highlight your ongoing costs only and do not reflect any transactional costs, such as sales charges (loads) or redemption fees (if applicable). Therefore, the second section of the table is useful in comparing ongoing costs only, and will not help you determine the relative total costs of owning different funds. In addition, if these transactional costs were included, your costs would be higher.
| | Beginning
Account Value
(4/1/22) | Ending
Account Value
(9/30/22) | Expenses Paid
During Period*
(4/1/22 – 9/30/22) | Annualized
Expense
Ratio |
| Actual | | | | |
| Class A | $1,000.00 | $ 834.60 | $5.52 ** | 1.20% |
| Class I | $1,000.00 | $ 836.20 | $4.37 ** | 0.95% |
| Hypothetical | | | | |
| (5% return per year before expenses) | | | | |
| Class A | $1,000.00 | $1,019.05 | $6.07 ** | 1.20% |
| Class I | $1,000.00 | $1,020.31 | $4.81 ** | 0.95% |
| * | Expenses are equal to the Fund's annualized expense ratio for the indicated Class, multiplied by the average account value over the period, multiplied by 183/365 (to reflect the one-half year period). The Example assumes that the $1,000 was invested at the net asset value per share determined at the close of business on March 31, 2022. |
| ** | Absent a waiver and/or reimbursement of expenses by an affiliate, expenses would be higher. |
Calvert
Emerging Markets Advancement Fund
September 30, 2022
| Security | Shares | Value |
| Brazil — 9.6% | |
| Alpargatas S.A., PFC Shares | | 8,051 | $ 31,745 |
| Americanas S.A. | | 23,756 | 74,778 |
| Atacadao S.A. | | 24,023 | 86,084 |
| B3 S.A. - Brasil Bolsa Balcao | | 195,099 | 471,983 |
| Banco Bradesco S.A., PFC Shares | | 151,028 | 555,469 |
| Banco BTG Pactual S.A. | | 41,326 | 190,069 |
| Banco do Brasil S.A. | | 31,480 | 224,793 |
| BB Seguridade Participacoes S.A. | | 25,372 | 124,970 |
| Bradespar S.A., PFC Shares | | 10,076 | 44,381 |
| BRF S.A.(1) | | 43,109 | 102,931 |
| Caixa Seguridade Participacoes S.A. | | 20,900 | 32,971 |
| Cia de Saneamento Basico do Estado de Sao Paulo | | 17,721 | 162,941 |
| Cia de Transmissao de Energia Eletrica Paulista | | 10,041 | 42,756 |
| Cia Energetica de Minas Gerais, PFC Shares | | 77,659 | 154,905 |
| Cia Paranaense de Energia, Class B, PFC Shares | | 24,786 | 30,234 |
| Cielo S.A. | | 36,900 | 36,939 |
| EDP - Energias do Brasil S.A. | | 11,763 | 47,603 |
| Engie Brasil Energia S.A. | | 13,344 | 95,262 |
| Equatorial Energia S.A. | | 57,896 | 288,710 |
| Hapvida Participacoes e Investimentos S.A.(2) | | 153,035 | 214,757 |
| Hypera S.A. | | 24,099 | 197,685 |
| Itau Unibanco Holding S.A., PFC Shares | | 141,285 | 734,928 |
| Itausa - Investimentos Itau S.A., PFC Shares | | 179,540 | 323,843 |
| Klabin S.A. | | 299,022 | 201,774 |
| Localiza Rent a Car S.A. | | 35,455 | 401,521 |
| Lojas Renner S.A. | | 34,749 | 179,402 |
| Magazine Luiza S.A.(1) | | 99,911 | 82,976 |
| Marfrig Global Foods S.A. | | 17,799 | 32,567 |
| Metalurgica Gerdau S.A., PFC Shares | | 45,252 | 88,837 |
| Multiplan Empreendimentos Imobiliarios S.A. | | 14,416 | 64,593 |
| Natura & Co. Holding S.A. | | 28,421 | 77,607 |
| Neoenergia S.A. | | 11,834 | 33,565 |
| Pagseguro Digital, Ltd., Class A(1) | | 7,078 | 93,642 |
| Porto Seguro S.A. | | 6,700 | 26,244 |
| Raia Drogasil S.A. | | 40,487 | 170,599 |
| Rede D'Or Sao Luiz S.A.(2) | | 26,191 | 144,298 |
| Sao Martinho S.A. | | 9,700 | 45,890 |
| Sendas Distribuidora S.A. | | 27,692 | 90,093 |
| SLC Agricola S.A. | | 3,400 | 27,285 |
| StoneCo, Ltd., Class A(1) | | 8,416 | 80,204 |
| Sul America S.A. | | 8,731 | 35,705 |
| Telefonica Brasil S.A. | | 14,935 | 112,102 |
| TIM S.A. | | 28,740 | 64,360 |
| TOTVS S.A. | | 17,679 | 96,189 |
| Vamos Locacao de Caminhoes Maquinas e Equipamentos S.A. | | 13,100 | 33,197 |
| Security | Shares | Value |
| Brazil (continued) | |
| WEG S.A. | | 63,918 | $ 380,829 |
| XP, Inc. BDR(1) | | 1,629 | 31,044 |
| XP, Inc., Class A(1) | | 9,247 | 175,785 |
| | | | $ 7,041,045 |
| Canada — 0.0%(3) | |
| Atlas Corp.(4) | | 2,261 | $ 31,428 |
| | | | $ 31,428 |
| China — 14.1% | |
| Alibaba Health Information Technology, Ltd.(1) | | 78,000 | $ 35,530 |
| A-Living Smart City Services Co., Ltd., Class H(2) | | 2,750 | 2,163 |
| Autohome, Inc. ADR | | 1,429 | 41,098 |
| Bank of Communications Co., Ltd., Class H | | 302,000 | 159,207 |
| BeiGene, Ltd.(1) | | 13,000 | 134,048 |
| Beijing Enterprises Water Group, Ltd. | | 102,000 | 23,392 |
| Bilibili, Inc. ADR(1)(4) | | 3,877 | 59,396 |
| Blue Moon Group Holdings, Ltd.(2)(4) | | 40,500 | 28,514 |
| BYD Co., Ltd., Class H | | 9,000 | 221,720 |
| BYD Electronic International Co., Ltd.(4) | | 13,500 | 32,260 |
| China CITIC Bank Corp, Ltd., Class H | | 215,000 | 85,322 |
| China Communications Services Corp., Ltd., Class H | | 54,000 | 18,155 |
| China Conch Venture Holdings, Ltd. | | 32,500 | 51,680 |
| China Datang Corp. Renewable Power Co., Ltd., Class H | | 45,000 | 10,425 |
| China Everbright Bank Co., Ltd., Class H | | 90,000 | 24,711 |
| China Everbright Environment Group, Ltd. | | 78,000 | 32,290 |
| China International Capital Corp., Ltd., Class H(2) | | 45,600 | 65,765 |
| China International Marine Containers Group Co., Ltd. | | 23,200 | 14,714 |
| China Jinmao Holdings Group, Ltd. | | 110,000 | 22,375 |
| China Lesso Group Holdings, Ltd. | | 32,000 | 29,619 |
| China Literature, Ltd.(1)(2) | | 7,200 | 20,249 |
| China Medical System Holdings, Ltd. | | 22,000 | 26,207 |
| China Meidong Auto Holdings, Ltd. | | 18,000 | 28,484 |
| China Mengniu Dairy Co., Ltd. | | 41,000 | 162,077 |
| China Merchants Bank Co., Ltd., Class H | | 45,500 | 210,568 |
| China Minsheng Banking Corp., Ltd., Class H(4) | | 217,500 | 62,194 |
| China Pacific Insurance Group Co., Ltd., Class H | | 55,600 | 102,102 |
| China Resources Land, Ltd. | | 42,000 | 164,509 |
| China Resources Mixc Lifestyle Services, Ltd.(2) | | 11,800 | 45,038 |
| China Resources Pharmaceutical Group, Ltd.(2) | | 27,000 | 18,463 |
| China Ruyi Holdings, Ltd.(1)(4) | | 68,000 | 14,430 |
| China Tower Corp, Ltd., Class H(2) | | 984,000 | 105,132 |
| China Vanke Co., Ltd., Class H | | 41,600 | 75,286 |
| Chinasoft International, Ltd. | | 56,000 | 34,207 |
| Chindata Group Holdings, Ltd. ADR(1)(4) | | 2,400 | 19,392 |
| Chongqing Rural Commercial Bank Co., Ltd., Class H | | 73,000 | 23,674 |
| Country Garden Holdings Co., Ltd.(4) | | 163,000 | 37,653 |
8
See Notes to Financial Statements.
Calvert
Emerging Markets Advancement Fund
September 30, 2022
Schedule of Investments — continued
| Security | Shares | Value |
| China (continued) | |
| Country Garden Services Holdings Co., Ltd. | | 44,000 | $ 64,241 |
| CSPC Pharmaceutical Group, Ltd. | | 113,600 | 112,597 |
| Dali Foods Group Co., Ltd.(2) | | 46,000 | 19,809 |
| Dongyue Group, Ltd. | | 39,000 | 38,647 |
| ENN Energy Holdings, Ltd. | | 11,700 | 155,998 |
| Far East Horizon, Ltd.(4) | | 53,000 | 35,731 |
| Flat Glass Group Co., Ltd., Class H(1) | | 12,000 | 29,037 |
| Fuyao Glass Industry Group Co., Ltd., Class H(2) | | 14,400 | 57,740 |
| GDS Holdings, Ltd. ADR(1) | | 2,578 | 45,528 |
| Geely Automobile Holdings, Ltd. | | 81,000 | 110,848 |
| Great Wall Motor Co., Ltd., Class H | | 53,500 | 60,992 |
| Greentown China Holdings, Ltd. | | 18,500 | 34,722 |
| Greentown Service Group Co., Ltd. | | 28,000 | 18,507 |
| Guangdong Investment, Ltd. | | 62,000 | 49,527 |
| Guangzhou Automobile Group Co., Ltd., Class H | | 92,000 | 65,370 |
| H World Group, Ltd. ADR | | 3,102 | 104,041 |
| Haichang Ocean Park Holdings, Ltd.(1)(2)(4) | | 22,000 | 21,490 |
| Haidilao International Holding, Ltd.(1)(2)(4) | | 29,000 | 56,251 |
| Haier Smart Home Co., Ltd., Class H | | 41,400 | 125,979 |
| Haitong Securities Co., Ltd., Class H | | 87,200 | 46,112 |
| Hangzhou Tigermed Consulting Co., Ltd., Class H(2) | | 2,100 | 16,883 |
| Hansoh Pharmaceutical Group Co., Ltd.(2) | | 18,000 | 28,415 |
| Hengan International Group Co., Ltd. | | 18,500 | 82,710 |
| Hua Hong Semiconductor, Ltd.(1)(2) | | 15,000 | 33,975 |
| Huatai Securities Co., Ltd., Class H(2) | | 48,400 | 53,081 |
| Hygeia Healthcare Holdings Co., Ltd.(1)(2)(4) | | 5,400 | 30,206 |
| Innovent Biologics, Inc.(1)(2) | | 17,000 | 52,246 |
| JD Health International, Inc.(1)(2) | | 16,700 | 95,129 |
| JD Logistics, Inc.(1)(2) | | 25,100 | 43,932 |
| JD.com, Inc. ADR | | 9,580 | 481,874 |
| JD.com, Inc., Class A | | 1,773 | 44,730 |
| Jiangsu Expressway Co., Ltd., Class H | | 28,000 | 21,022 |
| Jiumaojiu International Holdings, Ltd.(2)(4) | | 15,000 | 24,393 |
| Kingdee International Software Group Co., Ltd.(1) | | 56,000 | 72,988 |
| Kingsoft Corp., Ltd. | | 20,000 | 52,919 |
| Longfor Group Holdings, Ltd.(2) | | 36,000 | 103,196 |
| Lufax Holding, Ltd. ADR | | 15,300 | 38,862 |
| Meituan, Class B(1)(2) | | 35,000 | 735,576 |
| Microport Scientific Corp.(1)(4) | | 12,100 | 20,621 |
| Ming Yuan Cloud Group Holdings, Ltd. | | 14,000 | 8,236 |
| NetEase, Inc. ADR | | 4,096 | 309,658 |
| NIO, Inc. ADR(1) | | 14,785 | 233,159 |
| Nongfu Spring Co., Ltd., Class H(2)(4) | | 26,600 | 153,835 |
| Pharmaron Beijing Co., Ltd.(2) | | 3,500 | 16,932 |
| Pinduoduo, Inc. ADR(1) | | 4,661 | 291,685 |
| Ping An Healthcare and Technology Co., Ltd.(1)(2)(4) | | 8,900 | 16,737 |
| Postal Savings Bank of China Co., Ltd., Class H(2)(4) | | 201,000 | 118,141 |
| Security | Shares | Value |
| China (continued) | |
| Shandong Weigao Group Medical Polymer Co., Ltd., Class H | | 42,400 | $ 56,801 |
| Shanghai Fosun Pharmaceutical Group Co., Ltd., Class H(4) | | 8,500 | 20,520 |
| Shanghai Fudan Microelectronics Group Co., Ltd., Class H(4) | | 5,000 | 22,630 |
| Shanghai Junshi Biosciences Co., Ltd., Class H(1)(2)(4) | | 2,400 | 7,589 |
| Shanghai Pharmaceuticals Holding Co., Ltd. | | 14,100 | 19,445 |
| Sinopharm Group Co., Ltd., Class H | | 23,600 | 47,101 |
| Sunny Optical Technology Group Co., Ltd. | | 11,400 | 108,341 |
| Tencent Holdings, Ltd. | | 50,000 | 1,688,815 |
| Tencent Music Entertainment Group(1) | | 11,688 | 47,453 |
| Tingyi (Cayman Islands) Holding Corp. | | 40,000 | 68,884 |
| Tongcheng Travel Holdings, Ltd.(1) | | 21,600 | 42,153 |
| Topsports International Holdings, Ltd.(2) | | 91,000 | 63,612 |
| TravelSky Technology, Ltd., Class H | | 20,000 | 30,612 |
| Trip.com Group, Ltd. ADR(1) | | 7,520 | 205,371 |
| Vipshop Holdings, Ltd. ADR(1) | | 11,422 | 96,059 |
| Want Want China Holdings, Ltd. | | 128,000 | 83,592 |
| Weibo Corp. ADR(1) | | 3,268 | 55,883 |
| Weichai Power Co., Ltd., Class H | | 33,000 | 31,263 |
| WuXi AppTec Co., Ltd., Class H(2) | | 6,480 | 51,754 |
| WuXi Biologics Cayman, Inc.(1)(2) | | 35,500 | 211,326 |
| Xinyi Energy Holdings, Ltd. | | 32,000 | 9,824 |
| Xinyi Solar Holdings, Ltd. | | 90,000 | 94,512 |
| XPENG, Inc. ADR(1)(4) | | 8,993 | 107,466 |
| Xtep International Holdings, Ltd.(4) | | 38,000 | 39,997 |
| Yadea Group Holdings, Ltd.(2) | | 20,000 | 31,966 |
| Yihai International Holding Ltd. | | 10,000 | 21,059 |
| Yum China Holdings, Inc. | | 4,624 | 218,854 |
| Zai Lab, Ltd. ADR(1) | | 1,392 | 47,606 |
| Zhongsheng Group Holdings, Ltd. | | 13,500 | 53,532 |
| Zhuzhou CRRC Times Electric Co., Ltd. | | 8,000 | 33,486 |
| Zoomlion Heavy Industry Science and Technology Co., Ltd., Class H | | 66,400 | 22,973 |
| | | | $10,316,836 |
| Greece — 8.6% | |
| Alpha Services and Holdings S.A.(1) | | 212,000 | $ 166,426 |
| Eurobank Ergasias S.A.(1) | | 1,842,582 | 1,538,024 |
| Hellenic Telecommunications Organization S.A. | | 189,702 | 2,754,585 |
| JUMBO S.A. | | 11,100 | 147,789 |
| National Bank of Greece S.A.(1) | | 389,221 | 1,145,997 |
| Public Power Corp. S.A.(1) | | 38,300 | 194,504 |
| Star Bulk Carriers Corp. | | 9,500 | 166,060 |
| Terna Energy S.A. | | 9,000 | 145,518 |
| | | | $ 6,258,903 |
| Hong Kong — 0.7% | |
| China Gas Holdings, Ltd. | | 64,000 | $ 76,548 |
| China Overseas Land & Investment, Ltd. | | 56,500 | 146,986 |
9
See Notes to Financial Statements.
Calvert
Emerging Markets Advancement Fund
September 30, 2022
Schedule of Investments — continued
| Security | Shares | Value |
| Hong Kong (continued) | |
| China Resources Gas Group, Ltd. | | 19,500 | $ 61,827 |
| China State Construction International Holdings, Ltd. | | 40,000 | 40,307 |
| China Traditional Chinese Medicine Holdings Co., Ltd. | | 44,000 | 15,307 |
| JS Global Lifestyle Co., Ltd.(2) | | 28,000 | 26,966 |
| Nine Dragons Paper Holdings, Ltd. | | 47,000 | 29,161 |
| Sino Biopharmaceutical, Ltd. | | 170,500 | 79,902 |
| Yuexiu Property Co., Ltd. | | 25,000 | 30,124 |
| | | | $ 507,128 |
| India — 8.4% | |
| Aarti Industries, Ltd. | | 2,800 | $ 25,520 |
| Adani Total Gas, Ltd. | | 3,700 | 150,207 |
| Ambuja Cements, Ltd. | | 12,100 | 76,336 |
| Apollo Hospitals Enterprise, Ltd. | | 1,900 | 101,438 |
| Ashok Leyland, Ltd. | | 15,000 | 27,993 |
| Asian Paints, Ltd. | | 4,100 | 169,247 |
| AU Small Finance Bank, Ltd.(2) | | 3,300 | 24,842 |
| Avenue Supermarts, Ltd.(1)(2) | | 2,100 | 112,437 |
| Axis Bank, Ltd. | | 20,700 | 185,794 |
| Bajaj Finance, Ltd. | | 2,400 | 214,562 |
| Bajaj Finserv, Ltd. | | 3,000 | 61,729 |
| Bandhan Bank, Ltd.(1)(2) | | 7,200 | 23,371 |
| Bank of Baroda | | 11,300 | 18,262 |
| Bharti Airtel, Ltd. | | 22,700 | 222,081 |
| Biocon, Ltd. | | 7,700 | 27,363 |
| Cipla, Ltd. | | 8,000 | 108,584 |
| Coforge, Ltd. | | 600 | 24,546 |
| Dabur India, Ltd. | | 4,900 | 34,335 |
| Deepak Nitrite, Ltd. | | 1,000 | 24,840 |
| Dixon Technologies India, Ltd. | | 500 | 26,847 |
| DLF, Ltd. | | 10,200 | 44,327 |
| Dr Lal PathLabs, Ltd.(2) | | 800 | 24,539 |
| Federal Bank, Ltd. | | 16,600 | 24,141 |
| FSN E-Commerce Ventures, Ltd.(1) | | 1,200 | 18,606 |
| Godrej Consumer Products, Ltd.(1) | | 3,100 | 34,423 |
| Gujarat Gas, Ltd. | | 3,700 | 22,933 |
| Havells India, Ltd. | | 2,700 | 44,427 |
| HCL Technologies, Ltd. | | 11,400 | 129,436 |
| HDFC Asset Management Co., Ltd.(2) | | 600 | 13,918 |
| HDFC Bank, Ltd. | | 27,400 | 474,952 |
| HDFC Life Insurance Co., Ltd.(2) | | 8,200 | 53,055 |
| Hero MotoCorp, Ltd. | | 1,300 | 40,478 |
| Hindustan Unilever, Ltd. | | 7,600 | 250,973 |
| Housing Development Finance Corp., Ltd. | | 13,300 | 371,201 |
| ICICI Bank, Ltd. | | 38,000 | 401,193 |
| IDFC First Bank, Ltd.(1) | | 31,100 | 18,940 |
| Indian Hotels Co., Ltd. | | 13,800 | 56,022 |
| Security | Shares | Value |
| India (continued) | |
| Indian Railway Catering & Tourism Corp., Ltd. | | 3,900 | $ 33,498 |
| Indus Towers, Ltd. | | 13,400 | 32,354 |
| IndusInd Bank, Ltd. | | 4,400 | 63,738 |
| Info Edge India, Ltd. | | 800 | 37,623 |
| Kotak Mahindra Bank, Ltd. | | 9,000 | 199,619 |
| Larsen & Toubro Infotech, Ltd.(2) | | 500 | 27,103 |
| Laurus Labs, Ltd.(2) | | 5,800 | 36,486 |
| LIC Housing Finance, Ltd. | | 3,200 | 16,173 |
| Mahindra & Mahindra Financial Services, Ltd. | | 7,200 | 16,256 |
| Mahindra & Mahindra, Ltd. | | 10,900 | 168,617 |
| MakeMyTrip, Ltd.(1) | | 1,000 | 30,700 |
| Maruti Suzuki India, Ltd. | | 1,400 | 151,260 |
| Mindtree, Ltd. | | 700 | 26,828 |
| Mphasis, Ltd. | | 1,000 | 25,363 |
| Nestle India, Ltd. | | 500 | 117,176 |
| One 97 Communications, Ltd.(1) | | 2,000 | 15,589 |
| Patanjali Foods, Ltd. | | 1,500 | 25,275 |
| SBI Cards & Payment Services, Ltd. | | 2,100 | 23,427 |
| SBI Life Insurance Co., Ltd.(2) | | 3,400 | 51,943 |
| Shriram Transport Finance Co., Ltd. | | 1,800 | 26,199 |
| SRF, Ltd. | | 1,200 | 36,703 |
| State Bank of India | | 15,900 | 103,154 |
| Steel Authority of India, Ltd. | | 30,200 | 28,277 |
| Tata Chemicals, Ltd. | | 2,200 | 29,556 |
| Tata Consultancy Services, Ltd. | | 7,600 | 278,800 |
| Tata Elxsi, Ltd. | | 500 | 52,219 |
| Tata Motors, Ltd.(1) | | 19,300 | 95,122 |
| Tata Steel, Ltd. | | 96,000 | 116,249 |
| Tata Teleservices Maharashtra, Ltd.(1) | | 8,400 | 10,684 |
| Tech Mahindra, Ltd. | | 8,000 | 98,523 |
| Titan Co., Ltd. | | 3,600 | 114,407 |
| Trent, Ltd. | | 1,500 | 26,002 |
| TVS Motor Co., Ltd. | | 2,000 | 25,260 |
| UPL, Ltd. | | 5,700 | 46,837 |
| Vodafone Idea, Ltd.(1) | | 134,800 | 14,543 |
| Voltas, Ltd. | | 3,600 | 39,970 |
| Wipro, Ltd. | | 19,800 | 95,117 |
| WNS Holdings, Ltd. ADR(1) | | 600 | 49,104 |
| Yes Bank, Ltd.(1) | | 117,600 | 22,561 |
| Zee Entertainment Enterprises, Ltd. | | 13,900 | 43,927 |
| Zomato, Ltd.(1) | | 36,500 | 27,576 |
| | | | $ 6,163,716 |
| Indonesia — 10.2% | |
| Allo Bank Indonesia Tbk PT(1) | | 62,100 | $ 8,560 |
| Bank Central Asia Tbk PT | | 3,365,600 | 1,878,810 |
| Bank Jago Tbk PT(1) | | 294,000 | 126,769 |
10
See Notes to Financial Statements.
Calvert
Emerging Markets Advancement Fund
September 30, 2022
Schedule of Investments — continued
| Security | Shares | Value |
| Indonesia (continued) | |
| Bank Mandiri Persero Tbk PT | | 1,170,200 | $ 718,550 |
| Bank Negara Indonesia Persero Tbk PT | | 473,500 | 276,949 |
| Bank Rakyat Indonesia Persero Tbk PT | | 4,368,943 | 1,278,670 |
| Berkah Beton Sadaya Tbk PT | | 69,400 | 18,443 |
| Dayamitra Telekomunikasi PT | | 461,300 | 21,909 |
| Elang Mahkota Teknologi Tbk PT | | 710,800 | 70,532 |
| Indah Kiat Pulp & Paper Tbk PT | | 191,900 | 113,379 |
| Indofood CBP Sukses Makmur Tbk PT | | 411,900 | 233,865 |
| Kalbe Farma Tbk PT | | 1,552,200 | 186,176 |
| Merdeka Copper Gold Tbk PT(1) | | 2,346,600 | 604,025 |
| Mitra Keluarga Karyasehat Tbk PT | | 101,100 | 19,234 |
| Perusahaan Gas Negara Tbk PT | | 195,200 | 22,356 |
| Sarana Menara Nusantara Tbk PT | | 1,930,200 | 156,042 |
| Sumber Alfaria Trijaya Tbk PT | | 851,000 | 133,551 |
| Telkom Indonesia Persero Tbk PT | | 3,682,300 | 1,073,191 |
| Tower Bersama Infrastructure Tbk PT | | 665,600 | 123,326 |
| Transcoal Pacific Tbk PT | | 19,200 | 11,467 |
| Unilever Indonesia Tbk PT | | 1,063,400 | 336,365 |
| Vale Indonesia Tbk PT(1) | | 97,600 | 40,685 |
| | | | $ 7,452,854 |
| South Korea — 15.1% | |
| AMOREPACIFIC Corp. | | 930 | $ 65,574 |
| AMOREPACIFIC Group | | 762 | 14,159 |
| Cheil Worldwide, Inc. | | 2,000 | 31,527 |
| CJ CheilJedang Corp. | | 470 | 134,090 |
| Coway Co., Ltd. | | 1,541 | 57,628 |
| DB HiTek Co., Ltd. | | 800 | 20,542 |
| Doosan Enerbility Co., Ltd.(1) | | 13,868 | 136,227 |
| Ecopro BM Co., Ltd. | | 52 | 3,146 |
| Hana Financial Group, Inc. | | 8,782 | 215,642 |
| Hanjin Kal Corp.(1) | | 519 | 13,461 |
| Hanmi Pharm Co., Ltd. | | 345 | 54,776 |
| Hanmi Science Co., Ltd. | | 1,571 | 34,329 |
| Hanon Systems | | 4,247 | 24,474 |
| Hansol Chemical Co., Ltd. | | 361 | 42,198 |
| HLB, Inc.(1) | | 3,552 | 105,083 |
| HMM Co., Ltd. | | 9,728 | 124,208 |
| Hotel Shilla Co., Ltd. | | 887 | 44,116 |
| HYBE Co., Ltd.(1) | | 594 | 55,203 |
| Hyundai Engineering & Construction Co., Ltd. | | 2,532 | 65,669 |
| Hyundai Engineering & Construction Co., Ltd., PFC Shares | | 15 | 623 |
| Hyundai Glovis Co., Ltd. | | 531 | 59,763 |
| Hyundai Marine & Fire Insurance Co., Ltd. | | 1,400 | 28,503 |
| Hyundai Mobis Co., Ltd. | | 1,710 | 225,726 |
| Hyundai Motor Co. | | 3,963 | 483,639 |
| Industrial Bank of Korea | | 7,644 | 50,550 |
| Security | Shares | Value |
| South Korea (continued) | |
| Kakao Corp. | | 7,861 | $ 309,326 |
| Kakao Games Corp.(1) | | 1,157 | 33,949 |
| Kakaopay Corp.(1) | | 451 | 15,245 |
| KB Financial Group, Inc. | | 11,152 | 336,774 |
| Kia Corp. | | 7,012 | 349,001 |
| Korea Investment Holdings Co., Ltd. | | 1,386 | 45,541 |
| Krafton, Inc.(1) | | 713 | 103,365 |
| KT Corp. | | 3,426 | 86,121 |
| L&F Co., Ltd.(1) | | 650 | 79,042 |
| LG Chem, Ltd. | | 1,360 | 502,160 |
| LG Display Co., Ltd. | | 5,999 | 49,716 |
| LG Electronics, Inc. | | 3,144 | 170,611 |
| LG Household & Health Care, Ltd. | | 251 | 110,018 |
| LG Innotek Co., Ltd. | | 375 | 70,682 |
| Lotte Chemical Corp. | | 625 | 62,291 |
| Meritz Financial Group, Inc. | | 1,088 | 15,695 |
| Mirae Asset Securities Co., Ltd. | | 8,724 | 36,114 |
| NAVER Corp. | | 3,551 | 473,051 |
| Netmarble Corp.(2) | | 576 | 20,421 |
| NH Investment & Securities Co., Ltd. | | 3,800 | 23,720 |
| Orion Corp. of Republic of Korea | | 1,210 | 86,532 |
| Samsung C&T Corp. | | 2,869 | 205,586 |
| Samsung Electro-Mechanics Co., Ltd. | | 1,494 | 115,269 |
| Samsung Electronics Co., Ltd. | | 104,057 | 3,820,894 |
| Samsung Heavy Industries Co., Ltd.(1) | | 24,576 | 90,547 |
| Samsung SDS Co., Ltd. | | 977 | 77,807 |
| Samsung Securities Co., Ltd. | | 1,918 | 40,830 |
| SD Biosensor, Inc. | | 1,600 | 29,495 |
| Shinhan Financial Group Co., Ltd. | | 12,621 | 293,175 |
| SK Biopharmaceuticals Co., Ltd.(1) | | 1,537 | 60,555 |
| SK Bioscience Co., Ltd.(1) | | 1,443 | 79,877 |
| SK Hynix, Inc. | | 12,404 | 709,511 |
| SK IE Technology Co., Ltd.(1)(2) | | 871 | 31,463 |
| SK Square Co., Ltd.(1) | | 2,909 | 72,590 |
| SK Telecom Co., Ltd. | | 1,625 | 57,368 |
| Woori Financial Group, Inc. | | 16,990 | 126,086 |
| Yuhan Corp. | | 3,176 | 119,773 |
| | | | $11,001,057 |
| Taiwan — 10.5% | |
| Accton Technology Corp. | | 6,000 | $ 51,177 |
| Acer, Inc. | | 26,000 | 17,901 |
| Advantech Co., Ltd. | | 5,299 | 48,812 |
| Airtac International Group | | 4,139 | 94,697 |
| ASE Technology Holding Co., Ltd. | | 40,000 | 99,444 |
| ASPEED Technology, Inc. | | 1,100 | 60,541 |
| AU Optronics Corp. | | 92,000 | 42,103 |
11
See Notes to Financial Statements.
Calvert
Emerging Markets Advancement Fund
September 30, 2022
Schedule of Investments — continued
| Security | Shares | Value |
| Taiwan (continued) | |
| Catcher Technology Co., Ltd. | | 17,000 | $ 92,057 |
| Cathay Financial Holding Co., Ltd. | | 92,000 | 115,307 |
| Chailease Holding Co., Ltd. | | 15,823 | 90,383 |
| Chang Hwa Commercial Bank, Ltd. | | 40,314 | 21,717 |
| China Development Financial Holding Corp. | | 182,406 | 68,594 |
| China Development Financial Holding Corp., PFC Shares | | 14,970 | 3,861 |
| China Steel Corp. | | 187,000 | 156,767 |
| Chroma ATE, Inc. | | 9,000 | 50,637 |
| Chunghwa Telecom Co., Ltd. | | 45,000 | 161,061 |
| Compal Electronics, Inc. | | 46,000 | 31,367 |
| CTBC Financial Holding Co., Ltd. | | 245,000 | 152,415 |
| Delta Electronics, Inc. | | 24,000 | 190,635 |
| E.Sun Financial Holding Co., Ltd. | | 99,052 | 80,146 |
| Eclat Textile Co., Ltd. | | 2,000 | 24,556 |
| Eva Airways Corp. | | 27,000 | 23,870 |
| Evergreen Marine Corp. Taiwan, Ltd. | | 12,400 | 56,537 |
| Far Eastern New Century Corp. | | 25,000 | 25,382 |
| Far EasTone Telecommunications Co., Ltd. | | 19,000 | 43,231 |
| Feng TAY Enterprise Co., Ltd. | | 4,000 | 19,785 |
| First Financial Holding Co., Ltd. | | 131,458 | 107,316 |
| Fubon Financial Holding Co., Ltd. | | 88,680 | 138,679 |
| Fubon Financial Holding Co., Ltd., PFC Shares | | 1,252 | 2,248 |
| Giant Manufacturing Co., Ltd. | | 3,000 | 19,314 |
| Globalwafers Co., Ltd. | | 2,000 | 22,813 |
| Hiwin Technologies Corp. | | 6,401 | 35,444 |
| Hotai Motor Co., Ltd. | | 4,000 | 71,706 |
| Hua Nan Financial Holdings Co., Ltd. | | 112,310 | 78,354 |
| Innolux Corp. | | 111,000 | 36,157 |
| Inventec Corp. | | 30,000 | 21,566 |
| Largan Precision Co., Ltd. | | 1,000 | 52,421 |
| Lite-On Technology Corp. | | 24,000 | 48,136 |
| Macronix International Co., Ltd. | | 17,000 | 16,577 |
| MediaTek, Inc. | | 17,000 | 293,359 |
| Mega Financial Holding Co., Ltd. | | 135,300 | 132,376 |
| Merida Industry Co., Ltd. | | 2,000 | 11,306 |
| Micro-Star International Co., Ltd. | | 9,000 | 30,295 |
| momo.com, Inc. | | 1,200 | 20,026 |
| Nan Ya Printed Circuit Board Corp. | | 2,000 | 11,756 |
| Nanya Technology Corp. | | 13,000 | 19,922 |
| Nien Made Enterprise Co., Ltd. | | 1,000 | 7,894 |
| Novatek Microelectronics Corp. | | 7,000 | 47,909 |
| Oneness Biotech Co., Ltd.(1) | | 4,000 | 31,679 |
| Pou Chen Corp. | | 19,000 | 16,984 |
| Powertech Technology, Inc. | | 6,000 | 14,538 |
| President Chain Store Corp. | | 6,000 | 53,237 |
| Quanta Computer, Inc. | | 30,000 | 72,620 |
| Realtek Semiconductor Corp. | | 5,000 | 42,210 |
| Security | Shares | Value |
| Taiwan (continued) | |
| Ruentex Development Co., Ltd. | | 11,200 | $ 18,003 |
| Shanghai Commercial & Savings Bank, Ltd. (The) | | 49,000 | 75,645 |
| Shin Kong Financial Holding Co., Ltd. | | 131,011 | 33,721 |
| Sino-American Silicon Products, Inc. | | 5,000 | 20,425 |
| SinoPac Financial Holdings Co., Ltd. | | 155,540 | 84,395 |
| Synnex Technology International Corp. | | 15,000 | 24,848 |
| Ta Chen Stainless Pipe Co., Ltd. | | 34,826 | 41,196 |
| Taishin Financial Holding Co., Ltd. | | 157,458 | 67,691 |
| Taiwan Cooperative Financial Holding Co., Ltd. | | 122,518 | 100,873 |
| Taiwan High Speed Rail Corp. | | 22,000 | 19,704 |
| Taiwan Mobile Co., Ltd. | | 19,000 | 57,184 |
| Taiwan Semiconductor Manufacturing Co., Ltd. | | 229,000 | 3,035,485 |
| Unimicron Technology Corp. | | 15,000 | 54,911 |
| Uni-President Enterprises Corp. | | 51,000 | 107,854 |
| United Microelectronics Corp. | | 158,000 | 176,817 |
| Vanguard International Semiconductor Corp. | | 10,000 | 20,259 |
| Voltronic Power Technology Corp. | | 2,050 | 90,160 |
| Walsin Lihwa Corp. | | 65,266 | 82,433 |
| Wan Hai Lines, Ltd. | | 17,365 | 36,224 |
| Win Semiconductors Corp. | | 4,000 | 15,370 |
| Winbond Electronics Corp. | | 32,000 | 19,759 |
| Wiwynn Corp. | | 1,000 | 25,270 |
| WPG Holdings, Ltd. | | 21,000 | 30,670 |
| Yageo Corp. | | 4,000 | 33,764 |
| Yang Ming Marine Transport Corp. | | 22,000 | 42,267 |
| Yuanta Financial Holding Co., Ltd. | | 103,412 | 63,419 |
| | | | $ 7,658,172 |
| United Arab Emirates — 12.0% | |
| Abu Dhabi Commercial Bank PJSC | | 297,515 | $ 729,759 |
| Aldar Properties PJSC | | 606,462 | 692,311 |
| Alpha Dhabi Holding PJSC(1) | | 50,500 | 336,462 |
| Dubai Financial Market PJSC | | 61,300 | 24,684 |
| Dubai Investments PJSC | | 87,900 | 55,515 |
| Dubai Islamic Bank PJSC | | 220,675 | 358,009 |
| Emirates Integrated Telecommunications Co. PJSC | | 82,803 | 132,594 |
| Emirates Telecommunications Group Co. PJSC | | 180,055 | 1,144,430 |
| Fertiglobe PLC | | 34,200 | 53,152 |
| First Abu Dhabi Bank PJSC | | 415,589 | 2,015,800 |
| International Holdings Co. PJSC(1) | | 32,319 | 3,133,253 |
| Q Holding PJSC(1) | | 55,600 | 63,330 |
| | | | $ 8,739,299 |
Total Common Stocks
(identified cost $70,526,530) | | | $65,170,438 |
12
See Notes to Financial Statements.
Calvert
Emerging Markets Advancement Fund
September 30, 2022
Schedule of Investments — continued
| Security | Shares | Value |
| Brazil — 0.0%(3) | |
| Localiza Rent a Car S.A., Exp. 10/31/22(1) | | 108 | $ 220 |
Total Rights
(identified cost $0) | | | $ 220 |
| Short-Term Investments — 4.4% |
| Affiliated Fund — 4.2% |
| Security | Shares | Value |
| Morgan Stanley Institutional Liquidity Funds - Government Portfolio, Institutional Class, 2.80%(5) | | 3,013,623 | $ 3,013,623 |
Total Affiliated Fund
(identified cost $3,013,623) | | | $ 3,013,623 |
| Securities Lending Collateral — 0.2% |
| Security | Shares | Value |
| State Street Navigator Securities Lending Government Money Market Portfolio, 3.07%(6) | | 158,986 | $ 158,986 |
Total Securities Lending Collateral
(identified cost $158,986) | | | $ 158,986 |
Total Short-Term Investments
(identified cost $3,172,609) | | | $ 3,172,609 |
| | | |
Total Investments — 93.6%
(identified cost $73,699,139) | | $68,343,267 |
| Other Assets, Less Liabilities — 6.4% | | $ 4,705,126 |
| Net Assets — 100.0% | | $73,048,393 |
| The percentage shown for each investment category in the Schedule of Investments is based on net assets. |
| (1) | Non-income producing security. |
| (2) | Security exempt from registration under Rule 144A of the Securities Act of 1933, as amended. These securities may be sold in certain transactions in reliance on an exemption from registration (normally to qualified institutional buyers). At September 30, 2022, the aggregate value of these securities is $3,135,137 or 4.3% of the Fund's net assets. |
| (3) | Amount is less than 0.05%. |
| (4) | All or a portion of this security was on loan at September 30, 2022. The aggregate market value of securities on loan at September 30, 2022 was $882,939. |
| (5) | May be deemed to be an affiliated investment company. The rate shown is the annualized seven-day yield as of September 30, 2022. |
| (6) | Represents investment of cash collateral received in connection with securities lending. |
At September 30, 2022, the concentration of the Fund’s investments in the various sectors, determined as a percentage of net assets, was as follows:
| Economic Sectors | % of Net Assets |
| Financials | 26.4% |
| Information Technology | 15.8 |
| Communication Services | 13.5 |
| Consumer Discretionary | 9.1 |
| Industrials | 8.6 |
| Consumer Staples | 4.3 |
| Materials | 3.6 |
| Health Care | 3.4 |
| Utilities | 2.4 |
| Real Estate | 2.1 |
| Total | 89.2% |
13
See Notes to Financial Statements.
Calvert
Emerging Markets Advancement Fund
September 30, 2022
Schedule of Investments — continued
Forward Foreign Currency Exchange Contracts
| Currency Purchased | Currency Sold | Counterparty | Settlement
Date | Unrealized
Appreciation | Unrealized
(Depreciation) |
| USD | 5,845,440 | EUR | 5,863,506 | Standard Chartered Bank | 10/7/22 | $ 97,740 | $ — |
| CNH | 143,330,000 | USD | 21,249,342 | Standard Chartered Bank | 11/25/22 | — | (1,159,228) |
| USD | 19,152,866 | CNH | 129,830,000 | Standard Chartered Bank | 11/25/22 | 955,004 | — |
| USD | 2,016,156 | CNH | 13,500,000 | Standard Chartered Bank | 11/25/22 | 123,904 | — |
| USD | 653,399 | AED | 2,400,000 | Standard Chartered Bank | 4/19/23 | — | (87) |
| USD | 290,239 | AED | 1,067,092 | Standard Chartered Bank | 4/19/23 | — | (316) |
| USD | 1,329,859 | AED | 4,888,826 | Standard Chartered Bank | 4/19/23 | — | (1,300) |
| USD | 23,833,436 | CNH | 160,135,000 | Goldman Sachs International | 6/16/23 | 1,225,876 | — |
| | | | | | | $2,402,524 | $(1,160,931) |
| Abbreviations: |
| ADR | – American Depositary Receipt |
| BDR | – Brazilian Depositary Receipt |
| PFC Shares | – Preference Shares |
| Currency Abbreviations: |
| AED | – United Arab Emirates Dirham |
| CNH | – Yuan Renminbi Offshore |
| EUR | – Euro |
| USD | – United States Dollar |
14
See Notes to Financial Statements.
Calvert
Emerging Markets Advancement Fund
September 30, 2022
Statement of Assets and Liabilities
| | September 30, 2022 |
| Assets | |
Investments in securities of unaffiliated issuers, at value (identified cost $70,685,516) - including
$882,939 of securities on loan | $ 65,329,644 |
| Investments in securities of affiliated issuers, at value (identified cost $3,013,623) | 3,013,623 |
| Receivable for open forward foreign currency exchange contracts | 2,402,524 |
| Deposits for derivatives collateral - forward foreign currency exchange contracts | 1,180,000 |
| Cash denominated in foreign currency, at value (cost $461,395) | 446,254 |
| Receivable for investments sold | 3,253,602 |
| Receivable for capital shares sold | 98,656 |
| Dividends receivable | 87,584 |
| Dividends receivable - affiliated | 5,940 |
| Securities lending income receivable | 939 |
| Receivable from affiliate | 83,808 |
| Directors' deferred compensation plan | 730 |
| Other assets | 5,372 |
| Total assets | $75,908,676 |
| Liabilities | |
| Cash collateral due to broker | $ 1,180,000 |
| Payable for open forward foreign currency exchange contracts | 1,160,931 |
| Due to custodian | 204,220 |
| Payable for capital shares redeemed | 9,237 |
| Payable for foreign capital gains taxes | 31,987 |
| Deposits for securities loaned | 158,986 |
| Payable to affiliates: | |
| Investment advisory fee | 39,837 |
| Administrative fee | 7,666 |
| Distribution and service fees | 275 |
| Sub-transfer agency fee | 275 |
| Directors' deferred compensation plan | 730 |
| Accrued expenses | 66,139 |
| Total liabilities | $ 2,860,283 |
| Net Assets | $73,048,393 |
| Sources of Net Assets | |
| Paid-in capital | $ 81,320,963 |
| Accumulated loss | (8,272,570) |
| Net Assets | $73,048,393 |
| Class A Shares | |
| Net Assets | $ 1,269,545 |
| Shares Outstanding | 129,658 |
Net Asset Value and Redemption Price Per Share
(net assets ÷ shares of beneficial interest outstanding) | $ 9.79 |
Maximum Offering Price Per Share
(100 ÷ 94.75 of net asset value per share) | $ 10.33 |
15
See Notes to Financial Statements.
Calvert
Emerging Markets Advancement Fund
September 30, 2022
Statement of Assets and Liabilities — continued
| | September 30, 2022 |
| Class I Shares | |
| Net Assets | $ 71,778,848 |
| Shares Outstanding | 7,286,711 |
Net Asset Value, Offering Price and Redemption Price Per Share
(net assets ÷ shares of beneficial interest outstanding) | $ 9.85 |
| On sales of $50,000 or more, the offering price of Class A shares is reduced. |
16
See Notes to Financial Statements.
Calvert
Emerging Markets Advancement Fund
September 30, 2022
| | Year Ended |
| | September 30, 2022 |
| Investment Income | |
| Dividend income (net of foreign taxes withheld of $203,391) | $ 1,786,914 |
| Dividend income - affiliated issuers | 21,015 |
| Securities lending income, net | 7,608 |
| Total investment income | $ 1,815,537 |
| Expenses | |
| Investment advisory fee | $ 442,178 |
| Administrative fee | 84,224 |
| Distribution and service fees: | |
| Class A | 2,360 |
| Directors' fees and expenses | 3,335 |
| Custodian fees | 81,235 |
| Transfer agency fees and expenses | 12,166 |
| Accounting fees | 34,374 |
| Professional fees | 45,384 |
| Registration fees | 43,785 |
| Reports to shareholders | 2,550 |
| Miscellaneous | 33,127 |
| Total expenses | $ 784,718 |
| Waiver and/or reimbursement of expenses by affiliate | $ (101,783) |
| Net expenses | $ 682,935 |
| Net investment income | $ 1,132,602 |
| Realized and Unrealized Gain (Loss) | |
| Net realized gain (loss): | |
| Investment securities (net of foreign capital gains taxes of $3,227) | $ (5,403,775) |
| Investment securities - affiliated issuers | (89) |
| Futures contracts | (684,348) |
| Foreign currency transactions | 32,849 |
| Forward foreign currency exchange contracts | 1,181,506 |
| Payment by affiliate for loss on investment in violation of restrictions | 58,702 |
| Net realized loss | $ (4,815,155) |
| Change in unrealized appreciation (depreciation): | |
| Investment securities (including net increase in payable for foreign capital gains taxes of $31,987) | $ (12,361,774) |
| Investment securities - affiliated issuers | (640) |
| Futures contracts | 65,147 |
| Foreign currency | (22,836) |
| Forward foreign currency exchange contracts | 1,238,567 |
| Net change in unrealized appreciation (depreciation) | $(11,081,536) |
| Net realized and unrealized loss | $(15,896,691) |
| Net decrease in net assets from operations | $(14,764,089) |
17
See Notes to Financial Statements.
Calvert
Emerging Markets Advancement Fund
September 30, 2022
Statements of Changes in Net Assets
| | Year Ended September 30, |
| | 2022 | 2021 |
| Increase (Decrease) in Net Assets | | |
| From operations: | | |
| Net investment income | $ 1,132,602 | $ 353,436 |
| Net realized gain (loss) | (4,815,155) | 3,653,390 |
| Net change in unrealized appreciation (depreciation) | (11,081,536) | 2,931,529 |
| Net increase (decrease) in net assets from operations | $(14,764,089) | $ 6,938,355 |
| Distributions to shareholders: | | |
| Class A | $ (24,218) | $ (101) |
| Class I | (2,583,124) | (63,570) |
| Total distributions to shareholders | $ (2,607,342) | $ (63,671) |
| Capital share transactions: | | |
| Class A | $ 1,061,137 | $ 380,062 |
| Class I | 31,109,271 | 9,111,866 |
| Net increase in net assets from capital share transactions | $ 32,170,408 | $ 9,491,928 |
| Net increase in net assets | $ 14,798,977 | $16,366,612 |
| Net Assets | | |
| At beginning of year | $ 58,249,416 | $ 41,882,804 |
| At end of year | $ 73,048,393 | $58,249,416 |
18
See Notes to Financial Statements.
Calvert
Emerging Markets Advancement Fund
September 30, 2022
| | Class A |
| | Year Ended September 30, |
| | 2022 | 2021 | 2020 (1) |
| Net asset value — Beginning of period | $ 12.39 | $ 10.64 | $ 10.00 |
| Income (Loss) From Operations | | | |
| Net investment income(2) | $ 0.17 | $ 0.09 | $ 0.10 |
| Net realized and unrealized gain (loss) | (2.23) | 1.67 | 0.59 |
| Total income (loss) from operations | $ (2.06) | $ 1.76 | $ 0.69 |
| Less Distributions | | | |
| From net investment income | $ (0.06) | $ (0.01) | $ — |
| From net realized gain | (0.48) | — | (0.05) |
| Total distributions | $ (0.54) | $ (0.01) | $ (0.05) |
| Net asset value — End of period | $ 9.79 | $12.39 | $10.64 |
| Total Return(3) | (17.42)% | 16.54% | 6.94% |
| Ratios/Supplemental Data | | | |
| Net assets, end of period (000’s omitted) | $ 1,270 | $ 477 | $ 91 |
| Ratios (as a percentage of average daily net assets):(4) | | | |
| Total expenses | 1.36% (5) | 1.41% | 1.83% |
| Net expenses | 1.22% (5)(6) | 1.20% | 1.20% |
| Net investment income | 1.53% | 0.68% | 0.99% |
| Portfolio Turnover | 45% | 64% | 66% |
| (1) | The Fund commenced operations on October 1, 2019. |
| (2) | Computed using average shares outstanding. |
| (3) | Returns are historical and are calculated by determining the percentage change in net asset value with all distributions reinvested and do not reflect the effect of sales charges, if any. |
| (4) | Total expenses do not reflect amounts reimbursed and/or waived by the adviser and certain of its affiliates, if applicable. Net expenses are net of all reductions and represent the net expenses paid by the Fund. |
| (5) | Includes interest expense from bank overdrafts of 0.02%. |
| (6) | Includes a reduction by the investment adviser of a portion of its advisory fee due to the Fund’s investment in the Liquidity Fund (equal to less than 0.005% of average daily net assets for the year ended September 30, 2022). |
19
See Notes to Financial Statements.
Calvert
Emerging Markets Advancement Fund
September 30, 2022
Financial Highlights — continued
| | Class I |
| | Year Ended September 30, |
| | 2022 | 2021 | 2020 (1) |
| Net asset value — Beginning of period | $ 12.44 | $ 10.66 | $ 10.00 |
| Income (Loss) From Operations | | | |
| Net investment income(2) | $ 0.19 | $ 0.09 | $ 0.12 |
| Net realized and unrealized gain (loss) | (2.23) | 1.71 | 0.59 |
| Total income (loss) from operations | $ (2.04) | $ 1.80 | $ 0.71 |
| Less Distributions | | | |
| From net investment income | $ (0.07) | $ (0.02) | $ — |
| From net realized gain | (0.48) | — | (0.05) |
| Total distributions | $ (0.55) | $ (0.02) | $ (0.05) |
| Net asset value — End of period | $ 9.85 | $ 12.44 | $ 10.66 |
| Total Return(3) | (17.20)% | 16.85% | 7.14% |
| Ratios/Supplemental Data | | | |
| Net assets, end of period (000’s omitted) | $71,779 | $57,772 | $41,792 |
| Ratios (as a percentage of average daily net assets):(4) | | | |
| Total expenses | 1.11% (5) | 1.16% | 1.58% |
| Net expenses | 0.97% (5)(6) | 0.95% | 0.95% |
| Net investment income | 1.61% | 0.71% | 1.15% |
| Portfolio Turnover | 45% | 64% | 66% |
| (1) | The Fund commenced operations on October 1, 2019. |
| (2) | Computed using average shares outstanding. |
| (3) | Returns are historical and are calculated by determining the percentage change in net asset value with all distributions reinvested and do not reflect the effect of sales charges, if any. |
| (4) | Total expenses do not reflect amounts reimbursed and/or waived by the adviser and certain of its affiliates, if applicable. Net expenses are net of all reductions and represent the net expenses paid by the Fund. |
| (5) | Includes interest expense from bank overdrafts of 0.02%. |
| (6) | Includes a reduction by the investment adviser of a portion of its advisory fee due to the Fund’s investment in the Liquidity Fund (equal to less than 0.005% of average daily net assets for the year ended September 30, 2022). |
20
See Notes to Financial Statements.
Calvert
Emerging Markets Advancement Fund
September 30, 2022
Notes to Financial Statements
1 Significant Accounting Policies
Calvert Emerging Markets Advancement Fund (the Fund) is a diversified series of Calvert World Values Fund, Inc. (the Corporation). The Corporation is a Maryland corporation registered under the Investment Company Act of 1940, as amended (the 1940 Act), as an open-end management investment company. The investment objective of the Fund is total return.
The Fund offers two classes of shares. Class A shares are generally sold subject to a sales charge imposed at time of purchase. A contingent deferred sales charge of 1.00% (0.80% prior to April 29, 2022) may apply to certain redemptions of Class A shares for accounts for which no sales charge was paid, if redeemed within 12 months of purchase. Class I shares are sold at net asset value, are not subject to a sales charge and are sold only to certain eligible investors. Each class represents a pro rata interest in the Fund, but votes separately on class-specific matters and is subject to different expenses.
The Fund applies the accounting and reporting guidance in the Financial Accounting Standards Board (FASB) Accounting Standards Codification Topic 946, Financial Services – Investment Companies (ASC 946). Subsequent events, if any, through the date that the financial statements were issued have been evaluated in the preparation of the financial statements.
A Investment Valuation— Net asset value per share is determined every business day as of the close of the regular session of the New York Stock Exchange (generally 4:00 p.m. Eastern time). The Fund uses independent pricing services approved by the Board of Directors (the Board) to value its investments wherever possible. Investments for which market quotations are not available or deemed not reliable are fair valued in good faith under the direction of the Board.
U.S. generally accepted accounting principles (U.S. GAAP) establishes a disclosure hierarchy that categorizes the inputs to valuation techniques used to value assets and liabilities at measurement date. These inputs are summarized in the three broad levels listed below:
Level 1 - quoted prices in active markets for identical securities
Level 2 - other significant observable inputs (including quoted prices for similar securities, interest rates, prepayment speeds, credit risk, etc.)
Level 3 - significant unobservable inputs (including the Fund’s own assumptions in determining the fair value of investments)
The inputs or methodologies used for valuing securities are not necessarily an indication of the risk associated with investing in those securities.
Valuation techniques used to value the Fund’s investments by major category are as follows:
Equity Securities. Equity securities (including warrants and rights) listed on a U.S. securities exchange generally are valued at the last sale or closing price as reported by an independent pricing service on the primary market or exchange on which they are traded and are categorized as Level 1 in the hierarchy. Equity securities listed on the NASDAQ National Market System are valued at the NASDAQ official closing price and are categorized as Level 1 in the hierarchy. Unlisted or listed securities for which closing sales prices or closing quotations are not available are valued at the mean between the latest available bid and ask prices and are categorized as Level 2 in the hierarchy. The daily valuation of exchange-traded foreign securities generally is determined as of the close of trading on the principal exchange on which such securities trade. Events occurring after the close of trading on foreign exchanges may result in adjustments to the valuation of foreign securities to more accurately reflect their fair value as of the close of regular trading on the New York Stock Exchange. When valuing foreign equity securities that meet certain criteria, the Fund's Board has approved the use of a fair value service that values such securities to reflect market trading that occurs after the close of the applicable foreign markets of comparable securities or other instruments that have a strong correlation to the fair-valued securities. Such securities are categorized as Level 2 in the hierarchy.
Other Securities. Investments in management investment companies (including money market funds) that do not trade on an exchange are valued at the net asset value as of the close of each business day and are categorized as Level 1 in the hierarchy.
Derivatives. Futures contracts are valued at unrealized appreciation (depreciation) based on the settlement price established each day by the board of trade or exchange on which they are traded and are categorized as Level 1 or Level 2 in the hierarchy. Forward foreign currency exchange contracts are generally valued at the mean of the average bid and average ask prices that are reported by currency dealers to a third party pricing service at the valuation time. Such third party pricing service valuations are supplied for specific settlement periods and the Fund's forward foreign currency exchange contracts are valued at an interpolated rate between the closest preceding and subsequent settlement period reported by the third party pricing service and are categorized as Level 2 in the hierarchy.
Fair Valuation. In connection with Rule 2a-5 of the 1940 Act, which became effective September 8, 2022, the Board has designated the Fund’s investment adviser as its valuation designee. Investments for which valuations or market quotations are not readily available or are deemed unreliable are valued by the investment adviser, as valuation designee, at fair value using methods that most fairly reflect the security’s “fair value”, which is the amount that the Fund might reasonably expect to receive for the security upon its current sale in the ordinary course. Each such determination is based on a consideration of relevant factors, which are likely to vary from one pricing context to another. These factors may include, but are not limited to, the type of security, the existence of any contractual restrictions on the security’s disposition, the price and extent of public trading in similar securities of the issuer or of comparable companies or entities, quotations or relevant information obtained from broker/dealers or other market participants, information obtained from the issuer, analysts, and/or the appropriate stock exchange (for exchange-traded securities), an analysis of the company’s or entity’s financial statements, and an evaluation of the forces that influence the issuer and the market(s) in which the security is purchased and sold.
Calvert
Emerging Markets Advancement Fund
September 30, 2022
Notes to Financial Statements — continued
The values assigned to fair value investments are based on available information and do not necessarily represent amounts that might ultimately be realized. Further, due to the inherent uncertainty of valuations of such investments, the fair values may differ significantly from the values that would have been used had an active market existed, and the differences could be material.
The following table summarizes the market value of the Fund's holdings as of September 30, 2022, based on the inputs used to value them:
| Asset Description | Level 1 | Level 2 | Level 3 | Total |
| Common Stocks: | | | | |
| Brazil | $ 7,041,045 | $ — | $ — | $ 7,041,045 |
| Canada | 31,428 | — | — | 31,428 |
| China | 2,403,385 | 7,913,451 | — | 10,316,836 |
| Greece | 166,060 | 6,092,843 | — | 6,258,903 |
| Hong Kong | — | 507,128 | — | 507,128 |
| India | 79,804 | 6,083,912 | — | 6,163,716 |
| Indonesia | — | 7,452,854 | — | 7,452,854 |
| South Korea | — | 11,001,057 | — | 11,001,057 |
| Taiwan | — | 7,658,172 | — | 7,658,172 |
| United Arab Emirates | — | 8,739,299 | — | 8,739,299 |
| Total Common Stocks | $ 9,721,722 | $55,448,716 (1) | $ — | $65,170,438 |
| Rights | $ 220 | $ — | $ — | $ 220 |
| Short-Term Investments: | | | | |
| Affiliated Fund | 3,013,623 | — | — | 3,013,623 |
| Securities Lending Collateral | 158,986 | — | — | 158,986 |
| Total Investments | $12,894,551 | $55,448,716 | $ — | $68,343,267 |
| Forward Foreign Currency Exchange Contracts | $ — | $ 2,402,524 | $ — | $ 2,402,524 |
| Total | $12,894,551 | $57,851,240 | $ — | $70,745,791 |
| Liability Description | | | | |
| Forward Foreign Currency Exchange Contracts | $ — | $ (1,160,931) | $ — | $ (1,160,931) |
| Total | $ — | $ (1,160,931) | $ — | $ (1,160,931) |
| (1) | Includes foreign equity securities whose values were adjusted to reflect market trading of comparable securities or other correlated instruments that occurred after the close of trading in their applicable foreign markets. |
B Investment Transactions and Income— Investment transactions for financial statement purposes are accounted for on trade date. Realized gains and losses are recorded on an identified cost basis and may include proceeds from litigation. Dividend income is recorded on the ex-dividend date for dividends received in cash and/or securities or, in the case of dividends on certain foreign securities, as soon as the Fund is informed of the ex-dividend date. Non-cash dividends are recorded at the fair value of the securities received. Withholding taxes on foreign dividends, if any, have been provided for in accordance with the Fund's understanding of the applicable country’s tax rules and rates. Distributions received that represent a return of capital are recorded as a reduction of cost of investments. Distributions received that represent a capital gain are recorded as a realized gain.
C Share Class Accounting— Realized and unrealized gains and losses and net investment income and losses, other than class-specific expenses, are allocated daily to each class of shares based upon the relative net assets of each class to the total net assets of the Fund. Expenses arising in connection with a specific class are charged directly to that class.
D Foreign Currency Transactions— The Fund’s accounting records are maintained in U.S. dollars. For valuation of assets and liabilities on each date of net asset value determination, foreign denominations are converted into U.S. dollars using the current exchange rate. Security transactions, income and expenses are translated at the prevailing rate of exchange on the date of the event. Recognized gains or losses on investment transactions attributable to changes in foreign currency exchange rates are recorded for financial statement purposes as net realized gains and losses on investments. That portion of unrealized gains and losses on investments that results from fluctuations in foreign currency exchange rates is not separately disclosed.
Calvert
Emerging Markets Advancement Fund
September 30, 2022
Notes to Financial Statements — continued
E Futures Contracts— The Fund may enter into futures contracts to buy or sell a financial instrument for a set price at a future date. Initial margin deposits of either cash or securities as required by the broker are made upon entering into the contract. While the contract is open, daily variation margin payments are made to or received from the broker reflecting the daily change in market value of the contract and are recorded for financial reporting purposes as unrealized gains or losses by the Fund. When a futures contract is closed, a realized gain or loss is recorded equal to the difference between the opening and closing value of the contract. The risks associated with entering into futures contracts may include the possible illiquidity of the secondary market which would limit the Fund’s ability to close out a futures contract prior to the settlement date, an imperfect correlation between the value of the contracts and the underlying financial instruments, or that the counterparty will fail to perform its obligations under the contracts’ terms. Futures contracts are designed by boards of trade, which are designated “contracts markets” by the Commodities Futures Trading Commission. Futures contracts trade on the contracts markets in a manner that is similar to the way a stock trades on a stock exchange, and the boards of trade, through their clearing corporations, guarantee the futures contracts against default. As a result, there is minimal counterparty credit risk to the Fund.
F Forward Foreign Currency Exchange Contracts— The Fund may enter into forward foreign currency exchange contracts for the purchase or sale of a specific foreign currency at a fixed price on a future date. The forward foreign currency exchange contracts are adjusted by the daily exchange rate of the underlying currency and any gains or losses are recorded as unrealized until such time as the contracts have been closed. Risks may arise upon entering these contracts from the potential inability of counterparties to meet the terms of their contracts and from movements in the value of a foreign currency relative to the U.S. dollar.
G Distributions to Shareholders— Distributions to shareholders are recorded by the Fund on ex-dividend date. Distributions from net investment income and distributions from net realized capital gains, if any, are paid at least annually. Distributions are declared separately for each class of shares. Distributions are determined in accordance with income tax regulations, which may differ from U.S. GAAP; accordingly, periodic reclassifications are made within the Fund's capital accounts to reflect income and gains available for distribution under income tax regulations.
H Estimates— The preparation of financial statements in conformity with U.S. GAAP requires management to make estimates and assumptions that affect the reported amounts of assets and liabilities and disclosure of contingent assets and liabilities at the date of the financial statements and the reported amounts of increases and decreases in net assets from operations during the reporting period. Actual results could differ from those estimates.
I Indemnifications— The Corporation’s By-Laws provide for indemnification for Directors or officers of the Corporation and certain other parties, to the fullest extent permitted by Maryland law and the 1940 Act, provided certain conditions are met. Additionally, in the normal course of business, the Fund enters into agreements with service providers that may contain indemnification clauses. The Fund’s maximum exposure under these arrangements is unknown as this would involve future claims that may be made against the Fund that have not yet occurred.
J Federal Income Taxes— No provision for federal income or excise tax is required since the Fund intends to continue to qualify as a regulated investment company under the Internal Revenue Code and to distribute substantially all of its taxable earnings.
In addition to the requirements of the Internal Revenue Code, the Fund may also be subject to local taxes on the recognition of capital gains in certain countries. In determining the daily net asset value, the Fund estimates the accrual for such taxes, if any, based on the unrealized appreciation on certain portfolio securities and the related tax rates. Taxes attributable to unrealized appreciation are included in the change in unrealized appreciation (depreciation) on investments. Capital gains taxes on securities sold are included in net realized gain (loss) on investments.
Management has analyzed the Fund's tax positions taken for all open federal income tax years and has concluded that no provision for federal income tax is required in the Fund's financial statements. A Fund's federal tax return is subject to examination by the Internal Revenue Service for a period of three years from the date of filing.
2 Related Party Transactions
The investment advisory fee is earned by Calvert Research and Management (CRM), an indirect, wholly-owned subsidiary of Morgan Stanley, as compensation for investment advisory services rendered to the Fund. The investment advisory fee is computed at the annual rate of 0.63% of the Fund’s average daily net assets and is payable monthly. For the year ended September 30, 2022, the investment advisory fee amounted to $442,178.
Effective April 26, 2022, the Fund may invest in a money market fund, the Institutional Class of the Morgan Stanley Institutional Liquidity Funds - Government Portfolio (the “Liquidity Fund”), an open-end management investment company managed by Morgan Stanley Investment Management Inc., a wholly-owned subsidiary of Morgan Stanley. The investment advisory fee paid by the Fund is reduced by an amount equal to its pro-rata share of the advisory and administration fees paid by the Fund due to its investment in the Liquidity Fund. For the year ended September 30, 2022, the investment advisory fee paid was reduced by $1,938 relating to the Fund’s investment in the Liquidity Fund. Prior to April 26, 2022, the Fund may have invested its cash in Calvert Cash Reserves Fund, LLC (Cash Reserves Fund), an affiliated investment company managed by CRM. CRM did not receive a fee for advisory services provided to Cash Reserves Fund.
Calvert
Emerging Markets Advancement Fund
September 30, 2022
Notes to Financial Statements — continued
CRM has agreed to reimburse the Fund’s operating expenses to the extent that total annual operating expenses (relating to ordinary operating expenses only and excluding expenses such as brokerage commissions, acquired fund fees and expenses of unaffiliated funds, borrowing costs, taxes or litigation expenses) exceed 1.20% and 0.95% for Class A and Class I, respectively, of such class’s average daily net assets. The expense reimbursement agreement with CRM may be changed or terminated after January 31, 2023. For the year ended September 30, 2022, CRM waived or reimbursed expenses of $99,845.
The administrative fee is earned by CRM as compensation for administrative services rendered to the Fund. The fee is computed at an annual rate of 0.12% of the Fund’s average daily net assets attributable to Class A and Class I and is payable monthly. For the year ended September 30, 2022, CRM was paid administrative fees of $84,224.
The Fund has in effect a distribution plan for Class A shares (Class A Plan) pursuant to Rule 12b-1 under the 1940 Act. Pursuant to the Class A Plan, the Fund pays Eaton Vance Distributors, Inc. (EVD), an affiliate of CRM and the Fund’s principal underwriter, a distribution and service fee of 0.25% per annum of its average daily net assets attributable to Class A shares for distribution services and facilities provided to the Fund by EVD, as well as for personal services and/or the maintenance of shareholder accounts. Distribution and service fees paid or accrued for the year ended September 30, 2022 amounted to $2,360 for Class A shares.
The Fund was informed that EVD received $545 as its portion of the sales charge on sales of Class A shares and no contingent deferred sales charges paid by Fund shareholders for the year ended September 30, 2022.
Eaton Vance Management (EVM), an affiliate of CRM, provides sub-transfer agency and related services to the Fund pursuant to a Sub-Transfer Agency Support Services Agreement. For the year ended September 30, 2022, sub-transfer agency fees and expenses incurred to EVM amounted to $995 and are included in transfer agency fees and expenses on the Statement of Operations.
During the year ended September 30, 2022, CRM agreed to reimburse the Fund $58,702 for a loss from an investment which did not meet the Fund's investment guidelines. The reimbursement is included in Receivable from affiliate on the Statement of Assets and Liabilities. The impact of the reimbursement was less than $0.01 per share for each class and had no significant impact on total return.
Each Director of the Fund who is not an employee of CRM or its affiliates receives an annual fee of $214,000 ($154,000 prior to January 1, 2022), plus an annual Committee fee ranging from $8,500 to $16,500 depending on the Committee. The Board chair receives an additional $30,000 annual fee, Committee chairs receive an additional $6,000 annual fee and the special equities liaison receives an additional $2,500 annual fee. Eligible Directors may participate in a Deferred Compensation Plan (the Plan). Amounts deferred under the Plan are treated as though equal dollar amounts had been invested in shares of the Fund or other Calvert funds selected by the Directors. The Fund purchases shares of the funds selected equal to the dollar amounts deferred under the Plan, resulting in an asset equal to the deferred compensation liability. Obligations of the Plan are paid solely from the Fund's assets. Directors’ fees are allocated to each of the Calvert funds served. Salaries and fees of officers and Directors of the Fund who are employees of CRM or its affiliates are paid by CRM.
3 Investment Activity
During the year ended September 30, 2022, the cost of purchases and proceeds from sales of investments, other than short-term securities, were $60,420,010 and $29,116,066, respectively.
4 Distributions to Shareholders and Income Tax Information
The tax character of distributions declared for the years ended September 30, 2022 and September 30, 2021 was as follows:
| | Year Ended September 30, |
| | 2022 | 2021 |
| Ordinary income | $ 603,455 | $63,671 |
| Long-term capital gains | $2,003,887 | $ — |
During the year ended September 30, 2022, accumulated loss was increased by $146,215 and paid-in capital was increased by $146,215 due to the Fund's use of equalization accounting. Tax equalization accounting allows the Fund to treat as a distribution that portion of redemption proceeds representing a redeeming shareholder’s portion of undistributed taxable income and net capital gains. These reclassifications had no effect on the net assets or net asset value per share of the Fund.
Calvert
Emerging Markets Advancement Fund
September 30, 2022
Notes to Financial Statements — continued
As of September 30, 2022, the components of distributable earnings (accumulated loss) on a tax basis were as follows:
| Undistributed ordinary income | $ 3,480,754 |
| Deferred capital losses | (5,879,853) |
| Net unrealized depreciation | (5,873,471) |
| Accumulated loss | $(8,272,570) |
At September 30, 2022, the Fund, for federal income tax purposes, had deferred capital losses of $5,879,853 which would reduce the Fund's taxable income arising from future net realized gains on investment transactions, if any, to the extent permitted by the Internal Revenue Code, and thus would reduce the amount of distributions to shareholders, which would otherwise be necessary to relieve the Fund of any liability for federal income or excise tax. The deferred capital losses are treated as arising on the first day of the Fund's next taxable year, can be carried forward for an unlimited period, and retain the same short-term or long-term character as when originally deferred. Of the deferred capital losses at September 30, 2022, $3,810,650 are short-term and $2,069,203 are long-term.
The cost and unrealized appreciation (depreciation) of investments, including open derivative contracts, of the Fund at September 30, 2022, as determined on a federal income tax basis, were as follows:
| Aggregate cost | $ 75,409,070 |
| Gross unrealized appreciation | $ 5,259,212 |
| Gross unrealized depreciation | (11,083,422) |
| Net unrealized depreciation | $ (5,824,210) |
5 Financial Instruments
The Fund may trade in financial instruments with off-balance sheet risk in the normal course of its investing activities. These financial instruments may include forward foreign currency exchange contracts and futures contracts and may involve, to a varying degree, elements of risk in excess of the amounts recognized for financial statement purposes. The notional or contractual amounts of these instruments represent the investment the Fund has in particular classes of financial instruments and do not necessarily represent the amounts potentially subject to risk. The measurement of the risks associated with these instruments is meaningful only when all related and offsetting transactions are considered. A summary of obligations under these financial instruments at September 30, 2022 is included in the Schedule of Investments. At September 30, 2022, the Fund had sufficient cash and/or securities to cover commitments under these contracts.
In the normal course of pursuing its investment objective, the Fund is subject to the following risks:
Equity Price Risk: During the year ended September 30, 2022, the Fund entered into equity futures contracts to enhance total return, to manage certain investment risks and/or as a substitute for the purchase of securities.
Foreign Exchange Risk: During the year ended September 30, 2022, the Fund entered into forward foreign currency exchange contracts to seek to hedge against fluctuations in currency exchange rates and/or as a substitute for the purchase or sale of securities or currencies.
The Fund enters into forward foreign currency exchange contracts that may contain provisions whereby the counterparty may terminate the contract under certain conditions, including but not limited to a decline in the Fund’s net assets below a certain level over a certain period of time, which would trigger a payment by the Fund for those derivatives in a liability position. At September 30, 2022, the fair value of derivatives with credit-related contingent features in a net liability position was $1,160,931. At September 30, 2022, there were no assets pledged by the Fund for such liability.
The over-the-counter (OTC) derivatives in which the Fund invests are subject to the risk that the counterparty to the contract fails to perform its obligations under the contract. To mitigate this risk, the Fund has entered into an International Swaps and Derivatives Association, Inc. Master Agreement (“ISDA Master Agreement”) or similar agreement with its derivative counterparties. An ISDA Master Agreement is a bilateral agreement between the Fund and a counterparty that governs certain OTC derivatives and typically contains, among other things, set-off provisions in the event of a default and/or termination event as defined under the relevant ISDA Master Agreement. Under an ISDA Master Agreement, the Fund may, under certain circumstances, offset with the counterparty certain derivative financial instruments’ payables and/or receivables with collateral held and/or posted and create one single net payment. The provisions of the ISDA Master Agreement typically permit a single net payment in the event of default including the bankruptcy or insolvency of the counterparty. However, bankruptcy or insolvency laws of a particular jurisdiction may impose restrictions on or prohibitions against the right of offset in
Calvert
Emerging Markets Advancement Fund
September 30, 2022
Notes to Financial Statements — continued
bankruptcy or insolvency. Certain ISDA Master Agreements allow counterparties to OTC derivatives to terminate derivative contracts prior to maturity in the event the Fund’s net assets decline by a stated percentage or the Fund fails to meet the terms of its ISDA Master Agreement(s), which would cause the counterparty to accelerate payment by the Fund of any net liability owed to it.
The collateral requirements for derivatives traded under an ISDA Master Agreement are governed by a Credit Support Annex to the ISDA Master Agreement. Collateral requirements are determined at the close of business each day and are typically based on changes in market values for each transaction under an ISDA Master Agreement and netted into one amount for such agreement. Generally, the amount of collateral due from or to a counterparty is subject to a minimum transfer threshold amount before a transfer is required, which may vary by counterparty. Collateral pledged for the benefit of the Fund and/or counterparty is held in segregated accounts by the Fund’s custodian and cannot be sold, re-pledged, assigned or otherwise used while pledged. The portion of such collateral representing cash, if any, is reflected as deposits for derivatives collateral and, in the case of cash pledged by a counterparty for the benefit of the Fund, a corresponding liability on the Statement of Assets and Liabilities. Securities pledged by the Fund as collateral, if any, are identified as such in the Schedule of Investments. The carrying amount of the liability for cash collateral due to broker at September 30, 2022 approximated its fair value. If measured at fair value, such liability would have been considered as Level 2 in the fair value hierarchy (see Note 1A) at September 30, 2022.
At September 30, 2022, the fair value of open derivative instruments (not considered to be hedging instruments for accounting disclosure purposes) and whose primary underlying risk exposure is foreign exchange risk was as follows:
| Derivative | Statement of Assets and Liabilities Caption | Assets | Liabilities |
| Forward foreign currency exchange contracts | Receivable/Payable for open forward foreign currency
exchange contracts | $2,402,524 | $(1,160,931) |
The Fund’s derivative assets and liabilities at fair value by type, which are reported gross in the Statement of Assets and Liabilities, are presented in the table above. The following tables present the Fund’s derivative assets and liabilities by counterparty, net of amounts available for offset under a master netting agreement and net of the related collateral received by the Fund for such assets and pledged by the Fund for such liabilities as of September 30, 2022.
| Counterparty | Derivative
Assets Subject to
Master Netting
Agreement | Derivatives
Available
for Offset | Non-cash
Collateral
Received(a) | Cash
Collateral
Received(a) | Net Amount
of Derivative
Assets(b) |
| Goldman Sachs International | $ 1,225,876 | $ — | $ — | $ (1,180,000) | $ 45,876 |
| Standard Chartered Bank | 1,176,648 | (1,160,931) | — | — | 15,717 |
| | $2,402,524 | $(1,160,931) | $ — | $(1,180,000) | $61,593 |
| Counterparty | Derivative
Liabilities Subject to
Master Netting
Agreement | Derivatives
Available
for Offset | Non-cash
Collateral
Pledged(a) | Cash
Collateral
Pledged(a) | Net Amount
of Derivative
Liabilities(c) |
| Standard Chartered Bank | $(1,160,931) | $1,160,931 | $ — | $ — | $ — |
| (a) | In some instances, the total collateral received and/or pledged may be more than the amount shown due to overcollateralization. |
| (b) | Net amount represents the net amount due from the counterparty in the event of default. |
| (c) | Net amount represents the net amount payable to the counterparty in the event of default. |
Calvert
Emerging Markets Advancement Fund
September 30, 2022
Notes to Financial Statements — continued
The effect of derivative instruments (not considered to be hedging instruments for accounting disclosure purposes) on the Statement of Operations by risk exposure for the year ended September 30, 2022 was as follows:
| Statement of Operations Caption | Equity price | Foreign exchange | Total |
| Net realized gain (loss): | | | |
| Forward foreign currency exchange contracts | $ — | $ 1,181,506 | $ 1,181,506 |
| Futures contracts | (684,348) | — | (684,348) |
| Total | $(684,348) | $1,181,506 | $ 497,158 |
| Change in unrealized appreciation (depreciation): | | | |
| Forward foreign currency exchange contracts | $ — | $ 1,238,567 | $ 1,238,567 |
| Futures contracts | 65,147 | — | 65,147 |
| Total | $ 65,147 | $1,238,567 | $1,303,714 |
The average notional cost of futures contracts and average notional amounts of other derivative contracts outstanding during the year ended September 30, 2022, which are indicative of the volume of these derivative types, were approximately as follows:
| Futures Contracts — Long | Forward Foreign Currency Exchange Contracts* |
| $2,814,000 | $39,545,000 |
| * | The average notional amount for forward foreign currency exchange contracts is based on the absolute value of notional amounts of currency purchased and currency sold. |
6 Overdraft Advances
Pursuant to the custodian agreement, State Street Bank and Trust Company (SSBT) may, in its discretion, advance funds to the Fund to make properly authorized payments. When such payments result in an overdraft, the Fund is obligated to repay SSBT at the current rate of interest charged by SSBT for secured loans (currently, the Federal Funds rate plus 2%). This obligation is payable on demand to SSBT. SSBT has a lien on the Fund's assets to the extent of any overdraft. At September 30, 2022, the Fund had a payment due to SSBT pursuant to the foregoing arrangement of $204,220. Based on the short-term nature of these payments and the variable interest rate, the carrying value of the overdraft advances approximated its fair value at September 30, 2022. If measured at fair value, overdraft advances would have been considered as Level 2 in the fair value hierarchy (see Note 1A) at September 30, 2022. For the year ended September 30, 2022, the Fund incurred interest expense on overdraft advances of $14,050, which is included in custodian fees on the Statement of Operations.
7 Securities Lending
To generate additional income, the Fund may lend its securities pursuant to a securities lending agency agreement with SSBT, the securities lending agent. Security loans are subject to termination by the Fund at any time and, therefore, are not considered illiquid investments. The Fund requires that the loan be continuously collateralized by either cash or securities in an amount at least equal to the market value of the securities on loan. The market value of securities loaned is determined daily and any additional required collateral is delivered to the Fund on the next business day. Cash collateral is generally invested in a money market fund registered under the 1940 Act that is managed by an affiliate of SSBT. Any gain or loss in the market price of the loaned securities that might occur and any interest earned or dividends declared during the term of the loan would accrue to the account of the Fund. Income earned on the investment of collateral, net of broker rebates and other expenses incurred by the securities lending agent, is split between the Fund and the securities lending agent based on agreed upon contractual terms. Non-cash collateral, if any, is held by the lending agent on behalf of the Fund and cannot be sold or re-pledged by the Fund; accordingly, such collateral is not reflected in the Statement of Assets and Liabilities.
The risks associated with lending portfolio securities include, but are not limited to, possible delays in receiving additional collateral or in the recovery of the loaned securities, possible loss of rights to the collateral should the borrower fail financially, as well as risk of loss in the value of the collateral or the value of the investments made with the collateral. The securities lending agent shall indemnify the Fund in the case of default of any securities borrower.
At September 30, 2022, the total value of securities on loan was $882,939 and the total value of collateral received was $1,363,145, comprised of cash of $158,986 and U.S. government and/or agencies securities of $1,204,159.
Calvert
Emerging Markets Advancement Fund
September 30, 2022
Notes to Financial Statements — continued
The following table provides a breakdown of securities lending transactions accounted for as secured borrowings, the obligations by class of collateral pledged, and the remaining contractual maturity of those transactions as of September 30, 2022.
| | Remaining Contractual Maturity of the Transactions |
| | Overnight and
Continuous | <30 days | 30 to 90 days | >90 days | Total |
| Common Stocks | $158,986 | $ — | $ — | $ — | $158,986 |
The carrying amount of the liability for deposits for securities loaned at September 30, 2022 approximated its fair value. If measured at fair value, such liability would have been considered as Level 2 in the fair value hierarchy (see Note 1A) at September 30, 2022.
8 Line of Credit
The Fund participates with other portfolios and funds managed by EVM and its affiliates, including CRM, in an $800 million unsecured line of credit with a group of banks, which is in effect through October 25, 2022. Borrowings are made by the Fund solely for temporary purposes related to redemptions and other short-term cash needs. Interest is charged to the Fund based on its borrowings at an amount above either the Secured Overnight Financing Rate (SOFR) or Federal Funds rate. In addition, a fee computed at an annual rate of 0.15% on the daily unused portion of the line of credit is allocated among the participating portfolios and funds at the end of each quarter. In connection with the renewal of the agreement in October 2021, an arrangement fee of $150,000 was incurred that was allocated to the participating portfolios and funds. Because the line of credit is not available exclusively to the Fund, it may be unable to borrow some or all of its requested amounts at any particular time.
The Fund had no borrowings outstanding pursuant to its line of credit at September 30, 2022. The Fund did not have any significant borrowings or allocated fees during the year ended September 30, 2022. Effective October 25, 2022, the Fund renewed its line of credit agreement, which expires October 24, 2023. In connection with the renewal, the borrowing limit was decreased to $725 million.
9 Affiliated Funds
At September 30, 2022, the value of the Fund’s investment in affiliated funds was $3,013,623, which represents 4.2% of the Fund’s net assets. Transactions in affiliated funds by the Fund for the year ended September 30, 2022 were as follows:
| Name | Value,
beginning
of period | Purchases | Sales
proceeds | Net
realized
gain
(loss) | Change in
unrealized
appreciation
(depreciation) | Value,
end of
period | Dividend
income | Units/Shares,
end of period |
| Short-Term Investments | | | | | | |
| Cash Reserves Fund | $6,412,205 | $18,558,793 | $(24,970,269) | $ (89) | $ (640) | $ — | $ 1,684 | — |
| Liquidity Fund | — | 28,780,232 | (25,766,609) | — | — | 3,013,623 | 19,331 | 3,013,623 |
| Total | | | | $ (89) | $(640) | $3,013,623 | $21,015 | |
10 Capital Shares
The Corporation may issue its shares in one or more series (such as the Fund). The authorized shares of the Fund consist of 75,000,000 common shares, $0.01 par value, for each Class.
Calvert
Emerging Markets Advancement Fund
September 30, 2022
Notes to Financial Statements — continued
Transactions in capital shares for the years ended September 30, 2022 and September 30, 2021 were as follows:
| | Year Ended
September 30, 2022 | | Year Ended
September 30, 2021 |
| | Shares | Amount | | Shares | Amount |
| Class A | | | | | |
| Shares sold | 92,902 | $ 1,079,670 | | 39,025 | $ 499,974 |
| Reinvestment of distributions | 2,006 | 24,218 | | 8 | 101 |
| Shares redeemed | (3,757) | (42,751) | | (9,108) | (120,013) |
| Net increase | 91,151 | $ 1,061,137 | | 29,925 | $ 380,062 |
| Class I | | | | | |
| Shares sold | 2,972,067 | $ 34,751,468 | | 1,285,217 | $16,497,865 |
| Reinvestment of distributions | 213,126 | 2,583,084 | | 5,118 | 63,565 |
| Shares redeemed | (541,348) | (6,225,281) | | (568,417) | (7,449,564) |
| Net increase | 2,643,845 | $31,109,271 | | 721,918 | $ 9,111,866 |
At September 30, 2022, EVM, Calvert Conservative Allocation Fund, Calvert Moderate Allocation Fund and Calvert Growth Allocation Fund owned in the aggregate 67.7% of the value of the outstanding shares of the Fund.
11 Risks and Uncertainties
Risks Associated with Foreign Investments
Foreign investments can be adversely affected by political, economic and market developments abroad, including the imposition of economic and other sanctions by the United States or another country. There may be less publicly available information about foreign issuers because they may not be subject to reporting practices, requirements or regulations comparable to those to which United States companies are subject. Foreign markets may be smaller, less liquid and more volatile than the major markets in the United States. Trading in foreign markets typically involves higher expense than trading in the United States. The Fund may have difficulties enforcing its legal or contractual rights in a foreign country. Securities that trade or are denominated in currencies other than the U.S. dollar may be adversely affected by fluctuations in currency exchange rates.
Emerging market securities often involve greater risks than developed market securities. Investment markets within emerging market countries are typically smaller, less liquid, less developed and more volatile than those in more developed markets like the United States, and may be focused in certain economic sectors. The information available about an emerging market issuer may be less reliable than for comparable issuers in more developed capital markets. Governmental actions can have a significant effect on the economic conditions in emerging market countries. It may be more difficult to make a claim or obtain a judgment in the courts of these countries than it is in the United States. The possibility of fraud, negligence, undue influence being exerted by an issuer or refusal to recognize ownership exists in some emerging markets. Disruptions due to work stoppages and trading improprieties in foreign securities markets have caused such markets to close. Emerging market securities are also subject to speculative trading, which contributes to their volatility.
Pandemic Risk
An outbreak of respiratory disease caused by a novel coronavirus was first detected in China in late 2019 and subsequently spread internationally. This coronavirus has resulted in closing borders, enhanced health screenings, changes to healthcare service preparation and delivery, quarantines, cancellations, disruptions to supply chains and customer activity, as well as general concern and uncertainty. Health crises caused by outbreaks of disease, such as the coronavirus outbreak, may exacerbate other pre-existing political, social and economic risks and disrupt normal market conditions and operations. The impact of this outbreak has negatively affected the worldwide economy, as well as the economies of individual countries and industries, and could continue to affect the market in significant and unforeseen ways. Other epidemics and pandemics that may arise in the future may have similar effects. Any such impact could adversely affect the Fund's performance, or the performance of the securities in which the Fund invests.
Calvert
Emerging Markets Advancement Fund
September 30, 2022
Report of Independent Registered Public Accounting Firm
To the Board of Directors of Calvert World Values Fund, Inc. and Shareholders of Calvert Emerging Markets Advancement Fund:
Opinion on the Financial Statements and Financial Highlights
We have audited the accompanying statement of assets and liabilities of Calvert Emerging Markets Advancement Fund (the "Fund") (one of the funds constituting Calvert World Values Fund, Inc.), including the schedule of investments, as of September 30, 2022, the related statement of operations for the year then ended, the statements of changes in net assets and the financial highlights for each of the two years in the period then ended, and the related notes. In our opinion, the financial statements and financial highlights present fairly, in all material respects, the financial position of the Fund as of September 30, 2022, and the results of its operations for the year then ended, and the changes in its net assets and the financial highlights for each of the two years in the period then ended, in conformity with accounting principles generally accepted in the United States of America. The financial highlights for the year ended September 30, 2020 were audited by other auditors whose report, dated November 20, 2020, expressed an unqualified opinion on those financial highlights.
Basis for Opinion
These financial statements and financial highlights are the responsibility of the Fund's management. Our responsibility is to express an opinion on the Fund's financial statements and financial highlights based on our audits. We are a public accounting firm registered with the Public Company Accounting Oversight Board (United States) (PCAOB) and are required to be independent with respect to the Fund in accordance with the U.S. federal securities laws and the applicable rules and regulations of the Securities and Exchange Commission and the PCAOB.
We conducted our audits in accordance with the standards of the PCAOB. Those standards require that we plan and perform the audit to obtain reasonable assurance about whether the financial statements and financial highlights are free of material misstatement, whether due to error or fraud. The Fund is not required to have, nor were we engaged to perform, an audit of its internal control over financial reporting. As part of our audits, we are required to obtain an understanding of internal control over financial reporting but not for the purpose of expressing an opinion on the effectiveness of the Fund’s internal control over financial reporting. Accordingly, we express no such opinion.
Our audits included performing procedures to assess the risks of material misstatement of the financial statements and financial highlights, whether due to error or fraud, and performing procedures that respond to those risks. Such procedures included examining, on a test basis, evidence regarding the amounts and disclosures in the financial statements and financial highlights. Our audits also included evaluating the accounting principles used and significant estimates made by management, as well as evaluating the overall presentation of the financial statements and financial highlights. Our procedures included confirmation of securities owned as of September 30, 2022, by correspondence with the custodian and brokers; when replies were not received from brokers, we performed other auditing procedures. We believe that our audits provide a reasonable basis for our opinion.
/s/ Deloitte & Touche LLP
Boston, Massachusetts
November 22, 2022
We have served as the auditor of one or more Calvert investment companies since 2021.
Calvert
Emerging Markets Advancement Fund
September 30, 2022
Federal Tax Information (Unaudited)
The Form 1099-DIV you receive in February 2023 will show the tax status of all distributions paid to your account in calendar year 2022. Shareholders are advised to consult their own tax adviser with respect to the tax consequences of their investment in the Fund. As required by the Internal Revenue Code and/or regulations, shareholders must be notified regarding the status of qualified dividend income for individuals and the foreign tax credit.
Qualified Dividend Income. For the fiscal year ended September 30, 2022, the Fund designates approximately $714,787, or up to the maximum amount of such dividends allowable pursuant to the Internal Revenue Code, as qualified dividend income eligible for the reduced tax rate of 15%.
Foreign Tax Credit. For the fiscal year ended September 30, 2022, the Fund paid foreign taxes of $188,653 and recognized foreign source income of $1,987,060.
Calvert
Emerging Markets Advancement Fund
September 30, 2022
Board of Directors' Contract Approval
Overview of the Contract Review Process
The Investment Company Act of 1940, as amended, provides, in substance, that each investment advisory agreement between a fund and its investment adviser will continue in effect from year to year only if its continuation is approved at least annually by the fund’s board of directors, including by a vote of a majority of the directors who are not “interested persons” of the fund (“Independent Directors”), cast in person at a meeting called for the purpose of considering such approval.
At a video conference meeting of the Boards of Trustees/Directors (each a “Board”) of the registered investment companies advised by Calvert Research and Management (“CRM” or the “Adviser”) (the “Calvert Funds”) held on June 14, 2022, the Board, including a majority of the Independent Directors, voted to approve continuation of existing investment advisory and investment sub-advisory agreements for the Calvert Funds for an additional one-year period. The meeting was held by video conference due to circumstances related to current or potential effects of COVID-19 pursuant to temporary exemptive relief issued by the Securities and Exchange Commission.
In evaluating the investment advisory and investment sub-advisory agreements for the Calvert Funds, the Board considered a variety of information relating to the Calvert Funds and various service providers, including the Adviser. The Independent Directors reviewed a report prepared by the Adviser regarding various services provided to the Calvert Funds by the Adviser and its affiliates. Such report included, among other data, information regarding the Adviser’s personnel and the Adviser’s revenue and cost of providing services to the Calvert Funds, and a separate report prepared by an independent data provider, which compared each fund’s investment performance, fees and expenses to those of comparable funds as identified by such independent data provider (“comparable funds”).
The Independent Directors were separately represented by independent legal counsel with respect to their consideration of the continuation of the investment advisory and investment sub-advisory agreements for the Calvert Funds. Prior to voting, the Independent Directors reviewed the proposed continuation of the Calvert Funds’ investment advisory and investment sub-advisory agreements with management and also met in private sessions with their counsel at which time no representatives of management were present.
The information that the Board considered included, among other things, the following (for funds that invest through one or more affiliated underlying fund(s), references to “each fund” in this section may include information that was considered at the underlying fund-level):
Information about Fees, Performance and Expenses
| • | A report from an independent data provider comparing the advisory and related fees paid by each fund with fees paid by comparable funds; |
| • | A report from an independent data provider comparing each fund’s total expense ratio and its components to comparable funds; |
| • | A report from an independent data provider comparing the investment performance of each fund to the investment performance of comparable funds over various time periods; |
| • | Data regarding investment performance in comparison to benchmark indices; |
| • | For each fund, comparative information concerning the fees charged and the services provided by the Adviser in managing other accounts (including mutual funds, other collective investment funds and institutional accounts) using investment strategies and techniques similar to those used in managing such fund; |
| • | Profitability analyses for the Adviser with respect to each fund; |
Information about Portfolio Management and Trading
| • | Descriptions of the investment management services provided to each fund, including investment strategies and processes it employs; |
| • | Information about the Adviser’s policies and practices with respect to trading, including the Adviser’s processes for monitoring best execution of portfolio transactions; |
| • | Information about the allocation of brokerage transactions and the benefits received by the Adviser as a result of brokerage allocation, including information concerning the acquisition of research through client commission arrangements and policies with respect to “soft dollars”; |
Information about the Adviser
| • | Reports detailing the financial results and condition of CRM; |
| • | Descriptions of the qualifications, education and experience of the individual investment professionals whose responsibilities include portfolio management and investment research for the funds, and information relating to their compensation and responsibilities with respect to managing other mutual funds and investment accounts; |
| • | Policies and procedures relating to proxy voting and the handling of corporate actions and class actions; |
| • | A description of CRM’s procedures for overseeing sub-advisers, including with respect to regulatory and compliance issues, investment management and other matters; |
Calvert
Emerging Markets Advancement Fund
September 30, 2022
Board of Directors' Contract Approval — continued
Other Relevant Information
| • | Information concerning the nature, cost and character of the administrative and other non-investment advisory services provided by CRM and its affiliates; and |
| • | The terms of each investment advisory agreement. |
Over the course of the year, the Board and its committees held regular quarterly meetings. During these meetings, the Directors participated in investment and performance reviews with the portfolio managers and other investment professionals of the Adviser relating to each fund, and considered various investment and trading strategies used in pursuing each fund’s investment objective(s), such as the use of derivative instruments, as well as risk management techniques. The Board and its committees also evaluated issues pertaining to industry and regulatory developments, compliance procedures, corporate governance and other issues with respect to the funds, and received and participated in reports and presentations provided by CRM and its affiliates with respect to such matters. In addition to the formal meetings of the Board and its committees, the Independent Directors held regular video conferences in between meetings to discuss, among other topics, matters relating to the continuation of the Calvert Funds’ investment advisory and investment sub-advisory agreements.
For funds that invest through one or more affiliated underlying funds, the Board considered similar information about the underlying fund(s) when considering the approval of investment advisory agreements. In addition, in cases where the Adviser has engaged a sub-adviser, the Board considered similar information about the sub-adviser when considering the approval of any investment sub-advisory agreement.
The Independent Directors were assisted throughout the contract review process by their independent legal counsel. The Independent Directors relied upon the advice of such counsel and their own business judgment in determining the material factors to be considered in evaluating each investment advisory and investment sub-advisory agreement and the weight to be given to each such factor. The Board, including the Independent Directors, did not identify any single factor as controlling, and each Director may have attributed different weight to various factors.
Results of the Contract Review Process
Based on its consideration of the foregoing, and such other information as it deemed relevant, including the factors and conclusions described below, the Board, including the Independent Directors, concluded that the continuation of the investment advisory agreement of Calvert Emerging Markets Advancement Fund (the “Fund”), including the fee payable under the agreement, is in the best interests of the Fund’s shareholders. Accordingly, the Board, including a majority of the Independent Directors, voted to approve the continuation of the investment advisory agreement of the Fund.
Nature, Extent and Quality of Services
In considering the nature, extent and quality of the services provided by the Adviser under the investment advisory agreement, the Board reviewed information provided by the Adviser relating to its operations and personnel, including, among other information, biographical information on the Adviser’s investment personnel and descriptions of its organizational and management structure. The Board also took into account similar information provided periodically throughout the previous year by the Adviser as well as the Board’s familiarity with management through Board meetings, discussions and other reports. The Board considered the Adviser’s management style and its performance in employing its investment strategies as well as its current level of staffing and overall resources. The Board also noted that it reviewed on a quarterly basis information regarding the Adviser’s compliance with applicable policies and procedures, including those related to personal investing. The Board took into account, among other items, periodic reports received from the Adviser over the past year concerning the Adviser’s ongoing review and enhancement of certain processes, policies and procedures of the Calvert Funds and the Adviser. The Board concluded that it was satisfied with the nature, extent and quality of services provided to the Fund by the Adviser under the investment advisory agreement.
Fund Performance
In considering the Fund’s performance, the Board noted that it reviewed on a quarterly basis detailed information about the Fund’s performance results, portfolio composition and investment strategies. The Board compared the Fund’s investment performance to that of the Fund’s peer universe and its benchmark index. The Board’s review included comparative performance data for the one-year period ended December 31, 2021. This performance data indicated that the Fund had outperformed the median of its peer universe and benchmark index for the one-year period ended December 31, 2021. Based upon its review, the Board concluded that the Fund’s performance was satisfactory relative to the performance of its peer universe and its benchmark index.
Management Fees and Expenses
In considering the Fund’s fees and expenses, the Board compared the Fund’s fees and total expense ratio with those of comparable funds in its expense group. Among other findings, the data indicated that the Fund’s advisory and administrative fees (after taking into account waivers and/or reimbursements) (referred to collectively as “management fees”) and the Fund’s total expenses (net of waivers and/or reimbursements) were each below the respective median of the Fund’s expense group. The Board took into account the Adviser’s current undertaking to maintain expense limitations for the Fund and that the Adviser was waiving and/or reimbursing a portion of the Fund’s expenses. Based upon its review, the Board concluded that the management fees were reasonable in view of the nature, extent and quality of services provided by the Adviser.
Calvert
Emerging Markets Advancement Fund
September 30, 2022
Board of Directors' Contract Approval — continued
Profitability and Other “Fall-Out” Benefits
The Board reviewed the Adviser’s profitability in regard to the Fund and the Calvert Funds in the aggregate. In reviewing the overall profitability of the Fund to the Adviser, the Board also considered the fact that the Adviser and its affiliates provided sub-transfer agency support, administrative and distribution services to the Fund for which they received compensation. The information considered by the Board included the profitability of the Fund to the Adviser and its affiliates without regard to any marketing support or other payments by the Adviser and its affiliates to third parties in respect of distribution services. The Board also considered that the Adviser and its affiliates derived benefits to their reputation and other indirect benefits from their relationships with the Fund. Based upon its review, the Board concluded that the Adviser’s and its affiliates’ level of profitability from their relationships with the Fund was reasonable.
Economies of Scale
The Board considered the effect of the Fund’s current size and its potential growth on its performance and fees. The Board concluded that adding breakpoints to the advisory fee at specified asset levels would not be appropriate at this time. The Board noted that if the Fund’s assets increased over time, the Fund might realize other economies of scale if assets increased proportionally more than certain other expenses.
Calvert
Emerging Markets Advancement Fund
September 30, 2022
Liquidity Risk Management Program
The Fund has implemented a written liquidity risk management program (Program) and related procedures to manage its liquidity in accordance with Rule 22e-4 under the Investment Company Act of 1940, as amended (Liquidity Rule). The Liquidity Rule defines “liquidity risk” as the risk that a fund could not meet requests to redeem shares issued by the fund without significant dilution of the remaining investors’ interests in the fund. The Fund’s Board of Trustees/Directors has designated the investment adviser to serve as the administrator of the Program and the related procedures. The administrator has established a Liquidity Risk Management Oversight Committee (Committee) to perform the functions necessary to administer the Program. As part of the Program, the administrator is responsible for identifying illiquid investments and categorizing the relative liquidity of the Fund’s investments in accordance with the Liquidity Rule. Under the Program, the administrator assesses, manages, and periodically reviews the Fund’s liquidity risk, and is responsible for making certain reports to the Fund’s Board of Trustees/Directors and the Securities and Exchange Commission (SEC) regarding the liquidity of the Fund’s investments, and to notify the Board of Trustees/Directors and the SEC of certain liquidity events specified in the Liquidity Rule. The liquidity of the Fund’s portfolio investments is determined based on a number of factors including, but not limited to, relevant market, trading and investment-specific considerations under the Program.
At a meeting of the Fund’s Board of Trustees/Directors on June 14, 2022, the Committee provided a written report to the Fund’s Board of Trustees/ Directors pertaining to the operation, adequacy, and effectiveness of implementation of the Program, as well as the operation of the highly liquid investment minimum (if applicable) for the period January 1, 2021 through December 31, 2021 (Review Period). The Program operated effectively during the Review Period, supporting the administrator’s ability to assess, manage and monitor Fund liquidity risk, including during periods of market volatility and net redemptions. During the Review Period, the Fund met redemption requests on a timely basis.
There can be no assurance that the Program will achieve its objectives in the future. Please refer to the Fund’s prospectus for more information regarding the Fund’s exposure to liquidity risk and other principal risks to which an investment in the Fund may be subject.
Calvert
Emerging Markets Advancement Fund
September 30, 2022
Management and Organization
Fund Management. The Directors of Calvert World Values Fund, Inc. (the Corporation) are responsible for the overall management and supervision of the affairs of the Corporation. The Board members and officers of the Corporation are listed below. Except as indicated, each individual has held the office shown or other offices in the same company for the last five years. Board members hold indefinite terms of office. Each Board member holds office until his or her successor is elected and qualified, or until his or her earlier death, resignation, retirement, removal or disqualification. Under the terms of the Fund's current Board member retirement policy, an Independent Board member must retire at the end of the calendar year in which he or she turns 75. However, if such retirement would cause the Fund to be out of compliance with Section 16 of the 1940 Act or any other regulations or guidance of the SEC, then such retirement will not become effective until such time as action has been taken for the Fund to be in compliance therewith. The “noninterested Directors” consist of those Directors who are not “interested persons” of the Corporation, as that term is defined under the 1940 Act. The business address of each Board member and the Chief Compliance Officer is 1825 Connecticut Avenue NW, Suite 400, Washington, DC 20009 and the business address of the Secretary, Vice President and Chief Legal Officer and the Treasurer is Two International Place, Boston, Massachusetts 02110. As used below, “CRM” refers to Calvert Research and Management and “Eaton Vance” refers to Eaton Vance Management. Each Director oversees 42 funds in the Calvert fund complex. Effective March 1, 2021, each of Eaton Vance and CRM are indirect wholly-owned subsidiaries of Morgan Stanley. Each officer affiliated with CRM may hold a position with other CRM affiliates that is comparable to his or her position with CRM listed below.
| Name and Year of Birth | Corporation
Position(s) | Length of
Service | Principal Occupation(s) and Other Directorships
During Past Five Years and Other Relevant Experience |
| Interested Director |
John H. Streur(1)
1960 | Director and
President | Since 2015 | President and Chief Executive Officer of CRM (since December 31, 2016). President and Chief Executive Officer of Calvert Investments, Inc.
(January 2015 - December 2016); Chief Executive Officer of Calvert
Investment Distributors, Inc. (August 2015 - December 2016); Chief
Compliance Officer of Calvert Investment Management, Inc. (August 2015 -
April 2016); President and Director, Portfolio 21 Investments, Inc.
(through October 2014); President, Chief Executive Officer and
Director, Managers Investment Group LLC (through January 2012);
President and Director, The Managers Funds and Managers AMG
Funds (through January 2012).
Other Directorships. Portfolio 21 Investments, Inc. (asset management)
(through October 2014); Managers Investment Group LLC (asset management)
(through January 2012); The Managers Funds (asset management)
(through January 2012); Managers AMG Funds (asset management)
(through January 2012); Calvert Impact Capital, Inc. |
| Noninterested Directors |
Richard L. Baird, Jr.
1948 | Director | Since 2005 | Regional Disaster Recovery Lead, American Red Cross of Greater
Pennsylvania (since 2017). Volunteer, American Red Cross (since 2015).
Former President and CEO of Adagio Health Inc. (retired in 2014) in
Pittsburgh, PA.
Other Directorships. None. |
Alice Gresham Bullock
1950 | Chair and
Director | Since 2016 | Professor Emerita at Howard University School of Law. Dean Emerita of
Howard University School of Law and Deputy Director of the Association
of American Law Schools (1992-1994).
Other Directorships. None. |
Cari M. Dominguez
1949 | Director | Since 2016 | Former Chair of the U.S. Equal Employment Opportunity Commission.
Other Directorships. ManpowerGroup Inc. (workforce solutions company);
Triple S Management Corporation (managed care); National Association of Corporate Directors. |
John G. Guffey, Jr.
1948 | Director | Since 1992 | President of Aurora Press Inc., a privately held publisher of trade
paperbacks (since January 1997).
Other Directorships. Calvert Impact Capital, Inc. (through December 31, 2018); Calvert Ventures, LLC. |
Miles D. Harper, III
1962 | Director | Since 2005 | Partner, Carr Riggs & Ingram (public accounting firm) since October 2014.
Partner, Gainer Donnelly & Desroches (public accounting firm) (now Carr
Riggs & Ingram) (November 1999 - September 2014).
Other Directorships. Bridgeway Funds (9) (asset management). |
Joy V. Jones
1950 | Director | Since 2005 | Attorney.
Other Directorships. Palm Management Corporation. |
Calvert
Emerging Markets Advancement Fund
September 30, 2022
Management and Organization — continued
| Name and Year of Birth | Corporation
Position(s) | Length of
Service | Principal Occupation(s) and Other Directorships
During Past Five Years and Other Relevant Experience |
| Noninterested Directors (continued) |
Anthony A. Williams
1951 | Director | Since 2016 | CEO and Executive Director of the Federal City Council (July 2012 to
present); Senior Adviser and Independent Consultant for King and
Spalding LLP (September 2015 to present); Executive Director of Global
Government Practice at the Corporate Executive Board (January 2010 to
January 2012).
Other Directorships. Freddie Mac; Evoq Properties/Meruelo Maddux
Properties, Inc. (real estate management); Weston Solutions, Inc.
(environmental services); Bipartisan Policy Center’s Debt Reduction Task Force;
Chesapeake Bay Foundation; Catholic University of America; Urban Institute (research organization); The Howard Hughes Corporation (real estate development); Old Dominion National Bank. |
| Name and Year of Birth | Corporation
Position(s) | Length of
Service | Principal Occupation(s)
During Past Five Years |
| Principal Officers who are not Directors |
Hope L. Brown
1973 | Chief
Compliance
Officer | Since 2014 | Chief Compliance Officer of 42 registered investment companies advised
by CRM (since 2014). Vice President and Chief Compliance Officer,
Wilmington Funds (2012-2014). |
Deidre E. Walsh
1971 | Secretary,
Vice President
and Chief
Legal Officer | Since 2021 | Vice President of CRM and officer of 42 registered investment companies
advised by CRM (since 2021). Also Vice President of Eaton Vance and
certain of its affiliates and officer of 136 registered investment companies
advised or administered by Eaton Vance. |
James F. Kirchner
1967 | Treasurer | Since 2016 | Vice President of CRM and officer of 42 registered investment companies
advised by CRM (since 2016). Also Vice President of Eaton Vance and
certain of its affiliates and officer of 136 registered investment companies
advised or administered by Eaton Vance. |
| | | | |
| (1) Mr. Streur is an interested person of the Fund because of his positions with the Fund’s adviser and certain affiliates. |
The SAI for the Fund includes additional information about the Directors and officers of the Fund and can be obtained without charge on Calvert’s website at www.calvert.com or by calling 1-800-368-2745.
| FACTS | WHAT DOES EATON VANCE DO WITH YOUR
PERSONAL INFORMATION? |
| Why? | Financial companies choose how they share your personal information. Federal law gives consumers the right to limit some but not all sharing. Federal law also requires us to tell you how we collect, share, and protect your personal information. Please read this notice carefully to understand what we do. |
| |
| What? | The types of personal information we collect and share depend on the product or service you have with us. This information can include:■ Social Security number and income
■
investment experience and risk tolerance
■
checking account number and wire transfer instructions |
| |
| How? | All financial companies need to share customers’ personal information to run their everyday business. In the section below, we list the reasons financial companies can share their customers’ personal information; the reasons Eaton Vance chooses to share; and whether you can limit this sharing. |
Reasons we can share your
personal information | Does Eaton Vance
share? | Can you limit
this sharing? |
| For our everyday business purposes — such as to process your transactions, maintain your account(s), respond to court orders and legal investigations, or report to credit bureaus | Yes | No |
| For our marketing purposes — to offer our products and services to you | Yes | No |
| For joint marketing with other financial companies | No | We don’t share |
| For our investment management affiliates’ everyday business purposes — information about your transactions, experiences, and creditworthiness | Yes | Yes |
| For our affiliates’ everyday business purposes — information about your transactions and experiences | Yes | No |
| For our affiliates’ everyday business purposes — information about your creditworthiness | No | We don’t share |
| For our investment management affiliates to market to you | Yes | Yes |
| For our affiliates to market to you | No | We don’t share |
| For nonaffiliates to market to you | No | We don’t share |
To limit our
sharing | Call toll-free 1-800-368-2745 or email: CRMPrivacy@calvert.comPlease note:If you are a new customer, we can begin sharing your information 30 days from the date we sent this notice. When you are no longer our customer, we continue to share your information as described in this notice. However, you can contact us at any time to limit our sharing. |
| Questions? | Call toll-free 1-800-368-2745 or email: CRMPrivacy@calvert.com |
| Privacy Notice — continued | April 2021 |
| Who we are |
| Who is providing this notice? | Eaton Vance Management, Eaton Vance Distributors, Inc., Eaton Vance Trust Company, Eaton Vance Management (International) Limited, Eaton Vance Advisers International Ltd., Eaton Vance Global Advisors Limited, Eaton Vance Management’s Real Estate Investment Group, Boston Management and Research, Calvert Research and Management, Eaton Vance and Calvert Fund Families and our investment advisory affiliates (“Eaton Vance”) (see Investment Management Affiliates definition below) |
| What we do |
How does Eaton Vance
protect my personal
information? | To protect your personal information from unauthorized access and use, we use security measures that comply with federal law. These measures include computer safeguards and secured files and buildings. We have policies governing the proper handling of customer information by personnel and requiring third parties that provide support to adhere to appropriate security standards with respect to such information. |
How does Eaton Vance
collect my personal
information? | We collect your personal information, for example, when you■ open an account or make deposits or withdrawals from your account
■
buy securities from us or make a wire transfer
■
give us your contact informationWe also collect your personal information from others, such as credit bureaus, affiliates, or other companies. |
| Why can’t I limit all sharing? | Federal law gives you the right to limit only■ sharing for affiliates’ everyday business purposes — information about your creditworthiness
■
affiliates from using your information to market to you
■
sharing for nonaffiliates to market to youState laws and individual companies may give you additional rights to limit sharing. See below for more on your rights under state law. |
| Definitions |
Investment Management
Affiliates | Eaton Vance Investment Management Affiliates include registered investment advisers, registered broker- dealers, and registered and unregistered funds. Investment Management Affiliates does not include entities associated with Morgan Stanley Wealth Management, such as Morgan Stanley Smith Barney LLC and Morgan Stanley & Co. |
| Affiliates | Companies related by common ownership or control. They can be financial and nonfinancial companies.■ Our affiliates include companies with a Morgan Stanley name and financial companies such as Morgan Stanley Smith Barney LLC and Morgan Stanley & Co. |
| Nonaffiliates | Companies not related by common ownership or control. They can be financial and nonfinancial companies.■ Eaton Vance does not share with nonaffiliates so they can market to you. |
| Joint marketing | A formal agreement between nonaffiliated financial companies that together market financial products or services to you.■ Eaton Vance doesn’t jointly market. |
| Other important information |
| Vermont: Except as permitted by law, we will not share personal information we collect about Vermont residents with Nonaffiliates unless you provide us with your written consent to share such information.California: Except as permitted by law, we will not share personal information we collect about California residents with Nonaffiliates and we will limit sharing such personal information with our Affiliates to comply with California privacy laws that apply to us. |
Delivery of Shareholder Documents. The Securities and Exchange Commission (SEC) permits funds to deliver only one copy of shareholder documents, including prospectuses, proxy statements and shareholder reports, to fund investors with multiple accounts at the same residential or post office box address. This practice is often called “householding” and it helps eliminate duplicate mailings to shareholders. Calvert funds, or your financial intermediary, may household the mailing of your documents indefinitely unless you instruct Calvert funds, or your financial intermediary, otherwise. If you would prefer that your Calvert fund documents not be householded, please contact Calvert funds at 1-800-368-2745, or contact your financial intermediary. Your instructions that householding not apply to delivery of your Calvert fund documents will typically be effective within 30 days of receipt by Calvert funds or your financial intermediary.
Portfolio Holdings. Each Calvert fund files a schedule of portfolio holdings on Part F to Form N-PORT with the SEC. Certain information filed on Form N-PORT may be viewed on the Calvert website at www.calvert.com, by calling Calvert at 1-800-368-2745 or in the EDGAR database on the SEC’s website at www.sec.gov.
Proxy Voting. The Proxy Voting Guidelines that each Calvert fund uses to determine how to vote proxies relating to portfolio securities is provided as an Appendix to the fund’s Statement of Additional Information. The Statement of Additional Information can be obtained free of charge by calling the Calvert funds at 1-800-368-2745, by visiting the Calvert funds’ website at www.calvert.com or visiting the SEC’s website at www.sec.gov. Information regarding how a Calvert fund voted proxies relating to portfolio securities during the most recent 12-month period ended June 30 is available by calling Calvert funds, by visiting the Calvert funds’ website at www.calvert.com or by visiting the SEC’s website at www.sec.gov.
Investment Adviser and Administrator
Calvert Research and Management
1825 Connecticut Avenue NW, Suite 400
Washington, DC 20009
Principal Underwriter*
Eaton Vance Distributors, Inc.
Two International Place
Boston, MA 02110
(617) 482-8260
Custodian
State Street Bank and Trust Company
State Street Financial Center, One Lincoln Street
Boston, MA 02111
Transfer Agent
DST Asset Manager Solutions, Inc.
2000 Crown Colony Drive
Quincy, MA 02169
Independent Registered Public Accounting Firm
Deloitte & Touche LLP
200 Berkeley Street
Boston, MA 02116-5022
Fund Offices
1825 Connecticut Avenue NW, Suite 400
Washington, DC 20009
* FINRA BrokerCheck. Investors may check the background of their Investment Professional by contacting the Financial Industry Regulatory Authority (FINRA). FINRA BrokerCheck is a free tool to help investors check the professional background of current and former FINRA-registered securities firms and brokers. FINRA BrokerCheck is available by calling 1-800-289-9999 and at www.FINRA.org. The FINRA BrokerCheck brochure describing this program is available to investors at www.FINRA.org.
Printed on recycled paper.
36741 9.30.22
Item 2. Code of Ethics
The registrant has adopted a code of ethics applicable to its Principal Executive Officer, Principal Financial Officer and Principal Accounting Officer. The registrant undertakes to provide a copy of such code of ethics to any person upon request, without charge, by calling 1-800-368-2745. The registrant has not amended the code of ethics as described in Form N-CSR during the period covered by this report. The registrant has not granted any waiver, including an implicit waiver, from a provision of the code of ethics as described in Form N-CSR during the period covered by this report.
Item 3. Audit Committee Financial Expert
The registrant’s Board of Directors has determined that Miles D. Harper III, an “independent” Director serving on the registrant’s audit committee, is an “audit committee financial expert,” as defined in Item 3 of Form N-CSR. Under applicable securities laws, a person who is determined to be an audit committee financial expert will not be deemed an “expert” for any purpose, including without limitation for the purposes of Section 11 of the Securities Act of 1933, as a result of being designated or identified as an audit committee financial expert.
The designation or identification of a person as an audit committee financial expert does not impose on such person any duties, obligations, or liabilities that are greater than the duties, obligations, and liabilities imposed on such person as a member of the audit committee and Board of Directors in the absence of such designation or identification.
Item 4. Principal Accountant Fees and Services
(a) –(d)
The following table presents the aggregate fees billed to the registrant for the registrant’s fiscal years ended September 30, 2021 and September 30, 2022 by its principal accountant for professional services rendered for the audit of the registrant’s annual financial statements and fees billed for other services rendered by its principal accountant during such periods.
| | | | | | | | | | | | | | | | |
Fiscal Years Ended | | 9/30/21 | | | %* | | | 9/30/22 | | | %* | |
Audit Fees | | $ | 135,500 | | | | 5.9 | % | | $ | 135,500 | | | | 0 | % |
Audit-Related Fees(1) | | $ | 0 | | | | 0 | % | | $ | 0 | | | | 0 | % |
Tax Fees(2) | | $ | 65,259 | | | | 0 | % | | $ | 0 | | | | 0 | % |
All Other Fees(3) | | $ | 0 | | | | 0 | % | | $ | 0 | | | | 0 | % |
| | | | | | | | | | | | | | | | |
Total | | $ | 200,759 | | | | 4.5 | % | | $ | 135,500 | | | | 0 | % |
| | | | | | | | | | | | | | | | |
| * | Percentage of fees approved by the Audit Committee pursuant to (c)(7)(i)(C) of Rule 2-01 of Reg. S-X (statutory de minimis waiver of Committee’s requirement to pre-approve). |
| (1) | Audit-related fees consist of the aggregate fees billed for assurance and related services that are reasonably related to the performance of the audit of the registrant’s financial statements and are not reported under the category of audit fees. |
| (2) | Tax fees consist of the aggregate fees billed for professional services rendered by the principal accountant relating to tax compliance, tax advice, and tax planning and specifically include fees for tax return preparation and other related tax compliance/planning matters. |
| (3) | All other fees consist of the aggregate fees billed for products and services provided by the principal accountant other than audit, audit-related, and tax services. |
(e) The Audit Committee is required to pre-approve all audit and non-audit services provided to the registrant by the auditors, and to the registrant’s investment adviser, and any entity controlling, controlled by, or under common control with the adviser that provides ongoing services to the registrant. In determining whether to pre-approve non-audit services, the Audit Committee considers whether the services are consistent with maintaining the independence of the auditors. The Committee may delegate its authority to pre-approve certain matters to one or more of its members. In this regard, the Committee has delegated authority jointly to the Audit Committee Chair together with another Committee member with respect to non-audit services not exceeding $25,000 in each instance. In addition, the Committee has pre-approved the retention of the auditors to provide tax-related services related to the tax treatment and tax accounting of newly acquired securities, upon request by the investment adviser in each instance.
(f) Not applicable.
(g) ) Aggregate non-audit fees billed by the registrant’s principal accountant for services rendered to the registrant, and rendered to the registrant’s investment adviser, and any entity controlling, controlled by, or under common control with the adviser that provides ongoing services to the registrant for each of the last two fiscal years of the registrant:
| | | | | | | | | | | | |
Fiscal Year ended 9/30/21 | | | Fiscal Year ended 9/30/2022 | |
$ | | %* | | | $ | | | %* | |
$65,259 | | | 0 | % | | $ | 0 | | | | 0 | % |
| * | Percentage of fees approved by the Audit Committee pursuant to (c)(7)(i)(C) of Rule 2-01 of Reg. S-X (statutory de minimis waiver of Committee’s requirement to pre-approve). |
(h) The registrant’s audit committee has considered whether the provision by the registrant’s principal accountant of non-audit services to the registrant’s investment adviser and any entity controlling, controlled by, or under common control with the adviser that provides ongoing services to the registrant that were not pre-approved pursuant to Rule 2-01(c)(7)(ii) of Regulation S-X is compatible with maintaining the principal accountant’s independence.
Item 5. Audit Committee of Listed Registrants
Not applicable.
Item 6. Schedule of Investments
Please see schedule of investments contained in the Report to Stockholders included under Item 1 of this Form N-CSR.
Item 7. Disclosure of Proxy Voting Policies and Procedures for Closed-End Management Investment Companies
Not applicable.
Item 8. Portfolio Managers of Closed-End Management Investment Companies
Not applicable.
Item 9. Purchases of Equity Securities by Closed-End Management Investment Company and Affiliated Purchasers
Not applicable.
Item 10. Submission of Matters to a Vote of Security Holders
No material changes.
Item 11. Controls and Procedures
(a) The registrant’s principal executive and principal financial officers have concluded that the registrant’s disclosure controls and procedures (as defined in Rule 30a-3(c) under the Investment Company Act of 1940 Act, as amended (the “1940 Act”) are effective, based on the evaluation of these controls and procedures required by Rule 30a-3(b) under the 1940 Act and Rules 13a-15(b) or 15d-15(b) under the Securities Exchange Act of 1934 (“Exchange Act”), as of a date within 90 days of the filing date of this report.
(b) There was no change in the registrant’s internal control over financial reporting (as defined in Rule 30a-3(d) under the 1940 Act) that occurred during the period covered by this report that has materially affected, or is reasonably likely to materially affect, the registrant’s internal control over financial reporting.
Item 12. Disclosure of Securities Lending Activities for Closed-End Management Investment Companies
Not applicable.
Item 13. Exhibits
Signatures
Pursuant to the requirements of the Securities Exchange Act of 1934 and the Investment Company Act of 1940, the registrant has duly caused this report to be signed on its behalf by the undersigned, thereunto duly authorized.
| | |
| CALVERT WORLD VALUES FUND, INC. |
| |
| By: | | /s/ John H. Streur |
| | John H. Streur |
| | President |
| |
| Date: | | November 22, 2022 |
Pursuant to the requirements of the Securities Exchange Act of 1934 and the Investment Company Act of 1940, this report has been signed below by the following persons on behalf of the registrant and in the capacities and on the dates indicated.
| | |
| By: | | /s/ James F. Kirchner |
| | James F. Kirchner |
| | Treasurer |
| |
| Date: | | November 22, 2022 |
| |
| By: | | /s/ John H. Streur |
| | John H. Streur |
| | President |
| |
| Date: | | November 22, 2022 |