0000884110eatonvance:C000118374Member2022-12-310000884110eatonvance:EATONVANCEIndexMSCIEAFEnf19388BroadBasedIndexMember2017-06-300000884110eatonvance:EATONVANCEIndexMSCIEAFE19276BroadBasedIndexMember2020-03-310000884110eatonvance:EATONVANCEIndexRussellMidcap19155AdditionalIndexMember2020-05-31
UNITED STATES
SECURITIES AND EXCHANGE COMMISSION
Washington, D.C. 20549
Form N-CSR
CERTIFIED SHAREHOLDER REPORT OF REGISTERED
MANAGEMENT INVESTMENT COMPANIES
Investment Company Act File Number: 811-06563
Calvert World Values Fund, Inc.
(Exact Name of Registrant as Specified in Charter)
2050 M Street NW, Suite 200, Washington, DC 20036
(Address of Principal Executive Offices)
Deidre E. Walsh
One Post Office Square, Boston, Massachusetts 02109
(Name and Address of Agent for Services)
(202) 238-2200
(Registrant’s Telephone Number)
September 30
Date of Fiscal Year End
September 30, 2024
Date of Reporting Period
Item 1. Reports to Stockholders
(a)
Calvert Emerging Markets Advancement Fund
Annual Shareholder Report September 30, 2024
This annual shareholder report contains important information about the Calvert Emerging Markets Advancement Fund for the period of October 1, 2023 to September 30, 2024. You can find additional information about the Fund at www.eatonvance.com/calvert-fund-documents.php. You can also request this information by contacting us at 1-800-368-2745.
What were the Fund costs for the last year?
(based on a hypothetical $10,000 investment)
| Class Name | Costs of a $10,000 investment | Costs paid as a percentage of a $10,000 investment |
|---|
| Class A | $136 | 1.22% |
How did the Fund perform last year and what affected its performance?
Key contributors to (↑) and detractors from (↓) performance, relative to the MSCI Emerging Markets Index (the Index):
↓ The Fund’s underweight exposure to China detracted most from Index-relative returns as direct Chinese government intervention helped drive market rallies
↓ An underweight exposure to Taiwan ― in particular its largest stock, Taiwan Semiconductor Manufacturing Co. ― detracted from Index-relative returns as the Fund sought to enhance its level of portfolio diversification
↓ The Fund’s underweight exposure to India ― based on the country’s high valuations ― detracted from returns as the Indian market soared despite its lofty prices
↑ An overweight exposure to Greece contributed most to returns as government reforms took hold, the country’s debt rating improved, and its growth accelerated
↑ The Fund’s overweight exposure to Poland aided performance as the election of a pro-European coalition promised a more favorable business environment
↑ An overweight exposure to South Korea early in the period ― later followed by an underweight reallocation ― helped as a rally based on shareholder-friendly actions and a rise in the country’s technology exports shifted course
Comparison of the change in value of a $10,000 investment for the period indicated.

| Class A with Maximum Sales Charge | MSCI Emerging Markets Index | Calvert Emerging Markets Responsible Index |
|---|
| 10/19 | $9,475 | $10,000 | $10,000 |
| 11/19 | $9,835 | $11,676 | $10,405 |
| 12/19 | $10,457 | $12,547 | $11,153 |
| 1/20 | $9,971 | $11,962 | $10,667 |
| 2/20 | $9,533 | $11,331 | $10,152 |
| 3/20 | $8,047 | $9,586 | $8,529 |
| 4/20 | $8,571 | $10,464 | $9,348 |
| 5/20 | $8,714 | $10,544 | $9,439 |
| 6/20 | $9,219 | $11,319 | $10,192 |
| 7/20 | $9,876 | $12,331 | $11,120 |
| 8/20 | $10,219 | $12,603 | $11,389 |
| 9/20 | $10,133 | $12,401 | $11,231 |
| 10/20 | $10,228 | $12,657 | $11,494 |
| 11/20 | $11,247 | $13,827 | $12,565 |
| 12/20 | $12,037 | $14,844 | $13,426 |
| 1/21 | $12,409 | $15,299 | $13,863 |
| 2/21 | $12,524 | $15,416 | $14,002 |
| 3/21 | $12,305 | $15,183 | $13,733 |
| 4/21 | $12,571 | $15,561 | $14,141 |
| 5/21 | $12,562 | $15,922 | $14,398 |
| 6/21 | $12,762 | $15,950 | $14,459 |
| 7/21 | $12,009 | $14,876 | $13,435 |
| 8/21 | $12,266 | $15,266 | $13,821 |
| 9/21 | $11,809 | $14,659 | $13,170 |
| 10/21 | $12,181 | $14,803 | $13,226 |
| 11/21 | $11,904 | $14,200 | $12,696 |
| 12/21 | $12,043 | $14,467 | $12,893 |
| 1/22 | $12,063 | $14,193 | $12,603 |
| 2/22 | $11,953 | $13,769 | $12,248 |
| 3/22 | $11,684 | $13,458 | $12,088 |
| 4/22 | $11,345 | $12,709 | $11,373 |
| 5/22 | $11,495 | $12,765 | $11,479 |
| 6/22 | $10,708 | $11,917 | $10,520 |
| 7/22 | $10,748 | $11,887 | $10,607 |
| 8/22 | $10,778 | $11,937 | $10,672 |
| 9/22 | $9,752 | $10,538 | $9,452 |
| 10/22 | $9,971 | $10,210 | $9,252 |
| 11/22 | $10,648 | $11,725 | $10,671 |
| 12/22 | $10,193 | $11,560 | $10,503 |
| 1/23 | $10,948 | $12,473 | $11,293 |
| 2/23 | $10,528 | $11,664 | $10,616 |
| 3/23 | $10,518 | $12,017 | $10,841 |
| 4/23 | $10,539 | $11,881 | $10,760 |
| 5/23 | $10,413 | $11,682 | $10,680 |
| 6/23 | $10,959 | $12,125 | $11,124 |
| 7/23 | $11,557 | $12,880 | $11,776 |
| 8/23 | $10,990 | $12,087 | $11,037 |
| 9/23 | $10,549 | $11,770 | $10,732 |
| 10/23 | $10,077 | $11,313 | $10,336 |
| 11/23 | $11,032 | $12,219 | $11,304 |
| 12/23 | $11,355 | $12,696 | $11,774 |
| 1/24 | $11,182 | $12,107 | $11,146 |
| 2/24 | $11,755 | $12,683 | $11,646 |
| 3/24 | $12,058 | $12,997 | $11,961 |
| 4/24 | $12,079 | $13,055 | $11,875 |
| 5/24 | $12,036 | $13,129 | $12,004 |
| 6/24 | $12,469 | $13,647 | $12,486 |
| 7/24 | $12,728 | $13,687 | $12,470 |
| 8/24 | $12,880 | $13,908 | $12,766 |
| 9/24 | $12,928 | $13,258 | $13,627 |
Average Annual Total Returns (%)
| AATR | 1 Year | Since 10/1/19 (Inception) |
|---|
| Class A | 22.50% | 6.40% |
| Class A with 5.25% Maximum Sales Charge | 16.03% | 5.27% |
| MSCI Emerging Markets Index (net of foreign withholding taxes) | 26.05% | 5.80% |
Calvert Emerging Markets Responsible IndexFootnote Reference1 | 26.73% | 6.38% |
| Footnote | Description |
Footnote1 | Index is composed of companies that operate their businesses in a manner that is consistent with The Calvert Principles for Responsible Investment and are selected from the 1,000 largest companies by market capitalization that are located in or tied economically to countries that the Adviser has classified as emerging market countries. |
Performance does not reflect the deduction of taxes that a shareholder would pay on Fund distributions or redemption of Fund shares. Performance assumes that all dividends and distributions, if any, were reinvested. For more recent performance information, visit www.eatonvance.com/performance.php.
THE FUND'S PAST PERFORMANCE IS NO GUARANTEE OF FUTURE RESULTS.
| Total Net Assets | $91,259,604 |
| # of Portfolio Holdings | 285 |
| Portfolio Turnover Rate | 76% |
| Total Advisory Fees Paid | $392,624 |
What did the Fund invest in?
The following tables reflect what the Fund invested in as of the report date.
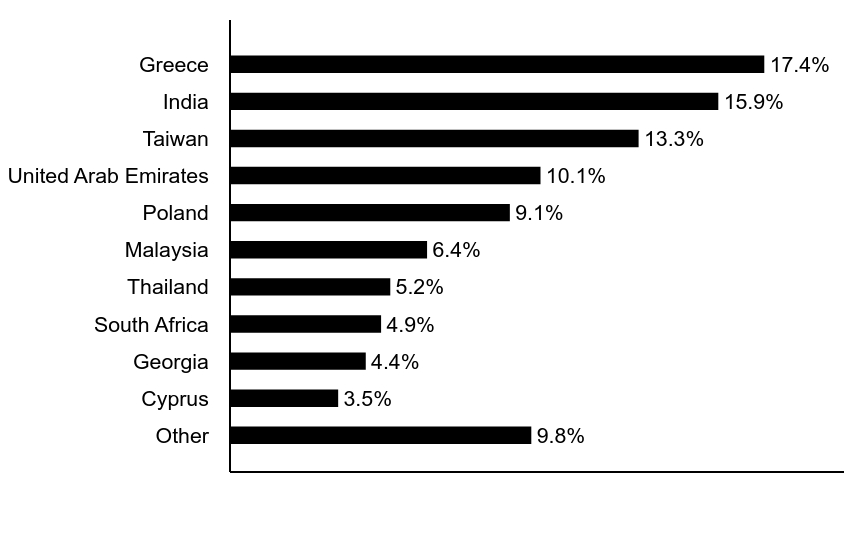
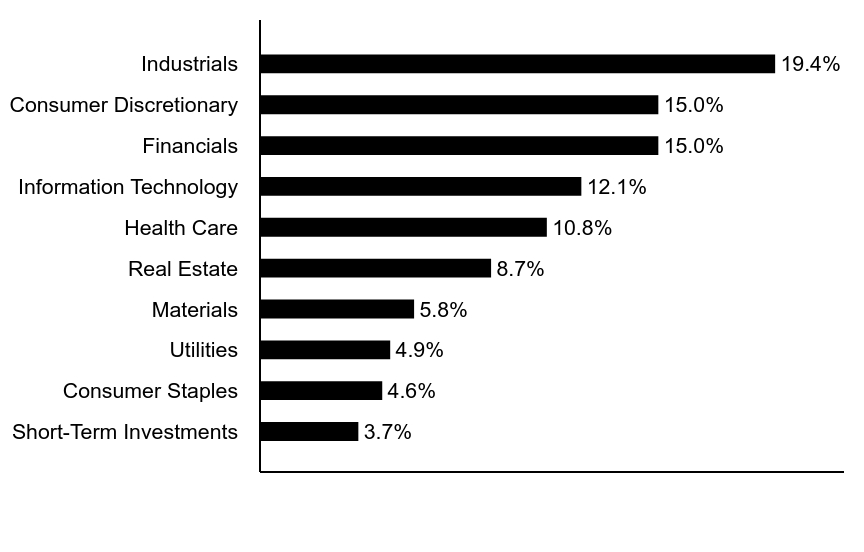
Country Allocation (% of total investments)
| Value | Value |
|---|
| Other | 9.8% |
| Cyprus | 3.5% |
| Georgia | 4.4% |
| South Africa | 4.9% |
| Thailand | 5.2% |
| Malaysia | 6.4% |
| Poland | 9.1% |
| United Arab Emirates | 10.1% |
| Taiwan | 13.3% |
| India | 15.9% |
| Greece | 17.4% |
Top Ten Holdings (% of total investments)Footnote Referencea
| Taiwan Semiconductor Manufacturing Co. Ltd. | 5.4% |
| Bank of Cyprus Holdings PLC | 3.5% |
| Aldar Properties PJSC | 3.5% |
| Emirates Telecommunications Group Co. PJSC | 3.3% |
| National Bank of Greece SA | 2.8% |
| Public Power Corp. SA | 2.5% |
| Eurobank Ergasias Services & Holdings SA, Class A | 2.5% |
| Nova Ljubljanska Banka DD GDR | 2.4% |
| FPT Corp. | 2.0% |
| Piraeus Financial Holdings SA | 1.9% |
| Total | 29.8% |
| Footnote | Description |
Footnotea | Excluding cash equivalents |
If you wish to view additional information about the Fund, including the prospectus, statement of additional information, financial statements and holdings, please scan the QR code or visit www.eatonvance.com/calvert-fund-documents.php. For proxy information, please visit www.calvert.com/active-engagement.php?DM=how-we-influence.
The Funds may deliver a single copy of certain required shareholder documents (including prospectuses, shareholder reports, and proxy materials) to investors with the same last name and the same address. Your participation will continue indefinitely unless you instruct otherwise by calling 1-800-368-2745 or by contacting your financial intermediary. Your instruction will typically be effective within 30 days of receipt.
Not FDIC Insured | May Lose Value | No Bank Guarantee
Annual Shareholder Report September 30, 2024
Calvert Emerging Markets Advancement Fund
Annual Shareholder Report September 30, 2024
This annual shareholder report contains important information about the Calvert Emerging Markets Advancement Fund for the period of October 1, 2023 to September 30, 2024. You can find additional information about the Fund at www.eatonvance.com/calvert-fund-documents.php. You can also request this information by contacting us at 1-800-368-2745.
What were the Fund costs for the last year?
(based on a hypothetical $10,000 investment)
| Class Name | Costs of a $10,000 investment | Costs paid as a percentage of a $10,000 investment |
|---|
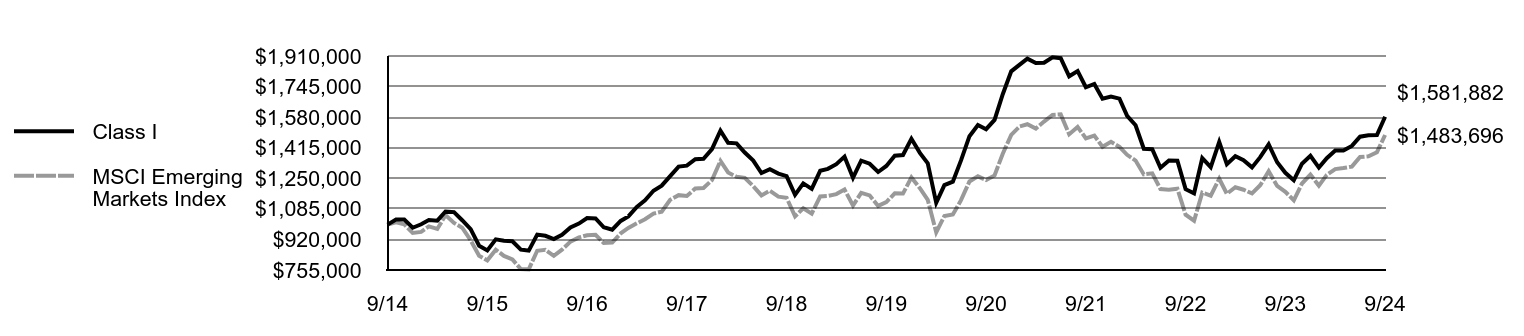
| Class I | $108 | 0.97% |
How did the Fund perform last year and what affected its performance?
Key contributors to (↑) and detractors from (↓) performance, relative to the MSCI Emerging Markets Index (the Index):
↓ The Fund’s underweight exposure to China detracted most from Index-relative returns as direct Chinese government intervention helped drive market rallies
↓ An underweight exposure to Taiwan ― in particular its largest stock, Taiwan Semiconductor Manufacturing Co. ― detracted from Index-relative returns as the Fund sought to enhance its level of portfolio diversification
↓ The Fund’s underweight exposure to India ― based on the country’s high valuations ― detracted from returns as the Indian market soared despite its lofty prices
↑ An overweight exposure to Greece contributed most to returns as government reforms took hold, the country’s debt rating improved, and its growth accelerated
↑ The Fund’s overweight exposure to Poland aided performance as the election of a pro-European coalition promised a more favorable business environment
↑ An overweight exposure to South Korea early in the period ― later followed by an underweight reallocation ― helped as a rally based on shareholder-friendly actions and a rise in the country’s technology exports shifted course
Comparison of the change in value of a $1,000,000 investment for the period indicated.
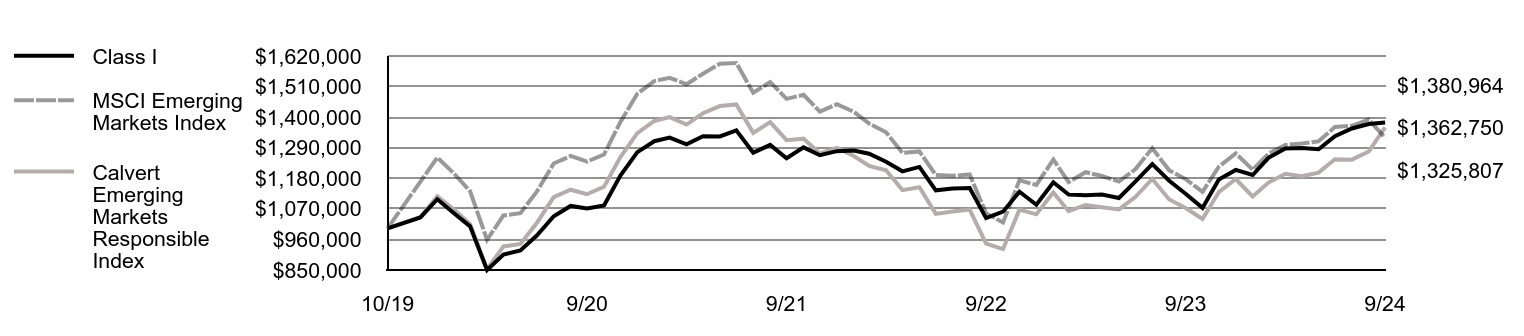
| Class I | MSCI Emerging Markets Index | Calvert Emerging Markets Responsible Index |
|---|
| 10/19 | $1,000,000 | $1,000,000 | $1,000,000 |
| 11/19 | $1,038,997 | $1,167,595 | $1,040,479 |
| 12/19 | $1,104,599 | $1,254,704 | $1,115,295 |
| 1/20 | $1,053,341 | $1,196,217 | $1,066,749 |
| 2/20 | $1,007,108 | $1,133,136 | $1,015,169 |
| 3/20 | $850,310 | $958,608 | $852,868 |
| 4/20 | $905,587 | $1,046,391 | $934,757 |
| 5/20 | $920,665 | $1,054,428 | $943,894 |
| 6/20 | $973,933 | $1,131,938 | $1,019,217 |
| 7/20 | $1,043,282 | $1,233,090 | $1,112,044 |
| 8/20 | $1,080,469 | $1,260,347 | $1,138,875 |
| 9/20 | $1,071,420 | $1,240,132 | $1,123,137 |
| 10/20 | $1,082,481 | $1,265,682 | $1,149,434 |
| 11/20 | $1,190,031 | $1,382,742 | $1,256,496 |
| 12/20 | $1,274,099 | $1,484,392 | $1,342,632 |
| 1/21 | $1,313,350 | $1,529,900 | $1,386,342 |
| 2/21 | $1,326,427 | $1,541,602 | $1,400,170 |
| 3/21 | $1,302,282 | $1,518,320 | $1,373,293 |
| 4/21 | $1,331,471 | $1,556,123 | $1,414,052 |
| 5/21 | $1,330,469 | $1,592,210 | $1,439,842 |
| 6/21 | $1,352,610 | $1,594,954 | $1,445,864 |
| 7/21 | $1,272,102 | $1,487,616 | $1,343,501 |
| 8/21 | $1,300,281 | $1,526,554 | $1,382,068 |
| 9/21 | $1,251,974 | $1,465,888 | $1,317,005 |
| 10/21 | $1,291,224 | $1,480,346 | $1,322,646 |
| 11/21 | $1,263,044 | $1,420,017 | $1,269,581 |
| 12/21 | $1,277,709 | $1,446,662 | $1,289,331 |
| 1/22 | $1,279,814 | $1,419,278 | $1,260,272 |
| 2/22 | $1,268,237 | $1,376,855 | $1,224,775 |
| 3/22 | $1,239,820 | $1,345,758 | $1,208,783 |
| 4/22 | $1,205,088 | $1,270,898 | $1,137,318 |
| 5/22 | $1,220,875 | $1,276,494 | $1,147,913 |
| 6/22 | $1,136,677 | $1,191,671 | $1,051,988 |
| 7/22 | $1,142,992 | $1,188,744 | $1,060,700 |
| 8/22 | $1,145,097 | $1,193,707 | $1,067,201 |
| 9/22 | $1,036,691 | $1,053,766 | $945,207 |
| 10/22 | $1,059,846 | $1,021,048 | $925,212 |
| 11/22 | $1,131,415 | $1,172,488 | $1,067,075 |
| 12/22 | $1,084,596 | $1,156,008 | $1,050,349 |
| 1/23 | $1,165,636 | $1,247,288 | $1,129,285 |
| 2/23 | $1,121,231 | $1,166,411 | $1,061,596 |
| 3/23 | $1,119,010 | $1,201,738 | $1,084,099 |
| 4/23 | $1,121,231 | $1,188,119 | $1,075,958 |
| 5/23 | $1,109,019 | $1,168,163 | $1,068,007 |
| 6/23 | $1,167,856 | $1,212,518 | $1,112,442 |
| 7/23 | $1,231,133 | $1,287,999 | $1,177,642 |
| 8/23 | $1,171,186 | $1,208,658 | $1,103,749 |
| 9/23 | $1,124,561 | $1,177,049 | $1,073,205 |
| 10/23 | $1,073,495 | $1,131,315 | $1,033,588 |
| 11/23 | $1,175,627 | $1,221,854 | $1,130,363 |
| 12/23 | $1,210,203 | $1,269,621 | $1,177,352 |
| 1/24 | $1,191,866 | $1,210,668 | $1,114,570 |
| 2/24 | $1,253,752 | $1,268,263 | $1,164,620 |
| 3/24 | $1,286,986 | $1,299,690 | $1,196,051 |
| 4/24 | $1,289,278 | $1,305,505 | $1,187,512 |
| 5/24 | $1,284,694 | $1,312,879 | $1,200,443 |
| 6/24 | $1,331,681 | $1,364,663 | $1,248,573 |
| 7/24 | $1,359,186 | $1,368,725 | $1,247,015 |
| 8/24 | $1,375,230 | $1,390,823 | $1,276,608 |
| 9/24 | $1,380,964 | $1,325,807 | $1,362,750 |
Average Annual Total Returns (%)
| AATR | 1 Year | Since 10/1/19 (Inception) |
|---|
| Class I | 22.80% | 6.66% |
| MSCI Emerging Markets Index (net of foreign withholding taxes) | 26.05% | 5.80% |
Calvert Emerging Markets Responsible IndexFootnote Reference1 | 26.73% | 6.38% |
| Footnote | Description |
Footnote1 | Index is composed of companies that operate their businesses in a manner that is consistent with The Calvert Principles for Responsible Investment and are selected from the 1,000 largest companies by market capitalization that are located in or tied economically to countries that the Adviser has classified as emerging market countries. |
Performance does not reflect the deduction of taxes that a shareholder would pay on Fund distributions or redemption of Fund shares. Performance assumes that all dividends and distributions, if any, were reinvested. For more recent performance information, visit www.eatonvance.com/performance.php.
THE FUND'S PAST PERFORMANCE IS NO GUARANTEE OF FUTURE RESULTS.
| Total Net Assets | $91,259,604 |
| # of Portfolio Holdings | 285 |
| Portfolio Turnover Rate | 76% |
| Total Advisory Fees Paid | $392,624 |
What did the Fund invest in?
The following tables reflect what the Fund invested in as of the report date.
Country Allocation (% of total investments)
| Value | Value |
|---|
| Other | 9.8% |
| Cyprus | 3.5% |
| Georgia | 4.4% |
| South Africa | 4.9% |
| Thailand | 5.2% |
| Malaysia | 6.4% |
| Poland | 9.1% |
| United Arab Emirates | 10.1% |
| Taiwan | 13.3% |
| India | 15.9% |
| Greece | 17.4% |
Top Ten Holdings (% of total investments)Footnote Referencea
| Taiwan Semiconductor Manufacturing Co. Ltd. | 5.4% |
| Bank of Cyprus Holdings PLC | 3.5% |
| Aldar Properties PJSC | 3.5% |
| Emirates Telecommunications Group Co. PJSC | 3.3% |
| National Bank of Greece SA | 2.8% |
| Public Power Corp. SA | 2.5% |
| Eurobank Ergasias Services & Holdings SA, Class A | 2.5% |
| Nova Ljubljanska Banka DD GDR | 2.4% |
| FPT Corp. | 2.0% |
| Piraeus Financial Holdings SA | 1.9% |
| Total | 29.8% |
| Footnote | Description |
Footnotea | Excluding cash equivalents |
If you wish to view additional information about the Fund, including the prospectus, statement of additional information, financial statements and holdings, please scan the QR code or visit www.eatonvance.com/calvert-fund-documents.php. For proxy information, please visit www.calvert.com/active-engagement.php?DM=how-we-influence.
The Funds may deliver a single copy of certain required shareholder documents (including prospectuses, shareholder reports, and proxy materials) to investors with the same last name and the same address. Your participation will continue indefinitely unless you instruct otherwise by calling 1-800-368-2745 or by contacting your financial intermediary. Your instruction will typically be effective within 30 days of receipt.
Not FDIC Insured | May Lose Value | No Bank Guarantee
Annual Shareholder Report September 30, 2024
Calvert Emerging Markets Equity Fund
Annual Shareholder Report September 30, 2024
This annual shareholder report contains important information about the Calvert Emerging Markets Equity Fund for the period of October 1, 2023 to September 30, 2024. You can find additional information about the Fund at www.eatonvance.com/calvert-fund-documents.php. You can also request this information by contacting us at 1-800-368-2745.
This report describes changes to the Fund that occurred during the reporting period.
What were the Fund costs for the last year?
(based on a hypothetical $10,000 investment)
| Class Name | Costs of a $10,000 investment | Costs paid as a percentage of a $10,000 investment |
|---|
| Class A | $143 | 1.28% |
How did the Fund perform last year and what affected its performance?
Key contributors to (↑) and detractors from (↓) performance, relative to the MSCI Emerging Markets Index (the Index):
↓ An underweight position in Alibaba Group Holding Ltd. hurt returns as Chinese e-commerce benefited from government stimulus. The stock was sold by period-end
↓ An overweight position in Samsung Electronics Co., a leading memory chipmaker, detracted from returns relative to the Index as analysts forecasted a slowdown in demand for smartphones and PCs
↓ An overweight position in Shenzhen Inovance Technology Co., an industrial automation firm, detracted from returns relative to the Index due to a downturn in demand for solar-driven products as well as competitive pricing pressures
↑ Taiwan Semiconductor Manufacturing Co. contributed to returns as its technological leadership was seen as key for AI semiconductors
↑ Micron Technology, Inc., a maker of computer memory and data storage products, helped returns as price hikes for memory chips led to strong sales and earnings
↑ An allocation to Lotes Co., a supplier of connectors and sockets, aided returns on solid revenue and gross margins driven by demand for PCs and server sockets
Comparison of the change in value of a $10,000 investment for the period indicated.
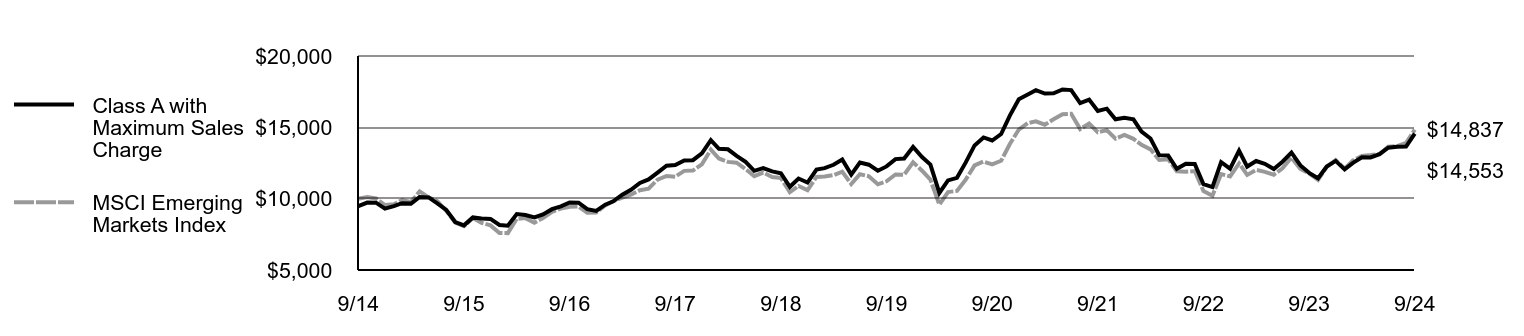
| Class A with Maximum Sales Charge | MSCI Emerging Markets Index |
|---|
| 9/14 | $9,475 | $10,000 |
| 10/14 | $9,727 | $10,118 |
| 11/14 | $9,720 | $10,011 |
| 12/14 | $9,303 | $9,550 |
| 1/15 | $9,482 | $9,607 |
| 2/15 | $9,683 | $9,904 |
| 3/15 | $9,653 | $9,763 |
| 4/15 | $10,116 | $10,514 |
| 5/15 | $10,086 | $10,093 |
| 6/15 | $9,668 | $9,831 |
| 7/15 | $9,206 | $9,150 |
| 8/15 | $8,363 | $8,322 |
| 9/15 | $8,131 | $8,072 |
| 10/15 | $8,683 | $8,648 |
| 11/15 | $8,616 | $8,310 |
| 12/15 | $8,579 | $8,125 |
| 1/16 | $8,157 | $7,598 |
| 2/16 | $8,105 | $7,585 |
| 3/16 | $8,918 | $8,589 |
| 4/16 | $8,850 | $8,636 |
| 5/16 | $8,684 | $8,314 |
| 6/16 | $8,895 | $8,646 |
| 7/16 | $9,264 | $9,081 |
| 8/16 | $9,459 | $9,307 |
| 9/16 | $9,738 | $9,426 |
| 10/16 | $9,715 | $9,449 |
| 11/16 | $9,264 | $9,014 |
| 12/16 | $9,141 | $9,034 |
| 1/17 | $9,580 | $9,528 |
| 2/17 | $9,814 | $9,820 |
| 3/17 | $10,283 | $10,068 |
| 4/17 | $10,616 | $10,288 |
| 5/17 | $11,101 | $10,592 |
| 6/17 | $11,350 | $10,699 |
| 7/17 | $11,827 | $11,337 |
| 8/17 | $12,311 | $11,590 |
| 9/17 | $12,357 | $11,544 |
| 10/17 | $12,675 | $11,948 |
| 11/17 | $12,697 | $11,972 |
| 12/17 | $13,181 | $12,402 |
| 1/18 | $14,105 | $13,436 |
| 2/18 | $13,499 | $12,816 |
| 3/18 | $13,461 | $12,578 |
| 4/18 | $12,999 | $12,522 |
| 5/18 | $12,582 | $12,078 |
| 6/18 | $11,953 | $11,577 |
| 7/18 | $12,142 | $11,831 |
| 8/18 | $11,915 | $11,511 |
| 9/18 | $11,786 | $11,450 |
| 10/18 | $10,831 | $10,453 |
| 11/18 | $11,412 | $10,884 |
| 12/18 | $11,130 | $10,595 |
| 1/19 | $12,039 | $11,523 |
| 2/19 | $12,138 | $11,549 |
| 3/19 | $12,375 | $11,646 |
| 4/19 | $12,742 | $11,891 |
| 5/19 | $11,687 | $11,028 |
| 6/19 | $12,535 | $11,716 |
| 7/19 | $12,382 | $11,573 |
| 8/19 | $11,962 | $11,009 |
| 9/19 | $12,260 | $11,219 |
| 10/19 | $12,772 | $11,692 |
| 11/19 | $12,810 | $11,676 |
| 12/19 | $13,624 | $12,547 |
| 1/20 | $12,917 | $11,962 |
| 2/20 | $12,388 | $11,331 |
| 3/20 | $10,400 | $9,586 |
| 4/20 | $11,283 | $10,464 |
| 5/20 | $11,459 | $10,544 |
| 6/20 | $12,526 | $11,319 |
| 7/20 | $13,731 | $12,331 |
| 8/20 | $14,291 | $12,603 |
| 9/20 | $14,077 | $12,401 |
| 10/20 | $14,530 | $12,657 |
| 11/20 | $15,819 | $13,827 |
| 12/20 | $16,969 | $14,844 |
| 1/21 | $17,300 | $15,299 |
| 2/21 | $17,600 | $15,416 |
| 3/21 | $17,369 | $15,183 |
| 4/21 | $17,385 | $15,561 |
| 5/21 | $17,654 | $15,922 |
| 6/21 | $17,608 | $15,950 |
| 7/21 | $16,699 | $14,876 |
| 8/21 | $16,946 | $15,266 |
| 9/21 | $16,145 | $14,659 |
| 10/21 | $16,307 | $14,803 |
| 11/21 | $15,560 | $14,200 |
| 12/21 | $15,670 | $14,467 |
| 1/22 | $15,562 | $14,193 |
| 2/22 | $14,697 | $13,769 |
| 3/22 | $14,218 | $13,458 |
| 4/22 | $13,052 | $12,709 |
| 5/22 | $13,021 | $12,765 |
| 6/22 | $12,094 | $11,917 |
| 7/22 | $12,450 | $11,887 |
| 8/22 | $12,434 | $11,937 |
| 9/22 | $11,013 | $10,538 |
| 10/22 | $10,812 | $10,210 |
| 11/22 | $12,558 | $11,725 |
| 12/22 | $12,104 | $11,560 |
| 1/23 | $13,361 | $12,473 |
| 2/23 | $12,251 | $11,664 |
| 3/23 | $12,639 | $12,017 |
| 4/23 | $12,445 | $11,881 |
| 5/23 | $12,080 | $11,682 |
| 6/23 | $12,593 | $12,125 |
| 7/23 | $13,222 | $12,880 |
| 8/23 | $12,329 | $12,087 |
| 9/23 | $11,809 | $11,770 |
| 10/23 | $11,428 | $11,313 |
| 11/23 | $12,251 | $12,219 |
| 12/23 | $12,646 | $12,696 |
| 1/24 | $12,051 | $12,107 |
| 2/24 | $12,513 | $12,683 |
| 3/24 | $12,896 | $12,997 |
| 4/24 | $12,888 | $13,055 |
| 5/24 | $13,123 | $13,129 |
| 6/24 | $13,576 | $13,647 |
| 7/24 | $13,639 | $13,687 |
| 8/24 | $13,655 | $13,908 |
| 9/24 | $14,553 | $14,837 |
Average Annual Total Returns (%)
| Fund | 1 Year | 5 Years | 10 Years |
|---|
| Class A | 23.25% | 3.49% | 4.38% |
| Class A with 5.25% Maximum Sales Charge | 16.80% | 2.38% | 3.82% |
| MSCI Emerging Markets Index (net of foreign withholding taxes) | 26.05% | 5.74% | 4.02% |
Performance does not reflect the deduction of taxes that a shareholder would pay on Fund distributions or redemption of Fund shares. Performance assumes that all dividends and distributions, if any, were reinvested. For more recent performance information, visit www.eatonvance.com/performance.php. Performance prior to December 31, 2016 is that of the Fund's former investment adviser.
THE FUND'S PAST PERFORMANCE IS NO GUARANTEE OF FUTURE RESULTS.
| Total Net Assets | $1,486,454,881 |
| # of Portfolio Holdings | 61 |
| Portfolio Turnover Rate | 36% |
| Total Advisory Fees Paid | $11,919,013 |
What did the Fund invest in?
The following tables reflect what the Fund invested in as of the report date.
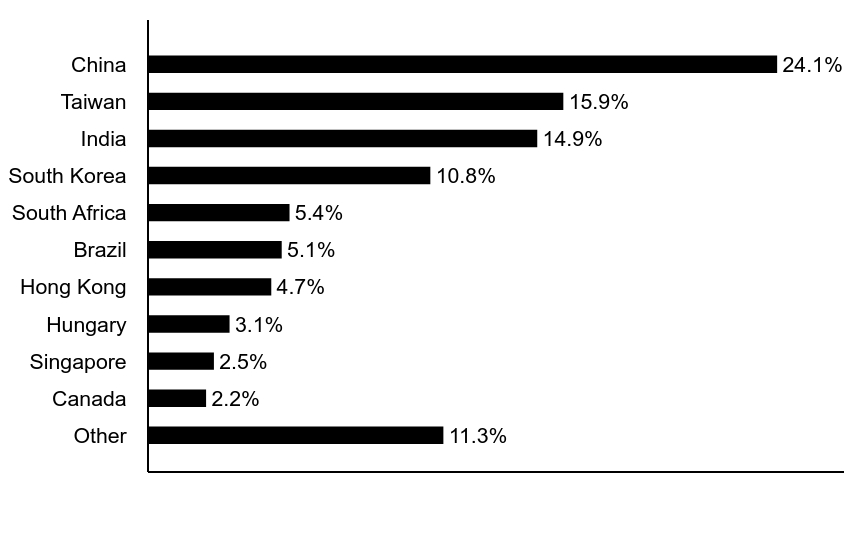
Country Allocation (% of total investments)
| Value | Value |
|---|
| Other | 11.3% |
| Canada | 2.2% |
| Singapore | 2.5% |
| Hungary | 3.1% |
| Hong Kong | 4.7% |
| Brazil | 5.1% |
| South Africa | 5.4% |
| South Korea | 10.8% |
| India | 14.9% |
| Taiwan | 15.9% |
| China | 24.1% |
Top Ten Holdings (% of total investments)Footnote Referencea
| Taiwan Semiconductor Manufacturing Co. Ltd. | 9.1% |
| Tencent Holdings Ltd. | 5.9% |
| Samsung Electronics Co. Ltd. | 5.4% |
| HDFC Bank Ltd. | 3.1% |
| Richter Gedeon Nyrt | 3.1% |
| Itausa SA, PFC Shares | 2.9% |
| ICICI Bank Ltd. | 2.9% |
| Infosys Ltd. | 2.8% |
| KB Financial Group, Inc. | 2.4% |
| NARI Technology Co. Ltd., Class A | 2.3% |
| Total | 39.9% |
| Footnote | Description |
Footnotea | Excluding cash equivalents |
This is a summary of certain changes to the Fund since September 30, 2023. For more complete information, you may review the Fund’s next prospectus, which we expect to be available by February 1, 2025 at www.eatonvance.com/calvert-fund-documents.php or upon request by contacting us at 1-800-368-2745.
In September 2024, the Fund's Board of Directors approved the termination of the investment sub-advisory agreement between Calvert Research and Management (CRM) and Hermes Investment Management Limited, which is expected to be effective November 11, 2024. CRM will continue to serve as the Fund's investment adviser.
Effective November 11, 2024, the Fund revised its responsible investing criteria to follow the Calvert Principles for Responsible Investment.
If you wish to view additional information about the Fund, including the prospectus, statement of additional information, financial statements and holdings, please scan the QR code or visit www.eatonvance.com/calvert-fund-documents.php. For proxy information, please visit www.calvert.com/active-engagement.php?DM=how-we-influence.
The Funds may deliver a single copy of certain required shareholder documents (including prospectuses, shareholder reports, and proxy materials) to investors with the same last name and the same address. Your participation will continue indefinitely unless you instruct otherwise by calling 1-800-368-2745 or by contacting your financial intermediary. Your instruction will typically be effective within 30 days of receipt.
Not FDIC Insured | May Lose Value | No Bank Guarantee
Annual Shareholder Report September 30, 2024
Calvert Emerging Markets Equity Fund
Annual Shareholder Report September 30, 2024
This annual shareholder report contains important information about the Calvert Emerging Markets Equity Fund for the period of October 1, 2023 to September 30, 2024. You can find additional information about the Fund at www.eatonvance.com/calvert-fund-documents.php. You can also request this information by contacting us at 1-800-368-2745.
This report describes changes to the Fund that occurred during the reporting period.
What were the Fund costs for the last year?
(based on a hypothetical $10,000 investment)
| Class Name | Costs of a $10,000 investment | Costs paid as a percentage of a $10,000 investment |
|---|
| Class C | $226 | 2.03% |
How did the Fund perform last year and what affected its performance?
Key contributors to (↑) and detractors from (↓) performance, relative to the MSCI Emerging Markets Index (the Index):
↓ An underweight position in Alibaba Group Holding Ltd. hurt returns as Chinese e-commerce benefited from government stimulus. The stock was sold by period-end
↓ An overweight position in Samsung Electronics Co., a leading memory chipmaker, detracted from returns relative to the Index as analysts forecasted a slowdown in demand for smartphones and PCs
↓ An overweight position in Shenzhen Inovance Technology Co., an industrial automation firm, detracted from returns relative to the Index due to a downturn in demand for solar-driven products as well as competitive pricing pressures
↑ Taiwan Semiconductor Manufacturing Co. contributed to returns as its technological leadership was seen as key for AI semiconductors
↑ Micron Technology, Inc., a maker of computer memory and data storage products, helped returns as price hikes for memory chips led to strong sales and earnings
↑ An allocation to Lotes Co., a supplier of connectors and sockets, aided returns on solid revenue and gross margins driven by demand for PCs and server sockets
Comparison of the change in value of a $10,000 investment for the period indicated.
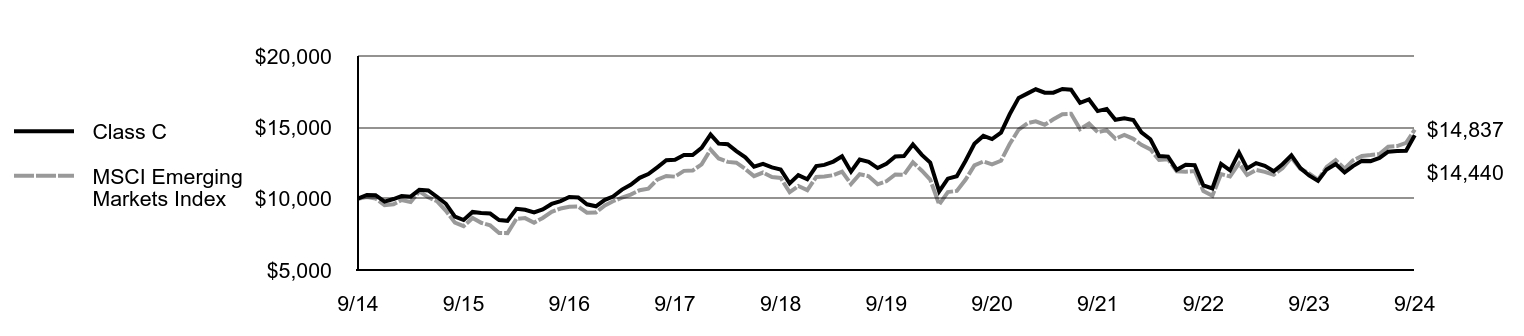
| Class C | MSCI Emerging Markets Index |
|---|
| 9/14 | $10,000 | $10,000 |
| 10/14 | $10,260 | $10,118 |
| 11/14 | $10,245 | $10,011 |
| 12/14 | $9,793 | $9,550 |
| 1/15 | $9,975 | $9,607 |
| 2/15 | $10,181 | $9,904 |
| 3/15 | $10,141 | $9,763 |
| 4/15 | $10,616 | $10,514 |
| 5/15 | $10,576 | $10,093 |
| 6/15 | $10,133 | $9,831 |
| 7/15 | $9,642 | $9,150 |
| 8/15 | $8,748 | $8,322 |
| 9/15 | $8,502 | $8,072 |
| 10/15 | $9,072 | $8,648 |
| 11/15 | $9,001 | $8,310 |
| 12/15 | $8,955 | $8,125 |
| 1/16 | $8,504 | $7,598 |
| 2/16 | $8,448 | $7,585 |
| 3/16 | $9,288 | $8,589 |
| 4/16 | $9,217 | $8,636 |
| 5/16 | $9,035 | $8,314 |
| 6/16 | $9,249 | $8,646 |
| 7/16 | $9,629 | $9,081 |
| 8/16 | $9,827 | $9,307 |
| 9/16 | $10,113 | $9,426 |
| 10/16 | $10,081 | $9,449 |
| 11/16 | $9,605 | $9,014 |
| 12/16 | $9,468 | $9,034 |
| 1/17 | $9,920 | $9,528 |
| 2/17 | $10,151 | $9,820 |
| 3/17 | $10,635 | $10,068 |
| 4/17 | $10,968 | $10,288 |
| 5/17 | $11,460 | $10,592 |
| 6/17 | $11,722 | $10,699 |
| 7/17 | $12,198 | $11,337 |
| 8/17 | $12,690 | $11,590 |
| 9/17 | $12,730 | $11,544 |
| 10/17 | $13,055 | $11,948 |
| 11/17 | $13,063 | $11,972 |
| 12/17 | $13,555 | $12,402 |
| 1/18 | $14,492 | $13,436 |
| 2/18 | $13,865 | $12,816 |
| 3/18 | $13,817 | $12,578 |
| 4/18 | $13,333 | $12,522 |
| 5/18 | $12,897 | $12,078 |
| 6/18 | $12,246 | $11,577 |
| 7/18 | $12,436 | $11,831 |
| 8/18 | $12,190 | $11,511 |
| 9/18 | $12,047 | $11,450 |
| 10/18 | $11,071 | $10,453 |
| 11/18 | $11,652 | $10,884 |
| 12/18 | $11,357 | $10,595 |
| 1/19 | $12,282 | $11,523 |
| 2/19 | $12,369 | $11,549 |
| 3/19 | $12,600 | $11,646 |
| 4/19 | $12,975 | $11,891 |
| 5/19 | $11,891 | $11,028 |
| 6/19 | $12,744 | $11,716 |
| 7/19 | $12,584 | $11,573 |
| 8/19 | $12,146 | $11,009 |
| 9/19 | $12,449 | $11,219 |
| 10/19 | $12,959 | $11,692 |
| 11/19 | $12,983 | $11,676 |
| 12/19 | $13,796 | $12,547 |
| 1/20 | $13,070 | $11,962 |
| 2/20 | $12,528 | $11,331 |
| 3/20 | $10,512 | $9,586 |
| 4/20 | $11,405 | $10,464 |
| 5/20 | $11,572 | $10,544 |
| 6/20 | $12,640 | $11,319 |
| 7/20 | $13,852 | $12,331 |
| 8/20 | $14,401 | $12,603 |
| 9/20 | $14,178 | $12,401 |
| 10/20 | $14,632 | $12,657 |
| 11/20 | $15,915 | $13,827 |
| 12/20 | $17,063 | $14,844 |
| 1/21 | $17,382 | $15,299 |
| 2/21 | $17,669 | $15,416 |
| 3/21 | $17,430 | $15,183 |
| 4/21 | $17,430 | $15,561 |
| 5/21 | $17,693 | $15,922 |
| 6/21 | $17,637 | $15,950 |
| 7/21 | $16,713 | $14,876 |
| 8/21 | $16,952 | $15,266 |
| 9/21 | $16,139 | $14,659 |
| 10/21 | $16,290 | $14,803 |
| 11/21 | $15,533 | $14,200 |
| 12/21 | $15,637 | $14,467 |
| 1/22 | $15,517 | $14,193 |
| 2/22 | $14,649 | $13,769 |
| 3/22 | $14,162 | $13,458 |
| 4/22 | $12,991 | $12,709 |
| 5/22 | $12,951 | $12,765 |
| 6/22 | $12,019 | $11,917 |
| 7/22 | $12,369 | $11,887 |
| 8/22 | $12,345 | $11,937 |
| 9/22 | $10,927 | $10,538 |
| 10/22 | $10,719 | $10,210 |
| 11/22 | $12,441 | $11,725 |
| 12/22 | $11,987 | $11,560 |
| 1/23 | $13,222 | $12,473 |
| 2/23 | $12,114 | $11,664 |
| 3/23 | $12,489 | $12,017 |
| 4/23 | $12,297 | $11,881 |
| 5/23 | $11,923 | $11,682 |
| 6/23 | $12,417 | $12,125 |
| 7/23 | $13,039 | $12,880 |
| 8/23 | $12,146 | $12,087 |
| 9/23 | $11,628 | $11,770 |
| 10/23 | $11,245 | $11,313 |
| 11/23 | $12,050 | $12,219 |
| 12/23 | $12,425 | $12,696 |
| 1/24 | $11,835 | $12,107 |
| 2/24 | $12,282 | $12,683 |
| 3/24 | $12,648 | $12,997 |
| 4/24 | $12,632 | $13,055 |
| 5/24 | $12,855 | $13,129 |
| 6/24 | $13,294 | $13,647 |
| 7/24 | $13,349 | $13,687 |
| 8/24 | $13,357 | $13,908 |
| 9/24 | $14,440 | $14,837 |
Average Annual Total Returns (%)
| Fund | 1 Year | 5 Years | 10 Years |
|---|
| Class C | 22.34% | 2.70% | 3.74% |
| Class C with 1% Maximum Deferred Sales Charge | 21.34% | 2.70% | 3.74% |
| MSCI Emerging Markets Index (net of foreign withholding taxes) | 26.05% | 5.74% | 4.02% |
Performance does not reflect the deduction of taxes that a shareholder would pay on Fund distributions or redemption of Fund shares. Performance assumes that all dividends and distributions, if any, were reinvested. For more recent performance information, visit www.eatonvance.com/performance.php. Performance prior to December 31, 2016 is that of the Fund's former investment adviser.
THE FUND'S PAST PERFORMANCE IS NO GUARANTEE OF FUTURE RESULTS.
| Total Net Assets | $1,486,454,881 |
| # of Portfolio Holdings | 61 |
| Portfolio Turnover Rate | 36% |
| Total Advisory Fees Paid | $11,919,013 |
What did the Fund invest in?
The following tables reflect what the Fund invested in as of the report date.
Country Allocation (% of total investments)
| Value | Value |
|---|
| Other | 11.3% |
| Canada | 2.2% |
| Singapore | 2.5% |
| Hungary | 3.1% |
| Hong Kong | 4.7% |
| Brazil | 5.1% |
| South Africa | 5.4% |
| South Korea | 10.8% |
| India | 14.9% |
| Taiwan | 15.9% |
| China | 24.1% |
Top Ten Holdings (% of total investments)Footnote Referencea
| Taiwan Semiconductor Manufacturing Co. Ltd. | 9.1% |
| Tencent Holdings Ltd. | 5.9% |
| Samsung Electronics Co. Ltd. | 5.4% |
| HDFC Bank Ltd. | 3.1% |
| Richter Gedeon Nyrt | 3.1% |
| Itausa SA, PFC Shares | 2.9% |
| ICICI Bank Ltd. | 2.9% |
| Infosys Ltd. | 2.8% |
| KB Financial Group, Inc. | 2.4% |
| NARI Technology Co. Ltd., Class A | 2.3% |
| Total | 39.9% |
| Footnote | Description |
Footnotea | Excluding cash equivalents |
This is a summary of certain changes to the Fund since September 30, 2023. For more complete information, you may review the Fund’s next prospectus, which we expect to be available by February 1, 2025 at www.eatonvance.com/calvert-fund-documents.php or upon request by contacting us at 1-800-368-2745.
In September 2024, the Fund's Board of Directors approved the termination of the investment sub-advisory agreement between Calvert Research and Management (CRM) and Hermes Investment Management Limited, which is expected to be effective November 11, 2024. CRM will continue to serve as the Fund's investment adviser.
Effective November 11, 2024, the Fund revised its responsible investing criteria to follow the Calvert Principles for Responsible Investment.
If you wish to view additional information about the Fund, including the prospectus, statement of additional information, financial statements and holdings, please scan the QR code or visit www.eatonvance.com/calvert-fund-documents.php. For proxy information, please visit www.calvert.com/active-engagement.php?DM=how-we-influence.
The Funds may deliver a single copy of certain required shareholder documents (including prospectuses, shareholder reports, and proxy materials) to investors with the same last name and the same address. Your participation will continue indefinitely unless you instruct otherwise by calling 1-800-368-2745 or by contacting your financial intermediary. Your instruction will typically be effective within 30 days of receipt.
Not FDIC Insured | May Lose Value | No Bank Guarantee
Annual Shareholder Report September 30, 2024
Calvert Emerging Markets Equity Fund
Annual Shareholder Report September 30, 2024
This annual shareholder report contains important information about the Calvert Emerging Markets Equity Fund for the period of October 1, 2023 to September 30, 2024. You can find additional information about the Fund at www.eatonvance.com/calvert-fund-documents.php. You can also request this information by contacting us at 1-800-368-2745.
This report describes changes to the Fund that occurred during the reporting period.
What were the Fund costs for the last year?
(based on a hypothetical $10,000 investment)
| Class Name | Costs of a $10,000 investment | Costs paid as a percentage of a $10,000 investment |
|---|
| Class I | $115 | 1.03% |
How did the Fund perform last year and what affected its performance?
Key contributors to (↑) and detractors from (↓) performance, relative to the MSCI Emerging Markets Index (the Index):
↓ An underweight position in Alibaba Group Holding Ltd. hurt returns as Chinese e-commerce benefited from government stimulus. The stock was sold by period-end
↓ An overweight position in Samsung Electronics Co., a leading memory chipmaker, detracted from returns relative to the Index as analysts forecasted a slowdown in demand for smartphones and PCs
↓ An overweight position in Shenzhen Inovance Technology Co., an industrial automation firm, detracted from returns relative to the Index due to a downturn in demand for solar-driven products as well as competitive pricing pressures
↑ Taiwan Semiconductor Manufacturing Co. contributed to returns as its technological leadership was seen as key for AI semiconductors
↑ Micron Technology, Inc., a maker of computer memory and data storage products, helped returns as price hikes for memory chips led to strong sales and earnings
↑ An allocation to Lotes Co., a supplier of connectors and sockets, aided returns on solid revenue and gross margins driven by demand for PCs and server sockets
Comparison of the change in value of a $1,000,000 investment for the period indicated.
| Class I | MSCI Emerging Markets Index |
|---|
| 9/14 | $1,000,000 | $1,000,000 |
| 10/14 | $1,027,152 | $1,011,791 |
| 11/14 | $1,027,146 | $1,001,089 |
| 12/14 | $982,979 | $954,953 |
| 1/15 | $1,001,774 | $960,677 |
| 2/15 | $1,024,487 | $990,422 |
| 3/15 | $1,021,359 | $976,338 |
| 4/15 | $1,070,702 | $1,051,433 |
| 5/15 | $1,067,571 | $1,009,327 |
| 6/15 | $1,023,715 | $983,113 |
| 7/15 | $975,152 | $914,965 |
| 8/15 | $885,858 | $832,209 |
| 9/15 | $860,790 | $807,173 |
| 10/15 | $920,319 | $864,752 |
| 11/15 | $913,266 | $831,020 |
| 12/15 | $910,351 | $812,495 |
| 1/16 | $865,151 | $759,785 |
| 2/16 | $859,599 | $758,542 |
| 3/16 | $946,036 | $858,918 |
| 4/16 | $939,689 | $863,586 |
| 5/16 | $922,241 | $831,373 |
| 6/16 | $945,243 | $864,600 |
| 7/16 | $984,104 | $908,109 |
| 8/16 | $1,005,512 | $930,677 |
| 9/16 | $1,035,641 | $942,644 |
| 10/16 | $1,033,267 | $944,892 |
| 11/16 | $985,688 | $901,398 |
| 12/16 | $972,553 | $903,388 |
| 1/17 | $1,019,743 | $952,824 |
| 2/17 | $1,044,532 | $981,992 |
| 3/17 | $1,095,723 | $1,006,781 |
| 4/17 | $1,130,919 | $1,028,822 |
| 5/17 | $1,182,900 | $1,059,239 |
| 6/17 | $1,210,089 | $1,069,902 |
| 7/17 | $1,261,278 | $1,133,678 |
| 8/17 | $1,313,274 | $1,158,965 |
| 9/17 | $1,318,066 | $1,154,357 |
| 10/17 | $1,353,266 | $1,194,824 |
| 11/17 | $1,355,673 | $1,197,222 |
| 12/17 | $1,407,419 | $1,240,199 |
| 1/18 | $1,506,859 | $1,343,565 |
| 2/18 | $1,441,907 | $1,281,600 |
| 3/18 | $1,438,690 | $1,257,771 |
| 4/18 | $1,388,961 | $1,252,206 |
| 5/18 | $1,345,662 | $1,207,836 |
| 6/18 | $1,278,304 | $1,157,654 |
| 7/18 | $1,299,150 | $1,183,084 |
| 8/18 | $1,275,083 | $1,151,095 |
| 9/18 | $1,261,448 | $1,144,985 |
| 10/18 | $1,160,408 | $1,045,277 |
| 11/18 | $1,222,306 | $1,088,353 |
| 12/18 | $1,193,087 | $1,059,521 |
| 1/19 | $1,290,477 | $1,152,290 |
| 2/19 | $1,301,027 | $1,154,880 |
| 3/19 | $1,326,186 | $1,164,573 |
| 4/19 | $1,366,778 | $1,189,090 |
| 5/19 | $1,253,142 | $1,102,808 |
| 6/19 | $1,344,858 | $1,171,635 |
| 7/19 | $1,328,625 | $1,157,308 |
| 8/19 | $1,283,978 | $1,100,882 |
| 9/19 | $1,316,440 | $1,121,897 |
| 10/19 | $1,371,624 | $1,169,204 |
| 11/19 | $1,375,691 | $1,167,595 |
| 12/19 | $1,463,382 | $1,254,704 |
| 1/20 | $1,387,354 | $1,196,217 |
| 2/20 | $1,330,955 | $1,133,136 |
| 3/20 | $1,117,576 | $958,608 |
| 4/20 | $1,213,230 | $1,046,391 |
| 5/20 | $1,232,025 | $1,054,428 |
| 6/20 | $1,346,480 | $1,131,938 |
| 7/20 | $1,477,275 | $1,233,090 |
| 8/20 | $1,537,762 | $1,260,347 |
| 9/20 | $1,514,865 | $1,240,132 |
| 10/20 | $1,564,748 | $1,265,682 |
| 11/20 | $1,703,740 | $1,382,742 |
| 12/20 | $1,827,390 | $1,484,392 |
| 1/21 | $1,863,527 | $1,529,900 |
| 2/21 | $1,895,549 | $1,541,602 |
| 3/21 | $1,871,751 | $1,518,320 |
| 4/21 | $1,873,408 | $1,556,123 |
| 5/21 | $1,902,953 | $1,592,210 |
| 6/21 | $1,898,043 | $1,594,954 |
| 7/21 | $1,800,367 | $1,487,616 |
| 8/21 | $1,828,279 | $1,526,554 |
| 9/21 | $1,741,257 | $1,465,888 |
| 10/21 | $1,759,319 | $1,480,346 |
| 11/21 | $1,679,685 | $1,420,017 |
| 12/21 | $1,691,715 | $1,446,662 |
| 1/22 | $1,680,134 | $1,419,278 |
| 2/22 | $1,586,655 | $1,376,855 |
| 3/22 | $1,536,193 | $1,345,758 |
| 4/22 | $1,409,625 | $1,270,898 |
| 5/22 | $1,407,143 | $1,276,494 |
| 6/22 | $1,307,046 | $1,191,671 |
| 7/22 | $1,345,927 | $1,188,744 |
| 8/22 | $1,344,272 | $1,193,707 |
| 9/22 | $1,191,232 | $1,053,766 |
| 10/22 | $1,168,896 | $1,021,048 |
| 11/22 | $1,358,335 | $1,172,488 |
| 12/22 | $1,309,689 | $1,156,008 |
| 1/23 | $1,446,410 | $1,247,288 |
| 2/23 | $1,326,362 | $1,166,411 |
| 3/23 | $1,368,879 | $1,201,738 |
| 4/23 | $1,348,038 | $1,188,119 |
| 5/23 | $1,308,855 | $1,168,163 |
| 6/23 | $1,363,877 | $1,212,518 |
| 7/23 | $1,433,072 | $1,287,999 |
| 8/23 | $1,336,366 | $1,208,658 |
| 9/23 | $1,279,677 | $1,177,049 |
| 10/23 | $1,238,828 | $1,131,315 |
| 11/23 | $1,328,863 | $1,221,854 |
| 12/23 | $1,371,614 | $1,269,621 |
| 1/24 | $1,307,661 | $1,210,668 |
| 2/24 | $1,358,150 | $1,268,263 |
| 3/24 | $1,400,224 | $1,299,690 |
| 4/24 | $1,399,383 | $1,305,505 |
| 5/24 | $1,424,627 | $1,312,879 |
| 6/24 | $1,474,274 | $1,364,663 |
| 7/24 | $1,481,848 | $1,368,725 |
| 8/24 | $1,483,531 | $1,390,823 |
| 9/24 | $1,581,882 | $1,483,696 |
Average Annual Total Returns (%)
| Fund | 1 Year | 5 Years | 10 Years |
|---|
| Class I | 23.62% | 3.74% | 4.69% |
| MSCI Emerging Markets Index (net of foreign withholding taxes) | 26.05% | 5.74% | 4.02% |
Performance does not reflect the deduction of taxes that a shareholder would pay on Fund distributions or redemption of Fund shares. Performance assumes that all dividends and distributions, if any, were reinvested. For more recent performance information, visit www.eatonvance.com/performance.php. Performance prior to December 31, 2016 is that of the Fund's former investment adviser.
THE FUND'S PAST PERFORMANCE IS NO GUARANTEE OF FUTURE RESULTS.
| Total Net Assets | $1,486,454,881 |
| # of Portfolio Holdings | 61 |
| Portfolio Turnover Rate | 36% |
| Total Advisory Fees Paid | $11,919,013 |
What did the Fund invest in?
The following tables reflect what the Fund invested in as of the report date.
Country Allocation (% of total investments)
| Value | Value |
|---|
| Other | 11.3% |
| Canada | 2.2% |
| Singapore | 2.5% |
| Hungary | 3.1% |
| Hong Kong | 4.7% |
| Brazil | 5.1% |
| South Africa | 5.4% |
| South Korea | 10.8% |
| India | 14.9% |
| Taiwan | 15.9% |
| China | 24.1% |
Top Ten Holdings (% of total investments)Footnote Referencea
| Taiwan Semiconductor Manufacturing Co. Ltd. | 9.1% |
| Tencent Holdings Ltd. | 5.9% |
| Samsung Electronics Co. Ltd. | 5.4% |
| HDFC Bank Ltd. | 3.1% |
| Richter Gedeon Nyrt | 3.1% |
| Itausa SA, PFC Shares | 2.9% |
| ICICI Bank Ltd. | 2.9% |
| Infosys Ltd. | 2.8% |
| KB Financial Group, Inc. | 2.4% |
| NARI Technology Co. Ltd., Class A | 2.3% |
| Total | 39.9% |
| Footnote | Description |
Footnotea | Excluding cash equivalents |
This is a summary of certain changes to the Fund since September 30, 2023. For more complete information, you may review the Fund’s next prospectus, which we expect to be available by February 1, 2025 at www.eatonvance.com/calvert-fund-documents.php or upon request by contacting us at 1-800-368-2745.
In September 2024, the Fund's Board of Directors approved the termination of the investment sub-advisory agreement between Calvert Research and Management (CRM) and Hermes Investment Management Limited, which is expected to be effective November 11, 2024. CRM will continue to serve as the Fund's investment adviser.
Effective November 11, 2024, the Fund revised its responsible investing criteria to follow the Calvert Principles for Responsible Investment.
If you wish to view additional information about the Fund, including the prospectus, statement of additional information, financial statements and holdings, please scan the QR code or visit www.eatonvance.com/calvert-fund-documents.php. For proxy information, please visit www.calvert.com/active-engagement.php?DM=how-we-influence.
The Funds may deliver a single copy of certain required shareholder documents (including prospectuses, shareholder reports, and proxy materials) to investors with the same last name and the same address. Your participation will continue indefinitely unless you instruct otherwise by calling 1-800-368-2745 or by contacting your financial intermediary. Your instruction will typically be effective within 30 days of receipt.
Not FDIC Insured | May Lose Value | No Bank Guarantee
Annual Shareholder Report September 30, 2024
Calvert Emerging Markets Equity Fund
Annual Shareholder Report September 30, 2024
This annual shareholder report contains important information about the Calvert Emerging Markets Equity Fund for the period of October 1, 2023 to September 30, 2024. You can find additional information about the Fund at www.eatonvance.com/calvert-fund-documents.php. You can also request this information by contacting us at 1-800-368-2745.
This report describes changes to the Fund that occurred during the reporting period.
What were the Fund costs for the last year?
(based on a hypothetical $10,000 investment)
| Class Name | Costs of a $10,000 investment | Costs paid as a percentage of a $10,000 investment |
|---|
| Class R6 | $107 | 0.96% |
How did the Fund perform last year and what affected its performance?
Key contributors to (↑) and detractors from (↓) performance, relative to the MSCI Emerging Markets Index (the Index):
↓ An underweight position in Alibaba Group Holding Ltd. hurt returns as Chinese e-commerce benefited from government stimulus. The stock was sold by period-end
↓ An overweight position in Samsung Electronics Co., a leading memory chipmaker, detracted from returns relative to the Index as analysts forecasted a slowdown in demand for smartphones and PCs
↓ An overweight position in Shenzhen Inovance Technology Co., an industrial automation firm, detracted from returns relative to the Index due to a downturn in demand for solar-driven products as well as competitive pricing pressures
↑ Taiwan Semiconductor Manufacturing Co. contributed to returns as its technological leadership was seen as key for AI semiconductors
↑ Micron Technology, Inc., a maker of computer memory and data storage products, helped returns as price hikes for memory chips led to strong sales and earnings
↑ An allocation to Lotes Co., a supplier of connectors and sockets, aided returns on solid revenue and gross margins driven by demand for PCs and server sockets
Comparison of the change in value of a $5,000,000 investment for the period indicated.
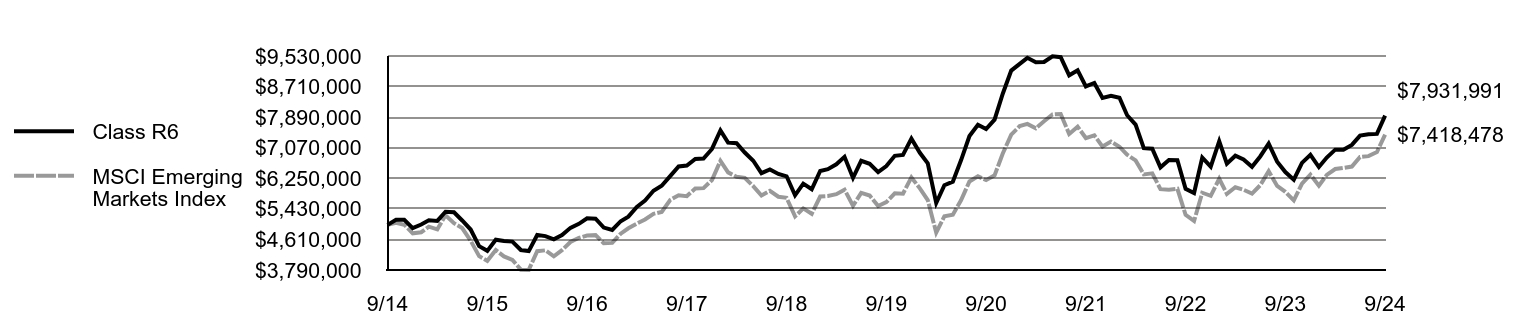
| Class R6 | MSCI Emerging Markets Index |
|---|
| 9/14 | $5,000,000 | $5,000,000 |
| 10/14 | $5,135,747 | $5,058,954 |
| 11/14 | $5,135,747 | $5,005,444 |
| 12/14 | $4,914,889 | $4,774,764 |
| 1/15 | $5,008,879 | $4,803,386 |
| 2/15 | $5,122,450 | $4,952,112 |
| 3/15 | $5,106,785 | $4,881,691 |
| 4/15 | $5,353,509 | $5,257,167 |
| 5/15 | $5,337,844 | $5,046,636 |
| 6/15 | $5,118,534 | $4,915,567 |
| 7/15 | $4,875,727 | $4,574,826 |
| 8/15 | $4,429,275 | $4,161,047 |
| 9/15 | $4,303,955 | $4,035,867 |
| 10/15 | $4,601,590 | $4,323,761 |
| 11/15 | $4,566,343 | $4,155,101 |
| 12/15 | $4,551,795 | $4,062,477 |
| 1/16 | $4,325,791 | $3,798,927 |
| 2/16 | $4,298,036 | $3,792,711 |
| 3/16 | $4,730,219 | $4,294,591 |
| 4/16 | $4,698,499 | $4,317,931 |
| 5/16 | $4,611,270 | $4,156,864 |
| 6/16 | $4,726,254 | $4,323,002 |
| 7/16 | $4,920,538 | $4,540,543 |
| 8/16 | $5,027,592 | $4,653,385 |
| 9/16 | $5,178,262 | $4,713,221 |
| 10/16 | $5,166,367 | $4,724,459 |
| 11/16 | $4,928,468 | $4,506,988 |
| 12/16 | $4,862,740 | $4,516,940 |
| 1/17 | $5,098,679 | $4,764,120 |
| 2/17 | $5,222,647 | $4,909,959 |
| 3/17 | $5,478,580 | $5,033,903 |
| 4/17 | $5,654,535 | $5,144,112 |
| 5/17 | $5,914,467 | $5,296,195 |
| 6/17 | $6,050,432 | $5,349,509 |
| 7/17 | $6,306,366 | $5,668,391 |
| 8/17 | $6,566,298 | $5,794,827 |
| 9/17 | $6,590,292 | $5,771,785 |
| 10/17 | $6,766,247 | $5,974,120 |
| 11/17 | $6,778,244 | $5,986,112 |
| 12/17 | $7,036,934 | $6,200,996 |
| 1/18 | $7,534,131 | $6,717,823 |
| 2/18 | $7,209,349 | $6,408,002 |
| 3/18 | $7,189,301 | $6,288,855 |
| 4/18 | $6,940,703 | $6,261,032 |
| 5/18 | $6,720,172 | $6,039,178 |
| 6/18 | $6,387,371 | $5,788,269 |
| 7/18 | $6,487,612 | $5,915,421 |
| 8/18 | $6,367,323 | $5,755,473 |
| 9/18 | $6,303,168 | $5,724,927 |
| 10/18 | $5,793,943 | $5,226,385 |
| 11/18 | $6,106,004 | $5,441,763 |
| 12/18 | $5,955,690 | $5,297,604 |
| 1/19 | $6,447,258 | $5,761,449 |
| 2/19 | $6,496,009 | $5,774,402 |
| 3/19 | $6,626,010 | $5,822,866 |
| 4/19 | $6,825,075 | $5,945,448 |
| 5/19 | $6,260,381 | $5,514,038 |
| 6/19 | $6,719,449 | $5,858,175 |
| 7/19 | $6,638,198 | $5,786,542 |
| 8/19 | $6,414,758 | $5,504,409 |
| 9/19 | $6,577,260 | $5,609,487 |
| 10/19 | $6,853,513 | $5,846,021 |
| 11/19 | $6,877,888 | $5,837,977 |
| 12/19 | $7,314,394 | $6,273,521 |
| 1/20 | $6,933,521 | $5,981,083 |
| 2/20 | $6,650,938 | $5,665,682 |
| 3/20 | $5,586,133 | $4,793,038 |
| 4/20 | $6,065,295 | $5,231,955 |
| 5/20 | $6,159,489 | $5,272,140 |
| 6/20 | $6,732,846 | $5,659,690 |
| 7/20 | $7,384,016 | $6,165,450 |
| 8/20 | $7,687,076 | $6,301,735 |
| 9/20 | $7,572,404 | $6,200,659 |
| 10/20 | $7,822,224 | $6,328,411 |
| 11/20 | $8,518,443 | $6,913,710 |
| 12/20 | $9,138,979 | $7,421,961 |
| 1/21 | $9,320,030 | $7,649,502 |
| 2/21 | $9,480,507 | $7,708,010 |
| 3/21 | $9,361,178 | $7,591,599 |
| 4/21 | $9,369,408 | $7,780,613 |
| 5/21 | $9,521,655 | $7,961,048 |
| 6/21 | $9,496,966 | $7,974,768 |
| 7/21 | $9,011,420 | $7,438,079 |
| 8/21 | $9,147,208 | $7,632,772 |
| 9/21 | $8,715,154 | $7,329,441 |
| 10/21 | $8,805,679 | $7,401,730 |
| 11/21 | $8,406,543 | $7,100,085 |
| 12/21 | $8,464,847 | $7,233,308 |
| 1/22 | $8,410,878 | $7,096,388 |
| 2/22 | $7,941,762 | $6,884,276 |
| 3/22 | $7,688,523 | $6,728,790 |
| 4/22 | $7,057,499 | $6,354,492 |
| 5/22 | $7,045,045 | $6,382,470 |
| 6/22 | $6,542,717 | $5,958,357 |
| 7/22 | $6,737,836 | $5,943,720 |
| 8/22 | $6,733,684 | $5,968,534 |
| 9/22 | $5,965,662 | $5,268,829 |
| 10/22 | $5,853,573 | $5,105,241 |
| 11/22 | $6,804,259 | $5,862,438 |
| 12/22 | $6,562,737 | $5,780,038 |
| 1/23 | $7,245,395 | $6,236,438 |
| 2/23 | $6,642,311 | $5,832,053 |
| 3/23 | $6,855,903 | $6,008,690 |
| 4/23 | $6,755,389 | $5,940,595 |
| 5/23 | $6,558,549 | $5,840,815 |
| 6/23 | $6,834,963 | $6,062,590 |
| 7/23 | $7,178,386 | $6,439,995 |
| 8/23 | $6,696,756 | $6,043,290 |
| 9/23 | $6,416,154 | $5,885,244 |
| 10/23 | $6,210,937 | $5,656,574 |
| 11/23 | $6,663,251 | $6,109,270 |
| 12/23 | $6,878,060 | $6,348,107 |
| 1/24 | $6,552,146 | $6,053,342 |
| 2/24 | $6,806,105 | $6,341,314 |
| 3/24 | $7,017,738 | $6,498,449 |
| 4/24 | $7,013,505 | $6,527,525 |
| 5/24 | $7,144,717 | $6,564,394 |
| 6/24 | $7,394,444 | $6,823,317 |
| 7/24 | $7,432,538 | $6,843,623 |
| 8/24 | $7,441,003 | $6,954,117 |
| 9/24 | $7,931,991 | $7,418,478 |
Average Annual Total Returns (%)Footnote Reference1
| Fund | 1 Year | 5 Years | 10 Years |
|---|
| Class R6 | 23.63% | 3.81% | 4.72% |
| MSCI Emerging Markets Index (net of foreign withholding taxes) | 26.05% | 5.74% | 4.02% |
| Footnote | Description |
Footnote1 | Class R6 performance prior to 2/1/18 is linked to Class I. This linked performance is adjusted for any applicable sales charge, but is not adjusted for class expense differences. If adjusted for such differences, the performance would be different. Performance presented in the Financial Highlights included in the financial statements is not linked. |
Performance does not reflect the deduction of taxes that a shareholder would pay on Fund distributions or redemption of Fund shares. Performance assumes that all dividends and distributions, if any, were reinvested. For more recent performance information, visit www.eatonvance.com/performance.php. Performance prior to December 31, 2016 is that of the Fund's former investment adviser.
THE FUND'S PAST PERFORMANCE IS NO GUARANTEE OF FUTURE RESULTS.
| Total Net Assets | $1,486,454,881 |
| # of Portfolio Holdings | 61 |
| Portfolio Turnover Rate | 36% |
| Total Advisory Fees Paid | $11,919,013 |
What did the Fund invest in?
The following tables reflect what the Fund invested in as of the report date.
Country Allocation (% of total investments)
| Value | Value |
|---|
| Other | 11.3% |
| Canada | 2.2% |
| Singapore | 2.5% |
| Hungary | 3.1% |
| Hong Kong | 4.7% |
| Brazil | 5.1% |
| South Africa | 5.4% |
| South Korea | 10.8% |
| India | 14.9% |
| Taiwan | 15.9% |
| China | 24.1% |
Top Ten Holdings (% of total investments)Footnote Referencea
| Taiwan Semiconductor Manufacturing Co. Ltd. | 9.1% |
| Tencent Holdings Ltd. | 5.9% |
| Samsung Electronics Co. Ltd. | 5.4% |
| HDFC Bank Ltd. | 3.1% |
| Richter Gedeon Nyrt | 3.1% |
| Itausa SA, PFC Shares | 2.9% |
| ICICI Bank Ltd. | 2.9% |
| Infosys Ltd. | 2.8% |
| KB Financial Group, Inc. | 2.4% |
| NARI Technology Co. Ltd., Class A | 2.3% |
| Total | 39.9% |
| Footnote | Description |
Footnotea | Excluding cash equivalents |
This is a summary of certain changes to the Fund since September 30, 2023. For more complete information, you may review the Fund’s next prospectus, which we expect to be available by February 1, 2025 at www.eatonvance.com/calvert-fund-documents.php or upon request by contacting us at 1-800-368-2745.
In September 2024, the Fund's Board of Directors approved the termination of the investment sub-advisory agreement between Calvert Research and Management (CRM) and Hermes Investment Management Limited, which is expected to be effective November 11, 2024. CRM will continue to serve as the Fund's investment adviser.
Effective November 11, 2024, the Fund revised its responsible investing criteria to follow the Calvert Principles for Responsible Investment.
If you wish to view additional information about the Fund, including the prospectus, statement of additional information, financial statements and holdings, please scan the QR code or visit www.eatonvance.com/calvert-fund-documents.php. For proxy information, please visit www.calvert.com/active-engagement.php?DM=how-we-influence.
The Funds may deliver a single copy of certain required shareholder documents (including prospectuses, shareholder reports, and proxy materials) to investors with the same last name and the same address. Your participation will continue indefinitely unless you instruct otherwise by calling 1-800-368-2745 or by contacting your financial intermediary. Your instruction will typically be effective within 30 days of receipt.
Not FDIC Insured | May Lose Value | No Bank Guarantee
Annual Shareholder Report September 30, 2024
Calvert International Equity Fund
Annual Shareholder Report September 30, 2024
This annual shareholder report contains important information about the Calvert International Equity Fund for the period of October 1, 2023 to September 30, 2024. You can find additional information about the Fund at www.eatonvance.com/calvert-fund-documents.php. You can also request this information by contacting us at 1-800-368-2745.
What were the Fund costs for the last year?
(based on a hypothetical $10,000 investment)
| Class Name | Costs of a $10,000 investment | Costs paid as a percentage of a $10,000 investment |
|---|
| Class A | $129 | 1.14% |
How did the Fund perform last year and what affected its performance?
Key contributors to (↑) and detractors from (↓) performance, relative to the MSCI EAFE Index (the Index):
↑ Recruit Holdings Co., a Japanese information technology recruiter, contributed to returns as fears of a recession receded and employment trends were strong
↑ Taiwan Semiconductor Manufacturing Co. helped returns as demand for its high-end semiconductors surged during a rise in artificial intelligence applications
↑ Safran SA, a French aeroengine maker, aided returns as air travel continued to recover and weak new aircraft production drove demand for spare parts and service
↑ Schneider Electric SE, a French maker of power distribution equipment, aided returns as electrical grid and data center demand boomed during the period
↓ Nestle SA, a consumer staples company, detracted from Index-relative returns as high inflation weakened consumer buying power during the period
↓ Reckitt Benckiser Group, a U.K. consumer staples company, hampered returns as U.S. litigation involving its baby formula business worried investors
↓ Sartorius AG, a German life sciences equipment supplier, hampered performance amid a downturn in demand for its products following the COVID pandemic
↓ Kose Corp., a Japanese cosmetics maker, hurt returns amid weak Chinese sales and fears that tainted water was used in production. Kose was sold by period-end
Comparison of the change in value of a $10,000 investment for the period indicated.
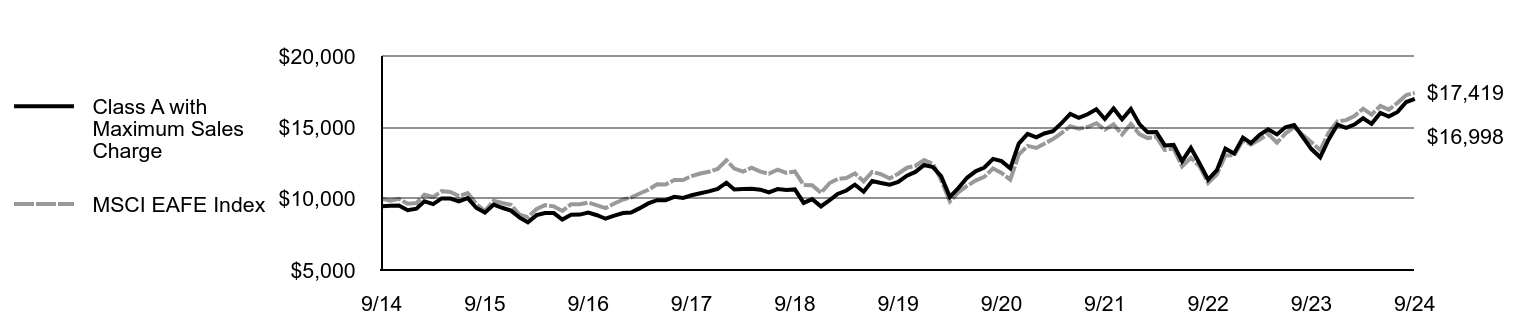
| Class A with Maximum Sales Charge | MSCI EAFE Index |
|---|
| 9/14 | $9,475 | $10,000 |
| 10/14 | $9,498 | $9,855 |
| 11/14 | $9,515 | $9,989 |
| 12/14 | $9,189 | $9,643 |
| 1/15 | $9,293 | $9,690 |
| 2/15 | $9,813 | $10,269 |
| 3/15 | $9,622 | $10,113 |
| 4/15 | $10,015 | $10,526 |
| 5/15 | $10,009 | $10,472 |
| 6/15 | $9,813 | $10,176 |
| 7/15 | $10,038 | $10,387 |
| 8/15 | $9,345 | $9,623 |
| 9/15 | $9,022 | $9,134 |
| 10/15 | $9,582 | $9,848 |
| 11/15 | $9,362 | $9,695 |
| 12/15 | $9,165 | $9,564 |
| 1/16 | $8,670 | $8,873 |
| 2/16 | $8,344 | $8,710 |
| 3/16 | $8,845 | $9,277 |
| 4/16 | $8,996 | $9,545 |
| 5/16 | $8,990 | $9,459 |
| 6/16 | $8,536 | $9,141 |
| 7/16 | $8,874 | $9,605 |
| 8/16 | $8,885 | $9,611 |
| 9/16 | $9,025 | $9,729 |
| 10/16 | $8,839 | $9,530 |
| 11/16 | $8,594 | $9,341 |
| 12/16 | $8,813 | $9,660 |
| 1/17 | $8,998 | $9,940 |
| 2/17 | $9,034 | $10,082 |
| 3/17 | $9,334 | $10,360 |
| 4/17 | $9,669 | $10,623 |
| 5/17 | $9,891 | $11,013 |
| 6/17 | $9,891 | $10,994 |
| 7/17 | $10,130 | $11,311 |
| 8/17 | $10,052 | $11,307 |
| 9/17 | $10,238 | $11,588 |
| 10/17 | $10,382 | $11,764 |
| 11/17 | $10,508 | $11,887 |
| 12/17 | $10,686 | $12,078 |
| 1/18 | $11,117 | $12,684 |
| 2/18 | $10,649 | $12,112 |
| 3/18 | $10,686 | $11,893 |
| 4/18 | $10,698 | $12,165 |
| 5/18 | $10,631 | $11,891 |
| 6/18 | $10,437 | $11,746 |
| 7/18 | $10,674 | $12,035 |
| 8/18 | $10,613 | $11,803 |
| 9/18 | $10,649 | $11,905 |
| 10/18 | $9,702 | $10,958 |
| 11/18 | $9,963 | $10,944 |
| 12/18 | $9,459 | $10,413 |
| 1/19 | $9,902 | $11,097 |
| 2/19 | $10,326 | $11,380 |
| 3/19 | $10,572 | $11,452 |
| 4/19 | $10,978 | $11,774 |
| 5/19 | $10,486 | $11,208 |
| 6/19 | $11,236 | $11,873 |
| 7/19 | $11,101 | $11,722 |
| 8/19 | $10,978 | $11,419 |
| 9/19 | $11,174 | $11,746 |
| 10/19 | $11,611 | $12,168 |
| 11/19 | $11,875 | $12,305 |
| 12/19 | $12,363 | $12,705 |
| 1/20 | $12,214 | $12,440 |
| 2/20 | $11,581 | $11,315 |
| 3/20 | $10,129 | $9,805 |
| 4/20 | $10,737 | $10,438 |
| 5/20 | $11,463 | $10,893 |
| 6/20 | $11,916 | $11,264 |
| 7/20 | $12,183 | $11,526 |
| 8/20 | $12,785 | $12,119 |
| 9/20 | $12,630 | $11,804 |
| 10/20 | $12,121 | $11,333 |
| 11/20 | $13,858 | $13,089 |
| 12/20 | $14,545 | $13,698 |
| 1/21 | $14,302 | $13,552 |
| 2/21 | $14,569 | $13,856 |
| 3/21 | $14,731 | $14,175 |
| 4/21 | $15,297 | $14,601 |
| 5/21 | $15,937 | $15,077 |
| 6/21 | $15,664 | $14,908 |
| 7/21 | $15,918 | $15,020 |
| 8/21 | $16,267 | $15,285 |
| 9/21 | $15,583 | $14,841 |
| 10/21 | $16,323 | $15,206 |
| 11/21 | $15,564 | $14,498 |
| 12/21 | $16,290 | $15,241 |
| 1/22 | $15,208 | $14,504 |
| 2/22 | $14,657 | $14,248 |
| 3/22 | $14,670 | $14,339 |
| 4/22 | $13,734 | $13,412 |
| 5/22 | $13,767 | $13,512 |
| 6/22 | $12,626 | $12,259 |
| 7/22 | $13,555 | $12,869 |
| 8/22 | $12,466 | $12,258 |
| 9/22 | $11,331 | $11,111 |
| 10/22 | $11,995 | $11,709 |
| 11/22 | $13,502 | $13,028 |
| 12/22 | $13,164 | $13,038 |
| 1/23 | $14,279 | $14,094 |
| 2/23 | $13,885 | $13,800 |
| 3/23 | $14,470 | $14,142 |
| 4/23 | $14,857 | $14,541 |
| 5/23 | $14,504 | $13,926 |
| 6/23 | $15,007 | $14,560 |
| 7/23 | $15,156 | $15,031 |
| 8/23 | $14,306 | $14,455 |
| 9/23 | $13,477 | $13,961 |
| 10/23 | $12,899 | $13,395 |
| 11/23 | $14,157 | $14,638 |
| 12/23 | $15,183 | $15,416 |
| 1/24 | $14,957 | $15,505 |
| 2/24 | $15,197 | $15,789 |
| 3/24 | $15,636 | $16,308 |
| 4/24 | $15,245 | $15,890 |
| 5/24 | $16,006 | $16,506 |
| 6/24 | $15,759 | $16,239 |
| 7/24 | $16,081 | $16,716 |
| 8/24 | $16,774 | $17,259 |
| 9/24 | $16,998 | $17,419 |
Average Annual Total Returns (%)
| Fund | 1 Year | 5 Years | 10 Years |
|---|
| Class A | 26.09% | 8.74% | 6.01% |
| Class A with 5.25% Maximum Sales Charge | 19.46% | 7.57% | 5.44% |
| MSCI EAFE Index (net of foreign withholding taxes) | 24.77% | 8.19% | 5.70% |
Performance does not reflect the deduction of taxes that a shareholder would pay on Fund distributions or redemption of Fund shares. Performance assumes that all dividends and distributions, if any, were reinvested. For more recent performance information, visit www.eatonvance.com/performance.php. Performance prior to December 31, 2016 is that of the Fund's former investment adviser.
THE FUND'S PAST PERFORMANCE IS NO GUARANTEE OF FUTURE RESULTS.
| Total Net Assets | $1,112,704,495 |
| # of Portfolio Holdings | 48 |
| Portfolio Turnover Rate | 23% |
| Total Advisory Fees Paid | $6,150,824 |
What did the Fund invest in?
The following tables reflect what the Fund invested in as of the report date.
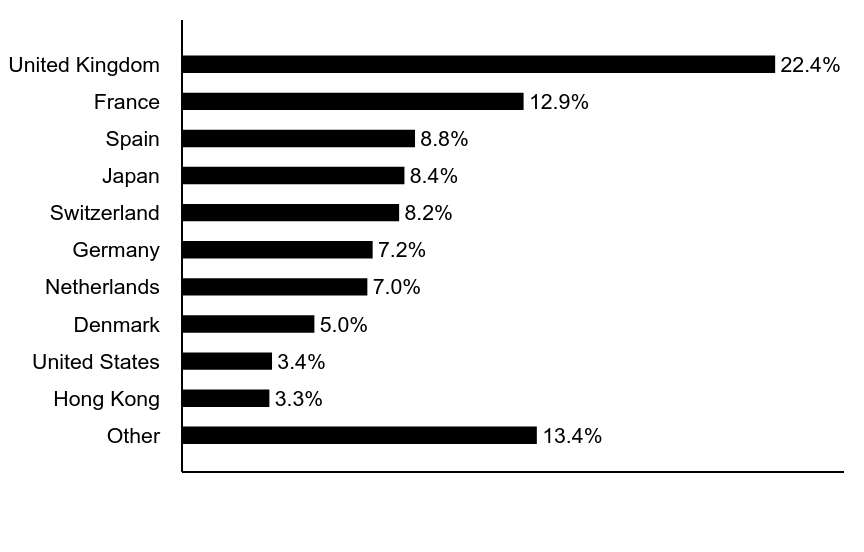
Country Allocation (% of total investments)
| Value | Value |
|---|
| Other | 13.4% |
| Hong Kong | 3.3% |
| United States | 3.4% |
| Denmark | 5.0% |
| Netherlands | 7.0% |
| Germany | 7.2% |
| Switzerland | 8.2% |
| Japan | 8.4% |
| Spain | 8.8% |
| France | 12.9% |
| United Kingdom | 22.4% |
Top Ten Holdings (% of total investments)Footnote Referencea
| Nestle SA | 4.9% |
| ASML Holding NV | 3.9% |
| Iberdrola SA | 3.7% |
| AstraZeneca PLC | 3.7% |
| Siemens AG | 3.5% |
| Compass Group PLC | 3.4% |
| AIA Group Ltd. | 3.3% |
| Novo Nordisk AS, Class B | 3.3% |
| IMCD NV | 3.1% |
| Reckitt Benckiser Group PLC | 3.1% |
| Total | 35.9% |
| Footnote | Description |
Footnotea | Excluding cash equivalents |
If you wish to view additional information about the Fund, including the prospectus, statement of additional information, financial statements and holdings, please scan the QR code or visit www.eatonvance.com/calvert-fund-documents.php. For proxy information, please visit www.calvert.com/active-engagement.php?DM=how-we-influence.
The Funds may deliver a single copy of certain required shareholder documents (including prospectuses, shareholder reports, and proxy materials) to investors with the same last name and the same address. Your participation will continue indefinitely unless you instruct otherwise by calling 1-800-368-2745 or by contacting your financial intermediary. Your instruction will typically be effective within 30 days of receipt.
Not FDIC Insured | May Lose Value | No Bank Guarantee
Annual Shareholder Report September 30, 2024
Calvert International Equity Fund
Annual Shareholder Report September 30, 2024
This annual shareholder report contains important information about the Calvert International Equity Fund for the period of October 1, 2023 to September 30, 2024. You can find additional information about the Fund at www.eatonvance.com/calvert-fund-documents.php. You can also request this information by contacting us at 1-800-368-2745.
What were the Fund costs for the last year?
(based on a hypothetical $10,000 investment)
| Class Name | Costs of a $10,000 investment | Costs paid as a percentage of a $10,000 investment |
|---|
| Class C | $213 | 1.89% |
How did the Fund perform last year and what affected its performance?
Key contributors to (↑) and detractors from (↓) performance, relative to the MSCI EAFE Index (the Index):
↑ Recruit Holdings Co., a Japanese information technology recruiter, contributed to returns as fears of a recession receded and employment trends were strong
↑ Taiwan Semiconductor Manufacturing Co. helped returns as demand for its high-end semiconductors surged during a rise in artificial intelligence applications
↑ Safran SA, a French aeroengine maker, aided returns as air travel continued to recover and weak new aircraft production drove demand for spare parts and service
↑ Schneider Electric SE, a French maker of power distribution equipment, aided returns as electrical grid and data center demand boomed during the period
↓ Nestle SA, a consumer staples company, detracted from Index-relative returns as high inflation weakened consumer buying power during the period
↓ Reckitt Benckiser Group, a U.K. consumer staples company, hampered returns as U.S. litigation involving its baby formula business worried investors
↓ Sartorius AG, a German life sciences equipment supplier, hampered performance amid a downturn in demand for its products following the COVID pandemic
↓ Kose Corp., a Japanese cosmetics maker, hurt returns amid weak Chinese sales and fears that tainted water was used in production. Kose was sold by period-end
Comparison of the change in value of a $10,000 investment for the period indicated.
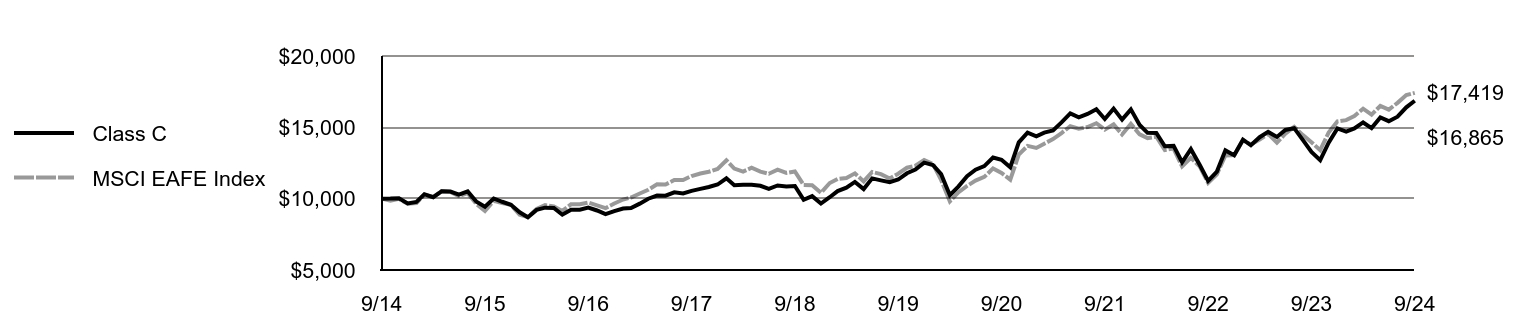
| Class C | MSCI EAFE Index |
|---|
| 9/14 | $10,000 | $10,000 |
| 10/14 | $10,007 | $9,855 |
| 11/14 | $10,028 | $9,989 |
| 12/14 | $9,671 | $9,643 |
| 1/15 | $9,769 | $9,690 |
| 2/15 | $10,315 | $10,269 |
| 3/15 | $10,105 | $10,113 |
| 4/15 | $10,511 | $10,526 |
| 5/15 | $10,497 | $10,472 |
| 6/15 | $10,287 | $10,176 |
| 7/15 | $10,511 | $10,387 |
| 8/15 | $9,783 | $9,623 |
| 9/15 | $9,433 | $9,134 |
| 10/15 | $10,014 | $9,848 |
| 11/15 | $9,783 | $9,695 |
| 12/15 | $9,573 | $9,564 |
| 1/16 | $9,045 | $8,873 |
| 2/16 | $8,700 | $8,710 |
| 3/16 | $9,214 | $9,277 |
| 4/16 | $9,369 | $9,545 |
| 5/16 | $9,354 | $9,459 |
| 6/16 | $8,876 | $9,141 |
| 7/16 | $9,228 | $9,605 |
| 8/16 | $9,228 | $9,611 |
| 9/16 | $9,369 | $9,729 |
| 10/16 | $9,171 | $9,530 |
| 11/16 | $8,911 | $9,341 |
| 12/16 | $9,127 | $9,660 |
| 1/17 | $9,313 | $9,940 |
| 2/17 | $9,349 | $10,082 |
| 3/17 | $9,651 | $10,360 |
| 4/17 | $9,996 | $10,623 |
| 5/17 | $10,219 | $11,013 |
| 6/17 | $10,212 | $10,994 |
| 7/17 | $10,449 | $11,311 |
| 8/17 | $10,363 | $11,307 |
| 9/17 | $10,549 | $11,588 |
| 10/17 | $10,686 | $11,764 |
| 11/17 | $10,815 | $11,887 |
| 12/17 | $10,991 | $12,078 |
| 1/18 | $11,427 | $12,684 |
| 2/18 | $10,941 | $12,112 |
| 3/18 | $10,970 | $11,893 |
| 4/18 | $10,970 | $12,165 |
| 5/18 | $10,904 | $11,891 |
| 6/18 | $10,694 | $11,746 |
| 7/18 | $10,926 | $12,035 |
| 8/18 | $10,861 | $11,803 |
| 9/18 | $10,890 | $11,905 |
| 10/18 | $9,917 | $10,958 |
| 11/18 | $10,178 | $10,944 |
| 12/18 | $9,656 | $10,413 |
| 1/19 | $10,101 | $11,097 |
| 2/19 | $10,532 | $11,380 |
| 3/19 | $10,773 | $11,452 |
| 4/19 | $11,174 | $11,774 |
| 5/19 | $10,671 | $11,208 |
| 6/19 | $11,422 | $11,873 |
| 7/19 | $11,284 | $11,722 |
| 8/19 | $11,152 | $11,419 |
| 9/19 | $11,342 | $11,746 |
| 10/19 | $11,780 | $12,168 |
| 11/19 | $12,035 | $12,305 |
| 12/19 | $12,524 | $12,705 |
| 1/20 | $12,363 | $12,440 |
| 2/20 | $11,719 | $11,315 |
| 3/20 | $10,239 | $9,805 |
| 4/20 | $10,847 | $10,438 |
| 5/20 | $11,580 | $10,893 |
| 6/20 | $12,026 | $11,264 |
| 7/20 | $12,283 | $11,526 |
| 8/20 | $12,883 | $12,119 |
| 9/20 | $12,722 | $11,804 |
| 10/20 | $12,202 | $11,333 |
| 11/20 | $13,945 | $13,089 |
| 12/20 | $14,626 | $13,698 |
| 1/21 | $14,370 | $13,552 |
| 2/21 | $14,626 | $13,856 |
| 3/21 | $14,787 | $14,175 |
| 4/21 | $15,344 | $14,601 |
| 5/21 | $15,974 | $15,077 |
| 6/21 | $15,696 | $14,908 |
| 7/21 | $15,937 | $15,020 |
| 8/21 | $16,274 | $15,285 |
| 9/21 | $15,586 | $14,841 |
| 10/21 | $16,311 | $15,206 |
| 11/21 | $15,542 | $14,498 |
| 12/21 | $16,259 | $15,241 |
| 1/22 | $15,167 | $14,504 |
| 2/22 | $14,617 | $14,248 |
| 3/22 | $14,609 | $14,339 |
| 4/22 | $13,674 | $13,412 |
| 5/22 | $13,698 | $13,512 |
| 6/22 | $12,550 | $12,259 |
| 7/22 | $13,470 | $12,869 |
| 8/22 | $12,377 | $12,258 |
| 9/22 | $11,246 | $11,111 |
| 10/22 | $11,898 | $11,709 |
| 11/22 | $13,383 | $13,028 |
| 12/22 | $13,043 | $13,038 |
| 1/23 | $14,134 | $14,094 |
| 2/23 | $13,741 | $13,800 |
| 3/23 | $14,310 | $14,142 |
| 4/23 | $14,679 | $14,541 |
| 5/23 | $14,326 | $13,926 |
| 6/23 | $14,816 | $14,560 |
| 7/23 | $14,944 | $15,031 |
| 8/23 | $14,102 | $14,455 |
| 9/23 | $13,275 | $13,961 |
| 10/23 | $12,698 | $13,395 |
| 11/23 | $13,925 | $14,638 |
| 12/23 | $14,923 | $15,416 |
| 1/24 | $14,698 | $15,505 |
| 2/24 | $14,923 | $15,789 |
| 3/24 | $15,341 | $16,308 |
| 4/24 | $14,947 | $15,890 |
| 5/24 | $15,687 | $16,506 |
| 6/24 | $15,430 | $16,239 |
| 7/24 | $15,743 | $16,716 |
| 8/24 | $16,403 | $17,259 |
| 9/24 | $16,865 | $17,419 |
Average Annual Total Returns (%)
| Fund | 1 Year | 5 Years | 10 Years |
|---|
| Class C | 25.14% | 7.92% | 5.36% |
| Class C with 1% Maximum Deferred Sales Charge | 24.14% | 7.92% | 5.36% |
| MSCI EAFE Index (net of foreign withholding taxes) | 24.77% | 8.19% | 5.70% |
Performance does not reflect the deduction of taxes that a shareholder would pay on Fund distributions or redemption of Fund shares. Performance assumes that all dividends and distributions, if any, were reinvested. For more recent performance information, visit www.eatonvance.com/performance.php. Performance prior to December 31, 2016 is that of the Fund's former investment adviser.
THE FUND'S PAST PERFORMANCE IS NO GUARANTEE OF FUTURE RESULTS.
| Total Net Assets | $1,112,704,495 |
| # of Portfolio Holdings | 48 |
| Portfolio Turnover Rate | 23% |
| Total Advisory Fees Paid | $6,150,824 |
What did the Fund invest in?
The following tables reflect what the Fund invested in as of the report date.
Country Allocation (% of total investments)
| Value | Value |
|---|
| Other | 13.4% |
| Hong Kong | 3.3% |
| United States | 3.4% |
| Denmark | 5.0% |
| Netherlands | 7.0% |
| Germany | 7.2% |
| Switzerland | 8.2% |
| Japan | 8.4% |
| Spain | 8.8% |
| France | 12.9% |
| United Kingdom | 22.4% |
Top Ten Holdings (% of total investments)Footnote Referencea
| Nestle SA | 4.9% |
| ASML Holding NV | 3.9% |
| Iberdrola SA | 3.7% |
| AstraZeneca PLC | 3.7% |
| Siemens AG | 3.5% |
| Compass Group PLC | 3.4% |
| AIA Group Ltd. | 3.3% |
| Novo Nordisk AS, Class B | 3.3% |
| IMCD NV | 3.1% |
| Reckitt Benckiser Group PLC | 3.1% |
| Total | 35.9% |
| Footnote | Description |
Footnotea | Excluding cash equivalents |
If you wish to view additional information about the Fund, including the prospectus, statement of additional information, financial statements and holdings, please scan the QR code or visit www.eatonvance.com/calvert-fund-documents.php. For proxy information, please visit www.calvert.com/active-engagement.php?DM=how-we-influence.
The Funds may deliver a single copy of certain required shareholder documents (including prospectuses, shareholder reports, and proxy materials) to investors with the same last name and the same address. Your participation will continue indefinitely unless you instruct otherwise by calling 1-800-368-2745 or by contacting your financial intermediary. Your instruction will typically be effective within 30 days of receipt.
Not FDIC Insured | May Lose Value | No Bank Guarantee
Annual Shareholder Report September 30, 2024
Calvert International Equity Fund
Annual Shareholder Report September 30, 2024
This annual shareholder report contains important information about the Calvert International Equity Fund for the period of October 1, 2023 to September 30, 2024. You can find additional information about the Fund at www.eatonvance.com/calvert-fund-documents.php. You can also request this information by contacting us at 1-800-368-2745.
What were the Fund costs for the last year?
(based on a hypothetical $10,000 investment)
| Class Name | Costs of a $10,000 investment | Costs paid as a percentage of a $10,000 investment |
|---|
| Class I | $101 | 0.89% |
How did the Fund perform last year and what affected its performance?
Key contributors to (↑) and detractors from (↓) performance, relative to the MSCI EAFE Index (the Index):
↑ Recruit Holdings Co., a Japanese information technology recruiter, contributed to returns as fears of a recession receded and employment trends were strong
↑ Taiwan Semiconductor Manufacturing Co. helped returns as demand for its high-end semiconductors surged during a rise in artificial intelligence applications
↑ Safran SA, a French aeroengine maker, aided returns as air travel continued to recover and weak new aircraft production drove demand for spare parts and service
↑ Schneider Electric SE, a French maker of power distribution equipment, aided returns as electrical grid and data center demand boomed during the period
↓ Nestle SA, a consumer staples company, detracted from Index-relative returns as high inflation weakened consumer buying power during the period
↓ Reckitt Benckiser Group, a U.K. consumer staples company, hampered returns as U.S. litigation involving its baby formula business worried investors
↓ Sartorius AG, a German life sciences equipment supplier, hampered performance amid a downturn in demand for its products following the COVID pandemic
↓ Kose Corp., a Japanese cosmetics maker, hurt returns amid weak Chinese sales and fears that tainted water was used in production. Kose was sold by period-end
Comparison of the change in value of a $1,000,000 investment for the period indicated.
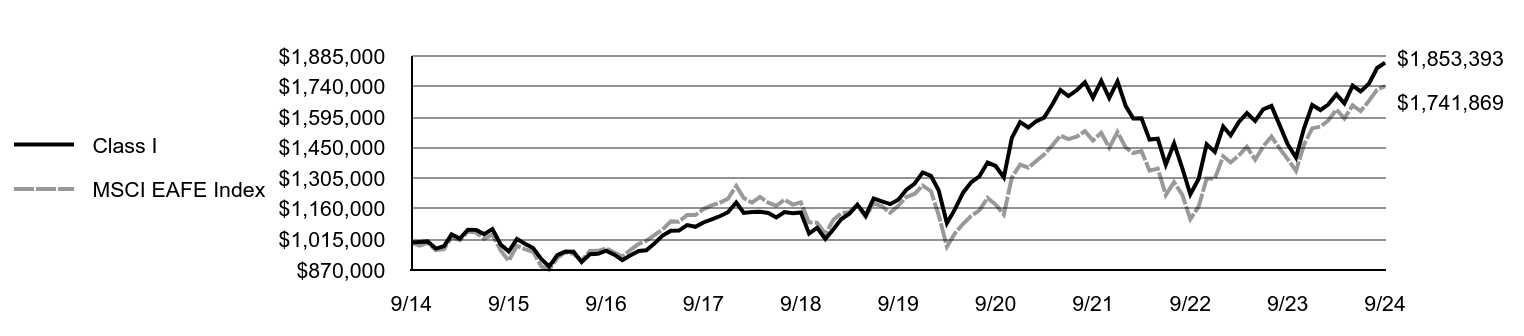
| Class I | MSCI EAFE Index |
|---|
| 9/14 | $1,000,000 | $1,000,000 |
| 10/14 | $1,002,827 | $985,480 |
| 11/14 | $1,005,662 | $998,885 |
| 12/14 | $971,667 | $964,282 |
| 1/15 | $983,115 | $968,996 |
| 2/15 | $1,038,618 | $1,026,923 |
| 3/15 | $1,019,154 | $1,011,323 |
| 4/15 | $1,060,923 | $1,052,614 |
| 5/15 | $1,060,343 | $1,047,226 |
| 6/15 | $1,040,323 | $1,017,555 |
| 7/15 | $1,064,367 | $1,038,682 |
| 8/15 | $991,112 | $962,274 |
| 9/15 | $957,355 | $913,414 |
| 10/15 | $1,016,870 | $984,815 |
| 11/15 | $994,559 | $969,494 |
| 12/15 | $974,027 | $956,431 |
| 1/16 | $921,102 | $887,268 |
| 2/16 | $886,789 | $871,012 |
| 3/16 | $940,291 | $927,687 |
| 4/16 | $957,156 | $954,545 |
| 5/16 | $956,569 | $945,873 |
| 6/16 | $908,300 | $914,123 |
| 7/16 | $944,927 | $960,451 |
| 8/16 | $946,665 | $961,133 |
| 9/16 | $961,782 | $972,940 |
| 10/16 | $942,586 | $953,039 |
| 11/16 | $916,414 | $934,058 |
| 12/16 | $939,866 | $965,997 |
| 1/17 | $960,289 | $994,019 |
| 2/17 | $963,891 | $1,008,233 |
| 3/17 | $996,316 | $1,035,988 |
| 4/17 | $1,032,945 | $1,062,349 |
| 5/17 | $1,056,375 | $1,101,341 |
| 6/17 | $1,056,966 | $1,099,393 |
| 7/17 | $1,082,787 | $1,131,106 |
| 8/17 | $1,074,977 | $1,130,680 |
| 9/17 | $1,095,397 | $1,158,812 |
| 10/17 | $1,110,420 | $1,176,408 |
| 11/17 | $1,124,827 | $1,188,748 |
| 12/17 | $1,143,888 | $1,207,828 |
| 1/18 | $1,190,296 | $1,268,412 |
| 2/18 | $1,140,820 | $1,211,161 |
| 3/18 | $1,145,091 | $1,189,332 |
| 4/18 | $1,146,305 | $1,216,487 |
| 5/18 | $1,140,209 | $1,189,143 |
| 6/18 | $1,119,447 | $1,174,615 |
| 7/18 | $1,145,089 | $1,203,529 |
| 8/18 | $1,138,975 | $1,180,286 |
| 9/18 | $1,143,244 | $1,190,529 |
| 10/18 | $1,042,481 | $1,095,772 |
| 11/18 | $1,070,568 | $1,094,392 |
| 12/18 | $1,016,841 | $1,041,266 |
| 1/19 | $1,064,519 | $1,109,698 |
| 2/19 | $1,110,338 | $1,137,985 |
| 3/19 | $1,136,957 | $1,145,161 |
| 4/19 | $1,180,300 | $1,177,358 |
| 5/19 | $1,128,285 | $1,120,814 |
| 6/19 | $1,209,413 | $1,187,307 |
| 7/19 | $1,195,164 | $1,172,232 |
| 8/19 | $1,182,149 | $1,141,864 |
| 9/19 | $1,203,193 | $1,174,585 |
| 10/19 | $1,250,880 | $1,216,787 |
| 11/19 | $1,278,747 | $1,230,504 |
| 12/19 | $1,332,668 | $1,270,495 |
| 1/20 | $1,316,372 | $1,243,957 |
| 2/20 | $1,248,117 | $1,131,507 |
| 3/20 | $1,091,563 | $980,486 |
| 4/20 | $1,157,313 | $1,043,828 |
| 5/20 | $1,236,857 | $1,089,282 |
| 6/20 | $1,285,707 | $1,126,371 |
| 7/20 | $1,314,510 | $1,152,626 |
| 8/20 | $1,379,648 | $1,211,883 |
| 9/20 | $1,363,376 | $1,180,394 |
| 10/20 | $1,308,897 | $1,133,263 |
| 11/20 | $1,496,781 | $1,308,934 |
| 12/20 | $1,571,440 | $1,369,794 |
| 1/21 | $1,545,658 | $1,355,200 |
| 2/21 | $1,574,565 | $1,385,596 |
| 3/21 | $1,592,797 | $1,417,456 |
| 4/21 | $1,653,797 | $1,460,106 |
| 5/21 | $1,723,605 | $1,507,722 |
| 6/21 | $1,694,677 | $1,490,754 |
| 7/21 | $1,722,357 | $1,501,979 |
| 8/21 | $1,760,716 | $1,528,472 |
| 9/21 | $1,687,143 | $1,484,115 |
| 10/21 | $1,767,004 | $1,520,617 |
| 11/21 | $1,685,885 | $1,449,842 |
| 12/21 | $1,764,489 | $1,524,079 |
| 1/22 | $1,647,258 | $1,450,430 |
| 2/22 | $1,588,308 | $1,424,784 |
| 3/22 | $1,589,648 | $1,433,942 |
| 4/22 | $1,488,494 | $1,341,173 |
| 5/22 | $1,492,514 | $1,351,228 |
| 6/22 | $1,369,254 | $1,225,851 |
| 7/22 | $1,470,407 | $1,286,935 |
| 8/22 | $1,352,507 | $1,225,812 |
| 9/22 | $1,229,247 | $1,111,141 |
| 10/22 | $1,301,595 | $1,170,892 |
| 11/22 | $1,466,388 | $1,302,777 |
| 12/22 | $1,429,709 | $1,303,824 |
| 1/23 | $1,550,568 | $1,409,404 |
| 2/23 | $1,508,679 | $1,379,994 |
| 3/23 | $1,572,542 | $1,414,196 |
| 4/23 | $1,614,431 | $1,454,123 |
| 5/23 | $1,576,662 | $1,392,587 |
| 6/23 | $1,631,598 | $1,455,963 |
| 7/23 | $1,648,079 | $1,503,073 |
| 8/23 | $1,556,061 | $1,445,487 |
| 9/23 | $1,466,104 | $1,396,112 |
| 10/23 | $1,403,614 | $1,339,511 |
| 11/23 | $1,540,954 | $1,463,842 |
| 12/23 | $1,652,172 | $1,541,614 |
| 1/24 | $1,628,600 | $1,550,486 |
| 2/24 | $1,654,946 | $1,578,867 |
| 3/24 | $1,702,784 | $1,630,795 |
| 4/24 | $1,660,492 | $1,589,032 |
| 5/24 | $1,744,383 | $1,650,584 |
| 6/24 | $1,717,344 | $1,623,937 |
| 7/24 | $1,753,396 | $1,671,578 |
| 8/24 | $1,828,275 | $1,725,931 |
| 9/24 | $1,853,393 | $1,741,869 |
Average Annual Total Returns (%)
| Fund | 1 Year | 5 Years | 10 Years |
|---|
| Class I | 26.41% | 9.01% | 6.36% |
| MSCI EAFE Index (net of foreign withholding taxes) | 24.77% | 8.19% | 5.70% |
Performance does not reflect the deduction of taxes that a shareholder would pay on Fund distributions or redemption of Fund shares. Performance assumes that all dividends and distributions, if any, were reinvested. For more recent performance information, visit www.eatonvance.com/performance.php. Performance prior to December 31, 2016 is that of the Fund's former investment adviser.
THE FUND'S PAST PERFORMANCE IS NO GUARANTEE OF FUTURE RESULTS.
| Total Net Assets | $1,112,704,495 |
| # of Portfolio Holdings | 48 |
| Portfolio Turnover Rate | 23% |
| Total Advisory Fees Paid | $6,150,824 |
What did the Fund invest in?
The following tables reflect what the Fund invested in as of the report date.
Country Allocation (% of total investments)
| Value | Value |
|---|
| Other | 13.4% |
| Hong Kong | 3.3% |
| United States | 3.4% |
| Denmark | 5.0% |
| Netherlands | 7.0% |
| Germany | 7.2% |
| Switzerland | 8.2% |
| Japan | 8.4% |
| Spain | 8.8% |
| France | 12.9% |
| United Kingdom | 22.4% |
Top Ten Holdings (% of total investments)Footnote Referencea
| Nestle SA | 4.9% |
| ASML Holding NV | 3.9% |
| Iberdrola SA | 3.7% |
| AstraZeneca PLC | 3.7% |
| Siemens AG | 3.5% |
| Compass Group PLC | 3.4% |
| AIA Group Ltd. | 3.3% |
| Novo Nordisk AS, Class B | 3.3% |
| IMCD NV | 3.1% |
| Reckitt Benckiser Group PLC | 3.1% |
| Total | 35.9% |
| Footnote | Description |
Footnotea | Excluding cash equivalents |
If you wish to view additional information about the Fund, including the prospectus, statement of additional information, financial statements and holdings, please scan the QR code or visit www.eatonvance.com/calvert-fund-documents.php. For proxy information, please visit www.calvert.com/active-engagement.php?DM=how-we-influence.
The Funds may deliver a single copy of certain required shareholder documents (including prospectuses, shareholder reports, and proxy materials) to investors with the same last name and the same address. Your participation will continue indefinitely unless you instruct otherwise by calling 1-800-368-2745 or by contacting your financial intermediary. Your instruction will typically be effective within 30 days of receipt.
Not FDIC Insured | May Lose Value | No Bank Guarantee
Annual Shareholder Report September 30, 2024
Calvert International Equity Fund
Annual Shareholder Report September 30, 2024
This annual shareholder report contains important information about the Calvert International Equity Fund for the period of October 1, 2023 to September 30, 2024. You can find additional information about the Fund at www.eatonvance.com/calvert-fund-documents.php. You can also request this information by contacting us at 1-800-368-2745.
What were the Fund costs for the last year?
(based on a hypothetical $10,000 investment)
| Class Name | Costs of a $10,000 investment | Costs paid as a percentage of a $10,000 investment |
|---|
| Class R6 | $96 | 0.85% |
How did the Fund perform last year and what affected its performance?
Key contributors to (↑) and detractors from (↓) performance, relative to the MSCI EAFE Index (the Index):
↑ Recruit Holdings Co., a Japanese information technology recruiter, contributed to returns as fears of a recession receded and employment trends were strong
↑ Taiwan Semiconductor Manufacturing Co. helped returns as demand for its high-end semiconductors surged during a rise in artificial intelligence applications
↑ Safran SA, a French aeroengine maker, aided returns as air travel continued to recover and weak new aircraft production drove demand for spare parts and service
↑ Schneider Electric SE, a French maker of power distribution equipment, aided returns as electrical grid and data center demand boomed during the period
↓ Nestle SA, a consumer staples company, detracted from Index-relative returns as high inflation weakened consumer buying power during the period
↓ Reckitt Benckiser Group, a U.K. consumer staples company, hampered returns as U.S. litigation involving its baby formula business worried investors
↓ Sartorius AG, a German life sciences equipment supplier, hampered performance amid a downturn in demand for its products following the COVID pandemic
↓ Kose Corp., a Japanese cosmetics maker, hurt returns amid weak Chinese sales and fears that tainted water was used in production. Kose was sold by period-end
Comparison of the change in value of a $5,000,000 investment for the period indicated.

| Class R6 | MSCI EAFE Index |
|---|
| 9/14 | $5,000,000 | $5,000,000 |
| 10/14 | $5,014,140 | $4,927,402 |
| 11/14 | $5,028,281 | $4,994,423 |
| 12/14 | $4,858,272 | $4,821,409 |
| 1/15 | $4,915,495 | $4,844,979 |
| 2/15 | $5,193,029 | $5,134,616 |
| 3/15 | $5,095,749 | $5,056,615 |
| 4/15 | $5,304,615 | $5,263,072 |
| 5/15 | $5,301,754 | $5,236,131 |
| 6/15 | $5,201,613 | $5,087,773 |
| 7/15 | $5,321,782 | $5,193,412 |
| 8/15 | $4,955,552 | $4,811,369 |
| 9/15 | $4,786,743 | $4,567,069 |
| 10/15 | $5,084,305 | $4,924,074 |
| 11/15 | $4,972,719 | $4,847,471 |
| 12/15 | $4,870,103 | $4,782,156 |
| 1/16 | $4,605,518 | $4,436,339 |
| 2/16 | $4,433,974 | $4,355,062 |
| 3/16 | $4,701,466 | $4,638,435 |
| 4/16 | $4,785,785 | $4,772,723 |
| 5/16 | $4,782,877 | $4,729,366 |
| 6/16 | $4,541,553 | $4,570,613 |
| 7/16 | $4,724,727 | $4,802,255 |
| 8/16 | $4,733,449 | $4,805,665 |
| 9/16 | $4,809,045 | $4,864,699 |
| 10/16 | $4,713,097 | $4,765,193 |
| 11/16 | $4,582,258 | $4,670,289 |
| 12/16 | $4,699,492 | $4,829,987 |
| 1/17 | $4,801,590 | $4,970,093 |
| 2/17 | $4,819,607 | $5,041,163 |
| 3/17 | $4,981,762 | $5,179,940 |
| 4/17 | $5,164,937 | $5,311,743 |
| 5/17 | $5,282,049 | $5,506,705 |
| 6/17 | $5,285,052 | $5,496,966 |
| 7/17 | $5,414,175 | $5,655,530 |
| 8/17 | $5,375,138 | $5,653,399 |
| 9/17 | $5,477,236 | $5,794,059 |
| 10/17 | $5,552,307 | $5,882,040 |
| 11/17 | $5,624,376 | $5,943,738 |
| 12/17 | $5,719,678 | $6,039,142 |
| 1/18 | $5,951,763 | $6,342,062 |
| 2/18 | $5,704,409 | $6,055,807 |
| 3/18 | $5,725,786 | $5,946,659 |
| 4/18 | $5,731,893 | $6,082,437 |
| 5/18 | $5,701,356 | $5,945,716 |
| 6/18 | $5,597,528 | $5,873,076 |
| 7/18 | $5,725,786 | $6,017,644 |
| 8/18 | $5,695,248 | $5,901,428 |
| 9/18 | $5,716,624 | $5,952,645 |
| 10/18 | $5,212,755 | $5,478,862 |
| 11/18 | $5,353,228 | $5,471,958 |
| 12/18 | $5,084,622 | $5,206,328 |
| 1/19 | $5,323,060 | $5,548,489 |
| 2/19 | $5,552,209 | $5,689,927 |
| 3/19 | $5,685,363 | $5,725,806 |
| 4/19 | $5,905,222 | $5,886,789 |
| 5/19 | $5,642,010 | $5,604,071 |
| 6/19 | $6,047,665 | $5,936,535 |
| 7/19 | $5,976,443 | $5,861,160 |
| 8/19 | $5,911,415 | $5,709,321 |
| 9/19 | $6,019,796 | $5,872,927 |
| 10/19 | $6,255,138 | $6,083,936 |
| 11/19 | $6,397,581 | $6,152,522 |
| 12/19 | $6,666,271 | $6,352,477 |
| 1/20 | $6,584,746 | $6,219,787 |
| 2/20 | $6,246,102 | $5,657,533 |
| 3/20 | $5,462,203 | $4,902,432 |
| 4/20 | $5,791,441 | $5,219,142 |
| 5/20 | $6,189,661 | $5,446,408 |
| 6/20 | $6,434,237 | $5,631,856 |
| 7/20 | $6,578,475 | $5,763,129 |
| 8/20 | $6,904,576 | $6,059,416 |
| 9/20 | $6,823,051 | $5,901,972 |
| 10/20 | $6,550,254 | $5,666,313 |
| 11/20 | $7,490,932 | $6,544,668 |
| 12/20 | $7,866,260 | $6,848,969 |
| 1/21 | $7,737,047 | $6,776,000 |
| 2/21 | $7,878,866 | $6,927,981 |
| 3/21 | $7,970,261 | $7,087,278 |
| 4/21 | $8,279,113 | $7,300,531 |
| 5/21 | $8,628,934 | $7,538,608 |
| 6/21 | $8,483,963 | $7,453,770 |
| 7/21 | $8,622,631 | $7,509,893 |
| 8/21 | $8,814,876 | $7,642,362 |
| 9/21 | $8,446,145 | $7,420,573 |
| 10/21 | $8,849,543 | $7,603,085 |
| 11/21 | $8,439,842 | $7,249,209 |
| 12/21 | $8,833,901 | $7,620,396 |
| 1/22 | $8,249,231 | $7,252,149 |
| 2/22 | $7,953,535 | $7,123,920 |
| 3/22 | $7,960,256 | $7,169,709 |
| 4/22 | $7,452,869 | $6,705,866 |
| 5/22 | $7,476,390 | $6,756,139 |
| 6/22 | $6,854,758 | $6,129,253 |
| 7/22 | $7,365,505 | $6,434,673 |
| 8/22 | $6,770,753 | $6,129,061 |
| 9/22 | $6,159,202 | $5,555,706 |
| 10/22 | $6,518,740 | $5,854,462 |
| 11/22 | $7,341,983 | $6,513,884 |
| 12/22 | $7,160,170 | $6,519,118 |
| 1/23 | $7,766,905 | $7,047,018 |
| 2/23 | $7,556,616 | $6,899,971 |
| 3/23 | $7,877,221 | $7,070,980 |
| 4/23 | $8,087,510 | $7,270,614 |
| 5/23 | $7,897,905 | $6,962,935 |
| 6/23 | $8,173,694 | $7,279,815 |
| 7/23 | $8,256,431 | $7,515,365 |
| 8/23 | $7,794,484 | $7,227,433 |
| 9/23 | $7,346,327 | $6,980,561 |
| 10/23 | $7,032,617 | $6,697,556 |
| 11/23 | $7,718,642 | $7,319,209 |
| 12/23 | $8,279,948 | $7,708,071 |
| 1/24 | $8,161,514 | $7,752,430 |
| 2/24 | $8,290,398 | $7,894,334 |
| 3/24 | $8,530,750 | $8,153,976 |
| 4/24 | $8,321,749 | $7,945,162 |
| 5/24 | $8,739,752 | $8,252,918 |
| 6/24 | $8,607,384 | $8,119,684 |
| 7/24 | $8,785,036 | $8,357,888 |
| 8/24 | $9,164,722 | $8,629,654 |
| 9/24 | $9,290,123 | $8,709,344 |
Average Annual Total Returns (%)Footnote Reference1
| Fund | 1 Year | 5 Years | 10 Years |
|---|
| Class R6 | 26.46% | 9.06% | 6.39% |
| MSCI EAFE Index (net of foreign withholding taxes) | 24.77% | 8.19% | 5.70% |
| Footnote | Description |
Footnote1 | Class R6 performance prior to 3/7/19 is linked to Class I. This linked performance is adjusted for any applicable sales charge, but is not adjusted for class expense differences. If adjusted for such differences, the performance would be different. Performance presented in the Financial Highlights included in the financial statements is not linked. |
Performance does not reflect the deduction of taxes that a shareholder would pay on Fund distributions or redemption of Fund shares. Performance assumes that all dividends and distributions, if any, were reinvested. For more recent performance information, visit www.eatonvance.com/performance.php. Performance prior to December 31, 2016 is that of the Fund's former investment adviser.
THE FUND'S PAST PERFORMANCE IS NO GUARANTEE OF FUTURE RESULTS.
| Total Net Assets | $1,112,704,495 |
| # of Portfolio Holdings | 48 |
| Portfolio Turnover Rate | 23% |
| Total Advisory Fees Paid | $6,150,824 |
What did the Fund invest in?
The following tables reflect what the Fund invested in as of the report date.
Country Allocation (% of total investments)
| Value | Value |
|---|
| Other | 13.4% |
| Hong Kong | 3.3% |
| United States | 3.4% |
| Denmark | 5.0% |
| Netherlands | 7.0% |
| Germany | 7.2% |
| Switzerland | 8.2% |
| Japan | 8.4% |
| Spain | 8.8% |
| France | 12.9% |
| United Kingdom | 22.4% |
Top Ten Holdings (% of total investments)Footnote Referencea
| Nestle SA | 4.9% |
| ASML Holding NV | 3.9% |
| Iberdrola SA | 3.7% |
| AstraZeneca PLC | 3.7% |
| Siemens AG | 3.5% |
| Compass Group PLC | 3.4% |
| AIA Group Ltd. | 3.3% |
| Novo Nordisk AS, Class B | 3.3% |
| IMCD NV | 3.1% |
| Reckitt Benckiser Group PLC | 3.1% |
| Total | 35.9% |
| Footnote | Description |
Footnotea | Excluding cash equivalents |
If you wish to view additional information about the Fund, including the prospectus, statement of additional information, financial statements and holdings, please scan the QR code or visit www.eatonvance.com/calvert-fund-documents.php. For proxy information, please visit www.calvert.com/active-engagement.php?DM=how-we-influence.
The Funds may deliver a single copy of certain required shareholder documents (including prospectuses, shareholder reports, and proxy materials) to investors with the same last name and the same address. Your participation will continue indefinitely unless you instruct otherwise by calling 1-800-368-2745 or by contacting your financial intermediary. Your instruction will typically be effective within 30 days of receipt.
Not FDIC Insured | May Lose Value | No Bank Guarantee
Annual Shareholder Report September 30, 2024
Calvert International Opportunities Fund
Annual Shareholder Report September 30, 2024
This annual shareholder report contains important information about the Calvert International Opportunities Fund for the period of October 1, 2023 to September 30, 2024. You can find additional information about the Fund at www.eatonvance.com/calvert-fund-documents.php. You can also request this information by contacting us at 1-800-368-2745.
What were the Fund costs for the last year?
(based on a hypothetical $10,000 investment)
| Class Name | Costs of a $10,000 investment | Costs paid as a percentage of a $10,000 investment |
|---|
| Class A | $149 | 1.33% |
How did the Fund perform last year and what affected its performance?
Key contributors to (↑) and detractors from (↓) performance, relative to the MSCI EAFE SMID Cap Index (the Index):
↑ Zegona Communications PLC contributed to Index-relative returns after completing its acquisition of Vodafone Spain and restructuring its business operations
↑ Addtech AB, a Swedish industrial products group, helped returns on robust growth, profit generation, astute acquisitions, and a favorable market outlook
↑ Sanwa Holdings Corp., a Japanese building materials company, aided Fund performance as domestic demand was strong and price increases led to growth
↑ Volution Group PLC, a U.K.-based ventilation products firm, helped returns as profits rose on the strength of its renovations market and business acquisitions
↓ ATS Corp., a Canadian manufacturer of factory automation systems, detracted from Index-relative performance as its backlog of business declined
↓ SUMCO Corp., a Tokyo-based silicon wafer maker, hampered returns on lower-than-expected earnings due to slowing demand and adjustments to customer inventory
↓ Dip Corp., a Japanese online job-board operator, detracted from returns amid weak demand for job seekers by restaurants and manufacturers that hindered sales
↓ Spark New Zealand Ltd., a New Zealand-based telecommunications company, hampered returns as weak demand for IT services led to lower-than-expected earnings
Comparison of the change in value of a $10,000 investment for the period indicated.
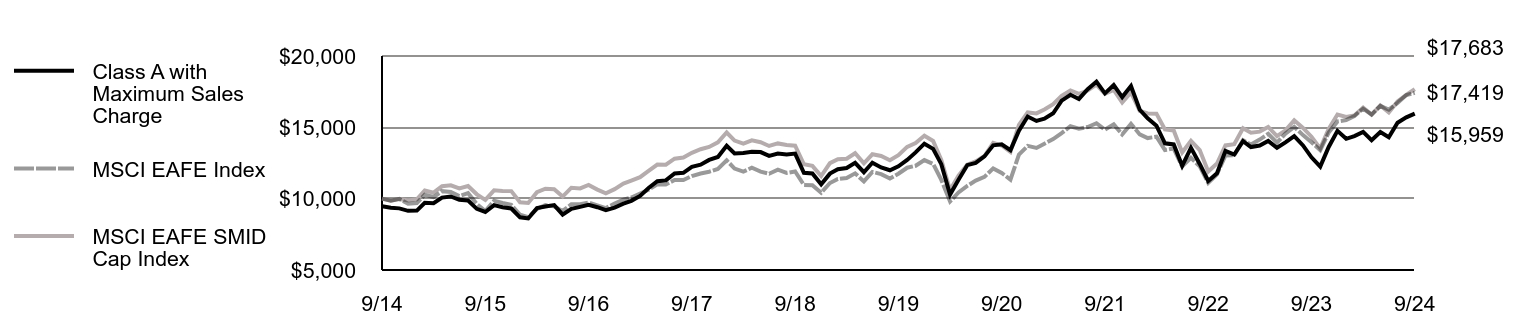
| Class A with Maximum Sales Charge | MSCI EAFE Index | MSCI EAFE SMID Cap Index |
|---|
| 9/14 | $9,475 | $10,000 | $10,000 |
| 10/14 | $9,371 | $9,855 | $9,864 |
| 11/14 | $9,319 | $9,989 | $9,982 |
| 12/14 | $9,147 | $9,643 | $9,876 |
| 1/15 | $9,165 | $9,690 | $9,954 |
| 2/15 | $9,713 | $10,269 | $10,574 |
| 3/15 | $9,682 | $10,113 | $10,426 |
| 4/15 | $10,073 | $10,526 | $10,867 |
| 5/15 | $10,154 | $10,472 | $10,932 |
| 6/15 | $9,924 | $10,176 | $10,720 |
| 7/15 | $9,868 | $10,387 | $10,882 |
| 8/15 | $9,284 | $9,623 | $10,305 |
| 9/15 | $9,066 | $9,134 | $9,918 |
| 10/15 | $9,545 | $9,848 | $10,588 |
| 11/15 | $9,402 | $9,695 | $10,545 |
| 12/15 | $9,311 | $9,564 | $10,529 |
| 1/16 | $8,690 | $8,873 | $9,746 |
| 2/16 | $8,612 | $8,710 | $9,702 |
| 3/16 | $9,337 | $9,277 | $10,457 |
| 4/16 | $9,453 | $9,545 | $10,700 |
| 5/16 | $9,550 | $9,459 | $10,659 |
| 6/16 | $8,877 | $9,141 | $10,147 |
| 7/16 | $9,291 | $9,605 | $10,768 |
| 8/16 | $9,427 | $9,611 | $10,718 |
| 9/16 | $9,563 | $9,729 | $10,958 |
| 10/16 | $9,401 | $9,530 | $10,634 |
| 11/16 | $9,201 | $9,341 | $10,377 |
| 12/16 | $9,372 | $9,660 | $10,668 |
| 1/17 | $9,647 | $9,940 | $11,061 |
| 2/17 | $9,850 | $10,082 | $11,267 |
| 3/17 | $10,196 | $10,360 | $11,506 |
| 4/17 | $10,746 | $10,623 | $11,941 |
| 5/17 | $11,223 | $11,013 | $12,389 |
| 6/17 | $11,282 | $10,994 | $12,384 |
| 7/17 | $11,772 | $11,311 | $12,802 |
| 8/17 | $11,812 | $11,307 | $12,889 |
| 9/17 | $12,230 | $11,588 | $13,214 |
| 10/17 | $12,381 | $11,764 | $13,463 |
| 11/17 | $12,715 | $11,887 | $13,628 |
| 12/17 | $12,925 | $12,078 | $13,952 |
| 1/18 | $13,706 | $12,684 | $14,638 |
| 2/18 | $13,169 | $12,112 | $14,073 |
| 3/18 | $13,204 | $11,893 | $13,860 |
| 4/18 | $13,281 | $12,165 | $14,092 |
| 5/18 | $13,267 | $11,891 | $13,954 |
| 6/18 | $13,002 | $11,746 | $13,694 |
| 7/18 | $13,162 | $12,035 | $13,873 |
| 8/18 | $13,099 | $11,803 | $13,769 |
| 9/18 | $13,162 | $11,905 | $13,716 |
| 10/18 | $11,815 | $10,958 | $12,411 |
| 11/18 | $11,763 | $10,944 | $12,297 |
| 12/18 | $11,012 | $10,413 | $11,587 |
| 1/19 | $11,756 | $11,097 | $12,490 |
| 2/19 | $12,059 | $11,380 | $12,770 |
| 3/19 | $12,150 | $11,452 | $12,801 |
| 4/19 | $12,514 | $11,774 | $13,185 |
| 5/19 | $11,854 | $11,208 | $12,478 |
| 6/19 | $12,522 | $11,873 | $13,110 |
| 7/19 | $12,188 | $11,722 | $12,990 |
| 8/19 | $11,991 | $11,419 | $12,689 |
| 9/19 | $12,272 | $11,746 | $13,044 |
| 10/19 | $12,711 | $12,168 | $13,628 |
| 11/19 | $13,242 | $12,305 | $13,905 |
| 12/19 | $13,853 | $12,705 | $14,411 |
| 1/20 | $13,492 | $12,440 | $14,046 |
| 2/20 | $12,418 | $11,315 | $12,711 |
| 3/20 | $10,286 | $9,805 | $10,609 |
| 4/20 | $11,329 | $10,438 | $11,611 |
| 5/20 | $12,349 | $10,893 | $12,378 |
| 6/20 | $12,503 | $11,264 | $12,615 |
| 7/20 | $12,963 | $11,526 | $12,989 |
| 8/20 | $13,738 | $12,119 | $13,914 |
| 9/20 | $13,815 | $11,804 | $13,729 |
| 10/20 | $13,401 | $11,333 | $13,272 |
| 11/20 | $14,758 | $13,089 | $15,166 |
| 12/20 | $15,755 | $13,698 | $16,045 |
| 1/21 | $15,447 | $13,552 | $15,977 |
| 2/21 | $15,609 | $13,856 | $16,256 |
| 3/21 | $15,987 | $14,175 | $16,617 |
| 4/21 | $16,866 | $14,601 | $17,209 |
| 5/21 | $17,282 | $15,077 | $17,588 |
| 6/21 | $16,989 | $14,908 | $17,347 |
| 7/21 | $17,676 | $15,020 | $17,581 |
| 8/21 | $18,200 | $15,285 | $17,993 |
| 9/21 | $17,383 | $14,841 | $17,352 |
| 10/21 | $17,961 | $15,206 | $17,623 |
| 11/21 | $17,121 | $14,498 | $16,740 |
| 12/21 | $17,898 | $15,241 | $17,450 |
| 1/22 | $16,232 | $14,504 | $16,160 |
| 2/22 | $15,635 | $14,248 | $15,973 |
| 3/22 | $15,112 | $14,339 | $15,959 |
| 4/22 | $13,877 | $13,412 | $14,850 |
| 5/22 | $13,803 | $13,512 | $14,780 |
| 6/22 | $12,302 | $12,259 | $13,243 |
| 7/22 | $13,562 | $12,869 | $14,057 |
| 8/22 | $12,435 | $12,258 | $13,409 |
| 9/22 | $11,241 | $11,111 | $11,902 |
| 10/22 | $11,780 | $11,709 | $12,460 |
| 11/22 | $13,355 | $13,028 | $13,730 |
| 12/22 | $13,091 | $13,038 | $13,817 |
| 1/23 | $14,031 | $14,094 | $14,936 |
| 2/23 | $13,615 | $13,800 | $14,627 |
| 3/23 | $13,723 | $14,142 | $14,700 |
| 4/23 | $14,048 | $14,541 | $15,026 |
| 5/23 | $13,565 | $13,926 | $14,379 |
| 6/23 | $13,948 | $14,560 | $14,788 |
| 7/23 | $14,389 | $15,031 | $15,497 |
| 8/23 | $13,732 | $14,455 | $14,962 |
| 9/23 | $12,900 | $13,961 | $14,342 |
| 10/23 | $12,251 | $13,395 | $13,527 |
| 11/23 | $13,624 | $14,638 | $14,887 |
| 12/23 | $14,753 | $15,416 | $15,897 |
| 1/24 | $14,196 | $15,505 | $15,722 |
| 2/24 | $14,390 | $15,789 | $15,834 |
| 3/24 | $14,677 | $16,308 | $16,387 |
| 4/24 | $14,095 | $15,890 | $15,890 |
| 5/24 | $14,669 | $16,506 | $16,528 |
| 6/24 | $14,306 | $16,239 | $16,039 |
| 7/24 | $15,327 | $16,716 | $16,818 |
| 8/24 | $15,699 | $17,259 | $17,276 |
| 9/24 | $15,959 | $17,419 | $17,683 |
Average Annual Total Returns (%)
| Fund | 1 Year | 5 Years | 10 Years |
|---|
| Class A | 23.72% | 5.39% | 5.35% |
| Class A with 5.25% Maximum Sales Charge | 17.22% | 4.26% | 4.78% |
MSCI EAFE Index (net of foreign withholding taxes)Footnote Reference1 | 24.77% | 8.19% | 5.70% |
| MSCI EAFE SMID Cap Index (net of foreign withholding taxes) | 23.30% | 6.27% | 5.86% |
| Footnote | Description |
Footnote1 | In accordance with regulatory changes requiring the Fund's primary benchmark to represent the overall applicable market, the Fund's primary prospectus benchmark changed to the indicated benchmark effective May 1, 2024. |
Performance does not reflect the deduction of taxes that a shareholder would pay on Fund distributions or redemption of Fund shares. Performance assumes that all dividends and distributions, if any, were reinvested. For more recent performance information, visit www.eatonvance.com/performance.php. Performance prior to December 31, 2016 is that of the Fund's former investment adviser.
THE FUND'S PAST PERFORMANCE IS NO GUARANTEE OF FUTURE RESULTS.
| Total Net Assets | $381,101,260 |
| # of Portfolio Holdings | 98 |
| Portfolio Turnover Rate | 31% |
| Total Advisory Fees Paid | $2,784,424 |
What did the Fund invest in?
The following tables reflect what the Fund invested in as of the report date.
Country Allocation (% of total investments)
| Value | Value |
|---|
| Other | 10.8% |
| Belgium | 2.4% |
| Germany | 2.9% |
| Canada | 3.8% |
| Sweden | 4.2% |
| Netherlands | 4.9% |
| United States | 7.1% |
| Italy | 7.2% |
| Australia | 7.6% |
| United Kingdom | 24.4% |
| Japan | 24.7% |
Top Ten Holdings (% of total investments)Footnote Referencea
| CAR Group Ltd. | 1.9% |
| JTC PLC | 1.8% |
| Diploma PLC | 1.8% |
| Sanwa Holdings Corp. | 1.6% |
| Euronext NV | 1.6% |
| Volution Group PLC | 1.6% |
| IMCD NV | 1.5% |
| BayCurrent, Inc. | 1.5% |
| Games Workshop Group PLC | 1.5% |
| Greggs PLC | 1.5% |
| Total | 16.3% |
| Footnote | Description |
Footnotea | Excluding cash equivalents |
If you wish to view additional information about the Fund, including the prospectus, statement of additional information, financial statements and holdings, please scan the QR code or visit www.eatonvance.com/calvert-fund-documents.php. For proxy information, please visit www.calvert.com/active-engagement.php?DM=how-we-influence.
The Funds may deliver a single copy of certain required shareholder documents (including prospectuses, shareholder reports, and proxy materials) to investors with the same last name and the same address. Your participation will continue indefinitely unless you instruct otherwise by calling 1-800-368-2745 or by contacting your financial intermediary. Your instruction will typically be effective within 30 days of receipt.
Not FDIC Insured | May Lose Value | No Bank Guarantee
Annual Shareholder Report September 30, 2024
Calvert International Opportunities Fund
Annual Shareholder Report September 30, 2024
This annual shareholder report contains important information about the Calvert International Opportunities Fund for the period of October 1, 2023 to September 30, 2024. You can find additional information about the Fund at www.eatonvance.com/calvert-fund-documents.php. You can also request this information by contacting us at 1-800-368-2745.
What were the Fund costs for the last year?
(based on a hypothetical $10,000 investment)
| Class Name | Costs of a $10,000 investment | Costs paid as a percentage of a $10,000 investment |
|---|
| Class C | $232 | 2.08% |
How did the Fund perform last year and what affected its performance?
Key contributors to (↑) and detractors from (↓) performance, relative to the MSCI EAFE SMID Cap Index (the Index):
↓ ATS Corp., a Canadian manufacturer of factory automation systems, detracted from Index-relative performance as its backlog of business declined
↓ SUMCO Corp., a Tokyo-based silicon wafer maker, hampered returns on lower-than-expected earnings due to slowing demand and adjustments to customer inventory
↓ Dip Corp., a Japanese online job-board operator, detracted from returns amid weak demand for job seekers by restaurants and manufacturers that hindered sales
↓ Spark New Zealand Ltd., a New Zealand-based telecommunications company, hampered returns as weak demand for IT services led to lower-than-expected earnings
↑ Zegona Communications PLC contributed to Index-relative returns after completing its acquisition of Vodafone Spain and restructuring its business operations
↑ Addtech AB, a Swedish industrial products group, helped returns on robust growth, profit generation, astute acquisitions, and a favorable market outlook
↑ Sanwa Holdings Corp., a Japanese building materials company, aided Fund performance as domestic demand was strong and price increases led to growth
↑ Volution Group PLC, a U.K.-based ventilation products firm, helped returns as profits rose on the strength of its renovations market and business acquisitions
Comparison of the change in value of a $10,000 investment for the period indicated.
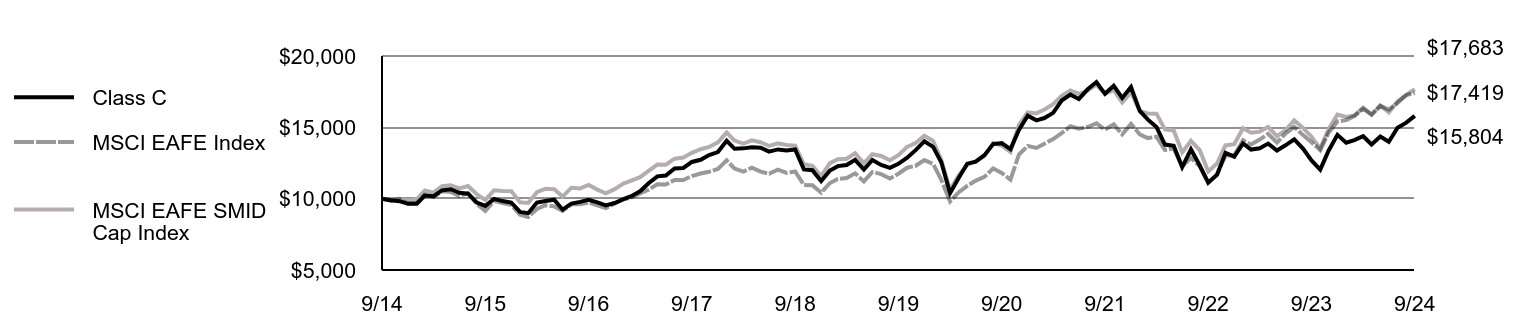
| Class C | MSCI EAFE Index | MSCI EAFE SMID Cap Index |
|---|
| 9/14 | $10,000 | $10,000 | $10,000 |
| 10/14 | $9,888 | $9,855 | $9,864 |
| 11/14 | $9,826 | $9,989 | $9,982 |
| 12/14 | $9,637 | $9,643 | $9,876 |
| 1/15 | $9,651 | $9,690 | $9,954 |
| 2/15 | $10,216 | $10,269 | $10,574 |
| 3/15 | $10,176 | $10,113 | $10,426 |
| 4/15 | $10,581 | $10,526 | $10,867 |
| 5/15 | $10,661 | $10,472 | $10,932 |
| 6/15 | $10,415 | $10,176 | $10,720 |
| 7/15 | $10,349 | $10,387 | $10,882 |
| 8/15 | $9,724 | $9,623 | $10,305 |
| 9/15 | $9,491 | $9,134 | $9,918 |
| 10/15 | $9,983 | $9,848 | $10,588 |
| 11/15 | $9,830 | $9,695 | $10,545 |
| 12/15 | $9,722 | $9,564 | $10,529 |
| 1/16 | $9,069 | $8,873 | $9,746 |
| 2/16 | $8,980 | $8,710 | $9,702 |
| 3/16 | $9,729 | $9,277 | $10,457 |
| 4/16 | $9,839 | $9,545 | $10,700 |
| 5/16 | $9,928 | $9,459 | $10,659 |
| 6/16 | $9,227 | $9,141 | $10,147 |
| 7/16 | $9,653 | $9,605 | $10,768 |
| 8/16 | $9,777 | $9,611 | $10,718 |
| 9/16 | $9,914 | $9,729 | $10,958 |
| 10/16 | $9,735 | $9,530 | $10,634 |
| 11/16 | $9,522 | $9,341 | $10,377 |
| 12/16 | $9,694 | $9,660 | $10,668 |
| 1/17 | $9,962 | $9,940 | $11,061 |
| 2/17 | $10,175 | $10,082 | $11,267 |
| 3/17 | $10,519 | $10,360 | $11,506 |
| 4/17 | $11,082 | $10,623 | $11,941 |
| 5/17 | $11,564 | $11,013 | $12,389 |
| 6/17 | $11,626 | $10,994 | $12,384 |
| 7/17 | $12,121 | $11,311 | $12,802 |
| 8/17 | $12,155 | $11,307 | $12,889 |
| 9/17 | $12,574 | $11,588 | $13,214 |
| 10/17 | $12,726 | $11,764 | $13,463 |
| 11/17 | $13,057 | $11,887 | $13,628 |
| 12/17 | $13,269 | $12,078 | $13,952 |
| 1/18 | $14,059 | $12,684 | $14,638 |
| 2/18 | $13,496 | $12,112 | $14,073 |
| 3/18 | $13,526 | $11,893 | $13,860 |
| 4/18 | $13,599 | $12,165 | $14,092 |
| 5/18 | $13,577 | $11,891 | $13,954 |
| 6/18 | $13,299 | $11,746 | $13,694 |
| 7/18 | $13,452 | $12,035 | $13,873 |
| 8/18 | $13,379 | $11,803 | $13,769 |
| 9/18 | $13,445 | $11,905 | $13,716 |
| 10/18 | $12,055 | $10,958 | $12,411 |
| 11/18 | $11,995 | $10,944 | $12,297 |
| 12/18 | $11,229 | $10,413 | $11,587 |
| 1/19 | $11,971 | $11,097 | $12,490 |
| 2/19 | $12,280 | $11,380 | $12,770 |
| 3/19 | $12,359 | $11,452 | $12,801 |
| 4/19 | $12,722 | $11,774 | $13,185 |
| 5/19 | $12,043 | $11,208 | $12,478 |
| 6/19 | $12,714 | $11,873 | $13,110 |
| 7/19 | $12,367 | $11,722 | $12,990 |
| 8/19 | $12,161 | $11,419 | $12,689 |
| 9/19 | $12,438 | $11,746 | $13,044 |
| 10/19 | $12,872 | $12,168 | $13,628 |
| 11/19 | $13,402 | $12,305 | $13,905 |
| 12/19 | $14,017 | $12,705 | $14,411 |
| 1/20 | $13,636 | $12,440 | $14,046 |
| 2/20 | $12,550 | $11,315 | $12,711 |
| 3/20 | $10,384 | $9,805 | $10,609 |
| 4/20 | $11,431 | $10,438 | $11,611 |
| 5/20 | $12,454 | $10,893 | $12,378 |
| 6/20 | $12,597 | $11,264 | $12,615 |
| 7/20 | $13,049 | $11,526 | $12,989 |
| 8/20 | $13,826 | $12,119 | $13,914 |
| 9/20 | $13,890 | $11,804 | $13,729 |
| 10/20 | $13,469 | $11,333 | $13,272 |
| 11/20 | $14,818 | $13,089 | $15,166 |
| 12/20 | $15,817 | $13,698 | $16,045 |
| 1/21 | $15,492 | $13,552 | $15,977 |
| 2/21 | $15,651 | $13,856 | $16,256 |
| 3/21 | $16,015 | $14,175 | $16,617 |
| 4/21 | $16,880 | $14,601 | $17,209 |
| 5/21 | $17,292 | $15,077 | $17,588 |
| 6/21 | $16,991 | $14,908 | $17,347 |
| 7/21 | $17,665 | $15,020 | $17,581 |
| 8/21 | $18,173 | $15,285 | $17,993 |
| 9/21 | $17,348 | $14,841 | $17,352 |
| 10/21 | $17,919 | $15,206 | $17,623 |
| 11/21 | $17,062 | $14,498 | $16,740 |
| 12/21 | $17,826 | $15,241 | $17,450 |
| 1/22 | $16,156 | $14,504 | $16,160 |
| 2/22 | $15,554 | $14,248 | $15,973 |
| 3/22 | $15,029 | $14,339 | $15,959 |
| 4/22 | $13,791 | $13,412 | $14,850 |
| 5/22 | $13,707 | $13,512 | $14,780 |
| 6/22 | $12,215 | $12,259 | $13,243 |
| 7/22 | $13,452 | $12,869 | $14,057 |
| 8/22 | $12,325 | $12,258 | $13,409 |
| 9/22 | $11,130 | $11,111 | $11,902 |
| 10/22 | $11,664 | $11,709 | $12,460 |
| 11/22 | $13,206 | $13,028 | $13,730 |
| 12/22 | $12,944 | $13,038 | $13,817 |
| 1/23 | $13,868 | $14,094 | $14,936 |
| 2/23 | $13,444 | $13,800 | $14,627 |
| 3/23 | $13,537 | $14,142 | $14,700 |
| 4/23 | $13,859 | $14,541 | $15,026 |
| 5/23 | $13,376 | $13,926 | $14,379 |
| 6/23 | $13,740 | $14,560 | $14,788 |
| 7/23 | $14,164 | $15,031 | $15,497 |
| 8/23 | $13,512 | $14,455 | $14,962 |
| 9/23 | $12,681 | $13,961 | $14,342 |
| 10/23 | $12,037 | $13,395 | $13,527 |
| 11/23 | $13,376 | $14,638 | $14,887 |
| 12/23 | $14,471 | $15,416 | $15,897 |
| 1/24 | $13,925 | $15,505 | $15,722 |
| 2/24 | $14,104 | $15,789 | $15,834 |
| 3/24 | $14,377 | $16,308 | $16,387 |
| 4/24 | $13,797 | $15,890 | $15,890 |
| 5/24 | $14,352 | $16,506 | $16,528 |
| 6/24 | $13,993 | $16,239 | $16,039 |
| 7/24 | $14,975 | $16,716 | $16,818 |
| 8/24 | $15,326 | $17,259 | $17,276 |
| 9/24 | $15,804 | $17,419 | $17,683 |
Average Annual Total Returns (%)
| Fund | 1 Year | 5 Years | 10 Years |
|---|
| Class C | 22.81% | 4.60% | 4.68% |
| Class C with 1% Maximum Deferred Sales Charge | 21.81% | 4.60% | 4.68% |
MSCI EAFE Index (net of foreign withholding taxes)Footnote Reference1 | 24.77% | 8.19% | 5.70% |
| MSCI EAFE SMID Cap Index (net of foreign withholding taxes) | 23.30% | 6.27% | 5.86% |
| Footnote | Description |
Footnote1 | In accordance with regulatory changes requiring the Fund's primary benchmark to represent the overall applicable market, the Fund's primary prospectus benchmark changed to the indicated benchmark effective May 1, 2024. |
Performance does not reflect the deduction of taxes that a shareholder would pay on Fund distributions or redemption of Fund shares. Performance assumes that all dividends and distributions, if any, were reinvested. For more recent performance information, visit www.eatonvance.com/performance.php. Performance prior to December 31, 2016 is that of the Fund's former investment adviser.
THE FUND'S PAST PERFORMANCE IS NO GUARANTEE OF FUTURE RESULTS.
| Total Net Assets | $381,101,260 |
| # of Portfolio Holdings | 98 |
| Portfolio Turnover Rate | 31% |
| Total Advisory Fees Paid | $2,784,424 |
What did the Fund invest in?
The following tables reflect what the Fund invested in as of the report date.
Country Allocation (% of total investments)
| Value | Value |
|---|
| Other | 10.8% |
| Belgium | 2.4% |
| Germany | 2.9% |
| Canada | 3.8% |
| Sweden | 4.2% |
| Netherlands | 4.9% |
| United States | 7.1% |
| Italy | 7.2% |
| Australia | 7.6% |
| United Kingdom | 24.4% |
| Japan | 24.7% |
Top Ten Holdings (% of total investments)Footnote Referencea
| CAR Group Ltd. | 1.9% |
| JTC PLC | 1.8% |
| Diploma PLC | 1.8% |
| Sanwa Holdings Corp. | 1.6% |
| Euronext NV | 1.6% |
| Volution Group PLC | 1.6% |
| IMCD NV | 1.5% |
| BayCurrent, Inc. | 1.5% |
| Games Workshop Group PLC | 1.5% |
| Greggs PLC | 1.5% |
| Total | 16.3% |
| Footnote | Description |
Footnotea | Excluding cash equivalents |
If you wish to view additional information about the Fund, including the prospectus, statement of additional information, financial statements and holdings, please scan the QR code or visit www.eatonvance.com/calvert-fund-documents.php. For proxy information, please visit www.calvert.com/active-engagement.php?DM=how-we-influence.
The Funds may deliver a single copy of certain required shareholder documents (including prospectuses, shareholder reports, and proxy materials) to investors with the same last name and the same address. Your participation will continue indefinitely unless you instruct otherwise by calling 1-800-368-2745 or by contacting your financial intermediary. Your instruction will typically be effective within 30 days of receipt.
Not FDIC Insured | May Lose Value | No Bank Guarantee
Annual Shareholder Report September 30, 2024
Calvert International Opportunities Fund
Annual Shareholder Report September 30, 2024
This annual shareholder report contains important information about the Calvert International Opportunities Fund for the period of October 1, 2023 to September 30, 2024. You can find additional information about the Fund at www.eatonvance.com/calvert-fund-documents.php. You can also request this information by contacting us at 1-800-368-2745.
What were the Fund costs for the last year?
(based on a hypothetical $10,000 investment)
| Class Name | Costs of a $10,000 investment | Costs paid as a percentage of a $10,000 investment |
|---|
| Class I | $121 | 1.08% |
How did the Fund perform last year and what affected its performance?
Key contributors to (↑) and detractors from (↓) performance, relative to the MSCI EAFE SMID Cap Index (the Index):
↑ Zegona Communications PLC contributed to Index-relative returns after completing its acquisition of Vodafone Spain and restructuring its business operations
↑ Addtech AB, a Swedish industrial products group, helped returns on robust growth, profit generation, astute acquisitions, and a favorable market outlook
↑ Sanwa Holdings Corp., a Japanese building materials company, aided Fund performance as domestic demand was strong and price increases led to growth
↑ Volution Group PLC, a U.K.-based ventilation products firm, helped returns as profits rose on the strength of its renovations market and business acquisitions
↓ ATS Corp., a Canadian manufacturer of factory automation systems, detracted from Index-relative performance as its backlog of business declined
↓ SUMCO Corp., a Tokyo-based silicon wafer maker, hampered returns on lower-than-expected earnings due to slowing demand and adjustments to customer inventory
↓ Dip Corp., a Japanese online job-board operator, detracted from returns amid weak demand for job seekers by restaurants and manufacturers that hindered sales
↓ Spark New Zealand Ltd., a New Zealand-based telecommunications company, hampered returns as weak demand for IT services led to lower-than-expected earnings
Comparison of the change in value of a $1,000,000 investment for the period indicated.
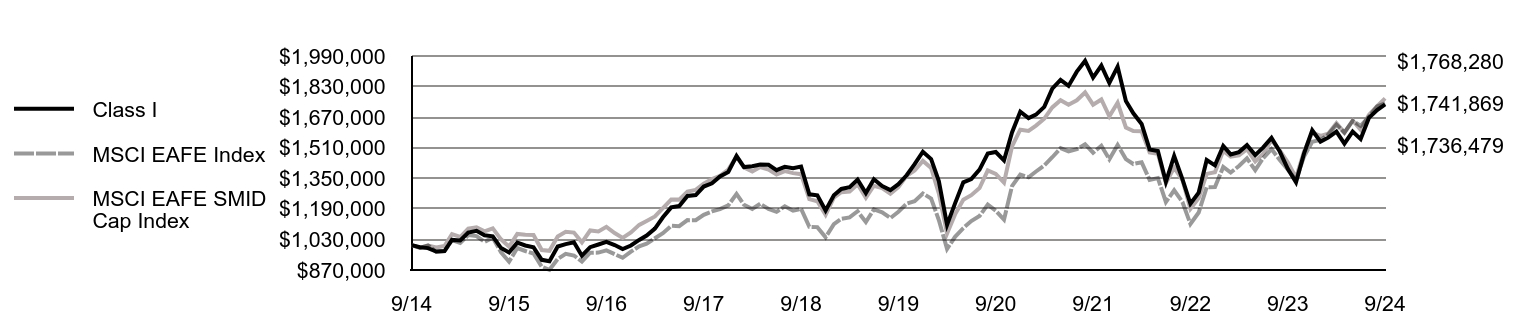
| Class I | MSCI EAFE Index | MSCI EAFE SMID Cap Index |
|---|
| 9/14 | $1,000,000 | $1,000,000 | $1,000,000 |
| 10/14 | $989,507 | $985,480 | $986,360 |
| 11/14 | $984,566 | $998,885 | $998,164 |
| 12/14 | $966,752 | $964,282 | $987,552 |
| 1/15 | $969,422 | $968,996 | $995,353 |
| 2/15 | $1,027,595 | $1,026,923 | $1,057,407 |
| 3/15 | $1,024,255 | $1,011,323 | $1,042,635 |
| 4/15 | $1,066,372 | $1,052,614 | $1,086,691 |
| 5/15 | $1,075,065 | $1,047,226 | $1,093,243 |
| 6/15 | $1,051,664 | $1,017,555 | $1,072,010 |
| 7/15 | $1,046,319 | $1,038,682 | $1,088,208 |
| 8/15 | $984,814 | $962,274 | $1,030,471 |
| 9/15 | $961,418 | $913,414 | $991,829 |
| 10/15 | $1,012,899 | $984,815 | $1,058,843 |
| 11/15 | $998,196 | $969,494 | $1,054,542 |
| 12/15 | $988,897 | $956,431 | $1,052,866 |
| 1/16 | $923,198 | $887,268 | $974,594 |
| 2/16 | $915,508 | $871,012 | $970,160 |
| 3/16 | $993,083 | $927,687 | $1,045,651 |
| 4/16 | $1,005,663 | $954,545 | $1,070,050 |
| 5/16 | $1,015,452 | $945,873 | $1,065,909 |
| 6/16 | $944,864 | $914,123 | $1,014,696 |
| 7/16 | $989,585 | $960,451 | $1,076,804 |
| 8/16 | $1,003,556 | $961,133 | $1,071,820 |
| 9/16 | $1,017,534 | $972,940 | $1,095,806 |
| 10/16 | $1,000,757 | $953,039 | $1,063,392 |
| 11/16 | $979,786 | $934,058 | $1,037,736 |
| 12/16 | $998,283 | $965,997 | $1,066,799 |
| 1/17 | $1,027,370 | $994,019 | $1,106,109 |
| 2/17 | $1,050,078 | $1,008,233 | $1,126,671 |
| 3/17 | $1,086,980 | $1,035,988 | $1,150,620 |
| 4/17 | $1,145,867 | $1,062,349 | $1,194,115 |
| 5/17 | $1,197,671 | $1,101,341 | $1,238,901 |
| 6/17 | $1,204,772 | $1,099,393 | $1,238,362 |
| 7/17 | $1,257,281 | $1,131,106 | $1,280,207 |
| 8/17 | $1,262,239 | $1,130,680 | $1,288,940 |
| 9/17 | $1,306,930 | $1,158,812 | $1,321,359 |
| 10/17 | $1,323,963 | $1,176,408 | $1,346,333 |
| 11/17 | $1,359,875 | $1,188,748 | $1,362,799 |
| 12/17 | $1,382,720 | $1,207,828 | $1,395,196 |
| 1/18 | $1,466,510 | $1,268,412 | $1,463,815 |
| 2/18 | $1,408,610 | $1,211,161 | $1,407,267 |
| 3/18 | $1,413,174 | $1,189,332 | $1,385,990 |
| 4/18 | $1,421,544 | $1,216,487 | $1,409,192 |
| 5/18 | $1,420,794 | $1,189,143 | $1,395,395 |
| 6/18 | $1,392,599 | $1,174,615 | $1,369,355 |
| 7/18 | $1,410,131 | $1,203,529 | $1,387,263 |
| 8/18 | $1,403,278 | $1,180,286 | $1,376,894 |
| 9/18 | $1,410,901 | $1,190,529 | $1,371,614 |
| 10/18 | $1,266,162 | $1,095,772 | $1,241,064 |
| 11/18 | $1,260,882 | $1,094,392 | $1,229,737 |
| 12/18 | $1,181,036 | $1,041,266 | $1,158,658 |
| 1/19 | $1,260,889 | $1,109,698 | $1,248,960 |
| 2/19 | $1,294,157 | $1,137,985 | $1,277,045 |
| 3/19 | $1,303,299 | $1,145,161 | $1,280,081 |
| 4/19 | $1,343,217 | $1,177,358 | $1,318,464 |
| 5/19 | $1,272,531 | $1,120,814 | $1,247,777 |
| 6/19 | $1,344,881 | $1,187,307 | $1,311,032 |
| 7/19 | $1,309,119 | $1,172,232 | $1,298,952 |
| 8/19 | $1,288,318 | $1,141,864 | $1,268,872 |
| 9/19 | $1,319,096 | $1,174,585 | $1,304,390 |
| 10/19 | $1,365,678 | $1,216,787 | $1,362,788 |
| 11/19 | $1,423,890 | $1,230,504 | $1,390,488 |
| 12/19 | $1,489,216 | $1,270,495 | $1,441,068 |
| 1/20 | $1,450,422 | $1,243,957 | $1,404,602 |
| 2/20 | $1,335,748 | $1,131,507 | $1,271,130 |
| 3/20 | $1,106,372 | $980,486 | $1,060,907 |
| 4/20 | $1,218,535 | $1,043,828 | $1,161,093 |
| 5/20 | $1,329,001 | $1,089,282 | $1,237,761 |
| 6/20 | $1,345,871 | $1,126,371 | $1,261,512 |
| 7/20 | $1,395,632 | $1,152,626 | $1,298,937 |
| 8/20 | $1,479,118 | $1,211,883 | $1,391,360 |
| 9/20 | $1,487,563 | $1,180,394 | $1,372,921 |
| 10/20 | $1,443,703 | $1,133,263 | $1,327,174 |
| 11/20 | $1,589,586 | $1,308,934 | $1,516,647 |
| 12/20 | $1,698,267 | $1,369,794 | $1,604,455 |
| 1/21 | $1,665,116 | $1,355,200 | $1,597,686 |
| 2/21 | $1,682,950 | $1,385,596 | $1,625,562 |
| 3/21 | $1,723,747 | $1,417,456 | $1,661,698 |
| 4/21 | $1,818,957 | $1,460,106 | $1,720,895 |
| 5/21 | $1,864,857 | $1,507,722 | $1,758,761 |
| 6/21 | $1,833,414 | $1,490,754 | $1,734,745 |
| 7/21 | $1,908,225 | $1,501,979 | $1,758,075 |
| 8/21 | $1,964,324 | $1,528,472 | $1,799,343 |
| 9/21 | $1,876,775 | $1,484,115 | $1,735,170 |
| 10/21 | $1,939,675 | $1,520,617 | $1,762,274 |
| 11/21 | $1,848,726 | $1,449,842 | $1,674,045 |
| 12/21 | $1,934,002 | $1,524,079 | $1,745,004 |
| 1/22 | $1,754,180 | $1,450,430 | $1,616,028 |
| 2/22 | $1,689,958 | $1,424,784 | $1,597,337 |
| 3/22 | $1,633,993 | $1,433,942 | $1,595,923 |
| 4/22 | $1,500,961 | $1,341,173 | $1,484,970 |
| 5/22 | $1,492,704 | $1,351,228 | $1,477,977 |
| 6/22 | $1,331,232 | $1,225,851 | $1,324,259 |
| 7/22 | $1,467,015 | $1,286,935 | $1,405,718 |
| 8/22 | $1,345,911 | $1,225,812 | $1,340,921 |
| 9/22 | $1,216,549 | $1,111,141 | $1,190,210 |
| 10/22 | $1,275,267 | $1,170,892 | $1,246,041 |
| 11/22 | $1,445,914 | $1,302,777 | $1,373,014 |
| 12/22 | $1,417,915 | $1,303,824 | $1,381,711 |
| 1/23 | $1,519,459 | $1,409,404 | $1,493,552 |
| 2/23 | $1,475,149 | $1,379,994 | $1,462,688 |
| 3/23 | $1,487,150 | $1,414,196 | $1,469,950 |
| 4/23 | $1,523,151 | $1,454,123 | $1,502,639 |
| 5/23 | $1,471,457 | $1,392,587 | $1,437,860 |
| 6/23 | $1,512,074 | $1,455,963 | $1,478,809 |
| 7/23 | $1,560,999 | $1,503,073 | $1,549,684 |
| 8/23 | $1,489,919 | $1,445,487 | $1,496,203 |
| 9/23 | $1,399,453 | $1,396,112 | $1,434,164 |
| 10/23 | $1,329,296 | $1,339,511 | $1,352,697 |
| 11/23 | $1,478,842 | $1,463,842 | $1,488,715 |
| 12/23 | $1,601,153 | $1,541,614 | $1,589,673 |
| 1/24 | $1,541,956 | $1,550,486 | $1,572,186 |
| 2/24 | $1,562,628 | $1,578,867 | $1,583,412 |
| 3/24 | $1,594,576 | $1,630,795 | $1,638,671 |
| 4/24 | $1,531,620 | $1,589,032 | $1,589,011 |
| 5/24 | $1,594,576 | $1,650,584 | $1,652,827 |
| 6/24 | $1,555,111 | $1,623,937 | $1,603,865 |
| 7/24 | $1,665,989 | $1,671,578 | $1,681,778 |
| 8/24 | $1,707,333 | $1,725,931 | $1,727,573 |
| 9/24 | $1,736,479 | $1,741,869 | $1,768,280 |
Average Annual Total Returns (%)
| Fund | 1 Year | 5 Years | 10 Years |
|---|
| Class I | 24.08% | 5.65% | 5.67% |
MSCI EAFE Index (net of foreign withholding taxes)Footnote Reference1 | 24.77% | 8.19% | 5.70% |
| MSCI EAFE SMID Cap Index (net of foreign withholding taxes) | 23.30% | 6.27% | 5.86% |
| Footnote | Description |
Footnote1 | In accordance with regulatory changes requiring the Fund's primary benchmark to represent the overall applicable market, the Fund's primary prospectus benchmark changed to the indicated benchmark effective May 1, 2024. |
Performance does not reflect the deduction of taxes that a shareholder would pay on Fund distributions or redemption of Fund shares. Performance assumes that all dividends and distributions, if any, were reinvested. For more recent performance information, visit www.eatonvance.com/performance.php. Performance prior to December 31, 2016 is that of the Fund's former investment adviser.
THE FUND'S PAST PERFORMANCE IS NO GUARANTEE OF FUTURE RESULTS.
| Total Net Assets | $381,101,260 |
| # of Portfolio Holdings | 98 |
| Portfolio Turnover Rate | 31% |
| Total Advisory Fees Paid | $2,784,424 |
What did the Fund invest in?
The following tables reflect what the Fund invested in as of the report date.
Country Allocation (% of total investments)
| Value | Value |
|---|
| Other | 10.8% |
| Belgium | 2.4% |
| Germany | 2.9% |
| Canada | 3.8% |
| Sweden | 4.2% |
| Netherlands | 4.9% |
| United States | 7.1% |
| Italy | 7.2% |
| Australia | 7.6% |
| United Kingdom | 24.4% |
| Japan | 24.7% |
Top Ten Holdings (% of total investments)Footnote Referencea
| CAR Group Ltd. | 1.9% |
| JTC PLC | 1.8% |
| Diploma PLC | 1.8% |
| Sanwa Holdings Corp. | 1.6% |
| Euronext NV | 1.6% |
| Volution Group PLC | 1.6% |
| IMCD NV | 1.5% |
| BayCurrent, Inc. | 1.5% |
| Games Workshop Group PLC | 1.5% |
| Greggs PLC | 1.5% |
| Total | 16.3% |
| Footnote | Description |
Footnotea | Excluding cash equivalents |
If you wish to view additional information about the Fund, including the prospectus, statement of additional information, financial statements and holdings, please scan the QR code or visit www.eatonvance.com/calvert-fund-documents.php. For proxy information, please visit www.calvert.com/active-engagement.php?DM=how-we-influence.
The Funds may deliver a single copy of certain required shareholder documents (including prospectuses, shareholder reports, and proxy materials) to investors with the same last name and the same address. Your participation will continue indefinitely unless you instruct otherwise by calling 1-800-368-2745 or by contacting your financial intermediary. Your instruction will typically be effective within 30 days of receipt.
Not FDIC Insured | May Lose Value | No Bank Guarantee
Annual Shareholder Report September 30, 2024
Calvert International Opportunities Fund
Annual Shareholder Report September 30, 2024
This annual shareholder report contains important information about the Calvert International Opportunities Fund for the period of October 1, 2023 to September 30, 2024. You can find additional information about the Fund at www.eatonvance.com/calvert-fund-documents.php. You can also request this information by contacting us at 1-800-368-2745.
What were the Fund costs for the last year?
(based on a hypothetical $10,000 investment)
| Class Name | Costs of a $10,000 investment | Costs paid as a percentage of a $10,000 investment |
|---|
| Class R6 | $112 | 1.00% |
How did the Fund perform last year and what affected its performance?
Key contributors to (↑) and detractors from (↓) performance, relative to the MSCI EAFE SMID Cap Index (the Index):
↑ Zegona Communications PLC contributed to Index-relative returns after completing its acquisition of Vodafone Spain and restructuring its business operations
↑ Addtech AB, a Swedish industrial products group, helped returns on robust growth, profit generation, astute acquisitions, and a favorable market outlook
↑ Sanwa Holdings Corp., a Japanese building materials company, aided Fund performance as domestic demand was strong and price increases led to growth
↑ Volution Group PLC, a U.K.-based ventilation products firm, helped returns as profits rose on the strength of its renovations market and business acquisitions
↓ ATS Corp., a Canadian manufacturer of factory automation systems, detracted from Index-relative performance as its backlog of business declined
↓ SUMCO Corp., a Tokyo-based silicon wafer maker, hampered returns on lower-than-expected earnings due to slowing demand and adjustments to customer inventory
↓ Dip Corp., a Japanese online job-board operator, detracted from returns amid weak demand for job seekers by restaurants and manufacturers that hindered sales
↓ Spark New Zealand Ltd., a New Zealand-based telecommunications company, hampered returns as weak demand for IT services led to lower-than-expected earnings
Comparison of the change in value of a $5,000,000 investment for the period indicated.
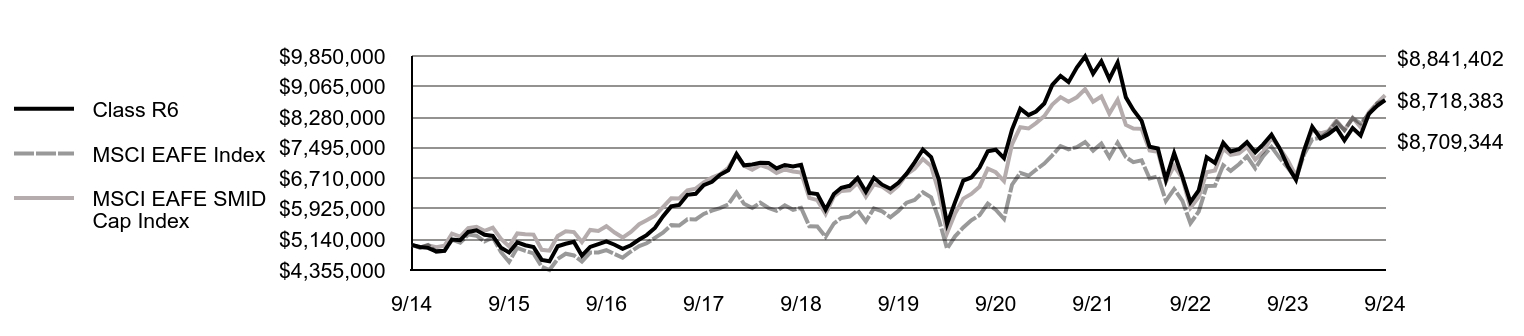
| Class R6 | MSCI EAFE Index | MSCI EAFE SMID Cap Index |
|---|
| 9/14 | $5,000,000 | $5,000,000 | $5,000,000 |
| 10/14 | $4,947,498 | $4,927,402 | $4,931,800 |
| 11/14 | $4,922,792 | $4,994,423 | $4,990,820 |
| 12/14 | $4,833,722 | $4,821,409 | $4,937,760 |
| 1/15 | $4,847,093 | $4,844,979 | $4,976,764 |
| 2/15 | $5,137,919 | $5,134,616 | $5,287,036 |
| 3/15 | $5,121,204 | $5,056,615 | $5,213,177 |
| 4/15 | $5,331,802 | $5,263,072 | $5,433,455 |
| 5/15 | $5,375,259 | $5,236,131 | $5,466,214 |
| 6/15 | $5,258,260 | $5,087,773 | $5,360,049 |
| 7/15 | $5,231,518 | $5,193,412 | $5,441,040 |
| 8/15 | $4,923,978 | $4,811,369 | $5,152,355 |
| 9/15 | $4,806,979 | $4,567,069 | $4,959,147 |
| 10/15 | $5,064,377 | $4,924,074 | $5,294,216 |
| 11/15 | $4,990,834 | $4,847,471 | $5,272,710 |
| 12/15 | $4,944,371 | $4,782,156 | $5,264,328 |
| 1/16 | $4,615,911 | $4,436,339 | $4,872,969 |
| 2/16 | $4,577,474 | $4,355,062 | $4,850,802 |
| 3/16 | $4,965,336 | $4,638,435 | $5,228,257 |
| 4/16 | $5,028,233 | $4,772,723 | $5,350,248 |
| 5/16 | $5,077,153 | $4,729,366 | $5,329,546 |
| 6/16 | $4,724,233 | $4,570,613 | $5,073,479 |
| 7/16 | $4,947,865 | $4,802,255 | $5,384,018 |
| 8/16 | $5,017,750 | $4,805,665 | $5,359,098 |
| 9/16 | $5,087,635 | $4,864,699 | $5,479,029 |
| 10/16 | $5,003,773 | $4,765,193 | $5,316,958 |
| 11/16 | $4,898,946 | $4,670,289 | $5,188,678 |
| 12/16 | $4,991,424 | $4,829,987 | $5,333,995 |
| 1/17 | $5,136,874 | $4,970,093 | $5,530,547 |
| 2/17 | $5,250,396 | $5,041,163 | $5,633,355 |
| 3/17 | $5,434,869 | $5,179,940 | $5,753,098 |
| 4/17 | $5,729,317 | $5,311,743 | $5,970,574 |
| 5/17 | $5,988,290 | $5,506,705 | $6,194,503 |
| 6/17 | $6,023,765 | $5,496,966 | $6,191,810 |
| 7/17 | $6,286,285 | $5,655,530 | $6,401,037 |
| 8/17 | $6,311,118 | $5,653,399 | $6,444,698 |
| 9/17 | $6,534,614 | $5,794,059 | $6,606,794 |
| 10/17 | $6,619,756 | $5,882,040 | $6,731,663 |
| 11/17 | $6,799,261 | $5,943,738 | $6,813,996 |
| 12/17 | $6,913,535 | $6,039,142 | $6,975,981 |
| 1/18 | $7,332,537 | $6,342,062 | $7,319,076 |
| 2/18 | $7,043,044 | $6,055,807 | $7,036,333 |
| 3/18 | $7,065,899 | $5,946,659 | $6,929,952 |
| 4/18 | $7,107,799 | $6,082,437 | $7,045,959 |
| 5/18 | $7,103,990 | $5,945,716 | $6,976,977 |
| 6/18 | $6,963,053 | $5,873,076 | $6,846,776 |
| 7/18 | $7,050,663 | $6,017,644 | $6,936,316 |
| 8/18 | $7,016,381 | $5,901,428 | $6,884,468 |
| 9/18 | $7,054,472 | $5,952,645 | $6,858,068 |
| 10/18 | $6,330,741 | $5,478,862 | $6,205,319 |
| 11/18 | $6,304,469 | $5,471,958 | $6,148,683 |
| 12/18 | $5,905,242 | $5,206,328 | $5,793,289 |
| 1/19 | $6,304,469 | $5,548,488 | $6,244,799 |
| 2/19 | $6,466,656 | $5,689,927 | $6,385,227 |
| 3/19 | $6,516,559 | $5,725,806 | $6,400,403 |
| 4/19 | $6,716,173 | $5,886,789 | $6,592,318 |
| 5/19 | $6,362,690 | $5,604,071 | $6,238,886 |
| 6/19 | $6,724,490 | $5,936,535 | $6,555,159 |
| 7/19 | $6,545,669 | $5,861,160 | $6,494,760 |
| 8/19 | $6,441,704 | $5,709,321 | $6,344,359 |
| 9/19 | $6,595,573 | $5,872,927 | $6,521,949 |
| 10/19 | $6,828,456 | $6,083,936 | $6,813,940 |
| 11/19 | $7,119,559 | $6,152,522 | $6,952,441 |
| 12/19 | $7,448,732 | $6,352,477 | $7,205,341 |
| 1/20 | $7,254,601 | $6,219,787 | $7,023,008 |
| 2/20 | $6,680,648 | $5,657,533 | $6,355,648 |
| 3/20 | $5,536,961 | $4,902,432 | $5,304,534 |
| 4/20 | $6,098,254 | $5,219,142 | $5,805,463 |
| 5/20 | $6,651,106 | $5,446,408 | $6,188,804 |
| 6/20 | $6,731,290 | $5,631,856 | $6,307,560 |
| 7/20 | $6,980,285 | $5,763,129 | $6,494,683 |
| 8/20 | $7,402,309 | $6,059,416 | $6,956,798 |
| 9/20 | $7,444,512 | $5,901,972 | $6,864,606 |
| 10/20 | $7,225,059 | $5,666,313 | $6,635,870 |
| 11/20 | $7,959,382 | $6,544,668 | $7,583,234 |
| 12/20 | $8,497,724 | $6,848,969 | $8,022,275 |
| 1/21 | $8,331,687 | $6,776,000 | $7,988,429 |
| 2/21 | $8,425,349 | $6,927,981 | $8,127,812 |
| 3/21 | $8,629,703 | $7,087,278 | $8,308,490 |
| 4/21 | $9,106,529 | $7,300,531 | $8,604,477 |
| 5/21 | $9,336,428 | $7,538,608 | $8,793,807 |
| 6/21 | $9,178,905 | $7,453,770 | $8,673,724 |
| 7/21 | $9,553,554 | $7,509,893 | $8,790,377 |
| 8/21 | $9,838,798 | $7,642,362 | $8,996,717 |
| 9/21 | $9,396,031 | $7,420,573 | $8,675,849 |
| 10/21 | $9,715,334 | $7,603,085 | $8,811,371 |
| 11/21 | $9,259,795 | $7,249,209 | $8,370,227 |
| 12/21 | $9,684,156 | $7,620,396 | $8,725,020 |
| 1/22 | $8,787,475 | $7,252,149 | $8,080,142 |
| 2/22 | $8,465,589 | $7,123,920 | $7,986,686 |
| 3/22 | $8,185,089 | $7,169,709 | $7,979,615 |
| 4/22 | $7,518,326 | $6,705,866 | $7,424,852 |
| 5/22 | $7,476,941 | $6,756,139 | $7,389,883 |
| 6/22 | $6,667,629 | $6,129,253 | $6,621,296 |
| 7/22 | $7,352,785 | $6,434,673 | $7,028,590 |
| 8/22 | $6,745,801 | $6,129,061 | $6,704,603 |
| 9/22 | $6,097,431 | $5,555,706 | $5,951,049 |
| 10/22 | $6,396,325 | $5,854,462 | $6,230,204 |
| 11/22 | $7,247,023 | $6,513,884 | $6,865,069 |
| 12/22 | $7,104,843 | $6,519,118 | $6,908,555 |
| 1/23 | $7,619,283 | $7,047,018 | $7,467,761 |
| 2/23 | $7,396,822 | $6,899,971 | $7,313,440 |
| 3/23 | $7,457,072 | $7,070,980 | $7,349,751 |
| 4/23 | $7,637,822 | $7,270,614 | $7,513,193 |
| 5/23 | $7,378,284 | $6,962,935 | $7,189,299 |
| 6/23 | $7,582,207 | $7,279,815 | $7,394,045 |
| 7/23 | $7,827,840 | $7,515,365 | $7,748,418 |
| 8/23 | $7,470,976 | $7,227,433 | $7,481,013 |
| 9/23 | $7,021,420 | $6,980,561 | $7,170,822 |
| 10/23 | $6,669,190 | $6,697,556 | $6,763,483 |
| 11/23 | $7,415,361 | $7,319,209 | $7,443,573 |
| 12/23 | $8,033,940 | $7,708,071 | $7,948,364 |
| 1/24 | $7,736,562 | $7,752,430 | $7,860,930 |
| 2/24 | $7,840,408 | $7,894,334 | $7,917,061 |
| 3/24 | $8,000,898 | $8,153,976 | $8,193,357 |
| 4/24 | $7,684,638 | $7,945,162 | $7,945,056 |
| 5/24 | $8,000,898 | $8,252,918 | $8,264,135 |
| 6/24 | $7,807,366 | $8,119,684 | $8,019,324 |
| 7/24 | $8,364,361 | $8,357,888 | $8,408,888 |
| 8/24 | $8,572,054 | $8,629,654 | $8,637,865 |
| 9/24 | $8,718,383 | $8,709,344 | $8,841,402 |
Average Annual Total Returns (%)Footnote Reference1
| Fund | 1 Year | 5 Years | 10 Years |
|---|
| Class R6 | 24.17% | 5.73% | 5.71% |
MSCI EAFE Index (net of foreign withholding taxes)Footnote Reference2 | 24.77% | 8.19% | 5.70% |
| MSCI EAFE SMID Cap Index (net of foreign withholding taxes) | 23.30% | 6.27% | 5.86% |
| Footnote | Description |
Footnote1 | Class R6 performance prior to 2/1/19 is linked to Class I. This linked performance is adjusted for any applicable sales charge, but is not adjusted for class expense differences. If adjusted for such differences, the performance would be different. Performance presented in the Financial Highlights included in the financial statements is not linked. |
Footnote2 | In accordance with regulatory changes requiring the Fund's primary benchmark to represent the overall applicable market, the Fund's primary prospectus benchmark changed to the indicated benchmark effective May 1, 2024. |
Performance does not reflect the deduction of taxes that a shareholder would pay on Fund distributions or redemption of Fund shares. Performance assumes that all dividends and distributions, if any, were reinvested. For more recent performance information, visit www.eatonvance.com/performance.php. Performance prior to December 31, 2016 is that of the Fund's former investment adviser.
THE FUND'S PAST PERFORMANCE IS NO GUARANTEE OF FUTURE RESULTS.
| Total Net Assets | $381,101,260 |
| # of Portfolio Holdings | 98 |
| Portfolio Turnover Rate | 31% |
| Total Advisory Fees Paid | $2,784,424 |
What did the Fund invest in?
The following tables reflect what the Fund invested in as of the report date.
Country Allocation (% of total investments)
| Value | Value |
|---|
| Other | 10.8% |
| Belgium | 2.4% |
| Germany | 2.9% |
| Canada | 3.8% |
| Sweden | 4.2% |
| Netherlands | 4.9% |
| United States | 7.1% |
| Italy | 7.2% |
| Australia | 7.6% |
| United Kingdom | 24.4% |
| Japan | 24.7% |
Top Ten Holdings (% of total investments)Footnote Referencea
| CAR Group Ltd. | 1.9% |
| JTC PLC | 1.8% |
| Diploma PLC | 1.8% |
| Sanwa Holdings Corp. | 1.6% |
| Euronext NV | 1.6% |
| Volution Group PLC | 1.6% |
| IMCD NV | 1.5% |
| BayCurrent, Inc. | 1.5% |
| Games Workshop Group PLC | 1.5% |
| Greggs PLC | 1.5% |
| Total | 16.3% |
| Footnote | Description |
Footnotea | Excluding cash equivalents |
If you wish to view additional information about the Fund, including the prospectus, statement of additional information, financial statements and holdings, please scan the QR code or visit www.eatonvance.com/calvert-fund-documents.php. For proxy information, please visit www.calvert.com/active-engagement.php?DM=how-we-influence.
The Funds may deliver a single copy of certain required shareholder documents (including prospectuses, shareholder reports, and proxy materials) to investors with the same last name and the same address. Your participation will continue indefinitely unless you instruct otherwise by calling 1-800-368-2745 or by contacting your financial intermediary. Your instruction will typically be effective within 30 days of receipt.
Not FDIC Insured | May Lose Value | No Bank Guarantee
Annual Shareholder Report September 30, 2024
Annual Shareholder Report September 30, 2024
This annual shareholder report contains important information about the Calvert Mid-Cap Fund for the period of October 1, 2023 to September 30, 2024. You can find additional information about the Fund at www.eatonvance.com/calvert-fund-documents.php. You can also request this information by contacting us at 1-800-368-2745.
What were the Fund costs for the last year?
(based on a hypothetical $10,000 investment)
| Class Name | Costs of a $10,000 investment | Costs paid as a percentage of a $10,000 investment |
|---|
| Class A | $132 | 1.18% |
How did the Fund perform last year and what affected its performance?
Key contributors to (↑) and detractors from (↓) performance, relative to the Russell Midcap® Index (the Index):
↓ Rentokil Initial Plc., a pest control and hygiene services provider, detracted from relative returns on challenges related to its 2022 acquisition of Terminix
↓ VeriSign, Inc., a provider of domain registration and internet services, hurt returns as Chinese registrations fell and its prospects disappointed investors
↓ Aptiv, a provider of auto industry electronics, detracted from returns on lower new car production volumes. The stock was sold by period-end
↓ Envista Holdings Corp., a provider of dental equipment, detracted from Index-relative returns on lower revenues and demand. The stock was sold by period-end
↑ Core & Main, Inc. ― a wastewater, storm drainage, and fire protection equipment distributor ― contributed to returns on better-than-expected sales and earnings
↑ Motorola Solutions, Inc., an information technology business, contributed to returns on record cash flows, and double-digit revenue and earnings growth
↑ Lamar Advertising Co., an outdoor advertising business, contributed to performance supported by robust demand from local and regional advertisers
↑ Trex Company, Inc., a composite deck maker, helped returns on strong revenue and margins growth during the first half of the period. Trex was sold by period-end
Comparison of the change in value of a $10,000 investment for the period indicated.
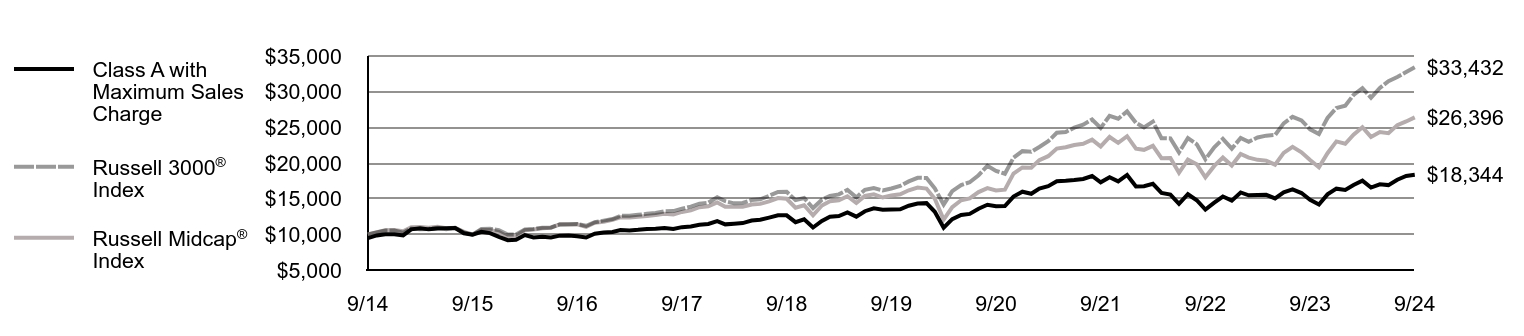
| Class A with Maximum Sales Charge | Russell 3000® Index | Russell Midcap® Index |
|---|
| 9/14 | $9,475 | $10,000 | $10,000 |
| 10/14 | $9,844 | $10,275 | $10,308 |
| 11/14 | $9,995 | $10,524 | $10,572 |
| 12/14 | $10,010 | $10,524 | $10,594 |
| 1/15 | $9,844 | $10,231 | $10,429 |
| 2/15 | $10,700 | $10,824 | $11,006 |
| 3/15 | $10,861 | $10,713 | $11,013 |
| 4/15 | $10,697 | $10,762 | $10,913 |
| 5/15 | $10,811 | $10,911 | $11,073 |
| 6/15 | $10,858 | $10,728 | $10,844 |
| 7/15 | $10,888 | $10,908 | $10,924 |
| 8/15 | $10,153 | $10,249 | $10,348 |
| 9/15 | $9,939 | $9,951 | $9,975 |
| 10/15 | $10,343 | $10,736 | $10,594 |
| 11/15 | $10,171 | $10,796 | $10,621 |
| 12/15 | $9,640 | $10,574 | $10,336 |
| 1/16 | $9,184 | $9,978 | $9,659 |
| 2/16 | $9,224 | $9,975 | $9,768 |
| 3/16 | $9,893 | $10,677 | $10,568 |
| 4/16 | $9,558 | $10,743 | $10,680 |
| 5/16 | $9,660 | $10,935 | $10,855 |
| 6/16 | $9,571 | $10,958 | $10,904 |
| 7/16 | $9,817 | $11,393 | $11,402 |
| 8/16 | $9,847 | $11,422 | $11,374 |
| 9/16 | $9,732 | $11,440 | $11,397 |
| 10/16 | $9,558 | $11,192 | $11,035 |
| 11/16 | $10,083 | $11,693 | $11,630 |
| 12/16 | $10,256 | $11,921 | $11,762 |
| 1/17 | $10,332 | $12,145 | $12,046 |
| 2/17 | $10,596 | $12,597 | $12,387 |
| 3/17 | $10,553 | $12,606 | $12,368 |
| 4/17 | $10,628 | $12,739 | $12,463 |
| 5/17 | $10,760 | $12,870 | $12,577 |
| 6/17 | $10,787 | $12,986 | $12,702 |
| 7/17 | $10,886 | $13,231 | $12,889 |
| 8/17 | $10,737 | $13,256 | $12,789 |
| 9/17 | $11,008 | $13,579 | $13,143 |
| 10/17 | $11,110 | $13,876 | $13,362 |
| 11/17 | $11,351 | $14,297 | $13,812 |
| 12/17 | $11,457 | $14,440 | $13,940 |
| 1/18 | $11,842 | $15,201 | $14,465 |
| 2/18 | $11,399 | $14,641 | $13,868 |
| 3/18 | $11,486 | $14,347 | $13,876 |
| 4/18 | $11,581 | $14,402 | $13,855 |
| 5/18 | $11,926 | $14,808 | $14,170 |
| 6/18 | $12,043 | $14,905 | $14,267 |
| 7/18 | $12,348 | $15,400 | $14,623 |
| 8/18 | $12,679 | $15,940 | $15,077 |
| 9/18 | $12,664 | $15,967 | $14,980 |
| 10/18 | $11,705 | $14,791 | $13,736 |
| 11/18 | $12,108 | $15,087 | $14,073 |
| 12/18 | $10,958 | $13,683 | $12,678 |
| 1/19 | $11,880 | $14,858 | $14,045 |
| 2/19 | $12,464 | $15,380 | $14,648 |
| 3/19 | $12,569 | $15,605 | $14,774 |
| 4/19 | $13,067 | $16,228 | $15,336 |
| 5/19 | $12,479 | $15,178 | $14,395 |
| 6/19 | $13,242 | $16,244 | $15,384 |
| 7/19 | $13,639 | $16,485 | $15,603 |
| 8/19 | $13,456 | $16,149 | $15,159 |
| 9/19 | $13,495 | $16,433 | $15,458 |
| 10/19 | $13,514 | $16,786 | $15,620 |
| 11/19 | $14,016 | $17,424 | $16,178 |
| 12/19 | $14,308 | $17,928 | $16,550 |
| 1/20 | $14,374 | $17,908 | $16,417 |
| 2/20 | $13,156 | $16,442 | $14,991 |
| 3/20 | $10,938 | $14,181 | $12,069 |
| 4/20 | $12,131 | $16,059 | $13,803 |
| 5/20 | $12,705 | $16,918 | $14,773 |
| 6/20 | $12,865 | $17,304 | $15,039 |
| 7/20 | $13,599 | $18,287 | $15,922 |
| 8/20 | $14,145 | $19,612 | $16,482 |
| 9/20 | $13,928 | $18,898 | $16,161 |
| 10/20 | $13,964 | $18,490 | $16,264 |
| 11/20 | $15,289 | $20,739 | $18,512 |
| 12/20 | $15,977 | $21,672 | $19,380 |
| 1/21 | $15,683 | $21,576 | $19,328 |
| 2/21 | $16,423 | $22,250 | $20,405 |
| 3/21 | $16,754 | $23,048 | $20,957 |
| 4/21 | $17,437 | $24,236 | $22,025 |
| 5/21 | $17,499 | $24,346 | $22,202 |
| 6/21 | $17,607 | $24,947 | $22,529 |
| 7/21 | $17,760 | $25,369 | $22,702 |
| 8/21 | $18,177 | $26,092 | $23,279 |
| 9/21 | $17,288 | $24,921 | $22,320 |
| 10/21 | $17,995 | $26,607 | $23,648 |
| 11/21 | $17,425 | $26,202 | $22,824 |
| 12/21 | $18,322 | $27,234 | $23,756 |
| 1/22 | $16,702 | $25,631 | $22,006 |
| 2/22 | $16,740 | $24,986 | $21,848 |
| 3/22 | $17,078 | $25,796 | $22,407 |
| 4/22 | $15,797 | $23,481 | $20,681 |
| 5/22 | $15,571 | $23,450 | $20,698 |
| 6/22 | $14,286 | $21,488 | $18,632 |
| 7/22 | $15,623 | $23,504 | $20,471 |
| 8/22 | $14,778 | $22,627 | $19,829 |
| 9/22 | $13,474 | $20,528 | $17,991 |
| 10/22 | $14,445 | $22,212 | $19,588 |
| 11/22 | $15,304 | $23,371 | $20,765 |
| 12/22 | $14,722 | $22,003 | $19,643 |
| 1/23 | $15,868 | $23,518 | $21,274 |
| 2/23 | $15,469 | $22,968 | $20,758 |
| 3/23 | $15,506 | $23,583 | $20,440 |
| 4/23 | $15,534 | $23,834 | $20,332 |
| 5/23 | $15,032 | $23,927 | $19,764 |
| 6/23 | $15,886 | $25,560 | $21,413 |
| 7/23 | $16,290 | $26,477 | $22,262 |
| 8/23 | $15,788 | $25,966 | $21,490 |
| 9/23 | $14,830 | $24,729 | $20,410 |
| 10/23 | $14,178 | $24,073 | $19,391 |
| 11/23 | $15,600 | $26,318 | $21,375 |
| 12/23 | $16,403 | $27,714 | $23,027 |
| 1/24 | $16,215 | $28,021 | $22,699 |
| 2/24 | $16,924 | $29,538 | $23,967 |
| 3/24 | $17,530 | $30,491 | $25,007 |
| 4/24 | $16,563 | $29,149 | $23,656 |
| 5/24 | $17,013 | $30,526 | $24,331 |
| 6/24 | $16,901 | $31,471 | $24,170 |
| 7/24 | $17,647 | $32,056 | $25,309 |
| 8/24 | $18,182 | $32,754 | $25,822 |
| 9/24 | $18,344 | $33,432 | $26,396 |
Average Annual Total Returns (%)
| Fund | 1 Year | 5 Years | 10 Years |
|---|
| Class A | 23.71% | 6.33% | 6.82% |
| Class A with 5.25% Maximum Sales Charge | 17.22% | 5.19% | 6.25% |
Russell 3000®IndexFootnote Reference1 | 35.19% | 15.25% | 12.82% |
Russell Midcap® Index | 29.33% | 11.28% | 10.18% |
| Footnote | Description |
Footnote1 | In accordance with regulatory changes requiring the Fund’s primary benchmark to represent the overall applicable market, the Fund’s primary prospectus benchmark changed to the indicated benchmark effective May 1, 2024. |
Performance does not reflect the deduction of taxes that a shareholder would pay on Fund distributions or redemption of Fund shares. Performance assumes that all dividends and distributions, if any, were reinvested. For more recent performance information, visit www.eatonvance.com/performance.php. Performance prior to December 31, 2016 is that of the Fund's former investment adviser.
THE FUND'S PAST PERFORMANCE IS NO GUARANTEE OF FUTURE RESULTS.
| Total Net Assets | $235,021,560 |
| # of Portfolio Holdings | 60 |
| Portfolio Turnover Rate | 26% |
| Total Advisory Fees Paid | $1,345,606 |
What did the Fund invest in?
The following tables reflect what the Fund invested in as of the report date.
Sector Allocation (% of total investments)
| Value | Value |
|---|
| Short-Term Investments | 3.7% |
| Consumer Staples | 4.6% |
| Utilities | 4.9% |
| Materials | 5.8% |
| Real Estate | 8.7% |
| Health Care | 10.8% |
| Information Technology | 12.1% |
| Financials | 15.0% |
| Consumer Discretionary | 15.0% |
| Industrials | 19.4% |
Top Ten Holdings (% of total investments)Footnote Referencea
| AptarGroup, Inc. | 3.5% |
| Motorola Solutions, Inc. | 3.4% |
| Tradeweb Markets, Inc., Class A | 3.0% |
| Dorman Products, Inc. | 2.8% |
| Lamar Advertising Co., Class A | 2.7% |
| Cooper Cos., Inc. | 2.7% |
| Equity LifeStyle Properties, Inc. | 2.6% |
| Copart, Inc. | 2.6% |
| AMETEK, Inc. | 2.5% |
| CMS Energy Corp. | 2.5% |
| Total | 28.3% |
| Footnote | Description |
Footnotea | Excluding cash equivalents |
If you wish to view additional information about the Fund, including the prospectus, statement of additional information, financial statements and holdings, please scan the QR code or visit www.eatonvance.com/calvert-fund-documents.php. For proxy information, please visit www.calvert.com/active-engagement.php?DM=how-we-influence.
The Funds may deliver a single copy of certain required shareholder documents (including prospectuses, shareholder reports, and proxy materials) to investors with the same last name and the same address. Your participation will continue indefinitely unless you instruct otherwise by calling 1-800-368-2745 or by contacting your financial intermediary. Your instruction will typically be effective within 30 days of receipt.
Not FDIC Insured | May Lose Value | No Bank Guarantee
Annual Shareholder Report September 30, 2024
Annual Shareholder Report September 30, 2024
This annual shareholder report contains important information about the Calvert Mid-Cap Fund for the period of October 1, 2023 to September 30, 2024. You can find additional information about the Fund at www.eatonvance.com/calvert-fund-documents.php. You can also request this information by contacting us at 1-800-368-2745.
What were the Fund costs for the last year?
(based on a hypothetical $10,000 investment)
| Class Name | Costs of a $10,000 investment | Costs paid as a percentage of a $10,000 investment |
|---|
| Class C | $215 | 1.93% |
How did the Fund perform last year and what affected its performance?
Key contributors to (↑) and detractors from (↓) performance, relative to the Russell Midcap® Index (the Index):
↓ Rentokil Initial Plc., a pest control and hygiene services provider, detracted from relative returns on challenges related to its 2022 acquisition of Terminix
↓ VeriSign, Inc., a provider of domain registration and internet services, hurt returns as Chinese registrations fell and its prospects disappointed investors
↓ Aptiv, a provider of auto industry electronics, detracted from returns on lower new car production volumes. The stock was sold by period-end
↓ Envista Holdings Corp., a provider of dental equipment, detracted from Index-relative returns on lower revenues and demand. The stock was sold by period-end
↑ Core & Main, Inc. ― a wastewater, storm drainage, and fire protection equipment distributor ― contributed to returns on better-than-expected sales and earnings
↑ Motorola Solutions, Inc., an information technology business, contributed to returns on record cash flows, and double-digit revenue and earnings growth
↑ Lamar Advertising Co., an outdoor advertising business, contributed to performance supported by robust demand from local and regional advertisers
↑ Trex Company, Inc., a composite deck maker, helped returns on strong revenue and margins growth during the first half of the period. Trex was sold by period-end
Comparison of the change in value of a $10,000 investment for the period indicated.
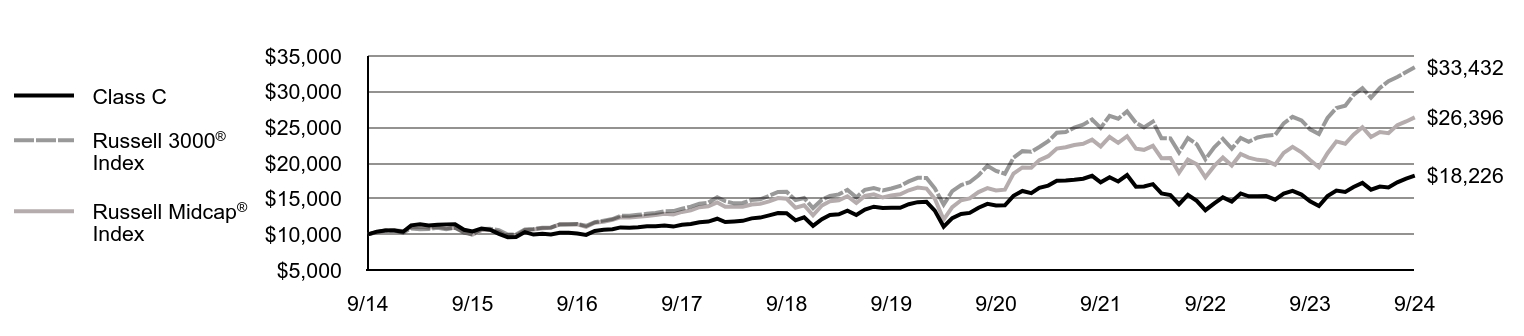
| Class C | Russell 3000® Index | Russell Midcap® Index |
|---|
| 9/14 | $10,000 | $10,000 | $10,000 |
| 10/14 | $10,383 | $10,275 | $10,308 |
| 11/14 | $10,538 | $10,524 | $10,572 |
| 12/14 | $10,547 | $10,524 | $10,594 |
| 1/15 | $10,364 | $10,231 | $10,429 |
| 2/15 | $11,262 | $10,824 | $11,006 |
| 3/15 | $11,420 | $10,713 | $11,013 |
| 4/15 | $11,242 | $10,762 | $10,913 |
| 5/15 | $11,355 | $10,911 | $11,073 |
| 6/15 | $11,396 | $10,728 | $10,844 |
| 7/15 | $11,416 | $10,908 | $10,924 |
| 8/15 | $10,640 | $10,249 | $10,348 |
| 9/15 | $10,409 | $9,951 | $9,975 |
| 10/15 | $10,823 | $10,736 | $10,594 |
| 11/15 | $10,636 | $10,796 | $10,621 |
| 12/15 | $10,073 | $10,574 | $10,336 |
| 1/16 | $9,593 | $9,978 | $9,659 |
| 2/16 | $9,630 | $9,975 | $9,768 |
| 3/16 | $10,319 | $10,677 | $10,568 |
| 4/16 | $9,963 | $10,743 | $10,680 |
| 5/16 | $10,064 | $10,935 | $10,855 |
| 6/16 | $9,967 | $10,958 | $10,904 |
| 7/16 | $10,212 | $11,393 | $11,402 |
| 8/16 | $10,235 | $11,422 | $11,374 |
| 9/16 | $10,111 | $11,440 | $11,397 |
| 10/16 | $9,926 | $11,192 | $11,035 |
| 11/16 | $10,462 | $11,693 | $11,630 |
| 12/16 | $10,636 | $11,921 | $11,762 |
| 1/17 | $10,710 | $12,145 | $12,046 |
| 2/17 | $10,974 | $12,597 | $12,387 |
| 3/17 | $10,928 | $12,606 | $12,368 |
| 4/17 | $10,997 | $12,739 | $12,463 |
| 5/17 | $11,127 | $12,870 | $12,577 |
| 6/17 | $11,150 | $12,986 | $12,702 |
| 7/17 | $11,242 | $13,231 | $12,889 |
| 8/17 | $11,085 | $13,256 | $12,789 |
| 9/17 | $11,353 | $13,579 | $13,143 |
| 10/17 | $11,450 | $13,876 | $13,362 |
| 11/17 | $11,691 | $14,297 | $13,812 |
| 12/17 | $11,793 | $14,440 | $13,940 |
| 1/18 | $12,187 | $15,201 | $14,465 |
| 2/18 | $11,724 | $14,641 | $13,868 |
| 3/18 | $11,803 | $14,347 | $13,876 |
| 4/18 | $11,893 | $14,402 | $13,855 |
| 5/18 | $12,240 | $14,808 | $14,170 |
| 6/18 | $12,350 | $14,905 | $14,267 |
| 7/18 | $12,655 | $15,400 | $14,623 |
| 8/18 | $12,987 | $15,940 | $15,077 |
| 9/18 | $12,966 | $15,967 | $14,980 |
| 10/18 | $11,971 | $14,791 | $13,736 |
| 11/18 | $12,377 | $15,087 | $14,073 |
| 12/18 | $11,193 | $13,683 | $12,678 |
| 1/19 | $12,132 | $14,858 | $14,045 |
| 2/19 | $12,718 | $15,380 | $14,648 |
| 3/19 | $12,816 | $15,605 | $14,774 |
| 4/19 | $13,317 | $16,228 | $15,336 |
| 5/19 | $12,707 | $15,178 | $14,395 |
| 6/19 | $13,478 | $16,244 | $15,384 |
| 7/19 | $13,875 | $16,485 | $15,603 |
| 8/19 | $13,680 | $16,149 | $15,159 |
| 9/19 | $13,714 | $16,433 | $15,458 |
| 10/19 | $13,720 | $16,786 | $15,620 |
| 11/19 | $14,221 | $17,424 | $16,178 |
| 12/19 | $14,509 | $17,928 | $16,550 |
| 1/20 | $14,564 | $17,908 | $16,417 |
| 2/20 | $13,324 | $16,442 | $14,991 |
| 3/20 | $11,066 | $14,181 | $12,069 |
| 4/20 | $12,269 | $16,059 | $13,803 |
| 5/20 | $12,846 | $16,918 | $14,773 |
| 6/20 | $13,001 | $17,304 | $15,039 |
| 7/20 | $13,733 | $18,287 | $15,922 |
| 8/20 | $14,273 | $19,612 | $16,482 |
| 9/20 | $14,043 | $18,898 | $16,161 |
| 10/20 | $14,068 | $18,490 | $16,264 |
| 11/20 | $15,395 | $20,739 | $18,512 |
| 12/20 | $16,082 | $21,672 | $19,380 |
| 1/21 | $15,774 | $21,576 | $19,328 |
| 2/21 | $16,510 | $22,250 | $20,405 |
| 3/21 | $16,830 | $23,048 | $20,957 |
| 4/21 | $17,509 | $24,236 | $22,025 |
| 5/21 | $17,559 | $24,346 | $22,202 |
| 6/21 | $17,654 | $24,947 | $22,529 |
| 7/21 | $17,798 | $25,369 | $22,702 |
| 8/21 | $18,207 | $26,092 | $23,279 |
| 9/21 | $17,302 | $24,921 | $22,320 |
| 10/21 | $17,999 | $26,607 | $23,648 |
| 11/21 | $17,415 | $26,202 | $22,824 |
| 12/21 | $18,306 | $27,234 | $23,756 |
| 1/22 | $16,679 | $25,631 | $22,006 |
| 2/22 | $16,702 | $24,986 | $21,848 |
| 3/22 | $17,036 | $25,796 | $22,407 |
| 4/22 | $15,743 | $23,481 | $20,681 |
| 5/22 | $15,508 | $23,450 | $20,698 |
| 6/22 | $14,222 | $21,488 | $18,632 |
| 7/22 | $15,538 | $23,504 | $20,471 |
| 8/22 | $14,694 | $22,627 | $19,829 |
| 9/22 | $13,386 | $20,528 | $17,991 |
| 10/22 | $14,344 | $22,212 | $19,588 |
| 11/22 | $15,188 | $23,371 | $20,765 |
| 12/22 | $14,595 | $22,003 | $19,643 |
| 1/23 | $15,728 | $23,518 | $21,274 |
| 2/23 | $15,325 | $22,968 | $20,758 |
| 3/23 | $15,348 | $23,583 | $20,440 |
| 4/23 | $15,363 | $23,834 | $20,332 |
| 5/23 | $14,861 | $23,927 | $19,764 |
| 6/23 | $15,698 | $25,560 | $21,413 |
| 7/23 | $16,086 | $26,477 | $22,262 |
| 8/23 | $15,576 | $25,966 | $21,490 |
| 9/23 | $14,625 | $24,729 | $20,410 |
| 10/23 | $13,971 | $24,073 | $19,391 |
| 11/23 | $15,363 | $26,318 | $21,375 |
| 12/23 | $16,146 | $27,714 | $23,027 |
| 1/24 | $15,949 | $28,021 | $22,699 |
| 2/24 | $16,641 | $29,538 | $23,967 |
| 3/24 | $17,219 | $30,491 | $25,007 |
| 4/24 | $16,260 | $29,149 | $23,656 |
| 5/24 | $16,694 | $30,526 | $24,331 |
| 6/24 | $16,572 | $31,471 | $24,170 |
| 7/24 | $17,295 | $32,056 | $25,309 |
| 8/24 | $17,804 | $32,754 | $25,822 |
| 9/24 | $18,226 | $33,432 | $26,396 |
Average Annual Total Returns (%)
| Fund | 1 Year | 5 Years | 10 Years |
|---|
| Class C | 22.78% | 5.53% | 6.18% |
| Class C with 1% Maximum Deferred Sales Charge | 21.78% | 5.53% | 6.18% |
Russell 3000®IndexFootnote Reference1 | 35.19% | 15.25% | 12.82% |
Russell Midcap® Index | 29.33% | 11.28% | 10.18% |
| Footnote | Description |
Footnote1 | In accordance with regulatory changes requiring the Fund’s primary benchmark to represent the overall applicable market, the Fund’s primary prospectus benchmark changed to the indicated benchmark effective May 1, 2024. |
Performance does not reflect the deduction of taxes that a shareholder would pay on Fund distributions or redemption of Fund shares. Performance assumes that all dividends and distributions, if any, were reinvested. For more recent performance information, visit www.eatonvance.com/performance.php. Performance prior to December 31, 2016 is that of the Fund's former investment adviser.
THE FUND'S PAST PERFORMANCE IS NO GUARANTEE OF FUTURE RESULTS.
| Total Net Assets | $235,021,560 |
| # of Portfolio Holdings | 60 |
| Portfolio Turnover Rate | 26% |
| Total Advisory Fees Paid | $1,345,606 |
What did the Fund invest in?
The following tables reflect what the Fund invested in as of the report date.
Sector Allocation (% of total investments)
| Value | Value |
|---|
| Short-Term Investments | 3.7% |
| Consumer Staples | 4.6% |
| Utilities | 4.9% |
| Materials | 5.8% |
| Real Estate | 8.7% |
| Health Care | 10.8% |
| Information Technology | 12.1% |
| Financials | 15.0% |
| Consumer Discretionary | 15.0% |
| Industrials | 19.4% |
Top Ten Holdings (% of total investments)Footnote Referencea
| AptarGroup, Inc. | 3.5% |
| Motorola Solutions, Inc. | 3.4% |
| Tradeweb Markets, Inc., Class A | 3.0% |
| Dorman Products, Inc. | 2.8% |
| Lamar Advertising Co., Class A | 2.7% |
| Cooper Cos., Inc. | 2.7% |
| Equity LifeStyle Properties, Inc. | 2.6% |
| Copart, Inc. | 2.6% |
| AMETEK, Inc. | 2.5% |
| CMS Energy Corp. | 2.5% |
| Total | 28.3% |
| Footnote | Description |
Footnotea | Excluding cash equivalents |
If you wish to view additional information about the Fund, including the prospectus, statement of additional information, financial statements and holdings, please scan the QR code or visit www.eatonvance.com/calvert-fund-documents.php. For proxy information, please visit www.calvert.com/active-engagement.php?DM=how-we-influence.
The Funds may deliver a single copy of certain required shareholder documents (including prospectuses, shareholder reports, and proxy materials) to investors with the same last name and the same address. Your participation will continue indefinitely unless you instruct otherwise by calling 1-800-368-2745 or by contacting your financial intermediary. Your instruction will typically be effective within 30 days of receipt.
Not FDIC Insured | May Lose Value | No Bank Guarantee
Annual Shareholder Report September 30, 2024
Annual Shareholder Report September 30, 2024
This annual shareholder report contains important information about the Calvert Mid-Cap Fund for the period of October 1, 2023 to September 30, 2024. You can find additional information about the Fund at www.eatonvance.com/calvert-fund-documents.php. You can also request this information by contacting us at 1-800-368-2745.
What were the Fund costs for the last year?
(based on a hypothetical $10,000 investment)
| Class Name | Costs of a $10,000 investment | Costs paid as a percentage of a $10,000 investment |
|---|
| Class I | $104 | 0.93% |
How did the Fund perform last year and what affected its performance?
Key contributors to (↑) and detractors from (↓) performance, relative to the Russell Midcap® Index (the Index):
↓ Rentokil Initial Plc., a pest control and hygiene services provider, detracted from relative returns on challenges related to its 2022 acquisition of Terminix
↓ VeriSign, Inc., a provider of domain registration and internet services, hurt returns as Chinese registrations fell and its prospects disappointed investors
↓ Aptiv, a provider of auto industry electronics, detracted from returns on lower new car production volumes. The stock was sold by period-end
↓ Envista Holdings Corp., a provider of dental equipment, detracted from Index-relative returns on lower revenues and demand. The stock was sold by period-end
↑ Core & Main, Inc. ― a wastewater, storm drainage, and fire protection equipment distributor ― contributed to returns on better-than-expected sales and earnings
↑ Motorola Solutions, Inc., an information technology business, contributed to returns on record cash flows, and double-digit revenue and earnings growth
↑ Lamar Advertising Co., an outdoor advertising business, contributed to performance supported by robust demand from local and regional advertisers
↑ Trex Company, Inc., a composite deck maker, helped returns on strong revenue and margins growth during the first half of the period. Trex was sold by period-end
Comparison of the change in value of a $1,000,000 investment for the period indicated.
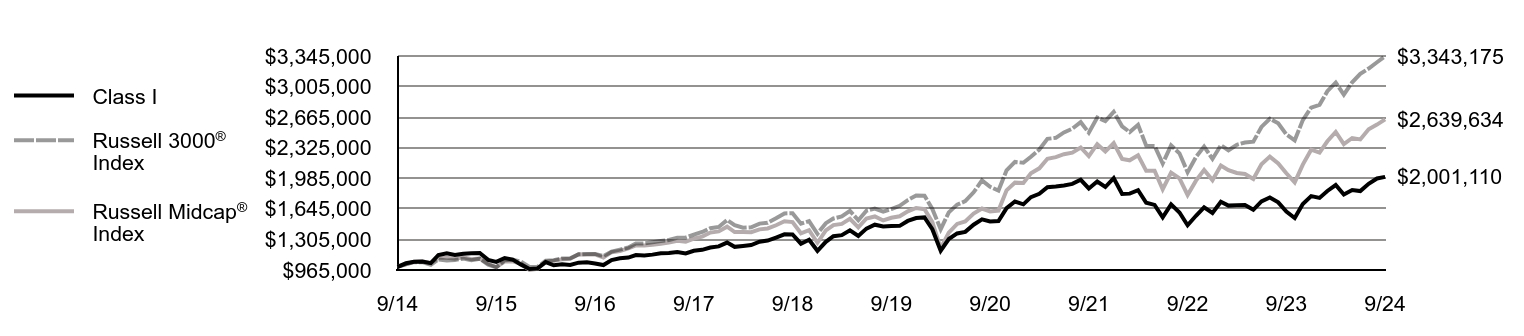
| Class I | Russell 3000® Index | Russell Midcap® Index |
|---|
| 9/14 | $1,000,000 | $1,000,000 | $1,000,000 |
| 10/14 | $1,039,573 | $1,027,513 | $1,030,820 |
| 11/14 | $1,056,324 | $1,052,414 | $1,057,197 |
| 12/14 | $1,058,317 | $1,052,402 | $1,059,436 |
| 1/15 | $1,041,122 | $1,023,112 | $1,042,905 |
| 2/15 | $1,132,088 | $1,082,351 | $1,100,647 |
| 3/15 | $1,149,838 | $1,071,348 | $1,101,305 |
| 4/15 | $1,132,938 | $1,076,194 | $1,091,296 |
| 5/15 | $1,145,704 | $1,091,079 | $1,107,282 |
| 6/15 | $1,151,241 | $1,072,825 | $1,084,382 |
| 7/15 | $1,154,867 | $1,090,768 | $1,092,425 |
| 8/15 | $1,077,471 | $1,024,919 | $1,034,778 |
| 9/15 | $1,055,282 | $995,053 | $997,523 |
| 10/15 | $1,098,816 | $1,073,648 | $1,059,366 |
| 11/15 | $1,081,076 | $1,079,600 | $1,062,065 |
| 12/15 | $1,024,616 | $1,057,440 | $1,033,601 |
| 1/16 | $976,925 | $997,774 | $965,878 |
| 2/16 | $981,443 | $997,453 | $976,795 |
| 3/16 | $1,052,999 | $1,067,679 | $1,056,801 |
| 4/16 | $1,017,687 | $1,074,296 | $1,067,973 |
| 5/16 | $1,029,166 | $1,093,516 | $1,085,487 |
| 6/16 | $1,020,105 | $1,095,764 | $1,090,431 |
| 7/16 | $1,046,386 | $1,139,252 | $1,140,215 |
| 8/16 | $1,050,020 | $1,142,158 | $1,137,367 |
| 9/16 | $1,037,938 | $1,143,953 | $1,139,665 |
| 10/16 | $1,019,835 | $1,119,203 | $1,103,500 |
| 11/16 | $1,075,978 | $1,169,290 | $1,163,010 |
| 12/16 | $1,094,645 | $1,192,107 | $1,176,220 |
| 1/17 | $1,103,459 | $1,214,544 | $1,204,605 |
| 2/17 | $1,131,784 | $1,259,715 | $1,238,692 |
| 3/17 | $1,127,504 | $1,260,572 | $1,236,756 |
| 4/17 | $1,136,024 | $1,273,934 | $1,246,282 |
| 5/17 | $1,150,314 | $1,286,971 | $1,257,666 |
| 6/17 | $1,153,662 | $1,298,586 | $1,270,176 |
| 7/17 | $1,164,615 | $1,323,070 | $1,288,878 |
| 8/17 | $1,149,096 | $1,325,620 | $1,278,861 |
| 9/17 | $1,178,322 | $1,357,949 | $1,314,297 |
| 10/17 | $1,189,293 | $1,387,582 | $1,336,228 |
| 11/17 | $1,215,495 | $1,429,716 | $1,381,189 |
| 12/17 | $1,227,567 | $1,444,006 | $1,394,030 |
| 1/18 | $1,269,735 | $1,520,120 | $1,446,509 |
| 2/18 | $1,222,551 | $1,464,089 | $1,386,759 |
| 3/18 | $1,231,872 | $1,434,699 | $1,387,619 |
| 4/18 | $1,242,479 | $1,440,152 | $1,385,506 |
| 5/18 | $1,279,686 | $1,480,808 | $1,416,954 |
| 6/18 | $1,292,981 | $1,490,492 | $1,426,736 |
| 7/18 | $1,326,187 | $1,539,955 | $1,462,281 |
| 8/18 | $1,361,734 | $1,594,035 | $1,507,701 |
| 9/18 | $1,360,724 | $1,596,674 | $1,498,039 |
| 10/18 | $1,257,759 | $1,479,106 | $1,373,576 |
| 11/18 | $1,301,594 | $1,508,731 | $1,407,337 |
| 12/18 | $1,178,356 | $1,368,314 | $1,267,757 |
| 1/19 | $1,278,098 | $1,485,762 | $1,404,513 |
| 2/19 | $1,340,860 | $1,538,015 | $1,464,842 |
| 3/19 | $1,352,486 | $1,560,473 | $1,477,398 |
| 4/19 | $1,406,414 | $1,622,785 | $1,533,615 |
| 5/19 | $1,343,338 | $1,517,772 | $1,439,505 |
| 6/19 | $1,425,477 | $1,624,375 | $1,538,381 |
| 7/19 | $1,468,834 | $1,648,522 | $1,560,347 |
| 8/19 | $1,449,442 | $1,614,916 | $1,515,904 |
| 9/19 | $1,454,021 | $1,643,259 | $1,545,758 |
| 10/19 | $1,456,110 | $1,678,633 | $1,562,012 |
| 11/19 | $1,510,732 | $1,742,441 | $1,617,836 |
| 12/19 | $1,542,647 | $1,792,752 | $1,654,954 |
| 1/20 | $1,550,044 | $1,790,794 | $1,641,688 |
| 2/20 | $1,419,068 | $1,644,176 | $1,499,089 |
| 3/20 | $1,179,972 | $1,418,072 | $1,206,937 |
| 4/20 | $1,309,132 | $1,605,882 | $1,380,275 |
| 5/20 | $1,371,494 | $1,691,762 | $1,477,308 |
| 6/20 | $1,389,184 | $1,730,439 | $1,503,923 |
| 7/20 | $1,468,489 | $1,828,699 | $1,592,234 |
| 8/20 | $1,527,916 | $1,961,178 | $1,648,216 |
| 9/20 | $1,504,316 | $1,889,770 | $1,616,127 |
| 10/20 | $1,508,754 | $1,848,982 | $1,626,430 |
| 11/20 | $1,652,296 | $2,073,917 | $1,851,236 |
| 12/20 | $1,726,936 | $2,167,218 | $1,937,966 |
| 1/21 | $1,695,285 | $2,157,579 | $1,932,840 |
| 2/21 | $1,775,749 | $2,225,019 | $2,040,483 |
| 3/21 | $1,811,888 | $2,304,770 | $2,095,697 |
| 4/21 | $1,886,382 | $2,423,579 | $2,202,504 |
| 5/21 | $1,893,414 | $2,434,642 | $2,220,180 |
| 6/21 | $1,905,360 | $2,494,678 | $2,252,858 |
| 7/21 | $1,922,518 | $2,536,865 | $2,270,190 |
| 8/21 | $1,968,319 | $2,609,210 | $2,327,904 |
| 9/21 | $1,872,249 | $2,492,141 | $2,231,997 |
| 10/21 | $1,948,956 | $2,660,670 | $2,364,755 |
| 11/21 | $1,887,888 | $2,620,172 | $2,282,414 |
| 12/21 | $1,985,655 | $2,723,350 | $2,375,637 |
| 1/22 | $1,810,146 | $2,563,119 | $2,200,622 |
| 2/22 | $1,814,285 | $2,498,556 | $2,184,795 |
| 3/22 | $1,851,953 | $2,579,600 | $2,240,744 |
| 4/22 | $1,712,871 | $2,348,100 | $2,068,131 |
| 5/22 | $1,688,862 | $2,344,952 | $2,069,779 |
| 6/22 | $1,549,780 | $2,148,777 | $1,863,199 |
| 7/22 | $1,695,071 | $2,350,370 | $2,047,122 |
| 8/22 | $1,604,005 | $2,262,656 | $1,982,899 |
| 9/22 | $1,462,853 | $2,052,842 | $1,799,123 |
| 10/22 | $1,568,407 | $2,221,188 | $1,958,801 |
| 11/22 | $1,662,370 | $2,337,125 | $2,076,519 |
| 12/22 | $1,598,904 | $2,200,278 | $1,964,293 |
| 1/23 | $1,724,195 | $2,351,818 | $2,127,413 |
| 2/23 | $1,681,048 | $2,296,849 | $2,075,814 |
| 3/23 | $1,685,197 | $2,358,265 | $2,043,959 |
| 4/23 | $1,688,931 | $2,383,391 | $2,033,164 |
| 5/23 | $1,634,583 | $2,392,664 | $1,976,356 |
| 6/23 | $1,727,929 | $2,556,048 | $2,141,271 |
| 7/23 | $1,771,905 | $2,647,674 | $2,226,212 |
| 8/23 | $1,717,557 | $2,596,564 | $2,148,998 |
| 9/23 | $1,614,255 | $2,472,879 | $2,041,033 |
| 10/23 | $1,543,312 | $2,407,326 | $1,939,085 |
| 11/23 | $1,698,473 | $2,631,805 | $2,137,469 |
| 12/23 | $1,786,351 | $2,771,401 | $2,302,685 |
| 1/24 | $1,766,406 | $2,802,116 | $2,269,896 |
| 2/24 | $1,843,694 | $2,953,796 | $2,396,713 |
| 3/24 | $1,910,178 | $3,049,077 | $2,500,700 |
| 4/24 | $1,805,050 | $2,914,913 | $2,365,617 |
| 5/24 | $1,854,498 | $3,052,634 | $2,433,087 |
| 6/24 | $1,842,863 | $3,147,135 | $2,416,970 |
| 7/24 | $1,924,306 | $3,205,637 | $2,530,881 |
| 8/24 | $1,982,896 | $3,275,420 | $2,582,162 |
| 9/24 | $2,001,110 | $3,343,175 | $2,639,634 |
Average Annual Total Returns (%)
| Fund | 1 Year | 5 Years | 10 Years |
|---|
| Class I | 23.97% | 6.59% | 7.18% |
Russell 3000®IndexFootnote Reference1 | 35.19% | 15.25% | 12.82% |
Russell Midcap® Index | 29.33% | 11.28% | 10.18% |
| Footnote | Description |
Footnote1 | In accordance with regulatory changes requiring the Fund’s primary benchmark to represent the overall applicable market, the Fund’s primary prospectus benchmark changed to the indicated benchmark effective May 1, 2024. |
Performance does not reflect the deduction of taxes that a shareholder would pay on Fund distributions or redemption of Fund shares. Performance assumes that all dividends and distributions, if any, were reinvested. For more recent performance information, visit www.eatonvance.com/performance.php. Performance prior to December 31, 2016 is that of the Fund's former investment adviser.
THE FUND'S PAST PERFORMANCE IS NO GUARANTEE OF FUTURE RESULTS.
| Total Net Assets | $235,021,560 |
| # of Portfolio Holdings | 60 |
| Portfolio Turnover Rate | 26% |
| Total Advisory Fees Paid | $1,345,606 |
What did the Fund invest in?
The following tables reflect what the Fund invested in as of the report date.
Sector Allocation (% of total investments)
| Value | Value |
|---|
| Short-Term Investments | 3.7% |
| Consumer Staples | 4.6% |
| Utilities | 4.9% |
| Materials | 5.8% |
| Real Estate | 8.7% |
| Health Care | 10.8% |
| Information Technology | 12.1% |
| Financials | 15.0% |
| Consumer Discretionary | 15.0% |
| Industrials | 19.4% |
Top Ten Holdings (% of total investments)Footnote Referencea
| AptarGroup, Inc. | 3.5% |
| Motorola Solutions, Inc. | 3.4% |
| Tradeweb Markets, Inc., Class A | 3.0% |
| Dorman Products, Inc. | 2.8% |
| Lamar Advertising Co., Class A | 2.7% |
| Cooper Cos., Inc. | 2.7% |
| Equity LifeStyle Properties, Inc. | 2.6% |
| Copart, Inc. | 2.6% |
| AMETEK, Inc. | 2.5% |
| CMS Energy Corp. | 2.5% |
| Total | 28.3% |
| Footnote | Description |
Footnotea | Excluding cash equivalents |
If you wish to view additional information about the Fund, including the prospectus, statement of additional information, financial statements and holdings, please scan the QR code or visit www.eatonvance.com/calvert-fund-documents.php. For proxy information, please visit www.calvert.com/active-engagement.php?DM=how-we-influence.
The Funds may deliver a single copy of certain required shareholder documents (including prospectuses, shareholder reports, and proxy materials) to investors with the same last name and the same address. Your participation will continue indefinitely unless you instruct otherwise by calling 1-800-368-2745 or by contacting your financial intermediary. Your instruction will typically be effective within 30 days of receipt.
Not FDIC Insured | May Lose Value | No Bank Guarantee
Annual Shareholder Report September 30, 2024
(b) Not applicable.
Item 2. Code of Ethics
The registrant (sometimes referred to as the “Fund”) has adopted a code of ethics applicable to its Principal Executive Officer, Principal Financial Officer and Principal Accounting Officer. The registrant undertakes to provide a copy of such code of ethics to any person upon request, without charge, by calling 1-800-368-2745. The registrant has not amended the code of ethics as described in Form N-CSR during the period covered by this report. The registrant has not granted any waiver, including an implicit waiver, from a provision of the code of ethics as described in Form N-CSR during the period covered by this report.
Item 3. Audit Committee Financial Expert
The registrant’s Board of Directors has determined that Miles D. Harper III, an “independent” Director serving on the registrant’s audit committee, is an “audit committee financial expert,” as defined in Item 3 of Form N-CSR. Under applicable securities laws, a person who is determined to be an audit committee financial expert will not be deemed an “expert” for any purpose, including without limitation for the purposes of Section 11 of the Securities Act of 1933, as a result of being designated or identified as an audit committee financial expert. The designation or identification of a person as an audit committee financial expert does not impose on such person any duties, obligations, or liabilities that are greater than the duties, obligations, and liabilities imposed on such person as a member of the audit committee and Board of Directors in the absence of such designation or identification.
Item 4. Principal Accountant Fees and Services
(a)-(d)
The following table presents the aggregate fees billed to the registrant for the registrant’s fiscal years ended September 30, 2023 and September 30, 2024 by its principal accountant for professional services rendered for the audit of the registrant’s annual financial statements and fees billed for other services rendered by its principal accountant during such periods.
| | | | | | | | | | | | | | | | |
Fiscal Years Ended | | 9/30/23 | | | %* | | | 9/30/24 | | | %* | |
Audit Fees | | $ | 149,600 | | | | 0 | % | | $ | 157,400 | | | | 0 | % |
Audit-Related Fees(1) | | $ | 0 | | | | 0 | % | | $ | 0 | | | | 0 | % |
Tax Fees(2) | | $ | 0 | | | | 0 | % | | $ | 0 | | | | 0 | % |
All Other Fees(3) | | $ | 0 | | | | 0 | % | | $ | 0 | | | | 0 | % |
| | | | | | | | | | | | | | | | |
Total | | $ | 149,600 | | | | 0 | % | | $ | 157,400 | | | | 0 | % |
| | | | | | | | | | | | | | | | |
| * | Percentage of fees approved by the Audit Committee pursuant to (c)(7)(i)(C) of Rule 2-01 of Reg. S-X (statutory de minimis waiver of Committee’s requirement to pre-approve). |
| (1) | Audit-related fees consist of the aggregate fees billed for assurance and related services that are reasonably related to the performance of the audit of the registrant’s financial statements and are not reported under the category of audit fees. |
| (2) | Tax fees consist of the aggregate fees billed for professional services rendered by the principal accountant relating to tax compliance, tax advice, and tax planning and specifically include fees for tax return preparation and other related tax compliance/planning matters. |
| (3) | All other fees consist of the aggregate fees billed for products and services provided by the principal accountant other than audit, audit-related, and tax services. |
(e) The Audit Committee is required to pre-approve all audit and non-audit services provided to the registrant by the auditors, and to the registrant’s investment adviser, and any entity controlling, controlled by, or under common control with the adviser that provides ongoing services to the registrant. In determining whether to pre-approve non-audit services, the Audit Committee considers whether the services are consistent with maintaining the independence of the auditors. The Committee may delegate its authority to pre-approve certain matters to one or more of its members. In this regard, the Committee has delegated authority jointly to the Audit Committee Chair together with another Committee member with respect to non-audit services not exceeding $25,000 in each instance. In addition, the Committee has pre-approved the retention of the auditors to provide tax-related services related to the tax treatment and tax accounting of newly acquired securities, upon request by the investment adviser in each instance.
(f) Not applicable.
(g) Aggregate non-audit fees billed by the registrant’s principal accountant for services rendered to the registrant, and rendered to the registrant’s investment adviser, and any entity controlling, controlled by, or under common control with the adviser that provides ongoing services to the registrant for each of the last two fiscal years of the registrant:
| | | | | | |
Fiscal Year ended 9/30/23 | | Fiscal Year ended 9/30/24 |
$ | | %* | | $ | | %* |
$0 | | 0% | | $18,490 | | 0% |
| * | Percentage of fees approved by the Audit Committee pursuant to (c)(7)(i)(C) of Rule 2-01 of Reg. S-X (statutory de minimis waiver of Committee’s requirement to pre-approve). |
(h) The registrant’s audit committee has considered whether the provision by the registrant’s principal accountant of non-audit services to the registrant’s investment adviser and any entity controlling, controlled by, or under common control with the adviser that provides ongoing services to the registrant that were not pre-approved pursuant to Rule 2-01(c)(7)(ii) of Regulation S-X is compatible with maintaining the principal accountant’s independence.
(i) Not applicable.
(j) Not applicable.
Item 5. Audit Committee of Listed Registrants
Not applicable.
Item 6. Schedule of Investments
(a) Please see schedule of investments contained in the Financial Statements and Financial Highlights included under Item 7 of this Form N-CSR.
(b) Not applicable.
Item 7. Financial Statements and Financial Highlights for Open-End Management Investment Companies
Calvert
Mid-Cap Fund
Annual Financial Statements and
Additional Information
September 30, 2024
This report must be preceded or accompanied by a current summary prospectus or prospectus. Before investing, investors should consider carefully the investment objective, risks, and charges and expenses of a mutual fund. This and other important information is contained in the prospectus and/or statement of additional information, which can be obtained by calling 1-800-368-2745 or from a financial intermediary. Prospective investors should read the prospectus carefully before investing.
Annual Financial Statements and Additional Information September 30, 2024
Calvert
Mid-Cap Fund
Calvert
Mid-Cap Fund
September 30, 2024
| Security | Shares | Value |
| Automobile Components — 2.8% | |
| Dorman Products, Inc.(1) | | 58,938 | $ 6,667,066 |
| | | | $ 6,667,066 |
| Banks — 2.5% | |
| Commerce Bancshares, Inc. | | 50,510 | $ 3,000,294 |
| First Financial Bankshares, Inc. | | 79,284 | 2,934,301 |
| | | | $ 5,934,595 |
| Biotechnology — 0.9% | |
| Neurocrine Biosciences, Inc.(1) | | 19,122 | $ 2,203,237 |
| | | | $2,203,237 |
| Broadline Retail — 0.4% | |
| Etsy, Inc.(1) | | 15,728 | $873,376 |
| | | | $873,376 |
| Building Products — 2.0% | |
| AZEK Co., Inc.(1) | | 101,219 | $4,737,049 |
| | | | $4,737,049 |
| Capital Markets — 4.3% | |
| LPL Financial Holdings, Inc. | | 12,621 | $2,936,023 |
| Tradeweb Markets, Inc., Class A | | 58,153 | 7,191,782 |
| | | | $10,127,805 |
| Chemicals — 1.9% | |
| Quaker Chemical Corp. | | 26,384 | $4,445,440 |
| | | | $4,445,440 |
| Commercial Services & Supplies — 3.3% | |
| Copart, Inc.(1) | | 116,805 | $6,120,582 |
| Rentokil Initial PLC ADR(2) | | 68,682 | 1,712,242 |
| | | | $7,832,824 |
| Communications Equipment — 3.5% | |
| Motorola Solutions, Inc. | | 18,099 | $8,137,853 |
| | | | $8,137,853 |
| Consumer Staples Distribution & Retail — 2.8% | |
| Casey's General Stores, Inc. | | 5,550 | $2,085,191 |
| U.S. Foods Holding Corp.(1) | | 71,831 | 4,417,606 |
| | | | $6,502,797 |
| Containers & Packaging — 4.0% | |
| AptarGroup, Inc. | | 51,392 | $8,232,484 |
| Avery Dennison Corp. | | 5,222 | 1,152,809 |
| | | | $9,385,293 |
| Security | Shares | Value |
| Electric Utilities — 2.4% | |
| Alliant Energy Corp. | | 94,069 | $ 5,709,048 |
| | | | $ 5,709,048 |
| Electrical Equipment — 2.5% | |
| AMETEK, Inc. | | 34,813 | $ 5,977,740 |
| | | | $ 5,977,740 |
| Electronic Equipment, Instruments & Components — 1.9% | |
| TE Connectivity PLC | | 29,319 | $ 4,426,876 |
| | | | $ 4,426,876 |
| Food Products — 0.4% | |
| Lamb Weston Holdings, Inc. | | 14,725 | $953,296 |
| | | | $953,296 |
| Ground Transportation — 1.6% | |
| Landstar System, Inc. | | 19,662 | $3,713,562 |
| | | | $3,713,562 |
| Health Care Equipment & Supplies — 7.0% | |
| Cooper Cos., Inc.(1) | | 57,230 | $6,314,758 |
| IDEXX Laboratories, Inc.(1) | | 9,618 | 4,859,206 |
| Teleflex, Inc. | | 20,955 | 5,182,591 |
| | | | $16,356,555 |
| Hotels, Restaurants & Leisure — 6.6% | |
| Aramark | | 125,323 | $4,853,760 |
| Choice Hotels International, Inc. | | 20,271 | 2,641,311 |
| Domino's Pizza, Inc. | | 4,954 | 2,130,914 |
| Wyndham Hotels & Resorts, Inc. | | 74,337 | 5,808,693 |
| | | | $15,434,678 |
| Household Durables — 1.3% | |
| NVR, Inc.(1) | | 314 | $3,080,905 |
| | | | $3,080,905 |
| Household Products — 1.4% | |
| Church & Dwight Co., Inc. | | 32,533 | $3,406,856 |
| | | | $3,406,856 |
| Industrial REITs — 1.6% | |
| Rexford Industrial Realty, Inc. | | 77,002 | $3,873,971 |
| | | | $3,873,971 |
| Insurance — 8.3% | |
| American Financial Group, Inc. | | 26,943 | $3,626,528 |
| Arch Capital Group Ltd.(1) | | 33,108 | 3,704,123 |
| Kinsale Capital Group, Inc. | | 5,934 | 2,762,692 |
| Ryan Specialty Holdings, Inc. | | 41,517 | 2,756,314 |
| W.R. Berkley Corp. | | 42,940 | 2,435,986 |
1
See Notes to Financial Statements.
Calvert
Mid-Cap Fund
September 30, 2024
Schedule of Investments — continued
| Security | Shares | Value |
| Insurance (continued) | |
| White Mountains Insurance Group Ltd. | | 2,483 | $ 4,211,665 |
| | | | $ 19,497,308 |
| IT Services — 1.5% | |
| VeriSign, Inc.(1) | | 18,751 | $ 3,561,940 |
| | | | $ 3,561,940 |
| Life Sciences Tools & Services — 1.3% | |
| Avantor, Inc.(1) | | 117,803 | $ 3,047,564 |
| | | | $ 3,047,564 |
| Machinery — 4.6% | |
| Graco, Inc. | | 45,207 | $3,956,064 |
| Middleby Corp.(1) | | 26,556 | 3,694,736 |
| Nordson Corp. | | 12,028 | 3,158,914 |
| | | | $10,809,714 |
| Multi-Utilities — 2.5% | |
| CMS Energy Corp. | | 83,171 | $5,874,368 |
| | | | $5,874,368 |
| Pharmaceuticals — 1.6% | |
| Royalty Pharma PLC, Class A | | 136,338 | $3,857,002 |
| | | | $3,857,002 |
| Professional Services — 2.1% | |
| Dayforce, Inc.(1)(2) | | 39,313 | $2,407,921 |
| Verisk Analytics, Inc. | | 9,703 | 2,600,016 |
| | | | $5,007,937 |
| Residential REITs — 4.5% | |
| Equity LifeStyle Properties, Inc. | | 87,416 | $6,236,258 |
| Mid-America Apartment Communities, Inc. | | 26,656 | 4,235,638 |
| | | | $10,471,896 |
| Semiconductors & Semiconductor Equipment — 3.6% | |
| Entegris, Inc. | | 13,998 | $1,575,195 |
| Microchip Technology, Inc. | | 32,829 | 2,635,840 |
| ON Semiconductor Corp.(1) | | 35,741 | 2,595,154 |
| Teradyne, Inc. | | 11,618 | 1,555,999 |
| | | | $8,362,188 |
| Software — 1.8% | |
| Tyler Technologies, Inc.(1) | | 7,108 | $4,149,082 |
| | | | $4,149,082 |
| Specialized REITs — 2.7% | |
| Lamar Advertising Co., Class A | | 47,601 | $6,359,493 |
| | | | $6,359,493 |
| Security | Shares | Value |
| Specialty Retail — 4.1% | |
| Burlington Stores, Inc.(1) | | 14,367 | $ 3,785,417 |
| O'Reilly Automotive, Inc.(1) | | 4,995 | 5,752,242 |
| | | | $ 9,537,659 |
| Trading Companies & Distributors — 3.4% | |
| Core & Main, Inc., Class A(1) | | 110,983 | $ 4,927,645 |
| United Rentals, Inc. | | 3,764 | 3,047,824 |
| | | | $ 7,975,469 |
Total Common Stocks
(identified cost $177,857,035) | | | $228,292,442 |
| Short-Term Investments — 3.7% | | | |
| Affiliated Fund — 3.0% |
| Security | Shares | Value |
| Morgan Stanley Institutional Liquidity Funds - Government Portfolio, Institutional Class, 4.83%(3) | | 6,974,937 | $ 6,974,937 |
Total Affiliated Fund
(identified cost $6,974,937) | | | $ 6,974,937 |
| Securities Lending Collateral — 0.7% |
| Security | Shares | Value |
| State Street Navigator Securities Lending Government Money Market Portfolio, 5.02%(4) | | 1,695,619 | $ 1,695,619 |
Total Securities Lending Collateral
(identified cost $1,695,619) | | | $ 1,695,619 |
Total Short-Term Investments
(identified cost $8,670,556) | | | $ 8,670,556 |
Total Investments — 100.8%
(identified cost $186,527,591) | | | $236,962,998 |
| Other Assets, Less Liabilities — (0.8)% | | | $ (1,941,438) |
| Net Assets — 100.0% | | | $235,021,560 |
| The percentage shown for each investment category in the Schedule of Investments is based on net assets. |
| (1) | Non-income producing security. |
| (2) | All or a portion of this security was on loan at September 30, 2024. The aggregate market value of securities on loan at September 30, 2024 was $3,994,142. |
| (3) | May be deemed to be an affiliated investment company. The rate shown is the annualized seven-day yield as of September 30, 2024. |
| (4) | Represents investment of cash collateral received in connection with securities lending. |
2
See Notes to Financial Statements.
Calvert
Mid-Cap Fund
September 30, 2024
Schedule of Investments — continued
| Abbreviations: |
| ADR | – American Depositary Receipt |
| REITs | – Real Estate Investment Trusts |
3
See Notes to Financial Statements.
Calvert
Mid-Cap Fund
September 30, 2024
Statement of Assets and Liabilities
| | September 30, 2024 |
| Assets | |
Investments in securities of unaffiliated issuers, at value (identified cost $179,552,654) - including
$3,994,142 of securities on loan | $229,988,061 |
| Investments in securities of affiliated issuers, at value (identified cost $6,974,937) | 6,974,937 |
| Receivable for capital shares sold | 67,576 |
| Dividends receivable | 105,898 |
| Dividends receivable - affiliated | 15,037 |
| Securities lending income receivable | 923 |
| Directors' deferred compensation plan | 169,848 |
| Total assets | $237,322,280 |
| Liabilities | |
| Payable for capital shares redeemed | $128,731 |
| Deposits for securities loaned | 1,695,619 |
| Payable to affiliates: | |
| Investment advisory fee | 123,333 |
| Administrative fee | 22,842 |
| Distribution and service fees | 34,988 |
| Sub-transfer agency fee | 15,988 |
| Directors' deferred compensation plan | 169,848 |
| Other | 8,197 |
| Accrued expenses | 101,174 |
| Total liabilities | $2,300,720 |
| Net Assets | $235,021,560 |
| Sources of Net Assets | |
| Paid-in capital | $176,903,490 |
| Distributable earnings | 58,118,070 |
| Net Assets | $235,021,560 |
| Class A Shares | |
| Net Assets | $159,879,055 |
| Shares Outstanding | 4,091,501 |
Net Asset Value and Redemption Price Per Share
(net assets ÷ shares of beneficial interest outstanding) | $39.08 |
Maximum Offering Price Per Share
(100 ÷ 94.75 of net asset value per share) | $41.25 |
| Class C Shares | |
| Net Assets | $3,188,059 |
| Shares Outstanding | 135,052 |
Net Asset Value and Offering Price Per Share*
(net assets ÷ shares of beneficial interest outstanding) | $23.61 |
4
See Notes to Financial Statements.
Calvert
Mid-Cap Fund
September 30, 2024
Statement of Assets and Liabilities — continued
| | September 30, 2024 |
| Class I Shares | |
| Net Assets | $71,954,446 |
| Shares Outstanding | 1,493,939 |
Net Asset Value, Offering Price and Redemption Price Per Share
(net assets ÷ shares of beneficial interest outstanding) | $48.16 |
| On sales of $50,000 or more, the offering price of Class A shares is reduced. |
| * | Redemption price per share is equal to the net asset value less any applicable contingent deferred sales charge. |
5
See Notes to Financial Statements.
Calvert
Mid-Cap Fund
September 30, 2024
| | Year Ended |
| | September 30, 2024 |
| Investment Income | |
| Dividend income | $2,775,612 |
| Dividend income - affiliated issuers | 123,368 |
| Interest income - affiliated issuers | 1,110 |
| Securities lending income, net | 10,403 |
| Total investment income | $2,910,493 |
| Expenses | |
| Investment advisory fee | $1,515,176 |
| Administrative fee | 279,725 |
| Distribution and service fees: | |
| Class A | 376,296 |
| Class C | 34,771 |
| Directors' fees and expenses | 13,942 |
| Custodian fees | 7,159 |
| Transfer agency fees and expenses | 308,750 |
| Accounting fees | 55,290 |
| Professional fees | 47,922 |
| Registration fees | 49,005 |
| Reports to shareholders | 37,308 |
| Miscellaneous | 24,016 |
| Total expenses | $2,749,360 |
| Waiver and/or reimbursement of expenses by affiliates | $(169,570) |
| Net expenses | $2,579,790 |
| Net investment income | $330,703 |
| Realized and Unrealized Gain (Loss) | |
| Net realized gain (loss): | |
| Investment securities | $9,243,596 |
| Net realized gain | $9,243,596 |
| Change in unrealized appreciation (depreciation): | |
| Investment securities | $40,253,733 |
| Investment securities - affiliated issuers | 4,936 |
| Net change in unrealized appreciation (depreciation) | $40,258,669 |
| Net realized and unrealized gain | $49,502,265 |
| Net increase in net assets from operations | $49,832,968 |
6
See Notes to Financial Statements.
Calvert
Mid-Cap Fund
September 30, 2024
Statements of Changes in Net Assets
| | Year Ended September 30, |
| | 2024 | 2023 |
| Increase (Decrease) in Net Assets | | |
| From operations: | | |
| Net investment income | $330,703 | $456,643 |
| Net realized gain | 9,243,596 | 1,773,755 |
| Net change in unrealized appreciation (depreciation) | 40,258,669 | 23,241,735 |
| Net increase in net assets from operations | $49,832,968 | $25,472,133 |
| Distributions to shareholders: | | |
| Class A | $ — | $(50,586) |
| Class I | (139,654) | (233,247) |
| Total distributions to shareholders | $(139,654) | $(283,833) |
| Capital share transactions: | | |
| Class A | $(12,654,880) | $(12,339,154) |
| Class C | (1,184,559) | (1,442,515) |
| Class I | (29,480,979) | (23,056,768) |
| Net decrease in net assets from capital share transactions | $(43,320,418) | $(36,838,437) |
| Net increase (decrease) in net assets | $6,372,896 | $(11,650,137) |
| Net Assets | | |
| At beginning of year | $228,648,664 | $240,298,801 |
| At end of year | $235,021,560 | $228,648,664 |
7
See Notes to Financial Statements.
Calvert
Mid-Cap Fund
September 30, 2024
| | Class A |
| | Year Ended September 30, |
| | 2024 | 2023 | 2022 | 2021 | 2020 |
| Net asset value — Beginning of year | $31.59 | $28.71 | $41.79 | $33.96 | $34.69 |
| Income (Loss) From Operations | | | | | |
| Net investment income (loss)(1) | $0.02 | $0.03 | $(0.02) | $(0.12) | $0.05 |
| Net realized and unrealized gain (loss) | 7.47 | 2.86 | (7.90) | 8.28 | 1.07 |
| Total income (loss) from operations | $7.49 | $2.89 | $(7.92) | $8.16 | $1.12 |
| Less Distributions | | | | | |
| From net investment income | $ — | $(0.01) | $ — | $(0.00)(2) | $(0.03) |
| From net realized gain | — | — | (5.16) | (0.33) | (1.82) |
| Total distributions | $ — | $(0.01) | $(5.16) | $(0.33) | $(1.85) |
| Net asset value — End of year | $39.08 | $31.59 | $28.71 | $41.79 | $33.96 |
| Total Return(3) | 23.71% | 10.07% | (22.06)% | 24.13% | 3.20% |
| Ratios/Supplemental Data | | | | | |
| Net assets, end of year (000’s omitted) | $159,879 | $140,598 | $138,646 | $183,991 | $149,112 |
| Ratios (as a percentage of average daily net assets):(4) | | | | | |
| Total expenses | 1.25% | 1.26% | 1.23% | 1.22% | 1.26% |
| Net expenses | 1.18%(5) | 1.18%(5) | 1.18%(5) | 1.18% | 1.18% |
| Net investment income (loss) | 0.07% | 0.09% | (0.07)% | (0.30)% | 0.15% |
| Portfolio Turnover | 26% | 27% | 109% | 79% | 70% |
| (1) | Computed using average shares outstanding. |
| (2) | Amount is less than $(0.005). |
| (3) | Returns are historical and are calculated by determining the percentage change in net asset value with all distributions reinvested and do not reflect the effect of sales charges, if any. |
| (4) | Total expenses do not reflect amounts reimbursed and/or waived by the adviser and certain of its affiliates, if applicable. Net expenses are net of all reductions and represent the net expenses paid by the Fund. |
| (5) | Includes a reduction by the investment adviser of a portion of its advisory fee due to the Fund’s investment in the Liquidity Fund (equal to less than 0.005% of average daily net assets for the years ended September 30, 2024, 2023 and 2022). |
8
See Notes to Financial Statements.
Calvert
Mid-Cap Fund
September 30, 2024
Financial Highlights — continued
| | Class C |
| | Year Ended September 30, |
| | 2024 | 2023 | 2022 | 2021 | 2020 |
| Net asset value — Beginning of year | $19.23 | $17.60 | $27.53 | $22.64 | $23.83 |
| Income (Loss) From Operations | | | | | |
| Net investment loss(1) | $(0.15) | $(0.13) | $(0.18) | $(0.28) | $(0.14) |
| Net realized and unrealized gain (loss) | 4.53 | 1.76 | (4.78) | 5.50 | 0.73 |
| Total income (loss) from operations | $4.38 | $1.63 | $(4.96) | $5.22 | $0.59 |
| Less Distributions | | | | | |
| From net realized gain | $ — | $ — | $(4.97) | $(0.33) | $(1.78) |
| Total distributions | $ — | $ — | $(4.97) | $(0.33) | $(1.78) |
| Net asset value — End of year | $23.61 | $19.23 | $17.60 | $27.53 | $22.64 |
| Total Return(2) | 22.78% | 9.26% | (22.63)% | 23.20% | 2.40% |
| Ratios/Supplemental Data | | | | | |
| Net assets, end of year (000’s omitted) | $3,188 | $3,654 | $4,612 | $7,469 | $8,787 |
| Ratios (as a percentage of average daily net assets):(3) | | | | | |
| Total expenses | 2.00% | 2.01% | 1.98% | 1.98% | 2.01% |
| Net expenses | 1.93%(4) | 1.93%(4) | 1.93%(4) | 1.93% | 1.93% |
| Net investment loss | (0.68)% | (0.65)% | (0.82)% | (1.05)% | (0.62)% |
| Portfolio Turnover | 26% | 27% | 109% | 79% | 70% |
| (1) | Computed using average shares outstanding. |
| (2) | Returns are historical and are calculated by determining the percentage change in net asset value with all distributions reinvested and do not reflect the effect of sales charges, if any. |
| (3) | Total expenses do not reflect amounts reimbursed and/or waived by the adviser and certain of its affiliates, if applicable. Net expenses are net of all reductions and represent the net expenses paid by the Fund. |
| (4) | Includes a reduction by the investment adviser of a portion of its advisory fee due to the Fund’s investment in the Liquidity Fund (equal to less than 0.005% of average daily net assets for the years ended September 30, 2024, 2023 and 2022). |
9
See Notes to Financial Statements.
Calvert
Mid-Cap Fund
September 30, 2024
Financial Highlights — continued
| | Class I |
| | Year Ended September 30, |
| | 2024 | 2023 | 2022 | 2021 | 2020 |
| Net asset value — Beginning of year | $38.91 | $35.34 | $50.28 | $40.77 | $41.25 |
| Income (Loss) From Operations | | | | | |
| Net investment income (loss)(1) | $0.14 | $0.14 | $0.09 | $(0.03) | $0.16 |
| Net realized and unrealized gain (loss) | 9.18 | 3.52 | (9.77) | 9.95 | 1.27 |
| Total income (loss) from operations | $9.32 | $3.66 | $(9.68) | $9.92 | $1.43 |
| Less Distributions | | | | | |
| From net investment income | $(0.07) | $(0.09) | $(0.08) | $(0.08) | $(0.09) |
| From net realized gain | — | — | (5.18) | (0.33) | (1.82) |
| Total distributions | $(0.07) | $(0.09) | $(5.26) | $(0.41) | $(1.91) |
| Net asset value — End of year | $48.16 | $38.91 | $35.34 | $50.28 | $40.77 |
| Total Return(2) | 23.97% | 10.35% | (21.87)% | 24.45% | 3.45% |
| Ratios/Supplemental Data | | | | | |
| Net assets, end of year (000’s omitted) | $71,954 | $84,396 | $97,041 | $122,391 | $76,327 |
| Ratios (as a percentage of average daily net assets):(3) | | | | | |
| Total expenses | 1.00% | 1.01% | 0.98% | 0.97% | 1.01% |
| Net expenses | 0.93%(4) | 0.93%(4) | 0.93%(4) | 0.93% | 0.93% |
| Net investment income (loss) | 0.32% | 0.34% | 0.20% | (0.06)% | 0.40% |
| Portfolio Turnover | 26% | 27% | 109% | 79% | 70% |
| (1) | Computed using average shares outstanding. |
| (2) | Returns are historical and are calculated by determining the percentage change in net asset value with all distributions reinvested and do not reflect the effect of sales charges, if any. |
| (3) | Total expenses do not reflect amounts reimbursed and/or waived by the adviser and certain of its affiliates, if applicable. Net expenses are net of all reductions and represent the net expenses paid by the Fund. |
| (4) | Includes a reduction by the investment adviser of a portion of its advisory fee due to the Fund’s investment in the Liquidity Fund (equal to less than 0.005% of average daily net assets for the years ended September 30, 2024, 2023 and 2022). |
10
See Notes to Financial Statements.
Calvert
Mid-Cap Fund
September 30, 2024
Notes to Financial Statements
1 Significant Accounting Policies
Calvert Mid-Cap Fund (the Fund) is a diversified series of Calvert World Values Fund, Inc. (the Corporation). The Corporation is a Maryland corporation registered under the Investment Company Act of 1940, as amended (the 1940 Act), as an open-end management investment company. The investment objective of the Fund is to seek to provide long-term capital appreciation by investing primarily in mid-cap stocks.
The Fund offers three classes of shares. Class A shares are generally sold subject to a sales charge imposed at time of purchase. A contingent deferred sales charge of 1.00% may apply to certain redemptions of Class A shares for accounts for which no sales charge was paid, if redeemed within 12 months of purchase. Class C shares are sold without a front-end sales charge, and with certain exceptions, are charged a contingent deferred sales charge of 1.00% on shares redeemed within 12 months of purchase. Class C shares are only available for purchase through a financial intermediary. Effective November 5, 2020, Class C shares automatically convert to Class A shares eight years after their purchase as described in the Fund’s prospectus. Class I shares are sold at net asset value, are not subject to a sales charge and are sold only to certain eligible investors. Each class represents a pro rata interest in the Fund, but votes separately on class-specific matters and is subject to different expenses.
The Fund applies the accounting and reporting guidance in the Financial Accounting Standards Board (FASB) Accounting Standards Codification Topic 946, Financial Services – Investment Companies (ASC 946). Subsequent events, if any, through the date that the financial statements were issued have been evaluated in the preparation of the financial statements.
A Investment Valuation— Net asset value per share is determined every business day as of the close of the regular session of the New York Stock Exchange (generally 4:00 p.m. Eastern time). The Fund uses independent pricing services approved by the Board of Directors (the Board) to value its investments wherever possible. Investments for which market quotations are not available or deemed not reliable are fair valued in good faith by the
Board’s valuation designee.
U.S. generally accepted accounting principles (U.S. GAAP) establishes a disclosure hierarchy that categorizes the inputs to valuation techniques used to value assets and liabilities at measurement date. These inputs are summarized in the three broad levels listed below:
Level 1 - quoted prices in active markets for identical securities
Level 2 - other significant observable inputs (including quoted prices for similar securities, interest rates, prepayment speeds, credit risk, etc.)
Level 3 - significant unobservable inputs (including the Fund’s own assumptions in determining the fair value of investments)
The inputs or methodologies used for valuing securities are not necessarily an indication of the risk associated with investing in those securities.
Valuation techniques used to value the Fund’s investments by major category are as follows:
Equity Securities. Equity securities (including warrants and rights) listed on a U.S. securities exchange generally are valued at the last sale or closing price as reported by an independent pricing service on the primary market or exchange on which they are traded and are categorized as Level 1 in the hierarchy. Equity securities listed on the NASDAQ National Market System are valued at the NASDAQ official closing price and are categorized as Level 1 in the hierarchy. Unlisted or listed securities for which closing sales prices or closing quotations are not available are valued at the mean between the latest available bid and ask prices and are categorized as Level 2 in the hierarchy.
Other Securities. Investments in management investment companies (including money market funds) that do not trade on an exchange are valued at the net asset value as of the close of each business day and are categorized as Level 1 in the hierarchy.
Fair Valuation. In connection with Rule 2a-5 of the 1940 Act, the Board has designated the Fund’s investment adviser as its valuation designee. Investments for which valuations or market quotations are not readily available or are deemed unreliable are valued by the investment adviser, as valuation designee, at fair value using methods that most fairly reflect the security’s “fair value”, which is the amount that the Fund might reasonably expect to receive for the security upon its current sale in the ordinary course. Each such determination is based on a consideration of relevant factors, which are likely to vary from one pricing context to another. These factors may include, but are not limited to, the type of security, the existence of any contractual restrictions on the security’s disposition, the price and extent of public trading in similar securities of the issuer or of comparable companies or entities, quotations or relevant information obtained from broker/dealers or other market participants, information obtained from the issuer, analysts, and/or the appropriate stock exchange (for exchange-traded securities), an analysis of the company’s or entity’s financial statements, and an evaluation of the forces that influence the issuer and the market(s) in which the security is purchased and sold.
The values assigned to fair value investments are based on available information and do not necessarily represent amounts that might ultimately be realized. Further, due to the inherent uncertainty of valuations of such investments, the fair values may differ significantly from the values that would have been used had an active market existed, and the differences could be material.
Calvert
Mid-Cap Fund
September 30, 2024
Notes to Financial Statements — continued
The following table summarizes the market value of the Fund's holdings as of September 30, 2024, based on the inputs used to value them:
| Asset Description | Level 1 | Level 2 | Level 3 | Total |
| Common Stocks | $228,292,442(1) | $ — | $ — | $228,292,442 |
| Short-Term Investments: | | | | |
| Affiliated Fund | 6,974,937 | — | — | 6,974,937 |
| Securities Lending Collateral | 1,695,619 | — | — | 1,695,619 |
| Total Investments | $236,962,998 | $ — | $ — | $236,962,998 |
| (1) | The level classification by major category of investments is the same as the category presentation in the Schedule of Investments. |
B Investment Transactions and Income— Investment transactions for financial statement purposes are accounted for on trade date. Realized gains and losses are recorded on an identified cost basis and may include proceeds from litigation. Dividend income is recorded on the ex-dividend date for dividends received in cash and/or securities. Non-cash dividends are recorded at the fair value of the securities received. Distributions received that represent a return of capital are recorded as a reduction of cost of investments. Distributions received that represent a capital gain are recorded as a realized gain. Interest income, which includes amortization of premium and accretion of discount on debt securities, is accrued as earned.
C Share Class Accounting— Realized and unrealized gains and losses and net investment income and losses, other than class-specific expenses, are allocated daily to each class of shares based upon the relative net assets of each class to the total net assets of the Fund. Expenses arising in connection with a specific class are charged directly to that class.
D Distributions to Shareholders— Distributions to shareholders are recorded by the Fund on ex-dividend date. Distributions from net investment income and distributions from net realized capital gains, if any, are paid at least annually. Distributions are declared separately for each class of shares. Distributions are determined in accordance with income tax regulations, which may differ from U.S. GAAP; accordingly, periodic reclassifications are made within the Fund's capital accounts to reflect income and gains available for distribution under income tax regulations.
E Estimates— The preparation of financial statements in conformity with U.S. GAAP requires management to make estimates and assumptions that affect the reported amounts of assets and liabilities and disclosure of contingent assets and liabilities at the date of the financial statements and the reported amounts of increases and decreases in net assets from operations during the reporting period. Actual results could differ from those estimates.
F Indemnifications— The Corporation’s By-Laws provide for indemnification for Directors or officers of the Corporation and certain other parties, to the fullest extent permitted by Maryland law and the 1940 Act, provided certain conditions are met. Additionally, in the normal course of business, the Fund enters into agreements with service providers that may contain indemnification clauses. The Fund’s maximum exposure under these arrangements is unknown as this would involve future claims that may be made against the Fund that have not yet occurred.
G Federal Income Taxes— No provision for federal income or excise tax is required since the Fund intends to continue to qualify as a regulated investment company under the Internal Revenue Code and to distribute substantially all of its taxable earnings.
Management has analyzed the Fund's tax positions taken for all open federal income tax years and has concluded that no provision for federal income tax is required in the Fund's financial statements. A Fund's federal tax return is subject to examination by the Internal Revenue Service for a period of three years from the date of filing.
2 Related Party Transactions
The investment advisory fee is earned by Calvert Research and Management (CRM), an indirect, wholly-owned subsidiary of Morgan Stanley, as compensation for investment advisory services rendered to the Fund. The investment advisory fee is computed at the annual rate of 0.65% of the Fund's average daily net assets and is payable monthly. For the year ended September 30, 2024, the investment advisory fee amounted to $1,515,176.
The Fund may invest in a money market fund, the Institutional Class of the Morgan Stanley Institutional Liquidity Funds - Government Portfolio (the “Liquidity Fund”), an open-end management investment company managed by Morgan Stanley Investment Management Inc., a wholly-owned subsidiary of Morgan Stanley. The investment advisory fee paid by the Fund is reduced by an amount equal to its pro rata share of the advisory and administration fees paid by the Fund due to its investment in the Liquidity Fund. For the year ended September 30, 2024, the investment advisory fee paid was reduced by $3,395 relating to the Fund’s investment in the Liquidity Fund.
CRM has agreed to reimburse the Fund’s operating expenses to the extent that total annual operating expenses (relating to ordinary operating expenses only and excluding expenses such as brokerage commissions, acquired fund fees and expenses of unaffiliated funds, borrowing costs, taxes or litigation expenses) exceed 1.18%, 1.93% and 0.93% for Class A, Class C and Class I, respectively, of such class's average daily net assets. The expense reimbursement agreement with CRM may be changed or terminated after February 1, 2025. For the year ended September 30, 2024, CRM waived and/or reimbursed expenses of $166,175.
Calvert
Mid-Cap Fund
September 30, 2024
Notes to Financial Statements — continued
The administrative fee is earned by CRM as compensation for administrative services rendered to the Fund. The fee is computed at an annual rate of 0.12% of the Fund’s average daily net assets attributable to Class A, Class C and Class I and is payable monthly. For the year ended September 30, 2024, CRM was paid administrative fees of $279,725.
The Fund has in effect a distribution plan for Class A shares (Class A Plan) pursuant to Rule 12b-1 under the 1940 Act. Pursuant to the Class A Plan, the Fund pays Eaton Vance Distributors, Inc. (EVD), an affiliate of CRM and the Fund’s principal underwriter, a distribution and service fee of 0.25% per annum of its average daily net assets attributable to Class A shares for distribution services and facilities provided to the Fund by EVD, as well as for personal services and/or the maintenance of shareholder accounts. The Fund also has in effect a distribution plan for Class C shares (Class C Plan) pursuant to Rule 12b-1 under the 1940 Act. Pursuant to the Class C Plan, the Fund pays EVD amounts equal to 0.75% per annum of its average daily net assets attributable to Class C shares for providing ongoing distribution services and facilities to the Fund. In addition, pursuant to the Class C Plan, the Fund also makes payments of service fees to EVD, financial intermediaries and other persons in amounts equal to 0.25% per annum of its average daily net assets attributable to that class. Service fees paid or accrued are for personal services and/or the maintenance of shareholder accounts. Distribution and service fees paid or accrued for the year ended September 30, 2024 amounted to $376,296 and $34,771 for Class A shares and Class C shares, respectively.
The Fund was informed that EVD received $10,460 as its portion of the sales charge on sales of Class A shares for the year ended September 30, 2024. The Fund was also informed that EVD received less than $100 of contingent deferred sales charges paid by Class A and Class C shareholders for the same period.
Eaton Vance Management (EVM), an affiliate of CRM, provides sub-transfer agency and related services to the Fund pursuant to a Sub-Transfer Agency Support Services Agreement. For the year ended September 30, 2024, sub-transfer agency fees and expenses incurred to EVM amounted to $65,554 and are included in transfer agency fees and expenses on the Statement of Operations.
Each Director of the Fund who is not an employee of CRM or its affiliates receives an annual fee of $225,000 ($214,000 prior to January 1, 2024), an annual Committee fee ranging from $8,500 to $16,500 depending on the Committee, and may receive a fee of $10,000 for special meetings. The Board chair receives an additional $40,000 annual fee, Committee chairs receive an additional $15,000 annual fee and the special equities liaison receives an additional $2,500 annual fee. Eligible Directors may participate in a Deferred Compensation Plan (the Plan). Amounts deferred under the Plan are treated as though equal dollar amounts had been invested in shares of the Fund or other Calvert funds selected by the Directors. The Fund purchases shares of the funds selected equal to the dollar amounts deferred under the Plan, resulting in an asset equal to the deferred compensation liability. Obligations of the Plan are paid solely from the Fund's assets. Directors’ fees are allocated to each of the Calvert funds served. Salaries and fees of officers and Directors of the Fund who are employees of CRM or its affiliates are paid by CRM.
3 Investment Activity
During the year ended September 30, 2024, the cost of purchases and proceeds from sales of investments, other than short-term securities, were $60,225,704 and $111,264,231, respectively.
4 Distributions to Shareholders and Income Tax Information
The tax character of distributions declared for the years ended September 30, 2024 and September 30, 2023 was as follows:
| | Year Ended September 30, |
| | 2024 | 2023 |
| Ordinary income | $139,654 | $283,833 |
During the year ended September 30, 2024, distributable earnings was decreased by $570,485 and paid-in capital was increased by $570,485 due to the Fund’s use of equalization accounting. Tax equalization accounting allows the Fund to treat as a distribution that portion of redemption proceeds representing a redeeming shareholder’s portion of undistributed taxable income and net capital gains. These reclassifications had no effect on the net assets or net asset value per share of the Fund.
As of September 30, 2024, the components of distributable earnings (accumulated loss) on a tax basis were as follows:
Calvert
Mid-Cap Fund
September 30, 2024
Notes to Financial Statements — continued
| Undistributed ordinary income | $47,055 |
| Undistributed long-term capital gains | 7,430,306 |
| Net unrealized appreciation | 50,640,709 |
| Distributable earnings | $58,118,070 |
The cost and unrealized appreciation (depreciation) of investments of the Fund at September 30, 2024, as determined on a federal income tax basis, were as follows:
| Aggregate cost | $186,322,289 |
| Gross unrealized appreciation | $54,132,569 |
| Gross unrealized depreciation | (3,491,860) |
| Net unrealized appreciation | $50,640,709 |
5 Securities Lending
To generate additional income, the Fund may lend its securities pursuant to a securities lending agency agreement with State Street Bank and Trust Company (SSBT), the securities lending agent. Security loans are subject to termination by the Fund at any time and, therefore, are not considered illiquid investments. The Fund requires that the loan be continuously collateralized by either cash or securities in an amount at least equal to the market value of the securities on loan. The market value of securities loaned is determined daily and any additional required collateral is delivered to the Fund on the next business day. Cash collateral is generally invested in a money market fund registered under the 1940 Act that is managed by an affiliate of SSBT. Any gain or loss in the market price of the loaned securities that might occur and any interest earned or dividends declared during the term of the loan would accrue to the account of the Fund. Income earned on the investment of collateral, net of broker rebates and other expenses incurred by the securities lending agent, is split between the Fund and the securities lending agent based on agreed upon contractual terms. Non-cash collateral, if any, is held by the lending agent on behalf of the Fund and cannot be sold or re-pledged by the Fund; accordingly, such collateral is not reflected in the Statement of Assets and Liabilities.
The risks associated with lending portfolio securities include, but are not limited to, possible delays in receiving additional collateral or in the recovery of the loaned securities, possible loss of rights to the collateral should the borrower fail financially, as well as risk of loss in the value of the collateral or the value of the investments made with the collateral. The securities lending agent shall indemnify the Fund in the case of default of any securities borrower.
At September 30, 2024, the total value of securities on loan was $3,994,142 and the total value of collateral received was $4,091,921, comprised of cash of $1,695,619 and U.S. government and/or agencies securities of $2,396,302.
The following table provides a breakdown of securities lending transactions accounted for as secured borrowings, the obligations by class of collateral pledged, and the remaining contractual maturity of those transactions as of September 30, 2024.
| | Remaining Contractual Maturity of the Transactions |
| | Overnight and
Continuous | <30 days | 30 to 90 days | >90 days | Total |
| Common Stocks | $1,695,619 | $ — | $ — | $ — | $1,695,619 |
The carrying amount of the liability for deposits for securities loaned at September 30, 2024 approximated its fair value. If measured at fair value, such liability would have been considered as Level 2 in the fair value hierarchy (see Note 1A) at September 30, 2024.
Calvert
Mid-Cap Fund
September 30, 2024
Notes to Financial Statements — continued
6 Line of Credit
The Fund participates with other portfolios and funds managed by EVM and its affiliates, including CRM, in a $650 million unsecured revolving line of credit agreement with a group of banks, which is in effect through October 22, 2024. In connection with the renewal of the agreement on October 24, 2023, the borrowing limit was decreased from $725 million. Borrowings are made by the Fund solely for temporary purposes related to redemptions and other short-term cash needs. Interest is charged to the Fund based on its borrowings generally at an amount above either the Secured Overnight Financing Rate (SOFR) or Federal Funds rate. In addition, a fee computed at an annual rate of 0.15% on the daily unused portion of the line of credit is allocated among the participating portfolios and funds at the end of each quarter. In connection with the renewal of the agreement in October 2023, an arrangement fee of $150,000 was incurred that was allocated to the participating portfolios and funds. Because the line of credit is not available exclusively to the Fund, it may be unable to borrow some or all of its requested amounts at any particular time.
The Fund had no borrowings outstanding pursuant to its line of credit at September 30, 2024. The Fund did not have any significant borrowings or allocated fees during the year ended September 30, 2024. Effective October 22, 2024, the Fund renewed its line of credit agreement, which expires October 21, 2025, at substantially the same terms.
7 Affiliated Investments
During the year ended September 30, 2024, the Fund had invested a portion of its assets in notes (the Notes) issued by Calvert Impact Capital, Inc. (CIC) pursuant to exemptive relief granted by the U.S. Securities and Exchange Commission (the SEC). There are certain potential points of affiliation between the Fund and CIC. CRM has licensed use of the Calvert name to CIC and provides other types of support. An officer of CRM’s affiliate serves on the CIC Board.
At September 30, 2024, the value of the Fund’s investment in the Notes and in funds that may be deemed to be affiliated was $6,974,937, which represents 3.0% of the Fund’s net assets. Transactions in such investments by the Fund for the year ended September 30, 2024 were as follows:
| Name | Value,
beginning
of period | Purchases | Sales
proceeds | Net
realized
gain
(loss) | Change in
unrealized
appreciation
(depreciation) | Value,
end of
period | Interest/
Dividend
income | Principal amount/
Shares,
end of period |
| High Social Impact Investments | | | | | | | | |
| Calvert Impact Capital, Inc., Community Investment Notes, 1.50%, 12/15/23 | $355,064 | $ — | $ (360,000) | $ — | $4,936 | $ — | $ 1,110 | $ — |
| Short-Term Investments | | | | | | |
| Liquidity Fund | 6,229 | 51,694,455 | (44,725,747) | — | — | 6,974,937 | 123,368 | 6,974,937 |
| Total | | | | $ — | $4,936 | $6,974,937 | $124,478 | |
8 Capital Shares
The Corporation may issue its shares in one or more series (such as the Fund). The authorized shares of the Fund consist of 75,000,000 common shares, $0.01 par value, for each Class.
Transactions in capital shares, including direct exchanges pursuant to share class conversions, were as follows:
| | Year Ended
September 30, 2024 | | Year Ended
September 30, 2023 |
| | Shares | Amount | | Shares | Amount |
| Class A | | | | | |
| Shares sold | 193,091 | $6,764,683 | | 212,781 | $6,880,015 |
| Reinvestment of distributions | — | — | | 1,549 | 48,798 |
| Shares redeemed | (552,134) | (19,419,563) | | (592,319) | (19,267,967) |
| Net decrease | (359,043) | $(12,654,880) | | (377,989) | $(12,339,154) |
| Class C | | | | | |
| Shares sold | 10,723 | $215,656 | | 14,125 | $277,364 |
| Shares redeemed | (65,717) | (1,400,215) | | (86,038) | (1,719,879) |
| Net decrease | (54,994) | $(1,184,559) | | (71,913) | $(1,442,515) |
Calvert
Mid-Cap Fund
September 30, 2024
Notes to Financial Statements — continued
| | Year Ended
September 30, 2024 | | Year Ended
September 30, 2023 |
| | Shares | Amount | | Shares | Amount |
| Class I | | | | | |
| Shares sold | 335,106 | $14,352,476 | | 501,247 | $20,066,342 |
| Reinvestment of distributions | 3,227 | 138,103 | | 5,935 | 229,870 |
| Shares redeemed | (1,013,673) | (43,971,558) | | (1,083,692) | (43,352,980) |
| Net decrease | (675,340) | $(29,480,979) | | (576,510) | $(23,056,768) |
Calvert
Mid-Cap Fund
September 30, 2024
Report of Independent Registered Public Accounting Firm
To the Board of Directors of Calvert World Values Fund, Inc. and Shareholders of Calvert Mid-Cap Fund:
Opinion on the Financial Statements and Financial Highlights
We have audited the accompanying statement of assets and liabilities of Calvert Mid-Cap Fund (the "Fund") (one of the funds constituting Calvert World Values Fund, Inc.), including the schedule of investments, as of September 30, 2024, the related statement of operations for the year then ended, the statements of changes in net assets for each of the two years in the period then ended, the financial highlights for each of the four years in the period then ended, and the related notes. In our opinion, the financial statements and financial highlights present fairly, in all material respects, the financial position of the Fund as of September 30, 2024, and the results of its operations for the year then ended, the changes in its net assets for each of the two years in the period then ended, and the financial highlights for each of the four years in the period then ended, in conformity with accounting principles generally accepted in the United States of America. The financial highlights for the year ended September 30, 2020 were audited by other auditors whose report, dated November 20, 2020, expressed an unqualified opinion on those financial highlights.
Basis for Opinion
These financial statements and financial highlights are the responsibility of the Fund's management. Our responsibility is to express an opinion on the Fund's financial statements and financial highlights based on our audits. We are a public accounting firm registered with the Public Company Accounting Oversight Board (United States) (PCAOB) and are required to be independent with respect to the Fund in accordance with the U.S. federal securities laws and the applicable rules and regulations of the Securities and Exchange Commission and the PCAOB.
We conducted our audits in accordance with the standards of the PCAOB. Those standards require that we plan and perform the audit to obtain reasonable assurance about whether the financial statements and financial highlights are free of material misstatement, whether due to error or fraud. The Fund is not required to have, nor were we engaged to perform, an audit of its internal control over financial reporting. As part of our audits, we are required to obtain an understanding of internal control over financial reporting but not for the purpose of expressing an opinion on the effectiveness of the Fund’s internal control over financial reporting. Accordingly, we express no such opinion.
Our audits included performing procedures to assess the risks of material misstatement of the financial statements and financial highlights, whether due to error or fraud, and performing procedures that respond to those risks. Such procedures included examining, on a test basis, evidence regarding the amounts and disclosures in the financial statements and financial highlights. Our audits also included evaluating the accounting principles used and significant estimates made by management, as well as evaluating the overall presentation of the financial statements and financial highlights. Our procedures included confirmation of securities owned as of September 30, 2024, by correspondence with the custodian and brokers; when replies were not received from brokers, we performed other auditing procedures. We believe that our audits provide a reasonable basis for our opinion.
/s/ Deloitte & Touche LLP
Boston, Massachusetts
November 21, 2024
We have served as the auditor of one or more Calvert investment companies since 2021.
Calvert
Mid-Cap Fund
September 30, 2024
Federal Tax Information (Unaudited)
The Form 1099-DIV you receive in February 2025 will show the tax status of all distributions paid to your account in calendar year 2024. Shareholders are advised to consult their own tax adviser with respect to the tax consequences of their investment in the Fund. As required by the Internal Revenue Code and/or regulations, shareholders must be notified regarding the status of qualified dividend income for individuals, the dividends received deduction for corporations and capital gains dividends.
Qualified Dividend Income. For the fiscal year ended September 30, 2024, the Fund designates approximately $1,818,889, or up to the maximum amount of such dividends allowable pursuant to the Internal Revenue Code, as qualified dividend income eligible for the reduced tax rate of 15%.
Dividends Received Deduction. Corporate shareholders are generally entitled to take the dividends received deduction on the portion of the Fund's dividend distribution that qualifies under tax law. For the Fund's fiscal 2024 ordinary income dividends, 100% qualifies for the corporate dividends received deduction.
Capital Gains Dividends. The Fund hereby designates as a capital gain dividend with respect to the taxable year ended September 30, 2024, $8,049,918 or, if subsequently determined to be different, the net capital gain of such year.
Calvert
Mid-Cap Fund
September 30, 2024
Board of Directors' Contract Approval
Overview of the Contract Review Process
The Investment Company Act of 1940, as amended, provides, in substance, that each investment advisory agreement between a fund and its investment adviser will continue in effect from year to year only if its continuation is approved at least annually by the fund’s board of directors, including by a vote of a majority of the directors who are not “interested persons” of the fund (“Independent Directors”), cast in person at a meeting called for the purpose of considering such approval.
At an in-person meeting of the Boards of Trustees/Directors (each a “Board”) of the registered investment companies advised by Calvert Research and Management (“CRM” or the “Adviser”) (the “Calvert Funds”) held on June 10-11, 2024, the Board, including a majority of the Independent Directors, voted to approve continuation of existing investment advisory and investment sub-advisory agreements for the Calvert Funds for an additional one-year period.
In evaluating the investment advisory and investment sub-advisory agreements for the Calvert Funds, the Board considered a variety of information relating to the Calvert Funds and various service providers, including the Adviser. The Independent Directors reviewed a report prepared by the Adviser regarding various services provided to the Calvert Funds by the Adviser and its affiliates. Such report included, among other data, information regarding the Adviser’s personnel and the Adviser’s revenue and cost of providing services to the Calvert Funds, and a separate report prepared by an independent data provider, which compared each fund’s investment performance, fees and expenses to those of comparable funds as identified by such independent data provider (“comparable funds”).
The Independent Directors were separately represented by independent legal counsel with respect to their consideration of the continuation of the investment advisory and investment sub-advisory agreements for the Calvert Funds. Prior to voting, the Independent Directors reviewed the proposed continuation of the Calvert Funds’ investment advisory and investment sub-advisory agreements with management and also met in private sessions with their counsel at which time no representatives of management were present.
The information that the Board considered included, among other things, the following (for funds that invest through one or more affiliated underlying fund(s), references to “each fund” in this section may include information that was considered at the underlying fund-level):
Information about Fees, Performance and Expenses
| • | A report from an independent data provider comparing the advisory and related fees paid by each fund with fees paid by comparable funds; |
| • | A report from an independent data provider comparing each fund’s total expense ratio and its components to comparable funds; |
| • | A report from an independent data provider comparing the investment performance of each fund to the investment performance of comparable funds over various time periods; |
| • | Data regarding investment performance in comparison to benchmark indices; |
| • | For each fund, comparative information concerning the fees charged and the services provided by the Adviser in managing other accounts (including mutual funds, other collective investment funds and institutional accounts) using investment strategies and techniques similar to those used in managing such fund; |
| • | Profitability analyses for the Adviser with respect to each fund; |
Information about Portfolio Management and Trading
| • | Descriptions of the investment management services provided to each fund, including investment strategies and processes it employs; |
| • | Information about the Adviser’s policies and practices with respect to trading, including the Adviser’s processes for monitoring best execution of portfolio transactions; |
| • | Information about the allocation of brokerage transactions and the benefits received by the Adviser as a result of brokerage allocation, including information concerning the acquisition of research through client commission arrangements and policies with respect to “soft dollars”; |
Information about the Adviser
| • | Reports detailing the financial results and condition of CRM; |
| • | Descriptions of the qualifications, education and experience of the individual investment professionals whose responsibilities include portfolio management and investment research for the funds, and information relating to their compensation and responsibilities with respect to managing other mutual funds and investment accounts; |
| • | Policies and procedures relating to proxy voting and the handling of corporate actions and class actions; |
| • | A description of CRM’s procedures for overseeing sub-advisers, including with respect to regulatory and compliance issues, investment management and other matters; |
Calvert
Mid-Cap Fund
September 30, 2024
Board of Directors' Contract Approval — continued
Other Relevant Information
| • | Information concerning the nature, cost and character of the administrative and other non-investment advisory services provided by CRM and its affiliates; and |
| • | The terms of each investment advisory agreement. |
Over the course of the year, the Board and its committees held regular quarterly meetings. During these meetings, the Directors participated in investment and performance reviews with the portfolio managers and other investment professionals of the Adviser relating to each fund and considered various investment and trading strategies used in pursuing each fund’s investment objective(s), such as the use of derivative instruments, as well as risk management techniques. The Board and its committees also evaluated issues pertaining to industry and regulatory developments, compliance procedures, corporate governance and other issues with respect to the funds and received and participated in reports and presentations provided by CRM and its affiliates with respect to such matters. In addition to the formal meetings of the Board and its committees, the Independent Directors held regular video conferences in between meetings to discuss, among other topics, matters relating to the continuation of the Calvert Funds’ investment advisory and investment sub-advisory agreements.
For funds that invest through one or more affiliated underlying funds, the Board considered similar information about the underlying fund(s) when considering the approval of investment advisory agreements. In addition, in cases where the Adviser has engaged a sub-adviser, the Board considered similar information about the sub-adviser when considering the approval of any investment sub-advisory agreement.
The Independent Directors were assisted throughout the contract review process by their independent legal counsel. The Independent Directors relied upon the advice of such counsel and their own business judgment in determining the material factors to be considered in evaluating each investment advisory and investment sub-advisory agreement and the weight to be given to each such factor. The Board, including the Independent Directors, did not identify any single factor as controlling, and each Director may have attributed different weight to various factors.
Results of the Contract Review Process
Based on its consideration of the foregoing, and such other information as it deemed relevant, including the factors and conclusions described below, the Board, including the Independent Directors, concluded that the continuation of the investment advisory agreement of Calvert Mid-Cap Fund (the “Fund”), including the fee payable under the agreement, is in the best interests of the Fund’s shareholders. Accordingly, the Board, including a majority of the Independent Directors, voted to approve the continuation of the investment advisory agreement of the Fund.
Nature, Extent and Quality of Services
In considering the nature, extent and quality of the services provided by the Adviser under the investment advisory agreement, the Board reviewed information provided by the Adviser relating to its operations and personnel, including, among other information, biographical information on the Adviser’s investment personnel and descriptions of its organizational and management structure. The Board also took into account similar information provided periodically throughout the previous year by the Adviser as well as the Board’s familiarity with management through Board meetings, discussions and other reports. The Board considered the Adviser’s management style and its performance in employing its investment strategies as well as its current level of staffing and overall resources. The Board also noted that it reviewed on a quarterly basis information regarding the Adviser’s compliance with applicable policies and procedures, including those related to personal investing. The Board took into account, among other items, periodic reports received from the Adviser over the past year concerning the Adviser’s ongoing review and enhancement of certain processes, policies and procedures of the Calvert Funds and the Adviser. The Board concluded that it was satisfied with the nature, extent and quality of services provided to the Fund by the Adviser under the investment advisory agreement.
Fund Performance
In considering the Fund’s performance, the Board noted that it reviewed on a quarterly basis detailed information about the Fund’s performance results, portfolio composition and investment strategies. The Board compared the Fund’s investment performance to that of the Fund’s peer universe and its benchmark index. The Board’s review included comparative performance data for the one-, three- and five-year periods ended December 31, 2023. This performance data indicated that the Fund had underperformed the median of its peer universe and its benchmark index for the one-, three- and five-year periods ended December 31, 2023. The Board took into account management’s discussion of the Fund’s recent performance, noting that a new portfolio management team had assumed responsibility for the day-to-day management of the Fund in the latter half of 2022. Based upon its review, the Board concluded that the Fund’s performance was satisfactory relative to the performance of its peer universe and its benchmark index.
Calvert
Mid-Cap Fund
September 30, 2024
Board of Directors' Contract Approval — continued
Management Fees and Expenses
In considering the Fund’s fees and expenses, the Board compared the Fund’s fees and total expense ratio with those of comparable funds in its expense group. Among other findings, the data indicated that the Fund’s advisory and administrative fees (after taking into account waivers and/or reimbursements) (referred to collectively as “management fees”) and the Fund’s total expenses (net of waivers and/or reimbursements) were each below the respective median of the Fund’s expense group. The Board took into account the Adviser’s current undertaking to maintain expense limitations for the Fund and that the Adviser was waiving and/or reimbursing a portion of the Fund’s expenses. Based upon its review, the Board concluded that the management fees were reasonable in view of the nature, extent and quality of services provided by the Adviser.
Profitability and Other “Fall-Out” Benefits
The Board reviewed the Adviser’s profitability in regard to the Fund and the Calvert Funds in the aggregate. In reviewing the overall profitability of the Fund to the Adviser, the Board also considered the fact that the Adviser and its affiliates provided sub-transfer agency support, administrative and distribution services to the Fund for which they received compensation. The information considered by the Board included the profitability of the Fund to the Adviser and its affiliates without regard to any marketing support or other payments by the Adviser and its affiliates to third parties in respect of distribution services. The Board also considered that the Adviser and its affiliates derived benefits to their reputation and other indirect benefits from their relationships with the Fund. Based upon its review, the Board concluded that the Adviser’s and its affiliates’ level of profitability from their relationships with the Fund was reasonable.
Economies of Scale
The Board considered the effect of the Fund’s current size and its potential growth on its performance and fees. The Board concluded that adding breakpoints to the advisory fee at specified asset levels was not necessary at this time. The Board noted that if the Fund’s assets increased over time, the Fund might realize other economies of scale if assets increased proportionally more than certain other expenses.
This Page Intentionally Left Blank
This Page Intentionally Left Blank
This Page Intentionally Left Blank
Calvert
Emerging Markets Equity Fund
Annual Financial Statements and
Additional Information
September 30, 2024
This report must be preceded or accompanied by a current summary prospectus or prospectus. Before investing, investors should consider carefully the investment objective, risks, and charges and expenses of a mutual fund. This and other important information is contained in the prospectus and/or statement of additional information, which can be obtained by calling 1-800-368-2745 or from a financial intermediary. Prospective investors should read the prospectus carefully before investing.
Annual Financial Statements and Additional Information September 30, 2024
Calvert
Emerging Markets Equity Fund
Calvert
Emerging Markets Equity Fund
September 30, 2024
| Security | Shares | Value |
| Brazil — 5.2% | |
| Itausa SA, PFC Shares | | 21,818,624 | $ 44,336,540 |
| Localiza Rent a Car SA | | 1,882,186 | 14,165,542 |
| WEG SA | | 1,912,400 | 19,093,459 |
| | | | $ 77,595,541 |
| Canada — 2.2% | |
| Wheaton Precious Metals Corp. | | 540,969 | $ 33,042,387 |
| | | | $ 33,042,387 |
| Chile — 2.0% | |
| Banco de Chile | | 114,074,404 | $14,568,219 |
| Falabella SA(1) | | 3,921,905 | 14,532,611 |
| | | | $29,100,830 |
| China — 24.5% | |
| BYD Co. Ltd., Class H | | 473,000 | $16,875,662 |
| Centre Testing International Group Co. Ltd., Class A | | 10,416,200 | 22,030,350 |
| China Overseas Property Holdings Ltd. | | 26,183,877 | 20,567,125 |
| H World Group Ltd. ADR | | 523,554 | 19,476,209 |
| Hangzhou First Applied Material Co. Ltd., Class A | | 3,599,745 | 8,976,845 |
| Hangzhou Tigermed Consulting Co. Ltd., Class A | | 2,333,668 | 22,731,116 |
| JD.com, Inc., Class A | | 1,688,887 | 33,875,473 |
| Kanzhun Ltd. ADR | | 1,358,009 | 23,575,036 |
| Kingsoft Corp. Ltd. | | 8,417,400 | 31,544,637 |
| NARI Technology Co. Ltd., Class A | | 8,822,769 | 34,406,176 |
| Shenzhen Inovance Technology Co. Ltd., Class A | | 1,404,685 | 12,378,622 |
| Tencent Holdings Ltd. | | 1,619,713 | 90,063,882 |
| Tencent Music Entertainment Group ADR | | 1,707,018 | 20,569,567 |
| Zhongsheng Group Holdings Ltd. | | 4,179,683 | 7,586,838 |
| | | | $364,657,538 |
| Hong Kong — 4.8% | |
| AIA Group Ltd. | | 2,714,417 | $23,704,617 |
| ASMPT Ltd. | | 1,806,246 | 21,956,848 |
| Hong Kong Exchanges & Clearing Ltd. | | 624,500 | 25,511,045 |
| | | | $71,172,510 |
| Hungary — 3.2% | |
| Richter Gedeon Nyrt | | 1,516,351 | $46,713,527 |
| | | | $46,713,527 |
| India — 15.2% | |
| Bharat Forge Ltd. | | 333,891 | $6,045,889 |
| Cyient Ltd. | | 508,297 | 11,234,551 |
| HDFC Bank Ltd. | | 2,301,215 | 47,390,602 |
| ICICI Bank Ltd. | | 2,891,873 | 43,918,496 |
| Infosys Ltd. | | 1,897,215 | 42,422,791 |
| Maruti Suzuki India Ltd. | | 118,507 | 18,724,456 |
| Max Healthcare Institute Ltd. | | 866,128 | 10,268,965 |
| Samvardhana Motherson International Ltd. | | 4,998,931 | 12,586,452 |
| Security | Shares | Value |
| India (continued) | |
| SBI Life Insurance Co. Ltd.(2) | | 1,537,828 | $ 33,791,584 |
| | | | $ 226,383,786 |
| Indonesia — 1.7% | |
| Bank Rakyat Indonesia Persero Tbk. PT | | 78,161,275 | $ 25,563,603 |
| | | | $ 25,563,603 |
| Malaysia — 1.2% | |
| Press Metal Aluminium Holdings Bhd. | | 14,164,300 | $ 17,413,869 |
| | | | $ 17,413,869 |
| Mexico — 2.0% | |
| Grupo Financiero Banorte SAB de CV, Class O | | 1,682,932 | $11,977,963 |
| Wal-Mart de Mexico SAB de CV | | 5,668,929 | 17,104,676 |
| | | | $29,082,639 |
| Singapore — 2.6% | |
| Grab Holdings Ltd., Class A(1) | | 3,152,456 | $11,979,333 |
| Singapore Telecommunications Ltd. | | 10,544,100 | 26,512,203 |
| | | | $38,491,536 |
| South Africa — 5.5% | |
| Clicks Group Ltd. | | 1,107,553 | $25,434,985 |
| FirstRand Ltd. | | 6,572,909 | 31,532,238 |
| Prosus NV(3) | | 569,867 | 24,958,769 |
| | | | $81,925,992 |
| South Korea — 11.0% | |
| Hansol Chemical Co. Ltd. | | 155,058 | $15,886,419 |
| KB Financial Group, Inc. | | 579,520 | 35,757,692 |
| Samsung Electronics Co. Ltd. | | 1,734,884 | 81,086,357 |
| Samsung Electronics Co. Ltd., PFC Shares | | 270,097 | 10,489,728 |
| Samsung Life Insurance Co. Ltd. | | 282,808 | 20,198,202 |
| | | | $163,418,398 |
| Sweden — 1.5% | |
| Epiroc AB, Class A(3) | | 1,046,419 | $22,664,864 |
| | | | $22,664,864 |
| Taiwan — 16.2% | |
| Accton Technology Corp. | | 1,497,000 | $25,047,273 |
| Airtac International Group | | 462,000 | 13,232,165 |
| Delta Electronics, Inc. | | 1,361,000 | 16,238,170 |
| Lotes Co. Ltd. | | 237,000 | 10,339,440 |
| Sinbon Electronics Co. Ltd. | | 1,706,000 | 16,160,464 |
| Taiwan Semiconductor Manufacturing Co. Ltd. | | 4,579,000 | 138,075,743 |
| Voltronic Power Technology Corp. | | 105,000 | 6,711,483 |
| Wiwynn Corp. | | 280,000 | 15,176,074 |
| | | | $240,980,812 |
1
See Notes to Financial Statements.
Calvert
Emerging Markets Equity Fund
September 30, 2024
Schedule of Investments — continued
| Security | Shares | Value |
| Turkey — 1.2% | |
| Haci Omer Sabanci Holding AS | | 6,433,698 | $ 18,278,705 |
| | | | $ 18,278,705 |
| United Arab Emirates — 0.3% | |
| Abu Dhabi Commercial Bank PJSC | | 1,833,828 | $ 4,203,746 |
| | | | $ 4,203,746 |
| United States — 0.5% | |
| Micron Technology, Inc. | | 67,973 | $ 7,049,480 |
| | | | $ 7,049,480 |
Total Common Stocks
(identified cost $1,136,646,924) | | | $1,497,739,763 |
| Short-Term Investments — 1.1% |
| Affiliated Fund — 0.0%(4) |
| Security | Shares | Value |
| Morgan Stanley Institutional Liquidity Funds - Government Portfolio, Institutional Class, 4.83%(5) | | 48,007 | $ 48,007 |
Total Affiliated Fund
(identified cost $48,007) | | | $ 48,007 |
| Securities Lending Collateral — 1.1% |
| Security | Shares | Value |
| State Street Navigator Securities Lending Government Money Market Portfolio, 5.02%(6) | | 17,100,000 | $ 17,100,000 |
Total Securities Lending Collateral
(identified cost $17,100,000) | | | $ 17,100,000 |
Total Short-Term Investments
(identified cost $17,148,007) | | | $ 17,148,007 |
| | | |
Total Investments — 101.9%
(identified cost $1,153,794,931) | | $1,514,887,770 |
| Other Assets, Less Liabilities — (1.9)% | | $ (28,432,889) |
| Net Assets — 100.0% | | $1,486,454,881 |
| The percentage shown for each investment category in the Schedule of Investments is based on net assets. |
| (1) | Non-income producing security. |
| (2) | Security exempt from registration under Rule 144A of the Securities Act of 1933, as amended. These securities may be sold in certain transactions in reliance on an exemption from registration (normally to qualified institutional buyers). At September 30, 2024, the aggregate value of these securities is $33,791,584 or 2.3% of the Fund's net assets. |
| (3) | All or a portion of this security was on loan at September 30, 2024. The aggregate market value of securities on loan at September 30, 2024 was $16,292,987. |
| (4) | Amount is less than 0.05%. |
| (5) | May be deemed to be an affiliated investment company. The rate shown is the annualized seven-day yield as of September 30, 2024. |
| (6) | Represents investment of cash collateral received in connection with securities lending. |
2
See Notes to Financial Statements.
Calvert
Emerging Markets Equity Fund
September 30, 2024
Schedule of Investments — continued
At September 30, 2024, the concentration of the Fund’s investments in the various sectors, determined as a percentage of net assets, was as follows:
| Economic Sectors | % of Net Assets |
| Information Technology | 27.2% |
| Financials | 25.6 |
| Communication Services | 12.9 |
| Industrials | 10.5 |
| Consumer Discretionary | 10.4 |
| Health Care | 5.4 |
| Materials | 4.5 |
| Consumer Staples | 2.9 |
| Real Estate | 1.4 |
| Total | 100.8% |
| Abbreviations: |
| ADR | – American Depositary Receipt |
| PFC Shares | – Preference Shares |
3
See Notes to Financial Statements.
Calvert
Emerging Markets Equity Fund
September 30, 2024
Statement of Assets and Liabilities
| | September 30, 2024 |
| Assets | |
Investments in securities of unaffiliated issuers, at value (identified cost $1,153,746,924) - including
$16,292,987 of securities on loan | $1,514,839,763 |
| Investments in securities of affiliated issuers, at value (identified cost $48,007) | 48,007 |
| Cash | 26,043 |
| Cash denominated in foreign currency, at value (cost $25,468,904) | 25,732,989 |
| Receivable for investments sold | 7,901,245 |
| Receivable for capital shares sold | 1,059,569 |
| Dividends receivable | 1,514,524 |
| Dividends receivable - affiliated | 15,371 |
| Securities lending income receivable | 810 |
| Directors' deferred compensation plan | 791,751 |
| Total assets | $1,551,930,072 |
| Liabilities | |
| Payable for line of credit | $25,400,000 |
| Payable for investments purchased | 9,165,166 |
| Payable for capital shares redeemed | 1,848,258 |
| Payable for foreign capital gains taxes | 8,760,821 |
| Deposits for securities loaned | 17,100,000 |
| Payable to affiliates: | |
| Investment advisory fee | 882,812 |
| Administrative fee | 145,189 |
| Distribution and service fees | 50,677 |
| Sub-transfer agency fee | 60,731 |
| Directors' deferred compensation plan | 791,751 |
| Other | 327,595 |
| Accrued expenses | 942,191 |
| Total liabilities | $65,475,191 |
| Net Assets | $1,486,454,881 |
| Sources of Net Assets | |
| Paid-in capital | $1,463,484,376 |
| Distributable earnings | 22,970,505 |
| Net Assets | $1,486,454,881 |
| Class A Shares | |
| Net Assets | $214,947,765 |
| Shares Outstanding | 11,553,401 |
Net Asset Value and Redemption Price Per Share
(net assets ÷ shares of beneficial interest outstanding) | $18.60 |
Maximum Offering Price Per Share
(100 ÷ 94.75 of net asset value per share) | $19.63 |
| Class C Shares | |
| Net Assets | $12,075,268 |
| Shares Outstanding | 676,772 |
Net Asset Value and Offering Price Per Share*
(net assets ÷ shares of beneficial interest outstanding) | $17.84 |
4
See Notes to Financial Statements.
Calvert
Emerging Markets Equity Fund
September 30, 2024
Statement of Assets and Liabilities — continued
| | September 30, 2024 |
| Class I Shares | |
| Net Assets | $1,096,465,799 |
| Shares Outstanding | 58,348,860 |
Net Asset Value, Offering Price and Redemption Price Per Share
(net assets ÷ shares of beneficial interest outstanding) | $18.79 |
| Class R6 Shares | |
| Net Assets | $162,966,049 |
| Shares Outstanding | 8,697,177 |
Net Asset Value, Offering Price and Redemption Price Per Share
(net assets ÷ shares of beneficial interest outstanding) | $18.74 |
| On sales of $50,000 or more, the offering price of Class A shares is reduced. |
| * | Redemption price per share is equal to the net asset value less any applicable contingent deferred sales charge. |
5
See Notes to Financial Statements.
Calvert
Emerging Markets Equity Fund
September 30, 2024
| | Year Ended |
| | September 30, 2024 |
| Investment Income | |
| Dividend income (net of foreign taxes withheld of $5,043,728) | $36,599,042 |
| Dividend income - affiliated issuers | 544,779 |
| Interest income (net of foreign taxes withheld of $88) | 310 |
| Interest income - affiliated issuers | 15,941 |
| Securities lending income, net | 51,435 |
| Total investment income | $37,211,507 |
| Expenses | |
| Investment advisory fee | $13,001,897 |
| Administrative fee | 2,137,298 |
| Distribution and service fees: | |
| Class A | 464,029 |
| Class C | 126,644 |
| Directors' fees and expenses | 102,645 |
| Custodian fees | 618,607 |
| Transfer agency fees and expenses | 1,807,633 |
| Accounting fees | 362,477 |
| Professional fees | 157,653 |
| Registration fees | 92,107 |
| Reports to shareholders | 127,908 |
| Interest expense and fees | 718,397 |
| Miscellaneous | 104,474 |
| Total expenses | $19,821,769 |
| Waiver and/or reimbursement of expenses by affiliates | $(1,082,884) |
| Net expenses | $18,738,885 |
| Net investment income | $18,472,622 |
| Realized and Unrealized Gain (Loss) | |
| Net realized gain (loss): | |
| Investment securities (net of foreign capital gains taxes of $8,356,964) | $6,370,022 |
| Foreign currency transactions | (2,196,434) |
| Net realized gain | $4,173,588 |
| Change in unrealized appreciation (depreciation): | |
| Investment securities (including net increase in payable for foreign capital gains taxes of $2,635,248) | $340,953,985 |
| Investment securities - affiliated issuers | 70,881 |
| Foreign currency | 360,771 |
| Net change in unrealized appreciation (depreciation) | $341,385,637 |
| Net realized and unrealized gain | $345,559,225 |
| Net increase in net assets from operations | $364,031,847 |
6
See Notes to Financial Statements.
Calvert
Emerging Markets Equity Fund
September 30, 2024
Statements of Changes in Net Assets
| | Year Ended September 30, |
| | 2024 | 2023 |
| Increase (Decrease) in Net Assets | | |
| From operations: | | |
| Net investment income | $18,472,622 | $30,441,220 |
| Net realized gain (loss) | 4,173,588 | (187,987,925) |
| Net change in unrealized appreciation (depreciation) | 341,385,637 | 327,090,397 |
| Net increase in net assets from operations | $364,031,847 | $169,543,692 |
| Distributions to shareholders: | | |
| Class A | $(1,391,955) | $(1,025,970) |
| Class I | (14,179,177) | (14,062,537) |
| Class R6 | (3,447,607) | (2,319,617) |
| Total distributions to shareholders | $(19,018,739) | $(17,408,124) |
| Capital share transactions: | | |
| Class A | $(109,393) | $(15,756,081) |
| Class C | (4,773,208) | (5,912,624) |
| Class I | (759,629,331) | (346,832,012) |
| Class R6 | (213,990,865) | 54,702,026 |
| Net decrease in net assets from capital share transactions | $(978,502,797) | $(313,798,691) |
| Net decrease in net assets | $(633,489,689) | $(161,663,123) |
| Net Assets | | |
| At beginning of year | $2,119,944,570 | $2,281,607,693 |
| At end of year | $1,486,454,881 | $2,119,944,570 |
7
See Notes to Financial Statements.
Calvert
Emerging Markets Equity Fund
September 30, 2024
| | Class A |
| | Year Ended September 30, |
| | 2024 | 2023 | 2022 | 2021 | 2020 |
| Net asset value — Beginning of year | $15.21 | $14.26 | $20.98 | $18.33 | $16.05 |
| Income (Loss) From Operations | | | | | |
| Net investment income(1) | $0.14 | $0.17 | $0.14 | $0.12 | $0.09 |
| Net realized and unrealized gain (loss) | 3.37 | 0.86 | (6.79) | 2.59 | 2.27 |
| Total income (loss) from operations | $3.51 | $1.03 | $(6.65) | $2.71 | $2.36 |
| Less Distributions | | | | | |
| From net investment income | $(0.12) | $(0.08) | $(0.07) | $(0.06) | $(0.08) |
| Total distributions | $(0.12) | $(0.08) | $(0.07) | $(0.06) | $(0.08) |
| Net asset value — End of year | $18.60 | $15.21 | $14.26 | $20.98 | $18.33 |
| Total Return(2) | 23.25% | 7.22% | (31.79)% | 14.70% | 14.82% |
| Ratios/Supplemental Data | | | | | |
| Net assets, end of year (000’s omitted) | $214,948 | $175,220 | $178,282 | $290,117 | $173,728 |
| Ratios (as a percentage of average daily net assets):(3) | | | | | |
| Total expenses | 1.34%(4) | 1.30% | 1.29% | 1.27% | 1.27% |
| Net expenses | 1.28%(4)(5) | 1.24%(5) | 1.24%(5) | 1.24% | 1.24% |
| Net investment income | 0.85% | 1.08% | 0.76% | 0.54% | 0.54% |
| Portfolio Turnover | 36% | 59% | 56% | 36% | 38% |
| (1) | Computed using average shares outstanding. |
| (2) | Returns are historical and are calculated by determining the percentage change in net asset value with all distributions reinvested and do not reflect the effect of sales charges, if any. |
| (3) | Total expenses do not reflect amounts reimbursed and/or waived by the adviser and certain of its affiliates, if applicable. Net expenses are net of all reductions and represent the net expenses paid by the Fund. |
| (4) | Includes interest expense and fees of 0.04% of average daily nets assets for the year ended September 30, 2024. |
| (5) | Includes a reduction by the investment adviser of a portion of its advisory fee due to the Fund’s investment in the Liquidity Fund (equal to less than 0.005% of average daily net assets for the years ended September 30, 2024, 2023 and 2022). |
8
See Notes to Financial Statements.
Calvert
Emerging Markets Equity Fund
September 30, 2024
Financial Highlights — continued
| | Class C |
| | Year Ended September 30, |
| | 2024 | 2023 | 2022 | 2021 | 2020 |
| Net asset value — Beginning of year | $14.59 | $13.71 | $20.25 | $17.78 | $15.62 |
| Income (Loss) From Operations | | | | | |
| Net investment income (loss)(1) | $0.01 | $0.05 | $(0.02) | $(0.07) | $(0.04) |
| Net realized and unrealized gain (loss) | 3.24 | 0.83 | (6.52) | 2.54 | 2.20 |
| Total income (loss) from operations | $3.25 | $0.88 | $(6.54) | $2.47 | $2.16 |
| Net asset value — End of year | $17.84 | $14.59 | $13.71 | $20.25 | $17.78 |
| Total Return(2) | 22.34% | 6.42% | (32.30)% | 13.83% | 13.89% |
| Ratios/Supplemental Data | | | | | |
| Net assets, end of year (000’s omitted) | $12,075 | $14,341 | $19,000 | $33,249 | $30,938 |
| Ratios (as a percentage of average daily net assets):(3) | | | | | |
| Total expenses | 2.09%(4) | 2.05% | 2.05% | 2.02% | 2.02% |
| Net expenses | 2.03%(4)(5) | 1.99%(5) | 1.99%(5) | 1.99% | 1.99% |
| Net investment income (loss) | 0.09% | 0.30% | (0.09)% | (0.32)% | (0.22)% |
| Portfolio Turnover | 36% | 59% | 56% | 36% | 38% |
| (1) | Computed using average shares outstanding. |
| (2) | Returns are historical and are calculated by determining the percentage change in net asset value with all distributions reinvested and do not reflect the effect of sales charges, if any. |
| (3) | Total expenses do not reflect amounts reimbursed and/or waived by the adviser and certain of its affiliates, if applicable. Net expenses are net of all reductions and represent the net expenses paid by the Fund. |
| (4) | Includes interest expense and fees of 0.04% of average daily nets assets for the year ended September 30, 2024. |
| (5) | Includes a reduction by the investment adviser of a portion of its advisory fee due to the Fund’s investment in the Liquidity Fund (equal to less than 0.005% of average daily net assets for the years ended September 30, 2024, 2023 and 2022). |
9
See Notes to Financial Statements.
Calvert
Emerging Markets Equity Fund
September 30, 2024
Financial Highlights — continued
| | Class I |
| | Year Ended September 30, |
| | 2024 | 2023 | 2022 | 2021 | 2020 |
| Net asset value — Beginning of year | $15.35 | $14.40 | $21.21 | $18.52 | $16.22 |
| Income (Loss) From Operations | | | | | |
| Net investment income(1) | $0.17 | $0.21 | $0.17 | $0.16 | $0.13 |
| Net realized and unrealized gain (loss) | 3.42 | 0.86 | (6.82) | 2.62 | 2.29 |
| Total income (loss) from operations | $3.59 | $1.07 | $(6.65) | $2.78 | $2.42 |
| Less Distributions | | | | | |
| From net investment income | $(0.15) | $(0.12) | $(0.16) | $(0.09) | $(0.12) |
| Total distributions | $(0.15) | $(0.12) | $(0.16) | $(0.09) | $(0.12) |
| Net asset value — End of year | $18.79 | $15.35 | $14.40 | $21.21 | $18.52 |
| Total Return(2) | 23.62% | 7.42% | (31.59)% | 14.94% | 15.07% |
| Ratios/Supplemental Data | | | | | |
| Net assets, end of year (000’s omitted) | $1,096,466 | $1,598,483 | $1,818,889 | $3,357,833 | $2,530,135 |
| Ratios (as a percentage of average daily net assets):(3) | | | | | |
| Total expenses | 1.09%(4) | 1.05% | 1.04% | 1.02% | 1.02% |
| Net expenses | 1.03%(4)(5) | 0.99%(5) | 0.99%(5) | 0.99% | 0.99% |
| Net investment income | 1.05% | 1.33% | 0.91% | 0.71% | 0.79% |
| Portfolio Turnover | 36% | 59% | 56% | 36% | 38% |
| (1) | Computed using average shares outstanding. |
| (2) | Returns are historical and are calculated by determining the percentage change in net asset value with all distributions reinvested and do not reflect the effect of sales charges, if any. |
| (3) | Total expenses do not reflect amounts reimbursed and/or waived by the adviser and certain of its affiliates, if applicable. Net expenses are net of all reductions and represent the net expenses paid by the Fund. |
| (4) | Includes interest expense and fees of 0.04% of average daily nets assets for the year ended September 30, 2024. |
| (5) | Includes a reduction by the investment adviser of a portion of its advisory fee due to the Fund’s investment in the Liquidity Fund (equal to less than 0.005% of average daily net assets for the years ended September 30, 2024, 2023 and 2022). |
10
See Notes to Financial Statements.
Calvert
Emerging Markets Equity Fund
September 30, 2024
Financial Highlights — continued
| | Class R6 |
| | Year Ended September 30, |
| | 2024 | 2023 | 2022 | 2021 | 2020 |
| Net asset value — Beginning of year | $15.32 | $14.37 | $21.18 | $18.49 | $16.19 |
| Income (Loss) From Operations | | | | | |
| Net investment income(1) | $0.19 | $0.22 | $0.18 | $0.17 | $0.14 |
| Net realized and unrealized gain (loss) | 3.40 | 0.87 | (6.81) | 2.62 | 2.30 |
| Total income (loss) from operations | $3.59 | $1.09 | $(6.63) | $2.79 | $2.44 |
| Less Distributions | | | | | |
| From net investment income | $(0.17) | $(0.14) | $(0.18) | $(0.10) | $(0.14) |
| Total distributions | $(0.17) | $(0.14) | $(0.18) | $(0.10) | $(0.14) |
| Net asset value — End of year | $18.74 | $15.32 | $14.37 | $21.18 | $18.49 |
| Total Return(2) | 23.63% | 7.55% | (31.55)% | 15.09% | 15.13% |
| Ratios/Supplemental Data | | | | | |
| Net assets, end of year (000’s omitted) | $162,966 | $331,901 | $265,436 | $522,879 | $313,830 |
| Ratios (as a percentage of average daily net assets):(3) | | | | | |
| Total expenses | 1.04%(4) | 0.98% | 0.97% | 0.94% | 0.95% |
| Net expenses | 0.96%(4)(5) | 0.92%(5) | 0.92%(5) | 0.92% | 0.92% |
| Net investment income | 1.13% | 1.36% | 1.00% | 0.78% | 0.84% |
| Portfolio Turnover | 36% | 59% | 56% | 36% | 38% |
| (1) | Computed using average shares outstanding. |
| (2) | Returns are historical and are calculated by determining the percentage change in net asset value with all distributions reinvested and do not reflect the effect of sales charges, if any. |
| (3) | Total expenses do not reflect amounts reimbursed and/or waived by the adviser and certain of its affiliates, if applicable. Net expenses are net of all reductions and represent the net expenses paid by the Fund. |
| (4) | Includes interest expense and fees of 0.04% of average daily nets assets for the year ended September 30, 2024. |
| (5) | Includes a reduction by the investment adviser of a portion of its advisory fee due to the Fund’s investment in the Liquidity Fund (equal to less than 0.005% of average daily net assets for the years ended September 30, 2024, 2023 and 2022). |
11
See Notes to Financial Statements.
Calvert
Emerging Markets Equity Fund
September 30, 2024
Notes to Financial Statements
1 Significant Accounting Policies
Calvert Emerging Markets Equity Fund (the Fund) is a diversified series of Calvert World Values Fund, Inc. (the Corporation). The Corporation is a Maryland corporation registered under the Investment Company Act of 1940, as amended (the 1940 Act), as an open-end management investment company. The investment objective of the Fund is to seek long-term capital appreciation by investing primarily in equity securities of companies located in emerging market countries.
The Fund offers four classes of shares. Class A shares are generally sold subject to a sales charge imposed at time of purchase. A contingent deferred sales charge of 1.00% may apply to certain redemptions of Class A shares for accounts for which no sales charge was paid, if redeemed within 12 months of purchase. Class C shares are sold without a front-end sales charge, and with certain exceptions, are charged a contingent deferred sales charge of 1.00% on shares redeemed within 12 months of purchase. Class C shares are only available for purchase through a financial intermediary. Effective November 5, 2020, Class C shares automatically convert to Class A shares eight years after their purchase as described in the Fund's prospectus. Class I and Class R6 shares are sold at net asset value, are not subject to a sales charge and are sold only to certain eligible investors. Each class represents a pro rata interest in the Fund, but votes separately on class-specific matters and is subject to different expenses.
The Fund applies the accounting and reporting guidance in the Financial Accounting Standards Board (FASB) Accounting Standards Codification Topic 946, Financial Services – Investment Companies (ASC 946). Subsequent events, if any, through the date that the financial statements were issued have been evaluated in the preparation of the financial statements.
A Investment Valuation— Net asset value per share is determined every business day as of the close of the regular session of the New York Stock Exchange (generally 4:00 p.m. Eastern time). The Fund uses independent pricing services approved by the Board of Directors (the Board) to value its investments wherever possible. Investments for which market quotations are not available or deemed not reliable are fair valued in good faith by the
Board’s valuation designee.
U.S. generally accepted accounting principles (U.S. GAAP) establishes a disclosure hierarchy that categorizes the inputs to valuation techniques used to value assets and liabilities at measurement date. These inputs are summarized in the three broad levels listed below:
Level 1 - quoted prices in active markets for identical securities
Level 2 - other significant observable inputs (including quoted prices for similar securities, interest rates, prepayment speeds, credit risk, etc.)
Level 3 - significant unobservable inputs (including the Fund’s own assumptions in determining the fair value of investments)
The inputs or methodologies used for valuing securities are not necessarily an indication of the risk associated with investing in those securities.
Valuation techniques used to value the Fund’s investments by major category are as follows:
Equity Securities. Equity securities (including warrants and rights) listed on a U.S. securities exchange generally are valued at the last sale or closing price as reported by an independent pricing service on the primary market or exchange on which they are traded and are categorized as Level 1 in the hierarchy. Equity securities listed on the NASDAQ National Market System are valued at the NASDAQ official closing price and are categorized as Level 1 in the hierarchy. Unlisted or listed securities for which closing sales prices or closing quotations are not available are valued at the mean between the latest available bid and ask prices and are categorized as Level 2 in the hierarchy. The daily valuation of exchange-traded foreign securities generally is determined as of the close of trading on the principal exchange on which such securities trade. Events occurring after the close of trading on foreign exchanges may result in adjustments to the valuation of foreign securities to more accurately reflect their fair value as of the close of regular trading on the New York Stock Exchange. When valuing foreign equity securities that meet certain criteria, the Fund's Board has approved the use of a fair value service that values such securities to reflect market trading that occurs after the close of the applicable foreign markets of comparable securities or other instruments that have a strong correlation to the fair-valued securities. Such securities are categorized as Level 2 in the hierarchy.
Debt Securities. Debt securities are generally valued based on valuations provided by third party pricing services, as derived from such services’ pricing models. Inputs to the models may include, but are not limited to, reported trades, executable bid and ask prices, broker/dealer quotations, prices or yields of securities with similar characteristics, interest rates, anticipated prepayments, benchmark curves or information pertaining to the issuer, as well as industry and economic events. Accordingly, debt securities are generally categorized as Level 2 in the hierarchy. Short-term debt securities with a remaining maturity at time of purchase of more than sixty days are valued based on valuations provided by a third party pricing service. Such securities are generally categorized as Level 2 in the hierarchy. Short-term debt securities of sufficient credit quality purchased with remaining maturities of sixty days or less for which a valuation from a third party pricing service is not readily available may be valued at amortized cost, which approximates fair value, and are categorized as Level 2 in the hierarchy.
Other Securities. Investments in management investment companies (including money market funds) that do not trade on an exchange are valued at the net asset value as of the close of each business day and are categorized as Level 1 in the hierarchy.
Fair Valuation. In connection with Rule 2a-5 of the 1940 Act, the Board has designated the Fund’s investment adviser as its valuation designee. Investments for which valuations or market quotations are not readily available or are deemed unreliable are valued by the investment adviser, as valuation designee, at fair value using methods that most fairly reflect the security’s “fair value”, which is the amount that the Fund might reasonably expect to
Calvert
Emerging Markets Equity Fund
September 30, 2024
Notes to Financial Statements — continued
receive for the security upon its current sale in the ordinary course. Each such determination is based on a consideration of relevant factors, which are likely to vary from one pricing context to another. These factors may include, but are not limited to, the type of security, the existence of any contractual restrictions on the security’s disposition, the price and extent of public trading in similar securities of the issuer or of comparable companies or entities, quotations or relevant information obtained from broker/dealers or other market participants, information obtained from the issuer, analysts, and/or the appropriate stock exchange (for exchange-traded securities), an analysis of the company’s or entity’s financial statements, and an evaluation of the forces that influence the issuer and the market(s) in which the security is purchased and sold.
The values assigned to fair value investments are based on available information and do not necessarily represent amounts that might ultimately be realized. Further, due to the inherent uncertainty of valuations of such investments, the fair values may differ significantly from the values that would have been used had an active market existed, and the differences could be material.
The following table summarizes the market value of the Fund's holdings as of September 30, 2024, based on the inputs used to value them:
| Asset Description | Level 1 | Level 2 | Level 3 | Total |
| Common Stocks: | | | | |
| Brazil | $77,595,541 | $ — | $ — | $77,595,541 |
| Canada | 33,042,387 | — | — | 33,042,387 |
| Chile | — | 29,100,830 | — | 29,100,830 |
| China | 63,620,812 | 301,036,726 | — | 364,657,538 |
| Hong Kong | — | 71,172,510 | — | 71,172,510 |
| Hungary | — | 46,713,527 | — | 46,713,527 |
| India | — | 226,383,786 | — | 226,383,786 |
| Indonesia | — | 25,563,603 | — | 25,563,603 |
| Malaysia | — | 17,413,869 | — | 17,413,869 |
| Mexico | 29,082,639 | — | — | 29,082,639 |
| Singapore | 11,979,333 | 26,512,203 | — | 38,491,536 |
| South Africa | — | 81,925,992 | — | 81,925,992 |
| South Korea | — | 163,418,398 | — | 163,418,398 |
| Sweden | — | 22,664,864 | — | 22,664,864 |
| Taiwan | — | 240,980,812 | — | 240,980,812 |
| Turkey | — | 18,278,705 | — | 18,278,705 |
| United Arab Emirates | — | 4,203,746 | — | 4,203,746 |
| United States | 7,049,480 | — | — | 7,049,480 |
| Total Common Stocks | $222,370,192 | $1,275,369,571(1) | $ — | $1,497,739,763 |
| Short-Term Investments: | | | | |
| Affiliated Fund | $48,007 | $ — | $ — | $48,007 |
| Securities Lending Collateral | 17,100,000 | — | — | 17,100,000 |
| Total Investments | $239,518,199 | $1,275,369,571 | $ — | $1,514,887,770 |
| (1) | Includes foreign equity securities whose values were adjusted to reflect market trading of comparable securities or other correlated instruments that occurred after the close of trading in their applicable foreign markets. |
B Investment Transactions and Income— Investment transactions for financial statement purposes are accounted for on trade date. Realized gains and losses are recorded on an identified cost basis and may include proceeds from litigation. Dividend income is recorded on the ex-dividend date for dividends received in cash and/or securities or, in the case of dividends on certain foreign securities, as soon as the Fund is informed of the ex-dividend date. Non-cash dividends are recorded at the fair value of the securities received. Withholding taxes on foreign dividends and interest, if any, have been provided for in accordance with the Fund's understanding of the applicable country’s tax rules and rates. Distributions received that represent a return of capital are recorded as a reduction of cost of investments. Distributions received that represent a capital gain are recorded as a realized gain. Interest income, which includes amortization of premium and accretion of discount on debt securities, is accrued as earned.
C Share Class Accounting— Realized and unrealized gains and losses and net investment income and losses, other than class-specific expenses, are allocated daily to each class of shares based upon the relative net assets of each class to the total net assets of the Fund. Expenses arising in connection
Calvert
Emerging Markets Equity Fund
September 30, 2024
Notes to Financial Statements — continued
with a specific class are charged directly to that class. Sub-accounting, recordkeeping and similar administrative fees payable to financial intermediaries, which are a component of transfer agency fees and expenses on the Statement of Operations, are not allocated to Class R6 shares.
D Foreign Currency Transactions— The Fund’s accounting records are maintained in U.S. dollars. For valuation of assets and liabilities on each date of net asset value determination, foreign denominations are converted into U.S. dollars using the current exchange rate. Security transactions, income and expenses are translated at the prevailing rate of exchange on the date of the event. Recognized gains or losses on investment transactions attributable to changes in foreign currency exchange rates are recorded for financial statement purposes as net realized gains and losses on investments. That portion of unrealized gains and losses on investments that results from fluctuations in foreign currency exchange rates is not separately disclosed.
E Distributions to Shareholders— Distributions to shareholders are recorded by the Fund on ex-dividend date. Distributions from net investment income and distributions from net realized capital gains, if any, are paid at least annually. Distributions are declared separately for each class of shares. Distributions are determined in accordance with income tax regulations, which may differ from U.S. GAAP; accordingly, periodic reclassifications are made within the Fund's capital accounts to reflect income and gains available for distribution under income tax regulations.
F Estimates— The preparation of financial statements in conformity with U.S. GAAP requires management to make estimates and assumptions that affect the reported amounts of assets and liabilities and disclosure of contingent assets and liabilities at the date of the financial statements and the reported amounts of increases and decreases in net assets from operations during the reporting period. Actual results could differ from those estimates.
G Indemnifications— The Corporation’s By-Laws provide for indemnification for Directors or officers of the Corporation and certain other parties, to the fullest extent permitted by Maryland law and the 1940 Act, provided certain conditions are met. Additionally, in the normal course of business, the Fund enters into agreements with service providers that may contain indemnification clauses. The Fund’s maximum exposure under these arrangements is unknown as this would involve future claims that may be made against the Fund that have not yet occurred.
H Federal Income Taxes— No provision for federal income or excise tax is required since the Fund intends to continue to qualify as a regulated investment company under the Internal Revenue Code and to distribute substantially all of its taxable earnings.
In addition to the requirements of the Internal Revenue Code, the Fund may also be subject to local taxes on the recognition of capital gains in certain countries. In determining the daily net asset value, the Fund estimates the accrual for such taxes, if any, based on the unrealized appreciation on certain portfolio securities and the related tax rates. Taxes attributable to unrealized appreciation are included in the change in unrealized appreciation (depreciation) on investments. Capital gains taxes on securities sold are included in net realized gain (loss) on investments.
Management has analyzed the Fund's tax positions taken for all open federal income tax years and has concluded that no provision for federal income tax is required in the Fund's financial statements. A Fund's federal tax return is subject to examination by the Internal Revenue Service for a period of three years from the date of filing.
2 Related Party Transactions
The investment advisory fee is earned by Calvert Research and Management (CRM), an indirect, wholly-owned subsidiary of Morgan Stanley, as compensation for investment advisory services rendered to the Fund. The investment advisory fee is computed at the annual rate of 0.73% of the Fund’s average daily net assets and is payable monthly. For the year ended September 30, 2024, the investment advisory fee amounted to $13,001,897.
The Fund may invest in a money market fund, the Institutional Class of the Morgan Stanley Institutional Liquidity Funds - Government Portfolio (the “Liquidity Fund”), an open-end management investment company managed by Morgan Stanley Investment Management Inc., a wholly-owned subsidiary of Morgan Stanley. The investment advisory fee paid by the Fund is reduced by an amount equal to its pro rata share of the advisory and administration fees paid by the Fund due to its investment in the Liquidity Fund. For the year ended September 30, 2024, the investment advisory fee paid was reduced by $15,218 relating to the Fund’s investment in the Liquidity Fund.
Pursuant to an investment sub-advisory agreement, CRM has delegated the investment management of the Fund to Hermes Investment Management Limited (Hermes). CRM pays Hermes a portion of its investment advisory fee for sub-advisory services provided to the Fund. In September 2024, the Board approved the termination of the investment sub-advisory agreement between CRM and Hermes, which is expected to be effective November 11, 2024. CRM will continue to serve as the Fund's investment adviser.
CRM has agreed to reimburse the Fund’s operating expenses to the extent that total annual operating expenses (relating to ordinary operating expenses only and excluding expenses such as brokerage commissions, acquired fund fees and expenses of unaffiliated funds, borrowing costs, taxes or litigation expenses) exceed 1.24%, 1.99%, 0.99% and 0.92% for Class A, Class C, Class I and Class R6, respectively, of such class’s average daily net assets. The expense reimbursement agreement with CRM may be changed or terminated after February 1, 2025. For the year ended September 30, 2024, CRM waived and/or reimbursed expenses of $1,067,666.
The administrative fee is earned by CRM as compensation for administrative services rendered to the Fund. The fee is computed at an annual rate of 0.12% of the Fund’s average daily net assets attributable to Class A, Class C, Class I and Class R6 and is payable monthly. For the year ended September 30, 2024, CRM was paid administrative fees of $2,137,298.
Calvert
Emerging Markets Equity Fund
September 30, 2024
Notes to Financial Statements — continued
The Fund has in effect a distribution plan for Class A shares (Class A Plan) pursuant to Rule 12b-1 under the 1940 Act. Pursuant to the Class A Plan, the Fund pays Eaton Vance Distributors, Inc. (EVD), an affiliate of CRM and the Fund’s principal underwriter, a distribution and service fee of 0.25% per annum of its average daily net assets attributable to Class A shares for distribution services and facilities provided to the Fund by EVD, as well as for personal services and/or the maintenance of shareholder accounts. The Fund also has in effect a distribution plan for Class C shares (Class C Plan) pursuant to Rule 12b-1 under the 1940 Act. Pursuant to the Class C Plan, the Fund pays EVD amounts equal to 0.75% per annum of its average daily net assets attributable to Class C shares for providing ongoing distribution services and facilities to the Fund. In addition, pursuant to the Class C Plan, the Fund also makes payments of service fees to EVD, financial intermediaries and other persons in amounts equal to 0.25% per annum of its average daily net assets attributable to that class. Service fees paid or accrued are for personal services and/or the maintenance of shareholder accounts. Distribution and service fees paid or accrued for the year ended September 30, 2024 amounted to $464,029 and $126,644 for Class A shares and Class C shares, respectively.
The Fund was informed that EVD received $3,154 as its portion of the sales charge on sales of Class A shares for the year ended September 30, 2024. The Fund was also informed that EVD received less than $100 and $500 of contingent deferred sales charges paid by Class A and Class C shareholders, respectively, for the same period.
Eaton Vance Management (EVM), an affiliate of CRM, provides sub-transfer agency and related services to the Fund pursuant to a Sub-Transfer Agency Support Services Agreement. For the year ended September 30, 2024, sub-transfer agency fees and expenses incurred to EVM amounted to $245,655 and are included in transfer agency fees and expenses on the Statement of Operations.
Each Director of the Fund who is not an employee of CRM or its affiliates receives an annual fee of $225,000 ($214,000 prior to January 1, 2024), an annual Committee fee ranging from $8,500 to $16,500 depending on the Committee, and may receive a fee of $10,000 for special meetings. The Board chair receives an additional $40,000 annual fee, Committee chairs receive an additional $15,000 annual fee and the special equities liaison receives an additional $2,500 annual fee. Eligible Directors may participate in a Deferred Compensation Plan (the Plan). Amounts deferred under the Plan are treated as though equal dollar amounts had been invested in shares of the Fund or other Calvert funds selected by the Directors. The Fund purchases shares of the funds selected equal to the dollar amounts deferred under the Plan, resulting in an asset equal to the deferred compensation liability. Obligations of the Plan are paid solely from the Fund's assets. Directors’ fees are allocated to each of the Calvert funds served. Salaries and fees of officers and Directors of the Fund who are employees of CRM or its affiliates are paid by CRM.
3 Investment Activity
During the year ended September 30, 2024, the cost of purchases and proceeds from sales of investments, other than short-term securities, were $635,535,251 and $1,606,459,201, respectively.
4 Distributions to Shareholders and Income Tax Information
The tax character of distributions declared for the years ended September 30, 2024 and September 30, 2023 was as follows:
| | Year Ended September 30, |
| | 2024 | 2023 |
| Ordinary income | $19,018,739 | $17,408,124 |
During the year ended September 30, 2024, distributable earnings was decreased by $2,477,859 and paid-in capital was increased by $2,477,859 due to the Fund's use of equalization accounting. Tax equalization accounting allows the Fund to treat as a distribution that portion of redemption proceeds representing a redeeming shareholder’s portion of undistributed taxable income and net capital gains. These reclassifications had no effect on the net assets or net asset value per share of the Fund.
As of September 30, 2024, the components of distributable earnings (accumulated loss) on a tax basis were as follows:
| Undistributed ordinary income | $7,398,965 |
| Deferred capital losses | (310,261,788) |
| Net unrealized appreciation | 325,833,328 |
| Distributable earnings | $22,970,505 |
Calvert
Emerging Markets Equity Fund
September 30, 2024
Notes to Financial Statements — continued
At September 30, 2024, the Fund, for federal income tax purposes, had deferred capital losses of $310,261,788 which would reduce the Fund’s taxable income arising from future net realized gains on investment transactions, if any, to the extent permitted by the Internal Revenue Code, and thus would reduce the amount of distributions to shareholders, which would otherwise be necessary to relieve the Fund of any liability for federal income or excise tax. The deferred capital losses are treated as arising on the first day of the Fund’s next taxable year, can be carried forward for an unlimited period, and retain the same short-term or long-term character as when originally deferred. Of the deferred capital losses at September 30, 2024, $280,033,121 are short-term and $30,228,667 are long-term.
The cost and unrealized appreciation (depreciation) of investments of the Fund at September 30, 2024, as determined on a federal income tax basis, were as follows:
| Aggregate cost | $1,180,562,044 |
| Gross unrealized appreciation | $365,543,646 |
| Gross unrealized depreciation | (31,217,920) |
| Net unrealized appreciation | $334,325,726 |
5 Securities Lending
To generate additional income, the Fund may lend its securities pursuant to a securities lending agency agreement with State Street Bank and Trust Company (SSBT), the securities lending agent. Security loans are subject to termination by the Fund at any time and, therefore, are not considered illiquid investments. The Fund requires that the loan be continuously collateralized by either cash or securities in an amount at least equal to the market value of the securities on loan. The market value of securities loaned is determined daily and any additional required collateral is delivered to the Fund on the next business day. Cash collateral is generally invested in a money market fund registered under the 1940 Act that is managed by an affiliate of SSBT. Any gain or loss in the market price of the loaned securities that might occur and any interest earned or dividends declared during the term of the loan would accrue to the account of the Fund. Income earned on the investment of collateral, net of broker rebates and other expenses incurred by the securities lending agent, is split between the Fund and the securities lending agent based on agreed upon contractual terms. Non-cash collateral, if any, is held by the lending agent on behalf of the Fund and cannot be sold or re-pledged by the Fund; accordingly, such collateral is not reflected in the Statement of Assets and Liabilities.
The risks associated with lending portfolio securities include, but are not limited to, possible delays in receiving additional collateral or in the recovery of the loaned securities, possible loss of rights to the collateral should the borrower fail financially, as well as risk of loss in the value of the collateral or the value of the investments made with the collateral. The securities lending agent shall indemnify the Fund in the case of default of any securities borrower.
At September 30, 2024, the total value of securities on loan was $16,292,987 and the total value of collateral received was $17,151,521, comprised of cash of $17,100,000 and U.S. government and/or agencies securities of $51,521.
The following table provides a breakdown of securities lending transactions accounted for as secured borrowings, the obligations by class of collateral pledged, and the remaining contractual maturity of those transactions as of September 30, 2024.
| | Remaining Contractual Maturity of the Transactions |
| | Overnight and
Continuous | <30 days | 30 to 90 days | >90 days | Total |
| Common Stocks | $17,100,000 | $ — | $ — | $ — | $17,100,000 |
The carrying amount of the liability for deposits for securities loaned at September 30, 2024 approximated its fair value. If measured at fair value, such liability would have been considered as Level 2 in the fair value hierarchy (see Note 1A) at September 30, 2024.
Calvert
Emerging Markets Equity Fund
September 30, 2024
Notes to Financial Statements — continued
6 Line of Credit
The Fund participates with other portfolios and funds managed by EVM and its affiliates, including CRM, in a $650 million unsecured revolving line of credit agreement with a group of banks, which is in effect through October 22, 2024. In connection with the renewal of the agreement on October 24, 2023, the borrowing limit was decreased from $725 million. Borrowings are made by the Fund solely for temporary purposes related to redemptions and other short-term cash needs. Interest is charged to the Fund based on its borrowings generally at an amount above either the Secured Overnight Financing Rate (SOFR) or Federal Funds rate. In addition, a fee computed at an annual rate of 0.15% on the daily unused portion of the line of credit is allocated among the participating portfolios and funds at the end of each quarter. In connection with the renewal of the agreement in October 2023, an arrangement fee of $150,000 was incurred that was allocated to the participating portfolios and funds. Because the line of credit is not available exclusively to the Fund, it may be unable to borrow some or all of its requested amounts at any particular time.
At September 30, 2024, the Fund had a balance outstanding pursuant to this line of credit of $25,400,000 at an annual interest rate of 8.00%. Based on the short-term nature of the borrowings under the line of credit and variable interest rate, the carrying value of the borrowings approximated its fair value at September 30, 2024. If measured at fair value, borrowings under the line of credit would have been considered as Level 2 in the fair value hierarchy (see Note 1A) at September 30, 2024. Average borrowings and the weighted average annual interest rate (excluding fees) for the year ended September 30, 2024 were $10,244,891 and 6.88%, respectively.
Effective October 22, 2024, the Fund renewed its line of credit agreement, which expires October 21, 2025, at substantially the same terms.
7 Affiliated Investments
During the year ended September 30, 2024, the Fund had invested a portion of its assets in notes (the Notes) issued by Calvert Impact Capital, Inc. (CIC) pursuant to exemptive relief granted by the U.S. Securities and Exchange Commission (the SEC). There are certain potential points of affiliation between the Fund and CIC. CRM has licensed use of the Calvert name to CIC and provides other types of support. An officer of CRM's affiliate serves on the CIC Board.
At September 30, 2024, the value of the Fund’s investment in the Notes and in funds that may be deemed to be affiliated was $48,007, which represents less than 0.05% of the Fund’s net assets. Transactions in such investments by the Fund for the year ended September 30, 2024 were as follows:
| Name | Value,
beginning
of period | Purchases | Sales
proceeds | Net
realized
gain
(loss) | Change in
unrealized
appreciation
(depreciation) | Value,
end of
period | Interest/
Dividend
income | Principal amount/
Shares,
end of period |
| High Social Impact Investments | | | | | | | | |
| Calvert Impact Capital, Inc., Community Investment Notes, 1.50%, 12/15/23 | $5,099,119 | $ — | $ (5,170,000) | $ — | $70,881 | $ — | $ 15,941 | $ — |
| Short-Term Investments | | | | | | |
| Liquidity Fund | 7,808 | 353,906,985 | (353,866,786) | — | — | 48,007 | 544,779 | 48,007 |
| Total | | | | $ — | $70,881 | $48,007 | $560,720 | |
8 Capital Shares
The Corporation may issue its shares in one or more series (such as the Fund). The authorized shares of the Fund consist of 75,000,000 common shares, $0.01 par value, for each Class.
Transactions in capital shares, including direct exchanges pursuant to share class conversions, were as follows:
| | Year Ended
September 30, 2024 | | Year Ended
September 30, 2023 |
| | Shares | Amount | | Shares | Amount |
| Class A | | | | | |
| Shares sold | 3,853,927 | $61,294,244 | | 5,651,709 | $83,959,127 |
| Reinvestment of distributions | 39,589 | 627,483 | | 33,171 | 523,432 |
| Shares redeemed | (3,862,884) | (62,031,120) | | (6,662,979) | (100,238,640) |
| Net increase (decrease) | 30,632 | $(109,393) | | (978,099) | $(15,756,081) |
Calvert
Emerging Markets Equity Fund
September 30, 2024
Notes to Financial Statements — continued
| | Year Ended
September 30, 2024 | | Year Ended
September 30, 2023 |
| | Shares | Amount | | Shares | Amount |
| Class C | | | | | |
| Shares sold | 23,499 | $370,670 | | 29,795 | $460,125 |
| Shares redeemed | (329,826) | (5,143,878) | | (432,393) | (6,372,749) |
| Net decrease | (306,327) | $(4,773,208) | | (402,598) | $(5,912,624) |
| Class I | | | | | |
| Shares sold | 12,340,008 | $199,796,622 | | 30,221,849 | $485,787,382 |
| Reinvestment of distributions | 842,320 | 13,460,275 | | 844,844 | 13,441,473 |
| Shares redeemed | (58,948,167) | (972,886,228) | | (53,273,460) | (846,060,867) |
| Net decrease | (45,765,839) | $(759,629,331) | | (22,206,767) | $(346,832,012) |
| Class R6 | | | | | |
| Shares sold | 2,018,121 | $32,546,152 | | 8,913,564 | $144,800,692 |
| Reinvestment of distributions | 188,977 | 3,010,411 | | 119,833 | 1,900,552 |
| Shares redeemed | (15,179,061) | (249,547,428) | | (5,837,507) | (91,999,218) |
| Net increase (decrease) | (12,971,963) | $(213,990,865) | | 3,195,890 | $54,702,026 |
9 Risks and Uncertainties
Risks Associated with Foreign Investments
Foreign investments can be adversely affected by political, economic and market developments abroad, including the imposition of economic and other sanctions by the United States or another country, and by acts of terrorism and war. There may be less publicly available information about foreign issuers because they may not be subject to reporting practices, requirements or regulations comparable to those to which United States companies are subject. Foreign markets may be smaller, less liquid and more volatile than the major markets in the United States. Trading in foreign markets typically involves higher expense than trading in the United States. The Fund may have difficulties enforcing its legal or contractual rights in a foreign country. Securities that trade or are denominated in currencies other than the U.S. dollar may be adversely affected by fluctuations in currency exchange rates.
Emerging market securities often involve greater risks than developed market securities. Investment markets within emerging market countries are typically smaller, less liquid, less developed and more volatile than those in more developed markets like the United States, and may be focused in certain economic sectors. The information available about an emerging market issuer may be less reliable than for comparable issuers in more developed capital markets. Governmental actions can have a significant effect on the economic conditions in emerging market countries. It may be more difficult to make a claim or obtain a judgment in the courts of these countries than it is in the United States. The possibility of fraud, negligence, undue influence being exerted by an issuer or refusal to recognize ownership exists in some emerging markets. Disruptions due to work stoppages and trading improprieties in foreign securities markets have caused such markets to close. Emerging market securities are also subject to speculative trading, which contributes to their volatility.
Calvert
Emerging Markets Equity Fund
September 30, 2024
Report of Independent Registered Public Accounting Firm
To the Board of Directors of Calvert World Values Fund, Inc. and Shareholders of Calvert Emerging Markets Equity Fund:
Opinion on the Financial Statements and Financial Highlights
We have audited the accompanying statement of assets and liabilities of Calvert Emerging Markets Equity Fund (the “Fund”) (one of the funds constituting Calvert World Values Fund, Inc.), including the schedule of investments, as of September 30, 2024, the related statement of operations for the year then ended, the statements of changes in net assets for each of the two years in the period then ended, the financial highlights for each of the four years in the period then ended, and the related notes. In our opinion, the financial statements and financial highlights present fairly, in all material respects, the financial position of the Fund as of September 30, 2024, and the results of its operations for the year then ended, the changes in its net assets for each of the two years in the period then ended, and the financial highlights for each of the four years in the period then ended, in conformity with accounting principles generally accepted in the United States of America. The financial highlights for the year ended September 30, 2020 were audited by other auditors whose report, dated November 20, 2020, expressed an unqualified opinion on those financial highlights.
Basis for Opinion
These financial statements and financial highlights are the responsibility of the Fund's management. Our responsibility is to express an opinion on the Fund's financial statements and financial highlights based on our audits. We are a public accounting firm registered with the Public Company Accounting Oversight Board (United States) (PCAOB) and are required to be independent with respect to the Fund in accordance with the U.S. federal securities laws and the applicable rules and regulations of the Securities and Exchange Commission and the PCAOB.
We conducted our audits in accordance with the standards of the PCAOB. Those standards require that we plan and perform the audit to obtain reasonable assurance about whether the financial statements and financial highlights are free of material misstatement, whether due to error or fraud. The Fund is not required to have, nor were we engaged to perform, an audit of its internal control over financial reporting. As part of our audits, we are required to obtain an understanding of internal control over financial reporting but not for the purpose of expressing an opinion on the effectiveness of the Fund’s internal control over financial reporting. Accordingly, we express no such opinion.
Our audits included performing procedures to assess the risks of material misstatement of the financial statements and financial highlights, whether due to error or fraud, and performing procedures that respond to those risks. Such procedures included examining, on a test basis, evidence regarding the amounts and disclosures in the financial statements and financial highlights. Our audits also included evaluating the accounting principles used and significant estimates made by management, as well as evaluating the overall presentation of the financial statements and financial highlights. Our procedures included confirmation of securities owned as of September 30, 2024, by correspondence with the custodian and brokers; when replies were not received from brokers, we performed other auditing procedures. We believe that our audits provide a reasonable basis for our opinion.
/s/ Deloitte & Touche LLP
Boston, Massachusetts
November 21, 2024
We have served as the auditor of one or more Calvert investment companies since 2021.
Calvert
Emerging Markets Equity Fund
September 30, 2024
Federal Tax Information (Unaudited)
The Form 1099-DIV you receive in February 2025 will show the tax status of all distributions paid to your account in calendar year 2024. Shareholders are advised to consult their own tax adviser with respect to the tax consequences of their investment in the Fund. As required by the Internal Revenue Code and/or regulations, shareholders must be notified regarding the status of qualified dividend income for individuals and the foreign tax credit.
Qualified Dividend Income. For the fiscal year ended September 30, 2024, the Fund designates approximately $18,495,368, or up to the maximum amount of such dividends allowable pursuant to the Internal Revenue Code, as qualified dividend income eligible for the reduced tax rate of 15%.
Foreign Tax Credit. For the fiscal year ended September 30, 2024, the Fund paid foreign taxes of $13,058,177 and recognized foreign source income of $40,692,010.
Calvert
Emerging Markets Equity Fund
September 30, 2024
Board of Directors' Contract Approval
Overview of the Contract Review Process
The Investment Company Act of 1940, as amended, provides, in substance, that each investment advisory agreement between a fund and its investment adviser will continue in effect from year to year only if its continuation is approved at least annually by the fund’s board of directors, including by a vote of a majority of the directors who are not “interested persons” of the fund (“Independent Directors”), cast in person at a meeting called for the purpose of considering such approval.
At an in-person meeting of the Boards of Trustees/Directors (each a “Board”) of the registered investment companies advised by Calvert Research and Management (“CRM” or the “Adviser”) (the “Calvert Funds”) held on June 10-11, 2024, the Board, including a majority of the Independent Directors, voted to approve continuation of existing investment advisory and investment sub-advisory agreements for the Calvert Funds for an additional one-year period.
In evaluating the investment advisory and investment sub-advisory agreements for the Calvert Funds, the Board considered a variety of information relating to the Calvert Funds and various service providers, including the Adviser. The Independent Directors reviewed a report prepared by the Adviser regarding various services provided to the Calvert Funds by the Adviser and its affiliates. Such report included, among other data, information regarding the Adviser’s personnel and the Adviser’s revenue and cost of providing services to the Calvert Funds, and a separate report prepared by an independent data provider, which compared each fund’s investment performance, fees and expenses to those of comparable funds as identified by such independent data provider (“comparable funds”).
The Independent Directors were separately represented by independent legal counsel with respect to their consideration of the continuation of the investment advisory and investment sub-advisory agreements for the Calvert Funds. Prior to voting, the Independent Directors reviewed the proposed continuation of the Calvert Funds’ investment advisory and investment sub-advisory agreements with management and also met in private sessions with their counsel at which time no representatives of management were present.
The information that the Board considered included, among other things, the following (for funds that invest through one or more affiliated underlying fund(s), references to “each fund” in this section may include information that was considered at the underlying fund-level):
Information about Fees, Performance and Expenses
| • | A report from an independent data provider comparing the advisory and related fees paid by each fund with fees paid by comparable funds; |
| • | A report from an independent data provider comparing each fund’s total expense ratio and its components to comparable funds; |
| • | A report from an independent data provider comparing the investment performance of each fund to the investment performance of comparable funds over various time periods; |
| • | Data regarding investment performance in comparison to benchmark indices; |
| • | For each fund, comparative information concerning the fees charged and the services provided by the Adviser in managing other accounts (including mutual funds, other collective investment funds and institutional accounts) using investment strategies and techniques similar to those used in managing such fund; |
| • | Profitability analyses for the Adviser with respect to each fund; |
Information about Portfolio Management and Trading
| • | Descriptions of the investment management services provided to each fund, including investment strategies and processes it employs; |
| • | Information about the Adviser’s policies and practices with respect to trading, including the Adviser’s processes for monitoring best execution of portfolio transactions; |
| • | Information about the allocation of brokerage transactions and the benefits received by the Adviser as a result of brokerage allocation, including information concerning the acquisition of research through client commission arrangements and policies with respect to “soft dollars”; |
Information about the Adviser
| • | Reports detailing the financial results and condition of CRM; |
| • | Descriptions of the qualifications, education and experience of the individual investment professionals whose responsibilities include portfolio management and investment research for the funds, and information relating to their compensation and responsibilities with respect to managing other mutual funds and investment accounts; |
| • | Policies and procedures relating to proxy voting and the handling of corporate actions and class actions; |
| • | A description of CRM’s procedures for overseeing sub-advisers, including with respect to regulatory and compliance issues, investment management and other matters; |
Calvert
Emerging Markets Equity Fund
September 30, 2024
Board of Directors' Contract Approval — continued
Other Relevant Information
| • | Information concerning the nature, cost and character of the administrative and other non-investment advisory services provided by CRM and its affiliates; and |
| • | The terms of each investment advisory agreement. |
Over the course of the year, the Board and its committees held regular quarterly meetings. During these meetings, the Directors participated in investment and performance reviews with the portfolio managers and other investment professionals of the Adviser relating to each fund and considered various investment and trading strategies used in pursuing each fund’s investment objective(s), such as the use of derivative instruments, as well as risk management techniques. The Board and its committees also evaluated issues pertaining to industry and regulatory developments, compliance procedures, corporate governance and other issues with respect to the funds and received and participated in reports and presentations provided by CRM and its affiliates with respect to such matters. In addition to the formal meetings of the Board and its committees, the Independent Directors held regular video conferences in between meetings to discuss, among other topics, matters relating to the continuation of the Calvert Funds’ investment advisory and investment sub-advisory agreements.
For funds that invest through one or more affiliated underlying funds, the Board considered similar information about the underlying fund(s) when considering the approval of investment advisory agreements. In addition, in cases where the Adviser has engaged a sub-adviser, the Board considered similar information about the sub-adviser when considering the approval of any investment sub-advisory agreement.
The Independent Directors were assisted throughout the contract review process by their independent legal counsel. The Independent Directors relied upon the advice of such counsel and their own business judgment in determining the material factors to be considered in evaluating each investment advisory and investment sub-advisory agreement and the weight to be given to each such factor. The Board, including the Independent Directors, did not identify any single factor as controlling, and each Director may have attributed different weight to various factors.
Results of the Contract Review Process
Based on its consideration of the foregoing, and such other information as it deemed relevant, including the factors and conclusions described below, the Board, including the Independent Directors, concluded that the continuation of the investment advisory agreement of Calvert Emerging Markets Equity Fund (the “Fund”), and the investment sub-advisory agreement with Hermes Investment Management Limited (the “Sub-Adviser”), including the fees payable under each agreement, is in the best interests of the Fund’s shareholders. Accordingly, the Board, including a majority of the Independent Directors, voted to approve the continuation of the investment advisory agreement and the investment sub-advisory agreement of the Fund.
Nature, Extent and Quality of Services
In considering the nature, extent and quality of the services provided by the Adviser and Sub-Adviser under the investment advisory agreement and investment sub-advisory agreement, respectively, the Board reviewed information relating to the Adviser’s and Sub-Adviser’s operations and personnel, including, among other information, biographical information on the Sub-Adviser’s investment personnel and descriptions of the Adviser’s organizational and management structure. The Board also took into account similar information provided periodically throughout the previous year by the Adviser and Sub-Adviser as well as the Board’s familiarity with the Adviser and Sub-Adviser through Board meetings, discussions and other reports. With respect to the Adviser, the Board considered the Adviser’s responsibilities overseeing the Sub-Adviser and the business-related and other risks to which the Adviser or its affiliates may be subject in managing the Fund. With respect to the Sub-Adviser, the Board took into account the resources available to the Sub-Adviser in fulfilling its duties under the investment sub-advisory agreement and the Sub-Adviser’s experience in managing the Fund. The Board also noted that it reviewed on a quarterly basis information regarding the Adviser’s and Sub-Adviser’s compliance with applicable policies and procedures, including those related to personal investing. The Board took into account, among other items, periodic reports received from the Adviser over the past year concerning the Adviser’s ongoing review and enhancement of certain processes, policies and procedures of the Calvert Funds and the Adviser. The Board concluded that it was satisfied with the nature, extent and quality of services provided to the Fund by the Adviser and the Sub-Adviser under the investment advisory agreement and investment sub-advisory agreement, respectively.
Fund Performance
In considering the Fund’s performance, the Board noted that it reviewed on a quarterly basis detailed information about the Fund’s performance results, portfolio composition and investment strategies. The Board compared the Fund’s investment performance to that of the Fund’s peer universe and its benchmark index. The Board’s review included comparative performance data for the one-, three- and five-year periods ended December 31, 2023. This performance data indicated that the Fund had underperformed the median of its peer universe and its benchmark index for the one-, three- and five-year periods ended December 31, 2023. The Board took into account management’s discussion of the Fund’s performance. Based upon its review, the Board concluded that the Fund’s performance was satisfactory relative to the performance of its peer universe and its benchmark index.
Calvert
Emerging Markets Equity Fund
September 30, 2024
Board of Directors' Contract Approval — continued
Management Fees and Expenses
In considering the Fund’s fees and expenses, the Board compared the Fund’s fees and total expense ratio with those of comparable funds in its expense group. Among other findings, the data indicated that the Fund’s advisory and administrative fees (after taking into account waivers and/or reimbursements) (referred to collectively as “management fees”) and the Fund’s total expenses (net of waivers and/or reimbursements) were each below the respective median of the Fund’s expense group. The Board took into account the Adviser’s and Sub-Adviser’s current undertaking to maintain expense limitations for the Fund and that the Adviser and Sub-Adviser were waiving and/or reimbursing a portion of the Fund’s expenses. Based upon its review, the Board concluded that the management and sub-advisory fees were reasonable in view of the nature, extent and quality of services provided by the Adviser and Sub-Adviser, respectively.
Profitability and Other “Fall-Out” Benefits
The Board reviewed the Adviser’s profitability in regard to the Fund and the Calvert Funds in the aggregate. In reviewing the overall profitability of the Fund to the Adviser, the Board also considered the fact that the Adviser and its affiliates provided sub-transfer agency support, administrative and distribution services to the Fund for which they received compensation. The information considered by the Board included the profitability of the Fund to the Adviser and its affiliates without regard to any marketing support or other payments by the Adviser and its affiliates to third parties in respect of distribution services. The Board also considered that the Adviser and its affiliates derived benefits to their reputation and other indirect benefits from their relationships with the Fund. Because the Adviser pays the Sub-Adviser’s sub-advisory fee out of its advisory fee and the sub-advisory fee was negotiated at arm’s length by the Adviser, the profitability of the Fund to the Sub-Adviser was not a material factor in the Board’s deliberations concerning the continuation of the investment sub-advisory agreement. Based upon its review, the Board concluded that the level of profitability of the Adviser and its affiliates from their relationships with the Fund was reasonable.
Economies of Scale
The Board considered the effect of the Fund’s current size and its potential growth on its performance and fees. The Board also took into account the breakpoints in the advisory fee schedule for the Fund that would reduce the advisory fee rate on assets above specific asset levels. Because the Adviser pays the Sub-Adviser’s sub-advisory fee out of its advisory fee and the sub-advisory fee was negotiated at arm’s length by the Adviser, the Board did not consider the potential economies of scale from the Sub-Adviser’s management of the Fund to be a material factor in the Board’s deliberations concerning the continuation of the investment sub-advisory agreement, although the Board noted that the sub-advisory fee schedule contained breakpoints. The Board noted that if the Fund’s assets increased over time, the Fund might realize other economies of scale if assets increased proportionally more than certain other expenses.
This Page Intentionally Left Blank
Calvert
International Equity Fund
Annual Financial Statements and
Additional Information
September 30, 2024
This report must be preceded or accompanied by a current summary prospectus or prospectus. Before investing, investors should consider carefully the investment objective, risks, and charges and expenses of a mutual fund. This and other important information is contained in the prospectus and/or statement of additional information, which can be obtained by calling 1-800-368-2745 or from a financial intermediary. Prospective investors should read the prospectus carefully before investing.
Annual Financial Statements and Additional Information September 30, 2024
Calvert
International Equity Fund
Calvert
International Equity Fund
September 30, 2024
| Security | Shares | Value |
| Australia — 2.8% | |
| CSL Ltd. | | 159,170 | $ 31,441,421 |
| | | | $ 31,441,421 |
| Belgium — 2.4% | |
| KBC Group NV(1) | | 337,402 | $ 26,843,019 |
| | | | $ 26,843,019 |
| Denmark — 5.1% | |
| Coloplast AS, Class B | | 148,734 | $ 19,386,804 |
| Novo Nordisk AS, Class B | | 319,554 | 37,902,786 |
| | | | $57,289,590 |
| France — 13.3% | |
| L'Oreal SA | | 53,045 | $23,792,624 |
| LVMH Moet Hennessy Louis Vuitton SE | | 41,262 | 31,642,816 |
| Safran SA | | 127,181 | 29,928,591 |
| Sanofi SA(1) | | 280,931 | 32,346,158 |
| Schneider Electric SE | | 114,407 | 30,158,561 |
| | | | $147,868,750 |
| Germany — 7.4% | |
| Infineon Technologies AG | | 704,781 | $24,743,377 |
| Sartorius AG, PFC Shares | | 63,200 | 17,770,531 |
| Siemens AG | | 196,934 | 39,841,294 |
| | | | $82,355,202 |
| Hong Kong — 3.4% | |
| AIA Group Ltd. | | 4,366,857 | $38,135,140 |
| | | | $38,135,140 |
| India — 2.3% | |
| HDFC Bank Ltd. | | 1,253,547 | $25,815,209 |
| | | | $25,815,209 |
| Japan — 8.7% | |
| Kao Corp. | | 396,206 | $19,583,118 |
| Keyence Corp. | | 52,625 | 25,221,162 |
| Nihon M&A Center Holdings, Inc. | | 1,568,190 | 7,162,763 |
| Recruit Holdings Co. Ltd. | | 355,120 | 21,574,389 |
| Tokyo Electron Ltd. | | 128,464 | 22,909,708 |
| | | | $96,451,140 |
| Netherlands — 7.2% | |
| ASML Holding NV | | 53,164 | $44,224,996 |
| IMCD NV(1) | | 206,916 | 35,944,361 |
| | | | $80,169,357 |
| Singapore — 2.6% | |
| DBS Group Holdings Ltd. | | 958,549 | $28,386,769 |
| | | | $28,386,769 |
| Security | Shares | Value |
| South Africa — 1.1% | |
| Vodacom Group Ltd. | | 1,871,720 | $ 11,880,811 |
| | | | $ 11,880,811 |
| Spain — 9.1% | |
| Amadeus IT Group SA(1) | | 426,158 | $ 30,863,417 |
| Banco Santander SA(1) | | 5,388,042 | 27,607,574 |
| Iberdrola SA | | 2,747,392 | 42,472,274 |
| | | | $ 100,943,265 |
| Sweden — 1.7% | |
| Indutrade AB | | 593,260 | $18,462,214 |
| | | | $18,462,214 |
| Switzerland — 8.5% | |
| Lonza Group AG | | 31,132 | $19,755,843 |
| Nestle SA | | 557,017 | 55,975,984 |
| Straumann Holding AG | | 116,526 | 19,060,767 |
| | | | $94,792,594 |
| Taiwan — 1.0% | |
| Taiwan Semiconductor Manufacturing Co. Ltd. ADR | | 66,828 | $11,606,019 |
| | | | $11,606,019 |
| United Kingdom — 23.1% | |
| Ashtead Group PLC | | 311,813 | $24,159,518 |
| AstraZeneca PLC | | 271,072 | 42,229,332 |
| Compass Group PLC | | 1,206,594 | 38,683,026 |
| Halma PLC | | 841,934 | 29,438,614 |
| HSBC Holdings PLC | | 1,182,376 | 10,607,116 |
| InterContinental Hotels Group PLC | | 209,689 | 22,835,157 |
| London Stock Exchange Group PLC | | 244,626 | 33,491,979 |
| Reckitt Benckiser Group PLC | | 583,557 | 35,704,466 |
| RELX PLC | | 417,412 | 19,708,658 |
| | | | $256,857,866 |
Total Common Stocks
(identified cost $887,549,877) | | | $1,109,298,366 |
| Security | Shares | Value |
| Venture Capital — 0.0% | |
| Bioceptive, Inc.: | | | |
| Series A(2)(3)(4) | | 582,574 | $ 0 |
| Series B(2)(3)(4) | | 40,523 | 0 |
| FINAE, Series D(2)(3)(4) | | 2,597,442 | 0 |
Total Preferred Stocks
(identified cost $491,304) | | | $ 0 |
1
See Notes to Financial Statements.
Calvert
International Equity Fund
September 30, 2024
Schedule of Investments — continued
| Venture Capital Limited Partnership Interests — 0.1% |
| Security | | | Value |
| Africa Renewable Energy Fund LP(2)(3)(4) | | | $ 758,271 |
| gNet Defta Development Holding LLC(2)(3)(4)(5) | | | 117,627 |
| SEAF India International Growth Fund LP(2)(3)(4) | | | 0 |
Total Venture Capital Limited Partnership Interests
(identified cost $1,592,782) | | | $ 875,898 |
| Short-Term Investments — 3.4% |
| Affiliated Fund — 1.6% |
| Security | Shares | Value |
| Morgan Stanley Institutional Liquidity Funds - Government Portfolio, Institutional Class, 4.83%(6) | | 18,415,052 | $ 18,415,052 |
Total Affiliated Fund
(identified cost $18,415,052) | | | $ 18,415,052 |
| Securities Lending Collateral — 1.8% |
| Security | Shares | Value |
| State Street Navigator Securities Lending Government Money Market Portfolio, 5.02%(7) | | 19,804,259 | $ 19,804,259 |
Total Securities Lending Collateral
(identified cost $19,804,259) | | | $ 19,804,259 |
Total Short-Term Investments
(identified cost $38,219,311) | | | $ 38,219,311 |
| | | |
Total Investments — 103.2%
(identified cost $927,853,274) | | $1,148,393,575 |
| Other Assets, Less Liabilities — (3.2)% | | $ (35,689,080) |
| Net Assets — 100.0% | | $1,112,704,495 |
| The percentage shown for each investment category in the Schedule of Investments is based on net assets. |
| (1) | All or a portion of this security was on loan at September 30, 2024. The aggregate market value of securities on loan at September 30, 2024 was $18,413,231. |
| (2) | For fair value measurement disclosure purposes, security is categorized as Level 3 (see Note 1A). |
| (3) | Non-income producing security. |
| (4) | Restricted security. Total market value of restricted securities amounts to $875,898, which represents 0.1% of the net assets of the Fund as of September 30, 2024. |
| (5) | May be deemed to be an affiliated company (see Note 7). |
| (6) | May be deemed to be an affiliated investment company. The rate shown is the annualized seven-day yield as of September 30, 2024. |
| (7) | Represents investment of cash collateral received in connection with securities lending. |
2
See Notes to Financial Statements.
Calvert
International Equity Fund
September 30, 2024
Schedule of Investments — continued
At September 30, 2024, the concentration of the Fund’s investments in the various sectors, determined as a percentage of net assets, was as follows:
| Economic Sectors | % of Net Assets |
| Health Care | 19.8% |
| Industrials | 19.8 |
| Financials | 17.8 |
| Information Technology | 14.2 |
| Consumer Staples | 12.1 |
| Consumer Discretionary | 11.1 |
| Utilities | 3.8 |
| Communication Services | 1.1 |
| Venture Capital | 0.1 |
| Total | 99.8% |
Restricted Securities
| Description | Acquisition Dates | Cost |
| Africa Renewable Energy Fund LP | 4/17/14-5/13/19 | $997,005 |
| Bioceptive, Inc., Series A | 10/26/12-12/18/13 | 252,445 |
| Bioceptive, Inc., Series B | 1/7/16 | 16,250 |
| FINAE, Series D | 2/28/11-11/16/15 | 222,609 |
| gNet Defta Development Holding LLC | 8/30/05 | 400,000 |
| SEAF India International Growth Fund LP | 3/22/05-5/24/10 | 195,777 |
| Abbreviations: |
| ADR | – American Depositary Receipt |
| PFC Shares | – Preference Shares |
3
See Notes to Financial Statements.
Calvert
International Equity Fund
September 30, 2024
Statement of Assets and Liabilities
| | September 30, 2024 |
| Assets | |
Investments in securities of unaffiliated issuers, at value (identified cost $909,038,222) - including
$18,413,231 of securities on loan | $1,129,860,896 |
| Investments in securities of affiliated issuers, at value (identified cost $18,815,052) | 18,532,679 |
| Cash | 1,696,473 |
| Receivable for investments sold | 7,407,501 |
| Receivable for capital shares sold | 834,196 |
| Dividends receivable | 606,376 |
| Dividends receivable - affiliated | 18,191 |
| Securities lending income receivable | 1,986 |
| Tax reclaims receivable | 1,849,644 |
| Receivable from affiliates | 38,216 |
| Directors' deferred compensation plan | 139,709 |
| Total assets | $1,160,985,867 |
| Liabilities | |
| Payable for investments purchased | $24,210,750 |
| Payable for capital shares redeemed | 663,085 |
| Payable for foreign capital gains taxes | 680,882 |
| Deposits for securities loaned | 19,804,259 |
| Payable to affiliates: | |
| Investment advisory fee | 594,070 |
| Administrative fee | 108,057 |
| Distribution and service fees | 41,625 |
| Sub-transfer agency fee | 18,848 |
| Directors' deferred compensation plan | 139,709 |
| Accrued expenses | 331,077 |
| Other liabilities | 1,689,010 |
| Total liabilities | $48,281,372 |
| Commitments and contingent liabilities (Note 10) | |
| Net Assets | $1,112,704,495 |
| Sources of Net Assets | |
| Paid-in capital | $888,924,951 |
| Distributable earnings | 223,779,544 |
| Net Assets | $1,112,704,495 |
| Class A Shares | |
| Net Assets | $187,575,320 |
| Shares Outstanding | 7,565,206 |
Net Asset Value and Redemption Price Per Share
(net assets ÷ shares of beneficial interest outstanding) | $24.79 |
Maximum Offering Price Per Share
(100 ÷ 94.75 of net asset value per share) | $26.16 |
| Class C Shares | |
| Net Assets | $4,473,411 |
| Shares Outstanding | 216,609 |
Net Asset Value and Offering Price Per Share*
(net assets ÷ shares of beneficial interest outstanding) | $20.65 |
4
See Notes to Financial Statements.
Calvert
International Equity Fund
September 30, 2024
Statement of Assets and Liabilities — continued
| | September 30, 2024 |
| Class I Shares | |
| Net Assets | $740,642,080 |
| Shares Outstanding | 27,705,867 |
Net Asset Value, Offering Price and Redemption Price Per Share
(net assets ÷ shares of beneficial interest outstanding) | $26.73 |
| Class R6 Shares | |
| Net Assets | $180,013,684 |
| Shares Outstanding | 6,750,241 |
Net Asset Value, Offering Price and Redemption Price Per Share
(net assets ÷ shares of beneficial interest outstanding) | $26.67 |
| On sales of $50,000 or more, the offering price of Class A shares is reduced. |
| * | Redemption price per share is equal to the net asset value less any applicable contingent deferred sales charge. |
5
See Notes to Financial Statements.
Calvert
International Equity Fund
September 30, 2024
| | Year Ended |
| | September 30, 2024 |
| Investment Income | |
| Dividend income (net of foreign taxes withheld of $2,004,175) | $21,580,165 |
| Dividend income - affiliated issuers | 396,584 |
| Non-cash dividend income | 1,940,187 |
| Interest income | 150,590 |
| Interest income - affiliated issuers | 2,713 |
| Securities lending income, net | 112,209 |
| Total investment income | $24,182,448 |
| Expenses | |
| Investment advisory fee | $6,745,346 |
| Administrative fee | 1,224,526 |
| Distribution and service fees: | |
| Class A | 443,700 |
| Class C | 45,696 |
| Directors' fees and expenses | 62,523 |
| Custodian fees | 91,702 |
| Transfer agency fees and expenses | 880,660 |
| Accounting fees | 231,086 |
| Professional fees | 118,244 |
| Registration fees | 76,049 |
| Reports to shareholders | 78,720 |
| Miscellaneous | 114,461 |
| Total expenses | $10,112,713 |
| Waiver and/or reimbursement of expenses by affiliates | $(594,522) |
| Net expenses | $9,518,191 |
| Net investment income | $14,664,257 |
| Realized and Unrealized Gain (Loss) | |
| Net realized gain (loss): | |
| Investment securities (net of foreign capital gains taxes of $54,473) | $(1,034,287) |
| Foreign currency transactions | 90,693 |
| Net realized loss | $(943,594) |
| Change in unrealized appreciation (depreciation): | |
| Investment securities (including net increase in payable for foreign capital gains taxes of $488,380) | $226,759,528 |
| Investment securities - affiliated issuers | (15,649) |
| Foreign currency | 151,628 |
| Net change in unrealized appreciation (depreciation) | $226,895,507 |
| Net realized and unrealized gain | $225,951,913 |
| Net increase in net assets from operations | $240,616,170 |
6
See Notes to Financial Statements.
Calvert
International Equity Fund
September 30, 2024
Statements of Changes in Net Assets
| | Year Ended September 30, |
| | 2024 | 2023 |
| Increase (Decrease) in Net Assets | | |
| From operations: | | |
| Net investment income | $14,664,257 | $11,574,837 |
| Net realized loss | (943,594) | (4,401,697) |
| Net change in unrealized appreciation (depreciation) | 226,895,507 | 119,169,074 |
| Net increase in net assets from operations | $240,616,170 | $126,342,214 |
| Distributions to shareholders: | | |
| Class A | $(1,437,960) | $(4,018,306) |
| Class C | (13,961) | (99,299) |
| Class I | (6,396,921) | (11,779,440) |
| Class R6 | (1,604,353) | (3,654,279) |
| Total distributions to shareholders | $(9,453,195) | $(19,551,324) |
| Capital share transactions: | | |
| Class A | $(12,749,960) | $(4,312,601) |
| Class C | (836,642) | (730,910) |
| Class I | (70,932,013) | 178,777,913 |
| Class R6 | 6,645,464 | (10,692,777) |
| Net increase (decrease) in net assets from capital share transactions | $(77,873,151) | $163,041,625 |
| Net increase in net assets | $153,289,824 | $269,832,515 |
| Net Assets | | |
| At beginning of year | $959,414,671 | $689,582,156 |
| At end of year | $1,112,704,495 | $959,414,671 |
7
See Notes to Financial Statements.
Calvert
International Equity Fund
September 30, 2024
| | Class A |
| | Year Ended September 30, |
| | 2024 | 2023 | 2022 | 2021 | 2020 |
| Net asset value — Beginning of year | $19.82 | $17.07 | $25.06 | $20.35 | $18.18 |
| Income (Loss) From Operations | | | | | |
| Net investment income(1) | $0.28 | $0.21 | $0.25 | $0.08 | $0.06 |
| Net realized and unrealized gain (loss) | 4.87 | 3.01 | (6.64) | 4.67 | 2.30 |
| Total income (loss) from operations | $5.15 | $3.22 | $(6.39) | $4.75 | $2.36 |
| Less Distributions | | | | | |
| From net investment income | $(0.18) | $(0.18) | $(0.23) | $(0.04) | $(0.19) |
| From net realized gain | — | (0.29) | (1.37) | — | — |
| Total distributions | $(0.18) | $(0.47) | $(1.60) | $(0.04) | $(0.19) |
| Net asset value — End of year | $24.79 | $19.82 | $17.07 | $25.06 | $20.35 |
| Total Return(2) | 26.09% | 18.94% | (27.28)% | 23.38% | 13.02% |
| Ratios/Supplemental Data | | | | | |
| Net assets, end of year (000’s omitted) | $187,575 | $160,617 | $140,998 | $190,998 | $138,810 |
| Ratios (as a percentage of average daily net assets):(3) | | | | | |
| Total expenses | 1.20% | 1.20% | 1.22% | 1.20% | 1.27% |
| Net expenses | 1.14%(4) | 1.14%(4) | 1.14%(4) | 1.14% | 1.14% |
| Net investment income | 1.25% | 1.01% | 1.15% | 0.34% | 0.33% |
| Portfolio Turnover | 23% | 35% | 32% | 38% | 47% |
| (1) | Computed using average shares outstanding. |
| (2) | Returns are historical and are calculated by determining the percentage change in net asset value with all distributions reinvested and do not reflect the effect of sales charges, if any. |
| (3) | Total expenses do not reflect amounts reimbursed and/or waived by the adviser and certain of its affiliates, if applicable. Net expenses are net of all reductions and represent the net expenses paid by the Fund. |
| (4) | Includes a reduction by the investment adviser of a portion of its advisory fee due to the Fund’s investment in the Liquidity Fund (equal to less than 0.005% of average daily net assets for the years ended September 30, 2024, 2023 and 2022). |
8
See Notes to Financial Statements.
Calvert
International Equity Fund
September 30, 2024
Financial Highlights — continued
| | Class C |
| | Year Ended September 30, |
| | 2024 | 2023 | 2022 | 2021 | 2020 |
| Net asset value — Beginning of year | $16.55 | $14.31 | $21.28 | $17.37 | $15.54 |
| Income (Loss) From Operations | | | | | |
| Net investment income (loss)(1) | $0.09 | $0.04 | $0.06 | $(0.09) | $(0.07) |
| Net realized and unrealized gain (loss) | 4.06 | 2.54 | (5.57) | 4.00 | 1.96 |
| Total income (loss) from operations | $4.15 | $2.58 | $(5.51) | $3.91 | $1.89 |
| Less Distributions | | | | | |
| From net investment income | $(0.05) | $(0.05) | $(0.09) | $ — | $(0.06) |
| From net realized gain | — | (0.29) | (1.37) | — | — |
| Total distributions | $(0.05) | $(0.34) | $(1.46) | $ — | $(0.06) |
| Net asset value — End of year | $20.65 | $16.55 | $14.31 | $21.28 | $17.37 |
| Total Return(2) | 25.14% | 18.05% | (27.85)% | 22.51% | 12.17% |
| Ratios/Supplemental Data | | | | | |
| Net assets, end of year (000’s omitted) | $4,473 | $4,297 | $4,304 | $7,485 | $6,157 |
| Ratios (as a percentage of average daily net assets):(3) | | | | | |
| Total expenses | 1.95% | 1.96% | 1.96% | 1.95% | 2.02% |
| Net expenses | 1.89%(4) | 1.89%(4) | 1.89%(4) | 1.89% | 1.89% |
| Net investment income (loss) | 0.49% | 0.25% | 0.32% | (0.42)% | (0.43)% |
| Portfolio Turnover | 23% | 35% | 32% | 38% | 47% |
| (1) | Computed using average shares outstanding. |
| (2) | Returns are historical and are calculated by determining the percentage change in net asset value with all distributions reinvested and do not reflect the effect of sales charges, if any. |
| (3) | Total expenses do not reflect amounts reimbursed and/or waived by the adviser and certain of its affiliates, if applicable. Net expenses are net of all reductions and represent the net expenses paid by the Fund. |
| (4) | Includes a reduction by the investment adviser of a portion of its advisory fee due to the Fund’s investment in the Liquidity Fund (equal to less than 0.005% of average daily net assets for the years ended September 30, 2024, 2023 and 2022). |
9
See Notes to Financial Statements.
Calvert
International Equity Fund
September 30, 2024
Financial Highlights — continued
| | Class I |
| | Year Ended September 30, |
| | 2024 | 2023 | 2022 | 2021 | 2020 |
| Net asset value — Beginning of year | $21.35 | $18.35 | $26.83 | $21.77 | $19.43 |
| Income (Loss) From Operations | | | | | |
| Net investment income(1) | $0.35 | $0.29 | $0.31 | $0.16 | $0.13 |
| Net realized and unrealized gain (loss) | 5.26 | 3.23 | (7.13) | 5.00 | 2.45 |
| Total income (loss) from operations | $5.61 | $3.52 | $(6.82) | $5.16 | $2.58 |
| Less Distributions | | | | | |
| From net investment income | $(0.23) | $(0.23) | $(0.29) | $(0.10) | $(0.24) |
| From net realized gain | — | (0.29) | (1.37) | — | — |
| Total distributions | $(0.23) | $(0.52) | $(1.66) | $(0.10) | $(0.24) |
| Net asset value — End of year | $26.73 | $21.35 | $18.35 | $26.83 | $21.77 |
| Total Return(2) | 26.41% | 19.27% | (27.14)% | 23.75% | 13.31% |
| Ratios/Supplemental Data | | | | | |
| Net assets, end of year (000’s omitted) | $740,642 | $656,696 | $416,978 | $524,521 | $279,039 |
| Ratios (as a percentage of average daily net assets):(3) | | | | | |
| Total expenses | 0.95% | 0.95% | 0.96% | 0.95% | 1.02% |
| Net expenses | 0.89%(4) | 0.89%(4) | 0.89%(4) | 0.89% | 0.89% |
| Net investment income | 1.47% | 1.32% | 1.32% | 0.63% | 0.61% |
| Portfolio Turnover | 23% | 35% | 32% | 38% | 47% |
| (1) | Computed using average shares outstanding. |
| (2) | Returns are historical and are calculated by determining the percentage change in net asset value with all distributions reinvested and do not reflect the effect of sales charges, if any. |
| (3) | Total expenses do not reflect amounts reimbursed and/or waived by the adviser and certain of its affiliates, if applicable. Net expenses are net of all reductions and represent the net expenses paid by the Fund. |
| (4) | Includes a reduction by the investment adviser of a portion of its advisory fee due to the Fund’s investment in the Liquidity Fund (equal to less than 0.005% of average daily net assets for the years ended September 30, 2024, 2023 and 2022). |
10
See Notes to Financial Statements.
Calvert
International Equity Fund
September 30, 2024
Financial Highlights — continued
| | Class R6 |
| | Year Ended September 30, |
| | 2024 | 2023 | 2022 | 2021 | 2020 |
| Net asset value — Beginning of year | $21.31 | $18.33 | $26.80 | $21.76 | $19.44 |
| Income (Loss) From Operations | | | | | |
| Net investment income(1) | $0.37 | $0.29 | $0.32 | $0.16 | $0.13 |
| Net realized and unrealized gain (loss) | 5.24 | 3.23 | (7.11) | 5.00 | 2.46 |
| Total income (loss) from operations | $5.61 | $3.52 | $(6.79) | $5.16 | $2.59 |
| Less Distributions | | | | | |
| From net investment income | $(0.25) | $(0.25) | $(0.31) | $(0.12) | $(0.27) |
| From net realized gain | — | (0.29) | (1.37) | — | — |
| Total distributions | $(0.25) | $(0.54) | $(1.68) | $(0.12) | $(0.27) |
| Net asset value — End of year | $26.67 | $21.31 | $18.33 | $26.80 | $21.76 |
| Total Return(2) | 26.46% | 19.27% | (27.08)% | 23.79% | 13.34% |
| Ratios/Supplemental Data | | | | | |
| Net assets, end of year (000’s omitted) | $180,014 | $137,804 | $127,303 | $160,163 | $122,150 |
| Ratios (as a percentage of average daily net assets):(3) | | | | | |
| Total expenses | 0.91% | 0.92% | 0.92% | 0.91% | 0.98% |
| Net expenses | 0.85%(4) | 0.85%(4) | 0.85%(4) | 0.85% | 0.85% |
| Net investment income | 1.54% | 1.29% | 1.38% | 0.63% | 0.64% |
| Portfolio Turnover | 23% | 35% | 32% | 38% | 47% |
| (1) | Computed using average shares outstanding. |
| (2) | Returns are historical and are calculated by determining the percentage change in net asset value with all distributions reinvested and do not reflect the effect of sales charges, if any. |
| (3) | Total expenses do not reflect amounts reimbursed and/or waived by the adviser and certain of its affiliates, if applicable. Net expenses are net of all reductions and represent the net expenses paid by the Fund. |
| (4) | Includes a reduction by the investment adviser of a portion of its advisory fee due to the Fund’s investment in the Liquidity Fund (equal to less than 0.005% of average daily net assets for the years ended September 30, 2024, 2023 and 2022). |
11
See Notes to Financial Statements.
Calvert
International Equity Fund
September 30, 2024
Notes to Financial Statements
1 Significant Accounting Policies
Calvert International Equity Fund (the Fund) is a diversified series of Calvert World Values Fund, Inc. (the Corporation). The Corporation is a Maryland corporation registered under the Investment Company Act of 1940, as amended (the 1940 Act), as an open-end management investment company. The investment objective of the Fund is to seek to provide a high total return consistent with reasonable risk by investing primarily in a diversified portfolio of stocks. The Fund invests primarily in equity securities of foreign companies.
The Fund offers four classes of shares. Class A shares are generally sold subject to a sales charge imposed at time of purchase. A contingent deferred sales charge of 1.00% may apply to certain redemptions of Class A shares for accounts for which no sales charge was paid, if redeemed within 12 months of purchase. Class C shares are sold without a front-end sales charge, and with certain exceptions, are charged a contingent deferred sales charge of 1.00% on shares redeemed within 12 months of purchase. Class C shares are only available for purchase through a financial intermediary. Effective November 5, 2020, Class C shares automatically convert to Class A shares eight years after their purchase as described in the Fund’s prospectus. Class I and Class R6 shares are sold at net asset value, are not subject to a sales charge and are sold only to certain eligible investors. Each class represents a pro rata interest in the Fund, but votes separately on class-specific matters and is subject to different expenses.
The Fund applies the accounting and reporting guidance in the Financial Accounting Standards Board (FASB) Accounting Standards Codification Topic 946, Financial Services – Investment Companies (ASC 946). Subsequent events, if any, through the date that the financial statements were issued have been evaluated in the preparation of the financial statements.
A Investment Valuation— Net asset value per share is determined every business day as of the close of the regular session of the New York Stock Exchange (generally 4:00 p.m. Eastern time). The Fund uses independent pricing services approved by the Board of Directors (the Board) to value its investments wherever possible. Investments for which market quotations are not available or deemed not reliable are fair valued in good faith by the
Board’s valuation designee.
U.S. generally accepted accounting principles (U.S. GAAP) establishes a disclosure hierarchy that categorizes the inputs to valuation techniques used to value assets and liabilities at measurement date. These inputs are summarized in the three broad levels listed below:
Level 1 - quoted prices in active markets for identical securities
Level 2 - other significant observable inputs (including quoted prices for similar securities, interest rates, prepayment speeds, credit risk, etc.)
Level 3 - significant unobservable inputs (including the Fund’s own assumptions in determining the fair value of investments)
The inputs or methodologies used for valuing securities are not necessarily an indication of the risk associated with investing in those securities.
Valuation techniques used to value the Fund’s investments by major category are as follows:
Equity Securities. Equity securities (including warrants and rights) listed on a U.S. securities exchange generally are valued at the last sale or closing price as reported by an independent pricing service on the primary market or exchange on which they are traded and are categorized as Level 1 in the hierarchy. Equity securities listed on the NASDAQ National Market System are valued at the NASDAQ official closing price and are categorized as Level 1 in the hierarchy. Unlisted or listed securities for which closing sales prices or closing quotations are not available are valued at the mean between the latest available bid and ask prices and are categorized as Level 2 in the hierarchy. The daily valuation of exchange-traded foreign securities generally is determined as of the close of trading on the principal exchange on which such securities trade. Events occurring after the close of trading on foreign exchanges may result in adjustments to the valuation of foreign securities to more accurately reflect their fair value as of the close of regular trading on the New York Stock Exchange. When valuing foreign equity securities that meet certain criteria, the Fund’s Board has approved the use of a fair value service that values such securities to reflect market trading that occurs after the close of the applicable foreign markets of comparable securities or other instruments that have a strong correlation to the fair-valued securities. Such securities are categorized as Level 2 in the hierarchy.
Venture Capital Securities. Venture capital securities for which market quotations are not readily available are generally categorized as Level 3 in the hierarchy. Venture capital equity securities are generally valued using the most appropriate and applicable method to measure fair value in light of each company’s situation. Methods may include market, income, options-pricing or cost approaches with discounts as appropriate based on assumptions of liquidation or exit risk. Examples of the market approach are subsequent rounds of financing, comparable transactions, and revenue times an industry multiple. An example of the income approach is the discounted cash flow model. Examples of the cost approach are replacement cost, salvage value, or net asset value. The options-pricing method treats common stock and preferred stock as call options on the enterprise value with strike price based on the preferred stock liquidation preference. Venture capital limited partnership interests are valued at the fair value reported by the general partner of the partnership, adjusted as necessary to reflect subsequent capital calls and distributions and any other available information. In some cases, adjustments may be made to account for daily pricing of material public holdings within the partnership.
Other Securities. Investments in management investment companies (including money market funds) that do not trade on an exchange are valued at the net asset value as of the close of each business day and are categorized as Level 1 in the hierarchy.
Calvert
International Equity Fund
September 30, 2024
Notes to Financial Statements — continued
Fair Valuation. In connection with Rule 2a-5 of the 1940 Act, the Board has designated the Fund’s investment adviser as its valuation designee. Investments for which valuations or market quotations are not readily available or are deemed unreliable are valued by the investment adviser, as valuation designee, at fair value using methods that most fairly reflect the security’s “fair value”, which is the amount that the Fund might reasonably expect to receive for the security upon its current sale in the ordinary course. Each such determination is based on a consideration of relevant factors, which are likely to vary from one pricing context to another. These factors may include, but are not limited to, the type of security, the existence of any contractual restrictions on the security’s disposition, the price and extent of public trading in similar securities of the issuer or of comparable companies or entities, quotations or relevant information obtained from broker/dealers or other market participants, information obtained from the issuer, analysts, and/or the appropriate stock exchange (for exchange-traded securities), an analysis of the company’s or entity’s financial statements, and an evaluation of the forces that influence the issuer and the market(s) in which the security is purchased and sold.
The values assigned to fair value investments are based on available information and do not necessarily represent amounts that might ultimately be realized. Further, due to the inherent uncertainty of valuations of such investments, the fair values may differ significantly from the values that would have been used had an active market existed, and the differences could be material.
The following table summarizes the market value of the Fund's holdings as of September 30, 2024, based on the inputs used to value them:
| Asset Description | Level 1 | Level 2 | Level 3(1) | Total |
| Common Stocks: | | | | |
| Australia | $ — | $31,441,421 | $ — | $31,441,421 |
| Belgium | — | 26,843,019 | — | 26,843,019 |
| Denmark | — | 57,289,590 | — | 57,289,590 |
| France | — | 147,868,750 | — | 147,868,750 |
| Germany | — | 82,355,202 | — | 82,355,202 |
| Hong Kong | — | 38,135,140 | — | 38,135,140 |
| India | — | 25,815,209 | — | 25,815,209 |
| Japan | — | 96,451,140 | — | 96,451,140 |
| Netherlands | — | 80,169,357 | — | 80,169,357 |
| Singapore | — | 28,386,769 | — | 28,386,769 |
| South Africa | — | 11,880,811 | — | 11,880,811 |
| Spain | — | 100,943,265 | — | 100,943,265 |
| Sweden | — | 18,462,214 | — | 18,462,214 |
| Switzerland | — | 94,792,594 | — | 94,792,594 |
| Taiwan | 11,606,019 | — | — | 11,606,019 |
| United Kingdom | — | 256,857,866 | — | 256,857,866 |
| Total Common Stocks | $11,606,019 | $1,097,692,347(2) | $ — | $1,109,298,366 |
| Preferred Stocks - Venture Capital | $ — | $ — | $0 | $0 |
| Venture Capital Limited Partnership Interests | — | — | 875,898 | 875,898 |
| Short-Term Investments: | | | | |
| Affiliated Fund | 18,415,052 | — | — | 18,415,052 |
| Securities Lending Collateral | 19,804,259 | — | — | 19,804,259 |
| Total Investments | $49,825,330 | $1,097,692,347 | $875,898 | $1,148,393,575 |
| (1) | None of the unobservable inputs for Level 3 assets, individually or collectively, had a material impact on the Fund. |
| (2) | Includes foreign equity securities whose values were adjusted to reflect market trading of comparable securities or other correlated instruments that occurred after the close of trading in their applicable foreign markets. |
Level 3 investments at the beginning and/or end of the period in relation to net assets were not significant and accordingly, a reconciliation of Level 3 assets for the year ended September 30, 2024 is not presented.
B Investment Transactions and Income— Investment transactions for financial statement purposes are accounted for on trade date. Realized gains and losses are recorded on an identified cost basis and may include proceeds from litigation. Dividend income is recorded on the ex-dividend date for dividends
Calvert
International Equity Fund
September 30, 2024
Notes to Financial Statements — continued
received in cash and/or securities or, in the case of dividends on certain foreign securities, as soon as the Fund is informed of the ex-dividend date. Non-cash dividends are recorded at the fair value of the securities received. Withholding taxes on foreign dividends, if any, have been provided for in accordance with the Fund’s understanding of the applicable country’s tax rules and rates. In consideration of recent decisions rendered by European courts, the Fund has filed additional tax reclaims for previously withheld taxes on dividends earned in certain European Union countries (the "EU reclaims"). These filings are subject to various administrative and judicial proceedings within these countries. Due to the uncertainty as to the ultimate resolution of these proceedings, the likelihood of receipt of these EU reclaims, and the potential timing of payment, the EU reclaims are recorded as income only when the likelihood of their receipt becomes certain. Distributions received that represent a return of capital are recorded as a reduction of cost of investments. Distributions received that represent a capital gain are recorded as a realized gain. Interest income, which includes amortization of premium and accretion of discount on debt securities, is accrued as earned.
C Share Class Accounting— Realized and unrealized gains and losses and net investment income and losses, other than class-specific expenses, are allocated daily to each class of shares based upon the relative net assets of each class to the total net assets of the Fund. Expenses arising in connection with a specific class are charged directly to that class. Sub-accounting, recordkeeping and similar administrative fees payable to financial intermediaries, which are a component of transfer agency fees and expenses on the Statement of Operations, are not allocated to Class R6 shares.
D Foreign Currency Transactions— The Fund’s accounting records are maintained in U.S. dollars. For valuation of assets and liabilities on each date of net asset value determination, foreign denominations are converted into U.S. dollars using the current exchange rate. Security transactions, income and expenses are translated at the prevailing rate of exchange on the date of the event. Recognized gains or losses on investment transactions attributable to changes in foreign currency exchange rates are recorded for financial statement purposes as net realized gains and losses on investments. That portion of unrealized gains and losses on investments that results from fluctuations in foreign currency exchange rates is not separately disclosed.
E Restricted Securities— The Fund may invest in securities that are subject to legal or contractual restrictions on resale. Generally, these securities may only be sold publicly upon registration under the Securities Act of 1933 or in transactions exempt from such registration. Information regarding restricted securities (excluding Rule 144A securities) is included at the end of the Schedule of Investments.
F Distributions to Shareholders— Distributions to shareholders are recorded by the Fund on ex-dividend date. Distributions from net investment income and distributions from net realized capital gains, if any, are paid at least annually. Distributions are declared separately for each class of shares. Distributions are determined in accordance with income tax regulations, which may differ from U.S. GAAP; accordingly, periodic reclassifications are made within the Fund's capital accounts to reflect income and gains available for distribution under income tax regulations.
G Estimates— The preparation of financial statements in conformity with U.S. GAAP requires management to make estimates and assumptions that affect the reported amounts of assets and liabilities and disclosure of contingent assets and liabilities at the date of the financial statements and the reported amounts of increases and decreases in net assets from operations during the reporting period. Actual results could differ from those estimates.
H Indemnifications— The Corporation’s By-Laws provide for indemnification for Directors or officers of the Corporation and certain other parties, to the fullest extent permitted by Maryland law and the 1940 Act, provided certain conditions are met. Additionally, in the normal course of business, the Fund enters into agreements with service providers that may contain indemnification clauses. The Fund’s maximum exposure under these arrangements is unknown as this would involve future claims that may be made against the Fund that have not yet occurred.
I Federal Income Taxes— No provision for federal income or excise tax is required since the Fund intends to continue to qualify as a regulated investment company under the Internal Revenue Code and to distribute substantially all of its taxable earnings.
In addition to the requirements of the Internal Revenue Code, the Fund may also be subject to local taxes on the recognition of capital gains in certain countries. In determining the daily net asset value, the Fund estimates the accrual for such taxes, if any, based on the unrealized appreciation on certain portfolio securities and the related tax rates. Taxes attributable to unrealized appreciation are included in the change in unrealized appreciation (depreciation) on investments. Capital gains taxes on securities sold are included in net realized gain (loss) on investments.
Management has analyzed the Fund's tax positions taken for all open federal income tax years and has concluded that no provision for federal income tax is required in the Fund's financial statements. A Fund's federal tax return is subject to examination by the Internal Revenue Service for a period of three years from the date of filing.
Calvert
International Equity Fund
September 30, 2024
Notes to Financial Statements — continued
2 Related Party Transactions
The investment advisory fee is earned by Calvert Research and Management (CRM), an indirect, wholly-owned subsidiary of Morgan Stanley, as compensation for investment advisory services rendered to the Fund. The investment advisory fee is computed at an annual rate as a percentage of the Fund’s average daily net assets as follows and is payable monthly:
| Average Daily Net Assets | Annual Fee
Rate |
| Up to and including $250 million | 0.680% |
| Over $250 million up to and including $500 million | 0.665% |
| Over $500 million | 0.650% |
For the year ended September 30, 2024, the investment advisory fee amounted to $6,745,346 or 0.66% of the Fund’s average daily net assets.
Pursuant to an investment sub-advisory agreement, CRM has delegated the investment management of the Fund to Eaton Vance Advisers International Ltd. (EVAIL), an affiliate of CRM and an indirect, wholly-owned subsidiary of Morgan Stanley. CRM pays EVAIL a portion of its investment advisory fee for sub-advisory services provided to the Fund.
The Fund may invest in a money market fund, the Institutional Class of the Morgan Stanley Institutional Liquidity Funds - Government Portfolio (the “Liquidity Fund”), an open-end management investment company managed by Morgan Stanley Investment Management Inc., a wholly-owned subsidiary of Morgan Stanley. The investment advisory fee paid by the Fund is reduced by an amount equal to its pro rata share of the advisory and administration fees paid by the Fund due to its investment in the Liquidity Fund. For the year ended September 30, 2024, the investment advisory fee paid was reduced by $10,671 relating to the Fund’s investment in the Liquidity Fund.
CRM and EVAIL have agreed to reimburse the Fund’s operating expenses to the extent that total annual operating expenses (relating to ordinary operating expenses only and excluding expenses such as brokerage commissions, acquired fund fees and expenses of unaffiliated funds, borrowing costs, taxes or litigation expenses) exceed 1.14%, 1.89%, 0.89% and 0.85% for Class A, Class C, Class I and Class R6, respectively, of such class’s average daily net assets. The expense reimbursement agreement may be changed or terminated after February 1, 2025. For the year ended September 30, 2024, CRM and EVAIL waived and/or reimbursed expenses in total of $583,851.
The administrative fee is earned by CRM as compensation for administrative services rendered to the Fund. The fee is computed at an annual rate of 0.12% of the Fund’s average daily net assets attributable to Class A, Class C, Class I and Class R6 and is payable monthly. For the year ended September 30, 2024, CRM was paid administrative fees of $1,224,526.
The Fund has in effect a distribution plan for Class A shares (Class A Plan) pursuant to Rule 12b-1 under the 1940 Act. Pursuant to the Class A Plan, the Fund pays Eaton Vance Distributors, Inc. (EVD), an affiliate of CRM and the Fund’s principal underwriter, a distribution and service fee of 0.25% per annum of its average daily net assets attributable to Class A shares for distribution services and facilities provided to the Fund by EVD, as well as for personal services and/or the maintenance of shareholder accounts. The Fund also has in effect a distribution plan for Class C shares (Class C Plan) pursuant to Rule 12b-1 under the 1940 Act. Pursuant to the Class C Plan, the Fund pays EVD amounts equal to 0.75% per annum of its average daily net assets attributable to Class C shares for providing ongoing distribution services and facilities to the Fund. In addition, pursuant to the Class C Plan, the Fund also makes payments of service fees to EVD, financial intermediaries and other persons in amounts equal to 0.25% per annum of its average daily net assets attributable to that class. Service fees paid or accrued are for personal services and/or the maintenance of shareholder accounts. Distribution and service fees paid or accrued for the year ended September 30, 2024 amounted to $443,700 and $45,696 for Class A shares and Class C shares, respectively.
The Fund was informed that EVD received $12,318 as its portion of the sales charge on sales of Class A shares for the year ended September 30, 2024. The Fund was also informed that EVD received less than $100 and $203 of contingent deferred sales charges (CDSC) paid by Class A and Class C shareholders, respectively, for the same period.
Eaton Vance Management (EVM), an affiliate of CRM, provides sub-transfer agency and related services to the Fund pursuant to a Sub-Transfer Agency Support Services Agreement. For the year ended September 30, 2024, sub-transfer agency fees and expenses incurred to EVM amounted to $77,131 and are included in transfer agency fees and expenses on the Statement of Operations.
Each Director of the Fund who is not an employee of CRM or its affiliates receives an annual fee of $225,000 ($214,000 prior to January 1, 2024), an annual Committee fee ranging from $8,500 to $16,500 depending on the Committee, and may receive a fee of $10,000 for special meetings. The Board chair receives an additional $40,000 annual fee, Committee chairs receive an additional $15,000 annual fee and the special equities liaison receives an additional $2,500 annual fee. Eligible Directors may participate in a Deferred Compensation Plan (the Plan). Amounts deferred under the Plan are treated as though equal dollar amounts had been invested in shares of the Fund or other Calvert funds selected by the Directors. The Fund purchases shares of the
Calvert
International Equity Fund
September 30, 2024
Notes to Financial Statements — continued
funds selected equal to the dollar amounts deferred under the Plan, resulting in an asset equal to the deferred compensation liability. Obligations of the Plan are paid solely from the Fund's assets. Directors’ fees are allocated to each of the Calvert funds served. Salaries and fees of officers and Directors of the Fund who are employees of CRM or its affiliates are paid by CRM.
3 Investment Activity
During the year ended September 30, 2024, the cost of purchases and proceeds from sales of investments, other than short-term securities, were $229,281,683 and $294,812,011, respectively.
4 Distributions to Shareholders and Income Tax Information
The tax character of distributions declared for the years ended September 30, 2024 and September 30, 2023 was as follows:
| | Year Ended September 30, |
| | 2024 | 2023 |
| Ordinary income | $9,453,195 | $9,815,591 |
| Long-term capital gains | $ — | $9,735,733 |
During the year ended September 30, 2024, distributable earnings was decreased by $1,938,017 and paid-in capital was increased by $1,938,017 due to the Fund's use of equalization accounting and investment in partnerships. Tax equalization accounting allows the Fund to treat as a distribution that portion of redemption proceeds representing a redeeming shareholder’s portion of undistributed taxable income and net capital gains. These reclassifications had no effect on the net assets or net asset value per share of the Fund.
As of September 30, 2024, the components of distributable earnings (accumulated loss) on a tax basis were as follows:
| Undistributed ordinary income | $12,260,078 |
| Deferred capital losses | (4,744,829) |
| Net unrealized appreciation | 216,264,295 |
| Distributable earnings | $223,779,544 |
At September 30, 2024, the Fund, for federal income tax purposes, had deferred capital losses of $4,744,829 which would reduce the Fund’s taxable income arising from future net realized gains on investment transactions, if any, to the extent permitted by the Internal Revenue Code, and thus would reduce the amount of distributions to shareholders, which would otherwise be necessary to relieve the Fund of any liability for federal income or excise tax. The deferred capital losses are treated as arising on the first day of the Fund’s next taxable year, can be carried forward for an unlimited period, and retain the same short-term or long-term character as when originally deferred. Of the deferred capital losses at September 30, 2024, $4,744,829 are long-term.
The cost and unrealized appreciation (depreciation) of investments of the Fund at September 30, 2024, as determined on a federal income tax basis, were as follows:
| Aggregate cost | $931,548,824 |
| Gross unrealized appreciation | $249,263,474 |
| Gross unrealized depreciation | (32,418,723) |
| Net unrealized appreciation | $216,844,751 |
Calvert
International Equity Fund
September 30, 2024
Notes to Financial Statements — continued
5 Securities Lending
To generate additional income, the Fund may lend its securities pursuant to a securities lending agency agreement with State Street Bank and Trust Company (SSBT), the securities lending agent. Security loans are subject to termination by the Fund at any time and, therefore, are not considered illiquid investments. The Fund requires that the loan be continuously collateralized by either cash or securities in an amount at least equal to the market value of the securities on loan. The market value of securities loaned is determined daily and any additional required collateral is delivered to the Fund on the next business day. Cash collateral is generally invested in a money market fund registered under the 1940 Act that is managed by an affiliate of SSBT. Any gain or loss in the market price of the loaned securities that might occur and any interest earned or dividends declared during the term of the loan would accrue to the account of the Fund. Income earned on the investment of collateral, net of broker rebates and other expenses incurred by the securities lending agent, is split between the Fund and the securities lending agent based on agreed upon contractual terms. Non-cash collateral, if any, is held by the lending agent on behalf of the Fund and cannot be sold or re-pledged by the Fund; accordingly, such collateral is not reflected in the Statement of Assets and Liabilities.
The risks associated with lending portfolio securities include, but are not limited to, possible delays in receiving additional collateral or in the recovery of the loaned securities, possible loss of rights to the collateral should the borrower fail financially, as well as risk of loss in the value of the collateral or the value of the investments made with the collateral. The securities lending agent shall indemnify the Fund in the case of default of any securities borrower.
At September 30, 2024, the total value of securities on loan was $18,413,231 and the total value of collateral received was $19,804,259, comprised of cash.
The following table provides a breakdown of securities lending transactions accounted for as secured borrowings, the obligations by class of collateral pledged, and the remaining contractual maturity of those transactions as of September 30, 2024.
| | Remaining Contractual Maturity of the Transactions |
| | Overnight and
Continuous | <30 days | 30 to 90 days | >90 days | Total |
| Common Stocks | $19,804,259 | $ — | $ — | $ — | $19,804,259 |
The carrying amount of the liability for deposits for securities loaned at September 30, 2024 approximated its fair value. If measured at fair value, such liability would have been considered as Level 2 in the fair value hierarchy (see Note 1A) at September 30, 2024.
6 Line of Credit
The Fund participates with other portfolios and funds managed by EVM and its affiliates, including CRM, in a $650 million unsecured revolving line of credit agreement with a group of banks, which is in effect through October 22, 2024. In connection with the renewal of the agreement on
October 24, 2023, the borrowing limit was decreased from $725 million. Borrowings are made by the Fund solely for temporary purposes related to redemptions and other short-term cash needs. Interest is charged to the Fund based on its borrowings generally at an amount above either the Secured Overnight Financing Rate (SOFR) or Federal Funds rate. In addition, a fee computed at an annual rate of 0.15% on the daily unused portion of the line of credit is allocated among the participating portfolios and funds at the end of each quarter. In connection with the renewal of the agreement in October 2023, an arrangement fee of $150,000 was incurred that was allocated to the participating portfolios and funds. Because the line of credit is not available exclusively to the Fund, it may be unable to borrow some or all of its requested amounts at any particular time.
The Fund had no borrowings outstanding pursuant to its line of credit at September 30, 2024. The Fund did not have any significant borrowings or allocated fees during the year ended September 30, 2024. Effective October 22, 2024, the Fund renewed its line of credit agreement, which expires October 21, 2025, at substantially the same terms.
7 Affiliated Investments
During the year ended September 30, 2024, the Fund had invested a portion of its assets in notes (the Notes) issued by Calvert Impact Capital, Inc. (CIC) pursuant to exemptive relief granted by the U.S. Securities and Exchange Commission (the SEC). There are certain potential points of affiliation between the Fund and CIC. CRM has licensed use of the Calvert name to CIC and provides other types of support. An officer of CRM's affiliate serves on the CIC Board.
Calvert
International Equity Fund
September 30, 2024
Notes to Financial Statements — continued
In addition to the Notes, the Fund may also invest in companies that are considered affiliated companies because the Fund has a direct or indirect ownership of, control of, or voting power of 5 percent or more of the outstanding voting shares of the company, or the company is under common ownership or control with the Fund. At September 30, 2024, the value of the Fund's investment in the Notes and affiliated companies and in funds that may be deemed to be affiliated was $18,532,679, which represents 1.7% of the Fund's net assets. Transactions in such investments by the Fund for the year ended September 30, 2024 were as follows:
| Name | Value,
beginning
of period | Purchases | Sales
proceeds | Net
realized
gain
(loss) | Change in
unrealized
appreciation
(depreciation) | Value,
end of
period | Interest/
Dividend
income | Principal amount/
Shares,
end of period |
| High Social Impact Investments | | | | | | | | |
| Calvert Impact Capital, Inc., Community Investment Notes, 1.50%, 12/15/23 | $ 867,935 | $ — | $ (880,000) | $ — | $ 12,065 | $ — | $ 2,713 | $ — |
| Venture Capital Limited Partnership Interests | | | | | | | | |
| gNet Defta Development Holding LLC(1) | 145,341 | — | — | — | (27,714) | 117,627 | — | — |
| Short-Term Investments | | | | | | |
| Liquidity Fund | 7,548,628 | 211,600,741 | (200,734,317) | — | — | 18,415,052 | 396,584 | 18,415,052 |
| Total | | | | $ — | $(15,649) | $18,532,679 | $399,297 | |
8 Capital Shares
The Corporation may issue its shares in one or more series (such as the Fund). The authorized shares of the Fund consist of 75,000,000 common shares, $0.01 par value, for each Class.
Transactions in capital shares, including direct exchanges pursuant to share class conversions, were as follows:
| | Year Ended
September 30, 2024 | | Year Ended
September 30, 2023 |
| | Shares | Amount | | Shares | Amount |
| Class A | | | | | |
| Shares sold | 1,014,993 | $21,715,684 | | 1,627,476 | $32,626,642 |
| Reinvestment of distributions | 59,642 | 1,306,148 | | 196,712 | 3,796,530 |
| Shares redeemed | (1,613,155) | (35,771,792) | | (1,980,900) | (40,735,773) |
| Net decrease | (538,520) | $(12,749,960) | | (156,712) | $(4,312,601) |
| Class C | | | | | |
| Shares sold | 23,827 | $413,729 | | 39,906 | $699,293 |
| Reinvestment of distributions | 757 | 13,896 | | 6,124 | 99,270 |
| Shares redeemed | (67,663) | (1,264,267) | | (87,140) | (1,529,473) |
| Net decrease | (43,079) | $(836,642) | | (41,110) | $(730,910) |
| Class I | | | | | |
| Shares sold | 8,784,910 | $209,257,343 | | 16,519,520 | $367,228,547 |
| Reinvestment of distributions | 260,912 | 6,149,693 | | 548,376 | 11,378,808 |
| Shares redeemed | (12,099,563) | (286,339,049) | | (9,027,376) | (199,829,442) |
| Net increase (decrease) | (3,053,741) | $(70,932,013) | | 8,040,520 | $178,777,913 |
Calvert
International Equity Fund
September 30, 2024
Notes to Financial Statements — continued
| | Year Ended
September 30, 2024 | | Year Ended
September 30, 2023 |
| | Shares | Amount | | Shares | Amount |
| Class R6 | | | | | |
| Shares sold | 1,518,027 | $36,249,865 | | 923,606 | $20,282,526 |
| Reinvestment of distributions | 63,130 | 1,483,558 | | 165,668 | 3,429,334 |
| Shares redeemed | (1,298,722) | (31,087,959) | | (1,568,237) | (34,404,637) |
| Net increase (decrease) | 282,435 | $6,645,464 | | (478,963) | $(10,692,777) |
9 Risks and Uncertainties
Risks Associated with Foreign Investments
Foreign investments can be adversely affected by political, economic and market developments abroad, including the imposition of economic and other sanctions by the United States or another country, and by acts of terrorism and war. There may be less publicly available information about foreign issuers because they may not be subject to reporting practices, requirements or regulations comparable to those to which United States companies are subject. Foreign markets may be smaller, less liquid and more volatile than the major markets in the United States. Trading in foreign markets typically involves higher expense than trading in the United States. The Fund may have difficulties enforcing its legal or contractual rights in a foreign country. Securities that trade or are denominated in currencies other than the U.S. dollar may be adversely affected by fluctuations in currency exchange rates.
10 Capital Commitments
In connection with certain venture capital and/or limited partnership investments, the Fund is committed to future capital calls, which will increase the Fund’s investment in these securities. The aggregate amount of the future capital commitments totaled $17,500 at September 30, 2024. The Fund had sufficient cash and/or securities to cover these commitments.
The Fund's unfunded capital commitments by investment at September 30, 2024 were as follows:
| Name of Investment | Unfunded
Commitment |
| SEAF India International Growth Fund LP | $17,500 |
| Total | $17,500 |
Calvert
International Equity Fund
September 30, 2024
Report of Independent Registered Public Accounting Firm
To the Board of Directors of Calvert World Values Fund, Inc. and Shareholders of Calvert International Equity Fund:
Opinion on the Financial Statements and Financial Highlights
We have audited the accompanying statement of assets and liabilities of Calvert International Equity Fund (the "Fund") (one of the funds constituting Calvert World Values Fund, Inc.), including the schedule of investments, as of September 30, 2024, the related statement of operations for the year then ended, the statements of changes in net assets for each of the two years in the period then ended, the financial highlights for each of the four years in the period then ended, and the related notes. In our opinion, the financial statements and financial highlights present fairly, in all material respects, the financial position of the Fund as of September 30, 2024, and the results of its operations for the year then ended, the changes in its net assets for each of the two years in the period then ended, and the financial highlights for each of the four years in the period then ended, in conformity with accounting principles generally accepted in the United States of America. The financial highlights for the year ended September 30, 2020 were audited by other auditors whose report, dated November 20, 2020, expressed an unqualified opinion on those financial highlights.
Basis for Opinion
These financial statements and financial highlights are the responsibility of the Fund's management. Our responsibility is to express an opinion on the Fund's financial statements and financial highlights based on our audits. We are a public accounting firm registered with the Public Company Accounting Oversight Board (United States) (PCAOB) and are required to be independent with respect to the Fund in accordance with the U.S. federal securities laws and the applicable rules and regulations of the Securities and Exchange Commission and the PCAOB.
We conducted our audits in accordance with the standards of the PCAOB. Those standards require that we plan and perform the audit to obtain reasonable assurance about whether the financial statements and financial highlights are free of material misstatement, whether due to error or fraud. The Fund is not required to have, nor were we engaged to perform, an audit of its internal control over financial reporting. As part of our audits, we are required to obtain an understanding of internal control over financial reporting but not for the purpose of expressing an opinion on the effectiveness of the Fund’s internal control over financial reporting. Accordingly, we express no such opinion.
Our audits included performing procedures to assess the risks of material misstatement of the financial statements and financial highlights, whether due to error or fraud, and performing procedures that respond to those risks. Such procedures included examining, on a test basis, evidence regarding the amounts and disclosures in the financial statements and financial highlights. Our audits also included evaluating the accounting principles used and significant estimates made by management, as well as evaluating the overall presentation of the financial statements and financial highlights. Our procedures included confirmation of securities owned as of September 30, 2024, by correspondence with the custodian and brokers; when replies were not received from brokers, we performed other auditing procedures. We believe that our audits provide a reasonable basis for our opinion.
/s/ Deloitte & Touche LLP
Boston, Massachusetts
November 21, 2024
We have served as the auditor of one or more Calvert investment companies since 2021.
Calvert
International Equity Fund
September 30, 2024
Federal Tax Information (Unaudited)
The Form 1099-DIV you receive in February 2025 will show the tax status of all distributions paid to your account in calendar year 2024. Shareholders are advised to consult their own tax adviser with respect to the tax consequences of their investment in the Fund. As required by the Internal Revenue Code and/or regulations, shareholders must be notified regarding the status of qualified dividend income for individuals and the foreign tax credit.
Qualified Dividend Income. For the fiscal year ended September 30, 2024, the Fund designates approximately $22,869,988, or up to the maximum amount of such dividends allowable pursuant to the Internal Revenue Code, as qualified dividend income eligible for the reduced tax rate of 15%.
Foreign Tax Credit. For the fiscal year ended September 30, 2024, the Fund paid foreign taxes of $2,014,657 and recognized foreign source income of $25,314,641.
Calvert
International Equity Fund
September 30, 2024
Board of Directors' Contract Approval
Overview of the Contract Review Process
The Investment Company Act of 1940, as amended, provides, in substance, that each investment advisory agreement between a fund and its investment adviser will continue in effect from year to year only if its continuation is approved at least annually by the fund’s board of directors, including by a vote of a majority of the directors who are not “interested persons” of the fund (“Independent Directors”), cast in person at a meeting called for the purpose of considering such approval.
At an in-person meeting of the Boards of Trustees/Directors (each a “Board”) of the registered investment companies advised by Calvert Research and Management (“CRM” or the “Adviser”) (the “Calvert Funds”) held on June 10-11, 2024, the Board, including a majority of the Independent Directors, voted to approve continuation of existing investment advisory and investment sub-advisory agreements for the Calvert Funds for an additional one-year period.
In evaluating the investment advisory and investment sub-advisory agreements for the Calvert Funds, the Board considered a variety of information relating to the Calvert Funds and various service providers, including the Adviser. The Independent Directors reviewed a report prepared by the Adviser regarding various services provided to the Calvert Funds by the Adviser and its affiliates. Such report included, among other data, information regarding the Adviser’s personnel and the Adviser’s revenue and cost of providing services to the Calvert Funds, and a separate report prepared by an independent data provider, which compared each fund’s investment performance, fees and expenses to those of comparable funds as identified by such independent data provider (“comparable funds”).
The Independent Directors were separately represented by independent legal counsel with respect to their consideration of the continuation of the investment advisory and investment sub-advisory agreements for the Calvert Funds. Prior to voting, the Independent Directors reviewed the proposed continuation of the Calvert Funds’ investment advisory and investment sub-advisory agreements with management and also met in private sessions with their counsel at which time no representatives of management were present.
The information that the Board considered included, among other things, the following (for funds that invest through one or more affiliated underlying fund(s), references to “each fund” in this section may include information that was considered at the underlying fund-level):
Information about Fees, Performance and Expenses
| • | A report from an independent data provider comparing the advisory and related fees paid by each fund with fees paid by comparable funds; |
| • | A report from an independent data provider comparing each fund’s total expense ratio and its components to comparable funds; |
| • | A report from an independent data provider comparing the investment performance of each fund to the investment performance of comparable funds over various time periods; |
| • | Data regarding investment performance in comparison to benchmark indices; |
| • | For each fund, comparative information concerning the fees charged and the services provided by the Adviser in managing other accounts (including mutual funds, other collective investment funds and institutional accounts) using investment strategies and techniques similar to those used in managing such fund; |
| • | Profitability analyses for the Adviser with respect to each fund; |
Information about Portfolio Management and Trading
| • | Descriptions of the investment management services provided to each fund, including investment strategies and processes it employs; |
| • | Information about the Adviser’s policies and practices with respect to trading, including the Adviser’s processes for monitoring best execution of portfolio transactions; |
| • | Information about the allocation of brokerage transactions and the benefits received by the Adviser as a result of brokerage allocation, including information concerning the acquisition of research through client commission arrangements and policies with respect to “soft dollars”; |
Information about the Adviser
| • | Reports detailing the financial results and condition of CRM; |
| • | Descriptions of the qualifications, education and experience of the individual investment professionals whose responsibilities include portfolio management and investment research for the funds, and information relating to their compensation and responsibilities with respect to managing other mutual funds and investment accounts; |
| • | Policies and procedures relating to proxy voting and the handling of corporate actions and class actions; |
| • | A description of CRM’s procedures for overseeing sub-advisers, including with respect to regulatory and compliance issues, investment management and other matters; |
Calvert
International Equity Fund
September 30, 2024
Board of Directors' Contract Approval — continued
Other Relevant Information
| • | Information concerning the nature, cost and character of the administrative and other non-investment advisory services provided by CRM and its affiliates; and |
| • | The terms of each investment advisory agreement. |
Over the course of the year, the Board and its committees held regular quarterly meetings. During these meetings, the Directors participated in investment and performance reviews with the portfolio managers and other investment professionals of the Adviser relating to each fund and considered various investment and trading strategies used in pursuing each fund’s investment objective(s), such as the use of derivative instruments, as well as risk management techniques. The Board and its committees also evaluated issues pertaining to industry and regulatory developments, compliance procedures, corporate governance and other issues with respect to the funds and received and participated in reports and presentations provided by CRM and its affiliates with respect to such matters. In addition to the formal meetings of the Board and its committees, the Independent Directors held regular video conferences in between meetings to discuss, among other topics, matters relating to the continuation of the Calvert Funds’ investment advisory and investment sub-advisory agreements.
For funds that invest through one or more affiliated underlying funds, the Board considered similar information about the underlying fund(s) when considering the approval of investment advisory agreements. In addition, in cases where the Adviser has engaged a sub-adviser, the Board considered similar information about the sub-adviser when considering the approval of any investment sub-advisory agreement.
The Independent Directors were assisted throughout the contract review process by their independent legal counsel. The Independent Directors relied upon the advice of such counsel and their own business judgment in determining the material factors to be considered in evaluating each investment advisory and investment sub-advisory agreement and the weight to be given to each such factor. The Board, including the Independent Directors, did not identify any single factor as controlling, and each Director may have attributed different weight to various factors.
Results of the Contract Review Process
Based on its consideration of the foregoing, and such other information as it deemed relevant, including the factors and conclusions described below, the Board, including the Independent Directors, concluded that the continuation of the investment advisory agreement of Calvert International Equity Fund (the “Fund”), and the investment sub-advisory agreement with Eaton Vance Advisers International Ltd. (the “Sub-Adviser”), an affiliate of CRM, including the fees payable under each agreement, is in the best interests of the Fund’s shareholders. Accordingly, the Board, including a majority of the Independent Directors, voted to approve the continuation of the investment advisory agreement and the investment sub-advisory agreement of the Fund.
Nature, Extent and Quality of Services
In considering the nature, extent and quality of the services provided by the Adviser and Sub-Adviser under the investment advisory agreement and investment sub-advisory agreement, respectively, the Board reviewed information relating to the Adviser’s and Sub-Adviser’s operations and personnel, including, among other information, biographical information on the Sub-Adviser’s investment personnel and descriptions of the Adviser’s organizational and management structure. The Board also took into account similar information provided periodically throughout the previous year by the Adviser and Sub-Adviser as well as the Board’s familiarity with the Adviser and Sub-Adviser through Board meetings, discussions and other reports. With respect to the Adviser, the Board considered the Adviser’s responsibilities overseeing the Sub-Adviser and the business-related and other risks to which the Adviser or its affiliates may be subject in managing the Fund. With respect to the Sub-Adviser, the Board took into account the resources available to the Sub-Adviser in fulfilling its duties under the investment sub-advisory agreement and the Sub-Adviser’s experience in managing the Fund. The Board also noted that it reviewed on a quarterly basis information regarding the Adviser’s and Sub-Adviser’s compliance with applicable policies and procedures, including those related to personal investing. The Board took into account, among other items, periodic reports received from the Adviser over the past year concerning the Adviser’s ongoing review and enhancement of certain processes, policies and procedures of the Calvert Funds and the Adviser. The Board concluded that it was satisfied with the nature, extent and quality of services provided to the Fund by the Adviser and the Sub-Adviser under the investment advisory agreement and investment sub-advisory agreement, respectively.
Fund Performance
In considering the Fund’s performance, the Board noted that it reviewed on a quarterly basis detailed information about the Fund’s performance results, portfolio composition and investment strategies. The Board compared the Fund’s investment performance to that of the Fund’s peer universe and its benchmark index. The Board’s review included comparative performance data for the one-, three- and five-year periods ended December 31, 2023. This performance data indicated that the Fund had underperformed the median of the Fund’s peer universe for the one-year period ended December 31, 2023, while it had outperformed the median of its peer universe for the three- and five-year periods ended December 31, 2023. This performance data also
Calvert
International Equity Fund
September 30, 2024
Board of Directors' Contract Approval — continued
indicated that the Fund had underperformed its benchmark index for the one-, and three -year periods ended December 31, 2023, while it had outperformed its benchmark index for the five-year period ended December 31, 2023. The Board took into account management’s discussion of the Fund’s performance. Based upon its review, the Board concluded that the Fund’s performance was satisfactory relative to the performance of its peer universe and its benchmark index.
Management Fees and Expenses
In considering the Fund’s fees and expenses, the Board compared the Fund’s fees and total expense ratio with those of comparable funds in its expense group. Among other findings, the data indicated that the Fund’s advisory and administrative fees (after taking into account waivers and/or reimbursements) (referred to collectively as “management fees”) and the Fund’s total expenses (net of waivers and/or reimbursements) were each below the median of the Fund’s expense group. The Board took into account the Adviser’s and Sub-Adviser’s current undertaking to maintain expense limitations for the Fund and that the Adviser and Sub-Adviser were waiving and/or reimbursing a portion of the Fund’s expenses. Based upon its review, the Board concluded that the management and sub-advisory fees were reasonable in view of the nature, extent and quality of services provided by the Adviser and Sub-Adviser, respectively.
Profitability and Other “Fall-Out” Benefits
The Board reviewed the Adviser’s profitability in regard to the Fund and the Calvert Funds in the aggregate. In reviewing the overall profitability of the Fund to the Adviser, the Board also considered the fact that the Adviser and its affiliates, including the Sub-Adviser, provided sub-advisory, sub-transfer agency support, administrative and distribution services to the Fund for which they received compensation. The information considered by the Board included the profitability of the Fund to the Adviser and its affiliates without regard to any marketing support or other payments by the Adviser and its affiliates to third parties in respect of distribution services. The Board also considered that the Adviser and its affiliates, including the Sub-Adviser, derived benefits to their reputation and other indirect benefits from their relationships with the Fund. Because the Adviser pays the Sub-Adviser’s sub-advisory fee out of its advisory fee, the profitability of the Fund to the Sub-Adviser was not a material factor in the Board’s deliberations concerning the continuation of the investment sub-advisory agreement. Based upon its review, the Board concluded that the level of profitability of the Adviser and its affiliates, including the Sub-Adviser, from their relationships with the Fund was reasonable.
Economies of Scale
The Board considered the effect of the Fund’s current size and its potential growth on its performance and fees. The Board also took into account the breakpoints in the advisory fee schedule for the Fund that would reduce the advisory fee rate on assets above specific asset levels. Because the Adviser pays the Sub-Adviser’s sub-advisory fee out of its advisory fee, the Board did not consider the potential economies of scale from the Sub-Adviser’s management of the Fund to be a material factor in the Board’s deliberations concerning the continuation of the investment sub-advisory agreement, although the Board noted that the sub-advisory fee schedule contained breakpoints. The Board noted that if the Fund’s assets increased over time, the Fund might realize other economies of scale if assets increased proportionally more than certain other expenses.
Calvert
International Opportunities Fund
Annual Financial Statements and
Additional Information
September 30, 2024
This report must be preceded or accompanied by a current summary prospectus or prospectus. Before investing, investors should consider carefully the investment objective, risks, and charges and expenses of a mutual fund. This and other important information is contained in the prospectus and/or statement of additional information, which can be obtained by calling 1-800-368-2745 or from a financial intermediary. Prospective investors should read the prospectus carefully before investing.
Annual Financial Statements and Additional Information September 30, 2024
Calvert
International Opportunities Fund
Calvert
International Opportunities Fund
September 30, 2024
| Security | Shares | Value |
| Australia — 8.0% | |
| BlueScope Steel Ltd.(1) | | 113,792 | $ 1,737,026 |
| CAR Group Ltd. | | 290,561 | 7,515,762 |
| Data#3 Ltd.(1) | | 796,411 | 4,173,017 |
| Dexus(1) | | 810,701 | 4,229,970 |
| Dicker Data Ltd.(1) | | 536,939 | 3,492,423 |
| EBOS Group Ltd.(1) | | 217,511 | 5,003,057 |
| Steadfast Group Ltd. | | 1,127,591 | 4,413,675 |
| | | | $ 30,564,930 |
| Austria — 1.2% | |
| BAWAG Group AG(2) | | 57,764 | $4,475,376 |
| | | | $4,475,376 |
| Belgium — 2.5% | |
| Azelis Group NV(1) | | 225,574 | $4,942,371 |
| KBC Group NV | | 31,056 | 2,470,752 |
| VGP NV(1) | | 21,881 | 2,240,857 |
| | | | $9,653,980 |
| Canada — 4.0% | |
| Agnico Eagle Mines Ltd.(1) | | 30,405 | $2,449,351 |
| ATS Corp.(3) | | 141,417 | 4,103,075 |
| Descartes Systems Group, Inc.(3) | | 33,733 | 3,471,198 |
| Lumine Group, Inc.(3)(4) | | 56,066 | 1,309,982 |
| TMX Group Ltd.(1) | | 122,326 | 3,834,078 |
| | | | $15,167,684 |
| France — 1.3% | |
| IPSOS SA | | 77,138 | $4,854,883 |
| | | | $4,854,883 |
| Germany — 3.0% | |
| Jenoptik AG | | 121,130 | $3,738,932 |
| LEG Immobilien SE(3) | | 28,577 | 2,991,828 |
| Sartorius AG, PFC Shares(3) | | 6,163 | 1,732,908 |
| Schott Pharma AG & Co. KGaA | | 89,826 | 3,071,180 |
| | | | $11,534,848 |
| Ireland — 0.8% | |
| Kerry Group PLC, Class A | | 30,262 | $3,135,996 |
| | | | $3,135,996 |
| Italy — 7.7% | |
| Amplifon SpA(1) | | 146,475 | $4,215,635 |
| BFF Bank SpA(2) | | 443,331 | 4,864,839 |
| DiaSorin SpA(1) | | 17,617 | 2,059,893 |
| FinecoBank Banca Fineco SpA(1) | | 278,071 | 4,772,238 |
| Interpump Group SpA | | 96,036 | 4,486,363 |
| Moncler SpA | | 70,320 | 4,470,709 |
| Security | Shares | Value |
| Italy (continued) | |
| Reply SpA(1) | | 29,125 | $ 4,392,028 |
| | | | $ 29,261,705 |
| Japan — 26.2% | |
| As One Corp.(1) | | 245,127 | $ 4,965,402 |
| Asahi Intecc Co. Ltd.(1) | | 241,201 | 4,243,520 |
| Azbil Corp.(1) | | 441,416 | 3,587,760 |
| BayCurrent, Inc.(1) | | 164,926 | 6,056,367 |
| Chiba Bank Ltd.(1) | | 670,127 | 5,447,008 |
| Cosmos Pharmaceutical Corp. | | 92,934 | 4,815,645 |
| Daiseki Co. Ltd.(1) | | 178,679 | 4,679,102 |
| dip Corp.(1) | | 166,081 | 3,292,321 |
| Fukuoka Financial Group, Inc.(1) | | 203,690 | 5,274,074 |
| Goldwin, Inc.(1) | | 73,299 | 4,246,594 |
| Hoshino Resorts REIT, Inc.(1) | | 1,040 | 3,556,927 |
| Hoshizaki Corp. | | 132,216 | 4,604,531 |
| JMDC, Inc.(1) | | 80,840 | 2,632,050 |
| LaSalle Logiport REIT(1) | | 4,131 | 4,127,644 |
| Miura Co. Ltd. | | 115,470 | 2,847,301 |
| NOF Corp. | | 326,192 | 5,633,882 |
| Riken Keiki Co. Ltd.(1) | | 194,188 | 5,240,163 |
| Sanwa Holdings Corp. | | 239,967 | 6,388,532 |
| SUMCO Corp.(1) | | 358,141 | 3,873,632 |
| T Hasegawa Co. Ltd.(1) | | 100,378 | 2,300,631 |
| Tosei Corp. | | 286,114 | 4,607,214 |
| Toyo Suisan Kaisha Ltd. | | 46,294 | 3,039,432 |
| USS Co. Ltd. | | 443,977 | 4,214,216 |
| | | | $99,673,948 |
| Luxembourg — 0.2% | |
| APERAM SA | | 27,653 | $866,856 |
| | | | $866,856 |
| Netherlands — 5.2% | |
| BE Semiconductor Industries NV(1) | | 21,062 | $2,686,258 |
| Euronext NV(2) | | 58,649 | 6,366,174 |
| IMCD NV | | 35,675 | 6,197,274 |
| NN Group NV(1) | | 56,631 | 2,825,665 |
| Topicus.com, Inc. | | 17,270 | 1,629,633 |
| | | | $19,705,004 |
| New Zealand — 0.6% | |
| Spark New Zealand Ltd.(1) | | 1,279,724 | $2,467,755 |
| | | | $2,467,755 |
| Norway — 1.7% | |
| Norsk Hydro ASA | | 123,729 | $799,290 |
| SmartCraft ASA(3) | | 1,822,876 | 5,557,473 |
| | | | $6,356,763 |
1
See Notes to Financial Statements.
Calvert
International Opportunities Fund
September 30, 2024
Schedule of Investments — continued
| Security | Shares | Value |
| Portugal — 0.6% | |
| NOS SGPS SA | | 541,603 | $ 2,203,536 |
| | | | $ 2,203,536 |
| Singapore — 1.0% | |
| Daiwa House Logistics Trust(1) | | 7,856,214 | $ 3,941,671 |
| | | | $ 3,941,671 |
| Spain — 1.9% | |
| Acciona SA(1) | | 29,947 | $ 4,248,778 |
| Inmobiliaria Colonial Socimi SA(1) | | 443,591 | 3,074,263 |
| | | | $7,323,041 |
| Sweden — 4.5% | |
| AddTech AB, Class B | | 131,683 | $3,947,732 |
| Boliden AB | | 38,213 | 1,296,908 |
| Indutrade AB | | 133,275 | 4,147,510 |
| Lagercrantz Group AB, Class B | | 150,357 | 2,834,713 |
| Sdiptech AB, Class B(3) | | 167,375 | 4,914,504 |
| | | | $17,141,367 |
| Switzerland — 2.2% | |
| Galenica AG(2) | | 34,002 | $2,995,775 |
| Straumann Holding AG | | 15,999 | 2,617,040 |
| VZ Holding AG | | 16,964 | 2,715,455 |
| | | | $8,328,270 |
| United Kingdom — 25.9% | |
| Allfunds Group PLC | | 402,945 | $2,479,760 |
| Ashtead Group PLC | | 45,446 | 3,521,192 |
| Compass Group PLC | | 104,330 | 3,344,787 |
| Cranswick PLC | | 64,770 | 4,353,540 |
| Diploma PLC | | 123,510 | 7,342,029 |
| DiscoverIE Group PLC | | 621,015 | 5,047,074 |
| Games Workshop Group PLC | | 41,968 | 6,037,679 |
| Grainger PLC | | 699,562 | 2,290,448 |
| Greggs PLC | | 143,485 | 6,002,867 |
| Halma PLC | | 160,509 | 5,612,272 |
| Hilton Food Group PLC | | 312,796 | 3,767,579 |
| Howden Joinery Group PLC | | 297,448 | 3,614,675 |
| InterContinental Hotels Group PLC | | 31,253 | 3,403,456 |
| Intermediate Capital Group PLC | | 88,879 | 2,654,101 |
| JTC PLC(2) | | 525,322 | 7,446,910 |
| Judges Scientific PLC(1) | | 35,028 | 4,629,142 |
| Premier Foods PLC | | 858,807 | 2,111,451 |
| Shaftesbury Capital PLC | | 1,465,176 | 2,890,236 |
| Supermarket Income Reit PLC | | 1,949,180 | 1,954,986 |
| Vistry Group PLC(3) | | 266,821 | 4,666,166 |
| Volution Group PLC | | 778,115 | 6,363,232 |
| Wise PLC, Class A(3) | | 508,743 | 4,574,435 |
| Security | Shares | Value |
| United Kingdom (continued) | |
| Zegona Communications PLC(3) | | 935,797 | $ 4,578,323 |
| | | | $ 98,686,340 |
Total Common Stocks
(identified cost $303,353,772) | | | $375,343,953 |
| Short-Term Investments — 7.5% |
| Affiliated Fund — 0.5% |
| Security | Shares | Value |
| Morgan Stanley Institutional Liquidity Funds - Government Portfolio, Institutional Class, 4.83%(5) | | 1,838,250 | $ 1,838,250 |
Total Affiliated Fund
(identified cost $1,838,250) | | | $ 1,838,250 |
| Securities Lending Collateral — 7.0% |
| Security | Shares | Value |
| State Street Navigator Securities Lending Government Money Market Portfolio, 5.02%(6) | | 26,763,236 | $ 26,763,236 |
Total Securities Lending Collateral
(identified cost $26,763,236) | | | $ 26,763,236 |
Total Short-Term Investments
(identified cost $28,601,486) | | | $ 28,601,486 |
| | | |
Total Investments — 106.0%
(identified cost $331,955,258) | | $403,945,439 |
| Other Assets, Less Liabilities — (6.0)% | | $(22,844,179) |
| Net Assets — 100.0% | | $381,101,260 |
| The percentage shown for each investment category in the Schedule of Investments is based on net assets. |
| (1) | All or a portion of this security was on loan at September 30, 2024. The aggregate market value of securities on loan at September 30, 2024 was $49,007,065. |
| (2) | Security exempt from registration under Rule 144A of the Securities Act of 1933, as amended. These securities may be sold in certain transactions in reliance on an exemption from registration (normally to qualified institutional buyers). At September 30, 2024, the aggregate value of these securities is $26,149,074 or 6.9% of the Fund's net assets. |
| (3) | Non-income producing security. |
2
See Notes to Financial Statements.
Calvert
International Opportunities Fund
September 30, 2024
Schedule of Investments — continued
| (4) | Security exempt from registration under Regulation S of the Securities Act of 1933, as amended, which exempts from registration securities offered and sold outside the United States. Security may not be offered or sold in the United States except pursuant to an exemption from, or in a transaction not subject to, the registration requirements of the Securities Act of 1933, as amended. At September 30, 2024, the aggregate value of these securities is $1,309,982 or 0.4% of the Fund's net assets. |
| (5) | May be deemed to be an affiliated investment company. The rate shown is the annualized seven-day yield as of September 30, 2024. |
| (6) | Represents investment of cash collateral received in connection with securities lending. |
At September 30, 2024, the concentration of the Fund’s investments in the various sectors, determined as a percentage of net assets, was as follows:
| Economic Sectors | % of Net Assets |
| Industrials | 23.9% |
| Financials | 17.0 |
| Information Technology | 13.5 |
| Consumer Discretionary | 9.5 |
| Real Estate | 9.4 |
| Health Care | 8.8 |
| Communication Services | 5.7 |
| Consumer Staples | 5.6 |
| Materials | 4.0 |
| Utilities | 1.1 |
| Total | 98.5% |
| Abbreviations: |
| PFC Shares | – Preference Shares |
3
See Notes to Financial Statements.
Calvert
International Opportunities Fund
September 30, 2024
Statement of Assets and Liabilities
| | September 30, 2024 |
| Assets | |
Investments in securities of unaffiliated issuers, at value (identified cost $330,117,008) - including
$49,007,065 of securities on loan | $402,107,189 |
| Investments in securities of affiliated issuers, at value (identified cost $1,838,250) | 1,838,250 |
| Receivable for investments sold | 3,780,955 |
| Receivable for capital shares sold | 571,429 |
| Dividends receivable | 986,080 |
| Dividends receivable - affiliated | 10,096 |
| Securities lending income receivable | 8,059 |
| Tax reclaims receivable | 333,646 |
| Directors' deferred compensation plan | 188,945 |
| Total assets | $409,824,649 |
| Liabilities | |
| Due to custodian - foreign currency, at value (cost $712,064) | $711,630 |
| Payable for investments purchased | 124,415 |
| Payable for capital shares redeemed | 510,635 |
| Deposits for securities loaned | 26,763,236 |
| Payable to affiliates: | |
| Investment advisory fee | 229,826 |
| Administrative fee | 36,819 |
| Distribution and service fees | 16,968 |
| Sub-transfer agency fee | 6,682 |
| Directors' deferred compensation plan | 188,945 |
| Accrued expenses | 134,233 |
| Total liabilities | $28,723,389 |
| Net Assets | $381,101,260 |
| Sources of Net Assets | |
| Paid-in capital | $350,234,547 |
| Distributable earnings | 30,866,713 |
| Net Assets | $381,101,260 |
| Class A Shares | |
| Net Assets | $69,300,820 |
| Shares Outstanding | 3,664,530 |
Net Asset Value and Redemption Price Per Share
(net assets ÷ shares of beneficial interest outstanding) | $18.91 |
Maximum Offering Price Per Share
(100 ÷ 94.75 of net asset value per share) | $19.96 |
| Class C Shares | |
| Net Assets | $3,669,988 |
| Shares Outstanding | 201,287 |
Net Asset Value and Offering Price Per Share*
(net assets ÷ shares of beneficial interest outstanding) | $18.23 |
4
See Notes to Financial Statements.
Calvert
International Opportunities Fund
September 30, 2024
Statement of Assets and Liabilities — continued
| | September 30, 2024 |
| Class I Shares | |
| Net Assets | $220,030,047 |
| Shares Outstanding | 11,907,765 |
Net Asset Value, Offering Price and Redemption Price Per Share
(net assets ÷ shares of beneficial interest outstanding) | $18.48 |
| Class R6 Shares | |
| Net Assets | $88,100,405 |
| Shares Outstanding | 4,770,997 |
Net Asset Value, Offering Price and Redemption Price Per Share
(net assets ÷ shares of beneficial interest outstanding) | $18.47 |
| On sales of $50,000 or more, the offering price of Class A shares is reduced. |
| * | Redemption price per share is equal to the net asset value less any applicable contingent deferred sales charge. |
5
See Notes to Financial Statements.
Calvert
International Opportunities Fund
September 30, 2024
| | Year Ended |
| | September 30, 2024 |
| Investment Income | |
| Dividend income (net of foreign taxes withheld of $764,743) | $8,195,348 |
| Dividend income - affiliated issuers | 188,798 |
| Interest income | 190 |
| Interest income - affiliated issuers | 1,727 |
| Securities lending income, net | 149,158 |
| Total investment income | $8,535,221 |
| Expenses | |
| Investment advisory fee | $2,789,823 |
| Administrative fee | 446,371 |
| Distribution and service fees: | |
| Class A | 162,870 |
| Class C | 35,768 |
| Directors' fees and expenses | 22,368 |
| Custodian fees | 57,687 |
| Transfer agency fees and expenses | 296,545 |
| Accounting fees | 87,019 |
| Professional fees | 57,783 |
| Registration fees | 65,461 |
| Reports to shareholders | 37,602 |
| Miscellaneous | 87,307 |
| Total expenses | $4,146,604 |
| Waiver and/or reimbursement of expenses by affiliates | $(5,399) |
| Net expenses | $4,141,205 |
| Net investment income | $4,394,016 |
| Realized and Unrealized Gain (Loss) | |
| Net realized gain (loss): | |
| Investment securities | $(5,873,701) |
| Foreign currency transactions | (12,350) |
| Net realized loss | $(5,886,051) |
| Change in unrealized appreciation (depreciation): | |
| Investment securities | $82,399,587 |
| Investment securities - affiliated issuers | 7,678 |
| Foreign currency | 39,585 |
| Net change in unrealized appreciation (depreciation) | $82,446,850 |
| Net realized and unrealized gain | $76,560,799 |
| Net increase in net assets from operations | $80,954,815 |
6
See Notes to Financial Statements.
Calvert
International Opportunities Fund
September 30, 2024
Statements of Changes in Net Assets
| | Year Ended September 30, |
| | 2024 | 2023 |
| Increase (Decrease) in Net Assets | | |
| From operations: | | |
| Net investment income | $4,394,016 | $5,834,065 |
| Net realized loss | (5,886,051) | (16,401,105) |
| Net change in unrealized appreciation (depreciation) | 82,446,850 | 62,540,868 |
| Net increase in net assets from operations | $80,954,815 | $51,973,828 |
| Distributions to shareholders: | | |
| Class A | $(989,981) | $(226,116) |
| Class C | (29,909) | — |
| Class I | (4,265,114) | (1,303,518) |
| Class R6 | (1,529,814) | (777,165) |
| Total distributions to shareholders | $(6,814,818) | $(2,306,799) |
| Capital share transactions: | | |
| Class A | $(5,475,719) | $(7,604,681) |
| Class C | (541,574) | (593,542) |
| Class I | (45,000,987) | 5,753,223 |
| Class R6 | (12,548,624) | (16,097,609) |
| Net decrease in net assets from capital share transactions | $(63,566,904) | $(18,542,609) |
| Net increase in net assets | $10,573,093 | $31,124,420 |
| Net Assets | | |
| At beginning of year | $370,528,167 | $339,403,747 |
| At end of year | $381,101,260 | $370,528,167 |
7
See Notes to Financial Statements.
Calvert
International Opportunities Fund
September 30, 2024
| | Class A |
| | Year Ended September 30, |
| | 2024 | 2023 | 2022 | 2021 | 2020 |
| Net asset value — Beginning of year | $15.51 | $13.56 | $22.54 | $18.01 | $16.18 |
| Income (Loss) From Operations | | | | | |
| Net investment income(1) | $0.17 | $0.20 | $0.21 | $0.08 | $0.07 |
| Net realized and unrealized gain (loss) | 3.49 | 1.80 | (7.63) | 4.56 | 1.95 |
| Total income (loss) from operations | $3.66 | $2.00 | $(7.42) | $4.64 | $2.02 |
| Less Distributions | | | | | |
| From net investment income | $(0.26) | $(0.05) | $(0.27) | $(0.11) | $(0.19) |
| From net realized gain | — | — | (1.29) | — | — |
| Total distributions | $(0.26) | $(0.05) | $(1.56) | $(0.11) | $(0.19) |
| Net asset value — End of year | $18.91 | $15.51 | $13.56 | $22.54 | $18.01 |
| Total Return(2) | 23.72% | 14.76% | (35.33)% | 25.83% | 12.57% |
| Ratios/Supplemental Data | | | | | |
| Net assets, end of year (000’s omitted) | $69,301 | $61,860 | $60,335 | $92,236 | $68,940 |
| Ratios (as a percentage of average daily net assets):(3) | | | | | |
| Total expenses | 1.33% | 1.31% | 1.32% | 1.30% | 1.32% |
| Net expenses | 1.33%(4) | 1.31%(4) | 1.32%(4) | 1.30% | 1.32% |
| Net investment income | 1.00% | 1.24% | 1.14% | 0.36% | 0.42% |
| Portfolio Turnover | 31% | 33% | 48% | 54% | 62% |
| (1) | Computed using average shares outstanding. |
| (2) | Returns are historical and are calculated by determining the percentage change in net asset value with all distributions reinvested and do not reflect the effect of sales charges, if any. |
| (3) | Total expenses do not reflect amounts reimbursed and/or waived by the adviser and certain of its affiliates, if applicable. Net expenses are net of all reductions and represent the net expenses paid by the Fund. |
| (4) | Includes a reduction by the investment adviser of a portion of its advisory fee due to the Fund’s investment in the Liquidity Fund (equal to less than 0.005% of average daily net assets for the years ended September 30, 2024, 2023 and 2022). |
8
See Notes to Financial Statements.
Calvert
International Opportunities Fund
September 30, 2024
Financial Highlights — continued
| | Class C |
| | Year Ended September 30, |
| | 2024 | 2023 | 2022 | 2021 | 2020 |
| Net asset value — Beginning of year | $14.96 | $13.13 | $21.87 | $17.51 | $15.74 |
| Income (Loss) From Operations | | | | | |
| Net investment income (loss)(1) | $0.04 | $0.08 | $0.07 | $(0.08) | $(0.06) |
| Net realized and unrealized gain (loss) | 3.36 | 1.75 | (7.42) | 4.44 | 1.90 |
| Total income (loss) from operations | $3.40 | $1.83 | $(7.35) | $4.36 | $1.84 |
| Less Distributions | | | | | |
| From net investment income | $(0.13) | $ — | $(0.10) | $ — | $(0.07) |
| From net realized gain | — | — | (1.29) | — | — |
| Total distributions | $(0.13) | $ — | $(1.39) | $ — | $(0.07) |
| Net asset value — End of year | $18.23 | $14.96 | $13.13 | $21.87 | $17.51 |
| Total Return(2) | 22.81% | 13.94% | (35.84)% | 24.90% | 11.68% |
| Ratios/Supplemental Data | | | | | |
| Net assets, end of year (000’s omitted) | $3,670 | $3,507 | $3,583 | $6,260 | $5,527 |
| Ratios (as a percentage of average daily net assets):(3) | | | | | |
| Total expenses | 2.08% | 2.06% | 2.07% | 2.05% | 2.08% |
| Net expenses | 2.08%(4) | 2.06%(4) | 2.07%(4) | 2.05% | 2.08% |
| Net investment income (loss) | 0.24% | 0.48% | 0.37% | (0.40)% | (0.37)% |
| Portfolio Turnover | 31% | 33% | 48% | 54% | 62% |
| (1) | Computed using average shares outstanding. |
| (2) | Returns are historical and are calculated by determining the percentage change in net asset value with all distributions reinvested and do not reflect the effect of sales charges, if any. |
| (3) | Total expenses do not reflect amounts reimbursed and/or waived by the adviser and certain of its affiliates, if applicable. Net expenses are net of all reductions and represent the net expenses paid by the Fund. |
| (4) | Includes a reduction by the investment adviser of a portion of its advisory fee due to the Fund’s investment in the Liquidity Fund (equal to less than 0.005% of average daily net assets for the years ended September 30, 2024, 2023 and 2022). |
9
See Notes to Financial Statements.
Calvert
International Opportunities Fund
September 30, 2024
Financial Highlights — continued
| | Class I |
| | Year Ended September 30, |
| | 2024 | 2023 | 2022 | 2021 | 2020 |
| Net asset value — Beginning of year | $15.16 | $13.26 | $22.08 | $17.64 | $15.86 |
| Income (Loss) From Operations | | | | | |
| Net investment income(1) | $0.20 | $0.24 | $0.25 | $0.13 | $0.11 |
| Net realized and unrealized gain (loss) | 3.42 | 1.75 | (7.46) | 4.47 | 1.90 |
| Total income (loss) from operations | $3.62 | $1.99 | $(7.21) | $4.60 | $2.01 |
| Less Distributions | | | | | |
| From net investment income | $(0.30) | $(0.09) | $(0.32) | $(0.16) | $(0.23) |
| From net realized gain | — | — | (1.29) | — | — |
| Total distributions | $(0.30) | $(0.09) | $(1.61) | $(0.16) | $(0.23) |
| Net asset value — End of year | $18.48 | $15.16 | $13.26 | $22.08 | $17.64 |
| Total Return(2) | 24.08% | 15.03% | (35.18)% | 26.17% | 12.77% |
| Ratios/Supplemental Data | | | | | |
| Net assets, end of year (000’s omitted) | $220,030 | $221,591 | $189,082 | $348,044 | $254,350 |
| Ratios (as a percentage of average daily net assets):(3) | | | | | |
| Total expenses | 1.08% | 1.06% | 1.06% | 1.05% | 1.07% |
| Net expenses | 1.08%(4) | 1.06%(4) | 1.06%(4) | 1.05% | 1.07% |
| Net investment income | 1.20% | 1.54% | 1.37% | 0.62% | 0.67% |
| Portfolio Turnover | 31% | 33% | 48% | 54% | 62% |
| (1) | Computed using average shares outstanding. |
| (2) | Returns are historical and are calculated by determining the percentage change in net asset value with all distributions reinvested and do not reflect the effect of sales charges, if any. |
| (3) | Total expenses do not reflect amounts reimbursed and/or waived by the adviser and certain of its affiliates, if applicable. Net expenses are net of all reductions and represent the net expenses paid by the Fund. |
| (4) | Includes a reduction by the investment adviser of a portion of its advisory fee due to the Fund’s investment in the Liquidity Fund (equal to less than 0.005% of average daily net assets for the years ended September 30, 2024, 2023 and 2022). |
10
See Notes to Financial Statements.
Calvert
International Opportunities Fund
September 30, 2024
Financial Highlights — continued
| | Class R6 |
| | Year Ended September 30, |
| | 2024 | 2023 | 2022 | 2021 | 2020 |
| Net asset value — Beginning of year | $15.15 | $13.26 | $22.07 | $17.64 | $15.86 |
| Income (Loss) From Operations | | | | | |
| Net investment income(1) | $0.22 | $0.24 | $0.27 | $0.14 | $0.12 |
| Net realized and unrealized gain (loss) | 3.41 | 1.77 | (7.45) | 4.46 | 1.91 |
| Total income (loss) from operations | $3.63 | $2.01 | $(7.18) | $4.60 | $2.03 |
| Less Distributions | | | | | |
| From net investment income | $(0.31) | $(0.12) | $(0.34) | $(0.17) | $(0.25) |
| From net realized gain | — | — | (1.29) | — | — |
| Total distributions | $(0.31) | $(0.12) | $(1.63) | $(0.17) | $(0.25) |
| Net asset value — End of year | $18.47 | $15.15 | $13.26 | $22.07 | $17.64 |
| Total Return(2) | 24.17% | 15.15% | (35.11)% | 26.21% | 12.87% |
| Ratios/Supplemental Data | | | | | |
| Net assets, end of year (000’s omitted) | $88,100 | $83,569 | $86,404 | $68,492 | $48,475 |
| Ratios (as a percentage of average daily net assets):(3) | | | | | |
| Total expenses | 1.00% | 0.99% | 0.99% | 0.97% | 1.00% |
| Net expenses | 1.00%(4) | 0.99%(4) | 0.99%(4) | 0.97% | 1.00% |
| Net investment income | 1.31% | 1.53% | 1.56% | 0.69% | 0.74% |
| Portfolio Turnover | 31% | 33% | 48% | 54% | 62% |
| (1) | Computed using average shares outstanding. |
| (2) | Returns are historical and are calculated by determining the percentage change in net asset value with all distributions reinvested and do not reflect the effect of sales charges, if any. |
| (3) | Total expenses do not reflect amounts reimbursed and/or waived by the adviser and certain of its affiliates, if applicable. Net expenses are net of all reductions and represent the net expenses paid by the Fund. |
| (4) | Includes a reduction by the investment adviser of a portion of its advisory fee due to the Fund’s investment in the Liquidity Fund (equal to less than 0.005% of average daily net assets for the years ended September 30, 2024, 2023 and 2022). |
11
See Notes to Financial Statements.
Calvert
International Opportunities Fund
September 30, 2024
Notes to Financial Statements
1 Significant Accounting Policies
Calvert International Opportunities Fund (the Fund) is a diversified series of Calvert World Values Fund, Inc. (the Corporation). The Corporation is a Maryland corporation registered under the Investment Company Act of 1940, as amended (the 1940 Act), as an open-end management investment company. The investment objective of the Fund is to seek long-term capital appreciation. The Fund invests primarily in common and preferred stocks of non-U.S. small-cap to mid-cap companies.
The Fund offers four classes of shares. Class A shares are generally sold subject to a sales charge imposed at time of purchase. A contingent deferred sales charge of 1.00% may apply to certain redemptions of Class A shares for accounts for which no sales charge was paid, if redeemed within 12 months of purchase. Class C shares are sold without a front-end sales charge, and with certain exceptions, are charged a contingent deferred sales charge of 1.00% on shares redeemed within 12 months of purchase. Class C shares are only available for purchase through a financial intermediary. Effective November 5, 2020, Class C shares automatically convert to Class A shares eight years after their purchase as described in the Fund's prospectus. Class I and Class R6 shares are sold at net asset value, are not subject to a sales charge and are sold only to certain eligible investors. Each class represents a pro rata interest in the Fund, but votes separately on class-specific matters and is subject to different expenses.
The Fund applies the accounting and reporting guidance in the Financial Accounting Standards Board (FASB) Accounting Standards Codification Topic 946, Financial Services – Investment Companies (ASC 946). Subsequent events, if any, through the date that the financial statements were issued have been evaluated in the preparation of the financial statements.
A Investment Valuation— Net asset value per share is determined every business day as of the close of the regular session of the New York Stock Exchange (generally 4:00 p.m. Eastern time). The Fund uses independent pricing services approved by the Board of Directors (the Board) to value its investments wherever possible. Investments for which market quotations are not available or deemed not reliable are fair valued in good faith by the
Board’s valuation designee.
U.S. generally accepted accounting principles (U.S. GAAP) establishes a disclosure hierarchy that categorizes the inputs to valuation techniques used to value assets and liabilities at measurement date. These inputs are summarized in the three broad levels listed below:
Level 1 - quoted prices in active markets for identical securities
Level 2 - other significant observable inputs (including quoted prices for similar securities, interest rates, prepayment speeds, credit risk, etc.)
Level 3 - significant unobservable inputs (including the Fund’s own assumptions in determining the fair value of investments)
The inputs or methodologies used for valuing securities are not necessarily an indication of the risk associated with investing in those securities.
Valuation techniques used to value the Fund’s investments by major category are as follows:
Equity Securities. Equity securities (including warrants and rights) listed on a U.S. securities exchange generally are valued at the last sale or closing price as reported by an independent pricing service on the primary market or exchange on which they are traded and are categorized as Level 1 in the hierarchy. Equity securities listed on the NASDAQ National Market System are valued at the NASDAQ official closing price and are categorized as Level 1 in the hierarchy. Unlisted or listed securities for which closing sales prices or closing quotations are not available are valued at the mean between the latest available bid and ask prices and are categorized as Level 2 in the hierarchy. The daily valuation of exchange-traded foreign securities generally is determined as of the close of trading on the principal exchange on which such securities trade. Events occurring after the close of trading on foreign exchanges may result in adjustments to the valuation of foreign securities to more accurately reflect their fair value as of the close of regular trading on the New York Stock Exchange. When valuing foreign equity securities that meet certain criteria, the Fund's Board has approved the use of a fair value service that values such securities to reflect market trading that occurs after the close of the applicable foreign markets of comparable securities or other instruments that have a strong correlation to the fair-valued securities. Such securities are categorized as Level 2 in the hierarchy.
Debt Securities. Debt securities are generally valued based on valuations provided by third party pricing services, as derived from such services’ pricing models. Inputs to the models may include, but are not limited to, reported trades, executable bid and ask prices, broker/dealer quotations, prices or yields of securities with similar characteristics, interest rates, anticipated prepayments, benchmark curves or information pertaining to the issuer, as well as industry and economic events. Accordingly, debt securities are generally categorized as Level 2 in the hierarchy. Short-term debt securities with a remaining maturity at time of purchase of more than sixty days are valued based on valuations provided by a third party pricing service. Such securities are generally categorized as Level 2 in the hierarchy. Short-term debt securities of sufficient credit quality purchased with remaining maturities of sixty days or less for which a valuation from a third party pricing service is not readily available may be valued at amortized cost, which approximates fair value, and are categorized as Level 2 in the hierarchy.
Other Securities. Investments in management investment companies (including money market funds) that do not trade on an exchange are valued at the net asset value as of the close of each business day and are categorized as Level 1 in the hierarchy.
Fair Valuation. In connection with Rule 2a-5 of the 1940 Act, the Board has designated the Fund’s investment adviser as its valuation designee. Investments for which valuations or market quotations are not readily available or are deemed unreliable are valued by the investment adviser, as valuation designee, at fair value using methods that most fairly reflect the security’s “fair value”, which is the amount that the Fund might reasonably expect to
Calvert
International Opportunities Fund
September 30, 2024
Notes to Financial Statements — continued
receive for the security upon its current sale in the ordinary course. Each such determination is based on a consideration of relevant factors, which are likely to vary from one pricing context to another. These factors may include, but are not limited to, the type of security, the existence of any contractual restrictions on the security’s disposition, the price and extent of public trading in similar securities of the issuer or of comparable companies or entities, quotations or relevant information obtained from broker/dealers or other market participants, information obtained from the issuer, analysts, and/or the appropriate stock exchange (for exchange-traded securities), an analysis of the company’s or entity’s financial statements, and an evaluation of the forces that influence the issuer and the market(s) in which the security is purchased and sold.
The values assigned to fair value investments are based on available information and do not necessarily represent amounts that might ultimately be realized. Further, due to the inherent uncertainty of valuations of such investments, the fair values may differ significantly from the values that would have been used had an active market existed, and the differences could be material.
The following table summarizes the market value of the Fund's holdings as of September 30, 2024, based on the inputs used to value them:
| Asset Description | Level 1 | Level 2 | Level 3 | Total |
| Common Stocks: | | | | |
| Australia | $ — | $30,564,930 | $ — | $30,564,930 |
| Austria | — | 4,475,376 | — | 4,475,376 |
| Belgium | — | 9,653,980 | — | 9,653,980 |
| Canada | 15,167,684 | — | — | 15,167,684 |
| France | — | 4,854,883 | — | 4,854,883 |
| Germany | — | 11,534,848 | — | 11,534,848 |
| Ireland | — | 3,135,996 | — | 3,135,996 |
| Italy | — | 29,261,705 | — | 29,261,705 |
| Japan | — | 99,673,948 | — | 99,673,948 |
| Luxembourg | — | 866,856 | — | 866,856 |
| Netherlands | 1,629,633 | 18,075,371 | — | 19,705,004 |
| New Zealand | — | 2,467,755 | — | 2,467,755 |
| Norway | — | 6,356,763 | — | 6,356,763 |
| Portugal | — | 2,203,536 | — | 2,203,536 |
| Singapore | — | 3,941,671 | — | 3,941,671 |
| Spain | — | 7,323,041 | — | 7,323,041 |
| Sweden | — | 17,141,367 | — | 17,141,367 |
| Switzerland | — | 8,328,270 | — | 8,328,270 |
| United Kingdom | — | 98,686,340 | — | 98,686,340 |
| Total Common Stocks | $16,797,317 | $358,546,636(1) | $ — | $375,343,953 |
| Short-Term Investments: | | | | |
| Affiliated Fund | $1,838,250 | $ — | $ — | $1,838,250 |
| Securities Lending Collateral | 26,763,236 | — | — | 26,763,236 |
| Total Investments | $45,398,803 | $358,546,636 | $ — | $403,945,439 |
| (1) | Includes foreign equity securities whose values were adjusted to reflect market trading of comparable securities or other correlated instruments that occurred after the close of trading in their applicable foreign markets. |
B Investment Transactions and Income— Investment transactions for financial statement purposes are accounted for on trade date. Realized gains and losses are recorded on an identified cost basis and may include proceeds from litigation. Dividend income is recorded on the ex-dividend date for dividends received in cash and/or securities or, in the case of dividends on certain foreign securities, as soon as the Fund is informed of the ex-dividend date. Non-cash dividends are recorded at the fair value of the securities received. Withholding taxes on foreign dividends, if any, have been provided for in accordance with the Fund’s understanding of the applicable country’s tax rules and rates. Distributions received that represent a return of capital are recorded as a reduction of cost of investments. Distributions received that represent a capital gain are recorded as a realized gain. Interest income, which includes amortization of premium and accretion of discount on debt securities, is accrued as earned.
Calvert
International Opportunities Fund
September 30, 2024
Notes to Financial Statements — continued
C Share Class Accounting— Realized and unrealized gains and losses and net investment income and losses, other than class-specific expenses, are allocated daily to each class of shares based upon the relative net assets of each class to the total net assets of the Fund. Expenses arising in connection with a specific class are charged directly to that class. Sub-accounting, recordkeeping and similar administrative fees payable to financial intermediaries, which are a component of transfer agency fees and expenses on the Statement of Operations, are not allocated to Class R6 shares.
D Foreign Currency Transactions— The Fund’s accounting records are maintained in U.S. dollars. For valuation of assets and liabilities on each date of net asset value determination, foreign denominations are converted into U.S. dollars using the current exchange rate. Security transactions, income and expenses are translated at the prevailing rate of exchange on the date of the event. Recognized gains or losses on investment transactions attributable to changes in foreign currency exchange rates are recorded for financial statement purposes as net realized gains and losses on investments. That portion of unrealized gains and losses on investments that results from fluctuations in foreign currency exchange rates is not separately disclosed.
E Distributions to Shareholders— Distributions to shareholders are recorded by the Fund on ex-dividend date. Distributions from net investment income and distributions from net realized capital gains, if any, are paid at least annually. Distributions are declared separately for each class of shares. Distributions are determined in accordance with income tax regulations, which may differ from U.S. GAAP; accordingly, periodic reclassifications are made within the Fund's capital accounts to reflect income and gains available for distribution under income tax regulations.
F Estimates— The preparation of financial statements in conformity with U.S. GAAP requires management to make estimates and assumptions that affect the reported amounts of assets and liabilities and disclosure of contingent assets and liabilities at the date of the financial statements and the reported amounts of increases and decreases in net assets from operations during the reporting period. Actual results could differ from those estimates.
G Indemnifications— The Corporation’s By-Laws provide for indemnification for Directors or officers of the Corporation and certain other parties, to the fullest extent permitted by Maryland law and the 1940 Act, provided certain conditions are met. Additionally, in the normal course of business, the Fund enters into agreements with service providers that may contain indemnification clauses. The Fund’s maximum exposure under these arrangements is unknown as this would involve future claims that may be made against the Fund that have not yet occurred.
H Federal Income Taxes— No provision for federal income or excise tax is required since the Fund intends to continue to qualify as a regulated investment company under the Internal Revenue Code and to distribute substantially all of its taxable earnings.
Management has analyzed the Fund's tax positions taken for all open federal income tax years and has concluded that no provision for federal income tax is required in the Fund's financial statements. A Fund's federal tax return is subject to examination by the Internal Revenue Service for a period of three years from the date of filing.
2 Related Party Transactions
The investment advisory fee is earned by Calvert Research and Management (CRM), an indirect, wholly-owned subsidiary of Morgan Stanley, as compensation for investment advisory services rendered to the Fund. The investment advisory fee is computed at the annual rate of 0.75% of the Fund’s average daily net assets and is payable monthly. For the year ended September 30, 2024, the investment advisory fee amounted to $2,789,823.
Pursuant to an investment sub-advisory agreement, CRM has delegated a portion of the investment management of the Fund to Eaton Vance Advisers International Ltd. (EVAIL), an affiliate of CRM and an indirect, wholly-owned subsidiary of Morgan Stanley. EVAIL uses the portfolio management, research and other resources of its affiliate, MSIM Fund Management (Ireland) Limited (MSIM FMIL), in rendering investment advisory services to the Fund. MSIM FMIL has entered into a Memorandum of Understanding with EVAIL pursuant to which MSIM FMIL is considered a participating affiliate of the sub-adviser as that term is used in relief granted by the staff of the U.S. Securities and Exchange Commission allowing U.S. registered investment advisers to use portfolio management or research resources of unregistered advisory affiliates subject to the supervision of a U.S. registered adviser. CRM pays EVAIL a portion of its investment advisory fee for sub-advisory services provided to the Fund.
The Fund may invest in a money market fund, the Institutional Class of the Morgan Stanley Institutional Liquidity Funds - Government Portfolio (the “Liquidity Fund”), an open-end management investment company managed by Morgan Stanley Investment Management Inc., a wholly-owned subsidiary of Morgan Stanley. The investment advisory fee paid by the Fund is reduced by an amount equal to its pro rata share of the advisory and administration fees paid by the Fund due to its investment in the Liquidity Fund. For the year ended September 30, 2024, the investment advisory fee paid was reduced by $5,399 relating to the Fund’s investment in the Liquidity Fund.
CRM and EVAIL have agreed to reimburse the Fund’s operating expenses to the extent that total annual operating expenses (relating to ordinary operating expenses only and excluding expenses such as brokerage commissions, acquired fund fees and expenses of unaffiliated funds, borrowing costs, taxes or litigation expenses) exceed 1.34%, 2.09%, 1.09% and 1.05% for Class A, Class C, Class I and Class R6, respectively, of such class’s average daily net assets. The expense reimbursement agreement may be changed or terminated after February 1, 2025. For the year ended September 30, 2024, no expenses were waived and/or reimbursed by CRM and EVAIL.
The administrative fee is earned by CRM as compensation for administrative services rendered to the Fund. The fee is computed at an annual rate of 0.12% of the Fund’s average daily net assets attributable to Class A, Class C, Class I and Class R6 and is payable monthly. For the year ended September 30, 2024, CRM was paid administrative fees of $446,371.
Calvert
International Opportunities Fund
September 30, 2024
Notes to Financial Statements — continued
The Fund has in effect a distribution plan for Class A shares (Class A Plan) pursuant to Rule 12b-1 under the 1940 Act. Pursuant to the Class A Plan, the Fund pays Eaton Vance Distributors, Inc. (EVD), an affiliate of CRM and the Fund’s principal underwriter, a distribution and service fee of 0.25% per annum of its average daily net assets attributable to Class A shares for distribution services and facilities provided to the Fund by EVD, as well as for personal services and/or the maintenance of shareholder accounts. The Fund also has in effect a distribution plan for Class C shares (Class C Plan) pursuant to Rule 12b-1 under the 1940 Act. Pursuant to the Class C Plan, the Fund pays EVD amounts equal to 0.75% per annum of its average daily net assets attributable to Class C shares for providing ongoing distribution services and facilities to the Fund. In addition, pursuant to the Class C Plan, the Fund also makes payments of service fees to EVD, financial intermediaries and other persons in amounts equal to 0.25% per annum of its average daily net assets attributable to that class. Service fees paid or accrued are for personal services and/or the maintenance of shareholder accounts. Distribution and service fees paid or accrued for the year ended September 30, 2024 amounted to $162,870 and $35,768 for Class A shares and Class C shares, respectively.
The Fund was informed that EVD received $5,756 as its portion of the sales charge on sales of Class A shares for the year ended September 30, 2024. The Fund was also informed that EVD received less than $100 and $323 of contingent deferred sales charges paid by Class A and Class C shareholders, respectively, for the same period.
Eaton Vance Management (EVM), an affiliate of CRM, provides sub-transfer agency and related services to the Fund pursuant to a Sub-Transfer Agency Support Services Agreement. For the year ended September 30, 2024, sub-transfer agency fees and expenses incurred to EVM amounted to $27,509 and are included in transfer agency fees and expenses on the Statement of Operations.
Each Director of the Fund who is not an employee of CRM or its affiliates receives an annual fee of $225,000 ($214,000 prior to January 1, 2024), an annual Committee fee ranging from $8,500 to $16,500 depending on the Committee, and may receive a fee of $10,000 for special meetings. The Board chair receives an additional $40,000 annual fee, Committee chairs receive an additional $15,000 annual fee and the special equities liaison receives an additional $2,500 annual fee. Eligible Directors may participate in a Deferred Compensation Plan (the Plan). Amounts deferred under the Plan are treated as though equal dollar amounts had been invested in shares of the Fund or other Calvert funds selected by the Directors. The Fund purchases shares of the funds selected equal to the dollar amounts deferred under the Plan, resulting in an asset equal to the deferred compensation liability. Obligations of the Plan are paid solely from the Fund's assets. Directors’ fees are allocated to each of the Calvert funds served. Salaries and fees of officers and Directors of the Fund who are employees of CRM or its affiliates are paid by CRM.
3 Investment Activity
During the year ended September 30, 2024, the cost of purchases and proceeds from sales of investments, other than short-term securities, were $113,688,677 and $183,400,219, respectively.
4 Distributions to Shareholders and Income Tax Information
The tax character of distributions declared for the years ended September 30, 2024 and September 30, 2023 was as follows:
| | Year Ended September 30, |
| | 2024 | 2023 |
| Ordinary income | $6,814,818 | $2,306,799 |
During the year ended September 30, 2024, distributable earnings was decreased by $1,587,977 and paid-in capital was increased by $1,587,977 due to the Fund's use of equalization accounting. Tax equalization accounting allows the Fund to treat as a distribution that portion of redemption proceeds representing a redeeming shareholder’s portion of undistributed taxable income and net capital gains. These reclassifications had no effect on the net assets or net asset value per share of the Fund.
As of September 30, 2024, the components of distributable earnings (accumulated loss) on a tax basis were as follows:
| Undistributed ordinary income | $10,192,037 |
| Deferred capital losses | (40,703,269) |
| Net unrealized appreciation | 61,377,945 |
| Distributable earnings | $30,866,713 |
Calvert
International Opportunities Fund
September 30, 2024
Notes to Financial Statements — continued
At September 30, 2024, the Fund, for federal income tax purposes, had deferred capital losses of $40,703,269 which would reduce the Fund's taxable income arising from future net realized gains on investment transactions, if any, to the extent permitted by the Internal Revenue Code, and thus would reduce the amount of distributions to shareholders, which would otherwise be necessary to relieve the Fund of any liability for federal income or excise tax. The deferred capital losses are treated as arising on the first day of the Fund's next taxable year and retain the same short-term or long-term character as when originally deferred. Of the deferred capital losses at September 30, 2024, $24,071,660 are short-term and $16,631,609 are long-term.
The cost and unrealized appreciation (depreciation) of investments of the Fund at September 30, 2024, as determined on a federal income tax basis, were as follows:
| Aggregate cost | $342,583,591 |
| Gross unrealized appreciation | $74,820,537 |
| Gross unrealized depreciation | (13,458,689) |
| Net unrealized appreciation | $61,361,848 |
5 Securities Lending
To generate additional income, the Fund may lend its securities pursuant to a securities lending agency agreement with State Street Bank and Trust Company (SSBT), the securities lending agent. Security loans are subject to termination by the Fund at any time and, therefore, are not considered illiquid investments. The Fund requires that the loan be continuously collateralized by either cash or securities in an amount at least equal to the market value of the securities on loan. The market value of securities loaned is determined daily and any additional required collateral is delivered to the Fund on the next business day. Cash collateral is generally invested in a money market fund registered under the 1940 Act that is managed by an affiliate of SSBT. Any gain or loss in the market price of the loaned securities that might occur and any interest earned or dividends declared during the term of the loan would accrue to the account of the Fund. Income earned on the investment of collateral, net of broker rebates and other expenses incurred by the securities lending agent, is split between the Fund and the securities lending agent based on agreed upon contractual terms. Non-cash collateral, if any, is held by the lending agent on behalf of the Fund and cannot be sold or re-pledged by the Fund; accordingly, such collateral is not reflected in the Statement of Assets and Liabilities.
The risks associated with lending portfolio securities include, but are not limited to, possible delays in receiving additional collateral or in the recovery of the loaned securities, possible loss of rights to the collateral should the borrower fail financially, as well as risk of loss in the value of the collateral or the value of the investments made with the collateral. The securities lending agent shall indemnify the Fund in the case of default of any securities borrower.
At September 30, 2024, the total value of securities on loan was $49,007,065 and the total value of collateral received was $52,349,745, comprised of cash of $26,763,236 and U.S. government and/or agencies securities of $25,586,509.
The following table provides a breakdown of securities lending transactions accounted for as secured borrowings, the obligations by class of collateral pledged, and the remaining contractual maturity of those transactions as of September 30, 2024.
| | Remaining Contractual Maturity of the Transactions |
| | Overnight and
Continuous | <30 days | 30 to 90 days | >90 days | Total |
| Common Stocks | $26,763,236 | $ — | $ — | $ — | $26,763,236 |
The carrying amount of the liability for deposits for securities loaned at September 30, 2024 approximated its fair value. If measured at fair value, such liability would have been considered as Level 2 in the fair value hierarchy (see Note 1A) at September 30, 2024.
Calvert
International Opportunities Fund
September 30, 2024
Notes to Financial Statements — continued
6 Line of Credit
The Fund participates with other portfolios and funds managed by EVM and its affiliates, including CRM, in a $650 million unsecured revolving line of credit agreement with a group of banks, which is in effect through October 22, 2024. In connection with the renewal of the agreement on
October 24, 2023, the borrowing limit was decreased from $725 million. Borrowings are made by the Fund solely for temporary purposes related to redemptions and other short-term cash needs. Interest is charged to the Fund based on its borrowings generally at an amount above either the Secured Overnight Financing Rate (SOFR) or Federal Funds rate. In addition, a fee computed at an annual rate of 0.15% on the daily unused portion of the line of credit is allocated among the participating portfolios and funds at the end of each quarter. In connection with the renewal of the agreement in October 2023, an arrangement fee of $150,000 was incurred that was allocated to the participating portfolios and funds. Because the line of credit is not available exclusively to the Fund, it may be unable to borrow some or all of its requested amounts at any particular time.
The Fund had no borrowings outstanding pursuant to its line of credit at September 30, 2024. The Fund did not have any significant borrowings or allocated fees during the year ended September 30, 2024. Effective October 22, 2024, the Fund renewed its line of credit agreement, which expires October 21, 2025, at substantially the same terms.
7 Affiliated Investments
During the year ended September 30, 2024, the Fund had invested a portion of its assets in notes (the Notes) issued by Calvert Impact Capital, Inc. (CIC) pursuant to exemptive relief granted by the U.S. Securities and Exchange Commission (the SEC). There are certain potential points of affiliation between the Fund and CIC. CRM has licensed use of the Calvert name to CIC and provides other types of support. An officer of CRM's affiliate serves on the CIC Board.
At September 30, 2024, the value of the Fund’s investment in the Notes and in funds that may be deemed to be affiliated was $1,838,250, which represents 0.5% of the Fund’s net assets. Transactions in such investments by the Fund for the year ended September 30, 2024 were as follows:
| Name | Value,
beginning
of period | Purchases | Sales
proceeds | Net
realized
gain
(loss) | Change in
unrealized
appreciation
(depreciation) | Value,
end of
period | Interest/
Dividend
income | Principal amount/
Shares,
end of period |
| High Social Impact Investments | | | | | | | | |
| Calvert Impact Capital, Inc., Community Investment Notes, 1.50%, 12/15/23 | $552,322 | $ — | $ (560,000) | $ — | $7,678 | $ — | $ 1,727 | $ — |
| Short-Term Investments | | | | | | |
| Liquidity Fund | 676,424 | 98,546,323 | (97,384,497) | — | — | 1,838,250 | 188,798 | 1,838,250 |
| Total | | | | $ — | $7,678 | $1,838,250 | $190,525 | |
8 Capital Shares
The Corporation may issue its shares in one or more series (such as the Fund). The authorized shares of the Fund consist of 75,000,000 common shares, $0.01 par value, for each Class.
Transactions in capital shares, including direct exchanges pursuant to share class conversions, were as follows:
| | Year Ended
September 30, 2024 | | Year Ended
September 30, 2023 |
| | Shares | Amount | | Shares | Amount |
| Class A | | | | | |
| Shares sold | 474,733 | $8,003,858 | | 404,779 | $6,529,171 |
| Reinvestment of distributions | 55,457 | 957,737 | | 14,003 | 218,307 |
| Shares redeemed | (855,076) | (14,437,314) | | (879,847) | (14,352,159) |
| Net decrease | (324,886) | $(5,475,719) | | (461,065) | $(7,604,681) |
Calvert
International Opportunities Fund
September 30, 2024
Notes to Financial Statements — continued
| | Year Ended
September 30, 2024 | | Year Ended
September 30, 2023 |
| | Shares | Amount | | Shares | Amount |
| Class C | | | | | |
| Shares sold | 10,175 | $166,734 | | 14,907 | $234,892 |
| Reinvestment of distributions | 1,504 | 25,195 | | — | — |
| Shares redeemed | (44,864) | (733,503) | | (53,262) | (828,434) |
| Net decrease | (33,185) | $(541,574) | | (38,355) | $(593,542) |
| Class I | | | | | |
| Shares sold | 3,289,630 | $54,114,118 | | 5,015,593 | $78,508,526 |
| Reinvestment of distributions | 218,017 | 3,671,411 | | 73,452 | 1,117,208 |
| Shares redeemed | (6,217,329) | (102,786,516) | | (4,732,586) | (73,872,511) |
| Net increase (decrease) | (2,709,682) | $(45,000,987) | | 356,459 | $5,753,223 |
| Class R6 | | | | | |
| Shares sold | 348,669 | $5,734,863 | | 339,939 | $5,214,848 |
| Reinvestment of distributions | 90,952 | 1,529,814 | | 51,163 | 777,165 |
| Shares redeemed | (1,186,151) | (19,813,301) | | (1,389,988) | (22,089,622) |
| Net decrease | (746,530) | $(12,548,624) | | (998,886) | $(16,097,609) |
9 Risks and Uncertainties
Risks Associated with Foreign Investments
Foreign investments can be adversely affected by political, economic and market developments abroad, including the imposition of economic and other sanctions by the United States or another country, and by acts of terrorism and war. There may be less publicly available information about foreign issuers because they may not be subject to reporting practices, requirements or regulations comparable to those to which United States companies are subject. Foreign markets may be smaller, less liquid and more volatile than the major markets in the United States. Trading in foreign markets typically involves higher expense than trading in the United States. The Fund may have difficulties enforcing its legal or contractual rights in a foreign country. Securities that trade or are denominated in currencies other than the U.S. dollar may be adversely affected by fluctuations in currency exchange rates.
Calvert
International Opportunities Fund
September 30, 2024
Report of Independent Registered Public Accounting Firm
To the Board of Directors of Calvert World Values Fund, Inc. and Shareholders of Calvert International Opportunities Fund:
Opinion on the Financial Statements and Financial Highlights
We have audited the accompanying statement of assets and liabilities of Calvert International Opportunities Fund (the "Fund") (one of the funds constituting Calvert World Values Fund, Inc.), including the schedule of investments, as of September 30, 2024, the related statement of operations for the year then ended, the statements of changes in net assets for each of the two years in the period then ended, the financial highlights for each of the four years in the period then ended, and the related notes. In our opinion, the financial statements and financial highlights present fairly, in all material respects, the financial position of the Fund as of September 30, 2024, and the results of its operations for the year then ended, the changes in its net assets for each of the two years in the period then ended, and the financial highlights for each of the four years in the period then ended, in conformity with accounting principles generally accepted in the United States of America. The financial highlights for the year ended September 30, 2020 were audited by other auditors whose report, dated November 20, 2020, expressed an unqualified opinion on those financial highlights.
Basis for Opinion
These financial statements and financial highlights are the responsibility of the Fund's management. Our responsibility is to express an opinion on the Fund's financial statements and financial highlights based on our audits. We are a public accounting firm registered with the Public Company Accounting Oversight Board (United States) (PCAOB) and are required to be independent with respect to the Fund in accordance with the U.S. federal securities laws and the applicable rules and regulations of the Securities and Exchange Commission and the PCAOB.
We conducted our audits in accordance with the standards of the PCAOB. Those standards require that we plan and perform the audit to obtain reasonable assurance about whether the financial statements and financial highlights are free of material misstatement, whether due to error or fraud. The Fund is not required to have, nor were we engaged to perform, an audit of its internal control over financial reporting. As part of our audits, we are required to obtain an understanding of internal control over financial reporting but not for the purpose of expressing an opinion on the effectiveness of the Fund’s internal control over financial reporting. Accordingly, we express no such opinion.
Our audits included performing procedures to assess the risks of material misstatement of the financial statements and financial highlights, whether due to error or fraud, and performing procedures that respond to those risks. Such procedures included examining, on a test basis, evidence regarding the amounts and disclosures in the financial statements and financial highlights. Our audits also included evaluating the accounting principles used and significant estimates made by management, as well as evaluating the overall presentation of the financial statements and financial highlights. Our procedures included confirmation of securities owned as of September 30, 2024, by correspondence with the custodian and brokers; when replies were not received from brokers, we performed other auditing procedures. We believe that our audits provide a reasonable basis for our opinion.
/s/ Deloitte & Touche LLP
Boston, Massachusetts
November 21, 2024
We have served as the auditor of one or more Calvert investment companies since 2021.
Calvert
International Opportunities Fund
September 30, 2024
Federal Tax Information (Unaudited)
The Form 1099-DIV you receive in February 2025 will show the tax status of all distributions paid to your account in calendar year 2024. Shareholders are advised to consult their own tax adviser with respect to the tax consequences of their investment in the Fund. As required by the Internal Revenue Code and/or regulations, shareholders must be notified regarding the status of qualified dividend income for individuals, the dividends received deduction for corporations and the foreign tax credit.
Qualified Dividend Income. For the fiscal year ended September 30, 2024, the Fund designates approximately $7,160,060, or up to the maximum amount of such dividends allowable pursuant to the Internal Revenue Code, as qualified dividend income eligible for the reduced tax rate of 15%.
Dividends Received Deduction. Corporate shareholders are generally entitled to take the dividends received deduction on the portion of the Fund's dividend distribution that qualifies under tax law. For the Fund's fiscal 2024 ordinary income dividends, 1.39% qualifies for the corporate dividends received deduction.
Foreign Tax Credit. For the fiscal year ended September 30, 2024, the Fund paid foreign taxes of $513,085 and recognized foreign source income of $8,548,260.
Calvert
International Opportunities Fund
September 30, 2024
Board of Directors' Contract Approval
Overview of the Contract Review Process
The Investment Company Act of 1940, as amended, provides, in substance, that each investment advisory agreement between a fund and its investment adviser will continue in effect from year to year only if its continuation is approved at least annually by the fund’s board of directors, including by a vote of a majority of the directors who are not “interested persons” of the fund (“Independent Directors”), cast in person at a meeting called for the purpose of considering such approval.
At an in-person meeting of the Boards of Trustees/Directors (each a “Board”) of the registered investment companies advised by Calvert Research and Management (“CRM” or the “Adviser”) (the “Calvert Funds”) held on June 10-11, 2024, the Board, including a majority of the Independent Directors, voted to approve continuation of existing investment advisory and investment sub-advisory agreements for the Calvert Funds for an additional one-year period.
In evaluating the investment advisory and investment sub-advisory agreements for the Calvert Funds, the Board considered a variety of information relating to the Calvert Funds and various service providers, including the Adviser. The Independent Directors reviewed a report prepared by the Adviser regarding various services provided to the Calvert Funds by the Adviser and its affiliates. Such report included, among other data, information regarding the Adviser’s personnel and the Adviser’s revenue and cost of providing services to the Calvert Funds, and a separate report prepared by an independent data provider, which compared each fund’s investment performance, fees and expenses to those of comparable funds as identified by such independent data provider (“comparable funds”).
The Independent Directors were separately represented by independent legal counsel with respect to their consideration of the continuation of the investment advisory and investment sub-advisory agreements for the Calvert Funds. Prior to voting, the Independent Directors reviewed the proposed continuation of the Calvert Funds’ investment advisory and investment sub-advisory agreements with management and also met in private sessions with their counsel at which time no representatives of management were present.
The information that the Board considered included, among other things, the following (for funds that invest through one or more affiliated underlying fund(s), references to “each fund” in this section may include information that was considered at the underlying fund-level):
Information about Fees, Performance and Expenses
| • | A report from an independent data provider comparing the advisory and related fees paid by each fund with fees paid by comparable funds; |
| • | A report from an independent data provider comparing each fund’s total expense ratio and its components to comparable funds; |
| • | A report from an independent data provider comparing the investment performance of each fund to the investment performance of comparable funds over various time periods; |
| • | Data regarding investment performance in comparison to benchmark indices; |
| • | For each fund, comparative information concerning the fees charged and the services provided by the Adviser in managing other accounts (including mutual funds, other collective investment funds and institutional accounts) using investment strategies and techniques similar to those used in managing such fund; |
| • | Profitability analyses for the Adviser with respect to each fund; |
Information about Portfolio Management and Trading
| • | Descriptions of the investment management services provided to each fund, including investment strategies and processes it employs; |
| • | Information about the Adviser’s policies and practices with respect to trading, including the Adviser’s processes for monitoring best execution of portfolio transactions; |
| • | Information about the allocation of brokerage transactions and the benefits received by the Adviser as a result of brokerage allocation, including information concerning the acquisition of research through client commission arrangements and policies with respect to “soft dollars”; |
Information about the Adviser
| • | Reports detailing the financial results and condition of CRM; |
| • | Descriptions of the qualifications, education and experience of the individual investment professionals whose responsibilities include portfolio management and investment research for the funds, and information relating to their compensation and responsibilities with respect to managing other mutual funds and investment accounts; |
| • | Policies and procedures relating to proxy voting and the handling of corporate actions and class actions; |
| • | A description of CRM’s procedures for overseeing sub-advisers, including with respect to regulatory and compliance issues, investment management and other matters; |
Calvert
International Opportunities Fund
September 30, 2024
Board of Directors' Contract Approval — continued
Other Relevant Information
| • | Information concerning the nature, cost and character of the administrative and other non-investment advisory services provided by CRM and its affiliates; and |
| • | The terms of each investment advisory agreement. |
Over the course of the year, the Board and its committees held regular quarterly meetings. During these meetings, the Directors participated in investment and performance reviews with the portfolio managers and other investment professionals of the Adviser relating to each fund and considered various investment and trading strategies used in pursuing each fund’s investment objective(s), such as the use of derivative instruments, as well as risk management techniques. The Board and its committees also evaluated issues pertaining to industry and regulatory developments, compliance procedures, corporate governance and other issues with respect to the funds and received and participated in reports and presentations provided by CRM and its affiliates with respect to such matters. In addition to the formal meetings of the Board and its committees, the Independent Directors held regular video conferences in between meetings to discuss, among other topics, matters relating to the continuation of the Calvert Funds’ investment advisory and investment sub-advisory agreements.
For funds that invest through one or more affiliated underlying funds, the Board considered similar information about the underlying fund(s) when considering the approval of investment advisory agreements. In addition, in cases where the Adviser has engaged a sub-adviser, the Board considered similar information about the sub-adviser when considering the approval of any investment sub-advisory agreement.
The Independent Directors were assisted throughout the contract review process by their independent legal counsel. The Independent Directors relied upon the advice of such counsel and their own business judgment in determining the material factors to be considered in evaluating each investment advisory and investment sub-advisory agreement and the weight to be given to each such factor. The Board, including the Independent Directors, did not identify any single factor as controlling, and each Director may have attributed different weight to various factors.
Results of the Contract Review Process
Based on its consideration of the foregoing, and such other information as it deemed relevant, including the factors and conclusions described below, the Board, including the Independent Directors, concluded that the continuation of the investment advisory agreement of Calvert International Opportunities Fund (the “Fund”), and the investment sub-advisory agreement with Eaton Vance Advisers International Ltd. (the “Sub-Adviser”), an affiliate of CRM, including the fees payable under each agreement, is in the best interests of the Fund’s shareholders. Accordingly, the Board, including a majority of the Independent Directors, voted to approve the continuation of the investment advisory agreement and the investment sub-advisory agreement of the Fund.
Nature, Extent and Quality of Services
In considering the nature, extent and quality of the services provided by the Adviser and Sub-Adviser under the investment advisory agreement and investment sub-advisory agreement, respectively, the Board reviewed information relating to the Adviser’s and Sub-Adviser’s operations and personnel, including, among other information, biographical information on the Sub-Adviser’s investment personnel and descriptions of the Adviser’s organizational and management structure. The Board also took into account similar information provided periodically throughout the previous year by the Adviser and Sub-Adviser as well as the Board’s familiarity with the Adviser and Sub-Adviser through Board meetings, discussions and other reports. With respect to the Adviser, the Board considered the Adviser’s responsibilities overseeing the Sub-Adviser and the business-related and other risks to which the Adviser or its affiliates may be subject in managing the Fund. With respect to the Sub-Adviser, the Board took into account the resources available to the Sub-Adviser in fulfilling its duties under the investment sub-advisory agreement and the Sub-Adviser’s experience in managing the Fund. The Board also noted that it reviewed on a quarterly basis information regarding the Adviser’s and Sub-Adviser’s compliance with applicable policies and procedures, including those related to personal investing. The Board took into account, among other items, periodic reports received from the Adviser over the past year concerning the Adviser’s ongoing review and enhancement of certain processes, policies and procedures of the Calvert Funds and the Adviser. The Board concluded that it was satisfied with the nature, extent and quality of services provided to the Fund by the Adviser and the Sub-Adviser under the investment advisory agreement and investment sub-advisory agreement, respectively.
Fund Performance
In considering the Fund’s performance, the Board noted that it reviewed on a quarterly basis detailed information about the Fund’s performance results, portfolio composition and investment strategies. The Board compared the Fund’s investment performance to that of the Fund’s peer universe and its benchmark index. The Board’s review included comparative performance data for the one-, three- and five-year periods ended December 31, 2023. This performance data indicated that the Fund had underperformed the median of its peer universe for the one-year period ended December 31, 2023, while it had outperformed the median of its peer universe for the three- and five-year periods ended December 31, 2023. This data also indicated that the Fund
Calvert
International Opportunities Fund
September 30, 2024
Board of Directors' Contract Approval — continued
had underperformed its benchmark index for the one-, three- and five- year periods ended December 31, 2023. The Board took into account management’s discussion of the Fund’s performance. Based upon its review, the Board concluded that the Fund’s performance was satisfactory relative to the performance of its peer universe and its benchmark index.
Management Fees and Expenses
In considering the Fund’s fees and expenses, the Board compared the Fund’s fees and total expense ratio with those of comparable funds in its expense group. Among other findings, the data indicated that the Fund’s advisory and administrative fees (referred to collectively as “management fees”) were above the median of the Fund’s expense group and the Fund’s total expenses were at the median of the Fund’s expense group. The Board took into account the Adviser’s and Sub-Adviser’s current undertaking to maintain expense limitations for the Fund and that the Adviser and Sub-Adviser were waiving and/or reimbursing a portion of the Fund’s expenses. Based upon its review, the Board concluded that the management and sub-advisory fees were reasonable in view of the nature, extent and quality of services provided by the Adviser and Sub-Adviser, respectively.
Profitability and Other “Fall-Out” Benefits
The Board reviewed the Adviser’s profitability in regard to the Fund and the Calvert Funds in the aggregate. In reviewing the overall profitability of the Fund to the Adviser, the Board also considered the fact that the Adviser and its affiliates, including the Sub-Adviser, provided sub-advisory, sub-transfer agency support, administrative and distribution services to the Fund for which they received compensation. The information considered by the Board included the profitability of the Fund to the Adviser and its affiliates without regard to any marketing support or other payments by the Adviser and its affiliates to third parties in respect of distribution services. The Board also considered that the Adviser and its affiliates, including the Sub-Adviser, derived benefits to their reputation and other indirect benefits from their relationships with the Fund. Because the Adviser pays the Sub-Adviser’s sub-advisory fee out of its advisory fee, the profitability of the Fund to the Sub-Adviser was not a material factor in the Board’s deliberations concerning the continuation of the investment sub-advisory agreement. Based upon its review, the Board concluded that the level of profitability of the Adviser and its affiliates, including the Sub-Adviser, from their relationships with the Fund was reasonable.
Economies of Scale
The Board considered the effect of the Fund’s current size and its potential growth on its performance and fees. The Board concluded that adding breakpoints to the advisory fee at specific asset levels would not be appropriate at this time. Because the Adviser pays the Sub-Adviser’s sub-advisory fee out of its advisory fee, the Board did not consider the potential economies of scale from the Sub-Adviser’s management of the Fund to be a material factor in the Board’s deliberations concerning the continuation of the investment sub-advisory agreement. The Board noted that if the Fund’s assets increased over time, the Fund might realize other economies of scale if assets increased proportionally more than certain other expenses.
This Page Intentionally Left Blank
Calvert
Emerging Markets Advancement Fund
Annual Financial Statements and
Additional Information
September 30, 2024
This report must be preceded or accompanied by a current summary prospectus or prospectus. Before investing, investors should consider carefully the investment objective, risks, and charges and expenses of a mutual fund. This and other important information is contained in the prospectus and/or statement of additional information, which can be obtained by calling 1-800-368-2745 or from a financial intermediary. Prospective investors should read the prospectus carefully before investing.
Annual Financial Statements and Additional Information September 30, 2024
Calvert
Emerging Markets Advancement Fund
Calvert
Emerging Markets Advancement Fund
September 30, 2024
| Security | Shares | Value |
| Cyprus — 3.4% | |
| Bank of Cyprus Holdings PLC | | 600,026 | $ 3,099,142 |
| | | | $ 3,099,142 |
| Egypt — 1.0% | |
| Commercial International Bank - Egypt (CIB) | | 502,000 | $ 878,604 |
| | | | $ 878,604 |
| Georgia — 4.3% | |
| Bank of Georgia Group PLC | | 22,902 | $ 1,125,628 |
| Georgia Capital PLC(1) | | 105,157 | 1,310,095 |
| TBC Bank Group PLC | | 42,972 | 1,524,777 |
| | | | $3,960,500 |
| Greece — 17.0% | |
| Alpha Services and Holdings SA | | 748,546 | $1,299,835 |
| Athens Water Supply & Sewage Co. SA | | 42,939 | 274,986 |
| Eurobank Ergasias Services & Holdings SA, Class A | | 955,341 | 2,188,131 |
| GEK TERNA SA | | 43,520 | 855,008 |
| Hellenic Telecommunications Organization SA | | 86,110 | 1,485,872 |
| JUMBO SA | | 50,849 | 1,456,413 |
| LAMDA Development SA(1) | | 64,419 | 538,056 |
| National Bank of Greece SA | | 290,969 | 2,487,368 |
| Piraeus Financial Holdings SA | | 401,907 | 1,711,038 |
| Public Power Corp. SA | | 164,154 | 2,200,282 |
| Terna Energy SA | | 48,115 | 1,044,694 |
| | | | $15,541,683 |
| India — 15.6% | |
| Angel One Ltd. | | 200 | $6,114 |
| Apollo Hospitals Enterprise Ltd. | | 1,998 | 171,737 |
| Ashok Leyland Ltd. | | 30,101 | 84,570 |
| Asian Paints Ltd. | | 7,643 | 303,032 |
| AU Small Finance Bank Ltd.(2) | | 5,029 | 44,327 |
| Avenue Supermarts Ltd.(1)(2) | | 3,975 | 242,311 |
| Axis Bank Ltd. | | 32,364 | 475,582 |
| Bajaj Finance Ltd. | | 1,200 | 110,180 |
| Bajaj Finserv Ltd. | | 2,300 | 54,068 |
| Bandhan Bank Ltd.(2) | | 11,793 | 27,955 |
| Bank of Baroda | | 15,482 | 45,618 |
| Bank of India | | 5,600 | 7,372 |
| Bharti Airtel Ltd. | | 32,704 | 668,200 |
| Biocon Ltd. | | 11,674 | 50,502 |
| Britannia Industries Ltd. | | 2,374 | 179,666 |
| BSE Ltd. | | 400 | 17,545 |
| Central Depository Services India Ltd.(3) | | 600 | 10,283 |
| CG Power & Industrial Solutions Ltd. | | 5,600 | 50,746 |
| Cipla Ltd. | | 8,710 | 172,183 |
| Coforge Ltd. | | 2,193 | 183,279 |
| Crompton Greaves Consumer Electricals Ltd. | | 18,918 | 93,915 |
| Dabur India Ltd. | | 4,163 | 31,019 |
| Security | Shares | Value |
| India (continued) | |
| Dixon Technologies India Ltd.(3) | | 781 | $ 128,478 |
| DLF Ltd. | | 19,843 | 211,801 |
| Dr. Lal PathLabs Ltd.(2) | | 878 | 34,574 |
| Embassy Office Parks REIT | | 20,528 | 96,047 |
| Exide Industries Ltd. | | 2,700 | 16,171 |
| Federal Bank Ltd. | | 23,934 | 56,138 |
| FSN E-Commerce Ventures Ltd.(1) | | 38,254 | 89,222 |
| GMR Airports Infrastructure Ltd.(1) | | 21,700 | 24,342 |
| Godrej Consumer Products Ltd. | | 2,487 | 41,350 |
| Godrej Properties Ltd.(1) | | 1,000 | 37,764 |
| Havells India Ltd. | | 3,343 | 80,571 |
| HCL Technologies Ltd. | | 18,501 | 396,272 |
| HDFC Bank Ltd. | | 53,010 | 1,091,674 |
| HDFC Life Insurance Co. Ltd.(2) | | 5,700 | 48,868 |
| Hero MotoCorp Ltd. | | 3,715 | 253,924 |
| Hindustan Unilever Ltd. | | 13,521 | 477,426 |
| ICICI Bank Ltd. | | 52,124 | 791,600 |
| IDFC First Bank Ltd.(1) | | 61,395 | 54,439 |
| Indian Hotels Co. Ltd. | | 19,930 | 163,304 |
| Indian Railway Catering & Tourism Corp. Ltd. | | 13,222 | 146,145 |
| Indian Renewable Energy Development Agency Ltd.(1) | | 3,900 | 10,840 |
| Indus Towers Ltd.(1) | | 18,453 | 85,904 |
| IndusInd Bank Ltd. | | 11,840 | 204,026 |
| Info Edge India Ltd. | | 3,779 | 367,804 |
| IRB Infrastructure Developers Ltd. | | 15,600 | 11,349 |
| IRCON International Ltd.(2) | | 3,000 | 8,158 |
| Kotak Mahindra Bank Ltd. | | 17,460 | 387,195 |
| KPIT Technologies Ltd. | | 5,354 | 104,053 |
| Laurus Labs Ltd.(2) | | 5,460 | 29,997 |
| LTIMindtree Ltd.(2) | | 3,349 | 249,518 |
| MakeMyTrip Ltd.(1) | | 857 | 79,658 |
| Marico Ltd. | | 1,455 | 12,062 |
| Maruti Suzuki India Ltd. | | 2,252 | 355,823 |
| Max Healthcare Institute Ltd. | | 11,179 | 132,540 |
| Mphasis Ltd. | | 1,045 | 37,488 |
| Multi Commodity Exchange of India Ltd. | | 200 | 13,534 |
| NBCC India Ltd. | | 6,400 | 13,679 |
| Nestle India Ltd. | | 7,691 | 247,525 |
| One 97 Communications Ltd.(1) | | 2,200 | 18,147 |
| Patanjali Foods Ltd. | | 2,007 | 39,910 |
| PB Fintech Ltd.(1) | | 2,200 | 42,104 |
| Persistent Systems Ltd. | | 2,896 | 188,422 |
| Punjab National Bank | | 41,181 | 52,513 |
| REC Ltd. | | 7,300 | 48,209 |
| Shriram Finance Ltd. | | 2,000 | 85,731 |
| Siemens Ltd. | | 2,483 | 214,331 |
| Sona BLW Precision Forgings Ltd.(2) | | 3,300 | 29,077 |
| State Bank of India | | 31,004 | 291,134 |
| Sterling & Wilson Renewable(1)(3) | | 1,000 | 7,346 |
| Suzlon Energy Ltd.(1) | | 67,500 | 64,563 |
| Tata Consultancy Services Ltd. | | 13,438 | 684,643 |
1
See Notes to Financial Statements.
Calvert
Emerging Markets Advancement Fund
September 30, 2024
Schedule of Investments — continued
| Security | Shares | Value |
| India (continued) | |
| Tata Elxsi Ltd. | | 687 | $ 63,420 |
| Tata Motors Ltd. | | 32,352 | 376,221 |
| Tata Power Co. Ltd. | | 39,492 | 227,031 |
| Tata Teleservices Maharashtra Ltd.(1) | | 10,694 | 10,813 |
| Tech Mahindra Ltd. | | 14,419 | 271,647 |
| Titan Co. Ltd. | | 6,830 | 311,816 |
| Trent Ltd. | | 3,708 | 334,824 |
| TVS Motor Co. Ltd. | | 1,933 | 65,801 |
| Union Bank of India Ltd. | | 9,300 | 13,652 |
| Vodafone Idea Ltd.(1) | | 256,518 | 31,728 |
| Voltas Ltd. | | 2,965 | 65,452 |
| Wipro Ltd. | | 37,112 | 239,161 |
| WNS Holdings Ltd.(1) | | 586 | 30,888 |
| Yes Bank Ltd.(1) | | 429,324 | 115,253 |
| Zee Entertainment Enterprises Ltd.(1) | | 11,487 | 18,863 |
| Zomato Ltd.(1) | | 193,626 | 629,305 |
| | | | $14,193,472 |
| Malaysia — 6.3% | |
| AMMB Holdings Bhd. | | 202,900 | $246,157 |
| Axiata Group Bhd. | | 98,500 | 60,040 |
| CELCOMDIGI Bhd. | | 261,600 | 236,236 |
| CIMB Group Holdings Bhd. | | 407,800 | 797,998 |
| Fraser & Neave Holdings Bhd. | | 8,600 | 65,132 |
| Gamuda Bhd. | | 195,334 | 382,119 |
| Hong Leong Bank Bhd. | | 36,100 | 189,009 |
| IHH Healthcare Bhd. | | 138,200 | 239,478 |
| IJM Corp. Bhd. | | 297,900 | 211,973 |
| Inari Amertron Bhd. | | 94,500 | 66,533 |
| Maxis Bhd. | | 85,300 | 81,729 |
| Mr. DIY Group M Bhd.(2) | | 271,600 | 139,280 |
| Petronas Gas Bhd. | | 63,500 | 277,179 |
| PPB Group Bhd. | | 93,100 | 325,916 |
| Press Metal Aluminium Holdings Bhd. | | 309,100 | 380,014 |
| Public Bank Bhd. | | 664,600 | 734,635 |
| RHB Bank Bhd. | | 97,000 | 145,373 |
| SD Guthrie Bhd. | | 263,700 | 305,880 |
| Telekom Malaysia Bhd. | | 41,200 | 66,933 |
| Tenaga Nasional Bhd. | | 200,500 | 702,967 |
| TIME dotCom Bhd. | | 39,100 | 44,898 |
| | | | $5,699,479 |
| Philippines — 3.0% | |
| Bank of the Philippine Islands | | 274,710 | $665,410 |
| BDO Unibank, Inc. | | 342,220 | 969,054 |
| Globe Telecom, Inc. | | 4,450 | 180,404 |
| GT Capital Holdings, Inc. | | 15,790 | 205,698 |
| Monde Nissin Corp.(2) | | 838,300 | 151,847 |
| PLDT, Inc. | | 12,695 | 337,011 |
| Universal Robina Corp. | | 118,920 | 220,729 |
| | | | $2,730,153 |
| Security | Shares | Value |
| Poland — 8.9% | |
| Allegro.eu SA(1)(2) | | 49,021 | $ 443,223 |
| Bank Millennium SA(1) | | 81,000 | 179,013 |
| Bank Polska Kasa Opieki SA | | 21,321 | 814,032 |
| Budimex SA | | 1,764 | 273,722 |
| CCC SA(1) | | 4,256 | 187,517 |
| CD Projekt SA | | 8,118 | 367,330 |
| Cyfrowy Polsat SA(1) | | 40,735 | 134,861 |
| Dino Polska SA(1)(2) | | 4,422 | 402,530 |
| Inter Cars SA | | 1,648 | 220,764 |
| KGHM Polska Miedz SA | | 27,028 | 1,117,661 |
| KRUK SA | | 2,568 | 295,807 |
| LPP SA | | 98 | 401,694 |
| mBank SA(1) | | 1,723 | 276,477 |
| Orange Polska SA | | 104,046 | 228,219 |
| PGE Polska Grupa Energetyczna SA(1) | | 117,408 | 219,442 |
| Powszechna Kasa Oszczednosci Bank Polski SA | | 100,051 | 1,457,961 |
| Powszechny Zaklad Ubezpieczen SA | | 67,845 | 741,681 |
| Santander Bank Polska SA | | 3,208 | 379,084 |
| | | | $8,141,018 |
| Romania — 0.1% | |
| NEPI Rockcastle NV | | 12,033 | $101,996 |
| | | | $101,996 |
| Slovenia — 2.3% | |
| Nova Ljubljanska Banka DD GDR(3) | | 80,100 | $2,130,855 |
| | | | $2,130,855 |
| South Africa — 4.8% | |
| Absa Group Ltd. | | 19,208 | $195,005 |
| Anglo American Platinum Ltd.(4) | | 1,100 | 39,570 |
| Aspen Pharmacare Holdings Ltd. | | 8,241 | 92,835 |
| Bid Corp. Ltd.(4) | | 7,797 | 199,910 |
| Bidvest Group Ltd.(4) | | 8,070 | 136,818 |
| Capitec Bank Holdings Ltd. | | 2,118 | 372,417 |
| Clicks Group Ltd. | | 5,390 | 123,782 |
| Discovery Ltd. | | 12,099 | 120,480 |
| FirstRand Ltd. | | 134,884 | 647,079 |
| Gold Fields Ltd. | | 27,330 | 423,831 |
| Growthpoint Properties Ltd. | | 47,500 | 38,548 |
| Investec Ltd. | | 4,000 | 30,342 |
| Kumba Iron Ore Ltd. | | 1,300 | 30,185 |
| Mr. Price Group Ltd. | | 5,955 | 93,234 |
| MTN Group Ltd. | | 42,168 | 223,916 |
| MultiChoice Group(1) | | 4,100 | 25,935 |
| Nedbank Group Ltd. | | 11,257 | 194,427 |
| Northam Platinum Holdings Ltd. | | 10,152 | 64,138 |
| Old Mutual Ltd.(4) | | 116,178 | 92,231 |
| OUTsurance Group Ltd. | | 17,885 | 60,193 |
| Pepkor Holdings Ltd.(2) | | 26,200 | 36,500 |
| Remgro Ltd. | | 11,389 | 103,725 |
2
See Notes to Financial Statements.
Calvert
Emerging Markets Advancement Fund
September 30, 2024
Schedule of Investments — continued
| Security | Shares | Value |
| South Africa (continued) | |
| Sanlam Ltd. | | 52,212 | $ 265,575 |
| Shoprite Holdings Ltd.(4) | | 10,582 | 180,733 |
| Standard Bank Group Ltd. | | 32,445 | 454,357 |
| Vodacom Group Ltd. | | 12,388 | 78,633 |
| Woolworths Holdings Ltd.(4) | | 19,523 | 76,948 |
| | | | $ 4,401,347 |
| Taiwan — 13.0% | |
| Accton Technology Corp. | | 11,000 | $ 184,048 |
| Acer, Inc. | | 85,000 | 109,406 |
| Advantech Co. Ltd. | | 10,000 | 101,323 |
| Airtac International Group | | 4,000 | 114,564 |
| ASE Technology Holding Co. Ltd. | | 41,000 | 194,443 |
| Asia Vital Components Co. Ltd. | | 6,000 | 111,162 |
| AUO Corp. | | 220,000 | 117,987 |
| Catcher Technology Co. Ltd. | | 19,000 | 141,813 |
| Cathay Financial Holding Co. Ltd. | | 97,000 | 203,675 |
| Chailease Holding Co. Ltd. | | 28,929 | 148,795 |
| Chroma ATE, Inc. | | 14,000 | 164,373 |
| Chunghwa Telecom Co. Ltd. | | 49,000 | 193,953 |
| Compal Electronics, Inc. | | 118,000 | 123,823 |
| Delta Electronics, Inc. | | 19,000 | 226,690 |
| E Ink Holdings, Inc. | | 20,000 | 185,396 |
| Elite Material Co. Ltd. | | 8,000 | 112,949 |
| Evergreen Marine Corp. Taiwan Ltd. | | 18,000 | 114,396 |
| Far Eastern New Century Corp. | | 115,000 | 138,754 |
| Far EasTone Telecommunications Co. Ltd. | | 50,000 | 143,099 |
| First Financial Holding Co. Ltd. | | 6,090 | 5,270 |
| Fubon Financial Holding Co. Ltd. | | 86,550 | 246,405 |
| Gigabyte Technology Co. Ltd. | | 14,000 | 114,175 |
| Globalwafers Co. Ltd. | | 7,000 | 100,345 |
| Hiwin Technologies Corp. | | 18,000 | 121,460 |
| Hotai Motor Co. Ltd. | | 4,000 | 88,983 |
| Hua Nan Financial Holdings Co. Ltd. | | 1,570 | 1,274 |
| Innolux Corp. | | 254,320 | 129,423 |
| Inventec Corp. | | 79,000 | 107,347 |
| Lite-On Technology Corp. | | 40,000 | 125,532 |
| MediaTek, Inc. | | 12,000 | 442,266 |
| Mega Financial Holding Co. Ltd. | | 5,610 | 6,964 |
| Micro-Star International Co. Ltd. | | 22,000 | 120,269 |
| Novatek Microelectronics Corp. | | 11,000 | 179,095 |
| President Chain Store Corp. | | 15,000 | 139,514 |
| Quanta Computer, Inc. | | 28,000 | 233,358 |
| Realtek Semiconductor Corp. | | 11,000 | 163,268 |
| Shin Kong Financial Holding Co. Ltd.(1) | | 497,516 | 188,027 |
| Sino-American Silicon Products, Inc. | | 18,000 | 100,528 |
| SinoPac Financial Holdings Co. Ltd. | | 5,950 | 4,558 |
| Taishin Financial Holding Co. Ltd. | | 10,240 | 5,943 |
| Taiwan Mobile Co. Ltd. | | 37,000 | 134,428 |
| Taiwan Semiconductor Manufacturing Co. Ltd. | | 160,000 | 4,824,660 |
| Tatung Co. Ltd.(1) | | 77,000 | 119,308 |
| Security | Shares | Value |
| Taiwan (continued) | |
| TCC Group Holdings Co. Ltd. | | 107,000 | $ 114,005 |
| Teco Electric & Machinery Co. Ltd. | | 74,000 | 113,700 |
| Unimicron Technology Corp. | | 22,000 | 99,901 |
| Uni-President Enterprises Corp. | | 55,000 | 150,487 |
| United Microelectronics Corp. | | 127,000 | 214,054 |
| Walsin Lihwa Corp. | | 118,000 | 130,259 |
| WPG Holdings Ltd. | | 50,000 | 118,306 |
| Yageo Corp. | | 7,169 | 141,122 |
| Yuanta Financial Holding Co. Ltd. | | 237,660 | 237,588 |
| | | | $11,852,471 |
| Thailand — 5.1% | |
| Advanced Info Service PCL(5) | | 33,900 | $273,549 |
| Advanced Info Service PCL | | 23,800 | 192,049 |
| Bangkok Bank PCL | | 14,000 | 65,271 |
| Bangkok Bank PCL(5) | | 18,000 | 83,920 |
| Bangkok Dusit Medical Services PCL | | 193,400 | 179,635 |
| Bangkok Dusit Medical Services PCL(5) | | 302,200 | 280,691 |
| Bumrungrad Hospital PCL(5) | | 10,500 | 87,285 |
| Bumrungrad Hospital PCL | | 8,400 | 69,828 |
| Central Pattana PCL(5) | | 74,800 | 154,762 |
| Central Pattana PCL | | 47,900 | 99,106 |
| Central Retail Corp. PCL(5) | | 123,500 | 118,200 |
| Central Retail Corp. PCL(2) | | 112,600 | 107,767 |
| Charoen Pokphand Foods PCL(5) | | 120,000 | 88,964 |
| Charoen Pokphand Foods PCL | | 93,300 | 69,169 |
| CP ALL PCL(5) | | 202,800 | 411,036 |
| CP ALL PCL | | 136,700 | 277,064 |
| Delta Electronics Thailand PCL(5) | | 138,500 | 457,488 |
| Delta Electronics Thailand PCL | | 88,800 | 293,321 |
| Energy Absolute PCL(5) | | 82,900 | 22,794 |
| Home Product Center PCL(5) | | 234,600 | 75,378 |
| Home Product Center PCL | | 222,300 | 71,426 |
| Indorama Ventures PCL(5) | | 46,000 | 35,206 |
| Intouch Holdings PCL(5) | | 26,600 | 76,228 |
| Intouch Holdings PCL | | 25,100 | 71,930 |
| Kasikornbank PCL(5) | | 18,500 | 86,133 |
| Kasikornbank PCL | | 15,600 | 72,631 |
| Krungthai Card PCL(5) | | 33,300 | 50,172 |
| Krungthai Card PCL | | 42,500 | 64,033 |
| Land & Houses PCL(5) | | 452,800 | 89,605 |
| Land & Houses PCL | | 343,700 | 68,015 |
| Minor International PCL(5) | | 109,600 | 95,926 |
| Minor International PCL | | 69,300 | 60,654 |
| Muangthai Capital PCL(5) | | 20,900 | 31,899 |
| SCB X PCL(5) | | 26,500 | 89,536 |
| SCB X PCL | | 19,800 | 66,899 |
| SCG Packaging PCL(5) | | 32,900 | 29,495 |
| TMBThanachart Bank PCL(5) | | 771,400 | 47,032 |
| WHA Corp. PCL(5) | | 452,900 | 76,716 |
3
See Notes to Financial Statements.
Calvert
Emerging Markets Advancement Fund
September 30, 2024
Schedule of Investments — continued
| Security | Shares | Value |
| Thailand (continued) | |
| WHA Corp. PCL | | 387,800 | $ 65,689 |
| | | | $ 4,656,502 |
| United Arab Emirates — 9.9% | |
| Abu Dhabi Commercial Bank PJSC | | 283,856 | $ 650,693 |
| Aldar Properties PJSC | | 1,507,492 | 3,084,124 |
| Americana Restaurants International PLC - Foreign Co. | | 584,104 | 421,564 |
| Dubai Financial Market PJSC | | 188,038 | 67,045 |
| Dubai Islamic Bank PJSC | | 116,847 | 200,462 |
| Emirates Integrated Telecommunications Co. PJSC | | 158,471 | 301,318 |
| Emirates Telecommunications Group Co. PJSC | | 588,273 | 2,962,437 |
| Fertiglobe PLC | | 90,265 | 64,147 |
| First Abu Dhabi Bank PJSC | | 334,719 | 1,251,459 |
| | | | $9,003,249 |
| United Kingdom — 0.1% | |
| Pepco Group NV(1)(3) | | 20,032 | $106,878 |
| | | | $106,878 |
| Vietnam — 3.0% | |
| Digiworld Corp. | | 377,260 | $717,445 |
| FPT Corp. | | 319,920 | 1,751,580 |
| Gemadept Corp. | | 91,800 | 291,728 |
| | | | $2,760,753 |
Total Common Stocks
(identified cost $69,256,871) | | | $89,258,102 |
| Short-Term Investments — 0.0%(6) |
| Security | Shares | Value |
| Morgan Stanley Institutional Liquidity Funds - Government Portfolio, Institutional Class, 4.83%(7) | | 17,570 | $ 17,570 |
Total Short-Term Investments
(identified cost $17,570) | | | $ 17,570 |
| | | |
Total Investments — 97.8%
(identified cost $69,274,441) | | $89,275,672 |
| Other Assets, Less Liabilities — 2.2% | | $ 1,983,932 |
| Net Assets — 100.0% | | $91,259,604 |
| The percentage shown for each investment category in the Schedule of Investments is based on net assets. |
| (1) | Non-income producing security. |
| (2) | Security exempt from registration under Rule 144A of the Securities Act of 1933, as amended. These securities may be sold in certain transactions in reliance on an exemption from registration (normally to qualified institutional buyers). At September 30, 2024, the aggregate value of these securities is $1,995,932 or 2.2% of the Fund's net assets. |
| (3) | Security exempt from registration under Regulation S of the Securities Act of 1933, as amended, which exempts from registration securities offered and sold outside the United States. Security may not be offered or sold in the United States except pursuant to an exemption from, or in a transaction not subject to, the registration requirements of the Securities Act of 1933, as amended. At September 30, 2024, the aggregate value of these securities is $2,383,840 or 2.5% of the Fund's net assets. |
| (4) | All or a portion of this security was on loan at September 30, 2024. The aggregate market value of securities on loan at September 30, 2024 was $115,659. |
| (5) | Indicates a foreign registered security. Shares issued to foreign investors in markets that have foreign ownership limits. |
| (6) | Amount is less than 0.05%. |
| (7) | May be deemed to be an affiliated investment company. The rate shown is the annualized seven-day yield as of September 30, 2024. |
4
See Notes to Financial Statements.
Calvert
Emerging Markets Advancement Fund
September 30, 2024
Schedule of Investments — continued
At September 30, 2024, the concentration of the Fund’s investments in the various sectors, determined as a percentage of net assets, was as follows:
| Economic Sectors | % of Net Assets |
| Financials | 39.6% |
| Information Technology | 16.1 |
| Communication Services | 10.0 |
| Consumer Discretionary | 7.8 |
| Utilities | 5.4 |
| Real Estate | 5.1 |
| Consumer Staples | 4.8 |
| Industrials | 4.4 |
| Materials | 2.9 |
| Health Care | 1.7 |
| Total | 97.8% |
Forward Foreign Currency Exchange Contracts (OTC)
| Currency Purchased | Currency Sold | Counterparty | Settlement
Date | Unrealized
Appreciation | Unrealized
(Depreciation) |
| USD | 1,827,451 | EUR | 1,650,000 | UBS AG | 10/4/24 | $ — | $(9,388) |
| USD | 22,586,186 | EUR | 20,393,000 | UBS AG | 10/4/24 | — | (116,035) |
| USD | 1,368,295 | KRW | 1,829,000,000 | Goldman Sachs International | 10/15/24 | — | (19,212) |
| USD | 4,896,523 | KRW | 6,544,000,000 | Standard Chartered Bank | 10/15/24 | — | (67,854) |
| INR | 356,900,000 | USD | 4,234,644 | Goldman Sachs International | 12/18/24 | 8,852 | — |
| INR | 215,000,000 | USD | 2,550,566 | Goldman Sachs International | 12/18/24 | 5,756 | — |
| KRW | 8,625,000,000 | USD | 6,471,436 | Goldman Sachs International | 12/18/24 | 92,562 | — |
| KRW | 1,175,000,000 | USD | 881,722 | Goldman Sachs International | 12/18/24 | 12,504 | — |
| TWD | 42,817,602 | USD | 1,354,816 | Goldman Sachs International | 12/18/24 | 9,960 | — |
| TWD | 95,000,000 | USD | 2,999,612 | UBS AG | 12/18/24 | 28,436 | — |
| TWD | 33,829,000 | USD | 1,068,070 | UBS AG | 12/18/24 | 10,202 | — |
| TWD | 43,000,000 | USD | 1,363,122 | UBS AG | 12/18/24 | 7,468 | — |
| TWD | 32,199,000 | USD | 1,021,637 | UBS AG | 12/18/24 | 4,680 | — |
| TWD | 5,000,000 | USD | 157,920 | UBS AG | 12/18/24 | 1,451 | — |
| TWD | 2,148,881 | USD | 69,015 | UBS AG | 12/18/24 | — | (522) |
| USD | 1,071,927 | KRW | 1,427,000,000 | UBS AG | 12/18/24 | — | (14,081) |
| USD | 1,439,910 | PHP | 80,473,716 | Goldman Sachs International | 12/18/24 | 6,617 | — |
| USD | 1,216,654 | PHP | 68,121,425 | UBS AG | 12/18/24 | 3,363 | — |
| | | | | | | $191,851 | $(227,092) |
| Abbreviations: |
| GDR | – Global Depositary Receipt |
| OTC | – Over-the-counter |
| PCL | – Public Company Limited |
5
See Notes to Financial Statements.
Calvert
Emerging Markets Advancement Fund
September 30, 2024
Schedule of Investments — continued
| Currency Abbreviations: |
| EUR | – Euro |
| INR | – Indian Rupee |
| KRW | – South Korean Won |
| PHP | – Philippines Peso |
| TWD | – New Taiwan Dollar |
| USD | – United States Dollar |
6
See Notes to Financial Statements.
Calvert
Emerging Markets Advancement Fund
September 30, 2024
Statement of Assets and Liabilities
| | September 30, 2024 |
| Assets | |
Investments in securities of unaffiliated issuers, at value (identified cost $69,256,871) - including
$115,659 of securities on loan | $89,258,102 |
| Investments in securities of affiliated issuers, at value (identified cost $17,570) | 17,570 |
| Receivable for open forward foreign currency exchange contracts | 191,851 |
| Cash | 121 |
| Cash denominated in foreign currency, at value (cost $2,238,226) | 2,259,166 |
| Deposits for derivatives collateral - forward foreign currency exchange contracts | 1,820,000 |
| Receivable for investments sold | 2,532,103 |
| Receivable for capital shares sold | 117,421 |
| Dividends receivable | 151,569 |
| Dividends receivable - affiliated | 4,731 |
| Securities lending income receivable | 39 |
| Tax reclaims receivable | 24,531 |
| Receivable from affiliates | 75,039 |
| Directors' deferred compensation plan | 1,586 |
| Total assets | $96,453,829 |
| Liabilities | |
| Cash collateral due to broker | $120,000 |
| Payable for open forward foreign currency exchange contracts | 227,092 |
| Payable for line of credit | 600,000 |
| Payable for investments purchased | 3,609,478 |
| Payable for capital shares redeemed | 38,446 |
| Payable for foreign capital gains taxes | 424,605 |
| Payable to affiliates: | |
| Investment advisory fee | 46,439 |
| Administrative fee | 8,875 |
| Distribution and service fees | 614 |
| Sub-transfer agency fee | 499 |
| Directors' deferred compensation plan | 1,586 |
| Accrued expenses | 116,591 |
| Total liabilities | $5,194,225 |
| Net Assets | $91,259,604 |
| Sources of Net Assets | |
| Paid-in capital | $82,487,236 |
| Distributable earnings | 8,772,368 |
| Net Assets | $91,259,604 |
| Class A Shares | |
| Net Assets | $3,113,610 |
| Shares Outstanding | 260,608 |
Net Asset Value and Redemption Price Per Share
(net assets ÷ shares of beneficial interest outstanding) | $11.95 |
Maximum Offering Price Per Share
(100 ÷ 94.75 of net asset value per share) | $12.61 |
7
See Notes to Financial Statements.
Calvert
Emerging Markets Advancement Fund
September 30, 2024
Statement of Assets and Liabilities — continued
| | September 30, 2024 |
| Class I Shares | |
| Net Assets | $88,145,994 |
| Shares Outstanding | 7,318,173 |
Net Asset Value, Offering Price and Redemption Price Per Share
(net assets ÷ shares of beneficial interest outstanding) | $12.04 |
| On sales of $50,000 or more, the offering price of Class A shares is reduced. |
8
See Notes to Financial Statements.
Calvert
Emerging Markets Advancement Fund
September 30, 2024
| | Year Ended |
| | September 30, 2024 |
| Investment Income | |
| Dividend income (net of foreign taxes withheld of $334,869) | $2,744,792 |
| Dividend income - affiliated issuers | 57,377 |
| Interest income (net of foreign taxes withheld of $23) | 6,848 |
| Securities lending income, net | 12,320 |
| Total investment income | $2,821,337 |
| Expenses | |
| Investment advisory fee | $577,104 |
| Administrative fee | 109,924 |
| Distribution and service fees: | |
| Class A | 6,331 |
| Directors' fees and expenses | 5,415 |
| Custodian fees | 110,730 |
| Transfer agency fees and expenses | 43,030 |
| Accounting fees | 23,474 |
| Professional fees | 116,151 |
| Registration fees | 37,275 |
| Reports to shareholders | 6,789 |
| Interest expense and fees | 23,208 |
| Miscellaneous | 23,201 |
| Total expenses | $1,082,632 |
| Waiver and/or reimbursement of expenses by affiliates | $(184,480) |
| Net expenses | $898,152 |
| Net investment income | $1,923,185 |
| Realized and Unrealized Gain (Loss) | |
| Net realized gain (loss): | |
| Investment securities (net of foreign capital gains taxes of $135,917) | $766,778 |
| Futures contracts | 98,452 |
| Foreign currency transactions | 50,836 |
| Forward foreign currency exchange contracts | 200,783 |
| Net realized gain | $1,116,849 |
| Change in unrealized appreciation (depreciation): | |
| Investment securities (including net increase in payable for foreign capital gains taxes of $344,043) | $16,398,790 |
| Futures contracts | 188,760 |
| Foreign currency | 24,917 |
| Forward foreign currency exchange contracts | (890,141) |
| Net change in unrealized appreciation (depreciation) | $15,722,326 |
| Net realized and unrealized gain | $16,839,175 |
| Net increase in net assets from operations | $18,762,360 |
9
See Notes to Financial Statements.
Calvert
Emerging Markets Advancement Fund
September 30, 2024
Statements of Changes in Net Assets
| | Year Ended September 30, |
| | 2024 | 2023 |
| Increase (Decrease) in Net Assets | | |
| From operations: | | |
| Net investment income | $1,923,185 | $1,306,126 |
| Net realized gain (loss) | 1,116,849 | (3,465,030) |
| Net change in unrealized appreciation (depreciation) | 15,722,326 | 8,002,256 |
| Net increase in net assets from operations | $18,762,360 | $5,843,352 |
| Distributions to shareholders: | | |
| Class A | $(65,901) | $(95,421) |
| Class I | (3,027,385) | (4,071,452) |
| Total distributions to shareholders | $(3,093,286) | $(4,166,873) |
| Capital share transactions: | | |
| Class A | $541,944 | $840,988 |
| Class I | (18,375,015) | 17,857,741 |
| Net increase (decrease) in net assets from capital share transactions | $(17,833,071) | $18,698,729 |
| Net increase (decrease) in net assets | $(2,163,997) | $20,375,208 |
| Net Assets | | |
| At beginning of year | $93,423,601 | $73,048,393 |
| At end of year | $91,259,604 | $93,423,601 |
10
See Notes to Financial Statements.
Calvert
Emerging Markets Advancement Fund
September 30, 2024
| | Class A |
| | Year Ended September 30, |
| | 2024 | 2023 | 2022 | 2021 | 2020(1) |
| Net asset value — Beginning of year | $10.05 | $9.79 | $12.39 | $10.64 | $10.00 |
| Income (Loss) From Operations | | | | | |
| Net investment income(2) | $0.22 | $0.13 | $0.17 | $0.09 | $0.10 |
| Net realized and unrealized gain (loss) | 1.99 | 0.66 | (2.23) | 1.67 | 0.59 |
| Total income (loss) from operations | $2.21 | $0.79 | $(2.06) | $1.76 | $0.69 |
| Less Distributions | | | | | |
| From net investment income | $(0.31) | $(0.53) | $(0.06) | $(0.01) | $ — |
| From net realized gain | — | — | (0.48) | — | (0.05) |
| Total distributions | $(0.31) | $(0.53) | $(0.54) | $(0.01) | $(0.05) |
| Net asset value — End of year | $11.95 | $10.05 | $9.79 | $12.39 | $10.64 |
| Total Return(3) | 22.50% | 8.18% | (17.42)% | 16.54% | 6.94% |
| Ratios/Supplemental Data | | | | | |
| Net assets, end of year (000’s omitted) | $3,114 | $2,133 | $1,270 | $477 | $91 |
| Ratios (as a percentage of average daily net assets):(4) | | | | | |
| Total expenses | 1.42%(5) | 1.35%(5) | 1.36%(6) | 1.41% | 1.83% |
| Net expenses | 1.22%(5)(7) | 1.21%(5)(7) | 1.22%(6)(7) | 1.20% | 1.20% |
| Net investment income | 2.03% | 1.31% | 1.53% | 0.68% | 0.99% |
| Portfolio Turnover | 76% | 82% | 45% | 64% | 66% |
| (1) | The Fund commenced operations on October 1, 2019. |
| (2) | Computed using average shares outstanding. |
| (3) | Returns are historical and are calculated by determining the percentage change in net asset value with all distributions reinvested and do not reflect the effect of sales charges, if any. |
| (4) | Total expenses do not reflect amounts reimbursed and/or waived by the adviser and certain of its affiliates, if applicable. Net expenses are net of all reductions and represent the net expenses paid by the Fund. |
| (5) | Includes interest expense and fees of 0.02% and 0.01% of average daily net assets for the years ended September 30, 2024 and 2023, respectively. |
| (6) | Includes interest expense from bank overdrafts of 0.02%. |
| (7) | Includes a reduction by the investment adviser of a portion of its advisory fee due to the Fund’s investment in the Liquidity Fund (equal to less than 0.005% of average daily net assets for the years ended September 30, 2024, 2023 and 2022). |
11
See Notes to Financial Statements.
Calvert
Emerging Markets Advancement Fund
September 30, 2024
Financial Highlights — continued
| | Class I |
| | Year Ended September 30, |
| | 2024 | 2023 | 2022 | 2021 | 2020(1) |
| Net asset value — Beginning of year | $10.13 | $9.85 | $12.44 | $10.66 | $10.00 |
| Income (Loss) From Operations | | | | | |
| Net investment income(2) | $0.23 | $0.16 | $0.19 | $0.09 | $0.12 |
| Net realized and unrealized gain (loss) | 2.02 | 0.66 | (2.23) | 1.71 | 0.59 |
| Total income (loss) from operations | $2.25 | $0.82 | $(2.04) | $1.80 | $0.71 |
| Less Distributions | | | | | |
| From net investment income | $(0.34) | $(0.54) | $(0.07) | $(0.02) | $ — |
| From net realized gain | — | — | (0.48) | — | (0.05) |
| Total distributions | $(0.34) | $(0.54) | $(0.55) | $(0.02) | $(0.05) |
| Net asset value — End of year | $12.04 | $10.13 | $9.85 | $12.44 | $10.66 |
| Total Return(3) | 22.80% | 8.48% | (17.20)% | 16.85% | 7.14% |
| Ratios/Supplemental Data | | | | | |
| Net assets, end of year (000’s omitted) | $88,146 | $91,291 | $71,779 | $57,772 | $41,792 |
| Ratios (as a percentage of average daily net assets):(4) | | | | | |
| Total expenses | 1.17%(5) | 1.10%(5) | 1.11%(6) | 1.16% | 1.58% |
| Net expenses | 0.97%(5)(7) | 0.96%(5)(7) | 0.97%(6)(7) | 0.95% | 0.95% |
| Net investment income | 2.10% | 1.52% | 1.61% | 0.71% | 1.15% |
| Portfolio Turnover | 76% | 82% | 45% | 64% | 66% |
| (1) | The Fund commenced operations on October 1, 2019. |
| (2) | Computed using average shares outstanding. |
| (3) | Returns are historical and are calculated by determining the percentage change in net asset value with all distributions reinvested and do not reflect the effect of sales charges, if any. |
| (4) | Total expenses do not reflect amounts reimbursed and/or waived by the adviser and certain of its affiliates, if applicable. Net expenses are net of all reductions and represent the net expenses paid by the Fund. |
| (5) | Includes interest expense and fees of 0.02% and 0.01% of average daily net assets for the years ended September 30, 2024 and 2023, respectively. |
| (6) | Includes interest expense from bank overdrafts of 0.02%. |
| (7) | Includes a reduction by the investment adviser of a portion of its advisory fee due to the Fund’s investment in the Liquidity Fund (equal to less than 0.005%, 0.01% and less than 0.005% of average daily net assets for the years ended September 30, 2024, 2023 and 2022, respectively). |
12
See Notes to Financial Statements.
Calvert
Emerging Markets Advancement Fund
September 30, 2024
Notes to Financial Statements
1 Significant Accounting Policies
Calvert Emerging Markets Advancement Fund (the Fund) is a diversified series of Calvert World Values Fund, Inc. (the Corporation). The Corporation is a Maryland corporation registered under the Investment Company Act of 1940, as amended (the 1940 Act), as an open-end management investment company. The investment objective of the Fund is total return.
The Fund offers two classes of shares. Class A shares are generally sold subject to a sales charge imposed at time of purchase. A contingent deferred sales charge of 1.00% may apply to certain redemptions of Class A shares for accounts for which no sales charge was paid, if redeemed within 12 months of purchase. Class I shares are sold at net asset value, are not subject to a sales charge and are sold only to certain eligible investors. Each class represents a pro rata interest in the Fund, but votes separately on class-specific matters and is subject to different expenses.
The Fund applies the accounting and reporting guidance in the Financial Accounting Standards Board (FASB) Accounting Standards Codification Topic 946, Financial Services – Investment Companies (ASC 946). Subsequent events, if any, through the date that the financial statements were issued have been evaluated in the preparation of the financial statements.
A Investment Valuation— Net asset value per share is determined every business day as of the close of the regular session of the New York Stock Exchange (generally 4:00 p.m. Eastern time). The Fund uses independent pricing services approved by the Board of Directors (the Board) to value its investments wherever possible. Investments for which market quotations are not available or deemed not reliable are fair valued in good faith by the
Board’s valuation designee.
U.S. generally accepted accounting principles (U.S. GAAP) establishes a disclosure hierarchy that categorizes the inputs to valuation techniques used to value assets and liabilities at measurement date. These inputs are summarized in the three broad levels listed below:
Level 1 - quoted prices in active markets for identical securities
Level 2 - other significant observable inputs (including quoted prices for similar securities, interest rates, prepayment speeds, credit risk, etc.)
Level 3 - significant unobservable inputs (including the Fund’s own assumptions in determining the fair value of investments)
The inputs or methodologies used for valuing securities are not necessarily an indication of the risk associated with investing in those securities.
Valuation techniques used to value the Fund’s investments by major category are as follows:
Equity Securities. Equity securities (including warrants and rights) listed on a U.S. securities exchange generally are valued at the last sale or closing price as reported by an independent pricing service on the primary market or exchange on which they are traded and are categorized as Level 1 in the hierarchy. Equity securities listed on the NASDAQ National Market System are valued at the NASDAQ official closing price and are categorized as Level 1 in the hierarchy. Unlisted or listed securities for which closing sales prices or closing quotations are not available are valued at the mean between the latest available bid and ask prices and are categorized as Level 2 in the hierarchy. The daily valuation of exchange-traded foreign securities generally is determined as of the close of trading on the principal exchange on which such securities trade. Events occurring after the close of trading on foreign exchanges may result in adjustments to the valuation of foreign securities to more accurately reflect their fair value as of the close of regular trading on the New York Stock Exchange. When valuing foreign equity securities that meet certain criteria, the Fund's Board has approved the use of a fair value service that values such securities to reflect market trading that occurs after the close of the applicable foreign markets of comparable securities or other instruments that have a strong correlation to the fair-valued securities. Such securities are categorized as Level 2 in the hierarchy.
Other Securities. Investments in management investment companies (including money market funds) that do not trade on an exchange are valued at the net asset value as of the close of each business day and are categorized as Level 1 in the hierarchy.
Derivatives. Forward foreign currency exchange contracts are generally valued at the mean of the average bid and average ask prices that are reported by currency dealers to a third party pricing service at the valuation time. Such third party pricing service valuations are supplied for specific settlement periods and the Fund's forward foreign currency exchange contracts are valued at an interpolated rate between the closest preceding and subsequent settlement period reported by the third party pricing service and are categorized as Level 2 in the hierarchy.
Fair Valuation. In connection with Rule 2a-5 of the 1940 Act, the Board has designated the Fund’s investment adviser as its valuation designee. Investments for which valuations or market quotations are not readily available or are deemed unreliable are valued by the investment adviser, as valuation designee, at fair value using methods that most fairly reflect the security’s “fair value”, which is the amount that the Fund might reasonably expect to receive for the security upon its current sale in the ordinary course. Each such determination is based on a consideration of relevant factors, which are likely to vary from one pricing context to another. These factors may include, but are not limited to, the type of security, the existence of any contractual restrictions on the security’s disposition, the price and extent of public trading in similar securities of the issuer or of comparable companies or entities, quotations or relevant information obtained from broker/dealers or other market participants, information obtained from the issuer, analysts, and/or the appropriate stock exchange (for exchange-traded securities), an analysis of the company’s or entity’s financial statements, and an evaluation of the forces that influence the issuer and the market(s) in which the security is purchased and sold.
Calvert
Emerging Markets Advancement Fund
September 30, 2024
Notes to Financial Statements — continued
The values assigned to fair value investments are based on available information and do not necessarily represent amounts that might ultimately be realized. Further, due to the inherent uncertainty of valuations of such investments, the fair values may differ significantly from the values that would have been used had an active market existed, and the differences could be material.
The following table summarizes the market value of the Fund's holdings as of September 30, 2024, based on the inputs used to value them:
| Asset Description | Level 1 | Level 2 | Level 3 | Total |
| Common Stocks: | | | | |
| Cyprus | $3,099,142 | $ — | $ — | $3,099,142 |
| Egypt | 878,604 | — | — | 878,604 |
| Georgia | — | 3,960,500 | — | 3,960,500 |
| Greece | — | 15,541,683 | — | 15,541,683 |
| India | 110,546 | 14,082,926 | — | 14,193,472 |
| Malaysia | — | 5,699,479 | — | 5,699,479 |
| Philippines | — | 2,730,153 | — | 2,730,153 |
| Poland | — | 8,141,018 | — | 8,141,018 |
| Romania | — | 101,996 | — | 101,996 |
| Slovenia | — | 2,130,855 | — | 2,130,855 |
| South Africa | — | 4,401,347 | — | 4,401,347 |
| Taiwan | — | 11,852,471 | — | 11,852,471 |
| Thailand | — | 4,656,502 | — | 4,656,502 |
| United Arab Emirates | — | 9,003,249 | — | 9,003,249 |
| United Kingdom | — | 106,878 | — | 106,878 |
| Vietnam | — | 2,760,753 | — | 2,760,753 |
| Total Common Stocks | $4,088,292 | $85,169,810(1) | $ — | $89,258,102 |
| Short-Term Investments | $17,570 | $ — | $ — | $17,570 |
| Total Investments | $4,105,862 | $85,169,810 | $ — | $89,275,672 |
| Forward Foreign Currency Exchange Contracts | $ — | $191,851 | $ — | $191,851 |
| Total | $4,105,862 | $85,361,661 | $ — | $89,467,523 |
| Liability Description | | | | |
| Forward Foreign Currency Exchange Contracts | $ — | $(227,092) | $ — | $(227,092) |
| Total | $ — | $(227,092) | $ — | $(227,092) |
| (1) | Includes foreign equity securities whose values were adjusted to reflect market trading of comparable securities or other correlated instruments that occurred after the close of trading in their applicable foreign markets. |
B Investment Transactions and Income— Investment transactions for financial statement purposes are accounted for on trade date. Realized gains and losses are recorded on an identified cost basis and may include proceeds from litigation. Dividend income is recorded on the ex-dividend date for dividends received in cash and/or securities or, in the case of dividends on certain foreign securities, as soon as the Fund is informed of the ex-dividend date. Non-cash dividends are recorded at the fair value of the securities received. Withholding taxes on foreign dividends and interest, if any, have been provided for in accordance with the Fund’s understanding of the applicable country’s tax rules and rates. Distributions received that represent a return of capital are recorded as a reduction of cost of investments. Distributions received that represent a capital gain are recorded as a realized gain.
C Share Class Accounting— Realized and unrealized gains and losses and net investment income and losses, other than class-specific expenses, are allocated daily to each class of shares based upon the relative net assets of each class to the total net assets of the Fund. Expenses arising in connection with a specific class are charged directly to that class.
D Foreign Currency Transactions— The Fund’s accounting records are maintained in U.S. dollars. For valuation of assets and liabilities on each date of net asset value determination, foreign denominations are converted into U.S. dollars using the current exchange rate. Security transactions, income and
Calvert
Emerging Markets Advancement Fund
September 30, 2024
Notes to Financial Statements — continued
expenses are translated at the prevailing rate of exchange on the date of the event. Recognized gains or losses on investment transactions attributable to changes in foreign currency exchange rates are recorded for financial statement purposes as net realized gains and losses on investments. That portion of unrealized gains and losses on investments that results from fluctuations in foreign currency exchange rates is not separately disclosed.
E Futures Contracts— The Fund may enter into futures contracts to buy or sell a financial instrument for a set price at a future date. Initial margin deposits of either cash or securities as required by the broker are made upon entering into the contract. While the contract is open, daily variation margin payments are made to or received from the broker reflecting the daily change in market value of the contract and are recorded for financial reporting purposes as unrealized gains or losses by the Fund. When a futures contract is closed, a realized gain or loss is recorded equal to the difference between the opening and closing value of the contract. The risks associated with entering into futures contracts may include the possible illiquidity of the secondary market which would limit the Fund’s ability to close out a futures contract prior to the settlement date, an imperfect correlation between the value of the contracts and the underlying financial instruments, or that the counterparty will fail to perform its obligations under the contracts’ terms. Futures contracts are designed by boards of trade, which are designated “contracts markets” by the Commodities Futures Trading Commission. Futures contracts trade on the contracts markets in a manner that is similar to the way a stock trades on a stock exchange, and the boards of trade, through their clearing corporations, guarantee the futures contracts against default. As a result, there is minimal counterparty credit risk to the Fund.
F Forward Foreign Currency Exchange Contracts— The Fund may enter into forward foreign currency exchange contracts for the purchase or sale of a specific foreign currency at a fixed price on a future date. The forward foreign currency exchange contracts are adjusted by the daily exchange rate of the underlying currency and any gains or losses are recorded as unrealized until such time as the contracts have been closed. Risks may arise upon entering these contracts from the potential inability of counterparties to meet the terms of their contracts and from movements in the value of a foreign currency relative to the U.S. dollar.
G Distributions to Shareholders— Distributions to shareholders are recorded by the Fund on ex-dividend date. Distributions from net investment income and distributions from net realized capital gains, if any, are paid at least annually. Distributions are declared separately for each class of shares. Distributions are determined in accordance with income tax regulations, which may differ from U.S. GAAP; accordingly, periodic reclassifications are made within the Fund's capital accounts to reflect income and gains available for distribution under income tax regulations.
H Estimates— The preparation of financial statements in conformity with U.S. GAAP requires management to make estimates and assumptions that affect the reported amounts of assets and liabilities and disclosure of contingent assets and liabilities at the date of the financial statements and the reported amounts of increases and decreases in net assets from operations during the reporting period. Actual results could differ from those estimates.
I Indemnifications— The Corporation’s By-Laws provide for indemnification for Directors or officers of the Corporation and certain other parties, to the fullest extent permitted by Maryland law and the 1940 Act, provided certain conditions are met. Additionally, in the normal course of business, the Fund enters into agreements with service providers that may contain indemnification clauses. The Fund’s maximum exposure under these arrangements is unknown as this would involve future claims that may be made against the Fund that have not yet occurred.
J Federal Income Taxes— No provision for federal income or excise tax is required since the Fund intends to continue to qualify as a regulated investment company under the Internal Revenue Code and to distribute substantially all of its taxable earnings.
In addition to the requirements of the Internal Revenue Code, the Fund may also be subject to local taxes on the recognition of capital gains in certain countries. In determining the daily net asset value, the Fund estimates the accrual for such taxes, if any, based on the unrealized appreciation on certain portfolio securities and the related tax rates. Taxes attributable to unrealized appreciation are included in the change in unrealized appreciation (depreciation) on investments. Capital gains taxes on securities sold are included in net realized gain (loss) on investments.
Management has analyzed the Fund's tax positions taken for all open federal income tax years and has concluded that no provision for federal income tax is required in the Fund's financial statements. A Fund's federal tax return is subject to examination by the Internal Revenue Service for a period of three years from the date of filing.
2 Related Party Transactions
The investment advisory fee is earned by Calvert Research and Management (CRM), an indirect, wholly-owned subsidiary of Morgan Stanley, as compensation for investment advisory services rendered to the Fund. The investment advisory fee is computed at the annual rate of 0.63% of the Fund’s average daily net assets and is payable monthly. For the year ended September 30, 2024, the investment advisory fee amounted to $577,104. Pursuant to an investment sub-advisory agreement, CRM has delegated a portion of the investment management of the Fund to Eaton Vance Advisers International Ltd. (EVAIL), an affiliate of CRM and an indirect, wholly-owned subsidiary of Morgan Stanley. CRM pays EVAIL a portion of its investment advisory fee for sub-advisory services provided to the Fund.
Calvert
Emerging Markets Advancement Fund
September 30, 2024
Notes to Financial Statements — continued
The Fund may invest in a money market fund, the Institutional Class of the Morgan Stanley Institutional Liquidity Funds - Government Portfolio (the “Liquidity Fund”), an open-end management investment company managed by Morgan Stanley Investment Management Inc., a wholly-owned subsidiary of Morgan Stanley. The investment advisory fee paid by the Fund is reduced by an amount equal to its pro rata share of the advisory and administration fees paid by the Fund due to its investment in the Liquidity Fund. For the year ended September 30, 2024, the investment advisory fee paid was reduced by $1,622 relating to the Fund’s investment in the Liquidity Fund.
CRM and EVAIL have agreed to reimburse the Fund’s operating expenses to the extent that total annual operating expenses (relating to ordinary operating expenses only and excluding expenses such as brokerage commissions, acquired fund fees and expenses of unaffiliated funds, borrowing costs, taxes or litigation expenses) exceed 1.20% and 0.95% for Class A and Class I, respectively, of such class’s average daily net assets. The expense reimbursement agreement may be changed or terminated after February 1, 2025. For the year ended September 30, 2024, CRM and EVAIL waived and/or reimbursed expenses in total of $182,858.
The administrative fee is earned by CRM as compensation for administrative services rendered to the Fund. The fee is computed at an annual rate of 0.12% of the Fund’s average daily net assets attributable to Class A and Class I and is payable monthly. For the year ended September 30, 2024, CRM was paid administrative fees of $109,924.
The Fund has in effect a distribution plan for Class A shares (Class A Plan) pursuant to Rule 12b-1 under the 1940 Act. Pursuant to the Class A Plan, the Fund pays Eaton Vance Distributors, Inc. (EVD), an affiliate of CRM and the Fund’s principal underwriter, a distribution and service fee of 0.25% per annum of its average daily net assets attributable to Class A shares for distribution services and facilities provided to the Fund by EVD, as well as for personal services and/or the maintenance of shareholder accounts. Distribution and service fees paid or accrued for the year ended September 30, 2024 amounted to $6,331 for Class A shares.
The Fund was informed that EVD received $158 as its portion of the sales charge on sales of Class A shares for the year ended September 30, 2024. The Fund was also informed that EVD received no contingent deferred sales charges paid by Class A shareholders for the same period.
Eaton Vance Management (EVM), an affiliate of CRM, provides sub-transfer agency and related services to the Fund pursuant to a Sub-Transfer Agency Support Services Agreement. For the year ended September 30, 2024, sub-transfer agency fees and expenses incurred to EVM amounted to $1,844 and are included in transfer agency fees and expenses on the Statement of Operations.
Each Director of the Fund who is not an employee of CRM or its affiliates receives an annual fee of $225,000 ($214,000 prior to January 1, 2024), an annual Committee fee ranging from $8,500 to $16,500 depending on the Committee, and may receive a fee of $10,000 for special meetings. The Board chair receives an additional $40,000 annual fee, Committee chairs receive an additional $15,000 annual fee and the special equities liaison receives an additional $2,500 annual fee. Eligible Directors may participate in a Deferred Compensation Plan (the Plan). Amounts deferred under the Plan are treated as though equal dollar amounts had been invested in shares of the Fund or other Calvert funds selected by the Directors. The Fund purchases shares of the funds selected equal to the dollar amounts deferred under the Plan, resulting in an asset equal to the deferred compensation liability. Obligations of the Plan are paid solely from the Fund’s assets. Directors’ fees are allocated to each of the Calvert funds served. Salaries and fees of officers and Directors of the Fund who are employees of CRM or its affiliates are paid by CRM.
3 Investment Activity
During the year ended September 30, 2024, the cost of purchases and proceeds from sales of investments, other than short-term securities, were $67,494,243 and $87,925,379, respectively.
4 Distributions to Shareholders and Income Tax Information
The tax character of distributions declared for the years ended September 30, 2024 and September 30, 2023 was as follows:
| | Year Ended September 30, |
| | 2024 | 2023 |
| Ordinary income | $3,093,286 | $4,166,873 |
During the year ended September 30, 2024, distributable earnings was decreased by $157,845 and paid-in capital was increased by $157,845 due to the Fund's use of equalization accounting. Tax equalization accounting allows the Fund to treat as a distribution that portion of redemption proceeds representing a redeeming shareholder’s portion of undistributed taxable income and net capital gains. These reclassifications had no effect on the net assets or net asset value per share of the Fund.
Calvert
Emerging Markets Advancement Fund
September 30, 2024
Notes to Financial Statements — continued
As of September 30, 2024, the components of distributable earnings (accumulated loss) on a tax basis were as follows:
| Undistributed ordinary income | $1,019,141 |
| Deferred capital losses | (11,014,673) |
| Net unrealized appreciation | 18,767,900 |
| Distributable earnings | $8,772,368 |
At September 30, 2024, the Fund, for federal income tax purposes, had deferred capital losses of $11,014,673 which would reduce the Fund’s taxable income arising from future net realized gains on investment transactions, if any, to the extent permitted by the Internal Revenue Code, and thus would reduce the amount of distributions to shareholders, which would otherwise be necessary to relieve the Fund of any liability for federal income or excise tax. The deferred capital losses are treated as arising on the first day of the Fund's next taxable year, can be carried forward for an unlimited period, and retain the same short-term or long-term character as when originally deferred. Of the deferred capital losses at September 30, 2024, $11,014,673 are short-term.
The cost and unrealized appreciation (depreciation) of investments, including open derivative contracts, of the Fund at September 30, 2024, as determined on a federal income tax basis, were as follows:
| Aggregate cost | $70,174,479 |
| Gross unrealized appreciation | $19,933,928 |
| Gross unrealized depreciation | (761,080) |
| Net unrealized appreciation | $19,172,848 |
5 Financial Instruments
The Fund may trade in financial instruments with off-balance sheet risk in the normal course of its investing activities. These financial instruments may include forward foreign currency exchange contracts and futures contracts and may involve, to a varying degree, elements of risk in excess of the amounts recognized for financial statement purposes. The notional or contractual amounts of these instruments represent the investment the Fund has in particular classes of financial instruments and do not necessarily represent the amounts potentially subject to risk. The measurement of the risks associated with these instruments is meaningful only when all related and offsetting transactions are considered. A summary of obligations under these financial instruments at September 30, 2024 is included in the Schedule of Investments. At September 30, 2024, the Fund had sufficient cash and/or securities to cover commitments under these contracts.
In the normal course of pursuing its investment objective, the Fund is subject to the following risks:
Equity Price Risk: During the year ended September 30, 2024, the Fund entered into equity futures contracts to enhance total return, to manage certain investment risks and/or as a substitute for the purchase of securities.
Foreign Exchange Risk: During the year ended September 30, 2024, the Fund entered into forward foreign currency exchange contracts to seek to hedge against fluctuations in currency exchange rates and/or as a substitute for the purchase or sale of securities or currencies.
The Fund enters into over-the-counter (OTC) derivatives that may contain provisions whereby the counterparty may terminate the contract under certain conditions, including but not limited to a decline in the Fund’s net assets below a certain level over a certain period of time, which would trigger a payment by the Fund for those derivatives in a liability position. At September 30, 2024, the fair value of derivatives with credit-related contingent features in a net liability position was $227,092. The aggregate fair value of assets pledged as collateral by the Fund for such liability was $1,700,000 at September 30, 2024.
The OTC derivatives in which the Fund invests are subject to the risk that the counterparty to the contract fails to perform its obligations under the contract. To mitigate this risk, the Fund has entered into an International Swaps and Derivatives Association, Inc. Master Agreement (“ISDA Master Agreement”) or similar agreement with its derivative counterparties. An ISDA Master Agreement is a bilateral agreement between the Fund and a counterparty that governs certain OTC derivatives and typically contains, among other things, set-off provisions in the event of a default and/or termination event as defined under the relevant ISDA Master Agreement. Under an ISDA Master Agreement, the Fund may, under certain circumstances, offset with the counterparty certain derivative financial instruments’ payables and/or receivables with collateral held and/or posted and create one single net payment. The provisions of the ISDA Master Agreement typically permit a single net payment in the event of default including the bankruptcy or insolvency of the counterparty. However, bankruptcy or insolvency laws of a particular jurisdiction may impose restrictions on or prohibitions against the right of offset in
Calvert
Emerging Markets Advancement Fund
September 30, 2024
Notes to Financial Statements — continued
bankruptcy or insolvency. Certain ISDA Master Agreements allow counterparties to OTC derivatives to terminate derivative contracts prior to maturity in the event the Fund’s net assets decline by a stated percentage or the Fund fails to meet the terms of its ISDA Master Agreement(s), which would cause the counterparty to accelerate payment by the Fund of any net liability owed to it.
The collateral requirements for derivatives traded under an ISDA Master Agreement are governed by a Credit Support Annex to the ISDA Master Agreement. Collateral requirements are determined at the close of business each day and are typically based on changes in market values for each transaction under an ISDA Master Agreement and netted into one amount for such agreement. Generally, the amount of collateral due from or to a counterparty is subject to a minimum transfer threshold amount before a transfer is required, which may vary by counterparty. Collateral pledged for the benefit of the Fund and/or counterparty is held in segregated accounts by the Fund’s custodian and cannot be sold, re-pledged, assigned or otherwise used while pledged. The portion of such collateral representing cash, if any, is reflected as deposits for derivatives collateral and, in the case of cash pledged by a counterparty for the benefit of the Fund, a corresponding liability on the Statement of Assets and Liabilities. Securities pledged by the Fund as collateral, if any, are identified as such in the Schedule of Investments.
At September 30, 2024, the fair value of open derivative instruments (not considered to be hedging instruments for accounting disclosure purposes) by risk exposure was as follows:
| Derivative | Statement of Assets and Liabilities Caption | Assets | Liabilities |
| Forward foreign currency exchange contracts | Receivable/Payable for open forward foreign currency
exchange contracts | $191,851 | $(227,092) |
The Fund’s derivative assets and liabilities at fair value by risk, which are reported gross in the Statement of Assets and Liabilities, are presented in the table above. The following tables present the Fund’s derivative assets and liabilities by counterparty, net of amounts available for offset under a master netting agreement and net of the related collateral received by the Fund for such assets and pledged by the Fund for such liabilities as of September 30, 2024.
| Counterparty | Derivative
Assets Subject to
Master Netting
Agreement | Derivatives
Available
for Offset | Non-cash
Collateral
Received(a) | Cash
Collateral
Received(a) | Net Amount
of Derivative
Assets(b) |
| Goldman Sachs International | $136,251 | $(19,212) | $ — | $(117,039) | $ — |
| UBS AG | 55,600 | (55,600) | — | — | — |
| | $191,851 | $(74,812) | $ — | $(117,039) | $ — |
| Counterparty | Derivative
Liabilities Subject to
Master Netting
Agreement | Derivatives
Available
for Offset | Non-cash
Collateral
Pledged(a) | Cash
Collateral
Pledged(a) | Net Amount
of Derivative
Liabilities(c) |
| Goldman Sachs International | $(19,212) | $19,212 | $ — | $ — | $ — |
| Standard Chartered Bank | (67,854) | — | — | 67,854 | — |
| UBS AG | (140,026) | 55,600 | — | 84,426 | — |
| | $(227,092) | $74,812 | $ — | $152,280 | $ — |
| (a) | In some instances, the total collateral received and/or pledged may be more than the amount shown due to overcollateralization. |
| (b) | Net amount represents the net amount due from the counterparty in the event of default. |
| (c) | Net amount represents the net amount payable to the counterparty in the event of default. |
Calvert
Emerging Markets Advancement Fund
September 30, 2024
Notes to Financial Statements — continued
The effect of derivative instruments (not considered to be hedging instruments for accounting disclosure purposes) on the Statement of Operations by risk exposure for the year ended September 30, 2024 was as follows:
| Statement of Operations Caption | Equity price | Foreign exchange | Total |
| Net realized gain (loss): | | | |
| Forward foreign currency exchange contracts | $ — | $200,783 | $200,783 |
| Futures contracts | 98,452 | — | 98,452 |
| Total | $98,452 | $200,783 | $299,235 |
| Change in unrealized appreciation (depreciation): | | | |
| Forward foreign currency exchange contracts | $ — | $(890,141) | $(890,141) |
| Futures contracts | 188,760 | — | 188,760 |
| Total | $188,760 | $(890,141) | $(701,381) |
The average notional cost of futures contracts and average notional amounts of other derivative contracts outstanding during the year ended September 30, 2024, which are indicative of the volume of these derivative types, were approximately as follows:
| Futures Contracts — Long | Forward Foreign Currency Exchange Contracts* |
| $3,598,000 | $51,548,000 |
| * | The average notional amount for forward foreign currency exchange contracts is based on the absolute value of notional amounts of currency purchased and currency sold. |
6 Securities Lending
To generate additional income, the Fund may lend its securities pursuant to a securities lending agency agreement with State Street Bank and Trust Company (SSBT), the securities lending agent. Security loans are subject to termination by the Fund at any time and, therefore, are not considered illiquid investments. The Fund requires that the loan be continuously collateralized by either cash or securities in an amount at least equal to the market value of the securities on loan. The market value of securities loaned is determined daily and any additional required collateral is delivered to the Fund on the next business day. Cash collateral is generally invested in a money market fund registered under the 1940 Act that is managed by an affiliate of SSBT. Any gain or loss in the market price of the loaned securities that might occur and any interest earned or dividends declared during the term of the loan would accrue to the account of the Fund. Income earned on the investment of collateral, net of broker rebates and other expenses incurred by the securities lending agent, is split between the Fund and the securities lending agent based on agreed upon contractual terms. Non-cash collateral, if any, is held by the lending agent on behalf of the Fund and cannot be sold or re-pledged by the Fund; accordingly, such collateral is not reflected in the Statement of Assets and Liabilities.
The risks associated with lending portfolio securities include, but are not limited to, possible delays in receiving additional collateral or in the recovery of the loaned securities, possible loss of rights to the collateral should the borrower fail financially, as well as risk of loss in the value of the collateral or the value of the investments made with the collateral. The securities lending agent shall indemnify the Fund in the case of default of any securities borrower.
At September 30, 2024, the total value of securities on loan was $115,659 and the total value of collateral received was $125,005, comprised of U.S. government and/or agencies securities.
7 Line of Credit
The Fund participates with other portfolios and funds managed by EVM and its affiliates, including CRM, in a $650 million unsecured revolving line of credit agreement with a group of banks, which is in effect through October 22, 2024. In connection with the renewal of the agreement on October 24, 2023, the borrowing limit was decreased from $725 million. Borrowings are made by the Fund solely for temporary purposes related to redemptions and other short-term cash needs. Interest is charged to the Fund based on its borrowings generally at an amount above either the Secured Overnight Financing Rate (SOFR) or Federal Funds rate. In addition, a fee computed at an annual rate of 0.15% on the daily unused portion of the line of credit is allocated among the participating portfolios and funds at the end of each quarter. In connection with the renewal of the agreement in October 2023, an arrangement fee of $150,000 was incurred that was allocated to the participating portfolios and funds. Because the line of credit is not available exclusively to the Fund, it may be unable to borrow some or all of its requested amounts at any particular time.
Calvert
Emerging Markets Advancement Fund
September 30, 2024
Notes to Financial Statements — continued
At September 30, 2024, the Fund had a balance outstanding pursuant to this line of credit of $600,000 at an annual interest rate of 8.00%. Based on the short-term nature of the borrowings under the line of credit and variable interest rate, the carrying value of the borrowings approximated its fair value at September 30, 2024. If measured at fair value, borrowings under the line of credit would have been considered as Level 2 in the fair value hierarchy (see Note 1A) at September 30, 2024. Average borrowings and the weighted average interest rate (excluding fees) for the year ended September 30, 2024 were $279,781 and 6.46%, respectively.
Effective October 22, 2024, the Fund renewed its line of credit agreement, which expires October 21, 2025, at substantially the same terms.
8 Affiliated Investments
At September 30, 2024, the value of the Fund’s investment in funds that may be deemed to be affiliated was $17,570, which represents less than 0.05% of the Fund’s net assets. Transactions in such investments by the Fund for the year ended September 30, 2024 were as follows:
| Name | Value,
beginning
of period | Purchases | Sales
proceeds | Net
realized
gain
(loss) | Change in
unrealized
appreciation
(depreciation) | Value,
end of
period | Dividend
income | Shares,
end of
period |
| Short-Term Investments | | | | | | |
| Liquidity Fund | $5,086 | $43,774,754 | $(43,762,270) | $ — | $ — | $17,570 | $57,377 | 17,570 |
9 Capital Shares
The Corporation may issue its shares in one or more series (such as the Fund). The authorized shares of the Fund consist of 75,000,000 common shares, $0.01 par value, for each Class.
Transactions in capital shares were as follows:
| | Year Ended
September 30, 2024 | | Year Ended
September 30, 2023 |
| | Shares | Amount | | Shares | Amount |
| Class A | | | | | |
| Shares sold | 83,672 | $928,746 | | 137,808 | $1,414,459 |
| Reinvestment of distributions | 6,342 | 65,901 | | 9,767 | 95,421 |
| Shares redeemed | (41,643) | (452,703) | | (64,996) | (668,892) |
| Net increase | 48,371 | $541,944 | | 82,579 | $840,988 |
| Class I | | | | | |
| Shares sold | 1,135,445 | $12,477,467 | | 2,097,744 | $21,852,739 |
| Reinvestment of distributions | 289,690 | 3,027,257 | | 414,379 | 4,069,197 |
| Shares redeemed | (3,121,354) | (33,879,739) | | (784,442) | (8,064,195) |
| Net increase (decrease) | (1,696,219) | $(18,375,015) | | 1,727,681 | $17,857,741 |
At September 30, 2024, Calvert Conservative Allocation Fund, Calvert Moderate Allocation Fund and Calvert Growth Allocation Fund owned in the aggregate 48.2% of the value of the outstanding shares of the Fund.
10 Risks and Uncertainties
Risks Associated with Foreign Investments
Foreign investments can be adversely affected by political, economic and market developments abroad, including the imposition of economic and other sanctions by the United States or another country, and by acts of terrorism and war. There may be less publicly available information about foreign issuers because they may not be subject to reporting practices, requirements or regulations comparable to those to which United States companies are subject. Foreign markets may be smaller, less liquid and more volatile than the major markets in the United States. Trading in foreign markets typically involves higher expense than trading in the United States. The Fund may have difficulties enforcing its legal or contractual rights in a foreign country. Securities that trade or are denominated in currencies other than the U.S. dollar may be adversely affected by fluctuations in currency exchange rates.
Calvert
Emerging Markets Advancement Fund
September 30, 2024
Notes to Financial Statements — continued
Emerging market securities often involve greater risks than developed market securities. Investment markets within emerging market countries are typically smaller, less liquid, less developed and more volatile than those in more developed markets like the United States, and may be focused in certain economic sectors. The information available about an emerging market issuer may be less reliable than for comparable issuers in more developed capital markets. Governmental actions can have a significant effect on the economic conditions in emerging market countries. It may be more difficult to make a claim or obtain a judgment in the courts of these countries than it is in the United States. The possibility of fraud, negligence, undue influence being exerted by an issuer or refusal to recognize ownership exists in some emerging markets. Disruptions due to work stoppages and trading improprieties in foreign securities markets have caused such markets to close. Emerging market securities are also subject to speculative trading, which contributes to their volatility.
Calvert
Emerging Markets Advancement Fund
September 30, 2024
Report of Independent Registered Public Accounting Firm
To the Board of Directors of Calvert World Values Fund, Inc. and Shareholders of Calvert Emerging Markets Advancement Fund:
Opinion on the Financial Statements and Financial Highlights
We have audited the accompanying statement of assets and liabilities of Calvert Emerging Markets Advancement Fund (the “Fund") (one of the funds constituting Calvert World Values Fund, Inc.), including the schedule of investments, as of September 30, 2024, the related statement of operations for the year then ended, the statements of changes in net assets for each of the two years in the period then ended, the financial highlights for each of the four years in the period then ended, and the related notes. In our opinion, the financial statements and financial highlights present fairly, in all material respects, the financial position of the Fund as of September 30, 2024, and the results of its operations for the year then ended, the changes in its net assets for each of the two years in the period then ended, and the financial highlights for each of the four years in the period then ended, in conformity with accounting principles generally accepted in the United States of America. The financial highlights for the year ended September 30, 2020 were audited by other auditors whose report, dated November 20, 2020, expressed an unqualified opinion on those financial highlights.
Basis for Opinion
These financial statements and financial highlights are the responsibility of the Fund's management. Our responsibility is to express an opinion on the Fund's financial statements and financial highlights based on our audits. We are a public accounting firm registered with the Public Company Accounting Oversight Board (United States) (PCAOB) and are required to be independent with respect to the Fund in accordance with the U.S. federal securities laws and the applicable rules and regulations of the Securities and Exchange Commission and the PCAOB.
We conducted our audits in accordance with the standards of the PCAOB. Those standards require that we plan and perform the audit to obtain reasonable assurance about whether the financial statements and financial highlights are free of material misstatement, whether due to error or fraud. The Fund is not required to have, nor were we engaged to perform, an audit of its internal control over financial reporting. As part of our audits, we are required to obtain an understanding of internal control over financial reporting but not for the purpose of expressing an opinion on the effectiveness of the Fund’s internal control over financial reporting. Accordingly, we express no such opinion.
Our audits included performing procedures to assess the risks of material misstatement of the financial statements and financial highlights, whether due to error or fraud, and performing procedures that respond to those risks. Such procedures included examining, on a test basis, evidence regarding the amounts and disclosures in the financial statements and financial highlights. Our audits also included evaluating the accounting principles used and significant estimates made by management, as well as evaluating the overall presentation of the financial statements and financial highlights. Our procedures included confirmation of securities owned as of September 30, 2024, by correspondence with the custodian and brokers; when replies were not received from brokers, we performed other auditing procedures. We believe that our audits provide a reasonable basis for our opinion.
/s/ Deloitte & Touche LLP
Boston, Massachusetts
November 21, 2024
We have served as the auditor of one or more Calvert investment companies since 2021.
Calvert
Emerging Markets Advancement Fund
September 30, 2024
Federal Tax Information (Unaudited)
The Form 1099-DIV you receive in February 2025 will show the tax status of all distributions paid to your account in calendar year 2024. Shareholders are advised to consult their own tax adviser with respect to the tax consequences of their investment in the Fund. As required by the Internal Revenue Code and/or regulations, shareholders must be notified regarding the status of qualified dividend income for individuals and the foreign tax credit.
Qualified Dividend Income. For the fiscal year ended September 30, 2024, the Fund designates approximately $1,933,225, or up to the maximum amount of such dividends allowable pursuant to the Internal Revenue Code, as qualified dividend income eligible for the reduced tax rate of 15%.
Foreign Tax Credit. For the fiscal year ended September 30, 2024, the Fund paid foreign taxes of $367,250 and recognized foreign source income of $3,027,030.
Calvert
Emerging Markets Advancement Fund
September 30, 2024
Board of Directors' Contract Approval
Overview of the Contract Review Process
The Investment Company Act of 1940, as amended, provides, in substance, that each investment advisory agreement between a fund and its investment adviser will continue in effect from year to year only if its continuation is approved at least annually by the fund’s board of directors, including by a vote of a majority of the directors who are not “interested persons” of the fund (“Independent Directors”), cast in person at a meeting called for the purpose of considering such approval.
At an in-person meeting of the Boards of Trustees/Directors (each a “Board”) of the registered investment companies advised by Calvert Research and Management (“CRM” or the “Adviser”) (the “Calvert Funds”) held on June 10-11, 2024, the Board, including a majority of the Independent Directors, voted to approve continuation of existing investment advisory and investment sub-advisory agreements for the Calvert Funds for an additional one-year period.
In evaluating the investment advisory and investment sub-advisory agreements for the Calvert Funds, the Board considered a variety of information relating to the Calvert Funds and various service providers, including the Adviser. The Independent Directors reviewed a report prepared by the Adviser regarding various services provided to the Calvert Funds by the Adviser and its affiliates. Such report included, among other data, information regarding the Adviser’s personnel and the Adviser’s revenue and cost of providing services to the Calvert Funds, and a separate report prepared by an independent data provider, which compared each fund’s investment performance, fees and expenses to those of comparable funds as identified by such independent data provider (“comparable funds”).
The Independent Directors were separately represented by independent legal counsel with respect to their consideration of the continuation of the investment advisory and investment sub-advisory agreements for the Calvert Funds. Prior to voting, the Independent Directors reviewed the proposed continuation of the Calvert Funds’ investment advisory and investment sub-advisory agreements with management and also met in private sessions with their counsel at which time no representatives of management were present.
The information that the Board considered included, among other things, the following (for funds that invest through one or more affiliated underlying fund(s), references to “each fund” in this section may include information that was considered at the underlying fund-level):
Information about Fees, Performance and Expenses
| • | A report from an independent data provider comparing the advisory and related fees paid by each fund with fees paid by comparable funds; |
| • | A report from an independent data provider comparing each fund’s total expense ratio and its components to comparable funds; |
| • | A report from an independent data provider comparing the investment performance of each fund to the investment performance of comparable funds over various time periods; |
| • | Data regarding investment performance in comparison to benchmark indices; |
| • | For each fund, comparative information concerning the fees charged and the services provided by the Adviser in managing other accounts (including mutual funds, other collective investment funds and institutional accounts) using investment strategies and techniques similar to those used in managing such fund; |
| • | Profitability analyses for the Adviser with respect to each fund; |
Information about Portfolio Management and Trading
| • | Descriptions of the investment management services provided to each fund, including investment strategies and processes it employs; |
| • | Information about the Adviser’s policies and practices with respect to trading, including the Adviser’s processes for monitoring best execution of portfolio transactions; |
| • | Information about the allocation of brokerage transactions and the benefits received by the Adviser as a result of brokerage allocation, including information concerning the acquisition of research through client commission arrangements and policies with respect to “soft dollars”; |
Information about the Adviser
| • | Reports detailing the financial results and condition of CRM; |
| • | Descriptions of the qualifications, education and experience of the individual investment professionals whose responsibilities include portfolio management and investment research for the funds, and information relating to their compensation and responsibilities with respect to managing other mutual funds and investment accounts; |
| • | Policies and procedures relating to proxy voting and the handling of corporate actions and class actions; |
| • | A description of CRM’s procedures for overseeing sub-advisers, including with respect to regulatory and compliance issues, investment management and other matters; |
Calvert
Emerging Markets Advancement Fund
September 30, 2024
Board of Directors' Contract Approval — continued
Other Relevant Information
| • | Information concerning the nature, cost and character of the administrative and other non-investment advisory services provided by CRM and its affiliates; and |
| • | The terms of each investment advisory agreement. |
Over the course of the year, the Board and its committees held regular quarterly meetings. During these meetings, the Directors participated in investment and performance reviews with the portfolio managers and other investment professionals of the Adviser relating to each fund and considered various investment and trading strategies used in pursuing each fund’s investment objective(s), such as the use of derivative instruments, as well as risk management techniques. The Board and its committees also evaluated issues pertaining to industry and regulatory developments, compliance procedures, corporate governance and other issues with respect to the funds and received and participated in reports and presentations provided by CRM and its affiliates with respect to such matters. In addition to the formal meetings of the Board and its committees, the Independent Directors held regular video conferences in between meetings to discuss, among other topics, matters relating to the continuation of the Calvert Funds’ investment advisory and investment sub-advisory agreements.
For funds that invest through one or more affiliated underlying funds, the Board considered similar information about the underlying fund(s) when considering the approval of investment advisory agreements. In addition, in cases where the Adviser has engaged a sub-adviser, the Board considered similar information about the sub-adviser when considering the approval of any investment sub-advisory agreement.
The Independent Directors were assisted throughout the contract review process by their independent legal counsel. The Independent Directors relied upon the advice of such counsel and their own business judgment in determining the material factors to be considered in evaluating each investment advisory and investment sub-advisory agreement and the weight to be given to each such factor. The Board, including the Independent Directors, did not identify any single factor as controlling, and each Director may have attributed different weight to various factors.
Results of the Contract Review Process
Based on its consideration of the foregoing, and such other information as it deemed relevant, including the factors and conclusions described below, the Board, including the Independent Directors, concluded that the continuation of the investment advisory agreement of Calvert Emerging Markets Advancement Fund (the “Fund”), and the investment sub-advisory agreement with Eaton Vance Advisers International Ltd. (the “Sub-Adviser”), an affiliate of CRM, including the fees payable under each agreement, is in the best interests of the Fund’s shareholders. Accordingly, the Board, including a majority of the Independent Directors, voted to approve the continuation of the investment advisory agreement and the investment sub-advisory agreement of the Fund.
Nature, Extent and Quality of Services
In considering the nature, extent and quality of the services provided by the Adviser and Sub-Adviser under the investment advisory agreement and investment sub-advisory agreement, respectively, the Board reviewed information relating to the Adviser’s and Sub-Adviser’s operations and personnel, including, among other information, biographical information on the Sub-Adviser’s investment personnel and descriptions of the Adviser’s organizational and management structure. The Board also took into account similar information provided periodically throughout the previous year by the Adviser and Sub-Adviser as well as the Board’s familiarity with the Adviser and Sub-Adviser through Board meetings, discussions and other reports. With respect to the Adviser, the Board considered the Adviser’s responsibilities overseeing the Sub-Adviser and the business-related and other risks to which the Adviser or its affiliates may be subject in managing the Fund. With respect to the Sub-Adviser, the Board took into account the resources available to the Sub-Adviser in fulfilling its duties under the investment sub-advisory agreement and the Sub-Adviser’s experience in managing the Fund. The Board also noted that it reviewed on a quarterly basis information regarding the Adviser’s and Sub-Adviser’s compliance with applicable policies and procedures, including those related to personal investing. The Board took into account, among other items, periodic reports received from the Adviser over the past year concerning the Adviser’s ongoing review and enhancement of certain processes, policies and procedures of the Calvert Funds and the Adviser. The Board concluded that it was satisfied with the nature, extent and quality of services provided to the Fund by the Adviser and the Sub-Adviser under the investment advisory agreement and investment sub-advisory agreement, respectively.
Fund Performance
In considering the Fund’s performance, the Board noted that it reviewed on a quarterly basis detailed information about the Fund’s performance results, portfolio composition and investment strategies. The Board compared the Fund’s investment performance to that of the Fund’s peer universe and its benchmark index. The Board’s review included comparative performance data for the one- and three-year periods ended December 31, 2023. This performance data indicated that the Fund had outperformed the median of its peer universe and benchmark index for the one- and three-year periods ended December 31, 2023. Based upon its review, the Board concluded that the Fund’s performance was satisfactory relative to the performance of its peer universe and its benchmark index.
Management Fees and Expenses
In considering the Fund’s fees and expenses, the Board compared the Fund’s fees and total expense ratio with those of comparable funds in its expense group. Among other findings, the data indicated that the Fund’s advisory and administrative fees (after taking into account waivers and/or reimbursements) (referred to collectively as “management fees”) were at the median of the Fund’s expense group and the Fund’s total expenses (net of waivers and/or
Calvert
Emerging Markets Advancement Fund
September 30, 2024
Board of Directors' Contract Approval — continued
reimbursements) were below the median of the Fund’s expense group. The Board took into account the Adviser’s current undertaking to maintain expense limitations for the Fund and that the Adviser was waiving and/or reimbursing a portion of the Fund’s expenses. Based upon its review, the Board concluded that the management and sub-advisory fees were reasonable in view of the nature, extent and quality of services provided by the Adviser and Sub-Adviser, respectively.
Profitability and Other “Fall-Out” Benefits
The Board reviewed the Adviser’s profitability in regard to the Fund and the Calvert Funds in the aggregate. In reviewing the overall profitability of the Fund to the Adviser, the Board also considered the fact that the Adviser and its affiliates, including the Sub-Adviser, provided sub-advisory, sub-transfer agency support, administrative and distribution services to the Fund for which they received compensation. The information considered by the Board included the profitability of the Fund to the Adviser and its affiliates without regard to any marketing support or other payments by the Adviser and its affiliates to third parties in respect of distribution services. The Board also considered that the Adviser and its affiliates, including the Sub-Adviser, derived benefits to their reputation and other indirect benefits from their relationships with the Fund. Because the Adviser pays the Sub-Adviser’s sub-advisory fee out of its advisory fee, the profitability of the Fund to the Sub-Adviser was not a material factor in the Board’s deliberations concerning the continuation of the investment sub-advisory agreement. Based upon its review, the Board concluded that the level of profitability of the Adviser and its affiliates, including the Sub-Adviser, from their relationships with the Fund was reasonable.
Economies of Scale
The Board considered the effect of the Fund’s current size and its potential growth on its performance and fees. The Board concluded that adding breakpoints to the advisory fee at specified asset levels was not necessary at this time. Because the Adviser pays the Sub-Adviser’s sub-advisory fee out of its advisory fee, the Board did not consider the potential economies of scale from the Sub-Adviser’s management of the Fund to be a material factor in the Board’s deliberations concerning the continuation of the investment sub-advisory agreement. The Board noted that if the Fund’s assets increased over time, the Fund might realize other economies of scale if assets increased proportionally more than certain other expenses.
This Page Intentionally Left Blank
This Page Intentionally Left Blank
Item 8. Changes in and Disagreements with Accountants for Open-End Management Investment Companies
Not applicable.
Item 9. Proxy Disclosures for Open-End Management Investment Companies
Not applicable.
Item 10. Remuneration Paid to Directors, Officers, and Others of Open-End Management Investment Companies
The information is disclosed as part of the Financial Statements included in Item 7 of this Form N-CSR.
Item 11. Statement Regarding Basis for Approval of Investment Advisory Contract
The information is included in Item 7 of this Form N-CSR.
Item 12. Disclosure of Proxy Voting Policies and Procedures for Closed-End Management Investment Companies
Not applicable.
Item 13. Portfolio Managers of Closed-End Management Investment Companies
Not applicable.
Item 14. Purchases of Equity Securities by Closed-End Management Investment Company and Affiliated Purchasers
Not applicable.
Item 15. Submission of Matters to a Vote of Security Holders
There have been no material changes to the procedures by which shareholders may recommend nominee to the Fund’s Board of Directors since the Fund last provided disclosure in response to this item.
Item 16. Controls and Procedures
| (a) | It is the conclusion of the registrant’s principal executive officer and principal financial officer that the effectiveness of the registrant’s current disclosure controls and procedures (such disclosure controls and procedures having been evaluated within 90 days of the date of this filing) provide reasonable assurance that the information required to be disclosed by the registrant has been recorded, processed, summarized and reported within the time period specified in the Commission’s rules and forms and that the information required to be disclosed by the registrant has been accumulated and communicated to the registrant’s principal executive officer and principal financial officer in order to allow timely decisions regarding required disclosure. |
| (b) | There have been no changes in the registrant’s internal control over financial reporting during the period covered by this report that has materially affected, or is reasonably likely to materially affect, the registrant’s internal control over financial reporting. |
Item 17. Disclosure of Securities Lending Activities for Closed-End Management Investment Companies
Not applicable.
Item 18. Recovery of Erroneously Awarded Compensation
Not applicable.
Item 19. Exhibits
Signatures
Pursuant to the requirements of the Securities Exchange Act of 1934 and the Investment Company Act of 1940, the registrant has duly caused this report to be signed on its behalf by the undersigned, thereunto duly authorized.
| | |
| Calvert World Values Fund, Inc. |
| |
| By: | | /s/ Von M. Hughes |
| | Von M. Hughes |
| | Principal Executive Officer |
| |
| Date: | | November 25, 2024 |
Pursuant to the requirements of the Securities Exchange Act of 1934 and the Investment Company Act of 1940, this report has been signed below by the following persons on behalf of the registrant and in the capacities and on the dates indicated.
| | |
| By: | | /s/ James F. Kirchner |
| | James F. Kirchner |
| | Principal Financial Officer |
| |
| Date: | | November 25, 2024 |
| |
| By: | | /s/ Von M. Hughes |
| | Von M. Hughes |
| | Principal Executive Officer |
| |
| Date: | | November 25, 2024 |