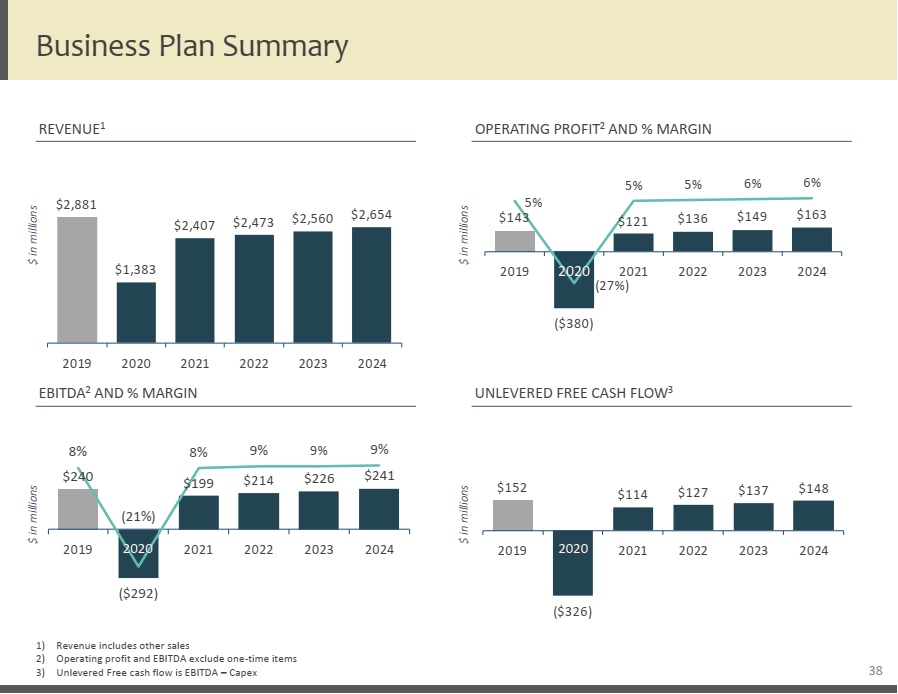
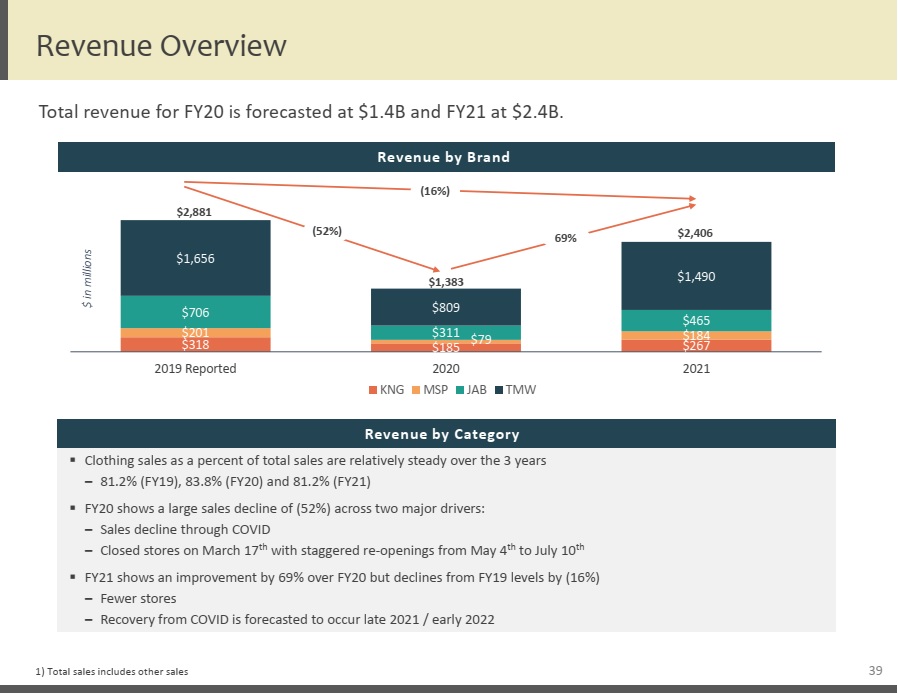
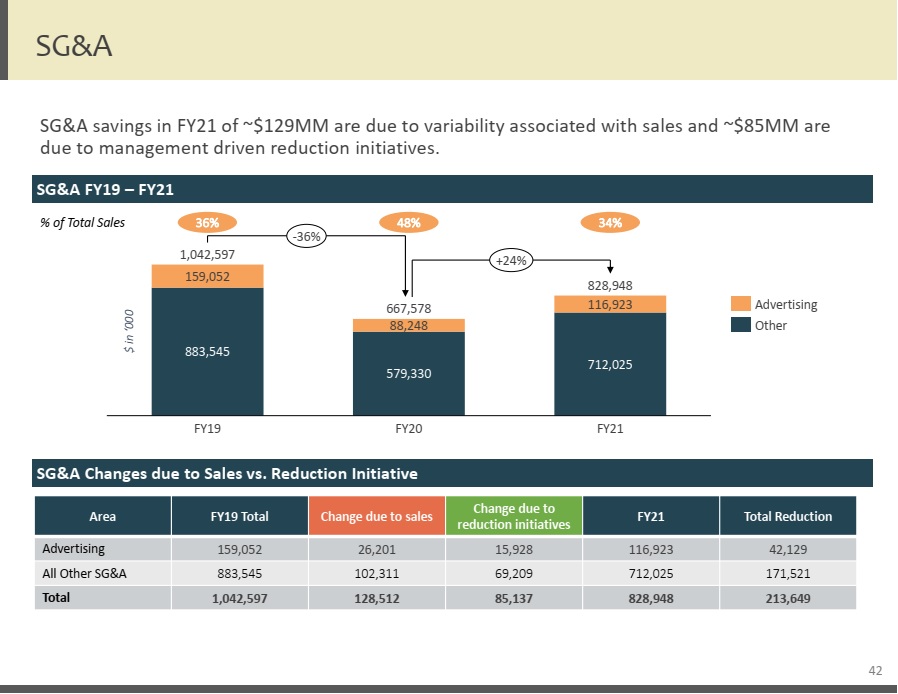
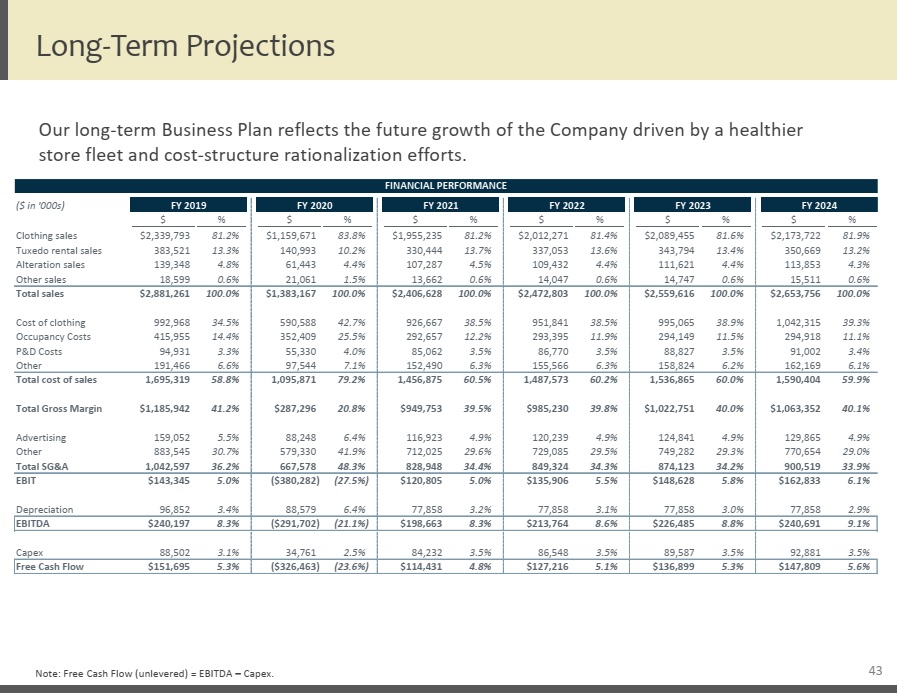
 | Long-Term Projections Our long-term Business Plan reflects the future growth of the Company driven by a healthier store fleet and cost-structure rationalization efforts. 43 Note: Free Cash Flow (unlevered) = EBITDA – Capex. ($ in '000s) FY 2019 FY 2020 FY 2021 FY 2022 FY 2023 $ % $2,173,722 81.9% 350,669 13.2% 113,853 4.3% 15,511 0.6% $ % Clothing sales $2,339,793 81.2% Tuxedo rental sales 383,521 13.3% Alteration sales 139,348 4.8% Other sales 18,599 0.6% $ % $1,159,671 83.8% 140,993 10.2% 61,443 4.4% 21,061 1.5% $ % $1,955,235 81.2% 330,444 13.7% 107,287 4.5% 13,662 0.6% $ % $2,012,271 81.4% 337,053 13.6% 109,432 4.4% 14,047 0.6% $ % $2,089,455 81.6% 343,794 13.4% 111,621 4.4% 14,747 0.6% Total sales $2,881,261 100.0% Cost of clothing 992,968 34.5% Occupancy Costs 415,955 14.4% P&D Costs 94,931 3.3% Other 191,466 6.6% $1,383,167 100.0% 590,588 42.7% 352,409 25.5% 55,330 4.0% 97,544 7.1% $2,406,628 100.0% 926,667 38.5% 292,657 12.2% 85,062 3.5% 152,490 6.3% $2,472,803 100.0% 951,841 38.5% 293,395 11.9% 86,770 3.5% 155,566 6.3% $2,559,616 100.0% 995,065 38.9% 294,149 11.5% 88,827 3.5% 158,824 6.2% $2,653,756 100.0% 1,042,315 39.3% 294,918 11.1% 91,002 3.4% 162,169 6.1% Total cost of sales 1,695,319 58.8% Total Gross Margin $1,185,942 41.2% Advertising 159,052 5.5% Other 883,545 30.7% Total SG&A 1,042,597 36.2% 1,095,871 79.2% $287,296 20.8% 88,248 6.4% 579,330 41.9% 667,578 48.3% 1,456,875 60.5% $949,753 39.5% 116,923 4.9% 712,025 29.6% 828,948 34.4% 1,487,573 60.2% $985,230 39.8% 120,239 4.9% 729,085 29.5% 849,324 34.3% 1,536,865 60.0% $1,022,751 40.0% 124,841 4.9% 749,282 29.3% 874,123 34.2% 1,590,404 59.9% $1,063,352 40.1% 129,865 4.9% 770,654 29.0% 900,519 33.9% EBIT $143,345 5.0% Depreciation 96,852 3.4% ($380,282) (27.5%) 88,579 6.4% $120,805 5.0% 77,858 3.2% $135,906 5.5% 77,858 3.1% $148,628 5.8% 77,858 3.0% $162,833 6.1% 77,858 2.9% EBITDA $240,197 8.3% ($291,702) (21.1%) $198,663 8.3% $213,764 8.6% $226,485 8.8% $240,691 9.1% Capex 88,502 3.1% 34,761 2.5% 84,232 3.5% 86,548 3.5% 89,587 3.5% 92,881 3.5% Free Cash Flow $151,695 5.3% ($326,463) (23.6%) $114,431 4.8% $127,216 5.1% $136,899 5.3% $147,809 5.6% FY 2024 FINANCIAL PERFORMANCE |