Free signup for more
- Track your favorite companies
- Receive email alerts for new filings
- Personalized dashboard of news and more
- Access all data and search results
Filing tables
Filing exhibits
Related financial report
VVI similar filings
- 15 Nov 23 Regulation FD Disclosure
- 2 Nov 23 Viad Corp Reports Results for the 2023 Third Quarter
- 11 Oct 23 Entry into a Material Definitive Agreement
- 3 Aug 23 Viad Corp Reports Results for the 2023 Second Quarter
- 26 May 23 Submission of Matters to a Vote of Security Holders
- 4 May 23 Viad Corp Reports Results for the 2023 First Quarter
- 31 Mar 23 Entry into a Material Definitive Agreement
Filing view
External links
Exhibit 99.2

SECOND quarter 2023 EARNINGS CALL AUGUST 3, 2023
Forward-looking statements This presentation contains a number of forward-looking statements. Words, and variations of words, such as “will,” “may,” “expect,” “would,” “could,” “might,” “intend,” “plan,” “believe,” “estimate,” “anticipate,” “deliver,” “seek,” “aim,” “potential,” “target,” “outlook,” and similar expressions are intended to identify our forward-looking statements. Similarly, statements that describe our business strategy, outlook, objectives, plans, initiatives, intentions or goals also are forward looking statements. These forward-looking statements are not historical facts and are subject to a host of risks and uncertainties, many of which are beyond our control, which could cause actual results to differ materially from those in the forward-looking statements. Important factors that could cause actual results to differ materially from those described in our forward-looking statements include, but are not limited to, the following: general economic uncertainty in key global markets and a worsening of global economic conditions; travel industry disruptions; the impact of our overall level of indebtedness, as well as our financial covenants, on our operational and financial flexibility; identified material weakness in our internal control over financial reporting; seasonality of our businesses; the impact of the COVID-19 pandemic on our financial condition, liquidity, and cash flow; our ability to anticipate and adjust for new and emerging challenges presented by the ramifications of the COVID-19 pandemic on our businesses; unanticipated delays and cost overruns of our capital projects, and our ability to achieve established financial and strategic goals for such projects; our exposure to labor shortages, turnover, and labor cost increases; the importance of key members of our account teams to our business relationships; our ability to manage our business and continue our growth if we lose any of our key personnel; the competitive nature of the industries in which we operate; our dependence on large exhibition event clients; adverse effects of show rotation on our periodic results and operating margins; transportation disruptions and increases in transportation costs; natural disasters, weather conditions, accidents, and other catastrophic events; our exposure to labor cost increases and work stoppages related to unionized employees; our multi-employer pension plan funding obligations; our ability to successfully integrate and achieve established financial and strategic goals from acquisitions; our exposure to cybersecurity attacks and threats; our exposure to currency exchange rate fluctuations; liabilities relating to prior and discontinued operations; and compliance with laws governing the storage, collection, handling, and transfer of personal data and our exposure to legal claims and fines for data breaches or improper handling of such data. For a more complete discussion of the risks and uncertainties that may affect our business or financial results, please see Item 1A, “Risk Factors,” of our most recent annual report on Form 10-K filed with the SEC. We disclaim and do not undertake any obligation to update or revise any forward-looking statement in this presentation except as required by applicable law or regulation. 2

NON-GAAP FINANCIAL MEASURES This document includes the presentation of “Adjusted EBITDA” and ”Income (Loss) Before Other Items”, which are supplemental to results presented under accounting principles generally accepted in the United States of America (“GAAP”) and may not be comparable to similarly titled measures presented by other companies. These non-GAAP measures should be considered in addition to, but not as a substitute for, other similar measures reported in accordance with GAAP. The use of these non-GAAP financial measures is limited, compared to the GAAP measure of net income attributable to Viad, because it does not consider a variety of items affecting Viad’s consolidated financial performance as explained below. Because these non-GAAP measures do not consider all items affecting Viad’s consolidated financial performance, a user of Viad’s financial information should consider net income attributable to Viad as an important measure of financial performance because it provides a more complete measure of the Company’s performance. Adjusted EBITDA is defined by management as net income attributable to Viad before income (loss) from discontinued operations, interest expense and interest income, income taxes, depreciation and amortization, acquisition-related costs, attraction start-up costs, restructuring charges, impairment charges, and the reduction/increase for income/loss attributable to non-redeemable and redeemable non-controlling interests, and gains or losses from sales of businesses. Adjusted EBITDA is considered a useful operating metric, in addition to net income attributable to Viad, as potential variations arising from non-recurring integration costs, non-cash amortization and depreciation, and non-operational expenses/income are eliminated, thus resulting in an additional measure considered to be indicative of Viad’s consolidated and segment performance. Management believes that the presentation of Adjusted EBITDA provides useful information to investors regarding Viad’s results of operations for trending, analyzing and benchmarking the performance and value of Viad’s business. Income (Loss) Before Other Items is defined by management as net income attributable to Viad before income (loss) from discontinued operations, acquisition-related costs, attraction start-up costs, restructuring charges, impairment charges, other non-recurring expenses, and tax matters. Income (Loss) Before Other Items is considered a useful operating metric, in addition to net income attributable to Viad, as potential variations arising from non-operational expenses/income are eliminated, thus resulting in an additional measure considered to be indicative of Viad’s performance. 3 Forward-Looking Non-GAAP Measures The company has not quantitatively reconciled its guidance for adjusted EBITDA to its respective most comparable GAAP measure because certain reconciling items that impact this metric including, provision for income taxes, interest expense, restructuring or impairment charges, acquisition-related costs, and attraction start-up costs have not occurred, are out of the company’s control, or cannot be reasonably predicted. Accordingly, reconciliations to the nearest GAAP financial measure are not available without unreasonable effort. Please note that the unavailable reconciling items could significantly impact the company’s results as reported under GAAP.
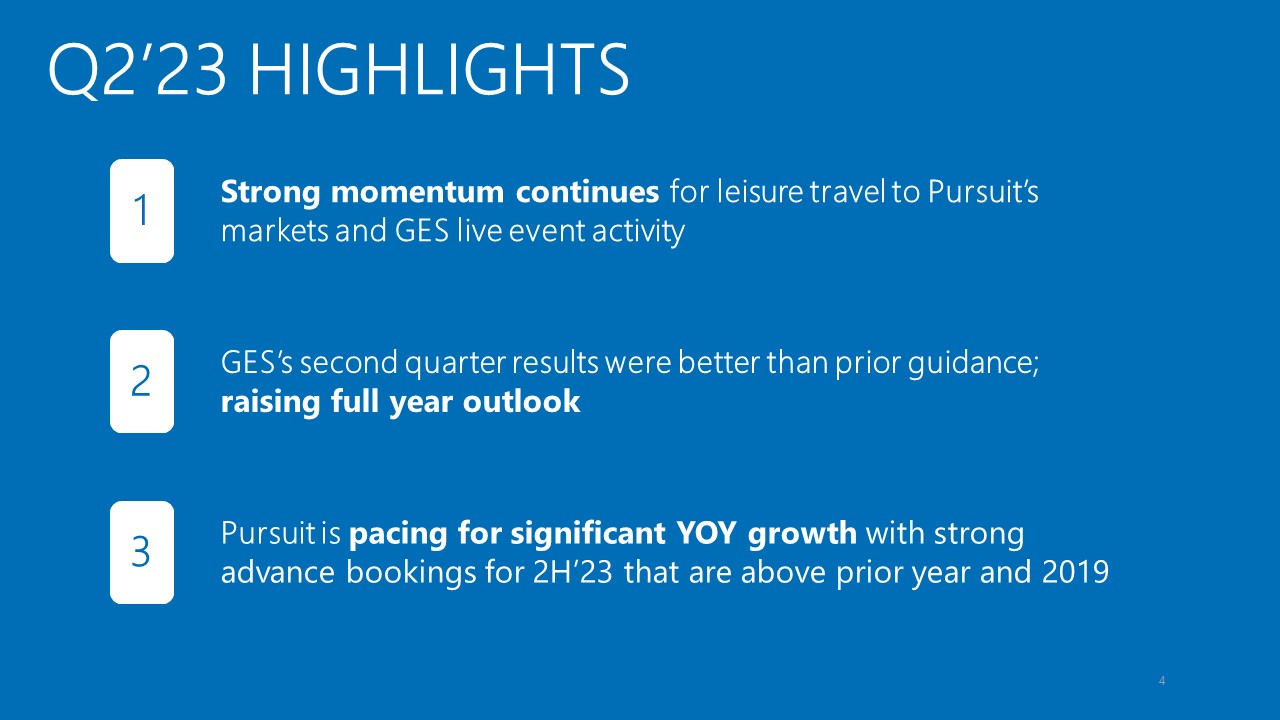
Q2’23 HIGHLIGHTS 4

FINANCIAL PERFORMANCE

6 strong Q2’23 RESULTS 6 Revenue increased $1.1 million as higher international tourism in Western Canada and Iceland and stronger demand for exhibitions and events more than offset a $16 million revenue reduction due to timing of events at GES and the sale of ON Services Net income attributable to Viad decreased $8.9 million primarily due to lower GES adjusted EBITDA, higher interest expense, and higher taxes, partially offset by higher adjusted EBITDA at Pursuit Consolidated Adjusted EBITDA declined $4.6 million primarily due to: Lower revenue at GES Increased staffing levels at GES as compared to the 2022 second quarter when a faster than expected recovery in event activity significantly outpaced workforce restaffing from pandemic levels Partially offset by stronger visitation and margin expansion at Pursuit * Refer to Appendix for a discussion and reconciliation of this non-GAAP financial measure to its most directly comparable GAAP financial measure. (in millions) Q2’23 Q2’22 $ Change Revenue $ 320.3 $ 319.2 $ 1.1 Pursuit Revenue 88.5 77.6 10.9 GES Revenue 231.8 241.6 (9.8) Net Income Attributable to Viad $ 11.0 $ 19.8 $ (8.9) Income Before Other Items 11.8 22.2 (10.3) Consolidated Adjusted EBITDA* $ 42.9 $ 47.5 $ (4.6) Pursuit Adjusted EBITDA* 19.5 15.6 3.9 GES Adjusted EBITDA* 26.8 35.1 (8.3) Corporate Adjusted EBITDA* (3.5) (3.3) (0.2) GES Adjusted EBITDA was ~$3 million above the high-end of guidance range Pursuit Adjusted EBITDA was within guidance range
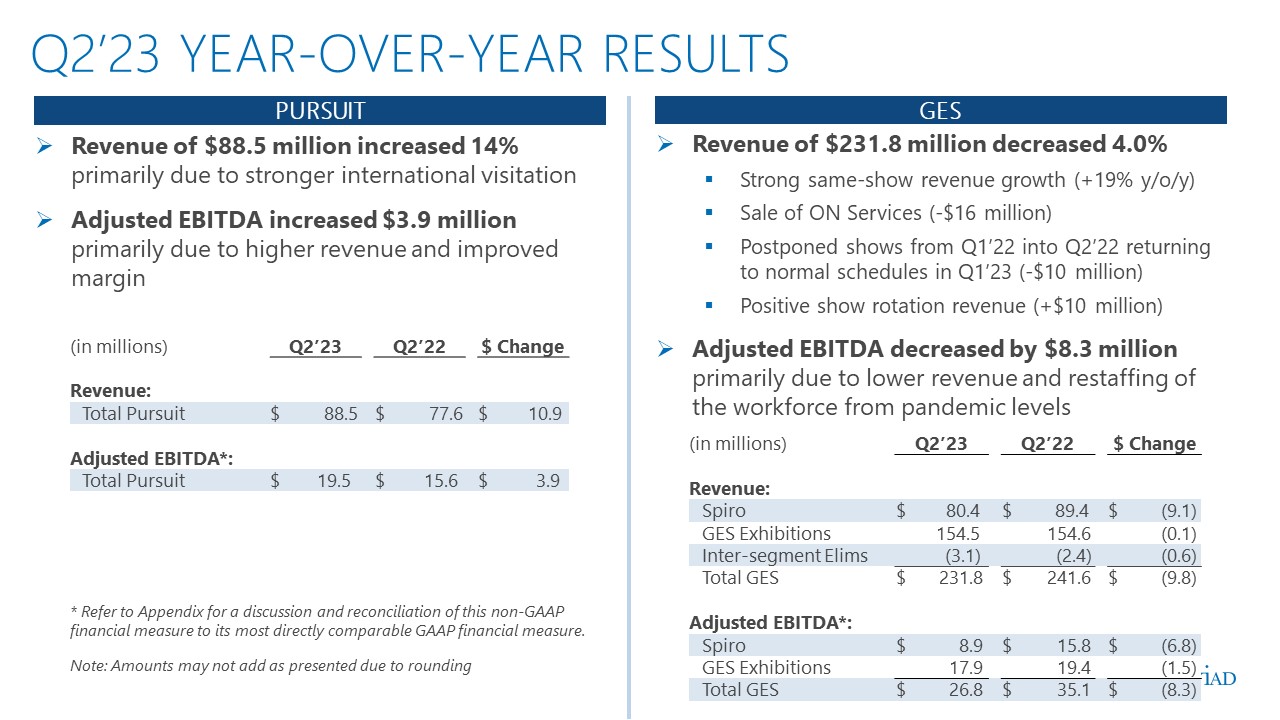
7 Q2’23 YEAR-OVER-YEAR RESULTS 7 (in millions) Q2’23 Q2’22 $ Change Revenue: Total Pursuit $ 88.5 $ 77.6 $ 10.9 Adjusted EBITDA*: Total Pursuit $ 19.5 $ 15.6 $ 3.9 * Refer to Appendix for a discussion and reconciliation of this non-GAAP financial measure to its most directly comparable GAAP financial measure. Note: Amounts may not add as presented due to rounding Revenue of $88.5 million increased 14% primarily due to stronger international visitation Adjusted EBITDA increased $3.9 million primarily due to higher revenue and improved margin Revenue of $231.8 million decreased 4.0% Strong same-show revenue growth (+19% y/o/y) Sale of ON Services (-$16 million) Postponed shows from Q1’22 into Q2’22 returning to normal schedules in Q1’23 (-$10 million) Positive show rotation revenue (+$10 million) Adjusted EBITDA decreased by $8.3 million primarily due to lower revenue and restaffing of the workforce from pandemic levels (in millions) Q2’23 Q2’22 $ Change Revenue: Spiro $ 80.4 $ 89.4 $ (9.1) GES Exhibitions 154.5 154.6 (0.1) Inter-segment Elims (3.1) (2.4) (0.6) Total GES $ 231.8 $ 241.6 $ (9.8) Adjusted EBITDA*: Spiro $ 8.9 $ 15.8 $ (6.8) GES Exhibitions 17.9 19.4 (1.5) Total GES $ 26.8 $ 35.1 $ (8.3) PURSUIT GES

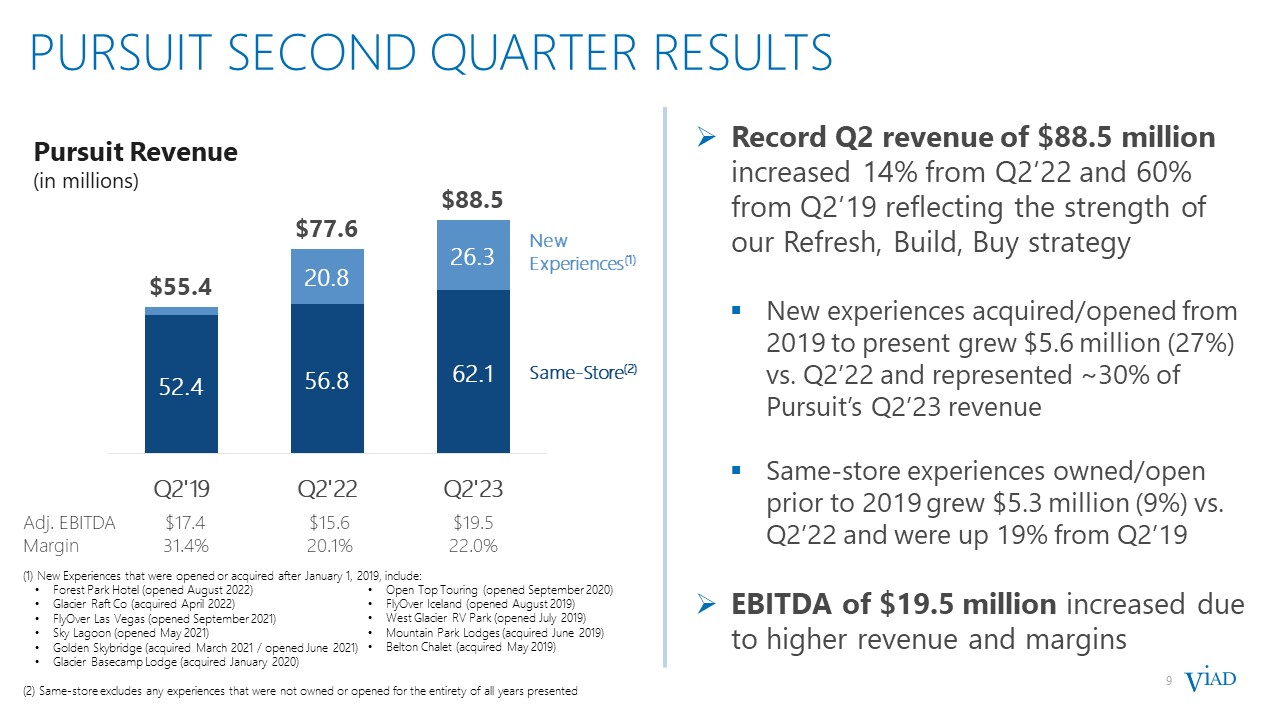
9 Pursuit second quarter results Record Q2 revenue of $88.5 million increased 14% from Q2’22 and 60% from Q2’19 reflecting the strength of our Refresh, Build, Buy strategy New experiences acquired/opened from 2019 to present grew $5.6 million (27%) vs. Q2’22 and represented ~30% of Pursuit’s Q2’23 revenue Same-store experiences owned/open prior to 2019 grew $5.3 million (9%) vs. Q2’22 and were up 19% from Q2’19 EBITDA of $19.5 million increased due to higher revenue and margins Pursuit Revenue (in millions) New Experiences(1) Same-Store(2) (1) New Experiences that were opened or acquired after January 1, 2019, include: Forest Park Hotel (opened August 2022) Glacier Raft Co (acquired April 2022) FlyOver Las Vegas (opened September 2021) Sky Lagoon (opened May 2021) Golden Skybridge (acquired March 2021 / opened June 2021) Glacier Basecamp Lodge (acquired January 2020) (2) Same-store excludes any experiences that were not owned or opened for the entirety of all years presented Open Top Touring (opened September 2020) FlyOver Iceland (opened August 2019) West Glacier RV Park (opened July 2019) Mountain Park Lodges (acquired June 2019) Belton Chalet (acquired May 2019) Adj. EBITDA $17.4 $15.6 $19.5 Margin 31.4% 20.1% 22.0%
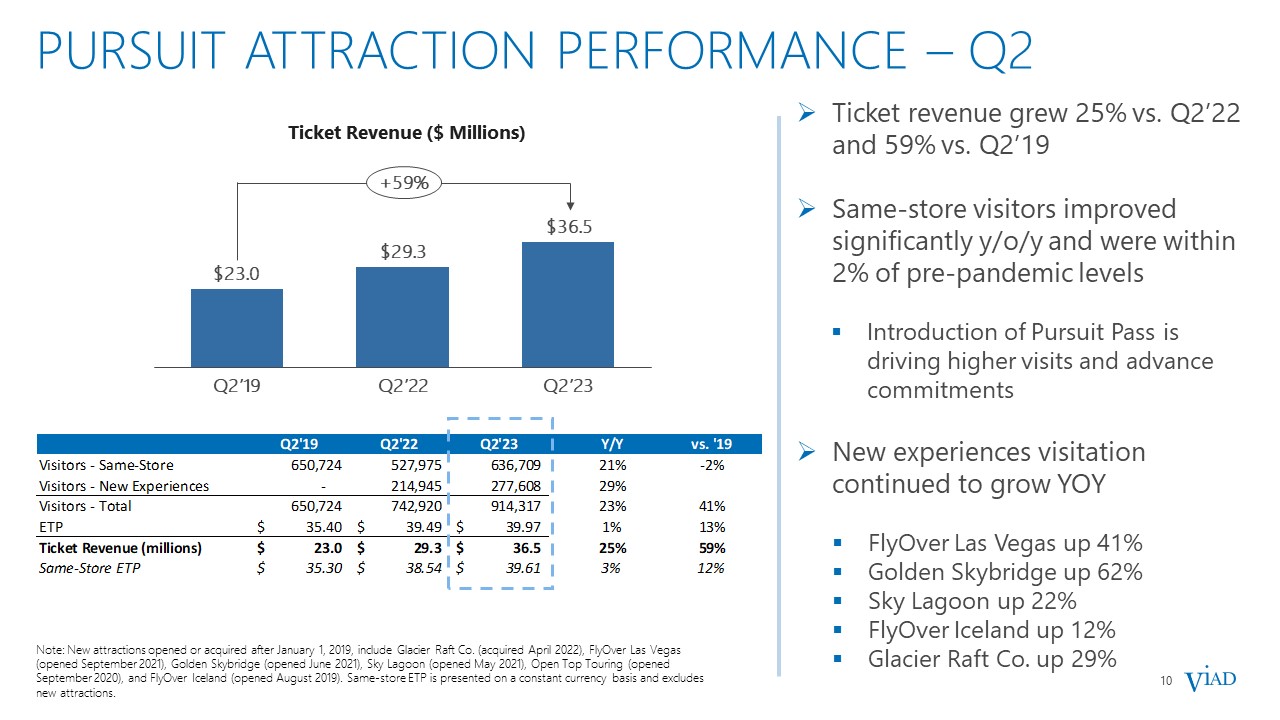
10 Pursuit attraction PERFORMANCE – Q2 Ticket revenue grew 25% vs. Q2’22 and 59% vs. Q2’19 Same-store visitors improved significantly y/o/y and were within 2% of pre-pandemic levels Introduction of Pursuit Pass is driving higher visits and advance commitments New experiences visitation continued to grow YOY FlyOver Las Vegas up 41% Golden Skybridge up 62% Sky Lagoon up 22% FlyOver Iceland up 12% Glacier Raft Co. up 29% Note: New attractions opened or acquired after January 1, 2019, include Glacier Raft Co. (acquired April 2022), FlyOver Las Vegas (opened September 2021), Golden Skybridge (opened June 2021), Sky Lagoon (opened May 2021), Open Top Touring (opened September 2020), and FlyOver Iceland (opened August 2019). Same-store ETP is presented on a constant currency basis and excludes new attractions. Ticket Revenue ($ Millions) Q2’23 Q2’19 Q2’22 +59%

11 Pursuit LODGING PERFORMANCE – Q2 Rooms revenue grew 8% vs. Q2’22 and 75% vs. Q2’19 Higher RevPAR and ADR than 2022 and 2019 from strong demand and refresh improvements to the guest experience Same-store RevPAR growth was primarily driven by stronger ADR, while occupancy remained strong Note: Same-store RevPAR is presented on a constant currency basis and excludes the following hotels that were opened or acquired after January 1, 2019: Forest Park Hotel (opened August 2022), Glacier Raft Co (acquired April 2022), Glacier Basecamp Lodge (acquired January 2020), West Glacier RV Park (opened July 2019), Mountain Park Lodges (acquired June 2019), and Belton Chalet (acquired May 2019). Rooms Revenue ($ Millions) Q2’19 Q2’22 Q2’23 +75%
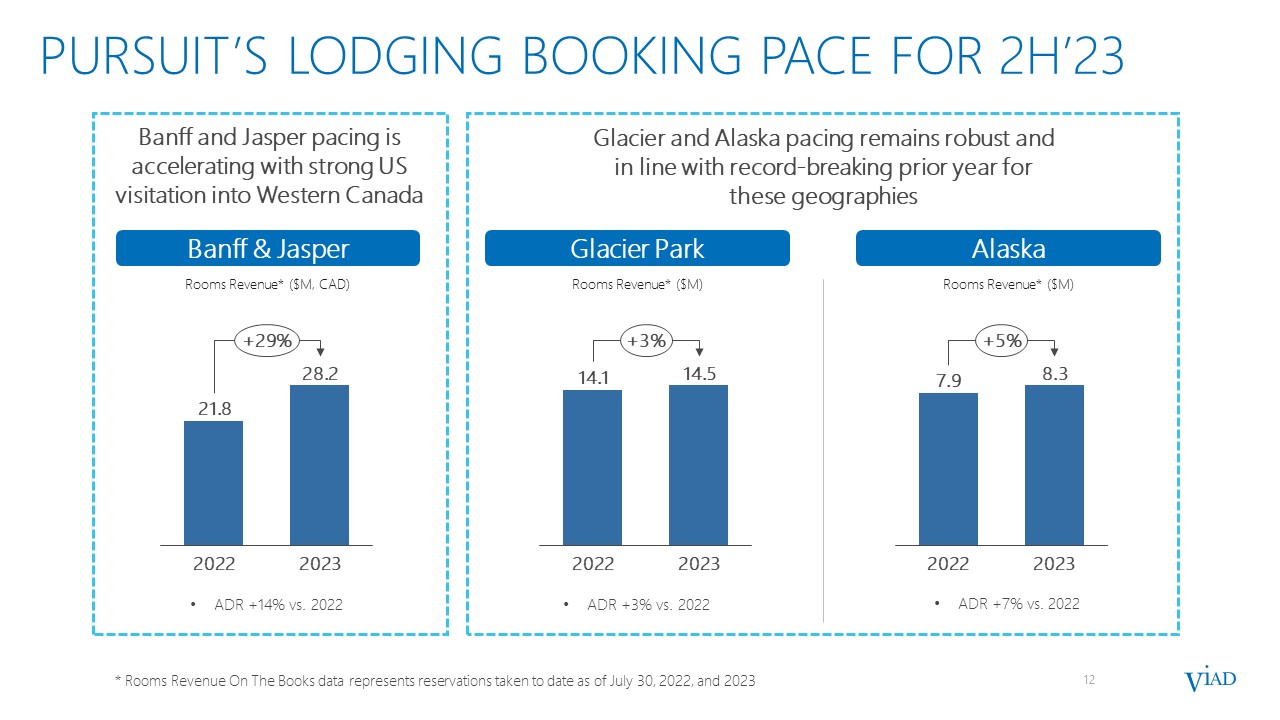
12 Banff & Jasper ADR +3% vs. 2022 ADR +7% vs. 2022 ADR +14% vs. 2022 Rooms Revenue* ($M, CAD) * Rooms Revenue On The Books data represents reservations taken to date as of July 30, 2022, and 2023 Glacier Park Rooms Revenue* ($M) Alaska Rooms Revenue* ($M) Pursuit’s lodging booking pace for 2h’23 Banff and Jasper pacing is accelerating with strong US visitation into Western Canada Glacier and Alaska pacing remains robust and in line with record-breaking prior year for these geographies 2022 2023 +29% 2022 2023 +3% 2022 2023 +5%

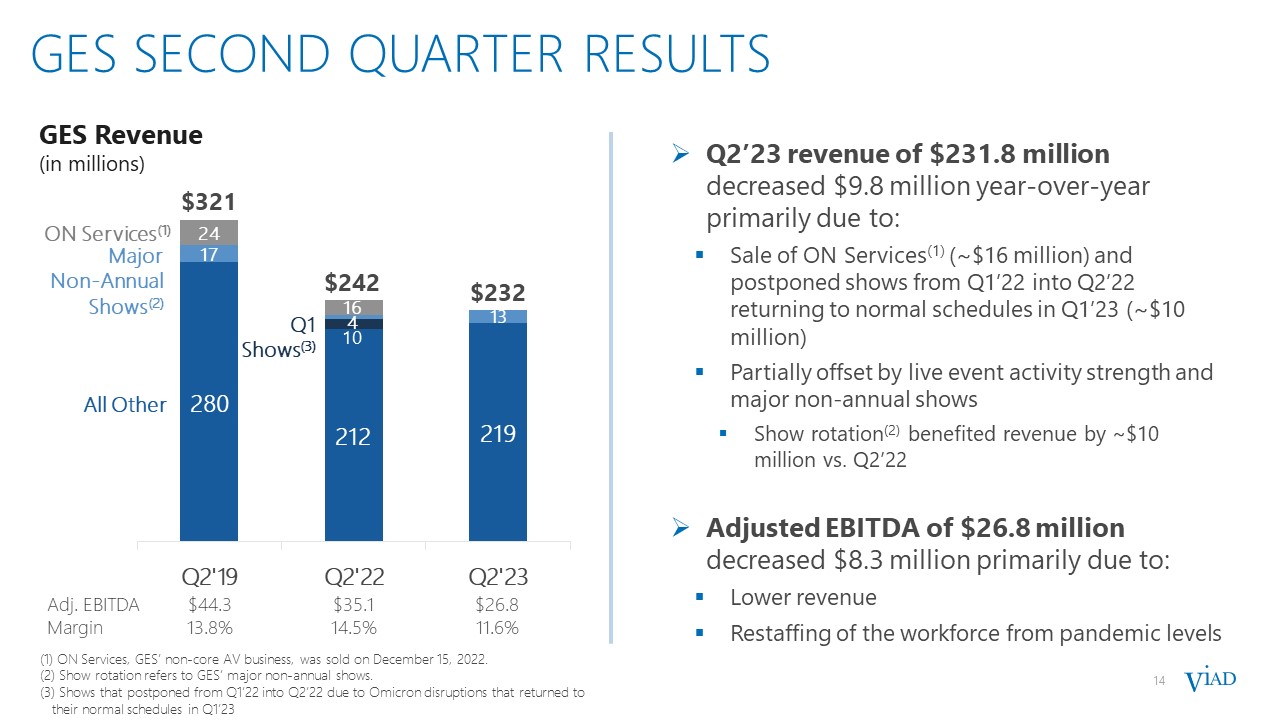
14 GES second quarter results GES Revenue (in millions) Q2’23 revenue of $231.8 million decreased $9.8 million year-over-year primarily due to: Sale of ON Services(1) (~$16 million) and postponed shows from Q1’22 into Q2’22 returning to normal schedules in Q1’23 (~$10 million) Partially offset by live event activity strength and major non-annual shows Show rotation(2) benefited revenue by ~$10 million vs. Q2’22 Adjusted EBITDA of $26.8 million decreased $8.3 million primarily due to: Lower revenue Restaffing of the workforce from pandemic levels (1) ON Services, GES’ non-core AV business, was sold on December 15, 2022. (2) Show rotation refers to GES’ major non-annual shows. (3) Shows that postponed from Q1’22 into Q2’22 due to Omicron disruptions that returned to their normal schedules in Q1’23 Adj. EBITDA $44.3 $35.1 $26.8 Margin 13.8% 14.5% 11.6% Q1 Shows(3) All Other ON Services(1) Major Non-Annual Shows(2)
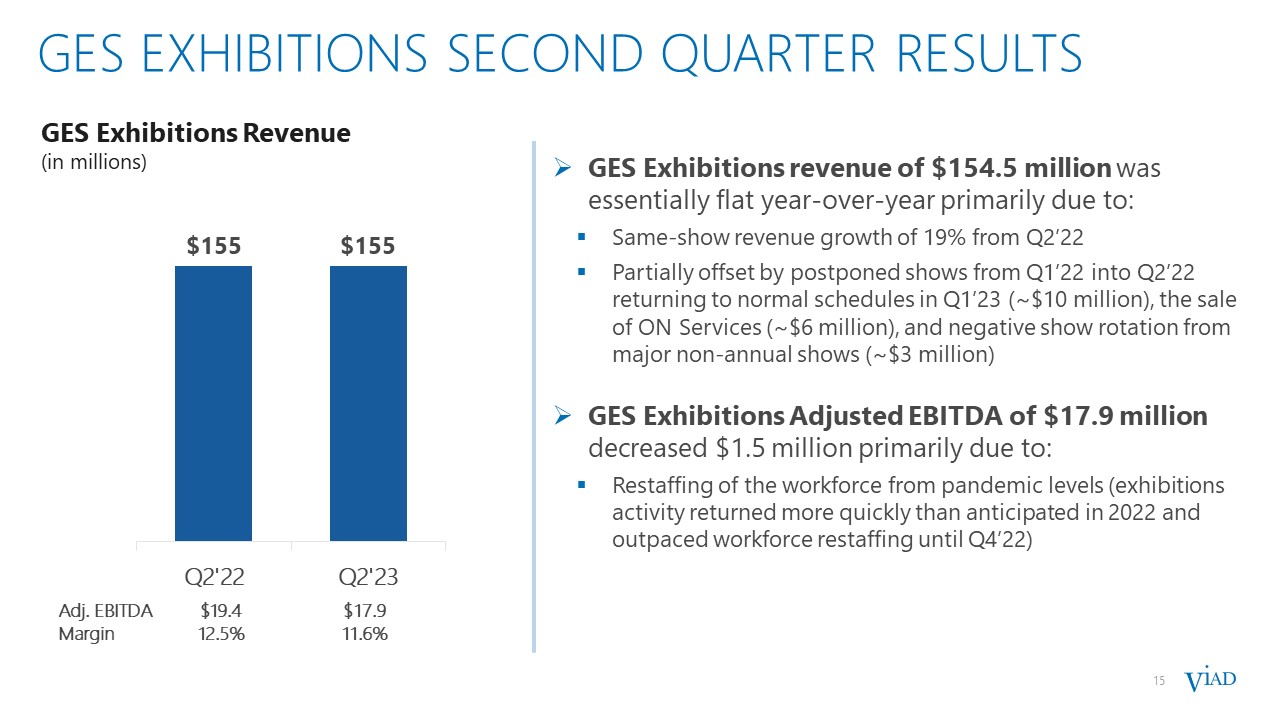
15 GES EXHIBITIONS second quarter results GES Exhibitions Revenue (in millions) Adj. EBITDA $19.4 $17.9 Margin 12.5% 11.6% GES Exhibitions revenue of $154.5 million was essentially flat year-over-year primarily due to: Same-show revenue growth of 19% from Q2’22 Partially offset by postponed shows from Q1’22 into Q2’22 returning to normal schedules in Q1’23 (~$10 million), the sale of ON Services (~$6 million), and negative show rotation from major non-annual shows (~$3 million) GES Exhibitions Adjusted EBITDA of $17.9 million decreased $1.5 million primarily due to: Restaffing of the workforce from pandemic levels (exhibitions activity returned more quickly than anticipated in 2022 and outpaced workforce restaffing until Q4’22)

16 EXHIBITIONS’ INDUSTRY HAS SUBSTANTIALLYRECOVERED WITH ROOM FOR MORE GROWTH 16 In Q2’23, GES Exhibitions’ same show revenue had nearly returned to 2019 levels Show sizes on average were still ~14% below pre-pandemic levels Substantial opportunity for future growth as event sizes fully recover * The US same show metric compares tradeshows that occurred in the same city for both occurrences and represented between 30% and 50% of the total exhibition revenue during each of the last five quarters GES’ revenue per net square foot of event space has improved vs. pre-pandemic GES US Exhibitions Same-Show* Revenue and Square Footage vs. 2019 Pre-Pandemic Occurrence
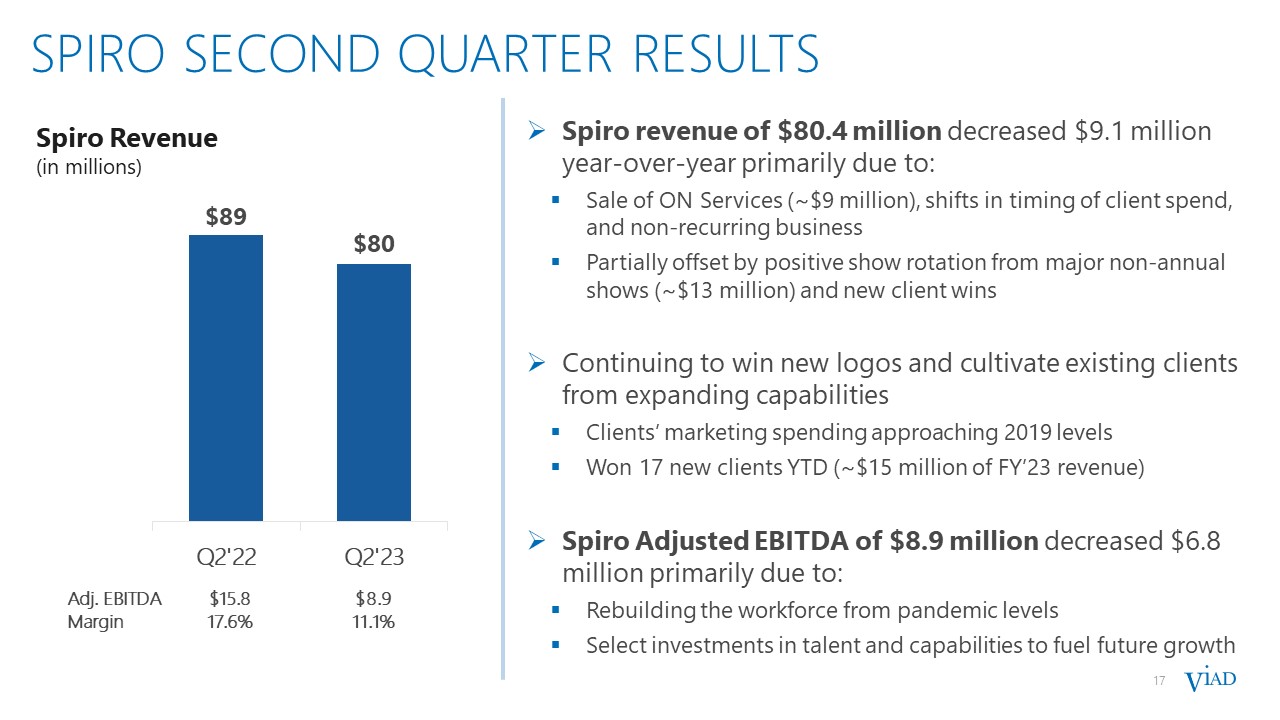
17 SPIRO second quarter results Spiro Revenue (in millions) Adj. EBITDA $15.8 $8.9 Margin 17.6% 11.1% Spiro revenue of $80.4 million decreased $9.1 million year-over-year primarily due to: Sale of ON Services (~$9 million), shifts in timing of client spend, and non-recurring business Partially offset by positive show rotation from major non-annual shows (~$13 million) and new client wins Continuing to win new logos and cultivate existing clients from expanding capabilities Clients’ marketing spending approaching 2019 levels Won 17 new clients YTD (~$15 million of FY’23 revenue) Spiro Adjusted EBITDA of $8.9 million decreased $6.8 million primarily due to: Rebuilding the workforce from pandemic levels Select investments in talent and capabilities to fuel future growth

18 FINANCIAL OUTLOOK

19 FINANCIAL OUTLOOK – Full Year 19 $millions FY’23 Guidance FY’22 Actual Pursuit: Revenue Adjusted EBITDA Up ~15% $85 to $95 $299.3 $67.9 Unchanged from prior guidance Revenue growth driven by lifting of all COVID restrictions at the Canadian border, acceleration of new experiences, and ongoing focus on improving the guest experience Margin improves as visitation increases, the performance of newer experiences improves, and pandemic-era cost pressures ease GES: Revenue Adjusted EBITDA Up low-single digits $54 to $62 $828.0 $61.3 Raised vs. prior guidance Revenue growth from stronger demand for exhibition and event services and new Spiro wins will more than offset negative show rotation (~$30) and sale of ON Services (~$50) EBITDA range reflects full run rate SG&A for GES Exhibitions and select investments in talent and capabilities at Spiro to fuel growth in 2023 and beyond Consolidated: Revenue Adjusted EBITDA Cash from Operations Capital Expenditures Up mid-single digits $126 to $143 $75 to $85 $70 to $75 $1,127.3 $116.1 $73.4 $67.2 Revenue, Adjusted EBITDA, and Cash from Operations raised from prior guidance on improved outlook for GES Cash from Operations range vs. prior year reflects higher EBITDA partially offset by higher interest and tax payments Capital expenditures range includes growth capex of ~$35 at Pursuit primarily related to FlyOver Chicago and refresh projects at Pyramid Lake Lodge

20 FINANCIAL OUTLOOK – Q3’23 20 $millions Q3’23 Guidance Q3’22 Actual Pursuit: Revenue Adjusted EBITDA $175 to $190 $87 to $95 $163.8 $75.1 Growth driven by lifting of all COVID restrictions at the Canadian border, acceleration of new experiences, and ongoing focus on improving the guest experience GES: Revenue Adjusted EBITDA $165 to $180 $(6) to $(2) $218.9 $10.7 Revenue decline due to show rotation (~$50) and sale of ON Services (~$14), partially offset by underlying growth EBITDA range reflects lower revenue Consolidated: Revenue Adjusted EBITDA Cash from Operations Capital Expenditures $340 to $370 $77.5 to $89.5 $55 to $60 $25 to $30 $382.7 $82.0 $61.5 $23.1 Revenue and Adjusted EBITDA ranges reflect expected revenue decline at GES, partially offset by continued growth at Pursuit Cash from Operations range reflects higher interest payments Capital expenditures range includes growth capex of ~$15 at Pursuit primarily related to FlyOver Chicago

APPENDIX
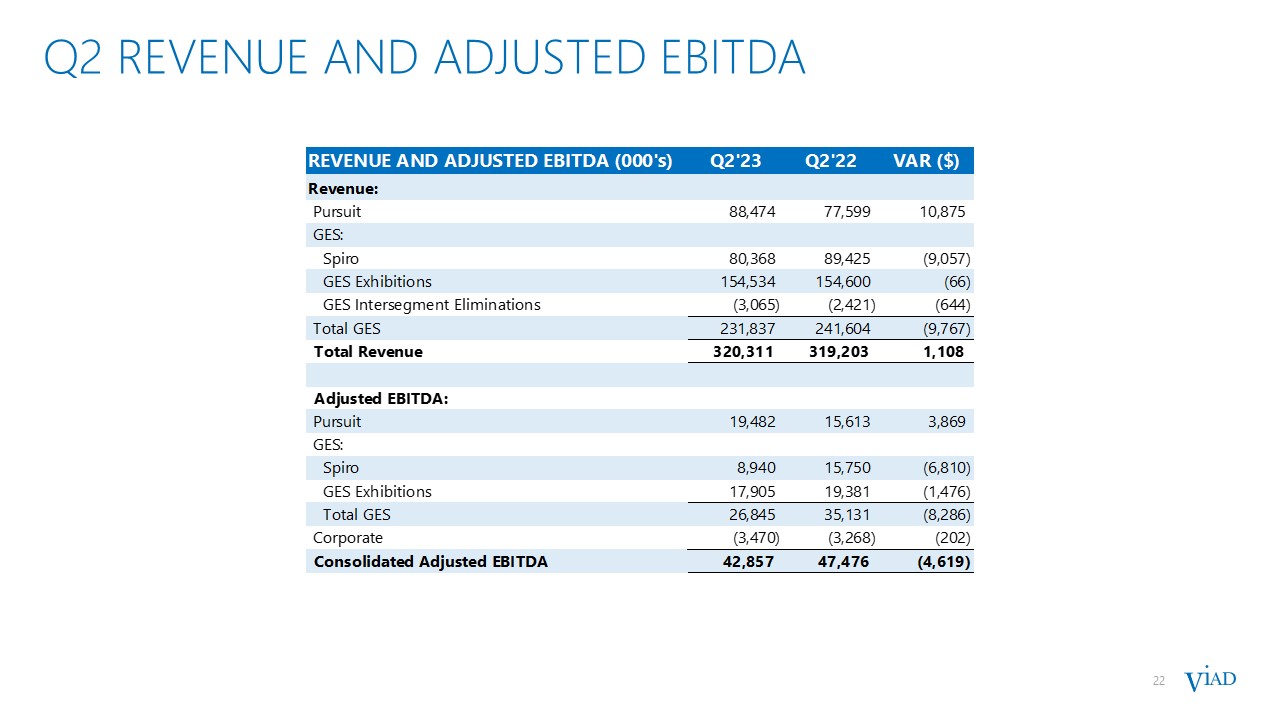
22 Q2 REVENUE AND ADJUSTED EBITDA
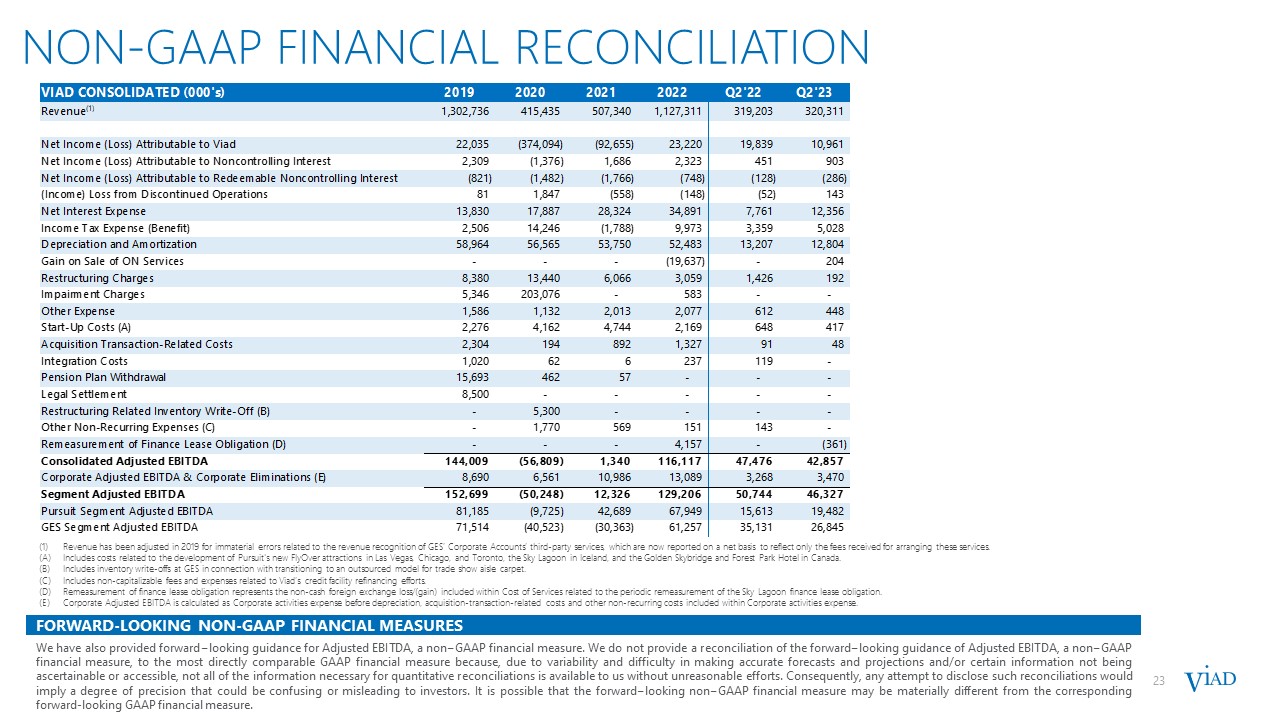
FORWARD-LOOKING NON-GAAP FINANCIAL MEASURES We have also provided forward−looking guidance for Adjusted EBITDA, a non−GAAP financial measure. We do not provide a reconciliation of the forward−looking guidance of Adjusted EBITDA, a non−GAAP financial measure, to the most directly comparable GAAP financial measure because, due to variability and difficulty in making accurate forecasts and projections and/or certain information not being ascertainable or accessible, not all of the information necessary for quantitative reconciliations is available to us without unreasonable efforts. Consequently, any attempt to disclose such reconciliations would imply a degree of precision that could be confusing or misleading to investors. It is possible that the forward−looking non−GAAP financial measure may be materially different from the corresponding forward-looking GAAP financial measure. NON-GAAP FINANCIAL RECONCILIATION 23 Revenue has been adjusted in 2019 for immaterial errors related to the revenue recognition of GES’ Corporate Accounts’ third-party services, which are now reported on a net basis to reflect only the fees received for arranging these services. Includes costs related to the development of Pursuit's new FlyOver attractions in Las Vegas, Chicago, and Toronto, the Sky Lagoon in Iceland, and the Golden Skybridge and Forest Park Hotel in Canada. Includes inventory write-offs at GES in connection with transitioning to an outsourced model for trade show aisle carpet. Includes non-capitalizable fees and expenses related to Viad’s credit facility refinancing efforts. Remeasurement of finance lease obligation represents the non-cash foreign exchange loss/(gain) included within Cost of Services related to the periodic remeasurement of the Sky Lagoon finance lease obligation. Corporate Adjusted EBITDA is calculated as Corporate activities expense before depreciation, acquisition-transaction-related costs and other non-recurring costs included within Corporate activities expense.
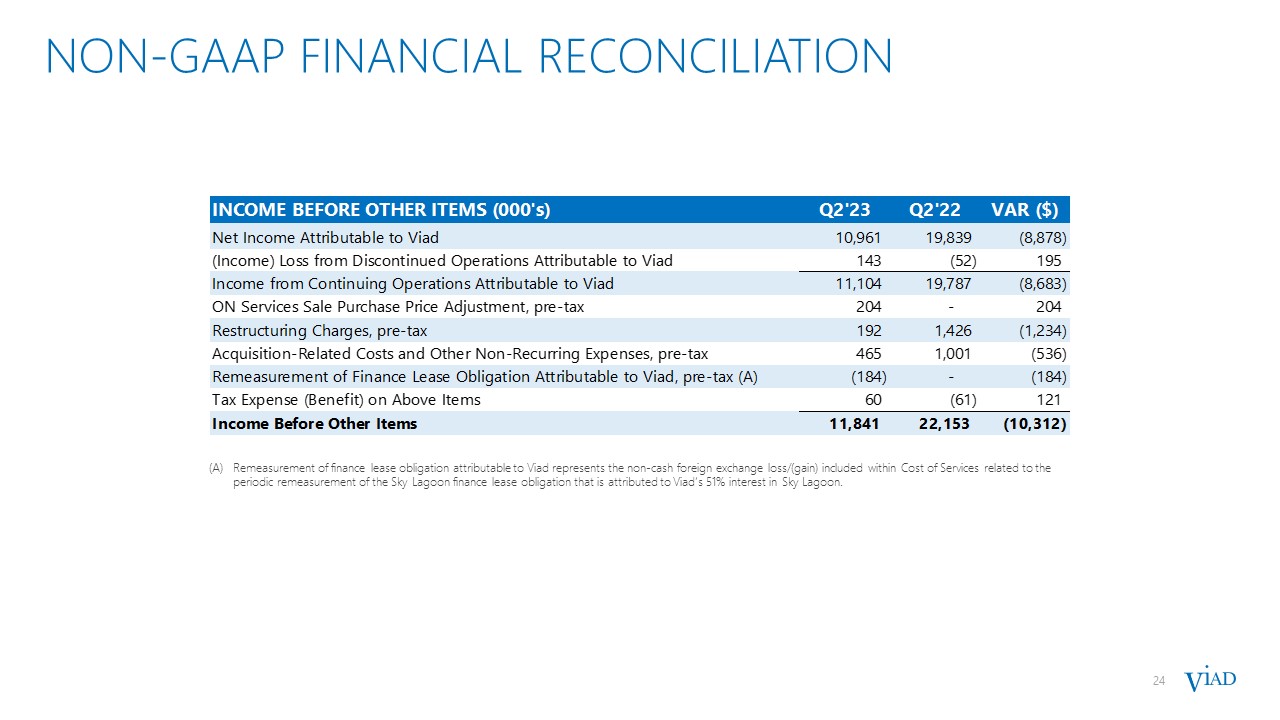
24 NON-GAAP FINANCIAL RECONCILIATION Remeasurement of finance lease obligation attributable to Viad represents the non-cash foreign exchange loss/(gain) included within Cost of Services related to the periodic remeasurement of the Sky Lagoon finance lease obligation that is attributed to Viad’s 51% interest in Sky Lagoon.
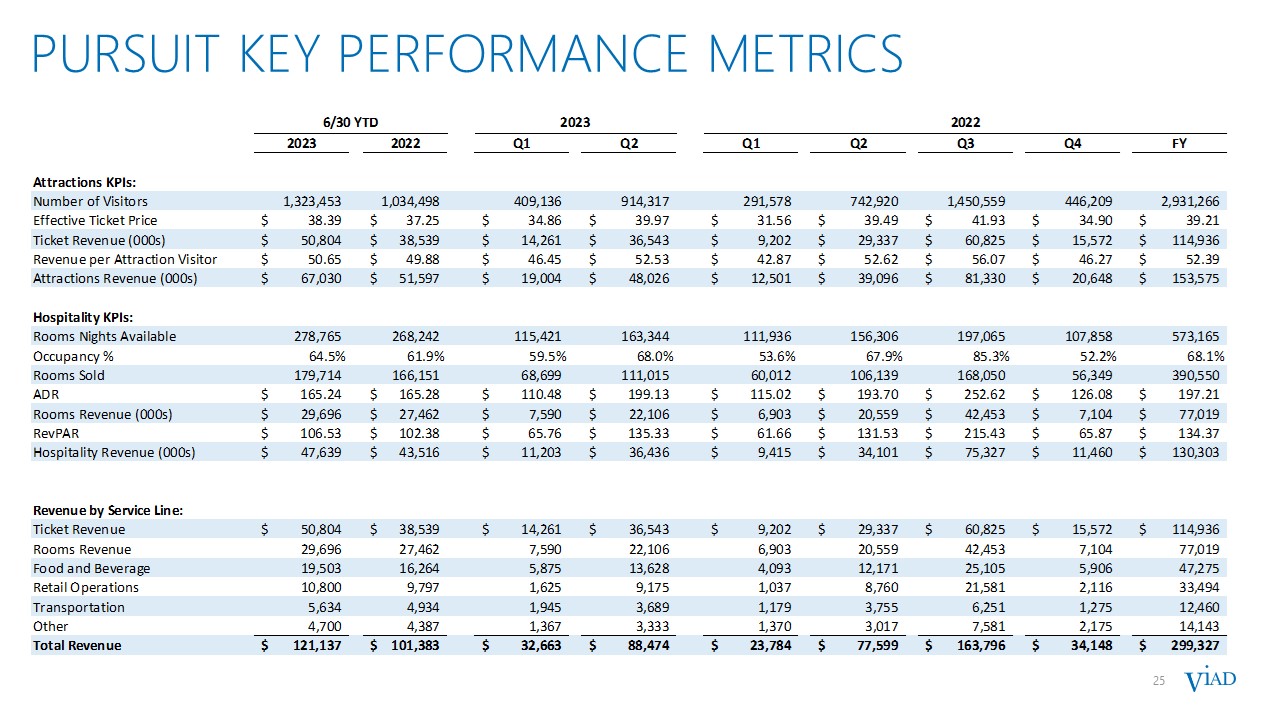
25 Pursuit key performance metrics 25

26 Cash Flow and Balance Sheet highlights 26 * Capacity available is equal to $100 million total facility size less outstanding balance and letters of credit.