Free signup for more
- Track your favorite companies
- Receive email alerts for new filings
- Personalized dashboard of news and more
- Access all data and search results
Filing tables
Filing exhibits
Related financial report
VVI similar filings
- 29 Apr 24 Entry into a Material Definitive Agreement
- 17 Apr 24 Results of Operations and Financial Condition
- 13 Mar 24 Regulation FD Disclosure
- 8 Feb 24 Viad Corp Reports 2023 Fourth Quarter and Full Year Results
- 15 Nov 23 Regulation FD Disclosure
- 2 Nov 23 Viad Corp Reports Results for the 2023 Third Quarter
- 11 Oct 23 Entry into a Material Definitive Agreement
Filing view
External links
| Exhibit 99.2 |

fourth quarter and full year 2023 EARNINGS CALL February 8, 2024
Forward-looking statements This presentation contains a number of forward-looking statements. Words, and variations of words, such as “will,” “may,” “expect,” “would,” “could,” “might,” “intend,” “plan,” “believe,” “estimate,” “anticipate,” “deliver,” “seek,” “aim,” “potential,” “target,” “outlook,” and similar expressions are intended to identify our forward-looking statements. Similarly, statements that describe our business strategy, outlook, objectives, plans, initiatives, intentions or goals also are forward looking statements. These forward-looking statements are not historical facts and are subject to a host of risks and uncertainties, many of which are beyond our control, which could cause actual results to differ materially from those in the forward-looking statements. Important factors that could cause actual results to differ materially from those described in our forward-looking statements include, but are not limited to, the following: general economic uncertainty in key global markets and a worsening of global economic conditions; travel industry disruptions; the impact of our overall level of indebtedness, as well as our financial covenants, on our operational and financial flexibility; identified material weakness in our internal control over financial reporting; seasonality of our businesses; the impact of the COVID-19 pandemic on our financial condition, liquidity, and cash flow; our ability to anticipate and adjust for new and emerging challenges presented by the ramifications of the COVID-19 pandemic on our businesses; unanticipated delays and cost overruns of our capital projects, and our ability to achieve established financial and strategic goals for such projects; our exposure to labor shortages, turnover, and labor cost increases; the importance of key members of our account teams to our business relationships; our ability to manage our business and continue our growth if we lose any of our key personnel; the competitive nature of the industries in which we operate; our dependence on large exhibition event clients; adverse effects of show rotation on our periodic results and operating margins; transportation disruptions and increases in transportation costs; natural disasters, weather conditions, accidents, and other catastrophic events; our exposure to labor cost increases and work stoppages related to unionized employees; our multi-employer pension plan funding obligations; our ability to successfully integrate and achieve established financial and strategic goals from acquisitions; our exposure to cybersecurity attacks and threats; our exposure to currency exchange rate fluctuations; liabilities relating to prior and discontinued operations; and compliance with laws governing the storage, collection, handling, and transfer of personal data and our exposure to legal claims and fines for data breaches or improper handling of such data. For a more complete discussion of the risks and uncertainties that may affect our business or financial results, please see Item 1A, “Risk Factors,” of our most recent annual report on Form 10-K filed with the SEC. We disclaim and do not undertake any obligation to update or revise any forward-looking statement in this presentation except as required by applicable law or regulation. 2
NON-GAAP FINANCIAL MEASURES This document includes the presentation of “Adjusted EBITDA” and ”Net Income (Loss) Before Other Items (Adjusted Net Income (Loss))”, which are supplemental to results presented under accounting principles generally accepted in the United States of America (“GAAP”) and may not be comparable to similarly titled measures presented by other companies. These non-GAAP measures should be considered in addition to, but not as a substitute for, other similar measures reported in accordance with GAAP. The use of these non-GAAP financial measures is limited, compared to the GAAP measure of net income attributable to Viad, because it does not consider a variety of items affecting Viad’s consolidated financial performance as explained below. Because these non-GAAP measures do not consider all items affecting Viad’s consolidated financial performance, a user of Viad’s financial information should consider net income attributable to Viad as an important measure of financial performance because it provides a more complete measure of the Company’s performance. Adjusted EBITDA is defined by management as net income attributable to Viad before income (loss) from discontinued operations, interest expense and interest income, income taxes, depreciation and amortization, acquisition-related costs, attraction start-up costs, restructuring charges, impairment charges, and the reduction/increase for income/loss attributable to non-redeemable and redeemable non-controlling interests, and gains or losses from sales of businesses. Adjusted EBITDA is considered a useful operating metric, in addition to net income attributable to Viad, as potential variations arising from non-recurring integration costs, non-cash amortization and depreciation, and non-operational expenses/income are eliminated, thus resulting in an additional measure considered to be indicative of Viad’s consolidated and segment performance. Management believes that the presentation of Adjusted EBITDA provides useful information to investors regarding Viad’s results of operations for trending, analyzing and benchmarking the performance and value of Viad’s business. Net Income (Loss) Before Other Items (Adjusted Net Income (Loss)) is defined by management as net income attributable to Viad before income (loss) from discontinued operations, acquisition-related costs, attraction start-up costs, restructuring charges, impairment charges, other non-recurring expenses, and tax matters. Net Income (Loss) Before Other Items (Adjusted Net Income (Loss)) is considered a useful operating metric, in addition to net income attributable to Viad, as potential variations arising from non-operational expenses/income are eliminated, thus resulting in an additional measure considered to be indicative of Viad’s performance. 3 Forward-Looking Non-GAAP Measures The company has not quantitatively reconciled its guidance for adjusted EBITDA to its respective most comparable GAAP measure because certain reconciling items that impact this metric including, provision for income taxes, interest expense, restructuring or impairment charges, acquisition-related costs, and attraction start-up costs have not occurred, are out of the company’s control, or cannot be reasonably predicted. Accordingly, reconciliations to the nearest GAAP financial measure are not available without unreasonable effort. Please note that the unavailable reconciling items could significantly impact the company’s results as reported under GAAP.
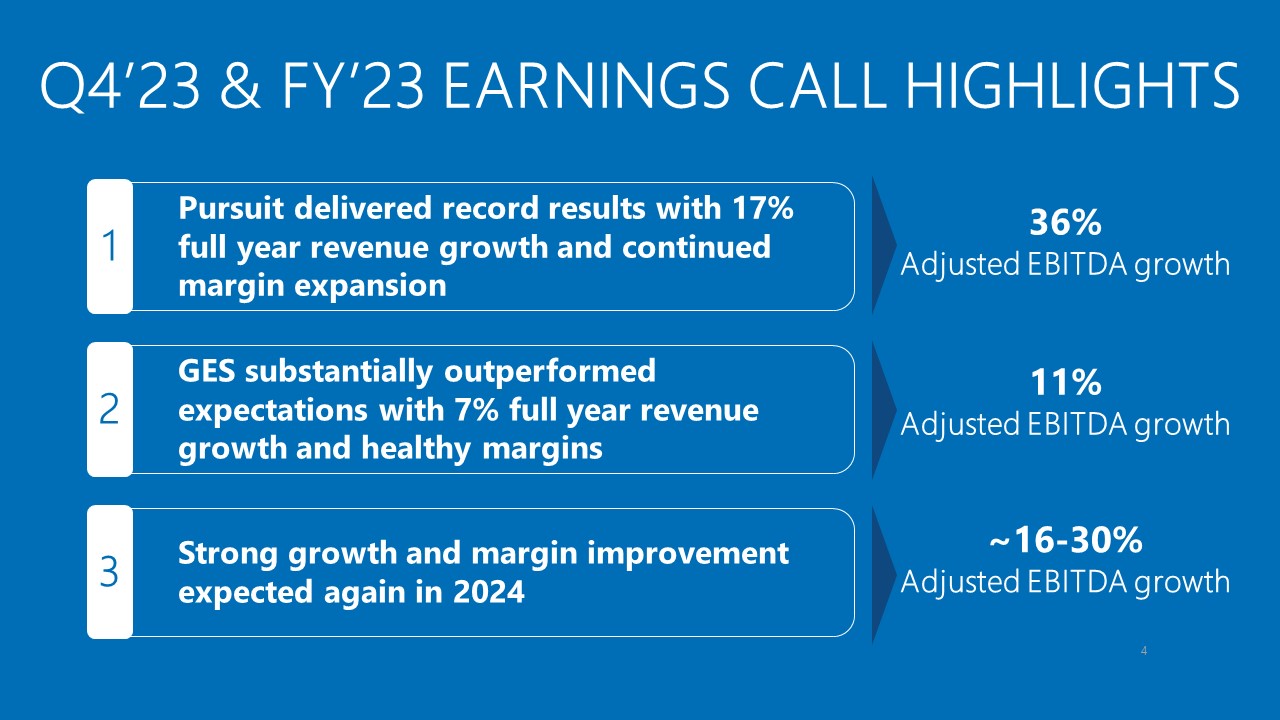
Q4’23 & FY’23 Earnings Call HIGHLIGHTS 4 36% Adjusted EBITDA growth 11% Adjusted EBITDA growth ~16-30% Adjusted EBITDA growth

FINANCIAL PERFORMANCE & OUTLOOK
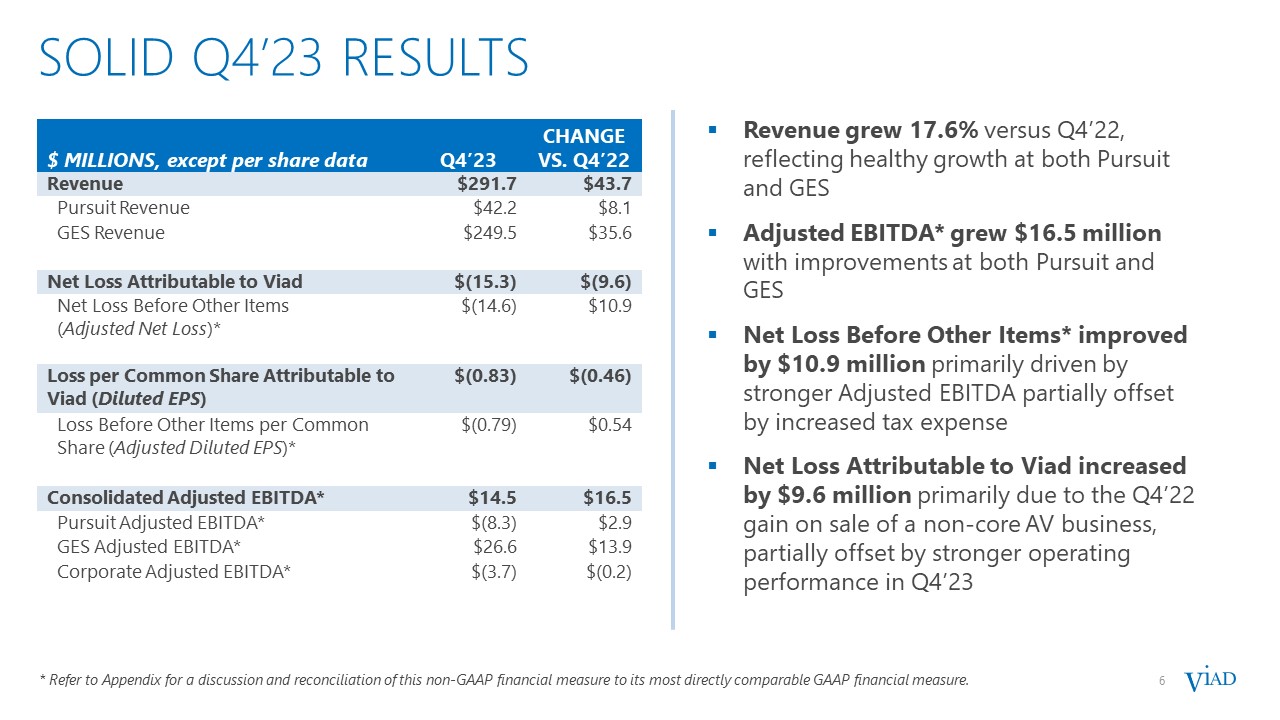
6 solid Q4’23 RESULTS 6 Revenue grew 17.6% versus Q4’22, reflecting healthy growth at both Pursuit and GES Adjusted EBITDA* grew $16.5 million with improvements at both Pursuit and GES Net Loss Before Other Items* improved by $10.9 million primarily driven by stronger Adjusted EBITDA partially offset by increased tax expense Net Loss Attributable to Viad increased by $9.6 million primarily due to the Q4’22 gain on sale of a non-core AV business, partially offset by stronger operating performance in Q4’23 * Refer to Appendix for a discussion and reconciliation of this non-GAAP financial measure to its most directly comparable GAAP financial measure. $ MILLIONS, except per share data Q4’23 CHANGE VS. Q4’22 Revenue $291.7 $43.7 Pursuit Revenue $42.2 $8.1 GES Revenue $249.5 $35.6 Net Loss Attributable to Viad $(15.3) $(9.6) Net Loss Before Other Items (Adjusted Net Loss)* $(14.6) $10.9 Loss per Common Share Attributable to Viad (Diluted EPS) $(0.83) $(0.46) Loss Before Other Items per Common Share (Adjusted Diluted EPS)* $(0.79) $0.54 Consolidated Adjusted EBITDA* $14.5 $16.5 Pursuit Adjusted EBITDA* $(8.3) $2.9 GES Adjusted EBITDA* $26.6 $13.9 Corporate Adjusted EBITDA* $(3.7) $(0.2)
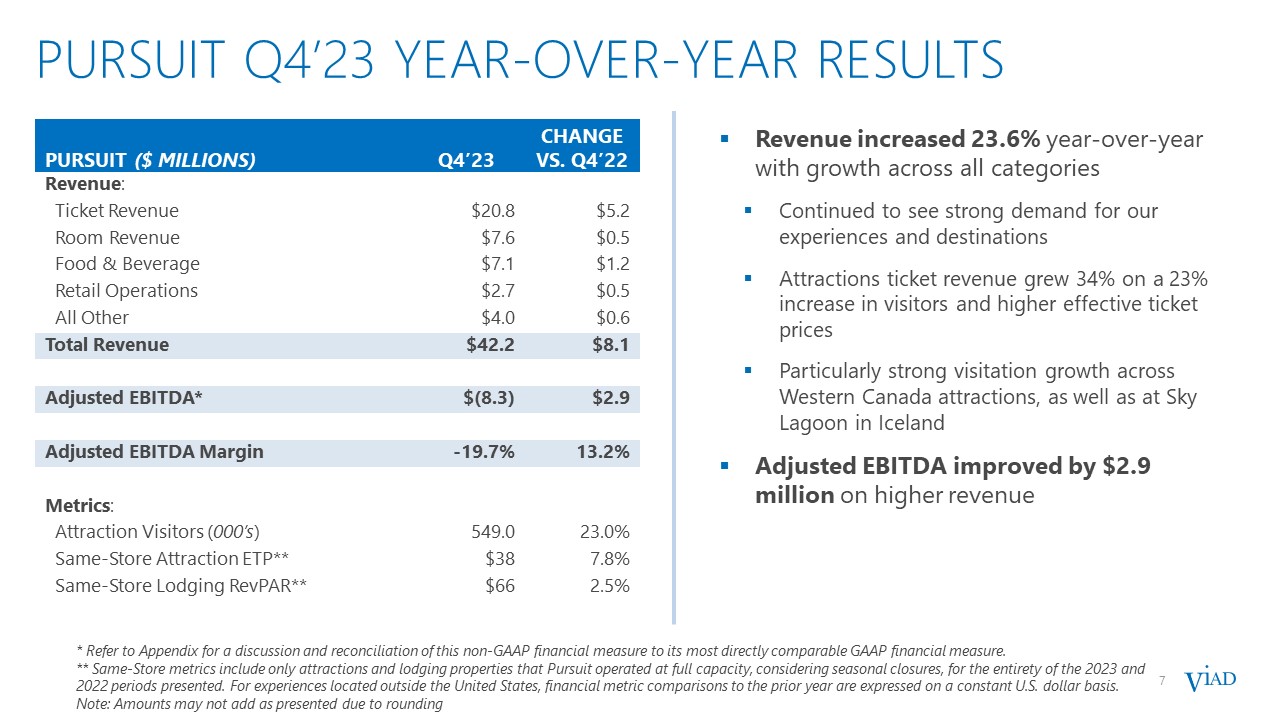
7 PURSUIT Q4’23 YEAR-OVER-YEAR RESULTS 7 * Refer to Appendix for a discussion and reconciliation of this non-GAAP financial measure to its most directly comparable GAAP financial measure. ** Same-Store metrics include only attractions and lodging properties that Pursuit operated at full capacity, considering seasonal closures, for the entirety of the 2023 and 2022 periods presented. For experiences located outside the United States, financial metric comparisons to the prior year are expressed on a constant U.S. dollar basis. Note: Amounts may not add as presented due to rounding Revenue increased 23.6% year-over-year with growth across all categories Continued to see strong demand for our experiences and destinations Attractions ticket revenue grew 34% on a 23% increase in visitors and higher effective ticket prices Particularly strong visitation growth across Western Canada attractions, as well as at Sky Lagoon in Iceland Adjusted EBITDA improved by $2.9 million on higher revenue PURSUIT ($ MILLIONS) Q4’23 CHANGE VS. Q4’22 Revenue: Ticket Revenue $20.8 $5.2 Room Revenue $7.6 $0.5 Food & Beverage $7.1 $1.2 Retail Operations $2.7 $0.5 All Other $4.0 $0.6 Total Revenue $42.2 $8.1 Adjusted EBITDA* $(8.3) $2.9 Adjusted EBITDA Margin -19.7% 13.2% Metrics: Attraction Visitors (000’s) 549.0 23.0% Same-Store Attraction ETP** $38 7.8% Same-Store Lodging RevPAR** $66 2.5%
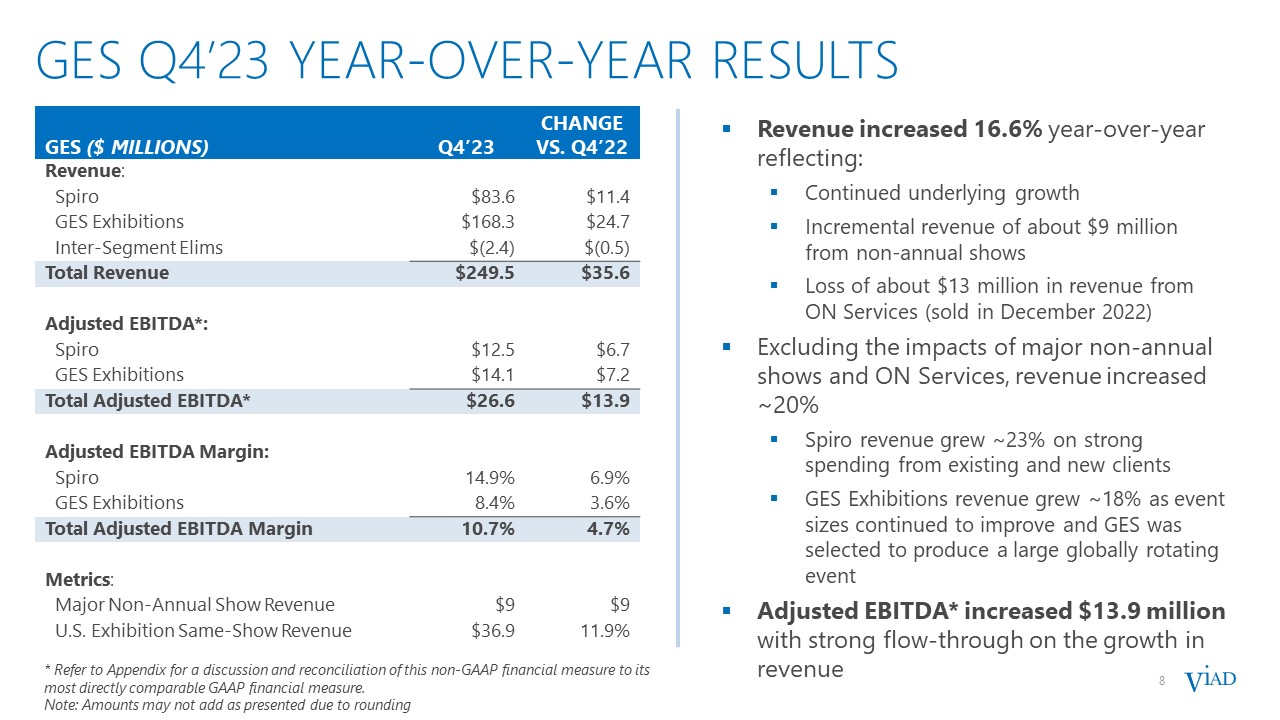
8 GES Q4’23 YEAR-OVER-YEAR RESULTS 8 Revenue increased 16.6% year-over-year reflecting: Continued underlying growth Incremental revenue of about $9 million from non-annual shows Loss of about $13 million in revenue from ON Services (sold in December 2022) Excluding the impacts of major non-annual shows and ON Services, revenue increased ~20% Spiro revenue grew ~23% on strong spending from existing and new clients GES Exhibitions revenue grew ~18% as event sizes continued to improve and GES was selected to produce a large globally rotating event Adjusted EBITDA* increased $13.9 million with strong flow-through on the growth in revenue GES ($ MILLIONS) Q4’23 CHANGE VS. Q4’22 Revenue: Spiro $83.6 $11.4 GES Exhibitions $168.3 $24.7 Inter-Segment Elims $(2.4) $(0.5) Total Revenue $249.5 $35.6 Adjusted EBITDA*: Spiro $12.5 $6.7 GES Exhibitions $14.1 $7.2 Total Adjusted EBITDA* $26.6 $13.9 Adjusted EBITDA Margin: Spiro 14.9% 6.9% GES Exhibitions 8.4% 3.6% Total Adjusted EBITDA Margin 10.7% 4.7% Metrics: Major Non-Annual Show Revenue $9 $9 U.S. Exhibition Same-Show Revenue $36.9 11.9% * Refer to Appendix for a discussion and reconciliation of this non-GAAP financial measure to its most directly comparable GAAP financial measure. Note: Amounts may not add as presented due to rounding
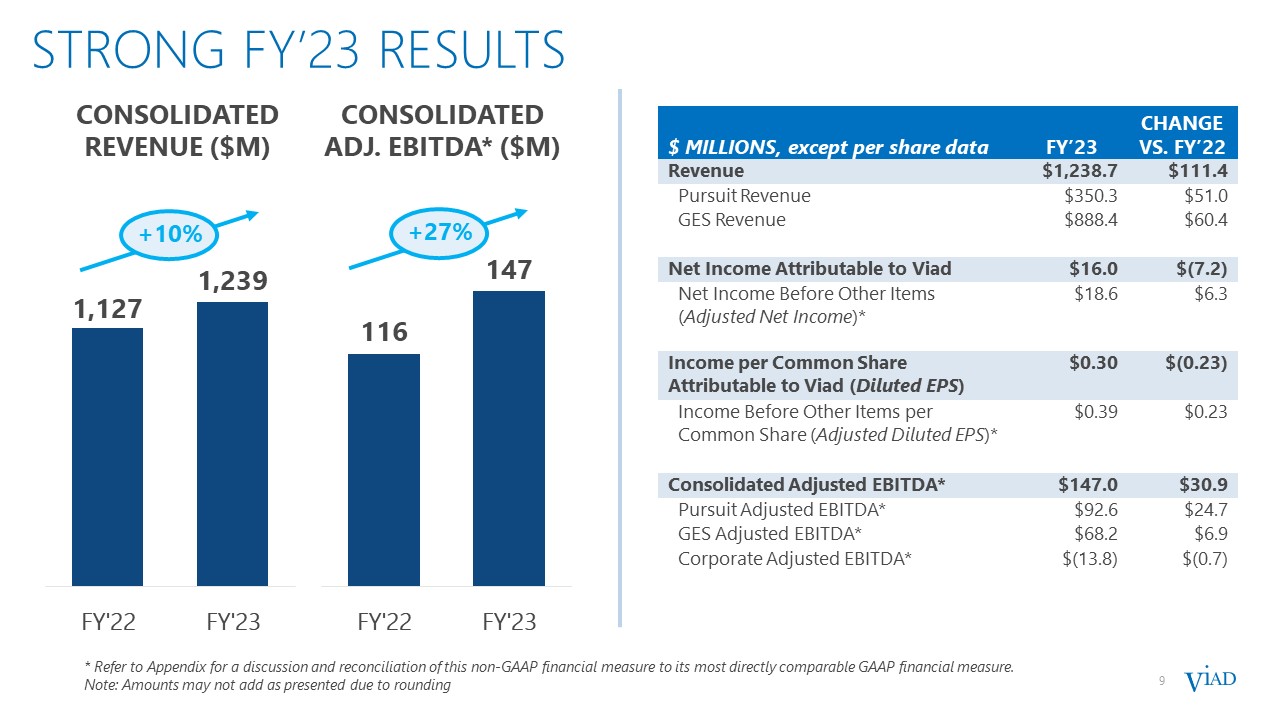
Strong FY’23 RESULTS 9 CONSOLIDATED REVENUE ($M) +10% CONSOLIDATED ADJ. EBITDA* ($M) +27% $ MILLIONS, except per share data FY’23 CHANGE VS. FY’22 Revenue $1,238.7 $111.4 Pursuit Revenue $350.3 $51.0 GES Revenue $888.4 $60.4 Net Income Attributable to Viad $16.0 $(7.2) Net Income Before Other Items (Adjusted Net Income)* $18.6 $6.3 Income per Common Share Attributable to Viad (Diluted EPS) $0.30 $(0.23) Income Before Other Items per Common Share (Adjusted Diluted EPS)* $0.39 $0.23 Consolidated Adjusted EBITDA* $147.0 $30.9 Pursuit Adjusted EBITDA* $92.6 $24.7 GES Adjusted EBITDA* $68.2 $6.9 Corporate Adjusted EBITDA* $(13.8) $(0.7) * Refer to Appendix for a discussion and reconciliation of this non-GAAP financial measure to its most directly comparable GAAP financial measure. Note: Amounts may not add as presented due to rounding
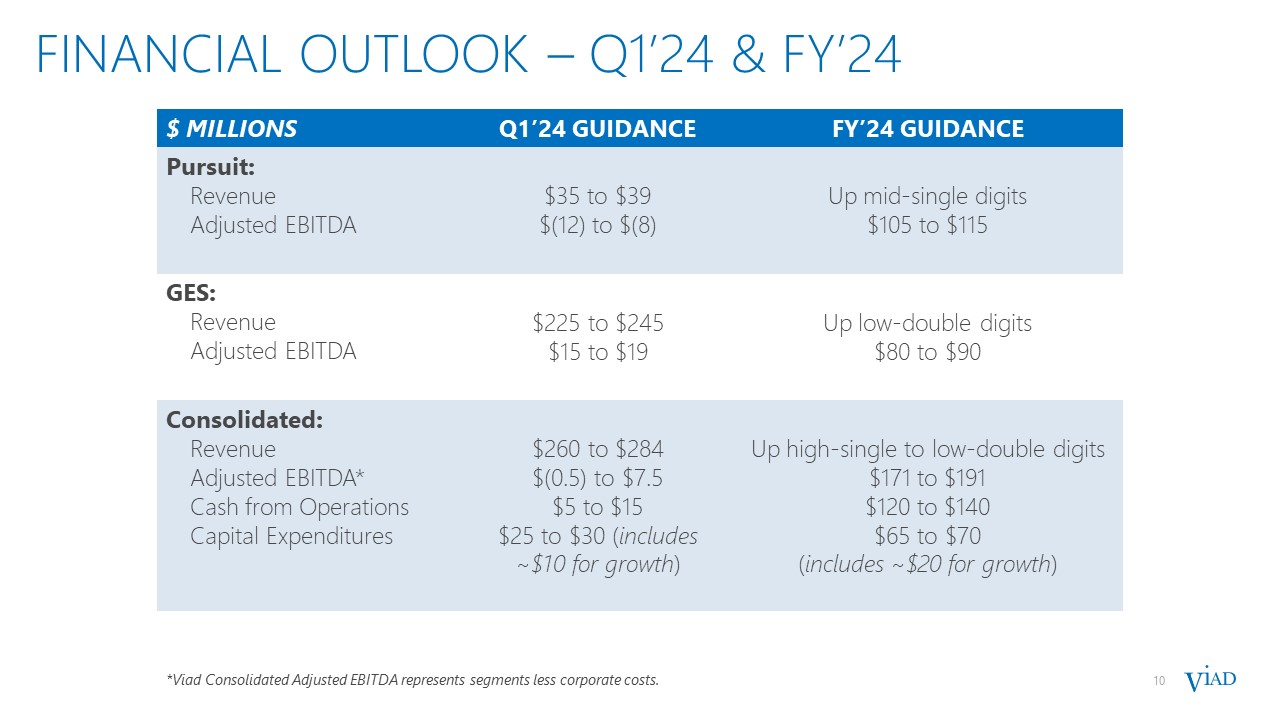
FINANCIAL OUTLOOK – Q1’24 & FY’24 $ MILLIONS Q1’24 GUIDANCE FY’24 GUIDANCE Pursuit: Revenue Adjusted EBITDA $35 to $39 $(12) to $(8) Up mid-single digits $105 to $115 GES: Revenue Adjusted EBITDA $225 to $245 $15 to $19 Up low-double digits $80 to $90 Consolidated: Revenue Adjusted EBITDA* Cash from Operations Capital Expenditures $260 to $284 $(0.5) to $7.5 $5 to $15 $25 to $30 (includes ~$10 for growth) Up high-single to low-double digits $171 to $191 $120 to $140 $65 to $70 (includes ~$20 for growth) 10 *Viad Consolidated Adjusted EBITDA represents segments less corporate costs.


12 PURSUIT’s Fy’23 attraction PERFORMANCE TICKET REVENUE ($M) +25% 2023F 2024P 25% year-over-year ticket revenue growth driven by strong increases in visitation and pricing Substantial increases in visitation from the return of international tourism to Western Canada and Iceland Newer experiences launched in recent years, including the Sky Lagoon, FlyOver Las Vegas, and Golden Skybridge delivered significant visitation increases over 2022 VISITATION (K) SAME-STORE ETP +21% +6% Note: Same-Store metrics include only attractions properties that Pursuit operated at full capacity, considering seasonal closures, for the entirety of the 2023 and 2022 periods presented. For experiences located outside the United States, financial metric comparisons to the prior year are expressed on a constant U.S. dollar basis. Sky Lagoon, Reykjavík, Iceland
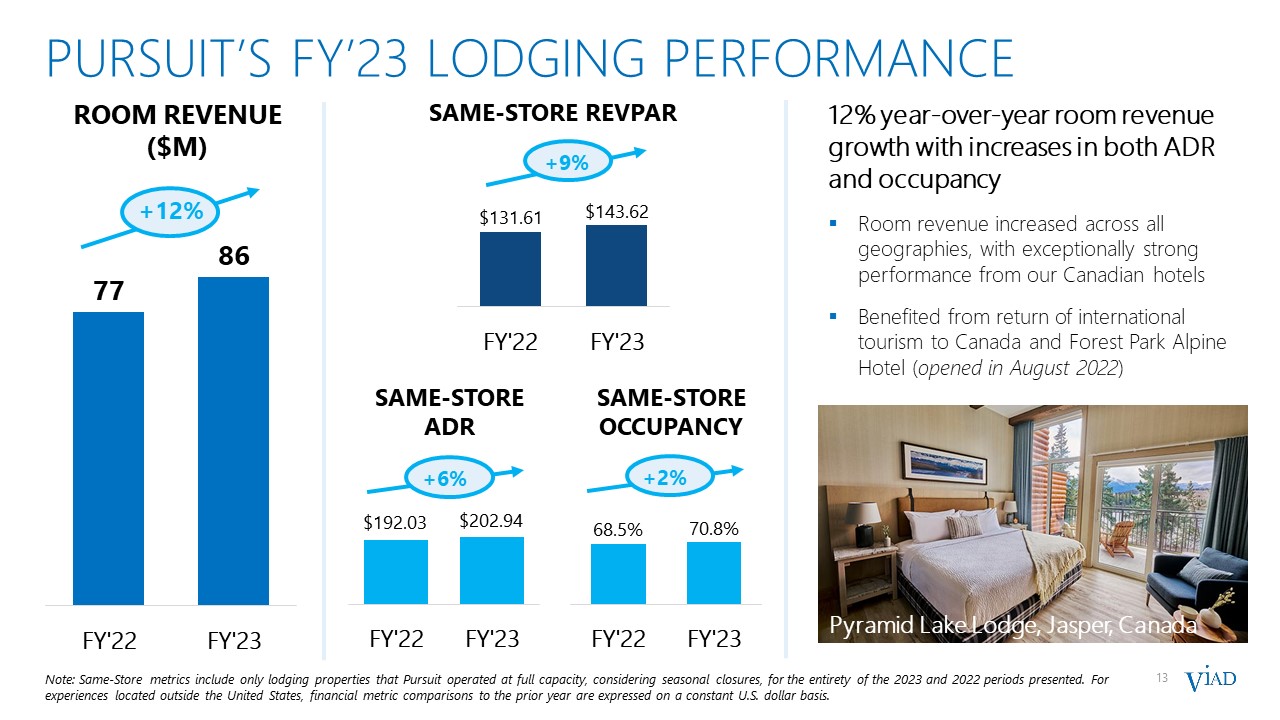
13 PURSUIT’s FY’23 LODGING PERFORMANCE ROOM REVENUE ($M) +12% 2023F 2024P 12% year-over-year room revenue growth with increases in both ADR and occupancy Room revenue increased across all geographies, with exceptionally strong performance from our Canadian hotels Benefited from return of international tourism to Canada and Forest Park Alpine Hotel (opened in August 2022) SAME-STORE ADR SAME-STORE OCCUPANCY +2% SAME-STORE REVPAR +9% +6% Note: Same-Store metrics include only lodging properties that Pursuit operated at full capacity, considering seasonal closures, for the entirety of the 2023 and 2022 periods presented. For experiences located outside the United States, financial metric comparisons to the prior year are expressed on a constant U.S. dollar basis. Pyramid Lake Lodge, Jasper, Canada

14 PURSUIT’s LODGING BOOKING PACE +22% US LODGING ROOM REVENUE ON THE BOOKS* (USD $M) +4% CANADIAN LODGING ROOM REVENUE ON THE BOOKS* (CAD $M) 2022 2023 2024 * Room Revenue on the Books data represents reservations taken to date as of February 2, 2022, 2023, and 2024. 2022 2023 2024 ADR +17% vs. 2023 ADR +13% vs. 2023
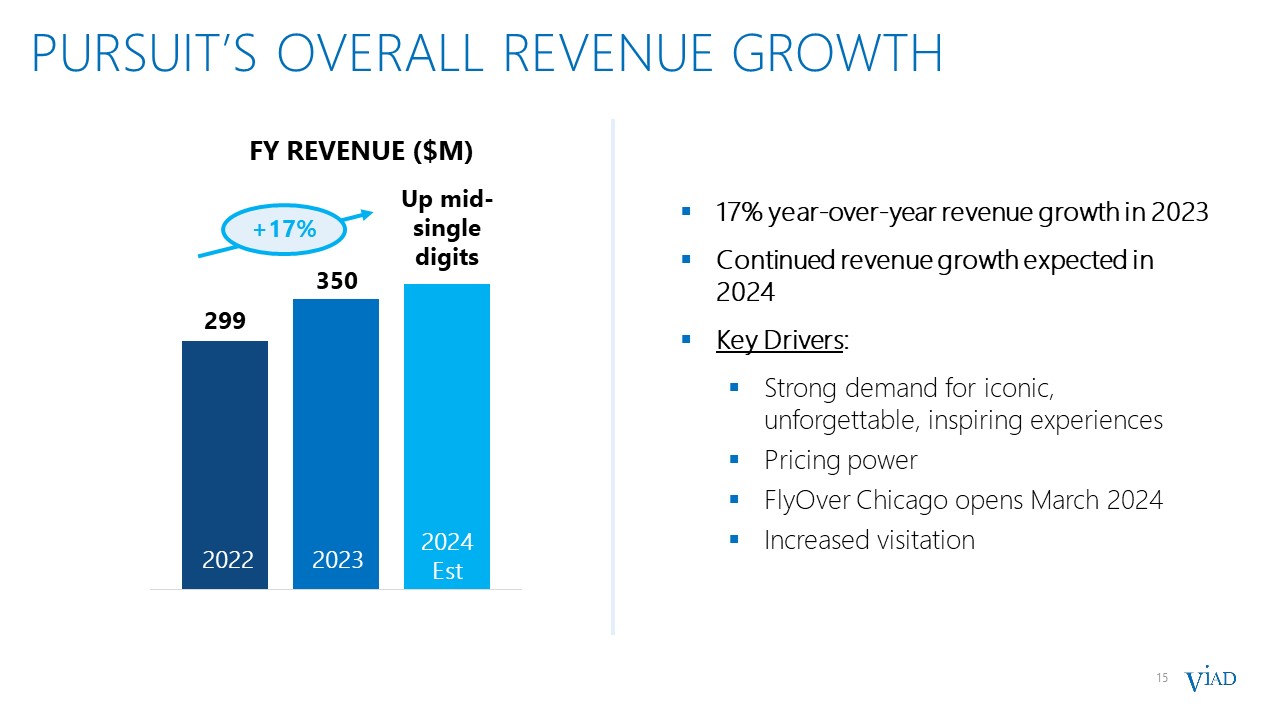
15 PURSUIT’s OVERALL REVENUE GROWTH FY REVENUE ($M) +17% 2022 2023 17% year-over-year revenue growth in 2023 Continued revenue growth expected in 2024 Key Drivers: Strong demand for iconic, unforgettable, inspiring experiences Pricing power FlyOver Chicago opens March 2024 Increased visitation 2024 Est Up mid-single digits

16 PURSUIT’s margin expansion FY ADJUSTED EBITDA MARGIN (%) +370 bps 2022 2022 2023 370 bps year-over-year margin increase in 2023 Continued strong margin improvement expected in 2024 to reach 30% target Key Drivers: Higher attraction visitation with strong throughput Revenue management Prudent labor and expense management 2024 Est FY ADJUSTED EBITDA (M) $68 $93 $105-115

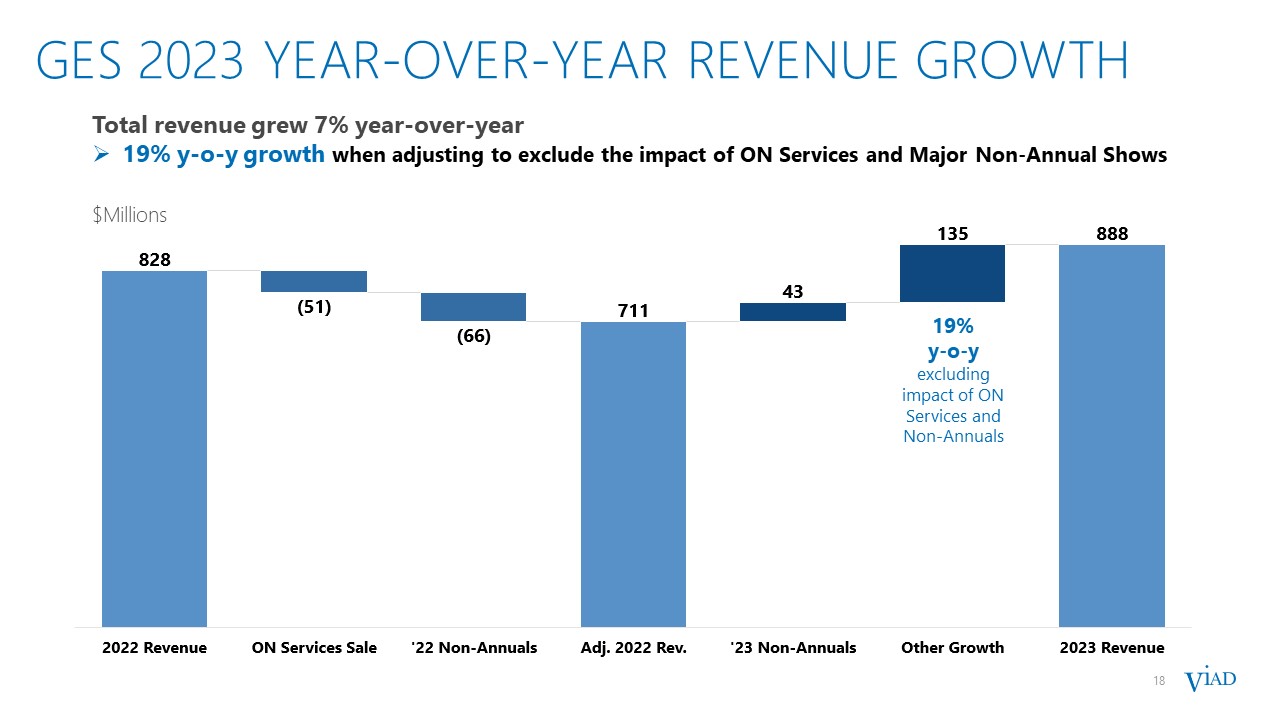
18 GES 2023 YEAR-OVER-YEAR Revenue growth 18 Total revenue grew 7% year-over-year 19% y-o-y growth when adjusting to exclude the impact of ON Services and Major Non-Annual Shows 19% y-o-y excluding impact of ON Services and Non-Annuals $Millions
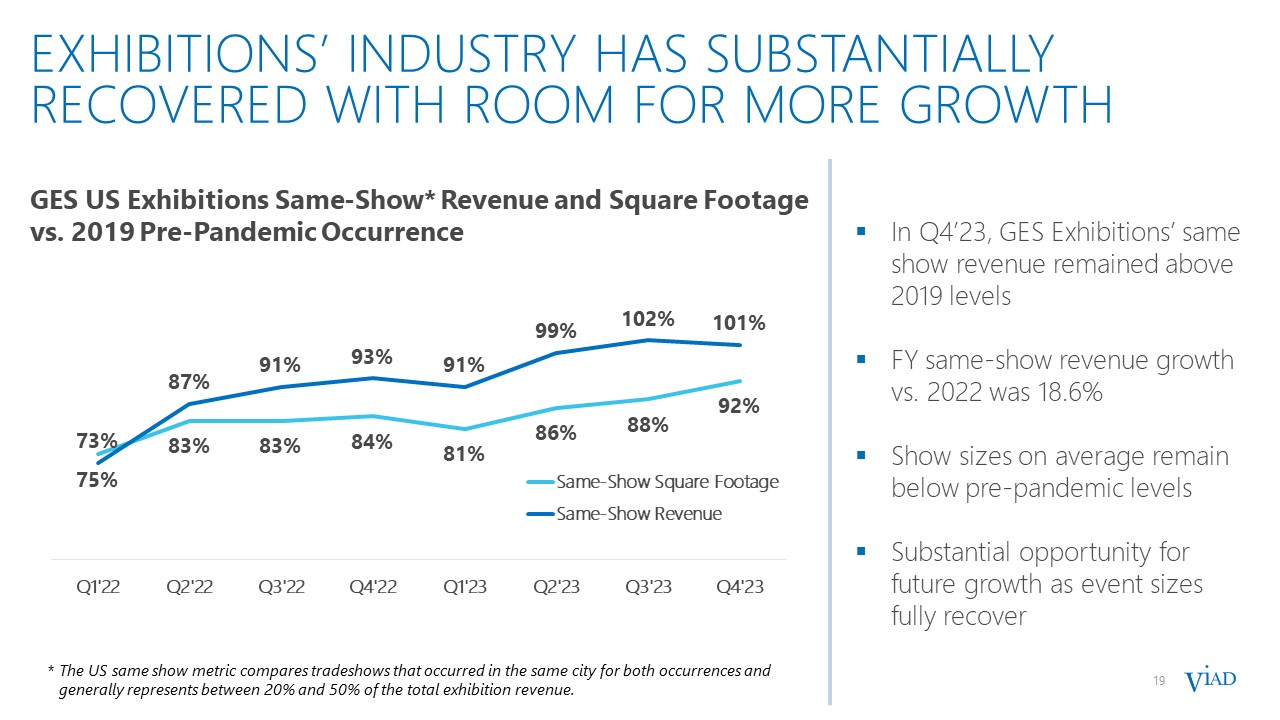
19 EXHIBITIONS’ INDUSTRY HAS SUBSTANTIALLYRECOVERED WITH ROOM FOR MORE GROWTH 19 In Q4’23, GES Exhibitions’ same show revenue remained above 2019 levels FY same-show revenue growth vs. 2022 was 18.6% Show sizes on average remain below pre-pandemic levels Substantial opportunity for future growth as event sizes fully recover * The US same show metric compares tradeshows that occurred in the same city for both occurrences and generally represents between 20% and 50% of the total exhibition revenue. GES US Exhibitions Same-Show* Revenue and Square Footage vs. 2019 Pre-Pandemic Occurrence

20 SPIRO’S GROWTH STRATEGY LARGE FRAGMENTED GROWING MARKET Experiential marketing is forecasted to rise globally at ~9% CAGR to $105B by 2026 ~80% of brands view experiential events as their most important marketing channel ~86% of brands plan to attend or host more in-person events in 2024 than in 2023 Sources: PQ Media Global Experiential Marketing Forecast 2022-2026, Bizzabo Well-positioned to win business from new and existing clients to drive accelerated growth: Global network End to end in-house solutions – from strategy & creative to execution & analytics Enhanced capabilities – expanded creative & design resources Industry leading expertise in multiple verticals Marquee client base NEW CLIENTS since Spiro launched in Q1’22 55
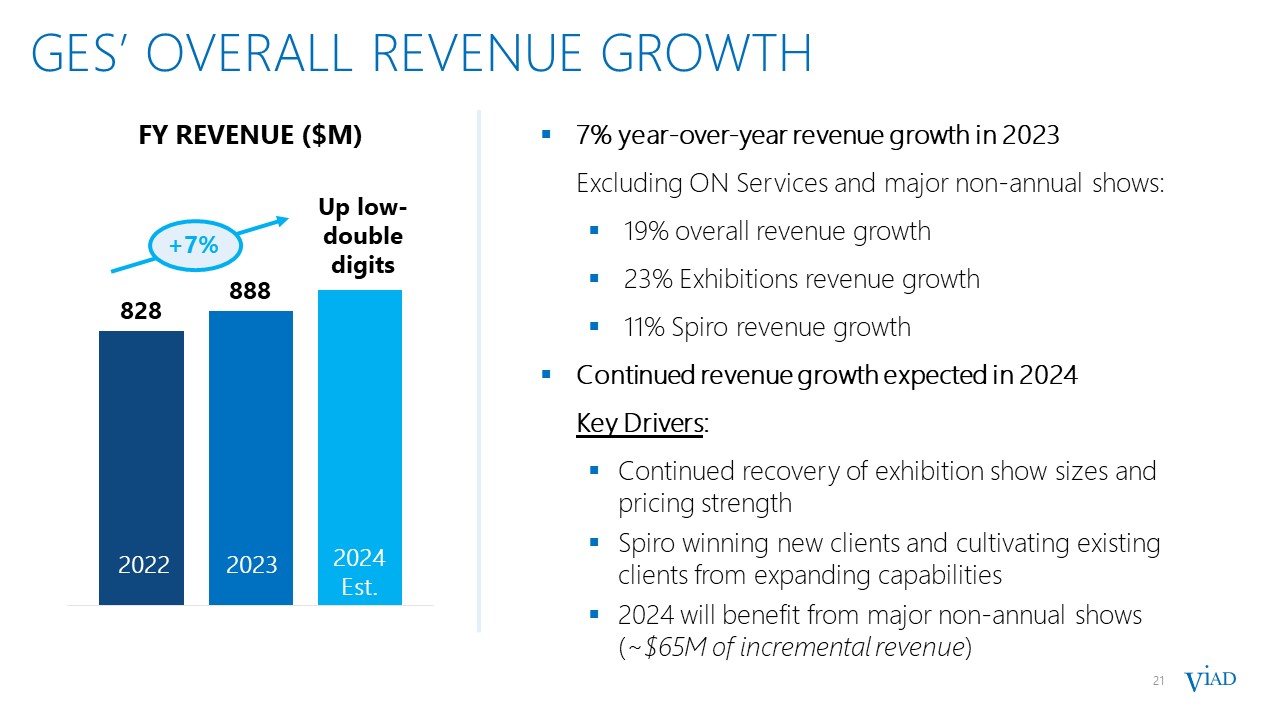
21 GES’ OVERALL REVENUE GROWTH FY REVENUE ($M) 2022 2023 7% year-over-year revenue growth in 2023 Excluding ON Services and major non-annual shows: 19% overall revenue growth 23% Exhibitions revenue growth 11% Spiro revenue growth Continued revenue growth expected in 2024 Key Drivers: Continued recovery of exhibition show sizes and pricing strength Spiro winning new clients and cultivating existing clients from expanding capabilities 2024 will benefit from major non-annual shows (~$65M of incremental revenue) +7% 2024 Est. Up low-double digits
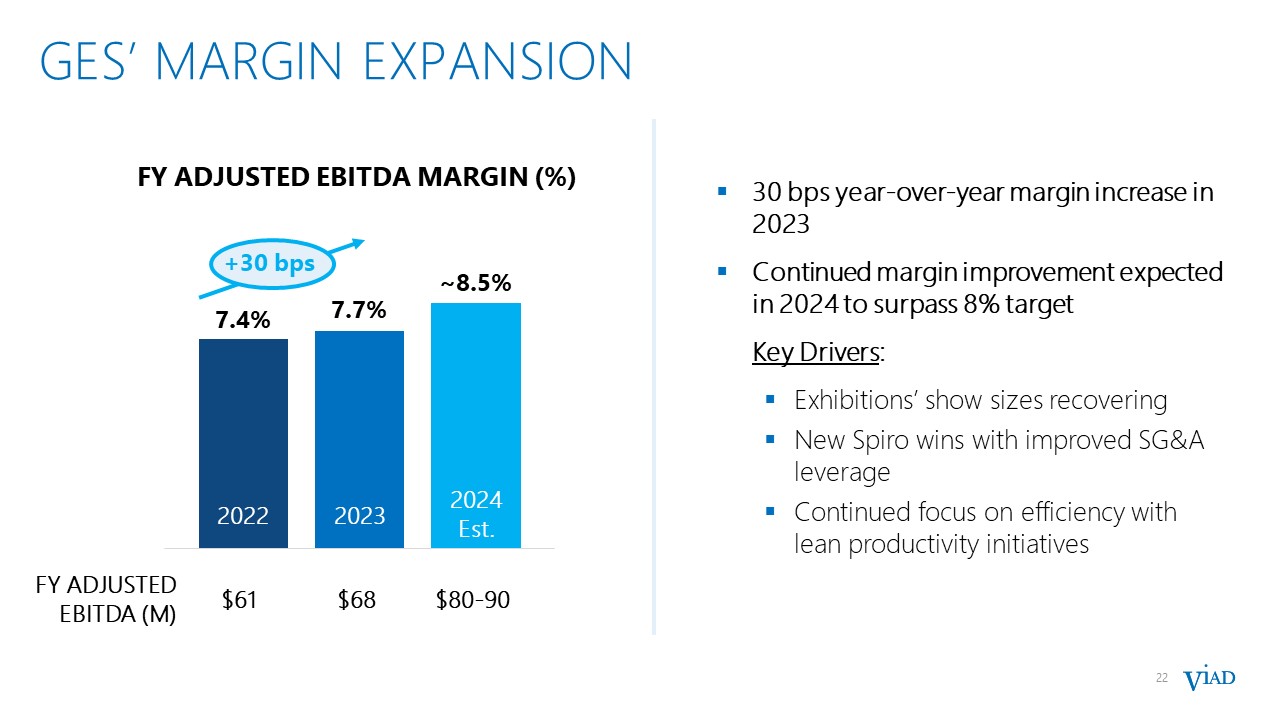
22 GES’ margin expansion FY ADJUSTED EBITDA MARGIN (%) +30 bps 2022 2022 2023 2024 Est. 30 bps year-over-year margin increase in 2023 Continued margin improvement expected in 2024 to surpass 8% target Key Drivers: Exhibitions’ show sizes recovering New Spiro wins with improved SG&A leverage Continued focus on efficiency with lean productivity initiatives FY ADJUSTED EBITDA (M) $61 $68 $80-90

APPENDIX
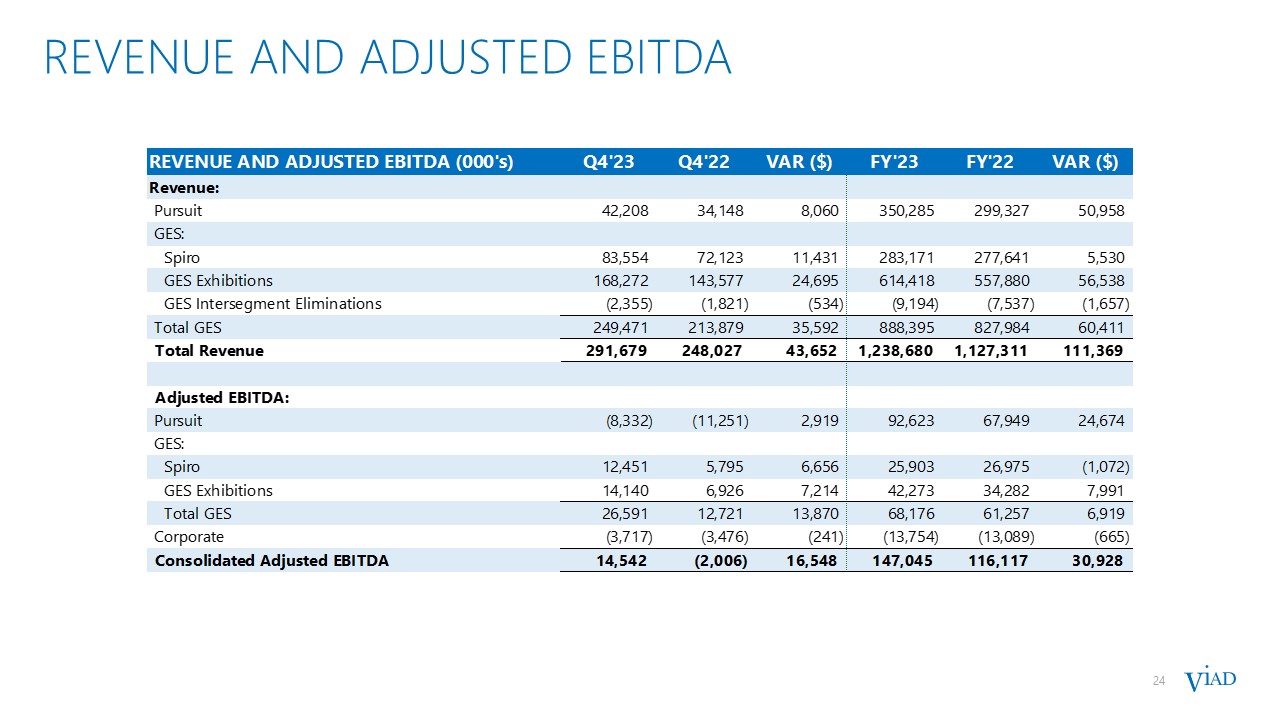
24 REVENUE AND ADJUSTED EBITDA
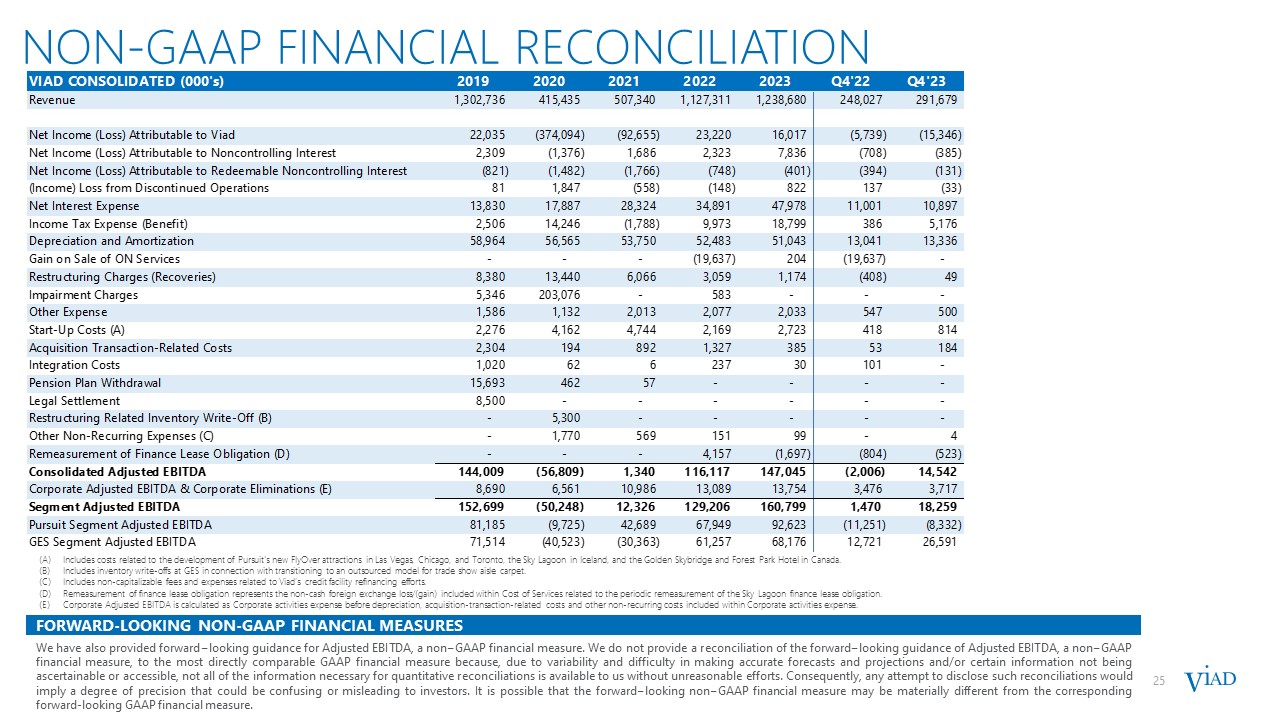
FORWARD-LOOKING NON-GAAP FINANCIAL MEASURES We have also provided forward−looking guidance for Adjusted EBITDA, a non−GAAP financial measure. We do not provide a reconciliation of the forward−looking guidance of Adjusted EBITDA, a non−GAAP financial measure, to the most directly comparable GAAP financial measure because, due to variability and difficulty in making accurate forecasts and projections and/or certain information not being ascertainable or accessible, not all of the information necessary for quantitative reconciliations is available to us without unreasonable efforts. Consequently, any attempt to disclose such reconciliations would imply a degree of precision that could be confusing or misleading to investors. It is possible that the forward−looking non−GAAP financial measure may be materially different from the corresponding forward-looking GAAP financial measure. NON-GAAP FINANCIAL RECONCILIATION 25 Includes costs related to the development of Pursuit's new FlyOver attractions in Las Vegas, Chicago, and Toronto, the Sky Lagoon in Iceland, and the Golden Skybridge and Forest Park Hotel in Canada. Includes inventory write-offs at GES in connection with transitioning to an outsourced model for trade show aisle carpet. Includes non-capitalizable fees and expenses related to Viad’s credit facility refinancing efforts. Remeasurement of finance lease obligation represents the non-cash foreign exchange loss/(gain) included within Cost of Services related to the periodic remeasurement of the Sky Lagoon finance lease obligation. Corporate Adjusted EBITDA is calculated as Corporate activities expense before depreciation, acquisition-transaction-related costs and other non-recurring costs included within Corporate activities expense.

26 NON-GAAP FINANCIAL RECONCILIATION Remeasurement of finance lease obligation attributable to Viad represents the non-cash foreign exchange loss/(gain) included within Cost of Services related to the periodic remeasurement of the Sky Lagoon finance lease obligation that is attributed to Viad’s 51% interest in Sky Lagoon.
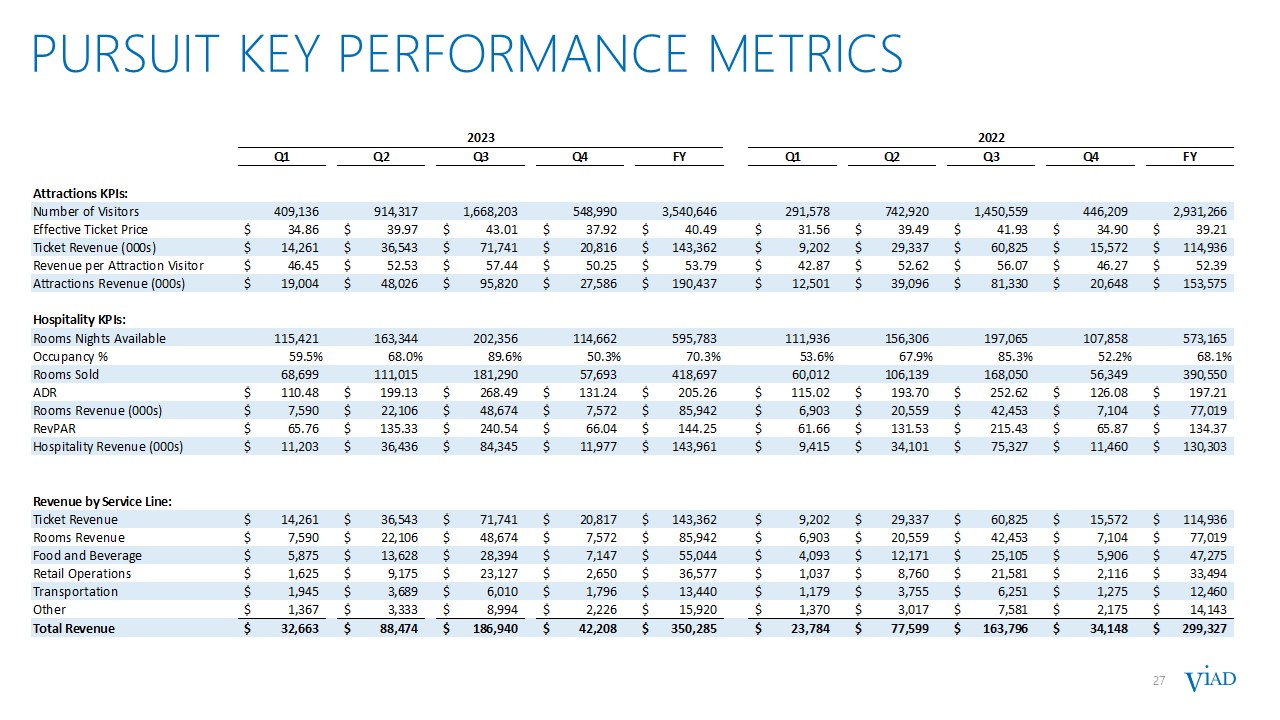
27 Pursuit key performance metrics 27

PURSUIT METRICS vs. pre-pandemic 2019 28 Note: Same-Store metrics include only attractions and lodging properties that Pursuit operated at full capacity, considering seasonal closures, for the entirety of the 2023, 2022, and 2019 periods presented. For experiences located outside the United States, financial metric comparisons to the prior year are expressed on a constant U.S. dollar basis. New attractions opened or acquired after January 1, 2019 and excluded from the same-store ETP, include Glacier Raft Co. (acquired April 2022), FlyOver Las Vegas (opened September 2021), Golden Skybridge (opened June 2021), Sky Lagoon (opened May 2021), Open Top Touring (opened September 2020), and FlyOver Iceland (opened August 2019). New lodging properties opened or acquired after January 1, 2019 and excluded from the same-store RevPAR and ADR, include Forest Park Hotel (opened August 2022), Glacier Raft Co (acquired April 2022), Glacier Basecamp Lodge (acquired January 2020), West Glacier RV Park (opened July 2019), Mountain Park Lodges (acquired June 2019), and Belton Chalet (acquired May 2019). Lodging and attraction experiences show significant improvement compared to the prior year and pre-pandemic 2019

29 Cash Flow and Balance Sheet highlights 29