Exhibit 99

Link to searchable text of slide shown above

Link to searchable text of slide shown above
Link to searchable text of slide shown above

Link to searchable text of slide shown above

Link to searchable text of slide shown above

Link to searchable text of slide shown above
Link to searchable text of slide shown above
Link to searchable text of slide shown above
Link to searchable text of slide shown above
Link to searchable text of slide shown above

Link to searchable text of slide shown above
Link to searchable text of slide shown above
Link to searchable text of slide shown above
Link to searchable text of slide shown above
Link to searchable text of slide shown above
Link to searchable text of slide shown above
Link to searchable text of slide shown above

Link to searchable text of slide shown above
Link to searchable text of slide shown above
Link to searchable text of slide shown above
Link to searchable text of slide shown above
Link to searchable text of slide shown above

Link to searchable text of slide shown above
Link to searchable text of slide shown above

Link to searchable text of slide shown above

Link to searchable text of slide shown above
Link to searchable text of slide shown above
Link to searchable text of slide shown above
Searchable text section of graphics shown above
PRIMEDIA
Seizing the Targeted Media Opportunity
March, 2005
[GRAPHIC]
Forward Looking Statements
This presentation contains forward-looking statements as that term is used under the Private Securities Litigation Act of 1995. These forward-looking statements are based on the current assumptions, expectations and projections of the Company’s management about future events. Although the assumptions, expectations and projections reflected in these forward-looking statements represent management’s best judgment at the time of this presentation, the Company can give no assurance that they will prove to be correct. Numerous factors, including those related to market conditions and those detailed from time-to-time in the Company’s filings with the Securities and Exchange Commission, may cause results of the Company to differ materially from those anticipated in these forward-looking statements. Many of the factors that will determine the Company’s future results are beyond the ability of the Company to control or predict. These forward-looking statements are subject to risks and uncertainties and, therefore, actual results may differ materially. The Company cautions you not to place undue reliance on these forward-looking statements. The Company undertakes no obligation to revise or update any forward-looking statements, or to make any other forward-looking statements, whether as a result of new information, future events or otherwise. All references to “Company” and “PRIMEDIA Inc.” as used throughout this presentation refer to PRIMEDIA Inc. and its subsidiaries.
2
Targeted Media
A Significant Business Opportunity
“Mass advertising (and its dependent media) is in peril. Yet, the opportunity for advertisers and targeted media has never been brighter.”
—Bernstein Research, May, 2004
“In advertising, 2005 will be the year of the sharpshooter.”
—”Why Big Bucks Are Chasing Targeted Media”
BusinessWeek, January, 2005
3
Seizing the Targeted Media Opportunity
Targeted Message + Engaged Audience = High ROI
Example: $35 Billion Fishing Market
[GRAPHIC] | | [GRAPHIC] | | [GRAPHIC] | | [GRAPHIC] |
| | | | | | |
Niche Publications, | | Focused | | Television | | Targeted |
Books, Videos | | Events | | Programming | | Web sites |
4
Consumers Seek Content With Highest Relevance
Alabama | | Missouri |
| | |
Arkansas | | New England |
| | |
California | | New York |
| [GRAPHIC] [GRAPHIC] [GRAPHIC] [GRAPHIC] | |
Florida | | North Carolina |
| | |
Georgia | | Ohio |
| | |
Great Plains | | Oklahoma |
| | |
Illinois | | Pennsylvania |
| | |
Indiana | | Rocky Mountain |
| | |
Iowa | | South Carolina |
| | |
Kentucky | [GRAPHIC] [GRAPHIC] [GRAPHIC] | Tennessee |
| | |
Louisiana | | Texas |
| | |
Michigan | | Virginia |
| | |
Mid-Atlantic | | Washington-Oregon |
| | |
Minnesota | | West Virginia |
| | |
Mississippi | | Wisconsin |
State/Region-Specific Game & Fish Outsells All Other
Outdoor Publications on Newsstand 2-to-1
5
PRIMEDIA’s Business Segments
(2004, $ Millions) | | Enthusiast
Media | | Consumer
Guides | | Business
Information | | Education | | Total | |
| | | | | | | | | | | |
% Total Revenue | | 55 | % | 23 | % | 18 | % | 5 | % | | |
| | | | | | | | | | | |
Revenue | | $ | 694.2 | | $ | 287.1 | | $ | 224.9 | | $ | 66.4 | | $ | 1,271.3 | |
| | | | | | | | | | | |
Revenue Growth | | -0.3 | % | 3.8 | % | 1.6 | % | -16.6 | % | 0.2 | % |
| | | | | | | | | | | |
Segment EBITDA | | $ | 149.8 | | $ | 81.5 | | $ | 37.4 | | $ | 4.9 | | $ | 247.9 | |
| | | | | | | | | | | |
Segment EBITDA Growth | | 2.5 | % | -2.0 | % | 6.6 | % | -70.5 | % | -2.6 | % |
| | | | | | | | | | | |
Segment EBITDA Margin | | 21.6 | % | 28.4 | % | 16.6 | % | 7.4 | % | 19.5 | % |
All revenue and segment EBITDA numbers in this presentation are for continuing businesses excluding About.com. Total includes Intersegment Eliminations and Corporate Overhead.
All non-GAAP terms reconciled to GAAP in the Company’s filings with the Securities and Exchange Commission.
6
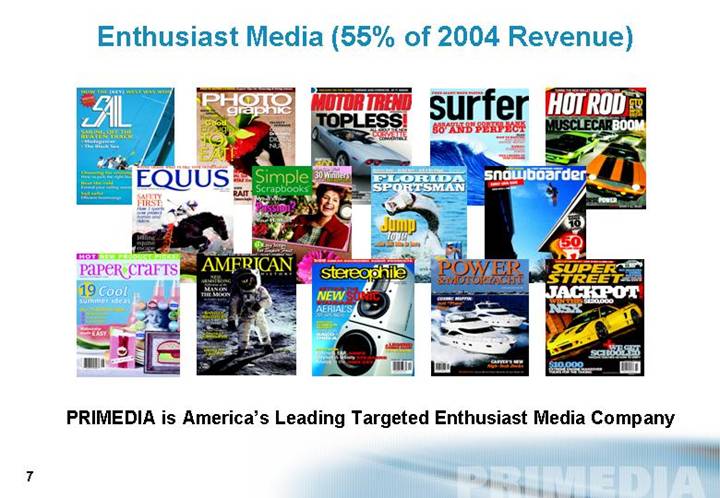
Enthusiast Media (55% of 2004 Revenue)
[GRAPHIC]
PRIMEDIA is America’s Leading Targeted Enthusiast Media Company
7
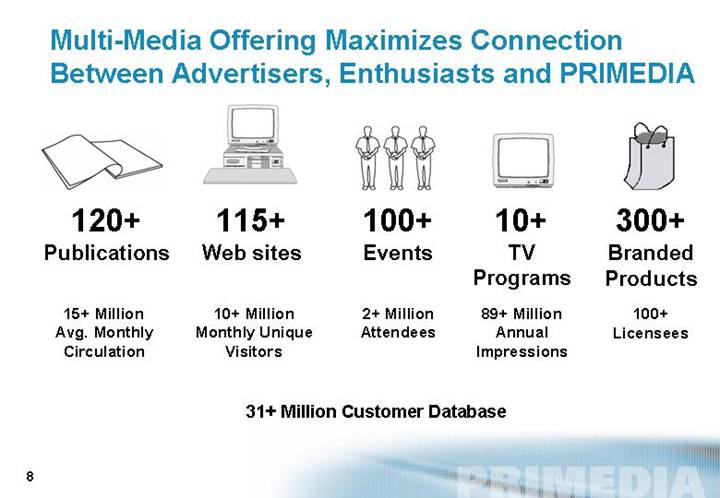
Multi-Media Offering Maximizes Connection
Between Advertisers, Enthusiasts and PRIMEDIA
[GRAPHIC] | | [GRAPHIC] | | [GRAPHIC] | | [GRAPHIC] | | [GRAPHIC] |
| | | | | | | | |
120+ | | 115+ | | 100+ | | 10+ | | 300+ |
Publications | | Web sites | | Events | | TV | | Branded |
| | | | | | Programs | | Products |
| | | | | | | | |
15+ Million | | 10+ Million | | 2+ Million | | 89+ Million | | 100+ |
Avg. Monthly | | Monthly Unique | | Attendees | | Annual | | Licensees |
Circulation | | Visitors | | | | Impressions | | |
31+ Million Customer Database
8
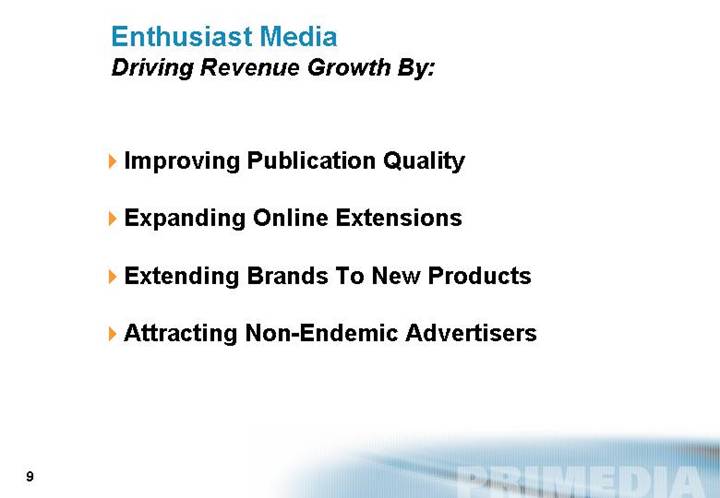
Enthusiast Media
Driving Revenue Growth By:
• Improving Publication Quality
• Expanding Online Extensions
• Extending Brands To New Products
• Attracting Non-Endemic Advertisers
9
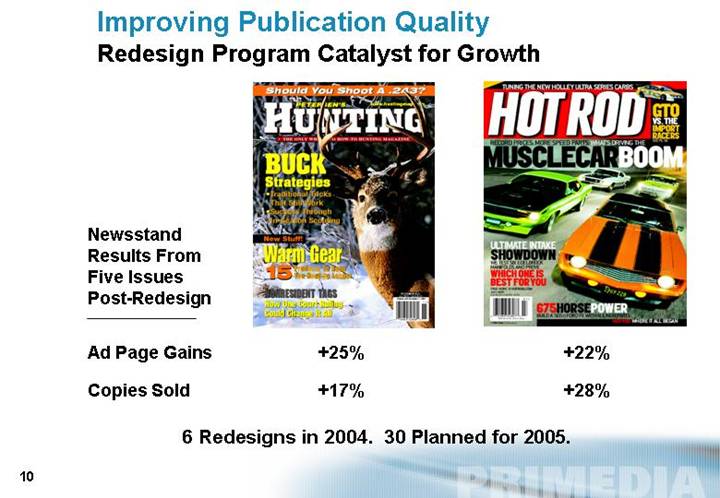
Improving Publication Quality
Redesign Program Catalyst for Growth
Newsstand
Results From
Five Issues
Post-Redesign | | [GRAPHIC] | | [GRAPHIC] | |
| | | | | |
Ad Page Gains | | +25% | | +22% | |
| | | | | |
Copies Sold | | +17% | | +28% | |
6 Redesigns in 2004. 30 Planned for 2005.
10
Expanding Online Extensions
[GRAPHIC]
Launch | | |
| | |
4Q04 | | Online Delivers: |
| | |
| | • Ad Revenue |
| | |
| | • Subscriber Acquisition |
| | |
| | • E-commerce |
| | |
1Q05 | | |
| | 2004 Results Ex-About.com: |
| | |
| | Page Views +29% |
| | |
| | Revenue |
| | |
| | Without Pay-per-Click +30% |
| | |
2Q05 | | With Pay-per-Click +38% |
11
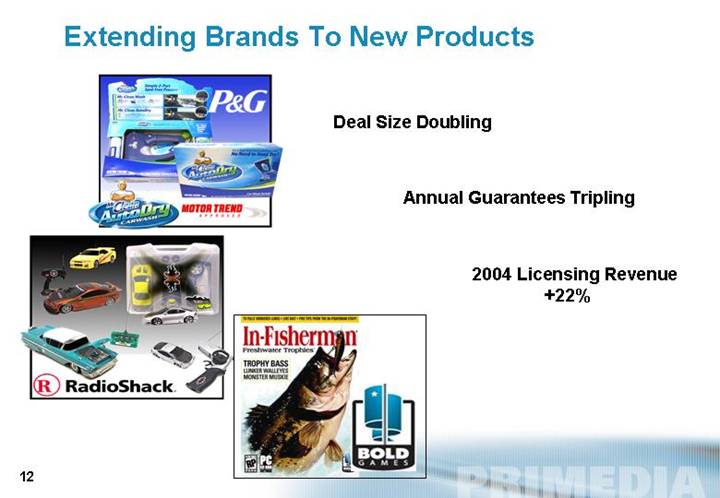
Extending Brands To New Products
[GRAPHIC] | | Deal Size Doubling |
| | |
[GRAPHIC] | | Annual Guarantees Tripling |
| | |
[GRAPHIC] | | 2004 Licensing Revenue
+22% |
12
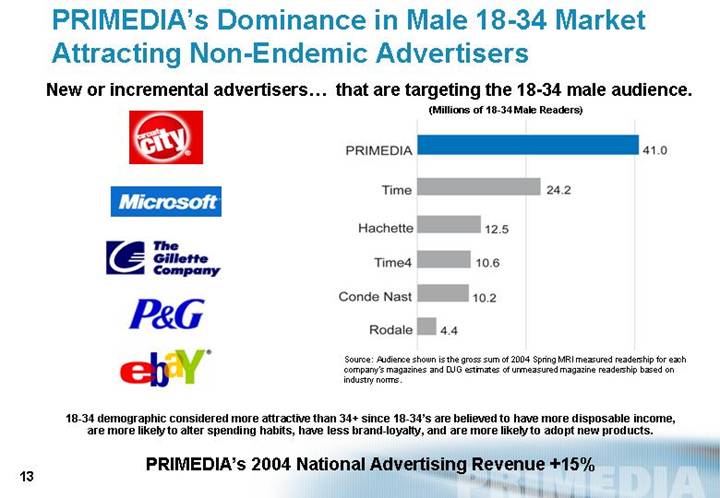
PRIMEDIA’s Dominance in Male 18-34 Market
Attracting Non-Endemic Advertisers
New or incremental advertisers... that are targeting the 18-34 male audience.
| (Millions of 18-34 Male Readers) |
| |
[LOGO] | [CHART] |
| |
| Source: Audience shown is the gross sum of 2004 Spring MRI measured readership for each company’s magazines and DJG estimates of unmeasured magazine readership based on industry norms. |
18-34 demographic considered more attractive than 34+ since 18-34’s are believed to have more disposable income,
are more likely to alter spending habits, have less brand-loyalty, and are more likely to adopt new products.
PRIMEDIA’s 2004 National Advertising Revenue +15%
13
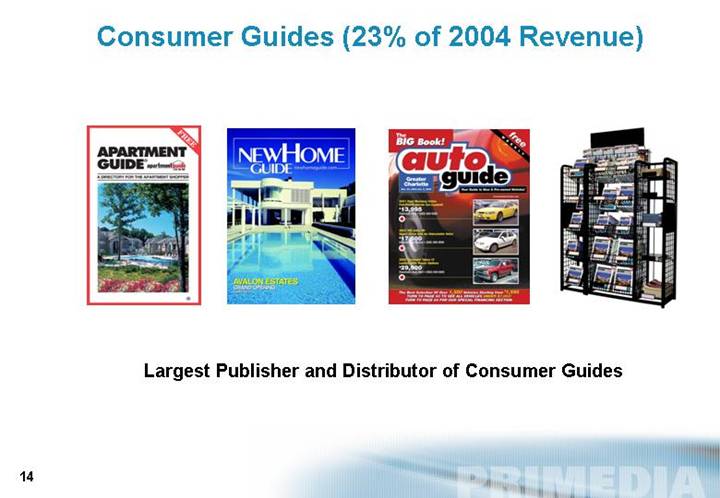
Consumer Guides (23% of 2004 Revenue)
[GRAPHIC]
Largest Publisher and Distributor of Consumer Guides
14
Consumer Guides
Driving Revenue Growth By:
• Apartment Guide Pickup
• New Home Guide Expansion
• Auto Guide Launches
15
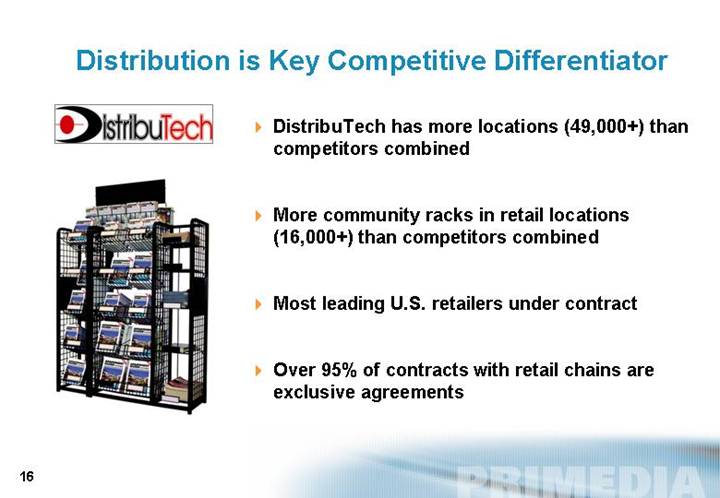
Distribution is Key Competitive Differentiator
[LOGO]
[GRAPHIC]
• DistribuTech has more locations (49,000+) than competitors combined
• More community racks in retail locations (16,000+) than competitors combined
• Most leading U.S. retailers under contract
• Over 95% of contracts with retail chains are exclusive agreements
16
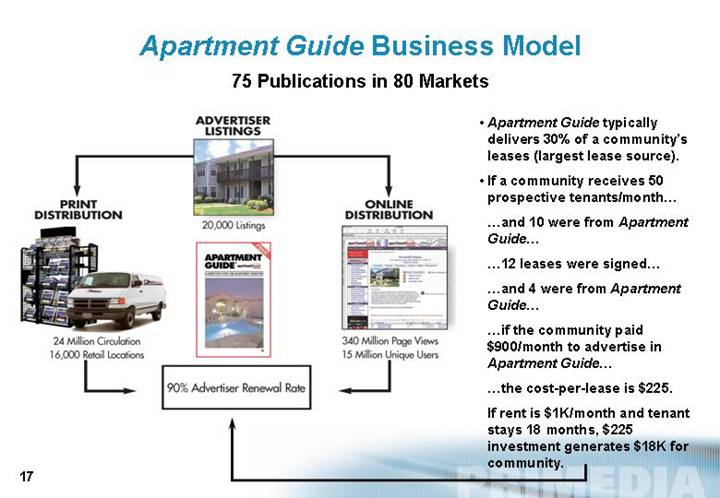
Apartment Guide Business Model
75 Publications in 80 Markets
| | ADVERTISER
LISTINGS | | |
PRINT
DISTRIBUTION | | [GRAPHIC] | | ONLINE
DISTRIBUTION |
[GRAPHIC] | | 20,000 Listings | | [GRAPHIC] |
24 Million Circulation
16,000 Retail Locations | | [GRAPHIC] | | 340 Million Pave Views
15 Million Unique Users |
| | 90% Advertiser Renewal Rate | | |
• Apartment Guide typically delivers 30% of a community’s leases (largest lease source).
• If a community receives 50 prospective tenants/month…
…and 10 were from Apartment Guide…
…12 leases were signed…
…and 4 were from Apartment Guide…
…if the community paid $900/month to advertise in Apartment Guide…
…the cost-per-lease is $225.
If rent is $1K/month and tenant stays 18 months, $225 investment generates $18K for community.
17
New Home Guide Growth
[GRAPHIC]
• 2004 Launches:
Orlando, Houston;
4Q04 vs. 3Q04 Revenue +33%
• 19 Publications vs. 80 Apartment Guides
• Solid market fundamentals
• Leverages existing distribution
• Targeting 25 guides by end of 2005
18
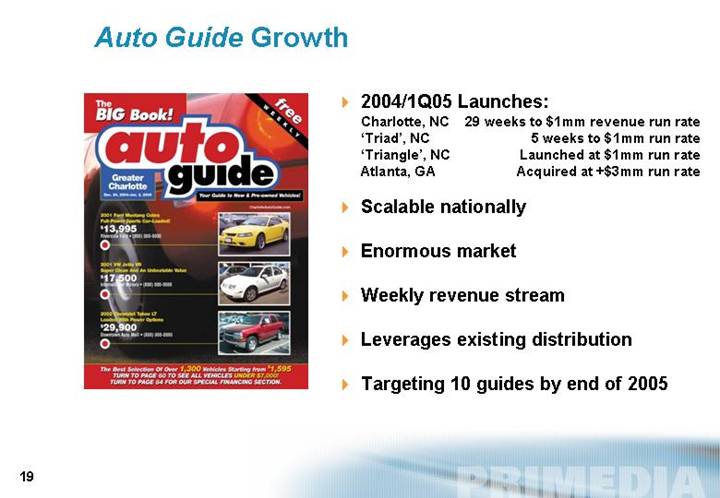
Auto Guide Growth
[GRAPHIC]
• 2004/1Q05 Launches:
Charlotte, NC | | 29 weeks to $1mm revenue run rate |
‘Triad’, NC | | 5 weeks to $1mm run rate |
‘Triangle’, NC | | Launched at $1mm run rate |
Atlanta, GA | | Acquired at +$3mm run rate |
• Scalable nationally
• Enormous market
• Weekly revenue stream
• Leverages existing distribution
• Targeting 10 guides by end of 2005
19
30 Years of Consumer Guides Success
• DistribuTech provides unmatched competitive advantages for existing guides and launches.
• High advertiser renewal rates driven by provable leads.
• Industry-leading web sites.
• Efficient, automated processes maximize margins.
• All three PRIMEDIA-owned products address large markets.
20
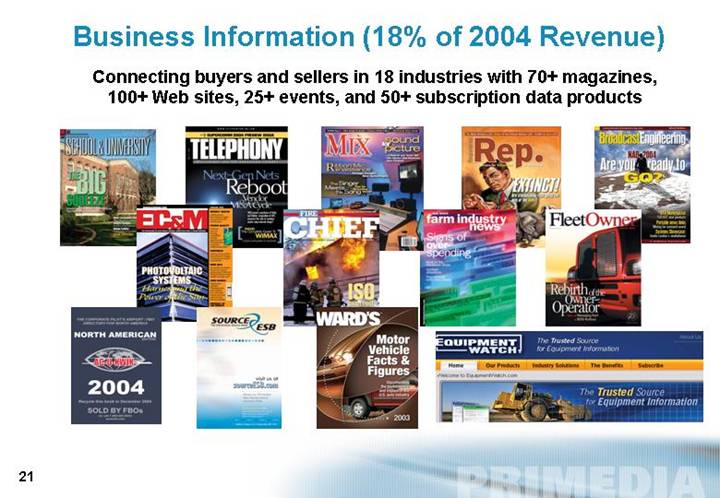
Business Information (18% of 2004 Revenue)
Connecting buyers and sellers in 18 industries with 70+ magazines,
100+ Web sites, 25+ events, and 50+ subscription data products
[GRAPHIC]
21
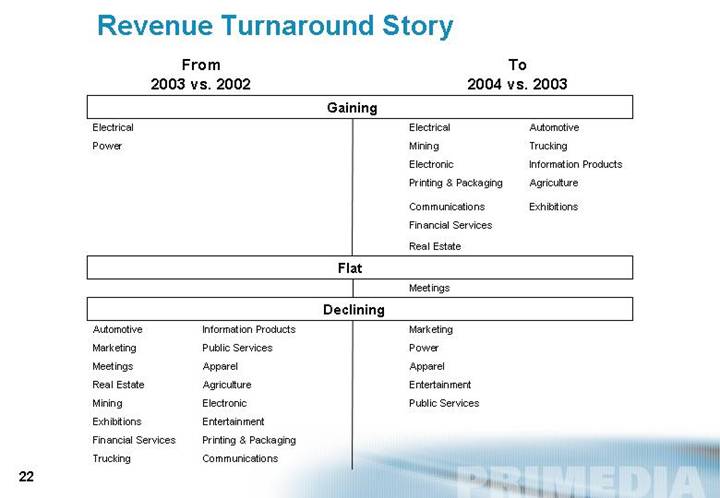
Revenue Turnaround Story
From | | | | To |
2003 vs. 2002 | | | | 2004 vs. 2003 |
| | | | Gaining | | | | |
Electrical | | | | | | Electrical | | Automotive |
| | | | | | | | |
Power | | | | | | Mining | | Trucking |
| | | | | | | | |
| | | | | | Electronic | | Information Products |
| | | | | | | | |
| | | | | | Printing & Packaging | | Agriculture |
| | | | | | | | |
| | | | | | | | |
| | | | | | Communications | | Exhibitions |
| | | | | | | | |
| | | | | | Financial Services | | |
| | | | | | | | |
| | | | | | Real Estate | | |
| | | | | | | | |
| | | | Flat | | | | |
| | | | | | | | |
| | | | | | Meetings | | |
| | | | | | | | |
| | | | Declining | | | | |
| | | | | | | | |
Automotive | | Information Products | | | | Marketing | | |
| | | | | | | | |
Marketing | | Public Services | | | | Power | | |
| | | | | | | | |
Meetings | | Apparel | | | | Apparel | | |
| | | | | | | | |
Real Estate | | Agriculture | | | | Entertainment | | |
| | | | | | | | |
Mining | | Electronic | | | | Public Services | | |
| | | | | | | | |
Exhibitions | | Entertainment | | | | | | |
| | | | | | | | |
Financial Services | | Printing & Packaging | | | | | | |
| | | | | | | | |
Trucking | | Communications | | | | | | |
22
Business Information
Driving Revenue Growth By:
• Building Marketing Partnerships
• Delivering Leads to Manufacturers
• Expanding Subscription Data Products
23
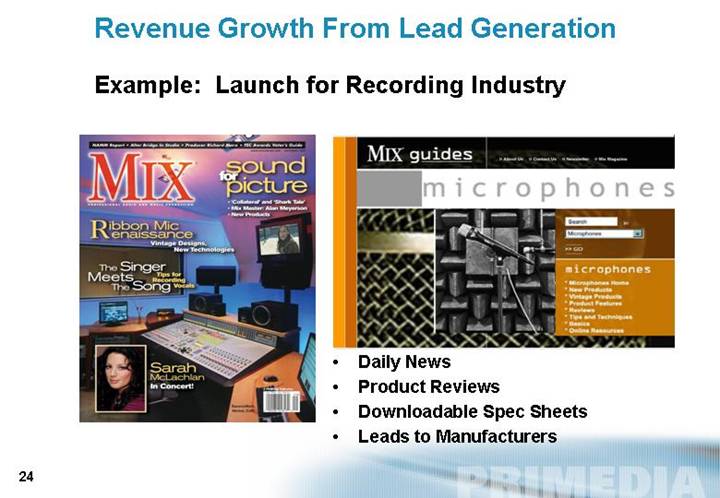
Revenue Growth From Lead Generation
Example: Launch for Recording Industry
[GRAPHIC]
• Daily News
• Product Reviews
• Downloadable Spec Sheets
• Leads to Manufacturers
24
Revenue Growth From Subscription Data Products
Example: EquipmentWatch
Before | | Launched 2Q04 | |
Separate Sites/Databases | | Integrated “Whole View” | |
| | | |
• | Custom Cost Evaluator | | [GRAPHIC] | |
• | Rental Rate Blue Book | | | |
• | Market Valuation Data | | | |
• | Serial Number Guide | | | |
• | Auction Results | | | |
Subscription Pricing 17-25% Higher
25
Education (5% of 2004 Revenue)
[LOGO]
• Improve advertising category management
• Leverage infrastructure
[LOGO]
• Provide digital delivery
• Enhance marketing capabilities
[LOGO]
• Maximizing strategic partnership with Mass General Hospital
• 2005 advance bookings exceed 2004 total revenue
26
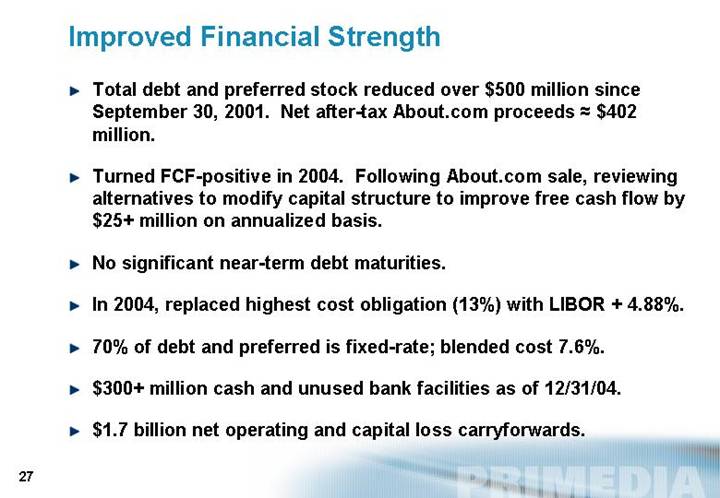
Improved Financial Strength
• Total debt and preferred stock reduced over $500 million since September 30, 2001. Net after-tax About.com proceeds=$402 million.
• Turned FCF-positive in 2004. Following About.com sale, reviewing alternatives to modify capital structure to improve free cash flow by $25+ million on annualized basis.
• No significant near-term debt maturities.
• In 2004, replaced highest cost obligation (13%) with LIBOR + 4.88%.
• 70% of debt and preferred is fixed-rate; blended cost 7.6%.
• $300+ million cash and unused bank facilities as of 12/31/04.
• 1.7 billion net operating and capital loss carryforwards.
27
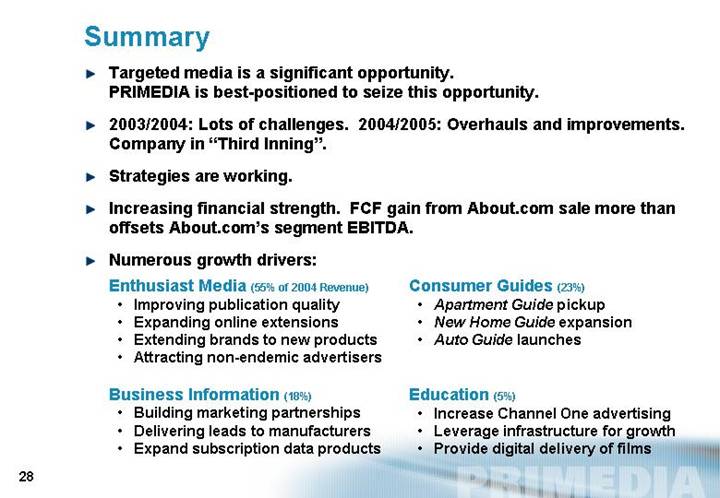
Summary
• Targeted media is a significant opportunity.
PRIMEDIA is best-positioned to seize this opportunity.
• 2003/2004: Lots of challenges. 2004/2005: Overhauls and improvements. Company in “Third Inning”.
• Strategies are working.
• Increasing financial strength. FCF gain from About.com sale more than offsets About.com’s segment EBITDA.
• Numerous growth drivers:
Enthusiast Media (55% of 2004 Revenue)
• Improving publication quality
• Expanding online extensions
• Extending brands to new products
• Attracting non-endemic advertisers
Business Information (18%)
• Building marketing partnerships
• Delivering leads to manufacturers
• Expand subscription data products
Consumer Guides (23%)
• Apartment Guide pickup
• New Home Guide expansion
• Auto Guide launches
Education (5%)
• Increase Channel One advertising
• Leverage infrastructure for growth
• Provide digital delivery of films
28